Genetic deletion of the angiotensin-(1–7) receptor Mas leads to glomerular hyperfiltration and microalbuminuria Se ´ rgio V.B. Pinheiro 1 , Anderson J. Ferreira 2 , Gregory T. Kitten 2 , Ka ´tia D. da Silveira 3 , Deivid A. da Silva 1 , Se ´ rgio H.S. Santos 3 , Elisandra Gava 2 , Carlos H. Castro 3 , Ju ´ nio A. Magalha ˜es 3 , Renata K. da Mota 2 , Giancarla A. Botelho-Santos 3 , Michael Bader 4 , Natalia Alenina 4 , Robson A.S. Santos 3 and Ana Cristina Simoes e Silva 1 1 Pediatric Nephrology Unit, Medicine Faculty, Department of Pediatrics, Federal University of Minas Gerais, Belo Horizonte, Brazil; 2 Department of Morphology, Biological Sciences Institute, Federal University of Minas Gerais, Belo Horizonte, Brazil; 3 Department of Physiology and Biophysics, Biological Sciences Institute, Federal University of Minas Gerais, Belo Horizonte, Brazil and 4 MaxDelbru¨ck Center for Molecular Medicine, Berlin, Germany Angiotensin-(1–7), an active fragment of both angiotensins I and II, generally opposes the vascular and proliferative actions of angiotensin II. Here we evaluated effects of the angiotensin-(1–7) receptor Mas on renal physiology and morphology using Mas-knockout mice. Compared to the wild-type animals, Mas knockout mice had significant reductions in urine volume and fractional sodium excretion without any significant change in free-water clearance. A significantly higher inulin clearance and microalbuminuria concomitant with a reduced renal blood flow suggest that glomerular hyperfiltration occurs in the knockout mice. Histological analysis found reduced glomerular tuft diameter and increased expression of collagen IV and fibronectin in the both the mesangium and interstitium, along with increased collagen III in the interstitium. These fibrogenic changes and the renal dysfunction of the knockout mice were associated with an upregulation of angiotensin II AT1 receptor and transforming growth factor-b mRNA. Our study suggests that Mas acts as a critical regulator of renal fibrogenesis by controlling effects transduced through angiotensin II AT1 receptors in the kidney. Kidney International (2009) 75, 1184–1193; doi:10.1038/ki.2009.61; published online 4 March 2009 KEYWORDS: angiotensin-(1–7); angiotensin II; AT 1 receptor; receptor Mas; renal fibrosis; transforming growth factor-b The renin–angiotensin system (RAS) is classically conceived as a coordinated hormonal cascade in the control of cardiovascular, renal, and adrenal functions, mainly through the actions of Angiotensin (Ang)II. 1 Recent advances in cell and molecular biology have led to the recognition of other active fragments of RAS metabolism, such as Ang III, Ang IV, and Ang-(1–7), 2–4 the Ang IV insulin-regulated aminopepti- dase-binding site, 5 the angiotensin-converting enzyme (ACE)2, a homolog of classic ACE that forms Ang-(1–7) directly from Ang II and indirectly from Ang I, 6,7 and the G-protein-coupled receptor Mas. 8 In general, Ang-(1–7) opposes the vascular and prolif- erative effects of Ang II and exerts complex renal actions in chronic renal diseases and hypertension. 3,9,10 Ang-(1–7) is formed from Ang II by prolylendopeptidase, prolyl-carboxy- peptidase or ACE2, or directly from Ang I through hydrolysis by prolylendopeptidase and endopeptidase 24.11 and is metabolized by ACE to Ang-(1–5). 6,7 ACE inhibitors elevate Ang-(1–7) concentrations by both increasing Ang I, a substrate for Ang-(1–7) generation, and preventing Ang- (1–7) degradation. 2–4 Recent studies suggest that, at least in part, the beneficial effects of ACE inhibitors 11,12 and AT 1 receptor blockade 13 may be attributed to Ang-(1–7). These findings are in keeping with the hypothesis that the RAS is capable of self-regulating its activity through the formation of Ang-(1–7). 2–4 Furthermore, Kostenis et al 14 showed that receptor Mas can hetero-oligomerize with AT 1 and, by so doing, inhibit the actions of Ang II. Indeed, Mas acts in vitro as an antagonist of the AT 1 receptor. 15 Our group showed that deletion of Mas produces an impairment in cardiac function associated with a significant increase in collagen I, III, and fibronectin in the heart. 16 The aim of this study was to evaluate the role of Mas in kidney structure and function using mice with genetic deletion of this receptor. original article http://www.kidney-international.org & 2009 International Society of Nephrology Received 26 November 2007; revised 15 December 2008; accepted 13 January 2009; published online 4 March 2009 Correspondence: Ana Cristina Simoes e Silva, Avenida Bernardo Monteiro 1300, ap 1104, Bairro Funciona´rios, Belo Horizonte, MG 30150-281, Brazil. E-mail: [email protected] 1184 Kidney International (2009) 75, 1184–1193

Welcome message from author
This document is posted to help you gain knowledge. Please leave a comment to let me know what you think about it! Share it to your friends and learn new things together.
Transcript
Genetic deletion of the angiotensin-(1–7) receptorMas leads to glomerular hyperfiltration andmicroalbuminuriaSergio V.B. Pinheiro1, Anderson J. Ferreira2, Gregory T. Kitten2, Katia D. da Silveira3, Deivid A. da Silva1,Sergio H.S. Santos3, Elisandra Gava2, Carlos H. Castro3, Junio A. Magalhaes3, Renata K. da Mota2,Giancarla A. Botelho-Santos3, Michael Bader4, Natalia Alenina4, Robson A.S. Santos3 andAna Cristina Simoes e Silva1
1Pediatric Nephrology Unit, Medicine Faculty, Department of Pediatrics, Federal University of Minas Gerais, Belo Horizonte, Brazil;2Department of Morphology, Biological Sciences Institute, Federal University of Minas Gerais, Belo Horizonte, Brazil; 3Department ofPhysiology and Biophysics, Biological Sciences Institute, Federal University of Minas Gerais, Belo Horizonte, Brazil and 4Max DelbruckCenter for Molecular Medicine, Berlin, Germany
Angiotensin-(1–7), an active fragment of both angiotensins I
and II, generally opposes the vascular and proliferative
actions of angiotensin II. Here we evaluated effects of the
angiotensin-(1–7) receptor Mas on renal physiology and
morphology using Mas-knockout mice. Compared to the
wild-type animals, Mas knockout mice had significant
reductions in urine volume and fractional sodium excretion
without any significant change in free-water clearance. A
significantly higher inulin clearance and microalbuminuria
concomitant with a reduced renal blood flow suggest that
glomerular hyperfiltration occurs in the knockout mice.
Histological analysis found reduced glomerular tuft diameter
and increased expression of collagen IV and fibronectin in
the both the mesangium and interstitium, along with
increased collagen III in the interstitium. These fibrogenic
changes and the renal dysfunction of the knockout mice
were associated with an upregulation of angiotensin II AT1
receptor and transforming growth factor-b mRNA. Our study
suggests that Mas acts as a critical regulator of renal
fibrogenesis by controlling effects transduced through
angiotensin II AT1 receptors in the kidney.
Kidney International (2009) 75, 1184–1193; doi:10.1038/ki.2009.61;
published online 4 March 2009
KEYWORDS: angiotensin-(1–7); angiotensin II; AT1 receptor; receptor Mas;
renal fibrosis; transforming growth factor-b
The renin–angiotensin system (RAS) is classically conceivedas a coordinated hormonal cascade in the control ofcardiovascular, renal, and adrenal functions, mainly throughthe actions of Angiotensin (Ang)II.1 Recent advances in celland molecular biology have led to the recognition of otheractive fragments of RAS metabolism, such as Ang III, Ang IV,and Ang-(1–7),2–4 the Ang IV insulin-regulated aminopepti-dase-binding site,5 the angiotensin-converting enzyme(ACE)2, a homolog of classic ACE that forms Ang-(1–7)directly from Ang II and indirectly from Ang I,6,7 and theG-protein-coupled receptor Mas.8
In general, Ang-(1–7) opposes the vascular and prolif-erative effects of Ang II and exerts complex renal actions inchronic renal diseases and hypertension.3,9,10 Ang-(1–7) isformed from Ang II by prolylendopeptidase, prolyl-carboxy-peptidase or ACE2, or directly from Ang I through hydrolysisby prolylendopeptidase and endopeptidase 24.11 and ismetabolized by ACE to Ang-(1–5).6,7 ACE inhibitors elevateAng-(1–7) concentrations by both increasing Ang I, asubstrate for Ang-(1–7) generation, and preventing Ang-(1–7) degradation.2–4 Recent studies suggest that, at least inpart, the beneficial effects of ACE inhibitors11,12 and AT1
receptor blockade13 may be attributed to Ang-(1–7). Thesefindings are in keeping with the hypothesis that the RAS iscapable of self-regulating its activity through the formationof Ang-(1–7).2–4 Furthermore, Kostenis et al14 showed thatreceptor Mas can hetero-oligomerize with AT1 and, by sodoing, inhibit the actions of Ang II. Indeed, Mas acts in vitroas an antagonist of the AT1 receptor.15
Our group showed that deletion of Mas produces animpairment in cardiac function associated with a significantincrease in collagen I, III, and fibronectin in the heart.16 Theaim of this study was to evaluate the role of Mas in kidneystructure and function using mice with genetic deletion ofthis receptor.
o r i g i n a l a r t i c l e http://www.kidney-international.org
& 2009 International Society of Nephrology
Received 26 November 2007; revised 15 December 2008; accepted 13
January 2009; published online 4 March 2009
Correspondence: Ana Cristina Simoes e Silva, Avenida Bernardo Monteiro
1300, ap 1104, Bairro Funcionarios, Belo Horizonte, MG 30150-281, Brazil.
E-mail: [email protected]
1184 Kidney International (2009) 75, 1184–1193
RESULTSRenal function parameters
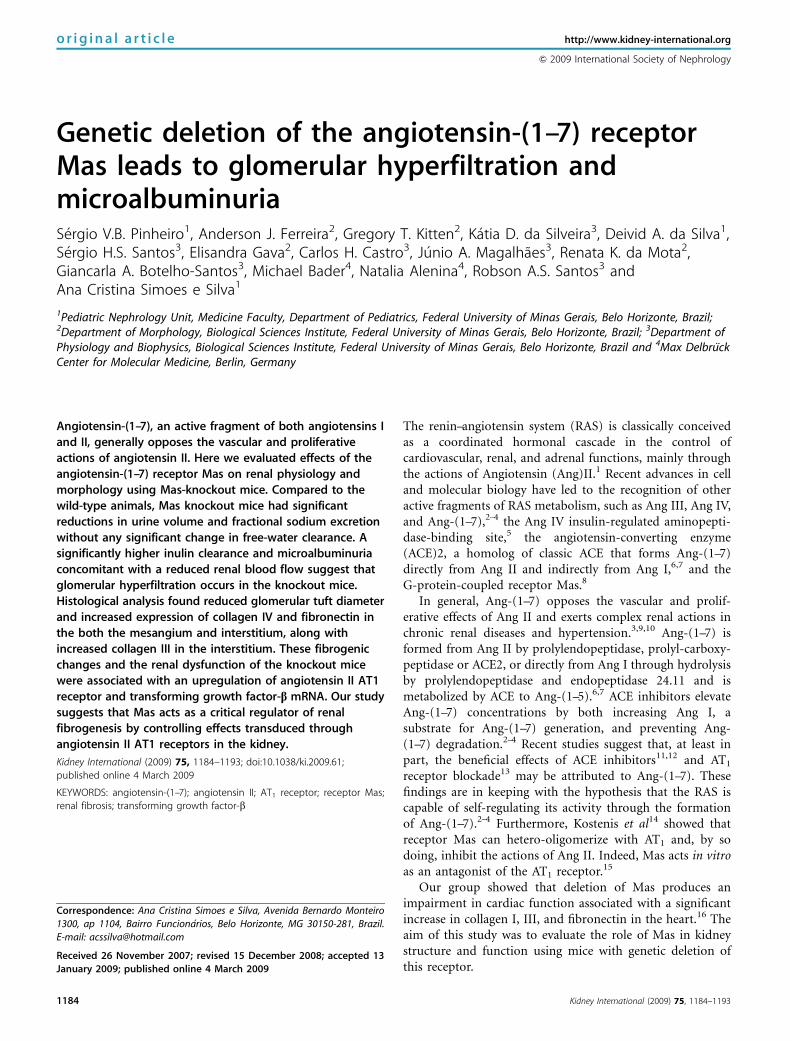
As the results displayed in Table 1 the 24-h urine flow ofMas�/� animals was significantly lower in comparison withthat of Masþ /þ . However, no differences in blood glucoselevels and in water and food intake were observed. Thereduced urinary volume observed in Mas�/� mice wasaccompanied by a significant increase in urinary osmolalityand a decrease in the fractional excretion of sodium (Po0.05,Table 1). Despite the increase in urinary osmolality, plasmaosmolality, osmolal, and free-water clearance were un-changed in Mas�/� animals when compared with those inMasþ /þ mice. No changes were detected in the fractionalexcretion of potassium either. Mean arterial pressure (MAP)in Mas�/� mice was also undistinguished from that in Masþ /þ
animals. However, significant reductions of renal blood flowaccompanied by increased total renal vascular resistance weredetected in knockout mice. Despite the reduced renal bloodflow, Mas�/� animals presented a significant elevation in theglomerular filtration rate (GFR), estimated by the creatinineand inulin clearances. This finding was made along with anelevated urinary albumin excretion in Mas�/� mice (Po0.05,Table 1).
Renal structure
The wet weights of kidneys from Masþ /þ and Mas�/�
animals normalized for body weight (BW) were similar(Table 2). However, microscopic changes in the kidneystructure of Mas�/� mice were observed, including asignificant reduction in the diameters of the glomerular tuftand Bowman’s capsule in comparison with those in Masþ /þ
animals (Figure 1 and Table 2). Bowman’s spaces and thediameter of the cortical tubule were unaltered in Mas�/�
animals when compared with those in Masþ /þ mice.
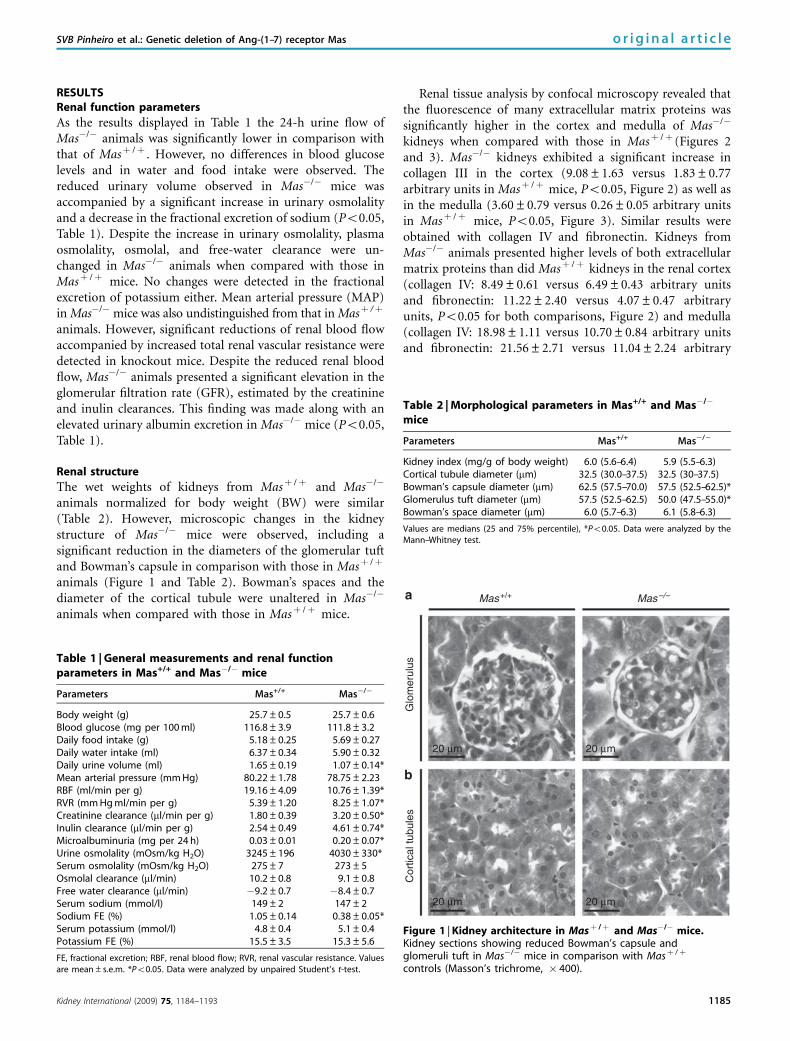
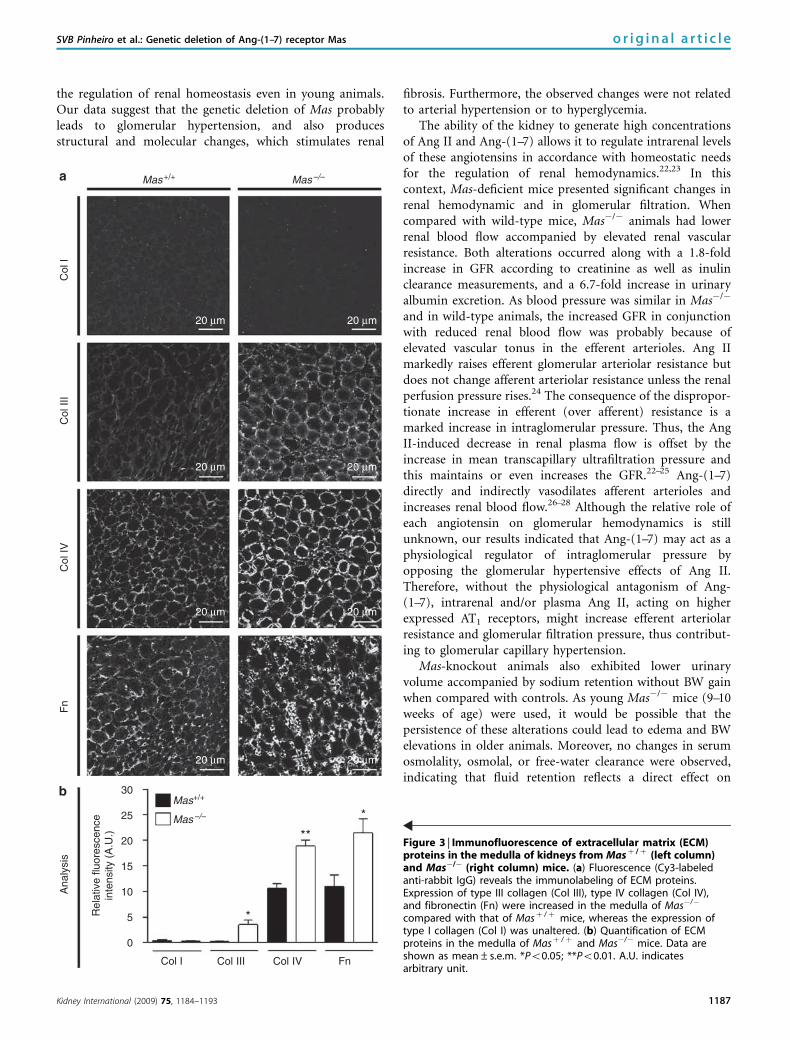
Renal tissue analysis by confocal microscopy revealed thatthe fluorescence of many extracellular matrix proteins wassignificantly higher in the cortex and medulla of Mas�/�
kidneys when compared with those in Masþ /þ (Figures 2and 3). Mas�/� kidneys exhibited a significant increase incollagen III in the cortex (9.08±1.63 versus 1.83±0.77arbitrary units in Masþ /þ mice, Po0.05, Figure 2) as well asin the medulla (3.60±0.79 versus 0.26±0.05 arbitrary unitsin Masþ /þ mice, Po0.05, Figure 3). Similar results wereobtained with collagen IV and fibronectin. Kidneys fromMas�/� animals presented higher levels of both extracellularmatrix proteins than did Masþ /þ kidneys in the renal cortex(collagen IV: 8.49±0.61 versus 6.49±0.43 arbitrary unitsand fibronectin: 11.22±2.40 versus 4.07±0.47 arbitraryunits, Po0.05 for both comparisons, Figure 2) and medulla(collagen IV: 18.98±1.11 versus 10.70±0.84 arbitrary unitsand fibronectin: 21.56±2.71 versus 11.04±2.24 arbitrary
Table 1 | General measurements and renal functionparameters in Mas+/+ and Mas�/� mice
Parameters Mas+/+ Mas�/�
Body weight (g) 25.7±0.5 25.7±0.6Blood glucose (mg per 100 ml) 116.8±3.9 111.8±3.2Daily food intake (g) 5.18±0.25 5.69±0.27Daily water intake (ml) 6.37±0.34 5.90±0.32Daily urine volume (ml) 1.65±0.19 1.07±0.14*Mean arterial pressure (mm Hg) 80.22±1.78 78.75±2.23RBF (ml/min per g) 19.16±4.09 10.76±1.39*RVR (mm Hg ml/min per g) 5.39±1.20 8.25±1.07*Creatinine clearance (ml/min per g) 1.80±0.39 3.20±0.50*Inulin clearance (ml/min per g) 2.54±0.49 4.61±0.74*Microalbuminuria (mg per 24 h) 0.03±0.01 0.20±0.07*Urine osmolality (mOsm/kg H2O) 3245±196 4030±330*Serum osmolality (mOsm/kg H2O) 275±7 273±5Osmolal clearance (ml/min) 10.2±0.8 9.1±0.8Free water clearance (ml/min) �9.2±0.7 �8.4±0.7Serum sodium (mmol/l) 149±2 147±2Sodium FE (%) 1.05±0.14 0.38±0.05*Serum potassium (mmol/l) 4.8±0.4 5.1±0.4Potassium FE (%) 15.5±3.5 15.3±5.6
FE, fractional excretion; RBF, renal blood flow; RVR, renal vascular resistance. Valuesare mean±s.e.m. *Po0.05. Data were analyzed by unpaired Student’s t-test.
Table 2 | Morphological parameters in Mas+/+ and Mas�/�
mice
Parameters Mas+/+ Mas�/�
Kidney index (mg/g of body weight) 6.0 (5.6–6.4) 5.9 (5.5–6.3)Cortical tubule diameter (mm) 32.5 (30.0–37.5) 32.5 (30–37.5)Bowman’s capsule diameter (mm) 62.5 (57.5–70.0) 57.5 (52.5–62.5)*Glomerulus tuft diameter (mm) 57.5 (52.5–62.5) 50.0 (47.5–55.0)*Bowman’s space diameter (mm) 6.0 (5.7–6.3) 6.1 (5.8–6.3)
Values are medians (25 and 75% percentile), *Po0.05. Data were analyzed by theMann–Whitney test.
Mas+/+
Glo
mer
ulus
Cor
tical
tubu
les
Mas–/–
20 µm
20 µm 20 µm
20 µm
Figure 1 | Kidney architecture in Masþ /þ and Mas�/� mice.Kidney sections showing reduced Bowman’s capsule andglomeruli tuft in Mas�/� mice in comparison with Masþ /þ
controls (Masson’s trichrome, � 400).
Kidney International (2009) 75, 1184–1193 1185
SVB Pinheiro et al.: Genetic deletion of Ang-(1–7) receptor Mas o r i g i n a l a r t i c l e
units, Po0.05 for both comparisons, Figure 3). However, nodifferences in the expression of collagen I in the cortex andmedulla were observed in the kidneys from Mas�/� and
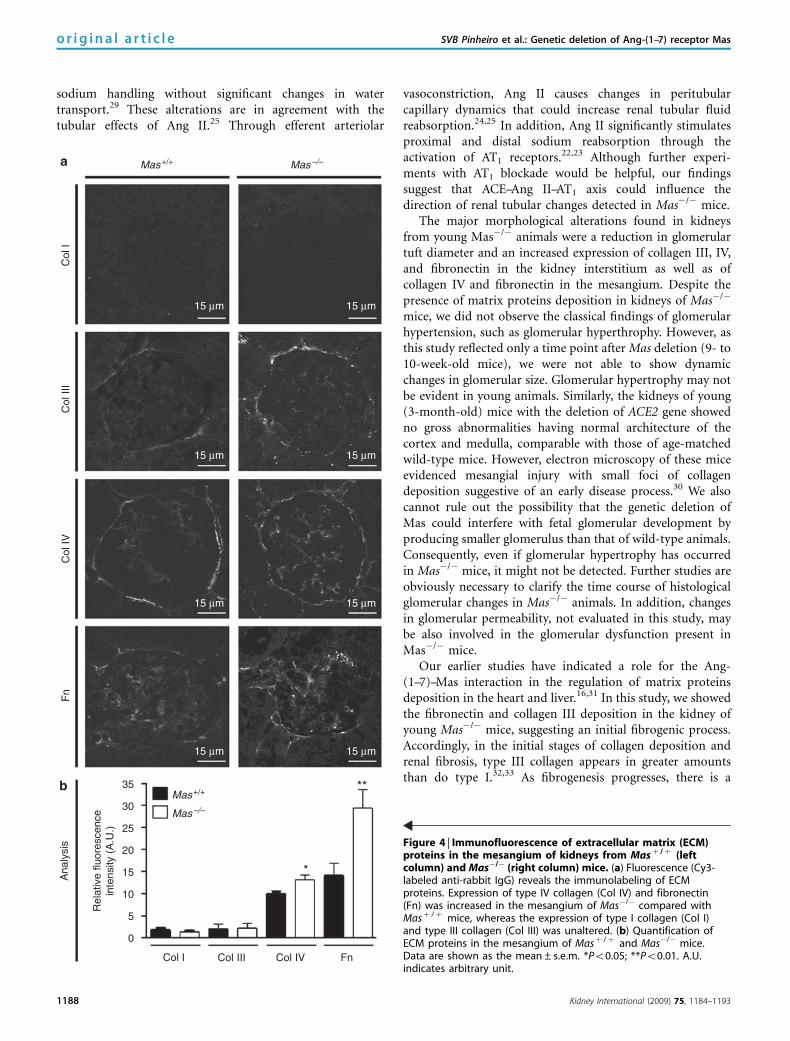
Masþ /þ animals (Figures 2 and 3). In the mesangium,Mas�/� kidneys exhibited a selective increase in collagen IV(13.25±0.99 versus 10.07±0.60 arbitrary units in Masþ /þ
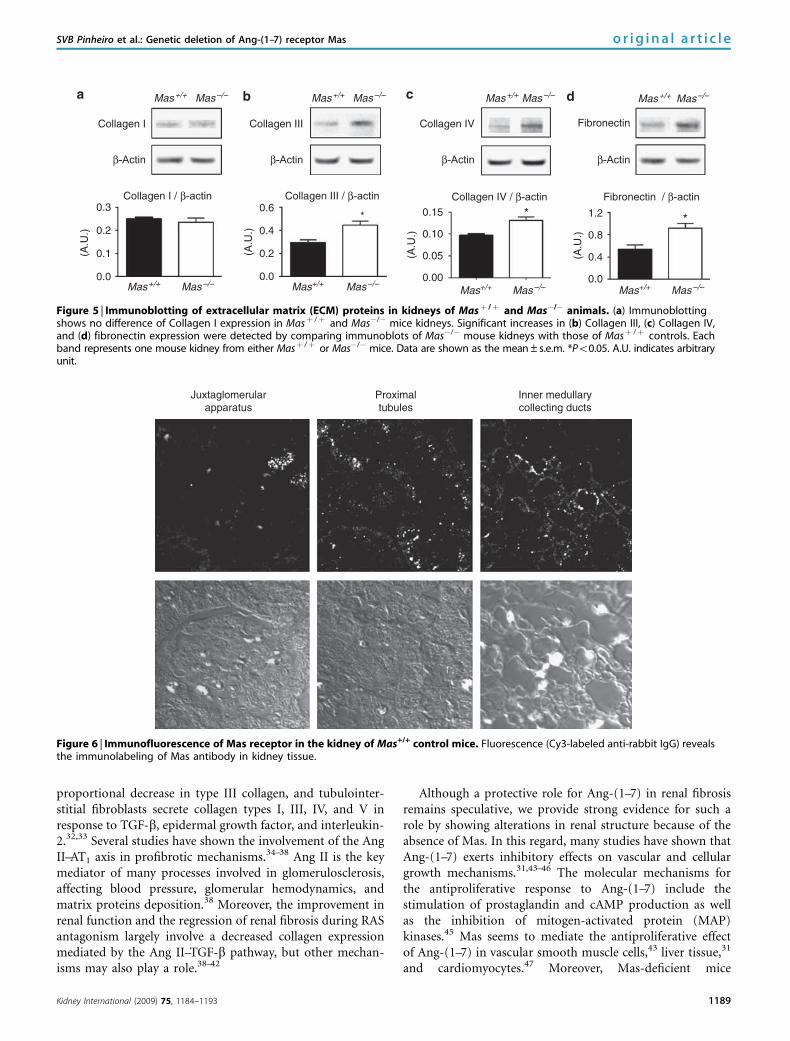
mice, Po0.05) and fibronectin (29.43±4.17 versus14.22±2.66 arbitrary units in Masþ /þ mice, Po0.05). Incontrast, collagen types I and III exhibited a similar pattern inthe mesangium in Mas�/� and Masþ /þ kidneys (Figure 4).As shown in Figure 5, results obtained with immunoblottingconfirmed the increased levels of fibronectin and collagentypes III and IV in Mas�/� animals.
Distribution of Mas in the kidney
To determine the distribution of Mas in the kidneys, confocalimmunofluorescence analysis of renal tissue from Masþ /þ
mice was performed. Mas immunolabeling was detected indifferent segments of the nephron, such as the juxtaglomer-ular apparatus, proximal cortical tubules, and collectingducts (Figure 6).
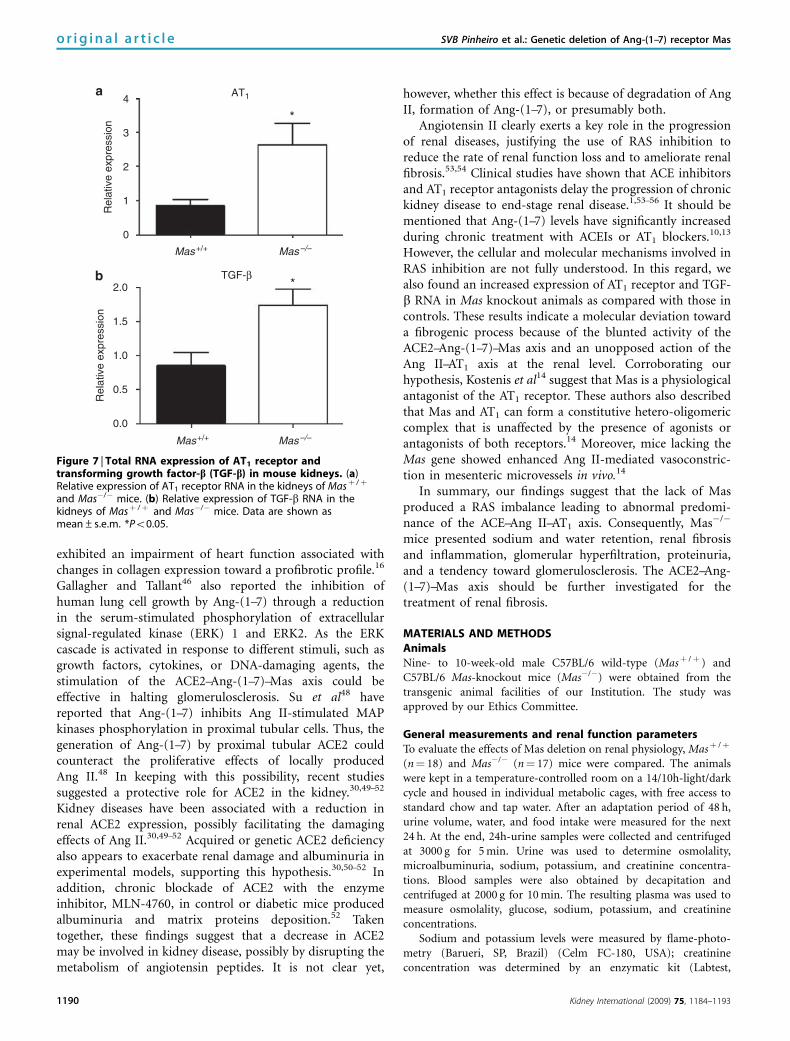
AT1 receptor and TGF-b RNA expression in the kidney
As observed in Figure 7, real-time PCR revealed a threefoldincrease in RNA expression of AT1 receptor and a twofoldelevation of total transforming growth factor-b (TGF-b)RNA in kidneys from Mas�/� mice compared with those inMasþ /þ mice (2.65±0.29 versus 0.85±0.19 relative expres-sion for AT1 RNA and 1.75±0.23 versus 0.85±0.17 relativeexpression for TGF-b RNA, Po0.05 for both comparisons).
DISCUSSION
Genetic deletion of the Ang-(1–7) receptor Mas produces anextremely rich phenotype that includes cardiac dysfunction,16
decreased baroreflex function, endothelial dysfunction,17
reduced reproductive function,18 increased thrombogen-esis,19 and, depending on the genetic background, increasedblood pressure and marked changes in lipid and glycidicmetabolism, leading to a metabolic syndrome-like state.17,20
Phenotypic differences have been reported according togenetic background. This is particularly true for bloodpressure and plasma glucose, which are increased in FVB/NMas�/�17,20 and are normal in C57BL/6 mice, as shown inthis study. These differences could be related to the fact thatC57BL/6 presents only one renin gene compared with twogenes of other mice strains, including FVB/N.21 However,despite the potentially lower sensitivity to the genetic deletionof Mas in C57BL/6 mice, we showed that Mas is critical for
Ana
lysi
s
Rel
ativ
e flu
ores
cenc
ein
tens
ity (
A.U
.)
***
*15
10
5
0
Col
I
Col I
Col
III
Col III
Col
IV
Col IV
Fn
Fn
Mas+/+ Mas–/–
Mas+/+
Mas–/–
20 µm
20 µm 20 µm
20 µm20 µm
20 µm 20 µm
20 µm
Figure 2 | Immunofluorescence of extracellular matrix (ECM)proteins in the cortex of kidneys from Masþ /þ (left column) andMas�/� (right column) mice. (a) Fluorescence (Cy3-labeled anti-rabbit IgG) reveals the immunolabeling of ECM proteins. Expression oftype III collagen (Col III), type IV collagen (Col IV), and fibronectin (Fn)were increased in the cortex of Mas�/� compared with that ofMasþ /þ mice, whereas the expression of type I collagen (Col I)was unaltered. (b) Quantification of ECM proteins in the cortex ofMasþ /þ and Mas�/� mice. Data are shown as mean±s.e.m.*Po0.05; **Po0.01. A.U. indicates arbitrary unit.
1186 Kidney International (2009) 75, 1184–1193
o r i g i n a l a r t i c l e SVB Pinheiro et al.: Genetic deletion of Ang-(1–7) receptor Mas
the regulation of renal homeostasis even in young animals.Our data suggest that the genetic deletion of Mas probablyleads to glomerular hypertension, and also producesstructural and molecular changes, which stimulates renal
fibrosis. Furthermore, the observed changes were not relatedto arterial hypertension or to hyperglycemia.
The ability of the kidney to generate high concentrationsof Ang II and Ang-(1–7) allows it to regulate intrarenal levelsof these angiotensins in accordance with homeostatic needsfor the regulation of renal hemodynamics.22,23 In thiscontext, Mas-deficient mice presented significant changes inrenal hemodynamic and in glomerular filtration. Whencompared with wild-type mice, Mas�/� animals had lowerrenal blood flow accompanied by elevated renal vascularresistance. Both alterations occurred along with a 1.8-foldincrease in GFR according to creatinine as well as inulinclearance measurements, and a 6.7-fold increase in urinaryalbumin excretion. As blood pressure was similar in Mas�/�
and in wild-type animals, the increased GFR in conjunctionwith reduced renal blood flow was probably because ofelevated vascular tonus in the efferent arterioles. Ang IImarkedly raises efferent glomerular arteriolar resistance butdoes not change afferent arteriolar resistance unless the renalperfusion pressure rises.24 The consequence of the dispropor-tionate increase in efferent (over afferent) resistance is amarked increase in intraglomerular pressure. Thus, the AngII-induced decrease in renal plasma flow is offset by theincrease in mean transcapillary ultrafiltration pressure andthis maintains or even increases the GFR.22–25 Ang-(1–7)directly and indirectly vasodilates afferent arterioles andincreases renal blood flow.26–28 Although the relative role ofeach angiotensin on glomerular hemodynamics is stillunknown, our results indicated that Ang-(1–7) may act as aphysiological regulator of intraglomerular pressure byopposing the glomerular hypertensive effects of Ang II.Therefore, without the physiological antagonism of Ang-(1–7), intrarenal and/or plasma Ang II, acting on higherexpressed AT1 receptors, might increase efferent arteriolarresistance and glomerular filtration pressure, thus contribut-ing to glomerular capillary hypertension.
Mas-knockout animals also exhibited lower urinaryvolume accompanied by sodium retention without BW gainwhen compared with controls. As young Mas�/� mice (9–10weeks of age) were used, it would be possible that thepersistence of these alterations could lead to edema and BWelevations in older animals. Moreover, no changes in serumosmolality, osmolal, or free-water clearance were observed,indicating that fluid retention reflects a direct effect on
Ana
lysi
s
Rel
ativ
e flu
ores
cenc
ein
tens
ity (
A.U
.)
*
**
*
15
30
25
20
10
5
0
Col
I
Col I
Col
III
Col III
Col
IV
Col IV
Fn
Fn
Mas+/+
20 µm
20 µm 20 µm
20 µm20 µm
20 µm 20 µm
20 µm
Mas–/–
Mas+/+
Mas–/–
Figure 3 | Immunofluorescence of extracellular matrix (ECM)proteins in the medulla of kidneys from Masþ / þ (left column)and Mas�/� (right column) mice. (a) Fluorescence (Cy3-labeledanti-rabbit IgG) reveals the immunolabeling of ECM proteins.Expression of type III collagen (Col III), type IV collagen (Col IV),and fibronectin (Fn) were increased in the medulla of Mas�/�
compared with that of Masþ /þ mice, whereas the expression oftype I collagen (Col I) was unaltered. (b) Quantification of ECMproteins in the medulla of Masþ /þ and Mas�/� mice. Data areshown as mean±s.e.m. *Po0.05; **Po0.01. A.U. indicatesarbitrary unit.
Kidney International (2009) 75, 1184–1193 1187
SVB Pinheiro et al.: Genetic deletion of Ang-(1–7) receptor Mas o r i g i n a l a r t i c l e
sodium handling without significant changes in watertransport.29 These alterations are in agreement with thetubular effects of Ang II.25 Through efferent arteriolar
vasoconstriction, Ang II causes changes in peritubularcapillary dynamics that could increase renal tubular fluidreabsorption.24,25 In addition, Ang II significantly stimulatesproximal and distal sodium reabsorption through theactivation of AT1 receptors.22,23 Although further experi-ments with AT1 blockade would be helpful, our findingssuggest that ACE–Ang II–AT1 axis could influence thedirection of renal tubular changes detected in Mas�/� mice.
The major morphological alterations found in kidneysfrom young Mas�/� animals were a reduction in glomerulartuft diameter and an increased expression of collagen III, IV,and fibronectin in the kidney interstitium as well as ofcollagen IV and fibronectin in the mesangium. Despite thepresence of matrix proteins deposition in kidneys of Mas�/�
mice, we did not observe the classical findings of glomerularhypertension, such as glomerular hyperthrophy. However, asthis study reflected only a time point after Mas deletion (9- to10-week-old mice), we were not able to show dynamicchanges in glomerular size. Glomerular hypertrophy may notbe evident in young animals. Similarly, the kidneys of young(3-month-old) mice with the deletion of ACE2 gene showedno gross abnormalities having normal architecture of thecortex and medulla, comparable with those of age-matchedwild-type mice. However, electron microscopy of these miceevidenced mesangial injury with small foci of collagendeposition suggestive of an early disease process.30 We alsocannot rule out the possibility that the genetic deletion ofMas could interfere with fetal glomerular development byproducing smaller glomerulus than that of wild-type animals.Consequently, even if glomerular hypertrophy has occurredin Mas�/� mice, it might not be detected. Further studies areobviously necessary to clarify the time course of histologicalglomerular changes in Mas�/� animals. In addition, changesin glomerular permeability, not evaluated in this study, maybe also involved in the glomerular dysfunction present inMas�/� mice.
Our earlier studies have indicated a role for the Ang-(1–7)–Mas interaction in the regulation of matrix proteinsdeposition in the heart and liver.16,31 In this study, we showedthe fibronectin and collagen III deposition in the kidney ofyoung Mas�/� mice, suggesting an initial fibrogenic process.Accordingly, in the initial stages of collagen deposition andrenal fibrosis, type III collagen appears in greater amountsthan do type I.32,33 As fibrogenesis progresses, there is a
Ana
lysi
s
Rel
ativ
e flu
ores
cenc
ein
tens
ity (
A.U
.)
*
**
15
30
35
25
20
10
5
0
Col
I
Col I
Col
III
Col III
Col
IV
Col IV
Fn
Fn
Mas+/+ Mas–/–
Mas+/+
Mas–/–
15 µm 15 µm
15 µm 15 µm
15 µm 15 µm
15 µm 15 µm
Figure 4 | Immunofluorescence of extracellular matrix (ECM)proteins in the mesangium of kidneys from Masþ /þ (leftcolumn) and Mas�/� (right column) mice. (a) Fluorescence (Cy3-labeled anti-rabbit IgG) reveals the immunolabeling of ECMproteins. Expression of type IV collagen (Col IV) and fibronectin(Fn) was increased in the mesangium of Mas�/� compared withMasþ /þ mice, whereas the expression of type I collagen (Col I)and type III collagen (Col III) was unaltered. (b) Quantification ofECM proteins in the mesangium of Masþ /þ and Mas�/� mice.Data are shown as the mean±s.e.m. *Po0.05; **Po0.01. A.U.indicates arbitrary unit.
1188 Kidney International (2009) 75, 1184–1193
o r i g i n a l a r t i c l e SVB Pinheiro et al.: Genetic deletion of Ang-(1–7) receptor Mas
proportional decrease in type III collagen, and tubulointer-stitial fibroblasts secrete collagen types I, III, IV, and V inresponse to TGF-b, epidermal growth factor, and interleukin-2.32,33 Several studies have shown the involvement of the AngII–AT1 axis in profibrotic mechanisms.34–38 Ang II is the keymediator of many processes involved in glomerulosclerosis,affecting blood pressure, glomerular hemodynamics, andmatrix proteins deposition.38 Moreover, the improvement inrenal function and the regression of renal fibrosis during RASantagonism largely involve a decreased collagen expressionmediated by the Ang II–TGF-b pathway, but other mechan-isms may also play a role.38–42
Although a protective role for Ang-(1–7) in renal fibrosisremains speculative, we provide strong evidence for such arole by showing alterations in renal structure because of theabsence of Mas. In this regard, many studies have shown thatAng-(1–7) exerts inhibitory effects on vascular and cellulargrowth mechanisms.31,43–46 The molecular mechanisms forthe antiproliferative response to Ang-(1–7) include thestimulation of prostaglandin and cAMP production as wellas the inhibition of mitogen-activated protein (MAP)kinases.45 Mas seems to mediate the antiproliferative effectof Ang-(1–7) in vascular smooth muscle cells,43 liver tissue,31
and cardiomyocytes.47 Moreover, Mas-deficient mice
Collagen I
0.3
0.2
0.1
0.0
(A.U
.)
(A.U
.)
(A.U
.)
(A.U
.)
0.6
0.4
0.2
0.0
Collagen IV
0.15
0.10
0.05
0.00
Collagen IV / β-actin
Fibronectin
*** 1.2
0.8
0.4
0.0
Fibronectin / β-actinCollagen III / β-actinCollagen I / β-actin
β-Actin
Collagen III
β-Actin
Mas–/–Mas+/+ Mas–/–Mas+/+
Mas–/–Mas+/+
Mas–/–Mas+/+
Mas–/–Mas+/+ Mas–/–Mas+/+Mas–/–Mas+/+
Mas–/–Mas+/+
β-Actin β-Actin
Figure 5 | Immunoblotting of extracellular matrix (ECM) proteins in kidneys of Masþ /þ and Mas�/� animals. (a) Immunoblottingshows no difference of Collagen I expression in Masþ /þ and Mas�/� mice kidneys. Significant increases in (b) Collagen III, (c) Collagen IV,and (d) fibronectin expression were detected by comparing immunoblots of Mas�/� mouse kidneys with those of Masþ /þ controls. Eachband represents one mouse kidney from either Masþ /þ or Mas�/� mice. Data are shown as the mean±s.e.m. *Po0.05. A.U. indicates arbitraryunit.
Juxtaglomerularapparatus
Inner medullarycollecting ducts
Proximaltubules
Figure 6 | Immunofluorescence of Mas receptor in the kidney of Mas+/+ control mice. Fluorescence (Cy3-labeled anti-rabbit IgG) revealsthe immunolabeling of Mas antibody in kidney tissue.
Kidney International (2009) 75, 1184–1193 1189
SVB Pinheiro et al.: Genetic deletion of Ang-(1–7) receptor Mas o r i g i n a l a r t i c l e
exhibited an impairment of heart function associated withchanges in collagen expression toward a profibrotic profile.16
Gallagher and Tallant46 also reported the inhibition ofhuman lung cell growth by Ang-(1–7) through a reductionin the serum-stimulated phosphorylation of extracellularsignal-regulated kinase (ERK) 1 and ERK2. As the ERKcascade is activated in response to different stimuli, such asgrowth factors, cytokines, or DNA-damaging agents, thestimulation of the ACE2–Ang-(1–7)–Mas axis could beeffective in halting glomerulosclerosis. Su et al48 havereported that Ang-(1–7) inhibits Ang II-stimulated MAPkinases phosphorylation in proximal tubular cells. Thus, thegeneration of Ang-(1–7) by proximal tubular ACE2 couldcounteract the proliferative effects of locally producedAng II.48 In keeping with this possibility, recent studiessuggested a protective role for ACE2 in the kidney.30,49–52
Kidney diseases have been associated with a reduction inrenal ACE2 expression, possibly facilitating the damagingeffects of Ang II.30,49–52 Acquired or genetic ACE2 deficiencyalso appears to exacerbate renal damage and albuminuria inexperimental models, supporting this hypothesis.30,50–52 Inaddition, chronic blockade of ACE2 with the enzymeinhibitor, MLN-4760, in control or diabetic mice producedalbuminuria and matrix proteins deposition.52 Takentogether, these findings suggest that a decrease in ACE2may be involved in kidney disease, possibly by disrupting themetabolism of angiotensin peptides. It is not clear yet,
however, whether this effect is because of degradation of AngII, formation of Ang-(1–7), or presumably both.
Angiotensin II clearly exerts a key role in the progressionof renal diseases, justifying the use of RAS inhibition toreduce the rate of renal function loss and to ameliorate renalfibrosis.53,54 Clinical studies have shown that ACE inhibitorsand AT1 receptor antagonists delay the progression of chronickidney disease to end-stage renal disease.1,53–56 It should bementioned that Ang-(1–7) levels have significantly increasedduring chronic treatment with ACEIs or AT1 blockers.10,13
However, the cellular and molecular mechanisms involved inRAS inhibition are not fully understood. In this regard, wealso found an increased expression of AT1 receptor and TGF-b RNA in Mas knockout animals as compared with those incontrols. These results indicate a molecular deviation towarda fibrogenic process because of the blunted activity of theACE2–Ang-(1–7)–Mas axis and an unopposed action of theAng II–AT1 axis at the renal level. Corroborating ourhypothesis, Kostenis et al14 suggest that Mas is a physiologicalantagonist of the AT1 receptor. These authors also describedthat Mas and AT1 can form a constitutive hetero-oligomericcomplex that is unaffected by the presence of agonists orantagonists of both receptors.14 Moreover, mice lacking theMas gene showed enhanced Ang II-mediated vasoconstric-tion in mesenteric microvessels in vivo.14
In summary, our findings suggest that the lack of Masproduced a RAS imbalance leading to abnormal predomi-nance of the ACE–Ang II–AT1 axis. Consequently, Mas�/�
mice presented sodium and water retention, renal fibrosisand inflammation, glomerular hyperfiltration, proteinuria,and a tendency toward glomerulosclerosis. The ACE2–Ang-(1–7)–Mas axis should be further investigated for thetreatment of renal fibrosis.
MATERIALS AND METHODSAnimalsNine- to 10-week-old male C57BL/6 wild-type (Masþ /þ ) andC57BL/6 Mas-knockout mice (Mas�/�) were obtained from thetransgenic animal facilities of our Institution. The study wasapproved by our Ethics Committee.
General measurements and renal function parametersTo evaluate the effects of Mas deletion on renal physiology, Masþ /þ
(n¼ 18) and Mas�/� (n¼ 17) mice were compared. The animalswere kept in a temperature-controlled room on a 14/10h-light/darkcycle and housed in individual metabolic cages, with free access tostandard chow and tap water. After an adaptation period of 48 h,urine volume, water, and food intake were measured for the next24 h. At the end, 24h-urine samples were collected and centrifugedat 3000 g for 5 min. Urine was used to determine osmolality,microalbuminuria, sodium, potassium, and creatinine concentra-tions. Blood samples were also obtained by decapitation andcentrifuged at 2000 g for 10 min. The resulting plasma was used tomeasure osmolality, glucose, sodium, potassium, and creatinineconcentrations.
Sodium and potassium levels were measured by flame-photo-metry (Barueri, SP, Brazil) (Celm FC-180, USA); creatinineconcentration was determined by an enzymatic kit (Labtest,
2.0
1.5
1.0
0.5
0.0
*
*
Mas+/+ Mas–/–
Mas+/+ Mas–/–
TGF-β
4
3
2
1
0
Rel
ativ
e ex
pres
sion
Rel
ativ
e ex
pres
sion
AT1
Figure 7 | Total RNA expression of AT1 receptor andtransforming growth factor-b (TGF-b) in mouse kidneys. (a)Relative expression of AT1 receptor RNA in the kidneys of Masþ /þ
and Mas�/� mice. (b) Relative expression of TGF-b RNA in thekidneys of Masþ /þ and Mas�/� mice. Data are shown asmean±s.e.m. *Po0.05.
1190 Kidney International (2009) 75, 1184–1193
o r i g i n a l a r t i c l e SVB Pinheiro et al.: Genetic deletion of Ang-(1–7) receptor Mas
Belo Horizonte, MG, Brazil); glucose levels were measured by Accu-Check glucometer (Roche Diagnostics, Indianapolis, IN, USA);microalbuminuria was determined by a latex immunoassay (GoldAnalisa, Belo Horizonte, MG, Brazil); and osmolality was deter-mined by a freezing-point osmometer (microOsmette, CalumetCity, IL, USA). Urinary fractional excretion of sodium andpotassium, osmolal clearance, free-water clearance, and creatinineclearance were calculated.
To confirm the GFR estimated by creatinine clearance, plasmainulin elimination kinetic was determined following a single bolusinjection of inulin57 in an additional group of Masþ /þ (n¼ 7) andMas�/�(n¼ 7) mice. The plasma inulin concentration wasmeasured at 5, 10, 20, and 45 min after bolus injection by theantron method.58 Inulin clearance was analyzed by using one-compartment model according to the formula: Inulin clearance¼ I/(A/a), where I is inulin quantity, A is the y-intercept value of thedecay rate and a is the decay constant. A nonlinear regression curve-fitting program (GraphPad Prism Software, USA) performed allcalculations.
Mean arterial pressure, renal blood flow, and total renal vascularresistance were determined in an additional group of Masþ /þ
(n¼ 10) and Mas�/� (n¼ 10) mice. MAP was recorded through afemoral arterial catheter connected to a data acquisition system(MP100-BIOPAC System Inc., Goleta, CA, USA). After 15 min ofbaseline MAP record, renal blood flow was measured by thefluorescent polystyrene microspheres (Molecular Probes, InvitrogenCorporation, Carlsbad, CA, USA) technique.59–61 Briefly, twodifferent colors of 15 mm fluorescent microspheres were selected toavoid spillover between colors.59 After mixing, 50,000 (50 ml)fluorescent microspheres were infused into the left ventricle over10 s. To calculate blood flow, arterial blood was withdrawn at a rateof 0.25 ml/min through the right femoral artery for 55 s, starting 10 sbefore microspheres injection. In the end, the animals were killed bylethal anesthesia. Kidneys were then removed, weighed, and placedin individual vials. Tissue and reference blood flow samples weredigested by 4 M ethanol-KOH and 2% Tween 80 solution and kept ina hot bath (501C) overnight. The microspheres were then recoveredby the sedimentation method60 and the dye was extracted with 4 mlof an organic solvent ethyl-acetate. The fluorescence intensity wasmeasured by luminescence spectrophotometry (Spex Fluoromax,HORIBA Jobin Yvon Inc., Edison, NJ, USA) and renal blood flowwas calculated, as described earlier.59–61 The total renal vascularresistance was calculated by the ratio between MAP and renal bloodflow of each animal.
Renal structureTo evaluate renal structure, histomorphometrical, immunohisto-chemical, and immunoblotting analyses were performed on kidneysfrom Masþ /þ (n¼ 4) and Mas�/� (n¼ 4) mice.
Histomorphometry. Both kidneys of each animal were im-mediately removed; mean wet weights were recorded and normal-ized for BW (mg/g). Kidneys from each group were left in 4% Bouinfixative for 24 h at room temperature. The tissues were dehydratedby sequential washes with graded ethanol concentrations andembedded in paraffin. Cross–sections (5mm) were cut from themiddle area of the kidney and stained with Masson’s trichrome. Thetissue sections were examined under light microscope (BX60,Olympus, Center Valley, PA, USA) at � 400 magnification andphotographed (Qcolor3, Olympus). The diameter of Bowman’scapsule and the glomerular tuft from the glomerulus cut in vascularpole planes (mean of 15 glomeruli per kidney) as well as the
diameter of the proximal cortical tubules (mean of 40 segments perkidney) were analyzed using Image Pro-Express software.
Immunohistochemistry. Immunofluorescence-labeling andquantitative confocal microscopy evaluated the distribution andamount of collagen types I, III, IV, and fibronectin in Masþ /þ andMas�/� mice kidneys. The same methodology was described earlierfor collagen I and III in human scars and normal skins.62 Briefly, thekidneys were obtained from Masþ /þ and Mas�/� mice, washed inphosphate-buffered saline to eliminate blood, and cryofixed in 80%methanol and 20% dimethyl-sulfoxide at �801C. The samples werestored at �801C for 7 days, moved to �201C for 1 day, washedthrice in 99.9% ethanol at room temperature, twice in xylene, andthen embedded in paraffin. Sections of 5–8 mm were mounted onslides, deparaffinized with xylene, rehydrated through graded seriesof ethanol to phosphate-buffered saline and then incubated in ablocking solution (1% bovine serum albumin and 0.1% Tween 20)at room temperature for 1 h. The sections were incubated overnightat 41C with one of the following primary antibodies (RocklandImmunochemicals Inc., Gilbertsville, PA, USA): rabbit anti-humancollagen I (1:200, cat. no. 600-401-103-0.5), rabbit anti-humancollagen III (1:200, cat. no. 600-401-105-0.1), rabbit anti-humancollagen IV (1:200, cat. no. 600-401-106-0.1), or rabbit anti-humanfibronectin (1:200, cat. no. 600-117-0.1). All antibodies were dilutedwith blocking solution (1:10). After five rinses in phosphate-buffered saline, donkey anti-rabbit IgG-conjugated with Cy3 (cat.no. 711-165-152, Jackson Immunoresearch, West Grove, PA, USA)was added for 1 h in the dark at room temperature. Followingwashes with phosphate-buffered saline, the sections were mountedin 90% glycerol/10% Tris 1 M, and images were captured through aconfocal microscope (Zeiss LSM 510, Carl Zeiss Inc., GottingenGermany), � 40 objective, and � 400 original magnification. Allconfocal settings were determined at the beginning of the imagingsession and remained unchanged. For quantitative analysis, theimages were captured at 8 bits and analyzed in a gray scale. Fourimages were captured from each kidney region and threemeasurements were obtained for each image. Scion Image Beta4.02 software (Scion Corporation, NIH-USA) was used to quantifyfluorescence intensity and area. Background fluorescence wassubtracted from the region of interest. The intensity of fluorescencecorresponded to the unit ‘gray level,’ varying from 0 (black) to 255(white), as an average of the area (sum of gray value of all pixelsdivided by the number of pixels/area).
Immunoblotting. Equal amounts of protein (50mg) of eachkidney sample were prepared for electrophoresis with a sample bufferNuPAGE LDS (Invitrogen Corporation, Carlsbad, CA, USA) plus 10%b-mercaptoethanol, and incubated at 701C for 10 min. As describedearlier,63 the samples were loaded into bis-Tris NuPAGE 4–12% gels(Invitrogen) and submitted to electrophoresis, followed by transfer tonitrocellulose membranes (Hybond ECL, Amersham PharmaciaBiotech, Chalfont St Giles, UK). Protein loading and efficiency of blottransfer were monitored by staining with Ponceau S (Sigma Chemical,St Louis, MO, USA). The membranes were blocked for 45 min with tris-buffered saline 0.1%Tween-20 plus 5%non-fat milk. The membraneblots were incubated overnight at 41C with the same antibodies used onimmunohistochemistry (anti-collagen I, 1:5000; anti-collagen III,1:5000; anti-collagen IV, 1:1000; anti-fibronectin, 1:5000; and anti-b-actin, 1:7000), diluted in tris-buffered saline 0.1% Tween-20. Themembranes were then washed and incubated for 1 h at roomtemperature with horseradish peroxidase-conjugated secondary anti-body, goat anti-rabbit IgG (1:15,000). The membranes were submittedto chemiluminescent detection with ECL Plus (Amersham Biosciences,
Kidney International (2009) 75, 1184–1193 1191
SVB Pinheiro et al.: Genetic deletion of Ang-(1–7) receptor Mas o r i g i n a l a r t i c l e
Chalfont St Giles, UK) and visualized on ImageQuant. Densitometricanalysis was carried out using Scion Image Beta 4.0.2 software.
Mas distribution in the kidneyImmunofluorescence analysis was carried out in four kidneys fromMasþ /þ mice to assess the localization of Mas. The sameprocedures described earlier for immunofluorescence analysis ofextracellular matrix proteins were carried out to prepare the kidneysections. Immunofluorescence labeling and quantitative confocalmicroscopy were then carried out to determine the distribution ofMas in renal tissue, using a specific Mas antibody (NovusBiologicals, Littleton, CO, USA).
RNA expression for AT1 receptor and TGF-bTotal RNA expression of AT1 receptor and TGF-b in the kidney wasevaluated by retrotranscription and real-time PCR assays in fiveanimals of each group. Total RNA was prepared using the TRIzolreagent (Invitrogen). RNA samples were reverse transcribed withMML-V (Invitrogen). The endogenous hypoxanthine guaninephosphoribosyltransferase (HPRT, internal control), AT1, andTGF-b cDNA were amplified using specific primers and the SYBRGreen reagent (Applied Biosystem, Carlsbad, CA, USA) in an ABIPrism 7000 platform (Applied Biosystem). AT1 primers: forward,ATGGCTGGCATTTTGTCTGG; reverse, GTTGAGTTGGTCTCAGACAC. TGF-b primers: forward, GGTTCATGTCATGGATGGTGC;reverse, TGACGTCACTGGAGTTGTAGGG. HPRT primers: for-ward, GTTGGATACAGGCCAGACTTTGTT; reverse, GATTCAACTTGCGCTCATCTTAGGC.
Statistical analysisData were expressed as mean±s.e.m. or median. Values withGaussian distribution were analyzed using the unpaired Student’st-test. Non-Gaussian variables were expressed as medians andcompared using the Mann–Whitney test. Values of Po0.05 wereconsidered significant and adjusted by Bonferroni’s correctionaccording to the number of comparisons.
DISCLOSUREAll the authors declared no competing interests.
ACKNOWLEDGMENTSThis study was financially supported by FAPEMIG (Fundacao deAmparo a Pesquisa do Estado de Minas Gerais, Brazil), CNPq(Conselho Nacional de Desenvolvimento Cientıfico e Tecnologico,Brazil), PRONEX (Programa de Grupos de Excelencia-FINEP, Brazil)and DFG (Deutsche Forschungsgemeinschaft, Germany).
REFERENCES1. Zaman MA, Oparil S, Calhoun DA. Drugs targeting the renin angiotensin
aldosterone system. Nat Rev Drug Discov 2002; 1: 621–636.2. Ferrario CM, Chappell MC. Novel angiotensin peptides. Cell Mol Life Sci
2004; 61: 2720–2727.3. Simoes e Silva AC, Pinheiro SVB, Pereira RM et al. The therapeutic
potential of Angiotensin-(1–7) as a novel renin angiotensin system
mediator. Mini-Rev Med Chem 2006; 6: 603–609.4. Santos RAS, Ferreira AJ, Simoes e Silva AC. Recent advances in the
angiotensin-converting enzyme 2-angiotensin(1–7)-Mas axis. Exp Physiol
2008; 93: 519–527.5. Albiston AL, McDowall SG, Matsacos D et al. Evidence that the
angiotensin IV (AT(4)) receptor is the enzyme insulin-regulated
aminopeptidase. J Biol Chem 2001; 276: 48623–48626.6. Donoghue M, Hsieh F, Baronas E et al. A novel angiotensin-converting
enzyme-related carboxypeptidase (ACE2) converts angiotensin I to
angiotensin-(1–9). Circ Res 2000; 87: 1–9.
7. Tipnis SR, Hooper NM, Hyde R et al. A human homolog of Angiotensin-converting enzyme. Cloning and functional expression as a captopril-insensitive carboxypeptidase. J Biol Chem 2000; 275: 33238–33243.
8. Santos RAS, Simoes e Silva AC, Maric C et al. Angiotensin-(1–7) is anendogenous ligand for the G-protein coupled receptor Mas. Proc NatlAcad Sci USA 2003; 100: 8258–8263.
9. Simoes e Silva AC, Diniz JS, Regueira-Filho A et al. The Renin AngiotensinSystem in childhood hypertension: Selective increase of Angiotensin-(1–7)in essential hypertension. J Pediatr 2004; 145: 93–98.
10. Simoes e Silva AC, Diniz JS, Pereira RM et al. Circulating Renin AngiotensinSystem in childhood chronic renal failure: Marked increase ofAngiotensin-(1–7) in end-stage renal disease. Pediatr Res 2006; 60:734–739.
11. Maia LG, Ramos MC, Fernandes L et al. Angiotensin-(1–7) antagonistA-779 attenuates the potentiation of bradykinin by captopril in rats.J Cardiovasc Pharmacol 2004; 43: 685–691.
12. Hocht C, Gironacci MM, Mayer MA et al. Involvement of angiotensin-(1–7)in the hypothalamic hypotensive effect of captopril in sinoaorticdenervated rats. Regul Pept 2008; 146: 58–66.
13. Ishiyama Y, Gallagher PE, Averill DB et al. Upregulation of angiotensin-converting enzyme 2 after myocardial infarction by blockade ofangiotensin II receptors. Hypertension 2004; 43: 970–976.
14. Kostenis E, Milligan G, Christopoulos A et al. G-protein-coupled receptorMas is a physiological antagonist of the angiotensin II type 1 receptor.Circulation 2005; 111: 1806–1813.
15. Canals M, Jenkins L, Kellett E et al. Up-regulation of the angiotensin IItype 1 receptor by the Mas proto-oncogene is due to constitutiveactivation of Gq/G11 by Mas. J Biol Chem 2006; 281: 16757–16767.
16. Santos RAS, Castro CH, Gava E et al. Impairment of in vitro and in vivoheart function in angiotensin-(1–7) receptor Mas knockout mice.Hypertension 2006; 47: 996–1002.
17. Xu P, Costa-Goncalves AC, Todiras M et al. Endothelial dysfunction andelevated blood pressure in Mas gene-deleted mice. Hypertension 2008;51: 574–580.
18. Costa Goncalves AC, Leite R, Fraga-Silva RA et al. Evidence that thevasodilator angiotensin-(1–7)-Mas axis plays an important role in erectilefunction. Am J Physiol Heart Circ Physiol 2007; 293: H2588–H2596.
19. Fraga-Silva RA, Pinheiro SV, Goncalves AC et al. The antithrombotic effectof angiotensin-(1–7) involves Mas-mediated NO release from platelets.Mol Med 2008; 14: 28–35.
20. Santos SH, Fernandes LR, Mario EG et al. Mas deficiency in FVB/N miceproduces marked changes in lipid and glycemic metabolism. Diabetes2008; 57: 340–347.
21. Hansen PB, Yang T, Huang Y et al. Plasma renin in mice with one or tworenin genes. Acta Physiol Scand 2004; 181: 431–437.
22. Navar LG, Nishiyama A. Why are angiotensin concentrations so high inthe kidney? Curr Opin Nephrol Hypertens 2004; 13: 107–115.
23. Brewster UC, Perazella MA. The renin-angiotensin-aldosteronesystem and the kidney: effects on kidney disease. Am J Med 2004; 116:263–272.
24. Arendshorst WJ, Brannstrom K, Ruan X. Actions of angiotensin II on therenal microvasculature. J Am Soc Nephrol 1999; (Suppl 11): S149–S161.
25. Hall JE, Brands MW, Henegar JR. Angiotensin II and long-term arterialpressure regulation: the overriding dominance of the kidney. J Am SocNephrol 1999; (Suppl 12): S258–S265.
26. Ren Y, Garvin JL, Carretero AO. Vasodilator action of angiotensin-(1–7) onisolated rabbit afferent arterioles. Hypertension 2002; 39: 799–802.
27. Sampaio WO, Nascimento AA, Santos RAS. Systemic and regionalhemodynamics effects of angiotensin-(1–7) in rats. Am J Physiol 2003;284: H1985–H1994.
28. Gironacci MM, Adler-Graschinsky E, Pena C et al. Effects of angiotensin IIand angiotensin-(1–7) on the release of [3H]norepinephrine from rat atria.Hypertension 1994; 24: 457–460.
29. Frokiaer J, Nielsen S, Knepper MA. Molecular physiology of renalaquaporins and sodium transporters: Exciting approaches to understandregulation of renal water handling. J Am Soc Nephrol 2005; 16: 2827–2829.
30. Oudit GY, Herzenberg AM, Kassiri Z et al. Loss of angiotensin-convertingenzyme-2 leads to the late development of angiotensin II-dependentglomerulosclerosis. Am J Pathol 2006; 168: 1808–1820.
31. Pereira RM, Santos RAS, Teixeira MM et al. The Renin Angiotensin Systemin a rat model of hepatic fibrosis: Evidence for a protective role ofAngiotensin-(1–7). J Hepatol 2007; 46: 674–681.
32. Kuncio GS, Neilson EG, Haverty TP. Mechanisms of tubulointerstitialfibrosis. Kidney Int 1992; 39: 550–556.
33. Harris RC, Neilson EG. Toward a unified theory of renal progression. AnnuRev Med 2006; 57: 365–380.
1192 Kidney International (2009) 75, 1184–1193
o r i g i n a l a r t i c l e SVB Pinheiro et al.: Genetic deletion of Ang-(1–7) receptor Mas
34. Fakhouri F, Placier S, Ardaillou R et al. Angiotensin II activates collagentype I gene in the renal cortex and aorta of transgenic mice throughinteraction with endothelin and TGF-b. J Am Soc Nephrol 2001; 12:2701–2710.
35. Remuzzi A, Gagliardini E, Donadoni C et al. Effect of angiotensin IIantagonism on the regression of kidney disease in the rat. Kidney Int2002; 62: 885–894.
36. Boffa JJ, Lu Y, Placier S et al. Regression of renal vascular and glomerularfibrosis: Role of Angiotensin II receptor antagonism and matrixmetalloproteinases. J Am Soc Nephrol 2003; 14: 1132–1144.
37. Chen S, Lee JS, Iglesias-de la Cruz MCI et al. Angiotensin II stimulatesa3(IV) collagen production in mouse podocytes via TGF-b and VEGFsignaling: implications for diabetic glomerulopathy. Nephrol DialTransplant 2005; 20: 1320–1328.
38. Ma LJ, Fogo A. Modulation of glomerulosclerosis. Semin Immunopathol2007; 29: 385–395.
39. Border WA, Okuda S, Languino LR et al. Suppression of experimentalglomerulonephritis by antiserum against transforming growth factorbeta 1. Nature 1990; 346: 371–374.
40. Wolf G. Renal injury due to renin-angiotensin-aldosterone systemactivation of the transforming growth factor-beta pathway. Kidney Int2006; 70: 1914–1919.
41. August P, Suthanthiran M. Transforming growth factor beta andprogression of renal disease. Kidney Int 2003; (Suppl 87): S99–S104.
42. Liu Y. Renal fibrosis: new insights into the pathogenesis and therapeutics.Kidney Int 2006; 69: 213–217.
43. Tallant EA, Ferrario CM, Gallagher PE. Angiotensin-(1–7) inhibits growth ofcardiac myocytes through activation of the Mas receptor. Am J Physiol2005; 289: 1560–1566.
44. Machado RD, Ferreira MA, Belo AV et al. Vasodilator effect of angiotensin-(1–7) in mature and sponge-induced neovasculature. Regul Pept 2002;107: 105–113.
45. Tallant EA, Clark MA. Molecular mechanisms of inhibition of vasculargrowth by angiotensin-(1–7). Hypertension 2003; 42: 574–579.
46. Gallagher PE, Tallant EA. Inhibition of human lung cancer cell growth byangiotensin-(1–7). Carcinogenesis 2004; 25: 2045–2052.
47. Iwata M, Cowling RT, Gurantz D et al. Angiotensin-(1–7) binds to specificreceptors on cardiac fibroblasts to initiate antifibrotic and antitrophiceffcts. Am J Physiol 2005; 289: 2356–2363.
48. Su Z, Zimpelmann J, Burns KD. Angiotensin-(1–7) inhibits angiotensin II-stimulated phosphorylation of MAP kinases in proximal tubular cells.Kidney Int 2006; 69: 2212–2218.
49. Wysocki J, Ye M, Soler MJ et al. ACE and ACE2 activity in diabetic mice.Diabetes 2006; 55: 2132–2139.
50. Ye M, Wysocki J, William J et al. Glomerular localization and expression ofAngiotensin-converting enzyme 2 and Angiotensin-converting enzyme:implications for albuminuria in diabetes. J Am Soc Nephrol 2006; 17:3067–3075.
51. Wong DW, Oudit GY, Reich H et al. Loss of angiotensin-convertingenzyme-2 (Ace2) accelerates diabetic kidney injury. Am J Pathol 2007;171: 438–451.
52. Soler MJ, Wysocki J, Ye M et al. ACE2 inhibition worsens glomerular injuryin association with increased ACE expression in streptozotocin-induceddiabetic mice. Kidney Int 2007; 72: 614–623.
53. Anderson S, Meyer TW, Rennke HG et al. Control of glomerularhypertension limits glomerular injury in rats with reduced renal mass.J Clin Invest 1985; 76: 612–619.
54. Taal MW, Brenner BM. Renoprotective benefits of RAS inhibition:from ACEI to angiotensin II antagonists. Kidney Int 2000; 57:1803–1817.
55. Azizi M, Menard J. Combined blockade of the Renin Angiotensin Systemwith Angiotensin-converting enzyme inhibitors and Angiotensin II type 1receptor antagonists. Circulation 2004; 109: 2492–2499.
56. Codreanu I, Perico N, Remuzzi G. Dual blockade of the renin-angiotensinsystem: the ultimate treatment for renal protection? J Am Soc Nephrol2005; (Suppl 1): S34–S38.
57. Qi Z, Whitt I, Mehta A et al. Serial determination of glomerular filtrationrate in conscious mice using FITC-Inulin clearance. Am J Physiol RenalPhysiol 2004; 286: 590–596.
58. Davidson WD, Sackner MA. Simplification of the anthrone method for thedetermination of inulin in clearance studies. J Lab Clin Med 1963; 62:351–356.
59. Gervais M, Demolis SP, Domerg V et al. Systemic and regionalhemodynamics assessment in rats with fluorescent microspheres.J Cardiovasc Pharmacol 1999; 33: 425–432.
60. Glenny RW, Bernard S, Brinkley M. Validation of fluorescent-labeledmicrospheres for measurement of regional organ perfusion. J Appl Physiol1993; 74: 2585–2597.
61. Van Oosterhout MFM, Willigers MM, Renaman RS et al. Fluorescentmicrospheres to measure organ perfusion: validation of a simplifiedsample processing technique. Am J Physiol Heart Circ Physiol 1995; 269:H725–H733.
62. de Oliveira GV, Sanford AP, Murphy KD et al. Growth hormone effects onhypertrophic scar formation: a randomized controlled trial of 62 burnedchildren. Wound Repair Regen 2004; 12: 404–411.
63. Souza BR, Motta BS, Rosa DVF et al. DARPP-32 and NCS-1 expression isnot altered in brains of rats treated with typical or atypical antipsychotics.Neurochem Res 2008; 33: 533–538.
Kidney International (2009) 75, 1184–1193 1193
SVB Pinheiro et al.: Genetic deletion of Ang-(1–7) receptor Mas o r i g i n a l a r t i c l e
Related Documents


![Glomerular Function and Structure in Living Donors ... · glomerular filtration rate (SNGFR) and glomerular capillary hydraulic pressure (P GC)[3]. Further insights into glomerular](https://static.cupdf.com/doc/110x72/5ed58c3d3f40d10acd516aa6/glomerular-function-and-structure-in-living-donors-glomerular-filtration-rate.jpg)