1 FY 3/2016 Summary of Consolidated Financial Results May 11, 2016 Company Name Wacom Co., Ltd. (Code Number: 6727 TSE1) (URL http://www.wacom .com ) Representative: Masahiko Yamada, CEO TEL: 03-5337-6502 Contact: Toru Ando, CFO Scheduled Date of General Shareholders’ Meeting: June 22, 2016 Preparation of Supplemental Explanatory Material for Financial Results: Yes Holding of Large Meeting for Financial Results: Yes 1. FY 3/16 Consolidated Financial Results (April 1, 2015 – March 31, 2016) (1) Business Performance (Consolidated) (Round off to mY) Sales Operating income Ordinary income Profit attributable to owners of parent FY 3/16 mY % mY % mY % mY % 77,568 4.0 3,664 -40.3 3,777 -37.7 2,310 -33.5 FY 3/15 74,557 -5.2 6,143 -29.1 6,065 -26.8 3,473 -33.8 (Note) Comprehensive income FY 3/16 1 ,438 mY (-62.4%) FY 3/15 3 ,821 mY (-43.8%) Net Profit per Share Outstanding Net Profit per Diluted Share Outstanding Return on Equity (ROE) Total Asset Recurring profit ratio Operating Profit Margin Yen Sen Yen Sen % % % FY 3/16 14.00 13.99 7.1 7.3 4.7 FY 3/15 20.86 20.82 10.5 11.9 8.2 (For Ref.) Equity in net income of affiliates FY 3/16 - mY FY 3/15 - mY (2) Financial Position (Consolidated) Total Assets Net Assets Capital Ratio Net Assets per Share mY mY % Yen Sen FY 3/16 51,567 31,096 60.0 188.22 FY 3/15 51,457 33,859 65.4 202.14 (For Ref.) Capital: FY3/16 30,959 mY FY 3/15 33,678 mY (3) Cash Flow (Consolidated) Operating Cash Flow Investing Cash Flow Financing Cash Flow Cash & Cash Equivalent mY mY mY mY FY 3/16 2,009 -4,878 1,209 14,365 FY 3/15 6,782 -3,278 -2,850 16,687 2. Dividend Dividend Per Share FY Amount of dividend Payout ratio Dividend on equity ratio (Record date) 1Q 2Q 3Q End of FY FY Total FY 3/15 Yen Sen - Yen Sen 0.00 Yen Sen - Yen Sen 18.00 Yen Sen 18.00 mY 2,999 % 86.3 % 9.0 FY 3/16 - 0.00 - 18.00 18.00 2,961 128.6 9.2 FY 3/17 (estimates) - 0.00 - 18.00 18.00 98.7

Welcome message from author
This document is posted to help you gain knowledge. Please leave a comment to let me know what you think about it! Share it to your friends and learn new things together.
Transcript

1
FY 3/2016 Summary of Consolidated Financial Results
May 11, 2016
Company Name Wacom Co., Ltd. (Code Number: 6727 TSE1) (URL http://www.wacom .com ) Representative: Masahiko Yamada, CEO TEL: 03-5337-6502 Contact: Toru Ando, CFO Scheduled Date of General Shareholders’ Meeting: June 22, 2016 Preparation of Supplemental Explanatory Material for Financial Results: Yes Holding of Large Meeting for Financial Results: Yes
1. FY 3/16 Consolidated Financial Results (April 1, 2015 – March 31, 2016)
(1) Business Performance (Consolidated) (Round off to mY)
Sales Operating income Ordinary income Profit attributable to owners of parent
FY 3/16
mY % mY % mY % mY %
77,568 4.0 3,664 -40.3 3,777 -37.7 2,310 -33.5
FY 3/15 74,557 -5.2 6,143 -29.1 6,065 -26.8 3,473 -33.8
(Note) Comprehensive income FY 3/16 1 ,438 mY (-62.4%) FY 3/15 3 ,821 mY (-43.8%)
Net Profit per Share Outstanding
Net Profit per Diluted Share Outstanding
Return on Equity (ROE)
Total Asset Recurring profit ratio
Operating Profit Margin
Yen Sen Yen Sen % % % FY 3/16 14.00 13.99 7.1 7.3 4.7
FY 3/15 20.86 20.82 10.5 11.9 8.2
(For Ref.) Equity in net income of affiliates FY 3/16 - mY FY 3/15 - mY
(2) Financial Position (Consolidated)
Total Assets
Net Assets
Capital Ratio Net Assets per Share
mY mY % Yen Sen
FY 3/16 51,567 31,096 60.0 188.22
FY 3/15 51,457 33,859 65.4 202.14 (For Ref.) Capital: FY3/16 30,959 mY FY 3/15 33,678 mY
(3) Cash Flow (Consolidated)
Operating Cash Flow
Investing Cash Flow
Financing Cash Flow
Cash & Cash Equivalent
mY mY mY mY FY 3/16 2,009 -4,878 1,209 14,365
FY 3/15 6,782 -3,278 -2,850 16,687
2. Dividend
Dividend Per Share FY Amount
of dividend
Payout
ratio Dividend on equity
ratio (Record date) 1Q 2Q 3Q End of FY FY Total
FY 3/15
Yen Sen
- Yen Sen
0.00 Yen Sen
- Yen Sen
18.00 Yen Sen
18.00 mY
2,999 %
86.3 %
9.0
FY 3/16 - 0.00 - 18.00 18.00 2,961 128.6 9.2 FY 3/17 (estimates) - 0.00 - 18.00 18.00 98.7

2
3. Consolidated Business Forecasts of FY 3/17 (April 1, 2016 – March 31, 2017)
Sales
Operating Income
Ordinary
Income
Net Profit Attri Stockholders
butable to
Net Profit Per Share
Outstanding mY % mY % mY % mY % Yen Sen
2Q (1H FY 3/17)
37,230
-4.4
100
-95.1
70
-96.7
50
-96.0
0.30
Full Year 82,000 5.7 4,200 14.6 4,140 9.6 3,000 29.9 18.24
4. Other
1) Reclassification of significant subsidiaries during the period (Reclassification due to the
change in scope of consolidation) : No
2) Changes in accounting principles, procedures and methods of presentation in consolidated financial statement ・Changes resulting from revisions in accounting standards : Yes
・Changes other than those above : No ・Changes resulting from accounting estimates : No
・Changes resulting from restatements : No
3) Numbers of shares outstanding (Common stock)
Number of shares outstanding at end of year (Including treasury stock):
Shares Shares FY 3/16 169,046,400 FY 3/15 169,046,400
Number of treasury stock outstanding at end of year:
Shares Shares FY 3/16 4,568,000 FY 3/15 2,438,000
Number of average shares for fiscal period:
Shares Shares FY 3/16 164,983,548 FY 3/15 166,476,833
* Regarding the implementation of review procedures
These financial results are not subject to review procedures. Thus, at the time of disclosure
of these financial results, the financial statement review procedures based on “Financial
Instruments and Exchange Law” have not been completed.
* Forward-looking statements regarding future events and performance contained in this
presentation are based on currently available information and involve risks and uncertainties.
Please note that actual results could materially differ from those expressed or implied by
the forward-looking statements in this presentation due to these risks and uncertainties.
(Accompanying data)
Consolidated Balance Sheet (Summary), Consolidated Profit and Loss Statement (Summary),
Consolidated Comprehensive Income Statement , Consolidated Statement of Changes in
Shareholder’s Equity, Consolidated Cash Flow Statement (Summary), Segment Information and
Other information, and Complementary Information
3
Qualitative Information and Financial Statements Consolidated business performance Note: All comparisons are with the same period of the previous fiscal year unless otherwise stated. Amounts for financial results are rounded to the nearest million yen.
In the current fiscal year under review (April 1, 2015 to March 31, 2016), the global economy maintained a slow recovery through to the third quarter, mainly in developed countries. Since the fourth quarter, however, uncertainties in the global economy have been increasing, driven by further economic slowdown in emerging countries including China, a worsening situation with unsolved refugees issues in Europe, and the fall in crude oil prices. The yen strengthened against the dollar in the fourth quarter, having also appreciated against Asian currencies from the third quarter. It remained strong against the euro throughout the fiscal year. In the IT industry, the penetration of mobile products, cloud computing and SNS (Social Networking Services) drove structural changes in the competitive environment, which in turn caused major changes in our business environment. In the Creative Business area in our Brand Business segment, digital content creation for the movie, comic and game application sectors has been expanding into emerging countries such as Asia and South America. In developed countries, we are seeing a shift in application usage from 2D to 3D following the spread of interest in 3D content, which is directing significant attention to digital pens as an advantageous input device for intuitive work. Furthermore, the design environment is expanding from conventional desktop computers to mobile devices based on cloud computing. It is also accelerating the progress in color management functions, which can improve work efficiency. In the Consumer Business area, the use of the stylus has been expanding as the digital stationery of choice, owing to the ease with which users can take notes and draw on tablets. In addition, we have opened up a new digital stationery market, featuring a product that can harmonize analog and digital information, transforming hand-written analog ideas on paper into digital data on screen via cloud computing, ready for editing, sharing, and storing.
In the Business Solution area, demand for cost-effective paperless procedures and improved digital signature security is growing across a broad range of sectors, including medicine, education and finance. Against this background, the adoption of digital signatures using LCD signature tablet products is growing as they are seen as effective ways to improve information security while reducing document handling costs via digital workflow.
In the Technology Solution Business segment, the low- and mid-end smartphone market grew rapidly, especially in emerging countries, while the high-end smartphone market saw a slowdown, leading to fierce competition and a rapid change in industry structure. The tablet market continued to stagnate due to weak sales of Android OS. The notebook PC market also experienced slow sales due to factors such as a prolonged upgrade cycle and an increasing shift in demand to a ‘2 in 1’ tablet market. However, there is a steadily growing demand for digital pen technology that enables users not only to read from, but also to write on screens for business and educational purposes mainly in the tablet market. In the stationery area with a wide range of users, we are seeing an increasing need for solutions utilizing digital pen technology, owing to the active movement toward digitization.
Against this background, Wacom Group has further solidified its position as a global leader and pursued investment strategies not only to expand our product line-up in each business segment, but also to enhance the Group’s future business base.
In order to satisfy the wide range of our users’ demands, from professionals to general consumers, we have leveraged our R&D activities to expand our cloud-based product line in the Brand Business segment. In the Technology Solution Business segment, we are increasing the commercial production of our Active-ES (Active Electrostatic) pen sensor system, to expand our customer base from existing customers to new customers such as Huawei, the largest tablet manufacturer in China. In addition, we have focused on restructuring the global supply chain and developing global IT infrastructures from a long-term perspective in response to rapid globalization
4
and e-commercialization. Simultaneously, in order to pursue growth in our global business, we shifted our previous region-based Global Business Unit structure into a customer segment-based global organization from April 2016. In order to accelerate the spread of digital pens, we continued to pursue the development and partner expansion of WILL (Wacom Ink Layer Language), which will establish a digital ink standard for exchanging and sharing ink data freely regardless of OS. In connection with WILL, we held the Wacom ‘Inkathon’ software developer challenge to accelerate the usage of digital ink with smartphones or tablet PCs, and have also made preparations for the establishment of ‘Digital Stationery Consortium’.
In the digital pen technology field, we formed an agreement with Microsoft in March 2016 to license its Windows Pen Protocol. Through this agreement, Wacom can develop and incorporate both Microsoft Pen and Wacom Active-ES pen technologies in a single pen. Under the open partnership policy, we aim to collaborate with a number of partner companies to drive our digital pen and ink technology to help people across the world maximize their own creativity.
In April 2015, we announced our Medium-term Business Plan “Wacom Strategic Business Plan: SBP-2019” (from April 2015 to March 2019) in response to ongoing rapid changes in the business environment. By March 2019 we aim to achieve consolidated net sales of ¥120 billion, consolidated operating profit on sales of 12%, and consolidated return on equity of over 20%. By working to realize these financial goals we aim to increase our corporate value. We also announced and submitted our Corporate Governance Report to the Tokyo Stock Exchange (“TSE”) on September 29, 2015, in compliance with the TSE’s newly established Corporate Governance Code.
For the year ended March 31, 2016, consolidated net sales increased 4.0% to ¥77,568 million, operating income decreased 40.3% to ¥3,664 million, ordinary income decreased 37.7% to ¥3,777 million, and net profit attributable to shareholders decreased 33.5% to ¥2,310 million.
Segment results 1. Brand Business Overall sales exceeded the previous fiscal year owing to favorable sales of new products introduced in both Creative and Consumer Business areas, the expanding Chinese market, and impact of the foreign exchange.
< Creative Business> ○Pen Tablet products Overall sales exceeded the previous fiscal year owing to a significant increase in sales of Intuos in the Chinese market in 1H, as well as favorable sales of new Intuos products released in September, which have been highly rated for the way the product lineup is tailored to different customer segments. ○Mobile products The highly-functional creative tablet Cintiq Companion 2, launched at the end of the previous fiscal year, continued to receive positive market reception; in particular an enhanced top-end model of Cintiq Companion 2 launched in May 2015 contributed significantly to the strong growth of total sales. We saw demand slowdown due to the intensified competition and the transition period of product life cycle in 2H. Combined with sales network expansion, overall sales greatly exceeded the same period of the previous fiscal year.
○Display products At the end of the previous fiscal year, we launched our flagship models, Cintiq 27QHD (27 inches) and Cintiq 27 QHD touch, which come with high-definition screen and superior color reproducibility. These sold well and opened up a new market of production tools for 3D works. In addition to other new models such as Cintiq 22HD (22 inches), which is user-friendly with large-size display, and Cintiq 13HD touch (13 inches), which provides comfortable drawing workspace on a compact screen, the increase in sales of all lineups contributed to an increase in overall sales compared to
5
the previous fiscal year.
< Consumer Business> To open up a new category of digital stationery, in September we launched our new product, Bamboo Spark, which digitalizes handwritten notes on paper to enable data sharing via cloud computing and has been selling strongly. With the exception of one part of the Asia-Oceania region, sales of Stylus pen products struggled, although the newly launched Bamboo Fineline 2 gained a good reputation. As a result of contributions from Bamboo Spark, overall sales significantly exceeded the previous fiscal year.
< Business Solution> Overall sales were below the previous fiscal year, mainly due to a strong yen against the euro, a decrease in sales in Europe as a consequence of large-scale deals that boosted performance in the previous fiscal year, and a postponement of capital investment driven by uncertainties in the global economy.
<By region> Sales in the U.S. greatly exceeded the previous fiscal year, supported by favorable sales of Display products and the weaker yen, although local currency-based sales only slightly exceeded the previous fiscal year, mainly due to a sales decrease in Pen Tablet products. Sales in Europe plateaued as a result of favorable sales of Creative Business products and Bamboo Spark, offsetting a sales decrease in the Business Solution area. In Japan, overall sales increased owing to steady sales of Creative Business products, despite a sales decrease in the Consumer Business area. In Asia and Oceania (excluding Japan), sales increased in all regions, especially in China, owing to the rapid expansion in digital content creation.
As a result, overall sales in the Brand Business segment for the fiscal year ended March 31, 2016 under review increased 12.2% to ¥48,931 million, and operating income increased 34.7% to ¥8,036 million . ※ Creative Business: Pen Tablet ……Intuos series
(including rebranded Bamboo pen tablets) Mobile……… Cintiq Companion, Intuos Creative Stylus Display………Cintiq series
Consumer Business: Stylus pen, Touch pad, Digital Stationery……Bamboo series Business Solution: LCD signature tablet……STU series
LCD pen tablet……DT series
2. Technology Solution Business Overall sales fell slightly below the previous fiscal year due to a significant decline in pen sensor system shipments for notebook PCs, despite favorable shipments for tablets and our initiatives to create new business categories such as digital stationery.
<Pen sensor systems for smartphones> We have focused on automated production of new cartridge pen, and activities to develop new customers. Overall sales fell below the previous fiscal year due to smaller orders for Samsung’s new Galaxy Note 5 compared with their previous model.
<Pen sensor systems for tablets> A large-scale order from the government of Turkey for an educational tablet project contributed to sales expansion. We also increased the commercial production of our Active-ES pen sensor system, which is a new and original Wacom technology that has been highly appraised and adopted not only by existing customers such as Hewlett Packard, DELL, and Lenovo, but also by new customers such as Huawei, which is the largest tablet manufacturer in China. These factors supported an increase in overall sales compared to the same period of the previous fiscal year.
<Pen sensor systems for notebook PCs> Overall sales decreased dramatically due to a shift in demand for digital pens from notebook PCs to tablets as a result of market expansion of tablets with detachable keyboards, as well as large-scale inventory adjustments across the notebook PC market.
6
As a result, overall sales in the Technology Solution Business segment for the fiscal year ended March 31, 2016 under review decreased 7.6% to ¥27,974 million, and operating income decreased 32.6% to ¥3,130 million. 3. Other Business (formerly Software Business) Overall sales slightly exceeded the previous fiscal year owing to a recovery in demand for replacements in response to the termination of Windows XP support, and the launch of the new products ECAD dio DCX R2 and ECAD dio 2016 during the period. As a result, overall sales in the Other Business segment for the fiscal year ended March 31, 2016 under review increased 1.2% to ¥663 million, and operating income decreased 35.1% to ¥36 million.
Note: In accordance with the Global Organization Reform, we have renamed our business segments as follows. Please note that intersegment sales and deletions of intersegment sales are not shown.
Until March 31, 2015 (previous name) From April 1, 2015 (new name) Change of
name Brand Business Brand Business No
Creative Business Creative Business No Consumer Business Consumer Business No Vertical Market Business Business Solution Yes
Component Business Technology Solution Business Yes Software Business Engineering Solution Business Yes
7
Consolidated results forecast In the fiscal year from April 1, 2016 to March 31, 2017, Wacom forecasts that the global economy as a whole will see a modest growth trend led by developed countries. However, this trend may be accompanied by uncertainties and influences such as the risk of an economic slowdown in major countries including the U.S. and China, unsolved refugees issues in Europe, and the impact of the rapid decline in crude oil prices. In foreign exchange, the trend of a strong yen against the US dollar since the fourth quarter of the fiscal year ended March 31, 2016 may have unpredictable impact on the Japanese economy’s recovery. In addition, we expect Japanese manufacturers to need some time to restore their supply chain after damage from the Kumamoto earthquake in April 2016. Under the assumptions described above, Wacom will actively promote new product launches and develop new technologies and business for future growth and competitiveness, propelling our Medium-term Business Plan “SBP-2019 (Wacom Strategic Business Plan)”. Wacom will also focus on launching IT infrastructures to restructure the global supply chain, as well as other projects to strengthen and to bring our corporate structure and platform into full operation within this fiscal year. The company assumes an average foreign exchange rate of ¥110 per 1 U.S. dollar and ¥125 per 1 euro for the fiscal year ended March 2017. Consolidated net sales are expected to increase 5.7% to ¥82,000 million, operating income to increase 14.6% to ¥4,200 million, ordinary income to increase 9.6% to ¥ 4,140 million, net profit attributable shareholders to increase 29.9% to ¥3,000 million, and return on equity to increase 2.6% to 9.7%. In the Creative Business area in our Brand Business segment, which forms Wacom’s core business, we will launch new products in all product categories of Pen Tablet, Display and Mobile this fiscal year. In particular, we identify Display and Mobile categories as our growth engine for launching new products, such as through adding new functions that improve 3D and color management. In Consumer Business, we will explore a new category of digital stationery by adding our new product, Bamboo Spark, launched in September 2015, to our existing Bamboo stylus series. In the Business Solution area, we will expand our sales in the financial and distribution fields by providing digital workflow solutions to promote paperless, digital signature authentication, and to improve information security and cost for customers. With the above mentioned plans and activities, sales in the Brand Business segment for the fiscal year ended March 31, 2017 are expected to increase 14.9% to ¥56,200 million, and operating income to increase 41.9% to ¥11,400 million. In the Technology Solution Business segment, we will not only strongly promote our new Active-ES technology to the market, but also focus on standardization in the industry, leading to the expansion of digital pen usage. We estimate sales for smartphones to fall below the previous fiscal year due to the strong yen despite of customer’s stable business trend. With the above mentioned activities, sales in the Technology Solution Business segment for the fiscal year ended March 31, 2017, are expected to decrease 10.3% to ¥25,100 million, and operating income to decrease 48.9% to ¥1,600 million. In the Engineering Solution Business segment within Other Business, Wacom plans to enhance sales of ECAD dio DCX R2, in addition to launching upgraded models of existing versions to acquire new customers. As a result of the above, sales in the Engineering Solution Business segment for the fiscal year ended March 31, 2017, are expected to increase 5.6% to ¥700 million, and operating income to increase 39.8% to ¥50 million.
Note : Forward-looking statements regarding future events and performance contained in this document are based on currently available information and involve risks and uncertainties. Please note that actual results could materially differ from those expressed or implied by the forward-looking statements in this presentation due to these risks and uncertainties.

8
Consolidated financial position 1. Assets, Liabilities, and Net Assets Total assets as of March 31, 2016 increased by ¥110 million to ¥51,567 million compared to the end of the previous fiscal year. The main factors contributing to this were an increase of ¥1,062 million in software, an increase of ¥1,563 million in software in progress, and a decrease of ¥2,322 million in cash and deposits. Total liabilities as of March 31, 2016 increased by ¥2,872 million to ¥20,470 million compared to the end of the previous fiscal year. The main factors contributing to this were an increase of ¥3,400 million in short-term loans payable, an increase of ¥2,000 million in long-term loans payable, and a decrease of ¥3,101 in notes and accounts payable - trade . Total net assets decreased by ¥2,762 million to ¥31,096 million compared to the end of the previous fiscal year. The main contributing factors were an increase of ¥2,310 million in net profit attributable to shareholders, a decrease of ¥893 million in foreign currency translation adjustment, a decrease of ¥2,999 million in the payment for shareholder’s dividends and an increase of ¥1,121 million in treasury shares as deductions of net assets. As a result, the capital ratio decreased by 5.4 points to 60.0% compared to the end of the previous fiscal year.
2. Cash Flow Consolidated cash and cash equivalents for the fiscal period ended March 31, 2016 totaled ¥14,365 million, a ¥2,322 million decrease from the end of the previous fiscal year. (A ¥1,293 million increase over the same previous fiscal period)
Cash Flow from Operating Activities Cash flow from operating activities during the fiscal period ended March 31, 2016 was ¥2,009 million (¥6,782 million generated in the same previous fiscal period). The main factors contributing to cash inflow were an increase of ¥3,597 million in income before income taxes and minority, an increase of ¥2,004 million in depreciation, and an increase of ¥422 million in provision for bonuses. The main factors contributing to cash outflow were a decrease of ¥2,781 million in notes and accounts payable – trade and a decrease of ¥1,635 million in income taxes paid.
Cash Flow from Investing Activities Cash flow from investing activities during the fiscal period ended March 31, 2016 was ¥4,878 million (compared to ¥3,278 million used in the previous comparable period). The primary contributing factors were a ¥1,167 million purchase of tangible assets such as equipment, and a ¥3,295 million purchase of system software and other such items for the global IT infrastructure.
Cash Flow from Financing Activities Cash flow from financing activities during the fiscal period ended March 31, 2016 was ¥1,209 million (compared to ¥2,850 million used in the previous comparable period). The primary contributing factor were a ¥5,400 million income from short-term loans payable, ¥1,245 million payment for treasury stock acquisition, and a ¥2,992 million payment for shareholders’ dividends.

9
(For Reference) Trend of Consolidated Cash Flow Indicator
FY 3/13 FY 3/14 FY 3/15 FY 3/16
Capital Ratio (%) 58.1 64.2 65.4 60.0
Market Cap. based
Capital Ratio (%)
313.2
237.3
187.1
152.1
Debt Redemption
(Yr)
0.1
0.8
0.1
3.0
Interest Coverage
Ratio
935.1
158.6
703.4
91.5
(Note) Capital Ratio : Capital / Total Assets Market Cap. based Capital Ratio : Market Cap. / Total Assets Debt Redemption ( Year) : Interest-Bearing Debt / Operating Cash Flow Interest Coverage Ratio : Operating Cash Flow / Interest Payment
Dividend payout policy and dividend for the fiscal year ended March 31, 2016 The Company’s dividend payout policy aims to maintain stable payouts while ensuring future business development and reinforcing our financial base. The dividend payout ratio is targeted to maintain a level of 40% or more on a consolidated basis to attract global investment. Treasury stock acquisition is considered flexibly, taking into account the current and expected environment to maintain a flexible capital strategy effective in a variety of business situations. The shareholder special benefit plan is not applied from the viewpoint of fairness for shareholders’ preference, continuing cash dividend payout and treasury stock acquisition. In accordance with the above policy, the Board of Directors has decided to pay a dividend of ¥18.00 per share. As a result, the payout ratio for the fiscal year ended March 31, 2016, is 128.6%. The dividend for the fiscal year ended March 31, 2017, is estimated to be ¥18.00 per share with an estimated payout ratio of 98.7%.
10
Corporate management policy 1. Basic corporate management policy
Our corporate vision, "a world alive with creativity”, aims to enhance creativity and make the world a richer place for people. We aim to leverage human creativity as a global leader, contributing to the world with intuitive technology and interface. Our focus is on developing technology and utilizing talented human resources to contribute to the global evolution and expansion of user interface technology in the future. We also place significance on competitiveness in our global business model, aiming for long-lasting and stable growth with higher corporate value under an open-partnership policy with a wide range of customers, a global business organization, corporate culture and brand. In addition, we continue to strengthen our compliance and corporate governance activities to fulfill our social responsibilities as a global company.
2. In April 2015, we announced our Medium-term Business Plan “Wacom Strategic Business Plan:
SBP-2019” (from April 2015 to March 2019) in response to ongoing rapid changes in the business environment. Under our new global business organization, we have continued to position our basic strategy to ‘evolve business toward mobile products and cloud’ as an axis. We also explore and create new markets, and reinforce our existing business globally. By March 2019, we aim to achieve consolidated net sales of ¥120 billion, consolidated operating profit on sales of 12%, and consolidated return on equity of over 20%.
3. Outline of SBP-2019 Basic Strategy (1) Evolve business toward mobile products and cloud (2) Accelerate growth through the new global business organization and enhanced global
integration (3) Accelerate Creative Business with Mobile product line expansion, 3D penetration and
emerging market investment (4) Reach new consumer users with digital stationery and cloud integration (5) Expand Technology Solution Business with Active ES and WILL (6) Enhance business workflow and security solutions by leveraging WILL and digital signature
solutions (7) Leverage global business systems for efficiency, speed and profitability
Concrete measures Our growth strategy is centered on accelerating the growth of both Brand Business and Technology Solution Business in correspondence with the recent rapid changes in business platforms. To support and realize the steady growth of both businesses in the future, we have reformed and reorganized our previously region-based organization to a global customer segment-based one, and have invested in developing a global IT infrastructure.
(1) Evolve business toward mobile products and cloud We plan to expand our product line by shifting our focus away from products for conventional PCs, and establishing an ecosystem that combines the mobile information device market with cloud-based applications and services, in order to correspond to the needs of new IT platforms of smartphones spreading through the markets, mobile information devices like tablets, and cloud computing.
(2) Accelerate growth through a new global business organization and enhanced global integration
To realize further growth through a globally integrated business, we shifted the previously region-based global business unit structure into a customer segment-based organization in April 2015, under which we aim to drive our customer segment-based strategy and accelerate business growth.
11
(3) Accelerate Creative Business with Mobile product line expansion, 3D penetration and merging market investment In March 2014, we released our first Mobile products as a new product line, in addition to existing product lines that connect to a PC. We foresee future growth in the mobile product market, and aim to develop and launch new models to correspond to its fast growth. We are also focused on 3D modeling, 3D industrial design and 3D printing, which are the most promising and evolving fields within the digital design market. Furthermore, we will develop and launch new products to meet the demand of growing markets in emerging markets such as China, India and Latin America. Through these activities, we aim to expand and grow our Creative Business going forward.
(4) Reach new consumers with digital stationery and cloud integration
The rapid spread and development of mobile information devices and SNS in recent times has increased the creativity and mobility of consumers. In addition to smartphones and tablets, there is an increasing need for new digital stationery that allows users to write down ideas intuitively like they would using conventional pen and paper. We plan to establish our own ecosystem for developing new digital stationery integrated with cloud computing, and create a completely new consumer market. In addition, we plan to not only raise brand recognition to consumers, but also create a user community by making the best use of global web communication.
(5) Expand Technology Solution Business with Active-ES and W ILL
In the Technology Solution Business, our Active-ES pens based on new technology went into commercial production and have attracted the attention of many customers. Through our collection of products using conventional EMR and the new Active-ES technologies, we can provide a variety of choices for our customers, and create and expand future markets. We developed WILL (Wacom Ink Layer Language), a new digital ink technology that standardizes digital ink data and can exchange data interactively over different OSs. Through these activities, we will promote and spread the potential of digital ink and expand the Technology Solution Business.
(6) Enhance business workflow and security solutions by leveraging WILL and digital signature solutions We have focused on the need for more efficient workflow and better security, with the aim of expanding the Business Solution market. We will reinforce and advance our signature solutions by utilizing WILL and signature authentication technology, as well as digital signature tablet products to provide faster, more efficient and secure workflow solutions to the market. We will also expand our Business Solution market by providing software and hardware integrated solutions for finance and retail industries.
(7) Leverage global business system for efficiency, speed and profitability We have been focusing our efforts on restructuring the global supply chain and developing a global IT infrastructure, such as e-commerce. With these activities, we aim to achieve higher profitability by dramatically improving the efficiency, speed and cost of our entire business process, from production to sales and customer support.
Please note that due to known and unknown risks and uncertainties pertaining to market forecasts and customer trends in the Technology Solution Business, actual results may differ materially from the forward-looking statements contained in this report. We aim to minimize the potential impact of the above uncertainties and risks by expanding our customer base and pursuing stable corporate management.

12
1. Summary of Consolidated Balance Sheet
(Unit: ‘000 Yen)
FY 3/15 (as of Mar.31, 2015)
FY 3/16 (as of Mar.31, 2016)
Assets Current assets
Cash and deposits 16,686,619 14,365,031 Notes and accounts receivable - trade 9,875,726 10,161,958 Merchandise and finished goods 7,701,801 8,229,212 Work in process 400,084 270,483 Raw materials and supplies 2,114,966 1,598,066 Deferred tax assets 1,229,497 1,458,666 Other 2,220,080 1,894,900 Allowance for doubtful accounts -41,268 -104,672 Total current assets 40,187,505 37,873,644
Non-current assets Property, plant and equipment
Buildings and structures 3,382,821 3,558,171 Accumulated depreciation -1,696,836 -1,785,737 Buildings and structures, net 1,685,985 1,772,434
Machinery, equipment and vehicles 1,104,298 1,064,058 Accumulated depreciation -397,792 -467,822 Machinery, equipment and vehicles, net 706,506 596,236
Tools, furniture and fixtures 3,937,461 4,391,719 Accumulated depreciation -2,912,270 -3,404,725 Tools, furniture and fixtures, net 1,025,191 986,994
Land 1,190,703 1,182,748 Total property, plant and equipment 4,608,385 4,538,412
Intangible assets Software 1,823,371 2,884,895 Software in progress 3,259,519 4,822,758 Other 358,946 423,719 Total intangible assets 5,441,836 8,131,372
Investments and other assets Investment securities 587,290 241,167 Deferred tax assets 55,678 90,677 Other 654,045 769,109 Allowance for doubtful accounts -77,882 -77,749 Total investments and other assets 1,219,131 1,023,204
Total non-current assets 11,269,352 13,692,988 Total assets 51,456,857 51,566,632

13
(Unit: ‘000 Yen)
FY 3/15 (as of Mar.31, 2015)
FY 3/16 (as of Mar.31, 2016)
Liabilities Current liabilities
Accounts payable - trade 9,203,455 6,102,787 Short-term loans payable 600,000 4,000,000 Accrued expenses 2,605,243 2,884,408 Income taxes payable 613,674 271,839 Provision for bonuses 545,810 941,847 Provision for directors' bonuses 59,270 9,787 Other 2,252,775 2,267,964 Total current liabilities 15,880,227 16,478,632
Non-current liabilities Long-term loans payable - 2,000,000 Deferred tax liabilities 206,397 545,983 Net defined benefit liability 813,059 868,560 Provision for bonuses - 7,484 Asset retirement obligations 152,845 153,996 Other 545,359 415,581 Total non-current liabilities 1,717,660 3,991,604
Total liabilities 17,597,887 20,470,236 Net assets
Shareholders' equity Capital stock 4,203,469 4,203,469 Capital surplus 7,550,743 7,513,373 Retained earnings 22,318,906 21,629,469 Treasury shares -1,455,137 -2,576,159 Total shareholders' equity 32,617,981 30,770,152
Accumulated other comprehensive income Valuation difference on available-for-sale securities 27,370 40,431
Foreign currency translation adjustment 1,068,558 175,342 Remeasurements of defined benefit plans -35,573 -27,392 Total accumulated other comprehensive income 1,060,355 188,381
Subscription rights to shares 180,634 137,863 Total net assets 33,858,970 31,096,396
Total liabilities and net assets 51,456,857 51,566,632
14
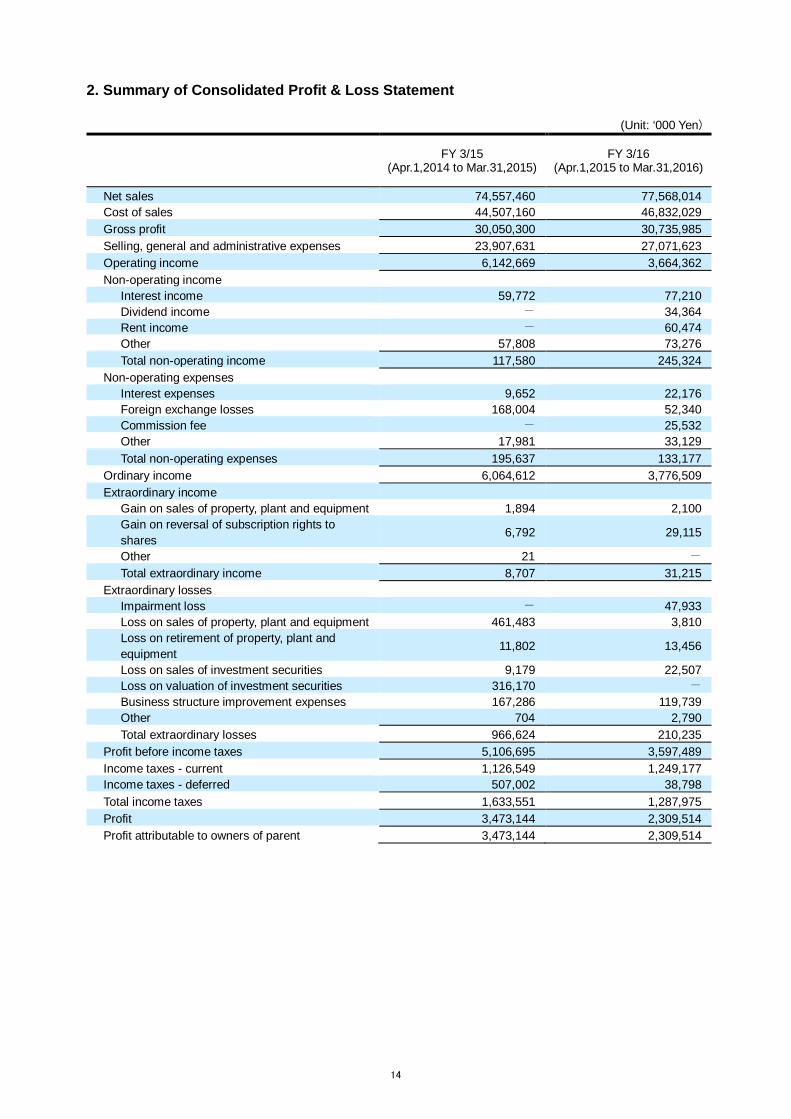
2. Summary of Consolidated Profit & Loss Statement
(Unit: ‘000 Yen)
FY 3/15 (Apr.1,2014 to Mar.31,2015)
FY 3/16 (Apr.1,2015 to Mar.31,2016)
Net sales 74,557,460 77,568,014 Cost of sales 44,507,160 46,832,029 Gross profit 30,050,300 30,735,985 Selling, general and administrative expenses 23,907,631 27,071,623 Operating income 6,142,669 3,664,362 Non-operating income
Interest income 59,772 77,210 Dividend income - 34,364 Rent income - 60,474 Other 57,808 73,276 Total non-operating income 117,580 245,324
Non-operating expenses Interest expenses 9,652 22,176 Foreign exchange losses 168,004 52,340 Commission fee - 25,532 Other 17,981 33,129 Total non-operating expenses 195,637 133,177
Ordinary income 6,064,612 3,776,509 Extraordinary income
Gain on sales of property, plant and equipment 1,894 2,100 Gain on reversal of subscription rights to shares 6,792 29,115
Other 21 - Total extraordinary income 8,707 31,215
Extraordinary losses Impairment loss - 47,933 Loss on sales of property, plant and equipment 461,483 3,810 Loss on retirement of property, plant and equipment 11,802 13,456
Loss on sales of investment securities 9,179 22,507 Loss on valuation of investment securities 316,170 - Business structure improvement expenses 167,286 119,739 Other 704 2,790 Total extraordinary losses 966,624 210,235
Profit before income taxes 5,106,695 3,597,489 Income taxes - current 1,126,549 1,249,177 Income taxes - deferred 507,002 38,798 Total income taxes 1,633,551 1,287,975 Profit 3,473,144 2,309,514 Profit attributable to owners of parent 3,473,144 2,309,514
15
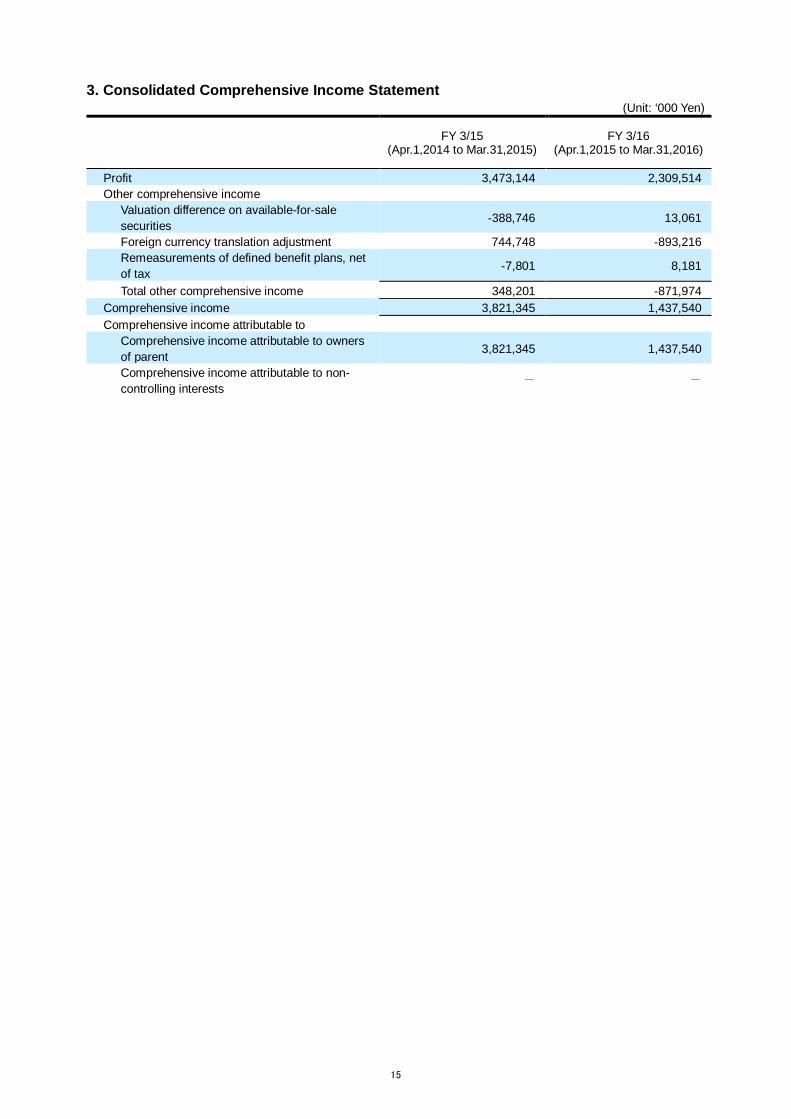
3. Consolidated Comprehensive Income Statement (Unit: ‘000 Yen)
FY 3/15 (Apr.1,2014 to Mar.31,2015)
FY 3/16 (Apr.1,2015 to Mar.31,2016)
Profit 3,473,144 2,309,514 Other comprehensive income
Valuation difference on available-for-sale securities -388,746 13,061
Foreign currency translation adjustment 744,748 -893,216 Remeasurements of defined benefit plans, net of tax -7,801 8,181
Total other comprehensive income 348,201 -871,974 Comprehensive income 3,821,345 1,437,540 Comprehensive income attributable to
Comprehensive income attributable to owners of parent 3,821,345 1,437,540
Comprehensive income attributable to non-controlling interests
- -
16
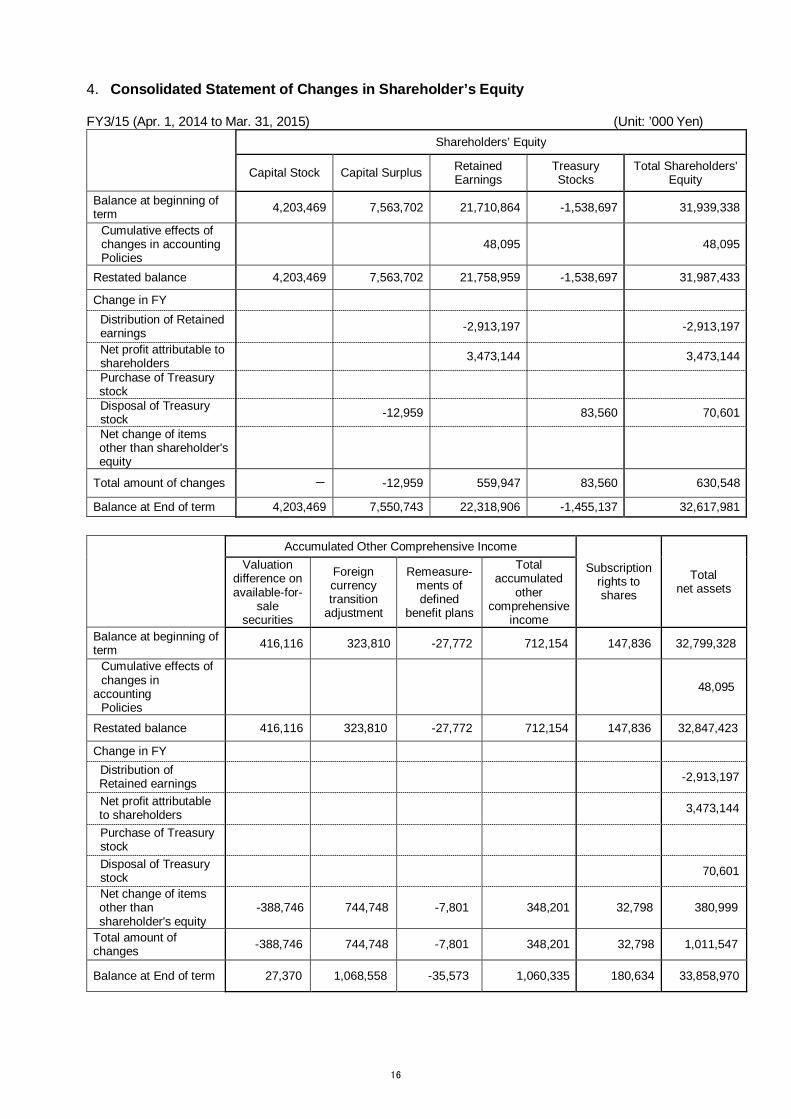
4. Consolidated Statement of Changes in Shareholder’s Equity FY3/15 (Apr. 1, 2014 to Mar. 31, 2015) (Unit: ’000 Yen) Shareholders’ Equity
Capital Stock Capital Surplus Retained Earnings
Treasury Stocks
Total Shareholders' Equity
Balance at beginning of term 4,203,469 7,563,702 21,710,864 -1,538,697 31,939,338
Cumulative effects of changes in accounting Policies
48,095 48,095
Restated balance 4,203,469 7,563,702 21,758,959 -1,538,697 31,987,433
Change in FY Distribution of Retained earnings -2,913,197 -2,913,197
Net profit attributable to shareholders 3,473,144 3,473,144
Purchase of Treasury stock
Disposal of Treasury stock -12,959 83,560 70,601
Net change of items other than shareholder's equity
Total amount of changes - -12,959 559,947 83,560 630,548
Balance at End of term 4,203,469 7,550,743 22,318,906 -1,455,137 32,617,981 Accumulated Other Comprehensive Income
Subscription rights to shares
Total net assets
Valuation difference on available-for-
sale securities
Foreign currency transition
adjustment
Remeasure-ments of defined
benefit plans
Total accumulated
other comprehensive
income Balance at beginning of term 416,116 323,810 -27,772 712,154 147,836 32,799,328
Cumulative effects of changes in accounting Policies
48,095
Restated balance 416,116 323,810 -27,772 712,154 147,836 32,847,423
Change in FY Distribution of Retained earnings -2,913,197
Net profit attributable to shareholders 3,473,144
Purchase of Treasury stock
Disposal of Treasury stock 70,601
Net change of items other than shareholder's equity
-388,746 744,748 -7,801 348,201 32,798 380,999
Total amount of changes -388,746 744,748 -7,801 348,201 32,798 1,011,547
Balance at End of term 27,370 1,068,558 -35,573 1,060,335 180,634 33,858,970

17
FY3/16 (Apr. 1, 2015 to Mar. 31, 2016) (Unit: ’000 Yen) Shareholders’ Equity
Capital Stock Capital Surplus Retained Earnings
Treasury Stocks
Total Shareholders' Equity
Balance at beginning of term 4,203,469 7,550,743 22,318,906 -1,455,137 32,617,981
Cumulative effects of changes in accounting Policies
Restated balance 4,203,469 7,550,743 22,318,906 -1,455,137 32,617,981
Change in FY Distribution of Retained earnings -2,998,951 -2,998,951
Net profit attributable to shareholders 2,309,514 2,309,514
Purchase of Treasury stock -1,219,000 -1,219,000
Disposal of Treasury stock -37,370 97,978 60,608
Net change of items other than shareholder's equity
Total amount of changes - -37,370 -689,437 -1,121,022 -1,847,829
Balance at End of term 4,203,469 7,513,373 21,629,469 -2,576,179 30,770,152 Accumulated Other Comprehensive Income
Subscription rights to shares
Total net assets
Valuation difference on available-for-
sale securities
Foreign currency transition
adjustment
Remeasure-ments of defined
benefit plans
Total accumulated
other comprehensive
income Balance at beginning of term 27,370 1,068,558 -35,573 1,060,355 180,634 33,858,970
Cumulative effects of changes in accounting Policies
-
Restated balance 27,370 1,068,558 -35,573 1,060,355 180,634 33,858,970
Change in FY Distribution of Retained earnings -2,998,951
Net profit attributable to shareholders 2,309,514
Purchase of Treasury stock -1,219,000
Disposal of Treasury stock 60,608
Net change of items other than shareholder's equity
13,061 -893,216 8,181 -871,974 -42,771 -914,745
Total amount of changes 13,061 -893.216 8,181 -871,974 -42,771 -2,762,574
Balance at End of term 40,431 175,342 -27,392 188,381 137,863 31,096,396

18
5. Summary of Consolidated Cash Flow Statement
(Unit: ‘000 Yen)
FY 3/15 (Apr.1,2014 to Mar.31,2015)
FY 3/16 (Apr.1,2015 to Mar.31,2016)
Cash flows from operating activities Profit before income taxes 5,106,695 3,597,489 Depreciation 1,970,162 2,003,718 Share-based compensation expenses 54,959 1,116 Increase (decrease) in allowance for doubtful accounts 46,405 69,740
Increase (decrease) in provision for bonuses 51,049 422,113 Increase (decrease) in provision for directors' bonuses -1,765 -49,559
Increase (decrease) in net defined benefit liability 83,402 68,725
Interest and dividend income -59,772 -111,574 Interest expenses 9,652 22,176 Foreign exchange losses (gains) -228,194 221,012 Loss (gain) on sales of property, plant and equipment 459,589 1,711
Loss on retirement of property, plant and equipment 11,802 13,456
Loss (gain) on sales of investment securities 9,179 22,507 Loss (gain) on valuation of investment securities 316,170 -
Decrease (increase) in notes and accounts receivable - trade 1,804,282 -456,313
Decrease (increase) in inventories -545,826 -342,300 Increase (decrease) in notes and accounts payable - trade -590,219 -2,780,336
Other, net 693,184 851,354 Subtotal 9,190,754 3,555,035 Interest and dividend income received 57,879 111,064 Interest expenses paid -9,642 -21,957 Income taxes paid -2,456,758 -1,634,978 Net cash provided by (used in) operating activities 6,782,233 2,009,164
Cash flows from investing activities Purchase of property, plant and equipment -762,060 -1,166,777 Purchase of intangible assets - -108,549 Purchase of software -2,576,225 -3,924,963 Proceeds from sales of property, plant and equipment 247,326 53,959
Proceeds from sales of investment securities 84,643 352,120 Acquisitions of Business -274,321 - Payments for lease and guarantee deposits -3,604 -98,645 Proceeds from collection of lease and guarantee deposits 6,302 14,731
Other, net 175 - Net cash provided by (used in) investing activities -3,277,764 -4,878,124
Cash flows from financing activities Increase in short-term loans payable 2,000,000 5,400,000 Decrease in short-term loans payable -2,000,000 -2,000,000 Proceeds from long-term loans payable - 2,000,000 Purchase of treasury shares - -1,244,532 Proceeds from disposal of treasury shares 55,066 45,563 Cash dividends paid -2,904,584 -2,991,749

19
Net cash provided by (used in) financing activities -2,849,518 1,209,282
Effect of exchange rate change on cash and cash equivalents 637,729 -661,910
Net increase (decrease) in cash and cash equivalents 1,292,680 -2,321,588
Cash and cash equivalents at beginning of period 15,393,939 16,686,619 Cash and cash equivalents at end of period 16,686,619 14,365,031

20
6. Segment Information and Other information a. Segment Information
The Company consists of “Brand business” and “Technology Solution business” as reportable segments and “Other business”
FY 3/15 (April 1, 2014 – March 31, 2015) (Unit: ’000 Yen)
Reportable Segments
Other
Business (Note)1
Total
Adjustment
(Note)2
Amount of Consolidated
P/L (Note)3
Brand business
Technology Solution business b i
Sub Total
Sales
43,625,486
30,277,172
73,902,658
654,802
74,557,460
-
74,557,460 Sales towards external customers
Sales between internal segments and - - - - - - - internal transfer
Total 43,625,486 30,277,172 73,902,658 654,802 74,557,460 - 74,557,460 Segment Profit or Loss (-) 5,964,586 4,641,641 10,606,227 55,126 10,661,353 -4,518,684 6,142,669 Segment Total
Assets 22,833,877 9,874,196 32,708,073 577,897 33,285,970 18,170,887 51,456,857
Other items
1,061,695
469,273
1,530,968
159,224
1,690,192
276,362
1,966,554 Depreciation
Amortization in Goodwill
- 3,608 3,608 - 3,608 - 3,608
Impairment Loss
- - - - - - -
Increase in Tangible fixed 705,655 462,305 1,167,960 187,883 1,355,843 2,726,334 4,082,177
Assets and Intangible fixed
Assets (Note) 1. “Other businesses” consist of Software business.
2. The above “Adjustment” in “Segment Profit” is mainly the cost of financial and general affairs departments which are not included in the reportable segments.
3. “Segment Profit” is adjusted for “Operating Income”. FY 3/16(April 1, 2015 – March 31, 2016) (Unit: ’000 Yen)
Reportable Segments
Other
Business (Note)1
Total
Adjustment
(Note)2
Amount of Consolidated
P/L (Note)3
Brand Business
Technology Solution business
Sub Total
Sales
48,931,153
27,974,243
76,905,396
662,618
77,568,014
-
77,568,014 Sales towards external customers
Sales between internal segments and
- - - - - - -
internal transfer
Total 48,931,153 27,974,243 76,905,396 662,618 77,568,014 77,568,014 Segment Profit or Loss (-) 8,035,559 3,130,082 11,165,641 35,767 11,201,408 -7,537,046 3,664,362
Segment Total Assets 25,648,533 7,869,231 33,517,764 616,089 34,133,853 17,432,779 51,566,632
Other items
440,978
303,273
744,251
101,200
845,451
1,158,267
2,003,718 Depreciation
Amortization in Goodwill
- - - - - - -
Impairment Loss
- - - - - 47,993 47,993
Increase in Tangible fixed 484,016 209,166 693,182 188,794 881,976 3,980,102 4,862,078
Assets and Intangible fixed
Assets

21
(Note) 1. “Other businesses” consist of Software business. 2.The above “Adjustment” in “Segment Profit” is mainly the cost of financial and general affairs departments which are not included in the reportable segments. 3. “Segment Profit” is adjusted for “Operating Income”.
a. Related Information FY 3/15 (April 1, 2014 – March 31, 2015)
[Information by products and services]
Ditto (substitution with the above reportable segment information)
[Sales] (Unit: ’000 Yen)
Japan
US
Europe
Asia &
Oceania
Others
Total
11,098,067 12,005,856 13,853,181 34,761,142 2,839,214 74,557,460
(Notes) The above sales are classified by countries or regions based on customer’s location [Tangible fixed assets]
(Unit: ’000 Yen)
Japan
US
Europe
Asia &
Oceania
Total
2,936,079 766,129 186,980 719,197 4,608,385
[Information of each major customer] (Unit: ’000 Yen)
Name of Major Customer
Sales
Related Segment
SAMSUNG GROUP 18,587,403 Technology Solution business
(Notes) Samsung Group includes Samsung Electronics, Samsung Electronics Vietnam, and Samsung Electronics Huizhou.
FY 3/16 (April 1, 2015 – March 31, 2016)
[Information by products and services]
Ditto (substitution with the above reportable segment information)
[Sales] (Unit: ’000 Yen)
Japan
US
Europe
Asia &
Oceania
Others
Total
13,629,201 14,830,124 14,153,604 33,304,961 1,640,224 77,568,014
(Notes) The above sales are classified by countries or regions based on customer’s location

22
[Tangible fixed assets] (Unit: ’000 Yen)
Japan
US
Europe
Asia &
Oceania
Total
2,776,516 1,027,943 94,083 639,870 4,538,412
[Information of each major customer] (Unit: ’000 Yen)
Name of Major Customer
Sales
Related Segment
SAMSUNG GROUP 16,771,052 Technology Solution business
(Notes) Samsung Group includes Samsung Electronics, Samsung Electronics Vietnam, and Samsung Electronics Huizhou.
c.Impairment Loss in Fixed Assets by Segment FY 3/15(April 1, 2014 – March 31, 2015) N/A FY 3/16 (April 1, 2015 – March 31, 2016) Ditto (substitution with the above reportable segment information) d.Balance of Amortization and Unamortization in Goodwill FY 3/15(April 1, 2014 – March 31, 2015) N/A FY 3/16 (April 1, 2015 – March 31, 2016) N/A e. Balance of Amortization in Gain on Negative Goodwill FY 3/15(April 1, 2014 – March 31, 2015) N/A FY 3/16 (April 1, 2015 – March 31, 2016) N/A

Complementary Information
(1) Business PerformanceFY 3/15 FY 3/16Result Result Amount Ratio
mil JPY mil JPY mil JPY
Sales 74,557 77,568 3,011 4.0%Operating Profit 6,143 3,664 -2,479 -40.3%
(Operation Profit Margin) 8.2% 4.7%Recurring Profit 6,065 3,777 -2,288 -37.7%
(Recurring Profit Margin) 8.1% 4.9%Net Proift 3,473 2,310 -1,163 -33.5%
(Net Profit Margin) 4.7% 3.0%
JPY JPY JPY
(US Doller ) 110.03 120.16 10.13 9.2%(Euro ) 138.68 132.36 -6.32 -4.6%
Note) Net Profit of FY 3/16 is equivalent to Profit Attributable to Owners of Parent.
(2) Sales by Business SegmentFY 3/15 FY 3/16Result Result Amount Ratio
mil JPY mil JPY mil JPY
Brand Business Sales 43,625 48,931 5,306 12.2% Operating Income 5,965 8,036 2,071 34.7%
(Operation Profit Margin) 13.7% 16.4%Technology Solution Business Sales 30,277 27,974 -2,303 -7.6% Operating Income 4,642 3,130 -1,512 -32.6%
(Operation Profit Margin) 15.3% 11.2%Other Business Sales 655 663 8 1.2% Operating Income 55 36 -19 -35.1%
(Operation Profit Margin) 8.4% 5.4%
Note) The above operating profit in each segment doesn't include the cost of corporate segment.
(3) Sales by Product LinesFY 3/15 FY 3/16
( by Subsidiaries ) Result Result Amount Ratiomil JPY mil JPY mil JPY
Brand Business 43,625 48,931 5,306 12.2%Creative Business 36,480 41,824 5,344 14.6% Pen tablets 21,981 24,148 2,167 9.9%
( Japan ) 2,754 2,739 -15 -0.6%(U.S. ) 6,990 7,277 287 4.1%
(Germany ) 6,500 7,059 559 8.6%(Asia-Oceania ) 5,737 7,073 1,336 23.3%
Mobiles 3,909 4,453 544 13.9%( Japan ) 686 937 251 36.5%(U.S. ) 1,508 1,465 -43 -2.9%
(Germany ) 969 973 4 0.4%(Asia-Oceania ) 746 1,078 332 44.5%
Displays 10,590 13,223 2,633 24.9%( Japan ) 1,919 2,298 379 19.8%(U.S. ) 4,229 5,613 1,384 32.7%
(Germany ) 2,964 3,128 164 5.5%(Asia-Oceania ) 1,478 2,184 706 47.8%
Consumer Business 1,554 2,149 595 38.3%( Japan ) 244 208 -36 -14.7%(U.S. ) 669 815 146 21.9%
(Germany ) 494 813 319 64.5%(Asia-Oceania ) 147 313 166 112.7%
Business Solution 5,591 4,958 -633 -11.3%( Japan ) 874 1,070 196 22.5%(U.S. ) 517 461 -56 -11.0%
(Germany ) 3,605 2,872 -733 -20.3%(Asia-Oceania ) 595 555 -40 -6.6%
Technology Solution Business 30,277 27,974 -2,303 -7.6% For smartphones 18,331 16,353 -1,978 -10.8% For tablets 8,542 9,532 990 11.6% For notebook PCs 3,404 2,089 -1,315 -38.6%Other Business 655 663 8 1.2%Engineering Solution 655 663 8 1.2%
( Japan ) 655 663 8 1.2%Total 74,557 77,568 3,011 4.0%
Note)“Vertical Market Business” is renamed “Business Solution” of Brand Business, “Component Business” is renamed “Technology Solution Business” and “CAD for electrical engineering” is renamed “Engineering Solution” of “Other Business” from FY 3/16.
from April 1, 2015 to March 31, 2016FY 3/2016 Summary of Consolidated Financial Results
YOY Change
YOY Change
YOY Change
P/L FX Rate (Average in the Term)
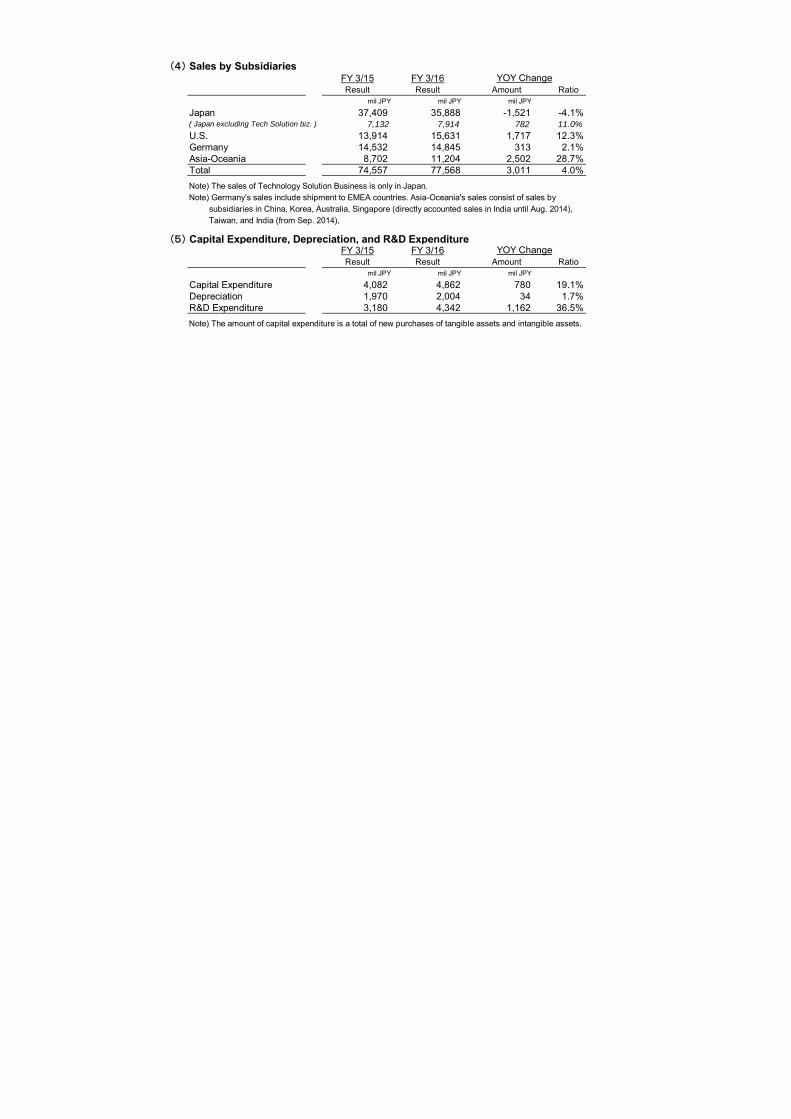
(4) Sales by SubsidiariesFY 3/15 FY 3/16Result Result Amount Ratio
mil JPY mil JPY mil JPY
Japan 37,409 35,888 -1,521 -4.1%( Japan excluding Tech Solution biz. ) 7,132 7,914 782 11.0%U.S. 13,914 15,631 1,717 12.3%Germany 14,532 14,845 313 2.1%Asia-Oceania 8,702 11,204 2,502 28.7%Total 74,557 77,568 3,011 4.0%
Note) The sales of Technology Solution Business is only in Japan.Note) Germany’s sales include shipment to EMEA countries. Asia-Oceania's sales consist of sales by subsidiaries in China, Korea, Australia, Singapore (directly accounted sales in India until Aug. 2014), Taiwan, and India (from Sep. 2014),
(5) Capital Expenditure, Depreciation, and R&D ExpenditureFY 3/15 FY 3/16Result Result Amount Ratio
mil JPY mil JPY mil JPY
Capital Expenditure 4,082 4,862 780 19.1%Depreciation 1,970 2,004 34 1.7%R&D Expenditure 3,180 4,342 1,162 36.5%
Note) The amount of capital expenditure is a total of new purchases of tangible assets and intangible assets.
YOY Change
YOY Change
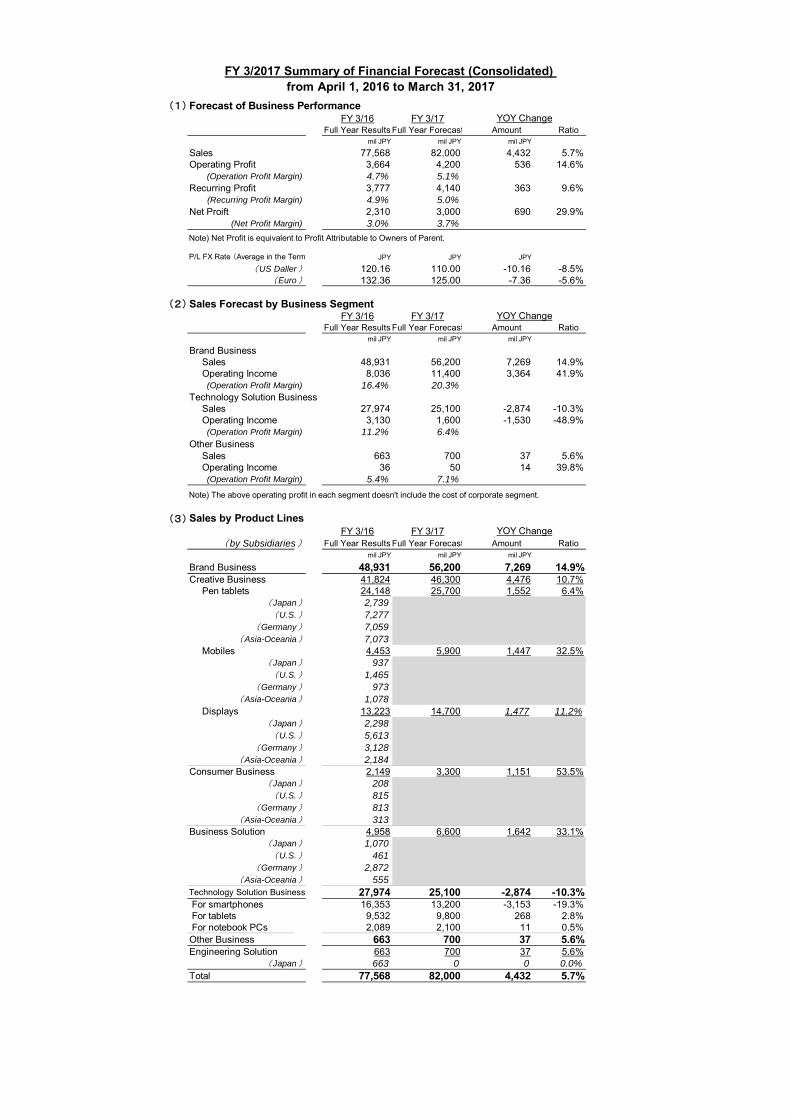
(1) Forecast of Business PerformanceFY 3/16 FY 3/17
Full Year Results Full Year Forecast Amount Ratiomil JPY mil JPY mil JPY
Sales 77,568 82,000 4,432 5.7%Operating Profit 3,664 4,200 536 14.6%
(Operation Profit Margin) 4.7% 5.1%Recurring Profit 3,777 4,140 363 9.6%
(Recurring Profit Margin) 4.9% 5.0%Net Proift 2,310 3,000 690 29.9%
(Net Profit Margin) 3.0% 3.7%
Note) Net Profit is equivalent to Profit Attributable to Owners of Parent.
JPY JPY JPY
(US Daller ) 120.16 110.00 -10.16 -8.5%(Euro ) 132.36 125.00 -7.36 -5.6%
(2) Sales Forecast by Business SegmentFY 3/16 FY 3/17
Full Year Results Full Year Forecast Amount Ratiomil JPY mil JPY mil JPY
Brand Business Sales 48,931 56,200 7,269 14.9% Operating Income 8,036 11,400 3,364 41.9%
(Operation Profit Margin) 16.4% 20.3%Technology Solution Business Sales 27,974 25,100 -2,874 -10.3% Operating Income 3,130 1,600 -1,530 -48.9%
(Operation Profit Margin) 11.2% 6.4%Other Business Sales 663 700 37 5.6% Operating Income 36 50 14 39.8%
(Operation Profit Margin) 5.4% 7.1%
Note) The above operating profit in each segment doesn't include the cost of corporate segment.
(3) Sales by Product LinesFY 3/16 FY 3/17
( by Subsidiaries ) Full Year Results Full Year Forecast Amount Ratiomil JPY mil JPY mil JPY
Brand Business 48,931 56,200 7,269 14.9%Creative Business 41,824 46,300 4,476 10.7% Pen tablets 24,148 25,700 1,552 6.4%
( Japan ) 2,739(U.S. ) 7,277
(Germany ) 7,059(Asia-Oceania ) 7,073
Mobiles 4,453 5,900 1,447 32.5%( Japan ) 937(U.S. ) 1,465
(Germany ) 973(Asia-Oceania ) 1,078
Displays 13,223 14,700 1,477 11.2%( Japan ) 2,298(U.S. ) 5,613
(Germany ) 3,128(Asia-Oceania ) 2,184
Consumer Business 2,149 3,300 1,151 53.5%( Japan ) 208(U.S. ) 815
(Germany ) 813(Asia-Oceania ) 313
Business Solution 4,958 6,600 1,642 33.1%( Japan ) 1,070(U.S. ) 461
(Germany ) 2,872(Asia-Oceania ) 555
Technology Solution Business 27,974 25,100 -2,874 -10.3% For smartphones 16,353 13,200 -3,153 -19.3% For tablets 9,532 9,800 268 2.8% For notebook PCs 2,089 2,100 11 0.5%Other Business 663 700 37 5.6%Engineering Solution 663 700 37 5.6%
( Japan ) 663 0 0 0.0%Total 77,568 82,000 4,432 5.7%
FY 3/2017 Summary of Financial Forecast (Consolidated)
YOY Change
from April 1, 2016 to March 31, 2017
YOY Change
P/L FX Rate (Average in the Term
YOY Change
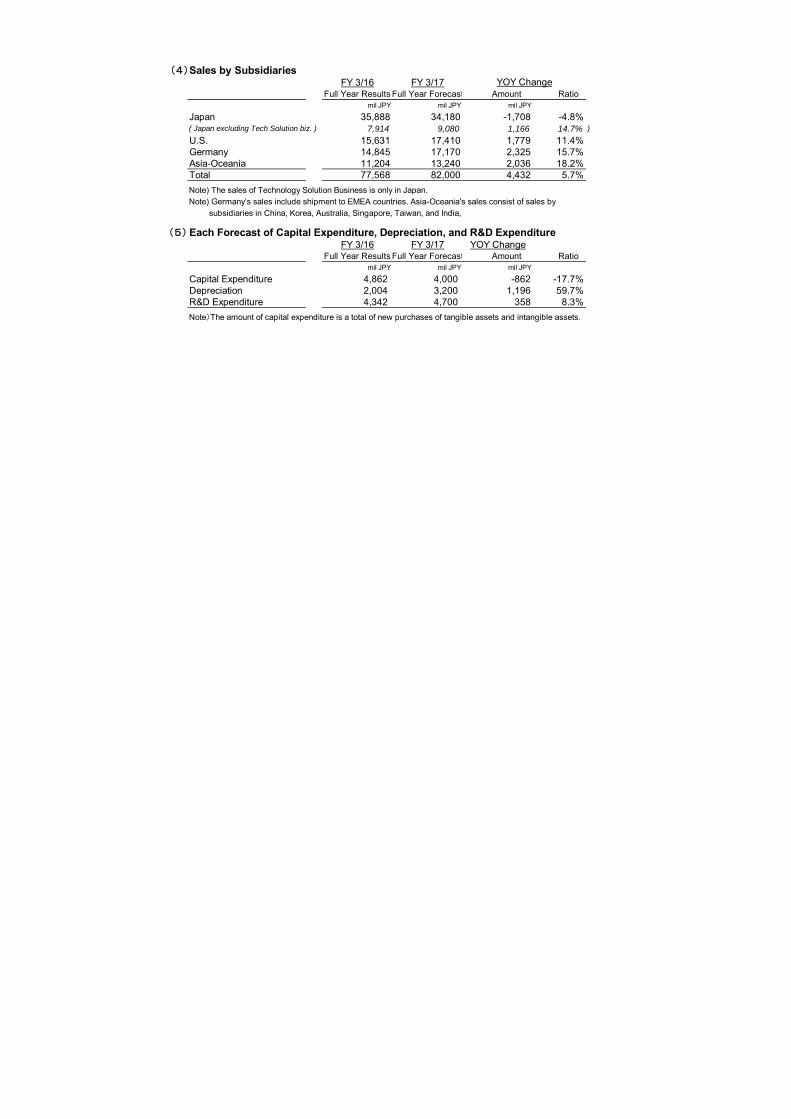
(4)Sales by SubsidiariesFY 3/16 FY 3/17
Full Year Results Full Year Forecast Amount Ratiomil JPY mil JPY mil JPY
Japan 35,888 34,180 -1,708 -4.8%( Japan excluding Tech Solution biz. ) 7,914 9,080 1,166 14.7% )
U.S. 15,631 17,410 1,779 11.4%Germany 14,845 17,170 2,325 15.7%Asia-Oceania 11,204 13,240 2,036 18.2%Total 77,568 82,000 4,432 5.7%
Note) The sales of Technology Solution Business is only in Japan.Note) Germany’s sales include shipment to EMEA countries. Asia-Oceania's sales consist of sales by subsidiaries in China, Korea, Australia, Singapore, Taiwan, and India,
(5) Each Forecast of Capital Expenditure, Depreciation, and R&D ExpenditureFY 3/16 FY 3/17 YOY Change
Full Year Results Full Year Forecast Amount Ratiomil JPY mil JPY mil JPY
Capital Expenditure 4,862 4,000 -862 -17.7%Depreciation 2,004 3,200 1,196 59.7%R&D Expenditure 4,342 4,700 358 8.3%
Note)The amount of capital expenditure is a total of new purchases of tangible assets and intangible assets.
YOY Change
Related Documents


