Formulation of active food packaging by design: Linking composition of the film-forming solution to properties of the chitosan-based film by response surface methodology (RSM) modelling Marijan Bajić a, ⁎, Ana Oberlintner a , Kristi Kõrge a,b , Blaž Likozar a,c , Uroš Novak a a Department of Catalysis and Chemical Reaction Engineering, National Institute of Chemistry, Hajdrihova 19, 1000 Ljubljana, Slovenia b Department of Chemistry and Biotechnology, Tallinn University of Technology, Akadeemia tee 15, 12618 Tallinn, Estonia c Faculty of Chemistry and Chemical Technology, University of Ljubljana, Večna pot 113, 1000 Ljubljana, Slovenia abstract article info Article history: Received 10 April 2020 Received in revised form 13 May 2020 Accepted 22 May 2020 Available online 26 May 2020 An active chitosan-based film, blended with the hydrolysable tannin-rich extract obtained from fibrous chestnut wood (Castanea sativa Mill.), underwent a simultaneous engineering optimization in terms of measured mois- ture content (MC), tensile strength (TS), elongation at break (EB), and total phenolic content (TPC). The optimal product formulation for a homogeneous film-forming solution was sought by designing an empirical Box– Behnken model simulation, based on three independent variables: the concentrations of chitosan (1.5–2.0% (w/v)), extracted powder-form chestnut extract (0.5–1.0% (w/v)) and plasticizer glycerol (30.0–90.0% (w/w); determined per mass of polysaccharide). Obtained linear (MC), quadratic (TS or EB), and two-factor interaction (TPC) sets were found to be significant (p b 0.05), to fit well with characteristic experimental data (0.969 b R 2 b 0.992), and could be considered predictive. Although all system parameters were influential, the level of polyol played a vital continuous role in defining EB, MC, and TS, while the variation of the chestnut extract caused an ex- pected connected change in affecting TPC. The component relationship formula of chemical mixture fractions (1.93% (w/v) of chitosan, 0.97% (w/v) chestnut extract and 30.0% (w/w) of glycerol) yielded the final applicable material of adequate physico-mechanical properties (MC = 17.0%, TS = 16.7 MPa, EB = 10.4%, and TPC = 19.4 mg GAE g film −1 ). Further statistical validation of the concept revealed a sufficient specific accuracy with the computed maximal absolute residual error up to 22.2%. Herein-proposed design methodology can thus be translated to smart packaging fabrication generally. © 2020 Elsevier B.V. All rights reserved. Keywords: Active chitosan-based film Chestnut wood extract Box–Behnken experimental design methodol- ogy Bio-based film-forming solution Physico-mechanical properties Simultaneous model-based optimization 1. Introduction The history of chitosan dates back to the mid-19th century, although its industrial production and utilization start from the 1970s [1]. Nowa- days, a quest for novel methods of chitosan extraction, modification, and characterization is in full swing [2,3]. This trend is based on the facts that chitosan is a non-toxic, biodegradable, and biocompatible bio- polymer with a good film-forming capacity as well as inherent antimi- crobial and antioxidant activities [4,5]. Following this, chitosan has been placed in focus as prospective raw material for the preparation of eco-friendly films for food packaging applications [6–8]. Chitosan- based films, however, may require the incorporation of certain auxiliary components to ameliorate functional properties. In the first instance, plasticization is done to minimize the films' rigidness and brittleness [9], whereby polyols (most of all glycerol) stand as the most widely used plasticizers [10,11]. On the other hand, the incorporation of various active components can lead to the production of chitosan-based films with the enhanced mechanical, barrier, and antimicrobial and/or anti- oxidant properties [3,7,12]. Extracts obtained from different parts of terrestrial plants are fre- quently used active components in eco-friendly films [13]. Recent stud- ies on chitosan-based films highlight the utilization of extracts obtained from banana [14], mangosteen [15], mango [16], black plum [17], pine/ peanut/jujube [18], turmeric [19], hop [20], oak [21], and chestnut [22]. The extract obtained from chestnut wood is quite complex in composi- tion but its major fraction consists of hydrolyzable tannins (HTs), while other components include water, ellagic/gallic acids, simple sugars, pro- teins, mineral substances, and crude fibre [23]. HTs are secondary plant metabolites, but also phenolic compounds by their chemical nature [24]. Due to their prominent biological activity, HTs-rich chestnut ex- tracts have found applications beyond the border of their traditional use in tanning, e.g. as an active agent in the food industry [25,26]. The above-mentioned auxiliary components (plasticizers, active agents) are usually pre-added in the film-forming solutions (FFSs), International Journal of Biological Macromolecules 160 (2020) 971–978 ⁎ Corresponding author at: Department of Biochemical Engineering, University College London, Gower Street, London WC1E 6BT, United Kingdom. E-mail addresses: [email protected], [email protected] (M. Bajić). https://doi.org/10.1016/j.ijbiomac.2020.05.186 0141-8130/© 2020 Elsevier B.V. All rights reserved. Contents lists available at ScienceDirect International Journal of Biological Macromolecules journal homepage: http://www.elsevier.com/locate/ijbiomac

Welcome message from author
This document is posted to help you gain knowledge. Please leave a comment to let me know what you think about it! Share it to your friends and learn new things together.
Transcript
International Journal of Biological Macromolecules 160 (2020) 971–978
Contents lists available at ScienceDirect
International Journal of Biological Macromolecules
j ourna l homepage: ht tp : / /www.e lsev ie r .com/ locate / i jb iomac
Formulation of active food packaging by design: Linking composition ofthe film-forming solution to properties of the chitosan-based film byresponse surface methodology (RSM) modelling
Marijan Bajić a,⁎, Ana Oberlintner a, Kristi Kõrge a,b, Blaž Likozar a,c, Uroš Novak a
a Department of Catalysis and Chemical Reaction Engineering, National Institute of Chemistry, Hajdrihova 19, 1000 Ljubljana, Sloveniab Department of Chemistry and Biotechnology, Tallinn University of Technology, Akadeemia tee 15, 12618 Tallinn, Estoniac Faculty of Chemistry and Chemical Technology, University of Ljubljana, Večna pot 113, 1000 Ljubljana, Slovenia
⁎ Corresponding author at: Department of BiochemicalLondon, Gower Street, London WC1E 6BT, United Kingdom
E-mail addresses: [email protected], [email protected]
https://doi.org/10.1016/j.ijbiomac.2020.05.1860141-8130/© 2020 Elsevier B.V. All rights reserved.
a b s t r a c t
a r t i c l e i n f oArticle history:Received 10 April 2020Received in revised form 13 May 2020Accepted 22 May 2020Available online 26 May 2020
An active chitosan-based film, blendedwith the hydrolysable tannin-rich extract obtained from fibrous chestnutwood (Castanea sativa Mill.), underwent a simultaneous engineering optimization in terms of measured mois-ture content (MC), tensile strength (TS), elongation at break (EB), and total phenolic content (TPC). The optimalproduct formulation for a homogeneous film-forming solution was sought by designing an empirical Box–Behnken model simulation, based on three independent variables: the concentrations of chitosan (1.5–2.0%(w/v)), extracted powder-form chestnut extract (0.5–1.0% (w/v)) and plasticizer glycerol (30.0–90.0% (w/w);determined per mass of polysaccharide). Obtained linear (MC), quadratic (TS or EB), and two-factor interaction(TPC) sets were found to be significant (p b 0.05), to fit well with characteristic experimental data (0.969 b R2
b 0.992), and could be considered predictive. Although all system parameters were influential, the level of polyolplayed a vital continuous role in defining EB,MC, and TS, while the variation of the chestnut extract caused an ex-pected connected change in affecting TPC. The component relationship formula of chemical mixture fractions(1.93% (w/v) of chitosan, 0.97% (w/v) chestnut extract and 30.0% (w/w) of glycerol) yielded the final applicablematerial of adequate physico-mechanical properties (MC = 17.0%, TS= 16.7 MPa, EB= 10.4%, and TPC = 19.4mgGAE gfilm−1 ). Further statistical validation of the concept revealed a sufficient specific accuracywith the computedmaximal absolute residual error up to 22.2%. Herein-proposed design methodology can thus be translated tosmart packaging fabrication generally.
© 2020 Elsevier B.V. All rights reserved.
Keywords:Active chitosan-based filmChestnut wood extractBox–Behnken experimental design methodol-ogyBio-based film-forming solutionPhysico-mechanical propertiesSimultaneous model-based optimization
1. Introduction
The history of chitosan dates back to themid-19th century, althoughits industrial production and utilization start from the 1970s [1]. Nowa-days, a quest for novel methods of chitosan extraction, modification,and characterization is in full swing [2,3]. This trend is based on thefacts that chitosan is a non-toxic, biodegradable, and biocompatible bio-polymer with a good film-forming capacity as well as inherent antimi-crobial and antioxidant activities [4,5]. Following this, chitosan hasbeen placed in focus as prospective raw material for the preparation ofeco-friendly films for food packaging applications [6–8]. Chitosan-based films, however, may require the incorporation of certain auxiliarycomponents to ameliorate functional properties. In the first instance,plasticization is done to minimize the films' rigidness and brittleness[9], whereby polyols (most of all glycerol) stand as the most widely
Engineering, University College.
k (M. Bajić).
used plasticizers [10,11]. On the other hand, the incorporation of variousactive components can lead to the production of chitosan-based filmswith the enhanced mechanical, barrier, and antimicrobial and/or anti-oxidant properties [3,7,12].
Extracts obtained from different parts of terrestrial plants are fre-quently used active components in eco-friendly films [13]. Recent stud-ies on chitosan-based films highlight the utilization of extracts obtainedfrom banana [14], mangosteen [15], mango [16], black plum [17], pine/peanut/jujube [18], turmeric [19], hop [20], oak [21], and chestnut [22].The extract obtained from chestnut wood is quite complex in composi-tion but its major fraction consists of hydrolyzable tannins (HTs), whileother components includewater, ellagic/gallic acids, simple sugars, pro-teins, mineral substances, and crude fibre [23]. HTs are secondary plantmetabolites, but also phenolic compounds by their chemical nature[24]. Due to their prominent biological activity, HTs-rich chestnut ex-tracts have found applications beyond the border of their traditionaluse in tanning, e.g. as an active agent in the food industry [25,26].
The above-mentioned auxiliary components (plasticizers, activeagents) are usually pre-added in the film-forming solutions (FFSs),

Table 1Box–Behnken experimental design matrix.
RunActual valuesa Coded valuesb
x1 x2 x3 X1 X2 X3
1 1.50 0.50 60 −1 −1 02 2.00 0.50 60 +1 −1 03 1.50 1.00 60 −1 +1 04 2.00 1.00 60 +1 +1 05 1.50 0.75 30 −1 0 −16 2.00 0.75 30 +1 0 −17 1.50 0.75 90 −1 0 +18 2.00 0.75 90 +1 0 +19 1.75 0.50 30 0 −1 −110 1.75 1.00 30 0 +1 −111 1.75 0.50 90 0 −1 +112 1.75 1.00 90 0 +1 +113 1.75 0.75 60 0 0 014 1.75 0.75 60 0 0 015 1.75 0.75 60 0 0 0
a Actual values: x1 – concentration of chitosan (CH, % w/v); x2 – concentration ofchestnut extract (CE, % w/v); x3 – concentration of glycerol (GLY, % w/w; calculated permass of chitosan). The concentration of lactic acid was kept constant, as stated inSection 2.3.1.
b Coded values: X1 – the coded level of CH; X2 – the coded level of CE; X3 – the codedlevel of GLY.
972 M. Bajić et al. / International Journal of Biological Macromolecules 160 (2020) 971–978
which could be considered as the films' semi-finished products. The fur-ther strategy of thefilm productionmeans casting of homogeneous FFSson a flat surface followed by a time-limited process of solvent evapora-tion at moderate temperatures [6]. The auxiliary components affect thebiological and physico-chemical characteristics of resulting films inter-dependently, and thus the formulation of FFSs should be carefully opti-mized in terms of achieving desired properties of the final products. Aset of statistical andmathematical tools knownasRSM is of great impor-tance in the design, development, and optimization of new as well as inthe improvement of existing products [27]. For instance, a family of ef-ficient three-level Box–Behnken design, BBD [28], has been applied forthe development of either pure or blended chitosan-based films in sev-eral studies. Drying temperature seems to be the most frequently stud-ied independent variable, either in combination with other processparameters (e.g. relative humidity, storage period [29]) or with filmcomposition parameters (e.g. chitosan/glycerol level [30], glycerol/van-illin level [31]). On the other hand, BBD was used to optimize only theformulation of chitosan-containing composite films blended with TiO2
[32], pea starch [33], and cellulose/polyvinyl alcohol [34].This study brings the optimization of novel active chestnut extract-
incorporated chitosan-based film intended for food packaging into theforeground, and therefore represents an extension of our previouswork on it [22]. The simultaneous optimization was done by linkingthe composition of the FFS containingmatrix-forming biopolymer (chi-tosan), active component (chestnut extract), and plasticizer (glycerol)to the properties of the active film material. Individual and interactiveeffects of the independent variables (concentrations of the FFS compo-nents) on the response variables (MC, TS, EB, and TPC of the film mate-rial) were evaluated by RSM. Moreover, model validation was done bycomparing predicted values of the response variables with those ob-tained from the experimental measurements.
2. Materials and methods
2.1. Materials
Highmolecular weight chitosan (Mw=310–375 kDa; deacetylationdegree ≥ 75%), lactic acid (purity N 85%; density 1.206 g mL−1), Folin-Ciocalteu's phenol reagent,magnesiumnitrate, and gallic acidwere pur-chased from Sigma-Aldrich (Steinheim, Germany). Sodium carbonateand glycerol were fromMerck (Darmstadt, Germany) and PharmachemSušnik (Ljubljana, Slovenia), respectively. All chemicals except lacticacid were of analytical grade. Milli-Q® water was used throughout allexperiments.
Tanin Sevnica (Sevnica, Slovenia) kindly donated a commerciallyavailable chestnut extract obtained from individual parts of chestnutwood. The extract contained ≥75% of tannins and b4% of ash [22], ac-cording to the manufacturer's specifications.
2.2. Experimental design
A 3-level-3-factor BBD with three replicates at the central point,which gives a total of 15 experimental runs [29,31–33], was used tostudy the effect of FFS composition on the physico-mechanical proper-ties of chitosan-based films (prepared according to the protocols de-scribed in Section 2.3). The levels of three main components of the FFSwere chosen as independent variables: (i) concentration of chitosan(CH, x1, % w/v), (ii) concentration of chestnut extract (CE, x2, % w/v),and (iii) concentration of glycerol (GLY, x3, % w/w, calculated per massof chitosan); whereby each variable was tested at three differentcoded levels: low (−1), medium (0), and high (+1). The low levelwas limited by mechanical properties of the final materials (films pre-pared from the FFSs containing a low amount of raw materials tend tobe mechanically unstable and brittle), while the high level was limitedby physical properties of the FFSs (the addition of raw materials inhigh concentrations gives very viscous and inapplicable FFSs). The
experimental designmatrix, in terms of actual (xi) and coded (Xi) levelsof the independent variables, is presented in Table 1.
The coded values are related to the actual values by the relation in-dicated in Eq. (1):
Xi ¼ 2� xi−xmð Þ=di ð1Þ
whereby xi, xm, and di denote variable value in the actual units of the ithobservation, mean of the highest and the lowest variable value, and thedifference between the highest and the lowest variable value, respec-tively [30]. After conducting all experimental runs (Table 1), a second-order polynomial equation was applied to fit the experimental re-sponses to the coded variables, as denoted in Eq. (2):
Yn ¼ β0 þX3
i¼1
βiXi þX3
i ¼ 1
ib j
X3
i¼1
βij Xi Xj þX3
i¼1
βii X2i þ ε ð2Þ
where,
Yn denotes predicted response;Xi (Xj) denotes a dimensionless coded value of the independent var-iable xi (xj);β0 denotes the model constant (intercept);βi denotes linear regression coefficient;βij denotes cross-product regression coefficient;βii denotes quadratic regression coefficient.
2.3. Film-forming solutions and chitosan-based films
2.3.1. Film-forming solutionsAll FFSs formulations (Table 1) were prepared by adding
predetermined amounts of CH (% w/v) and GLY (% w/w, calculatedper mass of CH) in the solvent (1% (v/v) aqueous solution of lacticacid) followed by continuous stirring (1000 rpm; 12 h; room tempera-ture, 24 °C) on RCT magnetic stirrer (IKA, Staufen, Germany) andvacuum-filtration through two sheets of medical gauze [20]. Thepredetermined amounts of CE were added subsequently after the filtra-tion step and the mixtures were homogenized (6000 rpm; 2 min) onUltra-Turrax® T50 (IKA) and left overnight to get rid of the air bubblesformed during this process. A small amount of stable sticky foam that
973M. Bajić et al. / International Journal of Biological Macromolecules 160 (2020) 971–978
was formed on the top of the mixtures due to the presence of CE waseventually removed by using a laboratory spatula [22]. A potential lossof CE during this procedure was presumed to be insignificant and with-out influence on the qualitative and quantitative composition of theFFSs.
2.3.2. Chitosan-based filmsPrepared FFSs were cast in polyurethane Petri dishes (approxi-
mately 0.32 mL cm−2) and left in drying oven Kambič SP-55 C (Kambič,Semič, Slovenia) at 40 °C for the next 48 h. Obtained films were peeledoff from Petri dishes, treated by ABS Digital Thickness Gauge (Mitutoyo,Aurora, USA) to measure their thicknesses (the measurements wereperformed at ten randomly selected positions and the resultswere aver-aged), and stored in a glass humidity chamber containing a saturatedaqueous solution of Mg(NO3)2 (relative humidity, RH = 53–55%;room temperature, 24 °C) until further analysis.
2.4. Fourier transform infrared spectroscopy analysis
The Fourier transform infrared (FT-IR) spectra (wavenumbers rangefrom 4000 cm−1 to 450 cm−1; resolution 4 cm−1) were recorded atroom temperature using Spectrum Two FT-IR spectrometer(PerkinElmer, Waltham, USA). The tested film samples were preparedfrom the FFSs containing 1.5% (w/v) of CH (unplasticized film), 1.5%(w/v) of CH and 30.0% (w/w; per mass of chitosan) of GLY (plasticizedfilm), and 1.5% (w/v) of CH, 30.0% (w/w; per mass of chitosan) of GLY,and 1.0% (w/v) of CE (plasticized film with incorporated CE). Thescans were done in triplicates on random positions of each tested sam-ple and the resulting curves were averaged.
2.5. Response variables
2.5.1. Moisture contentMCwas determined gravimetrically, according to the previously de-
scribed protocol [20]. In short, rectangular samples (~1 cm2) wereweighted on an analytical balance (Kern & Sohn, Balingen, Germany)to get the initial (M1) and dry mass (M2; obtained after drying at 105°C for 24 h), and the results were expressed as the percentage ofwater content in the films following thatMC=(M1−M2 /M1) × 100%.
2.5.2. Tensile strengthTS was determined by testing rectangular film samples (length ×
width=8 cm×2 cm; gage length segment 6 cm) on theXLWAuto Ten-sile Tester (Labthink® Instruments, Jinan, China) equippedwith a 100Nload cell, at a crosshead speed of 25mmmin−1. TSwas calculated by di-viding the maximal load with the average original cross-sectional areain the sample gage length segment [20].
2.5.3. Elongation at breakEBwas tested on the same samples and using the same equipment as
stated in Section 2.5.2. EBwas calculated as the ratio between increasedlength after breakage and the initial gage length [20].
2.5.4. Total phenolic contentTPC was estimated using Folin-Ciocalteu's (FC) phenol reagent, as
described elsewhere [20]. Small rectangular film samples of knownmasses were placed in glass vials, and water was added to reach thefinal film concentration of 5 mg mL−1, followed by successive additionof FC phenol reagent and 10% (w/v) aqueous solution of Na2CO3
(added 10% and 20% based on the volume of water, respectively).After the sample incubation for 2 h (dark conditions; room tempera-ture), the absorbance of the solutions was measured at 765 nm usingSynergy™ 2 Multi-Detection Microplate Reader (BioTek, Winooski,USA). The results were expressed as the mass of gallic acid equivalent(GAE) per mass of the film.
2.6. Simultaneous optimization and model validation
A desirability function-based approach [27] was used for the simul-taneous optimization of response variables (Eq. (S1), Appendix A). Theoptimizationwasdone based on the following goals: (i)minimization ofMC, (ii) maximization of TS, (iii) minimization of EB, (iv) maximizationof TPC. An algorithmwas then applied tomaximize the overall desirabil-ity (D; ranging from 0 to 1), defined as the geometric average of the in-dividual desirability functions [31]. Model validation was performed bycomparing predicted values of the response variables and those ob-tained from experimental measurements using a set of films preparedfrom the optimized FFS.
2.7. Statistical analysis
All measurements (Sections 2.5.1–2.5.4) on the film samples pre-pared for tested FFSs (runs 1–15, Table 1) were performed in triplicatesand the mean values were used in the analysis. Statistical analysis andsimultaneous optimization were done by a trial version of Design-Expert® software (Stat-Ease, Minneapolis, USA; version 12.0.0.6; serialnumber: 7614-9562-2103-EVAL). Response surface graphs obtainedfrom the regression equations in terms of coded values were visualizedusing a Python plotting library Matplotlib.
3. Results and discussion
3.1. Preparation of film-forming solutions and chitosan-based films
Two rawmaterials used in this study – the matrix-forming biopoly-mer CH (Fig. 1a) and the active component CE (Fig. 1b) – are obtainablefrom natural and renewable sources such as marine- and wood-basedbiomass, respectively. The third raw material, plasticizer GLY, wasadded in a low concentration relative to CHand CE, but it was very influ-ential on the film properties (Sections 3.3–3.5). Processing of the rawmaterials led to the preparation of brown-shaded FFSs (Fig. 1c),whose formulation was further optimized to get films of satisfying me-chanical integrity and desired physico-mechanical properties (Fig. 1d).
It has been visually observed that variation in the concentrations ofraw materials significantly affects the physical properties of the FFSs.In this regard, the viscosity of FFSs was mainly affected by variationsin the concentrations of CH and CE, while their visual appearanceswere affected by variations in the concentration of CE. A brownishshade of FFSs became more intense upon increasing the concentrationof CE (Fig. S1, Appendix A), whereby this trendwas replicated in the vi-sual appearance of chitosan-based films as well (Fig. S2, Appendix A).
The morphological evaluation of film materials has revealed theircompact structure without any significant microscopic pores or cracksat the films' cross-sections and surfaces (Fig. S2, Appendix A). The meanthickness of all tested film samples (Section 2.2) was 120 ± 30 μm,which is slightly above the values obtained for our previous chitosan-basedfilms prepared from the FFSs containing up to 1.5% (w/v) of hop ex-tract [20]. Nevertheless, it is still within the range of values for otherchitosan-based films with incorporated active components [16,18].
3.2. Fourier transform infrared spectroscopy analysis
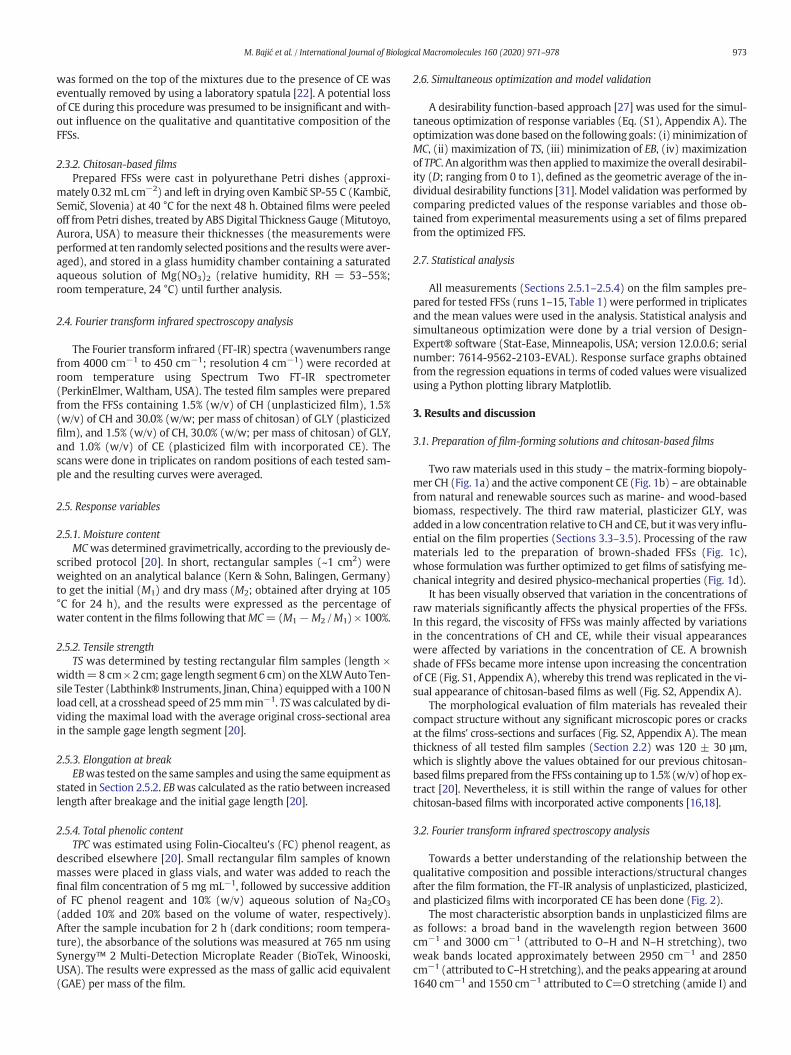
Towards a better understanding of the relationship between thequalitative composition and possible interactions/structural changesafter the film formation, the FT-IR analysis of unplasticized, plasticized,and plasticized films with incorporated CE has been done (Fig. 2).
The most characteristic absorption bands in unplasticized films areas follows: a broad band in the wavelength region between 3600cm−1 and 3000 cm−1 (attributed to O–H and N–H stretching), twoweak bands located approximately between 2950 cm−1 and 2850cm−1 (attributed to C–H stretching), and the peaks appearing at around1640 cm−1 and 1550 cm−1 attributed to C=O stretching (amide I) and
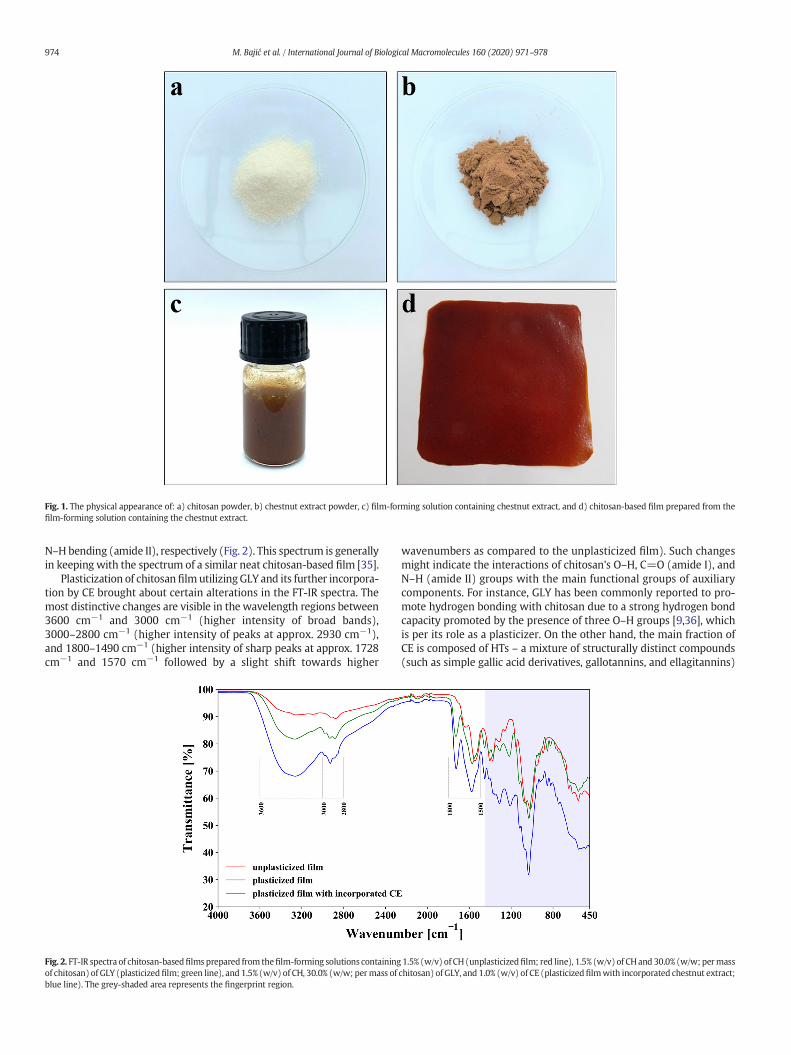
Fig. 1. The physical appearance of: a) chitosan powder, b) chestnut extract powder, c) film-forming solution containing chestnut extract, and d) chitosan-based film prepared from thefilm-forming solution containing the chestnut extract.
974 M. Bajić et al. / International Journal of Biological Macromolecules 160 (2020) 971–978
N–H bending (amide II), respectively (Fig. 2). This spectrum is generallyin keeping with the spectrum of a similar neat chitosan-based film [35].
Plasticization of chitosan film utilizingGLY and its further incorpora-tion by CE brought about certain alterations in the FT-IR spectra. Themost distinctive changes are visible in the wavelength regions between3600 cm−1 and 3000 cm−1 (higher intensity of broad bands),3000–2800 cm−1 (higher intensity of peaks at approx. 2930 cm−1),and 1800–1490 cm−1 (higher intensity of sharp peaks at approx. 1728cm−1 and 1570 cm−1 followed by a slight shift towards higher
Fig. 2. FT-IR spectra of chitosan-basedfilms prepared from thefilm-forming solutions containingof chitosan) of GLY (plasticizedfilm; green line), and 1.5% (w/v) of CH, 30.0% (w/w; permass ofblue line). The grey-shaded area represents the fingerprint region.
wavenumbers as compared to the unplasticized film). Such changesmight indicate the interactions of chitosan's O–H, C=O (amide I), andN–H (amide II) groups with the main functional groups of auxiliarycomponents. For instance, GLY has been commonly reported to pro-mote hydrogen bonding with chitosan due to a strong hydrogen bondcapacity promoted by the presence of three O–H groups [9,36], whichis per its role as a plasticizer. On the other hand, the main fraction ofCE is composed of HTs – a mixture of structurally distinct compounds(such as simple gallic acid derivatives, gallotannins, and ellagitannins)
1.5% (w/v) of CH (unplasticizedfilm; red line), 1.5% (w/v) of CHand 30.0% (w/w; permasschitosan) of GLY, and 1.0% (w/v) of CE (plasticizedfilmwith incorporated chestnut extract;

Table 2Experimental responses of dependent variables.
RunaExperimental responseb
MC TS EB TPC
1 35.1 7.7 53.7 13.02 33.4 8.7 56.9 10.13 25.1 10.4 62.4 22.94 28.5 7.8 23.4 19.95 21.7 21.6 48.1 17.46 20.4 18.0 10.3 19.07 38.6 5.6 59.3 17.78 36.3 6.6 57.6 12.69 24.8 14.7 57.1 11.010 20.2 15.7 36.7 23.711 42.8 4.4 86.7 9.612 36.5 3.2 68.3 17.813 30.4 9.7 75.0 16.214 31.1 7.1 71.8 17.115 30.7 8.2 69.6 14.5Min. 20.2 3.2 10.3 9.6Max. 42.8 21.6 86.7 23.7Mean 30.4 10.0 55.8 16.2Std. dev. 6.7 5.1 19.2 4.2
a The actual and coded values of independent variables in each experimental run arepresented in Table 1.
b MC, moisture content (%); TS, tensile strength (MPa); EB, elongation at break (%); TPC,total phenolic content (mgGAE gfilm−1 ).
975M. Bajić et al. / International Journal of Biological Macromolecules 160 (2020) 971–978
that possess a huge number of O–H (and C=O) functional groups [24]. Itcould be assumed that these functional groups are also involved in thenon-covalent interactions with CH molecules. This assumption mightbe supported by similar changes in the FT-IR spectrum of a chitosan-based film with incorporated ellagitannins-rich oak extract [21],which belongs to the same class as CE [37].
General conclusions derived from the FT-IR spectra of herein pre-sented three representative samples of chitosan-based films mightpoint to good incorporation of the auxiliary components in the polymermatrix established over non-covalent interactions of GLY and HTs withO–H, N–H, and C=O (in acetylatedmonomers) groups of CH. Neverthe-less, the FT-IR analysis has not been intended to play a decisive role inwhether (and how) the interactions between components reflect atthefinal properties of chitosan-basedfilms. This analysis actually shouldplay a supportive role, i.e. the results from this section should beinterpreted in context with the models discussed below. For thosewho seek a more detailed spectroscopic analysis, the FT-IR spectra ofraw materials are enclosed in Appendix A (Fig. S3), while a more in-depth interpretation can be found elsewhere in the literature [10,35,37].
3.3. Moisture content
MC notably affects the barrier,mechanical, and thermal properties ofchitosan-based films, which is of paramount importance for their appli-cation in food preservation [38]. Therefore, a set of 15 experimental
Table 3ANOVA summary statistics.
Responsea Source SSb dfb MSb F
MC Model 646.46 3 215.49 1Lack of fit 20.77 9 2.31 1
TS Model 378.68 9 42.08 3Lack of fit 3.27 3 1.09 0
EB Model 5494.74 9 610.53 7Lack of fit 27.12 3 9.04 1
TPC Model 255.82 6 42.64 4Lack of fit 4.30 6 0.7174 0
a MC, moisture content (%); TS, tensile strength (MPa); EB, elongation at break (%); TPC, totab SS, the sum of squares; df, degrees of freedom; MS, mean square; R2adj, adjusted R2.
measurements conducted on this variable revealed thatMCwas rangingfrom 20.2% to 42.8% (Table 2).
Further processing of the experimental data has led to the develop-ment of a linearmathematical model which efficiently described the re-lationship between independent variables andMC [YMC=30.37–0.24X1− 3.23X2 + 8.39X3]. An insight into the ANOVA summary statistics im-plied the model was significant (Table 3), whereby the proposed equa-tionmatched at least 96.85% of the total variations. Furthermore, a smalldifference between R2 and adjusted R2 (R2adj) indicated there were nounnecessary model terms included [27].
In this case, concentrations of CE and GLY were significant modelterms (p b 0.05). The effect of all three independent variables on MCcan be seen in Fig. 3a.1–3a.3.MCwas almost constant alongwith the en-tire range of CH concentrations, but the values increased alongwith de-creasing amount of CE (Fig. 3a.1), and the increasing amount of GLY(Fig. 3a.2). Plotting the concentrations of active component and plasti-cizer showed the highest values of MC were in the films producedfrom the FFS containing the minimal concentration of CE and maximalconcentration of GLY (Fig. 3a.3).
Such a response might be a consequence of the hydrogen bondingbetween CH and auxiliary components. Namely, GLY establishes inter-molecular hydrogen bonds with adjacent chains of CH (Section 3.2),causing changes in the spatial conformation of the film three-dimensional matrix [9,36]. This might aswell expose hydrogen bondingsites of CH to interact with water molecules and retain themwithin thepolymer matrix. The fact that GLY is hygroscopic by itself due to thepresence of three –OH could be contributive toMC as well [33]. A posi-tive correlation between the level of GLY andMC in chitosan-basedfilmsis in line with the findings reported elsewhere [10,33]. On the otherhand, CE was added in much higher concentrations relative to GLY. Itsmajor components (HTs) possess multiple interaction sites thatcrosslink polymer chains and therefore tend to saturate hydrogen bond-ing sites of CH. This might further prevent the retention of water mole-culewithin thematrix and lead to lower values ofMC. The incorporationof other plant-based active components has also been reported to re-duce the water absorption capacity of chitosan-based films [15,16,20].
3.4. Tensile strength
TS represents one of the most studied mechanical property ofchitosan-based films intended for food packaging, and it refers to thefilms' resistance to failure at elevated loads or deformation. The valuesof TS should be as high as possible because food packagingmust preservemechanical integrity and therefore provide sufficient protection of thefood during transportation and storage. The TS values of tested film sam-ples were ranging from 3.2 MPa to 21.6 MPa (Table 2), which is in agree-ment with the values of many other biodegradable packaging films withincorporatedplant extracts [13], but slightly below the values of some fre-quently used commercialmaterials [39]. The relationship between the in-dependent variables and TSwas found to be quadratic [YTS=8.33–0.53X1+ 0.20X2 − 6.28X3 − 0.90X1X2 + 1.15X1X3 − 0.55X2X3 + 1.88X1
2 −
-value p-Value R2 R2adjb Remark
12.81 b0.0001 0.9685 0.9599 Linear model8.71 0.05181.51 0.0007 0.9827 0.9515 Quadratic model.64 0.65722.91 b0.0001 0.9924 0.9788 Quadratic model.23 0.47863.78 b0.0001 0.9704 0.9483 2FI model.4115 0.8314
l phenolic content (mgGAE gfilm−1 ).
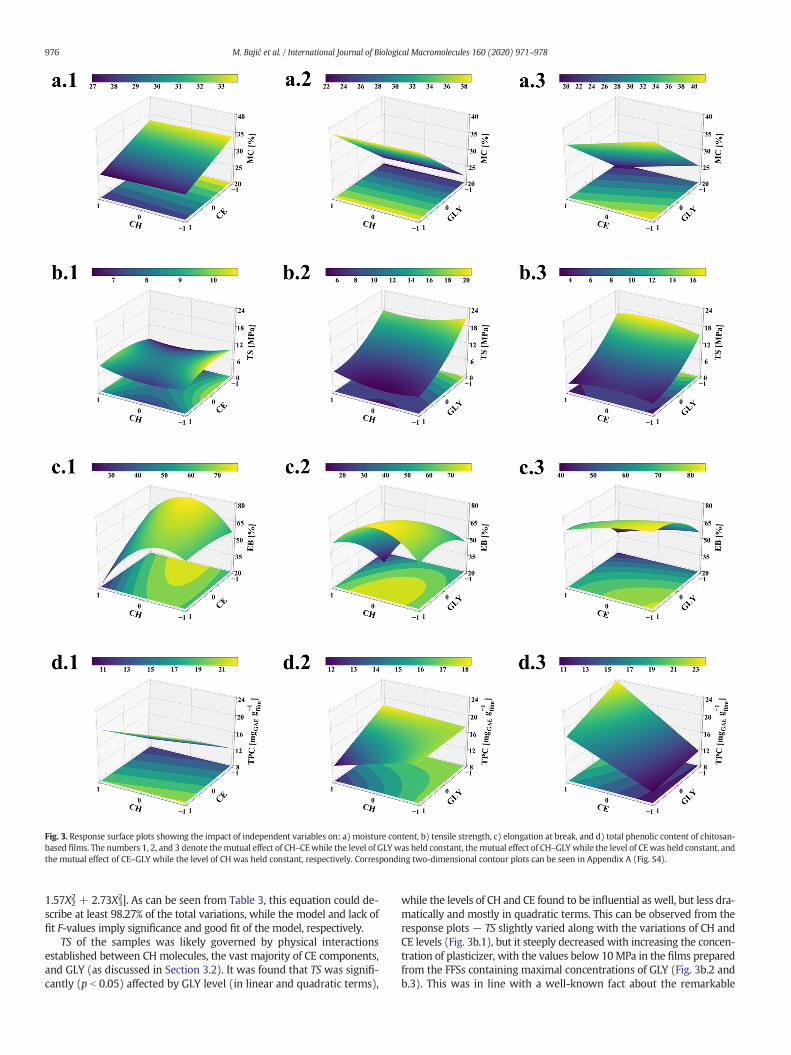
Fig. 3. Response surface plots showing the impact of independent variables on: a) moisture content, b) tensile strength, c) elongation at break, and d) total phenolic content of chitosan-based films. The numbers 1, 2, and 3 denote themutual effect of CH–CEwhile the level of GLYwas held constant, themutual effect of CH–GLYwhile the level of CEwas held constant, andthe mutual effect of CE–GLY while the level of CH was held constant, respectively. Corresponding two-dimensional contour plots can be seen in Appendix A (Fig. S4).
976 M. Bajić et al. / International Journal of Biological Macromolecules 160 (2020) 971–978
1.57X22 + 2.73X32]. As can be seen from Table 3, this equation could de-scribe at least 98.27% of the total variations, while the model and lack offit F-values imply significance and good fit of the model, respectively.
TS of the samples was likely governed by physical interactionsestablished between CH molecules, the vast majority of CE components,and GLY (as discussed in Section 3.2). It was found that TS was signifi-cantly (p b 0.05) affected by GLY level (in linear and quadratic terms),
while the levels of CH and CE found to be influential as well, but less dra-matically and mostly in quadratic terms. This can be observed from theresponse plots − TS slightly varied along with the variations of CH andCE levels (Fig. 3b.1), but it steeply decreased with increasing the concen-tration of plasticizer, with the values below 10MPa in the films preparedfrom the FFSs containing maximal concentrations of GLY (Fig. 3b.2 andb.3). This was in line with a well-known fact about the remarkable
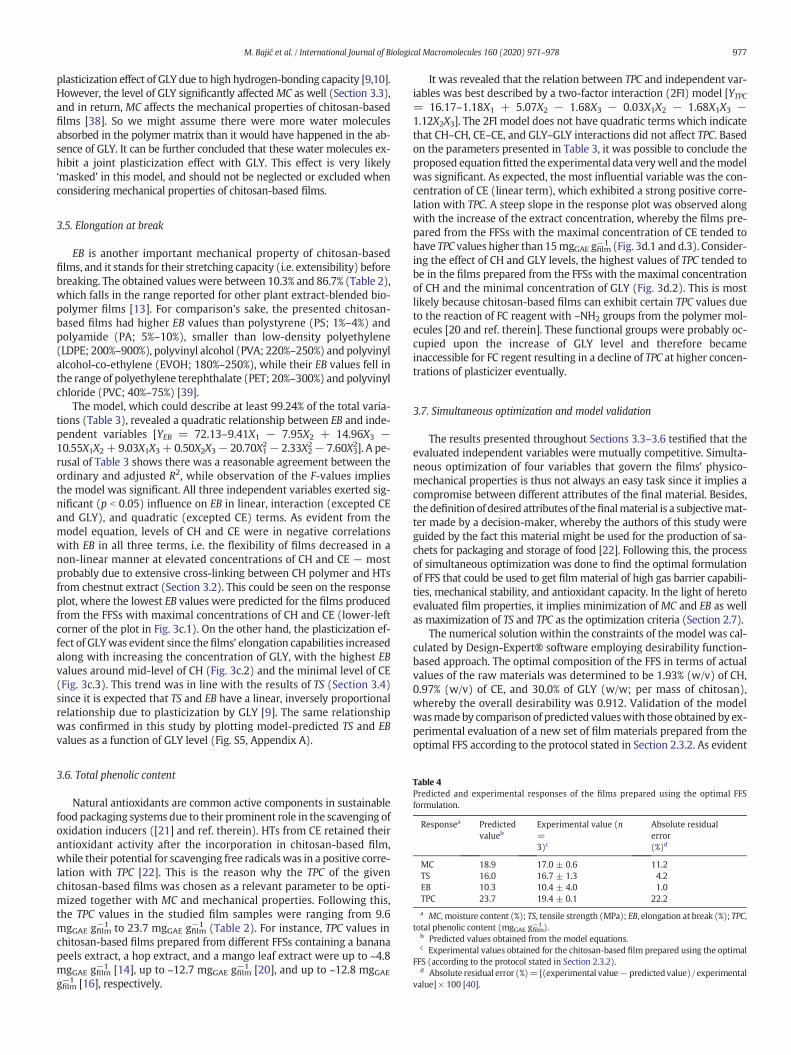
Table 4Predicted and experimental responses of the films prepared using the optimal FFSformulation.
Responsea Predictedvalueb
Experimental value (n=3)c
Absolute residualerror(%)d
MC 18.9 17.0 ± 0.6 11.2TS 16.0 16.7 ± 1.3 4.2EB 10.3 10.4 ± 4.0 1.0TPC 23.7 19.4 ± 0.1 22.2
a MC, moisture content (%); TS, tensile strength (MPa); EB, elongation at break (%); TPC,total phenolic content (mgGAE gfilm−1 ).
b Predicted values obtained from the model equations.c Experimental values obtained for the chitosan-based film prepared using the optimal
FFS (according to the protocol stated in Section 2.3.2).d Absolute residual error (%)= [(experimental value− predictedvalue) / experimental
value] × 100 [40].
977M. Bajić et al. / International Journal of Biological Macromolecules 160 (2020) 971–978
plasticization effect of GLY due to high hydrogen-bonding capacity [9,10].However, the level of GLY significantly affectedMC as well (Section 3.3),and in return, MC affects the mechanical properties of chitosan-basedfilms [38]. So we might assume there were more water moleculesabsorbed in the polymer matrix than it would have happened in the ab-sence of GLY. It can be further concluded that these water molecules ex-hibit a joint plasticization effect with GLY. This effect is very likely‘masked’ in this model, and should not be neglected or excluded whenconsidering mechanical properties of chitosan-based films.
3.5. Elongation at break
EB is another important mechanical property of chitosan-basedfilms, and it stands for their stretching capacity (i.e. extensibility) beforebreaking. The obtained values were between 10.3% and 86.7% (Table 2),which falls in the range reported for other plant extract-blended bio-polymer films [13]. For comparison's sake, the presented chitosan-based films had higher EB values than polystyrene (PS; 1%–4%) andpolyamide (PA; 5%–10%), smaller than low-density polyethylene(LDPE; 200%–900%), polyvinyl alcohol (PVA; 220%–250%) and polyvinylalcohol-co-ethylene (EVOH; 180%–250%), while their EB values fell inthe range of polyethylene terephthalate (PET; 20%–300%) and polyvinylchloride (PVC; 40%–75%) [39].
The model, which could describe at least 99.24% of the total varia-tions (Table 3), revealed a quadratic relationship between EB and inde-pendent variables [YEB = 72.13–9.41X1 − 7.95X2 + 14.96X3 −10.55X1X2+ 9.03X1X3+ 0.50X2X3− 20.70X12− 2.33X22− 7.60X32]. A pe-rusal of Table 3 shows there was a reasonable agreement between theordinary and adjusted R2, while observation of the F-values impliesthe model was significant. All three independent variables exerted sig-nificant (p b 0.05) influence on EB in linear, interaction (excepted CEand GLY), and quadratic (excepted CE) terms. As evident from themodel equation, levels of CH and CE were in negative correlationswith EB in all three terms, i.e. the flexibility of films decreased in anon-linear manner at elevated concentrations of CH and CE − mostprobably due to extensive cross-linking between CH polymer and HTsfrom chestnut extract (Section 3.2). This could be seen on the responseplot, where the lowest EB values were predicted for the films producedfrom the FFSs with maximal concentrations of CH and CE (lower-leftcorner of the plot in Fig. 3c.1). On the other hand, the plasticization ef-fect of GLYwas evident since the films' elongation capabilities increasedalong with increasing the concentration of GLY, with the highest EBvalues around mid-level of CH (Fig. 3c.2) and the minimal level of CE(Fig. 3c.3). This trend was in line with the results of TS (Section 3.4)since it is expected that TS and EB have a linear, inversely proportionalrelationship due to plasticization by GLY [9]. The same relationshipwas confirmed in this study by plotting model-predicted TS and EBvalues as a function of GLY level (Fig. S5, Appendix A).
3.6. Total phenolic content
Natural antioxidants are common active components in sustainablefood packaging systems due to their prominent role in the scavenging ofoxidation inducers ([21] and ref. therein). HTs from CE retained theirantioxidant activity after the incorporation in chitosan-based film,while their potential for scavenging free radicals was in a positive corre-lation with TPC [22]. This is the reason why the TPC of the givenchitosan-based films was chosen as a relevant parameter to be opti-mized together with MC and mechanical properties. Following this,the TPC values in the studied film samples were ranging from 9.6mgGAE gfilm−1 to 23.7 mgGAE gfilm−1 (Table 2). For instance, TPC values inchitosan-based films prepared from different FFSs containing a bananapeels extract, a hop extract, and a mango leaf extract were up to ~4.8mgGAE gfilm−1 [14], up to ~12.7 mgGAE gfilm−1 [20], and up to ~12.8 mgGAEgfilm−1 [16], respectively.
It was revealed that the relation between TPC and independent var-iables was best described by a two-factor interaction (2FI) model [YTPC= 16.17–1.18X1 + 5.07X2 − 1.68X3 − 0.03X1X2 − 1.68X1X3 −1.12X2X3]. The 2FI model does not have quadratic terms which indicatethat CH–CH, CE–CE, and GLY–GLY interactions did not affect TPC. Basedon the parameters presented in Table 3, it was possible to conclude theproposed equationfitted the experimental data verywell and themodelwas significant. As expected, the most influential variable was the con-centration of CE (linear term), which exhibited a strong positive corre-lation with TPC. A steep slope in the response plot was observed alongwith the increase of the extract concentration, whereby the films pre-pared from the FFSs with the maximal concentration of CE tended tohave TPC values higher than 15mgGAE gfilm−1 (Fig. 3d.1 and d.3). Consider-ing the effect of CH and GLY levels, the highest values of TPC tended tobe in the films prepared from the FFSs with the maximal concentrationof CH and the minimal concentration of GLY (Fig. 3d.2). This is mostlikely because chitosan-based films can exhibit certain TPC values dueto the reaction of FC reagent with –NH2 groups from the polymer mol-ecules [20 and ref. therein]. These functional groups were probably oc-cupied upon the increase of GLY level and therefore becameinaccessible for FC regent resulting in a decline of TPC at higher concen-trations of plasticizer eventually.
3.7. Simultaneous optimization and model validation
The results presented throughout Sections 3.3–3.6 testified that theevaluated independent variables were mutually competitive. Simulta-neous optimization of four variables that govern the films' physico-mechanical properties is thus not always an easy task since it implies acompromise between different attributes of the final material. Besides,thedefinition of desired attributes of thefinalmaterial is a subjectivemat-ter made by a decision-maker, whereby the authors of this study wereguided by the fact this material might be used for the production of sa-chets for packaging and storage of food [22]. Following this, the processof simultaneous optimization was done to find the optimal formulationof FFS that could be used to get film material of high gas barrier capabili-ties, mechanical stability, and antioxidant capacity. In the light of heretoevaluated film properties, it implies minimization of MC and EB as wellas maximization of TS and TPC as the optimization criteria (Section 2.7).
The numerical solution within the constraints of the model was cal-culated by Design-Expert® software employing desirability function-based approach. The optimal composition of the FFS in terms of actualvalues of the raw materials was determined to be 1.93% (w/v) of CH,0.97% (w/v) of CE, and 30.0% of GLY (w/w; per mass of chitosan),whereby the overall desirability was 0.912. Validation of the modelwasmade by comparison of predicted valueswith those obtained by ex-perimental evaluation of a new set of film materials prepared from theoptimal FFS according to the protocol stated in Section 2.3.2. As evident

978 M. Bajić et al. / International Journal of Biological Macromolecules 160 (2020) 971–978
from Table 4, the absolute residual errors were between 1.0% and 11.2%,which is in line with the accuracy of the models generated for otherpolymer-based films [31,33,40].
4. Conclusions
The response surface methodology has been successfully applied inthe formulation of active food packaging by linking composition of thefilm-forming solution to the physico-mechanical properties of thefinal material. The results revealed that, among the tested independentvariables, the level of plasticizer was the most influential on moisturecontent andmechanical properties, while the level of the active compo-nent was the most influential on the antioxidant capacity of chitosan-based films. Further insight into the optimization and validation of themodel-based results showed that it was possible to produce a materialwith satisfactory moisture, mechanical stability, and antioxidant capac-ity from the optimized film-forming solution under defined fabricationprocess parameters. The achievements of this study undoubtedlyproved the response surface methodology as a time-saving and cost-efficient tool in design, development, and optimization of activechitosan-based films intended for food packaging.
Declaration of competing interest
The authors declare that they have no known competing financialinterests or personal relationships that could have appeared to influ-ence the work reported in this paper.
Acknowledgements
BioApp project (Interreg V-A Italy-Slovenia 2014–2020 program)and Slovenian Research Agency (research core funding No. P2-0152)are highly acknowledged for financial support. The authors are gratefulto the company Tanin Sevnica (Sevnica, Slovenia) for the donation ofchestnut extract.
Appendix A. Supplementary data
Supplementary data to this article can be found online at https://doi.org/10.1016/j.ijbiomac.2020.05.186.
References
[1] G. Crini, Historical review on chitin and chitosan biopolymers, Environ. Chem. Lett.17 (2019) 1623–1643.
[2] H. El Knidri, R. Belaabed, A. Addaou, A. Laajeb, A. Lahsini, Extraction, chemical mod-ification and characterization of chitin and chitosan, Int. J. Biol. Macromol. 120(2018) 1181–1189.
[3] U. Novak, M. Bajić, K. Kõrge, A. Oberlintner, J. Murn, K. Lokar, K.V. Triler, B. Likozar,From waste/residual marine biomass to active biopolymer-based packaging filmmaterials for food industry applications – a review, Phys. Sci. Rev. (2019)https://doi.org/10.1515/psr-2019-0099.
[4] M. Hosseinnejad, S.M. Jafari, Evaluation of different factors affecting antimicrobialproperties of chitosan, Int. J. Biol. Macromol. 85 (2016) 467–475.
[5] P. Kulawik, E. Jamróz, F. Özogul, Chitosan role for shelf-life extension of seafood, En-viron. Chem. Lett. (2020) 61–74.
[6] P. Cazón, M. Vázquez, Applications of chitosan as food packaging materials, in: G.Crini, E. Lichtfouse (Eds.), Sustain. Agric. Rev, Springer Nature Switzerland AG,Cham 2019, pp. 81–123.
[7] M. Mujtaba, R.E. Morsi, G. Kerch, M.Z. Elsabee, M. Kaya, J. Labidi, K.M. Khawar, Cur-rent advancements in chitosan-based film production for food technology; a review,Int. J. Biol. Macromol. 121 (2019) 889–904.
[8] H. Wang, J. Qian, F. Ding, Emerging chitosan-based films for food packaging applica-tions, J. Agric. Food Chem. 66 (2018) 395–413.
[9] M. Chen, T. Runge, L. Wang, R. Li, J. Feng, X.L. Shu, Q.S. Shi, Hydrogen bonding impacton chitosan plasticization, Carbohydr. Polym. 200 (2018) 115–121.
[10] X. Ma, C. Qiao, X. Wang, J. Yao, J. Xu, Structural characterization and properties ofpolyols plasticized chitosan films, Int. J. Biol. Macromol. 135 (2019) 240–245.
[11] M. Matet, M.C. Heuzey, E. Pollet, A. Ajji, L. Avérous, Innovative thermoplastic chito-san obtained by thermo-mechanical mixing with polyol plasticizers, Carbohydr.Polym. 95 (2013) 241–251.
[12] A.P. Lunkov, A.V. Ilyina, V.P. Varlamov, Antioxidant, antimicrobial, and fungicidal prop-erties of chitosan based films (review), Appl. Biochem. Microbiol. 54 (2018) 449–458.
[13] S.A. Mir, B.N. Dar, A.A. Wani, M.A. Shah, Effect of plant extracts on the techno-functional properties of biodegradable packaging films, Trends Food Sci. Technol.80 (2018) 141–154.
[14] W. Zhang, X. Li, W. Jiang, Development of antioxidant chitosan film with bananapeels extract and its application as coating in maintaining the storage quality ofapple, Int. J. Biol. Macromol. (2019)https://www.sciencedirect.com/science/article/pii/S0141813019368114.
[15] X. Zhang, J. Liu, H. Yong, Y. Qin, J. Liu, C. Jin, Development of antioxidant and antimi-crobial packaging films based on chitosan and mangosteen (Garcinia mangostana L.)rind powder, Int. J. Biol. Macromol. 145 (2020) 1129–1139.
[16] K. Rambabu, G. Bharath, F. Banat, P.L. Show, H.H. Cocoletzi, Mango leaf extract incor-porated chitosan antioxidant film for active food packaging, Int. J. Biol. Macromol.126 (2019) 1234–1243.
[17] X. Zhang, Y. Liu, H. Yong, Y. Qin, J. Liu, J. Liu, Development of multifunctional foodpackaging films based on chitosan, TiO2 nanoparticles and anthocyanin-rich blackplum peel extract, Food Hydrocoll. 94 (2019) 80–92.
[18] X. Zhang, H. Lian, J. Shi, W. Meng, Y. Peng, Plant extracts such as pine nut shell, pea-nut shell and jujube leaf improved the antioxidant ability and gas permeability ofchitosan films, Int. J. Biol. Macromol. 148 (2019) 1242–1250.
[19] Z. Li, S. Lin, S. An, L. Liu, Y. Hu, L. Wan, Preparation, characterization and anti-aflatoxigenic activity of chitosan packaging films incorporated with turmeric essen-tial oil, Int. J. Biol. Macromol. 131 (2019) 420–434.
[20] M. Bajić, H. Jalšovec, A. Travan, U. Novak, B. Likozar, Chitosan-based filmswith incor-porated supercritical CO2 hop extract: structural, physicochemical, and antibacterialproperties, Carbohydr. Polym. 219 (2019) 261–268.
[21] M. Bajić, T. Ročnik, A. Oberlintner, F. Scognamiglio, U. Novak, B. Likozar, Naturalplant extracts as active components in chitosan-based films: a comparative study,Food Packag. Shelf Life 21 (2019), 100365. .
[22] K. Kõrge, M. Bajić, B. Likozar, U. Novak, Active chitosan-chestnut extract films usedfor packaging and storage of fresh pasta, Int. J. Food Sci. Technol. (2020)https://doi.org/10.1111/ijfs.14569.
[23] G. Biagi, I. Cipollini, B.R. Paulicks, F.X. Roth, Effect of tannins on growth performanceand intestinal ecosystem in weaned piglets, Arch. Anim. Nutr. 64 (2010) 121–135.
[24] R. Amarowicz, M. Janiak, Hydrolysable tannins, in: L. Melton, F. Shahidi, P. Varelis(Eds.), Encycl. Food Chem, Academic Press 2019, pp. 337–343.
[25] N. Echegaray, B. Gómez, F.J. Barba, D. Franco, M. Estévez, J. Carballo, K. Marszałek,J.M. Lorenzo, Chestnuts and by-products as source of natural antioxidants in meatand meat products: a review, Trends Food Sci. Technol. 82 (2018) 110–121.
[26] A. Messini, A. Buccioni, S. Minieri, F. Mannelli, L. Mugnai, C. Comparini, M. Venturi, C.Viti, A. Pezzati, S. Rapaccini, Effect of chestnut tannin extract (Castanea sativaMiller)on the proliferation of Cladosporium cladosporioides on sheep cheese rind during theripening, Int. Dairy J. 66 (2017) 6–12.
[27] R.H. Myers, D.C. Montgomery, C.M. Anderson-Cook, Response Surface Methodology:Process and Product Optimization Using Designed Experiments, 4th ed. John Wiley& Sons, Hoboken, 2016.
[28] G.E.P. Box, D.W. Behnken, Some new three level designs for the study of quantitativevariables, Technometrics 2 (1960) 455–475.
[29] P.C. Srinivasa, R. Ravi, R.N. Tharanathan, Effect of storage conditions on the tensileproperties of eco-friendly chitosan films by response surface methodology, J. FoodEng. 80 (2007) 184–189.
[30] T.P. Singh, M.K. Chatli, J. Sahoo, Development of chitosan based edible films: processoptimization using response surface methodology, J. Food Sci. Technol. 52 (2015)2530–2543.
[31] B. Tomadoni, A. Ponce, M. Pereda, M.R. Ansorena, Vanillin as a natural cross-linkingagent in chitosan-based films: optimizing formulation by response surface method-ology, Polym. Test. 78 (2019), 105935. .
[32] Y. Tao, J. Pan, S. Yan, B. Tang, L. Zhu, Tensile strength optimization and characteriza-tion of chitosan/TiO2 hybrid film, Mater. Sci. Eng. B Solid-State Mater. Adv. Technol.138 (2007) 84–89.
[33] R. Thakur, B. Saberi, P. Pristijono, C.E. Stathopoulos, J.B. Golding, C.J. Scarlett, M.Bowyer, Q.V. Vuong, Use of response surface methodology (RSM) to optimize peastarch-chitosan novel edible film formulation, J. Food Sci. Technol. 54 (2017)2270–2278.
[34] P. Cazón, M. Vázquez, G. Velazquez, Composite films of regenerate cellulose withchitosan and polyvinyl alcohol: evaluation of water adsorption, mechanical and op-tical properties, Int. J. Biol. Macromol. 117 (2018) 235–246.
[35] H. Liu, R. Adhikari, Q. Guo, B. Adhikari, Preparation and characterization of glycerolplasticized (high-amylose) starch-chitosan films, J. Food Eng. 116 (2013) 588–597.
[36] A. Domján, J. Bajdik, K. Pintye-Hódi, Understanding of the plasticizing effects of glyc-erol and PEG 400 on chitosan films using solid-state NMR spectroscopy, Macromol-ecules 42 (2009) 4667–4673.
[37] G. Tondi, A. Petutschnigg, Middle infrared (ATR FT-MIR) characterization of indus-trial tannin extracts, Ind. Crop. Prod. 65 (2015) 422–428.
[38] R.Y. Aguirre-Loredo, A.I. Rodríguez-Hernández, E. Morales-Sánchez, C.A.Gómez-Aldapa, G. Velazquez, Effect of equilibrium moisture content on barrier,mechanical and thermal properties of chitosan films, Food Chem. 196 (2016)560–566.
[39] F. Luzi, L. Torre, J.M. Kenny, D. Puglia, Bio- and fossil-based polymeric blends andnanocomposites for packaging: structure-property relationship, Materials 12(2019) (49 pp.).
[40] B. Saberi, R. Thakur, Q.V. Vuong, S. Chockchaisawasdee, J.B. Golding, C.J. Scarlett, C.E.Stathopoulos, Optimization of physical and optical properties of biodegradable edi-ble films based on pea starch and guar gum, Ind. Crop. Prod. 86 (2016) 342–352.
Related Documents