GLOBAL TRENDS FORCED DISPLACEMENT IN 2020

Welcome message from author
This document is posted to help you gain knowledge. Please leave a comment to let me know what you think about it! Share it to your friends and learn new things together.
Transcript
GLOBAL TRENDSFORCED DISPLACEMENT IN 2020

Trends at a Glanceat the end of 2020 as a result of persecution, conflict, violence, human rights violations or events seriously disturbing public order.
82.4 MILLIONFORCIBLY DISPLACED WORLDWIDE
3.7 MILLION REFUGEES HOSTED
IN TURKEY
Turkey hosted nearly 3.7 million refugees, the largest population worldwide. Colombia was second with more than 1.7 million, including Venezuelans displaced abroad.
Turkey 3.7 million
Colombia1.7 million
Pakistan1.4 million
Uganda 1.4 million
Germany 1.2 million
86% HOSTED IN
DEVELOPING COUNTRIES
Developing countries hosted 86 per cent of the world’s refugees and Venezuelans displaced abroad. The Least Developed Countries provided asylum to 27 per cent of the total.
73% HOSTED IN
NEIGHBOURING COUNTRIES
73 per cent of refugees and Venezuelans displaced abroad lived in countries neighbouring their countries of origin.
1 IN 6 ARE DISPLACED
Relative to their national populations, the island of Aruba hosted the largest number of Venezuelans displaced abroad (1 in 6) while Lebanon hosted the largest number of refugees (1 in 8)3, followed by Curaçao (1 in 10), Jordan (1 in 15) and Turkey (1 in 23).4
Lebanon 1 in 8
Aruba 1 in 6
Curaçao 1 in 10
Jordan 1 in 15
Turkey 1 in 23
26 . 4 million refugees
20.7 million refugees under UNHCR’s mandate
5.7 million Palestine refugees under UNRWA’s mandate
48 . 0 million internally displaced people1
4 . 1 million asylum-seekers
3 . 9 million Venezuelans displaced abroad2
-
90M
50M
30M
70M
10M
1990 2000 2010 2020
1 Source: Internal Displacement Monitoring Centre2 This number excludes Venezuelan asylum-seekers and refugees.3 When the 480,000 Palestinian refugees registered with UNRWA living in Lebanon are included, this proportion increases to one in five.4 In addition, Lebanon hosted 480,000 and Jordan 2.3 million Palestine refugees under UNRWA’s mandate.
2 UNHCR > GLOBAL TRENDS 2020
SOLUTIONS
5 This is the number of Venezuelan refugees and Venezuelans displaced abroad.
6 See the Coordination Platform for Refugees and Migrants from Venezuela R4V.
7 Sources: Estimation of IDP demographics (IDMC); Palestine refugees under UNRWA’s mandate (UNRWA); Refugees, people in a refugee-like situation, asylum-seekers and Venezuelans displaced abroad are based on the available data (UNHCR) and World Population estimates (UN Department of Economic and Social Affairs).
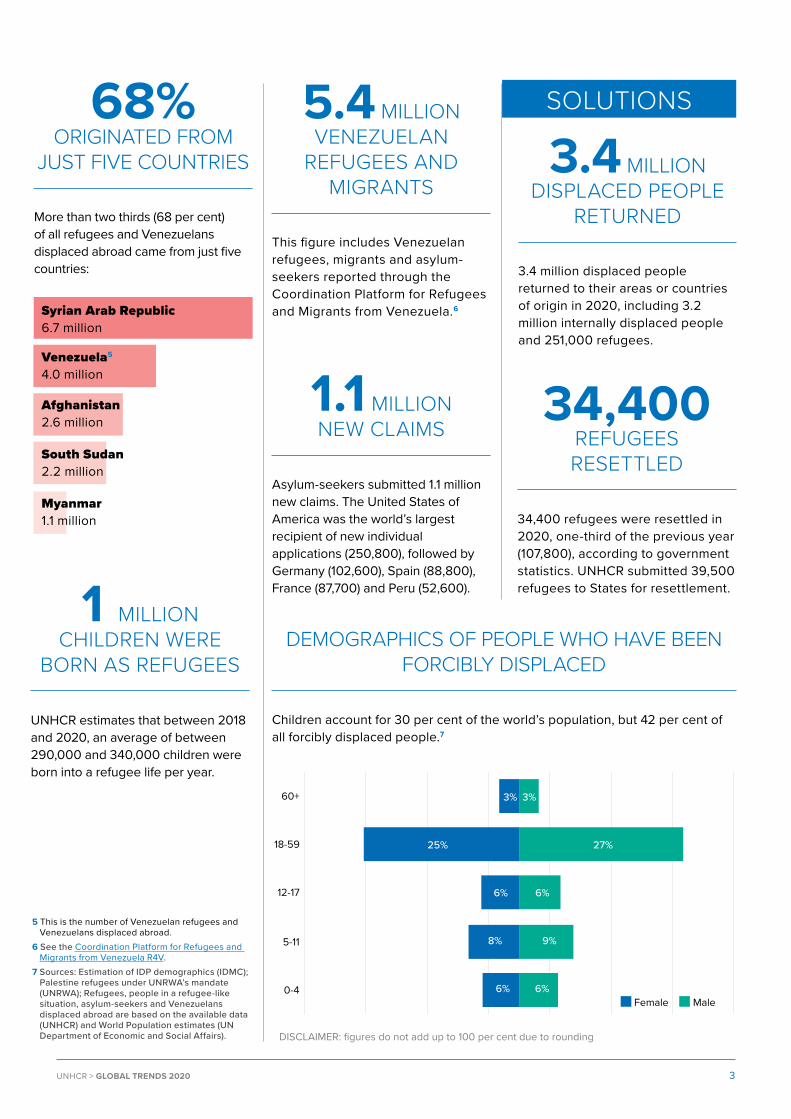
34,400REFUGEES RESETTLED
34,400 refugees were resettled in 2020, one-third of the previous year (107,800), according to government statistics. UNHCR submitted 39,500 refugees to States for resettlement.
DEMOGRAPHICS OF PEOPLE WHO HAVE BEEN FORCIBLY DISPLACED
Children account for 30 per cent of the world’s population, but 42 per cent of all forcibly displaced people.7
68% ORIGINATED FROM
JUST FIVE COUNTRIES
More than two thirds (68 per cent) of all refugees and Venezuelans displaced abroad came from just five countries:
5.4 MILLION VENEZUELAN
REFUGEES AND MIGRANTS
This figure includes Venezuelan refugees, migrants and asylum-seekers reported through the Coordination Platform for Refugees and Migrants from Venezuela.6
3.4 MILLION DISPLACED PEOPLE
RETURNED
3.4 million displaced people returned to their areas or countries of origin in 2020, including 3.2 million internally displaced people and 251,000 refugees.
1.1 MILLION NEW CLAIMS
Asylum-seekers submitted 1.1 million new claims. The United States of America was the world’s largest recipient of new individual applications (250,800), followed by Germany (102,600), Spain (88,800), France (87,700) and Peru (52,600).1 MILLION
CHILDREN WERE BORN AS REFUGEES
UNHCR estimates that between 2018 and 2020, an average of between 290,000 and 340,000 children were born into a refugee life per year.
Syrian Arab Republic 6.7 million
Venezuela5
4.0 million
Afghanistan 2.6 million
South Sudan 2.2 million
Myanmar1.1 million
0-4
5-11
12-17
18-59
60+
Female Male6%
8%
6%
25%
3%
6%
9%
6%
27%
3%
DISCLAIMER: figures do not add up to 100 per cent due to rounding
3UNHCR > GLOBAL TRENDS 2020

Statistics for forcibly displaced people and the population of concern to UNHCR
The main focus of this report is the analysis of statistical trends and changes in global forced displacement from January to December 2020 among populations for whom UNHCR has been entrusted with a responsibility by the international community.8 The data presented are based on information received as of 30 May 2021 unless otherwise indicated.
At the end of 2020, the total number of forcibly displaced people was 82.4 million, while the total population of concern to UNHCR stood at 91.9 million people.
The total number of forcibly displaced people encompasses refugees, asylum-seekers, internally displaced people and Venezuelans displaced abroad. It includes refugees and other displaced people who
are not covered by UNHCR’s mandate and excludes other categories such as returnees and non-displaced stateless people.
The total population of concern to UNHCR relates to the people UNHCR is mandated to protect and assist. It includes those who have been forcibly displaced; those who have returned home within the previous year; those who are stateless (most of whom are not forcibly displaced); and other groups to whom UNHCR has extended its protection or provided assistance on a humanitarian basis.
These two categorizations are compared graphically below. A detailed breakdown of UNHCR’s population of concern by category and country is provided in Annex Table 1.
The figures in this report are based on data reported by governments, non-governmental organizations and UNHCR. Numbers are rounded to the closest hundred or thousand. As some adjustments may appear later in the year in UNHCR’s Refugee Data
Finder,9 figures contained in this report should be considered as provisional and subject to change. Unless otherwise specified, the report does not refer to events occurring after 31 December 2020.
8 See the Methodology page of UNHCR’s Refugee Data Finder for a definition of each population group.9 https://www.unhcr.org/refugee-statistics
Asylum-seekers
Venezuelans displaced abroad
Internally Displaced People (IDPs)
Stateless people
IDP returns
Refugee returns
Others of concern to UNHCR
Forcibly displaced people82,381,000
Population of concern to UNHCR91,923,000
4.1M
3.9M
48.0M
4.2M
3.2M
0.25M
8.3M
Used consistently in both categorizations.
Used consistently in both categorizations.
The biggest difference between the two categorizations is with people who have been internally displaced. When presenting these statistics, UNHCR applies two different sources: IDMC’s IDP statistics collate the total forcibly displaced while those IDPs protected/assisted by UNHCR are included in the total population of concern to UNHCR.The two sources of IDP data vary significantly in certain countries. Globally, for 2020, IDMC report 48.0 million IDPs while UNHCR reports 48.6 million conflict-affected IDPs.
While in total UNHCR reports 4.2 million stateless people, 1.2 million are also forcibly displaced from Myanmar. These 1.2 million are only counted as forcibly displaced when calculating the total population of concern to UNHCR to avoid double counting.
Only included in UNHCR’s population of concern for a period of 12 months.
Only included in UNHCR’s population of concern for a period of 12 months.
Only included in UNHCR’s population of concern.
Palestine refugees under UNRWA’s mandate
5.7M Not included in UNHCR’s population of concern.
Refugees under UNHCR’s mandate 20.7M
Includes both refugees and people in refugee-like situations. Used consistently in both categorizations.
48.6M
4 UNHCR > GLOBAL TRENDS 2020

CHAPTER 1
The year 2020 will be remembered as a year like no other. The COVID-19 pandemic has disrupted all facets of life, causing millions of deaths around the world and leading to human suffering, economic recession, restrictions on human mobility and severe limitations on daily life.
While the full impact of the COVID-19 pandemic on wider cross-border migration and displacement globally is not yet clear, UNHCR data shows that arrivals of new refugees and asylum-seekers were sharply down in most regions – about 1.5 million
10 Based on displacement trends observed over the past 20 years, expected forced displacement in 2020 was estimated using a gravity model addressing explicitly the statistical problems of the non-random selection of destination countries by refugees from different countries of origin as well as controlling for the probability of the occurrence of trigger events such as conflict, based on the approaches documented in Echevarria & Gardeazabal, 2016 and Abel et al. 2019. Point estimates are based on the predicted values of the original full dataset. The 95 per cent bootstrap confidence intervals are computed using 200 resamples with replacement of the original dataset.
11 United Nations Department of Economic and Social Affairs (UN DESA), Population Division (2020). International Migration 2020 Highlights. UN DESA estimates the total number of international migrants at 281 million in 2020.
fewer people than would have been expected in non-COVID circumstances, and reflecting how many of those seeking international protection in 2020 became stranded (see Figure 1 by region).10 Similarly, the United Nations estimate that the pandemic may have reduced the number of international migrants by around two million globally during the first six months of the year. This corresponds to a decrease of around 27 per cent in the expected number of international migrants from July 2019 to June 2020.11
Figure 1 | Actual new arrivals of refugees and asylum-seekers versus forecast | 2020
Americas
Asia and the Pacific
East and Horn of Africa and Great Lakes
Europe
Middle East and North Africa
Southern Africa
West and Central Africa
Grand Total
-100% -80% -60% -40% -20% 0% 20% 40%
A negative percentage in the chart means that there were fewer arrivals than forecast.
Global Forced DisplacementMore than 82 million people worldwide are forcibly displaced
While the 1951 Refugee Convention and the Global Compact on Refugees provide the legal framework and tools to respond to displacement, we need much greater political will to address conflicts and persecution that force people to flee in the first place.Filippo Grandi UN High Commissioner for Refugees
5UNHCR > GLOBAL TRENDS 2020
CHAPTER 1

People were forced to flee their homes throughout the year despite an urgent appeal from the U.N. Secretary-General on 23 March 2020 calling for a global ceasefire to enable a concerted response to the pandemic.12 By the end of 2020, the number of people forcibly displaced due to persecution, conflict, violence, human rights violations and events seriously disturbing public order had grown to 82.4 million, the highest number on record according to available data.13 This was more than double the level of a decade ago (41 million in 2010, see Figure 2), and a four per cent increase from the 2019 total of 79.5 million. As a result, above one per cent of the world’s population – or 1 in 95 people – is now forcibly displaced. This compares with 1 in 159 in 2010.
Several crises – some new, some resurfacing after years – forced people to flee within or beyond the borders of their country. Afghanistan, Somalia and Yemen continued to be hotspots, while conflict in the Syrian Arab Republic (Syria) stretched into its tenth year. In the Sahel region of Africa, nearly three-quarters of a million people were newly displaced in what is perhaps the most complex regional crisis worldwide. In the Democratic Republic of the Congo (DRC), atrocities carried out by armed groups led to UNHCR partners documenting the killings of more than 2,000 civilians in its three eastern provinces.
In Ethiopia, more than one million people were displaced within the country during the year, while
12 See https://www.un.org/en/globalceasefire13 These included 26.4 million refugees: 20.7 million under UNHCR’s mandate and 5.7 million Palestine refugees registered with the United
Nations Relief and Works Agency for Palestine Refugees in the Near East (UNRWA). The global figure also included 48.0 million internally displaced persons (source: IDMC), 4.1 million individuals whose asylum applications had not yet been adjudicated by the end of the reporting period, and 3.9 million Venezuelans displaced abroad.
14 Consisting of more than 1.1 million new individual asylum claims and 305,500 refugees recognized on a prima facie or group basis. Some of these people may have arrived prior to 2020.
15 Based on a global estimate from IDMC.
more than 54,000 fled the Tigray region into eastern Sudan. In northern Mozambique, hundreds of thousands escaped deadly violence, with civilians witnessing massacres by non-state armed groups in several villages, including beheadings and abductions of women and children. The outbreak of hostilities between Armenia and Azerbaijan left a devastating impact on civilians in both countries and displaced tens of thousands of people.
Measures implemented by governments to limit the spread of COVID-19, including restricting freedom of movement and closing borders, made it considerably harder for people fleeing war and persecution to reach safety. However, a number of States have found ways to preserve some form of access to territory for people seeking international protection despite the pandemic. Uganda, for example, has accepted thousands of refugees from the DRC while ensuring that necessary health measures, including quarantine, were also taken.
During 2020, an estimated 11.2 million people became newly displaced – a total that includes people displaced for the first time as well as people displaced repeatedly. This includes 1.4 million who sought protection outside their country,14 plus 9.8 million new displacements within countries.15 This figure exceeds the 2019 total of 11.0 million.
Figure 2 | Global forced displacement | end-year
0
10
20
30
40
50
60
70
80
90
'10 '11 '12 '13 '14 '15 '16 '17 '18 '19 '20
Popu
latio
n (m
illio
ns)
Internally displaced people UNRWA refugees UNHCR refugees Asylum-seekers Venezuelans displaced abroad
CHAPTER 1
6 UNHCR > GLOBAL TRENDS 2020

With many governments closing borders for extended periods of time and restricting internal mobility, only a limited number of refugees and internally displaced people were able to avail themselves of solutions such as voluntary return or resettlement to a third country. Some 251,000 refugees were able to return to their country of origin in 2020, either assisted by UNHCR or spontaneously. This is the third lowest number of the past decade, and it continues a downward trend from the previous two years. Impediments to returns in many countries of origin include ongoing insecurity, the absence of essential services and the lack of livelihood opportunities.
16 This number includes Venezuelans displaced abroad, Venezuelan refugees and asylum-seekers recorded in UNHCR statistics. It does not include other Venezuelans beyond the Latin American and Caribbean region.
In the early phase of the pandemic, UNHCR and the International Organization for Migration put on hold resettlement departures for several months amid border and travel restrictions around the world. While these activities subsequently resumed, only 34,400 refugees were resettled to third countries in 2020, two-thirds of them assisted by UNHCR. This compares to 107,800 the year before and marks a dramatic 69 per cent decline – at a time when 1.4 million refugees are estimated to be in need of resettlement.
Figure 3 | International displacement situations by country of origin | end-2020*
0 1 2 3 4 5 6 7
Syria
Venezuela
Afghanistan
South Sudan
Myanmar
DRC
Somalia
Sudan
Central African Rep.
Eritrea
(millions)
*Excludes Palestine refugeesunder UNRWA's mandate.
Refugees
Asylum-seekers
Venezuelans displaced abroad
6.7
2.6
2.2
1.1
0.8
0.8
0.8
0.6
0.5
0.9 3.9
Refugees are not the only forcibly displaced people struggling to access solutions. In comparison with 2019, 40 per cent fewer IDPs (3.2 million versus 5.3 million in 2019) were able to return to their place of residence, leaving millions of IDPs in protracted displacement. Almost half of all IDP returns were concentrated in the Democratic Republic of the Congo (1.4 million).
The conflict in Syria has dragged on for one full decade, with more than half of its population still forcibly displaced, representing by far the largest forcibly displaced population worldwide (13.5 million, including more than 6.7 million internally displaced). When considering only international displacement situations, Syrians also topped the list with 6.8 million people, followed by Venezuelans with 4.9 million.16
7UNHCR > GLOBAL TRENDS 2020
CHAPTER 1

Afghans and South Sudanese came next, with 2.8 and 2.2 million respectively (see Figure 3).17
There was no change from 2019 in the top five countries that host the largest number of people displaced across borders.18 Turkey reported the highest number with just under 4 million, most of whom were Syrian refugees (92 per cent).
17 Excluding Palestine refugees under UNRWA’s mandate.18 Refers to refugees, asylum-seekers and Venezuelans displaced abroad. 19 See page 10 for more details.20 Both figures are significant underestimates due to the limited number of countries reporting data.
Colombia followed, hosting over 1.7 million displaced Venezuelans. Germany hosted the third largest number, almost 1.5 million, with Syrian refugees and asylum-seekers constituting the largest groups (44 per cent). Pakistan and Uganda hosted the 4th and 5th largest number, with about 1.4 million each (see Figure 4).
Figure 4 | International displacement situations by host country | end-2020*
Children are particularly affected during displacement crises, especially if their displacement drags on for many years. New UNHCR estimates show that almost one million children were born as refugees between 2018 and 2020.19 Many of them are at risk of remaining in exile for years to come, some potentially for the rest of their lives. It is especially challenging to ensure the best interests of children who are at risk, including children who are unaccompanied or separated from their families. Some 21,000
unaccompanied or separated children (UASC) lodged new asylum applications in 2020 (2 per cent), compared to 25,000 one year earlier (1 per cent).20 Considering that new asylum applications in 2020 dropped by one million due to COVID-19, this figure is disproportionately high.
0 1 2 3 4
Turkey
Colombia
Germany
Pakistan
Uganda
United States
Peru
Sudan
Lebanon
Bangladesh
(millions)
*Excludes Palestine refugeesunder UNRWA's mandate.
RefugeesAsylum-seekersVenezuelans displaced abroad
3.7
1.2
1.4
1.4
0.3
1.0
0.9
0.9
0.3
0.2
1.0
0.5
1.7
0.5
CHAPTER 1
8 UNHCR > GLOBAL TRENDS 2020

What next?
The magnitude and severity of food crises worsened in 2020 as protracted conflicts, extreme weather and the economic fallout of COVID-19 exacerbated pre-existing situations. Forecasts for 2021 are equally worrying, with some of the world’s worst food crises – including in displacement-affected countries such as South Sudan, Syria and the Central African Republic – at risk of turning into famine.21 Similarly, the World Bank expects the number of people pushed into extreme poverty due to COVID-19 to rise to an unprecedented level of between 119 million and 124 million in 2020.22
Although reported incidents of conflict and reported violence declined overall in 2020, in nearly half the world’s countries they rose. Because the pandemic is considered a unique development and vaccine distribution in response to COVID-19 is accelerating with countries relaxing public health restrictions, global conflict levels, locations, and agents are expected to increase significantly in 2021 – ultimately to a higher point than both 2019 and 2020, according to ACLED.23
Climate change is driving displacement and increasing the vulnerability of those already forced to flee.24 Forcibly displaced and stateless people are on the front lines of the climate emergency. Many are living in climate “hotspots” where they typically lack the resources to adapt to an increasingly inhospitable environment. The dynamics of poverty, food insecurity, climate change, conflict and displacement are increasingly interconnected and mutually reinforcing, driving more and more people to search for safety and security.
21 See 2021 Global Report on Food Crisis22 See https://blogs.worldbank.org/opendata/updated-estimates-impact-covid-19-global-poverty-looking-back-2020-and-outlook-202123 See The Armed Conflict Location & Event Data Project, ACLED 2020: The year in review, 2021.24 See Displaced on the frontlines of the climate emergency25 See https://www.unhcr.org/statistics/country/51bacb0f9/ 26 See https://www.unhcr.org/en-ie/51b9ba826.pdf27 All Venezuelans present on Colombian territory and lacking a legal status as of 31 January 2021 and those who will enter the country through
regular entry points until 30 June 2023 are eligible for temporary protection status.
At the launch of the 2012 Global Trends report25 in June 2013, António Guterres, who was then U.N. High Commissioner for Refugees, stated “These truly are alarming numbers. They reflect individual suffering on a huge scale and they reflect the difficulties of the international community in preventing conflicts and promoting timely solutions for them.”26 At the time, UNHCR reported that 45 million people were forcibly displaced worldwide. Now, almost a decade later, this figure has risen to more than 82 million. It is the ninth consecutive year-on-year increase. Based on this trajectory, the question is no longer if forced displacement will exceed 100 million people – but rather when. Clearly, the need for preventing conflicts and ensuring that displaced people have access to solutions has never been more pressing than now.
The early months of 2021 have offered a glimmer of hope, even as conflict and displacement continue in many parts of the world. The announcement by the US Government to admit more resettled refugees – up to 62,500 in 2021 and up to 125,000 in 2022 – will provide solutions to more of the world’s most vulnerable refugees, especially if other countries follow suit. Another positive step is the Government of Colombia’s announcement in February 2021 to grant temporary protection status to more than one million Venezuelans.27 Many more such symbols of solidarity and responsibility-sharing are needed to fulfil the rights, needs and, where possible, hopes of the displaced people around the world – and also realize the vision of the Global Compact on Refugees.
9UNHCR > GLOBAL TRENDS 2020
CHAPTER 1
BORN INTO A REFUGEE LIFE – IMPACT ON EDUCATION?
Registering the birth of every child in the civil registry is essential to recognizing its existence. It provides the child proof of legal identity and thus the ability to exercise rights and access services. The relevance of birth registration has been recognized in the Sustainable Development Goals (SDGs) and their pledge to leave no one behind. In this regard, SDG Target 16.9 is crucial: By 2030, provide legal identity for all, including birth registration.28 Comprehensive and accurate data on birth registration remains hard to come by, but UNICEF estimated in 2019 that the number of children whose births are registered in the civil registry has risen significantly worldwide. However, one in every four children below the age of five, some 166 million in all, remain unregistered.29
Registering children born to refugees is even more complex – but also vital to ensuring that they receive adequate protection and assistance. The number of registered births is often unavailable, not reported by governments or not properly recorded in national administrative systems. In many cases this is because the births of refugee children cannot or will not be registered in the host States’ Civil Registration and Vital Statistics (CRVS) systems or it may be difficult to determine among all children registered by authorities, how many are refugees. Even where UNHCR is operationally active and maintaining up-to-date figures on refugee family composition to enable its work, it is challenging to obtain a full picture. This is partly due to security concerns and other barriers that prevent UNHCR and its partners from collecting complete data sets. To fill these gaps, UNHCR has used statistical modelling to impute the missing values based on existing registration information gathered from governments as well as from UNHCR’s own case management system.30
However, the results should be viewed with the caveat that there remains statistical uncertainty due to the lack of data in some regions for specific refugee populations.
Based on this analysis, UNHCR estimates that almost one million children were born into a refugee life between 2018 and 2020, an average of between 290,000 and 340,000 per year.31 The analysis for 2020, however, most likely underestimates the number of children born, due to suspension of face-to-face activities in many countries during COVID-related lockdowns. Hence, a large number of births were not properly recorded in either host States’ CRVS or refugee registration systems. As they adapted to the pandemic, some countries have begun clearing these backlogs. Many refugee situations around the world have become protracted, relegating more and more children born to refugee parents to spend their entire childhood, and possibly their whole lives, outside their country of origin. Many may themselves have children or grandchildren born into refugee life. This has major implications for education, with a great many refugees never having the experience of going to school in their family’s country of origin. This in turn, may exacerbate the risk for children fall into child labour, including in its worst forms.32
28 See https://unstats.un.org/sdgs/. SDG Indicator 16.9.1 asks States to report on the “Proportion of children under 5 years of age whose births have been registered with a civil authority, by age.”
29 See UNICEF, Birth Registration for Every Child by 2030: Are we on track? 30 UNHCR has tested several models with multinomial multiple imputation generating the best results. Figures presented here are based on this
method.31 Refers to refugees and Venezuelans displaced abroad.32 See UNICEF-ILO, COVID-19 and child labour: A time of crisis, a time to act
10 UNHCR > GLOBAL TRENDS 2020
CHAPTER 1
Developing countries are home to 86 per cent of the world’s refugees, with 6.7 million refugees hosted in Least Developed Countries. This means systems in countries with limited capacity to provide basic services will disproportionately absorb refugee students. As a result, the basic rights and economic, social and psychological needs of millions of refugee children and youth risk being left unmet.
Data collected since 2015 have shown that, over the years, around half of school-age refugee children and youth were out of school. However, there has been some success. Out of school numbers fell from 55 per cent in 2017 to 48 per cent in 2019 across the 12 countries sampled33 – a seemingly small change which nevertheless represents more than half a million additional children entering school. Data from 2019 for 12 countries sampled indicates that 77 per cent of refugee children were enrolled in primary school; however, less than one third moved on to secondary school, with a lower share of refugee girls enrolling at this level in comparison to boys.34 A mere 3 per cent of refugee youth had access to tertiary education in the same year.35
Governments, UNHCR and partners have made some progress in enrolling refugees in school and ensuring they have access to accredited education in national systems. For example, in Colombia, about 334,000 Venezuelan children were enrolled in school in April 2020, representing 3.4 per cent of the country’s total student population.36 This constitutes a ten-fold increase from an enrolment of only 34,030 Venezuelan children in November 2018.37 In Uganda, refugee education enrolment rates grew from 43 in 2018 to 57 per cent in 2019.38 This is largely due to the strong leadership by the Government in including displaced children in national systems to improve the education system for both host and refugee populations. In Turkey, currently home to more than 3.6 million Syrian refugees, the Government prioritized education early in the refugee emergency, making investments that have helped prepare Syrian refugee children to transition from temporary education centres into the Turkish public school system. Refugee children also received Turkish language classes, remedial learning and school materials, and teachers received training. For 2020/2021, nearly 80 per cent of Syrian primary school-aged children were enrolled in formal education programmes.39 Similarly, Egypt has facilitated the integration of Syrian refugee students, with some 95 per cent registered in mostly formal education.40
Despite these gains, it is hard to keep up with the pace of displacement and the demographic pressure of children born into protracted displacement. Enrolling 300,000 additional children each year requires 6,000 classrooms and the recruitment of 10,000 additional teachers.41 Though the increasingly protracted nature of emergencies is clear,42 refugee education continues to be heavily reliant on emergency funds, leaving little room for long-term planning and, consequently, a robust response. Greater inclusion of refugee children in host country public schools will require more cooperation between humanitarian and development actors in a joint effort to strengthen national education systems for the benefit of all students – refugees and their national peers.
33 See UNHCR, Turn the Tide: Refugee Education in Crisis34 These figures are Gross Enrolment Ratios, which count all children enrolled in school regardless of their age.35 See UNHCR, Coming Together for Refugee Education 36 Colombia Ministry of National Education, Letter by Vice Minister, Multilateral Affairs, to the Director of the UNESCO Regional Office for Latin
America and the Caribbean. Bogotá, Ministry of National Education.37 See UNDP, Migración, desplazamiento y educación en Colombia: Inclusión y educación de migrantes venezolanos en Colombia.38 Uganda Ministry of Education and Sports, ERP – Year 1 Brochure, December 2019. 39 See ALNAP, No Lost Generation, Continued Learning for All Syrian Children and Youth, p. 6. 40 Ibid, p. 5. 41 Based on a ratio of 50 pupils per classroom and 30 pupils per teacher. 42 See Crawford, N., Cosgrave, J., Haysom, S., Walicki, N., Protracted Displacement: Uncertain paths to self-reliance in exile. Humanitarian Policy
Group – ODI.
11UNHCR > GLOBAL TRENDS 2020
CHAPTER 1

Refugees
43 Includes people in refugee-like situations.44 Excludes 5.7 million registered Palestine refugees under UNRWA’s mandate.45 The number of Syrians newly registered in Turkey in 2020 and thus granted temporary protection by the Government is not publicly available.
The international protection regime, particularly the right to claim asylum and the principle of non-refoulement, faced unprecedented challenges in 2020. As a result, many States restricted or denied asylum to those fleeing conflict and persecution. Despite these restrictions, the number of refugees43 worldwide rose by nearly a quarter of a million, from 20.4 million in 2019 to almost 20.7 million at the end of 2020,44 continuing a rising trend that began close to a decade ago. In addition, there were 3.9 million Venezuelans displaced abroad at year-end. Unless
otherwise stated, all references to “people displaced across borders” in this document refer to both of these populations.
During 2020, some 765,200 people were granted international protection either on an individual (459,700) or group (305,500) basis.45 This is significantly lower than in 2019 (952,800). In addition, hundreds of thousands of Venezuelans have been granted residence permits and other forms of legal stay in Latin America and the Caribbean.
By region of asylum
Figure 5 | People displaced across borders by region | end-year
-
5
10
15
20
25
2010 2011 2012 2013 2014 2015 2016 2017 2018 2019 2020
(in m
illio
ns)
East and Horn of Africa, and Great Lakes Southern Africa West and Central Africa
Americas Asia and Pacific Europe (incl. Turkey)Middle East/North Africa
CHAPTER 2
+ EXPLORE THE DATA
+ By origin and asylum
CHAPTER 2
12 UNHCR > GLOBAL TRENDS 2020

JORDAN. Syrian refugee Abdul Hameed and his grandson Odai outside their house in Amman, Jordan. Odai, aged 10, has spent his whole life in Jordan. Like other vulnerable Syrian refugee families, they receive UNHCR cash assistance. © UNHCR/LILLY CARLISLE
For detailed information on UNHCR’s work to protect and
support refugees, from the moment of flight until an
eventual return, resettlement or other resolution,
see the 2020 Global Report.
CHAPTER 2
13UNHCR > GLOBAL TRENDS 2020

Europe
Turkey continued to be the largest refugee-hosting country in the world, accounting for nearly 3.7 million refugees, or 15 per cent of all people displaced across borders globally. Germany was the second-largest hosting country in Europe, with 1.2 million refugees (5 per cent). Overall, the number of refugees hosted in Europe rose by 3 per cent. This was mainly due to the granting of international protection to over a quarter of a million people (284,900) within the region, almost half in Germany (83,700) and Spain (46,500) alone. In addition, armed conflict in and around Nagorno-Karabakh, which commenced in September 2020, caused some 90,000 people to flee to Armenia, while over 80,000 people were temporarily displaced in Azerbaijan. Those who fled to Armenia remain in a refugee-like situation in Armenia. Notable reductions in the number of refugees included a 79,000 decrease in Italy due to improved source data.46
Sub-Saharan Africa
The East and Horn of Africa, and Great Lakes region hosted 4.5 million refugees at the end of 2020, rising by 3 per cent or 122,800 people during the year. The region now hosts nearly 1 in every 5 refugees worldwide. Three countries – Uganda, Sudan and Ethiopia – alone hosted over two-thirds of refugees in the region, or some 13 per cent of all people displaced across borders. The eruption of conflict in the Tigray region in Ethiopia led to the outflow of more than 54,000 Ethiopians by year-end to Sudan. Displacement from Ethiopia, combined with that resulting from the surge in violence in the Central African Republic and the ongoing South Sudan crisis, led to Sudan recognizing 125,600 new refugees on a group basis, the most by a single country in 2020.
The largest regional increase in the number of refugees in 2020 was in West and Central Africa (+12 per cent). This was primarily due to the
46 In 2020, the refugee estimates were updated using the data provided by ISTAT for 2019, augmented with the decisions on asylum applications provided by the Ministry of Interior in 2020.
47 The Sahel region encompasses Burkina Faso, Chad, Mali, Mauritania and Niger.48 Verifications are a time-bound registration activity conducted in a specific area and/or for a specific population. They entail verifying and
updating individual registration records and collecting additional information as necessary. Verifications typically lead to more accurate population figures.
deepening crisis in the Sahel region and also in northern Nigeria.47 The region continues to face a severe humanitarian crisis with widespread and indiscriminate violence by armed groups as well as rising social and political tensions, forcing more people to flee their homes. The COVID-19 pandemic and the climate emergency made the situation even more complex and volatile. Major flooding affected the Sahel region early in 2020 and was exploited by insurgent groups to expand their operations.
In contrast, the Southern Africa region saw a 3 per cent reduction in the number of refugees due to verification exercises48 conducted in the Democratic Republic of the Congo affecting particularly the number of registered South Sudanese refugees. Despite repeated conflict and violence across parts of the country, the Democratic Republic of the Congo hosted nearly half a million refugees, mainly from neighbouring countries.
Americas
The number of refugees and Venezuelans displaced abroad in the Americas grew by 8 per cent during 2020, reaching some 4.6 million by year-end. Continued displacement of Venezuelans, notably to Brazil, Mexico and Peru, as well as revised estimates for Venezuelans displaced abroad in Peru were the main reasons for this increase. Colombia hosted more than 1.7 million people displaced across borders, 7 per cent of the global total, overwhelmingly from Venezuela. For the first time in five years, the number of Venezuelans in Colombia decreased, as some 124,600 Venezuelans returned to their country due to the difficulties posed by the pandemic and its economic impact.
Asia and the Pacific
The number of refugees in the Asia and Pacific region declined by 4 per cent. The drop is largely due to updated figures received from the Government of the Islamic Republic of Iran, which reported a decrease of some 178,300 refugees,
CHAPTER 2
14 UNHCR > GLOBAL TRENDS 2020

mostly among Afghans.49 The previous figures were provided by the Government in 2015. Together, Pakistan, Bangladesh and the Islamic Republic of Iran continue to host 13 per cent of the global total of people displaced across borders.
49 UNHCR is in consultations with the authorities to understand the reasons behind the decrease reported in 2020 data (170,100 for Afghan refugees and 8,300 for Iraqi refugees).
50 Includes refugees, people in a refugee-like situation and Venezuelans displaced abroad.51 Includes people in a refugee-like situation.52 The calculations do not reflect end-year data for the Dominican Republic as the data was received just before publication. This includes some
114,000 Venezuelans displaced abroad for whom age and sex disaggregation is available.
Middle East and North Africa
Even as the conflict in Syria entered its 10th year, the Middle East and North Africa region recorded a 5 per cent drop in the number of refugees during 2020. This reduction is mainly due to improved estimates of Somali refugees in Yemen. Lebanon and Jordan host 6 per cent of all people displaced across borders globally.
Table 1 | Refugees, people in refugee-like situations and Venezuelans displaced abroad, by UNHCR regions | 2020
UNHCR regions
Start-2020 End-2020 Change (total)
RefugeesPeople in refugee-
like situations
Venezuelans displaced
abroadTotal Refugees
People in refugee-
like situations
Venezuelans displaced
abroadTotal Absolute %
- East and Horn of Africa and Great Lakes
4,388,700 - - 4,388,700 4,511,500
- - 4,511,500 122,800 3%
- Southern Africa 744,400
- - 744,400 720,400 - - 720,400 - 24,000 -3%
- West and Central Africa 1,204,700
- - 1,204,700 1,353,500 - - 1,353,500 148,800 12%
Total Africa* 6,337,800 - - 6,337,800 6,585,400
- - 6,585,400 247,600 4%
Americas 592,900 108,800 3,582,200 4,283,900 650,300 108,800 3,856,300 4,615,400 331,500 8%
Asia and Pacific 4,114,400 48,700 - 4,163,100 3,968,400 48,000 - 4,016,400 -146,700 -4%
Europe 6,543,500 27,000 - 6,570,500 6,671,900 105,300 - 6,777,200 206,700 3%
Middle East and North Africa
2,602,400 40,300 - 2,642,700 2,483,500 26,000 - 2,509,500 - 133,200 -5%
Total 20,191,000 224,800 3,582,200 23,998,000 20,359,600 288,100 3,856,300 24,504,000 506,000 2%
Estimating the demographic composition of people displaced across borders50
UNHCR compiles data globally on the combined sex- and age-distribution of the populations of concern under its mandate at the end of each year. The availability of demographic data varies greatly by population group and by country of asylum. For example, demographic data by age and sex is available for 79 per cent of refugees51 and 49 per cent of Venezuelans displaced abroad.52
Statistical modelling can be used to impute the sex- and age-distribution for missing demographic data for these populations, helping to fill these data gaps with estimates. These models are generated using the available data for a country of origin as a starting point. Where data for a particular country of asylum is missing, the values are estimated using statistical modelling from the available data for the same origin country in nearby countries of asylum. This analysis assumes that the composition of refugee populations within a region is comparable across host countries, as it is likely that the displacement has occurred at the same point of time and under similar circumstances.
15UNHCR > GLOBAL TRENDS 2020
CHAPTER 2

Global figures
The result of applying this approach is shown in Figure 6. UNHCR estimates that at the end of 2020
53 Using a 90 per cent posterior prediction interval, the lower and upper bounds are 38 and 47 per cent.54 Using a 90 per cent posterior prediction interval, the lower and upper bounds are 42 and 54 per cent.
some 41 per cent of people displaced across borders were children,53 or 10.1 million of the total 24.5 million. Some 47 per cent of all people displaced across borders are estimated to be women and girls.54
Figure 6 | Estimated demographic composition of the global population displaced across borders | end-2020
0−4
5−11
12−17
18−59
60+
20% 10% 0 10% 20% 30%30%
Age
5
9
6
25
2 2
29
6
6
9
Female Male
Regional figures
Looking at regions of asylum separately (see Figure 7), the relatively high proportion of children in the three sub-Saharan regions (Southern Africa, West and Central Africa, and East and Horn of Africa and the Great Lakes region) stands out. The estimated proportion of children among refugees hosted in these regions is above 50 per cent, with as much as 56 per cent for some of them. By comparison,
38 per cent of the refugees in Europe and only 24 per cent in the Americas are estimated to be under the age of 18.
Compared to other regions, there are proportionally more women and girls among refugees in West and Central Africa with an estimated 54 per cent. Asia and the Pacific as well as Europe have relatively lower proportions of women and girls among the refugees who live there, with 44 per cent of
DISCLAIMER: figures do not add up to 100 per cent due to rounding
CHAPTER 2
16 UNHCR > GLOBAL TRENDS 2020

the refugee populations in each of these regions estimated to be female. In the other regions,
approximately half of the refugee population are estimated to be women and girls.
Figure 7 | Estimated demographic composition of populations displaced across borders by region of asylum | end-2020
Female Male
Children
Adults
Children
Adults
Children
Adults
40% 20% 0% 20% 40%
40% 20% 0% 20% 40% 40% 20% 0% 20% 40%
Americas
Europe
West and Central Africa
Asia and the Pacific
Middle East and North Africa
East and Horn of Africaand Great Lakes
Southern Africa
37 38
12 12
25 36
18 20
26 19
28 28
25 35
19 21
27 27
23 24
23 25
26 27
24 20
27 29
By country of origin
Eight out of every 10 people displaced across borders originate from just ten countries (82 per cent). The main countries of origin remained consistent with the end of 2019 (see Figure 8). Syria has been the main country of origin for refugees since 2014, and at the end of 2020 some 6.7 million Syrian refugees were hosted in 128 countries, an increase of about 100,000 from a year earlier. This increase is partly attributable
to Syrian asylum-seekers who were granted refugee status or complementary forms of protection in Germany and Greece. More than 80 per cent of all Syrian refugees are located in neighbouring countries, with Turkey alone hosting more than half of them (more than 3.6 million).
DISCLAIMER: figures do not add up to 100 per cent due to rounding
17UNHCR > GLOBAL TRENDS 2020
CHAPTER 2
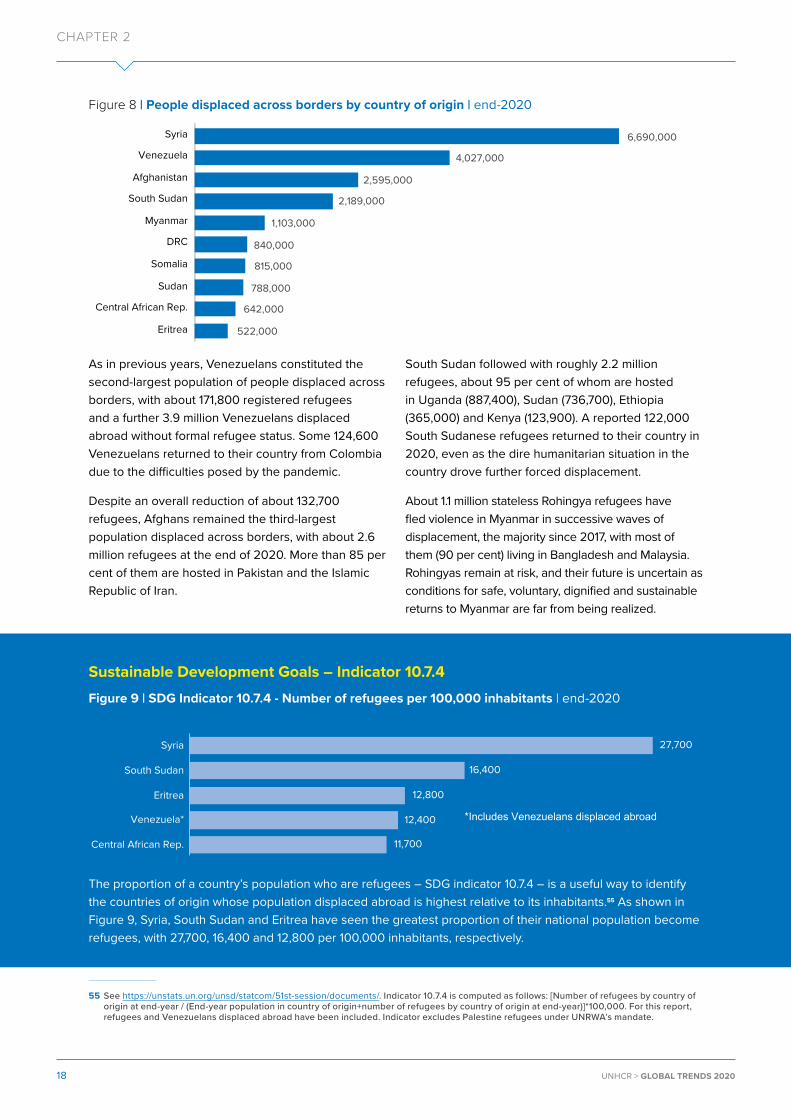
Figure 8 | People displaced across borders by country of origin | end-2020
Syria
Venezuela
Afghanistan
South Sudan
Myanmar
DRC
Somalia
Sudan
Central African Rep.
Eritrea
6,690,000
4,027,000
2,595,000
2,189,000
1,103,000
840,000
815,000
788,000
642,000
522,000
55 See https://unstats.un.org/unsd/statcom/51st-session/documents/. Indicator 10.7.4 is computed as follows: [Number of refugees by country of origin at end-year / (End-year population in country of origin+number of refugees by country of origin at end-year)]*100,000. For this report, refugees and Venezuelans displaced abroad have been included. Indicator excludes Palestine refugees under UNRWA’s mandate.
As in previous years, Venezuelans constituted the second-largest population of people displaced across borders, with about 171,800 registered refugees and a further 3.9 million Venezuelans displaced abroad without formal refugee status. Some 124,600 Venezuelans returned to their country from Colombia due to the difficulties posed by the pandemic.
Despite an overall reduction of about 132,700 refugees, Afghans remained the third-largest population displaced across borders, with about 2.6 million refugees at the end of 2020. More than 85 per cent of them are hosted in Pakistan and the Islamic Republic of Iran.
South Sudan followed with roughly 2.2 million refugees, about 95 per cent of whom are hosted in Uganda (887,400), Sudan (736,700), Ethiopia (365,000) and Kenya (123,900). A reported 122,000 South Sudanese refugees returned to their country in 2020, even as the dire humanitarian situation in the country drove further forced displacement.
About 1.1 million stateless Rohingya refugees have fled violence in Myanmar in successive waves of displacement, the majority since 2017, with most of them (90 per cent) living in Bangladesh and Malaysia. Rohingyas remain at risk, and their future is uncertain as conditions for safe, voluntary, dignified and sustainable returns to Myanmar are far from being realized.
Sustainable Development Goals – Indicator 10.7.4Figure 9 | SDG Indicator 10.7.4 - Number of refugees per 100,000 inhabitants | end-2020
27,700
16,400
12,800
12,400
11,700
Syria
South Sudan
Eritrea
Venezuela*
Central African Rep.
*Includes Venezuelans displaced abroad
The proportion of a country’s population who are refugees – SDG indicator 10.7.4 – is a useful way to identify the countries of origin whose population displaced abroad is highest relative to its inhabitants.55 As shown in Figure 9, Syria, South Sudan and Eritrea have seen the greatest proportion of their national population become refugees, with 27,700, 16,400 and 12,800 per 100,000 inhabitants, respectively.
CHAPTER 2
18 UNHCR > GLOBAL TRENDS 2020

By country of asylum
Some 56 per cent of all people displaced across borders were residing in just 10 countries, consistent with the previous year. The three largest countries of
56 See https://datahelpdesk.worldbank.org/knowledgebase/articles/906519-world-bank-country-and-lending-groups57 See https://unstats.un.org/unsd/methodology/m49/ for a list of countries included under each region.58 See https://unstats.un.org/unsd/methodology/m49/ for a list of Least Developed Countries.59 Source https://data.worldbank.org/indicator/NY.GDP.MKTP.CD
asylum hosted people almost exclusively from one single country. Turkey, for example, hosted more than 3.6 million Syrians, while Colombia hosted more than 1.7 million Venezuelans and Pakistan hosted 1.4 million Afghans.
Figure 10 | People displaced across borders by host country | end-2020
3,652,000
1,731,000
1,439,000
1,421,000
1,211,000
1,040,000
870,000
867,000
800,000
800,000
Turkey
Colombia
Pakistan
Uganda
Germany
Sudan
Lebanon
Bangladesh
Ethiopia
Islamic Rep. of Iran
The Global Compact on Refugees emphasizes the importance of greater responsibility- and burden-sharing. Yet, when it comes to hosting refugees, the burden is not equally shared. This is clear when we compare the number of people displaced across borders to national income levels. According to World Bank classification,56 high-income countries host just 17 per cent of people displaced across borders, as in previous years. Upper-middle income countries – including Turkey, Colombia, the Islamic Republic of Iran, Lebanon and Jordan – hosted 43 per cent of people displaced across borders at the end of 2020, with a further 18 per cent hosted by lower-middle-income countries and 22 per cent by low-income countries.
Developing regions57 continued to shoulder a disproportionately large responsibility for hosting displaced populations. In all, 86 per cent of people displaced across borders are in developing countries. Only one of the world’s top-ten hosting countries is in a developed region.
The Least Developed Countries58 – including Bangladesh, Chad, the Democratic Republic of the Congo, Ethiopia, Rwanda, South Sudan, Sudan,
Uganda, the United Republic of Tanzania and Yemen – were home to 14 per cent of the world’s population. Accounting for just 1.3 per cent of the global Gross Domestic Product,59 they had the least amount of resources available to meet the needs of those seeking refuge. Yet together they hosted 6.7 million people, 27 per cent of the global total of refugees and Venezuelans displaced abroad.
Most people fleeing conflict and persecution prefer to remain in close proximity to their country or region of origin. The statistical evidence shows that nearly three-quarters of people displaced across borders stay in neighbouring countries. This is consistent with previous years.
A way to measure the impact of hosting a refugee population is by comparing the number of refugees with the host country’s population. Figure 11 helps to shed light on some of the world’s major displacement situations. Four of these 10 countries are directly affected by the Venezuela crisis and three by the Syria crisis. Taking into account Venezuelans displaced abroad, the Caribbean islands of Aruba and Curaçao rank 1st and 3rd on the list, with 159 and 102
19UNHCR > GLOBAL TRENDS 2020
CHAPTER 2

displaced people per 1,000 inhabitants, respectively.60 Lebanon, Jordan and Turkey rank 2nd, 4th and 5th when comparing the number of refugees they host in relation to their national population size.61 Three countries not affected by the Syria or Venezuela crises but with large numbers of people displaced
60 National population data are from United Nations, Department of Economic and Social Affairs, Population Division, World population prospects: The 2019 revision, New York, 2019.
61 Figures for Lebanon and Jordan exclude Palestine refugees under UNRWA’s mandate. Lebanon hosted 480,000 and Jordan over 2.3 million registered Palestine refugees at the end of 2020.
62 Excludes Palestine refugees under UNRWA’s mandate.
across borders per 1,000 inhabitants are Armenia, Uganda and Chad. In Armenia, there were 36 displaced people per 1,000 inhabitants at year-end, a seven-fold increase from 2019 due to the Armenia-Azerbaijan conflict in 2020.
Figure 11 | People displaced across borders per 1,000 host country inhabitants | end-2020*
159
128
102
69
43
36
34
31
30
29
Aruba
Lebanon
Curaçao
Jordan
Turkey
Armenia
Colombia
Uganda
Guyana
Chad
*Limited to countries hosting at least 10,000 people. Excludes Palestine refugees under UNRWA's mandate.
PROTRACTED REFUGEE SITUATIONS
UNHCR defines a protracted refugee situation as one in which 25,000 or more refugees from the same nationality have been in exile for at least five consecutive years in a given host country.62 It is important to bear in mind that this definition does not refer to circumstances of individual refugees, but rather is a reflection of refugee situations as a whole.
Based on this definition, it is estimated that some 15.7 million refugees (76 per cent) were in a protracted situation at the end of 2020, similar to 2019. These refugees were living in 30 host countries in connection with 49 different protracted situations. Figures include the prolonged displacement of Afghans in Pakistan and the Islamic Republic of Iran as well more recent situations like that of South Sudanese refugees in Kenya, Sudan and Uganda.
In 2020, the situations of Burundian and South Sudanese refugees in the Democratic Republic of the Congo also became protracted. Two protracted situations no longer meet the requirement of the statistical definition. These are the situation of Ukrainians in the Russian Federation and of Iraqis in the Islamic Republic of Iran, which decreased to 18,400 and 20,000 at the end of 2020, respectively – both below the 25,000 threshold.
Map 1 | Refugees, people in refugee-like situations and Venezuelans displaced abroad | end-2020
2,500,0001,000,000100,000
4,000,000Number of people
Venezuelansdisplaced abroad
Refugees, including peoplein refugee-like situation
Colombia
Ecuador
Peru
ChileArgentina
Uganda
Germany
Pakistan
Turkey
Sudan
THE UNHCR MICRODATA LIBRARY
Providing access to open and timely data is critical to increase the evidence base and inform decision making. In January 2020, UNHCR launched its Microdata Library (MDL),63 which publishes anonymized microdata on forcibly displaced and stateless people as well as on their host communities. The MDL contains microdata collected by UNHCR or its partners, including survey, administrative and census data, as well as data contributed by other entities. Data in the library is catalogued with a minimum set of metadata, and the MDL is continuously updated as new datasets become available, including several studies on the impacts of COVID-19 on forcibly displaced people during 2020 and 2021.
A good example is an assessment conducted by UNHCR and the World Food Programme in September 2020 in East Cameroon.64 This study aimed to gather evidence to gauge the impact of COVID-19 on livelihoods and food security among refugees from the Central African Republic (316,000 of the 436,000 refugees in Cameroon). The study was conducted remotely with 275 households and found that 68 per cent of them were living below the Survival Minimum Emergency Basket line and that over 85 per cent had adjusted their food consumption habits after the COVID-19 pandemic hit their homes. The households surveyed had reduced the number of daily meals due to COVID-19 in 72 per cent of the cases, could not access typical preferred staple foods in 70 per cent of the cases, and had consumed food reserves in 57 per cent of the cases. Almost all households had developed at least one negative coping mechanism at the time of the survey.
63 See https://microdata.unhcr.org/ 64 Assessment on the socioeconomic impact of COVID-19 on Central African Republic refugees - East (May 2020). UNHCR Microdata Library;
available at https://microdata.unhcr.org/index.php/catalog/379.
CHAPTER 2
20 UNHCR > GLOBAL TRENDS 2020

Map 1 | Refugees, people in refugee-like situations and Venezuelans displaced abroad | end-2020
2,500,0001,000,000100,000
4,000,000Number of people
Venezuelansdisplaced abroad
Refugees, including peoplein refugee-like situation
Colombia
Ecuador
Peru
ChileArgentina
Uganda
Germany
Pakistan
Turkey
Sudan
THE UNHCR MICRODATA LIBRARY
Providing access to open and timely data is critical to increase the evidence base and inform decision making. In January 2020, UNHCR launched its Microdata Library (MDL),63 which publishes anonymized microdata on forcibly displaced and stateless people as well as on their host communities. The MDL contains microdata collected by UNHCR or its partners, including survey, administrative and census data, as well as data contributed by other entities. Data in the library is catalogued with a minimum set of metadata, and the MDL is continuously updated as new datasets become available, including several studies on the impacts of COVID-19 on forcibly displaced people during 2020 and 2021.
A good example is an assessment conducted by UNHCR and the World Food Programme in September 2020 in East Cameroon.64 This study aimed to gather evidence to gauge the impact of COVID-19 on livelihoods and food security among refugees from the Central African Republic (316,000 of the 436,000 refugees in Cameroon). The study was conducted remotely with 275 households and found that 68 per cent of them were living below the Survival Minimum Emergency Basket line and that over 85 per cent had adjusted their food consumption habits after the COVID-19 pandemic hit their homes. The households surveyed had reduced the number of daily meals due to COVID-19 in 72 per cent of the cases, could not access typical preferred staple foods in 70 per cent of the cases, and had consumed food reserves in 57 per cent of the cases. Almost all households had developed at least one negative coping mechanism at the time of the survey.
63 See https://microdata.unhcr.org/ 64 Assessment on the socioeconomic impact of COVID-19 on Central African Republic refugees - East (May 2020). UNHCR Microdata Library;
available at https://microdata.unhcr.org/index.php/catalog/379.
A country is named if it features among the five largest per population group.The boundaries and names shown and the designations used on this map do not imply official endorsement or acceptance by the United Nations.
CHAPTER 2
21UNHCR > GLOBAL TRENDS 2020

Internally Displaced People (IDPs)The number of people displaced inside their own countries due to armed conflict, generalized violence or human rights violations continued to grow in 2020 for the third consecutive year. The year-end figure of more than 48 million IDPs was once again the highest level ever recorded. As such, IDPs continued to constitute the majority of the world’s forcibly displaced population, as has been the
case for at least the last two decades. Total internal displacement due to conflict and violence increased in many places, intersecting with disasters and the adverse effects of climate change, as well as displacement due to COVID-19. By year-end, UNHCR was responding to situations of internal displacement in a total of 34 countries.
Figure 12 | IDPs of concern to UNHCR by region | end-year
-
5
10
15
20
25
30
35
40
45
50
2010 2011 2012 2013 2014 2015 2016 2017 2018 2019 2020
(in m
illio
ns)
East and Horn of Africa, and Great Lakes Southern Africa West and Central Africa
Americas Asia and Pacific EuropeMiddle East/North Africa
The countries with the greatest net increases in internal displacement were mainly in Africa, where growing numbers of people were forced to flee conflict and disasters. For example, the East and Horn of Africa and Great Lakes region witnessed massive
new internal displacement during the year. This was primarily due to the eruption of conflict in the Tigray region in Ethiopia, a country that was already grappling with displacement but now faced a full-scale humanitarian crisis, with more than 2.7 million
CHAPTER 3
+ EXPLORE THE DATA
+ By origin+ IDP returns
CHAPTER 3
22 UNHCR > GLOBAL TRENDS 2020

BURKINA FASO. In Kongoussi, an internally displaced person sits in front of the shelter she shares with her husband. Indiscriminate attacks on civilians by armed extremist groups have led to more than 1 million people remaining forcibly displaced inside Burkina Faso at end-2020. © UNHCR/ANNE MIMAULT
For detailed information on UNHCR’s activities to protect and assist IDPs, see the 2020
Global Report, including the section on UNHCR’s
engagement in situations of internal displacement.
CHAPTER 3
23UNHCR > GLOBAL TRENDS 2020

IDPs countrywide at year-end. Neighbouring Sudan and Somalia also experienced significant increases in their internally displaced populations.
Internal displacement in the West and Central African region likewise surged, with a net increase of 1.4 million IDPs during the year. This includes the near doubling in size of IDPs in Burkina Faso and Chad due to escalating violence in the Sahel and Lake Chad Basin, respectively. In Burkina Faso, the internally displaced population surpassed one million people, or 1 in every 20 inhabitants. Many have fled multiple times due to widespread violence. Meanwhile, the internally displaced population grew by several hundred thousand in both Mali and Niger and continued to increase in Nigeria and the Central African Republic. In all three cases, conflict and violence have been compounded by the increasingly adverse impact of climate change.
In the Southern Africa region, more than half a million people were displaced in Mozambique alone during the year. This was overwhelmingly due to the escalating insurgency, frequently involving brutal attacks, in the northern province of Cabo Delgado.
The massive need for protection among these large and growing internally displaced populations have made it necessary for UNHCR, together with partners, to scale up its operations and leadership. The aim is to reduce or mitigate risks of displacement, to
65 The Colombian authorities have expressed their intention to review this figure, with the technical support of UNHCR and partners.
prevent and respond to protection risks and grave violations, and to ensure protection for civilians and the displaced.
Forced displacement overview
Among the largest IDP situations globally, Colombia continued to report the highest number of internally displaced people, with 8.3 million at the end of 2020 according to Government statistics. The large number of registered IDPs comes from the total cumulative figure in the Government’s Victims Registry, which commenced in 1985.65 This builds on work spanning more than two decades, in which UNHCR has worked closely with authorities and civil society to address protracted displacement. These efforts aim to enable legalization and ensure access to services for the hundreds of thousands of people displaced from rural areas who have taken shelter in informal settlements located on the outskirts of Colombia’s largest cities.
After 10 years of conflict in Syria, more than 6.7 million people remain displaced inside the country. The majority have been uprooted for years, but not all. In 2020, renewed fighting in and around Idlib resulted in 624,000 new displacements, compounding the humanitarian suffering and deprivation of those displaced inside Syria.
Figure 13 | IDPs protected/assisted by UNHCR | end-2020
8.3
6.7
5.2
4.0
3.0
2.9
2.7
2.6
2.6
1.6
0 1 2 3 4 5 6 7 8 9
Colombia
Syria
DRC
Yemen
Somalia
Afghanistan
Ethiopia
Nigeria
Sudan
South Sudan
(millions)
CHAPTER 3
24 UNHCR > GLOBAL TRENDS 2020

The number of people internally displaced in the Democratic Republic of the Congo rose to 5.2 million by the end of 2020. Violent attacks by armed groups, most notably in Ituri province and sometimes targeting displaced civilians, add to an already complex displacement situation. In Yemen, the internally displaced population reached 4 million people, with displaced families facing an acute risk of famine66 amid violence, collapsing services and protracted displacement.
ReturnsDurable solutions are a strategic priority for UNHCR and the humanitarian community and are achieved when IDPs no longer have any displacement-related vulnerabilities or needs and are able to enjoy their human rights without discrimination associated with their displacement. This is typically achieved by voluntarily returning home, integrating into local communities, or settling elsewhere. In cases of return, UNHCR monitors the return of displaced people to their areas of origin and works with authorities, partners and communities on overcoming obstacles, such as shelter, housing, land and property, civil documentation or the explosive remnants of war.
In 2020, the growth in internal displacement globally was offset to some degree by the opportunity for some IDPs to return home safely. Returns among internally displaced populations reported by 18 countries totalled 3.2 million, a decrease of 40 per cent from 5.3 million in 2019. This is the lowest number of IDP returns recorded since 2014. The largest numbers of returns during 2020 occurred in the Democratic Republic of the Congo (1.4 million),67 reflecting increasing, but short-term new displacements, and Cameroon (466,000), where fear of COVID-19 and school closures reportedly were a factor in returns.68 Meanwhile, in Somalia, conflict and climate continued to drive displacement,69 although 289,000 IDPs were able to return to their homes after the rainy season, while in Iraq, where the Government started closing camps, there were 278,000 IDP returns.
66 See https://www.unhcr.org/yemen-emergency.html67 Reported IDP returns in DRC are for the period between March 2019 and August 2020.68 See Cameroon: Humanitarian Response Plan 2021 69 See Floods drive over 650,000 Somalis from their homes in 2020 70 See The African Union Convention for the Protection and Assistance of Internally Displaced Persons in Africa (Kampala Convention), October 200971 Based on UNHCR’s statistics.72 See ratification list by the African Union.73 See UN Commission on Human Rights, Report of the Representative of the Secretary-General, Mr. Francis M. Deng, submitted pursuant to
Commission resolution 1997/39. Addendum: Guiding Principles on Internal Displacement, 11 February 1998, E/CN.4/1998/53/Add.2.74 See GPC Database on Law & Policy
South Sudan saw 174,000 IDP returns in 2020. The governments of Sudan and the Republic of South Sudan, together with the Intergovernmental Authority on Development (IGAD) and UNHCR, launched a Solutions Initiative to work towards medium- to longterm solutions for the more than seven million forcibly displaced people, including refugees and returnees, originating from and hosted by the two countries.
Protection and solution for IDPsImplementation by States of the Kampala Convention70 – through national legislation, policies and measures – remained a fundamental step in addressing internal displacement, particularly with Africa constituting almost half of global conflict-related displacement at the end of 2020.71 In March 2020, Somalia became the 31st African Union Member State Party to the Kampala Convention, preceded by Mozambique in January. Ethiopia also ratified the Kampala Convention, but has yet to deposit its instrument of ratification with the African Union.72
UNHCR has long promoted the development and implementation of national laws and policies for protection, assistance and durable solutions for IDPs. In 2020, UNHCR supported the development of national frameworks for the protection of IDPs by providing legal and technical advice in 14 States, including Colombia, El Salvador, Honduras, Mali, Mexico, Mozambique, the Philippines, South Sudan and Ukraine. Mexico’s federal legal framework, developed with UNHCR’s support, was submitted to the Senate as a draft law after unanimous approval by the Chamber of Deputies. In Somalia a draft federal IDP Act was presented in a validation workshop ahead of review by the Attorney General. Since the Guiding Principles on Internal Displacement were introduced in 1998,73 UNHCR has documented that 48 States have adopted (in many cases multiple) national and/or local laws, policies, strategies and related documents on internal displacement.74
25UNHCR > GLOBAL TRENDS 2020
CHAPTER 3

DISASTERS UPROOT MILLIONS AND MANY REMAIN DISPLACED FOR YEARS75
In 2020 alone, disasters triggered 30.7 million new internal displacements around the globe according to data published by IDMC.76 This is the highest figure in a decade and more than three times as much as the 9.8 million displacements triggered by conflict and violence. Most displacements were triggered by weather-related events, primarily storms and floods. Intense cyclone seasons in the Americas, South Asia, East Asia and the Pacific forced millions to flee. Cyclone Amphan was the most devastating event, triggering around five million displacements across Bangladesh, Bhutan, India and Myanmar in May.
Amphan showed that, contrary to common beliefs, disaster displacement can be prolonged, as people see their houses severely damaged or destroyed.77 Months after the disaster, almost 300,000 people were still uprooted across Bangladesh. At a global level, IDMC estimates that at least seven million people remained internally displaced by disasters at the end of 2020. Many were living in conditions of protracted displacement. This figure is an underestimate, as long-term data are seldomly collected, making it difficult to monitor the duration of displacement following disasters.
Data are also insufficient to draw correlations between climate change, disasters, and displacement. Researchers are just starting to understand how global warming is increasing the intensity of weather-related hazards, including storms and droughts. However, more longitudinal data on displacement are needed to understand the influence of these factors on the scale and patterns of human mobility. This is particularly the case for so-called slow-onset events, such as desertification or sea-level rise, where additional drivers like social and economic vulnerability, ecosystem degradation, and unsustainable urbanization also influence the risk of displacement.
If research has so far been inconclusive to what extent climate change can trigger or aggravate conflict, 95 per cent of all conflict displacements in 2020 occurred in countries vulnerable or highly vulnerable to climate change.78 Disasters can also strike populations already uprooted by conflict, forcing them to flee multiple times, as was the case with IDPs in Yemen, Syria and Somalia and refugees in Bangladesh. Learning how to address these overlapping crises will be one of the big humanitarian challenges in the years to come.
75 Contributed by the Internal Displacement Monitoring Centre. The views and opinions expressed are those of the IDMC and do not necessarily represent the views of UNHCR.
76 See IDMC’s Global Report on Internal Displacement 202177 See IDMC’s Disaster displacement: a global review, 2008-201878 IDMC used the 2018 Notre Dame Global Adaptation Index (ND-GAIN), which measures a country’s vulnerability to climate disruptions, as a
reference. IDMC then calculated the percentage of new conflict displacements that fall into the lowest 50 per cent of ND-GAIN index values, i.e., countries vulnerable or highly vulnerable to climate change, in comparison to the global median. Results showed that 95 per cent of all new displacements happened in countries where values are below the global median. From these, 91.5 per cent happened in countries with the 25 per cent lowest values of the ND-GAIN index and 3.5 per cent in countries that fall between 25.1 per cent and the median value.
SOUTH SUDAN. Displaced people travel in canoes on flood water that has inundated areas around the town of Pibor in western South Sudan. © UNHCR/KOMMA GODFREY ANDRUGAA
26 UNHCR > GLOBAL TRENDS 2020
CHAPTER 3
Engagement in disaster situations
In 2020, of the 34 countries where UNHCR was responding to conflict-induced internal displacement, 30 (91 per cent) also recorded new internal displacement associated with disaster, according to the Internal Displacement Monitoring Centre. In 2020, UNHCR responded to emergencies caused by Cyclones Iota and Eta in Central America; Cyclone Gati and recurrent floods in Somalia; heavy floods devastating displaced and host communities in Sudan; and the worst floods in Niger’s history. Most countries grappling with conflict contend at the same time with disasters, with intersecting challenges for the protection needs and resilience of displaced populations and the responses by State institutions.
Mozambique is among the countries impacted by destructive storms and concurrently resurgent conflict. Likewise, Sudan is an example where droughts, floods and land degradation have played a role in conflicts that have resulted in environmental degradation as well as the displacement of about 1.6 million people. In the Sahel too, the climate crisis and armed violence reinforce one another, contributing to attacks between herders and sedentary farming communities, not least exacerbating the vulnerability of over 2 million IDPs. One way UNHCR is strengthening its efforts in disaster situations is by implementing its 2019 IDP Policy and Strategic Framework on Climate Action.79 Another is by co-organizing, through the GP20 Initiative, a regional State-to-State exchange in 2020 on disaster displacement in Asia and in the Americas. Key partners included the Disaster Displacement Working Group Asia-Pacific, the Platform on Disaster Displacement, and the Secretariat of the High-Level Panel on Internal Displacement.
79 See https://www.unhcr.org/604a26d84.pdf80 See https://population.un.org/wpp/
The urbanization of internal displacement
Following a decade-long increasing trend based on available information, there were twice as many internally displaced people in urban versus non-urban areas at the end of 2020. Currently, 56 per cent of the world’s population resides in urban areas.80 By 2050, this figure is projected to reach almost 70 per cent. The trend of urbanization has been seen in places like Mogadishu, Somalia, which has for years hosted thousands of internally displaced people fleeing conflict and disasters. In Nigeria, 61 per cent of the 2.6 million people internally displaced are concentrated in Borno State, where most have settled in urban centres such as the capital, Maiduguri.
In Burkina Faso, IDPs have been flocking to cities in the Centre-Nord and Sahel regions, in some cases doubling or tripling the population of cities. Most Iraqi IDPs who fled West Mosul, where fighting was fiercest, did not go to camps but sought refuge in other parts of the city. Yet urban settings can pose particular challenges for internally displaced people. These include protection risks related to overcrowded or substandard living conditions in informal settlements, lack of secure tenure and risk of evictions, and the struggle to find viable livelihoods. Meanwhile, humanitarian and development actors, together with municipal authorities, need proactive and tailored responses that focus on urban areas and seek to cultivate conditions where displaced people and host communities can thrive, and are a viable alternative to long-term camps.
27UNHCR > GLOBAL TRENDS 2020
CHAPTER 3

The demographics of internal displacement
Displacement affects people of every age and gender and every form of diversity. It can also exacerbate pre-existing risks of violence, vulnerabilities, discrimination, marginalization or barriers to access basic services, assistance and rights. The global COVID-19 pandemic has shown how vital it is to address specific protection needs, such as gender-based violence, and the abuse or exploitation of women and children.
Based on 22 out of 34 operations where demographic data was available at the end of 2020, women constituted on average 52 per cent of all IDPs, consistent with prior years. The highest reported ratios of women were in Sudan (57 per cent), Mali, Ukraine and Chad (all 56 per cent). Despite women and girls being the majority of the displaced, a critical priority is improving their representation in community management and leadership structures so they can meaningfully participate in decision-making processes that impact them, their families and their communities.
Children continued to be heavily affected by internal displacement in some of the worst humanitarian crises of the decade, and their situation remains dire today. Just under half of all IDPs were children in the 14 countries for which age and sex disaggregation was available according to UNHCR statistics. In several countries, the proportion of IDP children was significantly higher: Somalia (61 per cent); Afghanistan (58 per cent); Chad, Cameroon and Niger (all 55 per cent); and Yemen (54 per cent).
Available data from 2020 confirms that the prevalence and impact of disability in internal
81 See HNAP, Spring 2020 Report Series Disability Overview 82 See Syria Protection Cluster (Turkey), Disability-Inclusive COVID-19 response 83 See Policy on UNHCR’s engagement in situations of internal displacement
displacement contexts may have increased. Prevalence data from Syria81 shows that 30 per cent of people above the age of 12 have a disability, with education and employment rates up to 25 per cent lower than for internally displaced people without disabilities. In situations of severe pressure on health systems, older people and people with disabilities, are at risk of being deprioritized or denied access to treatment for COVID-19 based on the assumption that their chances of survival are less compared to those without disabilities.82 Physical distancing and/or separation from care givers and support networks also hinders the provision of the support required and may expose them to additional protection risks.
UNHCR’s engagement in internal displacement situations
As the size, scope and complexity of IDP situations has increased, so too has the UNHCR organizational IDP engagement, both in terms of operational delivery and coordination leadership.
In September 2019, a revised policy on UNHCR’s Engagement in Situations of Internal Displacement was released.83 This Policy reaffirms UNHCR’s commitment to a decisive and predictable engagement in situations of internal displacement, as an integral aspect of operations worldwide, and of the organization’s protection leadership role in humanitarian crises. It also commits UNHCR to adjusting internal systems and processes to enable the organization to work more seamlessly and effectively across the full spectrum of forced displacement.
CHAPTER 3
28 UNHCR > GLOBAL TRENDS 2020

Colombia Somalia
Democratic Republicof the Congo
Syrian ArabRepublic
Yemen
8,500,0005,000,0002,500,0001,000,000100,000
Number of people
Map 2 | IDPs protected/assisted by UNHCR | end-2020
A country is named if it features among the five largest per population group.The boundaries and names shown and the designations used on this map do not imply official endorsement or acceptance by the United Nations.
PLEASE share the caption
UKRAINE. Internally displaced Ukrainian footballer Maria
Romanchenko, 17, trains in Odessa. Originally from Enakievo in the
Donetsk region of eastern Ukraine, Maria’s parents removed her from
the danger of living in close proximity to the conflict.
© GOAL CLICK/UNHCR/ MARIA ROMANCHENKO
29UNHCR > GLOBAL TRENDS 2020
CHAPTER 3

Furthering protection and solutions in Central America and Mexico
84 The actual number of forcibly displaced people likely exceeded one million, considering those who have left their country but have not yet lodged asylum claims.
85 Many of the findings in this chapter are based on a study conducted by UNICEF and UNHCR between December 2019 and March 2020. It used a quantitative sample of 3,104 respondents, 34 focus group discussions and a series of in-depth interviews. See https://familiesontherun.org/.
At the end of 2020, some 867,800 people originating from El Salvador, Guatemala and Honduras remained forcibly displaced, almost 80,000 more than at the end of 2019.84 There are interconnected root causes of displacement in these three countries that are all too often linked to violence. Those who sought refuge either within their countries or by crossing international borders were escaping persistent gang violence, extortion, and persecution, among other factors.85
Strict limitations on movement and border closures aimed at slowing the spread of COVID-19 during 2020 left few options for people at risk in El Salvador, Guatemala and Honduras seeking protection. Containment measures limited the ability of people to flee, exacerbating their exposure to situations of violence and persecution that has driven displacement in these countries.
Displacement trends
While the intended destination of people on the move from these three countries generally remains the United States, some are increasingly settling in Mexico and a much smaller number go south to Costa Rica and Panama. These countries are also becoming major transit countries for nationals from within the subregion and from outside the region.
Over the last ten years, displacement from El Salvador, Guatemala and Honduras has increased almost 50-fold, rising from 18,400 people at the end of 2011 to some 867,800 people at the end of 2020. Globally, 12 per cent of all new asylum applications lodged in 2020 were by nationals of these three countries. Out of 549,200 internationally displaced Salvadorans, Guatemalans, and Hondurans, 79 per cent were in the United States (432,700 people).
CHAPTER 4
+ EXPLORE THE DATA
+ By origin+ Asylum applications
+ Asylum decisions
CHAPTER 4
30 UNHCR > GLOBAL TRENDS 2020

GUATEMALA. An asylum-seeking family from Honduras fled to Guatemala after gang members threatened them when they refused to pay extortion money. They reached Guatemala in the middle of the COVID-19 pandemic and were supported by UNHCR throughout the asylum procedure. Just months after their arrival, tropical storm Eta damaged their host community, forcing them to evacuate the home they were renting. UNHCR and partners relocated them to a safe shelter. © UNHCR/LUIS SANCHEZ VALVERTH
For detailed information on UNHCR’s work to protect and
assist forcibly displaced people in Central America and
Mexico, see the 2020 Global Report, especially the regional
chapter on the Americas.
CHAPTER 4
31UNHCR > GLOBAL TRENDS 2020
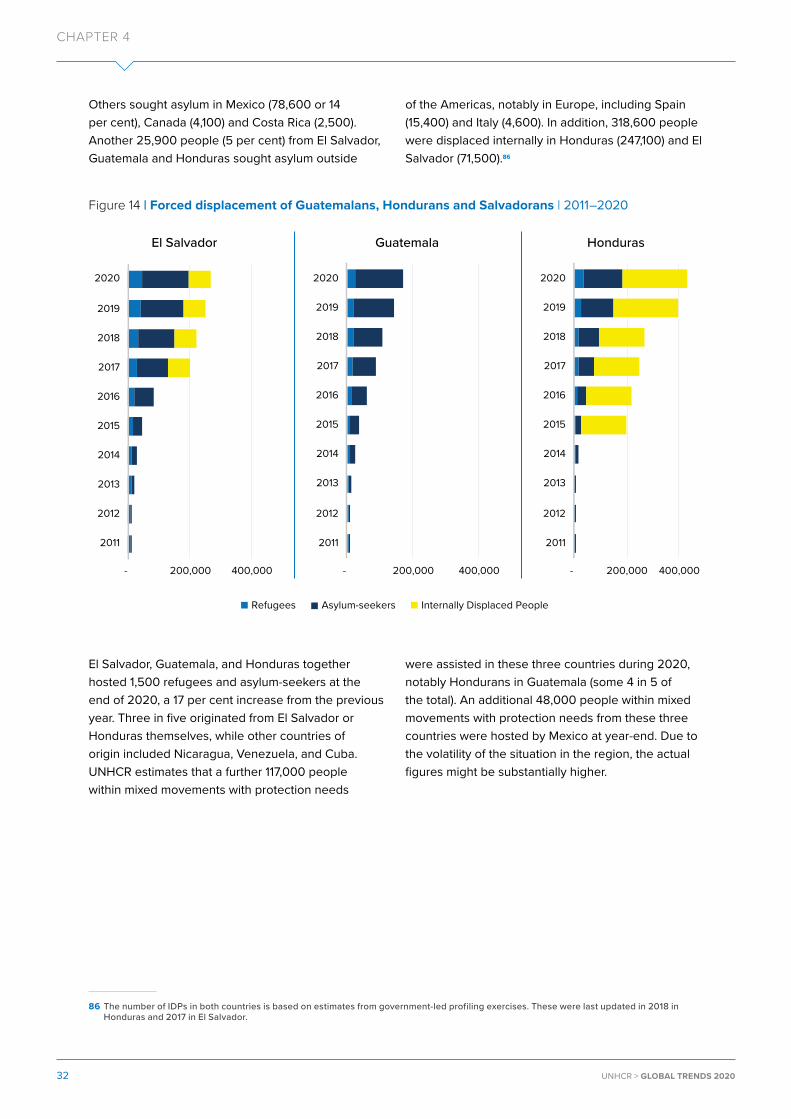
Others sought asylum in Mexico (78,600 or 14 per cent), Canada (4,100) and Costa Rica (2,500). Another 25,900 people (5 per cent) from El Salvador, Guatemala and Honduras sought asylum outside
86 The number of IDPs in both countries is based on estimates from government-led profiling exercises. These were last updated in 2018 in Honduras and 2017 in El Salvador.
of the Americas, notably in Europe, including Spain (15,400) and Italy (4,600). In addition, 318,600 people were displaced internally in Honduras (247,100) and El Salvador (71,500).86
Figure 14 | Forced displacement of Guatemalans, Hondurans and Salvadorans | 2011–2020
Refugees Asylum-seekers Internally Displaced People
- 200,000 400,000
2011
2012
2013
2014
2015
2016
2017
2018
2019
2020
El Salvador
- 200,000 400,000
2011
2012
2013
2014
2015
2016
2017
2018
2019
2020
Guatemala
- 200,000 400,000
2011
2012
2013
2014
2015
2016
2017
2018
2019
2020
Honduras
El Salvador, Guatemala, and Honduras together hosted 1,500 refugees and asylum-seekers at the end of 2020, a 17 per cent increase from the previous year. Three in five originated from El Salvador or Honduras themselves, while other countries of origin included Nicaragua, Venezuela, and Cuba. UNHCR estimates that a further 117,000 people within mixed movements with protection needs
were assisted in these three countries during 2020, notably Hondurans in Guatemala (some 4 in 5 of the total). An additional 48,000 people within mixed movements with protection needs from these three countries were hosted by Mexico at year-end. Due to the volatility of the situation in the region, the actual figures might be substantially higher.
CHAPTER 4
32 UNHCR > GLOBAL TRENDS 2020

432,7004,100
78,600
247,100
71,500
900
2,300
25,800
400
2,500
Honduras
Nicaragua
Internally displaced people
Refugees and asylum-seekers
Other regions, notably EuropeSpain – 15,400Italy – 4,600United Kingdom – 2,600
Costa Rica
Panama
USA
Canada
Mexico
Belize
Guatemala
El Salvador
1,500
Map 3 | Forced displacement of Guatemalans, Hondurans and Salvadoreans | end-2020
87 See https://www.cbp.gov/newsroom/stats/southwest-land-border-encounters#
Demographics of displacement
Based on the United States Customs and Border Protection arrivals figures,87 the demographics of those arriving continues to shift over time. Between 2018 and 2020, the proportion of unaccompanied and separated children from El Salvador, Guatemala and Honduras arriving at the United States border decreased slightly from 15 per cent to 11 per cent. In 2018 and 2019, most arrivals were families. In 2020, due to movement restrictions, there was a 75 per cent decrease in overall arrivals, notably families, with nearly three-quarters recorded as single adults.
Data recorded by the Mexican National Migration Institute (MNMI) reflects a similar trend. Prior to 2018,
approximately half of the children from El Salvador, Guatemala and Honduras were unaccompanied, compared to 32 per cent in 2018 and 25 per cent in 2019. These figures indicate that people fleeing these three countries were increasingly travelling as families. In 2020, the overall number of children from these three countries recorded in the MNMI data decreased by nearly 80 per cent, primarily due to movement restrictions enforced to contain COVID-19, and the proportion of unaccompanied children increased to 44 per cent. The overall number of asylum claims in Mexico also surged from 3,400 in 2015 to 70,400 in 2019 before dropping 41 per cent to 41,200 in 2020.
33UNHCR > GLOBAL TRENDS 2020
CHAPTER 4
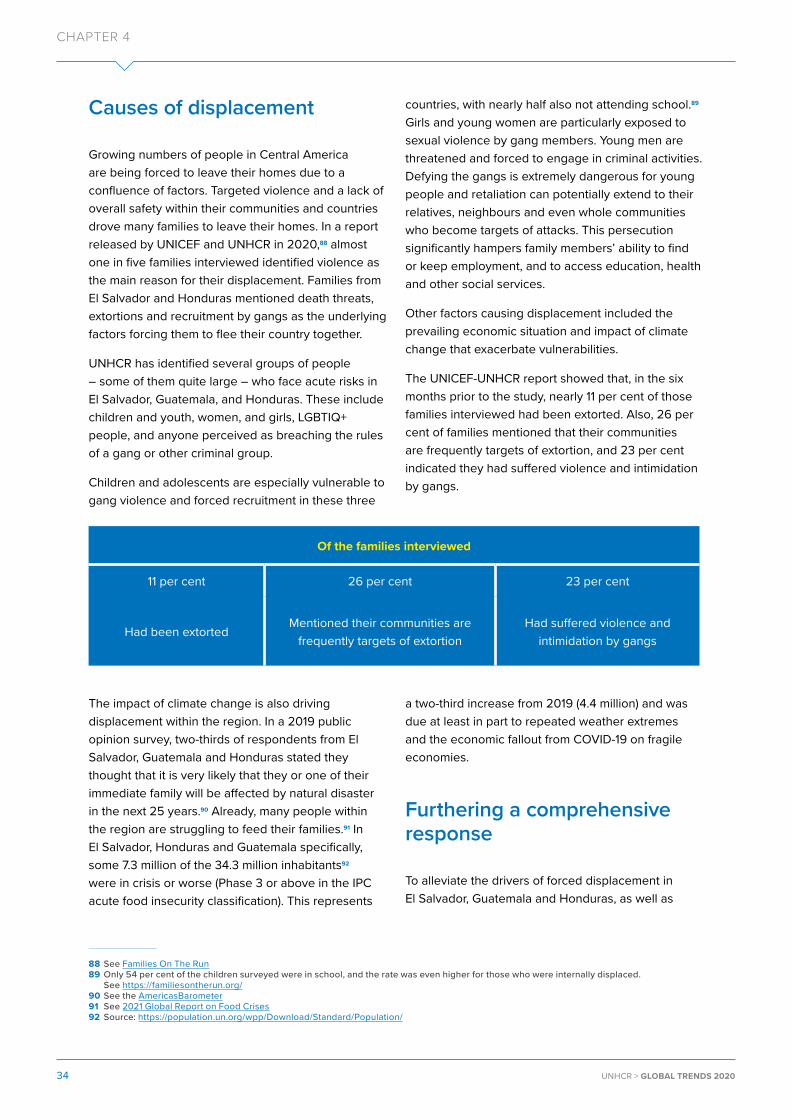
Causes of displacement
Growing numbers of people in Central America are being forced to leave their homes due to a confluence of factors. Targeted violence and a lack of overall safety within their communities and countries drove many families to leave their homes. In a report released by UNICEF and UNHCR in 2020,88 almost one in five families interviewed identified violence as the main reason for their displacement. Families from El Salvador and Honduras mentioned death threats, extortions and recruitment by gangs as the underlying factors forcing them to flee their country together.
UNHCR has identified several groups of people – some of them quite large – who face acute risks in El Salvador, Guatemala, and Honduras. These include children and youth, women, and girls, LGBTIQ+ people, and anyone perceived as breaching the rules of a gang or other criminal group.
Children and adolescents are especially vulnerable to gang violence and forced recruitment in these three
88 See Families On The Run 89 Only 54 per cent of the children surveyed were in school, and the rate was even higher for those who were internally displaced.
See https://familiesontherun.org/ 90 See the AmericasBarometer 91 See 2021 Global Report on Food Crises 92 Source: https://population.un.org/wpp/Download/Standard/Population/
countries, with nearly half also not attending school.89 Girls and young women are particularly exposed to sexual violence by gang members. Young men are threatened and forced to engage in criminal activities. Defying the gangs is extremely dangerous for young people and retaliation can potentially extend to their relatives, neighbours and even whole communities who become targets of attacks. This persecution significantly hampers family members’ ability to find or keep employment, and to access education, health and other social services.
Other factors causing displacement included the prevailing economic situation and impact of climate change that exacerbate vulnerabilities.
The UNICEF-UNHCR report showed that, in the six months prior to the study, nearly 11 per cent of those families interviewed had been extorted. Also, 26 per cent of families mentioned that their communities are frequently targets of extortion, and 23 per cent indicated they had suffered violence and intimidation by gangs.
Of the families interviewed
11 per cent 26 per cent 23 per cent
Had been extortedMentioned their communities are
frequently targets of extortionHad suffered violence and
intimidation by gangs
The impact of climate change is also driving displacement within the region. In a 2019 public opinion survey, two-thirds of respondents from El Salvador, Guatemala and Honduras stated they thought that it is very likely that they or one of their immediate family will be affected by natural disaster in the next 25 years.90 Already, many people within the region are struggling to feed their families.91 In El Salvador, Honduras and Guatemala specifically, some 7.3 million of the 34.3 million inhabitants92 were in crisis or worse (Phase 3 or above in the IPC acute food insecurity classification). This represents
a two-third increase from 2019 (4.4 million) and was due at least in part to repeated weather extremes and the economic fallout from COVID-19 on fragile economies.
Furthering a comprehensive response
To alleviate the drivers of forced displacement in El Salvador, Guatemala and Honduras, as well as
CHAPTER 4
34 UNHCR > GLOBAL TRENDS 2020
the wider region, developing and implementing a comprehensive, multi-stakeholder, multi-year, humanitarian and development plan is crucial.
As a regional application of the Global Compact on Refugees, the Comprehensive Regional Protection and Solutions Framework (MIRPS)93 seeks to strengthen cooperation and shared responsibility among countries of origin, transit and destination. Belize, Costa Rica, El Salvador, Guatemala, Honduras, Mexico, and Panama have each committed to adopt and implement national action plans aligned to country-specific commitments and priorities and have already achieved some tangible results. The State-led MIRPS represents a key opening for broader regional cooperation on investments to address the root causes of displacement.
A positive initiative that complements the national plans is the launching of a Comprehensive Development Plan (CDP) focusing on internal displacement in El Salvador, Guatemala, Honduras and southern Mexico. Prepared by the Economic Commission for Latin America and the Caribbean (ECLAC),94 it brings together the four States and their respective UN Country Teams with the aim of addressing the structural causes of displacement and migration over five years through economic development, improved social wellbeing, and environmental sustainability. Other initiatives include PAIM SICA95 and CRM96 all of which complement national government responses.
Immediate, mid-term and long-term cooperation under these regional approaches will further strengthen comprehensive protection and humanitarian responses and spur strategic investment in national development. This work will include addressing all forms of violence, strengthening the rule of law and local protection systems, as well as investing in and supporting good governance, strengthened asylum systems, inclusion and economic development, equality and participation, and environmental sustainability.
93 See https://globalcompactrefugees.org/mirps-en (the acronym in Spanish is MIRPS)94 See https://www.cepal.org/en95 See https://www.sica.int/sica-acnur/paimsica96 See https://www.crmsv.org/
Protecting individuals and families who have had no choice but to flee requires guaranteeing their human rights. For displaced children and adolescents, this entails putting their best interest first in all responses and decisions that impact them, whether they are traveling alone or with their families. This also includes ensuring that countries adhere to international standards that rule out migratory detention for children.
Civil society is a crucial partner in these regional initiatives to curtail violence and help those at risk of displacement. States have a duty to invest in and support civil society and other community organizations working to forge their own solutions. This should also entail supporting integration and relocation programmes. A useful example is a local integration programme in Mexico, which has facilitated the voluntary relocation of 10,000 refugees. Embracing an inclusive whole-of-society approach, civil society, together with local authorities and the private sector worked together to ensure access to job opportunities and financial assistance, and part of a socio-economic integration package. Additional complementary pathways for those who are at greatest risk and have had no choice but to flee also included resettlement and family reunification.
35UNHCR > GLOBAL TRENDS 2020
CHAPTER 4

Asylum trends
97 The data for some countries may include a significant number of repeat claims, i.e. the applicant has submitted at least one previous application in the same or another country.
98 Statistical information on outcomes of asylum appeals and court proceedings is under-reported in UNHCR’s statistics, particularly in industrialized countries, because this type of data is often either not collected by States or not published.
It is either the government or UNHCR, depending on the context, that decides whether to confer refugee status – through a process called Refugee Status Determination (RSD). Based on international, regional or national law, the RSD process often represents a crucial step in ensuring that refugees receive protection and long-lasting solutions, whether that means repatriation, building new lives in their host communities or resettlement in third countries.
Adaptability and preparedness are two vital characteristics of a robust asylum system. Their importance became manifestly clear in 2020, as the COVID-19 pandemic strained the systems designed to facilitate access to territory, register and document asylum claims, and determine refugee status. Over
the year, States and UNHCR collectively registered some 1.3 million individual asylum applications, one million fewer than in 2019 (2.3 million). An estimated 85 per cent of them were registered at first instance97 (that is, by the initial administrative or judicial authority), and the remainder at the second instance, such as upon review by courts or other appellate bodies.98
As noted above in chapter two, this dramatic decrease in asylum applications is largely related to travel restrictions, and the closure of borders and asylum institutions, in the face of the COVID-19 public health emergency – as opposed to improving conditions in countries of origin.
Figure 15 | Indexed change in individual asylum applications compared to previous years | Year 2000 = 100
40
60
80
100
120
140
160
2000
2001
2002
2003
2004
2005
2006
2007
2008
2009
2010 20
1120
1220
1320
1420
1520
1620
1720
1820
1920
20
CHAPTER 5
+ EXPLORE THE DATA
+ Asylum applications+ Asylum decisions
+ Pending asylum applications at end-2020
CHAPTER 5
36 UNHCR > GLOBAL TRENDS 2020
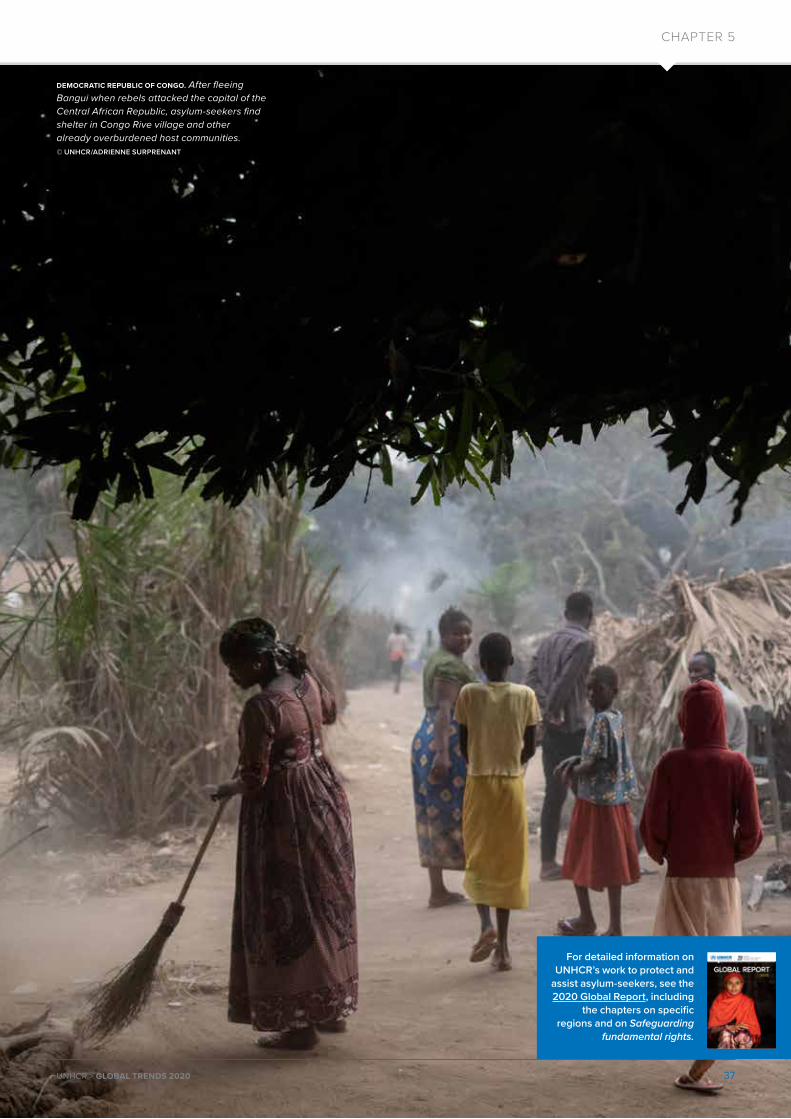
DEMOCRATIC REPUBLIC OF CONGO. After fleeing Bangui when rebels attacked the capital of the Central African Republic, asylum-seekers find shelter in Congo Rive village and other already overburdened host communities. © UNHCR/ADRIENNE SURPRENANT
For detailed information on UNHCR’s work to protect and
assist asylum-seekers, see the 2020 Global Report, including
the chapters on specific regions and on Safeguarding
fundamental rights.
CHAPTER 5
37UNHCR > GLOBAL TRENDS 2020

99 As some countries have not yet released all of their national asylum data at the time of writing, this figure is likely to be revised later this year.
In 2020, 1.1 million new asylum applications were registered.99 Over the same period, some 459,700 individuals received refugee or other protected status in 145 countries or territories as a result of their
asylum claim, and about 305,500 others received refugee or other protective status through group procedures.
Figure 16 | Individual asylum applications registered by region
0.0
0.5
1.0
1.5
2.0
2.5
2010 2011 2012 2013 2014 2015 2016 2017 2018 2019 2020
(Mill
ions
)
East and Horn of Africa, and Great Lakes Southern Africa West and Central Africa
Americas Asia and Pacific EuropeMiddle East/North Africa
Some travel restrictions remained in place through the end of the year, and will likely continue to impact arrival numbers into 2021. However, after the initial suspension of asylum systems (in full or in part), many States began to reorient and focus on adaptation. Some, for example, introduced measures to ensure appropriate health screening or quarantine on arrival. Others put in place new measures to allow for remote registration of claims (e.g. Argentina), began
processing asylum claims remotely (e.g. Ghana and Armenia), or started issuing or extending asylum documentation remotely (e.g. South Africa and Portugal). By the end of 2020, 123 States had put in place some form of adaptive measure to minimize protection risks as a result of COVID-19 and to ensure that asylum systems continued to function and strengthen their response going forward.
Table 2 | New and appeal applications registered
2016 2017 2018 2019 2020*
States 1,953,000 1,660,600 1,902,400 2,191,100 1,258,600UNHCR 208,500 263,500 227,800 124,900 55,000Jointly** 26,300 22,300 11,400 1,500 600
Total 2,187,800 1,946,400 2,141,600 2,317,500 1,314,200
% UNHCR only 10% 14% 11% 5% 4%
* Provisional figure
** Refers to refugee status determination conducted jointly by UNHCR and governments.
CHAPTER 5
38 UNHCR > GLOBAL TRENDS 2020

Individual asylum applications registered
During 2020, the number of new asylum-seekers registered at first instance globally dropped by 45 per cent, from 2 million to 1.1 million, the biggest single-year drop since accurate records began in 2000. Of these first-instance applications, 49,100 were made via UNHCR-mandate RSD procedures, 600 via joint UNHCR/State procedures and 1.1 million via national asylum procedures. These figures represent a decrease of 59, 58 and 44 per cent respectively compared to 2019. The number of individual asylum applications received globally at
100 2020 figure: estimated number of individuals based on the number of new affirmative asylum cases (87,700) and multiplied by 1.5 to reflect the average number of individuals per case (Source: US Department of Homeland Security) and the number of defensive asylum applications (119,300 individuals) (Source: US Department of Justice).
appeal or other instances (including reopening and judicial review) also decreased, from 284,000 in 2019 to 195,200 in 2020.
By country of asylum
Each of the 10 countries that registered the largest number of individual claims in 2019 saw fewer new asylum-seekers in 2020. These declines ranged from a 14 per cent reduction in the United States to an 80 per cent drop in Peru. The USA, Germany and Spain remained the countries registering the largest number of individual claims in 2020.
Figure 17 | Major countries for individual registration of new asylum-seekers | 2020
United States
Germany
Spain
France
Peru
Mexico
Greece
United Kingdom
Turkey
Uganda
250,800
102,600
88,800
87,700
52,600
41,200
37,800
36,000
31,300
23,800
Of the 250,800 new individual applications in the United States100, 3 in 5 were from just five countries in the Americas: Guatemala (40,400), Honduras (33,700), Venezuela (33,200), El Salvador (25,900) and Mexico (17,400). This high concentration reflects in part the deteriorating security situation and violence observed in some of these countries.
In Germany, similar to previous years, just over half of the 102,600 new individual asylum claims were submitted by Syrians (36,400), Afghans (9,900) and Iraqis (9,800). Yet it was Germany’s lowest number of asylum-seekers in almost a decade. In contrast, Spain registered 88,800 new applications, its second highest number since 2000. The vast majority originated from the Americas, most
commonly Venezuela (28,400), Colombia (27,600) and Honduras (5,500).
By country of origin
As in 2019, new individual asylum applications were most commonly registered by nationals of Venezuela (147,100), Afghanistan (76,200) and Syria (72,900). While more than 4 out of 5 applications by Venezuelans were lodged in countries in the Americas, almost all Afghans and Syrians lodged their asylum claims in Europe.
39UNHCR > GLOBAL TRENDS 2020
CHAPTER 5

Figure 18 | Major source countries of new asylum applications | 2020
Venezuela
Afghanistan
Syria
Honduras
Guatemala
Colombia
DRC
El Salvador
Iraq
Cuba
147,100
76,200
73,000
52,800
40,100
39,300
35,100
33,200
27,100
24,400
Figure 19 | Key flows of new asylum applications registered | 2020
147,100
76,200
73,000
52,800
40,100
39,300
35,100
33,200
27,100
24,400
525,600
207,000
102,600
88,800
87,700
52,600
41,200
37,800
36,000
31,300
23,800
365,000
Venezuela
Afghanistan
Syria
Honduras
Guatemala
Colombia
DRC
El Salvador
Iraq
Cuba
Other
United States of America*
Germany
Spain
France
Peru
Mexico
Greece
United Kingdom
Turkey
Uganda
Other
*Based on the number of new affirmative asylum cases (87,700 cases; Source: US Department of Homeland Security) and the number of defensive asylum applications (119,300 individuals) (Source: US Department of Justice).
CHAPTER 5
40 UNHCR > GLOBAL TRENDS 2020

Group determination of refugee status
As with individual applications, the number of people arriving and receiving international protection through group determination procedures in national systems also decreased in 2020, but only by 5 per cent (305,000, compared to 321,000 in 2019). As
in past years, most group recognitions occurred in Africa, and notably in Sudan, Niger, Ethiopia, Uganda, Cameroon, Mali and Chad. Despite concerns linked to COVID-19, these countries continued to adopt efficient and protection sensitive prima facie or other group-based processing methodologies when responding to large-scale influxes, as encouraged in the Global Compact on Refugees.
Figure 20| Type of recognition by country of asylum | 2020
- 50,000 100,000 150,000 200,000 250,000
Sudan
Germany
Niger
Spain
Uganda
Greece
France
Brazil
Ethiopia
Cameroon
Others
IndividualGroup
Individual Recognition: Refugee or other protective status recognized on an individual basis. Normally this entails an individual status determination interview, in addition to any registration procedures.
Group Recognition: Refugee or other protective status recognized on a group basis. Generally seen in situations of large-scale influx, this is when all members of the group are regarded as in need of international protection based on objective circumstances in their country of origin. This is often called recognizing international protection needs using a prima facie approach (i.e. in the absence of evidence to the contrary). Normally, this includes registration but no separate status determination interview.
41UNHCR > GLOBAL TRENDS 2020
CHAPTER 5

Decisions on asylum applications
Many of the adaptive measures noted above took time to put in place, so the total number of individual asylum applications processed by States and UNHCR declined in 2020 (including substantive101 and non-substantive decisions102). However, the decline was slightly smaller, at 18 per cent, than for the total number of substantive decisions made, which fell by 19 per cent. In total, 1.4 million decisions were processed by States and UNHCR at all levels of procedures, of which 997,800 were substantive decisions. Given the context in many countries, including multiple lockdowns and/or strict movement restrictions, the fact that States and UNHCR were
101 Substantive decisions include Convention status, complementary and other forms of protection, and rejected cases.102 Non-substantive decisions are the closure of a case without a decision on the merits. For example, from the death of the applicant, no-show
for interview, withdrawal of the application, abandonment of the claim, or the determination that another country is responsible for the claim, among other factors.
103 See UNHCR, Key Procedural Considerations on the Remote Participation of Asylum-Seekers in the Refugee Status Determination Interview 104 UNHCR uses two rates to compute the proportion of refugee claims accepted. The Refugee Recognition Rate is the proportion of asylum-
seekers accorded refugee status out of the total number of substantive decisions. The Total Protection Rate is the proportion of asylum-seekers accorded refugee status or a complementary form of protection relative to the total number of substantive decisions. Non-substantive decisions are, to the extent possible, excluded from both calculations. For the purposes of global comparability, UNHCR uses only these two rates and does not report rates calculated by national authorities.
able to maintain a relatively high output of decisions shows the strides made in adapting asylum systems. States and UNHCR also made efforts to ensure that adapted processes did not come at the expense of procedural fairness. This work included putting in place additional procedural safeguards, providing guidance on remote processing of claims and in some cases enabling the remote participation of legal representatives.103
The Total Protection Rate, or TPR, is the percentage of substantive decisions that resulted in any form of international protection. Worldwide, this figure stood at 46 per cent in 2020, consistent with the previous year.104
In the early days of the pandemic, many asylum authorities focused on working through their backlog
Map 4 | Asylum-seekers (with pending cases) | end-2020
United States of America
Germany
BrazilPeru
Turkey
Number of people
1,000,000500,000100,000
A country is named if it features among the five largest per population group.The boundaries and names shown and the designations used on this map do not imply official endorsement or acceptance by the United Nations.
42 UNHCR > GLOBAL TRENDS 2020
CHAPTER 5

of applications by focusing on cases where interviews had already been conducted but where a decision was still pending, thereby minimizing the need for human contact. As the pandemic response moved forward, interviews resumed, either in person with safety protocols or remotely. Against this backdrop, some asylum authorities managed to increase their productivity over the course of 2020, making more substantive individual refugee status decisions than in 2019. Examples of this include Brazil (21 per cent increase to 26,800), Mexico (49 per cent increase to 22,500) and the Netherlands (16 per cent increase to 12,500). These increases stemmed not only from putting adaptive measures in place, but also from implementing diversified case processing modalities, such as Brazil recognizing certain populations using a prima facie approach.
While the overall number of decisions made by UNHCR under its mandate declined slightly, from 124,400 to 115,700, the number of substantive decisions fell from 53,700 to 36,100, a 33 per cent decrease. Some of this change may be due to COVID-19, which initially impacted UNHCR’s interviewing and decision-making capacity, but UNHCR adapted its RSD processes and moved to remote case processing where appropriate. More significantly, the decline reflects a new strategic approach introduced in 2016.105 This shift acknowledges that RSD recognitions made by UNHCR under its mandate do not have the same impact on individuals as decisions taken by States, because UNHCR cannot automatically give access to protection or solutions. The strategic approach has many components, including placing more emphasis on supporting national authorities to create or strengthen their asylum systems. Importantly, though, it explains that UNHCR will not necessarily conduct refugee status determination for all of the asylum-seekers it registers; rather, it will focus on conducting quality RSD in situations where status determination will yield protection benefits, either at an individual or a group level, such as eligibility for resettlement or access to additional services in the country of asylum.
The result of this strategic shift is that, while asylum-seekers registered with UNHCR will remain persons of concern, they will not have their cases automatically processed for RSD or considered
105 See https://www.refworld.org/pdfid/57c83a724.pdf
as asylum applications pending processing. At a statistical level, this means that, while the number of individual asylum applications pending at first instance is reported as 295,800, approximately 20 per cent of these cases may not require RSD processing by UNHCR. This is in contrast to the context of national asylum systems, where there is a protection benefit for all asylum-seekers to go through an RSD procedure, meaning the number of pending asylum-seekers will be equal to the number of pending RSD cases.
Pending asylum claims
Despite the large drop in new asylum applications, the number of pending cases at the end of 2020 – some 4.15 million – remained virtually unchanged compared to 2019. Notable exceptions where countries managed to reduce a backlog of pending cases in 2020 were Germany (66,100 or 21 per cent fewer) and Greece (44,800 or 42 per cent fewer). Given that backlogs continued to grow in some countries, despite the historic drop in new applications, it is important that States continue to make efforts to improve the efficiency and adaptability of their asylum systems, without compromising fairness or integrity. If not, there is a risk that backlogs will dramatically increase once applications return to pre-COVID levels.
If backlogs become protracted and asylum-seekers wait multiple years for a final determination of their claim without meaningful access to rights, there will likely be negative consequences. This holds true for asylum-seekers, who are living in limbo and psychological distress, as well as for the State, because it can erode public confidence in the asylum system and make it more difficult to repatriate those found not to be in need of international protection. To improve the fairness, efficiency, adaptability and integrity of asylum systems, States are encouraged to support one another and make use of mechanisms like the Asylum Capacity Support Group, established in the Global Compact on Refugees. Such measures can strengthen their asylum systems and ensure they are resilient and prepared enough to effectively respond to unexpected events in the years to come.
43UNHCR > GLOBAL TRENDS 2020
CHAPTER 5

Solutions
The need for greater solidarity and cooperation to support host countries, communities and refugee populations has been widely acknowledged in the Global Compact on Refugees. One vital expression of this solidarity is identifying and supporting solutions for displaced populations. Yet solutions for refugees are becoming more and more elusive – thereby inflating the global displacement total further. This chapter focuses on refugees, and the durable solutions that enable them to rebuild their lives and to live in safety and dignity.
Traditionally, durable solutions include voluntary repatriation, resettlement to a third country and local integration. However, a growing number of displaced populations remain at risk with little hope of a durable solution. The COVID-19 pandemic has only exacerbated these challenges.
The partial or full closure of borders, along with more general restrictions on movement aimed at limiting the pandemic’s spread, has dramatically reduced the number of displaced people around the globe able to return to their home countries or resettle to other countries. In 2020, fewer than 300,000 refugees were able to return to their country of origin or be resettled to a third country. This compares to 425,000 one year prior and more than 600,000 at the start of the last decade, indicating the gradual drop in solutions available to refugees. Hopefully the low number of returns and resettlements in 2020 will be remembered as an outlier for finding solutions for refugees.
Returns
Returning home in safety and dignity based on a free and informed choice should offer refugees a sustainable option to bring their temporary status as refugees to an end. It remains the preferred solution for the majority of the world’s refugees. Together with the country of origin and the international community, UNHCR strives to promote enabling conditions for safe, dignified and sustainable voluntary repatriation.
UNHCR does not promote returns to countries of origin where sustainable conditions are not in place for the safe and dignified return of refugees. However, the organization recognizes the right of all individuals to return voluntarily to their country of origin. It also monitors the progress of returns while also advocating for improved conditions.
In 2020, an estimated 251,000 refugees returned to 30 countries of origin. Some of these returns were facilitated by UNHCR and its partners, while others were self-organized. This figure is 21 per cent less than the 317,200 returns reported in the previous year. Close to half (122,000) of the returns in 2020 were to South Sudan, mostly from Uganda (74,000), Sudan (22,500) and Ethiopia (14,500). Returns to South Sudan are difficult to verify as they tend to be self-organized, and access is often constrained in areas of returns.
After the elections in Burundi in May 2020, Burundian refugees living mostly in neighbouring
CHAPTER 6
+ EXPLORE THE DATA
+ Refugee returns+ Resettlement arrivals
+ Naturalization+ IDP returns
44 UNHCR > GLOBAL TRENDS 2020
CHAPTER 6

BURUNDI. Government health workers conduct a rapid antibody test on a returnee from Rwanda for the COVID-19 virus at the Kinazi Transit Centre in Burundi. © UNHCR/WILL SWANSON
For detailed information on UNHCR’s work to secure
solutions for refugees and other people of concern,
see the chapter on Building better futures in the
2020 Global Report.
45UNHCR > GLOBAL TRENDS 2020
CHAPTER 6

countries expressed increased interest in voluntary return.106 UNHCR began to facilitate returns from Rwanda in August and from the Democratic Republic of the Congo in September. Altogether, UNHCR and its partners facilitated the repatriation of some 40,900 Burundians over the course of the year, mainly from the United Republic of Tanzania (30,600), Rwanda (8,000) and the Democratic Republic of the Congo (2,000).
In 2020, there were also 38,600 reported returns to Syria107, mainly from Turkey (44 per cent), Lebanon (24 per cent) and Iraq (22 per cent). UNHCR maintains a comprehensive approach to solutions for Syrian refugees,108 recognizing that many people may not return in the near term, and some may not return at all. Sustaining and enhancing support to host governments and communities remains critical,
106 See https://data2.unhcr.org/en/documents/details/85338 107 Voluntary returns observed by UNHCR108 See Comprehensive Protection and Solutions Strategy (2018)109 See https://data2.unhcr.org/en/documents/details/85739
as does expanding access to resettlement and complementary pathways.
UNHCR conducted the sixth return intention survey among Syrians in early 2021.109 Focusing on Egypt, Iraq, Jordan and Lebanon, the survey canvassed more than 3,200 Syrian refugees, out of a total of 1.9 million in these countries. Consistent with previous surveys, 7 in 10 Syrians surveyed hoped to return to Syria in the future. Some 85 per cent of respondents said that COVID-19 had not affected their intention to return. Only two per cent planned to return to Syria in the next 12 months, with most of the others planning to stay in their host countries for now. Worryingly, 90 per cent of respondents stated they were struggling with the expense of food, housing, basic commodities, health care and school fees.
Figure 21 | Refugee returns by country of origin | 2020
122,000
40,900
38,600
18,300
12,300
18,900
South Sudan
Burundi
Syria
Cameroon
Nigeria
Others
In addition to refugee returns, at least 124,600 Venezuelans displaced abroad are reported to have returned to their country in 2020, primarily from Colombia. These returns were triggered by economic hardship resulting from job losses and business closures in Latin America during the COVID-19 pandemic.
During the past few years, opportunities for voluntary repatriation in safety and dignity have not kept pace with the rate of new displacements. The result, tragically, is more and more refugees living in exile for years on end.
CHAPTER 6
46 UNHCR > GLOBAL TRENDS 2020

Resettlement
Resettlement is a core activity mandated by UNHCR’s Statute, but it is an option for fewer and fewer refugees due to a significant reduction in the number of places offered by States as well as the temporary suspension of departure travel due to COVID-19. Nevertheless, several countries have signalled their commitment to resettlement as a crucial protection and solutions tool.
In 2020, refugee resettlement plummeted to its lowest level in almost two decades. Only 34,400 people were resettled to 21 countries, according to government statistics, two-thirds of them with UNHCR’s assistance. This is just one-third of the number resettled in 2019 (107,700) and 2018 (92,400).
110 See The Three-Year Strategy on Resettlement and Complementary Pathways, 2019. 111 See UNHCR Projected Global Resettlement Needs 2021
The Three-Year Strategy on Resettlement and Complementary Pathways,110 which was launched in May 2019, envisaged the resettlement of 70,000 refugees to 31 countries in 2020. Because travel restrictions related to COVID-19 forced temporary suspensions of resettlement programmes from mid-March to mid-June 2020, only a fraction of the anticipated number of refugees were resettled. As a result, the gap between global resettlement needs and the number of places offered by States continues to widen. More than 1.4 million refugees were estimated to be in need of resettlement in 2020,111 but barely 2.4 per cent of them actually arrived. More positively, some countries became more flexible in the way they process resettlement cases and took steps to safely manage resettlement travel with recommended protocols in place.
Figure 22 | Resettlement by UNHCR and others
-
20,000
40,000
60,000
80,000
100,000
120,000
140,000
160,000
180,000
200,000
2010 2011 2012 2013 2014 2015 2016 2017 2018 2019 2020
UNHCR resettlement Other resettlement
47UNHCR > GLOBAL TRENDS 2020
CHAPTER 6

Resettlement is a way to save lives and safeguard human rights by assisting refugees in countries that cannot provide them with appropriate protection and support. Of all cases submitted by UNHCR in 2020, 86 per cent were for survivors of torture and/or violence, people with legal and physical protection needs, and particularly vulnerable women and girls.112 Just over half (51 per cent) of all resettlement submissions concerned children.
According to government statistics, in 2020 the United States welcomed 9,600 resettled refugees from 51 countries, predominantly refugees originating from the Democratic Republic of the Congo (25 per cent), Ukraine (18 per cent) and Myanmar (17 per cent). A further 9,200 refugees were resettled to Canada, most commonly Syrians, Iraqis and Eritreans. Resettlement to both countries dropped precipitously from 2019, when 30,100 refugees were resettled in Canada and 27,500 in the United States. In 2020, European countries collectively welcomed 11,600 resettled refugees.
Overall, Syrians accounted for one-third of resettled refugees in 2020, followed by Congolese (12%). The other resettled refugees were from 82 countries of origin, including Iraq, Eritrea, Myanmar, Ukraine, Sudan and Afghanistan.
UNHCR is calling on more countries to expand third-country solutions like resettlement. It is also urging them to resettle more refugees, where possible, and to make family reunification and complementary pathways more accessible to refugees.
Local integration
When repatriation and resettlement are not viable options, some refugees are able to achieve a third durable solution: building a new life in their country of asylum. There are millions of refugees around the world who live in protracted situations with little hope of ever returning home. Local integration of refugees can include the provision of legal status, including appropriate alternatives under domestic regulations on long-term residence, and naturalization.
112 See https://www.unhcr.org/protection/resettlement/600e95094/resettlement-fact-sheet-2020.html113 See Statistics Canada, The Long-term Labour Market Integration of Refugee Claimants Who Became Permanent Residents in Canada114 See https://unstats.un.org/unsd/demographic-social/Standards-and-Methods/files/Principles_and_Recommendations/International-
Migration/2018_1746_EN_08-E.pdf
Refugees must be prepared to adapt to their new country, while host communities and public institutions who welcome refugees must strive to meet the needs of a diverse population and ensure their access to health care, education and work. While refugees seek asylum in their host country for humanitarian reasons, when integrated successfully they are empowered to pursue sustainable livelihoods and contribute to the social and economic life of the host country.
A recent study published by Statistics Canada113 confirms that refugees’ experiences in the labour market play a crucial role in their successful integration. The study compares the outcomes of refugees who eventually became permanent residents with privately sponsored refugees as well as with those who did not become permanent residents. While refugees arriving in Canada who became permanent residents are more likely to claim benefits for one year before reporting employment income, their average employment income gradually increases at a faster rate than the other refugee groups, to more than double the initial amount about 13 years after the initial claim, similar to privately sponsored refugees. Yet the researchers warn that as the economic downturn resulting from the COVID-19 pandemic reduces employment and erodes incomes, the gap between refugees and those born in Canada may widen.
The International Recommendations on Refugee Statistics114 suggest appropriate indicators for measuring and quantifying local integration in a way that is comparable and consistent across different contexts. However, the availability of data about the local integration of refugees remains elusive. Naturalization – the legal act or process by which a non-citizen in a country may acquire citizenship or nationality of that country – is therefore used as a proxy measure of local integration. However, even this proxy is limited by the uneven availability of data and poor coverage as well as policy and legal changes over time. In particular, it can be difficult to distinguish between the naturalization of refugees and non-refugees in national statistical systems. Therefore, the data are at best indicative and provide
CHAPTER 6
48 UNHCR > GLOBAL TRENDS 2020
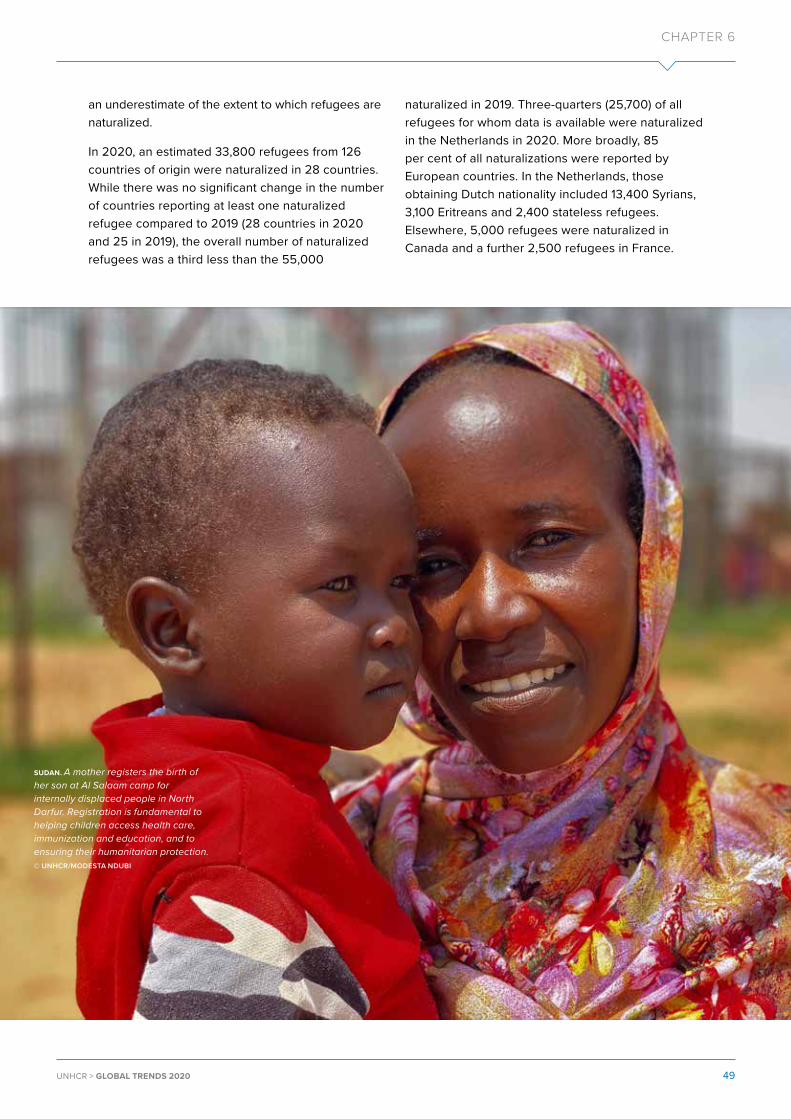
an underestimate of the extent to which refugees are naturalized.
In 2020, an estimated 33,800 refugees from 126 countries of origin were naturalized in 28 countries. While there was no significant change in the number of countries reporting at least one naturalized refugee compared to 2019 (28 countries in 2020 and 25 in 2019), the overall number of naturalized refugees was a third less than the 55,000
naturalized in 2019. Three-quarters (25,700) of all refugees for whom data is available were naturalized in the Netherlands in 2020. More broadly, 85 per cent of all naturalizations were reported by European countries. In the Netherlands, those obtaining Dutch nationality included 13,400 Syrians, 3,100 Eritreans and 2,400 stateless refugees. Elsewhere, 5,000 refugees were naturalized in Canada and a further 2,500 refugees in France.
SUDAN. A mother registers the birth of her son at Al Salaam camp for internally displaced people in North Darfur. Registration is fundamental to helping children access health care, immunization and education, and to ensuring their humanitarian protection. © UNHCR/MODESTA NDUBI
49UNHCR > GLOBAL TRENDS 2020
CHAPTER 6

Stateless people
115 Based on information provided by governments and other sources.
Global overview
Millions of people were not considered nationals by any State and therefore remained stateless in 2020. The global number of 4.2 million stateless people at year-end, including those of undetermined nationality, was based on information provided by governments and other sources in 94 countries.115 The true number of stateless people is believed to be significantly higher, as UNHCR does not have any information on stateless populations for most of the world’s countries, many of them likely to have stateless populations. Improving global data on statelessness therefore continues to be an important activity, and UNHCR is redoubling its efforts in this area through
the development of new international statistics recommendations.
Figure 23 displays the number of countries reflected in UNHCR’s reporting on stateless populations over the last ten years. The increase from 2019 to 2020 in the number of countries that are able to report on stateless populations is largely due to the inclusion of displaced stateless populations who were previously reported only as refugees, asylum-seekers or IDPs. Since 2017, UNHCR has reported on displaced Rohingya populations from Myanmar as both displaced and stateless due to the size of the population (some 1 million at end-2020) and is now able to extend that approach to certain other populations as well.
Figure 23 | Number of countries providing statistics on stateless populations to UNHCR | 2011 – 2020
0
20
40
60
80
100
120
'11 '12 '13 '14 '15 '16 '17 '18 '19 '20
Countries with data Countries with known stateless populations without data
CHAPTER 7
+ EXPLORE THE DATA
+ By asylum
CHAPTER 7
50 UNHCR > GLOBAL TRENDS 2020

UZBEKISTAN. “It’s impossible to describe the feeling. It’s like being born again.”
Mukhamadjon Turgunov (in yellow), born in Kyrgyzstan and until recently
stateless, trains students at the Taekwondo Federation in Tashkent, Uzbekistan. In April 2020 he finally received Uzbek citizenship. Around
the world, millions of stateless people are unable to vote, access education,
obtain medical treatment, seek employment and other basic rights.
© UNHCR/ELYOR NEMATOV
For detailed information on UNHCR’s work in support of
stateless people, see the chapter on Safeguarding fundamental rights in the
2020 Global Report.
CHAPTER 7
51UNHCR > GLOBAL TRENDS 2020

Figure 24 shows the globally reported numbers of stateless people from 2011 to 2020. The global total remains between approximately 3.2 and 4.2 million stateless people in any given year. These figures mask some notable increases and decreases. In part, these reflect decreases due to nationality
confirmation or increases in the number of stateless people. Some of the changes result from the fact that some countries began or stopped reporting on statelessness in a given year, and/or because of changes in estimation and data collection methods.
Figure 24 | Reported global number of stateless people | 2011 – 2020
4,000,000
3,000,000
0
1,000,000
2,000,000
2011 2012 2013 2014 2015 2016 2017 2018 2019 2020
Displaced versus non-displaced stateless people
Initially on an exceptional basis, stateless Rohingya refugees were included in UNHCR’s statistical reporting on statelessness starting in 2017, the year in which more than 650,000 had fled from Myanmar to Bangladesh. Before this time, the general approach was not to report people in statistics on stateless populations if they were already being reported as refugees, asylum-seekers or IDPs. The new approach taken with the Rohingya was continued in every year following 2017, and in 2020 this approach was extended to additional stateless refugees, asylum-seekers and IDPs. This approach is in line with UNHCR’s commitment to improve statelessness statistics with a view to identify appropriate responses.
Non-displaced stateless populations represent the largest stateless population in UNHCR statistics,
amounting to almost 3 million, or over 70 per cent of all known stateless people. Asylum-seekers and refugees represent the second-largest group, with slightly over 1 million stateless people (about 25 per cent) reported to UNHCR offices at the end of 2020. Of these, 988,300 are stateless Rohingya who fled Myanmar. The remaining 56,800 are stateless people displaced from other countries – predominantly stateless asylum-seekers and refugees hosted by countries in Western Europe and North America. A final category, stateless IDPs, accounts for 144,100, or over 3 per cent of the stateless population. At present, the data in this category only includes stateless people displaced inside Myanmar.
Solutions: Acquisition and confirmation of nationality
In 2020, progress continued to be made to reduce the number of stateless people through acquisition
CHAPTER 7
52 UNHCR > GLOBAL TRENDS 2020
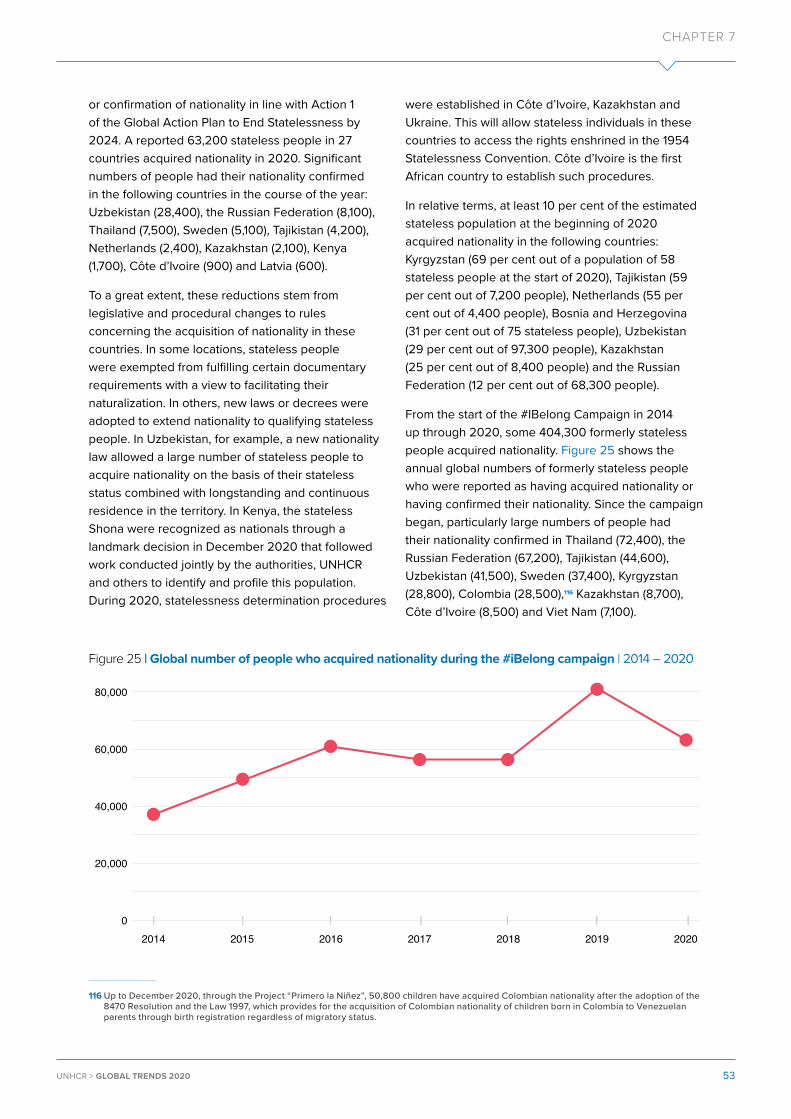
or confirmation of nationality in line with Action 1 of the Global Action Plan to End Statelessness by 2024. A reported 63,200 stateless people in 27 countries acquired nationality in 2020. Significant numbers of people had their nationality confirmed in the following countries in the course of the year: Uzbekistan (28,400), the Russian Federation (8,100), Thailand (7,500), Sweden (5,100), Tajikistan (4,200), Netherlands (2,400), Kazakhstan (2,100), Kenya (1,700), Côte d’Ivoire (900) and Latvia (600).
To a great extent, these reductions stem from legislative and procedural changes to rules concerning the acquisition of nationality in these countries. In some locations, stateless people were exempted from fulfilling certain documentary requirements with a view to facilitating their naturalization. In others, new laws or decrees were adopted to extend nationality to qualifying stateless people. In Uzbekistan, for example, a new nationality law allowed a large number of stateless people to acquire nationality on the basis of their stateless status combined with longstanding and continuous residence in the territory. In Kenya, the stateless Shona were recognized as nationals through a landmark decision in December 2020 that followed work conducted jointly by the authorities, UNHCR and others to identify and profile this population. During 2020, statelessness determination procedures
116 Up to December 2020, through the Project “Primero la Niñez”, 50,800 children have acquired Colombian nationality after the adoption of the 8470 Resolution and the Law 1997, which provides for the acquisition of Colombian nationality of children born in Colombia to Venezuelan parents through birth registration regardless of migratory status.
were established in Côte d’Ivoire, Kazakhstan and Ukraine. This will allow stateless individuals in these countries to access the rights enshrined in the 1954 Statelessness Convention. Côte d’Ivoire is the first African country to establish such procedures.
In relative terms, at least 10 per cent of the estimated stateless population at the beginning of 2020 acquired nationality in the following countries: Kyrgyzstan (69 per cent out of a population of 58 stateless people at the start of 2020), Tajikistan (59 per cent out of 7,200 people), Netherlands (55 per cent out of 4,400 people), Bosnia and Herzegovina (31 per cent out of 75 stateless people), Uzbekistan (29 per cent out of 97,300 people), Kazakhstan (25 per cent out of 8,400 people) and the Russian Federation (12 per cent out of 68,300 people).
From the start of the #IBelong Campaign in 2014 up through 2020, some 404,300 formerly stateless people acquired nationality. Figure 25 shows the annual global numbers of formerly stateless people who were reported as having acquired nationality or having confirmed their nationality. Since the campaign began, particularly large numbers of people had their nationality confirmed in Thailand (72,400), the Russian Federation (67,200), Tajikistan (44,600), Uzbekistan (41,500), Sweden (37,400), Kyrgyzstan (28,800), Colombia (28,500),116 Kazakhstan (8,700), Côte d’Ivoire (8,500) and Viet Nam (7,100).
Figure 25 | Global number of people who acquired nationality during the #iBelong campaign | 2014 – 2020
0
20,000
40,000
60,000
80,000
2014 2015 2016 2017 2018 2019 2020
53UNHCR > GLOBAL TRENDS 2020
CHAPTER 7

Demographic data coverage
Data disaggregation based on characteristics such as age and sex contributes to a better understanding of the issue of statelessness, including its causes. It also helps point the way to solutions. At the end of 2020, sex-disaggregated population data was available for 77 per cent of the globally reported stateless population of 4.2 million people. Both sex- and age-disaggregated data was reported for 62 per cent of the reported population.
Stateless Rohingya refugees and asylum-seekers hosted in several South-East and South Asian countries are among the stateless populations
with some of the best demographic data coverage. This is because they are individually registered as refugees in UNHCR’s case management system. Figure 26 shows the age- and sex-distribution of Rohingya in Bangladesh, India, Indonesia, Malaysia and Nepal. While the demographics of the Rohingya populations in Bangladesh, India and Nepal are broadly comparable, in Malaysia, 80 per cent of adult registered Rohingya are male, and the proportion of children (25 per cent) is much lower. Possible reasons for this imbalance include the lack of safe, affordable and regular pathways for displaced Rohingya to reach Malaysia, making it more likely for men to undertake the journey.
Figure 26 | Population structure of stateless Rohingya displaced from Myanmar in five countries of asylum | end-2020
Nepal
Malaysia
Indonesia
India
Bangladesh
40% 20% 0% 20% 40%
40% 20% 0% 20% 40%
25
26
27
22
23
24
24
29
19
26
17
38
12
15
13
60
24
22
25
29
Children
Adults
Children
Adults
Children
Adults
Female Male
1,000,000500,000100,000
Number of people
Bangladesh
MyanmarThailand
Côte d'Ivoire
Stateless refugees fromMyanmar in Bangladesh
CHAPTER 7
54 UNHCR > GLOBAL TRENDS 2020
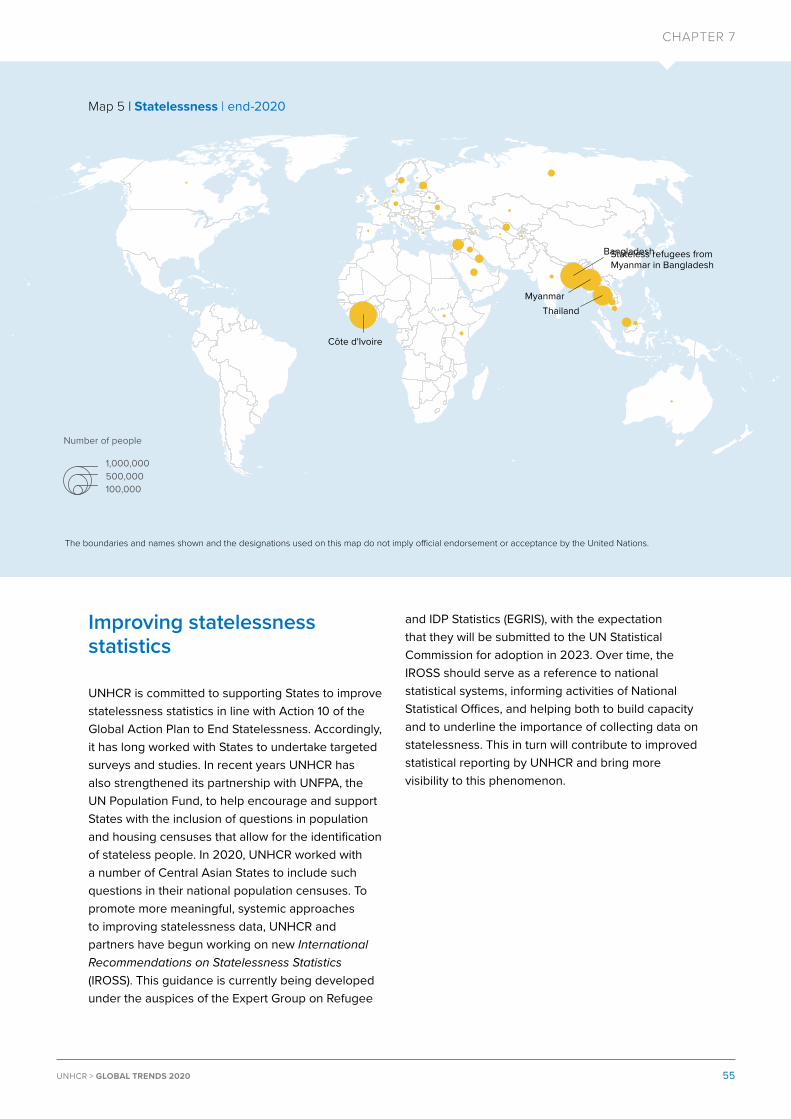
Improving statelessness statistics
UNHCR is committed to supporting States to improve statelessness statistics in line with Action 10 of the Global Action Plan to End Statelessness. Accordingly, it has long worked with States to undertake targeted surveys and studies. In recent years UNHCR has also strengthened its partnership with UNFPA, the UN Population Fund, to help encourage and support States with the inclusion of questions in population and housing censuses that allow for the identification of stateless people. In 2020, UNHCR worked with a number of Central Asian States to include such questions in their national population censuses. To promote more meaningful, systemic approaches to improving statelessness data, UNHCR and partners have begun working on new International Recommendations on Statelessness Statistics (IROSS). This guidance is currently being developed under the auspices of the Expert Group on Refugee
and IDP Statistics (EGRIS), with the expectation that they will be submitted to the UN Statistical Commission for adoption in 2023. Over time, the IROSS should serve as a reference to national statistical systems, informing activities of National Statistical Offices, and helping both to build capacity and to underline the importance of collecting data on statelessness. This in turn will contribute to improved statistical reporting by UNHCR and bring more visibility to this phenomenon.
Map 5 | Statelessness | end-2020
1,000,000500,000100,000
Number of people
Bangladesh
MyanmarThailand
Côte d'Ivoire
Stateless refugees fromMyanmar in Bangladesh
The boundaries and names shown and the designations used on this map do not imply official endorsement or acceptance by the United Nations.
55UNHCR > GLOBAL TRENDS 2020
CHAPTER 7
CHAPTER 8
Impact of COVID-19
117 See WHO, Coronavirus dashboard, as of 24 May 2021118 See IOM, Internal Displacement in Yemen Exceeds 100,000 in 2020 with COVID-19 an Emerging New Cause 119 See ICRC, What Happened? How the Humanitarian Response to COVID-19 Failed to Protect Women and Girls 120 See UNFPA et al., Daring to Ask, Listen, and Act: A Snapshot of the Impacts of COVID-19 on Women and Girls’ rights and sexual and
reproductive health121 See Oxfam, A New Scourge to Afghan Women: COVID-19 122 See UNICEF, COVID-19: A threat to progress against child marriage
Since the first case of COVID-19 was recorded in December 2019, more than 165 million117 people worldwide have been confirmed to have contracted the virus. The ongoing pandemic has impacted nearly every country, disrupting lives and perturbing health, political and economic systems across the world. People who have been forcibly displaced or who are stateless have been among the hardest-hit groups of society, facing increased food and economic insecurity as well as challenges to access health and protection services.
Emerging evidence indicates that, in addition to precluding the possibility to flee, in some cases, COVID-19 may also have been a factor in triggering new movement of people in 2020. For instance, displaced people in Yemen have started to report the pandemic as a reason for displacement.118 At least 10,000 people surveyed between the end of March and mid-July 2020 reported the impact of COVID-19 on services and economy and/or fears of contracting the virus as a reason for moving from virus hotspots to less affected areas in Yemen.
ProtectionAlthough all forcibly displaced and stateless people have in some way been affected by COVID-19, their experiences vary based on age, gender and diversity characteristics. In many countries, forcibly displaced women and girls have been particularly impacted, with the available data pointing to more incidents of gender-based violence (GBV) and sexual exploitation. Limited access to information and support services during the pandemic have intensified these risks. According to an assessment conducted in East Africa, West Africa, and the Great Lakes region, 73 per cent of forcibly displaced women interviewed reported increased cases of intimate partner violence.119 This trend is evident in other regions too, with women in Jordan (69 per cent)120 and Afghanistan (97 per cent)121 also reporting increased GBV since the start of the pandemic. Child, early and forced marriage is another concern as evidence demonstrates heightened risks for forcibly displaced adolescent girls. UNICEF estimates that, over the next decade, ten million additional child marriages may occur as a result of the pandemic.122
+ EXPLORE THE DATA
+ COVID-19 platform
CHAPTER 8
56 UNHCR > GLOBAL TRENDS 2020

YEMEN. Internally displaced Yemenis receive assistance during the COVID-19 pandemic in Hudaydah. Named by the UN as the world’s worst humanitarian crisis, Yemen has more than 24 million people in urgent need of aid. Yemen is also experiencing the world’s largest food security emergency, with more than 23 million people lacking sufficient nutrition. More than 4 million people remained displaced at end-2020. The coronavirus pandemic has increased the hardship and only half of the country’s health facilities are fully functioning. © UNHCR/NMO
For detailed information on UNHCR’s pandemic response, see the section on COVID-19,
as well as information mainstreamed into the regional
and thematic chapters across the 2020 Global Report.
CHAPTER 8
57UNHCR > GLOBAL TRENDS 2020

Measures to contain the spread of COVID-19 have directly impacted the functioning of asylum systems all over the world. The closure of borders and restrictions on movement are making it considerably harder for people fleeing war and persecution to reach safety. At the peak of the pandemic during 2020, some 164 countries had closed their borders, with 99 States making no exception for people seeking asylum (see Figure 27).123
123 Status on 25 May 2020, UNHCR Protection Dashboard.124 In 2012 there was a significant increase in the number of refugee registrations, notably due to the conflict in Syria.125 All figures relate to UNHCR’s web-based case management system, proGres.
This scenario has led many countries to adapt their asylum procedures, shifting to remote registration and adopt medical screenings at borders and quarantine measures. Despite efforts to adapt asylum procedures, the number of new asylum applications registered worldwide during 2020 was 45 per cent lower than in 2019.
Figure 27 | Borders and admission of asylum-seekers | 2020
4 6 13 16 20 24 27 29
6578
7881 77 70
7781
99
90 79 75 72 7167 63
27 21 25 23 26 30 24 22
May Jun Jul Aug Sep Oct Nov Dec
Countries where access to territory data was pending
Countries where access to territory was denied
Countries where restrictions on access to territory applied with exceptions to asylum-seekers
Countries where no COVID-19 related restrictions were imposed
Refugee registration conducted by UNHCR provides another useful measure of the impact of these restrictions. In 2020, UNHCR refugee registration numbers dropped to their lowest levels since 2012,124 and some 42 per cent lower than in 2019. The impact of these restrictions was most notable between March and April 2020, with a drop in registrations of
56 per cent from 71,900 to 31,700 (see Figure 28). The number of people registered per month slowly normalized as the year progressed, albeit through adapted modalities such as remote registrations. The East Africa and Middle East/North Africa regions experienced the most significant decreases in the number of refugee registrations during the year.125
CHAPTER 8
58 UNHCR > GLOBAL TRENDS 2020
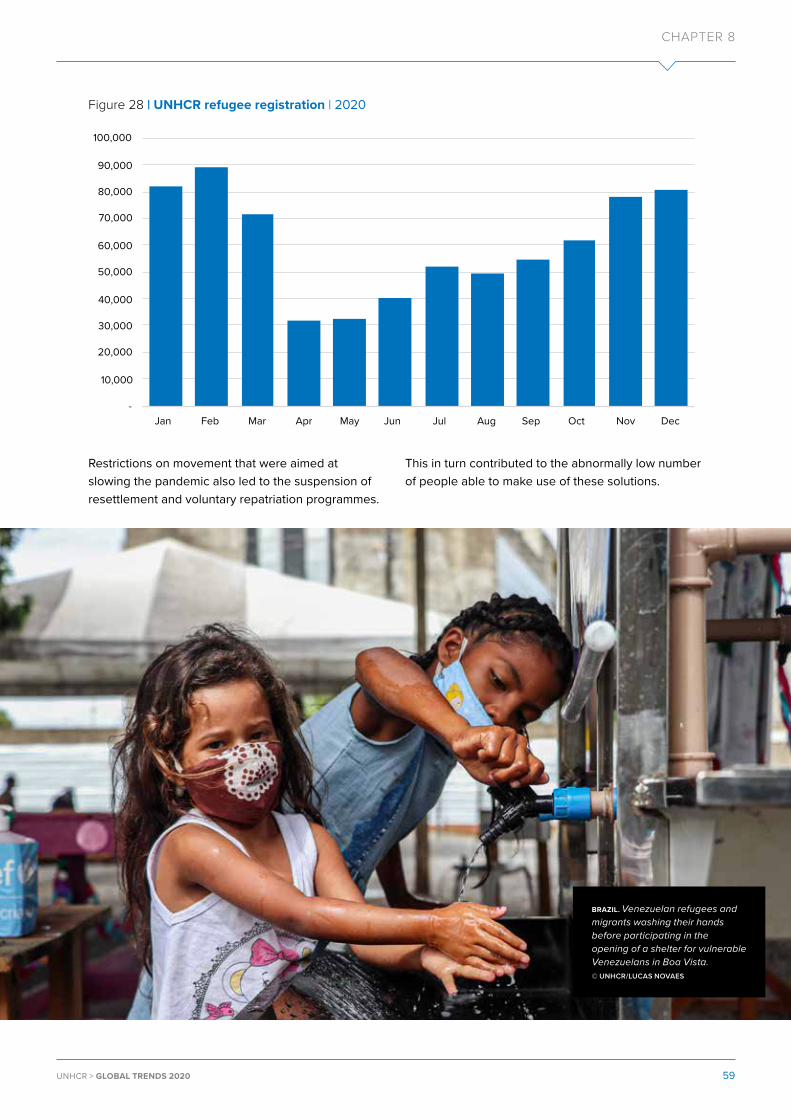
Figure 28 | UNHCR refugee registration | 2020
-
10,000
20,000
30,000
40,000
50,000
60,000
70,000
80,000
90,000
100,000
Jan Feb Mar Apr May Jun Jul Aug Sep Oct Nov Dec
Restrictions on movement that were aimed at slowing the pandemic also led to the suspension of resettlement and voluntary repatriation programmes.
This in turn contributed to the abnormally low number of people able to make use of these solutions.
BRAZIL. Venezuelan refugees and migrants washing their hands before participating in the opening of a shelter for vulnerable Venezuelans in Boa Vista. © UNHCR/LUCAS NOVAES
59UNHCR > GLOBAL TRENDS 2020
CHAPTER 8
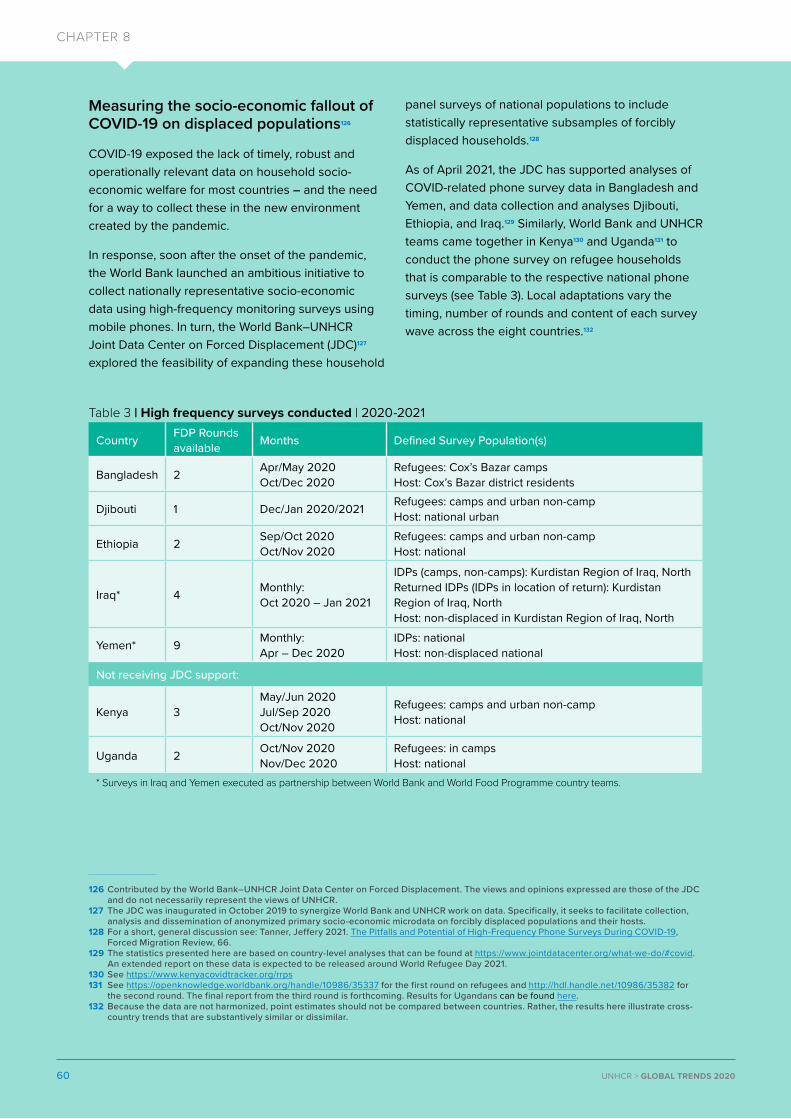
Measuring the socio-economic fallout of COVID-19 on displaced populations126
COVID-19 exposed the lack of timely, robust and operationally relevant data on household socio-economic welfare for most countries – and the need for a way to collect these in the new environment created by the pandemic.
In response, soon after the onset of the pandemic, the World Bank launched an ambitious initiative to collect nationally representative socio-economic data using high-frequency monitoring surveys using mobile phones. In turn, the World Bank–UNHCR Joint Data Center on Forced Displacement (JDC)127 explored the feasibility of expanding these household
126 Contributed by the World Bank–UNHCR Joint Data Center on Forced Displacement. The views and opinions expressed are those of the JDC and do not necessarily represent the views of UNHCR.
127 The JDC was inaugurated in October 2019 to synergize World Bank and UNHCR work on data. Specifically, it seeks to facilitate collection, analysis and dissemination of anonymized primary socio-economic microdata on forcibly displaced populations and their hosts.
128 For a short, general discussion see: Tanner, Jeffery 2021. The Pitfalls and Potential of High-Frequency Phone Surveys During COVID-19, Forced Migration Review, 66.
129 The statistics presented here are based on country-level analyses that can be found at https://www.jointdatacenter.org/what-we-do/#covid. An extended report on these data is expected to be released around World Refugee Day 2021.
130 See https://www.kenyacovidtracker.org/rrps131 See https://openknowledge.worldbank.org/handle/10986/35337 for the first round on refugees and http://hdl.handle.net/10986/35382 for
the second round. The final report from the third round is forthcoming. Results for Ugandans can be found here. 132 Because the data are not harmonized, point estimates should not be compared between countries. Rather, the results here illustrate cross-
country trends that are substantively similar or dissimilar.
panel surveys of national populations to include statistically representative subsamples of forcibly displaced households.128
As of April 2021, the JDC has supported analyses of COVID-related phone survey data in Bangladesh and Yemen, and data collection and analyses Djibouti, Ethiopia, and Iraq.129 Similarly, World Bank and UNHCR teams came together in Kenya130 and Uganda131 to conduct the phone survey on refugee households that is comparable to the respective national phone surveys (see Table 3). Local adaptations vary the timing, number of rounds and content of each survey wave across the eight countries.132
Table 3 | High frequency surveys conducted | 2020-2021
Country FDP Rounds available Months Defined Survey Population(s)
Bangladesh 2 Apr/May 2020Oct/Dec 2020
Refugees: Cox’s Bazar camps Host: Cox’s Bazar district residents
Djibouti 1 Dec/Jan 2020/2021 Refugees: camps and urban non-campHost: national urban
Ethiopia 2 Sep/Oct 2020Oct/Nov 2020
Refugees: camps and urban non-campHost: national
Iraq* 4 Monthly: Oct 2020 – Jan 2021
IDPs (camps, non-camps): Kurdistan Region of Iraq, North Returned IDPs (IDPs in location of return): Kurdistan Region of Iraq, North Host: non-displaced in Kurdistan Region of Iraq, North
Yemen* 9 Monthly: Apr – Dec 2020
IDPs: nationalHost: non-displaced national
Not receiving JDC support:
Kenya 3May/Jun 2020Jul/Sep 2020 Oct/Nov 2020
Refugees: camps and urban non-camp Host: national
Uganda 2 Oct/Nov 2020 Nov/Dec 2020
Refugees: in campsHost: national
* Surveys in Iraq and Yemen executed as partnership between World Bank and World Food Programme country teams.
60 UNHCR > GLOBAL TRENDS 2020
CHAPTER 8

The results from these seven countries are neither globally representative133 nor causal in their attribution of observed outcomes to the pandemic. Nevertheless, they aim to be as statistically representative of defined national and forcefully displaced populations in those countries as possible.134 While not conclusive, these timely, contemporaneous, high-quality socio-economic microdata are instructive in understanding the range of welfare challenges experienced during COVID-19.
133 The pandemic’s effects are a function of individual and country initial economic conditions and drivers of displacement, so the experience of a particular displaced person or population may be inconsistent with these results.
134 While the samples are representative of households that can be reached by mobile phone, most of the analyses apply re-weighting techniques to make the statistics as representative as possible of the full national and displaced populations, including those not reachable by phone.
135 See Vishwanath, Tara; Arthur Alik-Lagrange and Leila Aghabarari. 2020. Highly Vulnerable Yet Largely Invisible, World Bank – UNHCR Joint Data Center working paper series. December 2020.
136 General trends in this piece are based on all countries (of the seven) that had included the indicator in their public briefs; statistics presented from specific countries reflect the range of the countries’ experiences.
Drawing on a conceptual model developed in a JDC working paper135 on the theorized socio-economic effects of COVID-19 on those affected by forced displacement (see Figure 29), the results presented here follow indicators on income, living standards and coping strategies to give general trends and illustrative statistics136 on the range of experiences of displaced and host communities during the pandemic.
Figure 29 | Socio-economic implications of COVID-19
LABOUR INCOME: Forcibly displaced people were largely active in the informal economy (related to de jure and de facto lack of right to work) and other sectors highly impacted by lockdowns.
NON-LABOUR INCOME: Remittances have decreased and pandemic assistance is generally insu�cient to o�set losses.
FOOD SECURITY: Income loss and increases in food prices result in contracted access to food. Households often borrow or reduce food consumption as coping strategies.
HUMAN CAPITAL
LIMITED COPING
STRATEGIES
COVID-19 INDUCED ECONOMIC RECESSION
INCOMELOSS
REDUCED LIVING
STANDARDS HEALTH: Vulnerable populations are among the least served when health systems are strained.
EDUCATION: School closures and limited access to technology cripple displaced children’s academic progress.
Income loss
Displaced people are at risk of losing income from both labour and non-labour sources, such as assistance or remittances. Indeed, total income likely has decreased for large shares of displaced
households in Bangladesh, Ethiopia, Uganda and Yemen. But there is a wide range in the share of households affected. Compared to before the pandemic, 89 per cent of refugee households in Uganda reported reductions in total income, versus 27 per cent of those in Ethiopia.
61UNHCR > GLOBAL TRENDS 2020
CHAPTER 8

Labour income: Host and forcibly displaced households experienced lower levels of employment and decreases in labour income during the pandemic.
For nearly all countries analysed, employment rates among displaced populations were lower than among host communities. In Djibouti, for example, 83 per cent of national households’ main income earners
worked in January 2021 compared to only 54 per cent of main income earners from the displaced sample. However, in Yemen, employment losses were similar for displaced and host households. In Iraq, unemployment among IDP households in camps was much higher than for hosts or IDPs not living in camps (see Figure 30).
Figure 30 | IDPs living in camps experienced higher rates of unemployment than those not living in camps and host communities in Iraq (in %, 18 to 65 years of age)
Camp IDP Non-Camp IDP Host
0
20
40
60
80
100
Oct-20 Nov-20 Dec-20 Jan-21
Movement restrictions to curb the spread of COVID-19 would likely have the largest economic fallout on employment and income for casual labourers and informal workers. Consequently, restrictions may have disproportionately affected forcibly displaced populations in Djibouti, Ethiopia and Kenya, where a large share of workers are informal.
Labour market recovery is uneven. In Ethiopia, the labour market has rebounded to pre-pandemic levels for nationals, but it is still 10 percentage points lower for refugees. Employment in Kenya saw a 7–10 percentage point increase in the five months ending in November 2020 for both hosts and refugees, but a 40-percentage point gap still remained between the two groups. And although Ugandans’ employment has returned to pre-lockdown levels, employment among refugees has not, even though refugees reported being more excluded from the labour market before the pandemic.
Non-labour income: Displaced households’ non-labour income often waned during the pandemic.
Remittance income generally decreased, but assistance income was more mixed.
While still a main source of income in Djibouti and Ethiopia, remittances decreased after the onset of the pandemic for both refugee and host households. Nearly half of refugee households in Ethiopia received foreign remittances, but by September 36 per cent of those households had experienced a drop in the total value of those remittances. A similar scenario unfolded in Djibouti where 36 per cent of refugees in settlements received remittances and help from friends; of those, 32 per cent saw the value of those remittances decline.
Government and international assistance also represent a large share of refugee and host non-labour income, helping both groups cope with the socio-economic shocks associated with the pandemic. Government safety nets and international assistance programmes increased for most households in Ethiopia and Uganda. And while assistance in Ethiopia did decrease from September
CHAPTER 8
62 UNHCR > GLOBAL TRENDS 2020

to October 2020 for refugees, it shrank for a far greater share of the national population.
Shocks and coping strategies
Loss of labour and non-labour income places severe stress on households. Displaced households experienced harsh socio-economic shocks related to the pandemic and adopted different coping mechanisms across these eight countries surveyed.
In Uganda, every refugee household suffered at least one negative shock in each round of data collection, compared to 42 per cent of Ugandans who did not experience any shock between March and June 2020. In Uganda as elsewhere, increases in the price of food items consumed was by far the most commonly experienced shock; employment, illness, and agricultural losses were also by some. Households generally coped with these shocks using three main strategies: (1) reduction in food and non-food consumption; (2) assistance from family and friends; and (3) assistance from government and non-government actors.
Lower living standards
Reductions in food and non-food consumption were frequently reported by both displaced and non-displaced households in all eight surveyed countries. Deficiencies in nutrition, health and education incurred during the pandemic may have long-term negative repercussions on the well-being of affected populations by impairing human capital formation.
Food security: Access to food was a common concern for both forcibly displaced and host households throughout the pandemic in these countries. Host households were typically more likely to be able to access food than displaced households in Djibouti, Iraq, Kenya, Uganda and Yemen. Households pointed to decreases in income and increases in food prices over the pandemic period as the reasons for decreased food security in those countries.137
The persistence of food insecurity and inadequate diet may presage a severe, and possibly prolonged, impact of COVID-19 on health beyond direct infection. Families facing food shortages adopt elements of all
137 In Yemen, food price shocks are perhaps more likely due to continued war and its many repercussions, including the recent currency crisis, than COVID-19.
three coping strategies. In Kenya, more than three quarters of refugee households reduced meals, and adults in half of refugee households went without food so that children could eat. Receiving assistance from personal networks was common in Djibouti, Ethiopia, Iraq and Uganda. And cash, food and food stamp assistance from governments, international partners and NGOs also played an important role in mitigating some of the negative effects of the pandemic – particularly for refugee households Djibouti, Ethiopia and Uganda. In Ethiopia, refugee households can purchase food items more readily than host households – likely as a result of the assistance refugees typically receive.
Education: The pandemic may also have long-lasting ramifications by sharply reducing access to education. Pandemic lockdowns restricted participation in learning activities for both host and displaced children in Ethiopia, Iraq and Uganda.
Refugee children often showed remarkable resilience in keeping with their studies. The few displaced children enrolled in school prior to the pandemic were likely to continue engagement in educational activities. Prior to the pandemic, enrolment rates in Ethiopia were higher among the national population than among refugees; however, among all children previously enrolled, refugees were more likely to engage in learning activities during the pandemic. Still, refugee educational engagement dwindled as the pandemic wore on in Ethiopia.
Only 1 in 5 host households with school-age children in Iraq were able to engage in any learning activities, yet they were still twice as likely to do so as IDP households.
When countries begin to allow schools to reopen, that progress may be slow and uneven. A month after schools in Ethiopia started to reopen, less than 10 per cent of refugee households with school-age children indicated that their child’s school was open.
Health care: Displaced populations in all seven countries indicated significant challenges accessing health services when they needed it. This is a clear public health concern – particularly during a pandemic.
63UNHCR > GLOBAL TRENDS 2020
CHAPTER 8

Displaced households typically faced greater challenges than non-displaced households in accessing medical care in Djibouti, Ethiopia and Iraq. Where such data were collected – Djibouti,
138 See footnote 127 for more information.
Ethiopia and Uganda – the “inability to pay” was overwhelmingly the most common reason given by both displaced and non-displaced households for why they could not access health care.
Figure 31 | Share of respondents with poor access to health care in Yemen
20%
25%
30%
35%
40%
45%
50%
Host (pre-pandemic) IDP (pre-pandemic)Host (post-pandemic) IDP (post-pandemic)
Dec-20Nov-20Oct-20Sep-20Aug-20Jul-20Jun-20May-20Apr-20Mar-20Feb-20Jan-20Dec-19Nov-19
Notwithstanding the many concurrent challenges faced by Yemen, Figure 32 suggests the influence of the pandemic on health care access is clearly visible. Prior to March 2020, the share of respondents with poor access to health care was on a downward trend for both IDPs and the host community, but the pandemic erased those gains with a 12-15 percentage point jump in March which only started to decrease at the end of the year.
Insights for data collection
Survey results during COVID-19 for these eight contexts have yielded four important observations regarding data collection and data systems:
• In the face of large health and socio-economic shocks like the pandemic, the need for timely data
on displaced populations is particularly acute. A shock’s repercussions frequently differ between displaced and host communities. Monitoring their welfare facilitates appropriately differentiated responses.
• Flexibility while maintaining statistical rigour with phone surveys is possible – when the conditions are right.138 Reliable statistics require a robust sampling strategy, sampling frame and carefully derived weights.
• The need to shift from face-to-face data collection during the pandemic demonstrated that high-frequency phone surveys can be a useful tool. These methods can be innovatively applied to collect data on difficult-to-reach populations and can reduce data production time and cost – although often at the expense of survey length and the inability to control the interview environment to pursue sensitive topics. Though
64 UNHCR > GLOBAL TRENDS 2020
CHAPTER 8

not without significant challenges in overcoming sampling and selection bias, phone surveys are a useful complement to face-to-face surveys in filling data gaps.
• Finally, an inclusive agenda in which forcibly displaced populations are integrated into data collected by national statistical systems can build capacity and make it possible to incorporate the needs of displaced populations into operational planning.
Looking forward
The pandemic has compounded immediate and longer-term challenges to household welfare. Phone survey data indicates well-being generally has deteriorated, sometimes drastically. Yet there is important variation across socio-economic indicators, countries and even across forcibly displaced groups within a country.
Recovery from the pandemic is likely to be slow and, just as with its impacts, uneven across countries, populations and dimensions of well-being. The full extent of human and economic costs to households and countries may not be known for some time, but it will certainly be felt for years to come as the effects of income loss, food insecurity and foregone education reverberate for a generation.
NEPAL. A refugee from Bhutan receives his COVID-19 vaccination at the Beldangi refugee settlement in eastern Nepal. © SANTOSH KUMAR CHAUDHARY
65UNHCR > GLOBAL TRENDS 2020
CHAPTER 8
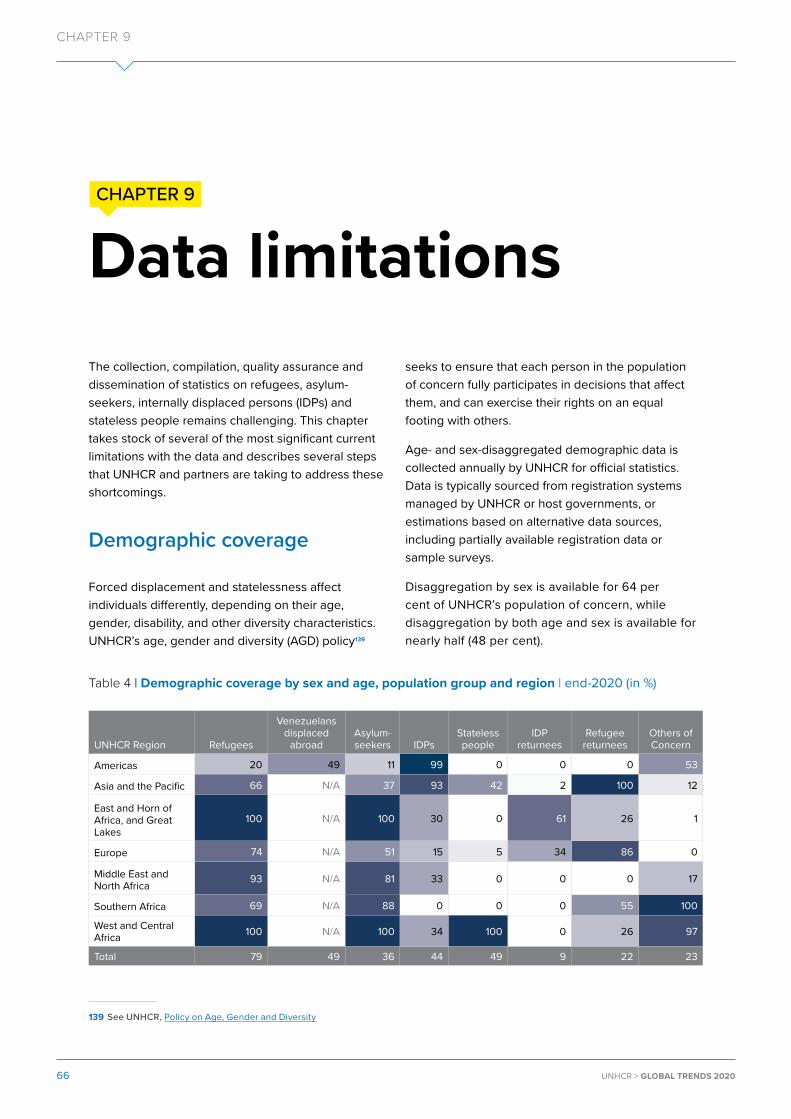
Data limitations
139 See UNHCR, Policy on Age, Gender and Diversity
The collection, compilation, quality assurance and dissemination of statistics on refugees, asylum-seekers, internally displaced persons (IDPs) and stateless people remains challenging. This chapter takes stock of several of the most significant current limitations with the data and describes several steps that UNHCR and partners are taking to address these shortcomings.
Demographic coverage
Forced displacement and statelessness affect individuals differently, depending on their age, gender, disability, and other diversity characteristics. UNHCR’s age, gender and diversity (AGD) policy139
seeks to ensure that each person in the population of concern fully participates in decisions that affect them, and can exercise their rights on an equal footing with others.
Age- and sex-disaggregated demographic data is collected annually by UNHCR for official statistics. Data is typically sourced from registration systems managed by UNHCR or host governments, or estimations based on alternative data sources, including partially available registration data or sample surveys.
Disaggregation by sex is available for 64 per cent of UNHCR’s population of concern, while disaggregation by both age and sex is available for nearly half (48 per cent).
Table 4 | Demographic coverage by sex and age, population group and region | end-2020 (in %)
UNHCR Region Refugees
Venezuelans displaced
abroadAsylum-seekers IDPs
Stateless people
IDP returnees
Refugee returnees
Others of Concern
Americas 20 49 11 99 0 0 0 53
Asia and the Pacific 66 N/A 37 93 42 2 100 12
East and Horn of Africa, and Great Lakes
100 N/A 100 30 0 61 26 1
Europe 74 N/A 51 15 5 34 86 0
Middle East and North Africa 93 N/A 81 33 0 0 0 17
Southern Africa 69 N/A 88 0 0 0 55 100
West and Central Africa 100 N/A 100 34 100 0 26 97
Total 79 49 36 44 49 9 22 23
CHAPTER 9
CHAPTER 9
66 UNHCR > GLOBAL TRENDS 2020

NIGER. Malian refugee Zeinabou holds a schoolbook in the shelter where she lives with her family in Ouallam camp, Niger. Increasing attacks by armed groups forced the family to uproot and cross the border into neighbouring Niger. Zeinabou is enrolled at the camp’s primary school. © UNHCR/BOUBACAR YOUNOUSSA SIDDO
CHAPTER 9
67UNHCR > GLOBAL TRENDS 2020

140 Including people in refugee-like situations.141 See https://static1.squarespace.com/static/5b2d24e39d5abbe187e75234/t/5dfa5c8dcda8467a3e88e89c/1576688782434/TF5.pdf
There are notable differences in the availability of detailed age- and sex-disaggregated data by population group and country of asylum. Detailed demographic data is available for 79 per cent of refugees,140 but just 36 per cent of asylum-seekers.
Regional variations in the availability of age- and sex-disaggregated demographic data are significant. They range from 6 per cent in Southern Africa to 68 per cent in Asia and the Pacific. Europe and the Americas, which host about three-quarters of the global asylum-seeking population, provide detailed demographics only for 51 and 11 per cent of their asylum-seeking population respectively. While some demographic data for asylum-seekers is available for many European countries, the data is often not directly interoperable with UNHCR’s due to inconsistent age cohorts. UNHCR’s age cohorts have been designed to align, where possible, to UN conventions and to capture information to support the monitoring of critical benchmarks in humanitarian programming.141
Notable improvements in the demographic coverage in 2020 included data for Venezuelans displaced abroad, for whom the availability of age and sex data soared from just one per cent in 2019 to 47 per cent in 2020, due to newly available official data in Colombia. Continuing to improve the availability of demographic data is a priority for UNHCR, which is exploring alternative data sources to estimate missing data with statistical modelling (e.g. the regional modelling presented in Chapter 2).
a. Sub-national coverage
Recording the locations of forcibly displaced and stateless populations is crucial to ensure effective humanitarian responses within countries. In large countries such as Syria and the Democratic Republic of the Congo, new displacement can be highly localized, sometimes within a specific region or city. UNHCR documents the locations of forcibly displaced populations in its annual statistical reporting. In 2020, some 102 of 187 countries (54 per cent) provided data disaggregated by at least one subnational location. In many instances these relate to regions, typically level-1 administrative units. Overall, UNHCR
has collected demographic data for 1,400 locations, of which some 300 are either cities or camps for refugees or IDPs. Location data is available for 57 per cent of refugees, 14 per cent of asylum-seekers, 86 per cent of IDPs and 55 per cent of stateless people.
Sub-national coverage tends to be higher where UNHCR is operational, because of a recognition that understanding the spatial distribution of populations can inform activities in ways that boost impact. As a result, sub-national coverage is highest in the Middle East and North Africa and Southern Africa regions (close to 100 per cent in both regions).
UNHCR regularly validates location data by standardizing and geotagging the locations of its population of concern. It also works with governments and research institutes to identify additional relevant locations. Further improvements to sub-national location data are a priority.
b. Vital statistics
Regular updates to and comprehensive coverage of major life events is an important component of population statistics. UNHCR’s vital statistics includes biannual collection of data on births and deaths of refugees. However, accurate reporting as well recording of these vital statistics remains a challenge. In 2020, less than one-third of the countries hosting at least 1,000 refugees reported at least one birth or death. The reporting varies significantly by region, with the lowest coverage in the Americas and Europe and the highest in the three sub-Saharan African regions, where UNHCR leads registration and other refugee support activities.
In 2020, UNHCR applied statistical modelling approaches to the available data, including the demographic data, to estimate the total number of children born into refugee life, thus improving the estimated by minimizing the impact of missing data (see page 10).
c. Estimation of population figures
Accurate and reliable population statistics underpin the design, delivery and efficacy of many, if not most, humanitarian activities. Yet no government figures for refugee populations are available in 17
CHAPTER 9
68 UNHCR > GLOBAL TRENDS 2020

developed countries.142 To bridge this gap, UNHCR estimates these populations by assuming that the refugee population is the sum of all asylum-seekers recognized during the last ten years on a rolling basis. The underlying assumption for this methodology is that after 10 years refugees will have found a durable solution in those countries, or will have returned to their country of origin (resettlement from these developed countries is rare). UNHCR recognizes that this approach is an oversimplification given that voluntary returns, naturalization and other long-term solutions, such as permanent residence status, take a longer or shorter period of time in some countries than others. Also, each refugee chooses whether to apply for naturalization and the time to complete these processes may certainly vary.
To evaluate the 10-year estimation methodology, UNHCR compared the refugee end-year figures obtained through estimation using this approach with the actual numbers for countries with a similar level of
142 The 17 countries where UNHCR estimates the number of refugees are Australia, Austria, Bulgaria, Canada, Denmark, Finland, Greece, Iceland, Japan, Netherlands, New Zealand, Norway, Portugal, Spain, Sweden, United Kingdom and United States. In Italy, data from ISTAT was used to re-base the number of refugees in 2020 for the first time, because this is more accurate than estimating the population each year.
development and geographical location that provide refugee population figures. The comparison used the available data for Belgium, France, Germany and Switzerland for the period between 2011 and 2020.
The results show that the methodology could usefully be more finely adjusted for specific country contexts, including taking into account national legislation on refugee naturalization, birth and death rates, family reunification and naturalization policies for children born to refugees, as well as how all of these aspects are reflected in the asylum statistics. Notably, the 10-year estimation works very well for Germany and Switzerland, with less than a 5 per cent margin of error between the estimated and true values for the last two years. However, this methodology significantly underestimates the actual refugee population in France (on average by 35 per cent for the last two years) and overestimates the refugee population in Belgium (23 per cent in the last two years).
Figure 32 | Reported and estimated number of refugees | 2011–2020
Estimated number of refugees Reported number of refugees
-
10,000
20,000
30,000
40,000
50,000
60,000
70,000
80,000
90,000
2011 2012 2013 2014 2015 2016 2017 2018 2019 2020
Belgium
-
50,000 100,000 150,000
200,000 250,000 300,000 350,000 400,000 450,000 500,000
2011 2012 2013 2014 2015 2016 2017 2018 2019 2020
France
-
200,000
400,000
600,000
800,000
1,000,000
1,200,000
1,400,000
2011 2012 2013 2014 2015 2016 2017 2018 2019 2020
Germany
-
20,000
40,000
60,000
80,000
100,000
120,000
140,000
2011 2012 2013 2014 2015 2016 2017 2018 2019 2020
Switzerland
69UNHCR > GLOBAL TRENDS 2020
CHAPTER 9

UNHCR’s preferred option is for the competent authorities in these 17 countries to provide the refugee estimate, consistent with the vast majority of refugee hosting countries. Until such data becomes available, UNHCR continues to assess the impact of other factors that would influence its estimates to then inform possible options for a more nuanced approach to the estimations used in these 17 countries. While there is utility in a consistent methodology for all countries, there are certainly merits to a more bespoke approach to better approximate the situation in specific countries.
d. Irregular data updates
Timely updates to statistics help UNHCR respond more quickly and appropriately where support is most needed. In most countries, updates to population statistics are available on at least an annual basis. In others, data is based on estimates or irregular data collection exercises such as censuses. In 16 countries data for at least one population group has not been updated in the last five years. Opportunities to refresh these statistics are being explored.
Addressing data limitations through a Statistical Quality Assurance Framework
To address the challenges noted above, and to better manage the quality of UNHCR’s statistical outputs, it is vital to have a commonly accepted framework which becomes the basis of quality improvement and performance evaluation. The framework depends upon commonly agreed principles, a clear understanding of quality and its dimensions, explicit quality guidelines, and a quality assessment programme.
UNHCR’s Statistical Quality Assurance Framework (SQAF) was initiated in late 2020 and shall be published later in 2021. It is a necessary element to achieve the vision set in the UNHCR Data Transformation Strategy 2020–2025143 and to deliver on the priority actions aimed at improving data management and information systems. The
143 See https://www.unhcr.org/5dc2e4734.pdf 144 See https://unstats.un.org/unsd/demographic-social/Standards-and-Methods/files/Principles_and_Recommendations/International-
Migration/2018_1746_EN_08-E.pdf 145 See https://unstats.un.org/unsd/statcom/51st-session/documents/BG-item-3n-international-recommendations-on-IDP-statistics-E.pdf 146 EGRIS was established in 2016 by the UN Statistical Commission. It is tasked with addressing these challenges including the lack of
consistent terminology and difficulties in comparing statistics internationally.
framework is relevant to all official statistics within UNHCR and aims to ensure the implementation of efficient statistical procedures in a trusted institutional environment to provide statistical products that meet the needs of users.
Three examples of how the SQAF is being applied to improve UNHCR’s statistics are:
a. To improve the accuracy and reliability of UNHCR’s population statistics, source data and statistical outputs are regularly assessed for accuracy and validated. One aspect of this has been the development of 45 automated validation checks to identify incorrect or unusual population statistics and highlight these for review and correction if needed by the data curation team in each region and country. These checks are extensible, with further outlier detection checks being developed.
b. To improve the interoperability of published statistics, UNHCR is working with other data providers to compare and, where possible, reconcile statistics from different data sources. This includes, for example, data on people who have been internally displaced, which is produced by the Internal Displacement Monitoring Centre.
c. To ensure sound methods and systems, the overall methodological framework used for UNHCR statistics should follow international standards, guidelines and good practices. These include the International Recommendations on Refugee Statistics144 and the International Recommendations on Internally Displaced Persons Statistics,145 published by the Expert Group on Refugee and IDP Statistics146 and endorsed by the United Nations Statistical Commission in 2018 and 2020, respectively.
UNHCR will continue to assess its official statistics, including population statistics as well as other thematic areas, using the new SQAF to tackle the specific challenges set out above.
CHAPTER 9
70 UNHCR > GLOBAL TRENDS 2020

Who is included in UNHCR statistics?UNHCR collates population data relating to people who are forcibly displaced or stateless. The data is sourced primarily from governments and also from UNHCR operations. See https://www.unhcr.org/refugee-statistics/methodology/ for the detailed description and definitions of who is included in these statistics.
Annex tablesAnnex tables 1 through 22 can be downloaded from the UNHCR website at: https://www.unhcr.org/2020-global-trends-annexAnnex table 5: https://www.unhcr.org/2020-global-trends-annex-table-statelessnessAll data are provisional and subject to change.Data is available at: https://www.unhcr.org/refugee-statistics
SOUTH SUDAN. Sudanese refugees observe COVID-19-related physical distancing measures during a food distribution at Ajuong Thok refugee camp. © UNHCR/ELIZABETH MARIE STUART
71UNHCR > GLOBAL TRENDS 2020
CHAPTER 9

PRODUCED BY UNHCR (18 JUNE 2021)
FRONT COVERYEMEN. Shaker Ali, 52, sits in front of what used to be a marketplace in Aden. “I have lived here for more than 15 years, and seeing my neighbourhood like this upsets me and makes me sad. The war forced us to leave and move. We moved to Inma’a city when things heated up and now I’m back to my home. We miss many of the basic services, such as electricity.”
© UNHCR/SALEH BAHULAIS
© 2021 United Nations High Commissioner for RefugeesAll rights reserved. Reproductions and translations are authorized, provided UNHCR is acknowledged as the source.
Statistics and Demographics SectionUNHCR Global Data ServiceUN City, Marmorvej 512100 Copenhagen, [email protected]
This document along with further information on global displacement is available on UNHCR’s statistics website:https://www.unhcr.org/refugee-statistics
GLOBAL TRENDSFORCED DISPLACEMENT IN 2020
Related Documents