PREDICTIVE VALUE OF ORTHOGRAPHIC PROCESSING FOR SPELLING PROFICIENCY By Hannah Krimm Thesis Submitted to the Faculty of the Vanderbilt University School of Medicine in partial fulfillment of the requirements for the degree of MASTER OF SCIENCE in Hearing and Speech Sciences May, 2013 Nashville, Tennessee Approved: C. Melanie Schuele, PhD (Chair) Donald Compton, PhD Linda Larrivee, PhD Krystal L. Werfel, PhD

Welcome message from author
This document is posted to help you gain knowledge. Please leave a comment to let me know what you think about it! Share it to your friends and learn new things together.
Transcript

PREDICTIVE VALUE OF ORTHOGRAPHIC PROCESSING
FOR SPELLING PROFICIENCY
By
Hannah Krimm
Thesis
Submitted to the Faculty of the
Vanderbilt University School of Medicine
in partial fulfillment of the requirements
for the degree of
MASTER OF SCIENCE
in
Hearing and Speech Sciences
May, 2013
Nashville, Tennessee
Approved:
C. Melanie Schuele, PhD (Chair)
Donald Compton, PhD
Linda Larrivee, PhD
Krystal L. Werfel, PhD
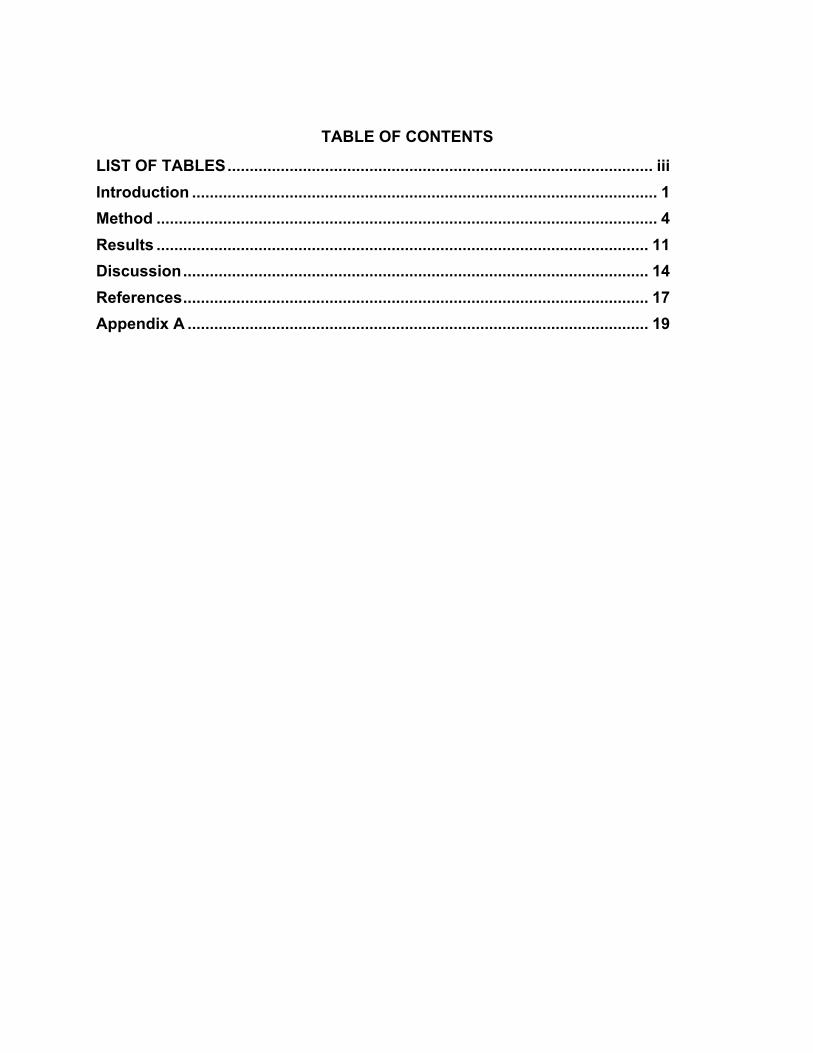
TABLE OF CONTENTS
LIST OF TABLES ................................................................................................ iii Introduction ......................................................................................................... 1 Method ................................................................................................................. 4 Results ............................................................................................................... 11 Discussion ......................................................................................................... 14 References ......................................................................................................... 17 Appendix A ........................................................................................................ 19

iii
LIST OF TABLES
Table Page
1 Study Measures……………………………………………………………….. 5
2 Order of Administration for Measures Administered in Groups………….. 9
3 Descriptive Statistics………………………………………………………….. 11
4 Intercorrelations among the Variables………………………………………. 12
5 Hierarchical Regression for Real Word Spelling…………………………… 12
6 Hierarchical Regression for Nonsense Word Spelling…………………….. 13

1
Introduction
Although reading proficiency is considered necessary for academic success, the
impact of spelling proficiency on academic achievement is often overlooked. Poor
spelling proficiency can contribute to related difficulty in written composition. According
to the Cognitive Process Theory of Writing (Flower & Hayes, 1981), writing involves
dividing limited cognitive resources (e.g., attention) between simultaneously planning,
translating (also called transcribing), and reviewing a composition. If a disproportional
amount of cognitive resources must be devoted to any one component, the other
components will suffer. The need to focus on constructing correct spellings pilfers
cognitive resources from planning and reviewing so that students who struggle with
spelling also struggle to produce effective writing at the text level (Flower & Hayes,
1981).
In addition to hindering the quality of an individual’s writing, poor spelling
proficiency can influence teachers’ perceptions of a student’s capabilities, which could
lead to reduced academic opportunities for the poor speller. Marshall and Powers
(1969) found that when prospective teachers were instructed to grade essays strictly
based on content, they assigned lower grades to essays that contained spelling errors
compared to essays with the same content but no spelling errors. Spelling errors can
also influence peer’s perceptions of a person’s general capability. Figueredo and
Varnhagen (2005) reported that college students had more negative perceptions about
the author of a written work that contained spelling errors than about the author of a
written work that did not contain spelling errors. The presence of misspellings was

2
associated with negative ratings of the author’s writing ability, general intelligence, and
attention to detail.
Given the importance of spelling proficiency to academic success, researchers
and educators must determine the most efficient and effective methods to teach
spelling. Elucidating the linguistic basis of spelling, including the relative contributions of
phonological awareness, orthographic knowledge, and morphological knowledge, is a
step towards developing effective instruction, but relatively few studies have aimed to
do so (Apel, Wilson-Fowler, Brimo, & Perrin, 2012; Cassar & Treiman, 1997; Walker &
Hauerwas, 2006; Werfel, 2012). The construct of interest for the current study is
orthographic knowledge which refers to an individual’s general knowledge of
orthographic conventions (Apel, 2011; Cassar & Treiman, 1997). Overall orthographic
knowledge is comprised of orthographic pattern knowledge and mental graphemic
representations (MGRs). Orthographic pattern knowledge refers to an individual’s
knowledge of the 240 or more graphemes that represent English phonemes and of
permissible and impermissible ways of combining those graphemes to represent words.
Orthographic knowledge includes knowledge of the alphabetic principle, constraints on
letter combinations and positions (e.g., ck can occur in the middle or at the end of a
word but not at the beginning), and conventions such as the long vowel sound
represented by vowel-consonant-e combinations. MGRs are the orthographic equivalent
of phonological representations; they are stored representations of words as whole or
partial graphemic units. As with a phonological representation, a person can have a
complete and accurate representation (e.g., jump), an incomplete representation (e.g.,
ju_p), or an inaccurate representation (e.g., gump) stored (Apel, 2011).

3
Studies examining the linguistic underpinnings of spelling proficiency have
reported conflicted findings related to orthographic knowledge. Werfel (2012) reported
that for a sample of second, third, and fourth graders, both orthographic knowledge and
morphological knowledge predicted spelling proficiency. Apel et al. (2012) reported that
for a sample of second and third graders, only morphological knowledge (called
awareness in the article) predicted spelling proficiency. Walker and Hauerwas (2006)
reported that different linguistic skills predict spelling at different grade levels. In first
grade phonological awareness and orthographic knowledge predicted spelling. In
second grade, orthographic knowledge predicted spelling. By third grade, morphological
knowledge, not orthographic knowledge predicted spelling.
Given the lack of consensus within the literature, it may also be beneficial to
investigate orthographic processing, or the efficiency with which one accesses and uses
orthographic knowledge (Apel, 2011). Orthographic processing may be more influential
for spelling proficiency than the mere presence or absence of knowledge. The basis for
this supposition is that automaticity often is required to achieve proficiency with learned
skills (see Samuels & Flor, 1997 for a review). For example, skilled reading requires
automatic word recognition; the knowledge of how to decode words is not sufficient for
an individual to become a skilled reader (LaBerge & Samuels, 1974). Likewise, it is
hypothesized that to be a skilled speller an individual must not only possess
orthographic knowledge, he must be able to quickly access and use that knowledge to
produce accurate orthographic representations.
The purpose of this study was to collect preliminary data to ascertain whether it
may be fruitful to investigate orthographic processing as a predictor of spelling

4
proficiency. Two research questions were addressed: (a) Is orthographic processing a
better predictor of real word spelling proficiency than orthographic pattern knowledge?
and (b) Is orthographic processing a better predictor of nonsense word spelling
proficiency than orthographic pattern knowledge?
It was hypothesized that orthographic processing would better predict real word
spelling proficiency compared to orthographic pattern knowledge. It was also
hypothesized that orthographic processing would better predict nonsense word spelling
proficiency compared to orthographic pattern knowledge. If orthographic processing is a
better predictor of spelling proficiency than orthographic pattern knowledge, the findings
could guide further research towards developing more effective methods of spelling
instruction. Future research could investigate whether or not orthographic processing is
a malleable factor and whether interventions aimed towards improving orthographic
processing could improve spelling outcomes.
Because the purpose of this study was exploratory, the sample was small. Power
was calculated as .44 for real word spelling and .15 for nonsense word spelling. Data
from an additional 24 participants would fully power the study for predictive value of
orthographic pattern knowledge and orthographic processing for real words.
Method
The Vanderbilt University Institutional Review Board approved the methods used
in the study.
Participants
Twenty-two third grade children (n = 14 males) who attended two religious-
affiliated private schools in Nashville, TN participated in the study. The mean age of the

5
participants was 9;1 (range 8;6 – 9;10). Included participants were monolingual
speakers of English who demonstrated typical language abilities and typical word-
recognition skills. Two children were eliminated from the participant pool because they
did not meet inclusionary criterion (one child did not meet word recognition criteria, one
child was reported by parents to be bilingual). Average maternal education level was 16
years (range 12 to 16+ years).
Measures
Six study measures were administered including two inclusionary measures, two
predictor measures, and two outcome measures. See Table 1 for a description of study
measures.
Table 1. Study Measures
Variable Measure Type Administration Expressive Language SPELT-3 Inclusionary Individual
Word Recognition TOWRE-2 Inclusionary Individual Orthographic Pattern
Knowledge OCT-A Predictor Group
Orthographic Processing Reaction time Predictor Individual Real Word Spelling TWS-4 Outcome Group
Nonsense Word Spelling Nonsense word spelling assessment Outcome Group
Note. SPELT-3 = Structured Photographic Expressive Language Test – 3rd ed. (Dawson et al., 2003); TOWRE-2 = Test of Word Reading Efficiency – 2nd ed. (Torgesen et al., 2012); OCT-A = Orthographic Constraints Test – Adapted, adapted by the author from Treiman (1993); TWS-4 = Test of Written Spelling – 4th ed. (Larsen et al., 1999); Nonsense word spelling assessment stimuli from Campbell (1985)
Inclusionary measures. Two inclusionary measures were administered to
ensure that participants had typical oral language abilities and typical word recognition
skills. The Structured Photographic Expressive Language Test - Third Edition (SPELT-
3; Dawson, Stout, & Eyer, 2003) measures expressive language abilities. The SPELT-3

6
taps morphology and syntax skills by eliciting word, phrase, and sentence-level
responses to verbal prompts accompanied by picture cards. Participants were required
to achieve a standard score of 85 to be included in the study.
The Test of Word Reading Efficiency - Second Edition (TOWRE-2; Torgesen,
Wagner, & Rashotte, 2012) measures word recognition skills. The TOWRE-2 is a timed
test comprised of two subtests, sight word efficiency (SWE) and phonemic decoding
efficiency (PDE), that require participants to read aloud lists of words and nonsense
words, respectively, of increasing difficulty. The test yields a standard score for each
subtest, as well as a composite total word reading efficiency (TWRE) score. Participants
were required to achieve a TWRE standard score of 85 to be included in the study.
Dependent measures. The study protocol included four dependent measures:
two predictor measures and two outcome measures. The predictor measures assessed
orthographic pattern knowledge and orthographic processing. The outcome measures
assessed real word and nonsense word spelling proficiency.
Predictor measures. The Orthographic Constraints Test – Adapted (OCT-A)
assessed orthographic pattern knowledge. We adapted the Orthographic Constraints
Test (OCT; 16 items) developed by Treiman (1993) to create the OCT-A. Because
participants in the current study were third graders and Treiman’s OCT was developed
for a study with first graders, items were added to the OCT to assess more advanced
aspects of spelling (Templeton & Bear, 2005). The OCT-A is an untimed paper and
pencil task that includes 26 items. Each item consists of a pair of nonsense words, and
participants circle which of the two nonsense words looks more like a real word (e.g.,
ffeb vs. beff). See Appendix A for test stimuli.

7
A computerized reaction-time measure assessed orthographic processing.
Reaction time on orthographic choice tasks has been used previously in the literature to
assess orthographic processing (Cunningham & Stanovich, 1990). The reaction time
measure contained items similar in format to the OCT-A, but assessed a more limited
range of orthographic patterns. The measure only assessed orthographic patterns that
third-grade students were expected to have mastered (e.g. conventions for using c, k, or
ck; Templeton & Bear, 2005) because the items needed to be ones for which
participants could achieve nearly 100% accuracy. The test contained 25 items, each
consisting of a pair of nonsense words. The items were presented one by one on a
computer screen, and participants were asked to identify which nonsense word in each
pair looked more like a real word. Participants responded by pressing a button on the
keyboard to correspond with their choice. Because this task is a measure of processing
efficiency, participants were instructed to make their choice as quickly as possible.
Outcome measures. Two measures assessed spelling proficiency. One
measure assessed real word spelling proficiency and one assessed nonsense word
spelling proficiency.
The Test of Written Spelling - Fourth Edition (TWS-4; Larsen et al., 1999)
assessed spelling proficiency for real words. The test consists of 50 real words of
increasing spelling difficulty (e.g., less transparent orthographic patterns, multisyllabic
words, multimorphemic words). For each item, the examiner reads the word aloud,
reads it in a sentence, and then repeats the word.
A nonsense word spelling test assessed nonsense word spelling proficiency,
which mimics spelling of words the child has never encountered before in print. The test

8
developed for this study was comprised of the stimuli used in a spelling study by
Campbell (1985). The majority of the nonsense words were monosyllabic and followed
the consonant, vowel, consonant (CVC) phonological form. Some items followed the
CCVC or CVCC form. The test contained 65 nonsense words that students spelled from
dictation. See Appendix B for test stimuli.
Procedures
Testing was completed in March, 2013 at the students’ schools. Measures were
administered by a certified speech-language pathologist (Werfel) and a speech-
language pathology masters student (primary investigator; PI) who were familiar with
the tests and followed test protocol sheets.
Each participant completed two assessment sessions. The measures in the first
session (SPELT-3, TOWRE-2, reaction time) were administered individually. The
inclusionary measures (SPELT-3 and TOWRE-2) were administered with standard
administration and scoring procedures as described in the test manuals (Dawson et al.,
2003; Torgesen et al., 2012). The orthographic processing measure was also
administered during the first session. Order of administration of these three tasks was
randomly assigned for each child using a random number generator. There were six
assessment sequences.
The second session involved group administration of the remaining measures
(TWS-4, OCT-A, nonsense word spelling test). Children were divided into small groups
of not more than eight persons. The OCT-A was the second measure administered to
all groups. Order of administration of the TWS-4 and the nonsense word spelling test
was counterbalanced. See Table 2 for an illustration of group administration.

9
Table 2. Sequence of Administration for Measures Administered in Groups.
Group size First Second Third n = 7 TWS-4 OCT-A Nonsense word spelling n = 8 Nonsense word spelling OCT-A TWS-4 n = 7 TWS-4 OCT-A Nonsense word spelling
Note. OCT-A = Orthographic Constraints Test – Adapted, adapted by the author from Treiman (1993); TWS-4 = Test of Written Spelling – 4th ed. (Larsen et al., 1999)
Predictor measures. For the OCT-A, participants were instructed verbally to
circle the nonsense word in each pair that looks more like a real word. Participants were
given as much time as needed to complete the OCT-A.
The reaction time measure was presented using E-prime software (Psychology
Software Tools, n.d.) on an Asus Eee PC 1005HA netbook with a 10.1 inch screen.
Instructions for the task appeared on the screen and were read aloud by the examiner
to the participant. Stimuli were presented as black text in Arial font on a white
background. A fixation cross appeared between trials and participants were instructed
to keep their fingers on the response keys throughout the test. Response keys were
colored and participants were instructed to press the green key (d key) if the correct
answer was on the left side of the screen and the red key (l key) if the correct answer
was on the right side of the screen. The measure consisted of 25 items plus five
unanalyzed practice items. For each participant, items were presented in a different,
random order determined by the program. The position of the correct answer for any
given item was randomly determined by the program, but the correct answer appeared
on the left side of the screen for 50% of the trials and on the right side of the screen for
50% of the trials.

10
Participants completed five practice trials. Mean accuracy on the practice trials
was 90% (range 60% – 100%; standard deviation 11%). Speed and accuracy feedback
appeared on the screen after each practice trial. High levels of accuracy are required for
reaction time measures because incorrect responses cannot be analyzed. After the
practice trials, the instructions were repeated and participants completed the test trials.
Mean accuracy on the test trials was 86.36% (range 60% - 100%; standard deviation
11%). No feedback was provided on the test trials.
Outcome measures. The TWS-4 was administered using standard
administration procedures described in the manual (Larsen et al., 1999) with the
exception of discontinuing when a ceiling is reached. All 50 items were administered for
ease of group administration. Repetitions of stimuli were provided when requested by
any participant within the group. After the testing session, responses were scored as
correct or incorrect. Scoring was discontinued when a ceiling was reached.
For each item on the nonsense word spelling test, the examiner dictated the item
number, said the word aloud, and repeated the word aloud. Items were repeated when
requested by any participant within the group. Only 63 of the 65 items were scored
because two test items occur twice. The first instance of each repeated item was
scored. All orthographically acceptable answers were scored as correct; hence, there
were multiple correct answers for many of the items. The PI generated a key of
orthographically legal spellings for each word, which was checked by an experienced
spelling researcher (Werfel). A research assistant scored the tests using the key. The
research assistant generated a list of child errors. The PI reviewed the list and identified
orthographically legal child spellings that were not contained in the original key. The
11
original key was revised to include the orthographically legal spellings and an
experienced spelling researcher (Werfel) checked the revised key. The PI re-scored all
nonsense word spelling tests to yield the final data set.
Results
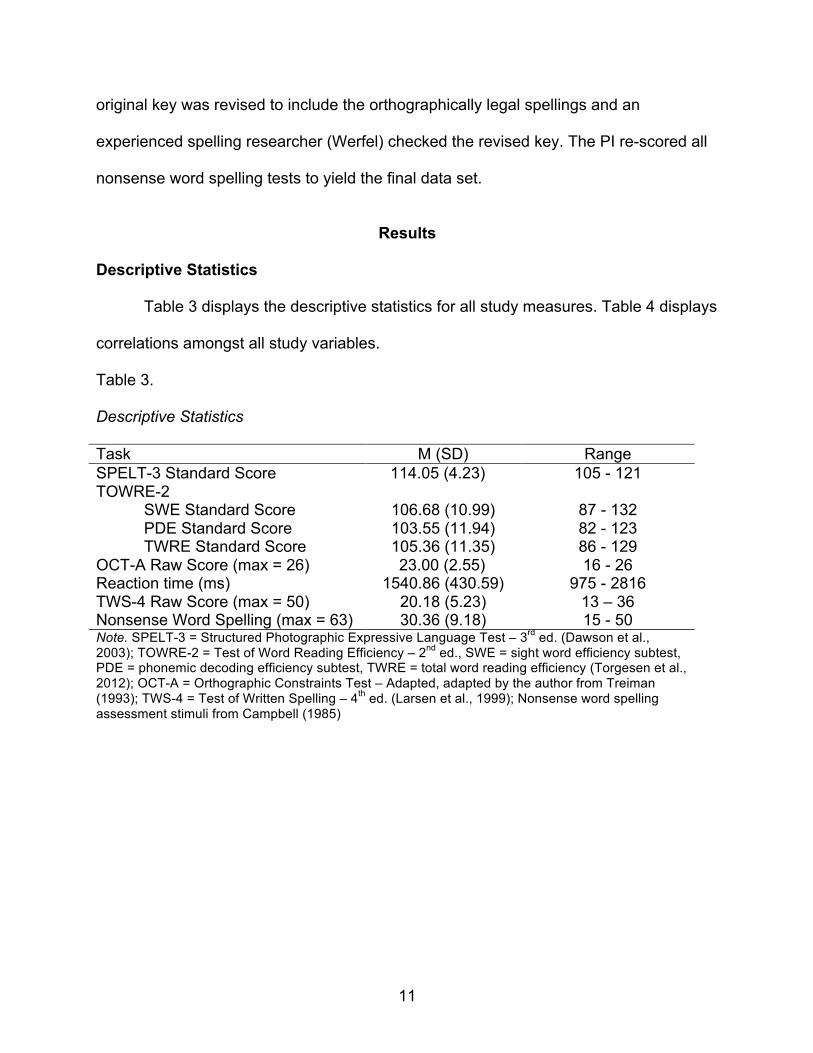
Descriptive Statistics
Table 3 displays the descriptive statistics for all study measures. Table 4 displays
correlations amongst all study variables.
Table 3. Descriptive Statistics Task M (SD) Range SPELT-3 Standard Score 114.05 (4.23) 105 - 121 TOWRE-2
SWE Standard Score 106.68 (10.99) 87 - 132 PDE Standard Score 103.55 (11.94) 82 - 123 TWRE Standard Score 105.36 (11.35) 86 - 129
OCT-A Raw Score (max = 26) 23.00 (2.55) 16 - 26 Reaction time (ms) 1540.86 (430.59) 975 - 2816 TWS-4 Raw Score (max = 50) 20.18 (5.23) 13 – 36 Nonsense Word Spelling (max = 63) 30.36 (9.18) 15 - 50 Note. SPELT-3 = Structured Photographic Expressive Language Test – 3rd ed. (Dawson et al., 2003); TOWRE-2 = Test of Word Reading Efficiency – 2nd ed., SWE = sight word efficiency subtest, PDE = phonemic decoding efficiency subtest, TWRE = total word reading efficiency (Torgesen et al., 2012); OCT-A = Orthographic Constraints Test – Adapted, adapted by the author from Treiman (1993); TWS-4 = Test of Written Spelling – 4th ed. (Larsen et al., 1999); Nonsense word spelling assessment stimuli from Campbell (1985)

12
Table 4. Intercorrelations among the Variables
Variable 1 2 3 4 5 6 7 1. SPELT-3 2. TOWRE-2 TWRE .13 3. TOWRE-2 SWE .21 .93** 4. TOWRE-2 PDE .03 .94** .74** 5. OCT-A .00 .12 .15 .10 6. Reaction Time .04 -.05 -.02 -.07 -.06 7. TWS-4 -.09 .31 .17 .40 .38 -.22 8. Nonsense Word
Spelling -.01 .54** .36 .65** .15 .13 .48* Note. SPELT-3 = Structured Photographic Expressive Language Test – 3rd ed. (Dawson et al., 2003); TOWRE-2 = Test of Word Reading Efficiency – 2nd ed., SWE = sight word efficiency subtest, PDE = phonemic decoding efficiency subtest, TWRE = total word reading efficiency (Torgesen et al., 2012); OCT-A = Orthographic Constraints Test – Adapted, adapted by the author from Treiman (1993); TWS-4 = Test of Written Spelling – 4th ed. (Larsen et al., 1999); Nonsense word spelling assessment stimuli from Campbell (1985)
**. Correlation is significant at the 0.01 level (2-tailed). *. Correlation is significant at the 0.05 level (2-tailed).
Orthographic Pattern Knowledge and Orthographic Processing as Predictors of Spelling Proficiency
Four hierarchical regression analyses were performed to compare the relative
predictive value of orthographic pattern knowledge and orthographic processing for real
word spelling proficiency and nonsense word spelling proficiency. Results are displayed
in Table 5 for real word spelling and Table 6 for nonsense word spelling.
Table 5. Hierarchical Regressions for Real Word Spelling
Step Variable R2 R2 change p 1. Orthographic pattern knowledge .144 .144 n.s. 2. Orthographic processing .182 .038 n.s.
1. Orthographic processing .048 .048 n.s. 2. Orthographic pattern knowledge .182 .134 n.s.
13
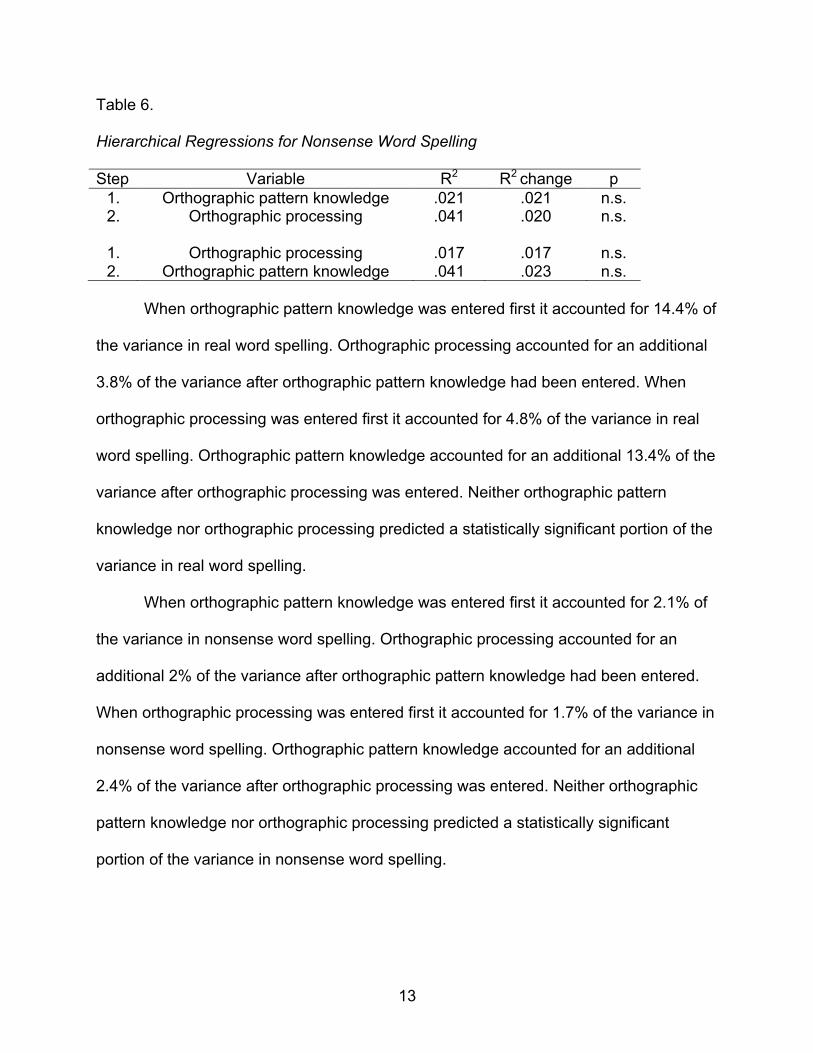
Table 6. Hierarchical Regressions for Nonsense Word Spelling
Step Variable R2 R2 change p 1. Orthographic pattern knowledge .021 .021 n.s. 2. Orthographic processing .041 .020 n.s.
1. Orthographic processing .017 .017 n.s. 2. Orthographic pattern knowledge .041 .023 n.s.
When orthographic pattern knowledge was entered first it accounted for 14.4% of
the variance in real word spelling. Orthographic processing accounted for an additional
3.8% of the variance after orthographic pattern knowledge had been entered. When
orthographic processing was entered first it accounted for 4.8% of the variance in real
word spelling. Orthographic pattern knowledge accounted for an additional 13.4% of the
variance after orthographic processing was entered. Neither orthographic pattern
knowledge nor orthographic processing predicted a statistically significant portion of the
variance in real word spelling.
When orthographic pattern knowledge was entered first it accounted for 2.1% of
the variance in nonsense word spelling. Orthographic processing accounted for an
additional 2% of the variance after orthographic pattern knowledge had been entered.
When orthographic processing was entered first it accounted for 1.7% of the variance in
nonsense word spelling. Orthographic pattern knowledge accounted for an additional
2.4% of the variance after orthographic processing was entered. Neither orthographic
pattern knowledge nor orthographic processing predicted a statistically significant
portion of the variance in nonsense word spelling.

14
Discussion
The purpose of this study was to collect preliminary data to ascertain whether it
may be fruitful to investigate orthographic processing as a predictor of spelling
proficiency. Two research questions were addressed: (a) Is orthographic processing a
better predictor of real word spelling proficiency than orthographic pattern knowledge?
and (b) Is orthographic processing a better predictor of nonsense word spelling
proficiency than orthographic pattern knowledge?
Neither orthographic pattern knowledge nor orthographic processing predicted
real word spelling proficiency. In real word spelling, orthographic pattern knowledge
accounted for 14.4% of the variance when entered first. Orthographic processing only
accounted for an additional 3.8% of the variance after orthographic pattern knowledge
had been partialed out. When orthographic processing was entered first, it accounted
for 4.8% of the variance in real word spelling. Orthographic pattern knowledge
accounted for an additional 13.4% of the variance after orthographic processing was
partialed out.
Neither orthographic pattern knowledge nor orthographic processing predicted
nonsense word spelling, and the predictors accounted for less variance than they did for
real word spelling. When orthographic pattern knowledge was entered first, it accounted
for only 2.1% of the variance. Orthographic processing accounted for an additional 2%
of the variance after orthographic pattern knowledge was partialed out. When
orthographic processing was entered first, it accounted for only 1.7% of the variance.
Orthographic pattern knowledge accounted for an additional 2.4% of the variance after
orthographic processing was partialed out.

15
The general trend within these data is that orthographic pattern knowledge
accounted for more variance in spelling proficiency than orthographic processing, but
that neither were significant predictors of real word spelling and nonsense word spelling
proficiency. The finding that neither orthographic pattern knowledge nor orthographic
processing were significant predictors of real word spelling and nonsense word spelling
proficiency is consistent with other findings in the literature. Apel et al. (2012) assessed
orthographic pattern knowledge as well as other predictors for spelling proficiency and
found only morphological knowledge (referred to by them as morphological awareness)
to uniquely predict real word spelling. Werfel (2012) found both orthographic knowledge
and morphological knowledge to uniquely predict spelling, but the measure of
orthographic knowledge used was a composite score that included both MGRs and
orthographic pattern knowledge. Additionally, Walker and Hauerwas (2006) found that
by third grade, orthographic knowledge no longer predicted spelling. Taken together,
these previous findings and the findings of the present study suggest that neither
orthographic pattern knowledge nor orthographic processing significantly influence
spelling proficiency of children in the late elementary grades.
Based on these findings, teaching spelling with a focus on orthographic patterns
may not be the most effective method of instruction, at least in the later elementary
grades. It appears that spelling may be more highly influenced by an individual’s word-
specific MGRs or their morphological knowledge than by their general knowledge of
English orthography. Although English spelling is highly regular, it is also highly complex
with words from many different languages adhering to different orthographic
conventions. Rather than attempting to teach the myriad of patterns, it may be more
16
beneficial to bolster other types of knowledge, such as morphological knowledge and
MGR-learning strategies, to improve spelling outcomes. Future research should aim to
develop effective means of instruction after further elucidating the underlying skills that
affect spelling proficiency. To assess the role of MGRs, a follow-up study is planned in
which participants will complete timed and untimed choice tasks using real words rather
than nonsense words.
Limitations
An additional limitation of the current study was that only orthographic pattern
knowledge and orthographic processing for orthographic patterns were assessed. The
role of MGRs as a predictor was not assessed due to methodological limitations; when
nonsense words are used, researchers can be confident that pattern knowledge is
being assessed because participants will not have MGRs for words that they have
never encountered. When assessments utilize real words, however, researchers cannot
be certain whether participants made decisions based on word-specific comparison to
an established MGR or based on more general knowledge of orthographic conventions.

17
References
Apel, K. (2011). What is orthographic knowledge? Language, Speech, and Hearing Services in Schools, 42, 592-603.
Apel, K., Wilson-Fowler, E.B., Brimo, D., & Perrin, N. (2012). Metalinguistic
contributions to reading and spelling in second and third grade students. Reading and Writing, 25, 1283-1305.
Campbell, R. (1985). When children write nonwords to dictation. Journal of
Experimental Child Psychology, 40, 133-151. Cassar, M, & Treiman, Rebecca. (1997). The beginnings of orthographic knowledge:
Children's knowledge of double letters in words. Journal of Educational Psychology, 89, 631-644.
Cunningham, A.E., & Stanovich, K. (1990). Assessing print exposure and orthographic
processing skill in children: A quick measure of reading experience. Journal of Educational Psychology, 82, 733-740.
Dawson, J., Stout, C., & Eyer, J. (2003). Structured Photographic Expressive Language
Test (3rd ed.). DeKalb, IL: Janelle. Figueredo, L., & Varnhagen, C.K. (2005). Didn't you run the spell checker? Effects of
type of spelling error and use of a spell checker on perceptions of the author. Reading Psychology, 26, 441-458.
Flower, L., & Hayes, J.R. (1981). A cognitive process theory of writing. College
Composition and Communication, 32, 365-387. LaBerge, D., & Samuels, S.J. (1974). Toward a theory of automatic information
processing in reading. Cognitive Psychology, 6, 293-323. Larsen, S., Hammill, D., & Moats, L. (1999). Test of Written Spelling (4th ed.). Austin:
ProEd. Marshall, J.C., & Powers, J.M. (1969). Writing neatness, composition errors, and essay
grades. Journal of Educational Measurement, 6, 97-101. Psychology Software Tools, Inc. (n.d.). E-Prime. Sharpsburg, PA: Author. Samuels, S.J., & Flor, R.F. (1997). The importance of automaticity for developing
expertise in reading. Reading and Writing, 13, 107-121. Templeton, S., & Bear, D.R. (2005). Houghton Mifflin spelling and vocabulary: Words for
readers and writers (Vol. 1-6). Boston: Houghton Mifflin.

18
Torgesen, J., Wagner, R., & Rashotte, C. (2012). Test of Word Reading Efficiency (2nd ed.). San Antonio: Pearson.
Treiman, Rebecca. (1993). Beginning to spell: A study of first-grade children. New York:
Oxford University Press. Walker, J, & Hauerwas, L.B. (2006). Development of phonological, morphological, and
orthographic knowledge in young spellers: The case of inflected verbs. Reading and Writing, 19, 819-843.
Werfel, K.L. (2012). Contributions of linguistic knowledge to spelling performance in
children with and without SLI. Unpublished doctoral dissertation. Vanderbilt University. Nashville.
19
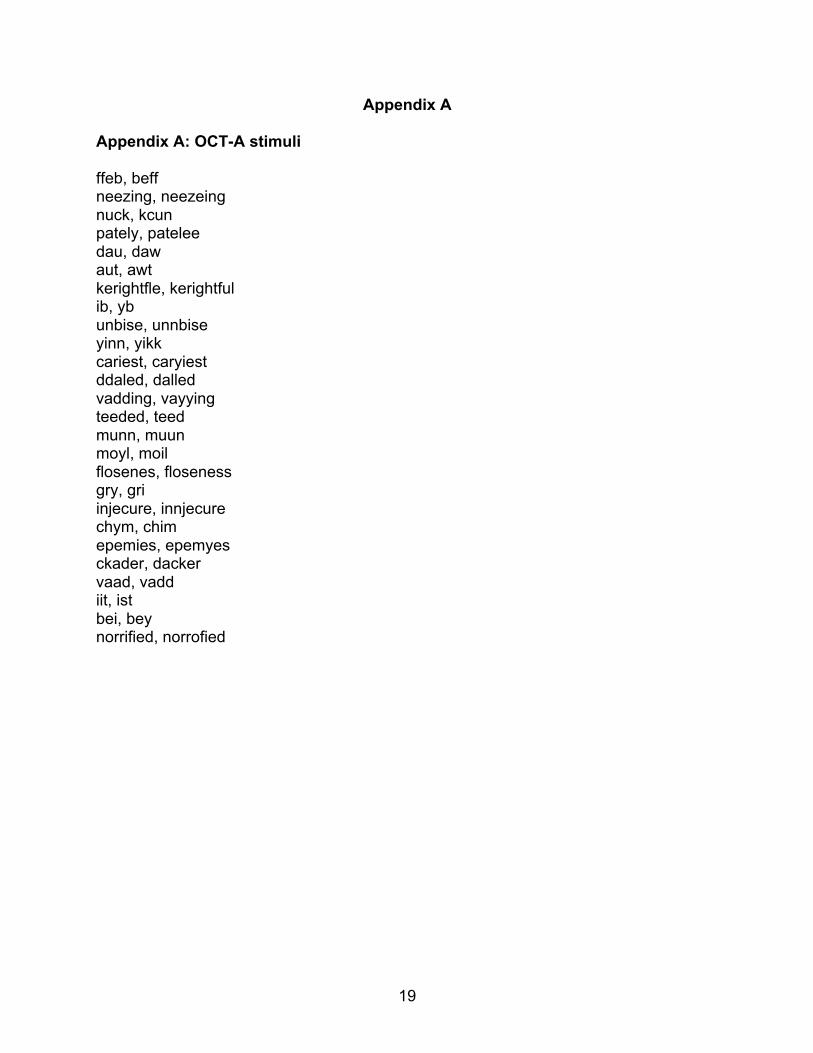
Appendix A
Appendix A: OCT-A stimuli ffeb, beff neezing, neezeing nuck, kcun pately, patelee dau, daw aut, awt kerightfle, kerightful ib, yb unbise, unnbise yinn, yikk cariest, caryiest ddaled, dalled vadding, vayying teeded, teed munn, muun moyl, moil flosenes, floseness gry, gri injecure, innjecure chym, chim epemies, epemyes ckader, dacker vaad, vadd iit, ist bei, bey norrified, norrofied

20

21

22
Related Documents