FMCG Amnish Aggarwal ([email protected])Tel:+9122 39825404/ Amit Purohit ([email protected]) +91 22 3982 5418 BSE Sensex: 9,149 S&P CNX: 2,784 3 February 2009 Slowdown in volume growth apparent now: Our concerns on the likely decline in volume growth were reflected in the 3QFY09 results with major players like HUL, Marico, and Asian Paints facing severe pressure on volumes. Discretionary spends like paints, refined edible oil, deodorants and health supplements reported lower volume growth. High penetration categories like soaps and detergents reported flat volumes due to sharp price increases and grammage reduction. However, category focused players like Britannia, Colgate, and United Spirits reported sequential improvement in volume growth. Benefit of lower crude based input price to reflect in 4QFY09: Our FMCG universe posted gross margin decline of 390bp YoY. Gross margins of large size declined just 220bp, while mid-size and small-size companies reported a gross margin decline of 830bp and 550bp respectively. Sharp decline in gross margin came as a surprise as we were expecting gross margin pressures to recede in the December quarter, particularly for companies using more of crude-based inputs. Inventories/forward covers of high cost raw materials purchased up to August/September resulted in severe margin erosion. We expect lower costs to start getting reflected in financials of 4QFY09 for users of crude-based inputs. We expect agri inputs to remain firm, which will delay margin recovery for user segments. Lower ad spend and other expenditure restrict EBITDA margin decline: Despite the 390bp decline in gross margin, our FMCG universe companies were successful in restricting a decline in EBITDA margin to 170bp (operating leverage of 220bp) by focusing on cost control measures in ad spend and other overheads. Advertising spend for the companies (excluding ITC and Asian Paints) grew by a mere 2% YoY in December 2008 (9.9% of sales in December 2008 v/s 11.4% in December 2007) v/s 12% YoY growth in September 2008. Fewer consumer activation initiatives and new launches contributed to lower ad spends. Lower growth in other expenditure also resulted in a positive operating leverage. Large size companies outperform at operating level: Mid size companies were outperforming at the operating level till September 2008. Poor performance from Asian Paints and United Spirits resulted in 34% PAT decline for mid size as against 9.3% increase for large caps and 10.3% PAT growth for small size. Large size companies in our coverage COMPANY NAME PG. Asian Paints 7 (Neutral, Rs769) Britannia Industries 8 (Buy, Rs1,382) Colgate Palmolive 9 (Buy, Rs417) Dabur India 10 (Neutral, Rs88) GlaxoSmithKline Consumer 11 (Buy, Rs600) Godrej Consumer Products 12 (Buy, Rs130) Hindustan Unilever 13 (Neutral, Rs264) ITC 14 (Buy, Rs181) Marico 15 (Buy, Rs58) Tata Tea 16 (Neutral, Rs563) United Spirits 17 (Buy, Rs560) CHANGE IN ESTIMATES FY09/CY08 FY10/CY09 NEW EPS EST % CHG. YOY GR. (%) NEW EPS EST % CHG. YOY GR. (%) Asian Paints 39.1 -21.6 -10.2 46.7 -19.1 19.6 United Spirits 33.7 -29.2 0.0 47.5 -29.7 40.9 Godrej Consumer 6.2 -12.5 -11.9 8.3 -11.1 33.1 GSK Consumer 44.8 4.1 15.8 53.9 1.9 20.4 Source: MOSL Sector Update

Welcome message from author
This document is posted to help you gain knowledge. Please leave a comment to let me know what you think about it! Share it to your friends and learn new things together.
Transcript
FMCG
Amnish Aggarwal ([email protected])Tel:+9122 39825404/ Amit Purohit ([email protected]) +91 22 3982 5418
BSE Sensex: 9,149 S&P CNX: 2,784 3 February 2009
Slowdown in volume growth apparent now: Our concerns on the likely decline involume growth were reflected in the 3QFY09 results with major players like HUL, Marico,and Asian Paints facing severe pressure on volumes. Discretionary spends like paints,refined edible oil, deodorants and health supplements reported lower volume growth. Highpenetration categories like soaps and detergents reported flat volumes due to sharp priceincreases and grammage reduction. However, category focused players like Britannia,Colgate, and United Spirits reported sequential improvement in volume growth.
Benefit of lower crude based input price to reflect in 4QFY09: Our FMCG universeposted gross margin decline of 390bp YoY. Gross margins of large size declined just 220bp,while mid-size and small-size companies reported a gross margin decline of 830bp and550bp respectively. Sharp decline in gross margin came as a surprise as we were expectinggross margin pressures to recede in the December quarter, particularly for companiesusing more of crude-based inputs. Inventories/forward covers of high cost raw materialspurchased up to August/September resulted in severe margin erosion. We expect lowercosts to start getting reflected in financials of 4QFY09 for users of crude-based inputs.We expect agri inputs to remain firm, which will delay margin recovery for user segments.
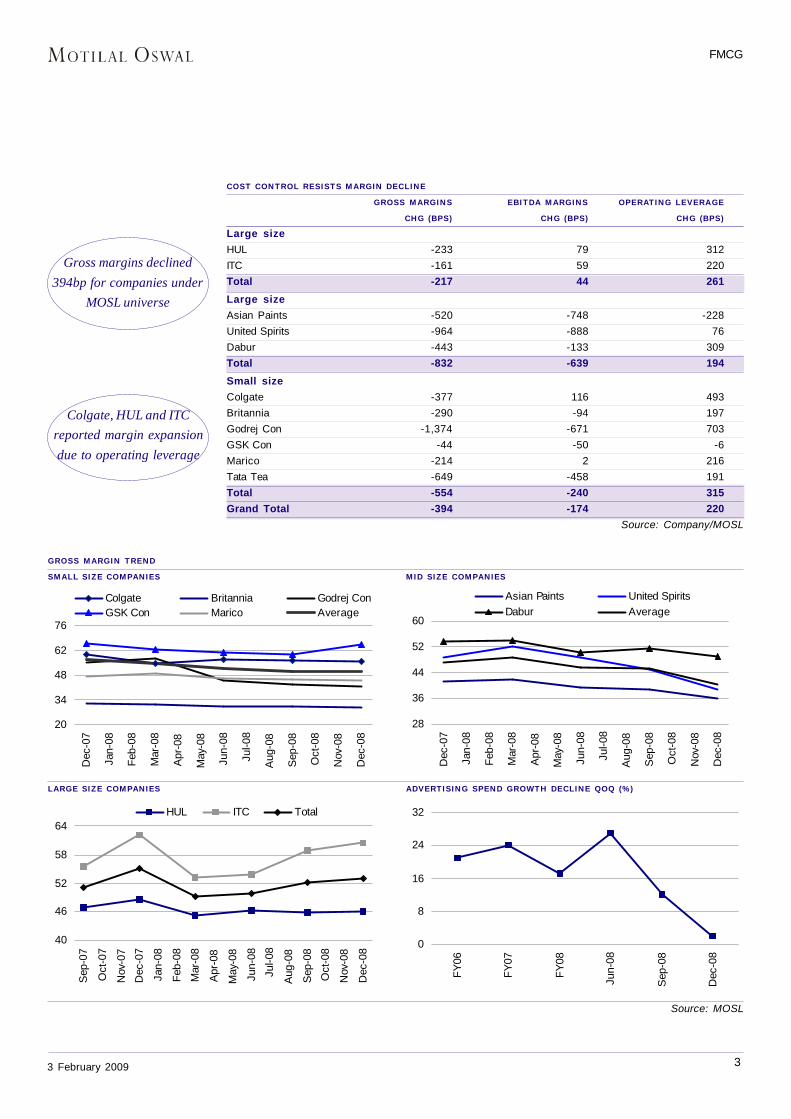
Lower ad spend and other expenditure restrict EBITDA margin decline: Despitethe 390bp decline in gross margin, our FMCG universe companies were successful inrestricting a decline in EBITDA margin to 170bp (operating leverage of 220bp) by focusingon cost control measures in ad spend and other overheads. Advertising spend for thecompanies (excluding ITC and Asian Paints) grew by a mere 2% YoY in December 2008(9.9% of sales in December 2008 v/s 11.4% in December 2007) v/s 12% YoY growth inSeptember 2008. Fewer consumer activation initiatives and new launches contributed tolower ad spends. Lower growth in other expenditure also resulted in a positive operatingleverage.
Large size companies outperform at operating level: Mid size companies wereoutperforming at the operating level till September 2008. Poor performance from AsianPaints and United Spirits resulted in 34% PAT decline for mid size as against 9.3% increasefor large caps and 10.3% PAT growth for small size. Large size companies in our coverage
COMPANY NAME PG.
Asian Paints 7(Neutral, Rs769)
Britannia Industries 8(Buy, Rs1,382)
Colgate Palmolive 9(Buy, Rs417)
Dabur India 10(Neutral, Rs88)
GlaxoSmithKline Consumer 11(Buy, Rs600)
Godrej Consumer Products 12(Buy, Rs130)
Hindustan Unilever 13(Neutral, Rs264)
ITC 14(Buy, Rs181)
Marico 15(Buy, Rs58)
Tata Tea 16(Neutral, Rs563)
United Spirits 17(Buy, Rs560)
CHANGE IN ESTIMATESFY09/CY08 FY10/CY09
NEW EPS EST % CHG. YOY GR. (%) NEW EPS EST % CHG. YOY GR. (%)Asian Paints 39.1 -21.6 -10.2 46.7 -19.1 19.6United Spirits 33.7 -29.2 0.0 47.5 -29.7 40.9Godrej Consumer 6.2 -12.5 -11.9 8.3 -11.1 33.1GSK Consumer 44.8 4.1 15.8 53.9 1.9 20.4
Source: MOSL
Sector Update
FMCG
3 February 2009 2
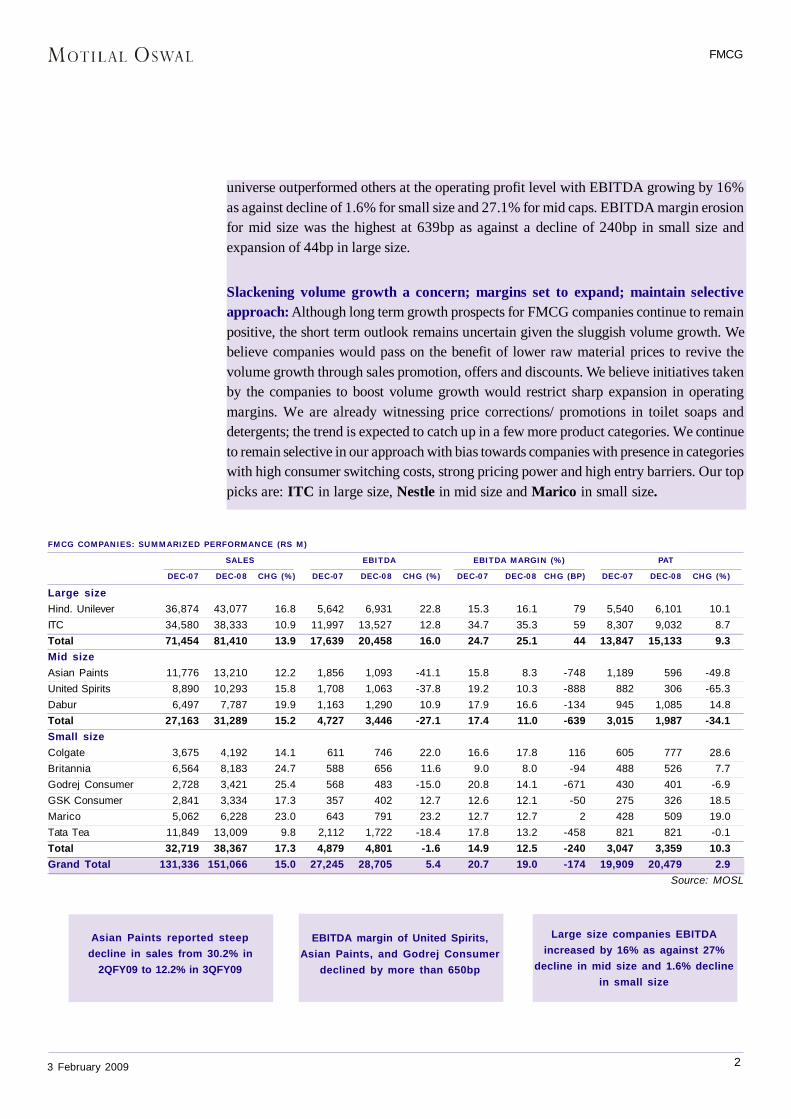
FMCG COMPANIES: SUMMARIZED PERFORMANCE (RS M)SALES EBITDA EBITDA MARGIN (%) PAT
DEC-07 DEC-08 CHG (%) DEC-07 DEC-08 CHG (%) DEC-07 DEC-08 CHG (BP) DEC-07 DEC-08 CHG (%)Large sizeHind. Unilever 36,874 43,077 16.8 5,642 6,931 22.8 15.3 16.1 79 5,540 6,101 10.1ITC 34,580 38,333 10.9 11,997 13,527 12.8 34.7 35.3 59 8,307 9,032 8.7Total 71,454 81,410 13.9 17,639 20,458 16.0 24.7 25.1 44 13,847 15,133 9.3Mid sizeAsian Paints 11,776 13,210 12.2 1,856 1,093 -41.1 15.8 8.3 -748 1,189 596 -49.8United Spirits 8,890 10,293 15.8 1,708 1,063 -37.8 19.2 10.3 -888 882 306 -65.3Dabur 6,497 7,787 19.9 1,163 1,290 10.9 17.9 16.6 -134 945 1,085 14.8Total 27,163 31,289 15.2 4,727 3,446 -27.1 17.4 11.0 -639 3,015 1,987 -34.1Small sizeColgate 3,675 4,192 14.1 611 746 22.0 16.6 17.8 116 605 777 28.6Britannia 6,564 8,183 24.7 588 656 11.6 9.0 8.0 -94 488 526 7.7Godrej Consumer 2,728 3,421 25.4 568 483 -15.0 20.8 14.1 -671 430 401 -6.9GSK Consumer 2,841 3,334 17.3 357 402 12.7 12.6 12.1 -50 275 326 18.5Marico 5,062 6,228 23.0 643 791 23.2 12.7 12.7 2 428 509 19.0Tata Tea 11,849 13,009 9.8 2,112 1,722 -18.4 17.8 13.2 -458 821 821 -0.1Total 32,719 38,367 17.3 4,879 4,801 -1.6 14.9 12.5 -240 3,047 3,359 10.3Grand Total 131,336 151,066 15.0 27,245 28,705 5.4 20.7 19.0 -174 19,909 20,479 2.9
Source: MOSL
Asian Paints reported steepdecline in sales from 30.2% in
2QFY09 to 12.2% in 3QFY09
EBITDA margin of United Spirits,Asian Paints, and Godrej Consumer
declined by more than 650bp
Large size companies EBITDAincreased by 16% as against 27%
decline in mid size and 1.6% declinein small size
universe outperformed others at the operating profit level with EBITDA growing by 16%as against decline of 1.6% for small size and 27.1% for mid caps. EBITDA margin erosionfor mid size was the highest at 639bp as against a decline of 240bp in small size andexpansion of 44bp in large size.
Slackening volume growth a concern; margins set to expand; maintain selectiveapproach: Although long term growth prospects for FMCG companies continue to remainpositive, the short term outlook remains uncertain given the sluggish volume growth. Webelieve companies would pass on the benefit of lower raw material prices to revive thevolume growth through sales promotion, offers and discounts. We believe initiatives takenby the companies to boost volume growth would restrict sharp expansion in operatingmargins. We are already witnessing price corrections/ promotions in toilet soaps anddetergents; the trend is expected to catch up in a few more product categories. We continueto remain selective in our approach with bias towards companies with presence in categorieswith high consumer switching costs, strong pricing power and high entry barriers. Our toppicks are: ITC in large size, Nestle in mid size and Marico in small size.
FMCG
3 February 2009 3
GROSS MARGIN TRENDSMALL SIZE COMPANIES MID SIZE COMPANIES
LARGE SIZE COMPANIES ADVERTISING SPEND GROWTH DECLINE QOQ (%)
Source: MOSL
COST CONTROL RESISTS MARGIN DECLINEGROSS MARGINS EBITDA MARGINS OPERATING LEVERAGE
CHG (BPS) CHG (BPS) CHG (BPS)Large sizeHUL -233 79 312ITC -161 59 220Total -217 44 261
Large sizeAsian Paints -520 -748 -228United Spirits -964 -888 76Dabur -443 -133 309Total -832 -639 194
Small sizeColgate -377 116 493Britannia -290 -94 197Godrej Con -1,374 -671 703GSK Con -44 -50 -6Marico -214 2 216Tata Tea -649 -458 191Total -554 -240 315Grand Total -394 -174 220
Source: Company/MOSL
Colgate, HUL and ITCreported margin expansiondue to operating leverage
Gross margins declined394bp for companies under
MOSL universe
20
34
48
62
76
Dec
-07
Jan-
08
Feb-
08
Mar
-08
Apr
-08
May
-08
Jun-
08
Jul-0
8
Aug
-08
Sep
-08
Oct
-08
Nov
-08
Dec
-08
Colgate Britannia Godrej ConGSK Con Marico Average
28
36
44
52
60
Dec
-07
Jan-
08
Feb-
08
Mar
-08
Apr
-08
May
-08
Jun-
08
Jul-0
8
Aug
-08
Sep
-08
Oct
-08
Nov
-08
Dec
-08
Asian Paints United SpiritsDabur Average
40
46
52
58
64
Sep
-07
Oct
-07
Nov
-07
Dec
-07
Jan-
08
Feb-
08
Mar
-08
Apr
-08
May
-08
Jun-
08
Jul-0
8
Aug
-08
Sep
-08
Oct
-08
Nov
-08
Dec
-08
HUL ITC Total
0
8
16
24
32
FY06
FY07
FY08
Jun-
08
Sep
-08
Dec
-08
FMCG
3 February 2009 4
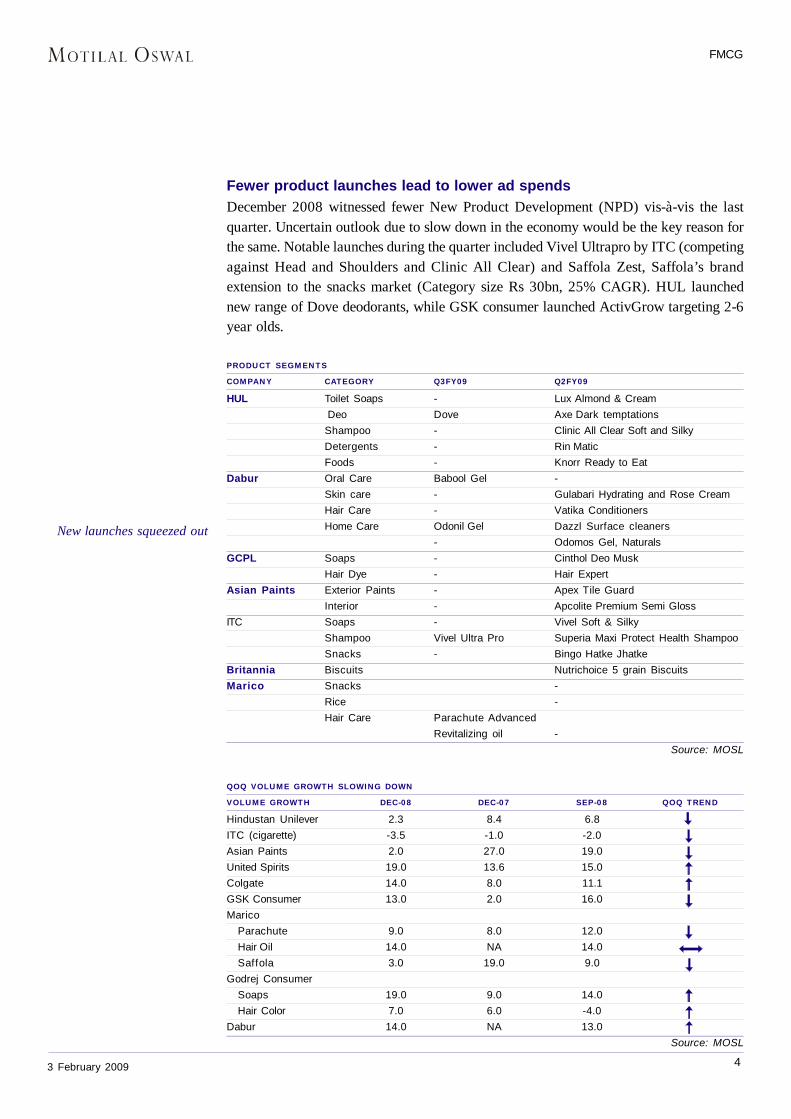
Fewer product launches lead to lower ad spendsDecember 2008 witnessed fewer New Product Development (NPD) vis-à-vis the lastquarter. Uncertain outlook due to slow down in the economy would be the key reason forthe same. Notable launches during the quarter included Vivel Ultrapro by ITC (competingagainst Head and Shoulders and Clinic All Clear) and Saffola Zest, Saffola’s brandextension to the snacks market (Category size Rs 30bn, 25% CAGR). HUL launchednew range of Dove deodorants, while GSK consumer launched ActivGrow targeting 2-6year olds.
PRODUCT SEGMENTSCOMPANY CATEGORY Q3FY09 Q2FY09HUL Toilet Soaps - Lux Almond & Cream
Deo Dove Axe Dark temptations Shampoo - Clinic All Clear Soft and Silky Detergents - Rin Matic
Foods - Knorr Ready to EatDabur Oral Care Babool Gel -
Skin care - Gulabari Hydrating and Rose CreamHair Care - Vatika Conditioners
Home Care Odonil Gel Dazzl Surface cleaners - Odomos Gel, NaturalsGCPL Soaps - Cinthol Deo Musk
Hair Dye - Hair ExpertAsian Paints Exterior Paints - Apex Tile Guard
Interior - Apcolite Premium Semi GlossITC Soaps - Vivel Soft & Silky
Shampoo Vivel Ultra Pro Superia Maxi Protect Health ShampooSnacks - Bingo Hatke Jhatke
Britannia Biscuits Nutrichoice 5 grain BiscuitsMarico Snacks -
Rice -Hair Care Parachute Advanced
Revitalizing oil -Source: MOSL
QOQ VOLUME GROWTH SLOWING DOWNVOLUME GROWTH DEC-08 DEC-07 SEP-08 QOQ TRENDHindustan Unilever 2.3 8.4 6.8ITC (cigarette) -3.5 -1.0 -2.0Asian Paints 2.0 27.0 19.0United Spirits 19.0 13.6 15.0Colgate 14.0 8.0 11.1GSK Consumer 13.0 2.0 16.0Marico
Parachute 9.0 8.0 12.0Hair Oil 14.0 NA 14.0Saffola 3.0 19.0 9.0
Godrej ConsumerSoaps 19.0 9.0 14.0Hair Color 7.0 6.0 -4.0
Dabur 14.0 NA 13.0Source: MOSL
New launches squeezed out
FMCG
3 February 2009 5
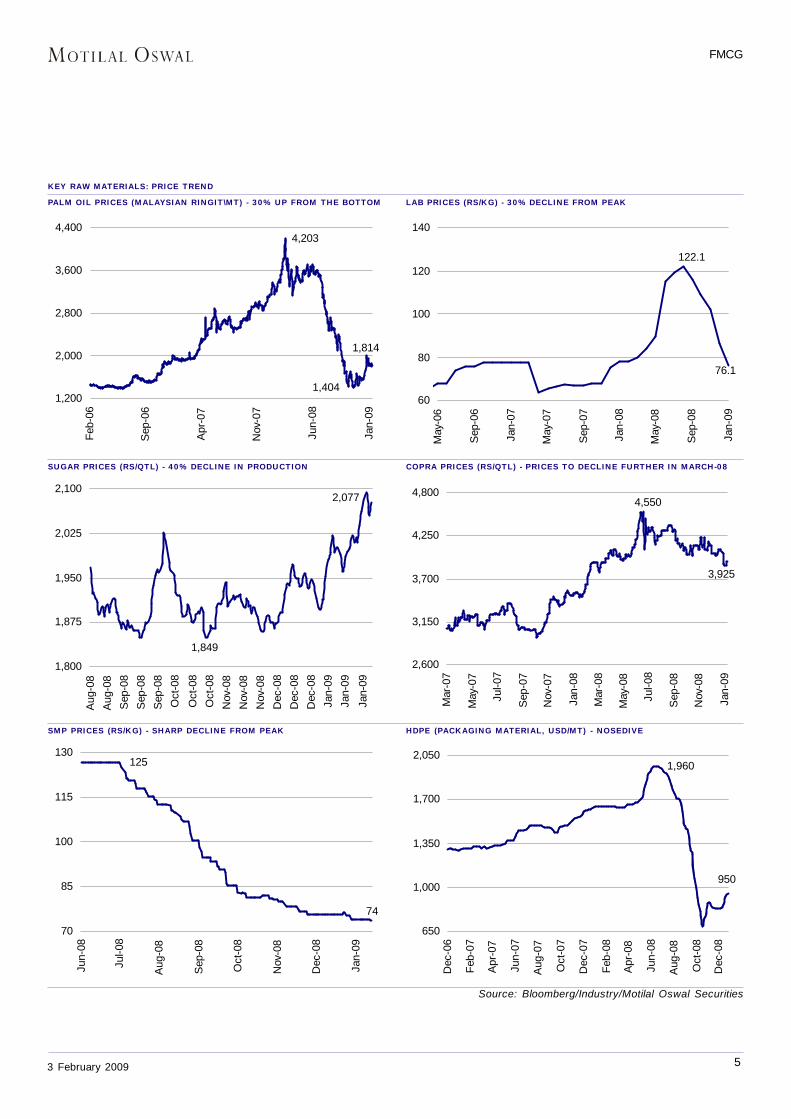
KEY RAW MATERIALS: PRICE TRENDPALM OIL PRICES (MALAYSIAN RINGIT\MT) - 30% UP FROM THE BOTTOM LAB PRICES (RS/KG) - 30% DECLINE FROM PEAK
SUGAR PRICES (RS/QTL) - 40% DECLINE IN PRODUCTION COPRA PRICES (RS/QTL) - PRICES TO DECLINE FURTHER IN MARCH-08
SMP PRICES (RS/KG) - SHARP DECLINE FROM PEAK HDPE (PACKAGING MATERIAL, USD/MT) - NOSEDIVE
Source: Bloomberg/Industry/Motilal Oswal Securities
1,814
1,404
4,203
1,200
2,000
2,800
3,600
4,400
Feb-
06
Sep
-06
Apr
-07
Nov
-07
Jun-
08
Jan-
0976.1
122.1
60
80
100
120
140
May
-06
Sep
-06
Jan-
07
May
-07
Sep
-07
Jan-
08
May
-08
Sep
-08
Jan-
09
1,849
2,077
1,800
1,875
1,950
2,025
2,100
Aug
-08
Aug
-08
Sep
-08
Sep
-08
Sep
-08
Oct
-08
Oct
-08
Oct
-08
Nov
-08
Nov
-08
Nov
-08
Dec
-08
Dec
-08
Dec
-08
Jan-
09Ja
n-09
Jan-
09
4,550
3,925
2,600
3,150
3,700
4,250
4,800
Mar
-07
May
-07
Jul-0
7
Sep
-07
Nov
-07
Jan-
08
Mar
-08
May
-08
Jul-0
8
Sep
-08
Nov
-08
Jan-
09
74
125
70
85
100
115
130
Jun-
08
Jul-0
8
Aug
-08
Sep
-08
Oct
-08
Nov
-08
Dec
-08
Jan-
09
950
1,960
650
1,000
1,350
1,700
2,050
Dec
-06
Feb-
07
Apr
-07
Jun-
07
Aug
-07
Oct
-07
Dec
-07
Feb-
08
Apr
-08
Jun-
08
Aug
-08
Oct
-08
Dec
-08
FMCG
3 February 2009 6
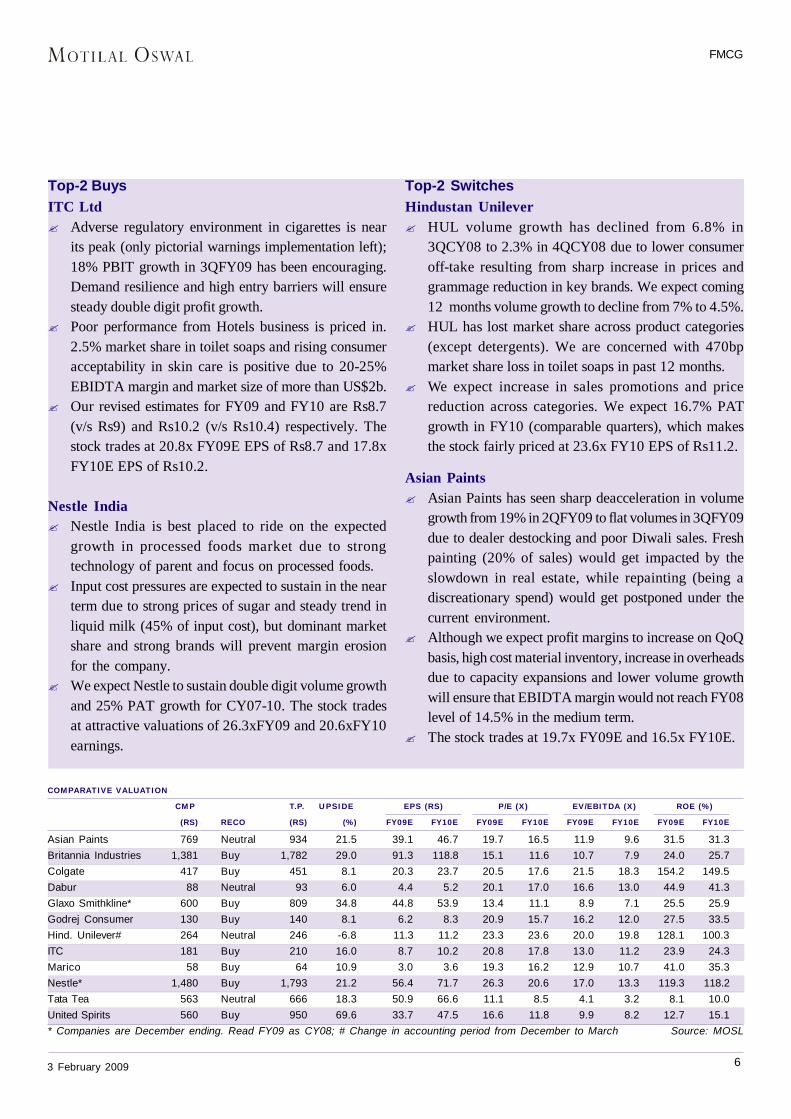
COMPARATIVE VALUATIONCMP T.P. UPSIDE EPS (RS) P/E (X) EV/EBITDA (X) ROE (%)
(RS) RECO (RS) (%) FY09E FY10E FY09E FY10E FY09E FY10E FY09E FY10EAsian Paints 769 Neutral 934 21.5 39.1 46.7 19.7 16.5 11.9 9.6 31.5 31.3Britannia Industries 1,381 Buy 1,782 29.0 91.3 118.8 15.1 11.6 10.7 7.9 24.0 25.7Colgate 417 Buy 451 8.1 20.3 23.7 20.5 17.6 21.5 18.3 154.2 149.5Dabur 88 Neutral 93 6.0 4.4 5.2 20.1 17.0 16.6 13.0 44.9 41.3Glaxo Smithkline* 600 Buy 809 34.8 44.8 53.9 13.4 11.1 8.9 7.1 25.5 25.9Godrej Consumer 130 Buy 140 8.1 6.2 8.3 20.9 15.7 16.2 12.0 27.5 33.5Hind. Unilever# 264 Neutral 246 -6.8 11.3 11.2 23.3 23.6 20.0 19.8 128.1 100.3ITC 181 Buy 210 16.0 8.7 10.2 20.8 17.8 13.0 11.2 23.9 24.3Marico 58 Buy 64 10.9 3.0 3.6 19.3 16.2 12.9 10.7 41.0 35.3Nestle* 1,480 Buy 1,793 21.2 56.4 71.7 26.3 20.6 17.0 13.3 119.3 118.2Tata Tea 563 Neutral 666 18.3 50.9 66.6 11.1 8.5 4.1 3.2 8.1 10.0United Spirits 560 Buy 950 69.6 33.7 47.5 16.6 11.8 9.9 8.2 12.7 15.1* Companies are December ending. Read FY09 as CY08; # Change in accounting period from December to March Source: MOSL
Top-2 BuysITC Ltd? Adverse regulatory environment in cigarettes is near
its peak (only pictorial warnings implementation left);18% PBIT growth in 3QFY09 has been encouraging.Demand resilience and high entry barriers will ensuresteady double digit profit growth.
? Poor performance from Hotels business is priced in.2.5% market share in toilet soaps and rising consumeracceptability in skin care is positive due to 20-25%EBIDTA margin and market size of more than US$2b.
? Our revised estimates for FY09 and FY10 are Rs8.7(v/s Rs9) and Rs10.2 (v/s Rs10.4) respectively. Thestock trades at 20.8x FY09E EPS of Rs8.7 and 17.8xFY10E EPS of Rs10.2.
Nestle India? Nestle India is best placed to ride on the expected
growth in processed foods market due to strongtechnology of parent and focus on processed foods.
? Input cost pressures are expected to sustain in the nearterm due to strong prices of sugar and steady trend inliquid milk (45% of input cost), but dominant marketshare and strong brands will prevent margin erosionfor the company.
? We expect Nestle to sustain double digit volume growthand 25% PAT growth for CY07-10. The stock tradesat attractive valuations of 26.3xFY09 and 20.6xFY10earnings.
Top-2 SwitchesHindustan Unilever? HUL volume growth has declined from 6.8% in
3QCY08 to 2.3% in 4QCY08 due to lower consumeroff-take resulting from sharp increase in prices andgrammage reduction in key brands. We expect coming12 months volume growth to decline from 7% to 4.5%.
? HUL has lost market share across product categories(except detergents). We are concerned with 470bpmarket share loss in toilet soaps in past 12 months.
? We expect increase in sales promotions and pricereduction across categories. We expect 16.7% PATgrowth in FY10 (comparable quarters), which makesthe stock fairly priced at 23.6x FY10 EPS of Rs11.2.
Asian Paints? Asian Paints has seen sharp deacceleration in volume
growth from 19% in 2QFY09 to flat volumes in 3QFY09due to dealer destocking and poor Diwali sales. Freshpainting (20% of sales) would get impacted by theslowdown in real estate, while repainting (being adiscreationary spend) would get postponed under thecurrent environment.
? Although we expect profit margins to increase on QoQbasis, high cost material inventory, increase in overheadsdue to capacity expansions and lower volume growthwill ensure that EBIDTA margin would not reach FY08level of 14.5% in the medium term.
? The stock trades at 19.7x FY09E and 16.5x FY10E.
FMCG
3 February 2009 7
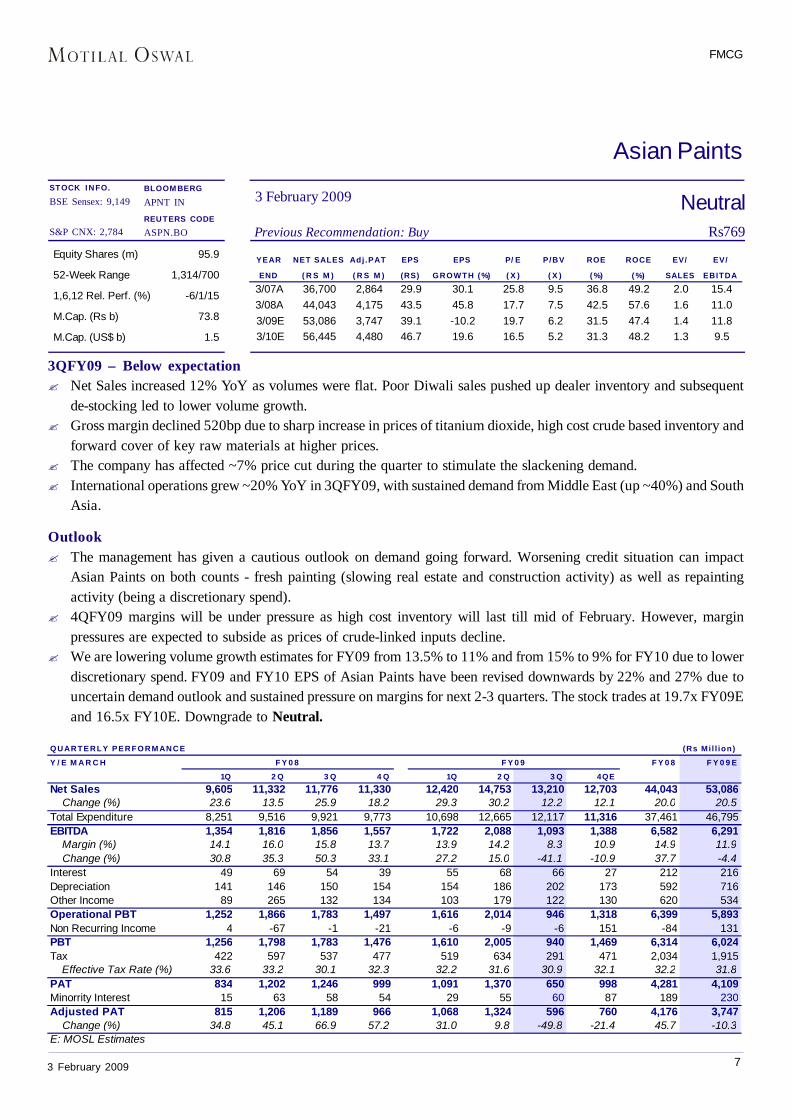
NeutralPrevious Recommendation: Buy Rs769
3 February 2009STOCK INFO.BSE Sensex: 9,149
S&P CNX: 2,784
Asian PaintsBLOOMBERGAPNT IN
REUTERS CODEASPN.BO
YEAR NET SALES Adj .PAT EPS EPS P/ E P/BV ROE ROCE EV/ EV/
END ( R S M ) ( R S M ) (RS) GROWTH (%) ( X ) ( X ) ( %) ( %) SALES EBITDA
3/07A 36,700 2,864 29.9 30.1 25.8 9.5 36.8 49.2 2.0 15.43/08A 44,043 4,175 43.5 45.8 17.7 7.5 42.5 57.6 1.6 11.03/09E 53,086 3,747 39.1 -10.2 19.7 6.2 31.5 47.4 1.4 11.83/10E 56,445 4,480 46.7 19.6 16.5 5.2 31.3 48.2 1.3 9.5
Equity Shares (m) 95.9
52-Week Range 1,314/700
1,6,12 Rel. Perf. (%) -6/1/15
M.Cap. (Rs b) 73.8
M.Cap. (US$ b) 1.5
3QFY09 – Below expectation? Net Sales increased 12% YoY as volumes were flat. Poor Diwali sales pushed up dealer inventory and subsequent
de-stocking led to lower volume growth.? Gross margin declined 520bp due to sharp increase in prices of titanium dioxide, high cost crude based inventory and
forward cover of key raw materials at higher prices.? The company has affected ~7% price cut during the quarter to stimulate the slackening demand.? International operations grew ~20% YoY in 3QFY09, with sustained demand from Middle East (up ~40%) and South
Asia.
Outlook? The management has given a cautious outlook on demand going forward. Worsening credit situation can impact
Asian Paints on both counts - fresh painting (slowing real estate and construction activity) as well as repaintingactivity (being a discretionary spend).
? 4QFY09 margins will be under pressure as high cost inventory will last till mid of February. However, marginpressures are expected to subside as prices of crude-linked inputs decline.
? We are lowering volume growth estimates for FY09 from 13.5% to 11% and from 15% to 9% for FY10 due to lowerdiscretionary spend. FY09 and FY10 EPS of Asian Paints have been revised downwards by 22% and 27% due touncertain demand outlook and sustained pressure on margins for next 2-3 quarters. The stock trades at 19.7x FY09Eand 16.5x FY10E. Downgrade to Neutral.
QUARTERLY PERFORMANCE (Rs Mi l l ion)
Y / E M A R C H F Y 0 8 F Y 0 9 E
1Q 2 Q 3 Q 4 Q 1Q 2 Q 3 Q 4QE
Net Sales 9,605 11,332 11,776 11,330 12,420 14,753 13,210 12,703 44,043 53,086 Change (%) 23.6 13.5 25.9 18.2 29.3 30.2 12.2 12.1 20.0 20.5Total Expenditure 8,251 9,516 9,921 9,773 10,698 12,665 12,117 11,316 37,461 46,795EBITDA 1,354 1,816 1,856 1,557 1,722 2,088 1,093 1,388 6,582 6,291 Margin (%) 14.1 16.0 15.8 13.7 13.9 14.2 8.3 10.9 14.9 11.9 Change (%) 30.8 35.3 50.3 33.1 27.2 15.0 -41.1 -10.9 37.7 -4.4Interest 49 69 54 39 55 68 66 27 212 216Depreciation 141 146 150 154 154 186 202 173 592 716Other Income 89 265 132 134 103 179 122 130 620 534Operational PBT 1,252 1,866 1,783 1,497 1,616 2,014 946 1,318 6,399 5,893Non Recurring Income 4 -67 -1 -21 -6 -9 -6 151 -84 131PBT 1,256 1,798 1,783 1,476 1,610 2,005 940 1,469 6,314 6,024Tax 422 597 537 477 519 634 291 471 2,034 1,915 Effective Tax Rate (%) 33.6 33.2 30.1 32.3 32.2 31.6 30.9 32.1 32.2 31.8PAT 834 1,202 1,246 999 1,091 1,370 650 998 4,281 4,109Minorrity Interest 15 63 58 54 29 55 60 87 189 230Adjusted PAT 815 1,206 1,189 966 1,068 1,324 596 760 4,176 3,747 Change (%) 34.8 45.1 66.9 57.2 31.0 9.8 -49.8 -21.4 45.7 -10.3E: MOSL Estimates
F Y 0 9F Y 0 8
FMCG
3 February 2009 8
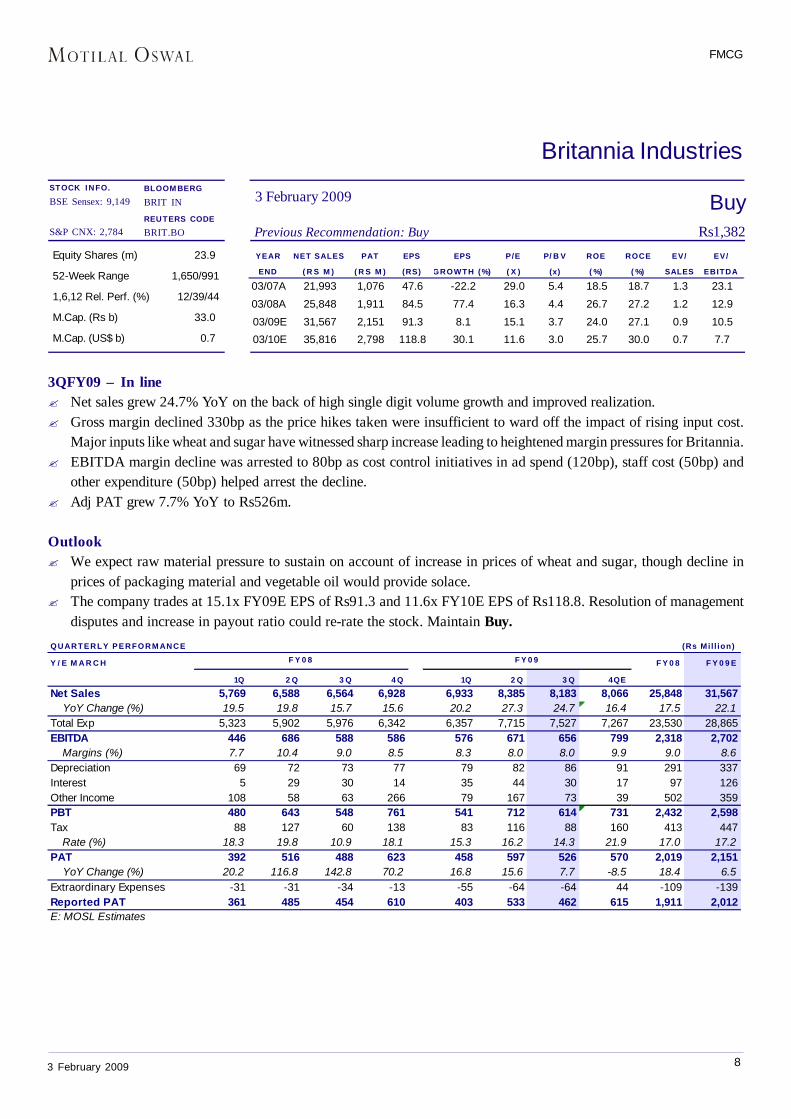
BuyPrevious Recommendation: Buy Rs1,382
3 February 2009STOCK INFO.BSE Sensex: 9,149
S&P CNX: 2,784
Britannia IndustriesBLOOMBERGBRIT IN
REUTERS CODEBRIT.BO
3QFY09 – In line? Net sales grew 24.7% YoY on the back of high single digit volume growth and improved realization.? Gross margin declined 330bp as the price hikes taken were insufficient to ward off the impact of rising input cost.
Major inputs like wheat and sugar have witnessed sharp increase leading to heightened margin pressures for Britannia.? EBITDA margin decline was arrested to 80bp as cost control initiatives in ad spend (120bp), staff cost (50bp) and
other expenditure (50bp) helped arrest the decline.? Adj PAT grew 7.7% YoY to Rs526m.
Outlook? We expect raw material pressure to sustain on account of increase in prices of wheat and sugar, though decline in
prices of packaging material and vegetable oil would provide solace.? The company trades at 15.1x FY09E EPS of Rs91.3 and 11.6x FY10E EPS of Rs118.8. Resolution of management
disputes and increase in payout ratio could re-rate the stock. Maintain Buy.
Equity Shares (m) 23.9
52-Week Range 1,650/991
1,6,12 Rel. Perf. (%) 12/39/44
M.Cap. (Rs b) 33.0
M.Cap. (US$ b) 0.7
YEAR NET SALES PAT EPS EPS P/E P/ B V ROE ROCE EV/ EV/
END ( R S M ) ( R S M ) (RS) GROWTH (%) ( X ) (x) ( %) ( %) SALES EBITDA
03/07A 21,993 1,076 47.6 -22.2 29.0 5.4 18.5 18.7 1.3 23.1
03/08A 25,848 1,911 84.5 77.4 16.3 4.4 26.7 27.2 1.2 12.9
03/09E 31,567 2,151 91.3 8.1 15.1 3.7 24.0 27.1 0.9 10.5
03/10E 35,816 2,798 118.8 30.1 11.6 3.0 25.7 30.0 0.7 7.7
QUARTERLY PERFORMANCE (Rs Mi l l ion)
Y / E M A R C H F Y 0 8 F Y 0 9 E
1Q 2 Q 3 Q 4 Q 1Q 2 Q 3 Q 4QE
Net Sales 5,769 6,588 6,564 6,928 6,933 8,385 8,183 8,066 25,848 31,567 YoY Change (%) 19.5 19.8 15.7 15.6 20.2 27.3 24.7 16.4 17.5 22.1Total Exp 5,323 5,902 5,976 6,342 6,357 7,715 7,527 7,267 23,530 28,865EBITDA 446 686 588 586 576 671 656 799 2,318 2,702 Margins (%) 7.7 10.4 9.0 8.5 8.3 8.0 8.0 9.9 9.0 8.6Depreciation 69 72 73 77 79 82 86 91 291 337Interest 5 29 30 14 35 44 30 17 97 126Other Income 108 58 63 266 79 167 73 39 502 359PBT 480 643 548 761 541 712 614 731 2,432 2,598Tax 88 127 60 138 83 116 88 160 413 447 Rate (%) 18.3 19.8 10.9 18.1 15.3 16.2 14.3 21.9 17.0 17.2PAT 392 516 488 623 458 597 526 570 2,019 2,151 YoY Change (%) 20.2 116.8 142.8 70.2 16.8 15.6 7.7 -8.5 18.4 6.5Extraordinary Expenses -31 -31 -34 -13 -55 -64 -64 44 -109 -139Reported PAT 361 485 454 610 403 533 462 615 1,911 2,012E: MOSL Estimates
F Y 0 9F Y 0 8
FMCG
3 February 2009 9
BuyPrevious Recommendation: Buy Rs417
3 February 2009
Colgate PalmoliveBLOOMBERGCLGT IN
REUTERS CODECOLG.BO
Equity Shares (m) 136.0
52-Week Range (Rs) 480/340
1,6,12 Rel. Perf. (%) 11/42/49
M.Cap. (Rs b) 56.7
M.Cap. (US$ B) 1.2
YEAR NET SALES PAT EPS EPS P/E P/BV ROE ROCE EV/ EV/
END ( R S M ) ( R S M ) (RS) GROWTH (%) ( X ) ( X ) ( %) ( %) SALES EBITDA
03/07A 12,951 1,518 11.2 16.1 37.3 160.9 55.0 54.5 3.3 28.303/08A 14,734 2,318 17.0 52.7 24.5 34.9 104.6 103.3 3.7 24.203/09E 16,865 2,764 20.3 19.3 20.5 28.9 154.2 151.6 3.2 21.603/10E 19,210 3,227 23.7 16.8 17.6 24.1 149.5 147.5 2.8 18.3
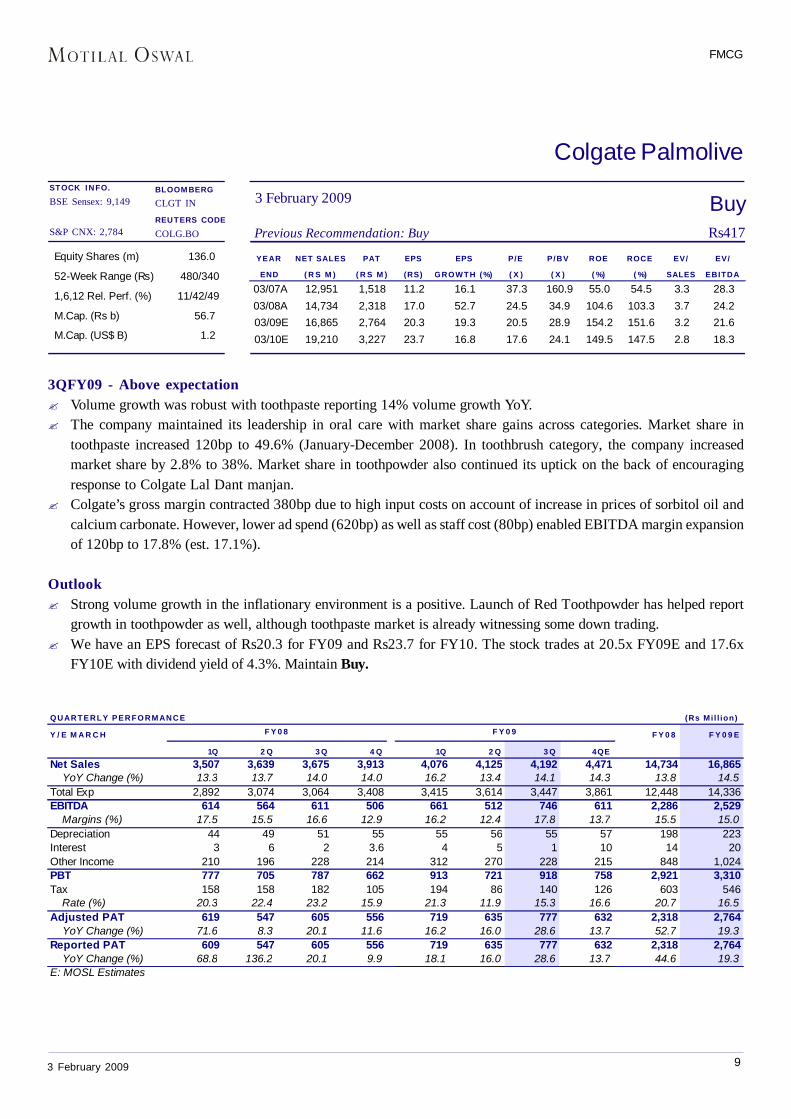
3QFY09 - Above expectation? Volume growth was robust with toothpaste reporting 14% volume growth YoY.? The company maintained its leadership in oral care with market share gains across categories. Market share in
toothpaste increased 120bp to 49.6% (January-December 2008). In toothbrush category, the company increasedmarket share by 2.8% to 38%. Market share in toothpowder also continued its uptick on the back of encouragingresponse to Colgate Lal Dant manjan.
? Colgate’s gross margin contracted 380bp due to high input costs on account of increase in prices of sorbitol oil andcalcium carbonate. However, lower ad spend (620bp) as well as staff cost (80bp) enabled EBITDA margin expansionof 120bp to 17.8% (est. 17.1%).
Outlook? Strong volume growth in the inflationary environment is a positive. Launch of Red Toothpowder has helped report
growth in toothpowder as well, although toothpaste market is already witnessing some down trading.? We have an EPS forecast of Rs20.3 for FY09 and Rs23.7 for FY10. The stock trades at 20.5x FY09E and 17.6x
FY10E with dividend yield of 4.3%. Maintain Buy.
STOCK INFO.BSE Sensex: 9,149
S&P CNX: 2,784
QUARTERLY PERFORMANCE (Rs Mi l l ion)
Y / E M A R C H F Y 0 8 F Y 0 9 E
1Q 2 Q 3 Q 4 Q 1Q 2 Q 3 Q 4QE
Net Sales 3,507 3,639 3,675 3,913 4,076 4,125 4,192 4,471 14,734 16,865 YoY Change (%) 13.3 13.7 14.0 14.0 16.2 13.4 14.1 14.3 13.8 14.5Total Exp 2,892 3,074 3,064 3,408 3,415 3,614 3,447 3,861 12,448 14,336EBITDA 614 564 611 506 661 512 746 611 2,286 2,529 Margins (%) 17.5 15.5 16.6 12.9 16.2 12.4 17.8 13.7 15.5 15.0Depreciation 44 49 51 55 55 56 55 57 198 223Interest 3 6 2 3.6 4 5 1 10 14 20Other Income 210 196 228 214 312 270 228 215 848 1,024PBT 777 705 787 662 913 721 918 758 2,921 3,310Tax 158 158 182 105 194 86 140 126 603 546 Rate (%) 20.3 22.4 23.2 15.9 21.3 11.9 15.3 16.6 20.7 16.5Adjusted PAT 619 547 605 556 719 635 777 632 2,318 2,764 YoY Change (%) 71.6 8.3 20.1 11.6 16.2 16.0 28.6 13.7 52.7 19.3Reported PAT 609 547 605 556 719 635 777 632 2,318 2,764 YoY Change (%) 68.8 136.2 20.1 9.9 18.1 16.0 28.6 13.7 44.6 19.3E: MOSL Estimates
F Y 0 9F Y 0 8
FMCG
3 February 2009 10
NeutralPrevious Recommendation: Neutral Rs88
3 February 2009
Dabur IndiaBLOOMBERGDABUR IN
REUTERS CODEDABU.BO
YEAR NET SALES PAT EPS EPS P/E P/ B V ROE ROCE EV/ EV/
END ( R S M ) ( R S M ) (RS) GROWTH (%) ( X ) ( X ) ( %) ( %) SALES EBITDA
03/07A 20,431 2,269 3.3 24.5 26.8 15.8 58.8 52.0 3.7 21.8
03/08A 23,610 3,337 3.9 17.7 22.8 12.3 54.0 55.6 3.1 18.1
03/09E 27,969 3,779 4.4 13.3 20.1 9.0 44.9 47.8 2.7 16.8
03/10E 32,683 4,478 5.2 18.5 17.0 7.0 41.3 45.9 2.3 13.2
Equity Shares (m) 864.0
52-Week Range 115/60
1,6,12 Rel. Perf. (%) 12/35/39
M.Cap. (Rs b) 76.0
M.Cap. (US$ b) 1.6
QUARTERLY PERFORMANCE (Rs Mi l l ion)
Y / E M A R C H F Y 0 8 F Y 0 9
1Q 2 Q 3 Q 4 Q 1Q 2 Q 3 Q 4QE
Net Sales 5,208 5,841 6,497 6,065 6,040 6,912 7,787 7,231 23,610 27,969 YoY Change (%) 33.0 5.4 14.7 14.3 16.0 18.3 19.9 19.2 15.6 18.5Total Exp 4,416 4,682 5,334 5,087 5,168 5,664 6,497 6,123 19,517 23,452EBITDA 792 1,160 1,163 978 871 1,248 1,290 1,108 4,093 4,517 Margins (%) 15.2 19.9 17.9 16.1 14.4 18.1 16.6 15.3 17.3 16.1Depreciation 102 98 105 117 117 123 109 124 421 473Interest 47 42 44 35 40 40 69 29 168 178Other Income 77 76 49 138 120 145 114 119 340 498PBT 721 1,096 1,064 964 834 1,230 1,226 1,074 3,844 4,364Tax 100 139 139 131 127 156 152 154 507 589 Rate (%) 13.9 12.7 13.0 13.6 15.2 12.7 12.4 14.4 13.2 13.5Minority Interest -1 -8 -20 29 1 -4 -11 10 -1 -4Adjusted PAT 622 966 945 804 707 1,078 1,085 910 3,337 3,779 YoY Change (%) 29.0 29.6 19.2 4.5 13.5 11.6 14.8 13.1 17.9 13.3Extraordinary Inc/(Exp) 0 0 0 8 0 0 0 10 10 10Reported PAT 622 966 945 796 707 1,078 1,085 900 3,327 3,769E: MOSL Estimates
F Y 0 9F Y 0 8
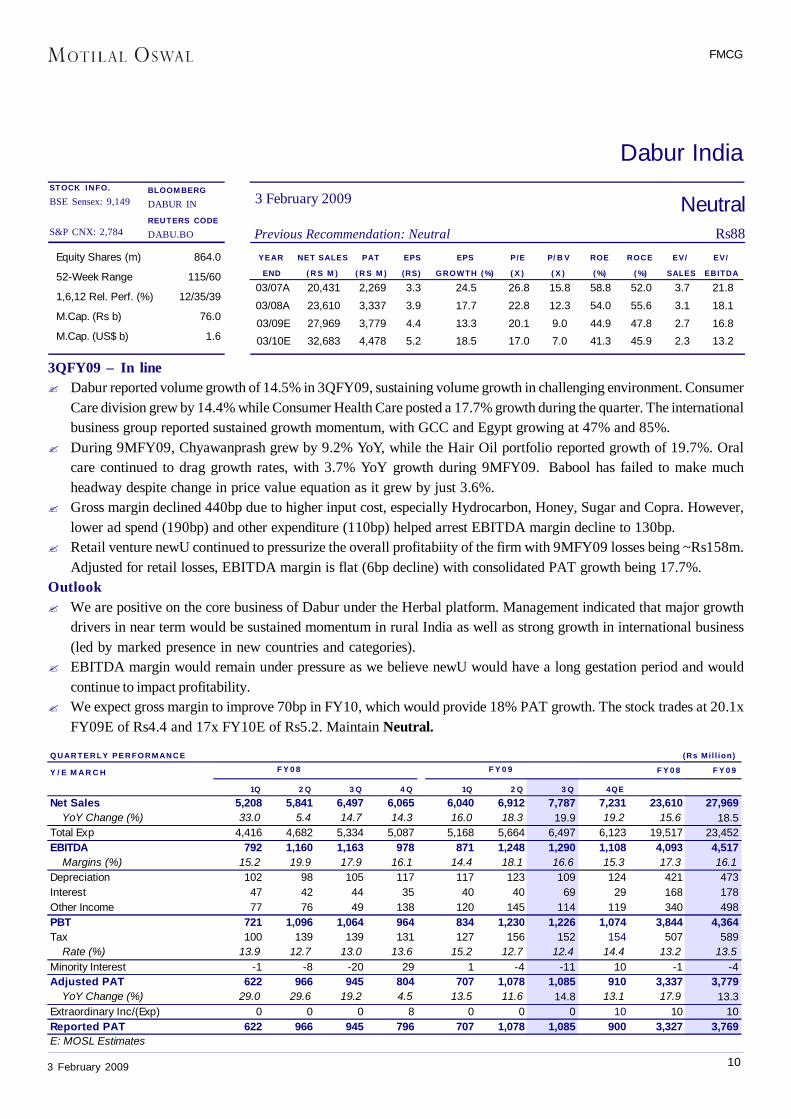
3QFY09 – In line? Dabur reported volume growth of 14.5% in 3QFY09, sustaining volume growth in challenging environment. Consumer
Care division grew by 14.4% while Consumer Health Care posted a 17.7% growth during the quarter. The internationalbusiness group reported sustained growth momentum, with GCC and Egypt growing at 47% and 85%.
? During 9MFY09, Chyawanprash grew by 9.2% YoY, while the Hair Oil portfolio reported growth of 19.7%. Oralcare continued to drag growth rates, with 3.7% YoY growth during 9MFY09. Babool has failed to make muchheadway despite change in price value equation as it grew by just 3.6%.
? Gross margin declined 440bp due to higher input cost, especially Hydrocarbon, Honey, Sugar and Copra. However,lower ad spend (190bp) and other expenditure (110bp) helped arrest EBITDA margin decline to 130bp.
? Retail venture newU continued to pressurize the overall profitabiity of the firm with 9MFY09 losses being ~Rs158m.Adjusted for retail losses, EBITDA margin is flat (6bp decline) with consolidated PAT growth being 17.7%.
Outlook? We are positive on the core business of Dabur under the Herbal platform. Management indicated that major growth
drivers in near term would be sustained momentum in rural India as well as strong growth in international business(led by marked presence in new countries and categories).
? EBITDA margin would remain under pressure as we believe newU would have a long gestation period and wouldcontinue to impact profitability.
? We expect gross margin to improve 70bp in FY10, which would provide 18% PAT growth. The stock trades at 20.1xFY09E of Rs4.4 and 17x FY10E of Rs5.2. Maintain Neutral.
STOCK INFO.BSE Sensex: 9,149
S&P CNX: 2,784
FMCG
3 February 2009 11
BuyPrevious Recommendation: Buy Rs600
3 February 2009
GlaxoSmithKline ConsumerBLOOMBERGSKB IN
REUTERS CODEGLSM.BO
YEAR NET SALES PAT EPS EPS P/E P/BV ROE ROCE EV/ EV/
END ( R S M ) ( R S M ) (RS) GROWTH (%) ( X ) ( X ) ( %) ( %) SALES EBITDA
12/06A 11,079 1,270 30.2 19.5 19.9 4.6 23.4 35.8 2.0 12.2
12/07A 12,778 1,626 38.7 28.1 15.5 3.9 25.2 38.6 1.7 9.5
12/08E 15,428 1,884 44.8 15.8 13.4 3.4 25.5 39.5 1.4 8.8
12/09E 17,833 2,267 53.9 20.4 11.1 2.9 25.9 39.8 1.2 6.9
Equity Shares (m) 42.1
52-Week Range (Rs) 766/480
1,6,12 Rel. Perf. (%) 16/32/45
M.Cap. (Rs b) 25.3
M.Cap. (US$ b) 0.5
QUARTERLY PERFORMANCE (Rs Mi l l ion)
Y / E DECEM B E R C Y 0 7 C Y 0 8
1Q 2 Q 3 Q 4 Q 1Q 2 Q 3 Q 4 Q
Net Sales 3,265 3,156 3,516 2,841 4,106 3,764 4,225 3,334 12,778 15,428 YoY Change (%) 17.9 17.8 16.6 7.3 25.8 19.3 20.2 17.3 14.9 20.7Total Exp 2,641 2,571 2,839 2,484 3,309 3,218 3,594 2,932 10,535 13,052EBITDA 624 585 677 357 797 546 631 402 2,243 2,376 Margins (%) 19.1 18.5 19.3 12.6 19.4 14.5 14.9 12.1 17.6 15.4Depreciation 108 109 111 108 106 102 104 107 435 419Interest 11 11 12 12 13 13 14 30 46 70Other Income 139 166 209 175 186 262 265 242 689 955PBT 644 631 763 412 864 692 778 507 2,451 2,841Tax 221 208 258 137 298 231 247 181 824 957 Rate (%) 34.3 33.0 33.8 33.3 34.0 33.3 33.0 35.8 33.6 33.7PAT 423 423 505 275 566 462 530 326 1,626 1,884 YoY Change (%) 22.8 36.8 39.4 9.1 33.8 9.1 5.0 18.5 28.4 15.8E: MOSL Estimates
C Y 0 7 C Y 0 8
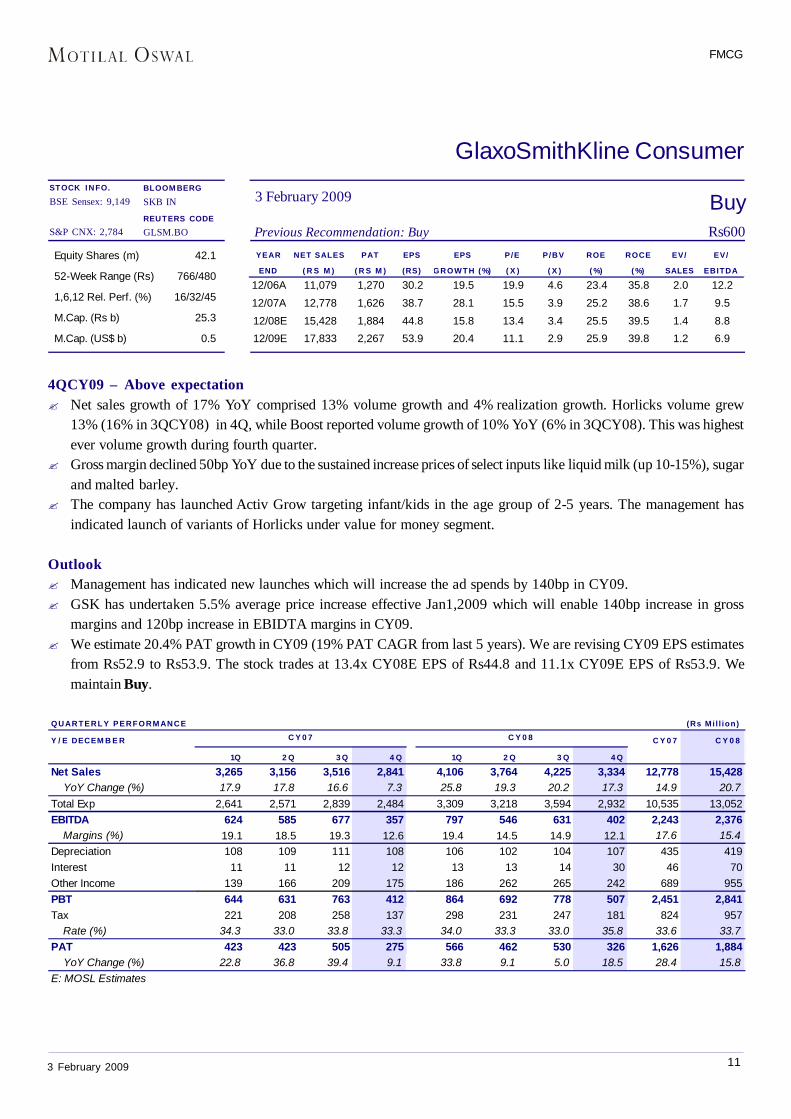
4QCY09 – Above expectation? Net sales growth of 17% YoY comprised 13% volume growth and 4% realization growth. Horlicks volume grew
13% (16% in 3QCY08) in 4Q, while Boost reported volume growth of 10% YoY (6% in 3QCY08). This was highestever volume growth during fourth quarter.
? Gross margin declined 50bp YoY due to the sustained increase prices of select inputs like liquid milk (up 10-15%), sugarand malted barley.
? The company has launched Activ Grow targeting infant/kids in the age group of 2-5 years. The management hasindicated launch of variants of Horlicks under value for money segment.
Outlook? Management has indicated new launches which will increase the ad spends by 140bp in CY09.? GSK has undertaken 5.5% average price increase effective Jan1,2009 which will enable 140bp increase in gross
margins and 120bp increase in EBIDTA margins in CY09.? We estimate 20.4% PAT growth in CY09 (19% PAT CAGR from last 5 years). We are revising CY09 EPS estimates
from Rs52.9 to Rs53.9. The stock trades at 13.4x CY08E EPS of Rs44.8 and 11.1x CY09E EPS of Rs53.9. Wemaintain Buy.
STOCK INFO.BSE Sensex: 9,149
S&P CNX: 2,784
FMCG
3 February 2009 12
BuyPrevious Recommendation: Buy Rs130
3 February 2009
Godrej Consumer ProductsBLOOMBERGGCPL IN
REUTERS CODEGOCP.BO
YEAR NET SALES PAT EPS EPS P/E P/ B V ROE ROCE EV/ EV/
END ( R S M ) ( R S M ) (RS) GROWTH (%) ( X ) ( X ) ( %) ( %) SALES EBITDA
03/07A 9,515 1,342 5.9 12.5 21.9 27.5 110.0 64.8 3.2 17.003/08A 11,040 1,592 7.1 18.6 18.4 19.6 92.8 64.4 2.8 14.303/09E 13,806 1,602 6.2 -11.9 20.9 5.8 27.5 27.9 2.3 16.203/10E 15,077 2,132 8.3 33.1 15.7 5.3 33.5 33.3 2.1 12.0
Equity Shares (m) 258.1
52-Week Range 146/94
1,6,12 Rel. Perf. (%) 0/46/66
M.Cap. (Rs b) 33.6
M.Cap. (US$ b) 0.7
STOCK INFO.BSE Sensex: 9,149
S&P CNX: 2,784
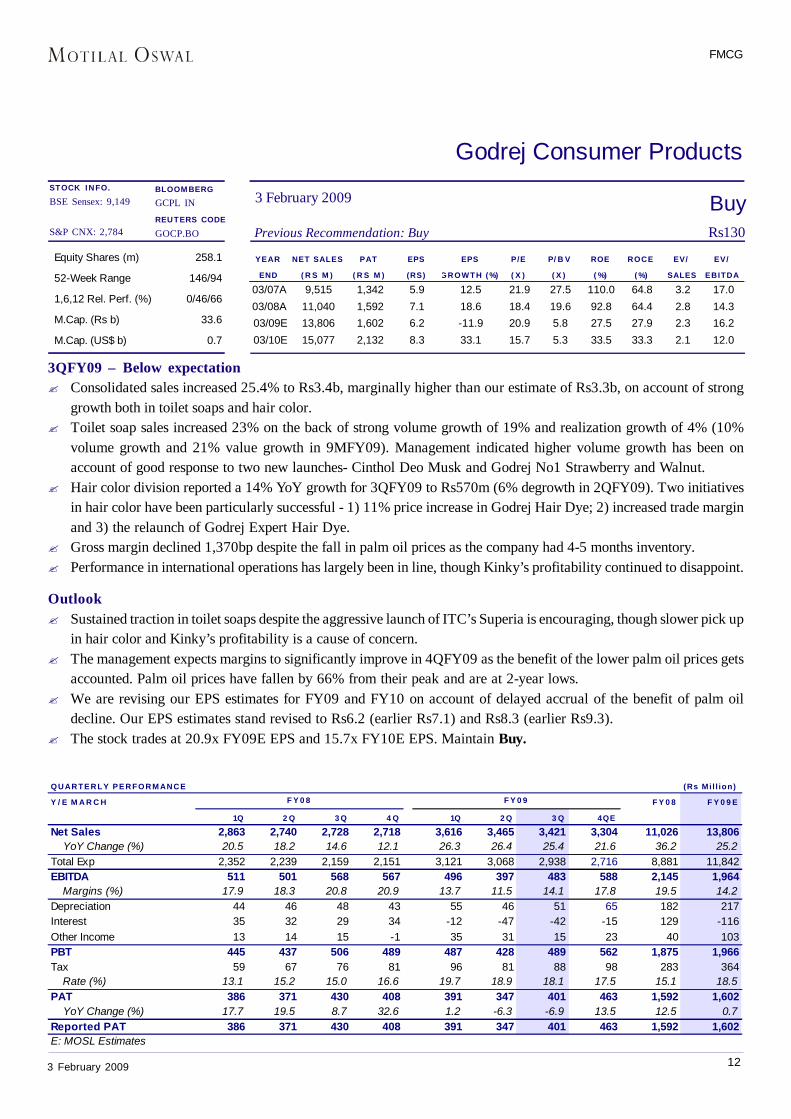
3QFY09 – Below expectation? Consolidated sales increased 25.4% to Rs3.4b, marginally higher than our estimate of Rs3.3b, on account of strong
growth both in toilet soaps and hair color.? Toilet soap sales increased 23% on the back of strong volume growth of 19% and realization growth of 4% (10%
volume growth and 21% value growth in 9MFY09). Management indicated higher volume growth has been onaccount of good response to two new launches- Cinthol Deo Musk and Godrej No1 Strawberry and Walnut.
? Hair color division reported a 14% YoY growth for 3QFY09 to Rs570m (6% degrowth in 2QFY09). Two initiativesin hair color have been particularly successful - 1) 11% price increase in Godrej Hair Dye; 2) increased trade marginand 3) the relaunch of Godrej Expert Hair Dye.
? Gross margin declined 1,370bp despite the fall in palm oil prices as the company had 4-5 months inventory.? Performance in international operations has largely been in line, though Kinky’s profitability continued to disappoint.
Outlook? Sustained traction in toilet soaps despite the aggressive launch of ITC’s Superia is encouraging, though slower pick up
in hair color and Kinky’s profitability is a cause of concern.? The management expects margins to significantly improve in 4QFY09 as the benefit of the lower palm oil prices gets
accounted. Palm oil prices have fallen by 66% from their peak and are at 2-year lows.? We are revising our EPS estimates for FY09 and FY10 on account of delayed accrual of the benefit of palm oil
decline. Our EPS estimates stand revised to Rs6.2 (earlier Rs7.1) and Rs8.3 (earlier Rs9.3).? The stock trades at 20.9x FY09E EPS and 15.7x FY10E EPS. Maintain Buy.
QUARTERLY PERFORMANCE (Rs Mi l l ion)
Y / E M A R C H F Y 0 8 F Y 0 9 E
1Q 2 Q 3 Q 4 Q 1Q 2 Q 3 Q 4QE
Net Sales 2,863 2,740 2,728 2,718 3,616 3,465 3,421 3,304 11,026 13,806 YoY Change (%) 20.5 18.2 14.6 12.1 26.3 26.4 25.4 21.6 36.2 25.2Total Exp 2,352 2,239 2,159 2,151 3,121 3,068 2,938 2,716 8,881 11,842EBITDA 511 501 568 567 496 397 483 588 2,145 1,964 Margins (%) 17.9 18.3 20.8 20.9 13.7 11.5 14.1 17.8 19.5 14.2Depreciation 44 46 48 43 55 46 51 65 182 217Interest 35 32 29 34 -12 -47 -42 -15 129 -116Other Income 13 14 15 -1 35 31 15 23 40 103PBT 445 437 506 489 487 428 489 562 1,875 1,966Tax 59 67 76 81 96 81 88 98 283 364 Rate (%) 13.1 15.2 15.0 16.6 19.7 18.9 18.1 17.5 15.1 18.5PAT 386 371 430 408 391 347 401 463 1,592 1,602 YoY Change (%) 17.7 19.5 8.7 32.6 1.2 -6.3 -6.9 13.5 12.5 0.7Reported PAT 386 371 430 408 391 347 401 463 1,592 1,602E: MOSL Estimates
F Y 0 9F Y 0 8
FMCG
3 February 2009 13
NeutralPrevious Recommendation: Neutral Rs264
3 February 2009BLOOMBERGHUVR IN
REUTERS CODEHLL.BO
Equity Shares (m) 2,177.5
52-Week Range 267/185
1,6,12 Rel. Perf. (%) 15/50/76
M.Cap. (Rs b) 574.9
M.Cap. (US$ b) 11.8
YEAR NET SALES PAT EPS EPS P/E P/ B V ROE ROCE EV/ EV/
END ( R S M ) ( R S M ) (RS) GROWTH (%) ( X ) ( X ) ( %) ( %) SALES EBITDA
12/06A 121,034 15,397 7.0 17.5 37.8 21.4 56.5 67.0 4.6 33.712/07A 137,178 17,691 8.1 16.4 32.5 39.9 122.9 144.7 4.1 29.703/09E 207,133 24,690 11.3 39.6 23.3 29.8 128.1 154.1 2.6 20.403/10E 179,561 24,345 11.2 -1.4 23.6 23.7 100.3 121.3 3.0 20.2
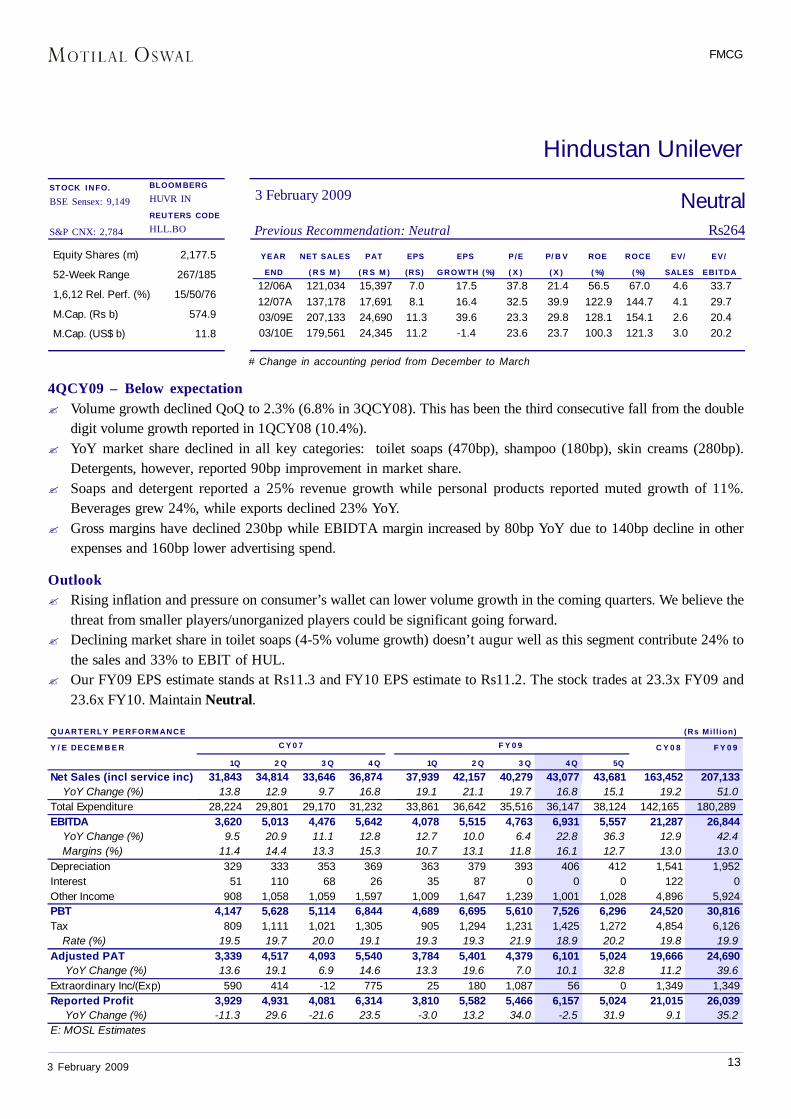
Hindustan Unilever
4QCY09 – Below expectation? Volume growth declined QoQ to 2.3% (6.8% in 3QCY08). This has been the third consecutive fall from the double
digit volume growth reported in 1QCY08 (10.4%).? YoY market share declined in all key categories: toilet soaps (470bp), shampoo (180bp), skin creams (280bp).
Detergents, however, reported 90bp improvement in market share.? Soaps and detergent reported a 25% revenue growth while personal products reported muted growth of 11%.
Beverages grew 24%, while exports declined 23% YoY.? Gross margins have declined 230bp while EBIDTA margin increased by 80bp YoY due to 140bp decline in other
expenses and 160bp lower advertising spend.
Outlook? Rising inflation and pressure on consumer’s wallet can lower volume growth in the coming quarters. We believe the
threat from smaller players/unorganized players could be significant going forward.? Declining market share in toilet soaps (4-5% volume growth) doesn’t augur well as this segment contribute 24% to
the sales and 33% to EBIT of HUL.? Our FY09 EPS estimate stands at Rs11.3 and FY10 EPS estimate to Rs11.2. The stock trades at 23.3x FY09 and
23.6x FY10. Maintain Neutral.
STOCK INFO.BSE Sensex: 9,149
S&P CNX: 2,784
QUARTERLY PERFORMANCE (Rs Mi l l ion)
Y / E DECEM B E R C Y 0 8 F Y 0 9
1Q 2 Q 3 Q 4 Q 1Q 2 Q 3 Q 4 Q 5Q
Net Sales (incl service inc) 31,843 34,814 33,646 36,874 37,939 42,157 40,279 43,077 43,681 163,452 207,133 YoY Change (%) 13.8 12.9 9.7 16.8 19.1 21.1 19.7 16.8 15.1 19.2 51.0Total Expenditure 28,224 29,801 29,170 31,232 33,861 36,642 35,516 36,147 38,124 142,165 180,289 EBITDA 3,620 5,013 4,476 5,642 4,078 5,515 4,763 6,931 5,557 21,287 26,844 YoY Change (%) 9.5 20.9 11.1 12.8 12.7 10.0 6.4 22.8 36.3 12.9 42.4 Margins (%) 11.4 14.4 13.3 15.3 10.7 13.1 11.8 16.1 12.7 13.0 13.0Depreciation 329 333 353 369 363 379 393 406 412 1,541 1,952Interest 51 110 68 26 35 87 0 0 0 122 0Other Income 908 1,058 1,059 1,597 1,009 1,647 1,239 1,001 1,028 4,896 5,924PBT 4,147 5,628 5,114 6,844 4,689 6,695 5,610 7,526 6,296 24,520 30,816Tax 809 1,111 1,021 1,305 905 1,294 1,231 1,425 1,272 4,854 6,126 Rate (%) 19.5 19.7 20.0 19.1 19.3 19.3 21.9 18.9 20.2 19.8 19.9Adjusted PAT 3,339 4,517 4,093 5,540 3,784 5,401 4,379 6,101 5,024 19,666 24,690 YoY Change (%) 13.6 19.1 6.9 14.6 13.3 19.6 7.0 10.1 32.8 11.2 39.6Extraordinary Inc/(Exp) 590 414 -12 775 25 180 1,087 56 0 1,349 1,349Reported Profit 3,929 4,931 4,081 6,314 3,810 5,582 5,466 6,157 5,024 21,015 26,039 YoY Change (%) -11.3 29.6 -21.6 23.5 -3.0 13.2 34.0 -2.5 31.9 9.1 35.2E: MOSL Estimates
F Y 0 9C Y 0 7
# Change in accounting period from December to March
FMCG
3 February 2009 14
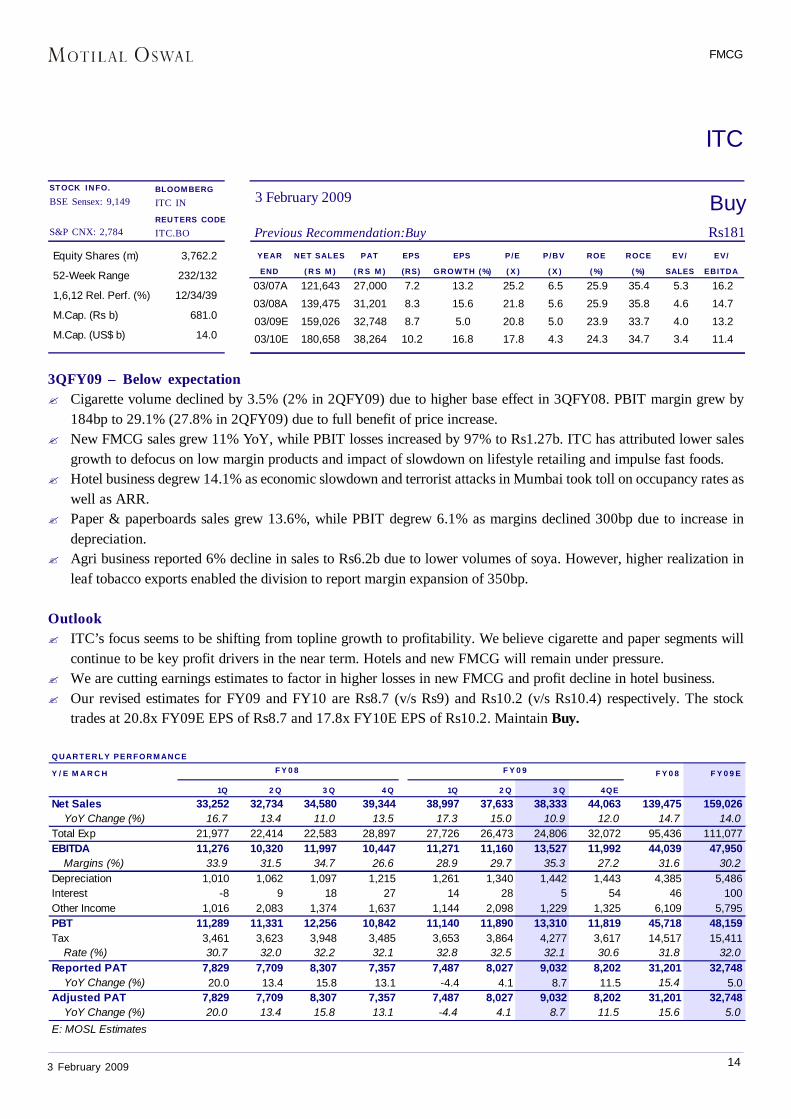
QUARTERLY PERFORMANCE
Y / E M A R C H F Y 0 8 F Y 0 9 E
1Q 2 Q 3 Q 4 Q 1Q 2 Q 3 Q 4QE
Net Sales 33,252 32,734 34,580 39,344 38,997 37,633 38,333 44,063 139,475 159,026 YoY Change (%) 16.7 13.4 11.0 13.5 17.3 15.0 10.9 12.0 14.7 14.0Total Exp 21,977 22,414 22,583 28,897 27,726 26,473 24,806 32,072 95,436 111,077EBITDA 11,276 10,320 11,997 10,447 11,271 11,160 13,527 11,992 44,039 47,950 Margins (%) 33.9 31.5 34.7 26.6 28.9 29.7 35.3 27.2 31.6 30.2Depreciation 1,010 1,062 1,097 1,215 1,261 1,340 1,442 1,443 4,385 5,486Interest -8 9 18 27 14 28 5 54 46 100Other Income 1,016 2,083 1,374 1,637 1,144 2,098 1,229 1,325 6,109 5,795PBT 11,289 11,331 12,256 10,842 11,140 11,890 13,310 11,819 45,718 48,159Tax 3,461 3,623 3,948 3,485 3,653 3,864 4,277 3,617 14,517 15,411 Rate (%) 30.7 32.0 32.2 32.1 32.8 32.5 32.1 30.6 31.8 32.0Reported PAT 7,829 7,709 8,307 7,357 7,487 8,027 9,032 8,202 31,201 32,748 YoY Change (%) 20.0 13.4 15.8 13.1 -4.4 4.1 8.7 11.5 15.4 5.0Adjusted PAT 7,829 7,709 8,307 7,357 7,487 8,027 9,032 8,202 31,201 32,748 YoY Change (%) 20.0 13.4 15.8 13.1 -4.4 4.1 8.7 11.5 15.6 5.0E: MOSL Estimates
F Y 0 9F Y 0 8
BuyPrevious Recommendation:Buy Rs181
3 February 2009
ITC
BLOOMBERGITC IN
REUTERS CODEITC.BO
Equity Shares (m) 3,762.2
52-Week Range 232/132
1,6,12 Rel. Perf. (%) 12/34/39
M.Cap. (Rs b) 681.0
M.Cap. (US$ b) 14.0
YEAR NET SALES PAT EPS EPS P/E P/BV ROE ROCE EV/ EV/
END ( R S M ) ( R S M ) (RS) GROWTH (%) ( X ) ( X ) ( %) ( %) SALES EBITDA
03/07A 121,643 27,000 7.2 13.2 25.2 6.5 25.9 35.4 5.3 16.2
03/08A 139,475 31,201 8.3 15.6 21.8 5.6 25.9 35.8 4.6 14.7
03/09E 159,026 32,748 8.7 5.0 20.8 5.0 23.9 33.7 4.0 13.2
03/10E 180,658 38,264 10.2 16.8 17.8 4.3 24.3 34.7 3.4 11.4
3QFY09 – Below expectation? Cigarette volume declined by 3.5% (2% in 2QFY09) due to higher base effect in 3QFY08. PBIT margin grew by
184bp to 29.1% (27.8% in 2QFY09) due to full benefit of price increase.? New FMCG sales grew 11% YoY, while PBIT losses increased by 97% to Rs1.27b. ITC has attributed lower sales
growth to defocus on low margin products and impact of slowdown on lifestyle retailing and impulse fast foods.? Hotel business degrew 14.1% as economic slowdown and terrorist attacks in Mumbai took toll on occupancy rates as
well as ARR.? Paper & paperboards sales grew 13.6%, while PBIT degrew 6.1% as margins declined 300bp due to increase in
depreciation.? Agri business reported 6% decline in sales to Rs6.2b due to lower volumes of soya. However, higher realization in
leaf tobacco exports enabled the division to report margin expansion of 350bp.
Outlook? ITC’s focus seems to be shifting from topline growth to profitability. We believe cigarette and paper segments will
continue to be key profit drivers in the near term. Hotels and new FMCG will remain under pressure.? We are cutting earnings estimates to factor in higher losses in new FMCG and profit decline in hotel business.? Our revised estimates for FY09 and FY10 are Rs8.7 (v/s Rs9) and Rs10.2 (v/s Rs10.4) respectively. The stock
trades at 20.8x FY09E EPS of Rs8.7 and 17.8x FY10E EPS of Rs10.2. Maintain Buy.
STOCK INFO.BSE Sensex: 9,149
S&P CNX: 2,784
FMCG
3 February 2009 15
BuyPrevious Recommendation: Buy Rs58
3 February 2009
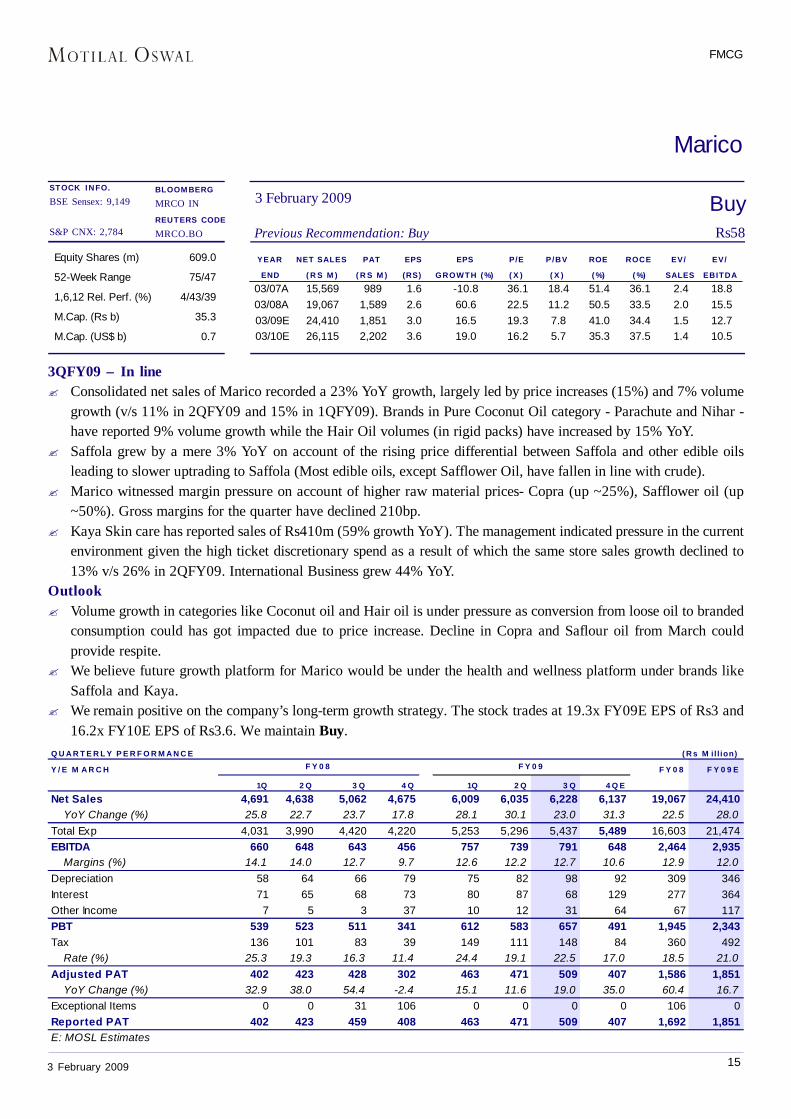
Marico
BLOOMBERGMRCO IN
REUTERS CODEMRCO.BO
Equity Shares (m) 609.0
52-Week Range 75/47
1,6,12 Rel. Perf. (%) 4/43/39
M.Cap. (Rs b) 35.3
M.Cap. (US$ b) 0.7
YEAR NET SALES PAT EPS EPS P/E P/BV ROE ROCE EV/ EV/
END ( R S M ) ( R S M ) (RS) GROWTH (%) ( X ) ( X ) ( %) ( %) SALES EBITDA
03/07A 15,569 989 1.6 -10.8 36.1 18.4 51.4 36.1 2.4 18.803/08A 19,067 1,589 2.6 60.6 22.5 11.2 50.5 33.5 2.0 15.503/09E 24,410 1,851 3.0 16.5 19.3 7.8 41.0 34.4 1.5 12.703/10E 26,115 2,202 3.6 19.0 16.2 5.7 35.3 37.5 1.4 10.5
Q U A R T E R L Y P E R F O R M A N C E ( R s M il l ion)
Y / E M A R C H F Y 0 8 F Y 0 9 E
1Q 2 Q 3 Q 4 Q 1Q 2 Q 3 Q 4 Q E
Net Sales 4,691 4,638 5,062 4,675 6,009 6,035 6,228 6,137 19,067 24,410 YoY Change (%) 25.8 22.7 23.7 17.8 28.1 30.1 23.0 31.3 22.5 28.0Total Exp 4,031 3,990 4,420 4,220 5,253 5,296 5,437 5,489 16,603 21,474EBITDA 660 648 643 456 757 739 791 648 2,464 2,935 Margins (%) 14.1 14.0 12.7 9.7 12.6 12.2 12.7 10.6 12.9 12.0Depreciation 58 64 66 79 75 82 98 92 309 346Interest 71 65 68 73 80 87 68 129 277 364Other Income 7 5 3 37 10 12 31 64 67 117PBT 539 523 511 341 612 583 657 491 1,945 2,343Tax 136 101 83 39 149 111 148 84 360 492 Rate (%) 25.3 19.3 16.3 11.4 24.4 19.1 22.5 17.0 18.5 21.0Adjusted PAT 402 423 428 302 463 471 509 407 1,586 1,851 YoY Change (%) 32.9 38.0 54.4 -2.4 15.1 11.6 19.0 35.0 60.4 16.7Exceptional Items 0 0 31 106 0 0 0 0 106 0Reported PAT 402 423 459 408 463 471 509 407 1,692 1,851E: MOSL Estimates
F Y 0 9F Y 0 8
3QFY09 – In line? Consolidated net sales of Marico recorded a 23% YoY growth, largely led by price increases (15%) and 7% volume
growth (v/s 11% in 2QFY09 and 15% in 1QFY09). Brands in Pure Coconut Oil category - Parachute and Nihar -have reported 9% volume growth while the Hair Oil volumes (in rigid packs) have increased by 15% YoY.
? Saffola grew by a mere 3% YoY on account of the rising price differential between Saffola and other edible oilsleading to slower uptrading to Saffola (Most edible oils, except Safflower Oil, have fallen in line with crude).
? Marico witnessed margin pressure on account of higher raw material prices- Copra (up ~25%), Safflower oil (up~50%). Gross margins for the quarter have declined 210bp.
? Kaya Skin care has reported sales of Rs410m (59% growth YoY). The management indicated pressure in the currentenvironment given the high ticket discretionary spend as a result of which the same store sales growth declined to13% v/s 26% in 2QFY09. International Business grew 44% YoY.
Outlook? Volume growth in categories like Coconut oil and Hair oil is under pressure as conversion from loose oil to branded
consumption could has got impacted due to price increase. Decline in Copra and Saflour oil from March couldprovide respite.
? We believe future growth platform for Marico would be under the health and wellness platform under brands likeSaffola and Kaya.
? We remain positive on the company’s long-term growth strategy. The stock trades at 19.3x FY09E EPS of Rs3 and16.2x FY10E EPS of Rs3.6. We maintain Buy.
STOCK INFO.BSE Sensex: 9,149
S&P CNX: 2,784
FMCG
3 February 2009 16
NeutralPrevious Recommendation: Neutral Rs563
3 February 2009
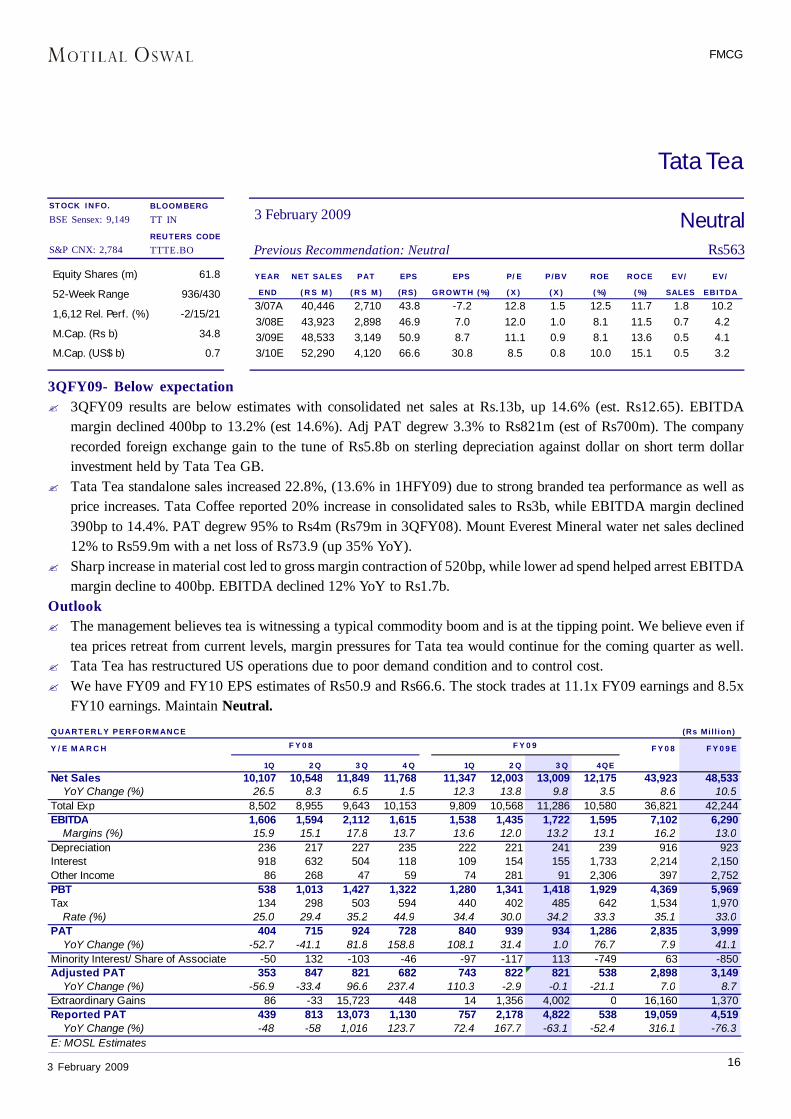
Tata Tea
STOCK INFO.BSE Sensex: 9,149
S&P CNX: 2,784
BLOOMBERGTT IN
REUTERS CODETTTE.BO
QUARTERLY PERFORMANCE (Rs Mi l l ion)
Y / E M A R C H F Y 0 8 F Y 0 9 E
1Q 2 Q 3 Q 4 Q 1Q 2 Q 3 Q 4QE
Net Sales 10,107 10,548 11,849 11,768 11,347 12,003 13,009 12,175 43,923 48,533 YoY Change (%) 26.5 8.3 6.5 1.5 12.3 13.8 9.8 3.5 8.6 10.5Total Exp 8,502 8,955 9,643 10,153 9,809 10,568 11,286 10,580 36,821 42,244EBITDA 1,606 1,594 2,112 1,615 1,538 1,435 1,722 1,595 7,102 6,290 Margins (%) 15.9 15.1 17.8 13.7 13.6 12.0 13.2 13.1 16.2 13.0Depreciation 236 217 227 235 222 221 241 239 916 923Interest 918 632 504 118 109 154 155 1,733 2,214 2,150Other Income 86 268 47 59 74 281 91 2,306 397 2,752PBT 538 1,013 1,427 1,322 1,280 1,341 1,418 1,929 4,369 5,969Tax 134 298 503 594 440 402 485 642 1,534 1,970 Rate (%) 25.0 29.4 35.2 44.9 34.4 30.0 34.2 33.3 35.1 33.0PAT 404 715 924 728 840 939 934 1,286 2,835 3,999 YoY Change (%) -52.7 -41.1 81.8 158.8 108.1 31.4 1.0 76.7 7.9 41.1Minority Interest/ Share of Associate -50 132 -103 -46 -97 -117 113 -749 63 -850Adjusted PAT 353 847 821 682 743 822 821 538 2,898 3,149 YoY Change (%) -56.9 -33.4 96.6 237.4 110.3 -2.9 -0.1 -21.1 7.0 8.7Extraordinary Gains 86 -33 15,723 448 14 1,356 4,002 0 16,160 1,370Reported PAT 439 813 13,073 1,130 757 2,178 4,822 538 19,059 4,519 YoY Change (%) -48 -58 1,016 123.7 72.4 167.7 -63.1 -52.4 316.1 -76.3E: MOSL Estimates
F Y 0 9F Y 0 8
3QFY09- Below expectation? 3QFY09 results are below estimates with consolidated net sales at Rs.13b, up 14.6% (est. Rs12.65). EBITDA
margin declined 400bp to 13.2% (est 14.6%). Adj PAT degrew 3.3% to Rs821m (est of Rs700m). The companyrecorded foreign exchange gain to the tune of Rs5.8b on sterling depreciation against dollar on short term dollarinvestment held by Tata Tea GB.
? Tata Tea standalone sales increased 22.8%, (13.6% in 1HFY09) due to strong branded tea performance as well asprice increases. Tata Coffee reported 20% increase in consolidated sales to Rs3b, while EBITDA margin declined390bp to 14.4%. PAT degrew 95% to Rs4m (Rs79m in 3QFY08). Mount Everest Mineral water net sales declined12% to Rs59.9m with a net loss of Rs73.9 (up 35% YoY).
? Sharp increase in material cost led to gross margin contraction of 520bp, while lower ad spend helped arrest EBITDAmargin decline to 400bp. EBITDA declined 12% YoY to Rs1.7b.
Outlook? The management believes tea is witnessing a typical commodity boom and is at the tipping point. We believe even if
tea prices retreat from current levels, margin pressures for Tata tea would continue for the coming quarter as well.? Tata Tea has restructured US operations due to poor demand condition and to control cost.? We have FY09 and FY10 EPS estimates of Rs50.9 and Rs66.6. The stock trades at 11.1x FY09 earnings and 8.5x
FY10 earnings. Maintain Neutral.
Equity Shares (m) 61.8
52-Week Range 936/430
1,6,12 Rel. Perf. (%) -2/15/21
M.Cap. (Rs b) 34.8
M.Cap. (US$ b) 0.7
YEAR NET SALES PAT EPS EPS P/ E P/BV ROE ROCE EV/ EV/
END ( R S M ) ( R S M ) (RS) GROWTH (%) ( X ) ( X ) ( %) ( %) SALES EBITDA
3/07A 40,446 2,710 43.8 -7.2 12.8 1.5 12.5 11.7 1.8 10.23/08E 43,923 2,898 46.9 7.0 12.0 1.0 8.1 11.5 0.7 4.23/09E 48,533 3,149 50.9 8.7 11.1 0.9 8.1 13.6 0.5 4.13/10E 52,290 4,120 66.6 30.8 8.5 0.8 10.0 15.1 0.5 3.2
FMCG
3 February 2009 17
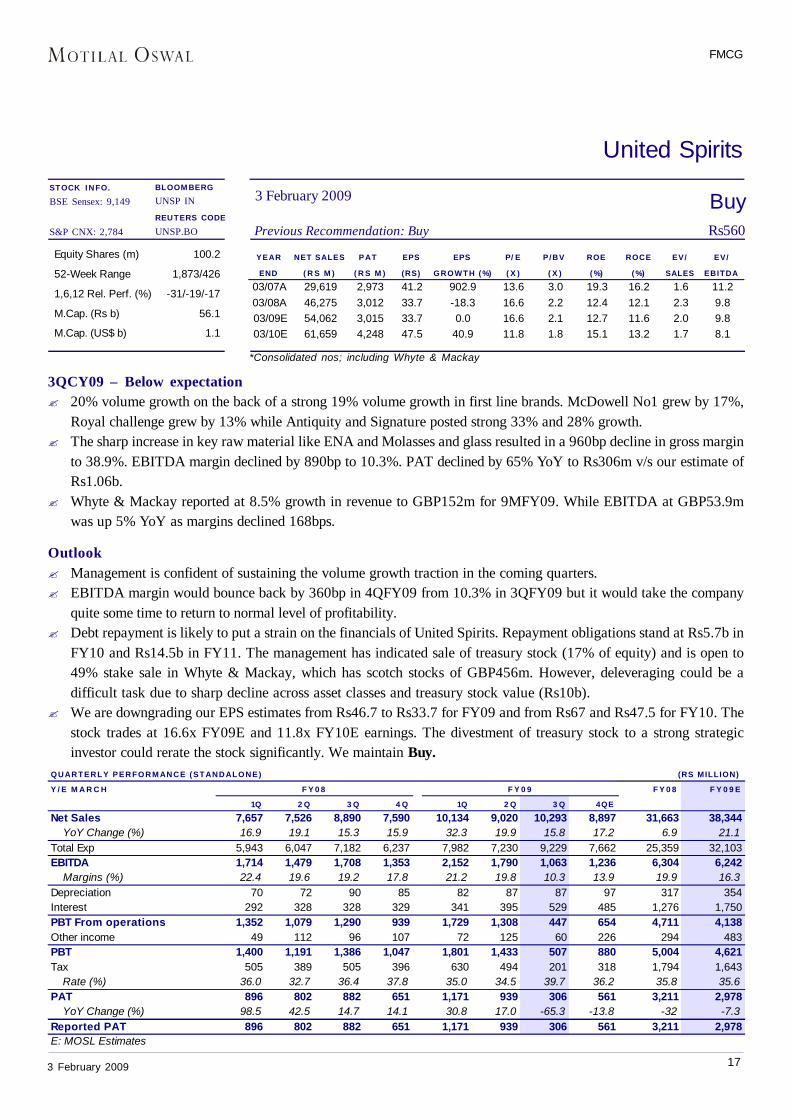
BuyPrevious Recommendation: Buy Rs560
3 February 2009
United SpiritsBLOOMBERGUNSP IN
REUTERS CODEUNSP.BO
*Consolidated nos; including Whyte & Mackay
Equity Shares (m) 100.2
52-Week Range 1,873/426
1,6,12 Rel. Perf. (%) -31/-19/-17
M.Cap. (Rs b) 56.1
M.Cap. (US$ b) 1.1
YEAR NET SALES PAT EPS EPS P/ E P/BV ROE ROCE EV/ EV/
END ( R S M ) ( R S M ) (RS) GROWTH (%) ( X ) ( X ) ( %) ( %) SALES EBITDA
03/07A 29,619 2,973 41.2 902.9 13.6 3.0 19.3 16.2 1.6 11.203/08A 46,275 3,012 33.7 -18.3 16.6 2.2 12.4 12.1 2.3 9.803/09E 54,062 3,015 33.7 0.0 16.6 2.1 12.7 11.6 2.0 9.803/10E 61,659 4,248 47.5 40.9 11.8 1.8 15.1 13.2 1.7 8.1
3QCY09 – Below expectation? 20% volume growth on the back of a strong 19% volume growth in first line brands. McDowell No1 grew by 17%,
Royal challenge grew by 13% while Antiquity and Signature posted strong 33% and 28% growth.? The sharp increase in key raw material like ENA and Molasses and glass resulted in a 960bp decline in gross margin
to 38.9%. EBITDA margin declined by 890bp to 10.3%. PAT declined by 65% YoY to Rs306m v/s our estimate ofRs1.06b.
? Whyte & Mackay reported at 8.5% growth in revenue to GBP152m for 9MFY09. While EBITDA at GBP53.9mwas up 5% YoY as margins declined 168bps.
Outlook? Management is confident of sustaining the volume growth traction in the coming quarters.? EBITDA margin would bounce back by 360bp in 4QFY09 from 10.3% in 3QFY09 but it would take the company
quite some time to return to normal level of profitability.? Debt repayment is likely to put a strain on the financials of United Spirits. Repayment obligations stand at Rs5.7b in
FY10 and Rs14.5b in FY11. The management has indicated sale of treasury stock (17% of equity) and is open to49% stake sale in Whyte & Mackay, which has scotch stocks of GBP456m. However, deleveraging could be adifficult task due to sharp decline across asset classes and treasury stock value (Rs10b).
? We are downgrading our EPS estimates from Rs46.7 to Rs33.7 for FY09 and from Rs67 and Rs47.5 for FY10. Thestock trades at 16.6x FY09E and 11.8x FY10E earnings. The divestment of treasury stock to a strong strategicinvestor could rerate the stock significantly. We maintain Buy.
STOCK INFO.BSE Sensex: 9,149
S&P CNX: 2,784
QUARTERLY PERFORMANCE (STANDALONE) (RS MILLION)
Y / E M A R C H F Y 0 8 F Y 0 9 E
1Q 2 Q 3 Q 4 Q 1Q 2 Q 3 Q 4QE
Net Sales 7,657 7,526 8,890 7,590 10,134 9,020 10,293 8,897 31,663 38,344 YoY Change (%) 16.9 19.1 15.3 15.9 32.3 19.9 15.8 17.2 6.9 21.1Total Exp 5,943 6,047 7,182 6,237 7,982 7,230 9,229 7,662 25,359 32,103EBITDA 1,714 1,479 1,708 1,353 2,152 1,790 1,063 1,236 6,304 6,242 Margins (%) 22.4 19.6 19.2 17.8 21.2 19.8 10.3 13.9 19.9 16.3Depreciation 70 72 90 85 82 87 87 97 317 354Interest 292 328 328 329 341 395 529 485 1,276 1,750PBT From operations 1,352 1,079 1,290 939 1,729 1,308 447 654 4,711 4,138Other income 49 112 96 107 72 125 60 226 294 483PBT 1,400 1,191 1,386 1,047 1,801 1,433 507 880 5,004 4,621Tax 505 389 505 396 630 494 201 318 1,794 1,643 Rate (%) 36.0 32.7 36.4 37.8 35.0 34.5 39.7 36.2 35.8 35.6PAT 896 802 882 651 1,171 939 306 561 3,211 2,978 YoY Change (%) 98.5 42.5 14.7 14.1 30.8 17.0 -65.3 -13.8 -32 -7.3Reported PAT 896 802 882 651 1,171 939 306 561 3,211 2,978E: MOSL Estimates
F Y 0 8 F Y 0 9
FMCG
3 February 2009 18
This report is for the personal information of the authorized recipient and does not construe to be any investment, legal or taxation advice to you. Motilal OswalSecurities Limited (hereinafter referred as MOSt) is not soliciting any action based upon it. This report is not for public distribution and has been furnished to you solelyfor your information and should not be reproduced or redistributed to any other person in any form.
The report is based upon information that we consider reliable, but we do not represent that it is accurate or complete, and it should not be relied upon such. MOSt orany of its affiliates or employees shall not be in any way responsible for any loss or damage that may arise to any person from any inadvertent error in the informationcontained in this report. MOSt or any of its affiliates or employees do not provide, at any time, any express or implied warranty of any kind, regarding any matterpertaining to this report, including without limitation the implied warranties of merchantability, fitness for a particular purpose, and non-infringement. The recipients ofthis report should rely on their own investigations.
MOSt and/or its affiliates and/or employees may have interests/ positions, financial or otherwise in the securities mentioned in this report. To enhance transparency,MOSt has incorporated a Disclosure of Interest Statement in this document. This should, however, not be treated as endorsement of the views expressed in the report.
Disclosure of Interest Statement
The MOSt group and its Directors own shares in the following companies covered in this report: Marico
MOSt has no broking relationships with the companies covered in this report.
MOSt is engaged in providing investment-banking services in the following companies covered in this report: Nil
This information is subject to change without any prior notice. MOSt reserves the right to make modifications and alternations to this statement as may be requiredfrom time to time. Nevertheless, MOSt is committed to providing independent and transparent recommendations to its clients, and would be happy to provideinformation in response to specific client queries.
For more copies or other information, contactInstitutional: Navin Agarwal. Retail: Manish Shah
Phone: (91-22) 39825500 Fax: (91-22) 22885038. E-mail: [email protected]
Motilal Oswal Securities Ltd, 3rd Floor, Hoechst House, Nariman Point, Mumbai 400 021
Related Documents