Mon. Not. R. Astron. Soc. 000, 000–000 (0000) Printed 8 October 2013 (MN L A T E X style file v1.4) Flat-spectrum symmetric objects with ∼ 1 kpc sizes I. The candidates Pedro Augusto, 1 J. Ignacio Gonzalez-Serrano, 2 Ismael Perez-Fournon, 3 and Peter N. Wilkinson, 4 1 Universidade da Madeira, Centro de Ciˆ encias Matem´aticas, Caminho da Penteada, 9000-390 Funchal, Portugal 2 Instituto de F´ ısica de Cantabria (CSIC-Universidad de Cantabria), 39005 Santander, Spain 3 Instituto de Astrof´ ısica de Canarias, c/ Via L´actea s/n, 38200 La Laguna, Tenerife, Spain 4 University of Manchester, Jodrell Bank Observatory, Macclesfield, Cheshire SK11 9DL, UK 8 October 2013 ABSTRACT In order to understand the origin and evolution of radio galaxies, searches for the youngest such sources have been conducted. Compact-medium symmetric objects (CSO-MSOs) are thought to be the earliest stages of radio sources, with possible ages of < ∼ 10 3 yrs for CSOs (< 1 kpc in size) and 10 4 –10 5 yrs for MSOs (1–15 kpc). From a literature selection in heterogeneous surveys, we have established a sample of 37 confirmed CSOs. In addition, we only found three confirmed flat-spectrum MSOs in the literature. The typical CSO resides on a z < ∼ 0.5 galaxy, has a flat radio spec- trum (α thin < 0.5; S ν ∝ ν −α ), is < 0.3 kpc in size, has an arm length ratio ≤ 2, and well-aligned (θ ≤ 20 ◦ ) opposite lobes with a flux density ratio ≤ 10. In order to populate the 0.3–1 kpc size range (large CSOs) and also in order to find more flat- spectrum MSOs, we have built a sample of 157 radio sources with α 4.85 1.40 < 0.5 that were resolved with the VLA-A 8.4 GHz. As first results, we have ‘rediscovered’ nine of the known CSO/MSOs while identifying two new ∼ 14 kpc MSOs and two candidate CSO/MSOs (which only lack redshifts for final classification). We were able to reject 61 of the remaining 144 objects from literature information alone. In the series of papers that starts with this one we plan to classify the remaining 83 CSO/MSO can- didates (thanks to radio and optical observations) as well as characterize the physical properties of the (likely) many 0.3–15 kpc flat-spectrum CSO/MSOs to be found. Key words: radio continuum: galaxies — galaxies: active — galaxies: evolution — galaxies: jets — galaxies: statistics. 1 INTRODUCTION 1.1 The evolution of extragalactic radio sources The origin and evolution of extragalactic radio sources is one of the outstanding problems in Astronomy (e.g. de Vries et al. 1998a) and has been a fundamental problem in the study of active galaxies and their nuclei (AGN). These come in a variety of sizes, from compact (< 1 kpc) to very large (> 1 Mpc). This wide range of sizes has been interpreted as evidence for size evolution of the radio structure (e.g. Blandford & Rees 1974; Carvalho 1985; Fanti et al. 1995; Readhead et al. 1996a,b). In the standard model of AGN, a central supermassive black hole, with ∼ 10 6 –10 9 M⊙ feeds on the material of the host galaxy to produce two opposing radio emitting jets, thus creating a symmetric source that might only be disturbed by the environment/speed of the jets, unless its source runs out of fuel. Mature radio galaxies fit into this picture and are mostly split up into Fanaroff & Riley (1974) type I and type II radio galaxies (FRI and FRII). Up to 10 5 times smaller, compact-medium symmetric objects (CSO-MSO) might be their precursors (e.g. Read- head et al. 1996a,b). Traditionally, CSO/MSOs have always been considered high-power radio sources. However, low-power sources must be considered as well, if we really want to tell a story about the evolution of small (and young) radio sources all the way until becoming large radio galaxies (FRII or FRI) — e.g. Marecki et al. (2003). Fanti et al. (1995) already pointed out the hypothesis of MSOs evolving not into FRIIs but into FRIs and despite their bias towards high-power CSSs they concluded that, really, only the most powerful MSOs could be the precursors of FRIIs. Similar conclusions were reached by Readhead et al. (1996b), while Middelberg et al. (2004) go as far as proposing the radio structure of NGC7674 (a c 0000 RAS

Welcome message from author
This document is posted to help you gain knowledge. Please leave a comment to let me know what you think about it! Share it to your friends and learn new things together.
Transcript
Mon. Not. R. Astron. Soc. 000, 000–000 (0000) Printed 8 October 2013 (MN LATEX style file v1.4)
Flat-spectrum symmetric objects with ∼ 1 kpc sizes
I. The candidates
Pedro Augusto,1 J. Ignacio Gonzalez-Serrano,2 Ismael Perez-Fournon,3
and Peter N. Wilkinson,41Universidade da Madeira, Centro de Ciencias Matematicas, Caminho da Penteada, 9000-390 Funchal, Portugal2Instituto de Fısica de Cantabria (CSIC-Universidad de Cantabria), 39005 Santander, Spain3Instituto de Astrofısica de Canarias, c/ Via Lactea s/n, 38200 La Laguna, Tenerife, Spain4University of Manchester, Jodrell Bank Observatory, Macclesfield, Cheshire SK11 9DL, UK
8 October 2013
ABSTRACTIn order to understand the origin and evolution of radio galaxies, searches for theyoungest such sources have been conducted. Compact-medium symmetric objects(CSO-MSOs) are thought to be the earliest stages of radio sources, with possibleages of <
∼ 103 yrs for CSOs (< 1 kpc in size) and 104–105 yrs for MSOs (1–15 kpc).From a literature selection in heterogeneous surveys, we have established a sample of37 confirmed CSOs. In addition, we only found three confirmed flat-spectrum MSOsin the literature. The typical CSO resides on a z <
∼ 0.5 galaxy, has a flat radio spec-trum (αthin < 0.5; Sν ∝ ν−α), is < 0.3 kpc in size, has an arm length ratio ≤ 2,and well-aligned (θ ≤ 20) opposite lobes with a flux density ratio ≤ 10. In order topopulate the 0.3–1 kpc size range (large CSOs) and also in order to find more flat-spectrum MSOs, we have built a sample of 157 radio sources with α4.85
1.40< 0.5 that
were resolved with the VLA-A 8.4 GHz. As first results, we have ‘rediscovered’ nine ofthe known CSO/MSOs while identifying two new ∼ 14 kpc MSOs and two candidateCSO/MSOs (which only lack redshifts for final classification). We were able to reject61 of the remaining 144 objects from literature information alone. In the series ofpapers that starts with this one we plan to classify the remaining 83 CSO/MSO can-didates (thanks to radio and optical observations) as well as characterize the physicalproperties of the (likely) many 0.3–15 kpc flat-spectrum CSO/MSOs to be found.
Key words: radio continuum: galaxies — galaxies: active — galaxies: evolution —galaxies: jets — galaxies: statistics.
1 INTRODUCTION
1.1 The evolution of extragalactic radio sources
The origin and evolution of extragalactic radio sources is oneof the outstanding problems in Astronomy (e.g. de Vrieset al. 1998a) and has been a fundamental problem in thestudy of active galaxies and their nuclei (AGN). These comein a variety of sizes, from compact (< 1 kpc) to very large(> 1 Mpc). This wide range of sizes has been interpretedas evidence for size evolution of the radio structure (e.g.Blandford & Rees 1974; Carvalho 1985; Fanti et al. 1995;Readhead et al. 1996a,b). In the standard model of AGN, acentral supermassive black hole, with ∼ 106–109 M⊙ feedson the material of the host galaxy to produce two opposingradio emitting jets, thus creating a symmetric source thatmight only be disturbed by the environment/speed of thejets, unless its source runs out of fuel. Mature radio galaxies
fit into this picture and are mostly split up into Fanaroff& Riley (1974) type I and type II radio galaxies (FRI andFRII). Up to 105 times smaller, compact-medium symmetricobjects (CSO-MSO) might be their precursors (e.g. Read-head et al. 1996a,b).
Traditionally, CSO/MSOs have always been consideredhigh-power radio sources. However, low-power sources mustbe considered as well, if we really want to tell a story aboutthe evolution of small (and young) radio sources all the wayuntil becoming large radio galaxies (FRII or FRI) — e.g.Marecki et al. (2003). Fanti et al. (1995) already pointedout the hypothesis of MSOs evolving not into FRIIs but intoFRIs and despite their bias towards high-power CSSs theyconcluded that, really, only the most powerful MSOs couldbe the precursors of FRIIs. Similar conclusions were reachedby Readhead et al. (1996b), while Middelberg et al. (2004)go as far as proposing the radio structure of NGC7674 (a
c© 0000 RAS
2 Augusto et al.
Seyfert galaxy) as the one of a (very weak) CSO. Begelman(1996) considered both hypothesis: lower power CSO/MSOswould evolve into FRIs while the high power ones wouldbecome FRIIs. In order to constrain models it is importantto extend the radio power range (Fanti et al. 2001).
For example, the square-root decrease with size of theluminosity from CSOs to FRIIs proposed by Begelman(1996) and Fanti et al. (1995), using the border value of1× 1025 W/Hz⋆, implies that a ∼ 1 Mpc FRII evolved froma 10 pc CSO with a > 3 × 1027 W/Hz power, through a10 kpc MSO with > 1×1026 W/Hz. This is why the total ra-dio power of CSO/MSOs was assumed to be ∼ 1026–1027h−2
W/Hz in earlier surveys (e.g. Phillips & Mutel 1982; Read-head et al. 1996a; Fanti et al. 1995; Murgia et al. 1999).Recent surveys (e.g. Kunert-Bajraszewska et al. 2005) in-clude much weaker sources.
‘Hot-spots’ in CSOs are so close (<1 kpc) to the nu-cleus that they might help towards the understanding ofthe central engines in AGN (Readhead et al. 1996a,b). Fur-thermore, they are unique probes to the physics of thegas clouds of the broad line-emitting region — Readheadet al. (1996a). MSOs, being larger (1–15 kpc), are ideal toprobe the ISM further away from the nucleus (including theclouds in the narrow line-emitting region (NLR) and ex-tended NLR). They might also be the middle link for thehypothetical evolution of CSOs into FRIIs or FRIs.
Assuming the jet to travel at the speed of light weget upper limits of 103−4 years for ∼ 1 kpc CSO/MSOs(large CSOs and small MSOs). Furthermore, kinematic mea-surements on ten CSOs (Giroletti et al. 2003; Ojha et al.2004; e.g. Polatidis & Conway 2003) give v ≃ 0.05–0.3h−1 c(hotspot advance speed) which, assuming constant speedssince source ignition (e.g. Readhead et al. 1996b), give agesof ∼300–2000 yrs. These are consistent with sychrotron losstime scales (∼ 1200–5000 yrs; e.g. Readhead et al. 1996a;Giroletti et al. 2003). CSOs evolve fast (c.f. FRIIs lobe ad-vance speed ∼ 0.06 c), explaining their ‘rarity’: only ∼10%of radio sources with compact structure are CSOs (Read-head et al. 1996a), getting down to 1% for the flat-spectrum(α4.85
1.40 < 0.5) largest CSOs and small MSOs (Augusto et al.1998).
There are still two possibilities for the origin ofCSO/MSOs, summarized in what follows.
Youth scenario: The most popular view is that in which
CSOs evolve into MSO/Compact Steep Spectrum Sources†
(CSSs; αthin > 0.5 with Sν ∝ ν−α) which, in turn, evolveinto FRIIs — e.g. Phillips & Mutel (1982); Carvalho (1985);
⋆ The formal boundary from Fanaroff & Riley (1974) is at178 MHz: 5.3 × 1025 W/Hz with our cosmology. A typical radiogalaxy (α1.4
0.178 = 0.8) has L1.4 = 1×1025 W/Hz while a flat spec-trum CSO/MSO (α1.4
0.178 = 0.4–0.5) has L1.4 = 2 × 1025 W/Hz.† The original definition is on Peacock & Wall (1982), with α5
2.7 ≥0.5 (now as far as α1.4
0.325 — e.g. Tschager et al. 2003), who alsodefine almost half of their sample as “compact” and with “steep”
spectra; in an historical perspective, up to this time compact ⇔flat spectrum and extended ⇔ steep spectrum. Phillips & Mutel(1982) demand an optically thin regime with α
ν2ν1
≥ 0.5, ν1, ν2 >
1 GHz. We define αthin from a full spectrum linear fit to the partthat is optically thin for frequencies greater than a given peak; ifthere is no peak, it is inferred to lie at some still unobserved lowfrequency and the full spectrum is used.
Begelman (1996); Readhead et al. (1996b); Kunert et al.(2002); Perucho & Martı (2002). The intermediate ∼ 1 kpcstage should be a CSS in the case of self-similar expan-sion (lobes expand with growth) or a flat-spectrum MSOin case the expansion is non-self-similar (hot spots remaincompact, if seen at all). Maybe less luminous CSOs evolveinto FRIs via a Giga-Hertz Peaked Spectrum Source (GPS)stage (O’Dea 1998; de Vries et al. 1998b).Re-born scenario: From an analytical model of the evo-
lution of double radio sources < 100 kpc, Alexander (2000)extended Kaiser & Alexander (1997) model to ∼ kpc scales:a population of ‘short-lived’ sources is predicted, where thejets are disrupted before reaching the ∼ 1 kpc core radius(King density profile) of the host galaxy. This could be inter-preted in the context of “re-birth”. For example, Baum et al.(1990) show the 47 pc CSO B0108+388 to have weak radioemission on tens of kpc scales; this might be an unrelatedsource or evidence for recurrent activity.
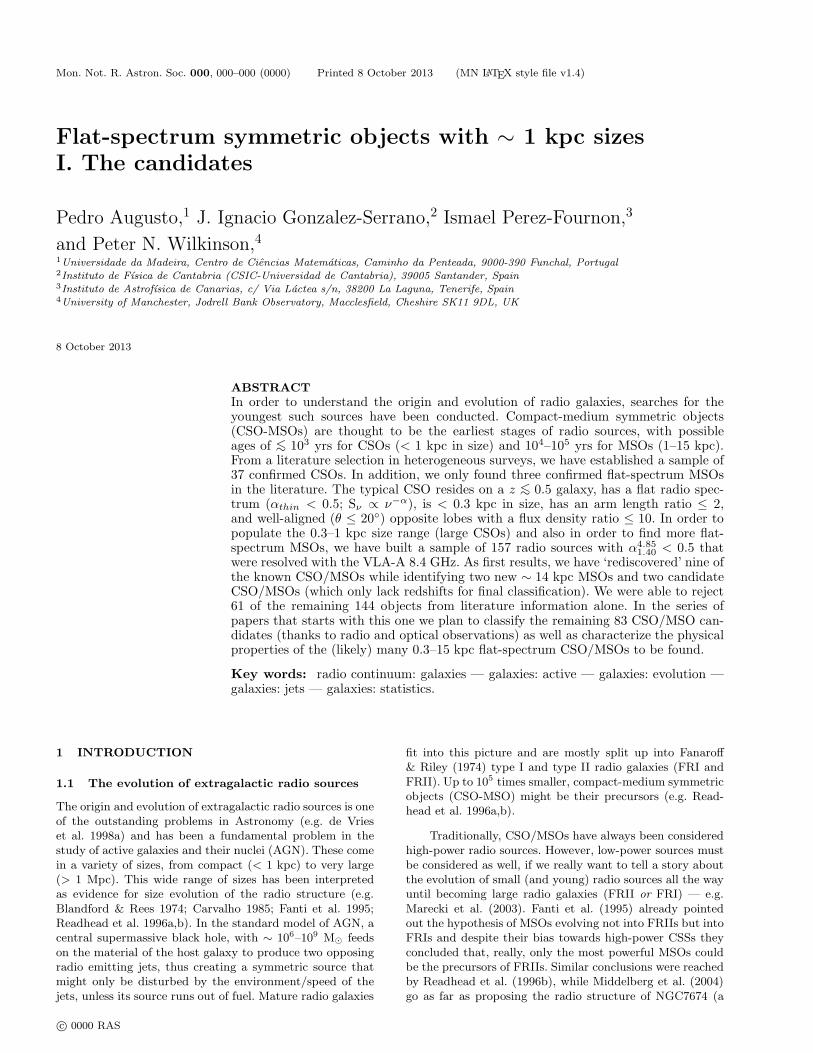
1.2 Definitions
Over the last twenty years, a panoply of names have beenused to classify < 15 kpc-sized sources which might be theprecursors of the much larger FRI/FRII radio galaxies. Usu-ally applied in the ‘young radio source’ context, we haveCSOs, MSOs, CSSs, GPSs, and, the oldest of all, compactdoubles (CDs). It is still disputed whether CSOs are in-cluded in the GPS class (e.g. Snellen et al. 1999, O’Dea 1998,Marecki et al. 1999 vs. Stanghellini et al. 1997a, Stanghelliniet al. 1999, Fassnacht & Taylor 2001). In Figure 1 we sum-marize the current (confused) status and in Table 1 wepropose a ‘non-grey zone’ radio classification for all thesesources, which can be used for the time being, at least op-erationally: since CSO/MSOs are a more homogenous classthan GPSs are (Fassnacht & Taylor 2001), we propose tosplit up the two main sets of ‘young sources’ into the onesselected by morphology (CSO/MSOs) and the ones selectedspectrally (CSS/GPSs). For CSO/MSOs, in particular, itshould be made clear that it is not necessarily true that anedge brighened lobe is an hotspot. It might just be a knot ina longer jet. However, the likelihood that we get two of thoseopposed to each other and they are not hotspots is small.It is on this basis that CSO/MSOs with only two compo-nents are confirmed. When we come to triple (and more)component sources the hotspot/edge-brightened lobe defini-tion relaxes: if we identify a central core component then wehave a CSO/MSO structure (even if no obvious hotspots oredge-brightening is seen in any terminal lobe).
Historically there has been a bias against steep-spectrum CSOs and flat-spectrum MSOs (e.g. the “CSO-finding” α < 0.5 Caltech-Jodrell Bank surveys (e.g. Wilkin-son et al. 1994); the “CSS (⊃MSO) finding” α > 0.5Bologna-Jodrell-Dwingeloo survey — e.g. Fanti et al. 1995).
1.2.1 CDs
Compact double (CD) is the name from where all namescome from: CSO/MSO/CSS/GPS. In fact, the classificationCD remains, for example, when no core is seen in a candidateCSO/MSO. Phillips & Mutel (1982) and Carvalho (1985)“compact symmetric (double) sources” were defined with no
c© 0000 RAS, MNRAS 000, 000–000
kiloparsec symmetric objects I. The candidates 3
(any α)CD (α > 0.5)CSS
GPSquasars
GPSgalaxies
(α = any)
size < 1 kpc size = 1 − 15 kpc
MSO (α > 0.5)GPS (α > 0.5)?
CSO(hitherto overlooked)
MSO (α < 0.5)
Figure 1. The currently messy (and incomplete) situation in the definition of CSOs, MSOs, CSSs, GPSs and CDs. CDs and CSSs coverall ranges of sizes. The latter includes GPSs and MSOs, the first generally < 1 kpc and the latter showing symmetric structure straddlinga (putative or not) central nucleus. CSOs also appear with flat-spectrum (α < 0.5) and, in this sense, they cannot be paralleled to GPSs(even if only the ones identified with galaxies); in any case, there is no evidence for complete overlap of GPSs and CSOs. MSOs with aflat-spectrum (upper right corner) have been overlooked.
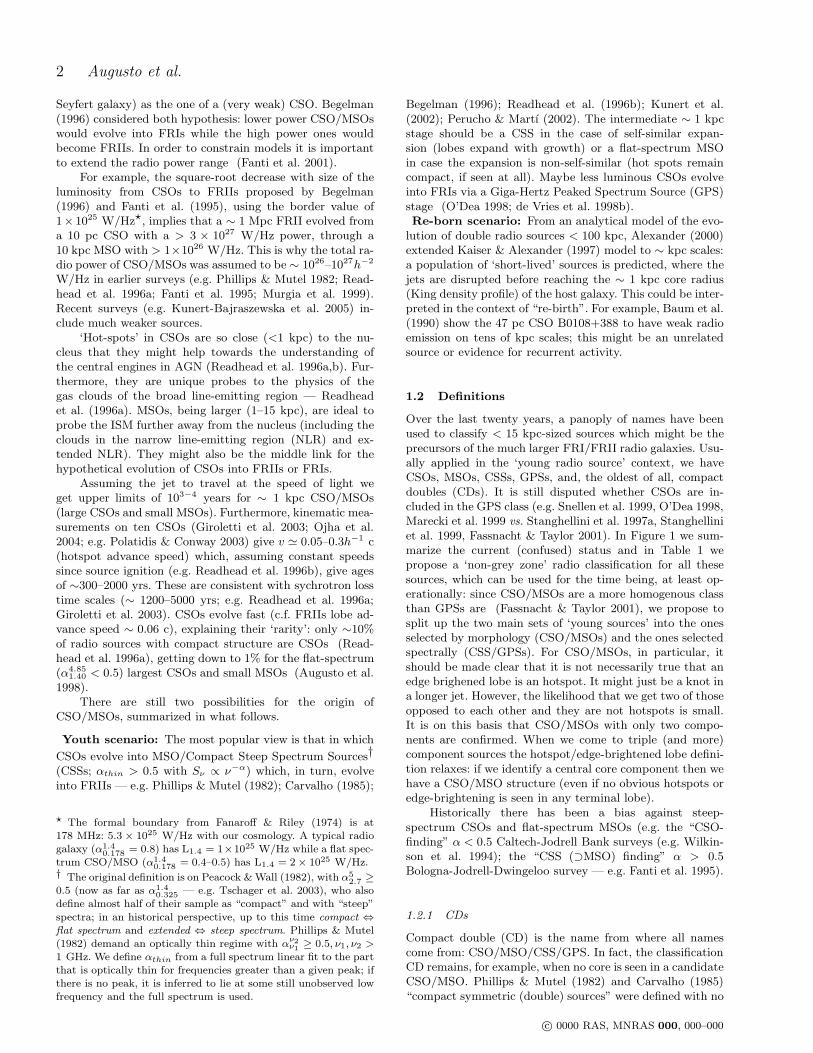
Table 1. Our proposed dual-view radio classification for CSOs, MSOs, CSSs and GPSs. CDs fall out of this picture since they canbe all or none (when one-sided core-jet sources). The scheme below must be viewed as operational only, since in the coming yearsmore knowledge of the sources involved might suggest a different one. Note that we give strict morphological criteria to confirm theclassification of CSO/MSOs; also that the latter are similar, apart from size (MSOs can be flat-spectrum radio sources).
Classification Two components (lobes) Three/more components
CSO edge-brightness clearlymorphological (<1 kpc) seen in both (one of the) central component(s)
MSO or kinematics show proved as the core(1–15 kpc) opposed motion
Spectral turnover GPS/CSS classification references
GPS 0.5–10 GHz Fanti et al. (1995)spectral (<1 kpc) de Vries et al. (1997)
(αthin > 0.5) CSS <∼0.1–0.5 GHz O’Dea (1998)(<15 kpc) Tschager et al. (2003)
central core and a ratio of flux density between the two lobes≤1.5, αthin ≥ 0.5 (except 3C394 with 0.4), sizes <0.1 kpc,ages 103–104 yrs, and v ≃ 0.2 c (theoretical lobe advancespeed).
1.2.2 CSOs (< 1 kpc)
A CSO (Wilkinson et al. 1994; Conway et al. 1994) isa compact radio source with two outer edge-brightenedlobes/hotspots or twin-jets plus a (possibly putative) cen-tral core. Symmetry is essential so, operationally, the armratio should be ≤ 10, although the flux density ratio (be-tween lobes) is not constrained (it is frequency-dependent).CSOs have weak polarization and variability (< 10% in a
few years): some are so stable that they might be excellentVLBI flux density calibrators — Fassnacht & Taylor (2001).
1.2.3 CSSs (<15 kpc)
This class of source, with a subgalactic size and a steepspectrum (αthin > 0.5), has more pronounced lobe flux den-sity ratios and/or arm ratios than CSOs (Fanti et al. 1990;Fanti et al. 1995; Dallacasa et al. 1995; Sanghera et al. 1995;O’Dea 1998). When with a spectrum peak at ν > 0.5 GHzthey are classified as GPSs (Section 1.2.4) while when sym-metric (most — e.g. Readhead et al. 1996a; Fanti et al. 1995;Kunert-Bajraszewska et al. 2005) they are called MSOs (Sec-tion 1.2.5). They show low radio polarizations and little vari-
c© 0000 RAS, MNRAS 000, 000–000
4 Augusto et al.
ability although up to an order of magnitude more variablethan the most stable CSOs (Fassnacht & Taylor 2001).
1.2.4 GPSs (< 1 kpc)
In most properties, GPSs are similar to CSSs. The main dif-ference is in the spectral peak (c.f. Table 1; e.g. Tornikoskiet al. 2001): the canonical turnover frequency of GPSs is1 GHz — de Vries et al. (1997). Also, many are highlyvariable (mostly identified with quasars — Torniainen et al.2005) jeopardizing their usual classification when based onlyon sparse spectral data points (both in observing epochs andin frequency) — Stanghellini et al. (1998) and Tornikoskiet al. (2001).
1.2.5 MSOs (1–15 kpc)
So far regarded as steep-spectrum sources, we here pointout the existence of α < 0.5 flat-spectrum MSOs (c.f. Sec-tions 2.3 and 4) as a hitherto not considered type of source(they fill the “empty corner” in Figure 1). Augusto et al.(1998) mention many candidates for such sources. Flat-spectrum MSOs could be the sources into which CSOs evolvewhen the expansion is non-self-similar (de Young 1997;Tschager et al. 2000). The statistics of MSOs are relevantin order to inspect which evolutionary scenario (non-self-similar vs. self-similar expansion) dominates.
1.3 The optical hosts
Not much is known at optical wavelengths about CSOs sinceonly a few cases have been studied (Taylor et al. 1997).Readhead et al. (1996a) and Bondi et al. (1998) found thatthe hosts of five CSOs are mostly mV ∼ 20–22 ellipticalgalaxies (0.3–1 L∗) with strong narrow emission lines; thecontinuum is characteristic of an old stellar population. De-tailed HST views of three nearby (z <∼ 0.1) CSOs (Perlmanet al. 2001) confirm residence in normal ellipticals but withten times more dust than radio elliptical galaxies.
A lot more is known in the optical about CSS/GPSs,which have similar redshift distributions and have as hosts0.1 <∼ z <∼ 1 regular giant elliptical galaxies (many interact-ing), like FRIIs do, a fact consistent with a GPS → CSS →FRII source evolution (O’Dea 1998; de Vries et al. 2000).GPS galaxies (z ∼ 0.3) show a CSO morphology while thequasars (z ∼ 2) do not (O’Dea et al. 1991; de Vries et al.1998b; Snellen et al. 1999; Stanghellini et al. 2001).
1.4 This paper
The total number of confirmed CSOs is relatively small (37— Section 2; 25 have linear size information) for a two or-ders of magnitude size range (0.01–1 kpc). Worse, only threeα < 0.5 flat-spectrum MSOs (1–15 kpc) and four ‘largeCSOs’ (0.3–1 kpc) are confirmed, so far. The lack of ‘largeCSOs’ and flat-spectrum MSOs might be explained by aCSO ‘preferred’ evolution into CSSs (e.g. Section 1.1; Au-gusto et al. 1998), but we need better statistics.
The aim of the series of papers which starts with thisone is to find a fairly large number of α4.85
1.40 < 0.5 flat-spectrum CSO/MSOs with ∼kpc sizes (large CSOs and
MSOs). We start by establishing the current sample of con-firmed CSOs as well as describing their overall properties(Section 2). In Section 3 we build up a 157-source sam-ple out of which we expect a few tens to be confirmed asCSO/MSOs when our study is complete. We conclude witha brief summary (Section 4).
Throughout the paper we use an Ωm = 0.3, ΩΛ = 0.7,H0 = 75 km/s/Mpc cosmology.
2 CONFIRMED SYMMETRIC SOURCES
The literature abounds with examples of confirmed CSOs(summarized in Section 2.1) while MSOs are only abundantas CSSs, i.e., with a steep spectrum. Flat-spectrum MSOsare rare (Section 2.3).
2.1 The sample of CSOs
In Table 2 we present all currently known confirmed CSOs,proved as such from maps (or kinematics, in a few cases)in our extensive literature search. We were very rigorous inour classification, using the criteria of Table 1. All relevantmaps/information have been compiled and carefully scru-tinized before listing a given CSO as “confirmed” beyondany reasonable doubt. Everytime the candidate had threeor more components (even when some doubt remains aboutwhich of the central components really is the core), we re-quired a confirmed central core usually from, at least, two-frequency data. If having only two components, they mustbe edge-brightened lobes: assumed is a putative central core(c.f. Taylor et al. 1996a; Taylor & Vermeulen 1997; Bondiet al. 1998; Polatidis et al. 1999). ‘Hotspots’ are not neces-sarily required for sources with three (or more) components;all we need is emission on both sides of the core (even if jet-like). This is the usual way CSOs have been identified (see,for example, Readhead et al. 1996a; Stanghellini et al. 1997a;Peck & Taylor 2000). Since CSOs have sizes < 1 kpc, we re-jected all sources with size > 1 kpc and since, by definition,they are symmetric sources (e.g. Readhead et al. 1996a,b),we ruled out any with an arm ratio R > 10. Figure 2 definesand explains the calculation of the radio map parameters inColumns (10) and (13)–(16) of Table 2.
In five CSOs studied, Taylor et al. (1996a) find consid-erable flux density ratio asymmetries in the two opposingjets, possibly due to differences in density of the surround-ing medium (Stanghellini et al. 1997a). Furthermore, fluxdensity ratios depend on frequency. Hence, it seems moredangerous to place a limit on such ratio and we do not doit. We also do not constrain arm angles (column (16) of Ta-ble 2) since, for example, we have φ = 148 (misalignment θis 32) for a ‘classic’ CSO (B2021+614) and only three CSOsin the Table are more misaligned (reaching a minimum ofφ = 134 for B1543+005, a Peck & Taylor (2000) CSO).
Comments on the sources marked with ∗ in Column (1)of Table 2 follow: B0046+316: This is a Sy2 galaxy; it pos-sibly has a core-jet radio structure in a weird geometry (An-ton et al. 2002). B0424+414, B0500+019, B0646+600,B0703+468, B0710+439: These sources are also classi-fied as GPSs (e.g. O’Dea et al. 1991; Marecki et al. 1999;Stanghellini et al. 2001). B1934-638: This is the archetypeGPS (e.g. Tzioumis et al. 1989).
c© 0000 RAS, MNRAS 000, 000–000
kiloparsec symmetric objects I. The candidates 5
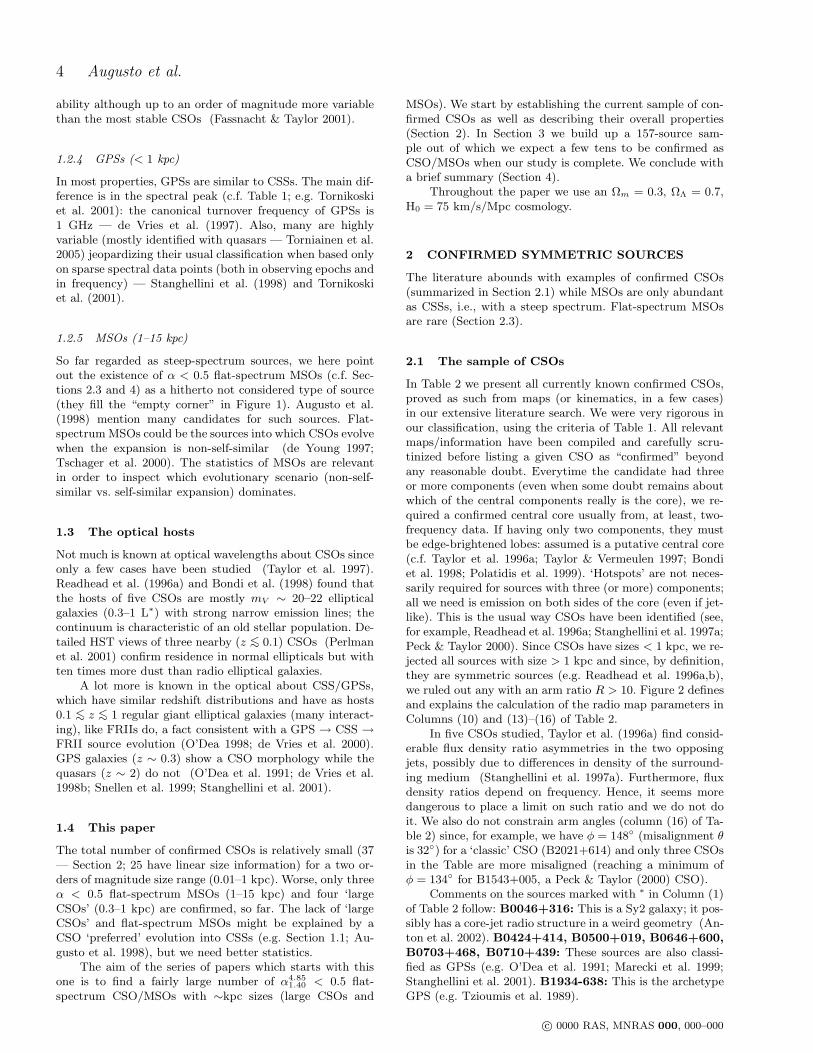
Figure 2. In order to help understanding the parameters mea-sured for each source in Columns (10) and (13)–(16) of Table 2, wehere present a case with an actually located core (without which,only Columns (10), (13) and (14) might have values). Most mapsin the literature are presented, like this one, with the lowest con-tour at three times the r.m.s. noise on the map (3σ). Then, inorder to estimate its angular size (LAS), we measure the largest
possible extent on the 6σ contour. Next, we locate the core andeach lobe peak (marked with crosses) and immeditately identifythe strongest lobe (bl) from the contours alone, deriving a peakflux density estimate. The same is made for the faintest lobe (fl)and the nucleus, whereby calculating the values in Columns (13)and (14). Finally, joining by segments the crosses that correspondto the two lobes and the nucleus, we estimate φ (Column (16))and R = a1
a2, a1 > a2 (Column (15)).
2.2 Statistics
Since all confirmed and candidate CSOs of Table 2 have beenextracted from different samples in the literature with noother selection criteria except for morphology, the statisticalresults must be taken with caution since they might not berepresentative of the CSO class. We list 41 sources in Table 2out of which four (labelled “CSO?”) still might be MSOs iftheir sizes turn out to be 1–15 kpc: we keep them in thetable until we have enough data to finally classify them.This leaves us with 37 certain CSOs which we use in thestatistical study that follows.
The optical information on the 27 CSOs that do haveit (73% completeness) shows that galaxies are clearly thetypical host (23 or 85%) while only four sources (15%), atmost, reside in quasars. In Figure 3 we present the redshiftdistribution of the sample (25 sources; 68% complete). Weclearly see a concentration towards low redshifts, with 17(68%) sources at z < 0.5, implying a nearby galactic hostpopulation. In fact, except for one quasar, all CSOs reside
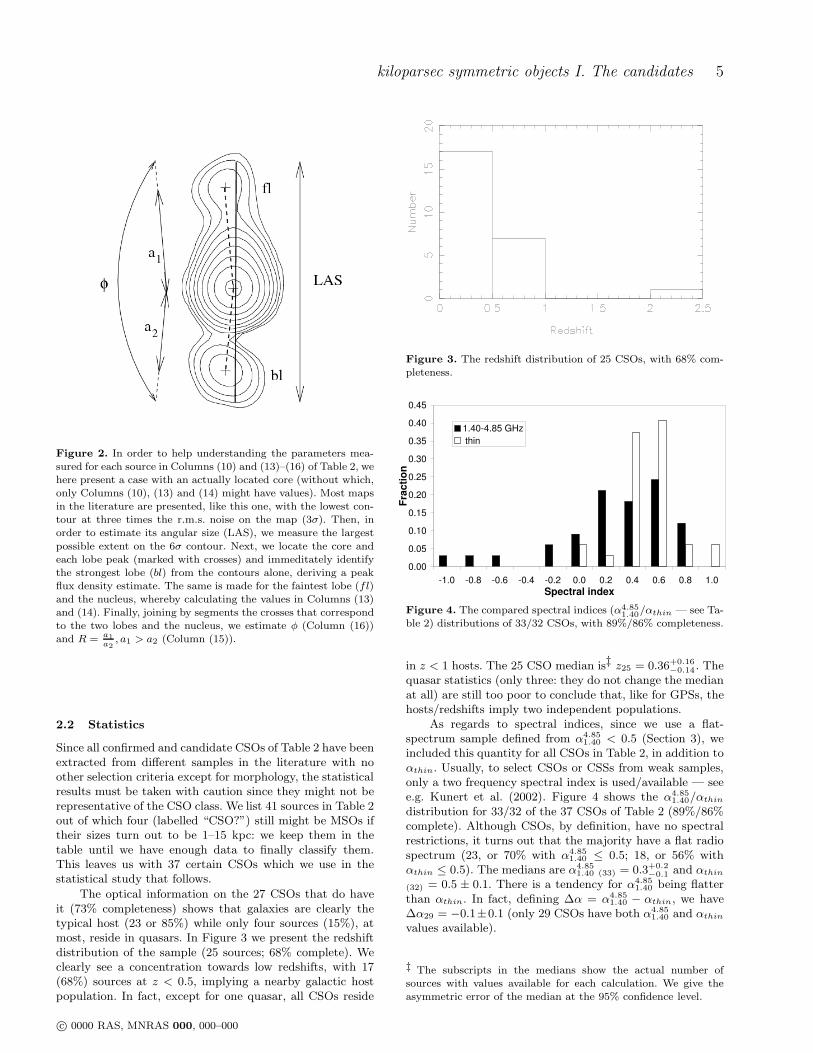
Figure 3. The redshift distribution of 25 CSOs, with 68% com-pleteness.
0.00
0.05
0.10
0.15
0.20
0.25
0.30
0.35
0.40
0.45
-1.0 -0.8 -0.6 -0.4 -0.2 0.0 0.2 0.4 0.6 0.8 1.0
Spectral index
Fra
cti
on
1.40-4.85 GHz
thin
Figure 4. The compared spectral indices (α4.851.40/αthin — see Ta-
ble 2) distributions of 33/32 CSOs, with 89%/86% completeness.
in z < 1 hosts. The 25 CSO median is‡ z25 = 0.36+0.16−0.14 . The
quasar statistics (only three: they do not change the medianat all) are still too poor to conclude that, like for GPSs, thehosts/redshifts imply two independent populations.
As regards to spectral indices, since we use a flat-spectrum sample defined from α4.85
1.40 < 0.5 (Section 3), weincluded this quantity for all CSOs in Table 2, in addition toαthin. Usually, to select CSOs or CSSs from weak samples,only a two frequency spectral index is used/available — seee.g. Kunert et al. (2002). Figure 4 shows the α4.85
1.40/αthin
distribution for 33/32 of the 37 CSOs of Table 2 (89%/86%complete). Although CSOs, by definition, have no spectralrestrictions, it turns out that the majority have a flat radiospectrum (23, or 70% with α4.85
1.40 ≤ 0.5; 18, or 56% withαthin ≤ 0.5). The medians are α4.85
1.40 (33) = 0.3+0.2−0.1 and αthin
(32) = 0.5 ± 0.1. There is a tendency for α4.851.40 being flatter
than αthin. In fact, defining ∆α = α4.851.40 − αthin, we have
∆α29 = −0.1±0.1 (only 29 CSOs have both α4.851.40 and αthin
values available).
‡ The subscripts in the medians show the actual number ofsources with values available for each calculation. We give theasymmetric error of the median at the 95% confidence level.
c© 0000 RAS, MNRAS 000, 000–000
6 Augusto et al.
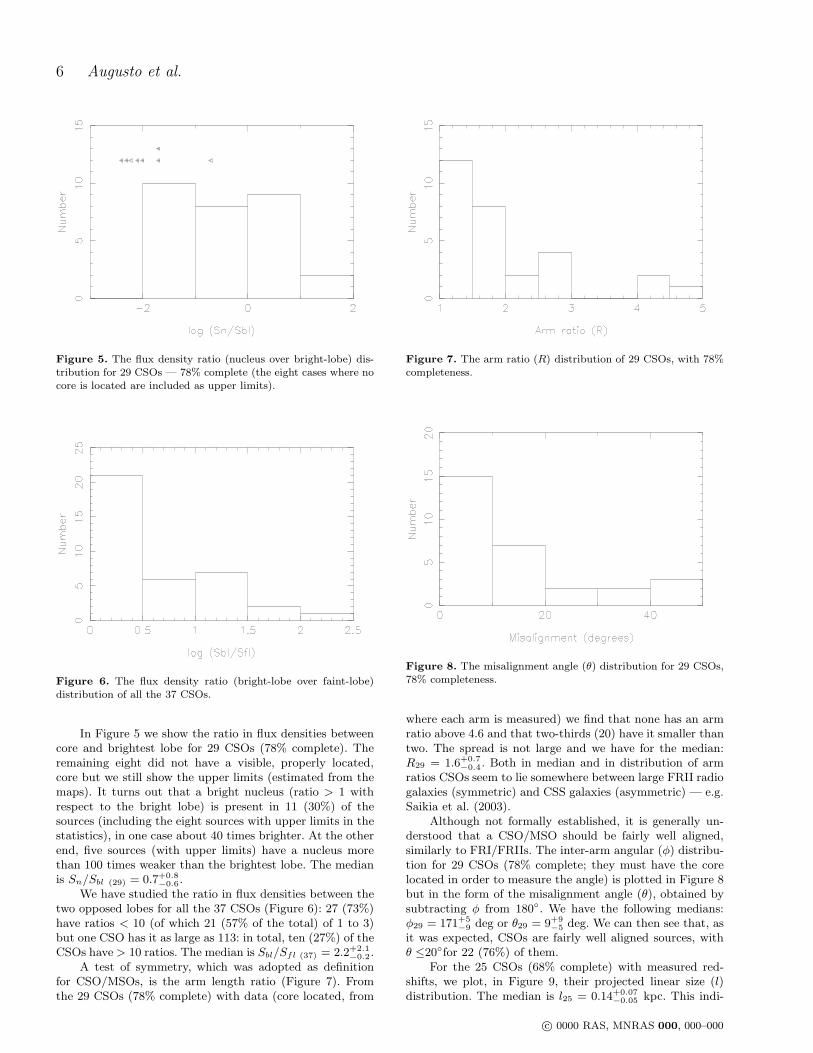
Figure 5. The flux density ratio (nucleus over bright-lobe) dis-tribution for 29 CSOs — 78% complete (the eight cases where nocore is located are included as upper limits).
Figure 6. The flux density ratio (bright-lobe over faint-lobe)distribution of all the 37 CSOs.
In Figure 5 we show the ratio in flux densities betweencore and brightest lobe for 29 CSOs (78% complete). Theremaining eight did not have a visible, properly located,core but we still show the upper limits (estimated from themaps). It turns out that a bright nucleus (ratio > 1 withrespect to the bright lobe) is present in 11 (30%) of thesources (including the eight sources with upper limits in thestatistics), in one case about 40 times brighter. At the otherend, five sources (with upper limits) have a nucleus morethan 100 times weaker than the brightest lobe. The medianis Sn/Sbl (29) = 0.7+0.8
−0.6.We have studied the ratio in flux densities between the
two opposed lobes for all the 37 CSOs (Figure 6): 27 (73%)have ratios < 10 (of which 21 (57% of the total) of 1 to 3)but one CSO has it as large as 113: in total, ten (27%) of theCSOs have > 10 ratios. The median is Sbl/Sfl (37) = 2.2+2.1
−0.2.A test of symmetry, which was adopted as definition
for CSO/MSOs, is the arm length ratio (Figure 7). Fromthe 29 CSOs (78% complete) with data (core located, from
Figure 7. The arm ratio (R) distribution of 29 CSOs, with 78%completeness.
Figure 8. The misalignment angle (θ) distribution for 29 CSOs,78% completeness.
where each arm is measured) we find that none has an armratio above 4.6 and that two-thirds (20) have it smaller thantwo. The spread is not large and we have for the median:R29 = 1.6+0.7
−0.4. Both in median and in distribution of armratios CSOs seem to lie somewhere between large FRII radiogalaxies (symmetric) and CSS galaxies (asymmetric) — e.g.Saikia et al. (2003).
Although not formally established, it is generally un-derstood that a CSO/MSO should be fairly well aligned,similarly to FRI/FRIIs. The inter-arm angular (φ) distribu-tion for 29 CSOs (78% complete; they must have the corelocated in order to measure the angle) is plotted in Figure 8but in the form of the misalignment angle (θ), obtained bysubtracting φ from 180. We have the following medians:φ29 = 171+5
−9 deg or θ29 = 9+9−5 deg. We can then see that, as
it was expected, CSOs are fairly well aligned sources, withθ ≤20for 22 (76%) of them.
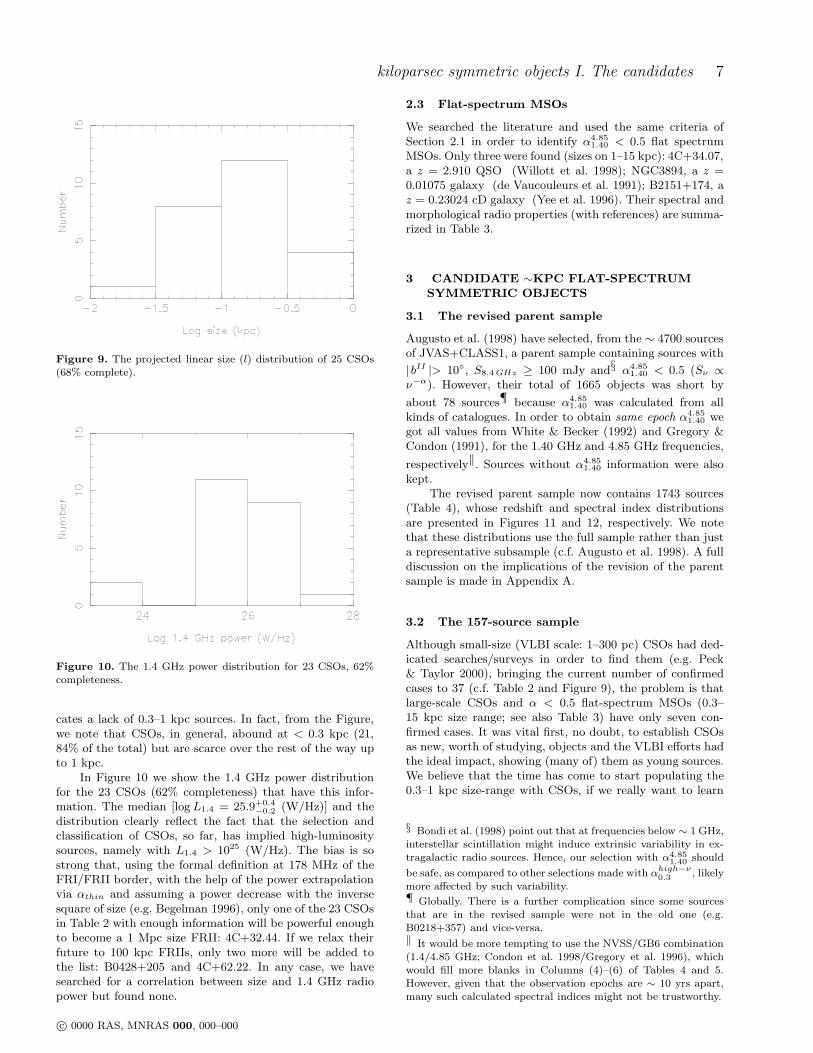
For the 25 CSOs (68% complete) with measured red-shifts, we plot, in Figure 9, their projected linear size (l)distribution. The median is l25 = 0.14+0.07
−0.05 kpc. This indi-
c© 0000 RAS, MNRAS 000, 000–000
kiloparsec symmetric objects I. The candidates 7
Figure 9. The projected linear size (l) distribution of 25 CSOs(68% complete).
Figure 10. The 1.4 GHz power distribution for 23 CSOs, 62%completeness.
cates a lack of 0.3–1 kpc sources. In fact, from the Figure,we note that CSOs, in general, abound at < 0.3 kpc (21,84% of the total) but are scarce over the rest of the way upto 1 kpc.
In Figure 10 we show the 1.4 GHz power distributionfor the 23 CSOs (62% completeness) that have this infor-mation. The median [log L1.4 = 25.9+0.4
−0.2 (W/Hz)] and thedistribution clearly reflect the fact that the selection andclassification of CSOs, so far, has implied high-luminositysources, namely with L1.4 > 1025 (W/Hz). The bias is sostrong that, using the formal definition at 178 MHz of theFRI/FRII border, with the help of the power extrapolationvia αthin and assuming a power decrease with the inversesquare of size (e.g. Begelman 1996), only one of the 23 CSOsin Table 2 with enough information will be powerful enoughto become a 1 Mpc size FRII: 4C+32.44. If we relax theirfuture to 100 kpc FRIIs, only two more will be added tothe list: B0428+205 and 4C+62.22. In any case, we havesearched for a correlation between size and 1.4 GHz radiopower but found none.
2.3 Flat-spectrum MSOs
We searched the literature and used the same criteria ofSection 2.1 in order to identify α4.85
1.40 < 0.5 flat spectrumMSOs. Only three were found (sizes on 1–15 kpc): 4C+34.07,a z = 2.910 QSO (Willott et al. 1998); NGC3894, a z =0.01075 galaxy (de Vaucouleurs et al. 1991); B2151+174, az = 0.23024 cD galaxy (Yee et al. 1996). Their spectral andmorphological radio properties (with references) are summa-rized in Table 3.
3 CANDIDATE ∼KPC FLAT-SPECTRUMSYMMETRIC OBJECTS
3.1 The revised parent sample
Augusto et al. (1998) have selected, from the ∼ 4700 sourcesof JVAS+CLASS1, a parent sample containing sources with
|bII |> 10, S8.4 GHz ≥ 100 mJy and§ α4.851.40 < 0.5 (Sν ∝
ν−α). However, their total of 1665 objects was short by
about 78 sources¶ because α4.851.40 was calculated from all
kinds of catalogues. In order to obtain same epoch α4.851.40 we
got all values from White & Becker (1992) and Gregory &Condon (1991), for the 1.40 GHz and 4.85 GHz frequencies,
respectively‖. Sources without α4.851.40 information were also
kept.The revised parent sample now contains 1743 sources
(Table 4), whose redshift and spectral index distributionsare presented in Figures 11 and 12, respectively. We notethat these distributions use the full sample rather than justa representative subsample (c.f. Augusto et al. 1998). A fulldiscussion on the implications of the revision of the parentsample is made in Appendix A.
3.2 The 157-source sample
Although small-size (VLBI scale: 1–300 pc) CSOs had ded-icated searches/surveys in order to find them (e.g. Peck& Taylor 2000), bringing the current number of confirmedcases to 37 (c.f. Table 2 and Figure 9), the problem is thatlarge-scale CSOs and α < 0.5 flat-spectrum MSOs (0.3–15 kpc size range; see also Table 3) have only seven con-firmed cases. It was vital first, no doubt, to establish CSOsas new, worth of studying, objects and the VLBI efforts hadthe ideal impact, showing (many of) them as young sources.We believe that the time has come to start populating the0.3–1 kpc size-range with CSOs, if we really want to learn
§ Bondi et al. (1998) point out that at frequencies below ∼ 1 GHz,interstellar scintillation might induce extrinsic variability in ex-tragalactic radio sources. Hence, our selection with α4.85
1.40 should
be safe, as compared to other selections made with αhigh−ν0.3 , likely
more affected by such variability.¶ Globally. There is a further complication since some sourcesthat are in the revised sample were not in the old one (e.g.B0218+357) and vice-versa.‖ It would be more tempting to use the NVSS/GB6 combination(1.4/4.85 GHz; Condon et al. 1998/Gregory et al. 1996), whichwould fill more blanks in Columns (4)–(6) of Tables 4 and 5.However, given that the observation epochs are ∼ 10 yrs apart,many such calculated spectral indices might not be trustworthy.
c© 0000 RAS, MNRAS 000, 000–000
8 Augusto et al.
Table 3. The three confirmed MSOs from the literature. The description for each column is as in Table 2 (columns (10)–(18)). Referencesfor the radio maps on the three sources: Dallacasa et al. (1995); Beasley et al. (2002); Fomalont et al. (2000); Spencer et al. (1989);Taylor et al. (1994); Taylor et al. (1998); Augusto et al. (1998); Augusto et al. (2005).
(1) (2) (3) (4) (5) (6) (7) (8) (9)Source α4.85
1.40 αthin LAS (′′) [l (kpc)] Sn/Sbl Sbl/Sfl R φ L1.4
4C+34.07 0.41 0.3s 1.851.7 (12.85) * 111.7 6.71.7 1.21.7 1741.7 26.8NGC3894 −0.33 −0.25
3 6.54 (1.34) 6.0 3.4 1.0 180 22.9B2151+174 0.13 0.33 0.49 (1.58) 15 3.7 1.7 166 25.2
Table 4. The parent sample of 1743 flat-spectrum (α4.851.40 < 0.5) radio sources (extract only — the complete version can be found at
CDS, ftp://cdsarc.u-strasbg.fr). Description of each column: (1): The source name (J2000.0); (2,3): position (J2000.0); (4): 1.40 GHzflux density from White & Becker (1992) — generally; < 110 mJy conservative upper limits are placed on some sources which werecovered in the sky survey but were not detected down to the ∼ 100 mJy treshold; other limits are for sources not covered in the surveyand observed with NVSS — Condon et al. 1998 (total flux density of all detected components within a 10′radius); (5): 4.85 GHz fluxdensity from Gregory & Condon (1991); (6): spectral index, calculated from Columns (4) and (5) using the convention Sν ∝ ν−α; (7):redshift; (8): reference for the redshift; (9): note/comment.
(1) (2) (3) (4) (5) (6) (7) (8) (9)Name RA (2000) Dec (2000) S1.40 S4.85 α4.85
1.40 z Ref. Note(mJy) (mJy)
J0457+067 04 57 07.7102 06 45 07.275 < 571 435 < 0.22 0.405 45J0458+201 04 58 29.8726 20 11 35.997 170 163 0.03J0459+024 04 59 52.0509 02 29 31.176 1752 1689 0.03 2.384 7J0501+139 05 01 45.2706 13 56 07.218 235 468 -0.55J0501+714 05 01 45.7829 71 28 33.977 < 110 148 < −0.23J0502+061 05 02 15.4466 06 09 07.507 1016 929 0.07 1.106 45J0502+136 05 02 33.2194 13 38 10.949 581 504 0.11J0503+020 05 03 21.1972 02 03 04.674 2118 1888 0.09 0.58457 21J0503+660 05 03 56.4447 66 00 31.503 < 110 158 < −0.29J0505+049 05 05 23.1850 04 59 42.723 659 964 -0.31 0.954 45J0505+641 05 05 40.9360 64 06 26.316 356 214 0.41J0508+845 05 08 42.3648 84 32 04.543 A
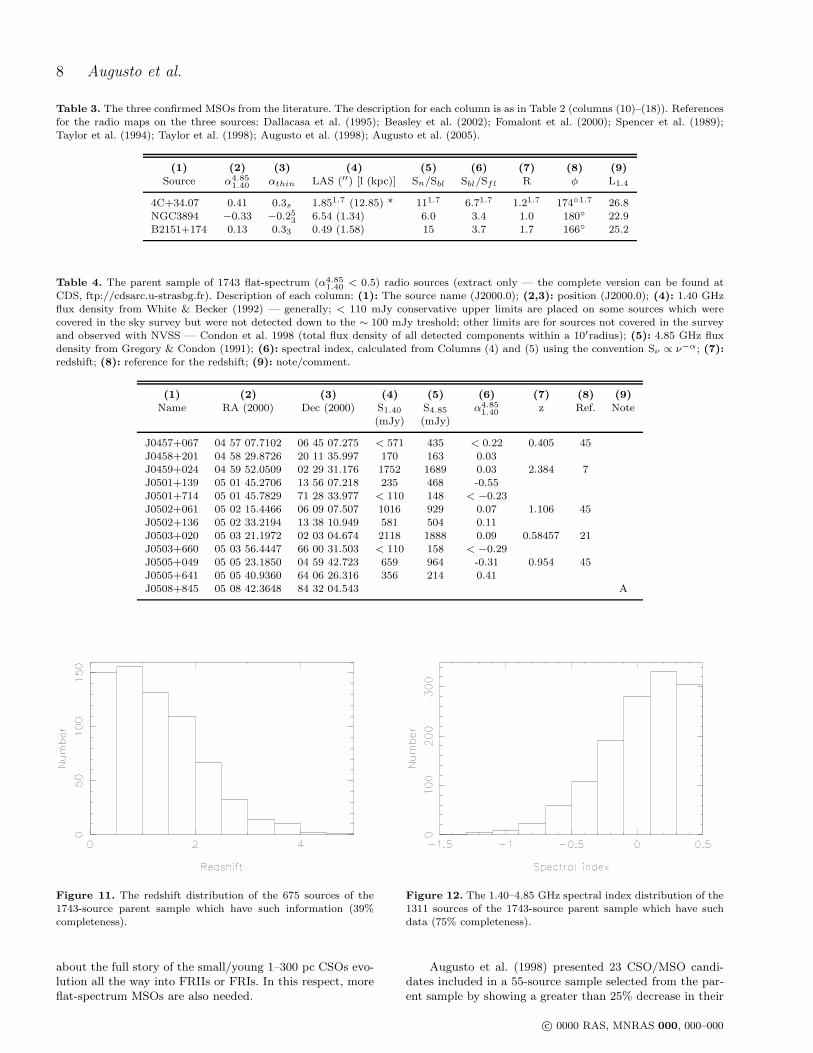
Figure 11. The redshift distribution of the 675 sources of the1743-source parent sample which have such information (39%completeness).
about the full story of the small/young 1–300 pc CSOs evo-lution all the way into FRIIs or FRIs. In this respect, moreflat-spectrum MSOs are also needed.
Figure 12. The 1.40–4.85 GHz spectral index distribution of the1311 sources of the 1743-source parent sample which have suchdata (75% completeness).
Augusto et al. (1998) presented 23 CSO/MSO candi-dates included in a 55-source sample selected from the par-ent sample by showing a greater than 25% decrease in their
c© 0000 RAS, MNRAS 000, 000–000
kiloparsec symmetric objects I. The candidates 9
8.4 GHz VLA-A visibilities (usually corresponding to strongradio features with <7:1 flux density ratio and >∼ 0.′′1 apart;at z > 0.2, the projected linear size is >∼ 0.3 kpc). However,the 55-source sample was biased towards finding gravita-tional lenses: many sources were excluded from their finalsample using a further surface brightness criterion in thatsources with a bright and compact component plus otherfainter and resolved components would be rejected (as wellas any sources with dominant components > 0.′′3 apart) —the full details are in Augusto (1996).
Since we now do not apply to the parent sample any ofthose extra criteria and only use the visibility criterion, weend up with a sample that includes 157 objects (includingthe 55 sources of Augusto et al. 1998) — Table 5, some ofwhich are very extended objects. We do not claim that thissub-sample of 157 CSO/MSO candidates is complete sinceneither is JVAS for the reasons presented, e.g, in Augustoet al. (1998) and Patnaik et al. (1992a).
Using the same classification criteria as for building Ta-ble 2 (mentioned in Table 1), a literature search ruled out61 sources as CSO/MSO candidates, also “rediscovering”nine of the CSO/MSOs in Table 2/Section 2.3 (including“CSO?” cases). We have discovered two new ∼ 14 kpc MSOs(J0751+826, J1454+299) and two CSO/MSOs (4C+66.09,J2055+287; a redshift is needed for each, for final classifi-cation; the latter case can be an MSO only if its redshift is< 0.09).
An obvious test to our criteria would be to check howmany of the northern hemisphere confirmed flat-spectrum(α4.85
1.40 < 0.5) CSOs in Table 2 were not selected by us fromthe parent sample, and why. To identify them it is easy,since they are the ones that are both in Tables 2 and 4and not in Table 5: they total to 13, of which 12 have sizes≤ 40 mas, hence they would never have been selected byour criteria. Recalling that we typically can only identifysources that have, at least, two components >∼ 0.′′1 apartand with < 7 : 1 flux density ratio at 8.4 GHz, as regardsto the only remaining (B1413+135), although with a globalsize of ∼ 0.′′18, it has a very faint lobe (Sn/Sfl ≃ 35) whilethe bright lobe (Sn/Sbl ≃ 1.6) is too close to the nucleus(∼35 mas). So, it could not have been selected.
In what follows we describe in detail the sources thatrefer to the text in Table 5:
J0013+778: This is a bright core large symmetric ob-ject (LSO), which has detailed information with 1.6 GHzVLBI (Polatidis et al. 1995) and 1.4 GHz VLA (Xu et al.1995). We locate its core thanks to the JVAS map, since at8.4 GHz with the VLA-A the middle VLBI component hasthe most inverted spectrum of all while the northeast com-ponent also shows a more modest inverted spectrum; the oneof the southwest component is very steep. The overall sizeis about 8′′ in a north-south direction (thanks to further,weaker VLA 1.4 GHz components) which, at its redshift of0.326, gives it ∼ 32 kpc.
4C+36.01: This is a radio galaxy with an extended halo,giving it an overall size of ∼ 40 kpc, as can be seen in a VLA1.4 GHz map (Taylor et al. 1996b).
J0123+307: This source is a good example on why JVASis not a complete sample. As explained (and imaged) in de-tail in Augusto (1996) this is, in fact, a VLBA point source(500:1 map) that had its position in error by an amount suf-
ficient to cause bandwidth smearing and confuse our visibil-ity selection criterion (see also Augusto et al. 1998; Patnaiket al. 1992a).J0259+426: As for the previous source, this was also a
JVAS failure and the selection was made erroneously. Al-though not quite a VLBI point source (it is a triple source∼ 15 mas in size — Henstock et al. 1995) it should neverhave been selected.3C108: This is a triple source with a candidate core at
the centre from a MERLIN 1.7 GHz map in Saikia et al.(1990). In JVAS, the 8.4 GHz VLA-A map confirms thecentral component as a core (α8.4
1.7 ≃ 0.2) while the sourceredshift of 1.215 implies that its 5.′′88 angular size meansa linear projected size of ∼40 kpc. Hence, this source isrejected.J0654+427: Bondi et al. (2001) give two VLBI maps at
different resolutions (and frequencies: 1.6 and 4.9 GHz) thatleave no room for doubt that the structure is that of a core-jet source rather than a CSO/MSO: the brightest componentin both images is the core since it has α4.9
1.6 = 0.0 (usingpeak brightnesses), likely becoming inverted if model fittingis applied.J0656+321: Yet another source that is an example of why
JVAS is not a complete sample. As explained (and imaged)in detail in Augusto (1996) this is, in fact, a MERLIN pointsource (670:1 map) that had its position in error by anamount sufficient to cause significant bandwidth smearing(see also Augusto et al. 1998; Patnaik et al. 1992a).J0751+826: Also presenting VLBI compact structure
(Polatidis et al. 1995; Xu et al. 1995), with an easily identi-fied core, the large scale structure of this source, easily seenin the VLA-A 8.4 GHz map of JVAS, looks like a ∼ 2′′ wide-angle tail. Its 1.991 redshift implies a global size of ∼ 14 kpc,just at the border of still classifying it as an MSO.J0815+019: This source is in the appendix of Augusto
et al. (1998), discarded by them from the 55-source sample(due to an erroneous spectral index evaluation — see Sec-tion 3.1). It is now recovered into the 157-source sample. Au-gusto et al. (1998) presented a MERLIN 5 GHz map of thesource. We must locate the core in future multi-frequencyfollow ups.J0817+324: As explained (and imaged) in detail in Au-
gusto (1996) this is, in fact, a MERLIN point source (500:1map) that had its position in error by an amount sufficientto cause significant bandwidth smearing (see also Augustoet al. 1998; Patnaik et al. 1992a).J0837+584: All evidence seems to point to a core-jet
source. In addition to the JVAS map and visibility, hinting ata strong unresolved component plus a very weak and distant(∼ 0.′′6 away) blob, the two frequency 1.6 and 5 GHz VLBImaps of Polatidis et al. (1995) and Xu et al. (1995) locatethe nucleus as the westernmost component, with α5
1.6 = 0.15as opposed to the α5
1.6 = 1.4 value of the other strong com-ponent ∼ 8 mas away.J0855+578: This source was observed with the VLBA at
5 GHz by Taylor et al. (2005). It has one of the lobes edge-brightened but the other is not so convincing. There is nocore detected. We must find a core with higher frequencyobservations, or a more convincing structure to pass ourstrict criterion for a CSO confirmation; Taylor et al. (2005)have not managed to detect this (weak) source at 15 GHz.4C+66.09: This source is in the appendix of Augusto
c© 0000 RAS, MNRAS 000, 000–000
10 Augusto et al.
et al. (1998), discarded by them from the 55-source sam-ple. It is now recovered into the 157-source sample. Au-gusto et al. (1998) presented a MERLIN 5 GHz map of thesource which leaves no room for doubt that this source is ei-ther a CSO or an MSO, depending on its unknown redshift:edge-brigthening is seen in both lobes, although no core isdetected. VLBA observations have been conducted for thissource at 1.7, 4.8 and 15 GHz (Rossetti et al. 2005) con-firming the classification and finding hotspots at both ends,although the nucleus still remains undetected.4C+55.17: The multi-frequency maps of Reid et al.
(1995) and the source redshift of 0.909 imply a large size(∼ 53 kpc), although the source is symmetric indeed (anLSO).J1015+674: Augusto (1996) shows it as a MERLIN point
source (300:1 map) that had its position in error by anamount sufficient to cause significant bandwidth smearing(see also Augusto et al. 1998; Patnaik et al. 1992a).J1041+525: This is a well-studied large scale quasar (∼
150 kpc in size), easily seen also in VLBI scales (e.g. Hen-stock et al. 1995; Taylor et al. 1996b).J1058+198: With a global size of ∼ 420 kpc (62′′at a
redshift of 1.11), this is a very large source, possibly a radiogalaxy (e.g. Hooimeyer et al. 1992).J1110+440: Augusto (1996) shows it as a core-jet source
(a very compact and strong nucleus and an extended, 50times weaker, jet).J1306+801: This is a very large triple source (∼110 kpc
— Taylor et al. 1996b), possibly an LSO, since the coreappears to be located in the middle component (from multi-frequency data).J1324+477: Augusto (1996) shows it as a point source, in
a 200:1 MERLIN 5 GHz map, so this source was erroneouslyselected due to bandwidth smearing.J1424+229: This is a well known arcsecond-scale gravi-
tationally lensed multiple-image system (e.g. Patnaik et al.1992b).J1440+383: This source is in the appendix of Augusto
et al. (1998), discarded by them from the 55-source sam-ple and now recovered into the 157-source sample. Augustoet al. (1998) presented a MERLIN 5 GHz map of this doublesource for which its 8′′ separation translates into ∼ 50 kpcat the source redshift of 1.775.J1454+299: This source is in the appendix of Augusto
et al. (1998), discarded by them from the 55-source sampleand now recovered into the 157-source sample. Augusto et al.(1998) presented a MERLIN 5 GHz map of the source whichleaves no room for doubt that this source is an MSO, giventhe edge-brigthening in both lobes and the presence of acentral compact “core”; the overall size of ∼2.′′5 correspondsto ∼ 14 kpc at the source redshift of 0.58.J1504+689: Lara et al. (2001) show this source as a large-
scale giant radio QSO, with a size of 1.16 Mpc.J1526+099: A confirmed LSO (from the VLA-A maps of
JVAS at 8.4 GHz and of Hintzen et al. (1983) at 1.4 GHz)which, given its redshift of 1.358 and from its angular sizeof ∼ 15.′′5, has a global size of ∼ 110 kpc.Arp220: This is a very well known radio galaxy with ul-
traluminosity at IR wavelengths, presenting a double ra-dio/IR nucleus (Norris 1988; Graham et al. 1990) and alsomaser emission. Too many observations at all wavelengthsexist for this source to mention here, so just as essential ex-
amples we cite Emerson et al. (1984); Soifer et al. (1984);Norris et al. (1985); Shaya et al. (1994); Heckman et al.(1996); Scoville et al. (1998); Clements et al. (2002). It isnot a CSO/MSO since it is thought that most of its radioemission comes from strong starburst activity (e.g. Roviloset al. 2003).4C+49.26: As already pointed out by Augusto et al.
(1998) this source is an LSO with a 6′′ size which, at itsredshift of 0.7, makes it ∼ 36 kpc in total.J1607+158: This is a core-jet source, from VLBI
(Beasley et al. 2002) up to 8.4 GHz VLA-A scales (JVAS).4C+12.59: From several multi-frequency maps (Saikia
et al. 1990; Lonsdale et al. 1998; Dallacasa et al. 1998) it isstill not clear whether this source is a core-jet or an LSO.From our point of view this is irrelevant, since its angularsize of 3.′′3 and redshift of 1.795 make it ∼ 24 kpc in size.J1715+217: A recent VLBA map on this source (Gurvits
et al. 2006, in prep.) shows it as a core with a jet containinga strong feature about ∼ 60 mas from the core. The VLA-A8.4 GHz visibilities, however, suggest larger scale structureas well. Future MERLIN 5 GHz observations should find it.J1749+431: All extant multi-frequency maps (Henstock
et al. 1995; Taylor et al. 1996b; Beasley et al. 2002) stronglysuggest that this source has a core-jet structure.J1753+093: All evidence seems to identify this radio
source with a galactic star (Thompson et al. 1990).NGC6521: Condon et al. (2002) find it likely that this
source has a core plus two lobes on each side, with an overallsize of 5′, giving it a size of ∼ 150 kpc at its 0.027462 redshift.NGC6572: This source is a galactic planetary nebula (e.g.
Condon & Kaplan 1998).J2055+287: This source is in the appendix of Augusto
et al. (1998), discarded by them from the 55-source sam-ple. It is now recovered into the 157-source sample. Au-gusto et al. (1998) presented a VLA 1.4 GHz map of thesource which shows it with a clear structure containing edge-brightened lobes. If it lies at a redshift closer than 0.09 itstill can be classified as an MSO (size < 15 kpc).J2234+361: This source is in the appendix of Augusto
et al. (1998), discarded by them from the 55-source sampleand now recovered into the 157-source sample. Augusto et al.(1998) presented both MERLIN and VLBA 5 GHz mapsof this source after which there is no doubt to classify itsstructure as a core-jet.
3.3 Statistics
In Figures 13 and 14 we plot, respectively, the redshift (z)and spectral index (α4.85
1.40) distributions for the 157-sourcesample (which have different completenesses). The com-pared statistics of this new sample with the previous 55-source sample of Augusto et al. (1998) are discussed in Ap-pendix A. Relevant here is the comparison with the new1743-source parent sample (Figure 11 vs. 13; Figure 12 vs.14), with results shown in Table 6. The completenesses aresimilar for both samples. This similarity, in the redshift case,is not surprising since the two samples have the same fluxdensity lower limit. The completeness similarity in the caseof the spectral index merely reflects that we are not bias-ing our selection towards “better known” or brighter sources(which is good, since we want a morphological-only differ-ence): the proportion of sources that are too weak to be
c© 0000 RAS, MNRAS 000, 000–000
kiloparsec symmetric objects I. The candidates 11
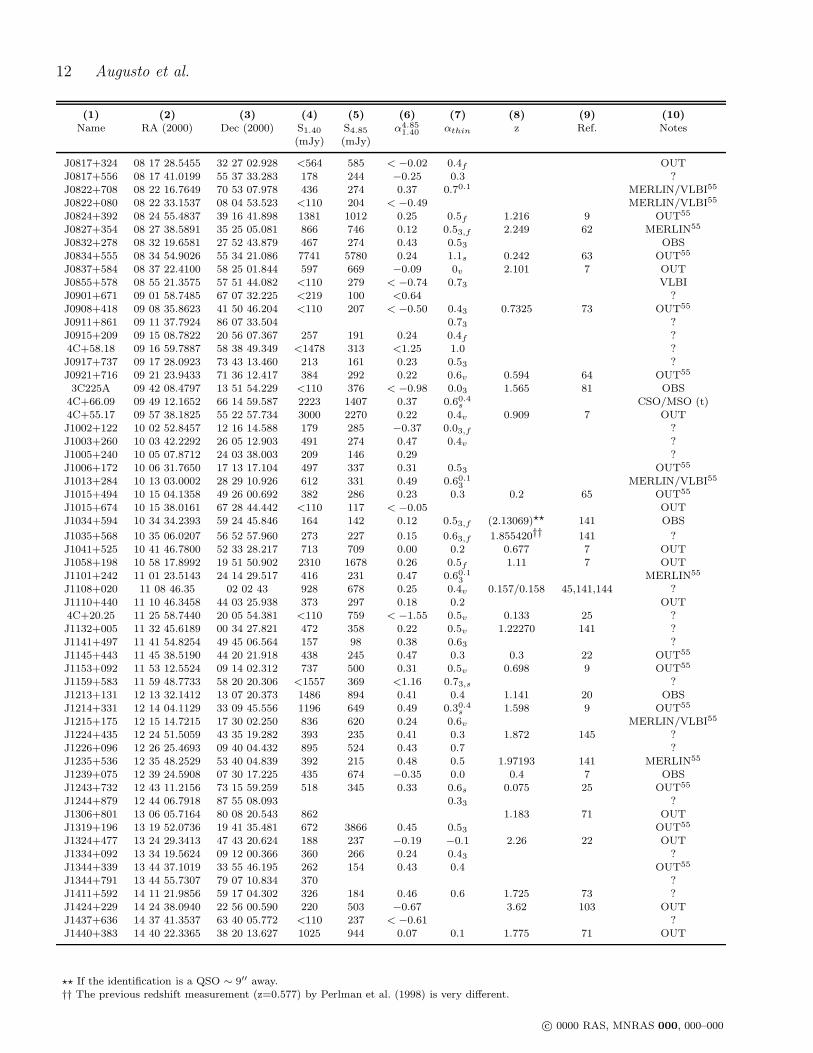
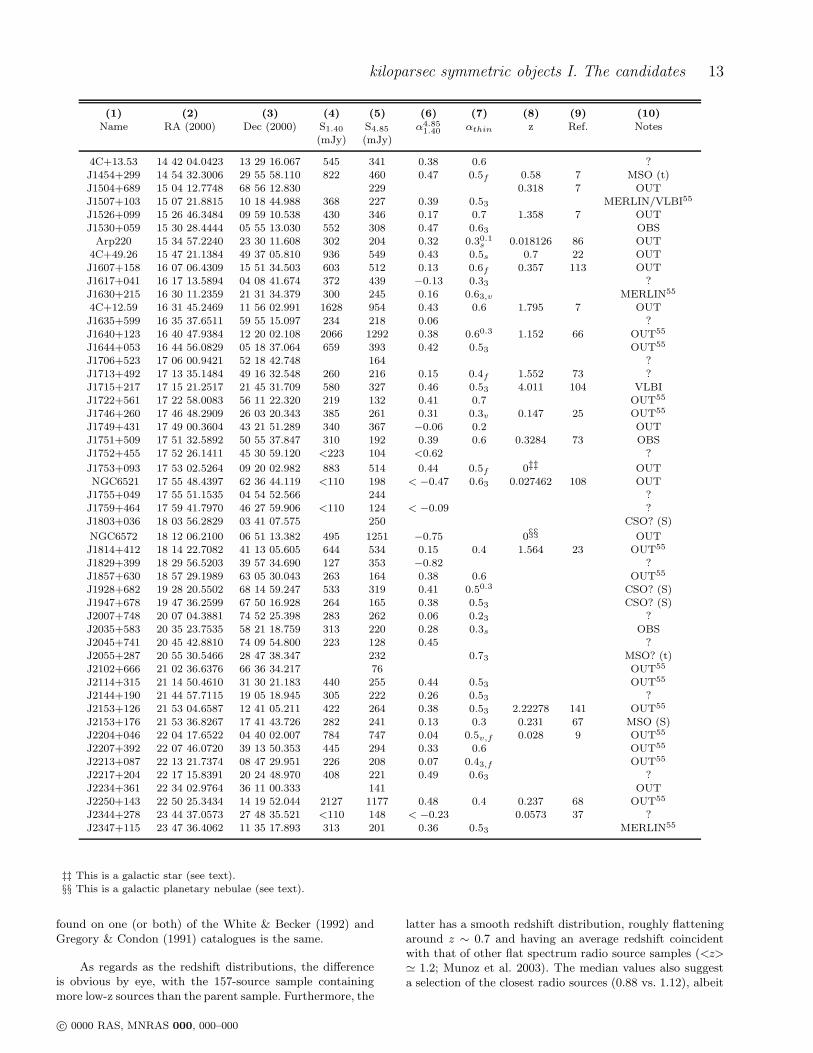
Table 5. The sample of 157 flat-spectrum (α4.851.40 < 0.5) radio sources. The columns are as in Table 4, except that; i) column (7) only
exists here (its caption is as in column (12) of Table 2 with an additional subscript: f — flattening of the spectrum at high-ν); ii)in column (10) we give comments on the status of the candidate: CSO/MSO (?) — (not yet) confirmed CSO/MSO — see text (t) orTable 2/Section 2.3 (S) for more details; OUT — ruled out, see why in text or in Augusto et al. (1998) for the sources marked with a “55”superscript; OBS — data exist (need processing/interpreting); ? — the cases that will need observations in the future for the first stepin the classification of their structure; MERLIN/VLBI — sources that have adequate structure but lack multi-frequency observations toconfirm core location (see text or Augusto et al. (1998) for the sources marked with a “55” superscript). For this table, also, we give herethe redshift references (Column (9)) with the same code numbers as in Table 4: 3– White et al. (1993); 7– Hewitt & Burbidge (1989); 9–Wills & Wills (1976); 10– Xu et al. (1994); 13– Stickel & Kuhr (1993); 17– Vermeulen & Taylor (1995); 18– Goncalves et al. (1998); 20–Hewett et al. (1995); 22– Hook et al. (1996); 23– Henstock et al. (1997); 25– Marcha et al. (1996); 37– Miller & Owen (2001); 41– ParkesCatalogue (1990), Australia Telescope National Facility, Wright & Otrupcek, (Eds); 45– Drinkwater et al. (1997); 62– Allington-Smithet al. (1988); 63– Burbidge & Crowne (1979); 64– Stickel & Kuhr (1996); 65– Puchnarewicz et al. (1992); 66– Stickel et al. (1996); 67–Le Borgne et al. (1991); 68– Baldwin et al. (1973); 69– Unger et al. (1986); 70– Sargent (1973); 71– Vermeulen et al. (1996); 73– Falcoet al. (1998); 81– Hewitt & Burbidge (1991); 86– de Vaucouleurs et al. (1991); 103– Patnaik et al. (1992b); 104– Hook & McMahon(1998); 108– Wegner et al. (1999); 113– Dondi & Ghisellini (1995); 141– Sloan Digital Sky Survey (www.sdss.org); 142– Cohen et al.(2003); 143– Gorshkov et al. (2003); 144– Magliocchetti et al. (2004); 145– Sowards-Emmerd et al. (2003).
(1) (2) (3) (4) (5) (6) (7) (8) (9) (10)Name RA (2000) Dec (2000) S1.40 S4.85 α4.85
1.40 αthin z Ref. Notes(mJy) (mJy)
J0000+393 00 00 41.5259 39 18 04.172 220 138 0.38 0.43 ?J0009+400 00 09 04.1750 40 01 46.724 569 333 0.43 0.5 1.83 7 OBSJ0013+778 00 13 11.6992 77 48 46.620 2203 0.50.1
3 0.326 10 OUTJ0020+430 00 20 49.9798 43 04 38.329 363 253 0.29 0.5 ?J0026+351 00 26 41.7238 35 08 42.285 819 453 0.48 0.43 0.333 13 ?J0036+318 00 36 48.1263 31 51 14.532 256 148 0.44 0.63 ?4C+36.01 00 37 46.1437 36 59 10.928 879 482 0.48 0.6s 0.366 17 OUT4C+12.05 00 38 18.0173 12 27 31.252 1002 670 0.32 0.7f 1.395 18 ?J0048+319 00 48 47.1438 31 57 25.094 270 254 0.05 0v 0.015 69 CSO (S)J0112+203 01 12 10.1864 20 20 21.789 407 247 0.40 0.63 0.746 7 ?J0115+521 01 15 56.8741 52 09 13.034 328 206 0.37 0.7 MERLIN55
J0119+321 01 19 34.9991 32 10 50.013 2826 1571 0.47 0.40.4 0.0592 70 CSO (S)J0123+307 01 23 02.2783 30 44 06.847 126 184 −0.30 OUTJ0129+147 01 29 55.3484 14 46 47.843 706 536 0.22 0.6f 1.62985 141 OUT55
J0138+293 01 38 35.3234 29 22 04.544 324 184 0.46 0.53 ?J0209+724 02 09 51.7921 72 29 26.669 842 560 0.33 0.4 0.895 71 MERLIN55
J0221+359 02 21 05.4702 35 56 13.722 1456 1498 −0.02 0.3 0.944 142 OUT55
J0227+190 02 27 53.3347 19 01 14.082 292 160 0.48 0.53 MERLIN/VLBI55
J0237+437 02 37 01.2149 43 42 04.191 431 246 0.45 0.50.43 CSO (S)
J0255+043 02 55 55.4349 04 19 40.588 435 278 0.36 0.53 ?J0259+426 02 59 37.6753 42 35 49.908 616 366 0.42 0.2 0.867 17 OUTJ0308+699 03 08 27.8276 69 55 58.900 228 205 0.09 0.3f OBSJ0348+087 03 48 10.4178 08 42 08.873 248 192 0.21 0.53 OUT55
J0354+801 03 54 46.1258 80 09 28.816 818 0.4 ?J0355+391 03 55 16.5912 39 09 09.824 160 191 −0.14 0.4 OUT55
J0402+826 04 02 12.6736 82 41 35.103 CSO (S)3C108 04 12 43.6683 23 05 05.468 1293 1000 0.21 0.6v,f 1.215 7 OUT
J0420+149 04 20 51.0857 14 59 15.634 460 310 0.32 0.53 OUT55
4C+68.05 04 26 50.0654 68 25 52.955 <454 244 <0.50 0.6 ?J0431+206 04 31 03.7585 20 37 34.189 3611 2811 0.20 0.61
s 0.219 41 CSO (S)J0431+175 04 31 57.3798 17 31 35.792 429 270 0.37 0.43 OUT55
J0458+201 04 58 29.8726 20 11 35.997 170 163 0.03 0.63,v OBS4C+10.16 05 16 46.6463 10 57 54.773 1207 734 0.40 0.5 1.580 143 ?J0532+013 05 32 08.7760 01 20 06.330 258 153 0.42 0.43 OUT55
J0600+630 06 00 27.0161 63 04 07.481 <110 114 < −0.02 ?J0626+621 06 26 42.2118 62 11 23.514 195 134 0.30 0.63 ?J0639+351 06 39 09.5887 35 06 22.543 346 233 0.32 0.4 ?J0641+356 06 41 35.8542 35 39 57.623 340 197 0.44 0.50.1 MERLIN55
J0653+646 06 53 53.7227 64 38 13.176 178 130 0.25 0.43 ?
J0654+427 06 54 43.5263 42 47 58.728 188 188 0.00 0.2 0.126 25 OUTJ0656+321 06 56 40.8892 32 09 32.554 <110 217 < −0.54 OUTJ0735+236 07 35 59.9293 23 41 02.764 878 552 0.37 0.5 MERLIN/VLBI55
J0751+826 07 50 57.7640 82 41 58.032 1815 0.5f 1.991 10 MSO (t)J0752+581 07 52 09.6792 58 08 52.256 203 212 −0.03 0.0f 2.94 3 OBSJ0757+611 07 57 44.6933 61 10 32.764 246 195 0.19 0.33,s ?J0803+640 08 03 52.1595 64 03 14.364 292 221 0.22 0.2 ?J0815+019 08 15 58.6371 01 55 55.820 <110 280 < −0.75 0.7 MERLIN
c© 0000 RAS, MNRAS 000, 000–000
12 Augusto et al.
(1) (2) (3) (4) (5) (6) (7) (8) (9) (10)Name RA (2000) Dec (2000) S1.40 S4.85 α4.85
1.40 αthin z Ref. Notes(mJy) (mJy)
J0817+324 08 17 28.5455 32 27 02.928 <564 585 < −0.02 0.4f OUTJ0817+556 08 17 41.0199 55 37 33.283 178 244 −0.25 0.3 ?J0822+708 08 22 16.7649 70 53 07.978 436 274 0.37 0.70.1 MERLIN/VLBI55
J0822+080 08 22 33.1537 08 04 53.523 <110 204 < −0.49 MERLIN/VLBI55
J0824+392 08 24 55.4837 39 16 41.898 1381 1012 0.25 0.5f 1.216 9 OUT55
J0827+354 08 27 38.5891 35 25 05.081 866 746 0.12 0.53,f 2.249 62 MERLIN55
J0832+278 08 32 19.6581 27 52 43.879 467 274 0.43 0.53 OBSJ0834+555 08 34 54.9026 55 34 21.086 7741 5780 0.24 1.1s 0.242 63 OUT55
J0837+584 08 37 22.4100 58 25 01.844 597 669 −0.09 0v 2.101 7 OUTJ0855+578 08 55 21.3575 57 51 44.082 <110 279 < −0.74 0.73 VLBIJ0901+671 09 01 58.7485 67 07 32.225 <219 100 <0.64 ?J0908+418 09 08 35.8623 41 50 46.204 <110 207 < −0.50 0.43 0.7325 73 OUT55
J0911+861 09 11 37.7924 86 07 33.504 0.73 ?J0915+209 09 15 08.7822 20 56 07.367 257 191 0.24 0.4f ?4C+58.18 09 16 59.7887 58 38 49.349 <1478 313 <1.25 1.0 ?J0917+737 09 17 28.0923 73 43 13.460 213 161 0.23 0.53 ?J0921+716 09 21 23.9433 71 36 12.417 384 292 0.22 0.6v 0.594 64 OUT55
3C225A 09 42 08.4797 13 51 54.229 <110 376 < −0.98 0.03 1.565 81 OBS4C+66.09 09 49 12.1652 66 14 59.587 2223 1407 0.37 0.60.4
s CSO/MSO (t)4C+55.17 09 57 38.1825 55 22 57.734 3000 2270 0.22 0.4v 0.909 7 OUTJ1002+122 10 02 52.8457 12 16 14.588 179 285 −0.37 0.03,f ?J1003+260 10 03 42.2292 26 05 12.903 491 274 0.47 0.4v ?J1005+240 10 05 07.8712 24 03 38.003 209 146 0.29 ?J1006+172 10 06 31.7650 17 13 17.104 497 337 0.31 0.53 OUT55
J1013+284 10 13 03.0002 28 29 10.926 612 331 0.49 0.60.13 MERLIN/VLBI55
J1015+494 10 15 04.1358 49 26 00.692 382 286 0.23 0.3 0.2 65 OUT55
J1015+674 10 15 38.0161 67 28 44.442 <110 117 < −0.05 OUTJ1034+594 10 34 34.2393 59 24 45.846 164 142 0.12 0.53,f (2.13069)⋆⋆ 141 OBS
J1035+568 10 35 06.0207 56 52 57.960 273 227 0.15 0.63,f 1.855420†† 141 ?J1041+525 10 41 46.7800 52 33 28.217 713 709 0.00 0.2 0.677 7 OUTJ1058+198 10 58 17.8992 19 51 50.902 2310 1678 0.26 0.5f 1.11 7 OUTJ1101+242 11 01 23.5143 24 14 29.517 416 231 0.47 0.60.1
3 MERLIN55
J1108+020 11 08 46.35 02 02 43 928 678 0.25 0.4v 0.157/0.158 45,141,144 ?J1110+440 11 10 46.3458 44 03 25.938 373 297 0.18 0.2 OUT4C+20.25 11 25 58.7440 20 05 54.381 <110 759 < −1.55 0.5v 0.133 25 ?J1132+005 11 32 45.6189 00 34 27.821 472 358 0.22 0.5v 1.22270 141 ?J1141+497 11 41 54.8254 49 45 06.564 157 98 0.38 0.63 ?J1145+443 11 45 38.5190 44 20 21.918 438 245 0.47 0.3 0.3 22 OUT55
J1153+092 11 53 12.5524 09 14 02.312 737 500 0.31 0.5v 0.698 9 OUT55
J1159+583 11 59 48.7733 58 20 20.306 <1557 369 <1.16 0.73,s ?J1213+131 12 13 32.1412 13 07 20.373 1486 894 0.41 0.4 1.141 20 OBSJ1214+331 12 14 04.1129 33 09 45.556 1196 649 0.49 0.30.4
s 1.598 9 OUT55
J1215+175 12 15 14.7215 17 30 02.250 836 620 0.24 0.6v MERLIN/VLBI55
J1224+435 12 24 51.5059 43 35 19.282 393 235 0.41 0.3 1.872 145 ?J1226+096 12 26 25.4693 09 40 04.432 895 524 0.43 0.7 ?J1235+536 12 35 48.2529 53 40 04.839 392 215 0.48 0.5 1.97193 141 MERLIN55
J1239+075 12 39 24.5908 07 30 17.225 435 674 −0.35 0.0 0.4 7 OBSJ1243+732 12 43 11.2156 73 15 59.259 518 345 0.33 0.6s 0.075 25 OUT55
J1244+879 12 44 06.7918 87 55 08.093 0.33 ?J1306+801 13 06 05.7164 80 08 20.543 862 1.183 71 OUTJ1319+196 13 19 52.0736 19 41 35.481 672 3866 0.45 0.53 OUT55
J1324+477 13 24 29.3413 47 43 20.624 188 237 −0.19 −0.1 2.26 22 OUTJ1334+092 13 34 19.5624 09 12 00.366 360 266 0.24 0.43 ?J1344+339 13 44 37.1019 33 55 46.195 262 154 0.43 0.4 OUT55
J1344+791 13 44 55.7307 79 07 10.834 370 ?J1411+592 14 11 21.9856 59 17 04.302 326 184 0.46 0.6 1.725 73 ?J1424+229 14 24 38.0940 22 56 00.590 220 503 −0.67 3.62 103 OUTJ1437+636 14 37 41.3537 63 40 05.772 <110 237 < −0.61 ?J1440+383 14 40 22.3365 38 20 13.627 1025 944 0.07 0.1 1.775 71 OUT
⋆⋆ If the identification is a QSO ∼ 9′′ away.†† The previous redshift measurement (z=0.577) by Perlman et al. (1998) is very different.
c© 0000 RAS, MNRAS 000, 000–000
kiloparsec symmetric objects I. The candidates 13
(1) (2) (3) (4) (5) (6) (7) (8) (9) (10)Name RA (2000) Dec (2000) S1.40 S4.85 α4.85
1.40 αthin z Ref. Notes(mJy) (mJy)
4C+13.53 14 42 04.0423 13 29 16.067 545 341 0.38 0.6 ?J1454+299 14 54 32.3006 29 55 58.110 822 460 0.47 0.5f 0.58 7 MSO (t)J1504+689 15 04 12.7748 68 56 12.830 229 0.318 7 OUTJ1507+103 15 07 21.8815 10 18 44.988 368 227 0.39 0.53 MERLIN/VLBI55
J1526+099 15 26 46.3484 09 59 10.538 430 346 0.17 0.7 1.358 7 OUTJ1530+059 15 30 28.4444 05 55 13.030 552 308 0.47 0.63 OBS
Arp220 15 34 57.2240 23 30 11.608 302 204 0.32 0.30.1s 0.018126 86 OUT
4C+49.26 15 47 21.1384 49 37 05.810 936 549 0.43 0.5s 0.7 22 OUTJ1607+158 16 07 06.4309 15 51 34.503 603 512 0.13 0.6f 0.357 113 OUTJ1617+041 16 17 13.5894 04 08 41.674 372 439 −0.13 0.33 ?J1630+215 16 30 11.2359 21 31 34.379 300 245 0.16 0.63,v MERLIN55
4C+12.59 16 31 45.2469 11 56 02.991 1628 954 0.43 0.6 1.795 7 OUT
J1635+599 16 35 37.6511 59 55 15.097 234 218 0.06 ?J1640+123 16 40 47.9384 12 20 02.108 2066 1292 0.38 0.60.3 1.152 66 OUT55
J1644+053 16 44 56.0829 05 18 37.064 659 393 0.42 0.53 OUT55
J1706+523 17 06 00.9421 52 18 42.748 164 ?J1713+492 17 13 35.1484 49 16 32.548 260 216 0.15 0.4f 1.552 73 ?J1715+217 17 15 21.2517 21 45 31.709 580 327 0.46 0.53 4.011 104 VLBIJ1722+561 17 22 58.0083 56 11 22.320 219 132 0.41 0.7 OUT55
J1746+260 17 46 48.2909 26 03 20.343 385 261 0.31 0.3v 0.147 25 OUT55
J1749+431 17 49 00.3604 43 21 51.289 340 367 −0.06 0.2 OUTJ1751+509 17 51 32.5892 50 55 37.847 310 192 0.39 0.6 0.3284 73 OBSJ1752+455 17 52 26.1411 45 30 59.120 <223 104 <0.62 ?
J1753+093 17 53 02.5264 09 20 02.982 883 514 0.44 0.5f 0‡‡ OUTNGC6521 17 55 48.4397 62 36 44.119 <110 198 < −0.47 0.63 0.027462 108 OUT
J1755+049 17 55 51.1535 04 54 52.566 244 ?J1759+464 17 59 41.7970 46 27 59.906 <110 124 < −0.09 ?J1803+036 18 03 56.2829 03 41 07.575 250 CSO? (S)
NGC6572 18 12 06.2100 06 51 13.382 495 1251 −0.75 0§§ OUTJ1814+412 18 14 22.7082 41 13 05.605 644 534 0.15 0.4 1.564 23 OUT55
J1829+399 18 29 56.5203 39 57 34.690 127 353 −0.82 ?J1857+630 18 57 29.1989 63 05 30.043 263 164 0.38 0.6 OUT55
J1928+682 19 28 20.5502 68 14 59.247 533 319 0.41 0.50.3 CSO? (S)J1947+678 19 47 36.2599 67 50 16.928 264 165 0.38 0.53 CSO? (S)J2007+748 20 07 04.3881 74 52 25.398 283 262 0.06 0.23 ?J2035+583 20 35 23.7535 58 21 18.759 313 220 0.28 0.3s OBSJ2045+741 20 45 42.8810 74 09 54.800 223 128 0.45 ?J2055+287 20 55 30.5466 28 47 38.347 232 0.73 MSO? (t)J2102+666 21 02 36.6376 66 36 34.217 76 OUT55
J2114+315 21 14 50.4610 31 30 21.183 440 255 0.44 0.53 OUT55
J2144+190 21 44 57.7115 19 05 18.945 305 222 0.26 0.53 ?J2153+126 21 53 04.6587 12 41 05.211 422 264 0.38 0.53 2.22278 141 OUT55
J2153+176 21 53 36.8267 17 41 43.726 282 241 0.13 0.3 0.231 67 MSO (S)J2204+046 22 04 17.6522 04 40 02.007 784 747 0.04 0.5v,f 0.028 9 OUT55
J2207+392 22 07 46.0720 39 13 50.353 445 294 0.33 0.6 OUT55
J2213+087 22 13 21.7374 08 47 29.951 226 208 0.07 0.43,f OUT55
J2217+204 22 17 15.8391 20 24 48.970 408 221 0.49 0.63 ?J2234+361 22 34 02.9764 36 11 00.333 141 OUTJ2250+143 22 50 25.3434 14 19 52.044 2127 1177 0.48 0.4 0.237 68 OUT55
J2344+278 23 44 37.0573 27 48 35.521 <110 148 < −0.23 0.0573 37 ?J2347+115 23 47 36.4062 11 35 17.893 313 201 0.36 0.53 MERLIN55
‡‡ This is a galactic star (see text).§§ This is a galactic planetary nebulae (see text).
found on one (or both) of the White & Becker (1992) andGregory & Condon (1991) catalogues is the same.
As regards as the redshift distributions, the differenceis obvious by eye, with the 157-source sample containingmore low-z sources than the parent sample. Furthermore, the
latter has a smooth redshift distribution, roughly flatteningaround z ∼ 0.7 and having an average redshift coincidentwith that of other flat spectrum radio source samples (<z>≃ 1.2; Munoz et al. 2003). The median values also suggesta selection of the closest radio sources (0.88 vs. 1.12), albeit
c© 0000 RAS, MNRAS 000, 000–000
14 Augusto et al.
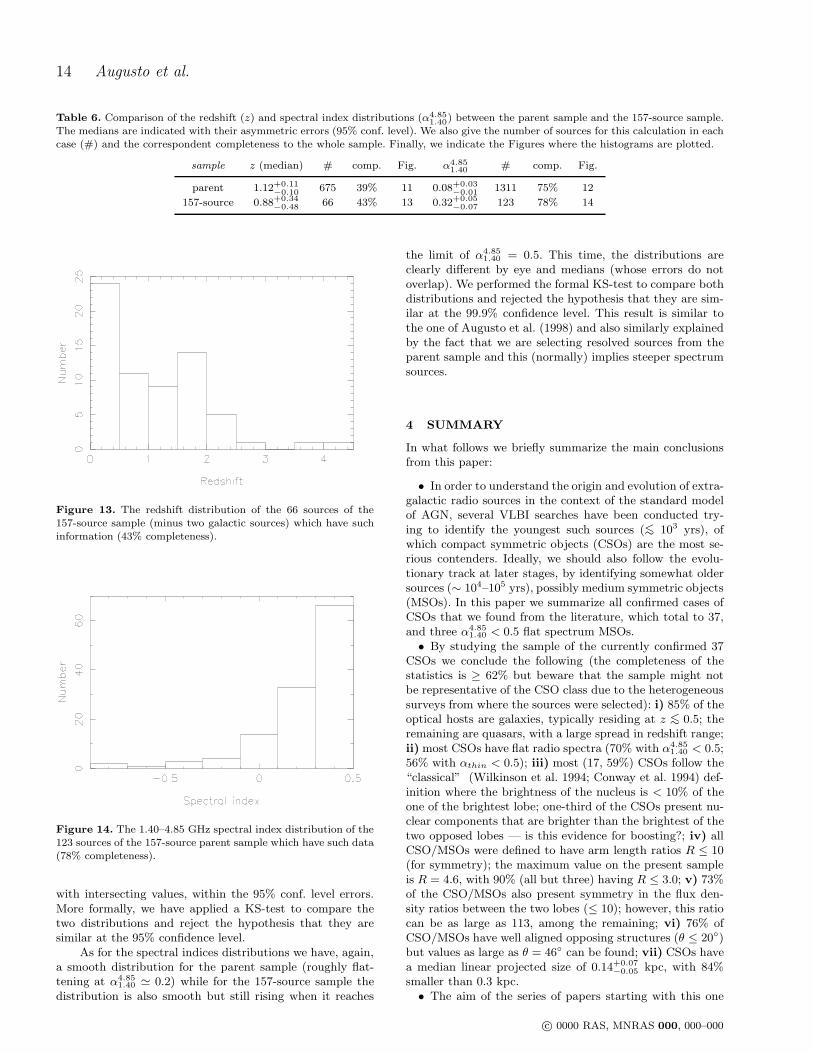
Table 6. Comparison of the redshift (z) and spectral index distributions (α4.851.40) between the parent sample and the 157-source sample.
The medians are indicated with their asymmetric errors (95% conf. level). We also give the number of sources for this calculation in eachcase (#) and the correspondent completeness to the whole sample. Finally, we indicate the Figures where the histograms are plotted.
sample z (median) # comp. Fig. α4.851.40 # comp. Fig.
parent 1.12+0.11−0.10 675 39% 11 0.08+0.03
−0.01 1311 75% 12
157-source 0.88+0.34−0.48 66 43% 13 0.32+0.05
−0.07 123 78% 14
Figure 13. The redshift distribution of the 66 sources of the157-source sample (minus two galactic sources) which have suchinformation (43% completeness).
Figure 14. The 1.40–4.85 GHz spectral index distribution of the123 sources of the 157-source parent sample which have such data(78% completeness).
with intersecting values, within the 95% conf. level errors.More formally, we have applied a KS-test to compare thetwo distributions and reject the hypothesis that they aresimilar at the 95% confidence level.
As for the spectral indices distributions we have, again,a smooth distribution for the parent sample (roughly flat-tening at α4.85
1.40 ≃ 0.2) while for the 157-source sample thedistribution is also smooth but still rising when it reaches
the limit of α4.851.40 = 0.5. This time, the distributions are
clearly different by eye and medians (whose errors do notoverlap). We performed the formal KS-test to compare bothdistributions and rejected the hypothesis that they are sim-ilar at the 99.9% confidence level. This result is similar tothe one of Augusto et al. (1998) and also similarly explainedby the fact that we are selecting resolved sources from theparent sample and this (normally) implies steeper spectrumsources.
4 SUMMARY
In what follows we briefly summarize the main conclusionsfrom this paper:
• In order to understand the origin and evolution of extra-galactic radio sources in the context of the standard modelof AGN, several VLBI searches have been conducted try-ing to identify the youngest such sources (<∼ 103 yrs), ofwhich compact symmetric objects (CSOs) are the most se-rious contenders. Ideally, we should also follow the evolu-tionary track at later stages, by identifying somewhat oldersources (∼ 104–105 yrs), possibly medium symmetric objects(MSOs). In this paper we summarize all confirmed cases ofCSOs that we found from the literature, which total to 37,and three α4.85
1.40 < 0.5 flat spectrum MSOs.• By studying the sample of the currently confirmed 37
CSOs we conclude the following (the completeness of thestatistics is ≥ 62% but beware that the sample might notbe representative of the CSO class due to the heterogeneoussurveys from where the sources were selected): i) 85% of theoptical hosts are galaxies, typically residing at z <∼ 0.5; theremaining are quasars, with a large spread in redshift range;ii) most CSOs have flat radio spectra (70% with α4.85
1.40 < 0.5;56% with αthin < 0.5); iii) most (17, 59%) CSOs follow the“classical” (Wilkinson et al. 1994; Conway et al. 1994) def-inition where the brightness of the nucleus is < 10% of theone of the brightest lobe; one-third of the CSOs present nu-clear components that are brighter than the brightest of thetwo opposed lobes — is this evidence for boosting?; iv) allCSO/MSOs were defined to have arm length ratios R ≤ 10(for symmetry); the maximum value on the present sampleis R = 4.6, with 90% (all but three) having R ≤ 3.0; v) 73%of the CSO/MSOs also present symmetry in the flux den-sity ratios between the two lobes (≤ 10); however, this ratiocan be as large as 113, among the remaining; vi) 76% ofCSO/MSOs have well aligned opposing structures (θ ≤ 20)but values as large as θ = 46 can be found; vii) CSOs havea median linear projected size of 0.14+0.07
−0.05 kpc, with 84%smaller than 0.3 kpc.
• The aim of the series of papers starting with this one
c© 0000 RAS, MNRAS 000, 000–000
kiloparsec symmetric objects I. The candidates 15
is to improve, many times, the number of confirmed largeCSOs and of flat-spectrum MSOs (0.3–15 kpc), which cur-rently sits at six. In this paper, in particular, we present asample of 157 sources, drawn from a parent sample of 1743flat spectrum (α4.85
1.40 < 0.5) sources by selecting the ones withradio structure on >∼ 0.′′1 scales. This resulted in the selec-tion of the lowest redshift and steepest spectrum sources in-cluding >∼ 0.3 kpc CSO/MSO candidates. Although we haveimmediately rejected, based on literature information, 61 ofthe sources, 83 are still left with data either to be analysed orto be gathered. As for the remaining thirteen sources, ninewere already listed as CSOs/flat-spectrum MSOs from theliterature and are, thus, a good quality control for our selec-tion. As for the final four, 4C+66.09 is a CSO/MSO (needsa redshift to identify which type exactly); J0751+826 andJ1454+299 are ∼ 14 kpc MSOs; J2055+287 might be anMSO too, if at z < 0.09.
ACKNOWLEDGMENTS
The authors acknowledge an anonymous referee, whose com-ments helped to improve this paper, and also support fromthe Fundacao para a Ciencia e a Tecnologia (FCT) un-der the ESO programme: PESO/P/PRO/15133/1999. Wethank Daniele Dallacasa for information on one source, be-fore publishing. This paper has made use of the NASA/IPACExtragalactic Database (NED) which is operated by the JetPropulsion Laboratory, California Institute of Technology,under contract with the National Aeronautics and SpaceAdministration. Funding for the Sloan Digital Sky Survey(SDSS) has been provided by the Alfred P. Sloan Founda-tion, the Participating Institutions, the National Aeronau-tics and Space Administration, the National Science Foun-dation, the U.S. Department of Energy, the Japanese Mon-bukagakusho, and the Max Planck Society. The SDSS Website is http://www.sdss.org/. The SDSS is managed by theAstrophysical Research Consortium (ARC) for the Partici-pating Institutions. The Participating Institutions are TheUniversity of Chicago, Fermilab, the Institute for AdvancedStudy, the Japan Participation Group, The Johns HopkinsUniversity, the Korean Scientist Group, Los Alamos Na-tional Laboratory, the Max-Planck-Institute for Astronomy(MPIA), the Max-Planck-Institute for Astrophysics (MPA),New Mexico State University, University of Pittsburgh, Uni-versity of Portsmouth, Princeton University, the UnitedStates Naval Observatory, and the University of Washing-ton.
REFERENCES
Akujor C. E., Porcas R. W., Smoker J. V., 1996, A&A, 306,391
Alexander P., 2000, MNRAS, 319, 8
Aller M. F., Aller H. D., Hughes P. A., 1992, ApJ, 399, 16
Allington-Smith J. R., Spinrad H., Djorgovski S., Liebert J.,1988, MNRAS, 234, 1091
Anton S., Thean A. H. C., Pedlar A., Browne I. W. A., 2002,MNRAS, 336, 319
Augusto P., Wilkinson P. N., 2001, MNRAS, 320, L40
Augusto P., Wilkinson P. N., Browne I. W. A., 1998, MN-RAS, 299, 1159
Augusto P., Edge A. C., Chandler C. J., 2005, MNRAS,submitted
Augusto P., 1996, Ph.D. Thesis, University of Manchester,UK
Baldwin J. A., Burbidge E. M., Hazard C., Murdoch H. S.,Robinson L. B., Wampler E. J., 1973, ApJ, 185, 739
Bartel N. et al., 1984, ApJ, 279, 116
Baum S. A., O’Dea C. P., de Bruyn A. G., Murphy D. W.,1990, A&A, 232, 19
Beasley A. J., Gordon D., Peck A. B., Petrov L., MacMil-lan D. S., Fomalont E. B., Ma C., 2002, ApJS, 141,13
Begelman M. C., 1996, in Carilli C. L., Harris D. E., eds,Cygnus A — Study of a Radio Galaxy (Proc. ofGreenbank workshop). Cambridge University Press,p. 209
Blandford R. D., Rees M. J., 1974, MNRAS, 169, 395
Bondi M., Garrett M. A., Gurvits L. I., 1998, MNRAS, 297,559
Bondi M., Marcha M. J. M., Dallacasa D., Stanghellini C.,2001, MNRAS, 325, 1109
Burbidge G., Crowne A. H., 1979, ApJS, 40, 583
Carilli C. L., Menten K. M., Reid M. J., Rupen M. P.,Yun M. S., 1998, ApJ, 494, 175
Carvalho J. C., 1985, MNRAS, 215, 463
Clements D. L., McDowell J. C., Shaked S., Baker A. C.,Borne K., Colina L., Lamb S. A., Mundell C., 2002,ApJ, 581, 974
Cohen J. G., Lawrence C. R., Blandford R. D., 2003, ApJ,583, 67
Condon J. J., Kaplan D. L., 1998, ApJS, 117, 361
Condon J. J., Cotton W. D., Greisen E. W., Yin Q. F.,Perley R. A., Taylor G. B., Broderick J. J., 1998,AJ, 115, 1693
Condon J. J., Cotton W. D., Broderick J. J., 2002, AJ, 124,675
Conway J. E., Pearson T. J., Readhead A. C. S., Un-win S. C., Xu W., Mutel R. L., 1992, ApJ, 396, 62
Conway J. E., Myers S. T., Pearson T. J., Readhead A. C. S.,Unwin S. C., Xu W., 1994, ApJ, 425, 568
c© 0000 RAS, MNRAS 000, 000–000
16 Augusto et al.
Cotton W. D., Feretti L., Giovannini G., Venturi T., Lara L.,Marcaide J., Wehrle A. E., 1995, ApJ, 452, 605
Dallacasa D., Fanti C., Fanti R., Schilizzi R. T.,Spencer R. E., 1995, A&A, 295, 27
Dallacasa D., Bondi M., Alef W., Mantovani F., 1998,A&AS, 129, 219
Dallacasa D., Tinti S., Fanti C., Fanti R., Gregorini L.,Stanghellini C., Vigotti M., 2002a, A&A, 389, 115
Dallacasa D., Fanti C., Giacintucci S., Stanghellini C.,Fanti R., Gregorini L., Vigotti M., 2002b, A&A, 389,126
de Vaucouleurs G., de Vaucouleurs A., Corwin Jr. H. G.,Buta R. J., Paturel G., Fouque P., 1991, in “ThirdReference Catalogue of Bright Galaxies”. Springer-Verlag
de Vries W. H., Barthel P. D., Hes R., 1995, A&AS, 114,259
de Vries W. H. et al., 1997, ApJS, 110, 191
de Vries W. H., O’Dea C. P., Perlman E., Baum S. A., Lehn-ert M. D., Stocke J., Rector T., Elston R., 1998a,ApJ, 503, 138
de Vries W. H., O’Dea C. P., Baum S. A., Perlman E., Lehn-ert M. D., Barthel P. D., 1998b, ApJ, 503, 156
de Vries W. H., O’Dea C. P., Barthel P. D., Fanti C.,Fanti R., Lehnert M. D., 2000, AJ, 120, 2300
de Young D. S., 1997, ApJ, 490, L55
Dondi L., Ghisellini G., 1995, MNRAS, 273, 583
Drinkwater M. J. et al., 1997, MNRAS, 284, 85
Emerson J. P., Clegg P. E., Gee G., Griffin M. J., Cun-ningham C. T., Brown L. M. J., Robson E. I., Long-more A. J., 1984, Nature, 311, 237
Falco E. E., Kochanek C. S., Munoz J. A., 1998, ApJ, 494,47
Fanaroff B. L., Riley J. M., 1974, MNRAS, 167, P31
Fanti R., Fanti C., Schilizzi R. T., Spencer R. E., Nan R.,Parma P., van Breugel W. J. M., Venturi T., 1990,A&A, 231, 333
Fanti C., Fanti R., Dallacasa D., Schilizzi R. T.,Spencer R. E., Stanghellini C., 1995, A&A, 302, 317
Fanti C., Pozzi F., Dallacasa D., Fanti R., Gregorini L.,Stanghellini C., Vigotti M., 2001, A&A, 369, 380
Fassnacht C. D., Taylor G. B., 2001, AJ, 122, 1661
Fey A. L., Clegg A. W., Fomalont E. B., 1996, ApJS, 105,299
Fomalont E. B., Frey S., Paragi Z., Gurvits L. I.,
Scott W. K., Taylor A. R., Edwards P. G.,Hirabayashi H., 2000, ApJS, 131, 95
Gallimore J. F., Baum S. A., O’Dea C. P., Pedlar A.,Brinks E., 1999, ApJ, 524, 684
Giovannini G., Cotton W. D., Feretti L., Lara L., Venturi T.,2001, ApJ, 552, 508
Giroletti M., Giovannini G., Taylor G. B., Conway J. E.,Lara L., Venturi T., 2003, A&A, 399, 889
Giroletti M., Giovannini G., Taylor G. B., 2005, A&A, 441,89
Goncalves A. C., Veron P., Veron-Cetty M.-P., 1998, A&AS,127, 107
Gorshkov A. G., Konnikova V. K., Mingaliev M. G., 2003,Astron. Rep., 47, 903
Graham J. R., Carico D. P., Matthews K., Neugebauer G.,Soifer B. T., Wilson T. D., 1990, ApJ, 354, L5
Gregory P. C., Condon J. J., 1991, ApJS, 75, 1011
Gregory P. C., Scott W. K., Douglas K., Condon J. J., 1996,ApJS, 103, 427
Gugliucci N. E., Taylor G. B., Peck A. B., Giroletti M., 2005,ApJ, 622, 136
Heckman T. M., Dahlem M., Eales S. A., Fabbiano G.,Weaver K., 1996, ApJ, 457, 616
Henstock D. R., Browne I. W. A., Wilkinson P. N., Tay-lor G. B., Vermeulen R. C., Pearson T. J., Read-head A. C. S., 1995, ApJS, 100, 1
Henstock D. R., Browne I. W. A., Wilkinson P. N., McMa-hon R. G., 1997, MNRAS, 290, 380
Herbig T., Readhead A. C. S., 1992, ApJS, 81, 83
Hewett P. C., Foltz C. B., Chaffee F. H., 1995, AJ, 109, 1498
Hewitt A., Burbidge G., 1989, ApJS, 63, 1
Hewitt A., Burbidge G., 1991, ApJS, 75, 297
Hintzen P., Ulvestad J., Owen F., 1983, AJ, 88, 709
Hooimeyer J. R. A., Schilizzi R. T., Miley G. K.,Barthel P. D., 1992, A&A, 261, 25
Hook I. M., McMahon R. G., 1998, MNRAS, 294, L7
Hook I. M., McMahon R. G., Irwin M. J., Hazard C., 1996,MNRAS, 282, 1274
Kaiser C. R., Alexander P., 1997, MNRAS, 286, 215
Kellerman K. I., Vermeulen R. C., Zensus J. A., Co-hen M. H., 1998, AJ, 115, 1295
Kunert-Bajraszewska M., Marecki A., Thomasson P.,Spencer R. E., 2005, A&A, 440, 93
c© 0000 RAS, MNRAS 000, 000–000
kiloparsec symmetric objects I. The candidates 17
Kunert M., Marecki A., Spencer R. E., Kus A. J., Niez-goda J., 2002, A&A, 391, 47
Lara L., Cotton W. D., Feretti L., Giovannini G., Mar-caide J. M., Marquez I., Venturi T., 2001, A&A, 370,409
Le Borgne J.-F., Mathez G., Mellier Y., Pello R.,Sanahuja B., Soucail G., 1991, A&AS, 88, 133
Lonsdale C. J., Barthel P. D., Miley G. K., 1998, ApJS, 87,63
Magliocchetti M. et al., 2004, MNRAS, 350, 1485
Marcha M. J. M., Browne I. W. A., Impey C. D., Smith P. S.,1996, MNRAS, 281, 425
Marecki A., Falcke H., Niezgoda J., Garrington S. T., Pat-naik A. R., 1999, A&AS, 135, 273
Marecki A., Spencer R. E., Kunert M., 2003, PASA, 20, 46
Middelberg E. et al., 2004, A&A, 417, 925
Miller N. A., Owen F. N., 2001, ApJS, 134, 355
Miller N. A., Ledlow M. J., Owen F. N., Hill J. M., 2002,AJ, 123, 3018
Munoz J. A., Falco E. E., Kochanek C. S., Lehar J., Medi-avilla E., 2003, ApJ, 594, 684
Murgia M., Fanti C., Fanti R., Gregorini L., Klein U.,Mack K.-H., Vigotti M., 1999, A&A, 345, 769
Norris R. P., Baan W. A., Haschick A. D., Diamond P. J.,Booth R. S., 1985, MNRAS, 213, 823
Norris R. P., 1988, MNRAS, 230, 345
O’Dea C. P., Baum S. A., Stanghellini C., 1991, ApJ, 380,66
O’Dea C., 1998, PASP, 110, 493
Ojha R., Fey A. L., Johnston K. J., Jauncey D. L.,Tzioumis A. K., Reynolds J. E., 2004, AJ, 127, 1977
Orienti M., Dallacasa D., Fanti C., Fanti R., Tinti S.,Stanghellini C., 2004, A&A, 426, 463
Owsianik I., Conway J. E., Polatidis A. G., 1998, A&A, 336,L37
Patnaik A. R., Browne I. W. A., Wilkinson P. N., Wro-bel J. M., 1992a, MNRAS, 254, 655
Patnaik A. R., Browne I. W. A., Walsh D., Chaffee F. H.,Foltz C. B., 1992b, MNRAS, 259, P1
Peacock J. A., Wall J. V., 1982, MNRAS, 198, 843
Peck A. B., Taylor G. B., 2000, ApJ, 534, 90
Peck A. B., Taylor G. B., Fassnacht C. D., Readhead A.C. S., Vermeulen R. C., 2000, ApJ, 534, 104
Perlman E. S., Stocke J. T., Shaffer D. B., Carilli C. L.,Ma C., 1994, ApJ, 424, L69
Perlman E. S., Carilli C. L., Stocke J. T., Conway J., 1996,AJ, 111, 1839
Perlman E. S., Padovani P., Giommi P., Sambruna R.,Jones L. R., Tzioumis A., Reynolds J., 1998, AJ, 115,1253
Perlman E. S., Stocke J. T., Conway J., Reynolds C., 2001,AJ, 122, 536
Perucho M., Martı J. M., 2002, ApJ, 568, 639
Phillips R. B., Mutel R. L., 1982, A&A, 106, 21
Polatidis A. G., Conway J. E., 2003, PASA, 20, 69
Polatidis A. G., Wilkinson P. N., Xu W., Readhead A. C. S.,Pearson T. J., Taylor G. B., Vermeulen R. C., 1995,ApJS, 98, 1
Polatidis A. G., Wilkinson P. N., Xu W., Readhead A. C. S.,Pearson T. J., Taylor G. B., Vermeulen R. C., 1999,New Astron. Rev., 43, 657
Puchnarewicz E. M., Mason K. O., Cordova F. A., Kartje J.,Brabduardi-Raymont G., Mittaz J. P. D., Mur-din P. G., Allington-Smith J., 1992, MNRAS, 256,589
Readhead A. C. S., Taylor G. B., Xu W., Pearson T. J.,Wilkinson P. N., 1996a, ApJ, 460, 612
Readhead A. C. S., Taylor G. B., Pearson T. J., Wilkin-son P. N., 1996b, ApJ, 460, 634
Reid A., Shone D. L., Akujor C. E., Browne I. W. A., Mur-phy D. W., Pedelty J., Rudnick L., Walsh D., 1995,A&AS, 110, 213
Rossetti A., Mantovani F., Dallacasa D., Fanti C., Fanti R.,2005, A&A, 434, 449
Rovilos E., Diamond P. J., Lonsdale C. J., Smith H. E.,2003, MNRAS, 342, 373
Saikia D. J., Junor W., Cornwell T. J., Muxlow T. W. B.,Shastri P., 1990, MNRAS, 245, 408
Saikia D. J., Jeyakumar S., Mantovani F., Salter C. J.,Spencer R. E., Thomasson P., Wiita P. J., 2003,PASA, 20, 50
Sanghera H. S., Saikia D. J., Luedke E., Spencer R. E., Foul-sham P. A., Akujor C. E., Tzioumis A. K., 1995,A&A, 295, 629
Sargent W. L. W., 1973, ApJ, 182, L13
Scoville N. Z. et al., 1998, ApJ, 492, L107
Shaya E. J., Dowling D. M., Currie D. G., Faber S. M.,Groth E. J., 1994, AJ, 107, 1675
c© 0000 RAS, MNRAS 000, 000–000
18 Augusto et al.
Snellen I. A. G., Schilizzi R. T., Bremer M. N., Miley G. K.,de Bruyn A. G., Rottgering H. J., 1999, MNRAS,307, 149
Snellen I. A. G., Schilizzi R. T., van Langevelde H. J., 2000,MNRAS, 319, 429
Soifer B. T. et al., 1984, ApJ, 283, L1
Sowards-Emmerd D., Romani R. W., Michelson P. F., 2003,ApJ, 590, 109
Spencer R. E., McDowell J. C., Charlesworth M., Fanti C.,Parma P., Peacock J. A., 1989, MNRAS, 240, 657
Stanghellini C., O’Dea C. P., Baum S. A., Dallacasa D.,Fanti R., Fanti C., 1997a, A&A, 325, 943
Stanghellini C., Bondi M., Dallacasa D., O’Dea C. P.,Baum S. A., Fanti R., Fanti C., 1997b, A&A, 318,376
Stanghellini C., O’Dea C. P., Dallacasa D., Baum S. A.,Fanti R., Fanti C., 1998, A&AS, 131, 303
Stanghellini C., O’Dea C. P., Murphy D. W., 1999, A&AS,134, 309
Stanghellini C., Dallacasa D., O’Dea C. P., Baum S. A.,Fanti R., Fanti C., 2001, A&A, 377, 377
Stickel M., Kuhr H., 1993, A&AS, 101, 521
Stickel M., Kuhr H., 1996, A&AS, 115, 1
Stickel M., Rieke G. H., Kuhr H., Rieke M. J., 1996, ApJ,468, 556
Sykes C. M., 1997, Ph.D. Thesis, University of Manchester,UK
Tadhunter C. N., Morganti R., di Serego-Alighieri S., Fos-bury R. A. E., Danziger I. J., 1993, MNRAS, 263,999
Taylor G. B., Peck A. B., 2003, ApJ, 597, 157
Taylor G. B., Vermeulen R. C., 1997, ApJ, 485, L9
Taylor G. B., Vermeulen R. C., Pearson T. J., Readhead A.C. S., Henstock D. R., Browne I. W. A., Wilkin-son P. N., 1994, ApJS, 95, 345
Taylor G. B., Readhead A. C. S., Pearson T. J., 1996a, ApJ,463, 95
Taylor G. B., Vermeulen R. C., Readhead A. C. S., Pear-son T. J., Henstock D. R., Wilkinson P. N., 1996b,ApJS, 107, 37
Taylor G. B., Vermeulen R. C., Readhead A. C. S., Pear-son T. J., Henstock D. R., Wilkinson P., 1997, inSnellen I. A. G., Schilizzi R. T., Rottgering H. J. A.,Bremer M. N., eds, The Second Workshop on Gi-gahertz Peaked Spectrum and Compact Steep Spec-trum Radio Sources. Leiden Observatory
Taylor G. B., Wrobel J. M., Vermeulen R. C., 1998, ApJ,498, 619
Taylor G. B., Marr J. M., Pearson T. J., Readhead A. C. S.,2000, ApJ, 541, 112
Taylor G. B. et al., 2005, ApJS, 159, 27
Thompson D., Djorgovski S., de Carvalho R., 1990, PASP,102, 1235
Torniainen I., Tornikoski M., Terasranta H., Aller M. F.,Aller H. D., 2005, A&A, 435, 839
Tornikoski M., Jussila I., Johansson P., Lainela M., Val-taoja E., 2001, AJ, 121, 1306
Tschager W., Schilizzi R. T., Rottgering H. J. A., Snellen I.A. G., Miley G. K., 2000, A&A, 360, 887
Tschager W., Schilizzi R. T., Rottgering H. J. A., Snellen I.A. G., Miley G. K., Perley R. A., 2003, A&A, 402,171
Tzioumis A. et al., 1989, AJ, 98, 36
Tzioumis A. K. et al., 2002, A&A, 392, 841
Unger S. W., Pedlar A., Neff S. G., de Bruyn A. G., 1984,MNRAS, 209, 15P
Unger S. W., Pedlar A., Booler R. V., Harrison B. A., 1986,MNRAS, 219, 387
Vermeulen R. C., Taylor G. B., 1995, AJ, 109, 1983
Vermeulen R. C., Taylor G. B., Redhead A. C. S., Browne I.W. A., 1996, AJ, 111, 1013
Wegner G., Colless M., Saglia R. P., McMahan R. K.,Davies R. L., Burstein D., Baggley G., 1999, MN-RAS, 305, 259
White R. L., Becker R. H., 1992, ApJS, 79, 331
White R. L., Kinney A. L., Becker R. H., 1993, ApJ, 407,456
Wiklind T., Combes F., 1997, A&A, 328, 48
Wilkinson P. N., Polatidis A., Readhead A. C. S., Xu W.,Person T. J., 1994, ApJ, 432, L87
Wilkinson P. N., 1995, Proc. Natl. Acad. Sci, 92, 11342
Willott C. J., Rawlings A., Blundell K. M., Lacy M., 1998,MNRAS, 300, 625
Wills D., Wills B. J., 1976, ApJS, 31, 143
Xu W., Lawrence C. R., Readhead A. C. S., Pearson T. J.,1994, AJ, 108, 395
Xu W., Readhead A. C. S., Pearson T. J., Polatidis A. G.,Wilkinson P. N., 1995, ApJS, 99, 297
Yee H. K. C., Ellingson E., Abraham R. G., Gravel P.,
c© 0000 RAS, MNRAS 000, 000–000
kiloparsec symmetric objects I. The candidates 19
Carlberg R. G., Smecker-Hane T. A., Schade D.,Rigler M., 1996, ApJS, 102, 289
Zensus J. A., Ros E., Kellermann K. I., Cohen M. H., Ver-meulen R. C., Kadler M., 2002, AJ, 124, 662
APPENDIX A: COMMENTS ON PREVIOUSRELATED PAPERS
In what follows, in two separate sections, we discuss theimplications of the new parent sample (1743 sources vs. theold 1665) and main sample (157 sources vs. the old 55) sizesand membership to the two main related papers, Augustoet al. (1998) and Augusto & Wilkinson (2001).
A1 Augusto et al. (1998)
Well after publishing this paper, we found that one of the55-sample sources (B1947+677) had a significantly wrongposition. It should have read (J2000.0): 19:47:36.2599 (RA)and 67:50:16.928 (dec). This has been corrected in Tables 4and 5. In addition, there are now new α4.85
1.40 values for sevenof the Augusto et al. (1998) Table 2 (Column (7)) 55-sample sources while five others (B0352+825, B0819+082,B0905+420, B1801+036, B2101+664) should be left withblanks (rather than fill them with spectral indices fromsources other than White & Becker (1992) and Gregory& Condon (1991)): −0.02 (B0218+357); 0.25 (B0821+394);0.24 (B0831+557); 0.22 (B0916+718); 0.47 (B1143+446);0.38 (B1947+677); 0.04 (B2201+044).
As regards the statistical conclusions of Augusto et al.(1998) we must revise them by comparing the “old” and the“new” situations, now that we have both revised the par-ent sample and the 55-source sample (which, now, has allits sources included in the larger 157-source sample). We fo-cus on the α4.85
1.40 distribution only. Starting with the parentsamples we first note that, while for the new sample we usedthe maximum number possible of values (1311) for the oldone a representative sub-sample of 373 sources was selectedand it is from this one that the statistics of Augusto et al.(1998) are worked out. Comparing both through a KS-testwe cannot reject the hypothesis that they are similar. Fi-nally, comparing the α4.85
1.40 distributions for the 157-source(actually 123 values) and 55-source samples through a KS-test we cannot reject the hypothesis that they are similar.
A2 Augusto & Wilkinson (2001)
The only result from Augusto & Wilkinson (2001) that is af-fected by the change from the old 1665-source parent sampleto the new 1743-source one relates to their different sizes:the quoted maximum multiple imaging lensing rate on 109.5–1010.9M⊙ (160–300 mas angular separation of images) of1:555 (95% confidence level) actually improves to 1:581 atthe same confidence level. As regards to the main result ofthe paper (limits on the density of compact objects withinthe above mass range of ΩCO < 0.1 at 95% confidence), thisremains unchanged since the 5% increase in sample size doesnot cause significant effects.
c© 0000 RAS, MNRAS 000, 000–000
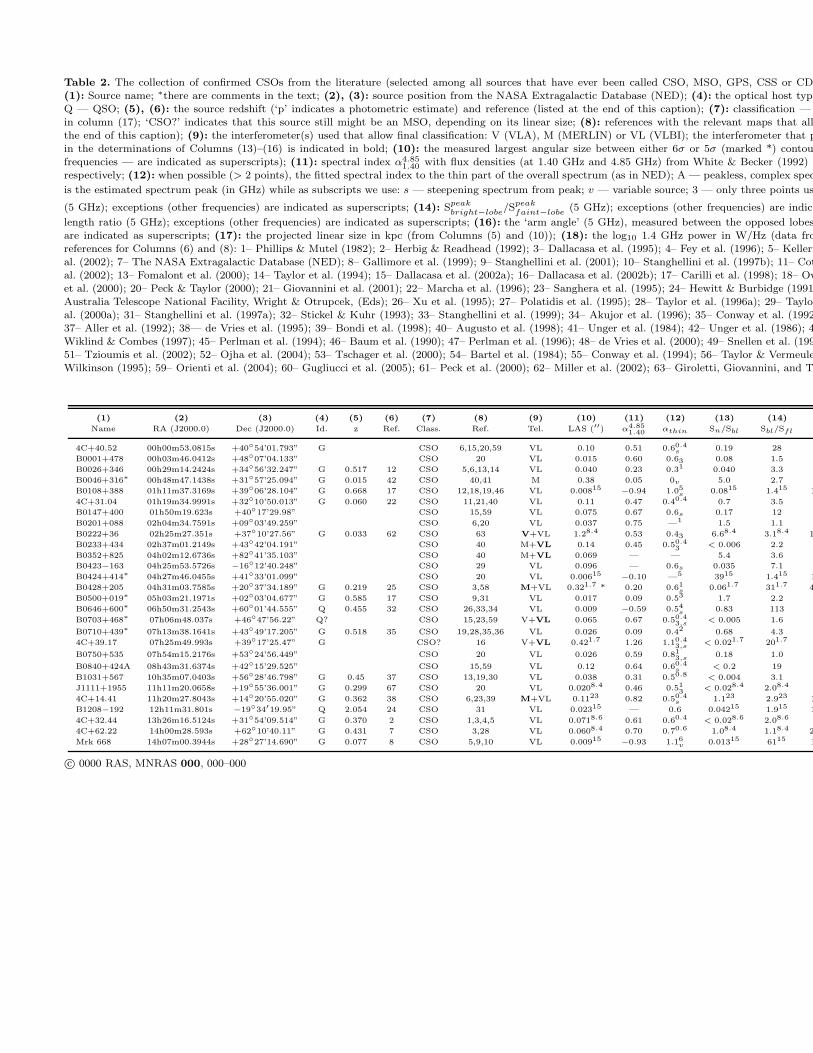
Table 2. The collection of confirmed CSOs from the literature (selected among all sources that have ever been called CSO, MSO, GPS, CSS or CD).(1): Source name; ∗there are comments in the text; (2), (3): source position from the NASA Extragalactic Database (NED); (4): the optical host type,Q — QSO; (5), (6): the source redshift (‘p’ indicates a photometric estimate) and reference (listed at the end of this caption); (7): classification —in column (17); ‘CSO?’ indicates that this source still might be an MSO, depending on its linear size; (8): references with the relevant maps that allothe end of this caption); (9): the interferometer(s) used that allow final classification: V (VLA), M (MERLIN) or VL (VLBI); the interferometer that proin the determinations of Columns (13)–(16) is indicated in bold; (10): the measured largest angular size between either 6σ or 5σ (marked *) contoursfrequencies — are indicated as superscripts); (11): spectral index α4.85
1.40 with flux densities (at 1.40 GHz and 4.85 GHz) from White & Becker (1992) andrespectively; (12): when possible (> 2 points), the fitted spectral index to the thin part of the overall spectrum (as in NED); A — peakless, complex spectrum
is the estimated spectrum peak (in GHz) while as subscripts we use: s — steepening spectrum from peak; v — variable source; 3 — only three points used;
(5 GHz); exceptions (other frequencies) are indicated as superscripts; (14): Speak
bright−lobe/Speak
faint−lobe(5 GHz); exceptions (other frequencies) are indicated
length ratio (5 GHz); exceptions (other frequencies) are indicated as superscripts; (16): the ‘arm angle’ (5 GHz), measured between the opposed lobes;are indicated as superscripts; (17): the projected linear size in kpc (from Columns (5) and (10)); (18): the log10 1.4 GHz power in W/Hz (data fromreferences for Columns (6) and (8): 1– Phillips & Mutel (1982); 2– Herbig & Readhead (1992); 3– Dallacasa et al. (1995); 4– Fey et al. (1996); 5– Kellermanal. (2002); 7– The NASA Extragalactic Database (NED); 8– Gallimore et al. (1999); 9– Stanghellini et al. (2001); 10– Stanghellini et al. (1997b); 11– Cottonal. (2002); 13– Fomalont et al. (2000); 14– Taylor et al. (1994); 15– Dallacasa et al. (2002a); 16– Dallacasa et al. (2002b); 17– Carilli et al. (1998); 18– Owsianiket al. (2000); 20– Peck & Taylor (2000); 21– Giovannini et al. (2001); 22– Marcha et al. (1996); 23– Sanghera et al. (1995); 24– Hewitt & Burbidge (1991);Australia Telescope National Facility, Wright & Otrupcek, (Eds); 26– Xu et al. (1995); 27– Polatidis et al. (1995); 28– Taylor et al. (1996a); 29– Tayloral. (2000a); 31– Stanghellini et al. (1997a); 32– Stickel & Kuhr (1993); 33– Stanghellini et al. (1999); 34– Akujor et al. (1996); 35– Conway et al. (1992);37– Aller et al. (1992); 38— de Vries et al. (1995); 39– Bondi et al. (1998); 40– Augusto et al. (1998); 41– Unger et al. (1984); 42– Unger et al. (1986); 43–Wiklind & Combes (1997); 45– Perlman et al. (1994); 46– Baum et al. (1990); 47– Perlman et al. (1996); 48– de Vries et al. (2000); 49– Snellen et al. (1999);51– Tzioumis et al. (2002); 52– Ojha et al. (2004); 53– Tschager et al. (2000); 54– Bartel et al. (1984); 55– Conway et al. (1994); 56– Taylor & VermeulenWilkinson (1995); 59– Orienti et al. (2004); 60– Gugliucci et al. (2005); 61– Peck et al. (2000); 62– Miller et al. (2002); 63– Giroletti, Giovannini, and Ta
(1) (2) (3) (4) (5) (6) (7) (8) (9) (10) (11) (12) (13) (14) (15)
Name RA (J2000.0) Dec (J2000.0) Id. z Ref. Class. Ref. Tel. LAS (′′) α4.851.40
αthin Sn/Sbl Sbl/Sfl
4C+40.52 00h00m53.0815s +4054’01.793” G CSO 6,15,20,59 VL 0.10 0.51 0.60.4s 0.19 28
B0001+478 00h03m46.0412s +4807’04.133” CSO 20 VL 0.015 0.60 0.63 0.08 1.5
B0026+346 00h29m14.2424s +3456’32.247” G 0.517 12 CSO 5,6,13,14 VL 0.040 0.23 0.31 0.040 3.3
B0046+316∗ 00h48m47.1438s +3157’25.094” G 0.015 42 CSO 40,41 M 0.38 0.05 0v 5.0 2.7
B0108+388 01h11m37.3169s +3906’28.104” G 0.668 17 CSO 12,18,19,46 VL 0.00815−0.94 1.05
s 0.0815 1.415 1.4
4C+31.04 01h19m34.9991s +3210’50.013” G 0.060 22 CSO 11,21,40 VL 0.11 0.47 0.40.4 0.7 3.5
B0147+400 01h50m19.623s +4017’29.98” CSO 15,59 VL 0.075 0.67 0.6s 0.17 12
B0201+088 02h04m34.7591s +0903’49.259” CSO 6,20 VL 0.037 0.75 —1 1.5 1.1
B0222+36 02h25m27.351s +3710’27.56” G 0.033 62 CSO 63 V+VL 1.28.4 0.53 0.43 6.68.4 3.18.4 1.1
B0233+434 02h37m01.2149s +4342’04.191” CSO 40 M+VL 0.14 0.45 0.50.43
< 0.006 2.2
B0352+825 04h02m12.6736s +8241’35.103” CSO 40 M+VL 0.069 — — 5.4 3.6
B0423−163 04h25m53.5726s −1612’40.248” CSO 29 VL 0.096 — 0.6s 0.035 7.1
B0424+414∗ 04h27m46.0455s +4133’01.099” CSO 20 VL 0.00615−0.10 —5 3915 1.415 1.5
B0428+205 04h31m03.7585s +2037’34.189” G 0.219 25 CSO 3,58 M+VL 0.321.7 * 0.20 0.61
s 0.061.7 311.7 4.6
B0500+019∗ 05h03m21.1971s +0203’04.677” G 0.585 17 CSO 9,31 VL 0.017 0.09 0.53 1.7 2.2
B0646+600∗ 06h50m31.2543s +6001’44.555” Q 0.455 32 CSO 26,33,34 VL 0.009 −0.59 0.54
s 0.83 113
B0703+468∗ 07h06m48.037s +4647’56.22” Q? CSO 15,23,59 V+VL 0.065 0.67 0.50.43,s
< 0.005 1.6
B0710+439∗ 07h13m38.1641s +4349’17.205” G 0.518 35 CSO 19,28,35,36 VL 0.026 0.09 0.42 0.68 4.3
4C+39.17 07h25m49.993s +3917’25.47” G CSO? 16 V+VL 0.421.7 1.26 1.10.43,s
< 0.021.7 201.7
B0750+535 07h54m15.2176s +5324’56.449” CSO 20 VL 0.026 0.59 0.81
3,s0.18 1.0
B0840+424A 08h43m31.6374s +4215’29.525” CSO 15,59 VL 0.12 0.64 0.60.4s < 0.2 19
B1031+567 10h35m07.0403s +5628’46.798” G 0.45 37 CSO 13,19,30 VL 0.038 0.31 0.50.8 < 0.004 3.1
J1111+1955 11h11m20.0658s +1955’36.001” G 0.299 67 CSO 20 VL 0.0208.4 0.46 0.51
3< 0.028.4 2.08.4
4C+14.41 11h20m27.8043s +1420’55.020” G 0.362 38 CSO 6,23,39 M+VL 0.1123 0.82 0.50.4s 1.123 2.923 1.2
B1208−192 12h11m31.801s −1934′19.95” Q 2.054 24 CSO 31 VL 0.02315 — 0.6 0.04215 1.915 1.2
4C+32.44 13h26m16.5124s +3154’09.514” G 0.370 2 CSO 1,3,4,5 VL 0.0718.6 0.61 0.60.4 < 0.028.6 2.08.6
4C+62.22 14h00m28.593s +6210’40.11” G 0.431 7 CSO 3,28 VL 0.0608.4 0.70 0.70.6 1.08.4 1.18.4 2.5
Mrk 668 14h07m00.3944s +2827’14.690” G 0.077 8 CSO 5,9,10 VL 0.00915−0.93 1.16
v 0.01315 6115 1.2
c© 0000 RAS, MNRAS 000, 000–000
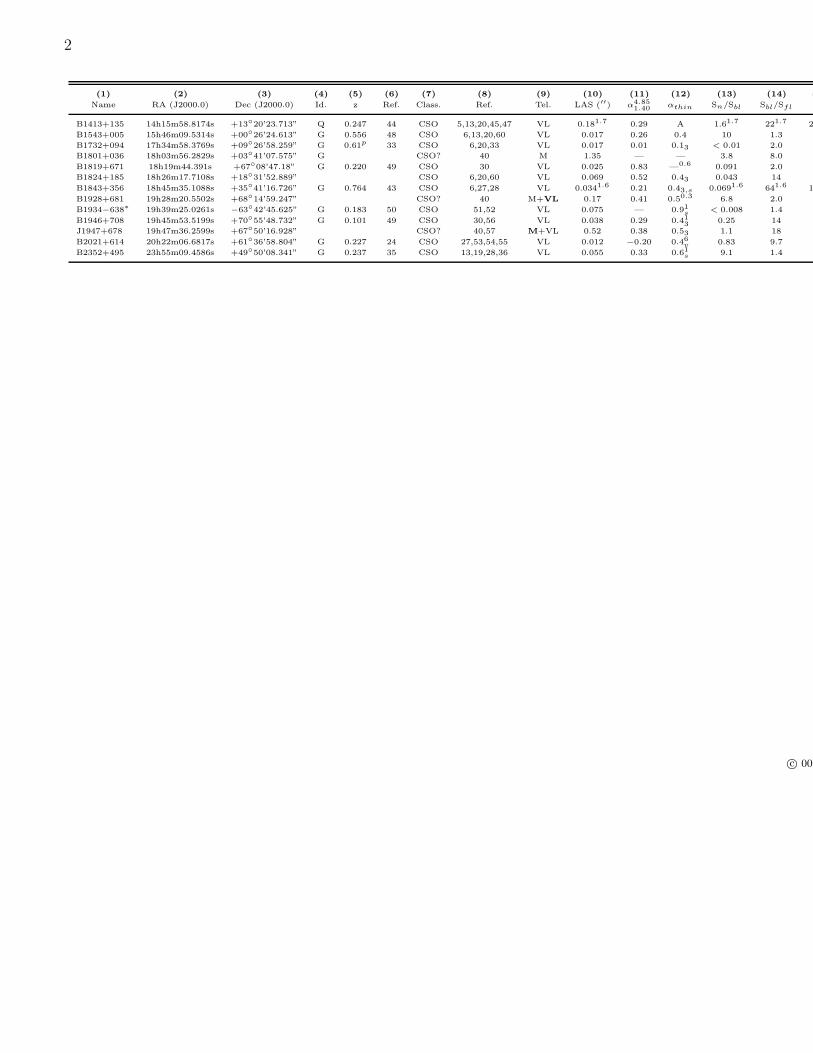
2
(1) (2) (3) (4) (5) (6) (7) (8) (9) (10) (11) (12) (13) (14) (15)
Name RA (J2000.0) Dec (J2000.0) Id. z Ref. Class. Ref. Tel. LAS (′′) α4.851.40
αthin Sn/Sbl Sbl/Sfl
B1413+135 14h15m58.8174s +1320’23.713” Q 0.247 44 CSO 5,13,20,45,47 VL 0.181.7 0.29 A 1.61.7 221.7 2.5
B1543+005 15h46m09.5314s +0026’24.613” G 0.556 48 CSO 6,13,20,60 VL 0.017 0.26 0.4 10 1.3
B1732+094 17h34m58.3769s +0926’58.259” G 0.61p 33 CSO 6,20,33 VL 0.017 0.01 0.13 < 0.01 2.0
B1801+036 18h03m56.2829s +0341’07.575” G CSO? 40 M 1.35 — — 3.8 8.0
B1819+671 18h19m44.391s +6708’47.18” G 0.220 49 CSO 30 VL 0.025 0.83 —0.6 0.091 2.0
B1824+185 18h26m17.7108s +1831’52.889” CSO 6,20,60 VL 0.069 0.52 0.43 0.043 14
B1843+356 18h45m35.1088s +3541’16.726” G 0.764 43 CSO 6,27,28 VL 0.0341.6 0.21 0.43,s 0.0691.6 641.6 1.0
B1928+681 19h28m20.5502s +6814’59.247” CSO? 40 M+VL 0.17 0.41 0.50.3 6.8 2.0
B1934−638∗ 19h39m25.0261s −6342’45.625” G 0.183 50 CSO 51,52 VL 0.075 — 0.91
s < 0.008 1.4
B1946+708 19h45m53.5199s +7055’48.732” G 0.101 49 CSO 30,56 VL 0.038 0.29 0.41
30.25 14
J1947+678 19h47m36.2599s +6750’16.928” CSO? 40,57 M+VL 0.52 0.38 0.53 1.1 18
B2021+614 20h22m06.6817s +6136’58.804” G 0.227 24 CSO 27,53,54,55 VL 0.012 −0.20 0.46
v 0.83 9.7
B2352+495 23h55m09.4586s +4950’08.341” G 0.237 35 CSO 13,19,28,36 VL 0.055 0.33 0.61
s 9.1 1.4
c© 0000
Related Documents