20 January 2015 3QFY15 Results Update | Sector: Financials Kotak Mahindra Bank Alpesh Mehta ([email protected]); +91 22 3982 5415 Vallabh Kulkarni ([email protected]); +91 22 3982 5430 BSE SENSEX S&P CNX CMP: INR1,396 TP: INR1,325 (-5%) Neutral 28,785 8,696 Bloomberg KMB IN Equity Shares (m) 770.3 M.Cap. (INR b) / (USD b) 1,070/16.8 52-Week Range (INR) 1,440/631 1, 6, 12 Rel. Per (%) 8/37/56 Avg Val/Vol ‘000 1,182/1,224 Free float (%) 60.0 Financials & Valuation (INR b) Y/E Mar 2015E 2016E 2017E NII 61.9 74.1 89.5 OP 42.1 50.9 62.9 NP 25.2 30.1 37.4 NP* 36.1 43.7 54.3 NIM (%) 4.1 4.1 4.0 EPS (INR)* 39.7 48.1 59.7 EPS Gr. (%) 21.1 24.2 BV. (INR)* 323.7 368.8 424.8 RoE (%) 12.3 13.1 14.4 RoA (%) 1.6 1.6 1.6 RoE (%)* 13.0 13.9 15.1 Valuations P/EPS (X)* 35.1 29.0 23.3 P/ BV (X)* 4.3 3.8 3.3 * Consolidated Healthy banking profitability; other businesses under pressure KMB’s 3QFY15 consolidated PAT missed our estimate by 6%. While banking business’ profits were in line, aided by strong loan (+22% YoY) and fees (+45% YoY in 3Q/9M) growth, continued competitive pressure on other businesses (INR2.5b, flat YoY) impacted overall profitability (est. of INR3b). Banking business: Standalone PAT grew 37% YoY (on a lower base) to INR4.65b (in-line). Strong total income growth (+28% YoY) was driven by healthy fees (+45% YoY) and higher trading gains (+123% YoY). Share of CV/CE loans (-16% YoY) in overall loans is down to an all-time low of ~7.8%. Loan growth (ex-CV) remains healthy at 27% YoY driven by unsecured retail loans (9% of loans, +38% YoY) and corporate banking (34% of loans, +33% YoY). Reported CASA ratio up 100bp QoQ to 32% led by continued traction in CA (+13% QoQ) and SA (+6%). Other highlights: (1) K-Sec market share improved 10bp QoQ to 2.8%, (2) car loan disbursements grew 25% YoY to INR18.9b, though vehicle (ex CV) loans were up just 13% YoY driven by higher repayments, (3) domestic AMC AUM increased 5% QoQ to INR364b but reported a loss of INR100m (higher distribution commission, in-line with competition) and (4) NIM (consolidated) was down 30bp QoQ to 4.7%. Valuation and view: Merger with VYSB places KMB in a sweet spot, with strong presence across geographies, products and continued healthy capitalization (CET 1 of 16.5%). The merged entity will be the fourth-largest private sector bank with a loan book of INR1.2t and market share of 1.8% of loans. KMB’s premium multiples are likely to sustain considering the strong growth and operating leverage available across businesses. While we are positive on the business, valuations at 3.3x/23x consolidated BV/EPS limit the upside. Maintain Neutral with an SOTP-based target price of INR1,325 (pro-forma merged VYSB). Investors are advised to refer through disclosures made at the end of the Research Report. Motilal Oswal research is available on www.motilaloswal.com/Institutional-Equities , Bloomberg, Thomson Reuters, Factset and S&P Capital.

financial results, fundamental, accumulate, analysis, investment, CMP, target price, revenue, profit, banking, Motilal Oswal, Kotak Mahindra bank, consolidated PAT, business, merger,
Aug 07, 2015
Welcome message from author
This document is posted to help you gain knowledge. Please leave a comment to let me know what you think about it! Share it to your friends and learn new things together.
Transcript

20 January 2015
3QFY15 Results Update | Sector: Financials
Kotak Mahindra Bank
Alpesh Mehta ([email protected]); +91 22 3982 5415
Vallabh Kulkarni ([email protected]); +91 22 3982 5430
BSE SENSEX S&P CNX CMP: INR1,396 TP: INR1,325 (-5%) Neutral 28,785 8,696
Bloomberg KMB IN
Equity Shares (m) 770.3
M.Cap. (INR b) / (USD b) 1,070/16.8
52-Week Range (INR) 1,440/631
1, 6, 12 Rel. Per (%) 8/37/56
Avg Val/Vol ‘000 1,182/1,224
Free float (%) 60.0
Financials & Valuation (INR b)
Y/E Mar 2015E 2016E 2017E
NII 61.9 74.1 89.5
OP 42.1 50.9 62.9
NP 25.2 30.1 37.4
NP* 36.1 43.7 54.3
NIM (%) 4.1 4.1 4.0
EPS (INR)* 39.7 48.1 59.7
EPS Gr. (%) 21.1 24.2
BV. (INR)* 323.7 368.8 424.8
RoE (%) 12.3 13.1 14.4
RoA (%) 1.6 1.6 1.6
RoE (%)* 13.0 13.9 15.1
Valuations
P/EPS (X)* 35.1 29.0 23.3
P/ BV (X)* 4.3 3.8 3.3 * Consolidated
Healthy banking profitability; other businesses under pressure KMB’s 3QFY15 consolidated PAT missed our estimate by 6%. While banking business’ profits were in line, aided by strong loan (+22% YoY) and fees (+45% YoY in 3Q/9M) growth, continued competitive pressure on other businesses (INR2.5b, flat YoY) impacted overall profitability (est. of INR3b). Banking business: Standalone PAT grew 37% YoY (on a lower base) to INR4.65b
(in-line). Strong total income growth (+28% YoY) was driven by healthy fees (+45% YoY) and higher trading gains (+123% YoY). Share of CV/CE loans (-16% YoY) in overall loans is down to an all-time low of ~7.8%. Loan growth (ex-CV) remains healthy at 27% YoY driven by unsecured retail loans (9% of loans, +38% YoY) and corporate banking (34% of loans, +33% YoY). Reported CASA ratio up 100bp QoQ to 32% led by continued traction in CA (+13% QoQ) and SA (+6%).
Other highlights: (1) K-Sec market share improved 10bp QoQ to 2.8%, (2) car loan disbursements grew 25% YoY to INR18.9b, though vehicle (ex CV) loans were up just 13% YoY driven by higher repayments, (3) domestic AMC AUM increased 5% QoQ to INR364b but reported a loss of INR100m (higher distribution commission, in-line with competition) and (4) NIM (consolidated) was down 30bp QoQ to 4.7%.
Valuation and view: Merger with VYSB places KMB in a sweet spot, with strong presence across geographies, products and continued healthy capitalization (CET 1 of 16.5%). The merged entity will be the fourth-largest private sector bank with a loan book of INR1.2t and market share of 1.8% of loans. KMB’s premium multiples are likely to sustain considering the strong growth and operating leverage available across businesses. While we are positive on the business, valuations at 3.3x/23x consolidated BV/EPS limit the upside. Maintain Neutral with an SOTP-based target price of INR1,325 (pro-forma merged VYSB).
Investors are advised to refer through disclosures made at the end of the Research Report.
Motilal Oswal research is available on www.motilaloswal.com/Institutional-Equities, Bloomberg, Thomson Reuters, Factset and S&P Capital.
20 January 2015 2
Kotak Mahindra Bank
Lending Business: Strong growth in corporate banking and unsecured loans; NIM softened QoQ to 4.7%; stable asset quality Profitability of the banking business was in-line with estimates with PAT of
INR4.65b (+37% YoY and +4% QoQ). PAT of lending business increased 28% YoY to INR6.1b (largely in-line with estimate)
Kotak Prime PAT declined 2% YoY and 4% QoQ to INR1.2b. On a lower base, Kotak Mahindra investments PAT grew 118% YoY to INR240m.
Standalone Bank: NIM declined 30bp QoQ to 4.7% as loan mix shifted towards relatively lower yielding corporate loans. Strong growth was witnessed in unsecured retail loans (+38% YoY) and corporate banking (+33% YoY). Fees grew strongly at 45% YoY helped by strong distribution related fees. Further, higher treasury (+123% YoY) led to overall non-interest income being 5% higher than estimate at INR4.9b.
Opex was largely inline (+30% YoY and +6% QoQ). INR560m write-back of provisions on investment book led to provisions 37% lower than estimate. Credit cost remained stable QoQ at ~0.5% (annualized).
Stable Asset quality; NSL one of the lowest among peers: GNPA increased 6% QoQ and in percentage terms stood at 1.9% (flat QoQ). NNPA% also remained flat QoQ at 1%. PCR improved marginally to 48.4% as compared to 47.5% in 2QFY15. Restructured loans were stable QoQ at ~25bp loans. Net Stressed Loans (NSL, 1.2% of loans) remains one of the lowest amongst peers.
Traction in CASA Deposits continues: SA deposits grew 6% QoQ and 36% YoY and new SA customer addition per quarter remains healthy at 0.2m. SA deposits as a proportion of overall deposits stood at 17% (stable QoQ).
Impressive growth in CA deposits continues and it 13% QoQ (+50% YoY). CASA (excluding float) grew 42% YoY (+9% QoQ). Reported CASA ratio improved 100bp QoQ to 32% as compared to 31% in 2QFY15 and 30% in 3QFY14. KMB further reduced its reliance on CDs which formed 7% of overall deposits as compared to 10% in FY14 and peak of 21.5% at end of 3QFY13. CASA and TDs below INR10m constitute 65% of total deposits (64% in 3QFY14).
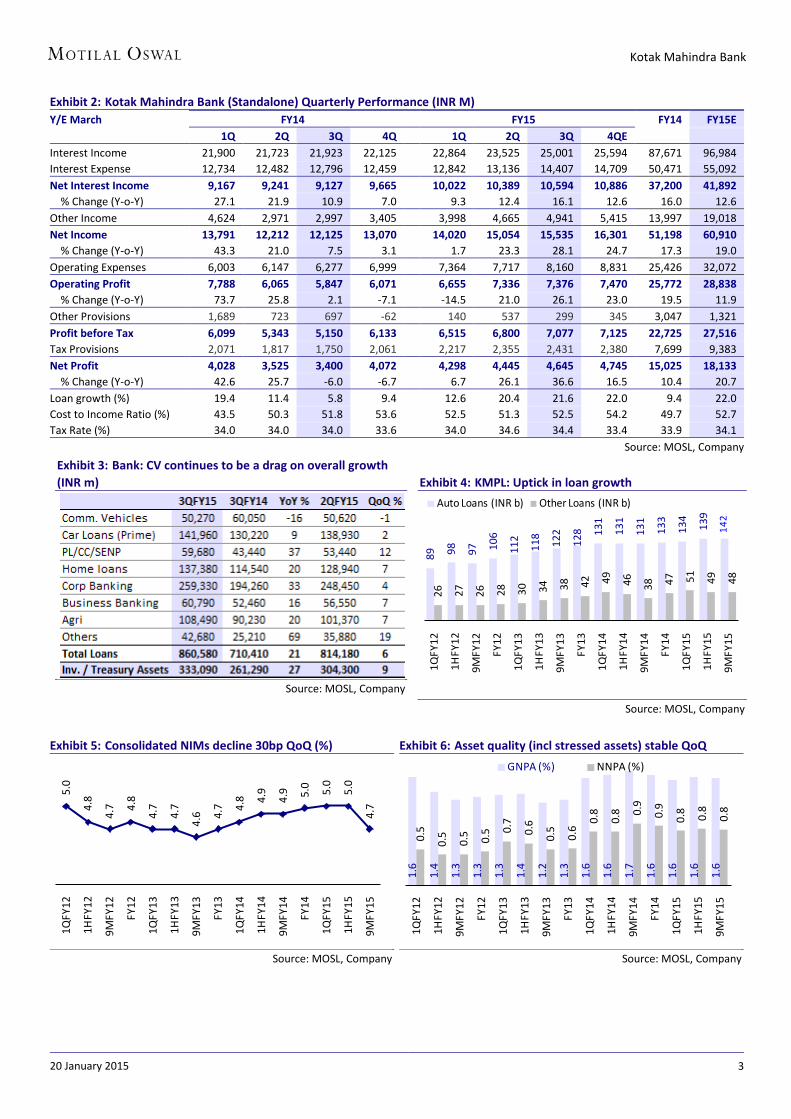
Consolidated ex-CV loan growth at 25% YoY: CV loan portfolio declined 1% QoQ and 16% YoY dragging overall loan growth to 21% YoY (+6% QoQ). CV loans as a proportion of overall loans now formed 5.8% as compared to 6.2% in previous quarter and 8.5% a year ago. Ex-CV loan growth was healthy at 25% YoY driven by strong growth in corporate segment (+4% QoQ and 33% YoY) and personal unsecured loans (+12% QoQ and 37% YoY). Growth in home loans (+7% QoQ and 20% YoY) also healthy. Car loans (Prime) is slowly gaining traction (+9% YoY and 2% QoQ).
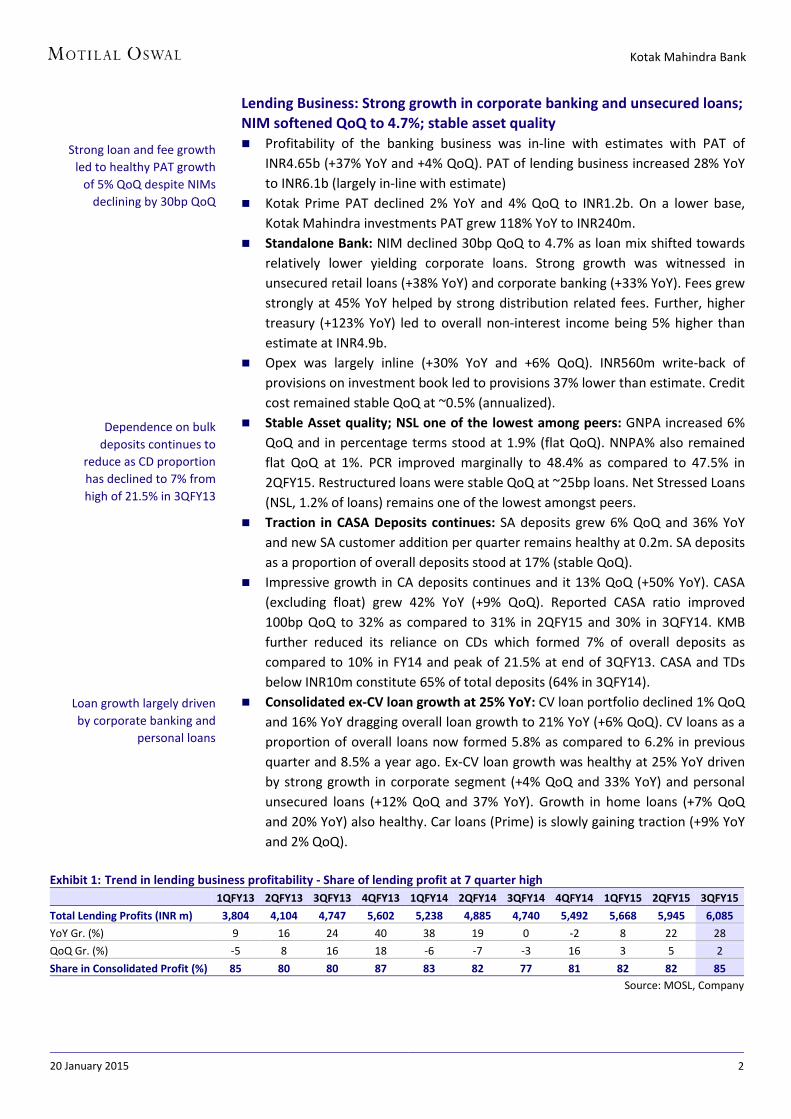
Exhibit 1: Trend in lending business profitability - Share of lending profit at 7 quarter high 1QFY13 2QFY13 3QFY13 4QFY13 1QFY14 2QFY14 3QFY14 4QFY14 1QFY15 2QFY15 3QFY15
Total Lending Profits (INR m) 3,804 4,104 4,747 5,602 5,238 4,885 4,740 5,492 5,668 5,945 6,085
YoY Gr. (%) 9 16 24 40 38 19 0 -2 8 22 28
QoQ Gr. (%) -5 8 16 18 -6 -7 -3 16 3 5 2
Share in Consolidated Profit (%) 85 80 80 87 83 82 77 81 82 82 85
Source: MOSL, Company
Strong loan and fee growth led to healthy PAT growth
of 5% QoQ despite NIMs declining by 30bp QoQ
Dependence on bulk deposits continues to
reduce as CD proportion has declined to 7% from high of 21.5% in 3QFY13
Loan growth largely driven by corporate banking and
personal loans
20 January 2015 3
Kotak Mahindra Bank
Exhibit 2: Kotak Mahindra Bank (Standalone) Quarterly Performance (INR M) Y/E March FY14 FY15 FY14 FY15E 1Q 2Q 3Q 4Q 1Q 2Q 3Q 4QE Interest Income 21,900 21,723 21,923 22,125
22,864 23,525 25,001 25,594 87,671 96,984
Interest Expense 12,734 12,482 12,796 12,459 12,842 13,136 14,407 14,709 50,471 55,092 Net Interest Income 9,167 9,241 9,127 9,665
10,022 10,389 10,594 10,886 37,200 41,892
% Change (Y-o-Y) 27.1 21.9 10.9 7.0 9.3 12.4 16.1 12.6 16.0 12.6 Other Income 4,624 2,971 2,997 3,405 3,998 4,665 4,941 5,415 13,997 19,018 Net Income 13,791 12,212 12,125 13,070
14,020 15,054 15,535 16,301 51,198 60,910
% Change (Y-o-Y) 43.3 21.0 7.5 3.1 1.7 23.3 28.1 24.7 17.3 19.0 Operating Expenses 6,003 6,147 6,277 6,999 7,364 7,717 8,160 8,831 25,426 32,072 Operating Profit 7,788 6,065 5,847 6,071
6,655 7,336 7,376 7,470 25,772 28,838
% Change (Y-o-Y) 73.7 25.8 2.1 -7.1 -14.5 21.0 26.1 23.0 19.5 11.9 Other Provisions 1,689 723 697 -62 140 537 299 345 3,047 1,321 Profit before Tax 6,099 5,343 5,150 6,133
6,515 6,800 7,077 7,125 22,725 27,516
Tax Provisions 2,071 1,817 1,750 2,061 2,217 2,355 2,431 2,380 7,699 9,383 Net Profit 4,028 3,525 3,400 4,072
4,298 4,445 4,645 4,745 15,025 18,133
% Change (Y-o-Y) 42.6 25.7 -6.0 -6.7 6.7 26.1 36.6 16.5 10.4 20.7 Loan growth (%) 19.4 11.4 5.8 9.4
12.6 20.4 21.6 22.0 9.4 22.0
Cost to Income Ratio (%) 43.5 50.3 51.8 53.6
52.5 51.3 52.5 54.2 49.7 52.7 Tax Rate (%) 34.0 34.0 34.0 33.6 34.0 34.6 34.4 33.4 33.9 34.1
Source: MOSL, Company
Exhibit 3: Bank: CV continues to be a drag on overall growth (INR m)
Source: MOSL, Company
Exhibit 4: KMPL: Uptick in loan growth
89 98 97 106
112
118
122
128 13
1
131
131
133
134
139
142
26 27 26 28 30 34 38 42 49 46 38 47 51 49 48
1QFY
12
1HFY
12
9MFY
12
FY12
1QFY
13
1HFY
13
9MFY
13
FY13
1QFY
14
1HFY
14
9MFY
14
FY14
1QFY
15
1HFY
15
9MFY
15
Auto Loans (INR b) Other Loans (INR b)
Source: MOSL, Company
Exhibit 5: Consolidated NIMs decline 30bp QoQ (%)
5.0
4.8
4.7 4.
8
4.7
4.7
4.6 4.
7 4.8 4.
9
4.9 5.
0 5.0
5.0
4.7
1QFY
12
1HFY
12
9MFY
12
FY12
1QFY
13
1HFY
13
9MFY
13
FY13
1QFY
14
1HFY
14
9MFY
14
FY14
1QFY
15
1HFY
15
9MFY
15
Source: MOSL, Company
Exhibit 6: Asset quality (incl stressed assets) stable QoQ
1.6
1.4
1.3
1.3
1.3
1.4
1.2
1.3
1.6
1.6
1.7
1.6
1.6
1.6
1.6
0.5
0.5
0.5 0.5 0.
7
0.6
0.5
0.6
0.8
0.8 0.
9
0.9
0.8
0.8
0.8
1QFY
12
1HFY
12
9MFY
12
FY12
1QFY
13
1HFY
13
9MFY
13
FY13
1QFY
14
1HFY
14
9MFY
14
FY14
1QFY
15
1HFY
15
9MFY
15
GNPA (%) NNPA (%)
Source: MOSL, Company

20 January 2015 4
Kotak Mahindra Bank
Weak quarter for most non-lending businesses Capital market related business PAT was at INR540m (26% below expectation)
driven by INR60m loss in the investment banking arm. K-sec net profit declined 9% QoQ to INR600m (+30% YoY) and its market share improved 10bp QoQ to 2.8% in 3QFY15.
Asset management business reported PAT of INR60m vs. INR160m in 2QFY15 and INR280m in 3QFY14. PAT of international subsidiaries improved to INR140m (+56% YoY and +8% QoQ). Profitability of Kotak Investment advisors remained weak in 3QFY15.
Overall AUM increased 9% QoQ to INR714b. Within which domestic AUM increased 5% YoY led by 21% QoQ growth in Equity AUM. Domestic debt AUMs remained flat on QoQ and YoY basis.
Life insurance profit declined 15% YoY and 2% QoQ to INR 510m.
Exhibit 7: K-Sec earnings trend (INR b)
1.5 1.5
1.3 1.8
1.3 1.
6
1.5 1.6
1.5 1.
5
1.7 1.
6
2.2
2.2
2.2
0.2
0.3
0.2
0.5
0.2
0.4
0.4
0.1
0.3
0.4
0.5
0.4
0.7
0.7
0.6
1619 18
2817
26 26
8
2126
27 28
3029 27
1QFY
12
2QFY
12
3QFY
12
4QFY
12
1QFY
13
2QFY
13
3QFY
13
4QFY
13
1QFY
14
2QFY
14
3QFY
14
4QFY
14
1QFY
15
2QFY
15
3QFY
15
Tot. Inc. PAT PATM (%)
Source: MOSL, Company
Exhibit 8: K-Sec market increased 10bp QoQ (%)
2.7 2.9 2.9 2.92.5 2.5 2.6 2.5
2.2 2.4 2.3 2.3
2.9 2.7 2.81Q
FY12
2QFY
12
3QFY
12
4QFY
12
1QFY
13
2QFY
13
3QFY
13
4QFY
13
1QFY
14
2QFY
14
3QFY
14
4QFY
14
1QFY
15
2QFY
15
3QFY
15
Source: MOSL, Company
Exhibit 9: Investment Banking: Earnings trend (INR m)
230
130
220
220
230
200
180 22
0
220
120
260
250
120
110
130
10
-40
40 50 60 40 20 40 40
-20
70 50
-40
-70
-60
1QFY
12
2QFY
12
3QFY
12
4QFY
12
1QFY
13
2QFY
13
3QFY
13
4QFY
13
1QFY
14
2QFY
14
3QFY
14
4QFY
14
1QFY
15
2QFY
15
3QFY
15
Total income PAT
Source: MOSL, Company
Exhibit 10: Kotak AMC: Equity AUM increases QoQ
36 30 29 32 31 34 34 28 31 30 36 34 47 59 71
15 15 10 14 10 11 11 11 13 6 6 6 7 7 7
72 76 73 77 82101
9699 100
97 102 102120 125
157
1QFY
12
1HFY
12
9MFY
12
FY12
1QFY
13
1HFY
13
9MFY
13
FY13
1QFY
14
1HFY
14
9MFY
14
FY14
1QFY
15
1HFY
15
9MFY
15
Eq. AUM PMS AUM Offshore AUM
Source: MOSL, Company
K-Sec market share increased by 10bp to 2.8%
in 3QFY15

20 January 2015 5
Kotak Mahindra Bank
Exhibit 11: Trend in segment wise profitability (INR m) 1QFY13 2QFY13 3QFY13 4QFY13 1QFY14 2QFY14 3QFY14 4QFY14 1QFY15 2QFY15 3QFY15 Total lending business profits 3,804 4,104 4,747 5,602 5,238 4,885 4,740 5,492 5,668 5,945 6,085 QoQ Growth (%) -5 8 16 18 -6 -7 -3 16 3 5 2 YoY Growth (%) 9 16 24 40 38 19 0 -2 8 22 28 % Share to total profits 85 80 80 87 83 82 77 81 82 82 85 Capital market related business 290 440 400 170 350 380 530 490 640 590 540 QoQ Growth (%) -47 52 -9 -58 106 9 39 -8 31 -8 -8 YoY Growth (%) 21 76 43 -69 21 -14 33 188 83 55 2 % Share to total profits 6 9 7 3 6 6 9 7 9 8 8 AMC Businesses 70 120 220 90 -20 220 280 150 150 160 60 QoQ Growth (%) -56 71 83 -59 -122 27 -46 0 7 -63 YoY Growth (%) -59 50 267 -44 -129 83 27 67 -850 -27 -79 % Share to total profits 2 2 4 1 0 4 5 2 2 2 1 Kotak Mah. Old Mutual Life Insur. 320 470 530 580 710 440 600 650 490 520 510 QoQ Growth (%) -44 47 13 9 22 -38 36 8 -25 6 -2 YoY Growth (%) -30 -11 13 2 122 -6 13 12 -31 18 -15 % Share to total profits 7 9 9 9 11 7 10 10 7 7 7 Consolidated PAT 4,484 5,134 5,897 6,442 6,278 5,925 6,150 6,782 6,948 7,215 7,195 QoQ Growth (%) -15 14 15 9 -3 -6 4 10 2 4 0 YoY Growth (%) 3 17 27 22 40 15 4 5 11 22 17 % Share to total profits 100 100 100 100 100 100 100 100 100 100 100 Total consolidated PAT ex Life 4,164 4,664 5,367 5,862 5,568 5,485 5,550 6,132 6,458 6,695 6,685 QoQ Growth (%) -12 12 15 9 -5 -1 1 10 5 4 0 YoY Growth (%) 7 21 29 24 34 18 3 5 16 22 20 % Share to total profits 93 91 91 91 89 93 90 90 93 93 93
# ex-consolidated adjustments Source: MOSL, Company
Conference Call Highlights VYSB merger: a) Shareholders at VYSB and KMB have approved the merger b) working
towards getting approval from CCI and RBI c) expects to complete the merger procedure by March 2015 d) integration plan is going on
KMB is most excited about ING/VYSB’s expertise on digitization, in small and mid-sized business, cross sell opportunities to customers of VYSB
Branch expansion is likely to be gradual post merger On retail business On saving accounts, KMB has not paid anything above 6% interest rate;
Weighted average cost on savings deposits is 5.47% KMB continues to build capacity and has added 4k employees on a
consolidated level (to 30k) and of which 2.5k are recruited in bank (to 18k) Deep mining on existing customers, acquisition of new customers and use of
analytics is helping to grow deposits healthily. Retail term deposits (up to INR10m) up 33% YoY.
On lending business Consolidated loan growth is likely to be 20%+, of which, small and medium
business loans and SENP segments are going to grow faster than overall growth Although early days, seeing some growth coming back in heavy CV segment In wholesale business, growth is driven by working capital financing, trade and
Forex business
20 January 2015 6
Kotak Mahindra Bank
KMPL (car + real estate financing business) margins are slightly under pressure and even loan mix is shifting towards relatively lower yielding vehicle financing – impacting overall profitability.
KMIL is likely to focus on structured capital market and commercial real estate related business. Strong team has been set up over last 12-18months
Mortgages are largely towards existing customers. LAP is driven by SENP segment largely to take care of working capital requirement
Other businesses Guidance of strong recoveries from distress asset business remains. Recoveries
in wholesale business are back ended whereas; in retail loans recoveries are behaving well.
Asset management business: Upfront fees paid for distribution of MF is impacting profitability
Life insurance business: More business coming from non-participating traditional Policy leading to some strain in P&L. Management is focusing on more medium term profitability and building embedded value.
Other details On a YoY basis, strong growth in fees is driven by distribution income (via
wealth mgmt), branch banking fees (incl service charges) and client related forex income. There is no large lumpy investment banking fees included. Management has seen some growth in DCM business.
Asset quality remains healthy and expects no further deterioration. Seeing some pressure in tractor financing business however, remains manageable
Well complied with current LCR requirement. KMB standalone NIM at 4.5%+ is sustainable Valuation and view Merger with VYSB places KMB in a sweet spot with strong presence across
geographies, products and healthy capitalization (CET 1 of 16.5%). The merged entity will be the fourth largest private sector bank with a loan book of INR1.2t and market share of 1.8% of loans. Further, KMB’s conglomerate structure places it in a very sweet position to ride the up-cycle across financial services.
Improvement in macro-economic environment coupled with strong Tier I of ~17% places KMB in a strong position to lever of growth opportunities in the economy. To leverage on its geographical expansion, the management is focusing on product penetration, with higher emphasis on Agriculture (will help in priority sector loans), small business loans (untapped opportunity; creating niche for itself) and mortgage loan. CV loans are bottoming out and likely to show traction in ensuing quarters. We factor loan CAGR (incl VYSB) of 24% over FY14/17, with core PPP CAGR of ~18% CAGR.
Asset quality for KMB remains one of the best with net stress loans at 122bp. With (1) management expectation of worst in CV/CE segment behind, (2) other retail products showing better than factored in loss given default (LGD) and (3) lower share of term/project loans in the corporate segment, we expect KMB to continue best-in-class asset quality performance in ensuing quarters.
Excess capitalisation is leading to (tier-I ratio of
17%) relatively lower RoE of ~15% over FY16/17

20 January 2015 7
Kotak Mahindra Bank
While we maintain earnings estimates for banking business, cut in estimates for non lending businesses is leading to marginal 1-3% cut in earnings for FY15-17. Non- lending businesses earnings in the near term are likely to be muted (~10% share in overall earnings including VYSB) however, they enjoy strong operating leverage. Capital light nature of these businesses can provide upside to ROE if there is a strong improvement in business cycle.
We roll forward our estimates to FY17E. Our SOTP is INR1,325 (based on pro-forma merger with VYSB) – 3.1x/22.1x FY17E cons. BV/EPS. Backed by higher capitalization, diversified business loan book, strong risk management and presence across financial services KMB historically traded at a premium multiples (2.8x/19.3x Cons. BV/EPS) to peers despite relatively lower ROE. While we are positive on the business, valuations at 3.3x/23x Cons BV/EPS (pro-forma merged basis) limit the upside. Maintain Neutral.
Exhibit 12: Kotak Mahindra: SOTP Valuation (FY17-based)
Value
(INR B) Value
(USD B) INR per share % To Total Rationale
Lending Business 1,085 17.5 1,193 90
Kotak Mahindra Bank (incl. VYSB) 951 15.3 1,046 79 3.5x FY17E Core NW, ~1.6% RoA and ~15% RoE
Kotak Prime (Car and other loans) 115 1.9 127 10 2.5x FY17E Net Worth, ~17% Core RoE
Kotak Investment Company (LAS) 18 0.3 20 2 2x FY17E Net Worth
Asset Management Business 43 0.7 47 4
Domestic Mutual Fund 23 0.4 25 2 4% of FY17E Avg. AUM of INR565b
Alternative Assets 10 0.2 11 1 12% of FY17E AUM of INR81b
Offshore Funds 11 0.2 12 1 5% of FY17E AUM of INR214b
Capital Markets related Business 57 0.9 62 5
Kotak Securities 54 0.9 60 5 15x FY17E Earnings; Implied 2x Core BV
Kotak Investment Banking (KMCC) 2 0.0 2 0 1x FY17E Free Networth
Kotak Life Insurance 20 0.3 22 2 16x FY17E NBAP, APE CAGR of ~15% in FY15-17
Target Value 1,205 19.4 1,325 100 Implied 3.1x PBV and 22.1x PE FY17; ROE of ~15%
Upside (%)
-5
Source: MOSL, Company
Our SOTP-based target price is INR1,325 (based on
pro-forma merger with VYSB)
20 January 2015 8
Kotak Mahindra Bank
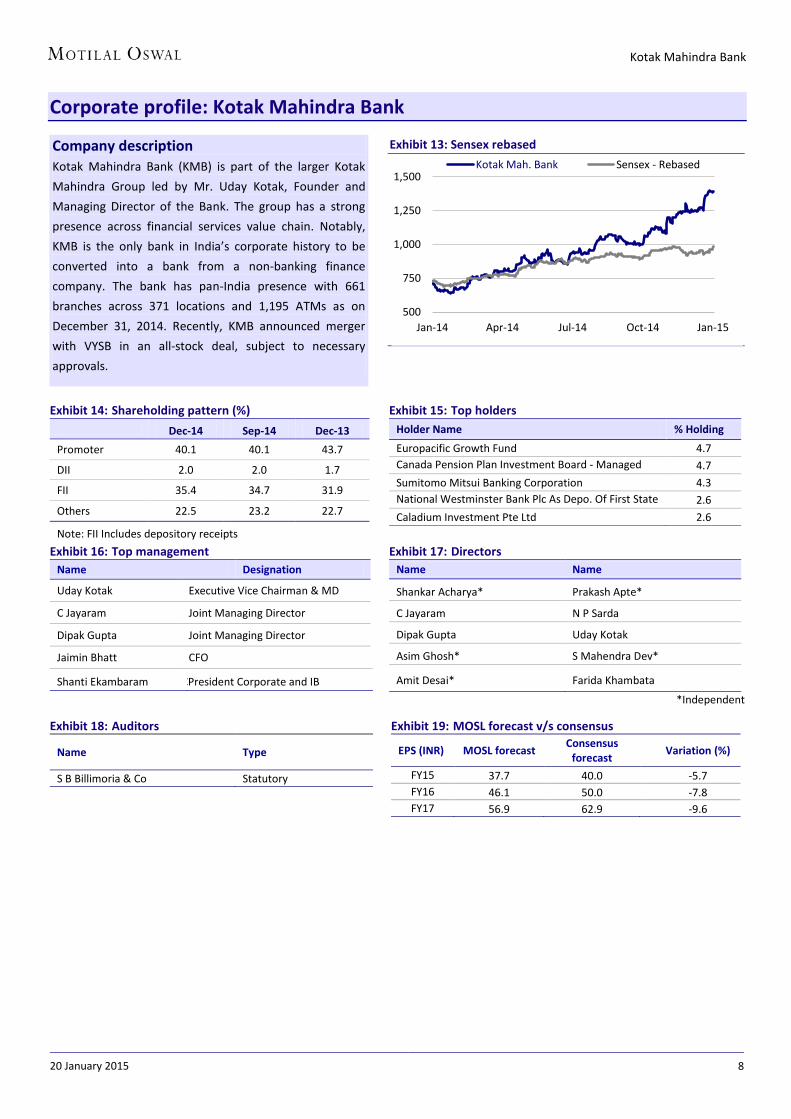
Corporate profile: Kotak Mahindra Bank
Exhibit 14: Shareholding pattern (%) Dec-14 Sep-14 Dec-13
Promoter 40.1 40.1 43.7
DII 2.0 2.0 1.7
FII 35.4 34.7 31.9
Others 22.5 23.2 22.7
Note: FII Includes depository receipts
Exhibit 15: Top holders Holder Name % Holding
Europacific Growth Fund 4.7 Canada Pension Plan Investment Board - Managed
4.7
Sumitomo Mitsui Banking Corporation 4.3 National Westminster Bank Plc As Depo. Of First State
2.6
Caladium Investment Pte Ltd 2.6
Exhibit 16: Top management
Name Designation
Uday Kotak Executive Vice Chairman & MD
C Jayaram Joint Managing Director
Dipak Gupta Joint Managing Director
Jaimin Bhatt CFO
Shanti Ekambaram CPresident Corporate and IB
Exhibit 17: Directors Name Name
Shankar Acharya* Prakash Apte*
C Jayaram N P Sarda
Dipak Gupta Uday Kotak
Asim Ghosh* S Mahendra Dev*
Amit Desai* Farida Khambata
*Independent
Exhibit 18: Auditors
Name Type
S B Billimoria & Co Statutory
Exhibit 19: MOSL forecast v/s consensus
EPS (INR) MOSL forecast Consensus
forecast Variation (%)
FY15 37.7 40.0 -5.7 FY16 46.1 50.0 -7.8 FY17 56.9 62.9 -9.6
Company description Kotak Mahindra Bank (KMB) is part of the larger Kotak
Mahindra Group led by Mr. Uday Kotak, Founder and
Managing Director of the Bank. The group has a strong
presence across financial services value chain. Notably,
KMB is the only bank in India’s corporate history to be
converted into a bank from a non-banking finance
company. The bank has pan-India presence with 661
branches across 371 locations and 1,195 ATMs as on
December 31, 2014. Recently, KMB announced merger
with VYSB in an all-stock deal, subject to necessary
approvals.
Exhibit 13: Sensex rebased
500
750
1,000
1,250
1,500
Jan-14 Apr-14 Jul-14 Oct-14 Jan-15
Kotak Mah. Bank Sensex - Rebased

20 January 2015 9
Kotak Mahindra Bank
Financials and valuations (KMB Standalone)
Income Statement (Standalone) (INR m) Y/E March 2010 2011 2012 2013 2014 2015E 2016E 2017E Interest Income 32,556 41,898 61,802 80,425 87,671 96,984 115,232 140,153 Interest Expense 13,975 20,922 36,677 48,368 50,471 55,092 64,295 77,965 Net Interest Income 18,581 20,976 25,125 32,057 37,200 41,892 50,937 62,188 Change (%) 22.4 12.9 19.8 27.6 16.0 12.6 21.6 22.1 Non Interest Income 6,282 7,805 9,773 11,607 13,997 19,018 22,428 27,042 Net Income 24,864 28,781 34,898 43,663 51,198 60,910 73,365 89,230 Change (%) 38.7 15.8 21.3 25.1 17.3 19.0 20.4 21.6 Operating Expenses 11,894 15,533 18,348 22,097 25,426 32,072 38,236 45,613 Pre Provision Profits 12,970 13,248 16,550 21,566 25,772 28,838 35,128 43,617 Change (%) 117.7 2.1 24.9 30.3 19.5 11.9 21.8 24.2 Provisions (excl tax) 4,859 1,371 551 1,846 3,047 1,321 2,330 3,038 PBT 8,111 11,877 15,999 19,721 22,725 27,516 32,798 40,579 Tax 2,500 3,695 5,149 6,113 7,699 9,383 10,987 13,594 Tax Rate (%) 30.8 31.1 32.2 31.0 33.9 34.1 33.5 33.5 Standalone PAT 5,611 8,182 10,851 13,607 15,025 18,133 21,811 26,985 Change (%) 103.2 45.8 32.6 25.4 10.4 20.7 20.3 23.7 Consolidated PAT 13,070 15,667 18,322 21,885 24,650 29,079 35,485 43,863 Change (%) 100.3 19.9 16.9 19.4 12.6 18.0 22.0 23.6 Equity Dividend (Incl tax) 297 462 536 597 721 851 1,038 1,283 Core PPP (Standlone)* 10,375 11,083 14,445 19,194 23,699 24,588 30,628 38,367 Change (%) 83.6 6.8 30.3 32.9 23.5 3.8 24.6 25.3 *Core PPP is (NII+Fee income-Opex)
Balance Sheet (Standalone) (INR Million) Y/E March 2010 2011 2012 2013 2014 2015E 2016E 2017E Equity Share Capital 3,481 3,684 3,703 3,733 3,852 3,852 3,852 3,852 Reserves & Surplus 41,370 64,280 75,756 90,737 118,899 136,182 156,955 182,657 Net Worth 44,851 67,965 79,459 94,470 122,751 140,034 160,806 186,508 Deposits 238,865 292,610 385,365 510,288 590,723 762,033 967,782 1,209,727 Change (%) 52.7 22.5 31.7 32.4 15.8 29.0 27.0 25.0 of which CASA Dep 74,631 87,905 124,024 149,183 188,279 257,140 316,402 405,117 Change (%) 45.8 17.8 41.1 20.3 26.2 36.6 23.0 28.0 Borrowings 61,405 117,239 165,955 204,106 128,956 110,071 121,540 147,461 Other Liabilities & Prov. 29,242 30,693 25,888 28,073 33,424 40,091 48,186 57,934 Total Liabilities 374,363 508,507 656,668 836,937 875,853 1,052,228 1,298,314 1,601,630 Current Assets 23,003 24,710 26,346 36,892 59,799 58,602 69,811 81,827 Investments 125,127 171,214 215,668 288,734 254,845 316,008 385,530 470,347 Change (%) 37.3 36.8 26.0 33.9 -11.7 24.0 22.0 22.0 Loans 207,751 293,293 390,792 484,690 530,276 646,937 808,671 1,010,839 Change (%) 25.0 41.2 33.2 24.0 9.4 22.0 25.0 25.0 Fixed Assets 4,276 4,256 4,500 4,644 11,069 10,818 10,466 10,014 Other Assets 14,207 15,033 19,362 21,977 19,863 19,863 23,836 28,603 Total Assets 374,363 508,507 656,668 836,937 875,853 1,052,228 1,298,314 1,601,630 Asset Quality (%) GNPA (INR m) 4,983 3,618 4,778 6,321 9,334 11,681 13,050 14,298 NNPA (INR m) 2,572 1,461 2,243 3,036 5,736 6,420 7,055 7,629 GNPA Ratio 2.37 1.22 1.21 1.30 1.75 1.79 1.60 1.41 NNPA Ratio 1.24 0.50 0.57 0.63 1.08 0.99 0.87 0.75 PCR (Incl acquired NPA) 53.1 65.0 61.4 58.9 45.9 50.0 50.0 50.0 PCR (Excl acquired NPA) 48.4 59.6 53.0 52.0 38.6 45.0 45.9 46.6 E: MOSL Estimates

20 January 2015 10
Kotak Mahindra Bank
Financials and valuations (KMB Standalone)
Ratios (Standalone) Y/E March 2010 2011 2012 2013 2014 2015E 2016E 2017E
Spreads Analysis (%)
Avg. Yield-Earning Assets 11.0 10.4 11.4 11.5 10.9 10.8 10.5 10.3
Avg. Yield on loans 13.5 12.8 14.2 14.0 13.2 12.7 12.2 12.0
Avg. Yield on Investments 6.7 6.5 6.8 7.4 7.5 7.6 7.4 7.2
Avg. Cost-Int. Bear. Liab. 5.3 5.9 7.6 7.6 7.0 6.9 6.6 6.4
Avg. Cost of Deposits 5.0 5.6 7.4 7.5 6.9 6.7 6.4 6.2
Interest Spread 5.6 4.5 3.8 3.8 3.9 3.9 3.9 3.9
Net Interest Margin 6.3 5.2 4.6 4.6 4.6 4.7 4.6 4.6
Profitability Ratios (%)
Consolidated RoE 18.1 16.6 15.4 15.5 14.4 14.2 15.0 16.0
Standalone Core RoE 14.6 15.4 15.4 16.3 14.4 14.3 15.0 16.0
Standalone RoA 1.7 1.9 1.9 1.8 1.8 1.9 1.9 1.9
Int. Expense/Int.Income 42.9 49.9 59.3 60.1 57.6 56.8 55.8 55.6
Non Int. Inc./Net Income 25.3 27.1 28.0 26.6 27.3 31.2 30.6 30.3
Asset-Liability Profile (%)
Loans/Deposit Ratio 87.0 100.2 101.4 95.0 89.8 84.9 83.6 83.6
Loans/(Deposits + Borrowings) 69.2 71.6 70.9 67.8 73.7 74.2 74.2 74.5
CASA Ratio 31.2 30.0 32.2 29.2 31.9 33.7 32.7 33.5
Investment/Deposit Ratio 52.4 58.5 56.0 56.6 43.1 41.5 39.8 38.9 Invest/(Deposits + Borrowings) 41.7 41.8 39.1 40.4 35.4 36.2 35.4 34.7
CAR 18.3 19.9 17.5 16.0 19.0 18.9 17.7 16.7
Tier 1 15.4 18.0 15.7 14.7 17.9 17.8 16.6 15.7 Valuation
Book Value (INR) 64.4 92.2 107.3 126.5 159.4 181.8 208.8 242.1
BV Growth (%) 16.8 43.2 16.3 17.9 25.9 14.1 14.8 16.0
AP/BV (x) 11.6 9.7 7.5 6.4 5.3 4.4
Consol BV (INR) 113.6 148.8 174.2 204.3 247.6 284.3 329.0 384.3
BV Growth (%) 20.4 30.9 17.1 17.3 21.2 14.8 15.7 16.8
Price-Consol BV (x) 8.0 6.8 5.6 4.9 4.2 3.6
Adjusted BV (INR)* 57.5 86.5 100.9 118.7 148.6 170.4 196.8 229.7
AP/ABV (x) 12.4 10.4 8.1 6.8 5.7 4.6
Adjusted Consol BV 111.0 147.4 172.1 201.4 242.4 278.5 322.6 377.3
Price-Consol ABV (x) 8.1 6.9 5.7 5.0 4.3 3.7
Standalone EPS (INR) 7.7 10.5 14.2 17.7 18.8 22.7 27.3 33.9
EPS Growth (%) 105.8 36.4 35.3 25.0 6.3 20.7 20.3 23.9
Price-Earnings (x) 88.0 69.6 63.8 50.8 40.7 31.3
Consol EPS (INR) 18.8 21.3 24.7 29.3 32.0 37.7 46.1 56.9
Con. EPS Growth (%) 98.9 13.3 16.3 18.5 9.2 18.0 22.0 23.6
Price-Concol EPS (x) 56.2 47.4 43.4 36.8 30.2 24.4
Dividend Per Share (INR) 0.4 0.5 0.6 0.7 0.8 0.9 1.2 1.4
Dividend Yield (%) 0.0 0.1 0.1 0.1 0.1 0.1
E: MOSL Estimates; * For Investments in Subs and NPA,

20 January 2015 11
Kotak Mahindra Bank
Financials and valuations (KMB+VYSB - Proforma-merged)
Income Statement (INR Million) Y/E March 2010 2011 2012 2013 2014 2015E 2016E 2017E Interest Income 54,885 68,838 100,370 129,041 139,722 155,341 182,817 222,529 Interest Expense 28,005 37,798 63,162 81,598 84,991 93,481 108,752 133,028 Net Interest Income 26,880 31,040 37,208 47,443 54,731 61,860 74,065 89,500 Change (%) 24.0 15.5 19.9 27.5 15.4 13.0 19.7 20.8 Non Interest Income 12,485 14,355 16,471 18,875 22,668 28,604 33,800 40,552 Net Income 39,365 45,395 53,679 66,318 77,399 90,464 107,865 130,053 Change (%) 31.7 15.3 18.2 23.5 16.7 16.9 19.2 20.6 Operating Expenses 19,975 25,793 29,450 34,825 40,353 48,357 56,964 67,150 Pre Provision Profits 19,390 19,602 24,229 31,493 37,046 42,107 50,900 62,902 Change (%) 90.0 1.1 23.6 30.0 17.6 13.7 20.9 23.6 Provisions (excl tax) 7,563 2,887 1,688 2,758 4,545 4,023 5,687 6,594 PBT 11,827 16,715 22,541 28,735 32,501 38,084 45,213 56,309 Tax 3,793 5,347 7,127 8,998 10,898 12,897 15,146 18,863 Tax Rate (%) 32.1 32.0 31.6 31.3 33.5 33.9 33.5 33.5 PAT 8,034 11,367 15,414 19,737 21,603 25,187 30,067 37,445 Change (%) 72.8 41.5 35.6 28.0 9.5 16.6 19.4 24.5 Consolidated PAT (incl VYSB) 15,290 18,853 22,885 28,014 31,228 36,133 43,741 54,323 Change (%) 81.8 23.3 21.4 22.4 11.5 15.7 21.1 24.2
Balance Sheet (INR Million) Y/E March 2010 2011 2012 2013 2014 2015E 2016E 2017E Net Worth 68,708 94,577 119,606 140,913 193,550 216,448 243,794 277,823 Deposits 497,518 594,552 737,319 923,628 1,002,891 1,240,148 1,560,644 1,944,876 Change (%) 22.7 19.5 24.0 25.3 8.6 23.7 25.8 24.6 of which CASA Dep 158,902 192,491 244,498 283,534 325,865 414,750 502,275 624,136 Change (%) 34.3 21.1 27.0 16.0 14.9 27.3 21.1 24.3 Borrowings 98,119 158,709 222,920 269,219 225,641 216,230 244,765 290,707 Other Liabilities & Prov. 48,820 50,809 46,828 51,542 57,905 67,176 79,467 94,078 Total Liabilities 713,165 898,646 1,126,673 1,385,301 1,479,986 1,740,002 2,128,670 2,607,485 Current Assets 53,273 49,924 58,651 65,226 118,060 89,929 106,543 126,890 Investments 229,856 281,797 342,823 471,517 422,053 513,313 612,431 731,283 Change (%) 17.2 22.6 21.7 37.5 -10.5 21.6 19.3 19.4 Loans 392,822 529,314 678,159 802,410 888,565 1,084,049 1,350,690 1,682,943 Change (%) 17.7 34.7 28.1 18.3 10.7 22.0 24.6 24.6 Fixed Assets 9,236 9,284 9,508 9,640 16,315 16,204 16,030 15,756 Other Assets 27,978 28,326 37,532 36,508 34,994 36,507 42,976 50,614 Total Assets 713,165 898,646 1,126,673 1,385,301 1,479,986 1,740,002 2,128,670 2,607,485
Asset Quality (%) GNPA (INR m) 13,245 11,567 11,771 13,283 17,037 20,597 24,092 27,371 NNPA (INR m) 5,821 3,029 2,899 3,205 6,756 7,018 7,492 7,711 GNPA Ratio 3.31 2.15 1.71 1.63 1.90 1.88 1.76 1.61 NNPA Ratio 1.48 0.57 0.43 0.40 0.76 0.65 0.55 0.46 PCR (Excl Tech. write off) 56.1 73.8 75.4 75.9 60.3 65.9 68.9 71.8 E: MOSL Estimates

20 January 2015 12
Kotak Mahindra Bank
Financials and valuations (KMB+VYSB - Proforma-merged)
Ratios Y/E March 2010 2011 2012 2013 2014 2015E 2016E 2017E Spreads Analysis (%)
Avg. Yield-Earning Assets 9.4 9.5 10.8 11.0 10.5 10.4 10.1 10.0 Avg. Yield on loans 11.7 11.4 12.8 13.1 12.4 12.0 11.5 11.3 Avg. Yield on Investments 5.8 6.3 7.3 7.8 7.7 7.8 7.5 7.4 Avg. Cost-Int. Bear. Liab. 5.1 5.6 7.4 7.6 7.0 7.0 6.7 6.6 Avg. Cost of Deposits 4.8 5.2 7.0 7.1 6.8 6.7 6.4 6.4 Interest Spread 4.3 3.9 3.4 3.5 3.5 3.4 3.5 3.4 Net Interest Margin 4.6 4.3 4.0 4.1 4.1 4.1 4.1 4.0
Profitability Ratios (%) RoE 12.8 14.1 14.5 15.3 13.0 12.3 13.1 14.4 RoA 1.2 1.4 1.5 1.6 1.5 1.6 1.6 1.6 Consolidated ROE 16.8 16.0 15.1 15.3 13.6 13.0 13.9 15.1 Other Ratios (%)
Int. Expense/Int.Income 51.0 54.9 62.9 63.2 60.8 60.2 59.5 59.8 Non Int. Inc./Net Income 31.7 31.6 30.7 28.5 29.3 31.6 31.3 31.2 Cost/Income 50.7 56.8 54.9 52.5 52.1 53.5 52.8 51.6 Empl. Cost/Op. Exps. 50.7 53.9 51.7 52.4 51.4 49.9 50.0 50.1 Loans/Deposit Ratio 79.0 89.0 92.0 86.9 88.6 87.4 86.5 86.5 CASA Ratio 31.9 32.4 33.2 30.7 32.5 33.4 32.2 32.1 Investment/Deposit Ratio 46.2 47.4 46.5 51.1 42.1 41.4 39.2 37.6
Valuation Consolidated BV (INR)
323.7 368.8 424.8
Change (%)
13.9 15.2 Price-BV (x) 4.3 3.8 3.3 Consolidated EPS (INR)
39.7 48.1 59.7
Change (%)
21.1 24.2 Price-Earnings (x) 35.1 29.0 23.3 E: MOSL Estimates

20 January 2015 13
Kotak Mahindra Bank
N O T E S

20 January 2015 14
Kotak Mahindra Bank
Disclosures This document has been prepared by Motilal Oswal Securities Limited (hereinafter referred to as Most) to provide information about the company(ies) and/sector(s), if any, covered in the report and may be distributed by it and/or its affiliated company(ies). This report is for personal information of the selected recipient/s and does not construe to be any investment, legal or taxation advice to you. This research report does not constitute an offer, invitation or inducement to invest in securities or other investments and Motilal Oswal Securities Limited (hereinafter referred as MOSt) is not soliciting any action based upon it. This report is not for public distribution and has been furnished to you solely for your general information and should not be reproduced or redistributed to any other person in any form. This report does not constitute a personal recommendation or take into account the particular investment objectives, financial situations, or needs of individual clients. Before acting on any advice or recommendation in this material, investors should consider whether it is suitable for their particular circumstances and, if necessary, seek professional advice. The price and value of the investments referred to in this material and the income from them may go down as well as up, and investors may realize losses on any investments. Past performance is not a guide for future performance, future returns are not guaranteed and a loss of original capital may occur.
MOSt and its affiliates are a full-service, integrated investment banking, investment management, brokerage and financing group. We and our affiliates have investment banking and other business relationships with a some companies covered by our Research Department. Our research professionals may provide input into our investment banking and other business selection processes. Investors should assume that MOSt and/or its affiliates are seeking or will seek investment banking or other business from the company or companies that are the subject of this material and that the research professionals who were involved in preparing this material may educate investors on investments in such business. The research professionals responsible for the preparation of this document may interact with trading desk personnel, sales personnel and other parties for the purpose of gathering, applying and interpreting information. Our research professionals are paid on the profitability of MOSt which may include earnings from investment banking and other business.
MOSt generally prohibits its analysts, persons reporting to analysts, and members of their households from maintaining a financial interest in the securities or derivatives of any companies that the analysts cover. Additionally, MOSt generally prohibits its analysts and persons reporting to analysts from serving as an officer, director, or advisory board member of any companies that the analysts cover. Our salespeople, traders, and other professionals or affiliates may provide oral or written market commentary or trading strategies to our clients that reflect opinions that are contrary to the opinions expressed herein, and our proprietary trading and investing businesses may make investment decisions that are inconsistent with the recommendations expressed herein. In reviewing these materials, you should be aware that any or all of the foregoing among other things, may give rise to real or potential conflicts of interest. MOSt and its affiliated company(ies), their directors and employees and their relatives may; (a) from time to time, have a long or short position in, act as principal in, and buy or sell the securities or derivatives thereof of companies mentioned herein. (b) be engaged in any other transaction involving such securities and earn brokerage or other compensation or act as a market maker in the financial instruments of the company(ies) discussed herein or act as an advisor or lender/borrower to such company(ies) or may have any other potential conflict of interests with respect to any recommendation and other related information and opinions.; however the same shall have no bearing whatsoever on the specific recommendations made by the analyst(s), as the recommendations made by the analyst(s) are completely independent of the views of the affiliates of MOSt even though there might exist an inherent conflict of interest in some of the stocks mentioned in the research report Reports based on technical and derivative analysis center on studying charts company's price movement, outstanding positions and trading volume, as opposed to focusing on a company's fundamentals and, as such, may not match with a report on a company's fundamental analysis. In addition MOST has different business segments / Divisions with independent research separated by Chinese walls catering to different set of customers having various objectives, risk profiles, investment horizon, etc, and therefore may at times have different contrary views on stocks sectors and markets.
Unauthorized disclosure, use, dissemination or copying (either whole or partial) of this information, is prohibited. The person accessing this information specifically agrees to exempt MOSt or any of its affiliates or employees from, any and all responsibility/liability arising from such misuse and agrees not to hold MOSt or any of its affiliates or employees responsible for any such misuse and further agrees to hold MOSt or any of its affiliates or employees free and harmless from all losses, costs, damages, expenses that may be suffered by the person accessing this information due to any errors and delays. The information contained herein is based on publicly available data or other sources believed to be reliable. Any statements contained in this report attributed to a third party represent MOSt’s interpretation of the data, information and/or opinions provided by that third party either publicly or through a subscription service, and such use and interpretation have not been reviewed by the third party. This Report is not intended to be a complete statement or summary of the securities, markets or developments referred to in the document. While we would endeavor to update the information herein on reasonable basis, MOSt and/or its affiliates are under no obligation to update the information. Also there may be regulatory, compliance, or other reasons that may prevent MOSt and/or its affiliates from doing so. MOSt or any of its affiliates or employees shall not be in any way responsible and liable for any loss or damage that may arise to any person from any inadvertent error in the information contained in this report. MOSt or any of its affiliates or employees do not provide, at any time, any express or implied warranty of any kind, regarding any matter pertaining to this report, including without limitation the implied warranties of merchantability, fitness for a particular purpose, and non-infringement. The recipients of this report should rely on their own investigations.
This report is intended for distribution to institutional investors. Recipients who are not institutional investors should seek advice of their independent financial advisor prior to taking any investment decision based on this report or for any necessary explanation of its contents.
Most and it’s associates may have managed or co-managed public offering of securities, may have received compensation for investment banking or merchant banking or brokerage services, may have received any compensation for products or services other than investment banking or merchant banking or brokerage services from the subject company in the past 12 months. Most and it’s associates have not received any compensation or other benefits from the subject company or third party in connection with the research report. Subject Company may have been a client of Most or its associates during twelve months preceding the date of distribution of the research report
MOSt and/or its affiliates and/or employees may have interests/positions, financial or otherwise of over 1 % at the end of the month immediately preceding the date of publication of the research in the securities mentioned in this report. To enhance transparency, MOSt has incorporated a Disclosure of Interest Statement in this document. This should, however, not be treated as endorsement of the views expressed in the report.
Motilal Oswal Securities Limited is under the process of seeking registration under SEBI (Research Analyst) Regulations, 2014.
There are no material disciplinary action that been taken by any regulatory authority impacting equity research analysis activities
Analyst Certification The views expressed in this research report accurately reflect the personal views of the analyst(s) about the subject securities or issues, and no part of the compensation of the research analyst(s) was, is, or will be directly or indirectly related to the specific recommendations and views expressed by research analyst(s) in this report. The research analysts, strategists, or research associates principally responsible for preparation of MOSt research receive compensation based upon various factors, including quality of research, investor client feedback, stock picking, competitive factors and firm revenues
Disclosure of Interest Statement KOTAK MAHINDRA BANK LTD Analyst ownership of the stock No Served as an officer, director or employee No
Regional Disclosures (outside India) This report is not directed or intended for distribution to or use by any person or entity resident in a state, country or any jurisdiction, where such distribution, publication, availability or use would be contrary to law, regulation or which would subject MOSt & its group companies to registration or licensing requirements within such jurisdictions.
For U.S. Motilal Oswal Securities Limited (MOSL) is not a registered broker - dealer under the U.S. Securities Exchange Act of 1934, as amended (the"1934 act") and under applicable state laws in the United States. In addition MOSL is not a registered investment adviser under the U.S. Investment Advisers Act of 1940, as amended (the "Advisers Act" and together with the 1934 Act, the "Acts), and under applicable state laws in the United States. Accordingly, in the absence of specific exemption under the Acts, any brokerage and investment services provided by MOSL, including the products and services described herein are not available to or intended for U.S. persons.
This report is intended for distribution only to "Major Institutional Investors" as defined by Rule 15a-6(b)(4) of the Exchange Act and interpretations thereof by SEC (henceforth referred to as "major institutional investors"). This document must not be acted on or relied on by persons who are not major institutional investors. Any investment or investment activity to which this document relates is only available to major institutional investors and will be engaged in only with major institutional investors. In reliance on the exemption from registration provided by Rule 15a-6 of the U.S. Securities Exchange Act of 1934, as amended (the "Exchange Act") and interpretations thereof by the U.S. Securities and Exchange Commission ("SEC") in order to conduct business with Institutional Investors based in the U.S., MOSL has entered into a chaperoning agreement with a U.S. registered broker-dealer, Motilal Oswal Securities International Private Limited. ("MOSIPL"). Any business interaction pursuant to this report will have to be executed within the provisions of this chaperoning agreement.
The Research Analysts contributing to the report may not be registered /qualified as research analyst with FINRA. Such research analyst may not be associated persons of the U.S. registered broker-dealer, MOSIPL, and therefore, may not be subject to NASD rule 2711 and NYSE Rule 472 restrictions on communication with a subject company, public appearances and trading securities held by a research analyst account.
For Singapore Motilal Oswal Capital Markets Singapore Pte Limited is acting as an exempt financial advisor under section 23(1)(f) of the Financial Advisers Act(FAA) read with regulation 17(1)(d) of the Financial Advisors Regulations and is a subsidiary of Motilal Oswal Securities Limited in India. This research is distributed in Singapore by Motilal Oswal Capital Markets Singapore Pte Limited and it is only directed in Singapore to accredited investors, as defined in the Financial Advisers Regulations and the Securities and Futures Act (Chapter 289), as amended from time to time. In respect of any matter arising from or in connection with the research you could contact the following representatives of Motilal Oswal Capital Markets Singapore Pte Limited: Anosh Koppikar Kadambari Balachandran Email : [email protected] Email : [email protected] Contact : (+65)68189232 Contact : (+65) 68189233 / 65249115 Office Address : 21 (Suite 31),16 Collyer Quay,Singapore 04931
Motilal Oswal Securities Ltd
Motilal Oswal Tower, Level 9, Sayani Road, Prabhadevi, Mumbai 400 025 Phone: +91 22 3982 5500 E-mail: [email protected]
Related Documents