hfy 3 January 2021 Initiating Coverage | Sector: Others Varun Beverages Safe and Bottled Investors are advised to refer through important disclosures made at the last page of the Research Report. Motilal Oswal research is available on www.motilaloswal.com/Institutional-Equities, Bloomberg, Thomson Reuters, Factset and S&P Capital. Research Analyst: Sumant Kumar ([email protected]) Darshit Shah ([email protected]) / Yusuf Inamdar ([email protected])

Welcome message from author
This document is posted to help you gain knowledge. Please leave a comment to let me know what you think about it! Share it to your friends and learn new things together.
Transcript

05 Mar 2020 2
hfy
3 January 2021
Initiating Coverage | Sector: Others
Varun Beverages
Safe and Bottled
Investors are advised to refer through important disclosures made at the last page of the Research Report. Motilal Oswal research is available on www.motilaloswal.com/Institutional-Equities, Bloomberg, Thomson Reuters, Factset and S&P Capital.
Research Analyst: Sumant Kumar ([email protected]) Darshit Shah ([email protected]) / Yusuf Inamdar ([email protected])
Varun Beverages
3 January 2021 2
Contents: Safe and bottled!
Summary ............................................................................................................... 3
Company overview ................................................................................................ 5
Near monopoly in PepsiCo’s India business ............................................................ 7
Improving mix in line with long-term strategy ...................................................... 12
More room for growth in soft-drink segment ....................................................... 15
Newly acquired territories to drive growth .......................................................... 19
Beverage Industry ................................................................................................ 21
SWOT analysis ..................................................................................................... 25
Expect EBITDA CAGR of 15% to ~INR22b over CY19-22E ....................................... 25
Valuation and view .............................................................................................. 29
Bulls and Bears..................................................................................................... 31
Key risks ............................................................................................................... 32
Management overview ........................................................................................ 33
Financials and valuations ..................................................................................... 34
Varun Beverages
3 January 2021 3
Varun Beverages (VBL) is engaged in the manufacture, sale, bottling, and distribution of
PepsiCo’s beverages in pre-defined territories in India (27 states and seven Union
Territories). Its India operations contributed ~82% to CY19 revenue. The company is
also present in Sri Lanka, Nepal, Morocco, Zambia, and Zimbabwe.
Safe and bottled! Pure monopoly in PepsiCo’s India business
VBL is PepsiCo’s second-largest bottler outside the US and handles over 80% of the
cola giant’s India business. While its link with PepsiCo provides it with long-term
growth sustainability, robust distribution and supply-chain network should improve
its market share in newly acquired territories and push volume growth.
The company is diversifying its product portfolio with the commencement of the
new Tropicana plant in Pathankot. This should help reduce concentration risk and
improve margin as realizations in non-carbonated beverages (NCB) are 10% higher
than in carbonated soft drinks (CSD). Inorganic expansion in the Water segment
and increasing share of the international business should help it diversify further.
Increasing electrification per household in rural and semi-rural areas, growing
refrigeration penetration, and rising per capita income, is expected to drive overall
consumption of beverages. VBL is poised to gain market share from the
consolidation in new territories.
Capacity utilization during peak months (May-June) is barely 60%. This surplus
capacity provides enough headroom to meet increasing demand without additional
capex. Higher sweating of assets should further improve its operating profit.
We estimate 12%/31% revenue/PAT CAGR over CY19-22E, driven by newly
acquired territories and stable operating margin. We value the stock at 30x CY22E
EPS of INR36.2 to arrive at our target price of INR1,100. We initiate coverage with a
Buy rating.
Pure monopoly in PepsiCo’s India business VBL single-handedly accounted for ~80% of PepsiCo India’s business in CY19 (v/s
45% in CY17) on the back of various expansions and acquisitions in the last few
years. Penetration level in the newly acquired territories is comparatively lower
compared to existing territories. Replication of existing distribution network
model, coupled with supply-chain, should increase penetration in these new
territories and help gain incremental market share. The newer geographies
(South and West) would also provide consistent volume sustainability in the
medium to long term. The company’s newly set-up Tropicana plant in Pathankot
should further boost push volumes as it has acquired the rights to sell and
distribute Tropicana fruit juices from PepsiCo India.
Initiating Coverage | Sector: Beverages
Varun Beverages CMP: INR909 TP: INR1,100 (+21%) Buy
BSE Sensex S&P CNX
47,354 13,873
Stock Info
Bloomberg VBL IN
Equity Shares (m) 289
M.Cap.(INRb)/(USDb) 259 / 3.6
52-Week Range (INR) 999 / 485
1, 6, 12 Rel. Per (%) -5/-3/15
12M Avg Val (INR M) 182
Free float (%) 32.0
Financials & Valuations (INR b)
Y/E Dec CY20E CY21E CY22E
Sales 63.7 87.7 101.3
EBITDA 11.9 17.7 21.8
PAT 4.7 3.8 6.9
EBITDA (%) 18.6 20.2 21.5
EPS (INR) 13.2 23.8 36.2
EPS Gr. (%) -18.8 80.4 52.2
BV/Sh. (INR) 123.5 144.3 177.4
Ratios
Net D/E 0.8 0.5 0.3
RoE (%) 11.0 17.8 22.5
RoCE (%) 10.1 13.6 18.5
Payout (%) 24.9 12.4 8.8
Valuations
P/E (x) 68.9 38.2 25.1
EV/EBITDA (x) 24.6 16.2 12.7
Div Yield (%) 0.3 0.3 0.3
FCF Yield (%) 2.7 3.5 4.6
Shareholding pattern (%) As On Sep-20 Jun-20 Sep-19
Promoter 68.4 66.4 66.4
DII 6.4 6.4 6.0
FII 19.2 20.5 20.8
Others 6.0 6.7 6.9
FII Includes depository receipts
Varun Beverages
3 January 2021 4
Improving mix and international presence Over CY12-19, though the volume share of CSD declined to 71% from 84%, VBL
delivered 17% volume CAGR. Blended realization has increased to INR145 from
INR138 over CY13-19. Post commencement of operations at its new plant in
Pathankot (with a higher focus on the Juice segment), VBL’s revenue share from NCB
should improve, thereby reducing revenue concentration from CSD alone. Several
inorganic international expansions by the company over CY12-19 has resulted in the
share of the Water segment rising to 23% from 9%. The same is expected to grow
further. International operations, which now account for 18% of total volumes (up
400bp over the last six years), is bound to grow further.
Rising electrification to support CSD sales Increasing electrification in India is expected to increase refrigeration penetration to
48% in CY26E from 30% in CY19. This in turn should drive VBL’s sales as most of its
products need to be chilled before serving. Also, a) increasing number of hours of
undisrupted electricity supply, b) higher dispatches of visi-coolers to distributors and
retailers would improve consumption at the point of sale, and c) greater
electrification in semi-urban/rural areas (currently contribute ~50% to revenue) are
factors that could push sales. Its association of over 28 years with PepsiCo would
continue further as the franchisee agreement has been extended from Oct’22 to
Apr’39. While PepsiCo’s market share as of CY19 was ~35% (consistent so far), it is
expected to rise led by increased penetration in newer geographies.
Higher sweating of assets to support growth Annual capacity utilization of VBL is way lower than its peak season utilization rate
of 60% (post consolidation in new territories). With excess surplus capacity in place,
the company has enough headroom to grow volumes without needing additional
capex. With operations increasing, economies of scale should kick in. It has better
negotiating power with its suppliers, especially for key raw materials like sugar and
PET polymer granules. After the initial setback in CY20 due to the COVID-19
pandemic, it should maintain its margin.
Initiate coverage with a Buy rating We expect strong demand traction over the next few years due to: a) VBL being a
monopoly play in PepsiCo India’s business, b) rising penetration on the back of a
robust distribution network, c) diversifying product portfolio, d) greater refrigerator
penetration in rural/and semi-rural areas per household and higher power
availability hours, and e) increasing discretionary spending per capita. Over CY19-
22E, we expect the company to deliver consolidated revenue/EBITDA/PAT CAGR of
12%/15%/31% to INR101b/INR22b/INR10b and generate strong CFO/FCF of
INR53.8b/INR34b. Overall debt is expected to reduce to INR15.7b from INR34b, over
the same period. VBL’s global peers trade at an average P/E of 32x CY20E. Based on
future growth potential and the return ratio profile, we value the stock at 30x (in-
line with its three year average P/E of 32x) CY22E EPS of INR36.2 to arrive at our
target price of INR1,100. We initiate coverage with a Buy rating.
Varun Beverages
3 January 2021 5
Company overview
About Varun Beverages VBL manufactures, sells, bottles and distributes products under the trademarks
and brands owned by PepsiCo in India, Nepal, Sri Lanka, Morocco, Zambia and
Zimbabwe through its extensive manufacturing facilities and well-entrenched
distribution network. Its product portfolio includes carbonated soft drinks, non-
carbonated juice-based drinks, energy drinks and packaged bottled water.
The company has been granted franchise rights for various PepsiCo products for
the territories of India, Nepal, Sri Lanka, Morocco, Zambia and Zimbabwe.
VBL has presence across India through its 37 state-of-the-art production
facilities, along with over 90 depots, 2,500 owned vehicles and more than 1,500
primary distributors and 775,000 visi-coolers.
VBL enjoys monopoly in India in terms of selling PepsiCo products (accounts for
80%+ sales volume) in the country.
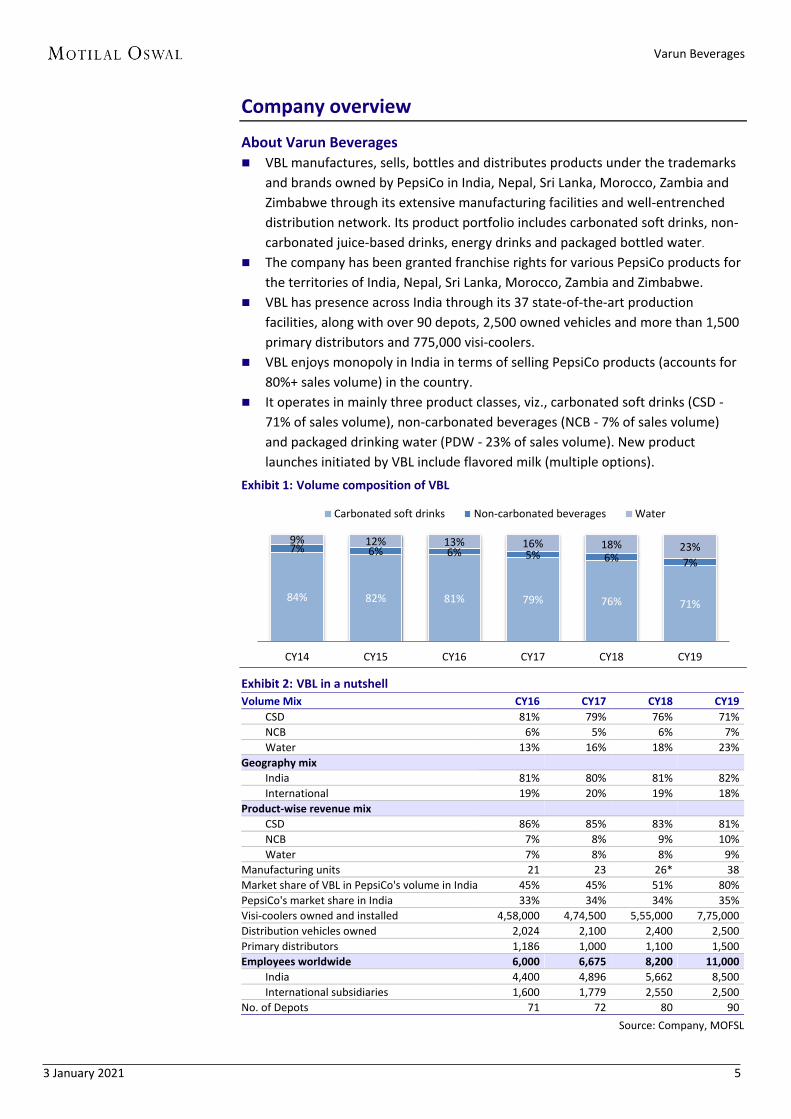
It operates in mainly three product classes, viz., carbonated soft drinks (CSD -
71% of sales volume), non-carbonated beverages (NCB - 7% of sales volume)
and packaged drinking water (PDW - 23% of sales volume). New product
launches initiated by VBL include flavored milk (multiple options).
Exhibit 1: Volume composition of VBL
Exhibit 2: VBL in a nutshell
Volume Mix CY16 CY17 CY18 CY19
CSD 81% 79% 76% 71%
NCB 6% 5% 6% 7%
Water 13% 16% 18% 23%
Geography mix
India 81% 80% 81% 82%
International 19% 20% 19% 18%
Product-wise revenue mix
CSD 86% 85% 83% 81%
NCB 7% 8% 9% 10%
Water 7% 8% 8% 9%
Manufacturing units 21 23 26* 38
Market share of VBL in PepsiCo's volume in India 45% 45% 51% 80%
PepsiCo's market share in India 33% 34% 34% 35%
Visi-coolers owned and installed 4,58,000 4,74,500 5,55,000 7,75,000
Distribution vehicles owned 2,024 2,100 2,400 2,500
Primary distributors 1,186 1,000 1,100 1,500
Employees worldwide 6,000 6,675 8,200 11,000
India 4,400 4,896 5,662 8,500
International subsidiaries 1,600 1,779 2,550 2,500
No. of Depots 71 72 80 90
Source: Company, MOFSL
84% 82% 81% 79% 76% 71%
7% 6% 6% 5% 6% 7%
9% 12% 13% 16% 18% 23%
CY14 CY15 CY16 CY17 CY18 CY19
Carbonated soft drinks Non-carbonated beverages Water
Varun Beverages
3 January 2021 6
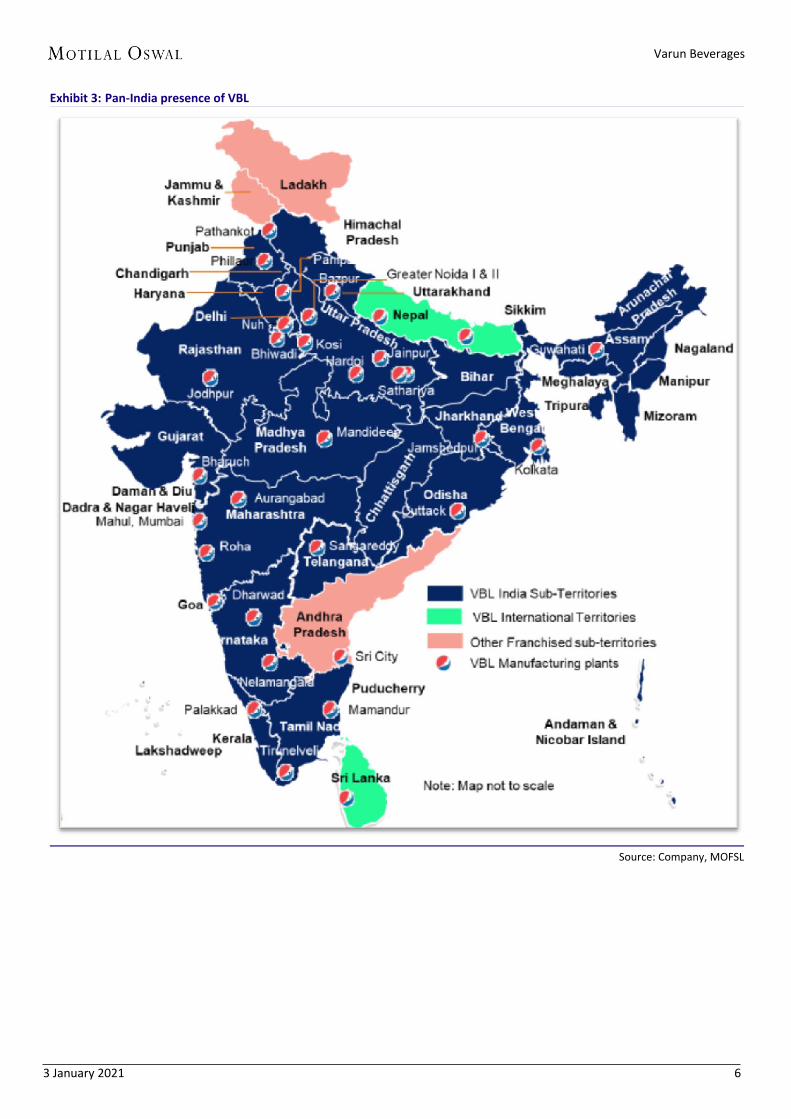
Exhibit 3: Pan-India presence of VBL
Source: Company, MOFSL
Varun Beverages
3 January 2021 7
Near monopoly in PepsiCo’s India business
Second largest bottler of PepsiCo outside the US
Majority of PepsiCo India’s business is handled by VBL alone; the company accounts
for over 80% sales of PepsiCo India’s business, and hence enjoys monopoly.
VBL has a diversified presence through manufacturing units, depots, and distributors,
which has created robust distribution and supply-chain network.
VBL’s recent growth is supported by various inorganic acquisitions and aggressive
expansions; these efforts should become fruitful in the medium-to-near term.
The company’s newly set-up Tropicana plant at Pathankot with emphasis on NCB sales
would also reduce revenue concentration risk (share of CSDs is higher) for VBL.
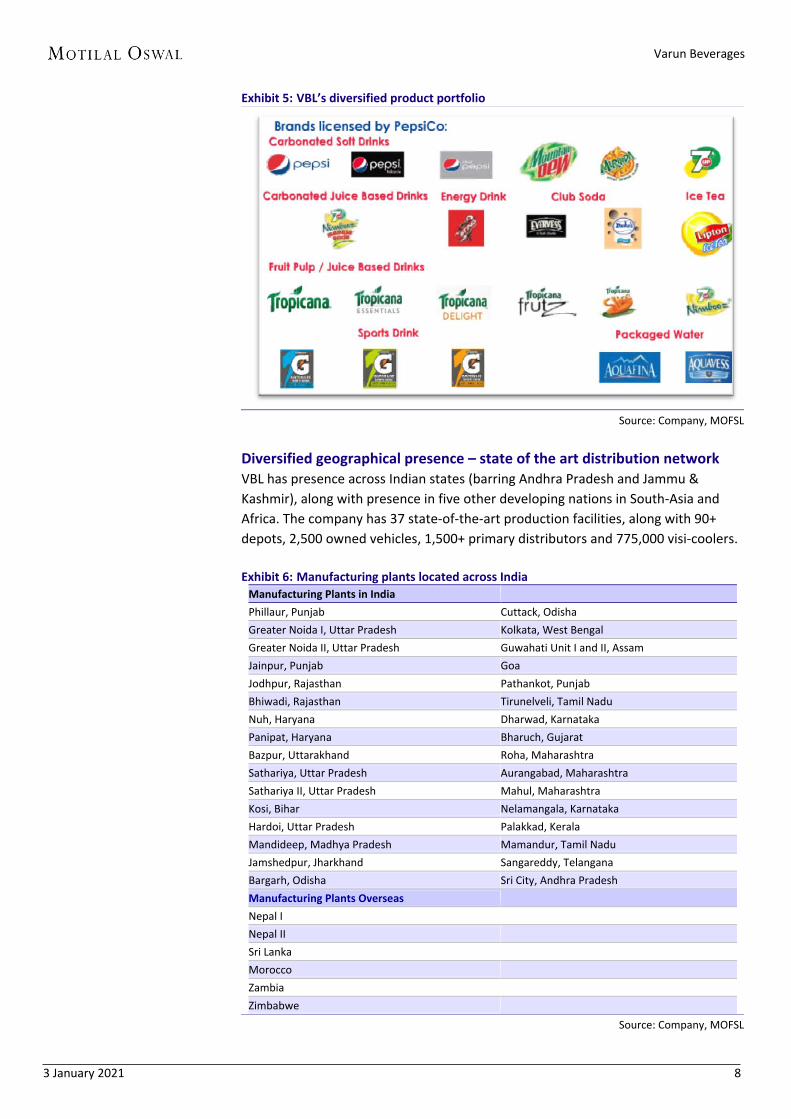
Market leader with near monopoly in PepsiCo India’s business VBL is engaged in the bottling, selling and distribution of various PepsiCo India’s
products (Pepsi, Mountain Dew, Pepsi Black, Mirinda, 7up, Tropicana Slice,
Tropicana, Sting, Evervess, Gatorade, Duke's, 7up Nimbooz and 7up Nimbooz Masala
Soda). VBL is PepsiCo’s second largest franchisee (outside the US) for CSDs and NCBs
that are sold under the trademarks of PepsiCo India.
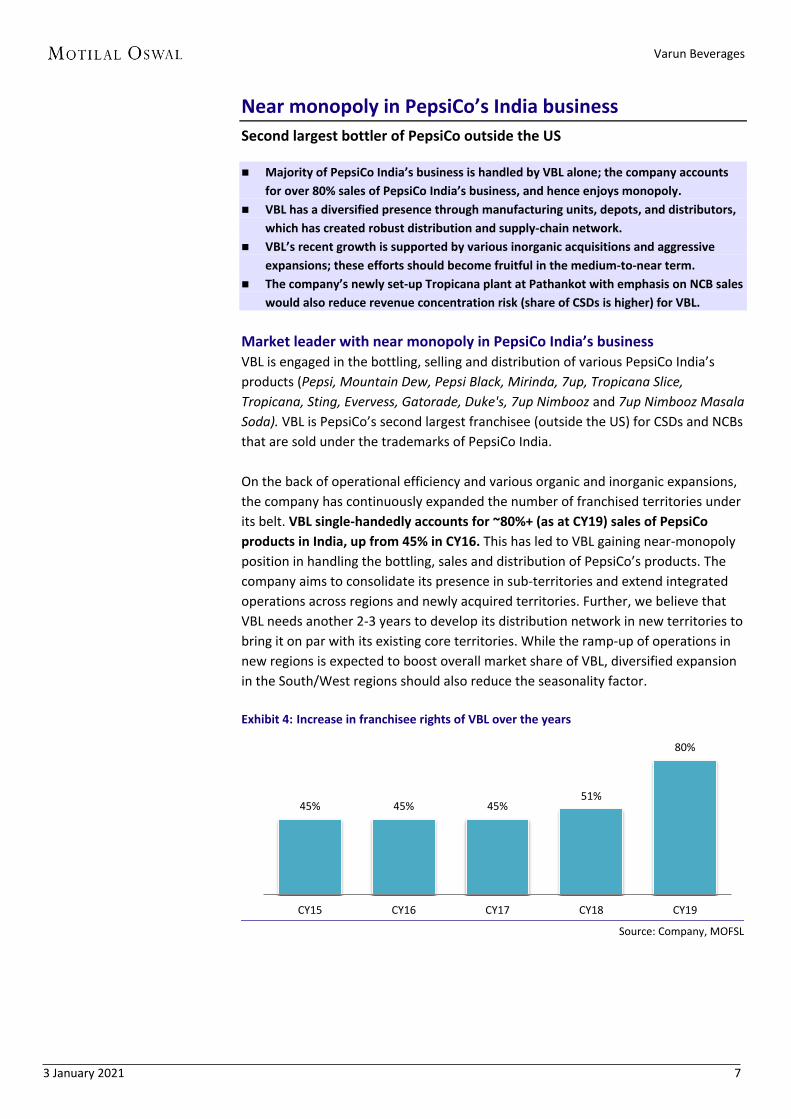
On the back of operational efficiency and various organic and inorganic expansions,
the company has continuously expanded the number of franchised territories under
its belt. VBL single-handedly accounts for ~80%+ (as at CY19) sales of PepsiCo
products in India, up from 45% in CY16. This has led to VBL gaining near-monopoly
position in handling the bottling, sales and distribution of PepsiCo’s products. The
company aims to consolidate its presence in sub-territories and extend integrated
operations across regions and newly acquired territories. Further, we believe that
VBL needs another 2-3 years to develop its distribution network in new territories to
bring it on par with its existing core territories. While the ramp-up of operations in
new regions is expected to boost overall market share of VBL, diversified expansion
in the South/West regions should also reduce the seasonality factor.
Exhibit 4: Increase in franchisee rights of VBL over the years
Source: Company, MOFSL
45% 45% 45% 51%
80%
CY15 CY16 CY17 CY18 CY19
Varun Beverages
3 January 2021 8
Exhibit 5: VBL’s diversified product portfolio
Source: Company, MOFSL
Diversified geographical presence – state of the art distribution network VBL has presence across Indian states (barring Andhra Pradesh and Jammu &
Kashmir), along with presence in five other developing nations in South-Asia and
Africa. The company has 37 state-of-the-art production facilities, along with 90+
depots, 2,500 owned vehicles, 1,500+ primary distributors and 775,000 visi-coolers.
Exhibit 6: Manufacturing plants located across India
Manufacturing Plants in India
Phillaur, Punjab Cuttack, Odisha
Greater Noida I, Uttar Pradesh Kolkata, West Bengal
Greater Noida II, Uttar Pradesh Guwahati Unit I and II, Assam
Jainpur, Punjab Goa
Jodhpur, Rajasthan Pathankot, Punjab
Bhiwadi, Rajasthan Tirunelveli, Tamil Nadu
Nuh, Haryana Dharwad, Karnataka
Panipat, Haryana Bharuch, Gujarat
Bazpur, Uttarakhand Roha, Maharashtra
Sathariya, Uttar Pradesh Aurangabad, Maharashtra
Sathariya II, Uttar Pradesh Mahul, Maharashtra
Kosi, Bihar Nelamangala, Karnataka
Hardoi, Uttar Pradesh Palakkad, Kerala
Mandideep, Madhya Pradesh Mamandur, Tamil Nadu
Jamshedpur, Jharkhand Sangareddy, Telangana
Bargarh, Odisha Sri City, Andhra Pradesh
Manufacturing Plants Overseas
Nepal I
Nepal II
Sri Lanka
Morocco
Zambia
Zimbabwe
Source: Company, MOFSL
Varun Beverages
3 January 2021 9
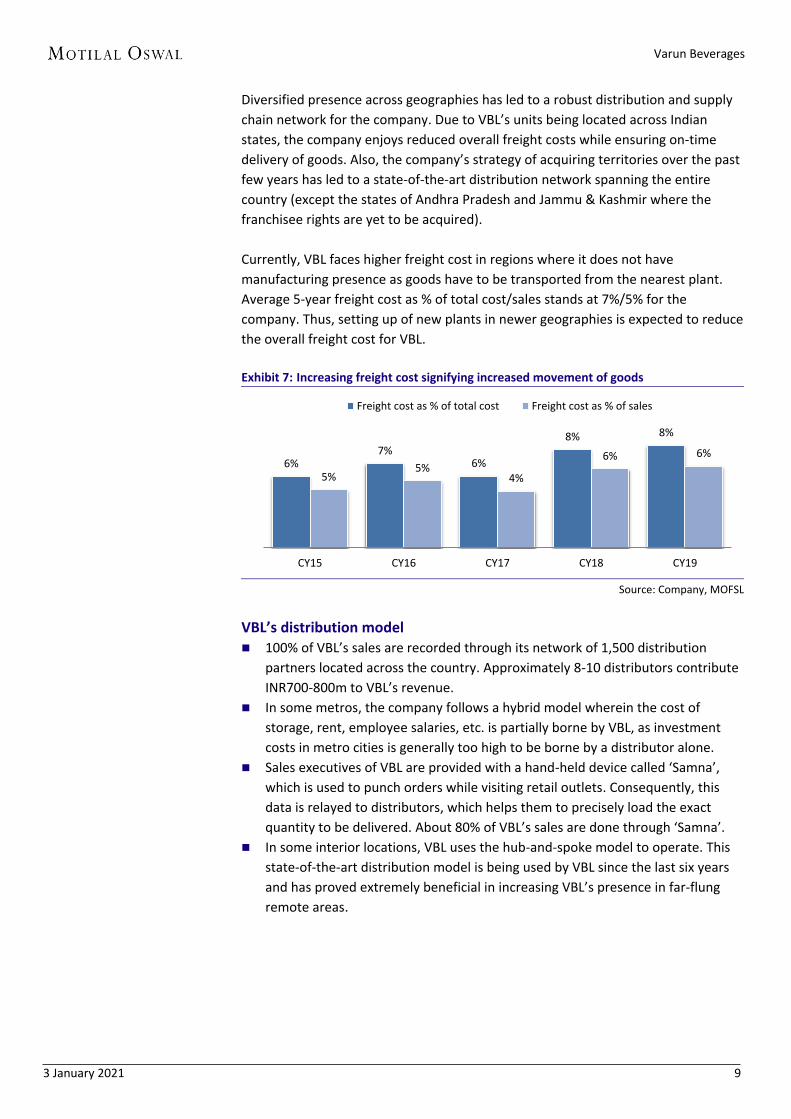
Diversified presence across geographies has led to a robust distribution and supply
chain network for the company. Due to VBL’s units being located across Indian
states, the company enjoys reduced overall freight costs while ensuring on-time
delivery of goods. Also, the company’s strategy of acquiring territories over the past
few years has led to a state-of-the-art distribution network spanning the entire
country (except the states of Andhra Pradesh and Jammu & Kashmir where the
franchisee rights are yet to be acquired).
Currently, VBL faces higher freight cost in regions where it does not have
manufacturing presence as goods have to be transported from the nearest plant.
Average 5-year freight cost as % of total cost/sales stands at 7%/5% for the
company. Thus, setting up of new plants in newer geographies is expected to reduce
the overall freight cost for VBL.
Exhibit 7: Increasing freight cost signifying increased movement of goods
Source: Company, MOFSL
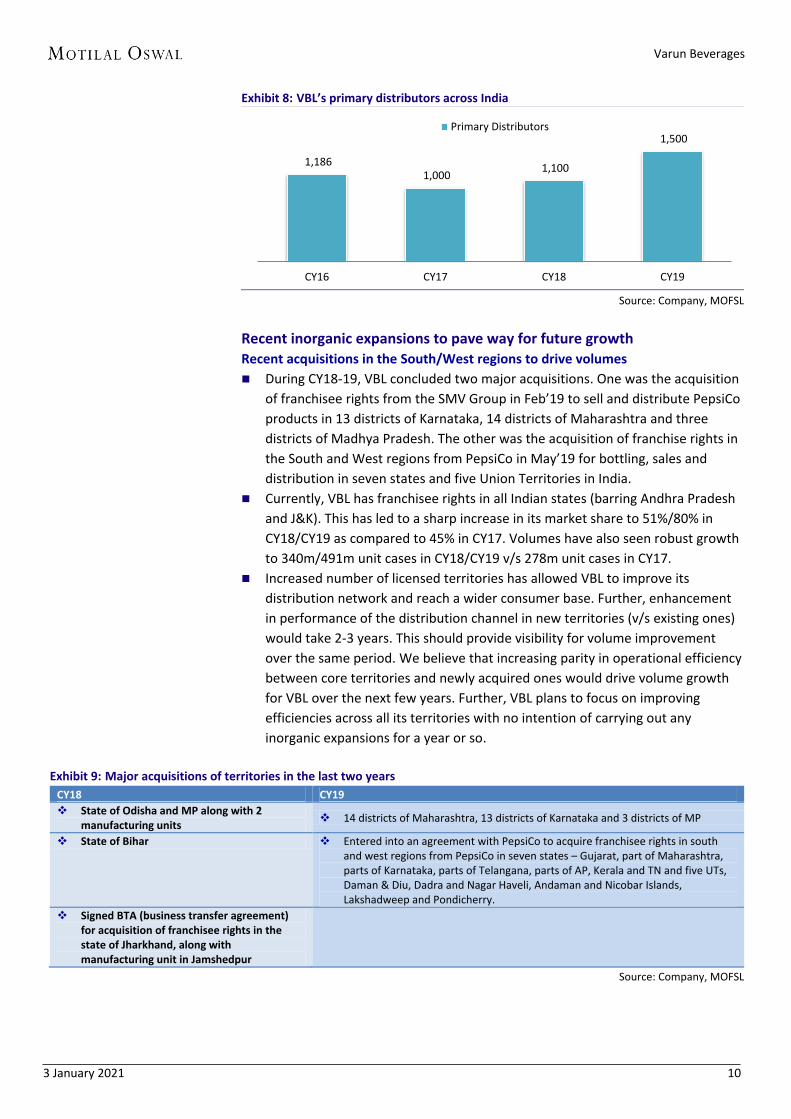
VBL’s distribution model 100% of VBL’s sales are recorded through its network of 1,500 distribution
partners located across the country. Approximately 8-10 distributors contribute
INR700-800m to VBL’s revenue.
In some metros, the company follows a hybrid model wherein the cost of
storage, rent, employee salaries, etc. is partially borne by VBL, as investment
costs in metro cities is generally too high to be borne by a distributor alone.
Sales executives of VBL are provided with a hand-held device called ‘Samna’,
which is used to punch orders while visiting retail outlets. Consequently, this
data is relayed to distributors, which helps them to precisely load the exact
quantity to be delivered. About 80% of VBL’s sales are done through ‘Samna’.
In some interior locations, VBL uses the hub-and-spoke model to operate. This
state-of-the-art distribution model is being used by VBL since the last six years
and has proved extremely beneficial in increasing VBL’s presence in far-flung
remote areas.
6% 7%
6%
8% 8%
5% 5%
4%
6% 6%
CY15 CY16 CY17 CY18 CY19
Freight cost as % of total cost Freight cost as % of sales
Varun Beverages
3 January 2021 10
Exhibit 8: VBL’s primary distributors across India
Source: Company, MOFSL
Recent inorganic expansions to pave way for future growth Recent acquisitions in the South/West regions to drive volumes
During CY18-19, VBL concluded two major acquisitions. One was the acquisition
of franchisee rights from the SMV Group in Feb’19 to sell and distribute PepsiCo
products in 13 districts of Karnataka, 14 districts of Maharashtra and three
districts of Madhya Pradesh. The other was the acquisition of franchise rights in
the South and West regions from PepsiCo in May’19 for bottling, sales and
distribution in seven states and five Union Territories in India.
Currently, VBL has franchisee rights in all Indian states (barring Andhra Pradesh
and J&K). This has led to a sharp increase in its market share to 51%/80% in
CY18/CY19 as compared to 45% in CY17. Volumes have also seen robust growth
to 340m/491m unit cases in CY18/CY19 v/s 278m unit cases in CY17.
Increased number of licensed territories has allowed VBL to improve its
distribution network and reach a wider consumer base. Further, enhancement
in performance of the distribution channel in new territories (v/s existing ones)
would take 2-3 years. This should provide visibility for volume improvement
over the same period. We believe that increasing parity in operational efficiency
between core territories and newly acquired ones would drive volume growth
for VBL over the next few years. Further, VBL plans to focus on improving
efficiencies across all its territories with no intention of carrying out any
inorganic expansions for a year or so.
Exhibit 9: Major acquisitions of territories in the last two years
CY18 CY19
State of Odisha and MP along with 2 manufacturing units
14 districts of Maharashtra, 13 districts of Karnataka and 3 districts of MP
State of Bihar Entered into an agreement with PepsiCo to acquire franchisee rights in south and west regions from PepsiCo in seven states – Gujarat, part of Maharashtra, parts of Karnataka, parts of Telangana, parts of AP, Kerala and TN and five UTs, Daman & Diu, Dadra and Nagar Haveli, Andaman and Nicobar Islands, Lakshadweep and Pondicherry.
Signed BTA (business transfer agreement) for acquisition of franchisee rights in the state of Jharkhand, along with manufacturing unit in Jamshedpur
Source: Company, MOFSL
1,186 1,000
1,100
1,500
CY16 CY17 CY18 CY19
Primary Distributors

Varun Beverages
3 January 2021 11
Tropicana plant in Pathankot – a step toward reducing concentration risk
VBL has the rights to sell and distribute Tropicana fruit juices under the PepsiCo
brand name. Also, to increase its product diversification, VBL has acquired the rights
to produce Tropicana in-house. In CY19, VBL added new capacity at Pathankot in
Punjab, capable of producing complete range of PepsiCo products under one roof.
We believe this new facility would reduce revenue concentration risk for VBL from
CSDs and at the same time help shift focus toward NCBs, dairy products and water.
Varun Beverages
3 January 2021 12
Improving mix in line with long-term strategy
Increasing share of NCBs/bottled water volumes to lower concentration risk
VBL is focusing on diversifying its product portfolio, which is in line with its long-term
strategy. Increasing coverage should drive organic volume growth of the CSD business.
Commencement of operations at its new plant should help improve margins of NCBs.
The company’s water segment volumes were driven by inorganic expansions.
Increased awareness is expected to lead the next phase of growth.
VBL’s international presence offers huge potential to grow and reduce geographical
revenue concentration.
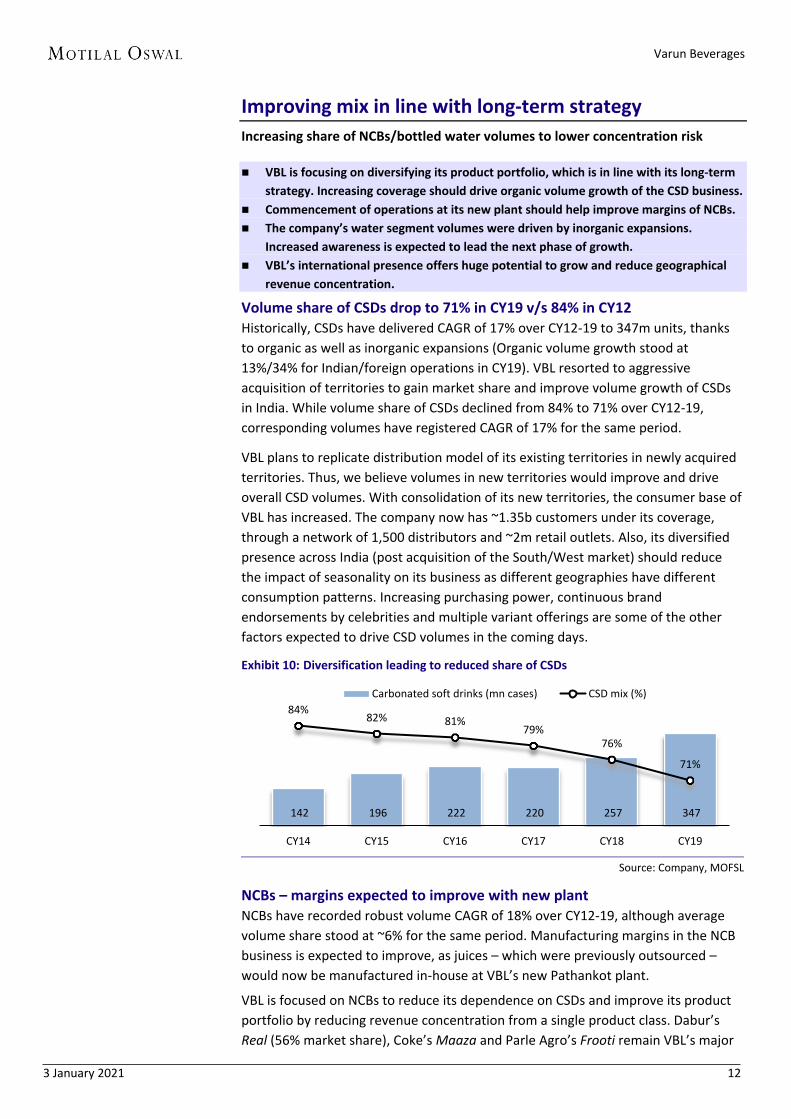
Volume share of CSDs drop to 71% in CY19 v/s 84% in CY12 Historically, CSDs have delivered CAGR of 17% over CY12-19 to 347m units, thanks
to organic as well as inorganic expansions (Organic volume growth stood at
13%/34% for Indian/foreign operations in CY19). VBL resorted to aggressive
acquisition of territories to gain market share and improve volume growth of CSDs
in India. While volume share of CSDs declined from 84% to 71% over CY12-19,
corresponding volumes have registered CAGR of 17% for the same period.
VBL plans to replicate distribution model of its existing territories in newly acquired
territories. Thus, we believe volumes in new territories would improve and drive
overall CSD volumes. With consolidation of its new territories, the consumer base of
VBL has increased. The company now has ~1.35b customers under its coverage,
through a network of 1,500 distributors and ~2m retail outlets. Also, its diversified
presence across India (post acquisition of the South/West market) should reduce
the impact of seasonality on its business as different geographies have different
consumption patterns. Increasing purchasing power, continuous brand
endorsements by celebrities and multiple variant offerings are some of the other
factors expected to drive CSD volumes in the coming days.
Exhibit 10: Diversification leading to reduced share of CSDs
Source: Company, MOFSL
NCBs – margins expected to improve with new plant NCBs have recorded robust volume CAGR of 18% over CY12-19, although average
volume share stood at ~6% for the same period. Manufacturing margins in the NCB
business is expected to improve, as juices – which were previously outsourced –
would now be manufactured in-house at VBL’s new Pathankot plant.
VBL is focused on NCBs to reduce its dependence on CSDs and improve its product
portfolio by reducing revenue concentration from a single product class. Dabur’s
Real (56% market share), Coke’s Maaza and Parle Agro’s Frooti remain VBL’s major
142 196 222 220 257 347
84% 82% 81%
79% 76%
71%
CY14 CY15 CY16 CY17 CY18 CY19
Carbonated soft drinks (mn cases) CSD mix (%)
Varun Beverages
3 January 2021 13
pan-India competitors in this segment. However, with recent expansion in newer
territories, VBL’s customer base has increased, providing the company an
opportunity to improve its NCB volumes. Further, increased awareness of the health
benefits of juices and other NCBs in Metros and Tier-1 cities is a good indicator of
their growth potential going forward.
Exhibit 11: NCB volume share gradually increasing in the last 3 years
Source: Company, MOFSL
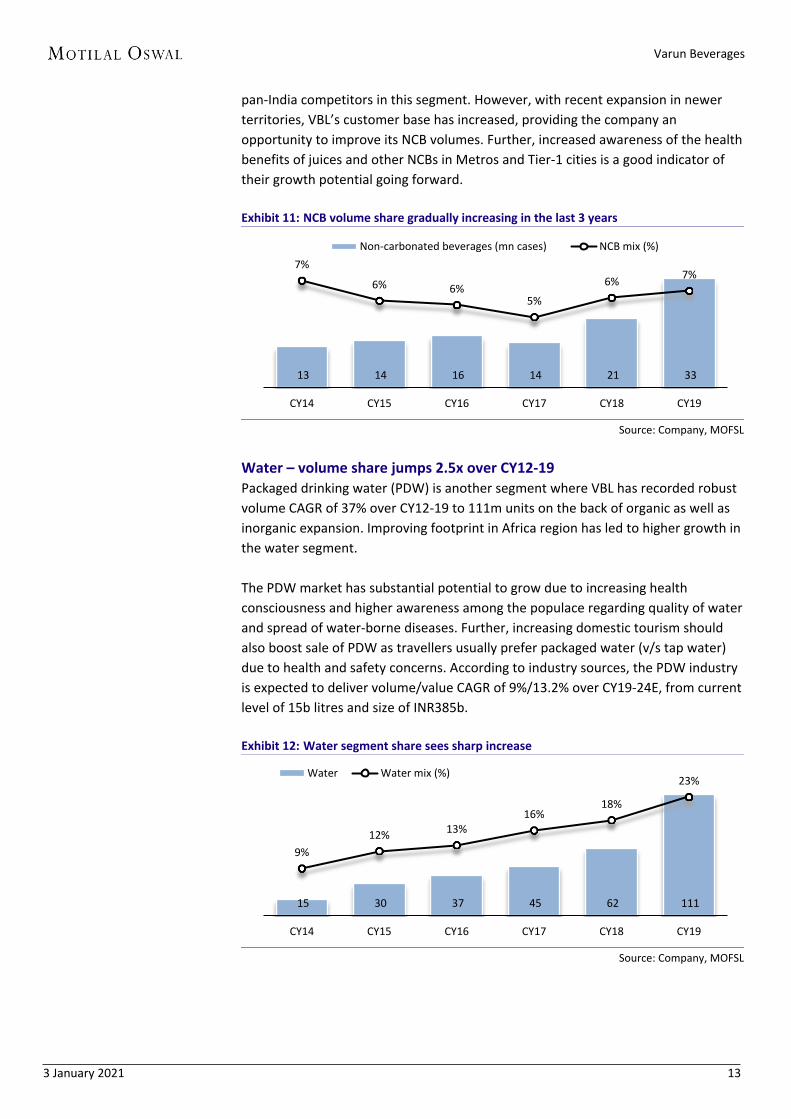
Water – volume share jumps 2.5x over CY12-19 Packaged drinking water (PDW) is another segment where VBL has recorded robust
volume CAGR of 37% over CY12-19 to 111m units on the back of organic as well as
inorganic expansion. Improving footprint in Africa region has led to higher growth in
the water segment.
The PDW market has substantial potential to grow due to increasing health
consciousness and higher awareness among the populace regarding quality of water
and spread of water-borne diseases. Further, increasing domestic tourism should
also boost sale of PDW as travellers usually prefer packaged water (v/s tap water)
due to health and safety concerns. According to industry sources, the PDW industry
is expected to deliver volume/value CAGR of 9%/13.2% over CY19-24E, from current
level of 15b litres and size of INR385b.
Exhibit 12: Water segment share sees sharp increase
Source: Company, MOFSL
13 14 16 14 21 33
7%
6% 6% 5%
6% 7%
CY14 CY15 CY16 CY17 CY18 CY19
Non-carbonated beverages (mn cases) NCB mix (%)
15 30 37 45 62 111
9%
12% 13%
16% 18%
23%
CY14 CY15 CY16 CY17 CY18 CY19
Water Water mix (%)
Varun Beverages
3 January 2021 14
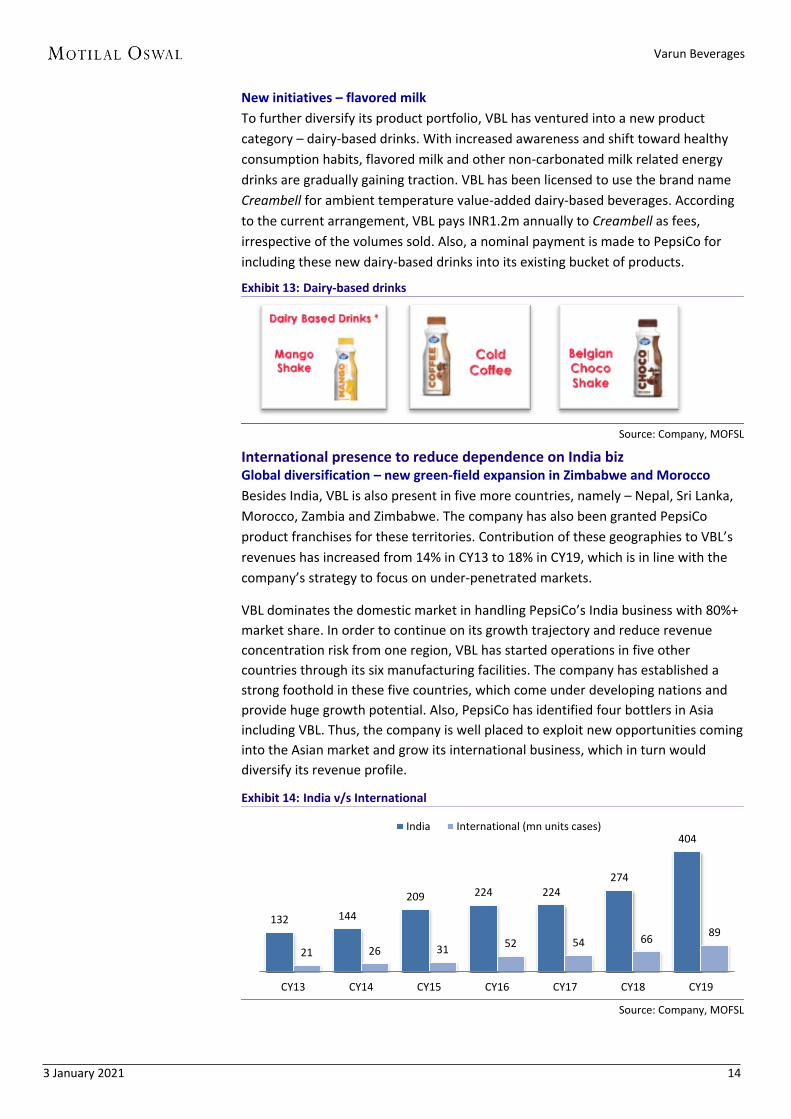
New initiatives – flavored milk
To further diversify its product portfolio, VBL has ventured into a new product
category – dairy-based drinks. With increased awareness and shift toward healthy
consumption habits, flavored milk and other non-carbonated milk related energy
drinks are gradually gaining traction. VBL has been licensed to use the brand name
Creambell for ambient temperature value-added dairy-based beverages. According
to the current arrangement, VBL pays INR1.2m annually to Creambell as fees,
irrespective of the volumes sold. Also, a nominal payment is made to PepsiCo for
including these new dairy-based drinks into its existing bucket of products.
Exhibit 13: Dairy-based drinks
Source: Company, MOFSL
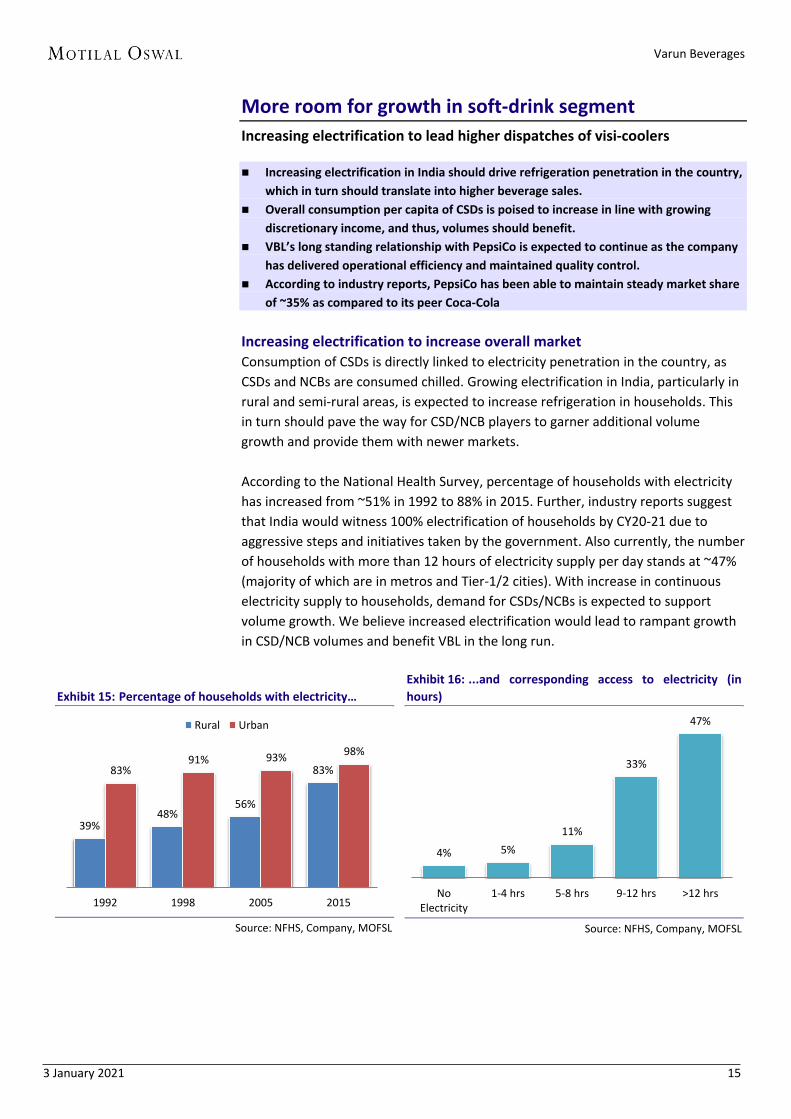
International presence to reduce dependence on India biz Global diversification – new green-field expansion in Zimbabwe and Morocco
Besides India, VBL is also present in five more countries, namely – Nepal, Sri Lanka,
Morocco, Zambia and Zimbabwe. The company has also been granted PepsiCo
product franchises for these territories. Contribution of these geographies to VBL’s
revenues has increased from 14% in CY13 to 18% in CY19, which is in line with the
company’s strategy to focus on under-penetrated markets.
VBL dominates the domestic market in handling PepsiCo’s India business with 80%+
market share. In order to continue on its growth trajectory and reduce revenue
concentration risk from one region, VBL has started operations in five other
countries through its six manufacturing facilities. The company has established a
strong foothold in these five countries, which come under developing nations and
provide huge growth potential. Also, PepsiCo has identified four bottlers in Asia
including VBL. Thus, the company is well placed to exploit new opportunities coming
into the Asian market and grow its international business, which in turn would
diversify its revenue profile.
Exhibit 14: India v/s International
Source: Company, MOFSL
132 144
209 224 224 274
404
21 26 31 52 54 66
89
CY13 CY14 CY15 CY16 CY17 CY18 CY19
India International (mn units cases)
Varun Beverages
3 January 2021 15
More room for growth in soft-drink segment
Increasing electrification to lead higher dispatches of visi-coolers
Increasing electrification in India should drive refrigeration penetration in the country,
which in turn should translate into higher beverage sales.
Overall consumption per capita of CSDs is poised to increase in line with growing
discretionary income, and thus, volumes should benefit.
VBL’s long standing relationship with PepsiCo is expected to continue as the company
has delivered operational efficiency and maintained quality control.
According to industry reports, PepsiCo has been able to maintain steady market share
of ~35% as compared to its peer Coca-Cola
Increasing electrification to increase overall market Consumption of CSDs is directly linked to electricity penetration in the country, as
CSDs and NCBs are consumed chilled. Growing electrification in India, particularly in
rural and semi-rural areas, is expected to increase refrigeration in households. This
in turn should pave the way for CSD/NCB players to garner additional volume
growth and provide them with newer markets.
According to the National Health Survey, percentage of households with electricity
has increased from ~51% in 1992 to 88% in 2015. Further, industry reports suggest
that India would witness 100% electrification of households by CY20-21 due to
aggressive steps and initiatives taken by the government. Also currently, the number
of households with more than 12 hours of electricity supply per day stands at ~47%
(majority of which are in metros and Tier-1/2 cities). With increase in continuous
electricity supply to households, demand for CSDs/NCBs is expected to support
volume growth. We believe increased electrification would lead to rampant growth
in CSD/NCB volumes and benefit VBL in the long run.
Exhibit 15: Percentage of households with electricity…
Source: NFHS, Company, MOFSL
Exhibit 16: ...and corresponding access to electricity (in
hours)
Source: NFHS, Company, MOFSL
39% 48%
56%
83% 83% 91% 93%
98%
1992 1998 2005 2015
Rural Urban
4% 5%
11%
33%
47%
NoElectricity
1-4 hrs 5-8 hrs 9-12 hrs >12 hrs
Varun Beverages
3 January 2021 16
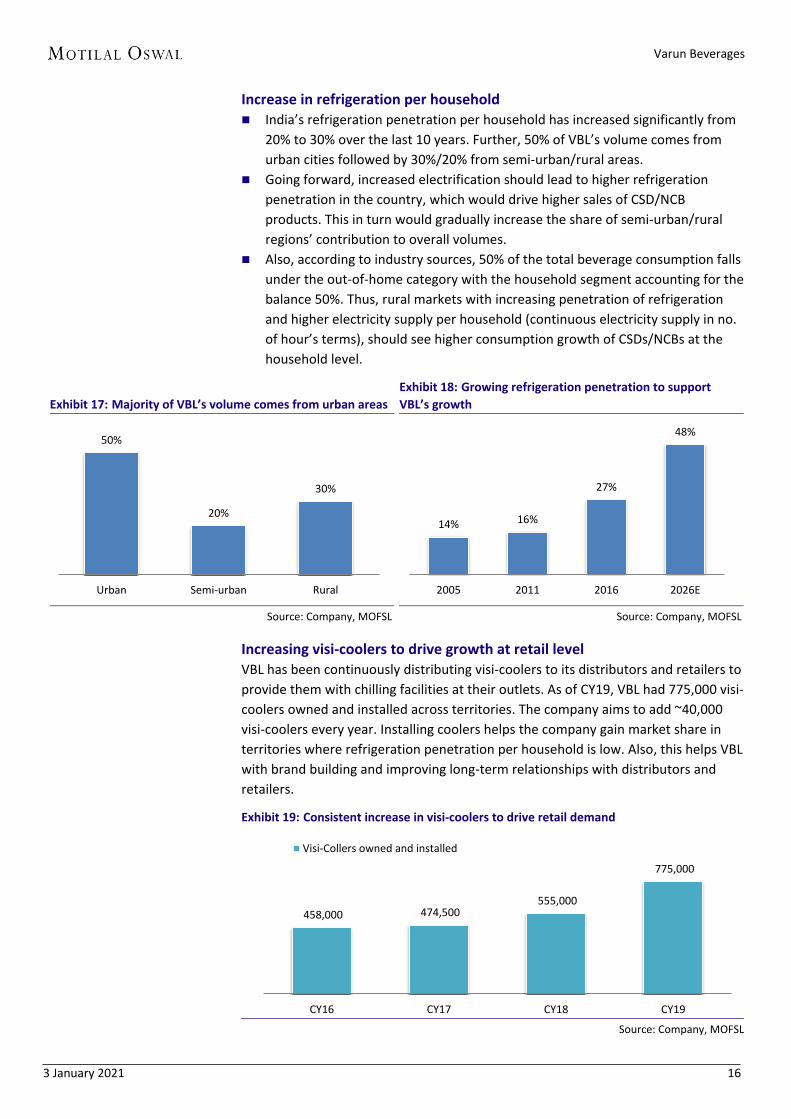
Increase in refrigeration per household India’s refrigeration penetration per household has increased significantly from
20% to 30% over the last 10 years. Further, 50% of VBL’s volume comes from
urban cities followed by 30%/20% from semi-urban/rural areas.
Going forward, increased electrification should lead to higher refrigeration
penetration in the country, which would drive higher sales of CSD/NCB
products. This in turn would gradually increase the share of semi-urban/rural
regions’ contribution to overall volumes.
Also, according to industry sources, 50% of the total beverage consumption falls
under the out-of-home category with the household segment accounting for the
balance 50%. Thus, rural markets with increasing penetration of refrigeration
and higher electricity supply per household (continuous electricity supply in no.
of hour’s terms), should see higher consumption growth of CSDs/NCBs at the
household level.
Exhibit 17: Majority of VBL’s volume comes from urban areas
Source: Company, MOFSL
Exhibit 18: Growing refrigeration penetration to support
VBL’s growth
Source: Company, MOFSL
Increasing visi-coolers to drive growth at retail level VBL has been continuously distributing visi-coolers to its distributors and retailers to
provide them with chilling facilities at their outlets. As of CY19, VBL had 775,000 visi-
coolers owned and installed across territories. The company aims to add ~40,000
visi-coolers every year. Installing coolers helps the company gain market share in
territories where refrigeration penetration per household is low. Also, this helps VBL
with brand building and improving long-term relationships with distributors and
retailers.
Exhibit 19: Consistent increase in visi-coolers to drive retail demand
Source: Company, MOFSL
50%
20%
30%
Urban Semi-urban Rural
14% 16%
27%
48%
2005 2011 2016 2026E
458,000 474,500 555,000
775,000
CY16 CY17 CY18 CY19
Visi-Collers owned and installed

Varun Beverages
3 January 2021 17
Increasing per capita consumption to help drive volumes According to a Euromonitor Report and industry sources, India’s per capita
consumption of soft drinks is lower compared to the US, Germany, Brazil and
Mexico. As at 2016, per capita consumption of soft drinks was only 44 bottles in
India v/s 1,496 bottles in the US.
We believe that improving purchasing power, higher disposable income and
increasing availability of electricity in Tier-3/4 cities as well as in rural areas is a
great opportunity for VBL, as consumption per capita is expected to double to
88 bottles by 2021E. Also with its recent acquisition spree, VBL is expected to
increase its coverage in newer territories and gain market share.
Exhibit 20: Break-up of 175b liters beverage industry
Source: DRHP, Company, MOFSL
Exhibit 21: CSD consumption per capita (in bottles)
Source: DRHP, Company, MOFSL
Strong relationship with PepsiCo to help sustain growth VBL is the second-largest franchisee in the world (outside the US) for CSDs/NCBs
sold under the trademarks owned by PepsiCo. VBL forged an alliance with PepsiCo
almost 28 years ago in 1991. Its long-standing relationship with the cola giant has
stood the test of time due to continuously delivering operational efficiency and
maintaining precise quality control standards. VBL’s aggressive expansion strategy
has led to PepsiCo licensing additional franchises to the company, including sub-
territories in India that were earlier directly operated by PepsiCo or by third-party
bottlers. Testimony to this is VBL’s ‘bottling appointment and trademark license
agreement’, which has been extended (Oct’22 to Apr’39). Also, VBL is the only
franchisee to have such a long-term contract with PepsiCo.
Further, VBL pays PepsiCo 14% revenue share, from which ~6% is utilized by the
latter for ‘above the line’ (ATL) sales promotion and advertisements. We believe
VBL’s strong partnership with PepsiCo would continue to thrive due to the former’s
operational efficiency and the latter’s multiple marketing and advertisement
activities.
Exhibit 22: Revised bottling agreement
Particular Existing Revised
Franchisee rights (up to) 2 October 2022 30 April 2039
Source: Company, MOFSL
52%
25%
15%
4% 4%
Hot drinks
Dairy drinks
Soft drinks
Bulk/HOD water
Alcoholic drinks 44
271
537
1,221
1,489 1,496
India China Brazil Germany Mexico USA
Varun Beverages
3 January 2021 18
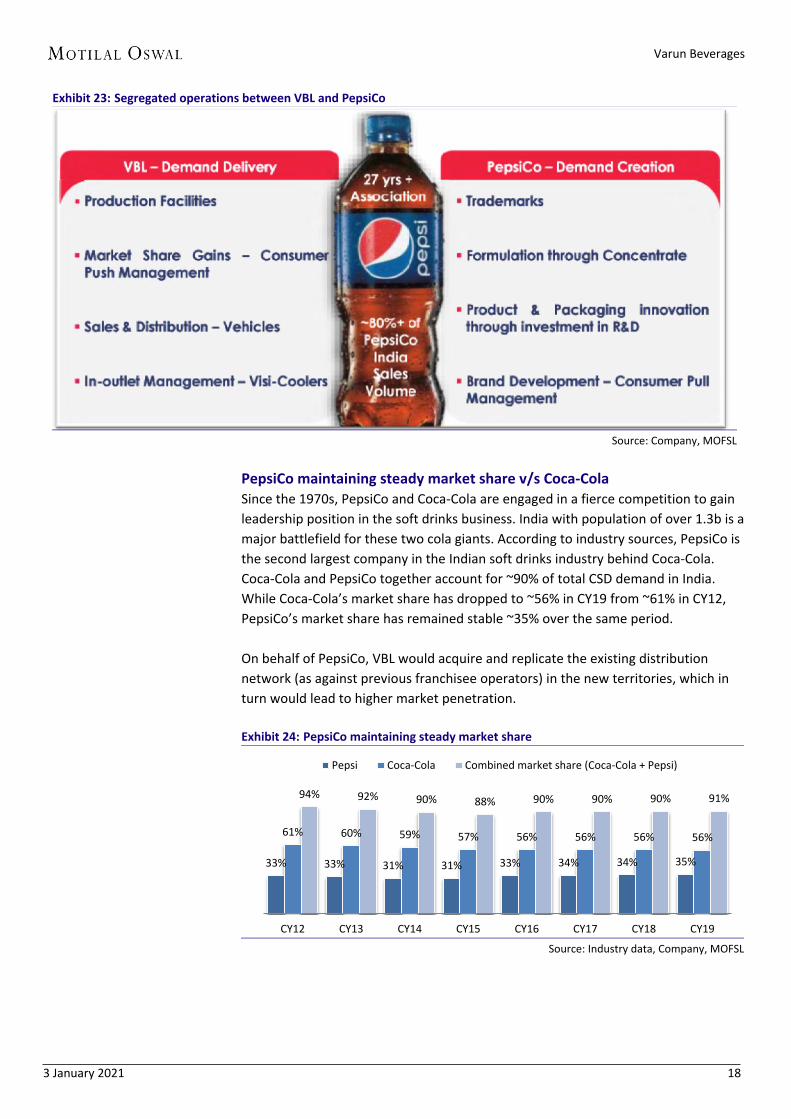
Exhibit 23: Segregated operations between VBL and PepsiCo
Source: Company, MOFSL
PepsiCo maintaining steady market share v/s Coca-Cola Since the 1970s, PepsiCo and Coca-Cola are engaged in a fierce competition to gain
leadership position in the soft drinks business. India with population of over 1.3b is a
major battlefield for these two cola giants. According to industry sources, PepsiCo is
the second largest company in the Indian soft drinks industry behind Coca-Cola.
Coca-Cola and PepsiCo together account for ~90% of total CSD demand in India.
While Coca-Cola’s market share has dropped to ~56% in CY19 from ~61% in CY12,
PepsiCo’s market share has remained stable ~35% over the same period.
On behalf of PepsiCo, VBL would acquire and replicate the existing distribution
network (as against previous franchisee operators) in the new territories, which in
turn would lead to higher market penetration.
Exhibit 24: PepsiCo maintaining steady market share
Source: Industry data, Company, MOFSL
33% 33% 31% 31% 33% 34% 34% 35%
61% 60% 59% 57% 56% 56% 56% 56%
94% 92% 90% 88% 90% 90% 90% 91%
CY12 CY13 CY14 CY15 CY16 CY17 CY18 CY19
Pepsi Coca-Cola Combined market share (Coca-Cola + Pepsi)
Varun Beverages
3 January 2021 19
Newly acquired territories to drive growth
Utilization in peak month ~60%
Surplus capacity provides enough head-room for volumes to grow.
With operations at newly acquired territories improving, operating leverage is
expected to kick in.
Higher sweating of assets to drive operating profit Previously, VBL’s utilization and expansion plans were largely dependent on its
peak quarter (April to June). Post consolidation of its recent acquisitions, VBL’s
capacity utilization declined to 60% in its peak month (i.e. May). Annual capacity
utilization of the company is way lower than the peak season utilization rate of
60%. Further, with recent acquisitions in the southern and western markets, the
seasonality factor has reduced, as demand is now expected to be less
concentrated in any one particular month, due to consumption cycles being
different across regions.
In some international units, VBL has been able to maintain peak asset turnover
ratio of 4x. Also at some units, the utilization rate in peak months has gone up to
100%. The company has indicated that it has no plans to undertake any major
capex or inorganic expansion for the next 2 years. The focus instead would be
on higher sweating of assets, maintaining high asset turnover ratio and
improving overall capacity utilization rate.
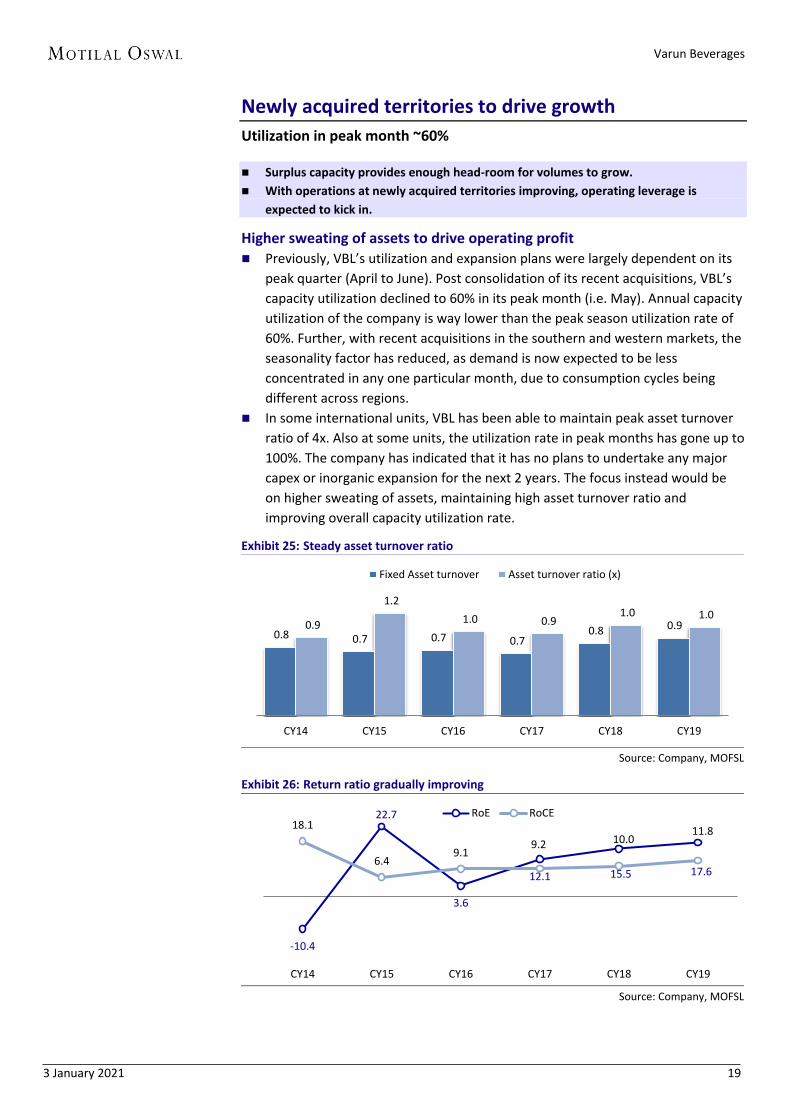
Exhibit 25: Steady asset turnover ratio
Source: Company, MOFSL
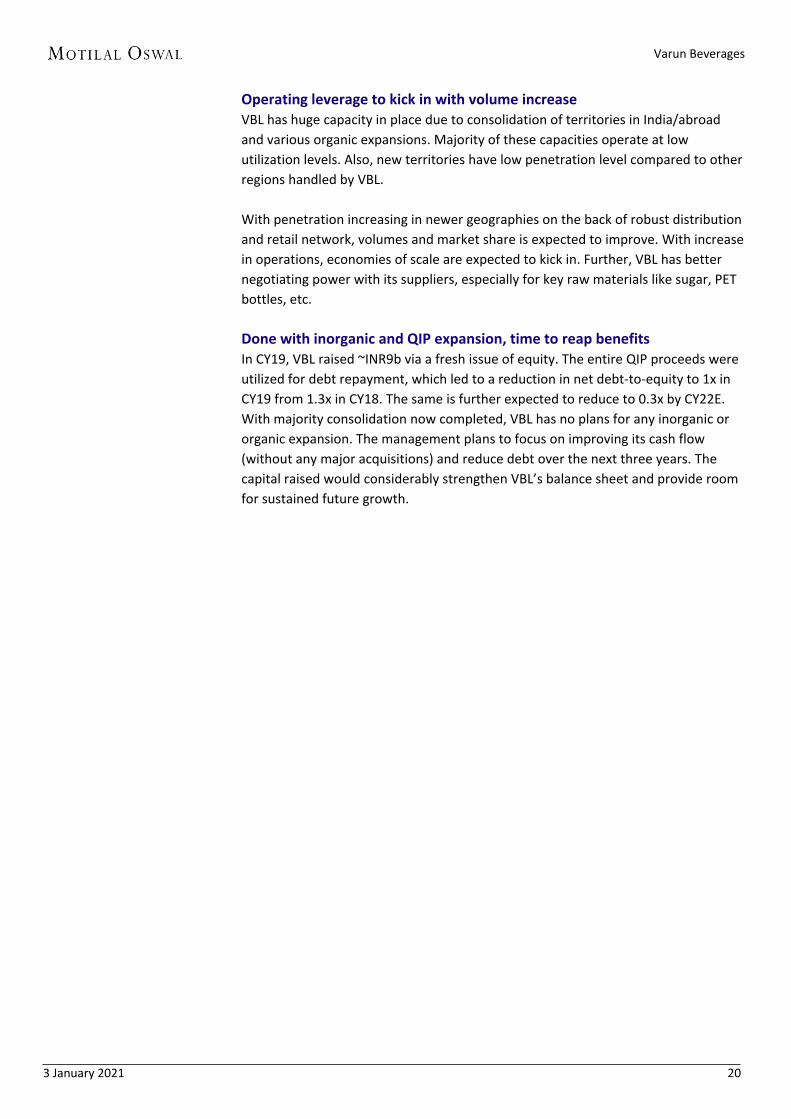
Exhibit 26: Return ratio gradually improving
Source: Company, MOFSL
0.8 0.7 0.7 0.7 0.8 0.9 0.9
1.2
1.0 0.9 1.0 1.0
CY14 CY15 CY16 CY17 CY18 CY19
Fixed Asset turnover Asset turnover ratio (x)
-10.4
22.7
3.6
12.1 15.5 17.6
18.1
6.4 9.1
9.2 10.0 11.8
CY14 CY15 CY16 CY17 CY18 CY19
RoE RoCE
Varun Beverages
3 January 2021 20
Operating leverage to kick in with volume increase VBL has huge capacity in place due to consolidation of territories in India/abroad
and various organic expansions. Majority of these capacities operate at low
utilization levels. Also, new territories have low penetration level compared to other
regions handled by VBL.
With penetration increasing in newer geographies on the back of robust distribution
and retail network, volumes and market share is expected to improve. With increase
in operations, economies of scale are expected to kick in. Further, VBL has better
negotiating power with its suppliers, especially for key raw materials like sugar, PET
bottles, etc.
Done with inorganic and QIP expansion, time to reap benefits In CY19, VBL raised ~INR9b via a fresh issue of equity. The entire QIP proceeds were
utilized for debt repayment, which led to a reduction in net debt-to-equity to 1x in
CY19 from 1.3x in CY18. The same is further expected to reduce to 0.3x by CY22E.
With majority consolidation now completed, VBL has no plans for any inorganic or
organic expansion. The management plans to focus on improving its cash flow
(without any major acquisitions) and reduce debt over the next three years. The
capital raised would considerably strengthen VBL’s balance sheet and provide room
for sustained future growth.
Varun Beverages
3 January 2021 21
Beverage Industry
Rising per capita income to support growth of beverage industry
Soft drink industry expected to record volume CAGR of ~7%.
Increasing awareness of healthy consumption habits to boost NCB’s performance.
Increasing awareness with respect to spread of water borne diseases to push sales of
packaged drinking water in India.
Soft drink industry in India The Indian soft drink industry is pegged at 33,559m liters in volume terms and
INR1,283b in value terms. It delivered 9.7%/11.9% CAGR in volume/value terms over
CY13-18. Majority of volume share is contributed by packaged drinking water (PDW)
at 48%, followed by bulk/HOD water at 23% and CSDs at 19%. However, in value
terms, the sector is majorly dominated by CSDs, which contribute 44%, followed by
PDW at 30% and bulk/HOD water at 1%.
Exhibit 27: Market share and volume break-up of Indian soft drink industry
Soft drink
volume (m liters) % share
Soft drink value (INR m)
% share
Packaged drinking water 15,960 48% 385,659 30%
Bulk/HOD water 7,700 23% 17,012 1%
Carbonates 6,216 19% 567,171 44%
Still drinks 2,011 6% 189,783 15%
Fruit powders 596 2% 15,324 1%
Squash/syrups 282 0.8% 15,085 1.2%
Nectars 260 0.8% 35,090 2.7%
Sport drinks 205 0.6% 18,506 1.4%
Juice 123 0.4% 18,811 1.5%
Enhanced water 113 0.3% 2,559 0.2%
Energy drinks 31 0.1% 12,438 1.0%
Flavored water 29 0.1% 1,670 0.1%
Iced RTD/tea drinks 24 0.1% 2,411 0.2%
Iced RTD/coffee drinks 9 0.0% 1,938 0.2%
Total 33,559
1,283,457
Source: DRHP, Company, MOFSL
Consumption of soft drinks in India is much lower than that in developed nations (at
44 bottles per capita in India v/s 1,496 bottles per capita in the US) due to lower per
capita income/household electrification. However, this is expected to change with
increasing disposable income and growing electrification in the country on the back
of several government initiatives. According to a GlobalData report, the soft drinks
industry is expected to continue its growth trajectory with volume/value CAGR of
6.9%/9.4% over CY19-24E. Volume/value growth is expected to be driven by the
PDW segment at 9%/13.2%, followed by CSDs at 2.6%/6% over CY19-24E.

Varun Beverages
3 January 2021 22
Exhibit 28: Domestic consumption of various beverages (per capita per liter)
Source: DRHP, Company, MOFSL
Exhibit 29: Volume contribution of different drinks
Source: DRHP, Company, MOFSL
Exhibit 30: Market share of different beverages
Source: DRHP, Company, MOFSL
Exhibit 31: Robust volume/value growth for soft drink
industry
Source: DRHP, Company, MOFSL
NCBs and Water segment to lead next growth phase PepsiCo enjoys health market share (20.2%/19.8% in volume/value terms) in the
Indian juice market. The NCB segment is expected to be the biggest beneficiary of
the changing preference toward healthy habits. Increased awareness among the
populace with respect to the dangers of high consumption of sugary drinks (CSDs)
has led to a slight shift toward NCBs, and thus, the category is expected to witness
stronger growth vis-à-vis CSDs.
70
34
20
6 4
Hot drinks Dairy drinks Soft drinks Bulk/HOD water Alcoholic drinks
Hot drinks, 52%
Dairy drinks, 25%
Soft drinks, 15%
Bulk/HOD water, 4%
Alcoholic drinks, 3%
91 45 26 8 6
52
25
15
4 3
Hot drinks Dairy drinks Soft drinks Bulk/HODWater
Alcoholicdtinks
Market volumes in 2018 (bn litres)
% market share
10.2% 9.7% 6.9%
11.3% 11.9%
9.4%
2017-2018 2013-2018 2019-2024E
Soft drink industry volume growth (%)
Soft drink industry value growth (%)
Varun Beverages
3 January 2021 23
According to a Euromonitor report, the PDW industry should deliver CAGR of 9%
over CY19-24E. Declining water quality in rural/semi-urban areas, continuous
introduction of new flavours along with increasing presence across various retail
formats should further support growth of PDW in India.
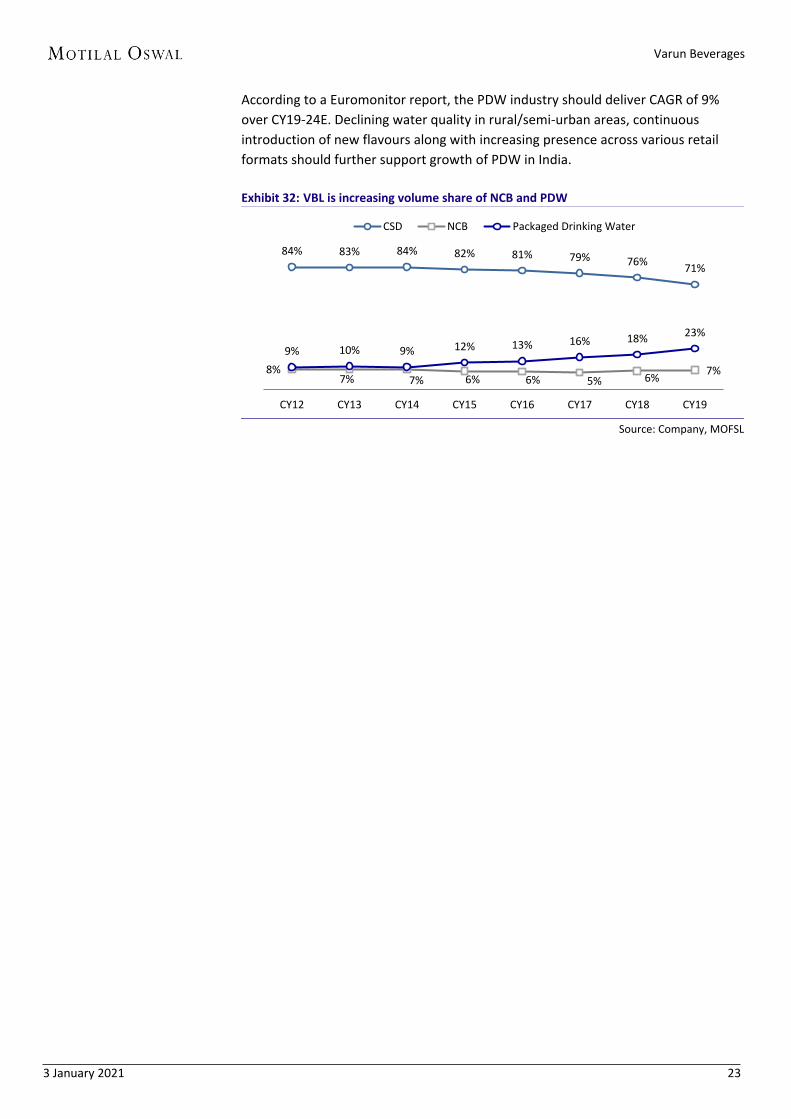
Exhibit 32: VBL is increasing volume share of NCB and PDW
Source: Company, MOFSL
84% 83% 84% 82% 81% 79% 76% 71%
8% 7% 7% 6% 6% 5% 6%
7%
9% 10% 9% 12% 13% 16% 18% 23%
CY12 CY13 CY14 CY15 CY16 CY17 CY18 CY19
CSD NCB Packaged Drinking Water
Varun Beverages
3 January 2021 24
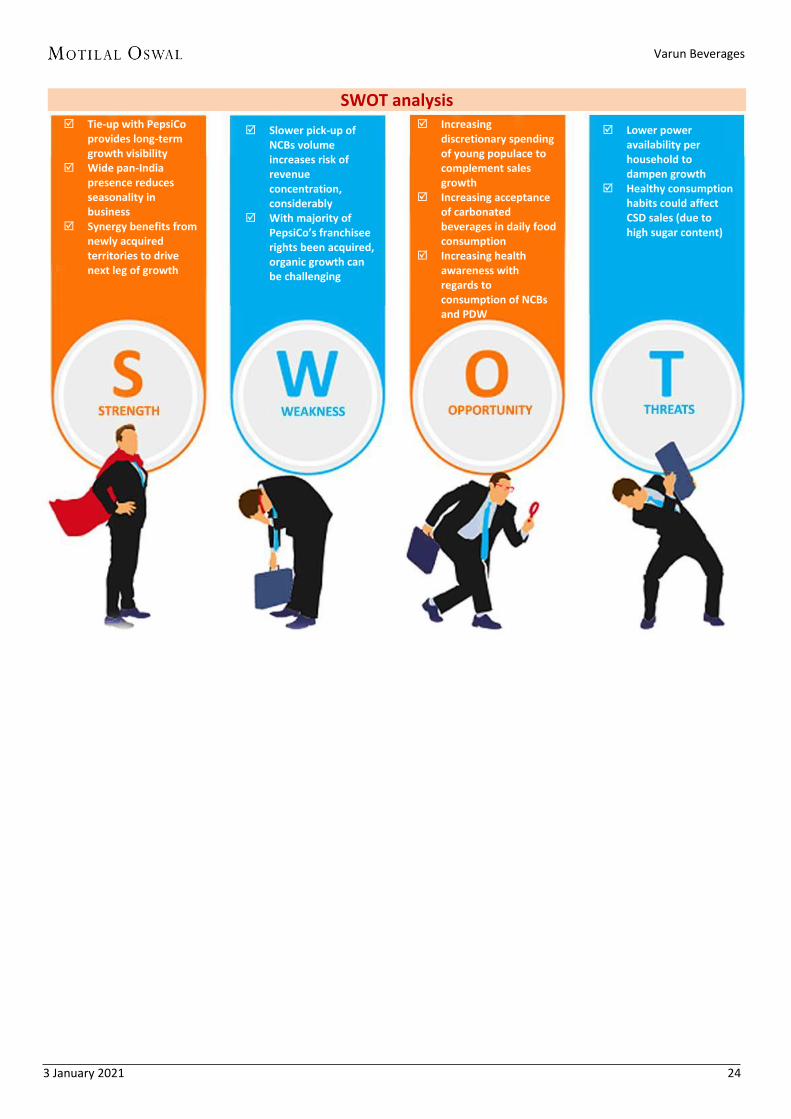
SWOT analysis
Tie-up with PepsiCo provides long-term growth visibility
Wide pan-India presence reduces seasonality in business
Synergy benefits from newly acquired territories to drive next leg of growth
Slower pick-up of NCBs volume increases risk of revenue concentration, considerably
With majority of PepsiCo’s franchisee rights been acquired, organic growth can be challenging
Increasing discretionary spending of young populace to complement sales growth
Increasing acceptance of carbonated beverages in daily food consumption
Increasing health awareness with regards to consumption of NCBs and PDW
Lower power availability per household to dampen growth
Healthy consumption habits could affect CSD sales (due to high sugar content)
Varun Beverages
3 January 2021 25
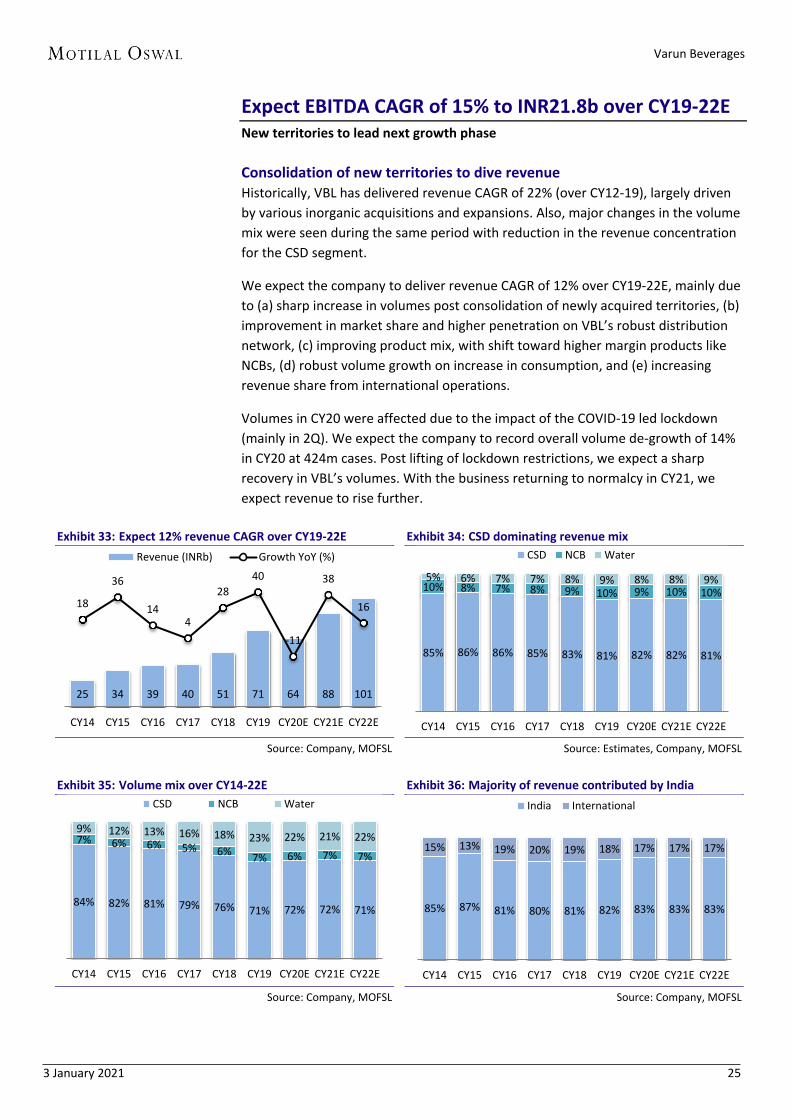
Expect EBITDA CAGR of 15% to INR21.8b over CY19-22E New territories to lead next growth phase
Consolidation of new territories to dive revenue Historically, VBL has delivered revenue CAGR of 22% (over CY12-19), largely driven
by various inorganic acquisitions and expansions. Also, major changes in the volume
mix were seen during the same period with reduction in the revenue concentration
for the CSD segment.
We expect the company to deliver revenue CAGR of 12% over CY19-22E, mainly due
to (a) sharp increase in volumes post consolidation of newly acquired territories, (b)
improvement in market share and higher penetration on VBL’s robust distribution
network, (c) improving product mix, with shift toward higher margin products like
NCBs, (d) robust volume growth on increase in consumption, and (e) increasing
revenue share from international operations.
Volumes in CY20 were affected due to the impact of the COVID-19 led lockdown
(mainly in 2Q). We expect the company to record overall volume de-growth of 14%
in CY20 at 424m cases. Post lifting of lockdown restrictions, we expect a sharp
recovery in VBL’s volumes. With the business returning to normalcy in CY21, we
expect revenue to rise further.
Exhibit 33: Expect 12% revenue CAGR over CY19-22E
Source: Company, MOFSL
Exhibit 34: CSD dominating revenue mix
Source: Estimates, Company, MOFSL
Exhibit 35: Volume mix over CY14-22E
Source: Company, MOFSL
Exhibit 36: Majority of revenue contributed by India
Source: Company, MOFSL
25 34 39 40 51 71 64 88 101
18
36
14 4
28
40
-11
38
16
CY14 CY15 CY16 CY17 CY18 CY19 CY20E CY21E CY22E
Revenue (INRb) Growth YoY (%)
85% 86% 86% 85% 83% 81% 82% 82% 81%
10% 8% 7% 8% 9% 10% 9% 10% 10%
5% 6% 7% 7% 8% 9% 8% 8% 9%
CY14 CY15 CY16 CY17 CY18 CY19 CY20E CY21E CY22E
CSD NCB Water
84% 82% 81% 79% 76% 71% 72% 72% 71%
7% 6% 6% 5% 6% 7% 6% 7% 7%
9% 12% 13% 16% 18% 23% 22% 21% 22%
CY14 CY15 CY16 CY17 CY18 CY19 CY20E CY21E CY22E
CSD NCB Water
85% 87% 81% 80% 81% 82% 83% 83% 83%
15% 13% 19% 20% 19% 18% 17% 17% 17%
CY14 CY15 CY16 CY17 CY18 CY19 CY20E CY21E CY22E
India International
Varun Beverages
3 January 2021 26
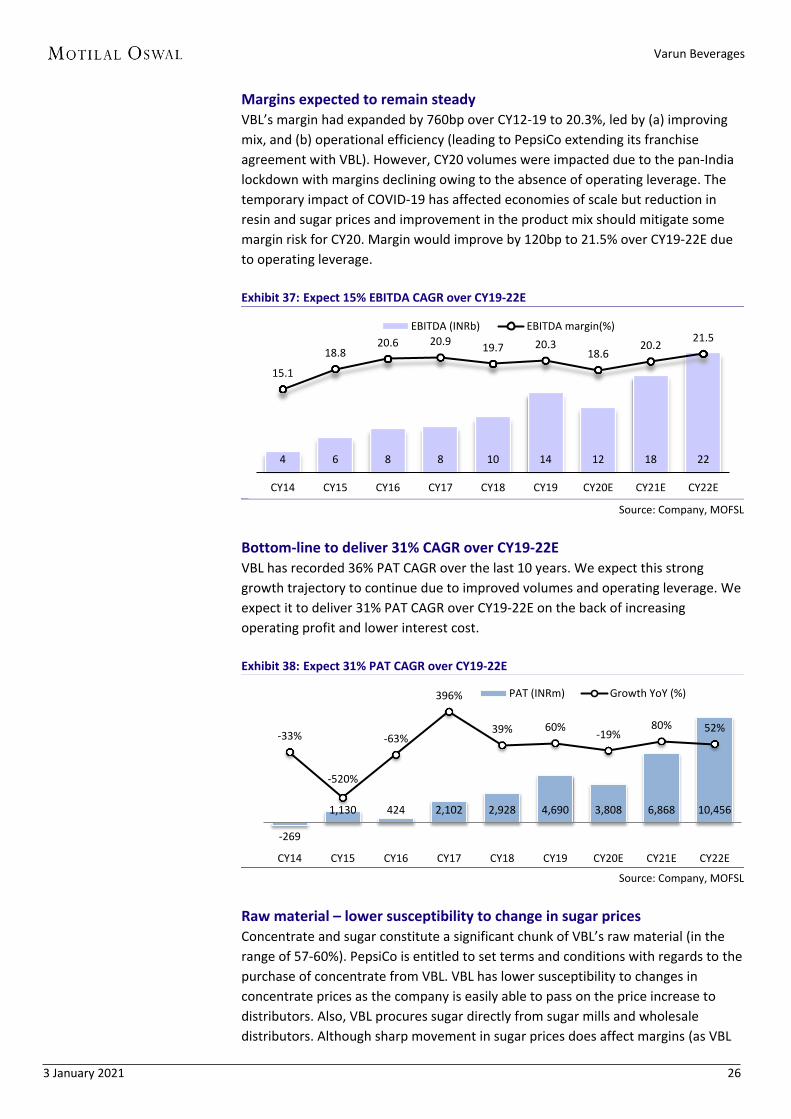
Margins expected to remain steady VBL’s margin had expanded by 760bp over CY12-19 to 20.3%, led by (a) improving
mix, and (b) operational efficiency (leading to PepsiCo extending its franchise
agreement with VBL). However, CY20 volumes were impacted due to the pan-India
lockdown with margins declining owing to the absence of operating leverage. The
temporary impact of COVID-19 has affected economies of scale but reduction in
resin and sugar prices and improvement in the product mix should mitigate some
margin risk for CY20. Margin would improve by 120bp to 21.5% over CY19-22E due
to operating leverage.
Exhibit 37: Expect 15% EBITDA CAGR over CY19-22E
Source: Company, MOFSL
Bottom-line to deliver 31% CAGR over CY19-22E VBL has recorded 36% PAT CAGR over the last 10 years. We expect this strong
growth trajectory to continue due to improved volumes and operating leverage. We
expect it to deliver 31% PAT CAGR over CY19-22E on the back of increasing
operating profit and lower interest cost.
Exhibit 38: Expect 31% PAT CAGR over CY19-22E
Source: Company, MOFSL
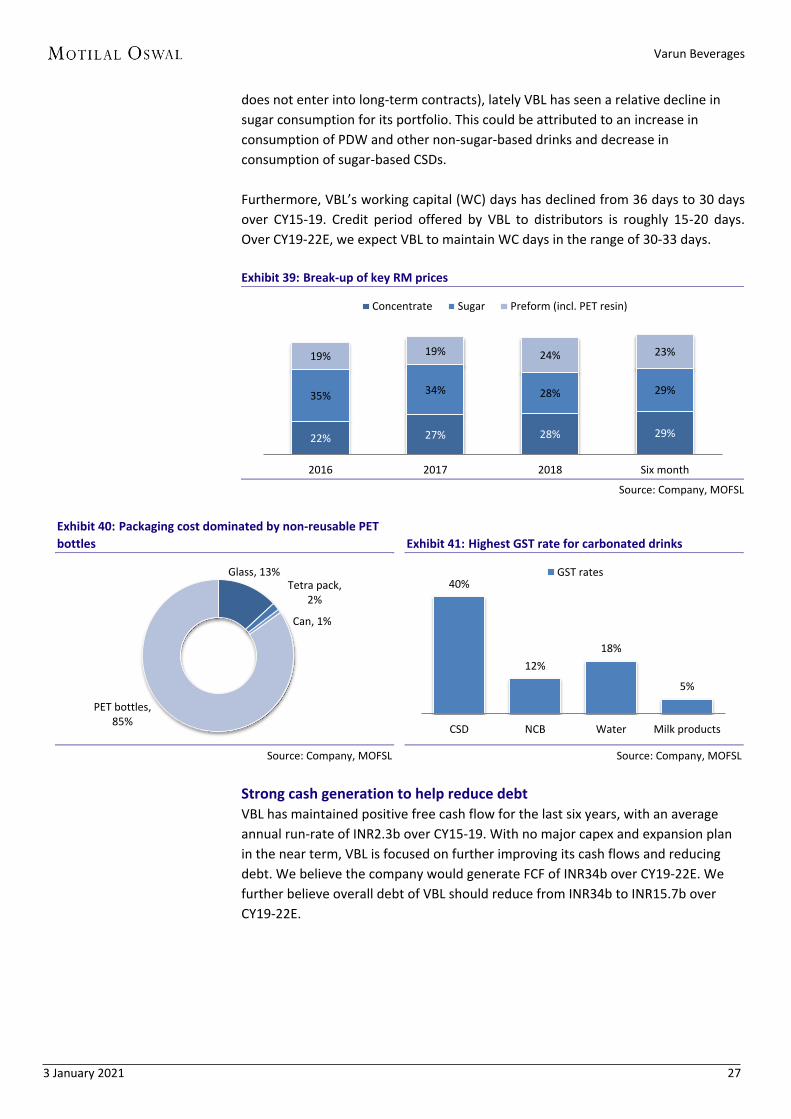
Raw material – lower susceptibility to change in sugar prices Concentrate and sugar constitute a significant chunk of VBL’s raw material (in the
range of 57-60%). PepsiCo is entitled to set terms and conditions with regards to the
purchase of concentrate from VBL. VBL has lower susceptibility to changes in
concentrate prices as the company is easily able to pass on the price increase to
distributors. Also, VBL procures sugar directly from sugar mills and wholesale
distributors. Although sharp movement in sugar prices does affect margins (as VBL
4 6 8 8 10 14 12 18 22
15.1
18.8 20.6 20.9
19.7 20.3 18.6
20.2 21.5
CY14 CY15 CY16 CY17 CY18 CY19 CY20E CY21E CY22E
EBITDA (INRb) EBITDA margin(%)
-269
1,130 424 2,102 2,928 4,690 3,808 6,868 10,456
-33%
-520%
-63%
396%
39% 60% -19%
80% 52%
CY14 CY15 CY16 CY17 CY18 CY19 CY20E CY21E CY22E
PAT (INRm) Growth YoY (%)
Varun Beverages
3 January 2021 27
does not enter into long-term contracts), lately VBL has seen a relative decline in
sugar consumption for its portfolio. This could be attributed to an increase in
consumption of PDW and other non-sugar-based drinks and decrease in
consumption of sugar-based CSDs.
Furthermore, VBL’s working capital (WC) days has declined from 36 days to 30 days
over CY15-19. Credit period offered by VBL to distributors is roughly 15-20 days.
Over CY19-22E, we expect VBL to maintain WC days in the range of 30-33 days.
Exhibit 39: Break-up of key RM prices
Source: Company, MOFSL
Exhibit 40: Packaging cost dominated by non-reusable PET
bottles
Source: Company, MOFSL
Exhibit 41: Highest GST rate for carbonated drinks
Source: Company, MOFSL
Strong cash generation to help reduce debt VBL has maintained positive free cash flow for the last six years, with an average
annual run-rate of INR2.3b over CY15-19. With no major capex and expansion plan
in the near term, VBL is focused on further improving its cash flows and reducing
debt. We believe the company would generate FCF of INR34b over CY19-22E. We
further believe overall debt of VBL should reduce from INR34b to INR15.7b over
CY19-22E.
22% 27% 28% 29%
35% 34% 28% 29%
19% 19% 24% 23%
2016 2017 2018 Six month
Concentrate Sugar Preform (incl. PET resin)
Glass, 13% Tetra pack,
2%
Can, 1%
PET bottles, 85%
40%
12%
18%
5%
CSD NCB Water Milk products
GST rates
Varun Beverages
3 January 2021 28
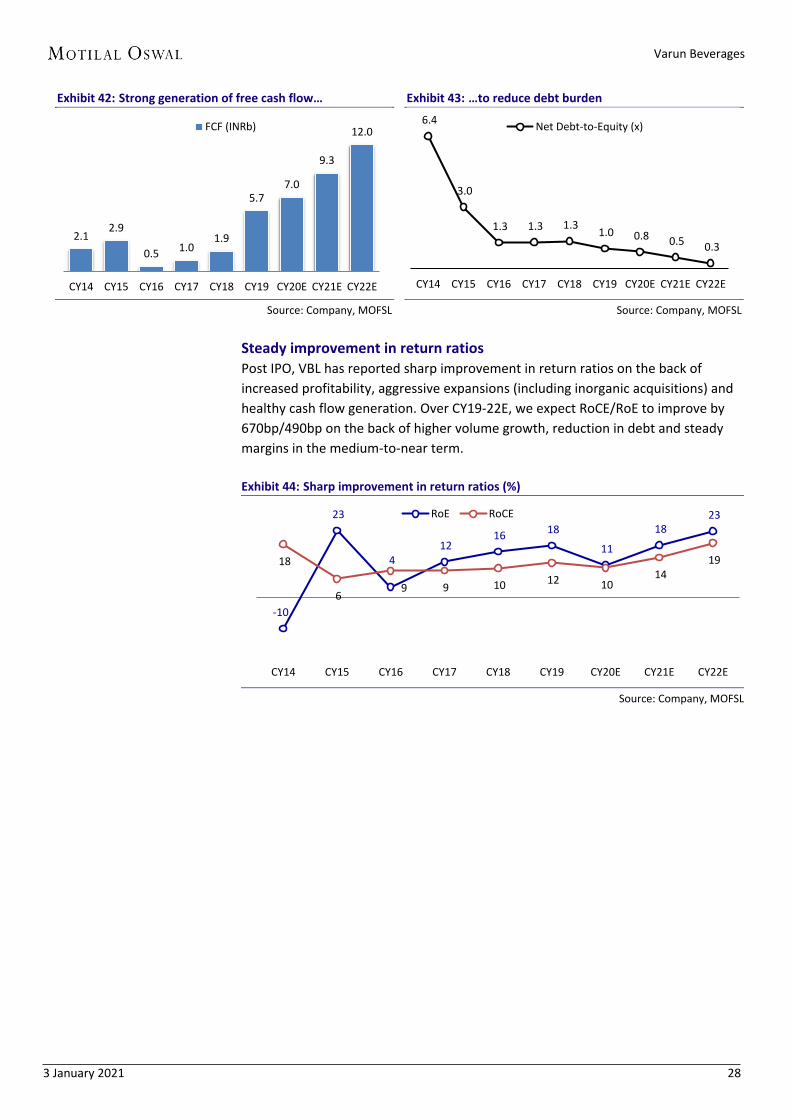
Exhibit 42: Strong generation of free cash flow…
Source: Company, MOFSL
Exhibit 43: …to reduce debt burden
Source: Company, MOFSL
Steady improvement in return ratios Post IPO, VBL has reported sharp improvement in return ratios on the back of
increased profitability, aggressive expansions (including inorganic acquisitions) and
healthy cash flow generation. Over CY19-22E, we expect RoCE/RoE to improve by
670bp/490bp on the back of higher volume growth, reduction in debt and steady
margins in the medium-to-near term.
Exhibit 44: Sharp improvement in return ratios (%)
Source: Company, MOFSL
2.1 2.9
0.5 1.0
1.9
5.7 7.0
9.3
12.0
CY14 CY15 CY16 CY17 CY18 CY19 CY20E CY21E CY22E
FCF (INRb) 6.4
3.0
1.3 1.3 1.3 1.0 0.8 0.5 0.3
CY14 CY15 CY16 CY17 CY18 CY19 CY20E CY21E CY22E
Net Debt-to-Equity (x)
-10
23
4 12
16 18
11
18 23
18
6 9 9 10 12 10
14 19
CY14 CY15 CY16 CY17 CY18 CY19 CY20E CY21E CY22E
RoE RoCE

Varun Beverages
3 January 2021 29
Valuation and view Initiating with Buy rating
VBL handles majority of PepsiCo’s India business and has strong distribution network.
Both these factors should help VBL gain incremental market share.
Improving product mix and introduction of new products should reduce concentration
risk and help diversify its product portfolio.
Rising electrification and increase in power availability (number of hours per day) is
expected to indirectly boost beverage sales.
Replication of existing model in newly acquired territories should lead to market share
gains and support volume growth.
We estimate 12%/31% revenue/PAT CAGR over CY19-22E. We value the stock on
price-to-earnings basis, assigning 30x CY22E EPS. We initiate Buy with a target price of
INR1,100 per share.
Near monopoly in PepsiCo’s India business VBL handles ~80%+ of PepsiCo’s India business, which provides it with volume
sustainability in the medium-to-long term. Further, its vast distribution network is
expected to increase penetration in newly acquired territories, support volume
growth and help gain market share.
Changing mix to reduce concentration Previously, VBL was heavily inclined toward manufacturing of CSDs. However, with
changing consumer preferences and to reduce concentration of a single product,
VBL has shifted focus toward manufacturing of NCBs and PDW. While this has
helped the company to diversify revenue and improve margin, we believe it would
also help to maintain steady margins in the medium-to-near term.
Increasing electrification to support VBL’s growth Several government initiatives to increase overall household electrification in India
is indirectly expected to boost VBL’s volumes. We believe increased power
availability (number of hours per day) in households would lead to higher
refrigeration penetration, which in turn would boost PepsiCo’s volumes as these
products are consumed chilled.
Operational efficiency to kick in with consolidation of new territories VBL completed acquisitions of several new territories in the last few years.
Operational efficiency in these new regions is expected to come on par with VBL’s
existing facilities, which would improve penetration level and lead to an increase in
market share. With no major acquisitions in the near term, we believe the
company’s prime focus is on improving volumes and penetration level.
Value VBL on price-to-earnings of 30x on CY22E EPS
We expect 12%/15% consolidated revenue/EBITDA CAGR over CY19-22E to
INR101b/INR21.8b. EBITDA margin is expected to expand by ~120bp to 21.5%. It
should generate CFO/FCF of INR53.8b/INR34b over the same period. Overall debt is
expected to reduce to INR15.7b from INR34b over CY19-22E. Based on future
growth potential and the return ratio profile, we value VBL at 30x (in-line with its
three-year average P/E of 32x) CY22E EPS of INR36.2 to arrive at a target price of
INR1,100. There is room for multiple improvement due to: a) ramp-up of operations
at its new facilities, b) kicking-in of synergy benefits (from the acquisition of new
territories), and c) growing revenue share from the higher margin NCB segment,
resulting in an improvement in return ratios. We initiate coverage with a Buy rating.
Varun Beverages
3 January 2021 30
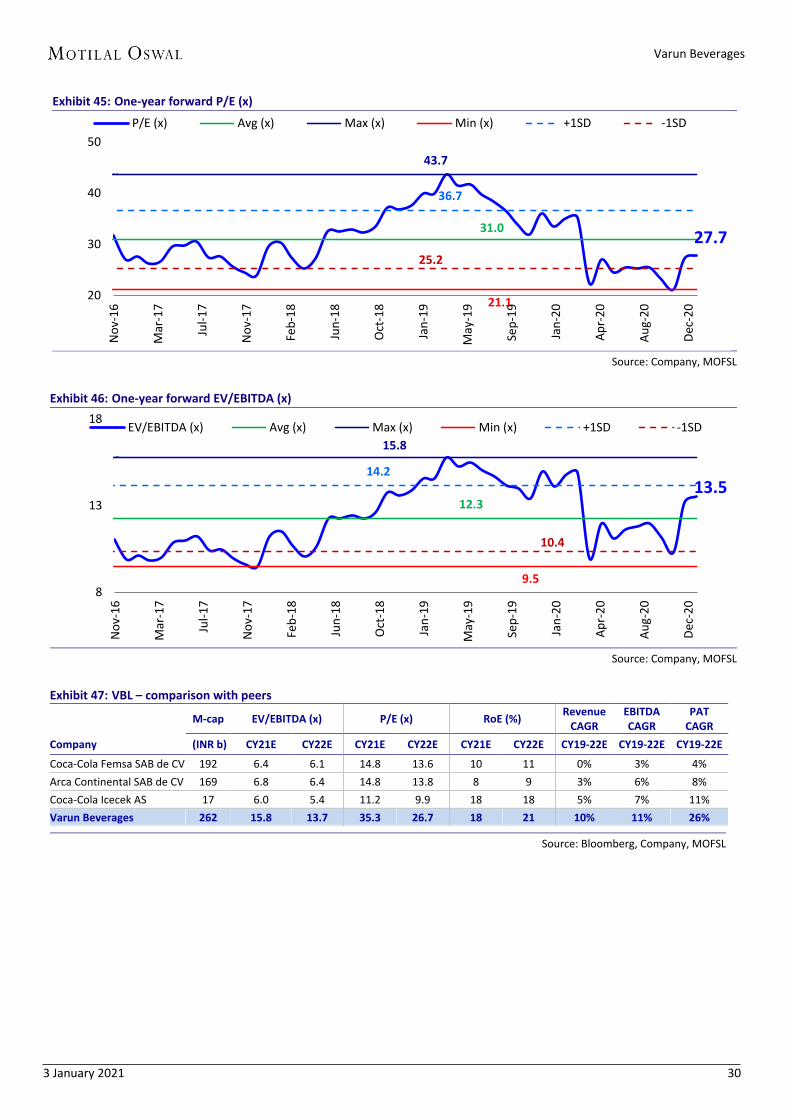
Exhibit 45: One-year forward P/E (x)
Source: Company, MOFSL
Exhibit 46: One-year forward EV/EBITDA (x)
Source: Company, MOFSL
Exhibit 47: VBL – comparison with peers
M-cap EV/EBITDA (x) P/E (x) RoE (%)
Revenue CAGR
EBITDA CAGR
PAT CAGR
Company (INR b) CY21E CY22E CY21E CY22E CY21E CY22E CY19-22E CY19-22E CY19-22E
Coca-Cola Femsa SAB de CV 192 6.4 6.1 14.8 13.6 10 11 0% 3% 4%
Arca Continental SAB de CV 169 6.8 6.4 14.8 13.8 8 9 3% 6% 8%
Coca-Cola Icecek AS 17 6.0 5.4 11.2 9.9 18 18 5% 7% 11%
Varun Beverages 262 15.8 13.7 35.3 26.7 18 21 10% 11% 26%
Source: Bloomberg, Company, MOFSL
27.7 31.0
43.7
21.1
36.7
25.2
20
30
40
50
No
v-1
6
Mar
-17
Jul-
17
No
v-1
7
Feb
-18
Jun
-18
Oct
-18
Jan
-19
May
-19
Sep
-19
Jan
-20
Ap
r-2
0
Au
g-2
0
Dec
-20
P/E (x) Avg (x) Max (x) Min (x) +1SD -1SD
13.5 12.3
15.8
9.5
14.2
10.4
8
13
18
No
v-16
Mar
-17
Jul-
17
No
v-1
7
Feb
-18
Jun
-18
Oct
-18
Jan
-19
May
-19
Sep
-19
Jan
-20
Ap
r-2
0
Au
g-2
0
Dec
-20
EV/EBITDA (x) Avg (x) Max (x) Min (x) +1SD -1SD
Varun Beverages
3 January 2021 31
Bulls and Bears
Bull case
In the bull case, we assume volume CAGR of 16% over CY19-22E. We assume
revenue CAGR of 15% (12% in base case), EBITDA CAGR of 17% (15% in base
case) and PAT CAGR of 36% (31% in base case) over CY19-22E.
For CSDs, we have factored in volume CAGR of 16% over CY19-22E v/s base case
assumption of 13%. We believe consolidation of new territories and rural
electrification would drive CSD volumes.
For NCBs, we have factored in volume CAGR of 17% over CY19-22E v/s base case
of 15%. We believe commencement of the new factory at Pathankot would
support volume growth and increase the share of NCBs.
For the water segment, we have factored in volume CAGR of 15% over CY19-22E
v/s base case assumption of 11%. International geographies are expected to
perform better.
Assuming a target multiple of 33x against 30x in the base case, we get a bull
case target price of INR1,345 (upside of 48%) as against base case target price of
INR1,100 (upside of 21%), based on CY22E EPS.
Bear case In the bear case, we assume volume CAGR of 10% over CY19-22E. We assume
revenue CAGR of 10% (12% in base case), EBITDA CAGR of 12% (15% in base
case) and PAT CAGR of 26% (31% in base case) over CY19-22E.
For CSDs, we have factored in volume CAGR of 11% over CY19-22E v/s base case
of 13%. We believe the COVID-19 impact would adversely affect CY20 volumes.
Further, momentum of government initiatives toward rural electrification is
expected to be slow.
For NCB’s, we have factored in volume CAGR of 12% over CY19-22E v/s base
case of 15%. We believe there is lower acceptance for juices, and thus, volumes
are weak even after commencement of the new plant.
For the water segment, we have factored in volume CAGR of 7% over CY19-22E
v/s base case assumption of 11%. We expect lower pick-up in volumes in foreign
geographies.
Assuming a target multiple of 27x against 30x in the base case, we get a bear
case target price of INR874 (downside of 4%) as against the base case target
price of INR1,100 (upside of 21%), based on CY22E EPS.
Exhibit 48: VBL – comparison with peers Bear Base Bull
CY20 CY21 CY22 CY20 CY21 CY22 CY20 CY21 CY22
Revenue (INR) 62,773 81,828 94,563 63,749 87,657 1,01,272 63,916 91,024 1,09,184
Growth YoY (%) -12 30 16 -11 38 16 -10 42 20
EBITDA (INR m) 11,671 16,496 20,361 11,853 17,671 21,805 11,884 18,350 23,509
EBITDA margin (%) 19 20 22 19 20 22 19 20 22
Adj. PAT (INR m) 3,866 6,338 9,590 3,808 6,868 10,456 3,839 7,377 11,762
Growth YoY (%) -18 64 51 -19 80 52 -18 92 59
EPS (INR) 13.2 21.5 32.4 13.2 23.8 36.2 13.3 25.6 40.7
Multiple (x)
27
30
33
TP (INR)
874
1,100
1,345
Return
-4%
21%
48%
Source: Company, MOFSL
Varun Beverages
3 January 2021 32
Key risks
Shift toward healthy consumption habits to impact growth of CSDs
Increasing awareness among the populace with respect to high sugar content in
CSDs is gradually leading to a reduction in its consumption, and thus, affecting
volumes. Changing preferences for healthier options would also affect CSD sales in
the long run.
Any change in contractual agreement with PepsiCo to impact overall biz
VBL’s entire business is solely dependent on its relationship with PepsiCo. While the
franchisee agreement was recently extended to 2039, any future changes in the
contractual agreement would have major repercussions on VBL’s business dynamics.
Any unforeseen scenario in peak season to impact earnings
The April-June quarter is the peak season for VBL, wherein majority of volumes are
recorded. This is due to the seasonality nature of its business as consumption
happens largely in May (summer season), which leads to an uneven annual revenue
distribution. Thus, an unforeseen event in the peak season would affect VBL’s
profitability (for e.g. due to the COVID-19 led lockdowns, 2QCY20 was adversely
impacted). However, with recent acquisitions, the seasonality factor should reduce
in the medium term.
Revenue concentration risk
Majority of VBL’s revenue (~71%) is recorded from sale of CSDs, followed by PWD
and NCBs. To reduce revenue concentration in a particular segment, management
plans to focus more on NCBs and PWD. Further, India’s contribution to the total
geographical revenue mix is also very high (~82% of revenue is recorded through
Indian operations). We believe that VBL is working on reducing revenue
concentration risk by changing the product-mix and focusing on global operations as
well. Thus, we expect concentration to subside in the medium-to-near term.
Further scope for domestic acquisitions lower
Currently, over 80% of PepsiCo’s India business is handled by VBL alone. Barring
Andhra Pradesh and Jammu & Kashmir, VBL operates in all Indian states. Thus, there
is meager room for inorganic growth within India. VBL would have to focus on
organic volume growth through increased penetration and market acquisition from
competitors.
Varun Beverages
3 January 2021 33
Management overview
Mr. Ravi Jaipuria, Chairman He has completed higher secondary education from Delhi Public School, New Delhi.
He has over three decades of experience in conceptualizing, executing, developing
and expanding food, beverages and dairy business in South Asia and Africa. He is the
only Indian promoter to have received PepsiCo’s award for ‘International Bottler of
the Year’, awarded in 1997. He was also awarded the ‘Distinguished
Entrepreneurship Award’ at the PHD Chamber Annual Awards for Excellence, 2018.
Mr. Varun Jaipuria, Whole-time Director He attended Millfield School, Somerset, England and holds a Bachelor’s degree in
International Business from Regent’s University, London. He has 11 years of
experience in the soft drinks industry and has also completed a program for
Leadership Development at the Harvard Business School. He has been with the
company since 2009 and has been responsible for development of new business
initiatives, which includes implementation of sales automation tools.
Mr. Kapil Agarwal, Whole-time Director and CEO He holds a Bachelor’s degree in Commerce from Lucknow University and has a Post-
Graduate Diploma in Business Management from IMT, Ghaziabad. He has been
associated with the company since inception and currently heads operations and
management. He has 28 years of experience with the group in sales and marketing.
Mr. Raj Gandhi, Whole-time Director and Group CFO He holds a Bachelor’s degree in Commerce from Delhi University and is a member of
the ICAI. He has 27 years of experience with the group out of a total experience of
39 years and has been instrumental in strategizing diversification, expansion,
mergers and acquisitions, capex funding and institutional relationships.
Mr. Rajinder Jeet Singh Bagga, Whole-time Director He holds a Master’s degree in Mechanical Engineering from IIT, Kanpur. He has been
associated with the company since 1996 and is currently heading technical
operations since 2003. He has an experience of 23 years with the company in
managing technical operations and execution of projects. Prior to this, he was
associated with Eveready Industries India Limited for approximately 10 years and
was last working in the capacity of their Production Manager.
Mr. Vikas Bhatia, CFO Mr. Bhatia is a Commerce graduate and a qualified FCA and ICWA with a diversified
FMCG career spanning 30 years, including 16 years of international assignments
with large MNCs. Before joining VBL, he was working with Carlsberg Group for six
years. Prior to this, Mr. Bhatia has worked with MNCs such as Whirlpool, P&G,
Gillette, PwC, etc. in India and overseas. He joined VBL in Jan’19.
Varun Beverages
3 January 2021 34
Financials and valuations
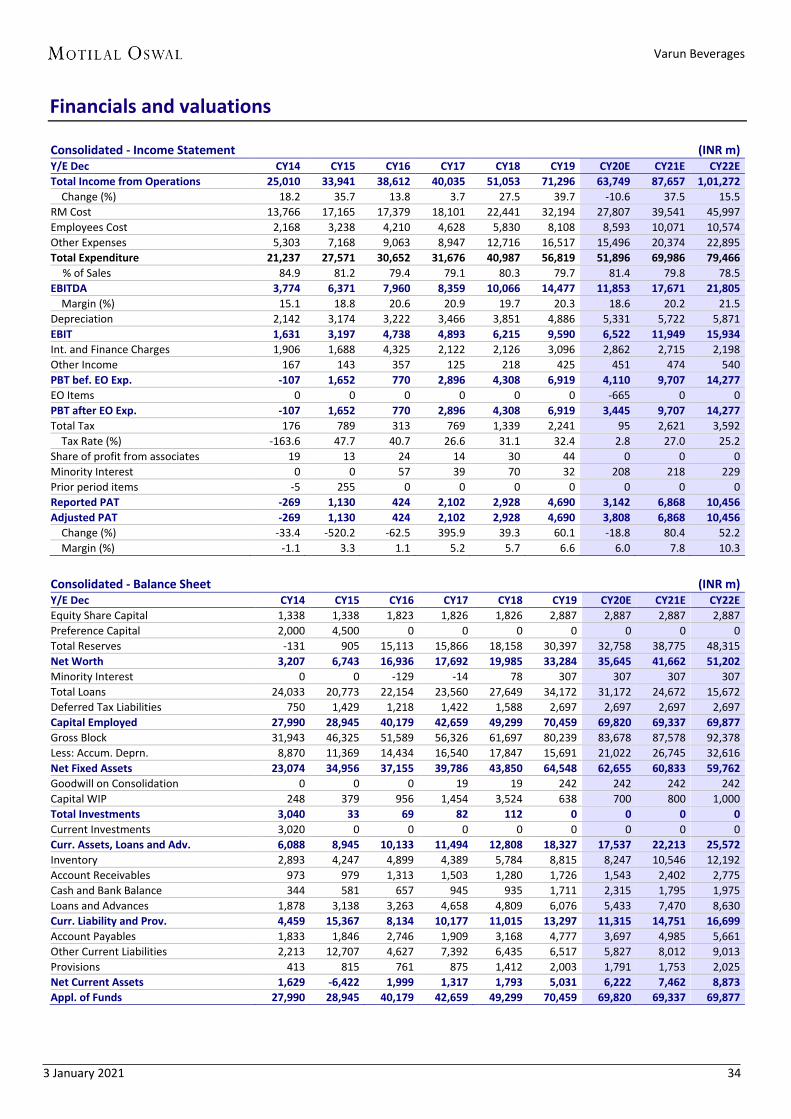
Consolidated - Income Statement (INR m) Y/E Dec CY14 CY15 CY16 CY17 CY18 CY19 CY20E CY21E CY22E
Total Income from Operations 25,010 33,941 38,612 40,035 51,053 71,296 63,749 87,657 1,01,272
Change (%) 18.2 35.7 13.8 3.7 27.5 39.7 -10.6 37.5 15.5
RM Cost 13,766 17,165 17,379 18,101 22,441 32,194 27,807 39,541 45,997
Employees Cost 2,168 3,238 4,210 4,628 5,830 8,108 8,593 10,071 10,574
Other Expenses 5,303 7,168 9,063 8,947 12,716 16,517 15,496 20,374 22,895
Total Expenditure 21,237 27,571 30,652 31,676 40,987 56,819 51,896 69,986 79,466
% of Sales 84.9 81.2 79.4 79.1 80.3 79.7 81.4 79.8 78.5
EBITDA 3,774 6,371 7,960 8,359 10,066 14,477 11,853 17,671 21,805
Margin (%) 15.1 18.8 20.6 20.9 19.7 20.3 18.6 20.2 21.5
Depreciation 2,142 3,174 3,222 3,466 3,851 4,886 5,331 5,722 5,871
EBIT 1,631 3,197 4,738 4,893 6,215 9,590 6,522 11,949 15,934
Int. and Finance Charges 1,906 1,688 4,325 2,122 2,126 3,096 2,862 2,715 2,198
Other Income 167 143 357 125 218 425 451 474 540
PBT bef. EO Exp. -107 1,652 770 2,896 4,308 6,919 4,110 9,707 14,277
EO Items 0 0 0 0 0 0 -665 0 0
PBT after EO Exp. -107 1,652 770 2,896 4,308 6,919 3,445 9,707 14,277
Total Tax 176 789 313 769 1,339 2,241 95 2,621 3,592
Tax Rate (%) -163.6 47.7 40.7 26.6 31.1 32.4 2.8 27.0 25.2
Share of profit from associates 19 13 24 14 30 44 0 0 0
Minority Interest 0 0 57 39 70 32 208 218 229
Prior period items -5 255 0 0 0 0 0 0 0
Reported PAT -269 1,130 424 2,102 2,928 4,690 3,142 6,868 10,456
Adjusted PAT -269 1,130 424 2,102 2,928 4,690 3,808 6,868 10,456
Change (%) -33.4 -520.2 -62.5 395.9 39.3 60.1 -18.8 80.4 52.2
Margin (%) -1.1 3.3 1.1 5.2 5.7 6.6 6.0 7.8 10.3
Consolidated - Balance Sheet (INR m) Y/E Dec CY14 CY15 CY16 CY17 CY18 CY19 CY20E CY21E CY22E
Equity Share Capital 1,338 1,338 1,823 1,826 1,826 2,887 2,887 2,887 2,887
Preference Capital 2,000 4,500 0 0 0 0 0 0 0
Total Reserves -131 905 15,113 15,866 18,158 30,397 32,758 38,775 48,315
Net Worth 3,207 6,743 16,936 17,692 19,985 33,284 35,645 41,662 51,202
Minority Interest 0 0 -129 -14 78 307 307 307 307
Total Loans 24,033 20,773 22,154 23,560 27,649 34,172 31,172 24,672 15,672
Deferred Tax Liabilities 750 1,429 1,218 1,422 1,588 2,697 2,697 2,697 2,697
Capital Employed 27,990 28,945 40,179 42,659 49,299 70,459 69,820 69,337 69,877
Gross Block 31,943 46,325 51,589 56,326 61,697 80,239 83,678 87,578 92,378
Less: Accum. Deprn. 8,870 11,369 14,434 16,540 17,847 15,691 21,022 26,745 32,616
Net Fixed Assets 23,074 34,956 37,155 39,786 43,850 64,548 62,655 60,833 59,762
Goodwill on Consolidation 0 0 0 19 19 242 242 242 242
Capital WIP 248 379 956 1,454 3,524 638 700 800 1,000
Total Investments 3,040 33 69 82 112 0 0 0 0
Current Investments 3,020 0 0 0 0 0 0 0 0
Curr. Assets, Loans and Adv. 6,088 8,945 10,133 11,494 12,808 18,327 17,537 22,213 25,572
Inventory 2,893 4,247 4,899 4,389 5,784 8,815 8,247 10,546 12,192
Account Receivables 973 979 1,313 1,503 1,280 1,726 1,543 2,402 2,775
Cash and Bank Balance 344 581 657 945 935 1,711 2,315 1,795 1,975
Loans and Advances 1,878 3,138 3,263 4,658 4,809 6,076 5,433 7,470 8,630
Curr. Liability and Prov. 4,459 15,367 8,134 10,177 11,015 13,297 11,315 14,751 16,699
Account Payables 1,833 1,846 2,746 1,909 3,168 4,777 3,697 4,985 5,661
Other Current Liabilities 2,213 12,707 4,627 7,392 6,435 6,517 5,827 8,012 9,013
Provisions 413 815 761 875 1,412 2,003 1,791 1,753 2,025
Net Current Assets 1,629 -6,422 1,999 1,317 1,793 5,031 6,222 7,462 8,873
Appl. of Funds 27,990 28,945 40,179 42,659 49,299 70,459 69,820 69,337 69,877
Varun Beverages
3 January 2021 35
Financials and valuations
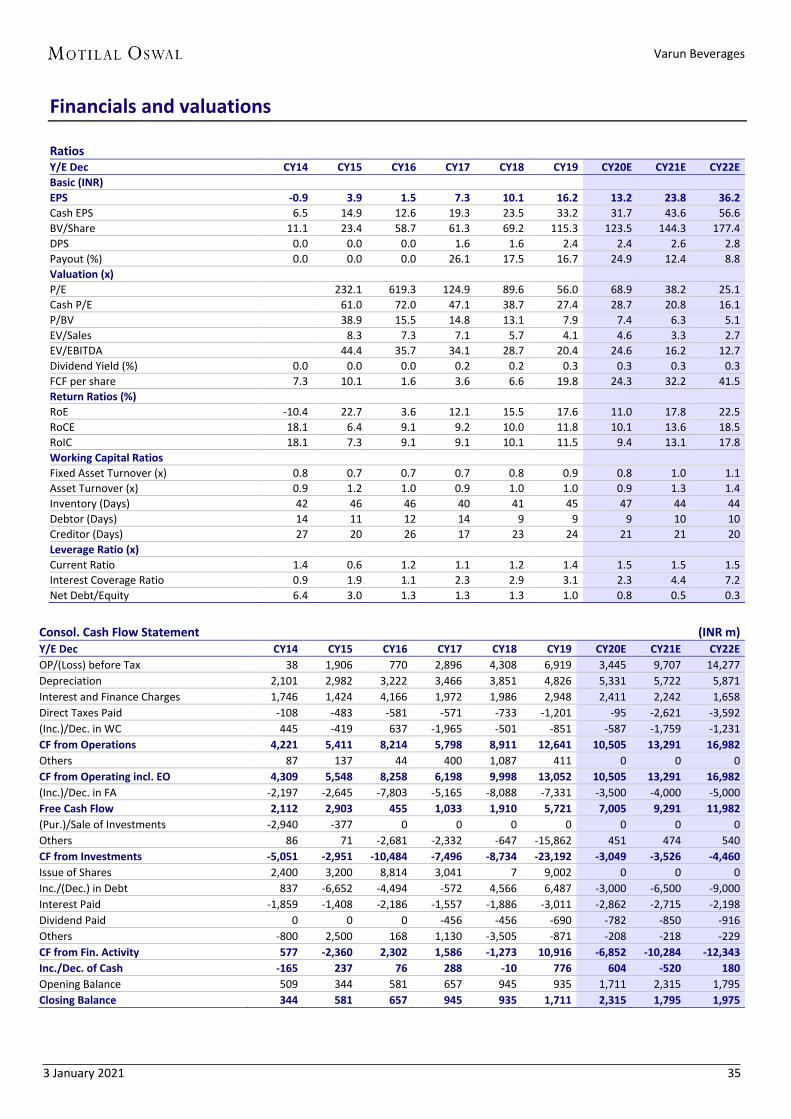
Ratios
Y/E Dec CY14 CY15 CY16 CY17 CY18 CY19 CY20E CY21E CY22E
Basic (INR)
EPS -0.9 3.9 1.5 7.3 10.1 16.2 13.2 23.8 36.2
Cash EPS 6.5 14.9 12.6 19.3 23.5 33.2 31.7 43.6 56.6
BV/Share 11.1 23.4 58.7 61.3 69.2 115.3 123.5 144.3 177.4
DPS 0.0 0.0 0.0 1.6 1.6 2.4 2.4 2.6 2.8
Payout (%) 0.0 0.0 0.0 26.1 17.5 16.7 24.9 12.4 8.8
Valuation (x)
P/E 232.1 619.3 124.9 89.6 56.0 68.9 38.2 25.1
Cash P/E 61.0 72.0 47.1 38.7 27.4 28.7 20.8 16.1
P/BV 38.9 15.5 14.8 13.1 7.9 7.4 6.3 5.1
EV/Sales 8.3 7.3 7.1 5.7 4.1 4.6 3.3 2.7
EV/EBITDA 44.4 35.7 34.1 28.7 20.4 24.6 16.2 12.7
Dividend Yield (%) 0.0 0.0 0.0 0.2 0.2 0.3 0.3 0.3 0.3
FCF per share 7.3 10.1 1.6 3.6 6.6 19.8 24.3 32.2 41.5
Return Ratios (%)
RoE -10.4 22.7 3.6 12.1 15.5 17.6 11.0 17.8 22.5
RoCE 18.1 6.4 9.1 9.2 10.0 11.8 10.1 13.6 18.5
RoIC 18.1 7.3 9.1 9.1 10.1 11.5 9.4 13.1 17.8
Working Capital Ratios
Fixed Asset Turnover (x) 0.8 0.7 0.7 0.7 0.8 0.9 0.8 1.0 1.1
Asset Turnover (x) 0.9 1.2 1.0 0.9 1.0 1.0 0.9 1.3 1.4
Inventory (Days) 42 46 46 40 41 45 47 44 44
Debtor (Days) 14 11 12 14 9 9 9 10 10
Creditor (Days) 27 20 26 17 23 24 21 21 20
Leverage Ratio (x)
Current Ratio 1.4 0.6 1.2 1.1 1.2 1.4 1.5 1.5 1.5
Interest Coverage Ratio 0.9 1.9 1.1 2.3 2.9 3.1 2.3 4.4 7.2
Net Debt/Equity 6.4 3.0 1.3 1.3 1.3 1.0 0.8 0.5 0.3
Consol. Cash Flow Statement (INR m) Y/E Dec CY14 CY15 CY16 CY17 CY18 CY19 CY20E CY21E CY22E
OP/(Loss) before Tax 38 1,906 770 2,896 4,308 6,919 3,445 9,707 14,277
Depreciation 2,101 2,982 3,222 3,466 3,851 4,826 5,331 5,722 5,871
Interest and Finance Charges 1,746 1,424 4,166 1,972 1,986 2,948 2,411 2,242 1,658
Direct Taxes Paid -108 -483 -581 -571 -733 -1,201 -95 -2,621 -3,592
(Inc.)/Dec. in WC 445 -419 637 -1,965 -501 -851 -587 -1,759 -1,231
CF from Operations 4,221 5,411 8,214 5,798 8,911 12,641 10,505 13,291 16,982
Others 87 137 44 400 1,087 411 0 0 0
CF from Operating incl. EO 4,309 5,548 8,258 6,198 9,998 13,052 10,505 13,291 16,982
(Inc.)/Dec. in FA -2,197 -2,645 -7,803 -5,165 -8,088 -7,331 -3,500 -4,000 -5,000
Free Cash Flow 2,112 2,903 455 1,033 1,910 5,721 7,005 9,291 11,982
(Pur.)/Sale of Investments -2,940 -377 0 0 0 0 0 0 0
Others 86 71 -2,681 -2,332 -647 -15,862 451 474 540
CF from Investments -5,051 -2,951 -10,484 -7,496 -8,734 -23,192 -3,049 -3,526 -4,460
Issue of Shares 2,400 3,200 8,814 3,041 7 9,002 0 0 0
Inc./(Dec.) in Debt 837 -6,652 -4,494 -572 4,566 6,487 -3,000 -6,500 -9,000
Interest Paid -1,859 -1,408 -2,186 -1,557 -1,886 -3,011 -2,862 -2,715 -2,198
Dividend Paid 0 0 0 -456 -456 -690 -782 -850 -916
Others -800 2,500 168 1,130 -3,505 -871 -208 -218 -229
CF from Fin. Activity 577 -2,360 2,302 1,586 -1,273 10,916 -6,852 -10,284 -12,343
Inc./Dec. of Cash -165 237 76 288 -10 776 604 -520 180
Opening Balance 509 344 581 657 945 935 1,711 2,315 1,795
Closing Balance 344 581 657 945 935 1,711 2,315 1,795 1,975
Varun Beverages
3 January 2021 36
RECENT INITIATING COVERAGE REPORTS
REPORT GALLERY
Varun Beverages
3 January 2021 37
Explanation of Investment Rating
Investment Rating Expected return (over 12-month)
BUY >=15%
SELL < - 10%
NEUTRAL < - 10 % to 15%
UNDER REVIEW Rating may undergo a change
NOT RATED We have forward looking estimates for the stock but we refrain from assigning recommendation
*In case the recommendation given by the Research Analyst is inconsistent with the investment rating legend for a continuous period of 30 days, the Research Analyst shall within following 30 days take appropriate measures to make the recommendation consistent with the investment rating legend. Disclosures The following Disclosures are being made in compliance with the SEBI Research Analyst Regulations 2014 (herein after referred to as the Regulations). Motilal Oswal Financial Services Ltd. (MOFSL) is a SEBI Registered Research Analyst having registration no. INH000000412. MOFSL, the Research Entity (RE) as defined in the Regulations, is engaged in the business of providing Stock broking services, Investment Advisory Services, Depository participant services & distribution of various financial products. MOFSL is a subsidiary company of Passionate Investment Management Pvt. Ltd.. (PIMPL). MOFSL is a listed public company, the details in respect of which are available on www.motilaloswal.com. MOFSL (erstwhile Motilal Oswal Securities Limited - MOSL) is registered with the Securities & Exchange Board of India (SEBI) and is a registered Trading Member with National Stock Exchange of India Ltd. (NSE) and Bombay Stock Exchange Limited (BSE), Multi Commodity Exchange of India Limited (MCX) and National Commodity & Derivatives Exchange Limited (NCDEX) for its stock broking activities & is Depository participant with Central Depository Services Limited (CDSL) National Securities Depository Limited (NSDL),NERL, COMRIS and CCRL and is member of Association of Mutual Funds of India (AMFI) for distribution of financial products and Insurance Regulatory & Development Authority of India (IRDA) as Corporate Agent for insurance products. Details of associate entities of Motilal Oswal Financial Services Limited are available on the website at http://onlinereports.motilaloswal.com/Dormant/documents/List%20of%20Associate%20companies.pdf MOFSL and its associate company(ies), their directors and Research Analyst and their relatives may; (a) from time to time, have a long or short position in, act as principal in, and buy or sell the securities or derivatives thereof of companies mentioned herein. (b) be engaged in any other transaction involving such securities and earn brokerage or other compensation or act as a market maker in the financial instruments of the company(ies) discussed herein or act as an advisor or lender/borrower to such company(ies) or may have any other potential conflict of interests with respect to any recommendation and other related information and opinions.; however the same shall have no bearing whatsoever on the specific recommendations made by the analyst(s), as the recommendations made by the analyst(s) are completely independent of the views of the associates of MOFSL even though there might exist an inherent conflict of interest in some of the stocks mentioned in the research report MOFSL and / or its affiliates do and seek to do business including investment banking with companies covered in its research reports. As a result, the recipients of this report should be aware that MOFSL may have a potential conflict of interest that may affect the objectivity of this report. Compensation of Research Analysts is not based on any specific merchant banking, investment banking or brokerage service transactions. Details of pending Enquiry Proceedings of Motilal Oswal Financial Services Limited are available on the website at https://galaxy.motilaloswal.com/ResearchAnalyst/PublishViewLitigation.aspx A graph of daily closing prices of securities is available at www.nseindia.com, www.bseindia.com. Research Analyst views on Subject Company may vary based on Fundamental research and Technical Research. Proprietary trading desk of MOFSL or its associates maintains arm’s length distance with Research Team as all the activities are segregated from MOFSL research activity and therefore it can have an independent view with regards to Subject Company for which Research Team have expressed their views. Regional Disclosures (outside India) This report is not directed or intended for distribution to or use by any person or entity resident in a state, country or any jurisdiction, where such distribution, publication, availability or use would be contrary to law, regulation or which would subject MOFSL & its group companies to registration or licensing requirements within such jurisdictions. For Hong Kong: This report is distributed in Hong Kong by Motilal Oswal capital Markets (Hong Kong) Private Limited, a licensed corporation (CE AYY-301) licensed and regulated by the Hong Kong Securities and Futures Commission (SFC) pursuant to the Securities and Futures Ordinance (Chapter 571 of the Laws of Hong Kong) “SFO”. As per SEBI (Research Analyst Regulations) 2014 Motilal Oswal Securities (SEBI Reg No. INH000000412) has an agreement with Motilal Oswal capital Markets (Hong Kong) Private Limited for distribution of research report in Hong Kong. This report is intended for distribution only to “Professional Investors” as defined in Part I of Schedule 1 to SFO. Any investment or investment activity to which this document relates is only available to professional investor and will be engaged only with professional investors.” Nothing here is an offer or solicitation of these securities, products and services in any jurisdiction where their offer or sale is not qualified or exempt from registration. The Indian Analyst(s) who compile this report is/are not located in Hong Kong & are not conducting Research Analysis in Hong Kong. For U.S. Motilal Oswal Financial Services Limited (MOFSL) is not a registered broker - dealer under the U.S. Securities Exchange Act of 1934, as amended (the"1934 act") and under applicable state laws in the United States. In addition MOFSL is not a registered investment adviser under the U.S. Investment Advisers Act of 1940, as amended (the "Advisers Act" and together with the 1934 Act, the "Acts), and under applicable state laws in the United States. Accordingly, in the absence of specific exemption under the Acts, any brokerage and investment services provided by MOFSL , including the products and services described herein are not available to or intended for U.S. persons. This report is intended for distribution only to "Major Institutional Investors" as defined by Rule 15a-6(b)(4) of the Exchange Act and interpretations thereof by SEC (henceforth referred to as "major institutional investors"). This document must not be acted on or relied on by persons who are not major institutional investors. Any investment or investment activity to which this document relates is only available to major institutional investors and will be engaged in only with major institutional investors. In reliance on the exemption from registration provided by Rule 15a-6 of the U.S. Securities Exchange Act of 1934, as amended (the "Exchange Act") and interpretations thereof by the U.S. Securities and Exchange Commission ("SEC") in order to conduct business with Institutional Investors based in the U.S., MOFSL has entered into a chaperoning agreement with a U.S. registered broker-dealer, Motilal Oswal Securities International Private Limited. ("MOSIPL"). Any business interaction pursuant to this report will have to be executed within the provisions of this chaperoning agreement. The Research Analysts contributing to the report may not be registered /qualified as research analyst with FINRA. Such research analyst may not be associated persons of the U.S. registered broker-dealer, MOSIPL, and therefore, may not be subject to NASD rule 2711 and NYSE Rule 472 restrictions on communication with a subject company, public appearances and trading securities held by a research analyst account. For Singapore In Singapore, this report is being distributed by Motilal Oswal Capital Markets Singapore Pte Ltd (“MOCMSPL”) (Co.Reg. NO. 201129401Z) which is a holder of a capital markets services license and an exempt financial adviser in Singapore.As per the approved agreement under Paragraph 9 of Third Schedule of Securities and Futures Act (CAP 289) and Paragraph 11 of First Schedule of Financial Advisors Act (CAP 110) provided to MOCMSPL by Monetary Authority of Singapore. Persons in Singapore should contact MOCMSPL in respect of any matter arising from, or in connection with this report/publication/communication. This report is distributed solely to persons who qualify as “Institutional Investors”, of which some of whom may consist of "accredited" institutional investors as defined in section 4A(1) of the Securities and Futures Act, Chapter 289 of Singapore (“the SFA”). Accordingly, if a Singapore person is not or ceases to be such an institutional investor, such Singapore Person must immediately discontinue any use of this Report and inform MOCMSPL. Specific Disclosures 1 MOFSL, Research Analyst and/or his relatives does not have financial interest in the subject company, as they do not have equity holdings in the subject company. 2 MOFSL, Research Analyst and/or his relatives do not have actual/beneficial ownership of 1% or more securities in the subject company 3 MOFSL, Research Analyst and/or his relatives have not received compensation/other benefits from the subject company in the past 12 months 4 MOFSL, Research Analyst and/or his relatives do not have material conflict of interest in the subject company at the time of publication of research report 5 Research Analyst has not served as director/officer/employee in the subject company 6 MOFSL has not acted as a manager or co-manager of public offering of securities of the subject company in past 12 months 7 MOFSL has not received compensation for investment banking/ merchant banking/brokerage services from the subject company in the past 12 months 8 MOFSL has not received compensation for other than investment banking/merchant banking/brokerage services from the subject company in the past 12 months 9 MOFSL has not received any compensation or other benefits from third party in connection with the research report 10 MOFSL has not engaged in market making activity for the subject company ******************************************************************************************************************************** The associates of MOFSL may have: - financial interest in the subject company - actual/beneficial ownership of 1% or more securities in the subject company - received compensation/other benefits from the subject company in the past 12 months
Varun Beverages
3 January 2021 38
- other potential conflict of interests with respect to any recommendation and other related information and opinions.; however the same shall have no bearing whatsoever on the specific recommendations made by the analyst(s), as the recommendations made by the analyst(s) are completely independent of the views of the associates of MOFSL even though there might exist an inherent conflict of interest in some of the stocks mentioned in the research report.
- acted as a manager or co-manager of public offering of securities of the subject company in past 12 months - be engaged in any other transaction involving such securities and earn brokerage or other compensation or act as a market maker in the financial instruments of the company(ies)
discussed herein or act as an advisor or lender/borrower to such company(ies) - received compensation from the subject company in the past 12 months for investment banking / merchant banking / brokerage services or from other than said services.
The associates of MOFSL has not received any compensation or other benefits from third party in connection with the research report Above disclosures include beneficial holdings lying in demat account of MOFSL which are opened for proprietary investments only. While calculating beneficial holdings, It does not consider demat accounts which are opened in name of MOFSL for other purposes (i.e holding client securities, collaterals, error trades etc.). MOFSL also earns DP income from clients which are not considered in above disclosures. Analyst Certification The views expressed in this research report accurately reflect the personal views of the analyst(s) about the subject securities or issues, and no part of the compensation of the research analyst(s) was, is, or will be directly or indirectly related to the specific recommendations and views expressed by research analyst(s) in this report. Terms & Conditions: This report has been prepared by MOFSL and is meant for sole use by the recipient and not for circulation. The report and information contained herein is strictly confidential and may not be altered in any way, transmitted to, copied or distributed, in part or in whole, to any other person or to the media or reproduced in any form, without prior written consent of MOFSL. The report is based on the facts, figures and information that are considered true, correct, reliable and accurate. The intent of this report is not recommendatory in nature. The information is obtained from publicly available media or other sources believed to be reliable. Such information has not been independently verified and no guaranty, representation of warranty, express or implied, is made as to its accuracy, completeness or correctness. All such information and opinions are subject to change without notice. The report is prepared solely for informational purpose and does not constitute an offer document or solicitation of offer to buy or sell or subscribe for securities or other financial instruments for the clients. Though disseminated to all the customers simultaneously, not all customers may receive this report at the same time. MOFSL will not treat recipients as customers by virtue of their receiving this report. Disclaimer: The report and information contained herein is strictly confidential and meant solely for the selected recipient and may not be altered in any way, transmitted to, copied or distributed, in part or in whole, to any other person or to the media or reproduced in any form, without prior written consent. This report and information herein is solely for informational purpose and may not be used or considered as an offer document or solicitation of offer to buy or sell or subscribe for securities or other financial instruments. Nothing in this report constitutes investment, legal, accounting and tax advice or a representation that any investment or strategy is suitable or appropriate to your specific circumstances. The securities discussed and opinions expressed in this report may not be suitable for all investors, who must make their own investment decisions, based on their own investment objectives, financial positions and needs of specific recipient. This may not be taken in substitution for the exercise of independent judgment by any recipient. Each recipient of this document should make such investigations as it deems necessary to arrive at an independent evaluation of an investment in the securities of companies referred to in this document (including the merits and risks involved), and should consult its own advisors to determine the merits and risks of such an investment. The investment discussed or views expressed may not be suitable for all investors. Certain transactions -including those involving futures, options, another derivative products as well as non-investment grade securities - involve substantial risk and are not suitable for all investors. No representation or warranty, express or implied, is made as to the accuracy, completeness or fairness of the information and opinions contained in this document. The Disclosures of Interest Statement incorporated in this document is provided solely to enhance the transparency and should not be treated as endorsement of the views expressed in the report. This information is subject to change without any prior notice. The Company reserves the right to make modifications and alternations to this statement as may be required from time to time without any prior approval. MOFSL, its associates, their directors and the employees may from time to time, effect or have effected an own account transaction in, or deal as principal or agent in or for the securities mentioned in this document. They may perform or seek to perform investment banking or other services for, or solicit investment banking or other business from, any company referred to in this report. Each of these entities functions as a separate, distinct and independent of each other. The recipient should take this into account before interpreting the document. This report has been prepared on the basis of information that is already available in publicly accessible media or developed through analysis of MOFSL. The views expressed are those of the analyst, and the Company may or may not subscribe to all the views expressed therein. This document is being supplied to you solely for your information and may not be reproduced, redistributed or passed on, directly or indirectly, to any other person or published, copied, in whole or in part, for any purpose. This report is not directed or intended for distribution to, or use by, any person or entity who is a citizen or resident of or located in any locality, state, country or other jurisdiction, where such distribution, publication, availability or use would be contrary to law, regulation or which would subject MOFSL to any registration or licensing requirement within such jurisdiction. The securities described herein may or may not be eligible for sale in all jurisdictions or to certain category of investors. Persons in whose possession this document may come are required to inform themselves of and to observe such restriction. Neither the Firm, not its directors, employees, agents or representatives shall be liable for any damages whether direct or indirect, incidental, special or consequential including lost revenue or lost profits that may arise from or in connection with the use of the information. The person accessing this information specifically agrees to exempt MOFSL or any of its affiliates or employees from, any and all responsibility/liability arising from such misuse and agrees not to hold MOFSL or any of its affiliates or employees responsible for any such misuse and further agrees to hold MOFSL or any of its affiliates or employees free and harmless from all losses, costs, damages, expenses that may be suffered by the person accessing this information due to any errors and delays. Registered Office Address: Motilal Oswal Tower, Rahimtullah Sayani Road, Opposite Parel ST Depot, Prabhadevi, Mumbai-400025; Tel No.: 022 71934200/ 022-71934263; Website www.motilaloswal.com.CIN no.: L67190MH2005PLC153397.Correspondence Office Address: Palm Spring Centre, 2nd Floor, Palm Court Complex, New Link Road, Malad(West), Mumbai- 400 064. Tel No: 022 7188 1000. Registration Nos.: Motilal Oswal Financial Services Limited (MOFSL)*: INZ000158836(BSE/NSE/MCX/NCDEX); CDSL and NSDL: IN-DP-16-2015; Research Analyst: INH000000412. AMFI: ARN - 146822; Investment Adviser: INA000007100; Insurance Corporate Agent: CA0579;PMS:INP000006712. Motilal Oswal Asset Management Company Ltd. (MOAMC): PMS (Registration No.: INP000000670); PMS and Mutual Funds are offered through MOAMC which is group company of MOFSL. Motilal Oswal Wealth Management Ltd. (MOWML): PMS (Registration No.: INP000004409) is offered through MOWML, which is a group company of MOFSL. Motilal Oswal Financial Services Limited is a distributor of Mutual Funds, PMS, Fixed Deposit, Bond, NCDs,Insurance Products and IPOs.Real Estate is offered through Motilal Oswal Real Estate Investment Advisors II Pvt. Ltd. which is a group company of MOFSL. Private Equity is offered through Motilal Oswal Private Equity Investment Advisors Pvt. Ltd which is a group company of MOFSL. Research & Advisory services is backed by proper research. Please read the Risk Disclosure Document prescribed by the Stock Exchanges carefully before investing. There is no assurance or guarantee of the returns. Investment in securities market is subject to market risk, read all the related documents carefully before investing. Details of Compliance Officer: Name: Neeraj Agarwal, Email ID: [email protected], Contact No.:022-71881085. * MOSL has been amalgamated with Motilal Oswal Financial Services Limited (MOFSL) w.e.f August 21, 2018 pursuant to order dated July 30, 2018 issued by Hon'ble National Company Law Tribunal, Mumbai Bench.
Related Documents