WINNING PORTFOLIOS POWERED BY KNOWLEDGE ISSUE 12 | April 2022 1 ‘Lallapalooza Effect’

Welcome message from author
This document is posted to help you gain knowledge. Please leave a comment to let me know what you think about it! Share it to your friends and learn new things together.
Transcript

WINNING PORTFOLIOS
POWERED BY KNOWLEDGE
ISSUE 12 | April 20221
‘Lallapalooza Effect’
Our company name has changed to Motilal Oswal Wealth Ltd formerly known as Motilal Oswal Wealth Management Ltd.
APRIL 2022 | ISSUE 112 2
This document is not valid without disclosure; refer the last page for the disclosure
Readers Speaks ...………………………………………………………………........................................….….........03
Executive Summary………………………………………………………………........................................….…......04
Asset Class Performance ......…....................................................................................................05
Long Term Investing............….................................................................................................06-07
Section I……………………………………………………………….......................................................……….. -08 19
(Market through Graphs Portfolios Commentary, Temperature Gauge, Risk Return Matrix Investment, ,
Grid Our Recommendations,, DELPHI)
S 2 34ection II…………………………………………………….......................................................….……………... 0-
( , , , )Macro Economy Equities Fixed Income Gold
Section III…………………………………………………….........................................................….….……….35 44-
( , ,Advisory Approach 4C Framework For Equity Managers Fixed Income Manager Selection
Framework Hind-sight Investing Decoding Investment Style Investment Charter Sample Investment, , , ,
Charter, Estate Planning
Section VI…………………………………………………….........................................................…….….……. 5-694
( , , )Managed Strategies - PMS Managed Strategies - MF Investment Charter Template
Alpha Strategist | ‘Lollapalooza Effect’
Contents
Alpha Strategist | ‘Lollapalooza Effect’
Readers Speak
APRIL 2022 | ISSUE 112 3

APRIL 2022 | ISSUE 112 4
Executive Summary
Alpha Strategist | ‘Lollapalooza Effect’
In the current environment, the “ ” is at play. From a short term lens, severalLollapalooza Effect
factors viz. war in Ukraine leading to elevated commodity prices on account of Russia being one of
the major suppliers of key commodities; hike in interest rates, etc. have meant heightened
volatility. Our stance on this being a year of consolidation still holds. From a longer term
viewpoint though, domestic Equity market fundamentals remain robust given healthy balance
sheets, low debt-equity & improving ROEs leading to steady earnings growth outlook. The
longer term vision for India's macro remains positive with gradual progression toward a $6 trillion
economy over the course of this decade.
Nifty50 ended FY22 with gains of 19% YoY, marking another year of strong returns. Given the multitude of challenges
(regional lockdowns due to the second COVID wave, gradual withdrawal of excess global liquidity, relentless rise in
commodity prices, disruption in supply chains, and weak rural demand), the fact that the Nifty is down barely 5% from
its recent high underscores its resilience. Markets never fail to astonish and what has been a pleasant development is
the rise of DIIs investing in equities to the tune of over $26 billion in FY22 countering the outflows by FIIs ($17.1 billion).
Before the breakout of War in Ukraine, the old economy of commodities (Crude Oil, Wheat, Natural Gas etc.) had not
made abnormal returns for the better part of a decade and the scarcity premiums have skyrocketed prices leading to
record profits for large energy companies across the globe; US Inflation scaled to a 40-year peak in February to 7.9%.
Minutes of the Fed meeting signalled it will reduce its substantial bond holdings at a maximum pace of $95 billion per
month compared to $50 billion in the previous cycle in 2017-19 further tightening credit across the economy.
BFSI & IT companies have been somewhat immune to the geopolitical crisis and could continue to do well; Metals &
Mining companies have benefitted on the back of unyielding rise in commodity prices while the same has had a negative
impact on consumption driven companies. Autos, consumer staples and cement could see a decline in margins due to
rising commodity costs in Q4FY22 results while upstream Oil & Gas as well as Metals could see a sharp uptick during the
same period. Almost half of NIFTY 50 companies would not have any direct impact of rising energy prices on its last
quarterly results while 29% will have a positive impact and 18% would gain from rupee depreciation. On a high base,
Nifty50 Q4FY22 PAT is expected to go up 23%.
Our proprietary Temperature Gauge Index indicates that Equity market is in the fair valuation zone. Hence for
incremental allocation to equities, we suggest 50% deployment immediately & 50% to be staggered over a period of 3-6
months. We continue to maintain bias towards Multi cap and select Mid & Small cap strategies across MF/PMS/AIF
platforms.
For the domestic fixed income market, concerns on higher inflation due to rising crude and commodity costs have led to
the yield curve getting steeper. Recently concluded MPC meeting revised growth projections to 7.2% for FY23 from 7.8%
earlier while keeping the rates unchanged and maintaining its accommodative stance. This was in line with RBI's earlier
stance to prioritize sustainable growth trajectory while remaining cognizant about the inflationary risks. Albeit, RBI's
move to replace FRRR with SDF indicates an explicit start of monetary tightening making it clear monetary policy
normalization has started.
For Fixed Income portfolios, we continue to suggest following a barbell portfolio approach i.e. having core allocation to
high quality accrual oriented funds with maturities of 4-6 years, complemented by 20-30% allocation towards long
maturity and high quality roll down strategies. Tactical allocation to select high yield strategies, MLDs, REITs, InvITs can
help enhance the yield on fixed income portfolios. Gold should be treated predominantly as a hedge against heightened
volatility.
We reiterate emphasis on Investment Charter, Asset Allocation, and a disciplined staggered deployment strategy for
incremental equity investments.
Happy Investing!
Ashish Shanker
(MD & CEO – Private Wealth)
APRIL 2022 | ISSUE 112 5
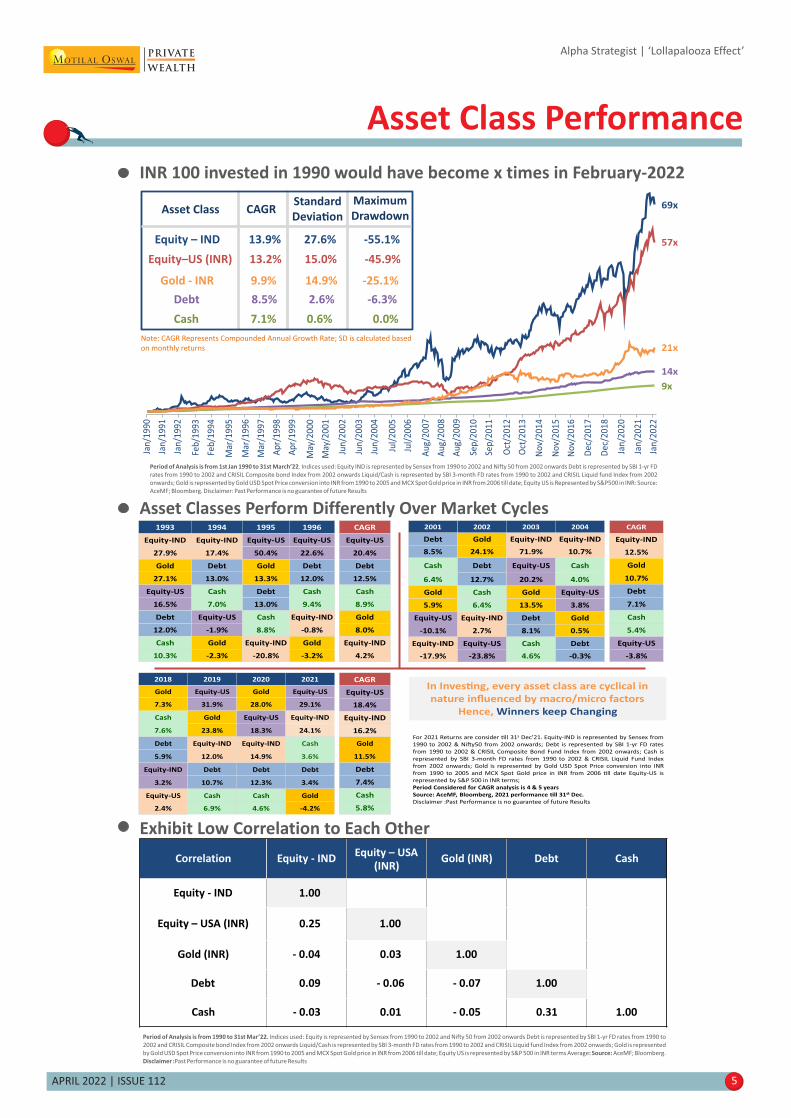
INR 100 invested in 1990 would have become x times in February-2022
Alpha Strategist | ‘Lollapalooza Effect’
A C Performancesset lass
Asset Classes Perform Differently Over Market Cycles
Exhibit Low Correlation to Each Other
Period of Analysis is from 1990 to 31st Mar’22. Indices used: Equity is represented by Sensex from 1990 to 2002 and Nifty 50 from 2002 onwards Debt is represented by SBI 1-yr FD rates from 1990 to
2002 and CRISIL Composite bond Index from 2002 onwards Liquid/Cash is represented by SBI 3-month FD rates from 1990 to 2002 and CRISIL Liquid fund Index from 2002 onwards; Gold is represented
by Gold USD Spot Price conversion into INR from 1990 to 2005 and MCX Spot Gold price in INR from 2006 till date; Equity US is represented by S&P 500 in INR terms Average AceMF; Bloomberg.: Source:
Disclaimer :Past Performance is no guarantee of future Results
Correlation Equity - INDEquity – USA
(INR)Gold (INR) Debt Cash
Equity - IND
Equity – USA (INR)
Gold (INR)
Debt
Cash
1.00
0.25
- 0.04
0.09
- 0.03
1.00
0.03
- 0.06
0.01
1.00
- 0.07
- 0.05
1.00
0.31 1.00
Period of Analysis is from 1st Jan 1990 to 31st March’22. Indices used: Equity IND is represented by Sensex from 1990 to 2002 and Nifty 50 from 2002 onwards Debt is represented by SBI 1-yr FD
rates from 1990 to 2002 and CRISIL Composite bond Index from 2002 onwards Liquid/Cash is represented by SBI 3-month FD rates from 1990 to 2002 and CRISIL Liquid fund Index from 2002
onwards; Gold is represented by Gold USD Spot Price conversion into INR from 1990 to 2005 and MCX Spot Gold price in INR from 2006 till date; Equity US is Represented by S&P500 in INR: Source:
AceMF; Bloomberg. Disclaimer: Past Performance is no guarantee of future Results
Cash 7.1% 0.6% 0.0%
Equity – IND 13.9% 27.6% -55.1%
Note: CAGR Represents Compounded Annual Growth Rate; SD is calculated based
on monthly returns
CAGRStandard
Devia�on
Maximum
DrawdownAsset Class
Equity–US (INR) 13.2% 15.0% -45.9%
Gold - INR 9.9% 14.9% -25.1%
Debt 8.5% 2.6% -6.3%
6 x9
5 x7
14x
9x
21x
Jan
/19
90
Jan
/19
91
Jan
/19
92
Feb
/19
93
Feb
/19
94
Mar
/19
95
Mar
/19
96
Mar
/19
97
Ap
r/1
99
8
Ap
r/1
99
9
May
/20
00
May
/20
01
Jun
/20
02
Jun
/20
03
Jun
/20
04
Jul/
20
05
Jul/
20
06
Au
g/2
00
7
Au
g/2
00
8
Au
g/2
00
9
Sep
/20
10
Sep
/20
11
Oct
/20
12
Oct
/20
13
No
v/2
01
4
No
v/2
01
5
No
v/2
01
6
De
c/2
01
7
De
c/2
01
8
Jan
/20
20
Jan
/20
21
Jan
/20
22
1993 1994 1995 1996
Equity-IND Equity-IND Equity-US Equity-US
27.9% 17.4% 50.4% 22.6%
Gold Debt Gold Debt
27.1% 13.0% 13.3% 12.0%
Equity-US Cash Debt Cash
16.5% 7.0% 13.0% 9.4%
Debt Equity-US Cash Equity-IND
12.0% -1.9% 8.8% -0.8%
Cash Gold Equity-IND Gold
10.3% -2.3% -20.8% -3.2%
2001 2002 2003 2004
Debt Gold Equity-IND Equity-IND
8.5% 24.1% 71.9% 10.7%
Cash Debt Equity-US Cash
6.4% 12.7% 20.2% 4.0%
Gold Cash Gold Equity-US
5.9% 6.4% 13.5% 3.8%
Equity-US Equity-IND Debt Gold
-10.1% 2.7% 8.1% 0.5%
Equity-IND Equity-US Cash Debt
-17.9% -23.8% 4.6% -0.3%
CAGR
Equity-US
20.4%
Debt
12.5%
Cash
8.9%
Gold
8.0%
Equity-IND
4.2%
CAGR
Equity-IND
12.5%
Gold
10.7%
Debt
7.1%
Cash
5.4%
Equity-US
-3.8%
In Inves�ng, every asset class are cyclical in
nature influenced by macro/micro factors
Hence, Winners keep Changing
For 2021 Returns are consider �ll 31s Dec’21. Equity-IND is represented by Sensex from
1990 to 2002 & Ni�y50 from 2002 onwards; Debt is represented by SBI 1-yr FD rates
from 1990 to 2002 & CRISIL Composite Bond Fund Index from 2002 onwards; Cash is
represented by SBI 3-month FD rates from 1990 to 2002 & CRISIL Liquid Fund Index
from 2002 onwards; Gold is represented by Gold USD Spot Price conversion into INR
from 1990 to 2005 and MCX Spot Gold price in INR from 2006 �ll date Equity-US is
represented by S&P 500 in INR terms;
Period Considered for CAGR analysis is 4 & 5 years
Source: AceMF, Bloomberg, 2021 performance �ll 31st Dec.
Disclaimer :Past Performance is no guarantee of future Results
CAGR
Equity-US
18.4%
Equity-IND
16.2%
Gold
11.5%
Debt
7.4%
Cash
5.8%
2018 2019 2020 2021
Gold Equity-US Gold Equity-US
7.3% 31.9% 28.0% 29.1%
Cash Gold Equity-US Equity-IND
7.6% 23.8% 18.3% 24.1%
Debt Equity-IND Equity-IND Cash
5.9% 12.0% 14.9% 3.6%
Equity-IND Debt Debt Debt
3.2% 10.7% 12.3% 3.4%
Equity-US Cash Cash Gold
2.4% 6.9% 4.6% -4.2%
It is common knowledge that investments, when given time to grow, have a much higher chance of reaching their full
potential. One of the most successful and well known investors, Peter Lynch, once mentioned “You get recessions, you
have stock market declines, if you don't understand that's going to happen, then you're not ready, you won't do well in
the markets”. Even though these scenarios mentioned are known to investors, why are they not able to ride through the
cycle? The problem arises when personal capital is invested, as it is simple human nature to notice every small
turbulence that depletes one's capital. Initially an investor may be able to comprehend the situation, but when the bear
market last months or even years, portfolio profits and even capital begin to erode. This is when for most investors,
patience begins to wear thin and fear sets in. In such a mindset, investors end up making impulsive decisions that are
solely based on emotions without realizing that they are doing themselves more harm than good. Therefore we believe
that the key ingredient to healthy investment portfolios is to have a long term vision.
The most common question that then arises is: how long is long term? When it comes to computation of tax on capital
gains, long term is considered as a holding period of one year for equities and a period of three years for debt
instruments. However, from an investment perspective one year is considered as a very short period of time since
volatility can be very high and the investor could suffer losses. The fundamental reason for investing for a long period of
time is to deal with volatility, which can never be predicted. This is why many successful managers strongly believe in the
philosophy of 'Time in the market' as opposed to 'Timing the Market'. In hindsight, even if the entry point might have
been wrong, positive returns can still be made by patiently holding onto the investments and benefitting from the
subsequent rally. Some managers even try to improve their returns by increasing their investments in periods which are
negative or low return phases.
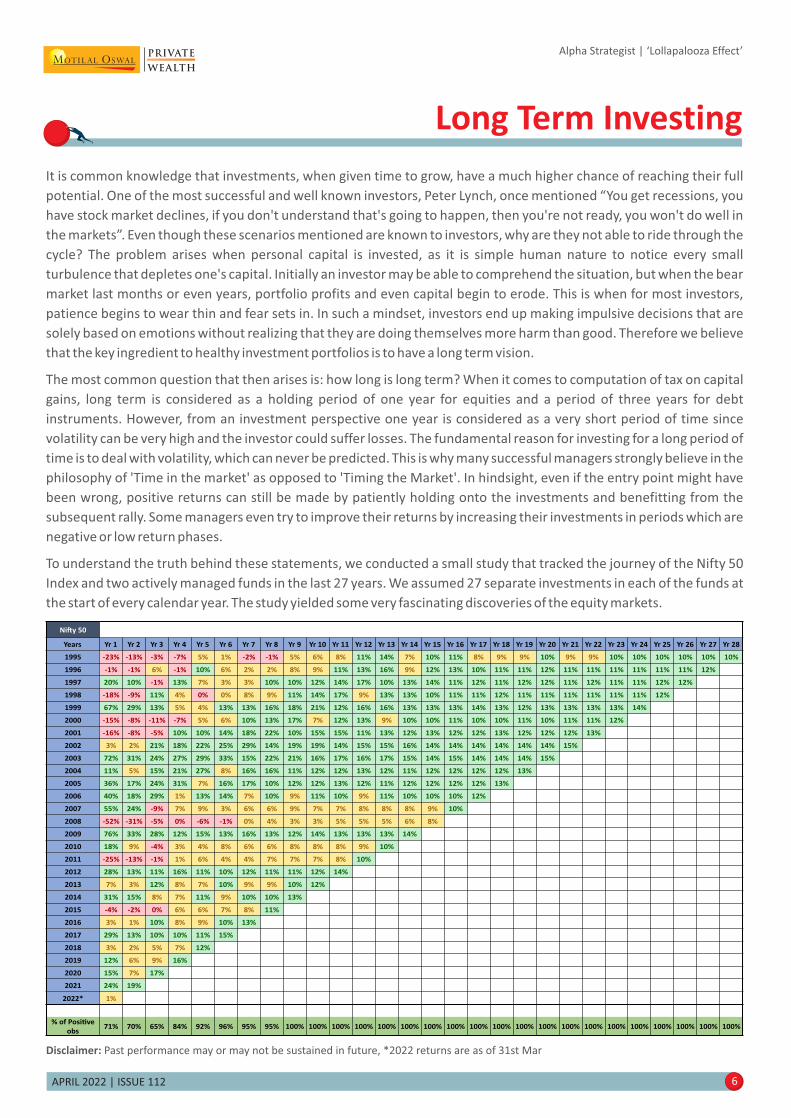
To understand the truth behind these statements, we conducted a small study that tracked the journey of the Nifty 50
Index and two actively managed funds in the last 27 years. We assumed 27 separate investments in each of the funds at
the start of every calendar year. The study yielded some very fascinating discoveries of the equity markets.
APRIL 2022 | ISSUE 112 6
Alpha Strategist | ‘Lollapalooza Effect’
Long Term Investing
Disclaimer: Past performance may or may not be sustained in future, *2022 returns are as of 31st Mar
Ni�y 50
Years Yr 1 Yr 2 Yr 3 Yr 4 Yr 5 Yr 6 Yr 7 Yr 8 Yr 9 Yr 10 Yr 11 Yr 12 Yr 13 Yr 14 Yr 15 Yr 16 Yr 17 Yr 18 Yr 19 Yr 20 Yr 21 Yr 22 Yr 23 Yr 24 Yr 25 Yr 26 Yr 27 Yr 28
1995 -23% -13% -3% -7% 5% 1% -2% -1% 5% 6% 8% 11% 14% 7% 10% 11% 8% 9% 9% 10% 9% 9% 10% 10% 10% 10% 10% 10%
1996 -1% -1% 6% -1% 10% 6% 2% 2% 8% 9% 11% 13% 16% 9% 12% 13% 10% 11% 11% 12% 11% 11% 11% 11% 11% 11% 12%
1997 20% 10% -1% 13% 7% 3% 3% 10% 10% 12% 14% 17% 10% 13% 14% 11% 12% 11% 12% 12% 11% 12% 11% 11% 12% 12%
1998 -18% -9% 11% 4% 0% 0% 8% 9% 11% 14% 17% 9% 13% 13% 10% 11% 11% 12% 11% 11% 11% 11% 11% 11% 12%
1999 67% 29% 13% 5% 4% 13% 13% 16% 18% 21% 12% 16% 16% 13% 13% 13% 14% 13% 12% 13% 13% 13% 13% 14%
2000 -15% -8% -11% -7% 5% 6% 10% 13% 17% 7% 12% 13% 9% 10% 10% 11% 10% 10% 11% 10% 11% 11% 12%
2001 -16% -8% -5% 10% 10% 14% 18% 22% 10% 15% 15% 11% 13% 12% 13% 12% 12% 13% 12% 12% 12% 13%
2002 3% 2% 21% 18% 22% 25% 29% 14% 19% 19% 14% 15% 15% 16% 14% 14% 14% 14% 14% 14% 15%
2003 72% 31% 24% 27% 29% 33% 15% 22% 21% 16% 17% 16% 17% 15% 14% 15% 14% 14% 14% 15%
2004 11% 5% 15% 21% 27% 8% 16% 16% 11% 12% 12% 13% 12% 11% 12% 12% 12% 12% 13%
2005 36% 17% 24% 31% 7% 16% 17% 10% 12% 12% 13% 12% 11% 12% 12% 12% 12% 13%
2006 40% 18% 29% 1% 13% 14% 7% 10% 9% 11% 10% 9% 11% 10% 10% 10% 12%
2007 55% 24% -9% 7% 9% 3% 6% 6% 9% 7% 7% 8% 8% 8% 9% 10%
2008 -52% -31% -5% 0% -6% -1% 0% 4% 3% 3% 5% 5% 5% 6% 8%
2009 76% 33% 28% 12% 15% 13% 16% 13% 12% 14% 13% 13% 13% 14%
2010 18% 9% -4% 3% 4% 8% 6% 6% 8% 8% 8% 9% 10%
2011 -25% -13% -1% 1% 6% 4% 4% 7% 7% 7% 8% 10%
2012 28% 13% 11% 16% 11% 10% 12% 11% 11% 12% 14%
2013 7% 3% 12% 8% 7% 10% 9% 9% 10% 12%
2014 31% 15% 8% 7% 11% 9% 10% 10% 13%
2015 -4% -2% 0% 6% 6% 7% 8% 11%
2016 3% 1% 10% 8% 9% 10% 13%
2017 29% 13% 10% 10% 11% 15%
2018 3% 2% 5% 7% 12%
2019 12% 6% 9% 16%
2020 15% 7% 17%
2021 24% 19%
2022* 1%
% of Posi�ve
obs71% 70% 65% 84% 92% 96% 95% 95% 100% 100% 100% 100% 100% 100% 100% 100% 100% 100% 100% 100% 100% 100% 100% 100% 100% 100% 100% 100%
APRIL 2022 | ISSUE 112 7
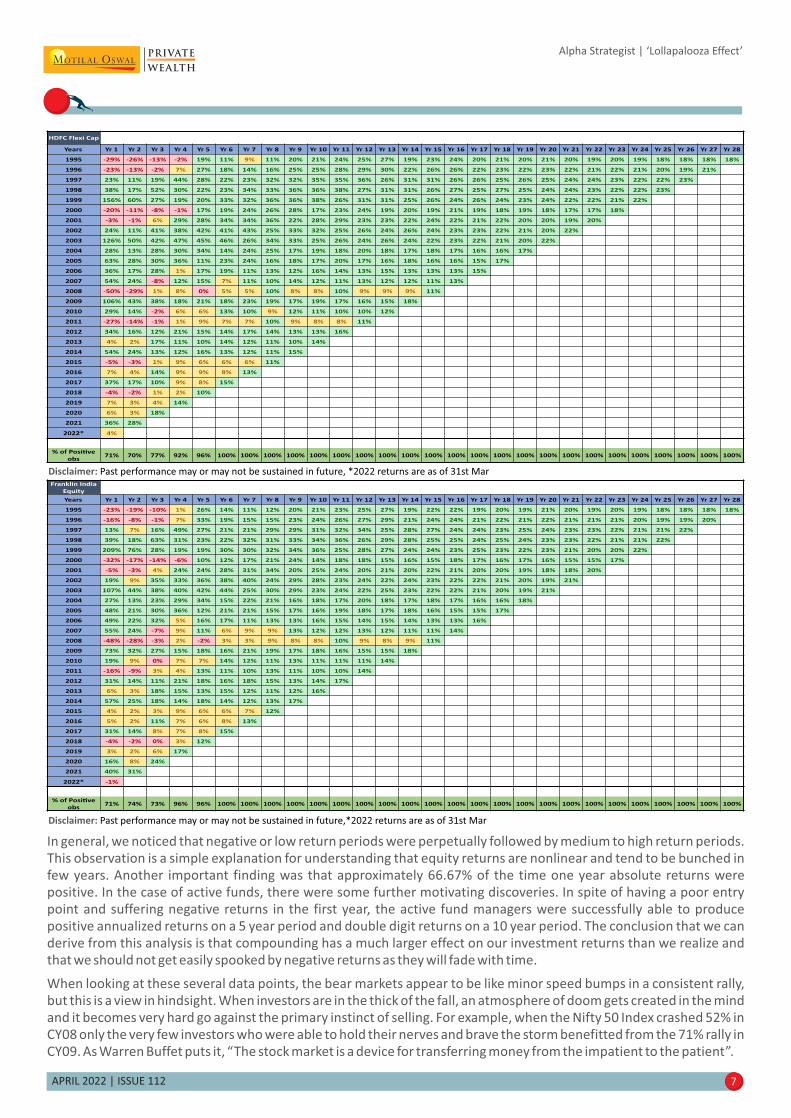
In general, we noticed that negative or low return periods were perpetually followed by medium to high return periods.
This observation is a simple explanation for understanding that equity returns are nonlinear and tend to be bunched in
few years. Another important finding was that approximately 66.67% of the time one year absolute returns were
positive. In the case of active funds, there were some further motivating discoveries. In spite of having a poor entry
point and suffering negative returns in the first year, the active fund managers were successfully able to produce
positive annualized returns on a 5 year period and double digit returns on a 10 year period. The conclusion that we can
derive from this analysis is that compounding has a much larger effect on our investment returns than we realize and
that we should not get easily spooked by negative returns as they will fade with time.
When looking at these several data points, the bear markets appear to be like minor speed bumps in a consistent rally,
but this is a view in hindsight. When investors are in the thick of the fall, an atmosphere of doom gets created in the mind
and it becomes very hard go against the primary instinct of selling. For example, when the Nifty 50 Index crashed 52% in
CY08 only the very few investors who were able to hold their nerves and brave the storm benefitted from the 71% rally in
CY09. As Warren Buffet puts it, “The stock market is a device for transferring money from the impatient to the patient”.
Alpha Strategist | ‘Lollapalooza Effect’
Disclaimer: Past performance may or may not be sustained in future, *2022 returns are as of 31st Mar
Disclaimer: Past performance may or may not be sustained in future,*2022 returns are as of 31st Mar
HDFC Flexi Cap
Years Yr 1 Yr 2 Yr 3 Yr 4 Yr 5 Yr 6 Yr 7 Yr 8 Yr 9 Yr 10 Yr 11 Yr 12 Yr 13 Yr 14 Yr 15 Yr 16 Yr 17 Yr 18 Yr 19 Yr 20 Yr 21 Yr 22 Yr 23 Yr 24 Yr 25 Yr 26 Yr 27 Yr 28
1995 -29% -26% -13% -2% 19% 11% 9% 11% 20% 21% 24% 25% 27% 19% 23% 24% 20% 21% 20% 21% 20% 19% 20% 19% 18% 18% 18% 18%
1996 -23% -13% -2% 7% 27% 18% 14% 16% 25% 25% 28% 29% 30% 22% 26% 26% 22% 23% 22% 23% 22% 21% 22% 21% 20% 19% 21%
1997 23% 11% 19% 44% 28% 22% 23% 32% 32% 35% 35% 36% 26% 31% 31% 26% 26% 25% 26% 25% 24% 24% 23% 22% 22% 23%
1998 38% 17% 52% 30% 22% 23% 34% 33% 36% 36% 38% 27% 31% 31% 26% 27% 25% 27% 25% 24% 24% 23% 22% 22% 23%
1999 156% 60% 27% 19% 20% 33% 32% 36% 36% 38% 26% 31% 31% 25% 26% 24% 26% 24% 23% 24% 22% 22% 21% 22%
2000 -20% -11% -8% -1% 17% 19% 24% 26% 28% 17% 23% 24% 19% 20% 19% 21% 19% 18% 19% 18% 17% 17% 18%
2001 -3% -1% 6% 29% 28% 34% 34% 36% 22% 28% 29% 23% 23% 22% 24% 22% 21% 22% 20% 20% 19% 20%
2002 24% 11% 41% 38% 42% 41% 43% 25% 33% 32% 25% 26% 24% 26% 24% 23% 23% 22% 21% 20% 22%
2003 126% 50% 42% 47% 45% 46% 26% 34% 33% 25% 26% 24% 26% 24% 22% 23% 22% 21% 20% 22%
2004 28% 13% 28% 30% 34% 14% 24% 25% 17% 19% 18% 20% 18% 17% 18% 17% 16% 16% 17%
2005 63% 28% 30% 36% 11% 23% 24% 16% 18% 17% 20% 17% 16% 18% 16% 16% 15% 17%
2006 36% 17% 28% 1% 17% 19% 11% 13% 12% 16% 14% 13% 15% 13% 13% 13% 15%
2007 54% 24% -8% 12% 15% 7% 11% 10% 14% 12% 11% 13% 12% 12% 11% 13%
2008 -50% -29% 1% 8% 0% 5% 5% 10% 8% 8% 10% 9% 9% 9% 11%
2009 106% 43% 38% 18% 21% 18% 23% 19% 17% 19% 17% 16% 15% 18%
2010 29% 14% -2% 6% 6% 13% 10% 9% 12% 11% 10% 10% 12%
2011 -27% -14% -1% 1% 9% 7% 7% 10% 9% 8% 8% 11%
2012 34% 16% 12% 21% 15% 14% 17% 14% 13% 13% 16%
2013 4% 2% 17% 11% 10% 14% 12% 11% 10% 14%
2014 54% 24% 13% 12% 16% 13% 12% 11% 15%
2015 -5% -3% 1% 9% 6% 6% 6% 11%
2016 7% 4% 14% 9% 9% 8% 13%
2017 37% 17% 10% 9% 8% 15%
2018 -4% -2% 1% 2% 10%
2019 7% 3% 4% 14%
2020 6% 3% 18%
2021 36% 28%
2022* 4%
% of Posi�ve
obs71% 70% 77% 92% 96% 100% 100% 100% 100% 100% 100% 100% 100% 100% 100% 100% 100% 100% 100% 100% 100% 100% 100% 100% 100% 100% 100% 100%
Franklin India
Equity
Years Yr 1 Yr 2 Yr 3 Yr 4 Yr 5 Yr 6 Yr 7 Yr 8 Yr 9 Yr 10 Yr 11 Yr 12 Yr 13 Yr 14 Yr 15 Yr 16 Yr 17 Yr 18 Yr 19 Yr 20 Yr 21 Yr 22 Yr 23 Yr 24 Yr 25 Yr 26 Yr 27 Yr 28
1995 -23% -19% -10% 1% 26% 14% 11% 12% 20% 21% 23% 25% 27% 19% 22% 22% 19% 20% 19% 21% 20% 19% 20% 19% 18% 18% 18% 18%
1996 -16% -8% -1% 7% 33% 19% 15% 15% 23% 24% 26% 27% 29% 21% 24% 24% 21% 22% 21% 22% 21% 21% 21% 20% 19% 19% 20%
1997 13% 7% 16% 49% 27% 21% 21% 29% 29% 31% 32% 34% 25% 28% 27% 24% 24% 23% 25% 24% 23% 23% 22% 21% 21% 22%
1998 39% 18% 63% 31% 23% 22% 32% 31% 33% 34% 36% 26% 29% 28% 25% 25% 24% 25% 24% 23% 23% 22% 21% 21% 22%
1999 209% 76% 28% 19% 19% 30% 30% 32% 34% 36% 25% 28% 27% 24% 24% 23% 25% 23% 22% 23% 21% 20% 20% 22%
2000 -32% -17% -14% -6% 10% 12% 17% 21% 24% 14% 18% 18% 15% 16% 15% 18% 17% 16% 17% 16% 15% 15% 17%
2001 -5% -3% 4% 24% 24% 28% 31% 34% 20% 25% 24% 20% 21% 20% 22% 21% 20% 20% 19% 18% 18% 20%
2002 19% 9% 35% 33% 36% 38% 40% 24% 29% 28% 23% 24% 22% 24% 23% 22% 22% 21% 20% 19% 21%
2003 107% 44% 38% 40% 42% 44% 25% 30% 29% 23% 24% 22% 25% 23% 22% 22% 21% 20% 19% 21%
2004 27% 13% 23% 29% 34% 15% 22% 21% 16% 18% 17% 20% 18% 17% 18% 17% 16% 16% 18%
2005 48% 21% 30% 36% 12% 21% 21% 15% 17% 16% 19% 18% 17% 18% 16% 15% 15% 17%
2006 49% 22% 32% 5% 16% 17% 11% 13% 13% 16% 15% 14% 15% 14% 13% 13% 16%
2007 55% 24% -7% 9% 11% 6% 9% 9% 13% 12% 12% 13% 12% 11% 11% 14%
2008 -48% -28% -3% 2% -2% 3% 3% 9% 8% 8% 10% 9% 8% 9% 11%
2009 73% 32% 27% 15% 18% 16% 21% 19% 17% 18% 16% 15% 15% 18%
2010 19% 9% 0% 7% 7% 14% 12% 11% 13% 11% 11% 11% 14%
2011 -16% -9% 3% 4% 13% 11% 10% 13% 11% 10% 10% 14%
2012 31% 14% 11% 21% 18% 16% 18% 15% 13% 14% 17%
2013 6% 3% 18% 15% 13% 15% 12% 11% 12% 16%
2014 57% 25% 18% 14% 18% 14% 12% 13% 17%
2015 4% 2% 3% 9% 6% 6% 7% 12%
2016 5% 2% 11% 7% 6% 8% 13%
2017 31% 14% 8% 7% 8% 15%
2018 -4% -2% 0% 3% 12%
2019 3% 2% 6% 17%
2020 16% 8% 24%
2021 40% 31%
2022* -1%
% of Posi�ve
obs71% 74% 73% 96% 96% 100% 100% 100% 100% 100% 100% 100% 100% 100% 100% 100% 100% 100% 100% 100% 100% 100% 100% 100% 100% 100% 100% 100%
This document is not valid without disclosure; refer the last page for the disclosure
APRIL 2022 | ISSUE 112 8
Alpha Strategist | ‘Lollapalooza Effect’
Market through Graphs................................................................ .. .... .09........... .. .....
Portfolios Commentary.........................................................................................10
Temperature Gauge.............................................................................................12
Risk Return Matrix ...............................................................................................14
Investment Grid...................................................................................................15
Our Recommendations.........................................................................................16
DELPHI ............................................... .................................................................18
Section I
Alpha Strategist | ‘Lollapalooza Effect’
Market through Graphs
APRIL 2022 | ISSUE 112 9
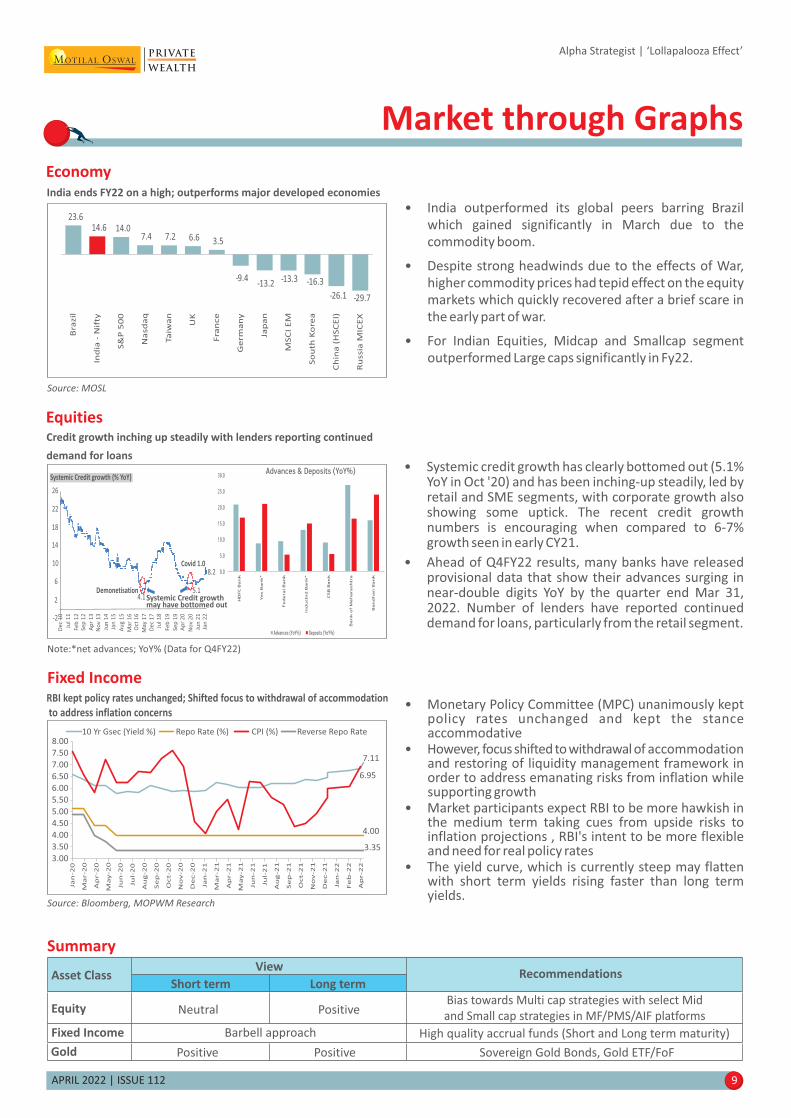
Summary
Equity
Fixed Income High quality accrual funds (Short and Long term maturity)Barbell approach
Sovereign Gold Bonds, Gold ETF/FoFPositive Positive
Recommendations
Gold
Bias towards Multi cap strategies with select Mid
and Small cap strategies in MF/PMS/AIF platformsNeutral Positive
Economy
EquitiesCredit growth inching up steadily with lenders reporting continued
demand for loans• Systemic credit growth has clearly bottomed out (5.1%
YoY in Oct '20) and has been inching-up steadily, led byretail and SME segments, with corporate growth alsoshowing some uptick. The recent credit growthnumbers is encouraging when compared to 6-7%growth seen in early CY21.
• Ahead of Q4FY22 results, many banks have releasedprovisional data that show their advances surging innear-double digits YoY by the quarter end Mar 31,2022. Number of lenders have reported continueddemand for loans, particularly from the retail segment.
Note:*net advances; YoY% (Data for Q4FY22)
• India outperformed its global peers barring Brazil
which gained significantly in March due to the
commodity boom.
• Despite strong headwinds due to the effects of War,
higher commodity prices had tepid effect on the equity
markets which quickly recovered after a brief scare in
the early part of war.
• For Indian Equities, Midcap and Smallcap segment
outperformed Large caps significantly in Fy22.
India ends FY22 on a high; outperforms major developed economies
Source: MOSL
23.614.6 14.0
7.4 7.2 6.6 3.5
-9.4-13.2 -13.3 -16.3
-26.1 -29.7
Bra
zil
Ind
ia -
Nif
ty
S&
P 5
00
Na
sd
aq
Ta
iwa
n
UK
Fra
nce
Ge
rma
ny
Jap
an
MS
CI
EM
So
uth
Ko
rea
Ch
ina
(H
SC
EI)
Ru
ssia
MIC
EX
Fixed IncomeRBI kept policy rates unchanged; Shifted focus to withdrawal of accommodation
to address inflation concerns
Source: Bloomberg, MOPWM Research
7.11
4.00
6.95
3.35
3.00
3.50
4.00
4.50
5.00
5.50
6.00
6.50
7.00
7.50
8.00
Ja
n-2
0
Ma
r-2
0
Ap
r-2
0
Ma
y-2
0
Ju
n-2
0
Ju
l-2
0
Au
g-2
0
Se
p-2
0
Oct-2
0
No
v-2
0
De
c-2
0
Ja
n-2
1
Ma
r-2
1
Ap
r-2
1
Ma
y-2
1
Ju
n-2
1
Ju
l-2
1
Au
g-2
1
Se
p-2
1
Oct-2
1
No
v-2
1
De
c-2
1
Ja
n-2
2
Fe
b-2
2
Ap
r-2
2
10 Yr Gsec (Yield %) Repo Rate (%) CPI (%) Reverse Repo Rate
• Monetary Policy Committee (MPC) unanimously keptpolicy rates unchanged and kept the stanceaccommodative
• However, focus shifted to withdrawal of accommodationand restoring of liquidity management framework inorder to address emanating risks from inflation whilesupporting growth
• Market participants expect RBI to be more hawkish inthe medium term taking cues from upside risks toinflation projections , RBI's intent to be more flexibleand need for real policy rates
• The yield curve, which is currently steep may flattenwith short term yields rising faster than long termyields.
26
22
18
14
10
-2
De
c 1
0
Jul 1
1
Feb
12
Se
p 1
2
Ap
r 1
3N
ov
13
Jun
14
Jan
15
De
c 1
7
Au
g 1
5
Jul 1
8
Feb
19
Se
p 1
9A
pr
20
No
v 2
0
Jun
21
Jan
22
Ma
r 1
6O
ct 1
6
Ma
y 1
7
Systemic Credit growth (% YoY)
6
2Demonetisation
Systemic Credit growthmay have bottomed out
5.14.1
Covid 1.08.2
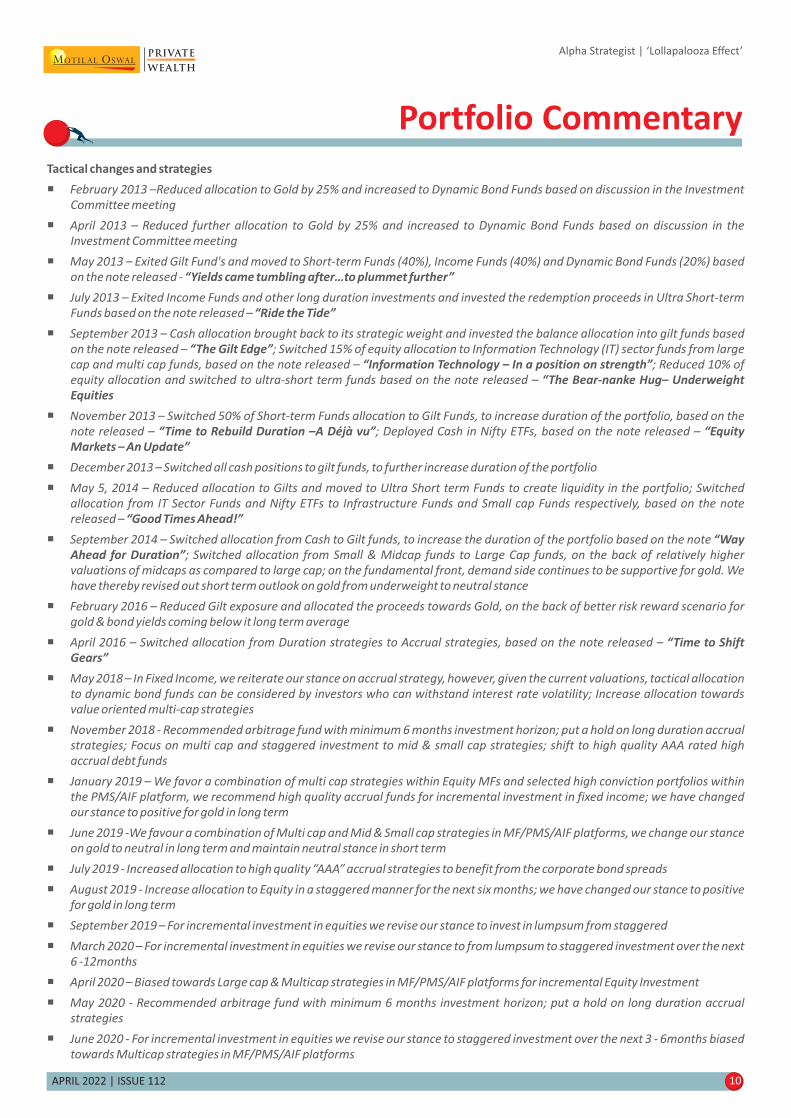
Tactical changes and strategies
� February 2013 –Reduced allocation to Gold by 25% and increased to Dynamic Bond Funds based on discussion in the Investment
Committee meeting
� April 2013 – Reduced further allocation to Gold by 25% and increased to Dynamic Bond Funds based on discussion in the
Investment Committee meeting
� May 2013 – Exited Gilt Fund's and moved to Short-term Funds (40%), Income Funds (40%) and Dynamic Bond Funds (20%) based
on the note released - “Yields came tumbling after…to plummet further”
� July 2013 – Exited Income Funds and other long duration investments and invested the redemption proceeds in Ultra Short-term
Funds based on the note released – “Ride the Tide”
� September 2013 – Cash allocation brought back to its strategic weight and invested the balance allocation into gilt funds based
on the note released – ; Switched 15% of equity allocation to Information Technology (IT) sector funds from large“The Gilt Edge”
cap and multi cap funds, based on the note released – ; Reduced 10% of“Information Technology – In a position on strength”
equity allocation and switched to ultra-short term funds based on the note released – “The Bear-nanke Hug– Underweight
Equities
� November 2013 – Switched 50% of Short-term Funds allocation to Gilt Funds, to increase duration of the portfolio, based on the
note released – ; Deployed Cash in Nifty ETFs, based on the note released –“Time to Rebuild Duration –A Déjà vu” “Equity
Markets – An Update”
� December 2013 – Switched all cash positions to gilt funds, to further increase duration of the portfolio
� May 5, 2014 – Reduced allocation to Gilts and moved to Ultra Short term Funds to create liquidity in the portfolio; Switched
allocation from IT Sector Funds and Nifty ETFs to Infrastructure Funds and Small cap Funds respectively, based on the note
released – “Good Times Ahead!”
� September 2014 – Switched allocation from Cash to Gilt funds, to increase the duration of the portfolio based on the note “Way
Ahead for Duration”; Switched allocation from Small & Midcap funds to Large Cap funds, on the back of relatively higher
valuations of midcaps as compared to large cap; on the fundamental front, demand side continues to be supportive for gold. We
have thereby revised out short term outlook on gold from underweight to neutral stance
� February 2016 – Reduced Gilt exposure and allocated the proceeds towards Gold, on the back of better risk reward scenario for
gold & bond yields coming below it long term average
� April 2016 – Switched allocation from Duration strategies to Accrual strategies, based on the note released – “Time to Shift
Gears”
� May 2018 – In Fixed Income, we reiterate our stance on accrual strategy, however, given the current valuations, tactical allocation
to dynamic bond funds can be considered by investors who can withstand interest rate volatility; Increase allocation towards
value oriented multi-cap strategies
� November 2018 - Recommended arbitrage fund with minimum 6 months investment horizon; put a hold on long duration accrual
strategies; Focus on multi cap and staggered investment to mid & small cap strategies; shift to high quality AAA rated high
accrual debt funds
� January 2019 – We favor a combination of multi cap strategies within Equity MFs and selected high conviction portfolios within
the PMS/AIF platform, we recommend high quality accrual funds for incremental investment in fixed income; we have changed
our stance to positive for gold in long term
� June 2019 -We favour a combination of Multi cap and Mid & Small cap strategies in MF/PMS/AIF platforms, we change our stance
on gold to neutral in long term and maintain neutral stance in short term
� July 2019 - Increased allocation to high quality “AAA” accrual strategies to benefit from the corporate bond spreads
� August 2019 - Increase allocation to Equity in a staggered manner for the next six months; we have changed our stance to positive
for gold in long term
� September 2019 – For incremental investment in equities we revise our stance to invest in lumpsum from staggered
� March 2020 – For incremental investment in equities we revise our stance to from lumpsum to staggered investment over the next
6 -12months
� April 2020 – Biased towards Large cap & Multicap strategies in MF/PMS/AIF platforms for incremental Equity Investment
� May 2020 - Recommended arbitrage fund with minimum 6 months investment horizon; put a hold on long duration accrual
strategies
� June 2020 - For incremental investment in equities we revise our stance to staggered investment over the next 3 - 6months biased
towards Multicap strategies in MF/PMS/AIF platforms
APRIL 2022 | ISSUE 112 10
Alpha Strategist | ‘Lollapalooza Effect’
Portfolio Commentary

APRIL 2022 | ISSUE 112 11
Alpha Strategist | ‘Lollapalooza Effect’
Investment CommitteeCommittee Members
Ashish Shanker – MD , Private Wealth& CEO
Gautam Duggad – Head of Research, Institutional Equities, MOSL
Kishore Narne – Head, Commodities & Currency
Nikhil Gupta – Economist, MOSL
Nitin Shanbhag – Head, Investment Products, Private Wealth
Product Team, Private Wealth
ExternalSpeakers: ExternalSpeakers:Mr.Shreyash Devalkar (SeniorFund Manager–Equity,Axis AMC)
and Mr.R.Sivakumar( Head - Fixed Income,Axis AMC)
� July 2020 – For incremental allocation in equity, we recommend to increase allocation by investing 50% immediately and the
balance in a staggered manner in Multicap strategies(MFs, PMS, AIF) over the next 3-6months
� October 2020 – For incremental allocation in equity, we recommend to increase allocation in a staggered manner in Multicap
strategies(MFs, PMS, AIF) over the next 3-6months; fixed income allocation can be complemented by tactical investments in select
credit oriented funds, high yield NCDs, bonds & MLDs
� November 2020 - To enhance the overall portfolio yield, investors with medium to high risk profile can consider 15 – 20% allocation
of the overall fixed income portfolio to select MLDs, NCDs and credit oriented strategies
� January 2021 -We change our stance in Gold to neutral in short term from positive
� February 2021 -We recommend to invest 50%in lumpsum and 50%in a staggered manner over the next 3-6months in Multi cap and
select Mid & Small Cap strategies(MFs, PMS, AIF); We recommend a barbell approach where 'Accrual' should precede 'Duration'
and the overall portfolio average maturity should be between 2-5 years with sufficient long term investment horizon according to
the investor's risk return profile
� June 2021 -We change our short term stance in Gold to Positive from Neutral
� July 2021 – In Fixed Income, we recommend a barbell approach where 'Accrual' should precede 'Duration' and the overall portfolio
average maturity should be between 4-6 years with long term investment horizon; To enhance the overall portfolio yield, investors
with medium to high risk profile can consider 20% – 25% allocation of the overall fixed income portfolio to select high yield
strategies, MLDs and NCDS. Fixed Income portfolios should also include REITs/InvITs which have highest credit rating & which aim
to offer regular (either quarterly or half yearly) &predictable cash flows - investment horizon should be at least 4-5 years to
mitigate interim mark to market volatility
� February 2022 - We recommend to invest 50%in lump sum and 50%in a staggered manner over the next 3 months in Multi cap and
select Mid & Small Cap strategies (MFs, PMS, AIF)

APRIL 2022 | ISSUE 112 12
Temperature Gauge
Alpha Strategist | ‘Lollapalooza Effect’
We are cognizant of the fact that investments are tuned to meet your objectives and thus calling for a suitable asset mix
basis your investment objective. However the challenge always remains to accurately estimate when the market is
cheap or expensive. In order to arrive at the decision of preferring equity over debt or vice versa, we believe earning
yield to bond yield is an excellent parameter to consider. This ratio indicates the perceived risk differential between
equity and bonds.
Historically whenever earnings yield and bond yield spreads are above 0.8, equities are considered to be undervalued.
The earning yield to bond yield parameter along with our in-house indicator of market valuations named as MOVI – The
Motilal Oswal Valuation Index enables us to arrive at a well-researched and thought through asset class outlook. MOVI
is basically an index which is calculated based on the Price to Earnings (PE), Price to Book Value (PB) and Dividend Yield
(DY) on the components of Nifty 50. By means of an algorithm the weighted average PE, PB and DY of the components of
Nifty 50, one arrives at index. A higher level on the MOVI means markets are expensive and hence one should reduce
equity exposure and vice versa.
With the above mentioned input variables, we have crafted a unique model coined as which helpTemperature Gauge
in making investment choices across asset classes.
This qualitative and quantitative process would enable us to construct “winning portfolios” for our clients. In line with
our philosophy of providing better insights to you, we hope you find the same informative.
Data as of 5th Apr’22, Source: Capital Line, Bloomberg Internal Research; Ni�y EPS considered for FY22E is INR 731 and FY23E is 874, es�mates are taken from MOFSL
Temperature Gauge Index using FY23E EPS is 100
117
60
70
80
90
100
110
120
130
140
150
Temperature Gauge Index
-7%
13%
33%
53%> 10% CAGR Between 0-10% CAGR < 0%Ni�y – 3 Year Forward Return
Cheap Zone Fair Zone Expensive Zone
100

APRIL 2022 | ISSUE 112 13
� Below grid is based on Temperature Gauge Index
Equity Allocation & Deployment Grid
No Ac�on Reduce Reduce
Invest Stay Invested Stay Invested
Invest Invest Stay Invested
Expensive
Fair
Cheap
Underweight Neutral Overweight
Strategic
Alloca�on
Valua�on
100% Staggered
50% Staggered
50% Lump sum
(Current Scenario)
100% Lump sum
Source: Capital Line, Internal Research, Data as of 5th Apr’22; *Total nos. of observa�on is 4,978
Temperature Gauge Index is
in the range of 115-120, the
3-yr forward return shows
h i g h e r p r o b a b i l i t y o f
positive returns
3 Yr Forward Returns Of Nifty At Different Levels Of TemperatureGauge Index
Alpha Strategist | ‘Lollapalooza Effect’
Nifty 50 3 Yr Return CAGR% Times in
CAGR range
Index in
Range
No. of
Observations
% of
ObservationsMin Max
Averag
e
%
Times
Positive
6% to
10%>=10%
65 70 26 0.5% 17% 58% 26% 100% 0% 100%
70 75 91 1.8% 14% 58% 31% 100% 0% 100%
75 80 54 1.1% 18% 56% 38% 100% 0% 100%
80 85 158 3.2% 15% 51% 39% 100% 0% 100%
85 90 190 3.8% 12% 45% 35% 100% 0% 100%
90 95 241 4.8% 10% 49% 28% 100% 0% 100%
95 100 583 11.7% 2% 48% 21% 100% 6% 93%
100 105 558 11.2% 1% 44% 15% 100% 20% 75%
105 110 611 12.3% -4% 33% 11% 98% 28% 57%
110 115 935 18.8% -6% 28% 8% 91% 38% 30%
115 120 887 17.8% -7% 14% 7% 95% 24% 38%
120 125 465 9.3% -4% 10% 5% 88% 28% 8%
125 130 55 1.1% -1% 6% 2% 78% 0% 0%
130 135 60 1.2% -2% 3% 0% 66% 0% 0%
135 140 64 1.2% -3% 0% -2% 0% 0% 0%

APRIL 2022 | ISSUE 112 14
Risk Return profile helps to determine one’s asset allocation frame work. The next logical step is to look at the different
investment strategies that would enable one to eventually achieve their financial goals.
Alpha Strategist | ‘Lollapalooza Effect’
Risk Return Matrix
From the above chart we can conclude that in debt, a high quality accrual strategy would have lower volatility as
compared to a dynamic strategy while generating similar average return over a 1 year holding period
While in equity, a large cap strategy has historically exhibited relatively lower volatility and generated lower return as
compared to the small cap strategy.
Thereby, one has to carefully examine if a particular investment strategy is aligned with their risk appetite before making
an investment decision.
Strategies considered for the analysis:
Large cap fund category:ABSL frontline, ABSL focused equity, SBI bluechip, Motilal Value PMS & Motilal Oswal focused 25
Multi cap fund category: ABSL equity, ASK IEP PMS, ASK Select PMS, Motilal NTDOP PMS, DHFL Deep Value PMS, Franklin
India equity, Franklin focused equity, I-Pru multi cap, Invesco contra, L&T value & Kotak standard multicap
Mid cap category: Franklin prima, HDFC midcap opps, Motilal IOP PMS, Kotak emerging equities, Sundaram midcap &
Motilal focused 30
Small cap category: Franklin smaller cos, DSP small Cap & HDFC small cap
High quality accrual: ABSL Corp Bond, Axis Banking PSU, BNP Corp bond, ICICI Short term bond fund, IDFC Banking & PSU
& IDFC bond fund –ST, ICICI Banking and PSU, Kotak Banking and PSU
Credit risk: BOI AXA credit risk, Franklin India ST income, ICICI credit risk, L&T resurgent, Reliance credit risk & Reliance
strategic debt fund
Dynamic: IDFC Dynamic, SBI Dynamic, UTI Dynamic & ABSL Dynamic
Long/Short: Performance of Ambit Alpha fund from 31 May 2013 – 30 Sep 2016, Liquid return assumed from 1st Oct 16-
29th Feb 17 and performance of Avendus Absolute Return Fund from 31st Mar 2017 onwards
Data used from December 2009, Source: Ace MF
*Every category consists of fund equally weighted
Multi Cap
Average
Max
Min
8.0%
18.7%
-3.3%
6. %7
1 . %3 0
-13.1%
7 9. %
. %17 3
0.1%
10.6%
16.5%
1.8%
16.8%
86.9%
-23.1%
20.9%
112.3%
-25.6%
22.3%
123.6%
-2 . %2 8
25.5%
145.9%
-36.3%
Credit Risk Dynamic Mid Cap Small CapHigh Quality
AccrualLarge CapLong Short
1 -Year
Rolling Return
Risk Return matrix of various investment strategies
Large Cap
Multi CapMidcap
Small cap
ST &
AccrualCredit
Dynamic
Long short
0
0.05
0.1
0.15
0.2
0.25
0.3
0 0.05 0.1 0.15 0.2 0.25 0.3 0.35 0.4
Av
era
ge
1 -
ye
ar
roll
ing
pe
rio
d
Standard Deviation (monthly data)
Large Cap Multi Cap Midcap Small cap ST & Accrual Credit Dynamic Long short
APRIL 2022 | ISSUE 112 15
Alpha Strategist | ‘Lollapalooza Effect’
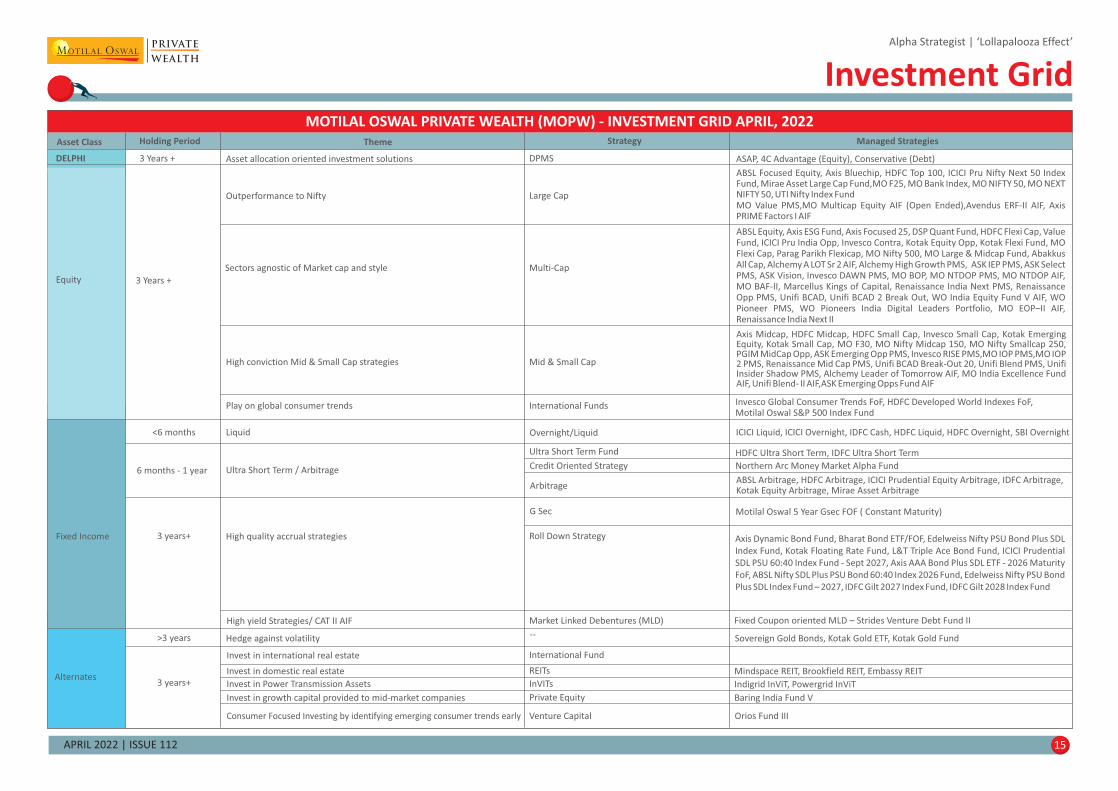
Investment Grid
6 months - 1 year
Fixed Income
Alternates
Ultra Short Term / Arbitrage
3 years+ High quality accrual strategies
Ultra Short Term Fund
Credit Oriented Strategy
Arbitrage
High conviction Mid & Small Cap strategies Mid & Small Cap
Axis Midcap, HDFC Midcap, HDFC Small Cap, Invesco Small Cap, Kotak EmergingEquity, Kotak Small Cap, MO F30, MO Nifty Midcap 150, MO Nifty Smallcap 250,PGIM MidCap Opp, ASK Emerging Opp PMS, Invesco RISE PMS,MO IOP PMS,MO IOP2 PMS, Renaissance Mid Cap PMS, Unifi BCAD Break-Out 20, Unifi Blend PMS, UnifiInsider Shadow PMS, Alchemy Leader of Tomorrow AIF, MO India Excellence FundAIF, Unifi Blend- II AIF,ASK Emerging Opps Fund AIF
MOTILAL OSWAL PRIVATE WEALTH (MO W) - INVESTMENT GRID APRIL 2022P ,
Asset Class Holding Period Theme Strategy
Equity
Outperformance to Nifty
Sectors agnostic of Market cap and style
Large Cap
Multi-Cap
3 Years +
Managed Strategies
ABSL Focused Equity, Axis Bluechip, HDFC Top 100, ICICI Pru Nifty Next 50 IndexFund, Mirae Asset Large Cap Fund,MO F25, MO Bank Index, MO NIFTY 50, MO NEXTNIFTY 50, UTI Nifty Index FundMO Value PMS,MO Multicap Equity AIF (Open Ended),Avendus ERF-II AIF, AxisPRIME Factors I AIF
ABSL Equity, Axis ESG Fund, Axis Focused 25, DSP Quant Fund, HDFC Flexi Cap, ValueFund, ICICI Pru India Opp, Invesco Contra, Kotak Equity Opp, Kotak Flexi Fund, MOFlexi Cap, Parag Parikh Flexicap, MO Nifty 500, MO Large & Midcap Fund, AbakkusAll Cap, Alchemy A LOT Sr 2 AIF, Alchemy High Growth PMS, ASK IEP PMS, ASK SelectPMS, ASK Vision, Invesco DAWN PMS, MO BOP, MO NTDOP PMS, MO NTDOP AIF,MO BAF-II, Marcellus Kings of Capital, Renaissance India Next PMS, RenaissanceOpp PMS, Unifi BCAD, Unifi BCAD 2 Break Out, WO India Equity Fund V AIF, WOPioneer PMS, WO Pioneers India Digital Leaders Portfolio, MO EOP–II AIF,Renaissance India Next II
<6 months Liquid Overnight/Liquid ICICI Liquid, ICICI Overnight, IDFC Cash, HDFC Liquid, HDFC Overnight, SBI Overnight
HDFC Ultra Short Term, IDFC Ultra Short Term
Northern Arc Money Market Alpha Fund
ABSL Arbitrage, HDFC Arbitrage, ICICI Prudential Equity Arbitrage, IDFC Arbitrage,Kotak Equity Arbitrage, Mirae Asset Arbitrage
High yield Strategies/ CAT II AIF Market Linked Debentures (MLD) Fixed Coupon oriented MLD – Strides Venture Debt Fund II
Play on global consumer trends International Funds Invesco Global Consumer Trends FoF, HDFC Developed World Indexes FoF,Motilal Oswal S&P 500 Index Fund
REITsInvest in domestic real estate Mindspace REIT, Brookfield REIT, Embassy REIT
DELPHI 3 Years + Asset allocation oriented investment solutions DPMS ASAP, 4C Advantage (Equity), Conservative (Debt)
InVITsInvest in Power Transmission Assets Indigrid InViT, Powergrid InViT
Invest in growth capital provided to mid-market companies Private Equity Baring India Fund V
Roll Down Strategy Axis Dynamic Bond Fund, Bharat Bond ETF/FOF, Edelweiss Nifty PSU Bond Plus SDL
Index Fund, Kotak Floating Rate Fund, L&T Triple Ace Bond Fund, ICICI Prudential
SDL PSU 60:40 Index Fund - Sept 2027, Axis AAA Bond Plus SDL ETF - 2026 Maturity
FoF, ABSL Nifty SDL Plus PSU Bond 60:40 Index 2026 Fund, Edelweiss Nifty PSU Bond
Plus SDL Index Fund – 2027, IDFC Gilt 2027 Index Fund, IDFC Gilt 2028 Index Fund
G Sec Motilal Oswal 5 Year Gsec FOF ( Constant Maturity)
--Hedge against volatility Sovereign Gold Bonds, Kotak Gold ETF, Kotak Gold Fund>3 years
3 years+
Consumer Focused Investing by identifying emerging consumer trends early Orios Fund IIIVenture Capital
Invest in international real estate International Fund
Alpha Strategist | ‘Lollapalooza Effect’
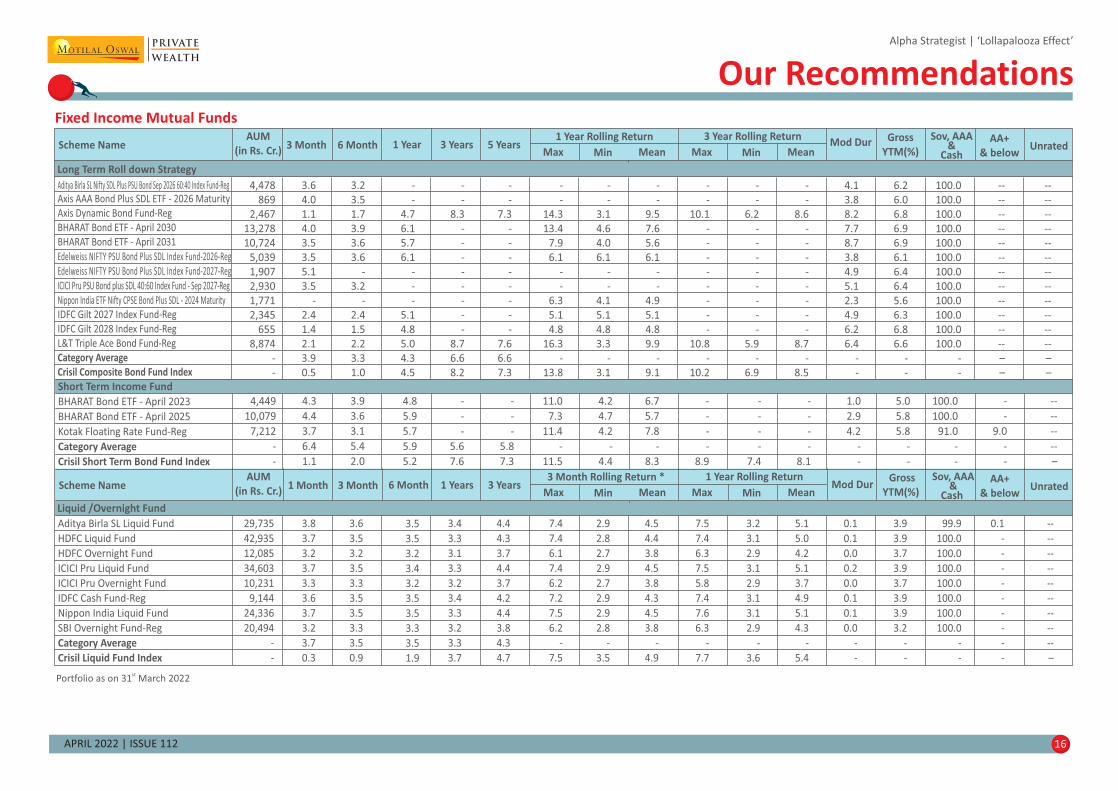
Our RecommendationsFixed Income Mutual Funds
APRIL 2022 | ISSUE 112 16
Aditya Birla SL Liquid Fund
HDFC Liquid Fund
HDFC Overnight Fund
ICICI Pru Liquid Fund
ICICI Pru Overnight Fund
IDFC Cash Fund-Reg
Nippon India Liquid Fund
SBI Overnight Fund-Reg
Category Average
Crisil Liquid Fund Index
Liquid /Overnight Fund
Scheme NameAUM
(in Rs. Cr.)1 Month 3 Month 6 Month 3 Years Mod Dur
Gross
YTM(%)
Sov, AAA&
CashUnrated
3 Month Rolling Return *
Min MinMax Max
1 Year Rolling Return AA+
& below1 Years
Mean Mean
29,735
42,935
12,085
34,603
10,231
9,144
24,336
20,494
-
-
3.8
3.7
3.2
3.7
3.3
3.6
3.7
3.2
3.7
0.3
3.6
3.5
3.2
3.5
3.3
3.5
3.5
3.3
3.5
0.9
3.5
3.5
3.2
3.4
3.2
3.5
3.5
3.3
3.5
1.9
3.4
3.3
3.1
3.3
3.2
3.4
3.3
3.2
3.3
3.7
4.4
4.3
3.7
4.4
3.7
4.2
4.4
3.8
4.3
4.7
7.4
7.4
6.1
7.4
6.2
7.2
7.5
6.2
-
7.5
2.9
2.8
2.7
2.9
2.7
2.9
2.9
2.8
-
3.5
4.5
4.4
3.8
4.5
3.8
4.3
4.5
3.8
-
4.9
7.5
7.4
6.3
7.5
5.8
7.4
7.6
6.3
-
7.7
3.2
3.1
2.9
3.1
2.9
3.1
3.1
2.9
-
3.6
5.1
5.0
4.2
5.1
3.7
4.9
5.1
4.3
-
5.4
0.1
0.1
0.0
0.2
0.0
0.1
0.1
0.0
-
-
3.9
3.9
3.7
3.9
3.7
3.9
3.9
3.2
-
-
99.9
100.0
100.0
100.0
100.0
100.0
100.0
100.0
-
-
0.1
-
-
-
-
-
-
-
-
-
--
--
--
--
--
--
--
--
--
–
Long Term Roll down Strategy
Scheme NameAUM
(in Rs. Cr.)3 Month 6 Month 1 Year 5 Years Mod Dur Gross
YTM(%)
Sov, AAA&
CashUnrated
1 Year Rolling Return
Min MinMax Max
3 Year Rolling Return AA+
& below3 Years
Mean Mean
BHARAT Bond ETF - April 2023
BHARAT Bond ETF - April 2025
Kotak Floating Rate Fund-Reg
Category Average
Crisil Short Term Bond Fund Index
Short Term Income Fund
4,449
10,079
7,212
-
-
4.3
4.4
3.7
6.4
1.1
3.9
3.6
3.1
5.4
2.0
4.8
5.9
5.7
5.9
5.2
-
-
-
5.6
7.6
-
-
-
5.8
7.3
11.0
7.3
11.4
-
11.5
4.2
4.7
4.2
-
4.4
6.7
5.7
7.8
-
8.3
-
-
-
-
8.9
-
-
-
-
7.4
-
-
-
-
8.1
1.0
2.9
4.2
-
-
5.0
5.8
5.8
-
-
100.0
100.0
91.0
-
-
-
-
9.0
-
-
--
--
--
--
–
4,478
869
2,467
13,278
10,724
5,039
1,907
2,930
1,771
2,345
655
8,874
-
-
3.6
4.0
1.1
4.0
3.5
3.5
5.1
3.5
-
2.4
1.4
2.1
3.9
0.5
3.2
3.5
1.7
3.9
3.6
3.6
-
3.2
-
2.4
1.5
2.2
3.3
1.0
-
-
4.7
6.1
5.7
6.1
-
-
-
5.1
4.8
5.0
4.3
4.5
-
-
8.3
-
-
-
-
-
-
-
-
8.7
6.6
8.2
-
-
7.3
-
-
-
-
-
-
-
-
7.6
6.6
7.3
-
-
14.3
13.4
7.9
6.1
-
-
6.3
5.1
4.8
16.3
-
13.8
-
-
3.1
4.6
4.0
6.1
-
-
4.1
5.1
4.8
3.3
-
3.1
-
-
9.5
7.6
5.6
6.1
-
-
4.9
5.1
4.8
9.9
-
9.1
-
-
10.1
-
-
-
-
-
-
-
-
10.8
-
10.2
-
-
6.2
-
-
-
-
-
-
-
-
5.9
-
6.9
-
-
8.6
-
-
-
-
-
-
-
-
8.7
-
8.5
4.1
3.8
8.2
7.7
8.7
3.8
4.9
5.1
2.3
4.9
6.2
6.4
-
-
6.2
6.0
6.8
6.9
6.9
6.1
6.4
6.4
5.6
6.3
6.8
6.6
-
-
100.0
100.0
100.0
100.0
100.0
100.0
100.0
100.0
100.0
100.0
100.0
100.0
-
-
--
--
--
--
--
--
--
--
--
--
--
--
–
–
--
--
--
--
--
--
--
--
--
--
--
--
–
–
Axis AAA Bond Plus SDL ETF - 2026 Maturity
Axis Dynamic Bond Fund-Reg
BHARAT Bond ETF - April 2030
BHARAT Bond ETF - April 2031
IDFC Gilt 2027 Index Fund-Reg
IDFC Gilt 2028 Index Fund-Reg
L&T Triple Ace Bond Fund-Reg
Category Average
Crisil Composite Bond Fund Index
Aditya Birla SL Nifty SDL Plus PSU Bond Sep 2026 60:40 Index Fund-Reg
Edelweiss NIFTY PSU Bond Plus SDL Index Fund-2026-Reg
Edelweiss NIFTY PSU Bond Plus SDL Index Fund-2027-Reg
ICICI Pru PSU Bond plus SDL 40:60 Index Fund - Sep 2027-Reg
Nippon India ETF Nifty CPSE Bond Plus SDL - 2024 Maturity
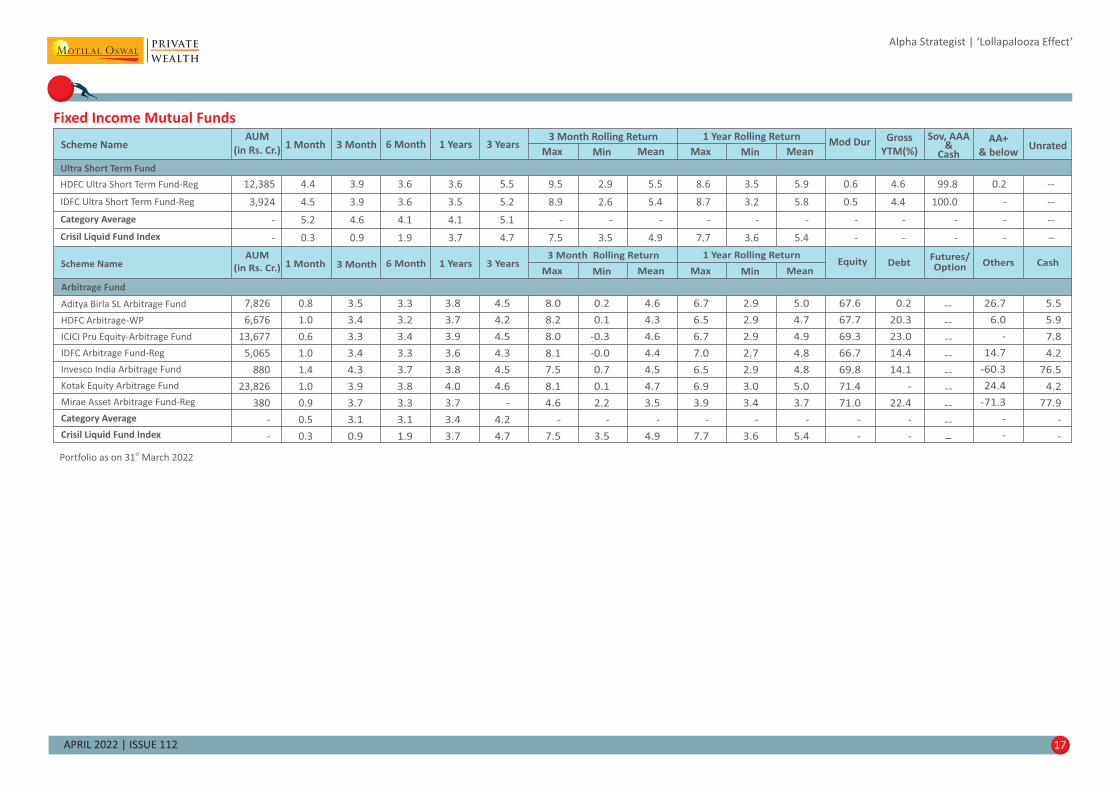
Portfolio as on 20231 March 2st
APRIL 2022 | ISSUE 112 17
Alpha Strategist | ‘Lollapalooza Effect’
Portfolio as on 20231 March 2st
Fixed Income Mutual Funds
Arbitrage Fund
Aditya Birla SL Arbitrage Fund
HDFC Arbitrage-WP
ICICI Pru Equity-Arbitrage Fund
IDFC Arbitrage Fund-Reg
Invesco India Arbitrage Fund
Kotak Equity Arbitrage Fund
Mirae Asset Arbitrage Fund-Reg
Category Average
Crisil Liquid Fund Index
26.7
6.0
-
14.7
-60.3
24.4
-71.3
-
-
5.5
5.9
7.8
4.2
76.5
4.2
77.9
-
-
Scheme NameAUM
(in Rs. Cr.) 1 Month 3 Month 6 Month 3 Years Equity DebtFutures/Option Cash
3 Month Rolling Return
Min MinMax Max
1 Year Rolling ReturnOthers1 Years
Mean Mean
7,826
6,676
13,677
5,065
880
23,826
380
-
-
0.8
1.0
0.6
1.0
1.4
1.0
0.9
0.5
0.3
3.5
3.4
3.3
3.4
4.3
3.9
3.7
3.1
0.9
3.3
3.2
3.4
3.3
3.7
3.8
3.3
3.1
1.9
3.8
3.7
3.9
3.6
3.8
4.0
3.7
3.4
3.7
4.5
4.2
4.5
4.3
4.5
4.6
-
4.2
4.7
8.0
8.2
8.0
8.1
7.5
8.1
4.6
-
7.5
0.2
0.1
-0.3
-0.0
0.7
0.1
2.2
-
3.5
4.6
4.3
4.6
4.4
4.5
4.7
3.5
-
4.9
6.7
6.5
6.7
7.0
6.5
6.9
3.9
-
7.7
2.9
2.9
2.9
2.7
2.9
3.0
3.4
-
3.6
5.0
4.7
4.9
4.8
4.8
5.0
3.7
-
5.4
67.6
67.7
69.3
66.7
69.8
71.4
71.0
-
-
0.2
20.3
23.0
14.4
14.1
-
22.4
-
-
--
--
--
--
--
--
--
--
–
HDFC Ultra Short Term Fund-Reg
IDFC Ultra Short Term Fund-Reg
Category Average
Crisil Liquid Fund Index
Scheme NameAUM
(in Rs. Cr.)1 Month 3 Month 6 Month 3 Years Mod Dur Gross
YTM(%)
Sov, AAA&
CashUnrated
3 Month Rolling Return
Min MinMax Max
1 Year Rolling Return AA+
& below1 Years
Mean Mean
Ultra Short Term Fund
12,385
3,924
-
-
4.4
4.5
5.2
0.3
3.9
3.9
4.6
0.9
3.6
3.6
4.1
1.9
3.6
3.5
4.1
3.7
5.5
5.2
5.1
4.7
9.5
8.9
-
7.5
2.9
2.6
-
3.5
5.5
5.4
-
4.9
8.6
8.7
-
7.7
3.5
3.2
-
3.6
5.9
5.8
-
5.4
0.6
0.5
-
-
4.6
4.4
-
-
99.8
100.0
-
-
0.2
-
-
-
--
--
--
–

APRIL 2022 | ISSUE 112 18
ASAP – The Big Picture!
ASAP - Simple Equal-Weight Portfolio…
Alpha Strategist | ‘Lollapalooza Effect’
DELPHI
1990 1991 1992 1993 1994 1995 1996 1997 1998 1999 2000 2001 2002 2003 2004 2005
Equity-IND Equity-IND Equity-IND Equity-IND Equity-IND Equity-US Equity-US Equity-US Equity-US Equity-IND Debt Debt Gold Equity-IND Equity-IND Equity-IND
34.4% 82.1% 37.0% 27.9% 17.4% 50.4% 22.6% 43.3% 37.3% 63.8% 9.0% 8.5% 24.1% 71.9% 10.7% 36.3%
ASAP Equity-US Equity-US Gold Debt Gold Debt Equity-IND Debt Equity-US Cash Cash Debt ASAP ASAP ASAP
10.4% 79.8% 17.3% 27.1% 13.0% 13.3% 12.0% 18.6% 10.5% 22.5% 5.6% 6.4% 12.7% 27.1% 6.7% 14.5%
Debt ASAP ASAP ASAP Cash Debt Cash ASAP ASAP ASAP Gold Gold Cash Equity-US Cash Gold
9.0% 42.2% 16.7% 18.8% 7.0% 13.0% 9.4% 13.2% 9.2% 20.7% 1.3% 5.9% 6.4% 20.2% 4.0% 13.6%
Cash Gold Cash Equity-US ASAP ASAP ASAP Debt Gold Debt ASAP ASAP ASAP Gold Equity-US Equity-US
8.0% 31.3% 12.1% 16.5% 6.6% 12.9% 8.0% 11.0% 8.1% 9.0% -1.7% -1.4% 4.4% 13.5% 3.8% 6.8%
Gold Debt Debt Debt Equity-US Cash Equity-IND Cash Cash Cash Equity-US Equity-US Equity-IND Debt Gold Debt
2.3% 9.0% 11.0% 12.0% -1.9% 8.8% -0.8% 7.0% 6.5% 5.7% -3.7% -10.1% 2.7% 8.1% 0.5% 4.8%
Equity-US Cash Gold Cash Gold Equity-IND Gold Gold Equity-IND Gold Equity-IND Equity-IND Equity-US Cash Debt Cash
-1.5% 9.0% 6.3% 10.3% -2.3% -20.8% -3.2% -14.0% -16.5% 2.4% -20.6% -17.9% -23.8% 4.6% -0.3% 4.6%
2006 2007 2008 2009 2010 2011 2012 2013^ 2014 2015 2016 2017 2018 2019 2020 2021 2022*
Equity-INDEquity-IND Gold Equity-IND Gold Gold Equity-IND Equity-US Equity-IND Debt Debt Equity-IND Gold Equity-US Gold Equity-US Gold
39.8% 54.8% 26.1% 75.8% 23.2% 31.7% 27.7% 45.6% 31.4% 8.6% 12.9% 28.6% 7.9% 31.9% 28.0% 29.1% 7.1%
Gold Gold Debt ASAP Equity-IND Equity-US Equity-US ASAP Debt Cash Equity-US ASAP Cash Gold Equity-US Equity-IND Cash
20.3% 16.0% 9.1% 29.4% 17.9% 18.7% 17.5% 12.2% 14.3% 8.2% 12.5% 12.4% 7.6% 23.8% 18.3% 24.1% 0.9%
ASAP ASAP Cash Gold ASAP ASAP ASAP Cash ASAP Equity-US Gold Equity-US Debt ASAP ASAP ASAP Equity-IND
15.4% 14.0% 8.4% 24.2% 11.6% 8.3% 15.3% 9.0% 14.2% 4.2% 11.3% 12.3% 5.9% 16.6% 16.7% 13.7% 0.6%
Equity-US Cash ASAP Equity-US Equity-US Cash Gold Equity-IND Equity-US ASAP ASAP Cash ASAP Equity-INDEquity-IND Cash ASAP
11.7% 7.5% -7.6% 17.7% 8.4% 8.2% 12.3% 6.8% 13.6% 3.1% 9.9% 6.7% 3.8% 12.0% 14.9% 3.6% 0.6%
Cash Debt Equity-US Cash Cash Debt Debt Debt Cash Equity-IND Cash Gold Equity-IND Debt Debt Debt Debt
6.0% 6.9% -23.8% 4.9% 5.1% 6.9% 9.4% 3.8% 9.2% -4.1% 7.5% 5.1% 3.2% 10.7% 12.3% 3.4% 0.5%
Debt Equity-US Equity-IND Debt Debt Equity-IND Cash Gold Gold Gold Equity-IND Debt Equity-US Cash Cash Gold Equity-US
4.0% -7.8% -51.8% 3.5% 5.0% -24.6% 8.5% -4.5% -7.9% -6.6% 3.0% 4.7% 2.4% 6.9% 4.6% -4.2% -3.0%
*CAGR is for period 1990 to 31st March 2022; Data updated as of 31st Mar'22. Equity-IND is represented by Sensex from 1990 to 2002 and Nifty 50 from 2002 onwards; Debt is represented by SBI 1-yr FD rates from 1990 to 2002 and CRISIL Composite bond
Index from 2002 onwards; Cash is represented by SBI 3-month FD rates from 1990 to 2002 and CRISIL Liquid fund Index from 2002 onwards; Gold is represented by Gold USD Spot Price conversion into INR from 1990 to 2005 and MCX Spot Gold price in INR
from 2006 till date; Equity-US is represented by S&P 500 in INR terms; Source: AceMF; Bloomberg
Note: ASAP Portfolio (Equity Sensex 1990-2002,Nifty200-2012 and MF Model Portfolio 2013 onwards; Debt: SBI 1 yr 1990-2002; CRISIL Composite 2002-2012, Debt only Model Portfolio 2013 onwards; Cash- SBI 3 month deposit 1900-2002; HDFC liquid (g)-
REG 2002-2012;HEFC Liquid (G)- Direct 2013 onwards; Gold is represented by Gold USD Spot Price conversion into INR from 1990 to 2005 and MCX Spot Gold price in INR from 2006 till date; S&P 500 in INR 1990 onwards Disclaimer :Past Performance is no
guarantee of future Results
^ For ASAP: Model Portfolios are used from 2012 onwards; ASAP - Alpha Strategist Advantage Portfolio
Data up to 31st March 2022. Returns are represented on CY basis. Equity-IND is represented by Sensex from 1990 to 2002 and Nifty 50 from 2002 onwards; Debt is represented by SBI 1-yr FD rates from 1990 to 2002 and CRISIL Composite bond Index from 2002 onwards; Cash is
represented by SBI 3-month FD rates from 1990 to 2002 and CRISIL Liquid fund Index from 2002 onwards; Gold is represented by Gold USD Spot Price conversion into INR from 1990 to 2005 and MCX Spot Gold price in INR from 2006 till date; Equity-US is represented by S&P 500 in INR
terms; Source: AceMF; Bloomberg
Note: ASAP Portfolio (Equity Sensex 1990-2002,Nifty200-2012 and MF Model Portfolio 2013 onwards; Debt: SBI 1 yr 1990-2002; CRISIL Composite 2002-2012, Debt only Model Portfolio 2013 onwards; Cash- SBI 3 month deposit 1900-2002; HDFC liquid (g)- REG 2002-
2012;HEFC Liquid (G)- Direct 2013 onwards; Gold is represented by Gold USD Spot Price conversion into INR from 1990 to 2005 and MCX Spot Gold price in INR from 2006 till date; S&P 500 in INR 1990 onwards
ASAP - Alpha StrategistAdvantage Portfolio
Asset Class Equity-IND Equity-US Debt Cash Gold ASAP
CAGR from 1990 to 2022* 14.0% 13.3% 8.4% 7.1% 10.0% 11.9%
Standard Deviation 27.6% 15.0% 2.6% 0.6% 14.9% 8.0%
Maximum Drawdown -55.1% -45.9% -6.3% 0.0% -25.1% -11.4%
Maximum Returns - 3Y 59.6% 41.1% 12.7% 10.6% 32.2% 27.1%
Minimum Returns - 3Y -15.7% -14.9% 2.4% 4.4% -7.3% 0.1%
Average Returns - 3Y 12.6% 13.3% 8.6% 7.1% 10.2% 11.4%
Positive Observations (%) - 3Y 84.7% 81.8% 100.0% 100.0% 83.8% 100.0%
Returns Distribution
(3Y Rolling Returns)
% Observations
Equity-IND Equity-US Debt Cash Gold ASAP
-20% to -10% 3.1% 4.5%
-10% to 0% 12.2% 13.6% 16.2%
0% to 6% 21.0% 9.7% 15.3% 24.1% 19.9% 10.3%
6% to 10% 15.3% 8.5% 55.7% 70.5% 12.8% 24.7%
10% to 15% 17.6% 20.2% 29.0% 5.4% 19.6% 52.3%
15% to 20% 7.7% 13.9% 13.6% 7.4%
20% to 30% 8.2% 16.5% 17.3% 5.4%
Above 30% 15.6% 13.8% 0.6%

APRIL 2022 | ISSUE 112 19
Alpha Strategist | ‘Lollapalooza Effect’
DELPHI
4C – Average Rolling Returns
4C – Average Rolling Returns
ASAP – Time Window Performance
Data up to 31st Mar 2022. Source: AceMF; Bloomberg, MOPWM Disclaimer :Past Performance is no guarantee of future Results
For ASAP: Model Portfolios are used from 2012 onwards; ASAP - Alpha Strategist Advantage Portfolio
*Note: ASAP Portfolio (Equity - Nifty2000-2012 and MF Model Portfolio 2013 onwards; Debt - CRISIL Composite 2002-2012, Debt only Model Portfolio 2013 onwards; Cash- HDFC liquid (g)- REG 2002-2012; HEFC Liquid (G)-
Direct 2013 onwards; Gold – MCX Gold sport Price; S&P 500 in INR terms
Data up to 31st Mar’2022; Rolling Returns Analysis is from Oct’12 to Mar’22
Source: AceMF; Bloomberg, ACEMF, MOPWM Disclaimer :Past Performance is no guarantee of future Results Conservative consist of MOPWM Debt Model Portfolio
Data up to 28th Feb’2022; Rolling Returns Period of Analysis is Oct’12 to Feb’22
Source: AceMF; Bloomberg, MOPWM Disclaimer :Past Performance is no guarantee of future Results 4C Advantage Portfolio consist of MOPWM MF Model Portfolio
Performance as on 31/03/2022 Absolute CAGR(%)
Strategy 1M 3M 6M 1Y 2Y 3Y 5Y 7Y 10Y
ASAP* 2.1% 0.6% 3.6% 13.6% 19.0% 14.0% 11.6% 10.5% 11.0%
Nifty 50 4.0% 0.6% -0.9% 18.9% 42.5% 14.5% 13.7% 10.8% 12.7%
S&P 500 – INR 4.2% -3.0% 7.4% 18.3% 32.6% 20.5% 17.5% 15.0% 17.0%
Gold – INR 1.7% 7.1% 12.5% 16.6% 7.1% 17.5% 12.5% 10.1% 6.2%
Crisil Composite 0.2% 0.5% 1.0% 4.5% 6.1% 8.2% 7.3% 8.0% 8.4%
Crisil Liquid 0.3% 0.9% 1.9% 3.7% 3.9% 4.7% 5.7% 6.2% 7.0%
17.1%
14.2%
12.4% 12.5%
17.3%
14.1%
12.5%13.0%
1Y 2Y 3Y 5Y
Average Rolling Returns
4c Nifty 500 TRI
Performance as on 31/03/2022 Annualized CAGR(%)
Strategy 1M 3M 6M 1Y 2Y 3Y 5Y 7Y
Conservative 4.3% 3.5% 3.2% 5.5% 6.7% 8.2% 7.5% 7.7%
Crisil Composite 2.5% 1.9% 2.1% 4.5% 6.1% 8.2% 7.3% 8.0%
8.76%
9.03%
8.80%
8.59%8.64%
9.07%
8.96%
8.62%
1Y 2Y 3Y 5Y
Average Rolling Returns
Conservative CRISIL Composite Bond
This document is not valid without disclosure; refer the last page for the disclosure
APRIL 2022 | ISSUE 112 20
Alpha Strategist | ‘Lollapalooza Effect’
Section II
Macro Economy...................................................................................................21
Equities...............................................................................................................25
Fixed Income.......................................................................................................29
Gold....................................................................................................................33
Sources: BNP Paribas MF, tradingeconomics.com, SIAM (www.siam.in), Petroleum Planning & Analysis Cell
(https://www.ppac.gov.in/content/147_1_ConsumptionPetroleum.aspx), RBI (https://rbi.org.in/Scripts/Data_MSupply.aspx)
(https://www.rbi.org.in/Scripts/BS_NSDPDisplay.aspx?param=4)
*Only central government expenditure has been considered
Alpha Strategist | ‘Lollapalooza Effect’
Macro Economy
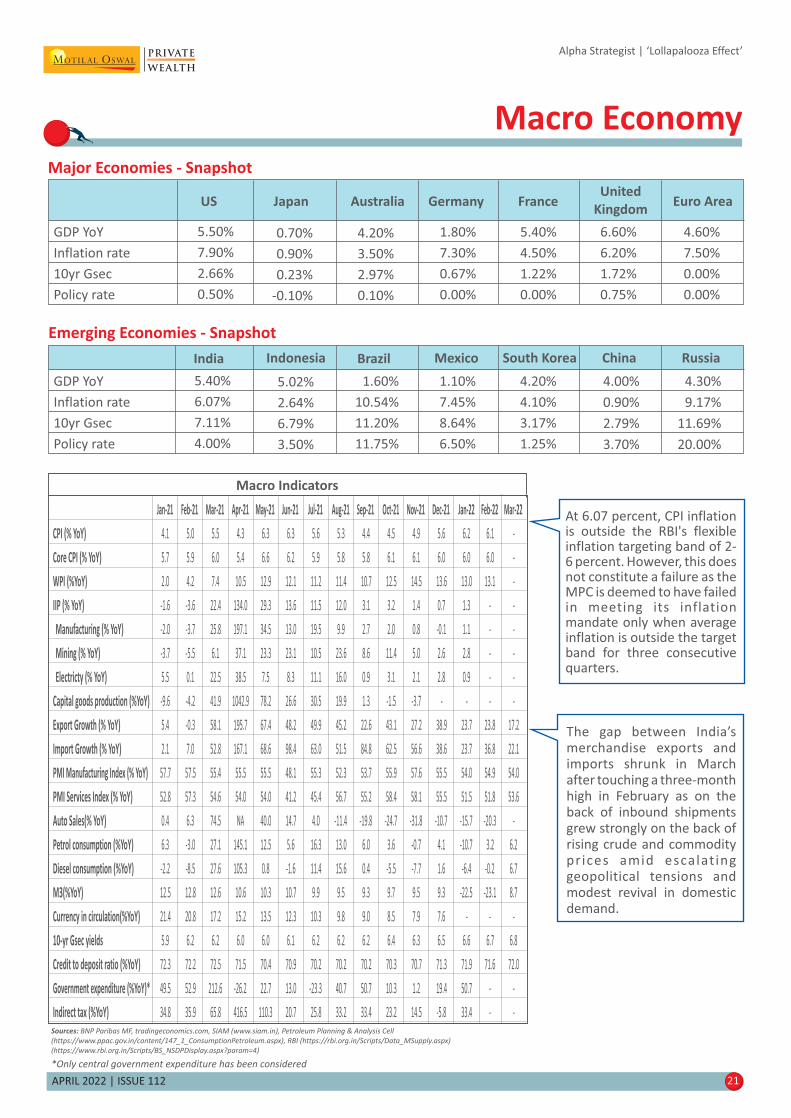
Emerging Economies - Snapshot
Major Economies - Snapshot
GDP YoY
Inflation rate
10yr Gsec
Policy rate
5.50%
7.90%
2.66%
0.50%
0.70%
0.90%
0.23%
-0.10%
4.20%
3.50%
2.97%
0.10%
1.80%
7.30%
0.67%
0.00%
5.40%
4.50%
1.22%
0.00%
6.60%
6.20%
1.72%
0.75%
4.60%
7.50%
0.00%
0.00%
US Japan Australia Germany FranceUnited
KingdomEuro Area
GDP YoY
Inflation rate
10yr Gsec
Policy rate
5.40%
6.07%
7.11%
4.00%
1.60%
10.54%
11.20%
11.75%
1.10%
7.45%
8.64%
6.50%
4.20%
4.10%
3.17%
1.25%
4.00%
0.90%
2.79%
3.70%
4.30%
9.17%
11.69%
20.00%
India
5.02%
2.64%
6.79%
3.50%
Indonesia Brazil Mexico South Korea RussiaChina
APRIL 2022 | ISSUE 112 21
At 6.07 percent, CPI inflationis outside the RBI's flexibleinflation targeting band of 2-6 percent. However, this doesnot constitute a failure as theMPC is deemed to have failedin meeting its inflationmandate only when averageinflation is outside the targetband for three consecutivequarters.
The gap between India’smerchandise exports andimports shrunk in Marchafter touching a three-monthhigh in February as on theback of inbound shipmentsgrew strongly on the back ofrising crude and commodityprices amid escalat inggeopolitical tensions andmodest revival in domesticdemand.
Macro ndicatorsI
Jan-21 Feb-21 Mar-21 Apr-21 May-21 Jun-21 Jul-21 Aug-21 Sep-21 Oct-21 Nov-21 Dec-21 Jan-22 Feb-22 Mar-22
CPI (% YoY) 4.1 5.0 5.5 4.3 6.3 6.3 5.6 5.3 4.4 4.5 4.9 5.6 6.2 6.1 -
Core CPI (% YoY) 5.7 5.9 6.0 5.4 6.6 6.2 5.9 5.8 5.8 6.1 6.1 6.0 6.0 6.0 -
WPI (%YoY) 2.0 4.2 7.4 10.5 12.9 12.1 11.2 11.4 10.7 12.5 14.5 13.6 13.0 13.1 -
IIP (% YoY) -1.6 -3.6 22.4 134.0 29.3 13.6 11.5 12.0 3.1 3.2 1.4 0.7 1.3 - -
Manufacturing (% YoY) -2.0 -3.7 25.8 197.1 34.5 13.0 19.5 9.9 2.7 2.0 0.8 -0.1 1.1 - -
Mining (% YoY) -3.7 -5.5 6.1 37.1 23.3 23.1 10.5 23.6 8.6 11.4 5.0 2.6 2.8 - -
Electricty (% YoY) 5.5 0.1 22.5 38.5 7.5 8.3 11.1 16.0 0.9 3.1 2.1 2.8 0.9 - -
Capital goods production (%YoY) -9.6 -4.2 41.9 1042.9 78.2 26.6 30.5 19.9 1.3 -1.5 -3.7 - - - -
Export Growth (% YoY) 5.4 -0.3 58.1 195.7 67.4 48.2 49.9 45.2 22.6 43.1 27.2 38.9 23.7 23.8 17.2
Import Growth (% YoY) 2.1 7.0 52.8 167.1 68.6 98.4 63.0 51.5 84.8 62.5 56.6 38.6 23.7 36.8 22.1
PMI Manufacturing Index (% YoY) 57.7 57.5 55.4 55.5 55.5 48.1 55.3 52.3 53.7 55.9 57.6 55.5 54.0 54.9 54.0
PMI Services Index (% YoY) 52.8 57.3 54.6 54.0 54.0 41.2 45.4 56.7 55.2 58.4 58.1 55.5 51.5 51.8 53.6
Auto Sales(% YoY) 0.4 6.3 74.5 NA 40.0 14.7 4.0 -11.4 -19.8 -24.7 -31.8 -10.7 -15.7 -20.3 -
Petrol consumption (%YoY) 6.3 -3.0 27.1 145.1 12.5 5.6 16.3 13.0 6.0 3.6 -0.7 4.1 -10.7 3.2 6.2
Diesel consumption (%YoY) -2.2 -8.5 27.6 105.3 0.8 -1.6 11.4 15.6 0.4 -5.5 -7.7 1.6 -6.4 -0.2 6.7
M3(%YoY) 12.5 12.8 12.6 10.6 10.3 10.7 9.9 9.5 9.3 9.7 9.5 9.3 -22.5 -23.1 8.7
Currency in circulation(%YoY) 21.4 20.8 17.2 15.2 13.5 12.3 10.3 9.8 9.0 8.5 7.9 7.6 - - -
10-yr Gsec yields 5.9 6.2 6.2 6.0 6.0 6.1 6.2 6.2 6.2 6.4 6.3 6.5 6.6 6.7 6.8
Credit to deposit ratio (%YoY) 72.3 72.2 72.5 71.5 70.4 70.9 70.2 70.2 70.2 70.3 70.7 71.3 71.9 71.6 72.0
Government expenditure (%YoY)* 49.5 52.9 212.6 -26.2 22.7 13.0 -23.3 40.7 50.7 10.3 1.2 19.4 50.7 - -
Indirect tax (%YoY) 34.8 35.9 65.8 416.5 110.3 20.7 25.8 33.2 33.4 23.2 14.5 -5.8 33.4 - -
APRIL 2022 | ISSUE 112 22
Global Economy
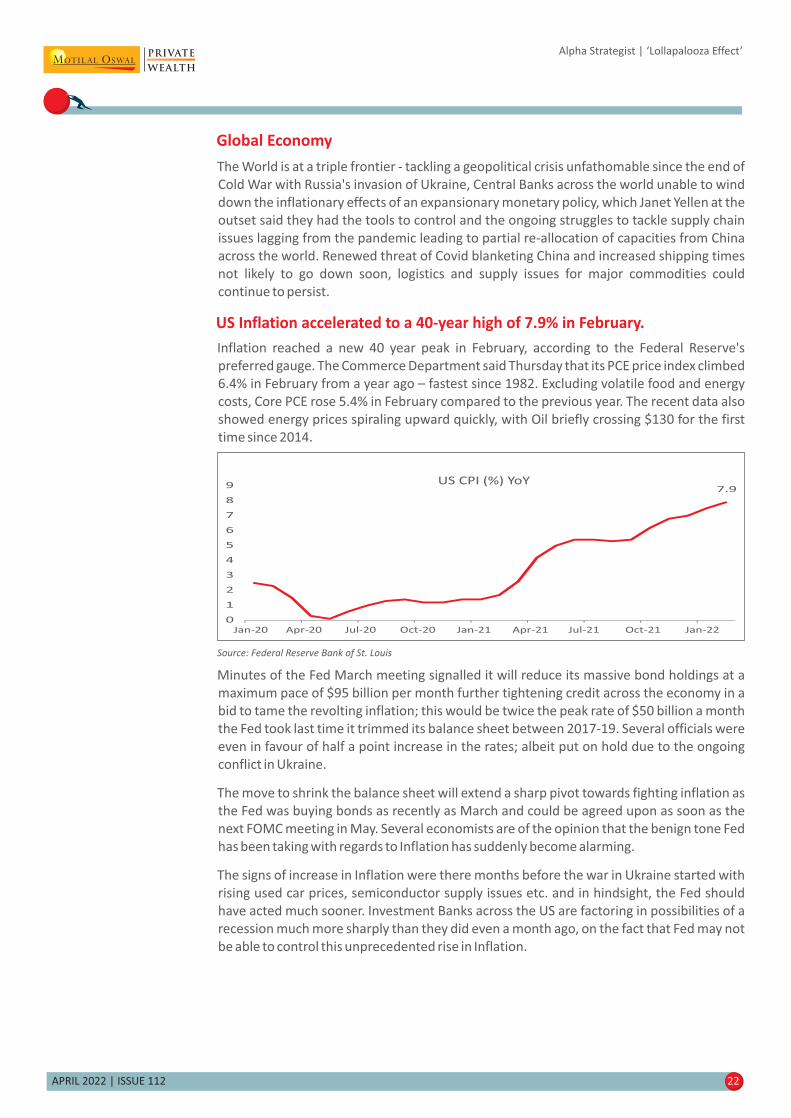
US Inflation accelerated to a 40-year high of 7.9% in February.
Inflation reached a new 40 year peak in February, according to the Federal Reserve's
preferred gauge. The Commerce Department said Thursday that its PCE price index climbed
6.4% in February from a year ago – fastest since 1982. Excluding volatile food and energy
costs, Core PCE rose 5.4% in February compared to the previous year. The recent data also
showed energy prices spiraling upward quickly, with Oil briefly crossing $130 for the first
time since 2014.
Alpha Strategist | ‘Lollapalooza Effect’
The World is at a triple frontier - tackling a geopolitical crisis unfathomable since the end of
Cold War with Russia's invasion of Ukraine, Central Banks across the world unable to wind
down the inflationary effects of an expansionary monetary policy, which Janet Yellen at the
outset said they had the tools to control and the ongoing struggles to tackle supply chain
issues lagging from the pandemic leading to partial re-allocation of capacities from China
across the world. Renewed threat of Covid blanketing China and increased shipping times
not likely to go down soon, logistics and supply issues for major commodities could
continue to persist.
Source: Federal Reserve Bank of St. Louis
Minutes of the Fed March meeting signalled it will reduce its massive bond holdings at a
maximum pace of $95 billion per month further tightening credit across the economy in a
bid to tame the revolting inflation; this would be twice the peak rate of $50 billion a month
the Fed took last time it trimmed its balance sheet between 2017-19. Several officials were
even in favour of half a point increase in the rates; albeit put on hold due to the ongoing
conflict in Ukraine.
The move to shrink the balance sheet will extend a sharp pivot towards fighting inflation as
the Fed was buying bonds as recently as March and could be agreed upon as soon as the
next FOMC meeting in May. Several economists are of the opinion that the benign tone Fed
has been taking with regards to Inflation has suddenly become alarming.
The signs of increase in Inflation were there months before the war in Ukraine started with
rising used car prices, semiconductor supply issues etc. and in hindsight, the Fed should
have acted much sooner. Investment Banks across the US are factoring in possibilities of a
recession much more sharply than they did even a month ago, on the fact that Fed may not
be able to control this unprecedented rise in Inflation.
7.9
0
1
2
3
4
5
6
7
8
9
Jan-20 Apr-20 Jul-20 Oct-20 Jan-21 Apr-21 Jul-21 Oct-21 Jan-22
US CPI (%) YoY
APRIL 2022 | ISSUE 112 23
Alpha Strategist | ‘Lollapalooza Effect’
Indian Economy
Current Account deficit widens to 2.7% in Q3FY22
India's current account balance stood at USD23b (or 2.7% of GDP) in 3QFY22, higher than
USD10b (or 1.3% of GDP) in 2QFY22. It implies a CAD of USD26.5b (or 1.2% of GDP) in
9MFY22 as compared to a surplus of USD32.1b (or 1.7% of GDP) in 9MFY21.
Wider CAD was on account of larger merchandise trade deficit, which stood at 7.2% of GDP
(or USD60.4b), after a deficit of 5.9% of GDP (or USD44.5b) in 2QFY22. Higher imports (up
52% YoY in 3QFY22) vis-à-vis exports (up 41% YoY) led to a wider merchandise deficit.
The quantum of hit from crude related products is clearly visible here; excluding petroleum
products, India had a current account surplus of 0.8% of GDP, lower than 2.2% of GDP in
2QFY22. Excluding gold, India had a current account deficit of 1.1% of GDP in 2QFY22.
FII Outflows for the last quarter of FY22 stood at $13.5 bn, compared to $4.8 bn in the
previous quarter. What was more surprising is that DII Inflow almost stemmed the outflow
with $11.5 bn inflow in the last quarter. Going forward, a further widening of the
merchandise trade deficit in 4QFY22 could take the current account deficit to 1.5% of GDP
in FY22 as against a surplus of 0.9% in FY21.
Not unlike the global economy, India is plagued by its own set of challenges; Prominently
being an oil importing country, higher oil prices were bound to hurt economic growth; With
crude oil prices remaining above USD100/bbl, OMCs have started to pass on the increase to
consumers. The ~INR10/litre hike in petrol and diesel prices is likely to raise freight costs for
companies as well as impact consumer sentiment.
This was also highlighted in RBI's April commentary where Inflation projections were
revised upwards for FY23 to 5.7% from 4.5% just this Feb largely on account of higher
energy prices emanating from the Russia-Ukraine War; It also adjusted growth
expectations to a modest 7.2% from 7.8% previously with the latter half growth expected at
a tepid 4%. Despite headwinds, the MPC kept all policy rates unchanged in a unanimous
decision and maintained its accommodative stance to not hinder economic growth in a bid
to control inflation as RBI had stated earlier. Overall, it is clear that monetary policy
normalization in India has begun.
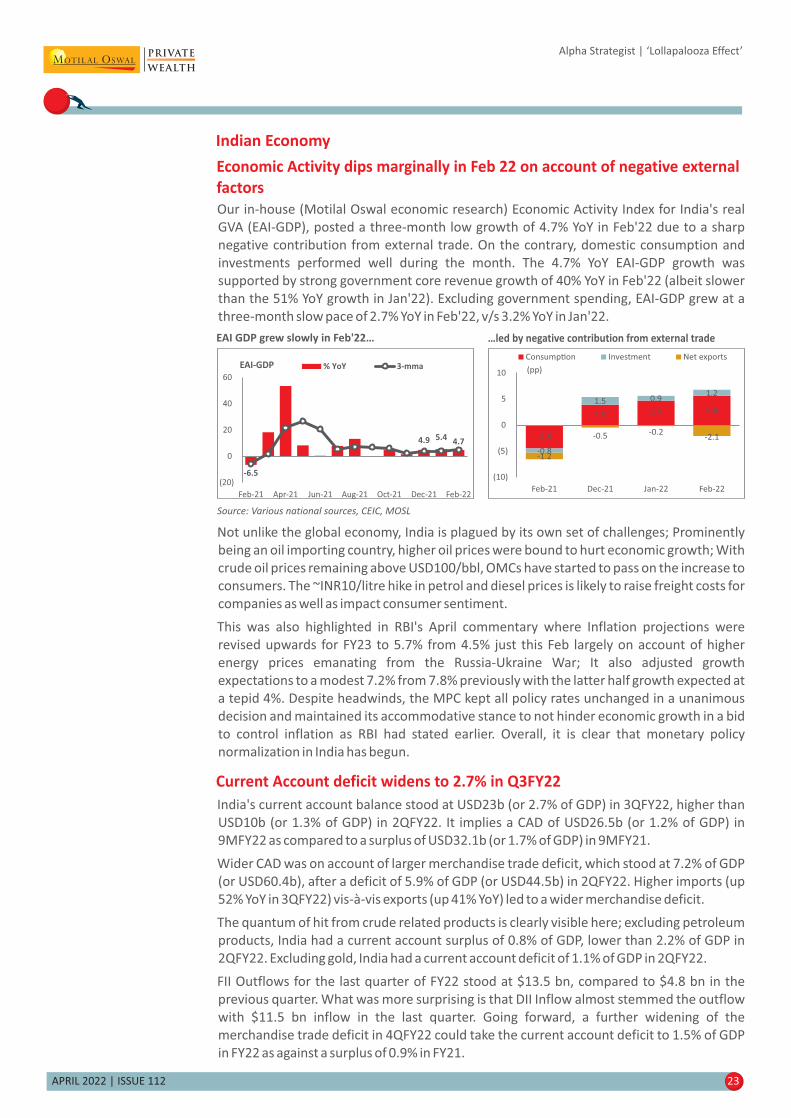
Economic Activity dips marginally in Feb 22 on account of negative external
factors
Our in-house (Motilal Oswal economic research) Economic Activity Index for India's real
GVA (EAI-GDP), posted a three-month low growth of 4.7% YoY in Feb'22 due to a sharp
negative contribution from external trade. On the contrary, domestic consumption and
investments performed well during the month. The 4.7% YoY EAI-GDP growth was
supported by strong government core revenue growth of 40% YoY in Feb'22 (albeit slower
than the 51% YoY growth in Jan'22). Excluding government spending, EAI-GDP grew at a
three-month slow pace of 2.7% YoY in Feb'22, v/s 3.2% YoY in Jan'22.
Source: Various national sources, CEIC, MOSL
EAI GDP grew slowly in Feb'22… …led by negative contribution from external trade
-6.5
4.9 5.44.7
(20)
0
20
40
60
Feb-21 Apr-21 Jun-21 Aug-21 Oct-21 Dec-21 Feb-22
EAI-GDP % YoY 3-mma
-4.5
3.9 4.7 5.6
-0.8
1.5 0.91.2
-1.2
-0.5 -0.2-2.1
(10)
(5)
0
5
10
Feb-21 Dec-21 Jan-22 Feb-22
Consump�on Investment Net exports
(pp)

APRIL 2022 | ISSUE 112 24
Alpha Strategist | ‘Lollapalooza Effect’
Source: Motilal Oswal Economic Research
GST Collection hits an all-time high in March of INR 1.42 trillion
A domestic economic recovery provides relief, with multiple indicators not least GST
collections but also power demand, e-invoice etc. suggesting a good pick-up. Average
monthly GST collections rose 35.5% YoY to INR1.24t in FY22. Total Goods & Services Tax
(GST) collections in FY22(P), at INR14.9 tn have exceeded FY22RE (revised estimate) level of
INR13.5t by ~10%. This indicates a 35.5% YoY growth over collections of INR11t in FY21
compared with an envisaged growth of 23% YoY in the Union Budget 2022.
Therefore, our outlook on the likely surplus of ~INR2 tn in government's total receipts still
remains intact. What remains to be seen is whether the government utilizes this surplus to
spend more and maintain its FY22RE fiscal deficit of 6.9% of GDP or reduce it.
Source: Motilal Oswal Economic Research
8.9
11.6 12.011.0
14.913.5
FY
18
FY
19
FY
20
FY
21
FY
22
(P)
FY
22
RE
GST Collec�ons (INRt)
1.41 1.42
0.0
0.4
0.8
1.2
1.6
Se
p-2
0
No
v-2
0
Jan
-21
Ma
r-2
1
Ma
y-2
1
Jul-
21
Se
p-2
1
No
v-2
1
Jan
-22
Ma
r-2
2
GST collec�on, INRt
(6)
(3)
0
3
6
3QFY16 3QFY17 3QFY18 3QFY19 3QFY20 3QFY21 3QFY22
CAB CAB ex fuel products CAB ex gold
(% of GDP)

APRIL 2022 | ISSUE 112 25
Alpha Strategist | ‘Lollapalooza Effect’
Equities
Historically, most geopolitical crisis tend to have a short term impact on equities and are
followed with a significant rebound once the risks have been priced in. However, it is
important to assess the pass through effects from conflict to the economy. The ongoing
Russia-Ukraine conflict and response from developed economies' to Russia is exacerbating
the global supply shortage of energy and other commodities. This could keep inflation
pressure high globally and some of the economies can witness growth slowdown. Europe
seems to be more vulnerable given its energy supply dependence on Russia.
For India, every $10/bbl rise in crude oil increases the CPI by 50 bps, assuming a full pass
through. Higher inflation especially of commodities, has an impact on corporates, as some
sectors have their raw material cost linked to these imported commodities such as crude
and crude linked derivatives. On the other hand, commodity suppliers could see good
margins and profits at the expense of the end users. It would be prudent to assume some
pressure on margins and subdued profitability for Corporate India. The benevolent factor
comes in the form of Corporate India having a more deleveraged balance sheet which
should help them see through these challenging times. Also, India's exports have registered
a 2-year CAGR of 12.5%, lifting the capacity utilisation ratio to 72%, which is now in line with
pre-Covid levels.
Given the multitude of challenges (lockdowns, Russia-Ukraine conflict, the relentless rise in
commodity prices, disruption in supply chains and rate hikes by the US Fed), the fact that
the Nifty is down barely 5% from its recent high underscores its resilience. The Nifty is
trading at a 12-month forward P/E of 19.8x, near to its long period average (LPA) of 19.3x (at
3% premium). P/B, at 3.2x, is at a 21% premium to its historical average. Nifty EPS is
projected at INR 732/870/1003 for FY22E/FY23E/FY24E.
Despite war worries, MSCI Word index rose 4.2% m-o-m on the back of S&P500 (+5.2%),
Euro-50 (+3.6%) and NIKKEI (+3.6%). MSCI EM index (-2.9%) was dragged lower by Hang
Seng index (-3.4%), whereas other EMs gained quite handsomely. MOEX Russia, BOVESPA
Brazil and NIFTY India were up 9.4%, 6.1% and 4% respectively. MSCI India outperformed
MSCI EM by 6% in March. LME Metals index gained 4.2% while Brent crude was up 2.8% m-
o-m. Dollar index appreciated 0.9% in March.
In India, SENSEX gained 4% while BSE Midcap index and BSE Smallcap index were up 3.2%
and 5.8% MoM respectively. FPIs sold US$4.7 bn of Indian equities in the secondary market
while DIIs bought US$5.2 bn.
Positive high frequency indicators such as continued momentum in GST collections, pick up
manufacturing activity and steady exports bode well for decent economic recovery after
Inflation risks coming to the fore
While export growth has remained strong
Source: CEIC, Morgan Stanley Research Source: CEIC, Morgan Stanley Research forecasts
Setting the stage for private corporate capex to GDP to rise

APRIL 2022 | ISSUE 112 26
Alpha Strategist | ‘Lollapalooza Effect’
the mild disruption caused by spread of the Omicron variant. GST Collection stood at INR
1.42 Tn in March '22 marking all-time high levels and topped INR 1.3 Tn for the sixth
consecutive month. Manufacturing IIP increased 1.1% in January '22 vs decline of 0.9% in
January last year.
Benchmark Performance on a calendar year basis as on February 2022:
Source: Bloomberg; Data as of 28th Feb 2022
C 21Y
24.12%
46.06%
59.28%
CY19
12.02%
-4.32%
-9.53%
CY20
14.90%
21.87%
21.47%
CY18
3.15%
-15.42%
-29.08%
CY17
28.65%
47.26%
57.30%
CY16
3.01%
7.13%
2.26%
CY15
-4.06%
6.46%
7.21%
CY13
6.76%
-5.10%
-8.28%
CY14
31.39%
55.91%
54.95%
0.64%
- %2.47
- %7.55
C 22Y
NIFTY
NIFTY Midcap 100
NIFTY Smallcap 100
Index
Nifty continued to decline for 2nd consecutive month in February posting a fall of 3.1%
MoM which was the second steepest MoM decline in 23 months.
FII's and DII's net flows (in $ Bn)
DII flows into equities in FY22 were the highest ever at USD 26.8b v/s outflows of USD18.4b
in FY21, while FIIs witnessed equity outflows of USD 17.1b after five consecutive years of
inflows.
Source: NSDL, MOFSL, Data updated as of 31st Mar'22
Fiscal Year Wise Ins�tu�onal Flows (USD Bn)
8.5
25.8
13.718.1
-1.5
8.33.1
0.3 0.8
37.5
-17.1
-0.9
-12.7-8.9
-3.7
12.1
4.5
17.7
10.3
17.9
-18.3
26.8
-30.0
-20.0
-10.0
0.0
10.0
20.0
30.0
40.0
50.0
FY12 FY13 FY14 FY15 FY16 FY17 FY18 FY19 FY20 FY21 FY22
FII DII
4QFY22 Earnings Preview
Despite input cost pressure and ongoing geopolitical uncertainties, the earnings growth
trajectory for the MOFSL Universe continues to remain healthy. 4QFY22 earnings growth is
expected to be ~19% YoY.
While the aggregate growth is impressive, it is narrow and driven by three sectors: BFSI,
O&G, and IT. More than half of the incremental growth is steered by BFSI, led by a modest
revival in credit growth and improvement in asset quality trends. Upstream O&G
companies are likely to benefit from the spike in crude oil prices in 4QFY22, driving
aggregate earnings.
Nifty revenues to post 28% YoY growth in Q4FY22E
Source: MOFSL Source: MOFSL
Nifty PAT to post 23% YoY growth in Q4FY22E
0 012 11
5 513 18 19
115 8
-23-30
1020
84
99
3926 23
Ma
r-1
7
Jun
-17
Se
p-1
7
De
c-1
7
Ma
r-1
8
Jun
-18
Se
p-1
8
De
c-1
8
Ma
r-1
9
Jun
-19
Se
p-1
9
De
c-1
9
Ma
r-2
0
Jun
-20
Se
p-2
0
De
c-2
0
Ma
r-2
1
Jun
-21
Se
p-2
1
De
c-2
1
Ma
r-2
2E
149 12
18 15
24 23 22
128
0 1
-4
-26
-4
2
17
46
28 26 28
Mar
-17
Jun
-17
Sep
-17
Dec
-17
Mar
-18
Jun
-18
Sep
-18
Dec
-18
Mar
-19
Jun
-19
Sep
-19
Dec
-19
Mar
-20
Jun
-20
Sep
-20
Dec
-20
Mar
-21
Jun
-21
Sep
-21
Dec
-21
Mar
-22
E

APRIL 2022 | ISSUE 112 27
Alpha Strategist | ‘Lollapalooza Effect’
Key Sectoral Insights:
While input cost pressures are impacting margins in Consumer, Autos, Cement, Specialty
Chemicals, and Consumer Durables but BFSI, IT, Utilities, and Telecom have largely
remained unaffected.
Strong demand visibility in IT, pick up in credit growth, and normalization of asset quality
should lend support to Nifty earnings. Deep cyclical sectors (Energy and Metals) continue to
benefit from higher commodity prices, leading to strong aggregate earnings growth.
The key drivers in 4QFY22 are:
Private Banks: MOFSL Banking universe can report 41%/39% YoY growth in PBT/PAT. Loan
growth is projected to remain strong, led by the Retail and SME segments. Slippages are
likely to remain modest across segments in 4QFY22, barring the MFI business, which may
see some tail stress.
Metals: MOFSL Metal stocks should see a modest 9% YoY growth in profits on a higher base
(profits were up 4x YoY in 4QFY21), as higher coal prices impacted EBITDA margins of steel
companies. EBITDA margin for the MOSFL Metals Universe is likely to decline by 710bp YoY
to 22.1% in 4QFY22.
Consumer: MOFSL Consumer stocks is likely to report muted cumulative growth numbers –
revenue/EBITDA/PAT of 8%/7%/5% – in 4QFY22E. Sales growth will largely be led by price
hikes as volume growth remains constrained, impacted by spiraling inflation and a
slowdown in rural demand.
Key sectors which are likely to drag earnings:
Autos – A sharp increase in fuel and commodity prices are likely to delay a recovery in
margin for OEMs, despite some improvement in supply-side constraints (semiconductor
shortages), MOFSL Auto stocks is likely to report an aggregate profit decline of 51% YoY
despite an improvement in semiconductor supplies
Cement: Higher coal and petcoke prices are likely to lead to a fall in profitability for
companies, despite the likely increase in blended realizations by 7% YoY. MOFSL Cement
Universe should report an EBITDA/PAT decline of 20%/26%.
Source: MOFSL
Sector-wise breakdown of Nifty Q4FY22E PAT change YoY (%)
304
66 63 5937 37 36 33 30 27 23 22 15 6
-2-20 -20
-59
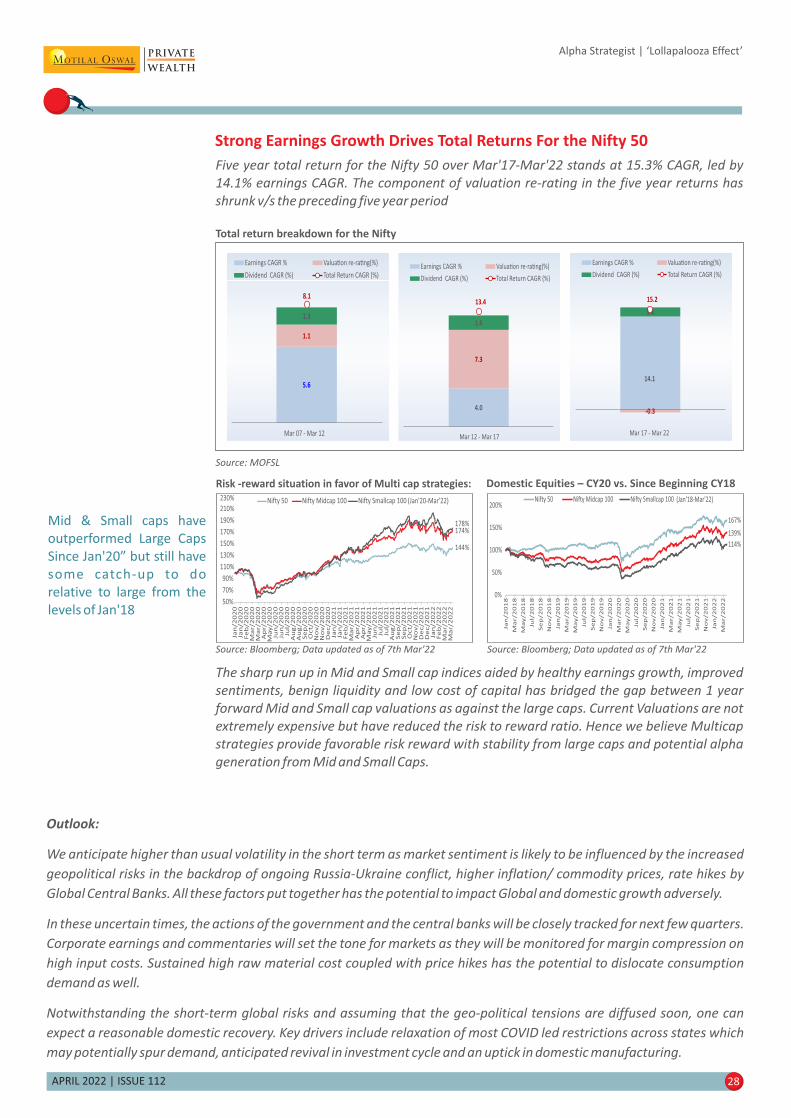
APRIL 2022 | ISSUE 112 28
Alpha Strategist | ‘Lollapalooza Effect’
Strong Earnings Growth Drives Total Returns For the Nifty 50
Five year total return for the Nifty 50 over Mar'17-Mar'22 stands at 15.3% CAGR, led by
14.1% earnings CAGR. The component of valuation re-rating in the five year returns has
shrunk v/s the preceding five year period
Total return breakdown for the Nifty
Source: MOFSL
Domestic Equities – CY20 vs. Since Beginning CY18
Source: Bloomberg; Data updated as of 7th Mar'22 Source: Bloomberg; Data updated as of 7th Mar'22
Risk -reward situation in favor of Multi cap strategies:
144%
174%178%
50%
70%
90%
110%
130%
150%
170%
190%
210%
230% (Jan'20-Mar'22)Nifty 50 Nifty Midcap 100 Nifty Smallcap 100
Jan
/2
02
0Ja
n/2
02
0Fe
b/2
02
0M
ar/
20
20
Ma
r/2
02
0A
pr/
20
20
Ma
y/2
02
0Ju
n/2
02
0Ju
n/2
02
0Ju
l/2
02
0A
ug
/2
02
0A
ug
/2
02
0S
ep
/2
02
0O
ct/
20
20
No
v/2
02
0N
ov/2
02
0D
ec/2
02
0Ja
n/2
02
1Ja
n/2
02
1Fe
b/2
02
1M
ar/
20
21
Ap
r/2
02
1A
pr/
20
21
Ma
y/2
02
1Ju
n/2
02
1Ju
l/2
02
1Ju
l/2
02
1A
ug
/2
02
1S
ep
/2
02
1S
ep
/2
02
1O
ct/
20
21
No
v/2
02
1D
ec/2
02
1D
ec/2
02
1Ja
n/2
02
2Fe
b/2
02
2M
ar/
20
22
Ma
r/2
02
2
167%
139%
114%
0%
50%
100%
150%
200%Nifty 50 Nifty Midcap 100 Nifty Smallcap 100
Ja
n/2
01
8
Ma
r/2
01
8
Ma
y/2
01
8
Ju
l/2
01
8
Se
p/2
01
8
No
v/2
01
8
Ja
n/2
01
9
Ma
r/2
01
9
Ma
y/2
01
9
Ju
l/2
01
9
Se
p/2
01
9
No
v/2
01
9
Ja
n/2
02
0
Ma
r/2
02
0
Ma
y/2
02
0
Ju
l/2
02
0
Se
p/2
02
0
No
v/2
02
0
Ja
n/2
02
1
Ma
r/2
02
1
Ma
y/2
02
1
Ju
l/2
02
1
Se
p/2
02
1
No
v/2
02
1
Ja
n/2
02
2
Ma
r/2
02
2
(Jan'18-Mar'22)
The sharp run up in Mid and Small cap indices aided by healthy earnings growth, improved
sentiments, benign liquidity and low cost of capital has bridged the gap between 1 year
forward Mid and Small cap valuations as against the large caps. Current Valuations are not
extremely expensive but have reduced the risk to reward ratio. Hence we believe Multicap
strategies provide favorable risk reward with stability from large caps and potential alpha
generation from Mid and Small Caps.
5.6
1.1
1.3
8.1
Mar Mar07 - 12
Earnings CAGR % Valua�on re-ra�ng(%)
Dividend CAGR (%) Total Return CAGR (%)
4.0
7.3
1.6
13.4
Mar Mar12 - 17
Earnings CAGR % Valua�on re-ra�ng(%)
Dividend CAGR (%) Total Return CAGR (%)
14.1
-0.3
1.4
15.2
Mar Mar17 - 22
Earnings CAGR % Valua�on re-ra�ng(%)
Dividend CAGR (%) Total Return CAGR (%)
Mid & Small caps have
outperformed Large Caps
Since Jan'20” but still have
some catch-up to do
relative to large from the
levels of Jan'18
Outlook:
We anticipate higher than usual volatility in the short term as market sentiment is likely to be influenced by the increased
geopolitical risks in the backdrop of ongoing Russia-Ukraine conflict, higher inflation/ commodity prices, rate hikes by
Global Central Banks. All these factors put together has the potential to impact Global and domestic growth adversely.
In these uncertain times, the actions of the government and the central banks will be closely tracked for next few quarters.
Corporate earnings and commentaries will set the tone for markets as they will be monitored for margin compression on
high input costs. Sustained high raw material cost coupled with price hikes has the potential to dislocate consumption
demand as well.
Notwithstanding the short-term global risks and assuming that the geo-political tensions are diffused soon, one can
expect a reasonable domestic recovery. Key drivers include relaxation of most COVID led restrictions across states which
may potentially spur demand, anticipated revival in investment cycle and an uptick in domestic manufacturing.
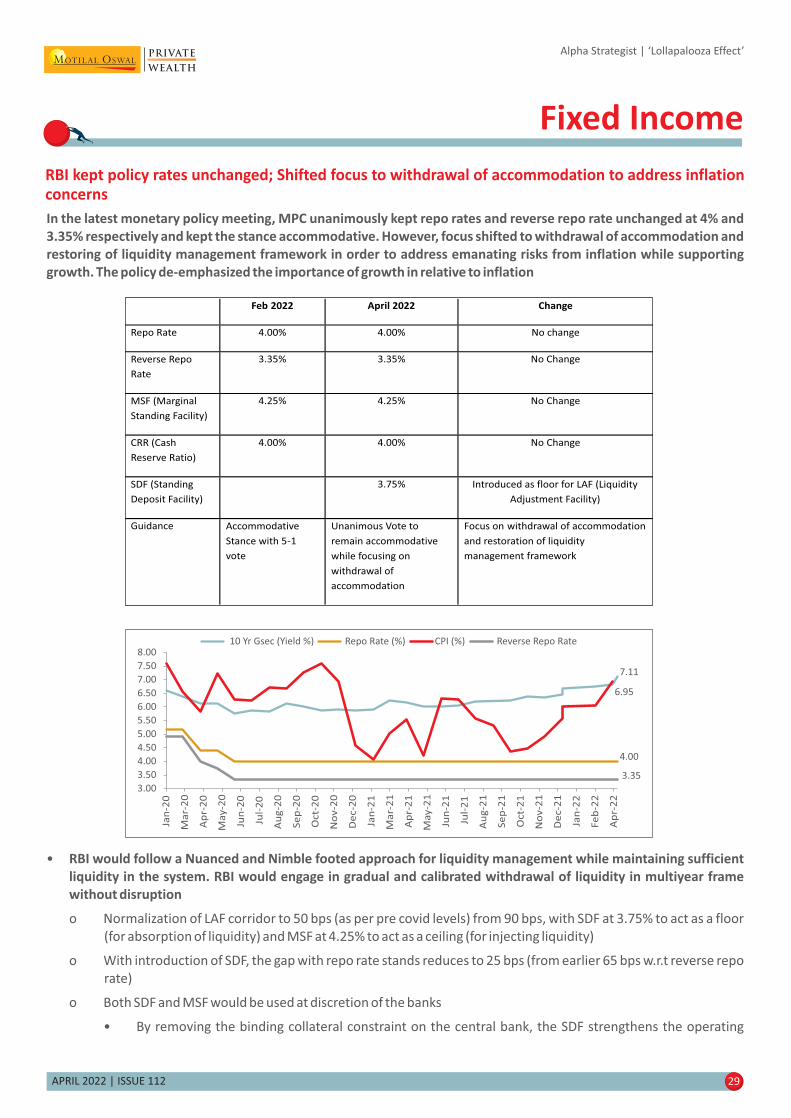
APRIL 2022 | ISSUE 112 29
RBI kept policy rates unchanged; Shifted focus to withdrawal of accommodation to address inflationconcerns
In the latest monetary policy meeting, MPC unanimously kept repo rates and reverse repo rate unchanged at 4% and
3.35% respectively and kept the stance accommodative. However, focus shifted to withdrawal of accommodation and
restoring of liquidity management framework in order to address emanating risks from inflation while supporting
growth. The policy de-emphasized the importance of growth in relative to inflation
Alpha Strategist | ‘Lollapalooza Effect’
Fixed Income
Feb 2022 April 2022 Change
Repo Rate 4.00% 4.00% No change
Reverse Repo
Rate
3.35% 3.35% No Change
MSF (Marginal
Standing Facility)
4.25% 4.25% No Change
CRR (Cash
Reserve Ratio)
4.00% 4.00% No Change
SDF (Standing
Deposit Facility)
3.75% Introduced as floor for LAF (Liquidity
Adjustment Facility)
Guidance Accommodative
Stance with 5-1
vote
Unanimous Vote to
remain accommodative
while focusing on
withdrawal of
accommodation
Focus on withdrawal of accommodation
and restoration of liquidity
management framework
• RBI would follow a Nuanced and Nimble footed approach for liquidity management while maintaining sufficient
liquidity in the system. RBI would engage in gradual and calibrated withdrawal of liquidity in multiyear frame
without disruption
o Normalization of LAF corridor to 50 bps (as per pre covid levels) from 90 bps, with SDF at 3.75% to act as a floor
(for absorption of liquidity) and MSF at 4.25% to act as a ceiling (for injecting liquidity)
o With introduction of SDF, the gap with repo rate stands reduces to 25 bps (from earlier 65 bps w.r.t reverse repo
rate)
o Both SDF and MSF would be used at discretion of the banks
• By removing the binding collateral constraint on the central bank, the SDF strengthens the operating
7.11
4.00
6.95
3.35
3.00
3.50
4.00
4.50
5.00
5.50
6.00
6.50
7.00
7.50
8.00
Jan
-20
Ma
r-2
0
Ap
r-2
0
Ma
y-2
0
Jun
-20
Jul-
20
Au
g-2
0
Se
p-2
0
Oct-
20
No
v-2
0
De
c-2
0
Jan
-21
Ma
r-2
1
Ap
r-2
1
Ma
y-2
1
Jun
-21
Jul-
21
Au
g-2
1
Se
p-2
1
Oct-
21
No
v-2
1
De
c-2
1
Jan
-22
Fe
b-2
2
Ap
r-2
2
10 Yr Gsec (Yield %) Repo Rate (%) CPI (%) Reverse Repo Rate
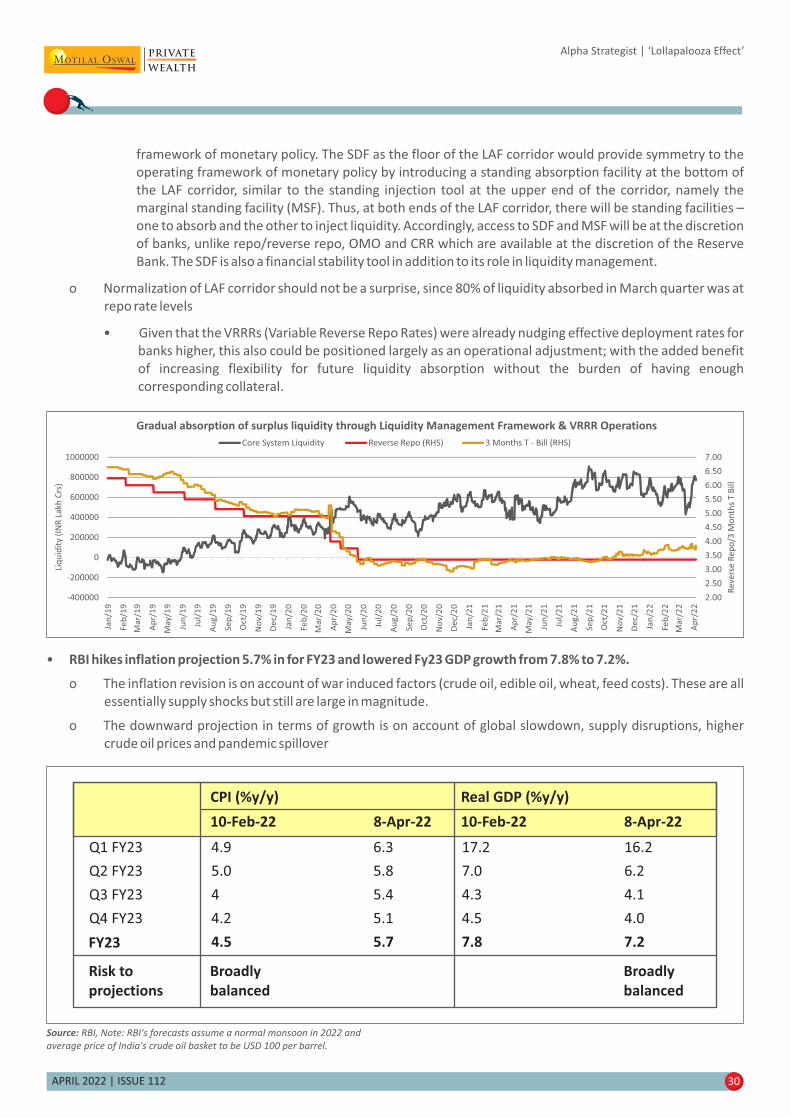
CPI (%y/y)
10-Feb-22 8-Apr-22
Real GDP (%y/y)
10-Feb-22 8-Apr-22
Q1 FY23
Q2 FY23
Q3 FY23
Q4 FY23
FY23
4.9
5.0
4
4.2
4.5
6.3
5.8
5.4
5.1
5.7
17.2
7.0
4.3
4.5
7.8
16.2
6.2
4.1
4.0
7.2
Risk to
projections
Broadly
balanced
Broadly
balanced
30APRIL 2022 | ISSUE 112
Alpha Strategist | ‘Lollapalooza Effect’
framework of monetary policy. The SDF as the floor of the LAF corridor would provide symmetry to the
operating framework of monetary policy by introducing a standing absorption facility at the bottom of
the LAF corridor, similar to the standing injection tool at the upper end of the corridor, namely the
marginal standing facility (MSF). Thus, at both ends of the LAF corridor, there will be standing facilities –
one to absorb and the other to inject liquidity. Accordingly, access to SDF and MSF will be at the discretion
of banks, unlike repo/reverse repo, OMO and CRR which are available at the discretion of the Reserve
Bank. The SDF is also a financial stability tool in addition to its role in liquidity management.
o Normalization of LAF corridor should not be a surprise, since 80% of liquidity absorbed in March quarter was at
repo rate levels
• Given that the VRRRs (Variable Reverse Repo Rates) were already nudging effective deployment rates for
banks higher, this also could be positioned largely as an operational adjustment; with the added benefit
of increasing flexibility for future liquidity absorption without the burden of having enough
corresponding collateral.
• RBI hikes inflation projection 5.7% in for FY23 and lowered Fy23 GDP growth from 7.8% to 7.2%.
o The inflation revision is on account of war induced factors (crude oil, edible oil, wheat, feed costs). These are all
essentially supply shocks but still are large in magnitude.
o The downward projection in terms of growth is on account of global slowdown, supply disruptions, higher
crude oil prices and pandemic spillover
Source: RBI, Note: RBI's forecasts assume a normal monsoon in 2022 and
average price of India's crude oil basket to be USD 100 per barrel.
2.00
2.50
3.00
3.50
4.00
4.50
5.00
5.50
6.00
6.50
7.00
-400000
-200000
0
200000
400000
600000
800000
1000000
Gradual absorption of surplus liquidity through Liquidity Management Framework & VRRR Operations
Core System Liquidity Reverse Repo (RHS) 3 Months T - Bill (RHS)
Jan
/19
Fe
b/1
9
Ma
r/1
9
Ap
r/1
9
Ma
y/1
9
Jun
/19
Jul/
19
Au
g/1
9
Se
p/1
9
Oct
/19
No
v/1
9
De
c/1
9
Jan
/20
Fe
b/2
0
Ma
r/2
0
Ap
r/2
0
Ma
y/2
0
Jun
/20
Jul/
20
Au
g/2
0
Se
p/2
0
Oct
/20
No
v/2
0
De
c/2
0
Jan
/21
Fe
b/2
1
Ma
r/2
1
Ap
r/2
1
Ma
y/2
1
Jun
/21
Jul/
21
Au
g/2
1
Se
p/2
1
Oct
/21
No
v/2
1
De
c/2
1
Jan
/22
Fe
b/2
2
Ma
r/2
2
Ap
r/2
2
Re
vers
e R
ep
o/3
Mo
nth
s T
Bill
Liq
uid
ity
(IN
R L
akh
Crs
)
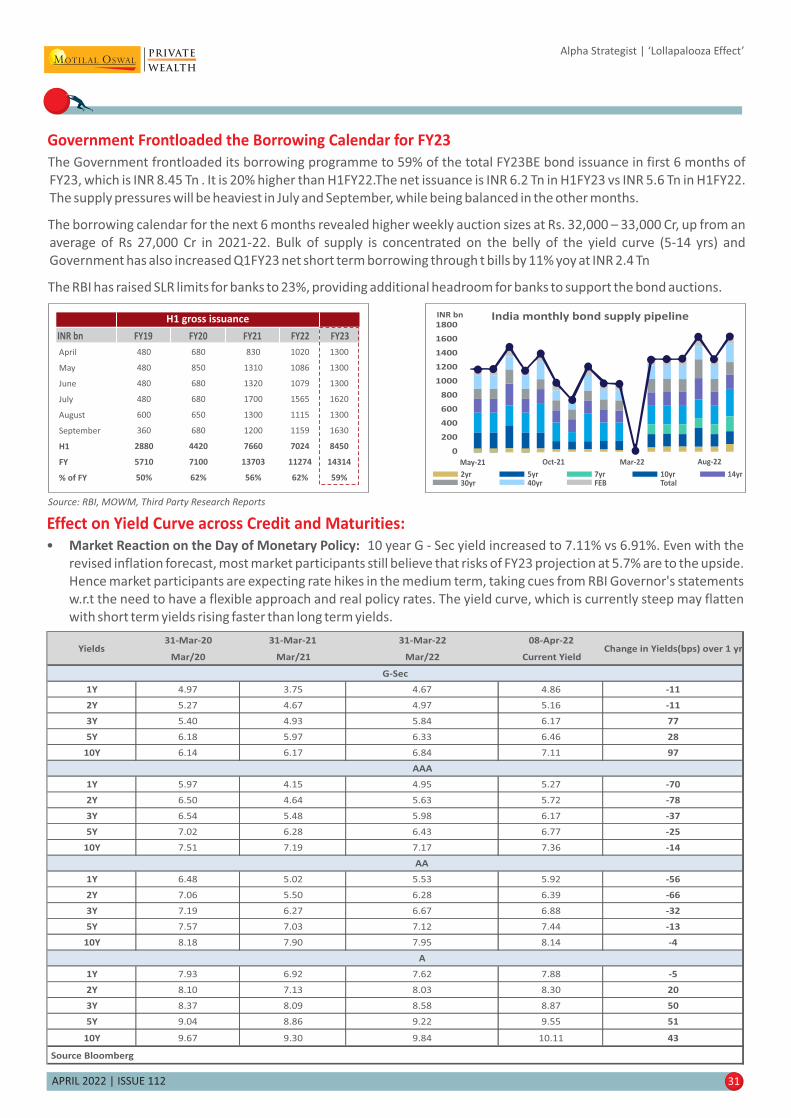
31APRIL 2022 | ISSUE 112
Alpha Strategist | ‘Lollapalooza Effect’
The Government frontloaded its borrowing programme to 59% of the total FY23BE bond issuance in first 6 months of
FY23, which is INR 8.45 Tn . It is 20% higher than H1FY22.The net issuance is INR 6.2 Tn in H1FY23 vs INR 5.6 Tn in H1FY22.
The supply pressures will be heaviest in July and September, while being balanced in the other months.
The borrowing calendar for the next 6 months revealed higher weekly auction sizes at Rs. 32,000 – 33,000 Cr, up from an
average of Rs 27,000 Cr in 2021-22. Bulk of supply is concentrated on the belly of the yield curve (5-14 yrs) and
Government has also increased Q1FY23 net short term borrowing through t bills by 11% yoy at INR 2.4 Tn
The RBI has raised SLR limits for banks to 23%, providing additional headroom for banks to support the bond auctions.
Government Frontloaded the Borrowing Calendar for FY23
Source: RBI, MOWM, Third Party Research Reports
Effect on Yield Curve across Credit and Maturities:
• 10 year G - Sec yield increased to 7.11% vs 6.91%. Even with theMarket Reaction on the Day of Monetary Policy:
revised inflation forecast, most market participants still believe that risks of FY23 projection at 5.7% are to the upside.
Hence market participants are expecting rate hikes in the medium term, taking cues from RBI Governor's statements
w.r.t the need to have a flexible approach and real policy rates. The yield curve, which is currently steep may flatten
with short term yields rising faster than long term yields.
31-Mar-20 31-Mar-21 31-Mar-22 08-Apr-22
Mar/20 Mar/21 Mar/22 Current Yield
1Y 4.97 3.75 4.67 4.86 -11
2Y 5.27 4.67 4.97 5.16 -11
3Y 5.40 4.93 5.84 6.17 77
5Y 6.18 5.97 6.33 6.46 28
10Y 6.14 6.17 6.84 7.11 97
1Y 5.97 4.15 4.95 5.27 -70
2Y 6.50 4.64 5.63 5.72 -78
3Y 6.54 5.48 5.98 6.17 -37
5Y 7.02 6.28 6.43 6.77 -25
10Y 7.51 7.19 7.17 7.36 -14
1Y 6.48 5.02 5.53 5.92 -56
2Y 7.06 5.50 6.28 6.39 -66
3Y 7.19 6.27 6.67 6.88 -32
5Y 7.57 7.03 7.12 7.44 -13
10Y 8.18 7.90 7.95 8.14 -4
1Y 7.93 6.92 7.62 7.88 -5
2Y 8.10 7.13 8.03 8.30 20
3Y 8.37 8.09 8.58 8.87 50
5Y 9.04 8.86 9.22 9.55 51
10Y 9.67 9.30 9.84 10.11 43
Source Bloomberg
Yields
G-Sec
AAA
AA
A
Change in Yields(bps) over 1 yr
April
May
June
July
August
September
H1
FY
% of FY
480
480
480
480
600
360
2880
5710
50%
680
850
680
680
650
680
4420
7100
62%
830
1310
1320
1700
1300
1200
7660
13703
56%
1020
1086
1079
1565
1115
1159
7024
11274
62%
1300
1300
1300
1620
1300
1630
8450
14314
59%
INR bn FY19 FY20 FY21 FY23FY22
H1 gross issuance INR bn
1800
1600
1400
1200
1000
800
600
400
200
0
May-21 Oct-21 Mar-22 Aug-22
2yr30yr
5yr40yr
7yrFEB
10yrTotal
14yr
India monthly bond supply pipeline

• Currently the yield curve is still steep with sweet spot between 2-5 yr maturity since future rate hikes to someextent has already been priced in.
• RBI's focus has been shifted to withdrawal of accommodation and restoring of liquidity management framework inorder to address emanating risks from inflation while supporting growth
• Going forward, Yield Curve may become flat due to RBI's intent for gradual withdrawal of liquidity and signalingtowards normalization of policy
o Yields at shorter end of the curve may gradually increase due to RBI's gradual normalization of liquidity
o Yields at longer end of the curve may remain volatile due to inflation concerns, demand-supply mismatch, &global factors
Direction of the Yield Curve:
Current Yield Curve
(8 April 2022)
32APRIL 2022 | ISSUE 112
Alpha Strategist | ‘Lollapalooza Effect’
Term Spreads are Still Attractive
In the current market scenario, we recommend a barbell approach where 'Accrual' should precede 'Duration'.
From investor's point of view, focus should be towards investing in high quality accrual strategies through acombination of short term and long term maturity portfolio such that average portfolio maturity does not goesbeyond 4-6 yrs. For yield enhancement, investors can also evaluate investing 20 – 25% in well researched high yieldcredit strategies, MLDs, NCDs etc.
• ~70% - 80% of the fixed income portfolio should be biased towards high quality short to medium term accrualstrategies with minimum investment horizon of 3 years.
o Within the above allocation, ~20% - 30% can be allocated towards long maturity and high quality roll downstrategies with minimum investment horizon of 5 years.
• To enhance the overall portfolio yield, investors with medium to high risk profile can consider 20% – 25% allocationof the overall fixed income portfolio to select high yield strategies, MLDs and NCDS. Fixed Income portfolios shouldalso include REITs/InvITs which have highest credit rating & which aim to offer regular (either quarterly or half yearly)&predictable cash flows - investment horizon should be at least 4-5 years to mitigate interim mark to marketvolatility
• investments can be allocated to Arbitrage/UST (minimum 6For liquidity management or temporary parking,months)/Liquid (less than 3 months) strategies which can be deployed in a staggered manner when opportunitiesarise.
Our Portfolio Strategy:
55
103
225
-50
0
50
100
150
200
250
300
Term Spreads
(India 10 Yr GSec with 1,3,5 yr maturities)
India (10yr - 5 yr) India (10yr - 3 yr) India (10yr - 1 yr)
Jan/
20
Feb/
20
Mar
/20
Apr/
20
May
/20
Jun/
20
Jul/2
0
Aug/
20
Sep/
20
Oct/
20
Nov/
20
Dec/
20
Jan/
21
Feb/
21
Mar
/21
Apr/
21
May
/21
Jun/
21
Jul/2
1
Aug/
21
Oct/
21
Nov/
21
Dec/
21
Jan/
22
Feb/
22
Mar
/22
1Y 2Y 3Y 5Y 10Y
G-Sec 4.86 5.16 6.17 6.46 7.11
AAA 5.27 5.72 6.17 6.77 7.36
5.92 6.39 6.88 7.44 8.14AA
A 7.88 8.30 8.87 9.55 10.11
4.865.16
6.176.46
7.11
5.275.72
6.176.77
7.36
5.926.39
6.88
7.44
8.147.88
8.30
8.87
9.5510.11
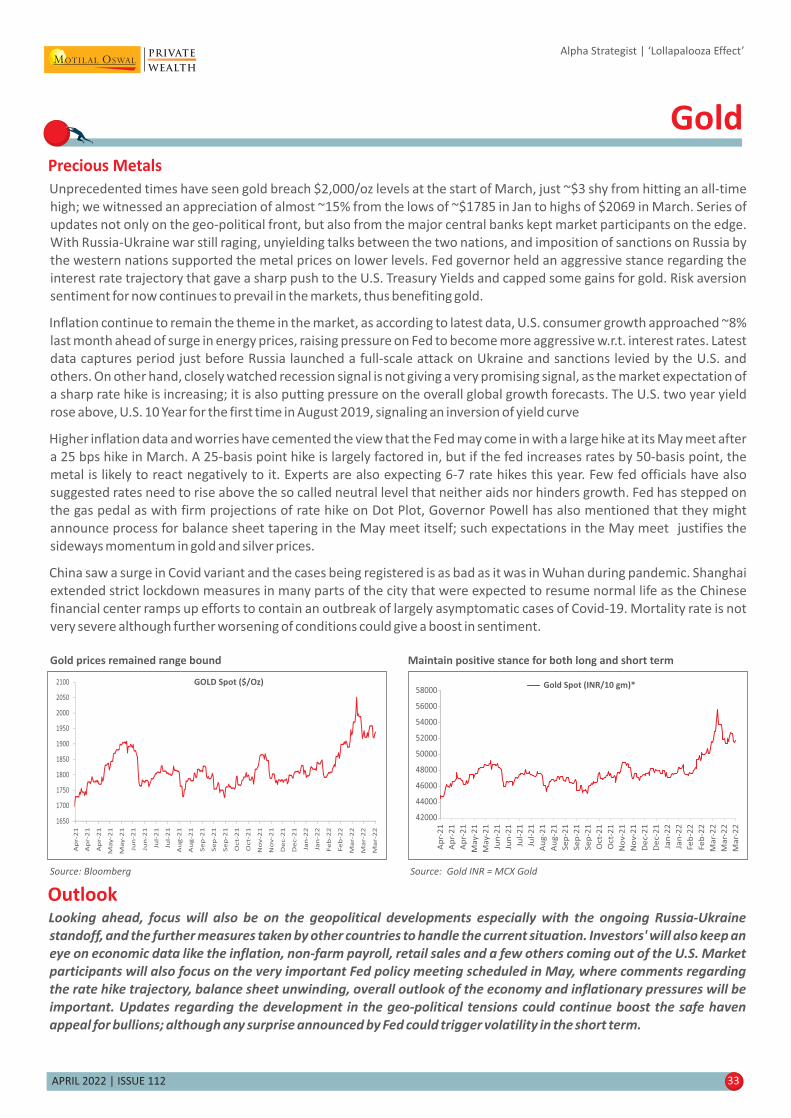
APRIL 2022 | ISSUE 112 33
Alpha Strategist | ‘Lollapalooza Effect’
Gold
OutlookLooking ahead, focus will also be on the geopolitical developments especially with the ongoing Russia-Ukraine
standoff, and the further measures taken by other countries to handle the current situation. Investors' will also keep an
eye on economic data like the inflation, non-farm payroll, retail sales and a few others coming out of the U.S. Market
participants will also focus on the very important Fed policy meeting scheduled in May, where comments regarding
the rate hike trajectory, balance sheet unwinding, overall outlook of the economy and inflationary pressures will be
important. Updates regarding the development in the geo-political tensions could continue boost the safe haven
appeal for bullions; although any surprise announced by Fed could trigger volatility in the short term.
Unprecedented times have seen gold breach $2,000/oz levels at the start of March, just ~$3 shy from hitting an all-time
high; we witnessed an appreciation of almost ~15% from the lows of ~$1785 in Jan to highs of $2069 in March. Series of
updates not only on the geo-political front, but also from the major central banks kept market participants on the edge.
With Russia-Ukraine war still raging, unyielding talks between the two nations, and imposition of sanctions on Russia by
the western nations supported the metal prices on lower levels. Fed governor held an aggressive stance regarding the
interest rate trajectory that gave a sharp push to the U.S. Treasury Yields and capped some gains for gold. Risk aversion
sentiment for now continues to prevail in the markets, thus benefiting gold.
Inflation continue to remain the theme in the market, as according to latest data, U.S. consumer growth approached ~8%
last month ahead of surge in energy prices, raising pressure on Fed to become more aggressive w.r.t. interest rates. Latest
data captures period just before Russia launched a full-scale attack on Ukraine and sanctions levied by the U.S. and
others. On other hand, closely watched recession signal is not giving a very promising signal, as the market expectation of
a sharp rate hike is increasing; it is also putting pressure on the overall global growth forecasts. The U.S. two year yield
rose above, U.S. 10 Year for the first time in August 2019, signaling an inversion of yield curve
Higher inflation data and worries have cemented the view that the Fed may come in with a large hike at its May meet after
a 25 bps hike in March. A 25-basis point hike is largely factored in, but if the fed increases rates by 50-basis point, the
metal is likely to react negatively to it. Experts are also expecting 6-7 rate hikes this year. Few fed officials have also
suggested rates need to rise above the so called neutral level that neither aids nor hinders growth. Fed has stepped on
the gas pedal as with firm projections of rate hike on Dot Plot, Governor Powell has also mentioned that they might
announce process for balance sheet tapering in the May meet itself; such expectations in the May meet justifies the
sideways momentum in gold and silver prices.
China saw a surge in Covid variant and the cases being registered is as bad as it was in Wuhan during pandemic. Shanghai
extended strict lockdown measures in many parts of the city that were expected to resume normal life as the Chinese
financial center ramps up efforts to contain an outbreak of largely asymptomatic cases of Covid-19. Mortality rate is not
very severe although further worsening of conditions could give a boost in sentiment.
Precious Metals
Gold prices remained range bound
Source: Bloomberg
Maintain positive stance for both long and short term
Source: Gold INR = MCX Gold
42000
44000
46000
48000
50000
52000
54000
56000
58000
Ap
r-2
1
Ap
r-2
1
Ap
r-2
1
Ma
y-2
1
Ma
y-2
1
Jun
-21
Jun
-21
Jul-
21
Jul-
21
Au
g-2
1
Au
g-2
1
Se
p-2
1
Se
p-2
1
Se
p-2
1
Oct-
21
Oct-
21
No
v-2
1
No
v-2
1
De
c-2
1
De
c-2
1
Jan
-22
Jan
-22
Fe
b-2
2
Fe
b-2
2
Ma
r-2
2
Ma
r-2
2
Ma
r-2
2
Gold Spot (INR/10 gm)*
Ap
r-2
1
Ap
r-2
1
Ap
r-2
1
Ma
y-2
1
Ma
y-2
1
Jun
-21
Jun
-21
Jul-
21
Jul-
21
Au
g-2
1
Au
g-2
1
Se
p-2
1
Se
p-2
1
Se
p-2
1
Oct-
21
Oct-
21
No
v-2
1
No
v-2
1
De
c-2
1
De
c-2
1
Jan
-22
Jan
-22
Fe
b-2
2
Fe
b-2
2
Ma
r-2
2
Ma
r-2
2
Ma
r-2
2
1650
1700
1750
1800
1850
1900
1950
2000
2050
2100 GOLD Spot ($/Oz)
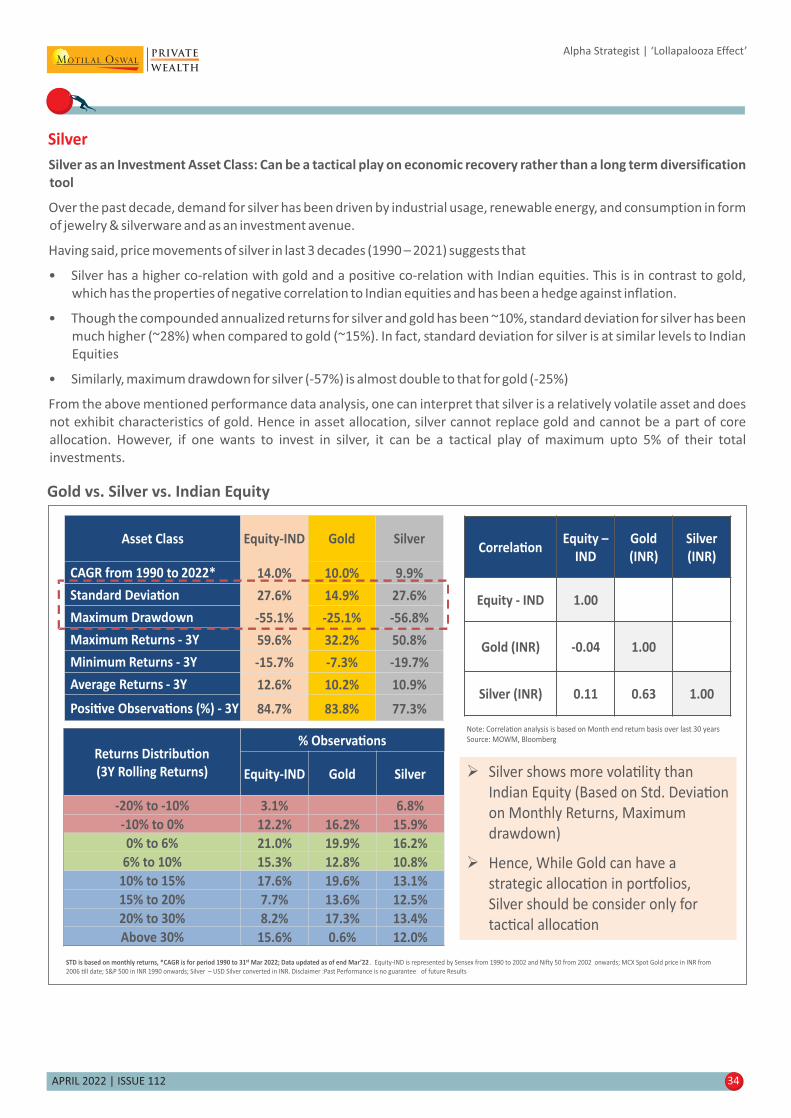
APRIL 2022 | ISSUE 112 34
Silver as an Investment Asset Class: Can be a tactical play on economic recovery rather than a long term diversification
tool
Over the past decade, demand for silver has been driven by industrial usage, renewable energy, and consumption in form
of jewelry & silverware and as an investment avenue.
Having said, price movements of silver in last 3 decades (1990 – 2021) suggests that
• Silver has a higher co-relation with gold and a positive co-relation with Indian equities. This is in contrast to gold,
which has the properties of negative correlation to Indian equities and has been a hedge against inflation.
• Though the compounded annualized returns for silver and gold has been ~10%, standard deviation for silver has been
much higher (~28%) when compared to gold (~15%). In fact, standard deviation for silver is at similar levels to Indian
Equities
• Similarly, maximum drawdown for silver (-57%) is almost double to that for gold (-25%)
From the above mentioned performance data analysis, one can interpret that silver is a relatively volatile asset and does
not exhibit characteristics of gold. Hence in asset allocation, silver cannot replace gold and cannot be a part of core
allocation. However, if one wants to invest in silver, it can be a tactical play of maximum upto 5% of their total
investments.
Alpha Strategist | ‘Lollapalooza Effect’
Silver
Gold vs. Silver vs. Indian Equity
Asset Class Equity-IND Gold Silver
CAGR from 1990 to 2022* 14.0% 10.0% 9.9%
Standard Devia�on 27.6% 14.9% 27.6%
Maximum Drawdown -55.1% -25.1% -56.8%
Maximum Returns - 3Y 59.6% 32.2% 50.8%
Minimum Returns - 3Y -15.7% -7.3% -19.7%
Average Returns - 3Y 12.6% 10.2% 10.9%
Posi�ve Observa�ons (%) - 3Y 84.7% 83.8% 77.3%
Returns Distribu�on
(3Y Rolling Returns)
% Observa�ons
Equity-IND Gold Silver
-20% to -10% 3.1% 6.8%
-10% to 0% 12.2% 16.2% 15.9%
0% to 6% 21.0% 19.9% 16.2%
6% to 10% 15.3% 12.8% 10.8%
10% to 15% 17.6% 19.6% 13.1%
15% to 20% 7.7% 13.6% 12.5%
20% to 30% 8.2% 17.3% 13.4%
Above 30% 15.6% 0.6% 12.0%
STD is based on monthly returns, *CAGR is for period 1990 to 31st Mar 2022; Data updated as of end Mar’22 . Equity-IND is represented by Sensex from 1990 to 2002 and Ni�y 50 from 2002 onwards; MCX Spot Gold price in INR from
2006 �ll date; S&P 500 in INR 1990 onwards; Silver – USD Silver converted in INR. Disclaimer :Past Performance is no guarantee of future Results
Correla�onEquity –
IND
Gold
(INR)
Silver
(INR)
Equity - IND 1.00
Gold (INR) -0.04 1.00
Silver (INR) 0.11 0.63 1.00
Note: Correla�on analysis is based on Month end return basis over last 30 years
Source: MOWM, Bloomberg
� Silver shows more vola�lity than
Indian Equity (Based on Std. Devia�on
on Monthly Returns, Maximum
drawdown)
� Hence, While Gold can have a
strategic alloca�on in por�olios,
Silver should be consider only for
tac�cal alloca�on

Section III
Advisory Approach .............................................................................................. 63
4C Framework For Equity Managers ..................................................................... 73
Fixed Income Manager Selection Framework ........................................................ 83
Hind-sight Investing.............................................................................................40
Decoding Investment Style ...................................................................................41
Investment Charter .............................................................................................42
Sample Investment Charter .................................................................................43
Estate Planning ...................................................................................................44
This document is not valid without disclosure; refer the last page for the disclosure
APRIL 2022 | ISSUE 112 35
Alpha Strategist | ‘Lollapalooza Effect’
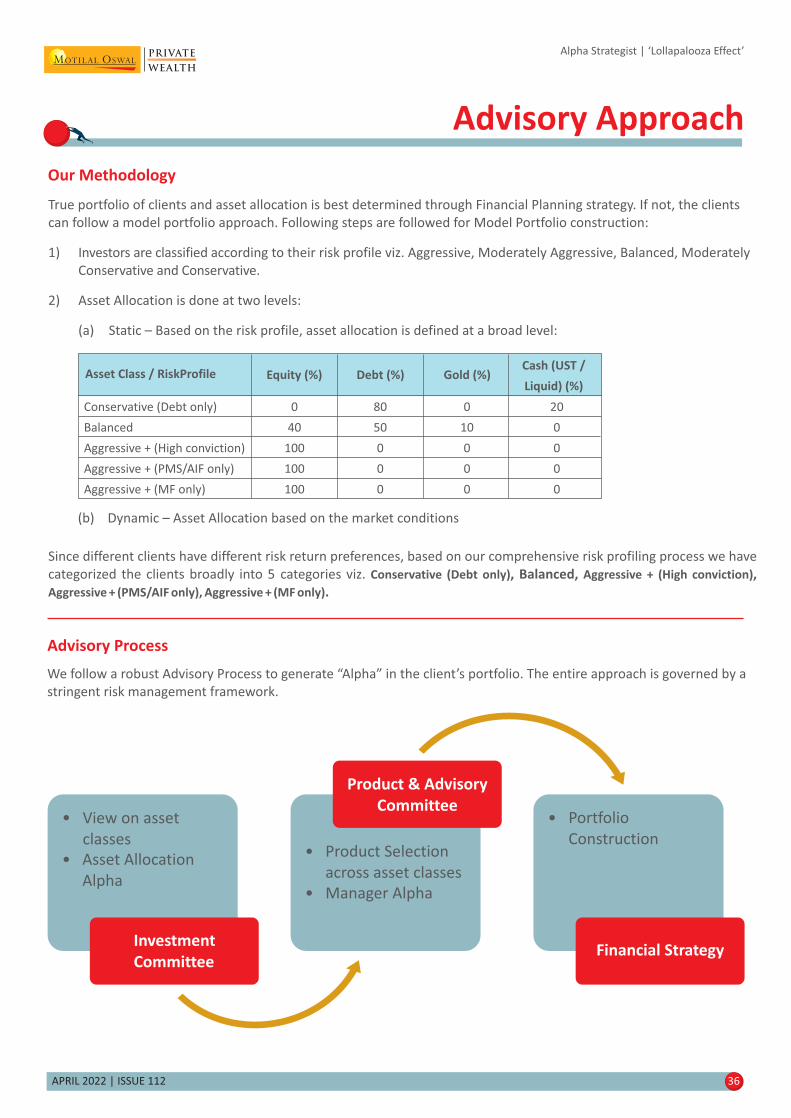
True portfolio of clients and asset allocation is best determined through Financial Planning strategy. If not, the clients
can follow a model portfolio approach. Following steps are followed for Model Portfolio construction:
1) Investors are classified according to their risk profile viz. Aggressive, Moderately Aggressive, Balanced, Moderately
Conservative and Conservative.
2) Asset Allocation is done at two levels:
(a) Static – Based on the risk profile, asset allocation is defined at a broad level:
APRIL 2022 | ISSUE 112 36
Our Methodology
Since different clients have different risk return preferences, based on our comprehensive risk profiling process we have
categorized the clients broadly into 5 categories viz. Conservative (Debt only) Aggressive + (High conviction), Balanced, ,
Aggressive + (PMS/AIF only), Aggressive + (MF only).
Advisory Process
We follow a robust Advisory Process to generate “Alpha” in the client’s portfolio. The entire approach is governed by a
stringent risk management framework.
View on asset
classes
Asset Allocation
Alpha
Investment
Committee
Product Selection
across asset classes
Manager Alpha
Product & Advisory
CommitteePortfolio
Construction
Financial Strategy
Alpha Strategist | ‘Lollapalooza Effect’
Advisory Approach
Conservative (Debt only)
Balanced
Aggressive + (High conviction)
Aggressive + (PMS/AIF only)
Aggressive + (MF only)
0
40
100
100
100
80
50
0
0
0
0
10
0
0
0
20
0
0
0
0
Equity (%) Debt (%) Gold (%)Cash (UST /
Liquid) (%)Asset Class / RiskProfile
(b) Dynamic – Asset Allocation based on the market conditions

APRIL 2022 | ISSUE 112 37
The 4C Manager Selection Process
Evaluating Manager Expertise
Alpha Strategist | ‘Lollapalooza Effect’
4C Framework For Equity Managers

APRIL 2022 | ISSUE 112 38
Alpha Strategist | ‘Lollapalooza Effect’
In the above graph, we have taken the Average 1 yr rolling return for 5 years (December 2012 to December 2017) for
various funds across categories. The result was that there was a significant difference between the top performer and
bottom performer in almost every category, making a case for choosing fund managers over the funds. The ability to
generate enhanced returns varies from manager to manager within the same category, thus laying emphasis on the skills
of a fund manager. But one must also realize that past performance cannot be the only criteria to judge a fund. It is almost
hazardous to do so. Different market cycles present different opportunities.
So what strategy will help investors so that their investments are relevant for the ongoing market cycle? Even in fixed
income, there are risks associated with interest rates, credit and liquidity. With the numerous funds at one's disposal,
choosing the correct one can be quite a challenge. Before we venture into the framework of choosing a manager let us
take a sneak-peak into the two kinds of strategies adopted for “enhancing” returns – Credit and Duration.
The credit opportunities style looks for companies that have the ability to repay and mitigates risks such as default and
liquidity. This benefits investors via higher coupons, thus enhancing their overall return. However, the duration style
plays on interest rate cycles and requires an intricate macroeconomic understanding as the manager must get the
interest rate cycles right. Both these strategies play out at various points of time. At a time one anticipates interest rates
to peak, duration strategies would be a preferred option as any subsequent decline in interest rates would enhance the
portfolio returns. Likewise, in a rising interest rate scenario, duration strategies would not augur well, calling for
investment in credit strategies.
Adding objectivity to fixed income investing
The battle of objective vs. subjective decision making often makes appearance in investing. To our mind, having an
objective oriented approach gives purpose to investment which helps in avoiding any impulsive calls. Traditionally, equity
has always been viewed as an asset class for capital appreciation while fixed income is seen as an avenue for capital
preservation. Amongst the fixed income instruments, the most commonly accepted investment avenue is fixed deposits.
There is a psychological comfort that investors draw on account of the fixed return provided by such instruments.
However investors must realize that an instrument like a fixed deposit is tax inefficient. As a result, it does not even meet
the core objective preserving the purchasing power. That raises the obvious question – what kind of fixed income options
should investors seek?
If the veil of ignorance is done away with and the fixed income market is probed into, one will realize that there are
various market linked investment avenues that investors can invest in. To our mind, fixed income mutual funds are one
example of an efficient investment option that investors can avail of as they have various benefits like diversification,
professional management and tax efficiency. However, the question of prudent selection still remains unanswered.
Liq
uid
UST
Sho
rt T
erm
Cre
dit
Op
ps.
Lon
g I
nco
me
Dyn
am
ic
Bo
nd Gilt
6.6 6.77.4
9.2
7.7
6.7 6.9
8.3 8.6 9.0
9.9
8.9 9.29.88.9
9.3
10.310.8 10.8
11.912.6
Avg. 1 Yr RR of worst performing fund Category Average Avg. 1 Yr RR of best performing fund
Fixed Income Manager Selection Framework
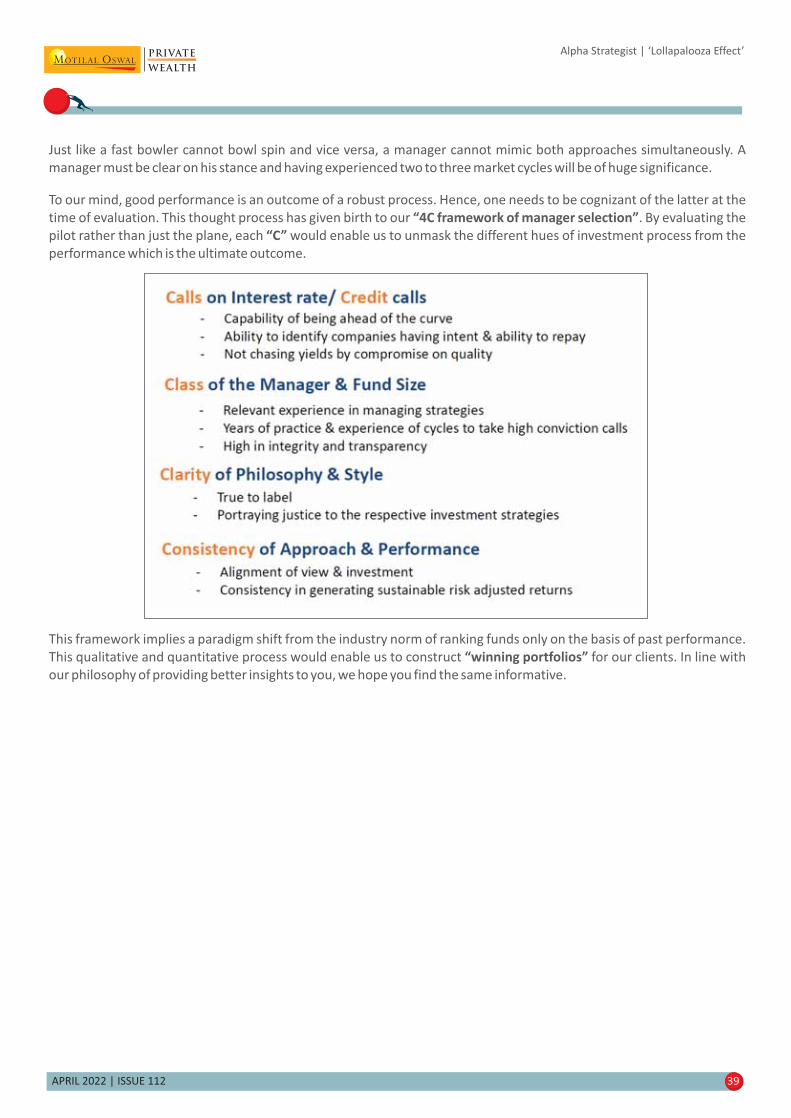
APRIL 2022 | ISSUE 112 39
Just like a fast bowler cannot bowl spin and vice versa, a manager cannot mimic both approaches simultaneously. A
manager must be clear on his stance and having experienced two to three market cycles will be of huge significance.
To our mind, good performance is an outcome of a robust process. Hence, one needs to be cognizant of the latter at the
time of evaluation. This thought process has given birth to our . By evaluating the“4C framework of manager selection”
pilot rather than just the plane, each would enable us to unmask the different hues of investment process from the“C”
performance which is the ultimate outcome.
This framework implies a paradigm shift from the industry norm of ranking funds only on the basis of past performance.
This qualitative and quantitative process would enable us to construct for our clients. In line with“winning portfolios”
our philosophy of providing better insights to you, we hope you find the same informative.
Alpha Strategist | ‘Lollapalooza Effect’
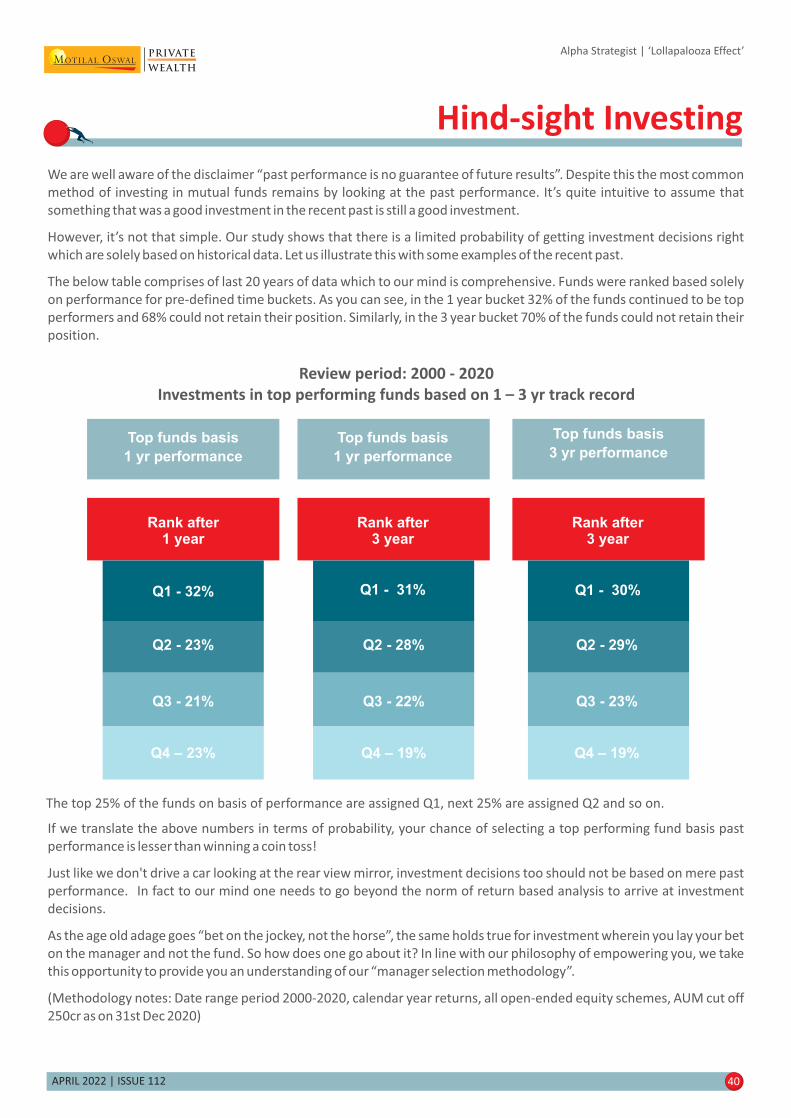
40
Hind-sight Investing
We are well aware of the disclaimer “past performance is no guarantee of future results”. Despite this the most common
method of investing in mutual funds remains by looking at the past performance. It’s quite intuitive to assume that
something that was a good investment in the recent past is still a good investment.
However, it’s not that simple. Our study shows that there is a limited probability of getting investment decisions right
which are solely based on historical data. Let us illustrate this with some examples of the recent past.
The below table comprises of last 20 years of data which to our mind is comprehensive. Funds were ranked based solely
on performance for pre-defined time buckets. As you can see, in the 1 year bucket 32% of the funds continued to be top
performers and 68% could not retain their position. Similarly, in the 3 year bucket 70% of the funds could not retain their
position.
If we translate the above numbers in terms of probability, your chance of selecting a top performing fund basis past
performance is lesser than winning a coin toss!
Just like we don't drive a car looking at the rear view mirror, investment decisions too should not be based on mere past
performance. In fact to our mind one needs to go beyond the norm of return based analysis to arrive at investment
decisions.
As the age old adage goes “bet on the jockey, not the horse”, the same holds true for investment wherein you lay your bet
on the manager and not the fund. So how does one go about it? In line with our philosophy of empowering you, we take
this opportunity to provide you an understanding of our “manager selection methodology”.
(Methodology notes: Date range period 2000-2020, calendar year returns, all open-ended equity schemes, AUM cut off
250cr as on 31st Dec 2020)
Review period: 2000 - 2020
Investments in top performing funds based on 1 – 3 yr track record
Top funds basis
1 yr performance
Rank after1 year
Q1 - 32%
Q2 - 23%
Q3 - 21%
Q4 – 23%
Rank after3 year
Q1 - 31% Q1 - 30%
Top funds basis
1 yr performance
Top funds basis
3 yr performance
Q2 - 28%
Q3 - 22%
Q4 – 19%
Q2 - 29%
Q3 - 23%
Q4 – 19%
Rank after3 year
The top 25% of the funds on basis of performance are assigned Q1, next 25% are assigned Q2 and so on.
APRIL 2022 | ISSUE 112
Alpha Strategist | ‘Lollapalooza Effect’
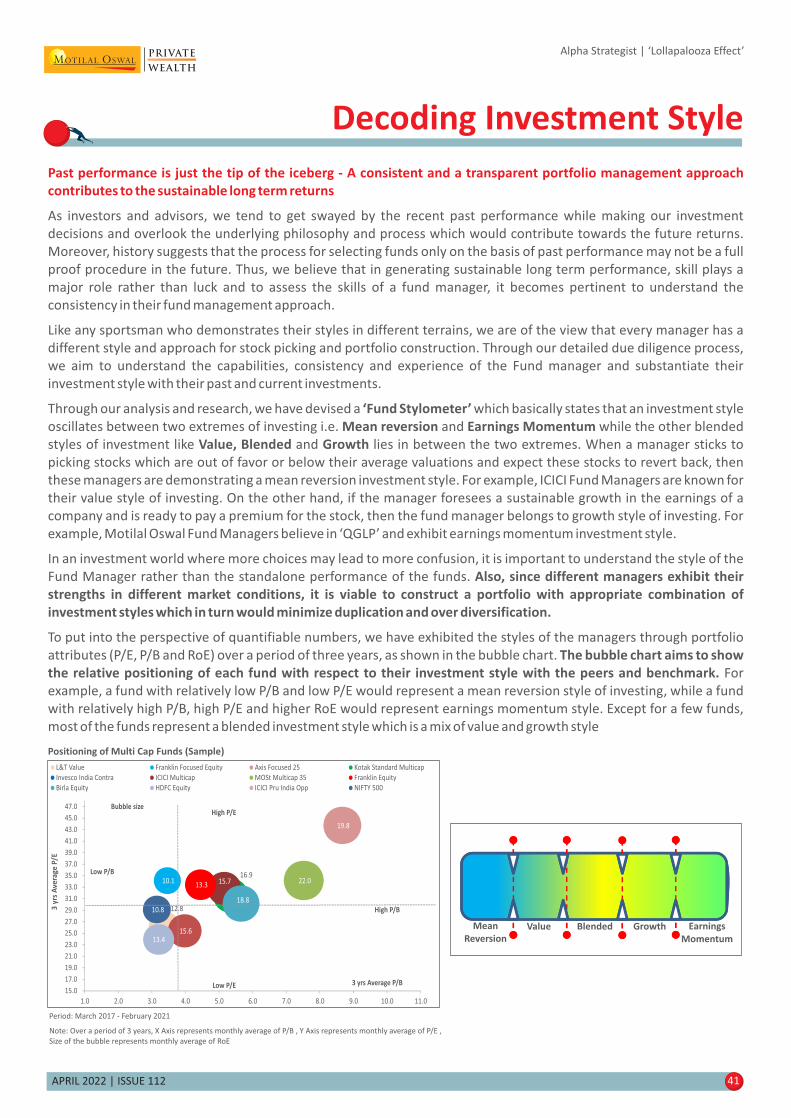
APRIL 2022 | ISSUE 112 41
Past performance is just the tip of the iceberg - A consistent and a transparent portfolio management approach
contributes to the sustainable long term returns
As investors and advisors, we tend to get swayed by the recent past performance while making our investment
decisions and overlook the underlying philosophy and process which would contribute towards the future returns.
Moreover, history suggests that the process for selecting funds only on the basis of past performance may not be a full
proof procedure in the future. Thus, we believe that in generating sustainable long term performance, skill plays a
major role rather than luck and to assess the skills of a fund manager, it becomes pertinent to understand the
consistency in their fund management approach.
Like any sportsman who demonstrates their styles in different terrains, we are of the view that every manager has a
different style and approach for stock picking and portfolio construction. Through our detailed due diligence process,
we aim to understand the capabilities, consistency and experience of the Fund manager and substantiate their
investment style with their past and current investments.
Through our analysis and research, we have devised a which basically states that an investment style‘Fund Stylometer’
oscillates between two extremes of investing i.e. and while the other blendedMean reversion Earnings Momentum
styles of investment like and lies in between the two extremes. When a manager sticks toValue, Blended Growth
picking stocks which are out of favor or below their average valuations and expect these stocks to revert back, then
these managers are demonstrating a mean reversion investment style. For example, ICICI Fund Managers are known for
their value style of investing. On the other hand, if the manager foresees a sustainable growth in the earnings of a
company and is ready to pay a premium for the stock, then the fund manager belongs to growth style of investing. For
example, Motilal Oswal Fund Managers believe in ‘QGLP’ and exhibit earnings momentum investment style.
In an investment world where more choices may lead to more confusion, it is important to understand the style of the
Fund Manager rather than the standalone performance of the funds. Also, since different managers exhibit their
strengths in different market conditions, it is viable to construct a portfolio with appropriate combination of
investment styles which in turn would minimize duplication and over diversification.
To put into the perspective of quantifiable numbers, we have exhibited the styles of the managers through portfolio
attributes (P/E, P/B and RoE) over a period of three years, as shown in the bubble chart. The bubble chart aims to show
the relative positioning of each fund with respect to their investment style with the peers and benchmark. For
example, a fund with relatively low P/B and low P/E would represent a mean reversion style of investing, while a fund
with relatively high P/B, high P/E and higher RoE would represent earnings momentum style. Except for a few funds,
most of the funds represent a blended investment style which is a mix of value and growth style
Alpha Strategist | ‘Lollapalooza Effect’
Decoding Investment Style
Mean
Reversion
Value Blended Growth Earnings
Momentum
Note: Over a period of 3 years, X Axis represents monthly average of P/B , Y Axis represents monthly average of P/E ,
Size of the bubble represents monthly average of RoE
Positioning of Multi Cap Funds (Sample)
Period: March 2017 - February 2021
12.8
10.1
19.8
16.9
15.6
15.7 22.013.3
18.8
13.4
10.8
15.0
17.0
19.0
21.0
23.0
25.0
27.0
29.0
31.0
33.0
35.0
37.0
39.0
41.0
43.0
45.0
47.0
1.0 2.0 3.0 4.0 5.0 6.0 7.0 8.0 9.0 10.0 11.0
3 yrs Average P/B
L&T Value Franklin Focused Equity Axis Focused 25 Kotak Standard Multicap
Invesco India Contra ICICI Multicap MOSt Multicap 35 Franklin Equity
Birla Equity HDFC Equity ICICI Pru India Opp NIFTY 500
Bubble size
High P/B
High P/E
Low P/E
Low P/B
3 y
rs A
vera
ge P
/E

Investment Charter
Alpha Strategist | ‘Lollapalooza Effect’
APRIL 2022 | ISSUE 112 42
Define & Review
Investment
Objectives
Design Investment
Charter In Line
With Objectives
Analyze Existing
Portfolio
Implement
Portfolio Changes
Ongoing
Monitoring &
Evaluation
Define
Investment
Objective
• Example: Portfolio designed to provide stability and protection from loss. Primary goal iscapital preservation with moderate growth
• Define any liquidity or cash flow requirements from the portfolio
Risk Tolerance• Degree of risk you are willing to undertake to achieve investment objectives
• Understanding that portfolio returns and portfolio risk are positively correlated
Investment
Horizon
• Defining investment horizon, consistent with risk tolerance and return expectations
• The longer the investment tenure, the greater likelihood of achieving investment
objectives
Return
Expectations
• Return expectations has to be viewed in conjunction with risk undertaken, and the
investment horizon
• Ensuring return maximization, for a given level of risk
• Optimizing returns through tax efficiency & legal mechanisms
Investment Charter – Purpose & Objectives
Portfolio Process
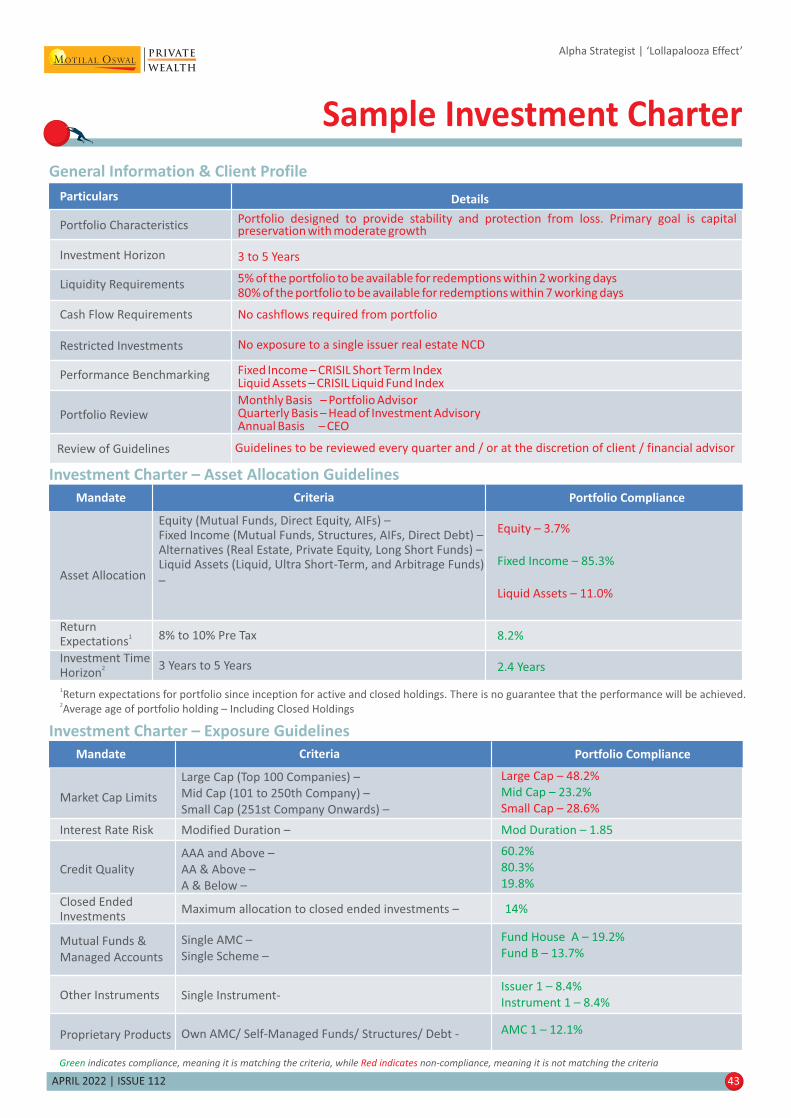
APRIL 2022 | ISSUE 112 43
General Information & Client Profile
Investment Horizon
Particulars Details
Liquidity Requirements
Cash Flow Requirements
Restricted Investments
Performance Benchmarking
Portfolio Review
Portfolio Characteristics
1Return expectations for portfolio since inception for active and closed holdings. There is no guarantee that the performance will be achieved.
2Average age of portfolio holding – Including Closed Holdings
Investment Charter – Asset Allocation Guidelines
Asset Allocation
Equity (Mutual Funds, Direct Equity, AIFs) –Fixed Income ( –Mutual Funds, Structures, AIFs, Direct Debt)Alternatives (Real Estate, Private Equity, Long Short Funds) –Liquid Assets (Liquid, Ultra Short-Term, and Arbitrage Funds)
–
ReturnExpectations
1
Investment TimeHorizon
2
8% to 10% Pre Tax
3 Years to 5 Years
Mandate Criteria Portfolio Compliance
Equity – 3.7%
Fixed Income – 85.3%
Liquid Assets – 11.0%
8.2%
2.4 Years
Portfolio designed to provide stability and protection from loss. Primary goal is capitalpreservation with moderate growth
5% of the portfolio to be available for redemptions within 2 working days80% of the portfolio to be available for redemptions within 7 working days
Fixed Income – CRISIL Short Term IndexLiquid Assets – CRISIL Liquid Fund Index
No cashflows required from portfolio
No exposure to a single issuer real estate NCD
3 to 5 Years
Review of Guidelines Guidelines to be reviewed every quarter and / or at the discretion of client / financial advisor
Monthly Basis – Portfolio AdvisorQuarterly Basis – Head of Investment AdvisoryAnnual Basis – CEO
Investment Charter – Exposure Guidelines
Market Cap Limits
Interest Rate Risk
Mandate Criteria Portfolio Compliance
Green indicates compliance, meaning it is matching the criteria, while non-compliance, meaning it is not matching the criteriaRed indicates
Credit Quality
Mutual Funds &
Managed Accounts
Other Instruments
Large Cap (Top 100 Companies) –
Mid Cap (101 to 250th Company) –
Small Cap (251st Company Onwards) –
Modified Duration –
AAA and Above –
AA & Above –
A & Below –
Single AMC –
Single Scheme –
Single Instrument-
Large Cap – 48.2%
Mid Cap – 23.2%
Small Cap – 28.6%
60.2%
80.3%
19.8%
Proprietary Products Own AMC/ Self-Managed Funds/ Structures/ Debt - AMC 1 – 12.1%
Fund House A – 19.2%
Fund B – 13.7%
Issuer 1 – 8.4%
Instrument 1 – 8.4%
Mod Duration – 1.85
Closed EndedInvestments
Maximum allocation to closed ended investments – 14%
Alpha Strategist | ‘Lollapalooza Effect’
Sample Investment Charter

Alpha Strategist | ‘Lollapalooza Effect’
Estate Planning
APRIL 2022 | ISSUE 112 44
To think about creating a succession plan is rather easy as compared to executing it. In India, succession plan is a
topic that is considered as an omen. It is considered bad to talk about death and thus making any plans
pertaining to it or around it is the worst.
Inspite of the above, there has been an exponential growth in the number of individuals who want to plan their
succession.
There are multiple reasons that can be attributed to such a growth. One of the biggest reasons has to be fear of
loss of life due to Covid. People don't want to leave their assets in haphazard manner in case of sudden
eventuality.
However, we can't say that Covid is the only major attribute. May be it was a very big thought stimulant for the
past two years. In the years preceding the last two years, we have seen a consistent growth for the need of
succession planning with our clients. One would have to look at factors such as:
• Increase in invested corpus,
• New companies are being formed that are getting recognition and large valuation,
• The need for protection of the wealth that has been generated over the years by the family against business
risks,
• multi-generational succession planning;
• Increased awareness and acknowledgment of separation or divorces;
• International migration of the family members;
• Consolidation of assets for the family;
• Providing for the special needs people in the family;
• Appointment of Guardian for minors;
• Legacy planning
• Charitable contributions
Over the past years, the HNI & UHNI segment has been aware of the above requirements and have been very
seriously creating the succession plan for the benefit of their family.
There can be situations where there are complexities such as misunderstanding between the family members,
complex asset holding structures, etc, in which case creating structures that will last with them for generations
is pertinent.
Thus, one should start with a more holistic approach which includes not only managing wealth but also
preserving it for the “rightful” beneficiaries.
This document is not valid without disclosure; refer the last page for the disclosure
APRIL 2022 | ISSUE 112 45
Alpha Strategist | ‘Lollapalooza Effect’
Section IV
Managed Strategies - PMS ..................................................................................... 64
Managed Strategies - MF .......................................................................................55
Investment Charter Template .................................................................................69
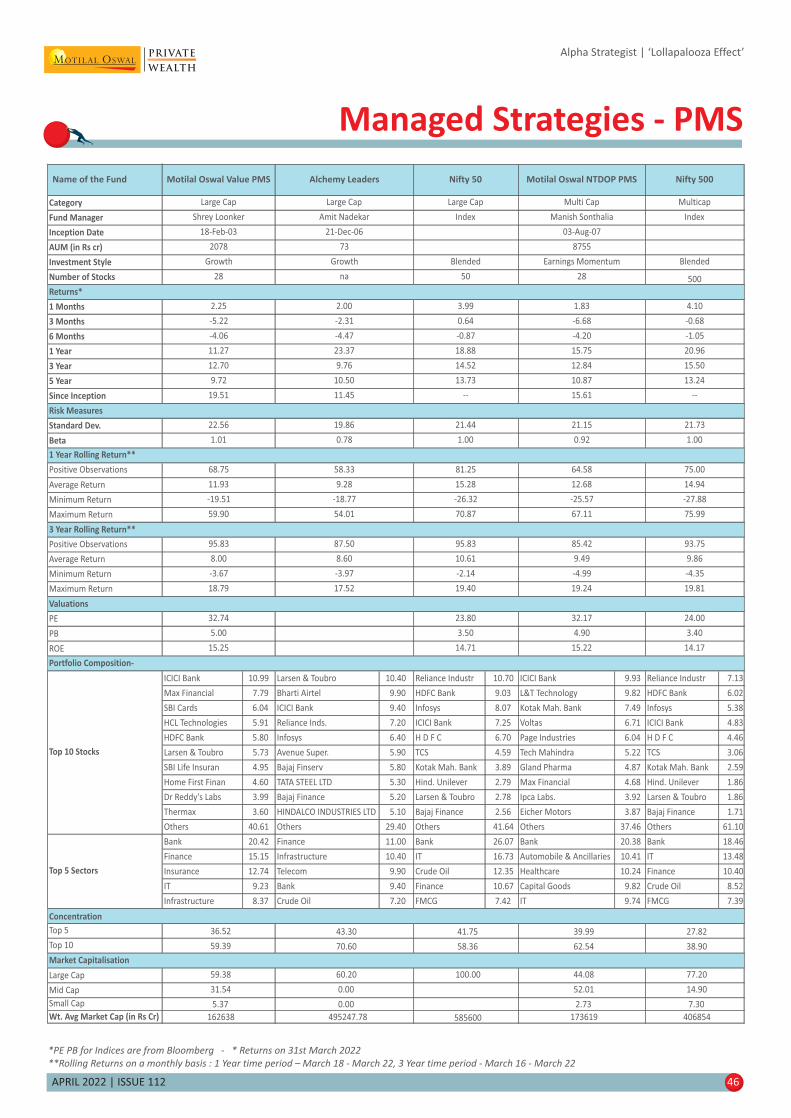
APRIL 2022 | ISSUE 112 46
*PE PB for Indices are from Bloomberg - * Returns on 31st March 2022
**Rolling Returns on a monthly basis : 1 Year time period – March 18 - March 22, 3 Year time period - March 16 - March 22
Alpha Strategist | ‘Lollapalooza Effect’
Managed Strategies - PMS
Name of the Fund
Category
Fund Manager
Inception Date
AUM (in Rs cr)
Investment Style
Number of Stocks
1 Months
3 Months
6 Months
1 Year
3 Year
5 Year
Standard Dev.
Average Return
Minimum Return
Maximum Return
Positive Observations
Average Return
Minimum Return
Maximum Return
PE
PB
ROE
ICICI Bank 10.99 Larsen & Toubro 10.40 Reliance Industr 10.70 ICICI Bank 9.93 Reliance Industr 7.13
Max Financial 7.79 Bharti Airtel 9.90 HDFC Bank 9.03 L&T Technology 9.82 HDFC Bank 6.02
SBI Cards 6.04 ICICI Bank 9.40 Infosys 8.07 Kotak Mah. Bank 7.49 Infosys 5.38
HCL Technologies 5.91 Reliance Inds. 7.20 ICICI Bank 7.25 Voltas 6.71 ICICI Bank 4.83
HDFC Bank 5.80 Infosys 6.40 H D F C 6.70 Page Industries 6.04 H D F C 4.46
Larsen & Toubro 5.73 Avenue Super. 5.90 TCS 4.59 Tech Mahindra 5.22 TCS 3.06
SBI Life Insuran 4.95 Bajaj Finserv 5.80 Kotak Mah. Bank 3.89 Gland Pharma 4.87 Kotak Mah. Bank 2.59
Home First Finan 4.60 TATA STEEL LTD 5.30 Hind. Unilever 2.79 Max Financial 4.68 Hind. Unilever 1.86
Dr Reddy's Labs 3.99 Bajaj Finance 5.20 Larsen & Toubro 2.78 Ipca Labs. 3.92 Larsen & Toubro 1.86
Thermax 3.60 HINDALCO INDUSTRIES LTD 5.10 Bajaj Finance 2.56 Eicher Motors 3.87 Bajaj Finance 1.71
Others 40.61 Others 29.40 Others 41.64 Others 37.46 Others 61.10
Bank 20.42 Finance 11.00 Bank 26.07 Bank 20.38 Bank 18.46
Finance 15.15 Infrastructure 10.40 IT 16.73 Automobile & Ancillaries 10.41 IT 13.48
Insurance 12.74 Telecom 9.90 Crude Oil 12.35 Healthcare 10.24 Finance 10.40
IT 9.23 Bank 9.40 Finance 10.67 Capital Goods 9.82 Crude Oil 8.52
Infrastructure 8.37 Crude Oil 7.20 FMCG 7.42 IT 9.74 FMCG 7.39
93.75
9.86
-4.35
19.81
Motilal Oswal Value PMS Alchemy Leaders Nifty 50 Motilal Oswal NTDOP PMS Nifty 500
Large Cap Large Cap Large Cap Multi Cap Multicap
Shrey Loonker Amit Nadekar Index Manish Sonthalia Index
18-Feb-03 21-Dec-06 03-Aug-07
2078 73 8755
Growth Growth Blended Earnings Momentum Blended
28 na 50 28 500
2.25 2.00 3.99 1.83 4.10
-5.22 -2.31 0.64 -6.68 -0.68
-4.06 -4.47 -0.87 -4.20 -1.05
11.27 23.37 18.88 15.75 20.96
12.70 9.76 14.52 12.84 15.50
9.72 10.50 13.73 10.87 13.24
19.51 11.45 15.61
22.56 19.86 21.15 21.73
1.01 0.78 0.92 1.00
21.44
1.00
11.93 9.28 12.68
-19.51 -18.77 -25.57
15.28
-26.32
70.87
14.94
-27.88
75.99
-3.67 -3.97 -4.99
18.79 17.52 19.24
95.83 87.50 85.42
8.00 8.60 9.49
95.83
10.61
-2.14
19.40
59.90 54.01 67.11
32.74 23.80 32.17 24.00
Top 10 Stocks
Top 5 Sectors
5.00 3.50 4.90 3.40
15.25 14.71 15.22 14.17
36.52 43.30 41.75 39.99 27.82
162638 495247.78 585600 173619 406854
59.38 60.20 100.00 44.08 77.20
31.54 0.00 52.01 14.90
5.37 0.00 2.73 7.30
59.39 70.60 58.36 62.54 38.90
Concentration
Top 5
Top 10
Large Cap
Mid Cap
Small Cap
Wt. Avg Market Cap (in Rs Cr)
Portfolio Composition-
Market Capitalisation
Returns*
3 Year Rolling Return**
Valuations
Since Inception
Risk Measures
-- --
Beta
Positive Observations
1 Year Rolling Return**
68.75 58.33 64.5881.25 75.00

APRIL 2022 | ISSUE 112 47
*PE PB for Indices are from Bloomberg - * Returns on 31st March 2022
**Rolling Returns on a monthly basis : 1 Year time period – March 18 - March 22, 3 Year time period - March 16 - March 22
Alpha Strategist | ‘Lollapalooza Effect’
Name of the Fund
Category
Fund Manager
Incep�on Date
AUM (in Rs cr)
Investment Style
Number of Stocks
1 Months
3 Months
6 Months
1 Year
3 Year
5 Year
Since Incep�on
Average Return
Minimum Return
Maximum Return
PE
PB
ROE
Bajaj Finance 7.43 Bajaj Finance 7.11 APL Apollo 6.96 BSE LTD 6.70 Reliance Industr 7.13
Bajaj Finserv 6.12 Bajaj Finserv 6.39 Bajaj Finance 6.95 POLYCAB INDIA 5.34 HDFC Bank 6.02
Infosys 5.80 Cholaman.Inv.&Fn 5.68 Bajaj Finserv 6.93 DCM SHRIRAM 5.31 Infosys 5.38
APL Apollo Tubes 5.52 APL Apollo Tubes 5.43 AU Small Finance 5.08 MASTEK 5.22 ICICI Bank 4.83
Polycab India 5.40 AU Small Finance 5.23 SRF 5.02 SBI 5.13 H D F C 4.46
ICICI Bank 5.37 TCS 5.14 Reliance Inds. 4.98 ICICI BANK 5.08 TCS 3.06
Reliance Industr 5.27 Page Industries 5.11 Navin Fluo.Intl. 4.93 HCL TECH 5.08 Kotak Mah. Bank 2.59
Aar� Industries 4.85 Divi's Lab. 4.89 Infosys 4.88 MAX FINANCIAL 4.68 Hind. Unilever 1.86
Page Industries 4.83 Reliance Industr 4.88 Dixon Technolog. 4.69 ORACLE FINANCIAL 4.67 Larsen & Toubro 1.86
Divi's Lab. 4.79 P I Industries 4.62 Aar� Inds. 4.68 UPL LTD 4.53 Bajaj Finance 1.71
Others 44.63 Others 45.52 Others 44.90 Others 48.26 Others 61.10
Chemicals 16.62 Finance 19.18 Chemicals 15.93 IT 4.53 Bank 18.46
Finance 13.55 Chemicals 12.78 Finance 15.14 Finance 4.53 IT 13.48
Bank 11.41 Healthcare 11.14 Bank 7.99 Materials 4.53 Finance 10.40
IT 5.80 Bank 8.97 IT 7.49 Bank 4.53 Crude Oil 8.52
Iron & Steel 5.52 Iron & Steel 5.43 Iron & Steel Industrials 4.53 FMCG 7.39
Mid Cap
Small Cap
Wt. Avg Market Cap (in Rs Cr)
14.94
-27.88
75.99
44.47 11.30 2.19 0.00 7.30
18910 236635 246147 252396 406854
21.29 20.10 33.88 48.10 14.90
Top 10 Stocks
Top 5 Sectors
7.23 4.60 8.22 2.94 3.40
18.78 12.80 16.71 16.30 14.17
38.52 35.93 49.18 18.00 24.00
54.49 69.31 - -
13.48 18.69 - -
-15.60 -18.53 - -
16.63 19.02 18.69 53.67
15.72 18.73 -- -- 15.50
12.51 16.25 -- -- 13.24
-3.59 -2.76 -2.06 -0.13 -1.05
20.20 20.90 23.30 38.11 20.96
2.61 2.23 3.17 4.55 4.10
-3.64 -3.83 -3.12 -3.36 -0.68
24 23 23 23
4326 19322 323 650
Earnings Momentum Earnings Momentum Earnings Momentum Blended Blended
Chetan Thacker, Prateek Agarwal Sumit Jain, Prateek Agarwal Kuldeep Gangwar, Sujit Jain Sunil Singhania, Aman Chowhan Index
04-Jan-10 25-Jan-10 20-Nov-19 29-Oct-20
ASK Select PMS ASK IEP PMS ASK India Vision Abakkus All Cap Ni�y 500
Mul� Cap Mul� Cap Mul�cap Mul� Cap Mul�cap
6.96
Concentra�on
Top 5
Top 10
Market Capitalisa�on
Large Cap
55.37 54.48 9.35 51.74 38.90
8.79 66.02 57.50 46.90 77.20
30.27 29.84 2.18 27.70 27.82
Returns*
500
Risk Measures
Standard Dev.
Beta
1 Year Rolling Return**
Posi�ve Observa�ons 75.0066.67 85.42 - -
20.93 21.85 21.73
--
0.89 0.94 1.00
3 Year Rolling Return**
Posi�ve Observa�ons
Average Return
Minimum Return
Maximum Return
93.75
9.86
-4.35
19.81
10.13 13.21 -
-0.49 1.38 -
21.09 24.11
95.83 100.00 -
Valua�ons
-
Por�olio Composi�on-
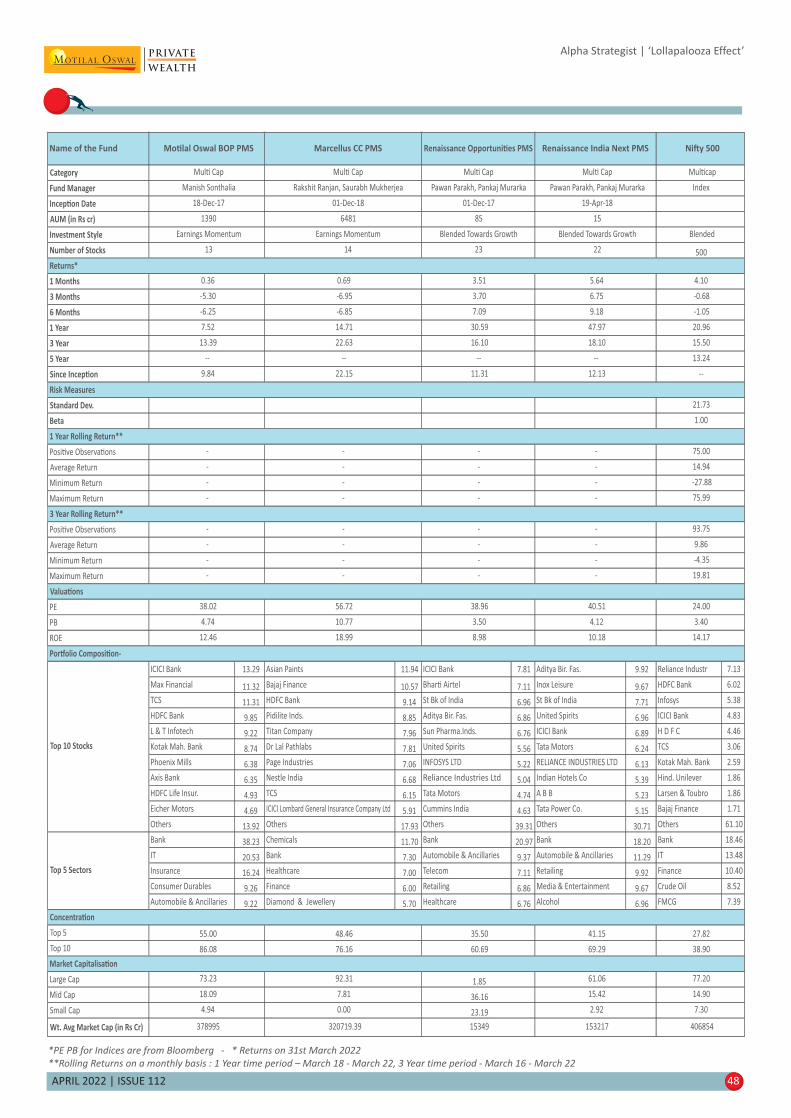
APRIL 2022 | ISSUE 112 48
*PE PB for Indices are from Bloomberg - * Returns on 31st March 2022
**Rolling Returns on a monthly basis : 1 Year time period – March 18 - March 22, 3 Year time period - March 16 - March 22
Alpha Strategist | ‘Lollapalooza Effect’
Name of the Fund
Category
Fund Manager
Incep�on Date
AUM (in Rs cr)
Investment Style
Number of Stocks
ICICI Bank 13.29 Asian Paints 11.94 ICICI Bank 7.81 Aditya Bir. Fas. 9.92 Reliance Industr 7.13
Max Financial 11.32 Bajaj Finance 10.57 Bhar� Airtel 7.11 Inox Leisure 9.67 HDFC Bank 6.02
TCS 11.31 HDFC Bank 9.14 St Bk of India 6.96 St Bk of India 7.71 Infosys 5.38
HDFC Bank 9.85 Pidilite Inds. 8.85 Aditya Bir. Fas. 6.86 United Spirits 6.96 ICICI Bank 4.83
L & T Infotech 9.22 Titan Company 7.96 Sun Pharma.Inds. 6.76 ICICI Bank 6.89 H D F C 4.46
Kotak Mah. Bank 8.74 Dr Lal Pathlabs 7.81 United Spirits 5.56 Tata Motors 6.24 TCS 3.06
Phoenix Mills 6.38 Page Industries 7.06 INFOSYS LTD 5.22 RELIANCE INDUSTRIES LTD 6.13 Kotak Mah. Bank 2.59
Axis Bank 6.35 Nestle India 6.68 Reliance Industries Ltd 5.04 Indian Hotels Co 5.39 Hind. Unilever 1.86
HDFC Life Insur. 4.93 TCS 6.15 Tata Motors 4.74 A B B 5.23 Larsen & Toubro 1.86
Eicher Motors 4.69 ICICI Lombard General Insurance Company Ltd 5.91 Cummins India 4.63 Tata Power Co. 5.15 Bajaj Finance 1.71
Others 13.92 Others 17.93 Others 39.31 Others 30.71 Others 61.10
Bank 38.23 Chemicals 11.70 Bank 20.97 Bank 18.20 Bank 18.46
IT 20.53 Bank 7.30 Automobile & Ancillaries 9.37 Automobile & Ancillaries 11.29 IT 13.48
Insurance 16.24 Healthcare 7.00 Telecom 7.11 Retailing 9.92 Finance 10.40
Consumer Durables 9.26 Finance 6.00 Retailing 6.86 Media & Entertainment 9.67 Crude Oil 8.52
Automobile & Ancillaries Diamond & Jewellery Healthcare Alcohol FMCG 7.39
Mid Cap
Small Cap
Wt. Avg Market Cap (in Rs Cr)
4.94 0.00 23.19 2.92 7.30
378995 320719.39 15349 153217 406854
1.85
18.09 7.81 36.16 15.42 14.90
Top 10 Stocks
Top 5 Sectors
Earnings Momentum Earnings Momentum Blended Towards Growth Blended Towards Growth Blended
13 14 23 22 500
18-Dec-17 01-Dec-18 01-Dec-17 19-Apr-18
1390 6481 85 15
Ni�y 500
Mul� Cap Mul� Cap Mul� Cap Mul� Cap Mul�cap
Manish Sonthalia Rakshit Ranjan, Saurabh Mukherjea Pawan Parakh, Pankaj Murarka Pawan Parakh, Pankaj Murarka Index
Mo�lal Oswal BOP PMS Marcellus CC PMS Renaissance Opportuni�es PMS Renaissance India Next PMS
9.22 5.70 6.76 6.96
Concentra�on
Top 5
Top 10
Market Capitalisa�on
Large Cap 73.23 92.31 61.06 77.20
86.08 76.16 60.69 69.29 38.90
55.00 48.46 35.50 41.15 27.82
Returns*
1 Months
3 Months
6 Months
1 Year
3 Year
5 Year
Since Incep�on
Risk Measures
Standard Dev.
Beta
1 Year Rolling Return**
Posi�ve Observa�ons
Average Return
Minimum Return
Maximum Return
3 Year Rolling Return**
Posi�ve Observa�ons
Average Return
Minimum Return
Maximum Return
Valua�ons
PE
PB
ROE
Por�olio Composi�on-
75.00
14.94
-27.88
75.99
93.75
9.86
-4.35
19.81
4.74 10.77 3.50 4.12 3.40
12.46 18.99 8.98 10.18 14.17
38.02 56.72 38.96 40.51 24.00
- - - -
- - - -
- - - -
- - - -
- - - -
- - - -
- - - -
- - - -
1.00
21.73
-- -- -- -- 13.24
9.84 22.15 11.31 12.13 --
7.52 14.71 30.59 47.97 20.96
13.39 22.63 16.10 18.10 15.50
-5.30 -6.95 3.70 6.75 -0.68
-6.25 -6.85 7.09 9.18 -1.05
0.36 0.69 3.51 5.64 4.10
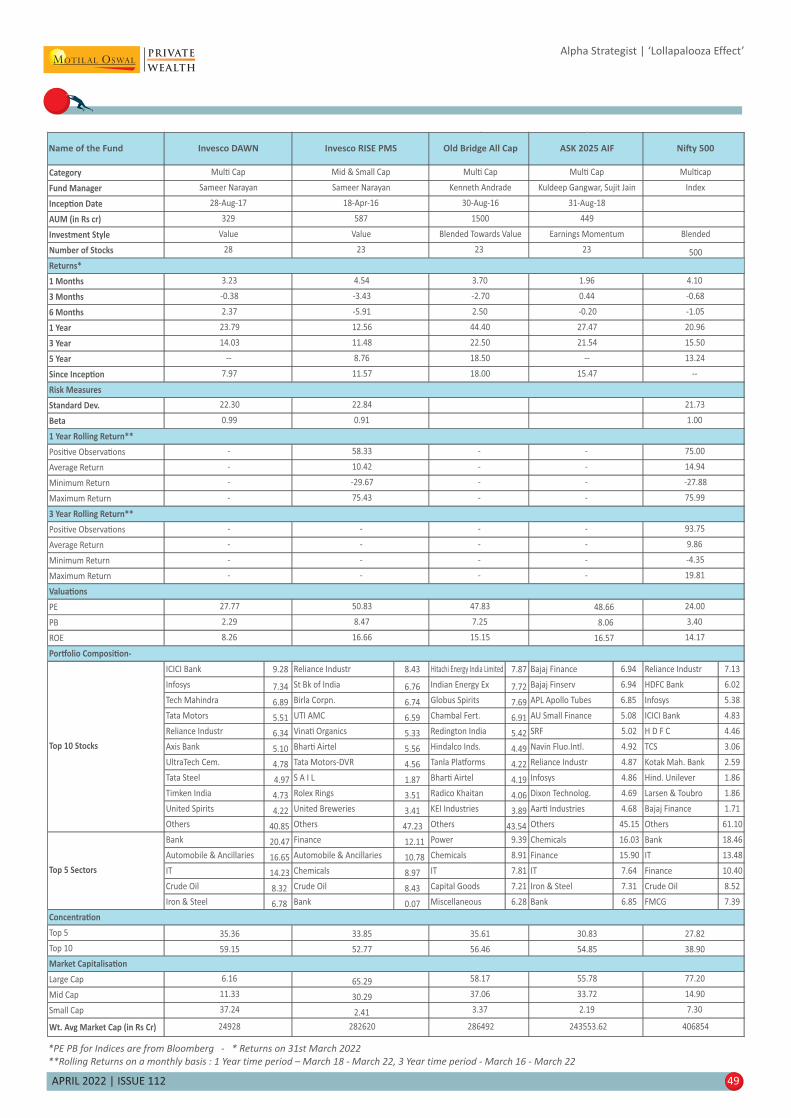
APRIL 2022 | ISSUE 112 49
*PE PB for Indices are from Bloomberg - * Returns on 31st March 2022
**Rolling Returns on a monthly basis : 1 Year time period – March 18 - March 22, 3 Year time period - March 16 - March 22
Alpha Strategist | ‘Lollapalooza Effect’
Name of the Fund
Category
Fund Manager
Incep�on Date
AUM (in Rs cr)
Investment Style
Number of Stocks
1 Months
3 Months
6 Months
1 Year
3 Year
5 Year
9.28 8.43 Hitachi Energy India Limited 7.87 Bajaj Finance
Infosys 7.34 St Bk of India 6.76 Indian Energy Ex 7.72 Bajaj Finserv 6.94 HDFC Bank 6.02
Tech Mahindra 6.89 Birla Corpn. 6.74 Globus Spirits 7.69 APL Apollo Tubes 6.85 Infosys 5.38
Tata Motors 5.51 UTI AMC 6.59 Chambal Fert. 6.91 AU Small Finance 5.08 ICICI Bank 4.83
Reliance Industr 6.34 Vina� Organics 5.33 Redington India 5.42 SRF 5.02 H D F C 4.46
Axis Bank 5.10 Bhar� Airtel 5.56 Hindalco Inds. 4.49 Navin Fluo.Intl. 4.92 TCS 3.06
UltraTech Cem. 4.78 Tata Motors-DVR 4.56 Tanla Pla�orms 4.22 Reliance Industr 4.87 Kotak Mah. Bank 2.59
Tata Steel 4.97 S A I L 1.87 Bhar� Airtel 4.19 Infosys 4.86 Hind. Unilever 1.86
Timken India 4.73 Rolex Rings 3.51 Radico Khaitan 4.06 Dixon Technolog. 4.69 Larsen & Toubro 1.86
United Spirits 4.22 United Breweries 3.41 KEI Industries 3.89 Aar� Industries 4.68 Bajaj Finance 1.71
Others 40.85 Others 47.23 Others 43.54 Others 45.15 Others 61.10
Bank 20.47 Finance 12.11 Power 9.39 Chemicals 16.03 Bank 18.46
Automobile & Ancillaries 16.65 Automobile & Ancillaries 10.78 Chemicals 8.91 Finance 15.90 IT 13.48
IT 14.23 Chemicals 8.97 IT 7.81 IT 7.64 Finance 10.40
Crude Oil 8.32 Crude Oil 8.43 Capital Goods 7.21 Iron & Steel 7.31 Crude Oil 8.52
Mid Cap
Small Cap
Wt. Avg Market Cap (in Rs Cr)
37.24 2.41 3.37 2.19 7.30
406854
11.33 30.29 37.06 33.72 14.90
Top 10 Stocks
Top 5 Sectors
24928 282620 286492 243553.62
8.76 18.50 13.24
23.79 12.56 44.40 27.47 20.96
14.03 11.48 22.50 21.54 15.50
-0.38 -3.43 -2.70 0.44 -0.68
2.37 -5.91 2.50 -0.20 -1.05
3.23 4.54 3.70 1.96 4.10
Value Value Blended Towards Value Earnings Momentum Blended
28 23 23 23 500
28-Aug-17 18-Apr-16 30-Aug-16 31-Aug-18
329 587 1500 449
Kuldeep Gangwar, Sujit Jain Index
Invesco DAWN Invesco RISE PMS Old Bridge All Cap ASK 2025 AIF Ni�y 500
Mul� Cap Mid & Small Cap Mul� Cap Mul� Cap Mul�cap
Sameer Narayan Sameer Narayan Kenneth Andrade
Iron & Steel 6.78 Bank 0.07 Miscellaneous 6.28 Bank 6.85 FMCG 7.39
Concentra�on
Top 5
Top 10
Market Capitalisa�on
Large Cap
59.15 52.77 56.46 54.85 38.90
6.16 65.29 58.17 55.78 77.20
35.36 33.85 35.61 30.83 27.82
Since Incep�on
Risk Measures
Standard Dev.
Beta
1 Year Rolling Return**
Posi�ve Observa�ons
Average Return
Minimum Return
Maximum Return
3 Year Rolling Return**
Posi�ve Observa�ons
Average Return
Minimum Return
Maximum Return
Valua�ons
PE 48.66
PB 8.06
ROE 16.57
Por�olio Composi�on-
ICICI Bank Reliance Industr 6.94 Reliance Industr 7.13
75.00
14.94
-27.88
75.99
93.75
9.86
-4.35
19.81
27.77 50.83 47.83 24.00
2.29 8.47 7.25 3.40
8.26 16.66 15.15 14.17
- - - -
- - - -
- - - -
- - - -
- 75.43 - -
- 58.33 - -
- 10.42 - -
- -29.67 - -
0.99 0.91 1.00
22.30 22.84 21.73
-- --
7.97 11.57 18.00 15.47 --
Returns*
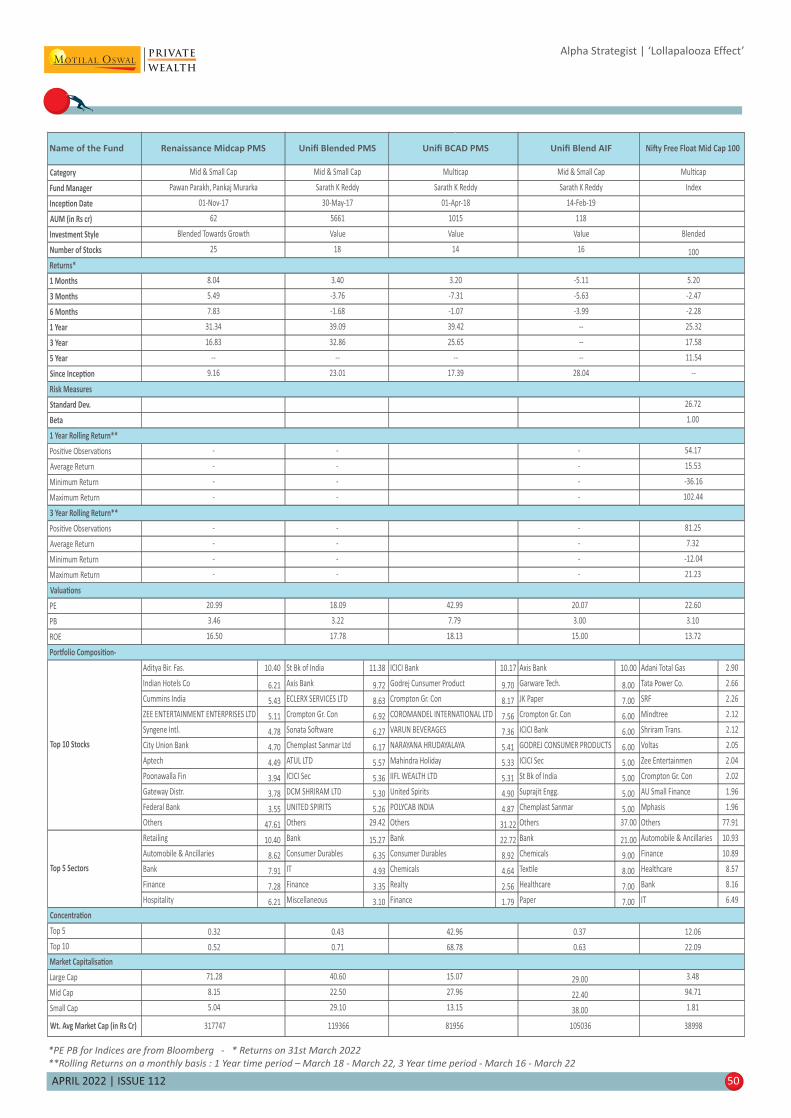
*PE PB for Indices are from Bloomberg - * Returns on 31st March 2022
**Rolling Returns on a monthly basis : 1 Year time period – March 18 - March 22, 3 Year time period - March 16 - March 22
APRIL 2022 | ISSUE 112 50
Alpha Strategist | ‘Lollapalooza Effect’
Name of the Fund
Category
Fund Manager
Incep�on Date
AUM (in Rs cr)
Investment Style
Indian Hotels Co 6.21 Axis Bank 9.72 Godrej Cunsumer Product 9.70 Garware Tech. 8.00 Tata Power Co. 2.66
Cummins India 5.43 ECLERX SERVICES LTD 8.63 Crompton Gr. Con 8.17 JK Paper 7.00 SRF 2.26
ZEE ENTERTAINMENT ENTERPRISES LTD 5.11 Crompton Gr. Con 6.92 COROMANDEL INTERNATIONAL LTD 7.56 Crompton Gr. Con 6.00 Mindtree 2.12
Syngene Intl. 4.78 Sonata So�ware 6.27 VARUN BEVERAGES 7.36 ICICI Bank 6.00 Shriram Trans. 2.12
City Union Bank 4.70 Chemplast Sanmar Ltd 6.17 NARAYANA HRUDAYALAYA 5.41 GODREJ CONSUMER PRODUCTS 6.00 Voltas 2.05
Aptech 4.49 ATUL LTD 5.57 Mahindra Holiday 5.33 ICICI Sec 5.00 Zee Entertainmen 2.04
Poonawalla Fin 3.94 ICICI Sec 5.36 IIFL WEALTH LTD 5.31 St Bk of India 5.00 Crompton Gr. Con 2.02
Gateway Distr. 3.78 DCM SHRIRAM LTD 5.30 United Spirits 4.90 Suprajit Engg. 5.00 AU Small Finance 1.96
Federal Bank 3.55 UNITED SPIRITS 5.26 POLYCAB INDIA 4.87 Chemplast Sanmar 5.00 Mphasis 1.96
Others 47.61 Others 29.42 Others 31.22 Others 37.00 Others 77.91
Retailing 10.40 Bank 15.27 Bank 22.72 Bank 21.00 Automobile & Ancillaries 10.93
Automobile & Ancillaries 8.62 Consumer Durables 6.35 Consumer Durables 8.92 Chemicals 9.00 Finance 10.89
Bank 7.91 IT 4.93 Chemicals 4.64 Tex�le 8.00 Healthcare 8.57
Finance 7.28 Finance 3.35 Realty 2.56 Healthcare 7.00 Bank 8.16
Hospitality 6.21 Miscellaneous 3.10 Finance 1.79 Paper 7.00 IT 6.49
Large Cap
Mid Cap
Small Cap
Wt. Avg Market Cap (in Rs Cr) 317747 119366 81956 105036 38998
8.15 22.50 27.96 22.40 94.71
5.04 29.10 13.15 38.00 1.81
71.28 40.60 15.07 29.00 3.48
Top 5 Sectors
Top 10 Stocks
01-Apr-18 14-Feb-19
62 5661 1015 118
Blended Towards Growth Value Value Value Blended
Renaissance Midcap PMS Unifi Blended PMS Unifi BCAD PMS Unifi Blend AIF Ni�y Free Float Mid Cap 100
Mid & Small Cap Mid & Small Cap Mul�cap Mid & Small Cap Mul�cap
Pawan Parakh, Pankaj Murarka Sarath K Reddy Sarath K Reddy Sarath K Reddy Index
01-Nov-17 30-May-17
Concentra�on
Top 5
Top 10
Market Capitalisa�on
0.32 0.43 42.96 0.37 12.06
0.52 0.71 68.78 0.63 22.09
Number of Stocks
Returns*
1 Months
3 Months
6 Months
1 Year
3 Year
5 Year
Since Incep�on
Risk Measures
Standard Dev.
Beta
1 Year Rolling Return**
Posi�ve Observa�ons
Average Return
Minimum Return
Maximum Return
3 Year Rolling Return**
Posi�ve Observa�ons
Average Return
Minimum Return
Maximum Return
Valua�ons
PE
PB
ROE
Por�olio Composi�on-
Aditya Bir. Fas. 10.40 St Bk of India 11.38 ICICI Bank 10.17 Axis Bank 10.00 Adani Total Gas 2.90
81.25
7.32
-12.04
21.23
16.50 17.78 18.13 15.00 13.72
20.99 18.09 42.99 20.07 22.60
3.46 3.22 7.79 3.00 3.10
- - -
- - -
- - -
- - -
- - -
- - -
- - -
- - -
54.17
15.53
-36.16
102.44
26.72
1.00
9.16 23.01 17.39 28.04 --
16.83 32.86 25.65 -- 17.58
-- -- -- -- 11.54
7.83 -1.68 -1.07 -3.99 -2.28
31.34 39.09 39.42 -- 25.32
8.04 3.40 3.20 -5.11 5.20
5.49 -3.76 -7.31 -5.63 -2.47
25 18 14 16 100
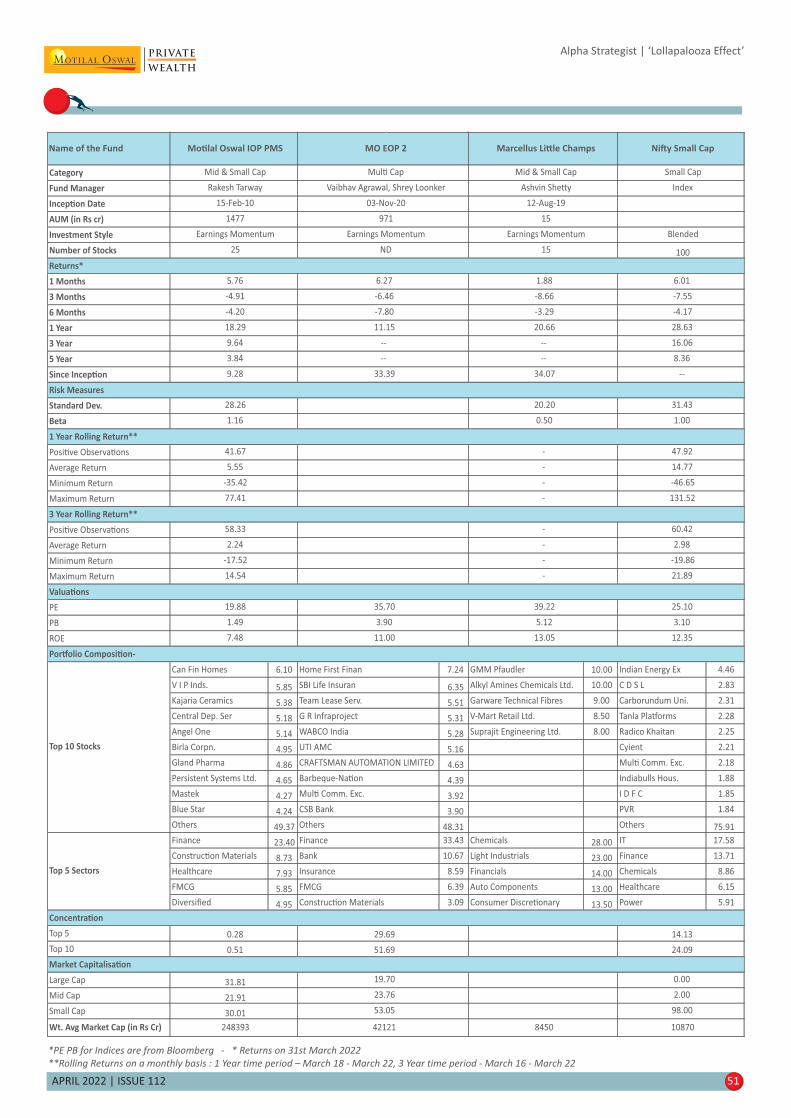
APRIL 2022 | ISSUE 112 51
Alpha Strategist | ‘Lollapalooza Effect’
*PE PB for Indices are from Bloomberg - * Returns on 31st March 2022
**Rolling Returns on a monthly basis : 1 Year time period – March 18 - March 22, 3 Year time period - March 16 - March 22
Name of the Fund
Category
Fund Manager
Incep�on Date
AUM (in Rs cr)
Investment Style
1 Months
3 Months
6 Months
1 Year
3 Year
5 Year
Minimum Return
Posi�ve Observa�ons
Average Return
Minimum Return
Maximum Return
PE
PB
ROE
Can Fin Homes 6.10 Home First Finan 7.24 GMM Pfaudler 10.00 Indian Energy Ex 4.46
V I P Inds. 5.85 SBI Life Insuran 6.35 Alkyl Amines Chemicals Ltd. 10.00 C D S L 2.83
Kajaria Ceramics 5.38 Team Lease Serv. 5.51 Garware Technical Fibres 9.00 Carborundum Uni. 2.31
Central Dep. Ser 5.18 G R Infraproject 5.31 V-Mart Retail Ltd. 8.50 Tanla Pla�orms 2.28
Angel One 5.14 WABCO India 5.28 Suprajit Engineering Ltd. 8.00 Radico Khaitan 2.25
Birla Corpn. 4.95 UTI AMC 5.16 Cyient 2.21
Gland Pharma 4.86 CRAFTSMAN AUTOMATION LIMITED 4.63 Mul� Comm. Exc. 2.18
Persistent Systems Ltd. 4.65 Barbeque-Na�on 4.39 Indiabulls Hous. 1.88
Mastek 4.27 Mul� Comm. Exc. 3.92 I D F C 1.85
Blue Star 4.24 CSB Bank 3.90 PVR 1.84
Others 49.37 Others 48.31 Others 75.91
Finance 23.40 Finance 33.43 Chemicals 28.00 IT 17.58
Construc�on Materials 8.73 Bank 10.67 Light Industrials 23.00 Finance 13.71
Healthcare 7.93 Insurance 8.59 Financials 14.00 Chemicals 8.86
FMCG 5.85 FMCG 6.39 Auto Components 13.00 Healthcare 6.15
Diversified 4.95 Construc�on Materials 3.09 Consumer Discre�onary 13.50 Power 5.91
Large Cap
Mid Cap
Small Cap
Wt. Avg Market Cap (in Rs Cr)
-46.65
60.42
2.98
-19.86
21.89
21.91 23.76 2.00
30.01 53.05 98.00
248393 42121 8450 10870
31.81
Top 10 Stocks
Top 5 Sectors
7.48 11.00 13.05 12.35
19.88 35.70 39.22 25.10
1.49 3.90 5.12 3.10
2.24 -
-17.52 -
14.54 -
58.33
-35.42 -
9.64 -- -- 16.06
3.84 -- -- 8.36
-4.91 -6.46 -8.66 -7.55
-4.20 -7.80 -3.29 -4.17
18.29 11.15 20.66 28.63
15-Feb-10 03-Nov-20 12-Aug-19
1477 971 15
Earnings Momentum Earnings Momentum Earnings Momentum Blended
Rakesh Tarway Vaibhav Agrawal, Shrey Loonker Ashvin She� y Index
Mo�lal Oswal IOP PMS MO EOP 2 Marcellus Li� le Champs Ni�y Small Cap
Mid & Small Cap Mul� Cap Mid & Small Cap Small Cap
Por�olio Composi�on-
Valua�ons
Concentra�on
Top 5
Top 10
Market Capitalisa�on
0.51 51.69 24.09
19.70 0.00
0.28 29.69 14.13
Maximum Return
3 Year Rolling Return**
131.5277.41 -
-
Since Incep�on
Risk Measures
Standard Dev.
Beta
1 Year Rolling Return**
Posi�ve Observa�ons
Average Return
47.92
14.77
41.67 -
5.55 -
1.16 0.50 1.00
28.26 20.20 31.43
9.28 33.39 34.07 --
Number of Stocks
Returns*
25 ND 15 100
5.76 6.27 1.88 6.01

*PE PB for Indices are from Bloomberg - * Returns on 31st March 2022
**Rolling Returns on a monthly basis : 1 Year time period – March 18 - March 22, 3 Year time period - March 16 - March 22
APRIL 2022 | ISSUE 112 52
Alpha Strategist | ‘Lollapalooza Effect’
Name of the Fund
Category
Fund Manager
Incep�on Date
AUM (in Rs cr)
Investment Style
Number of Stocks
Guj. Ambuja Exp 10.07 HCL Technologies 5.80 BAJAJ FINANCE LTD 7.60 ICICI BANK LTD 6.70 HDFC Bank 6.02
Hindalco Inds. 8.52 Aurobindo Pharma 4.00 DIVI'S LABORATORIES LTD 5.50 MAX HEALTHCARE INSTITUTE LTD 6.00 Infosys 5.38
HCL Technologies 8.12 Carborundum Uni. 0.00 UNITED SPIRITS LTD 4.10 LARSEN & TOUBRO INFOTECH LTD 6.80 ICICI Bank 4.83
Tata Steel 7.85 Guj.St.Petronet 2.80 ICICI BANK LTD 3.90 PRAJ INDUSTRIES LTD 6.80 H D F C 4.46
Ramkrishna Forg. 7.62 Chambal Fert. 4.40 DIXON TECHNOLOGIES (INDIA) LTD 3.00 AVENUE SUPERMARTS LTD 5.10 TCS 3.06
Great Eastern Shipping Co. Ltd. 7.03 Macrotech developers 4.90 TATA CONSUMER PRODUCTS LTD 3.20 DIVI'S LABORATORIES LTD 5.00 Kotak Mah. Bank 2.59
Redington India 6.87 Bhar� airtel 4.30 RELIANCE INDUSTRIES LTD 3.40 TATA STEEL LTD 0.00 Hind. Unilever 1.86
UPL Limited 6.60 Bhar� airtel(partly paid) 0.20 L&T TECHNOLOGY SERVICES LTD 3.20 DEEPAK NITRITE LTD 5.30 Larsen & Toubro 1.86
Cyient 6.23 Brigade enterprise 0.04 DEEPAK NITRITE LTD 3.10 TITAN COMPANY LTD 0.00 Bajaj Finance 1.71
Others 20.01 Others 62.20 Others 48.20 Others 51.00 Others 61.10
IT 15.81 IT 12.50 IT 11.90 Healthcare 11.70 Bank 18.46
Auto & Ancillaries 13.12 Chemicals 11.20 Finance 7.80 Finance 7.30 IT 13.48
Tex�le 12.67 Miscellaneous 8.50 Healthcare 5.70 Bank 7.00 Finance 10.40
Non - Ferrous Metals 7.83 Power 8.40 Alcohol 4.30 Capital Goods 6.00 Crude Oil 8.52
Agri 7.10 Agri 5.60 Bank 4.20 Retailing 5.70 FMCG 7.39
Large Cap
Mid Cap
Small Cap
Wt. Avg Market Cap (in Rs Cr)
OLD Bridge Thema�c PMS
Mid & Small Cap
Kenneth Andrade
30-Aug-16
Blended Towords Value
41073 270269 167657 406854
28.10 6.30 27.51 14.90
31.10 0.00 8.87 7.30
13.10 43.40 45.62 77.20
Top 10 Stocks
Top 5 Sectors
NA NA 16
3201 1307
Blended Towards Value Growth Blended Towards Growth Blended
Index
22-May-19 19-Dec-08 08-May-02
Old Bridge Long Term Equity Alchemy High Growth Select Stock Alchemy High Growth PMS Ni�y 500
Mul� Cap Mul�cap Mul� Cap Mul�cap
Kenneth Andrade Hiren Ved Amit Nadekar
15.85
32.14
32.27
53308
Returns*
1 Months
3 Months
6 Months
1 Year
3 Year
5 Year
Since Incep�on
Risk Measures
Standard Dev.
Beta
Posi�ve Observa�ons
Average Return
Minimum Return
Maximum Return
Posi�ve Observa�ons
Average Return
Minimum Return
Maximum Return
Valua�ons
PE
PB
ROE
Por�olio Composi�on-
Vardhman Tex�le 11.08 Indian Energy Ex 7.30 TATA ELXSI LTD 14.80 BAJAJ FINANCE LTD 7.30 Reliance Industr 7.13
NA
1.70
-3.90
8.62 5.54 3.40
15.62 19.81 14.17
55.19 27.96 24.00
-4.05 -7.66 -4.35
20.21 18.19 19.81
83.33 70.83 93.75
10.55 5.98 9.86
78.11 55.19 75.99
3 Year Rolling Return**
15.58 7.42 14.94
-30.61 -31.47 -27.88--
--
70.83 56.25 75.00
20.93 22.72 21.73
0.89 0.98 1.00
21.11 20.86 --
-- 15.82 7.03 15.50
-- 14.62 7.09 13.24
2.13 -2.21 -1.05
39.62 38.51 23.03 20.96
6.00 7.41 3.84 4.10
0.00 1.08 -3.83 -0.68
500
-6.20
27.00
23.00
--
16.90
--
--
--
--
1 Year Rolling Return**
7.05
23.98
--
--
--
--
19.06
3.56
18.70
Concentra�on
Top 5
Top 10
Market Capitalisa�on
19.90 35.90 0.34 27.82
33.74 48.70 0.49 38.90
45.64
79.99

APRIL 2022 | ISSUE 112 53
*PE PB for Indices are from Bloomberg - * Returns on 31st March 2022
**Rolling Returns on a monthly basis : 1 Year time period – March 18 - March 22, 3 Year time period - March 16 - March 22
Alpha Strategist | ‘Lollapalooza Effect’
Name of the Fund
Category
Fund Manager
Incep�on Date
AUM (in Rs cr)
WABCO India 6.46 ICICI Bank 8.14 Bajaj Finance 7.69 INFOSYS LTD 7.83 HDFC Bank 6.02
Barbeque-Na�on 5.97 HDFC Bank 6.65 Titan Company 6.71 HDFC BANK LIMITED 6.11 Infosys 5.38
SBI Life Insuran 4.93 Cash 5.05 Syngene Intl. 7.11 NESTLE INDIA LTD 4.66 ICICI Bank 4.83
Persistent Systems Ltd 4.64 Nestle India 4.39 KDDL Ltd 7.39 TITAN CO LTD 4.57 H D F C 4.46
TCNS Clothing Co 4.47 Titan Company 3.98 United Spirits 6.23 ASIAN PAINTS LTD 3.63 TCS 3.06
Catholic Syrian Bank 4.37 Asian Paints 3.82 Dixon Technolog. 5.71 PERSISTENT SYSTEMS LTD 3.52 Kotak Mah. Bank 2.59
G R Infraproject 4.33 Cholaman.Inv.&Fn 3.49 Pidilite Inds. 4.87 CHOLAMANDALAM INVESTMENT AND 3.50 Hind. Unilever 1.86
Team Lease Serv. 4.08 Axis Bank 3.24 Reliance Industr 5.23 MPHASIS LTD 3.02 Larsen & Toubro 1.86
Ratnamani Metals 3.91 Astral Poly Tech 2.70 Trent 5.07 AXIS BANK LTD 2.86 Bajaj Finance 1.71
Others 50.29 Others 49.91 Others 34.63 Others 51.49 Others 61.10
Finance 16.27 IT 18.94 IT 16.73 Bank 17.78 Bank 18.46
FMCG 5.97 Bank 16.96 Consumer Durables 13.10 IT 16.65 IT 13.48
Chemicals 5.27 Chemicals 8.58 Miscellaneous 9.64 Finance 7.91 Finance 10.40
Insurance 4.93 Finance 7.95 Finance 7.69 Chemicals 6.99 Crude Oil 8.52
Tex�le 4.47 FMCG 4.66 Retailing 7.36 FMCG 4.66 FMCG 7.39
Large Cap
Mid Cap
Small Cap
Wt. Avg Market Cap (in Rs Cr) 96848 150315.25 192899.19 322635 406854
7.12 20.36 25.20 11.91 14.90
54.10 15.82 12.10 1.51 7.30
18.43 45.31 53.70 55.21 77.20
Top 10 Stocks
Top 5 Sectors
262 6499 314
31-Aug-20 08-Apr-19 03-Jan-18 21-May-20
Ni�y 500
Mul� Cap Mul� Cap Mul� Cap Mul� Cap Mul�cap
Vaibhav Agrawal, Shrey Loonker Prashant Khemka Hiren Ved Prashant Khemka Index
MO BAF 2 ( An� Fragile) WO Pioneers PMS Alchemy ALOT AIF WO India Select AIF
Concentra�on
Top 5
Top 10
Market Capitalisa�on
28.55 32.86 38.26 0.34 27.82
49.71 50.09 60.30 0.49 38.90
Investment Style
Number of Stocks
Returns*
1 Months
3 Months
6 Months
1 Year
3 Year
5 Year
Since Incep�on
Risk Measures
Standard Dev.
Beta
Posi�ve Observa�ons
Average Return
Minimum Return
Maximum Return
Posi�ve Observa�ons
Average Return
Minimum Return
Maximum Return
Valua�ons
PE
PB
ROE
Por�olio Composi�on-
UTI AMC 6.55 Infosys 8.63 Tata Elxsi 9.36 ICICI BANK LTD 8.81 Reliance Industr 7.13
5.04 7.54 9.45 6.36 3.40
13.71 16.10 14.12 15.82 14.17
36.77 46.83 66.94 40.18 24.00
-- -- -- -- -4.35
-- -- -- -- 19.81
93.75
-- -- -- -- 9.86
3 Year Rolling Return**
-- -- -- --
-- -- -- -- -27.88
-- -- -- -- 75.99
75.00
-- -- -- -- 14.94
1 Year Rolling Return**
-- -- -- --
-- -- 21.30 21.73
-- -- 0.98 1.00
19.63 23.39 14.42 45.45 0.00
-- -- 22.54 -- 15.50
-- -- -- -- 13.24
-10.21 -1.94 6.89 -5.00 -1.05
13.83 21.86 44.46 17.58 20.96
6.74 3.11 7.86 2.46 4.10
-5.92 -3.60 -0.31 -6.52 -0.68
Growth Blended Blended Towards Growth Blended Blended
28 59 ND 21 500

*PE PB for Indices are from Bloomberg - * Returns on 31st March 2022
**Rolling Returns on a monthly basis : 1 Year time period – March 18 - March 22, 3 Year time period - March 16 - March 22
APRIL 2022 | ISSUE 112 54
Alpha Strategist | ‘Lollapalooza Effect’
Name of the Fund
Category
Fund Manager
Incep�on Date
AUM (in Rs cr)
Investment Style
3 Months
6 Months
1 Year
3 Year
5 Year
Infosys 8.41 8.71 Bajaj Fin. 6.45
HDFC Bank 6.69 Max Financial 6.85 HDFC Bank 9.03 Bajaj Finserv 6.38 Tata Power Co. 2.66
Power Grid Corpora�on Of India Limited 5.79 SBI Cards 6.50 Infosys 8.07 APL Apollo 5.76 SRF 2.26
Asian Paints 4.60 Larsen & Toubro 6.08 ICICI Bank 7.25 Solar Industries 5.53 Mindtree 2.12
Indian Energy Ex 4.00 SBI Life Insuran 5.06 H D F C 6.70 Aar� Inds. 4.94 Shriram Trans. 2.12
Apollo Hospitals 2.40 HDFC Bank 6.04 TCS 4.59 AAVAS Financiers 4.58 Voltas 2.05
Persistent Sys 4.16 Bhar� Airtel 3.44 Kotak Mah. Bank 3.89 Dixon Technolog. 4.47 Zee Entertainmen 2.04
Reliance Inds. 4.07 HCL Technologies 6.02 Hind. Unilever 2.79 AU Small Finance 4.43 Crompton Gr. Con 2.02
Titan Company 4.49 Home First Finan 4.86 Larsen & Toubro 2.78 Radico Khaitan 4.39 AU Small Finance 1.96
Kotak Mah. Bank 3.02 Tube Investments 3.15 Bajaj Finance 2.56 Affle India 4.31 Mphasis 1.96
Others 52.37 Others 43.29 Others 41.64 Others 48.77 Others 77.91
IT 20.96 Finance 22.77 Bank 26.07 Chemicals 18.98 Automobile & Ancillaries 10.93
Bank 11.90 Bank 18.55 IT 16.73 Finance 18.57 Finance 10.89
Healthcare 9.04 IT 9.31 Crude Oil 12.35 FMCG 7.62 Healthcare 8.57
Finance 7.18 Automobile & Ancillaries 7.90 Finance 10.67 Healthcare 5.76 Bank 8.16
Chemicals 4.60 FMCG 7.46 FMCG 7.42 Iron & Steel 5.47 IT 6.49
Large Cap
Mid Cap
Small Cap
Wt. Avg Market Cap (in Rs Cr) 69984 38998
21.44 3.48
61.52 94.71
Top 10 Stocks
Top 5 Sectors
15.52 1.81
21.20
3.14
100.00
0.00
0.00
-5.10
15.80
19.51
--
ASK EOP
Mid and Small Cap
Anant Jalan , Dhaval Mehta
-7.62
24-Aug-17
Earnings Momentum
18-Apr-21
95
Blended
Axis Prime Factor AIF MO Mul�cap Equity AIF Ni�y 50
Large Cap
Karthik Kumar
07-Sep-20
Shrey Loonker
Large Cap Large Cap
Index
69.27
-4.40
-2.00
--
--
--
324825.40 54525.40
28.93
3.19
24.49
16.40
3.20
585600
Blended
0.641.46
Growth
-0.87
18.88
14.52
13.73--
--
1 Months 1.974.80 3.992.99
Since Incep�on
Posi�ve Observa�ons
Average Return
Minimum Return
Maximum Return
Posi�ve Observa�ons
Average Return
Minimum Return
Maximum Return
Valua�ons
PE
PB
ROE
Por�olio Composi�on-
ICICI Bank Reliance Industr 10.70 Adani Total Gas 2.90
16.35 13.60
-- 7.32
-- -12.04
-- 21.23
52.00 22.60
8.50 3.10
-- 81.25
--
--
--
--
3 Year Rolling Return**
15.28
-26.32
13.2020.20
23.80
3.50
14.71
70.87
95.83
10.61
-2.14
19.40
81.25
22.49
Concentra�on
Top 5
Top 10
Market Capitalisa�on
51.23 22.09
29.06 12.06
30.52
33.2029.49
47.63
41.75
35.64
-2.28
25.32
17.58
11.54
CNX FF Midcap 100
Mid Cap
Index
-2.47
Blended
5.20
54.17
15.53
-36.16
102.44
--
Number of Stocks
Returns*
2642 50ND 100
Risk Measures
Standard Dev.
Beta --
1 Year Rolling Return**
--21.44
1.00
--
1.00
26.72
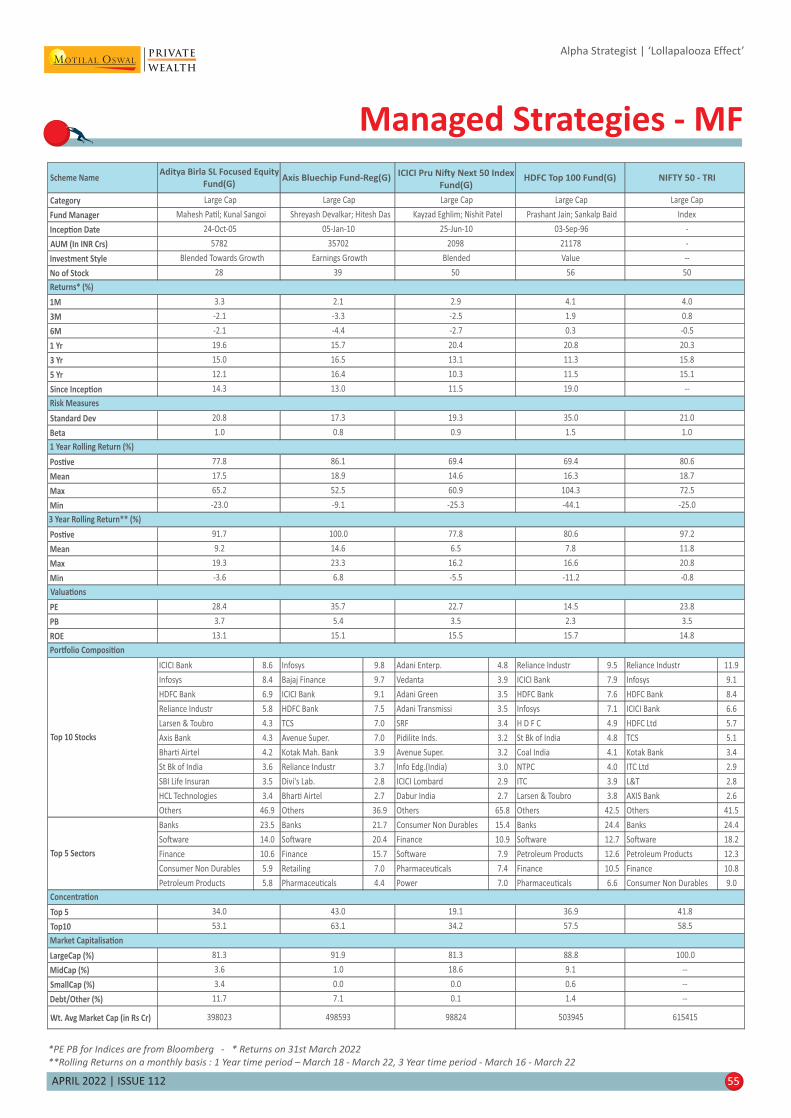
APRIL 2022 | ISSUE 112 55
Alpha Strategist | ‘Lollapalooza Effect’
Managed Strategies - MF
*PE PB for Indices are from Bloomberg - * Returns on 31st March 2022
**Rolling Returns on a monthly basis : 1 Year time period – March 18 - March 22, 3 Year time period - March 16 - March 22
Scheme Name
Category
Fund Manager
Incep�on Date
AUM (In INR Crs)
Investment Style
No of Stock
1M
3M
6M
1 Yr
3 Yr
5 Yr
Since Incep�on
Standard Dev
Beta
Pos�ve
Mean
Max
Min
Pos�ve
Mean
Max
Min
PE
PB
ROE
ICICI Bank 8.6 Infosys 9.8 Adani Enterp. 4.8 Reliance Industr 9.5 Reliance Industr 11.9
Infosys 8.4 Bajaj Finance 9.7 Vedanta 3.9 ICICI Bank 7.9 Infosys 9.1
HDFC Bank 6.9 ICICI Bank 9.1 Adani Green 3.5 HDFC Bank 7.6 HDFC Bank 8.4
Reliance Industr 5.8 HDFC Bank 7.5 Adani Transmissi 3.5 Infosys 7.1 ICICI Bank 6.6
Larsen & Toubro 4.3 TCS 7.0 SRF 3.4 H D F C 4.9 HDFC Ltd 5.7
Axis Bank 4.3 Avenue Super. 7.0 Pidilite Inds. 3.2 St Bk of India 4.8 TCS 5.1
Bhar� Airtel 4.2 Kotak Mah. Bank 3.9 Avenue Super. 3.2 Coal India 4.1 Kotak Bank 3.4
St Bk of India 3.6 Reliance Industr 3.7 Info Edg.(India) 3.0 NTPC 4.0 ITC Ltd 2.9
SBI Life Insuran 3.5 Divi's Lab. 2.8 ICICI Lombard 2.9 ITC 3.9 L&T 2.8
HCL Technologies 3.4 Bhar� Airtel 2.7 Dabur India 2.7 Larsen & Toubro 3.8 AXIS Bank 2.6
Others 46.9 Others 36.9 Others 65.8 Others 42.5 Others 41.5
Banks 23.5 Banks 21.7 Consumer Non Durables 15.4 Banks 24.4 Banks 24.4
So�ware 14.0 So�ware 20.4 Finance 10.9 So�ware 12.7 So�ware 18.2
Finance 10.6 Finance 15.7 So�ware 7.9 Petroleum Products 12.6 Petroleum Products 12.3
Consumer Non Durables 5.9 Retailing 7.0 Pharmaceu�cals 7.4 Finance 10.5 Finance 10.8
Petroleum Products 5.8 Pharmaceu�cals 4.4 Power 7.0 Pharmaceu�cals 6.6 Consumer Non Durables 9.0
Top 5
Top10
LargeCap (%)
MidCap (%)
SmallCap (%)
Debt/Other (%)
Wt. Avg Market Cap (in Rs Cr)
28.4 35.7
Top 10 Stocks
Top 5 Sectors
Aditya Birla SL Focused Equity
Fund(G)Axis Bluechip Fund-Reg(G)
19.6 15.7
23.3
-2.1 -4.4
15.0 16.5
Returns* (%)
Risk Measures
1 Year Rolling Return (%)
3 Year Rolling Return** (%)
Por�olio Composi�on
NIFTY 50 - TRI
Large Cap Large Cap Large Cap Large Cap
20.3
398023 498593
-
Blended Towards Growth Earnings Growth Value --
28 39 56 50
2098
Blended
5782 35702 21178
50
4.0
-2.1 -3.3 1.9 0.8
15.5
Valua�ons
11.3 15.8
12.1 16.4 11.5 15.1
20.4
13.1
10.3
20.8
HDFC Top 100 Fund(G)
Mahesh Pa�l; Kunal Sangoi Shreyash Devalkar; Hitesh Das Prashant Jain; Sankalp Baid
0.3 -0.5
2.9
-2.5
-2.7
3.3 2.1 4.1
Large Cap
Kayzad Eghlim; Nishit Patel
25-Jun-10
Index
24-Oct-05 05-Jan-10 03-Sep-96 -
ICICI Pru Ni�y Next 50 Index
Fund(G)
21.0
1.0 0.8 1.5 1.0
11.5
19.3
0.9
14.3 13.0 19.0 --
20.8 17.3 35.0
72.5
-23.0 -9.1 -44.1 -25.0
77.8 86.1 69.4 80.6
17.5 18.9 16.3 18.7
69.4
14.6
60.9
-25.3
65.2 52.5 104.3
16.6 20.8
-3.6 6.8 -11.2 -0.8
91.7 80.6 97.2
9.2 14.6 7.8 11.8
100.0 77.8
6.5
16.2
-5.5
19.3
14.5 23.8
3.7 5.4 2.3 3.5
22.7
3.5
503945 615415
3.6 1.0 9.1 --
3.4 0.0 0.6 --
34.2
81.3
18.6
0.0
0.1
98824
13.1 15.1 15.7 14.8
34.0 43.0 36.9 41.8
11.7 7.1 1.4 --
53.1 63.1 57.5 58.5
81.3 91.9 88.8 100.0
Concentra�on
Market Capitalisa�on
19.1

APRIL 2022 | ISSUE 112 56
Alpha Strategist | ‘Lollapalooza Effect’
*PE PB for Indices are from Bloomberg - * Returns on 31st March 2022
**Rolling Returns on a monthly basis : 1 Year time period – March 18 - March 22, 3 Year time period - March 16 - March 22
Scheme Name
Category
Fund Manager
Incep�on Date
AUM (In INR Crs)
Investment Style
No of Stock
1M
3M
6M
1 Yr
3 Yr
5 Yr
Since Incep�on
Standard Dev
Beta
Pos�ve
Mean
Max
Min
Pos�ve
Mean
Max
Min
PE
PB
ROE
Infosys 9.7 HDFC Bank 8.5 Reliance Industr 11.9 Reliance Industr 11.9 Reliance Industr 11.9
ICICI Bank 8.8 ICICI Bank 8.5 Infosys 8.5 Infosys 9.1 Infosys 9.1
HDFC Bank 8.1 H D F C 7.5 HDFC Bank 7.5 HDFC Bank 8.4 HDFC Bank 8.4
Reliance Industr 6.7 Bajaj Auto 7.5 ICICI Bank 7.5 ICICI Bank 6.6 ICICI Bank 6.6
Axis Bank 4.3 A B B 7.3 H D F C 7.3 H D F C 5.7 HDFC Ltd 5.7
St Bk of India 4.3 TCS 7.2 TCS 7.2 TCS 5.1 TCS 5.1
Bhar� Airtel 3.1 Container Corpn. 6.5 Kotak Mah. Bank 6.5 Kotak Mah. Bank 3.4 Kotak Bank 3.4
TCS 2.9 Infosys 5.3 ITC 5.3 ITC 2.9 ITC Ltd 2.9
Sun Pharma.Inds. 2.4 Reliance Industr 4.4 Larsen & Toubro 4.4 Larsen & Toubro 2.8 L&T 2.8
HCL Technologies 2.4 Kotak Mah. Bank 3.9 Axis Bank 3.9 Axis Bank 2.6 AXIS Bank 2.6
Others 47.2 Others 33.4 Others 30.1 Others 41.5 Others 41.5
Banks 25.6 Banks 20.9 Banks 24.4 Banks 24.4 Banks 24.4
So�ware 16.1 Finance 13.8 So�ware 18.2 So�ware 18.2 So�ware 18.2
Petroleum Products 8.0 So�ware 12.5 Petroleum Products 12.4 Petroleum Products 12.4 Petroleum Products 12.3
Finance 7.2 Auto 10.6 Finance 10.9 Finance 10.8 Finance 10.8
Pharmaceu�cals 6.1 Industrial Capital Goods 7.3 Consumer Non Durables 9.0 Consumer Non Durables 9.0 Consumer Non Durables 9.0
Top 5
Top10
LargeCap (%)
MidCap (%)
SmallCap (%)
Debt/Other (%)
Wt. Avg Market Cap (in Rs Cr)
Mirae Asset Large Cap
Fund-Reg(G)
Mo�lal Oswal Focused 25
Fund-Reg(G)
UTI Ni�y Index Fund-
Reg(G)
Mo�lal Oswal Ni�y 50
Index Fund-Reg(G)NIFTY 50 - TRI
Large Cap Large Cap Large Cap Large Cap Large Cap
Gaurav Misra; Gaurav Khandelwal Siddharth Bothra; Abhiroop Mukherjee Sharwan Kumar Goyal Swapnil P Mayekar Index
04-Apr-08 13-May-13 04-Mar-00 23-Dec-19 -
31929 1695 6882 164 -
Blended Towards Value Earnings Growth Blended Blended --
63 24 50 50 50
3.4 2.8 4.0 4.0 4.0
Returns* (%)
-1.8 -4.0 0.7 0.7 0.8
-2.5 -8.0 -0.6 -0.8 -0.5
18.2 5.6 19.8 19.3 20.3
14.8 13.4 15.4 -- 15.8
14.2 10.9 14.7 -- 15.1
15.7 13.7 11.8 17.5 --
20.6 19.9 21.3 -- 21.0
1.0 0.9 1.0 -- 1.0
83.3 77.8 77.8 -- 80.6
18.1 16.4 18.3 -- 18.7
68.7 59.9 72.1 -- 72.5
-24.1 -13.6 -25.4 -- -25.0
97.2 97.2 97.2 -- 97.2
11.4 10.4 11.4 -- 11.8
23.7 32.5 23.8 23.8 23.8
20.0 20.6 20.4 -- 20.8
-0.9 -0.2 -1.2 -- -0.8
Top 10 Stocks
Top 5 Sectors
37.8 39.3 42.7 41.8 41.8
3.6 4.7 3.5 3.5 3.5
15.2 14.3 14.8 14.8 14.8
Concentra�on
100.0
13.8 21.2 0.0 0.0 --
52.8 66.6 69.9 58.5 58.5
Market Capitalisa�on
Risk Measures
1 Year Rolling Return (%)
3 Year Rolling Return** (%)
Valua�ons
Por�olio Composi�on-
454761 422973 613452 613051 615415
2.0 0.0 0.0 0.0 --
3.5 3.5 -0.2 -0.1 --
80.8 75.3 100.2 100.1
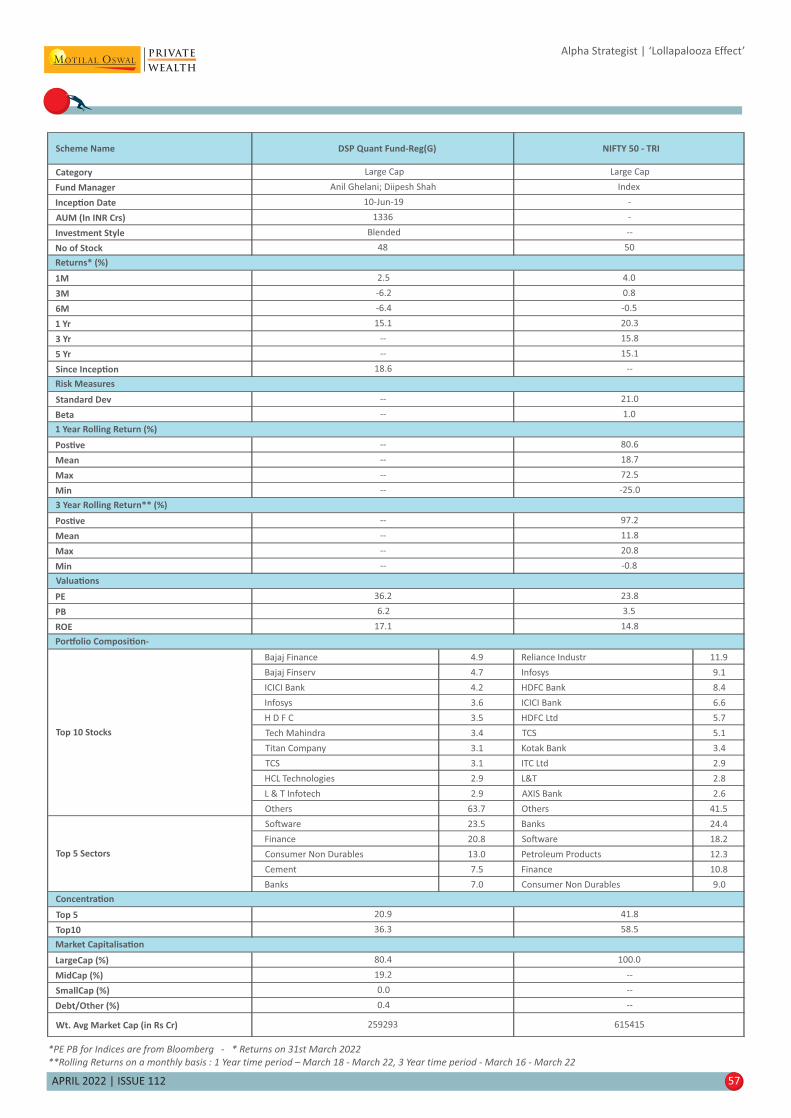
Alpha Strategist | ‘Lollapalooza Effect’
57APRIL 2022 | ISSUE 112
*PE PB for Indices are from Bloomberg - * Returns on 31st March 2022
**Rolling Returns on a monthly basis : 1 Year time period – March 18 - March 22, 3 Year time period - March 16 - March 22
Scheme Name
Category
Fund Manager
Incep�on Date
AUM (In INR Crs)
Investment Style
No of Stock
1M
3M
6M
1 Yr
3 Yr
5 Yr
Since Incep�on
Standard Dev
Beta
Pos�ve
Mean
Max
Min
Pos�ve
Mean
Max
Min
PE
PB
ROE
Bajaj Finance 4.9 Reliance Industr 11.9
Bajaj Finserv 4.7 Infosys 9.1
ICICI Bank 4.2 HDFC Bank 8.4
Infosys 3.6 ICICI Bank 6.6
H D F C 3.5 HDFC Ltd 5.7
Tech Mahindra 3.4 TCS 5.1
Titan Company 3.1 Kotak Bank 3.4
TCS 3.1 ITC Ltd 2.9
HCL Technologies 2.9 L&T 2.8
L & T Infotech 2.9 AXIS Bank 2.6
Others 63.7 Others 41.5
So�ware 23.5 Banks 24.4
Finance 20.8 So�ware 18.2
Consumer Non Durables 13.0 Petroleum Products 12.3
Cement 7.5 Finance 10.8
Banks 7.0 Consumer Non Durables 9.0
Top 5
Top10
LargeCap (%)
MidCap (%)
SmallCap (%)
Debt/Other (%)
Wt. Avg Market Cap (in Rs Cr)
Anil Ghelani; Diipesh Shah Index
10-Jun-19 -
DSP Quant Fund-Reg(G) NIFTY 50 - TRI
Large Cap Large Cap
48 50
2.5 4.0
1336 -
Blended --
Returns* (%)
15.1 20.3
-- 15.8
-6.2 0.8
-6.4 -0.5
-- 21.0
-- 1.0
-- 15.1
18.6 --
Risk Measures
-- 72.5
-- -25.0
-- 80.6
-- 18.7
-- 20.8
-- -0.8
-- 97.2
-- 11.8
6.2 3.5
17.1 14.8
36.2 23.8
Top 10 Stocks
Top 5 Sectors
20.9 41.8
Por�olio Composi�on-
Concentra�on
1 Year Rolling Return (%)
3 Year Rolling Return** (%)
Valua�ons
259293 615415
0.0 --
0.4 --
80.4 100.0
19.2 --
36.3 58.5
Market Capitalisa�on

APRIL 2022 | ISSUE 112 58
Alpha Strategist | ‘Lollapalooza Effect’
*PE PB for Indices are from Bloomberg - * Returns on 31st March 2022
**Rolling Returns on a monthly basis : 1 Year time period – March 18 - March 22, 3 Year time period - March 16 - March 22
Scheme Name
Category
Fund Manager
Incep�on Date
AUM (In INR Crs)
Investment Style
No of Stock
1M
3M
6M
1 Yr
3 Yr
5 Yr
Since Incep�on
Standard Dev
Beta
Pos�ve
Mean
Max
Min
Pos�ve
Mean
Max
Min
PE
PB
ROE
ICICI Bank 9.2 Bajaj Finance 10.6 Bajaj Finance 9.9 St Bk of India 8.1 Reliance Industries Ltd 7.9
Infosys 8.8 Nestle India 9.6 TCS 9.6 ICICI Bank 6.9 Infosys Ltd 6.1
HDFC Bank 6.3 Avenue Super. 9.1 Avenue Super. 9.1 Reliance Industr 5.8 HDFC Bank Ltd. 5.6
Bhar� Airtel 5.7 TCS 8.4 Divi's Lab. 8.4 Infosys 5.4 ICICI Bank Ltd. 4.4
Dr Reddy's Labs 5.0 Wipro 7.4 Kotak Mah. Bank 7.4 NTPC 5.4 Housing Development Finance Corp.Lt 3.8
HCL Technologies 4.9 Info Edg.(India) 5.7 Pidilite Inds. 5.7 Coal India 5.2 Tata Consultancy Services Ltd. 3.4
Sun Pharma.Inds. 3.4 H D F C 4.7 Info Edg.(India) 4.7 HDFC Bank 5.2 Kotak Mahindra Bank Ltd. 2.2
Bajaj Finance 2.7 Kotak Mah. Bank 4.1 H D F C 4.1 Larsen & Toubro 5.1 ITC Ltd 1.9
Tata Steel 2.4 Torrent Power 3.8 ICICI Bank 3.8 ITC 4.0 Larsen & Toubro Limited 1.9
Axis Bank 2.1 HDFC Bank 3.1 Bajaj Finserv 3.1 Axis Bank 2.8 AXIS Bank Ltd. 1.7
Others 49.4 Others 33.5 Others 34.1 Others 46.0 Others 61.2
Banks 21.7 So�ware 23.8 So�ware 19.7 Banks 24.6 Banks 17.7
So�ware 16.0 Finance 15.3 Finance 18.8 Finance 9.5 So�ware 14.6
Pharmaceu�cals 10.6 Consumer Non Durables 9.6 Banks 14.7 Power 8.4 Finance 10.8
Finance 9.1 Retailing 9.1 Retailing 8.6 Petroleum Products 8.2 Petroleum Products 8.7
Consumer Non Durables 6.2 Banks 7.2 Pharmaceu�cals 6.8 So�ware 6.4 Consumer Non Durables 8.4
Top 5
Top10
LargeCap (%)
MidCap (%)
SmallCap (%)
Debt/Other (%)
Wt. Avg Market Cap (in Rs Cr)
Aditya Birla SL Flexi Cap
Fund(G)
Axis ESG Equity Fund-
Reg(G)
Axis Focused 25 Fund-
Reg(G)HDFC Flexi Cap Fund(G) NIFTY 500 - TRI
Large Cap Large Cap Large Cap Large Cap Large Cap
Anil Shah; Vinod Narayan Bhat Jinesh Gopani; Hitesh Das Jinesh Gopani; Hitesh Das Prashant Jain; Sankalp Baid Index
27-Aug-98 12-Feb-20 29-Jun-12 01-Jan-95 -
16012 1897 19560 27496 -
Blended Towards Growth Blended towards Growth Blended towards Growth Value --
72 18 23 54 50
4.2 1.8 1.6 4.3 4.1
Returns* (%)
-1.5 -7.7 -6.6 3.7 -0.4
-2.5 -6.6 -8.9 3.0 -0.6
21.3 13.5 15.0 26.8 22.3
15.8 0.0 16.7 14.0 16.8
12.6 0.0 15.3 13.2 14.6
22.2 22.5 16.2 18.5 --
22.5 -- 21.1 24.16 21.3
1.0 -- 0.9 1.04 1.0
72.2 -- 77.8 69.44 83.3
18.8 -- 19.2 18.59 19.5
74.0 -- 61.9 75.96 77.6
-26.3 -- -13.7 -32.81 -26.6
86.1 -- 100.0 80.56 94.4
9.2 -- 13.3 8.28 10.5
25.3 38.9 40.1 12.4 24.0
20.4 -- 23.4 17.69 21.2
-4.9 -- 3.4 -5.58 -3.1
Top 10 Stocks
Top 5 Sectors
35.0 45.0 44.4 31.6 27.7
3.7 6.5 6.2 1.9 3.4
14.8 16.7 15.5 15.6 14.2
83.0 74.5 77.2
15.2 7.4 5.0 16.1 14.9
50.6 66.5 65.9 54.0 38.8
Risk Measures
1 Year Rolling Return (%)
3 Year Rolling Return** (%)
Valua�ons
Por�olio Composi�on-
Concentra�on
Market Capitalisa�on
306105 291483 345396 353186 424829
10.1 2.3 0.6 7.1 7.3
4.4 27.5 11.4 2.3 0.6
70.3 62.8

APRIL 2022 | ISSUE 112 59
*PE PB for Indices are from Bloomberg - * Returns on 31st March 2022
**Rolling Returns on a monthly basis : 1 Year time period – March 18 - March 22, 3 Year time period - March 16 - March 22
Alpha Strategist | ‘Lollapalooza Effect’
Scheme Name
Category
Fund Manager
Incep�on Date
AUM (In INR Crs)
Investment Style
No of Stock
1M
3M
6M
1 Yr
3 Yr
5 Yr
Since Incep�on
Standard Dev
Beta
Pos�ve
Mean
Max
Min
Pos�ve
Mean
Max
Min
PE
PB
ROE
NTPC 9.3 ICICI Bank 8.5 ICICI Bank 5.4 ICICI Bank 8.9 Reliance Industries Ltd 7.9
Sun Pharma.Inds. 9.0 HDFC Bank 7.5 St Bk of India 7.5 Infosys 8.2 Infosys Ltd 6.1
O N G C 9.0 Infosys 6.9 Infosys 6.9 Reliance Industr 6.4 HDFC Bank Ltd. 5.6
Bhar� Airtel 8.2 St Bk of India 4.4 SRF 4.4 SRF 5.8 ICICI Bank Ltd. 4.4
Axis Bank 7.3 Sun Pharma.Inds. 3.8 Axis Bank 3.8 HDFC Bank 5.4 Housing Development Finance Corp.Lt 3.8
M & M 6.5 Reliance Industr 3.7 Larsen & Toubro 3.7 UltraTech Cem. 5.1 Tata Consultancy Services Ltd. 3.4
GAIL (India) 5.0 Axis Bank 3.2 Linde India 3.2 TCS 4.6 Kotak Mahindra Bank Ltd. 2.2
ICICI Bank 4.2 Tech Mahindra 3.2 Bajaj Finance 3.2 Larsen & Toubro 4.4 ITC Ltd 1.9
CESC 2.9 Larsen & Toubro 3.1 Jindal Steel 3.1 St Bk of India 4.2 Larsen & Toubro Limited 1.9
SBI Life Insuran 2.6 Maru� Suzuki 2.3 Reliance Industr 2.3 Axis Bank 3.9 AXIS Bank Ltd. 1.7
Others 36.0 Others 53.5 Others 56.6 Others 43.2 Others 61.2
Banks 17.0 Banks 24.7 Banks 17.8 Banks 25.8 Banks 17.7
Pharmaceu�cals 14.6 So�ware 13.0 Industrial Products 7.9 So�ware 12.8 So�ware 14.6
Power 13.8 Auto 7.0 So�ware 7.4 Cement 8.1 Finance 10.8
Oil 9.5 Pharmaceu�cals 6.5 Industrial Capital Goods 5.9 Petroleum Products 6.4 Petroleum Products 8.7
Auto 9.0 Consumer Non Durables 5.5 Tex�le Products 5.4 Tex�le Products 5.8 Consumer Non Durables 8.4
Top 5
Top10
LargeCap (%)
MidCap (%)
SmallCap (%)
Debt/Other (%)
Wt. Avg Market Cap (in Rs Cr)
ICICI Pru India Opp Fund(G) Invesco India Contra Fund(G) Kotak Equity Opp Fund(G) Kotak Flexicap Fund(G) NIFTY 500 - TRI
Large Cap Large Cap Large Cap Large Cap Large Cap
Sankaran Naren; Roshan Chutkey Taher Badshah; Dhimant Kothari Harsha Upadhyaya Harsha Upadhyaya Index
15-Jan-19 11-Apr-07 09-Sep-04 11-Sep-09 -
4911 8726 9455 37126 -
Value Value Blended towards Growth Blended towards Growth --
42 56 56 47 50
2.9 3.3 4.5 3.9 4.1
Returns* (%)
4.6 -2.1 1.0 -0.8 -0.4
1.0 -1.5 0.9 -1.7 -0.6
35.4 19.7 20.1 15.6 22.3
17.8 15.6 17.5 13.5 16.8
0.0 14.7 14.0 12.6 14.6
19.4 14.4 18.5 14.0 --
26.0 21.5 20.1 20.49 21.3
1.1 1.0 0.9 0.94 1.0
-- 80.6 83.3 75.00 83.3
-- 18.5 20.1 16.86 19.5
-- 72.8 71.4 66.46 77.6
-- -25.2 -21.1 -23.87 -26.6
-- 97.2 94.4 94.44 94.4
-- 11.3 11.0 10.23 10.5
13.2 25.7 25.4 25.1 24.0
-- 20.4 22.2 19.03 21.2
-- -1.3 -2.2 -2.05 -3.1
Top 10 Stocks
Top 5 Sectors
42.7 31.0 27.9 34.6 27.7
1.7 3.4 4.0 3.8 3.4
12.8 13.3 15.6 15.1 14.2
54.8 75.6 77.2
12.6 11.0 35.2 20.1 14.9
64.0 46.5 43.4 56.8 38.8
Risk Measures
1 Year Rolling Return (%)
3 Year Rolling Return** (%)
Valua�ons
Por�olio Composi�on-
Concentra�on
Market Capitalisa�on
160743 319885 270508 423688 424829
13.8 12.7 3.9 1.3 7.3
4.8 5.9 6.2 3.0 0.6
68.8 70.4

APRIL 2022 | ISSUE 112 60
Alpha Strategist | ‘Lollapalooza Effect’
*PE PB for Indices are from Bloomberg - * Returns on 31st March 2022
**Rolling Returns on a monthly basis : 1 Year time period – March 18 - March 22, 3 Year time period - March 16 - March 22
Scheme Name
Category
Fund Manager
Incep�on Date
AUM (In INR Crs)
Investment Style
No of Stock
1M
3M
6M
1 Yr
3 Yr
5 Yr
Since Incep�on
Standard Dev
Beta
Pos�ve
Mean
Max
Min
Pos�ve
Mean
Max
Min
PE
PB
ROE
HDFC Bank 7.4 ICICI Bank 9.8 Reliance Industr 7.9 Reliance Industries Ltd 7.9
Infosys 6.7 Cholaman.Inv.&Fn 5.8 Infosys 6.1 Infosys Ltd 6.1
TCS 6.2 Larsen & Toubro 4.8 HDFC Bank 5.6 HDFC Bank Ltd. 5.6
ICICI Bank 5.6 St Bk of India 4.8 ICICI Bank 4.4 ICICI Bank Ltd. 4.4
H D F C 5.4 Axis Bank 4.8 H D F C 3.8 Housing Development Finance Corp.Lt 3.8
Maru� Suzuki 5.4 UltraTech Cem. 4.2 TCS 3.4 Tata Consultancy Services Ltd. 3.4
St Bk of India 4.3 Jubilant Food. 3.9 Kotak Mah. Bank 2.2 Kotak Mahindra Bank Ltd. 2.2
Gland Pharma 4.3 Dr Lal Pathlabs 3.9 ITC 1.9 ITC Ltd 1.9
Vaibhav Global 4.3 Infosys 3.8 Larsen & Toubro 1.9 Larsen & Toubro Limited 1.9
Reliance Industr 4.2 Medplus Health 3.7 Axis Bank 1.7 AXIS Bank Ltd. 1.7
Others 46.2 Others 50.4 Others 61.2 Others 61.2
Banks 23.3 Banks 22.6 Banks 17.7 Banks 17.7
So�ware 15.1 Finance 9.9 So�ware 14.6 So�ware 14.6
Finance 14.3 Cement 9.1 Finance 10.8 Finance 10.8
Auto 10.9 Health Care Services 7.4 Petroleum Products 8.7 Petroleum Products 8.7
Retailing 4.3 Consumer Non Durables 7.0 Consumer Non Durables 8.4 Consumer Non Durables 8.4
Top 5
Top10
LargeCap (%)
MidCap (%)
SmallCap (%)
Debt/Other (%)
Wt. Avg Market Cap (in Rs Cr)
Mo�lal Oswal Flexi Cap Fund-
Reg(G)
Mo�lal Oswal Large & Midcap
Fund-Reg(G)
Mo�lal Oswal Ni�y 500
Fund-Reg(G)NIFTY 500 - TRI
Large Cap Large Cap Large Cap Large Cap
Siddharth Bothra; Abhiroop Mukherjee Aditya Khemani; Abhiroop Mukherjee Swapnil P Mayekar Index
28-Apr-14 17-Oct-19 06-Sep-19 -
9690 1168 294 -
Earnings Growth Earnings Growth Blended --
31 32 500 50
1.6 0.1 4.0 4.1
-6.5 -7.4 -0.7 -0.4
Returns* (%)
-9.8 -5.4 -1.1 -0.6
2.4 17.6 20.8 22.3
7.5 -- -- 16.8
7.2 -- -- 14.6
15.9 20.2 21.8 --
21.1 -- -- 21.32
Risk Measures
1.0 -- -- 1.00
72.2 -- -- 83.33
11.4 -- -- 19.51
1 Year Rolling Return (%)
61.7 -- -- 77.58
-25.0 -- -- -26.62
77.8 -- -- 94.44
3 Year Rolling Return** (%)
6.5 -- -- 10.55
32.8 31.4 24.0 24.0
14.7 -- -- 21.22
-5.1 -- -- -3.14
Valua�ons
4.6 4.2 3.5 3.4
13.9 13.3 14.4 14.2
53.8 49.6 38.8 38.8
Top 10 Stocks
Top 5 Sectors
31.3 30.1 27.7 27.7
Por�olio Composi�on-
Concentra�on
Market Capitalisa�on
83.4 48.6 77.4 77.2
8.9 32.5 14.8 14.9
419313 194858 425342 424829
4.6 18.6 7.7 7.3
3.1 0.4 0.1 0.6

APRIL 2022 | ISSUE 112 60APRIL 2022 | ISSUE 112 61
*PE PB for Indices are from Bloomberg - * Returns on 31st March 2022
**Rolling Returns on a monthly basis : 1 Year time period – March 18 - March 22, 3 Year time period - March 16 - March 22
Alpha Strategist | ‘Lollapalooza Effect’
Scheme Name
Category
Fund Manager
Incep�on Date
AUM (In INR Crs)
Investment Style
No of Stock
1M
3M
6M
1 Yr
3 Yr
5 Yr
Since Incep�on
Standard Dev
Beta
Pos�ve
Mean
Max
Min
Pos�ve
Mean
Max
Min
PE
PB
ROE
Cholaman.Inv.&Fn 4.8 Cholaman.Inv.&Fn 6.0 Persistent Sys 4.6 Tube Investments 10.9 Adani Total Gas 4.2
ICICI Bank 3.7 Bharat Electron 4.4 Supreme Inds. 4.4 Gujarat Gas 8.6 Tata Power Co 2.9
Trent 3.2 Indian Hotels Co 4.1 Schaeffler India 4.1 Phoenix Mills 8.1 Tata Elxsi 2.2
Bajaj Finance 3.2 Balkrishna Inds 3.9 Thermax 3.9 CG Power & Indu. 6.9 Voltas Ltd. 2.1
Coforge 3.0 Sundram Fasten. 3.7 Cummins India 3.7 V I P Inds. 5.6 Trent Ltd [Lakme Ltd] 2.0
Astral 2.9 Max Healthcare 3.7 Sheela Foam 3.7 Max Financial 5.4 Mphasis 2.0
Tata Elxsi 2.8 Ipca Labs. 2.9 Solar Industries 2.9 Cholaman.Inv.&Fn 4.8 AU Small Fin Bank 2.0
Mphasis 2.8 Aar� Industries 2.9 Coromandel Inter 2.9 AU Small Finance 4.7 Zee Enterta 1.9
Mindtree 2.8 Persistent Sys 2.8 SKF India 2.8 Voltas 4.5 Page Industries 1.8
Avenue Super. 2.7 Hind.Aeronau�cs 2.7 Oberoi Realty 2.7 Bajaj Finance 4.0 Bharat Electronics 1.8
Others 67.8 Others 63.0 Others 64.3 Others 36.5 Others 77.1
So�ware 15.9 Finance 14.4 Industrial Products 15.4 Finance 14.2 Finance 9.4
Finance 9.1 Auto Ancillaries 11.9 Consumer Durables 9.0 Auto Ancillaries 10.9 So�ware 8.5
Industrial Products 8.5 Industrial Products 7.7 Banks 7.5 Construc�on 9.4 Banks 7.5
Retailing 7.6 Chemicals 7.4 Pharmaceu�cals 6.0 Gas 8.6 Gas 7.3
Banks 6.4 Consumer Durables 6.6 Construc�on 5.4 Consumer Durables 8.3 Pharmaceu�cals 7.3
Top 5
Top10
LargeCap (%)
MidCap (%)
SmallCap (%)
Debt/Other (%)
Wt. Avg Market Cap (in Rs Cr)
Axis Midcap Fund-Reg(G) HDFC Mid-Cap Opportuni�es
Fund(G)
Kotak Emerging Equity
Fund(G)
Mo�lal Oswal Midcap 30
Fund-Reg(G)Ni�y Midcap 100 - TRI
Large Cap Large Cap Large Cap Large Cap Large Cap
Shreyash Devalkar; Hitesh Das Chirag Setalvad; Sankalp Baid Pankaj Tibrewal Niket Shah; Abhiroop Mukherjee Index
18-Feb-11 25-Jun-07 30-Mar-07 24-Feb-14 -
17645 31309 18635 2641 -
Earnings Growth Blended towards Value Blended towards Growth Earnings Growth --
62 65 69 23 50
3.5 3.6 3.8 3.8 5.2
Returns* (%)
-3.8 -0.6 -1.7 -1.7 -2.2
-2.0 -0.2 1.0 6.8 -1.8
23.4 23.7 24.4 38.2 26.7
22.7 17.2 22.4 20.9 18.8
19.4 12.8 15.2 13.1 12.6
18.7 16.1 14.0 20.4 --
18.4 23.8 23.7 23.81 26.3
0.6 0.8 0.9 0.82 1.0
86.1 69.4 77.8 66.67 61.1
24.8 21.0 25.9 21.33 23.0
67.8 88.1 94.3 71.65 103.9
-10.6 -30.7 -24.1 -24.20 -35.1
100.0 83.3 88.9 77.78 77.8
15.9 7.9 11.1 7.34 6.9
43.1 19.1 29.4 55.3 22.6
27.5 21.7 26.7 25.33 22.6
5.4 -7.8 -5.6 -7.42 -11.1
Top 10 Stocks
Top 5 Sectors
18.1 22.1 20.8 40.1 13.4
7.1 2.8 4.8 8.1 3.1
16.6 14.4 16.2 14.6 13.6
14.4 6.7 15.1
65.7 66.3 64.6 67.1 81.3
32.2 37.0 35.7 63.5 22.9
Risk Measures
1 Year Rolling Return (%)
3 Year Rolling Return** (%)
Valua�ons
Por�olio Composi�on-
Concentra�on
Market Capitalisa�on
84964 27025 44230 50157 44268
2.1 25.5 15.8 17.5 2.5
11.9 3.8 5.2 8.7 --
20.3 4.4
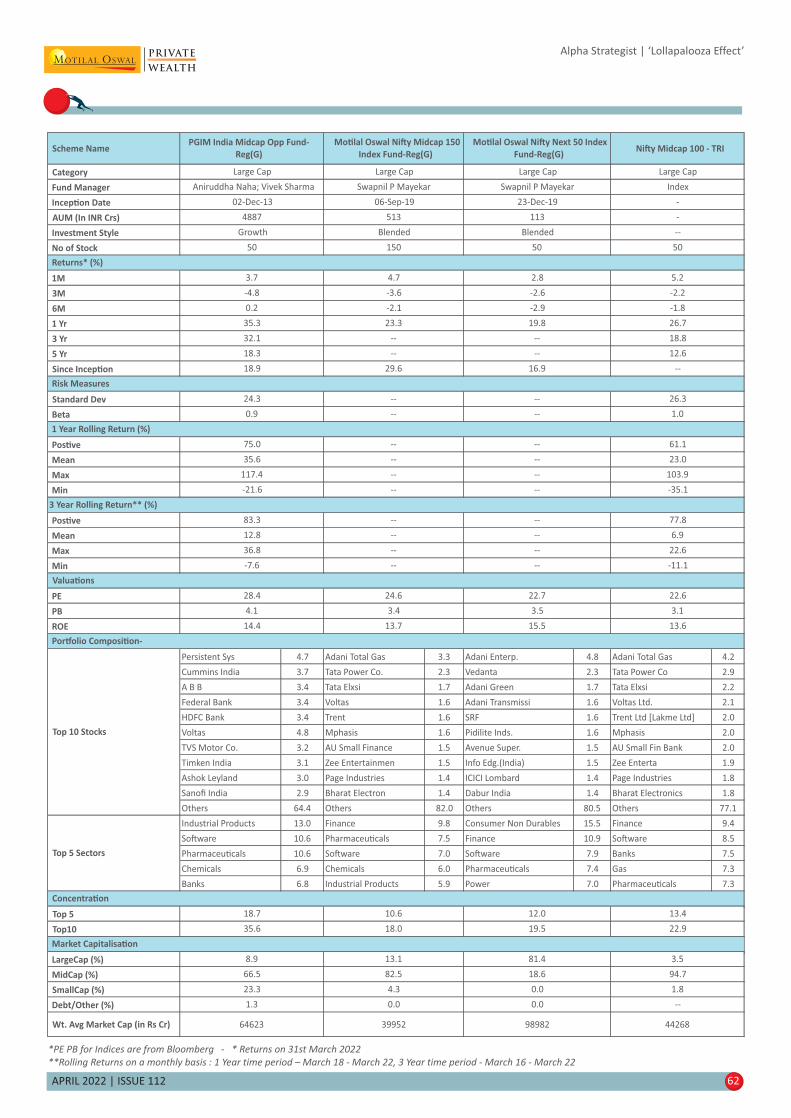
62APRIL 2022 | ISSUE 112
*PE PB for Indices are from Bloomberg - * Returns on 31st March 2022
**Rolling Returns on a monthly basis : 1 Year time period – March 18 - March 22, 3 Year time period - March 16 - March 22
Alpha Strategist | ‘Lollapalooza Effect’
Scheme Name
Category
Fund Manager
Incep�on Date
AUM (In INR Crs)
Investment Style
No of Stock
1M
3M
6M
1 Yr
3 Yr
5 Yr
Since Incep�on
Standard Dev
Beta
Pos�ve
Mean
Max
Min
Pos�ve
Mean
Max
Min
PE
PB
ROE
Persistent Sys 4.7 Adani Total Gas 3.3 Adani Enterp. 4.8 Adani Total Gas 4.2
Cummins India 3.7 Tata Power Co. 2.3 Vedanta 2.3 Tata Power Co 2.9
A B B 3.4 Tata Elxsi 1.7 Adani Green 1.7 Tata Elxsi 2.2
Federal Bank 3.4 Voltas 1.6 Adani Transmissi 1.6 Voltas Ltd. 2.1
HDFC Bank 3.4 Trent 1.6 SRF 1.6 Trent Ltd [Lakme Ltd] 2.0
Voltas 4.8 Mphasis 1.6 Pidilite Inds. 1.6 Mphasis 2.0
TVS Motor Co. 3.2 AU Small Finance 1.5 Avenue Super. 1.5 AU Small Fin Bank 2.0
Timken India 3.1 Zee Entertainmen 1.5 Info Edg.(India) 1.5 Zee Enterta 1.9
Ashok Leyland 3.0 Page Industries 1.4 ICICI Lombard 1.4 Page Industries 1.8
Sanofi India 2.9 Bharat Electron 1.4 Dabur India 1.4 Bharat Electronics 1.8
Others 64.4 Others 82.0 Others 80.5 Others 77.1
Industrial Products 13.0 Finance 9.8 Consumer Non Durables 15.5 Finance 9.4
So�ware 10.6 Pharmaceu�cals 7.5 Finance 10.9 So�ware 8.5
Pharmaceu�cals 10.6 So�ware 7.0 So�ware 7.9 Banks 7.5
Chemicals 6.9 Chemicals 6.0 Pharmaceu�cals 7.4 Gas 7.3
Banks 6.8 Industrial Products 5.9 Power 7.0 Pharmaceu�cals 7.3
Top 5
Top10
LargeCap (%)
MidCap (%)
SmallCap (%)
Debt/Other (%)
Wt. Avg Market Cap (in Rs Cr)
PGIM India Midcap Opp Fund-
Reg(G)
Mo�lal Oswal Ni�y Midcap 150
Index Fund-Reg(G)
Mo�lal Oswal Ni�y Next 50 Index
Fund-Reg(G)Ni�y Midcap 100 - TRI
Large Cap Large Cap Large Cap Large Cap
4887 513 113 -
Growth Blended Blended --
Aniruddha Naha; Vivek Sharma Swapnil P Mayekar Swapnil P Mayekar Index
02-Dec-13 06-Sep-19 23-Dec-19 -
50 150 50 50
3.7 4.7 2.8 5.2
Returns* (%)
35.3 23.3 19.8 26.7
32.1 -- -- 18.8
-4.8 -3.6 -2.6 -2.2
0.2 -2.1 -2.9 -1.8
24.3 -- -- 26.3
0.9 -- -- 1.0
18.3 -- -- 12.6
18.9 29.6 16.9 --
Risk Measures
117.4 -- -- 103.9
-21.6 -- -- -35.1
75.0 -- -- 61.1
35.6 -- -- 23.0
36.8 -- -- 22.6
-7.6 -- -- -11.1
83.3 -- -- 77.8
12.8 -- -- 6.9
4.1 3.4 3.5 3.1
14.4 13.7 15.5 13.6
28.4 24.6 22.7 22.6
18.6 94.7
35.6 18.0 19.5 22.9
Top 10 Stocks
Top 5 Sectors
18.7 10.6 12.0 13.4
1 Year Rolling Return (%)
3 Year Rolling Return** (%)
Valua�ons
Por�olio Composi�on-
Concentra�on
Market Capitalisa�on
64623 39952 98982 44268
23.3 4.3 0.0 1.8
1.3 0.0 0.0 --
8.9 13.1 81.4 3.5
66.5 82.5
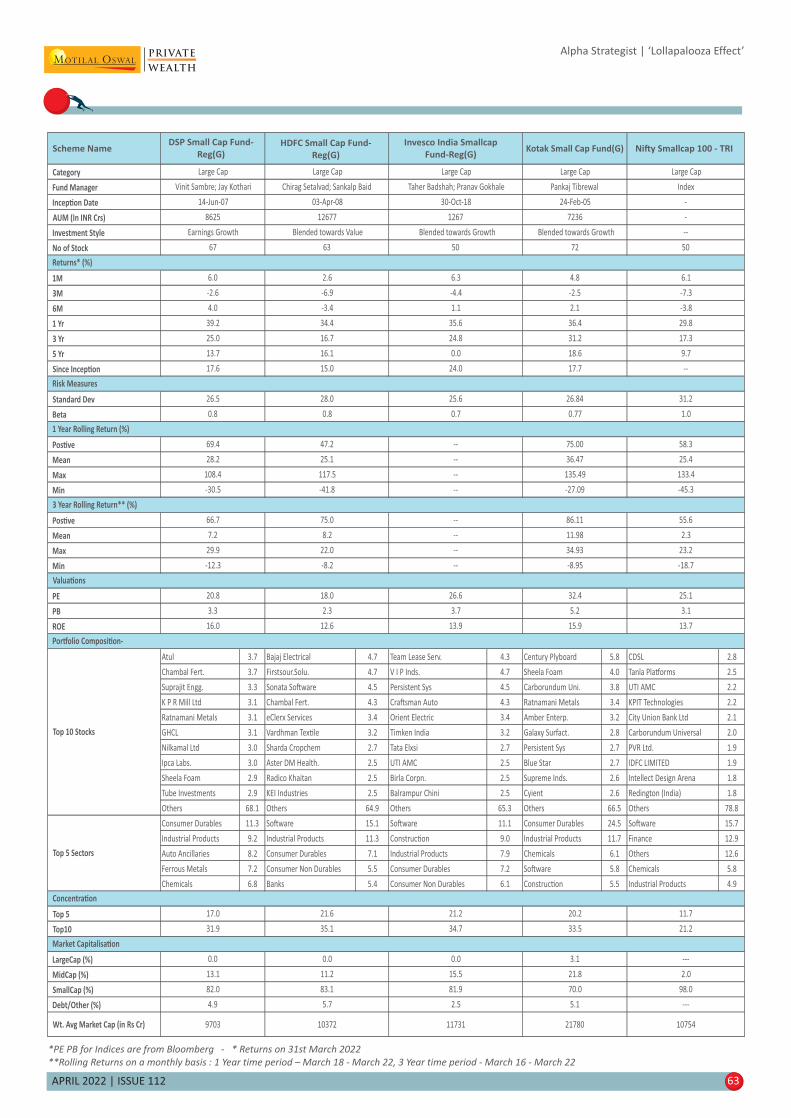
APRIL 2022 | ISSUE 112 63
*PE PB for Indices are from Bloomberg - * Returns on 31st March 2022
**Rolling Returns on a monthly basis : 1 Year time period – March 18 - March 22, 3 Year time period - March 16 - March 22
Alpha Strategist | ‘Lollapalooza Effect’
Scheme Name
Category
Fund Manager
Incep�on Date
AUM (In INR Crs)
Investment Style
No of Stock
1M
3M
6M
1 Yr
3 Yr
5 Yr
Since Incep�on
Standard Dev
Beta
Pos�ve
Mean
Max
Min
Pos�ve
Mean
Max
Min
PE
PB
ROE
Atul 3.7 Bajaj Electrical 4.7 Team Lease Serv. 4.3 Century Plyboard 5.8 CDSL 2.8
Chambal Fert. 3.7 Firstsour.Solu. 4.7 V I P Inds. 4.7 Sheela Foam 4.0 Tanla Pla�orms 2.5
Suprajit Engg. 3.3 Sonata So�ware 4.5 Persistent Sys 4.5 Carborundum Uni. 3.8 UTI AMC 2.2
K P R Mill Ltd 3.1 Chambal Fert. 4.3 Cra�sman Auto 4.3 Ratnamani Metals 3.4 KPIT Technologies 2.2
Ratnamani Metals 3.1 eClerx Services 3.4 Orient Electric 3.4 Amber Enterp. 3.2 City Union Bank Ltd 2.1
GHCL 3.1 Vardhman Tex�le 3.2 Timken India 3.2 Galaxy Surfact. 2.8 Carborundum Universal 2.0
Nilkamal Ltd 3.0 Sharda Cropchem 2.7 Tata Elxsi 2.7 Persistent Sys 2.7 PVR Ltd. 1.9
Ipca Labs. 3.0 Aster DM Health. 2.5 UTI AMC 2.5 Blue Star 2.7 IDFC LIMITED 1.9
Sheela Foam 2.9 Radico Khaitan 2.5 Birla Corpn. 2.5 Supreme Inds. 2.6 Intellect Design Arena 1.8
Tube Investments 2.9 KEI Industries 2.5 Balrampur Chini 2.5 Cyient 2.6 Redington (India) 1.8
Others 68.1 Others 64.9 Others 65.3 Others 66.5 Others 78.8
Consumer Durables 11.3 So�ware 15.1 So�ware 11.1 Consumer Durables 24.5 So�ware 15.7
Industrial Products 9.2 Industrial Products 11.3 Construc�on 9.0 Industrial Products 11.7 Finance 12.9
Auto Ancillaries 8.2 Consumer Durables 7.1 Industrial Products 7.9 Chemicals 6.1 Others 12.6
Ferrous Metals 7.2 Consumer Non Durables 5.5 Consumer Durables 7.2 So�ware 5.8 Chemicals 5.8
Chemicals 6.8 Banks 5.4 Consumer Non Durables 6.1 Construc�on 5.5 Industrial Products 4.9
Top 5
Top10
LargeCap (%)
MidCap (%)
SmallCap (%)
Debt/Other (%)
Wt. Avg Market Cap (in Rs Cr)
DSP Small Cap Fund-
Reg(G)HDFC Small Cap Fund-
Reg(G)
Invesco India Smallcap
Fund-Reg(G)Ni�y Smallcap 100 - TRI
Large Cap Large Cap Large Cap Large Cap
Kotak Small Cap Fund(G)
Large Cap
Vinit Sambre; Jay Kothari Chirag Setalvad; Sankalp Baid Taher Badshah; Pranav Gokhale Index
14-Jun-07 03-Apr-08 30-Oct-18 -
Pankaj Tibrewal
24-Feb-05
8625 12677 1267 -
Earnings Growth Blended towards Value Blended towards Growth --
7236
Blended towards Growth
67 63 50 50
6.0 2.6 6.3 6.1
72
4.8
Returns* (%)
-2.6 -6.9 -4.4 -7.3
4.0 -3.4 1.1 -3.8
-2.5
2.1
39.2 34.4 35.6 29.8
25.0 16.7 24.8 17.3
36.4
31.2
13.7 16.1 0.0 9.7
17.6 15.0 24.0 --
18.6
17.7
26.5 28.0 25.6 31.2
0.8 0.8 0.7 1.0
26.84
0.77
69.4 47.2 -- 58.3
28.2 25.1 -- 25.4
75.00
36.47
108.4 117.5 -- 133.4
-30.5 -41.8 -- -45.3
135.49
-27.09
66.7 75.0 -- 55.6
7.2 8.2 -- 2.3
86.11
11.98
29.9 22.0 -- 23.2
-12.3 -8.2 -- -18.7
34.93
-8.95
13.7
Top 10 Stocks
20.8 18.0 26.6 25.1
3.3 2.3 3.7 3.1
32.4
5.2
15.916.0 12.6 13.9
4.9 5.7 2.5
21.2
0.0 0.0 0.0 ---
Top 5 Sectors
17.0 21.6 21.2 11.720.2
33.5
3.1
31.9 35.1 34.7
Risk Measures
1 Year Rolling Return (%)
3 Year Rolling Return** (%)
Valua�ons
Por�olio Composi�on-
Concentra�on
Market Capitalisa�on
---
9703 10372 11731 10754
5.1
21780
13.1 11.2 15.5 2.0
82.0 83.1 81.9 98.070.0
21.8
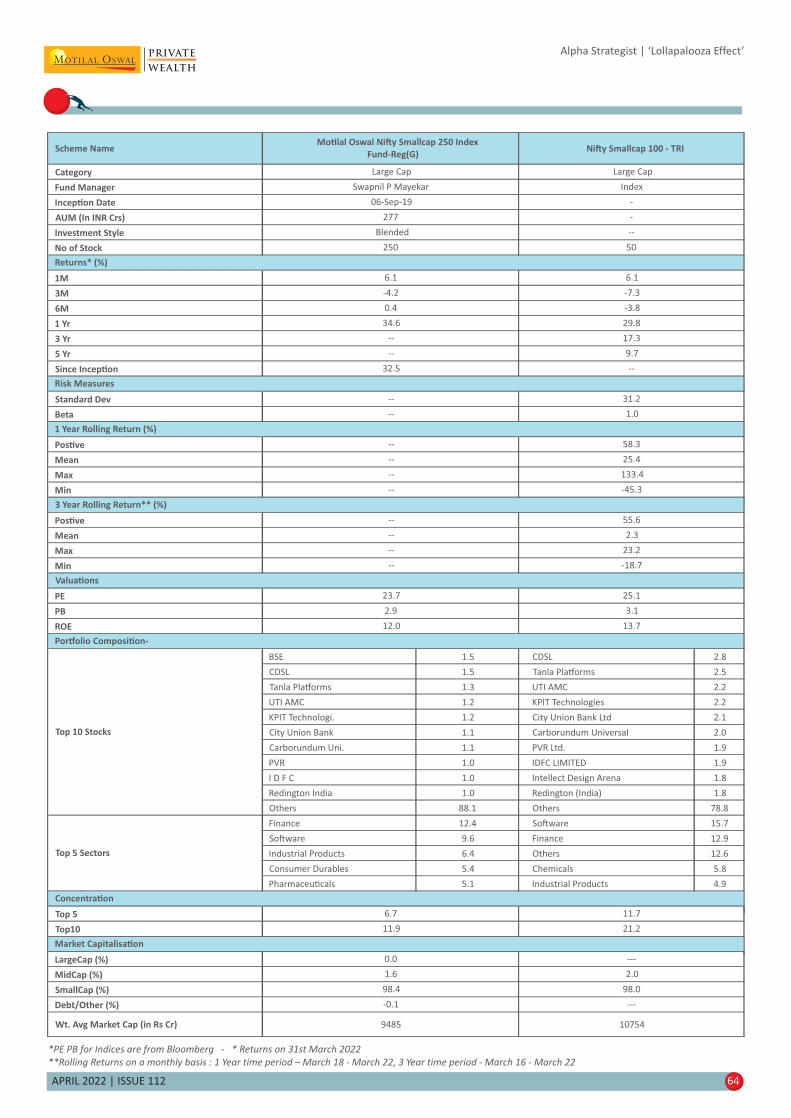
Alpha Strategist | ‘Lollapalooza Effect’
64APRIL 2022 | ISSUE 112
*PE PB for Indices are from Bloomberg - * Returns on 31st March 2022
**Rolling Returns on a monthly basis : 1 Year time period – March 18 - March 22, 3 Year time period - March 16 - March 22
Scheme Name
Category
Fund Manager
Incep�on Date
AUM (In INR Crs)
Investment Style
No of Stock
1M
3M
6M
1 Yr
3 Yr
5 Yr
Since Incep�on
Standard Dev
Beta
Pos�ve
Mean
Max
Min
Pos�ve
Mean
Max
Min
PE
PB
ROE
BSE 1.5 CDSL 2.8
CDSL 1.5 Tanla Pla�orms 2.5
Tanla Pla�orms 1.3 UTI AMC 2.2
UTI AMC 1.2 KPIT Technologies 2.2
KPIT Technologi. 1.2 City Union Bank Ltd 2.1
City Union Bank 1.1 Carborundum Universal 2.0
Carborundum Uni. 1.1 PVR Ltd. 1.9
PVR 1.0 IDFC LIMITED 1.9
I D F C 1.0 Intellect Design Arena 1.8
Redington India 1.0 Redington (India) 1.8
Others 88.1 Others 78.8
Finance 12.4 So�ware 15.7
So�ware 9.6 Finance 12.9
Industrial Products 6.4 Others 12.6
Consumer Durables 5.4 Chemicals 5.8
Pharmaceu�cals 5.1 Industrial Products 4.9
Top 5
Top10
LargeCap (%)
MidCap (%)
SmallCap (%)
Debt/Other (%)
Wt. Avg Market Cap (in Rs Cr)
Swapnil P Mayekar Index
06-Sep-19 -
Mo�lal Oswal Ni�y Smallcap 250 Index
Fund-Reg(G)Ni�y Smallcap 100 - TRI
Large Cap Large Cap
250 50
6.1 6.1
277 -
Blended --
Returns* (%)
34.6 29.8
-- 17.3
-4.2 -7.3
0.4 -3.8
-- 9.7
32.5 --
Risk Measures
-- 58.3
-- 25.4
-- 31.2
-- 1.0
1 Year Rolling Return (%)
-- 133.4
-- -45.3
3 Year Rolling Return** (%)
6.7 11.7
2.9 3.1
12.0 13.7
0.0 ---
1.6 2.0
11.9 21.2
Market Capitalisa�on
9485 10754
98.4 98.0
-0.1 ---
Valua�ons
Por�olio Composi�on-
Concentra�on
Top 10 Stocks
Top 5 Sectors
23.7 25.1
-- 23.2
-- -18.7
-- 55.6
-- 2.3
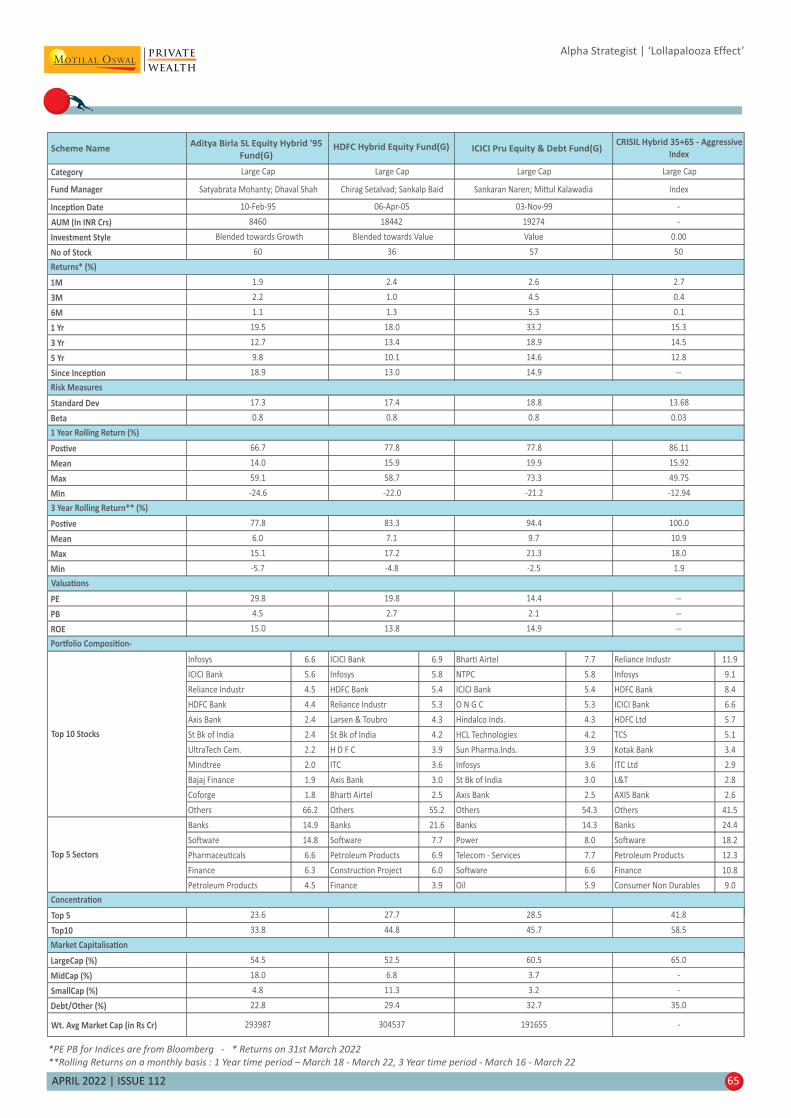
Alpha Strategist | ‘Lollapalooza Effect’
65APRIL 2022 | ISSUE 112
*PE PB for Indices are from Bloomberg - * Returns on 31st March 2022
**Rolling Returns on a monthly basis : 1 Year time period – March 18 - March 22, 3 Year time period - March 16 - March 22
Scheme Name
Category
Fund Manager
Incep�on Date
AUM (In INR Crs)
Investment Style
No of Stock
1M
3M
6M
1 Yr
3 Yr
5 Yr
Since Incep�on
Standard Dev
Beta
Pos�ve
Mean
Max
Min
Pos�ve
Mean
Max
Min
PE
PB
ROE
Infosys 6.6 ICICI Bank 6.9 Bhar� Airtel 7.7 Reliance Industr 11.9
ICICI Bank 5.6 Infosys 5.8 NTPC 5.8 Infosys 9.1
Reliance Industr 4.5 HDFC Bank 5.4 ICICI Bank 5.4 HDFC Bank 8.4
HDFC Bank 4.4 Reliance Industr 5.3 O N G C 5.3 ICICI Bank 6.6
Axis Bank 2.4 Larsen & Toubro 4.3 Hindalco Inds. 4.3 HDFC Ltd 5.7
St Bk of India 2.4 St Bk of India 4.2 HCL Technologies 4.2 TCS 5.1
UltraTech Cem. 2.2 H D F C 3.9 Sun Pharma.Inds. 3.9 Kotak Bank 3.4
Mindtree 2.0 ITC 3.6 Infosys 3.6 ITC Ltd 2.9
Bajaj Finance 1.9 Axis Bank 3.0 St Bk of India 3.0 L&T 2.8
Coforge 1.8 Bhar� Airtel 2.5 Axis Bank 2.5 AXIS Bank 2.6
Others 66.2 Others 55.2 Others 54.3 Others 41.5
Banks 14.9 Banks 21.6 Banks 14.3 Banks 24.4
So�ware 14.8 So�ware 7.7 Power 8.0 So�ware 18.2
Pharmaceu�cals 6.6 Petroleum Products 6.9 Telecom - Services 7.7 Petroleum Products 12.3
Finance 6.3 Construc�on Project 6.0 So�ware 6.6 Finance 10.8
Petroleum Products 4.5 Finance 3.9 Oil 5.9 Consumer Non Durables 9.0
Top 5
Top10
LargeCap (%)
MidCap (%)
SmallCap (%)
Debt/Other (%)
Wt. Avg Market Cap (in Rs Cr) 293987 304537 191655 -
4.8 11.3 3.2 -
22.8 29.4 32.7 35.0
54.5 52.5 60.5 65.0
18.0 6.8 3.7 -
33.8 44.8 45.7 58.5
Top 10 Stocks
Top 5 Sectors
23.6 27.7 28.5 41.8
4.5 2.7 2.1 --
15.0 13.8 14.9 --
29.8 19.8 14.4 --
15.1 17.2 21.3 18.0
-5.7 -4.8 -2.5 1.9
77.8 83.3 94.4 100.0
6.0 7.1 9.7 10.9
59.1 58.7 73.3 49.75
-24.6 -22.0 -21.2 -12.94
66.7 77.8 77.8 86.11
14.0 15.9 19.9 15.92
17.3 17.4 18.8 13.68
0.8 0.8 0.8 0.03
9.8 10.1 14.6 12.8
18.9 13.0 14.9 --
19.5 18.0 33.2 15.3
12.7 13.4 18.9 14.5
1.1 1.3 5.3 0.1
60 36 57 50
1.9 2.4 2.6 2.7
Returns* (%)
Chirag Setalvad; Sankalp Baid Sankaran Naren; Mi� ul Kalawadia Index
10-Feb-95 06-Apr-05 03-Nov-99 -
2.2 1.0 4.5 0.4
Risk Measures
1 Year Rolling Return (%)
3 Year Rolling Return** (%)
Valua�ons
Por�olio Composi�on-
Concentra�on
Market Capitalisa�on
Aditya Birla SL Equity Hybrid '95
Fund(G)HDFC Hybrid Equity Fund(G) ICICI Pru Equity & Debt Fund(G)
CRISIL Hybrid 35+65 - Aggressive
Index
Large Cap Large Cap Large Cap Large Cap
8460 18442 19274 -
Blended towards Growth Blended towards Value Value 0.00
Satyabrata Mohanty; Dhaval Shah

APRIL 2022 | ISSUE 112 66
Notes
Alpha Strategist | ‘Lollapalooza Effect’

APRIL 2022 | ISSUE 112 67
Notes
Alpha Strategist | ‘Lollapalooza Effect’
APRIL 2022 | ISSUE 112 68
Notes
Alpha Strategist | ‘Lollapalooza Effect’
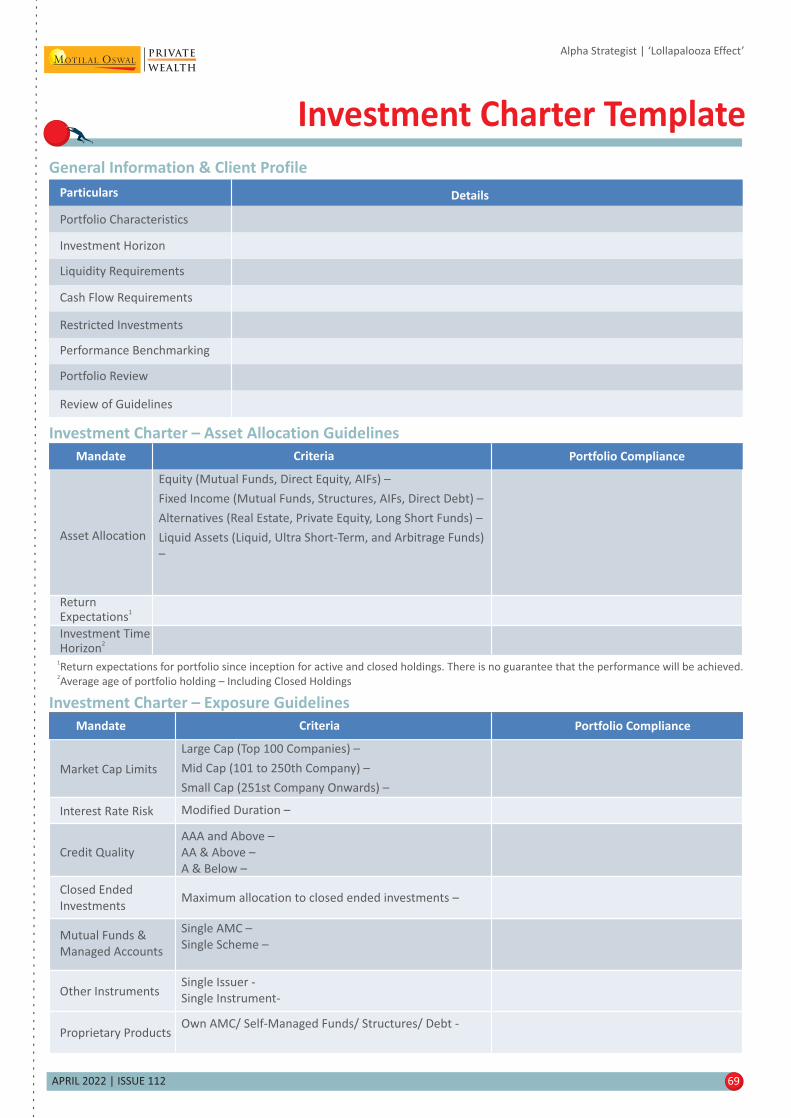
APRIL 2022 | ISSUE 112 69
Alpha Strategist | ‘Lollapalooza Effect’
Investment Charter Template
General Information & Client Profile
Investment Horizon
Particulars Details
Liquidity Requirements
Cash Flow Requirements
Restricted Investments
Performance Benchmarking
Portfolio Review
Review of Guidelines
Portfolio Characteristics
1Return expectations for portfolio since inception for active and closed holdings. There is no guarantee that the performance will be achieved.
2Average age of portfolio holding – Including Closed Holdings
Investment Charter – Exposure Guidelines
Market Cap Limits
Interest Rate Risk
Mandate Criteria Portfolio Compliance
Investment Charter – Asset Allocation Guidelines
Asset Allocation
Equity (Mutual Funds, Direct Equity, AIFs) –
Fixed Income ( –Mutual Funds, Structures, AIFs, Direct Debt)
Alternatives (Real Estate, Private Equity, Long Short Funds) –
Liquid Assets (Liquid, Ultra Short-Term, and Arbitrage Funds)
–
ReturnExpectations
1
Investment TimeHorizon
2
Mandate Criteria Portfolio Compliance
Credit Quality
Mutual Funds &
Managed Accounts
Closed Ended
Investments
Other Instruments
Proprietary Products
Large Cap (Top 100 Companies) –
Mid Cap (101 to 250th Company) –
Small Cap (251st Company Onwards) –
Modified Duration –
AAA and Above –
AA & Above –
A & Below –
Single AMC –
Single Scheme –
Maximum allocation to closed ended investments –
Single Issuer -
Single Instrument-
Own AMC/ Self-Managed Funds/ Structures/ Debt -

Inte
ntion
ally l
eft b
lank
APRIL 2022 | ISSUE 112 70
Motilal Oswal Wealth Limited
CIN: U67110MH2002PLC135075
Registered Office Address: Motilal Oswal Tower, Rahimtullah Sayani Road,
Opposite Parel ST Depot, Prabhadevi, Mumbai 400 025
Tel No.: 022 7193 4200/63; Website: www.motilaloswalpwm.com
Registration details: SEBI PMS Regn No: INP000004409; AMFI Regn No: ARN87554
Please read disclosure document as issued by company from time to time.
Ashish Shanker
MD & CEO
91 22+ 7198 5549
Nitin Shanbhag
Head - Investment Products
+91 22 7199 2328
“© 2013 CRISIL Limited. All Rights Reserved.
“CRISIL Indices are the sole property of CRISIL Limited (CRISIL). CRISIL Indices shall not be copied, retransmitted or redistributed in any manner for any commercial
use. CRISIL has taken due care and caution in computation of the Indices, based on the data obtained from sources, which it considers reliable. However, CRISIL does
not guarantee the accuracy, adequacy or completeness of the Indices and is not responsible for any errors or for the results obtained from the use of the Indices.
CRISIL especially states that it has no financial liability whatsoever to the Licensee / users of CRISIL Indices.”
Motilal Oswal Wealth Limited, a company incorporated under the Companies act 1956, is registered with SEBI as Portfolio Manager. Motilal Oswal Wealth Limited is also registered as adistributor of mutual funds. Registration details: SEBI PMS Regn No: INP000004409; AMFI Regn No: ARN87554
The information, data, or analysis does not constitute investment advice or as an offer or solicitation of an offer to purchase or subscribe for any investment or a recommendation and is meantfor your personal information only and suggests a proposition which does not guarantee any returns. Motilal Oswal Wealth Ltd (hereinafter referred as MOWL) or any of its affiliates is notsoliciting any action based upon it. This information, including the data or analysis provided herein is neither intended to aid in decision making for legal, financial, or other consultingquestions nor should it be the basis of any investment or other decisions. The historical performance presented in this document is not indicative of and should not be construed as beingindicative of or otherwise used as a proxy for future or specific investments. The relevant product offering documents should be read for further details.MOWL does not take responsibility forauthentication of any data or information which has been furnished by you,the entity offering the product, or any other third party which furnishes the data or information. The abovementioned assets are not necessarily maintained or kept in custody of MOWL.
The information contained in this statement are updated as and when received as a result of which there may be differences between the details contained herein and those reflected in therecords of the respective entities or that of yours. In the event where information sent through any electronic Media (including but not limited to Net Banking or email) or print do not tally, forwhatever reason, with the records available with the entity offering the product or the third party maintaining such information in each of the foregoing cases, the information with the entityoffering the product or third party maintaining such information shall be considered as final. The benchmarking shown in the document above is a result of the choice of benchmark MOWLuses for the various products. It is possible that some investments offered by the third parties have other benchmarks and their actual relative under- or out-performance is different from thatprovided in the statement. The recipient should seek appropriate professional advice, including tax advice, before dealing with any realized or unrealized gain/loss reflecting in this statement.The above data, information, or analysis is shared at the request of the recipient and is meant for information purposes only and is not an official confirmation of any transactions mentionedin the document above. Service-related complaints may be acceptable for the rectification of inaccurate data. You should notify us immediately and in any case within 15 days of receipt of thisdocument date if you notice any error or discrepancy in the information furnished above, failing which it would be deemed to have been accepted by you. MOWL reserves the right to rectifydiscrepancies in this document at any point of time. The sharing of information in relation to one's assets may not be secure, and you are required to completely understand the risk associatedwith sharing such information. The information being shared with MOWL can pose risk of information being stolen and or used by unauthorized persons who do not have the rights to accesssuch information. MOWL or any of its group companies, its employees, and agents cannot be held liable for unauthorized use of such information. Our sales professionals or other employeesmay provide oral or written views to you that reflect their personal opinions, which may be contrary to the opinions expressed herein. You should carefully consider whether any informationshared herein and investment products mentioned herein are appropriate in view of your investment experience, objectives, financial resources, relevant circumstances & risk appetite. Allrecipients of this information should conduct their own investigation and analysis and should check the accuracy, reliability, and completeness of the information. This information isdistributed upon the express understanding that no part of the information herein contained has been independently verified. Further, no representation or warranty expressed or implied ismade, nor is any responsibility of any kind accepted with respect to the completeness or accuracy of any information as may be contained herein. Also, no representation or warrantyexpressed or implied is made that such information remains unchanged in any respect as of any date or dates after those stated herein with respect to any matter concerning any statementmade herein above.
In no event will MOWL and their officers, directors, personnel, employees, or its affiliates and group company be liable for any damages, losses, or liabilities including without limitation, director indirect, special, incidental, consequential damages, losses or liabilities, in connection with your use of the information mentioned in this document or your reliance on or use or inability touse the information contained in this document, even if you advise us of the possibility of such damages, losses or expenses. The contents of this document do not have any contractual value.The information contained in this document is confidential in nature, and you are receiving all such information on the express condition of confidentiality. If you are not the intendedrecipient, you must not disclose or use the information in this document in any way whatsoever. If you received it in error, please inform us immediately by return email and delete thedocument with no intention of its being retrieved by you. We do not guarantee the integrity of any emails or attached files and are not responsible for any changes made to them. This reportand information therein is not directed or intended for distribution to, or use by, any person or entity who is a citizen or resident of or located in any locality, state, country, or other jurisdiction,where such distribution, publication, availability or use would be contrary to law, regulation or which would subject MOWL and affiliates to any registration or licensing requirement withinsuch jurisdiction. The information contained herein is strictly confidential and meant solely for the selected recipient and may not be altered in any way, transmitted to, copied or distributed,in part or in whole, to any other person or to the media or reproduced in any form, without the prior written consent of MOWL. MOWL, in the course of conduct of its business activity, mayhave a financial, business, or other interest in other entities, including the subject mentioned herein, however, MOWL encourages independence in preparing this information and strives tominimize conflict in preparation of the above information. MOWL does not have a material conflict of interest at the time of publication of this information. While every effort has been madeto ensure that the information provided herein is accurate, timely, secure and error-free, MOWL, their directors, promoters, employees, agents and assigns shall not in any way be responsiblefor any loss or damages arising in any contract, tort or otherwise from the use or inability to use this information and its contents. Any material downloaded or otherwise obtained through theuse of the website or email is at your own discretion and risk, and you will be solely responsible for any damage that may occur to your computer systems and data as a result of download ofsuch material. Any information sent from MOWL to an email account or other electronic receiving communication systems/ servers, is at your risk and if the same is lost, incorrectly received,or sent to the incorrect email or are accessible to third parties, MOWL is not and cannot be responsible or made liable for such transmission.
For any queries and grievances, please write to [email protected]
Safe Harbor
Alpha Strategist | ‘Lollapalooza Effect’

Motilal Oswal Tower, 6th Floor, Junction of Gokhale & Sayani Road, Prabhadevi, Mumbai - 400 025.
Ahmedabad | Bangalore | Chennai | Hyderabad | | Kolkata | Mumbai | New Delhi | PuneJaipur
Email: [email protected]
@MotilalOswalPW | Motilal Oswal Private Wealth
www.motilaloswalpwm.com
Related Documents