SANDAG | Impacts of Border Delays at California-Baja California Land Ports of Entry Volume 1: Background and Summary of Findings hdrinc.com Final Report Impacts of Border Delays at California-Baja California Land Ports of Entry Volume 1: Background and Summary of Findings San Diego, CA February 9, 2021 In Coordination with T. Kear Transportation Planning and Management, Inc.

Welcome message from author
This document is posted to help you gain knowledge. Please leave a comment to let me know what you think about it! Share it to your friends and learn new things together.
Transcript
SANDAG | Impacts of Border Delays at California-Baja California Land Ports of Entry Volume 1: Background and Summary of Findings
hdrinc.com
Final Report Impacts of Border Delays at California-Baja California Land Ports of Entry
Volume 1: Background and Summary of Findings
San Diego, CA February 9, 2021
In Coordination with T. Kear Transportation Planning and Management, Inc.

SANDAG | Impacts of Border Delays at California-Baja California Land Ports of Entry Volume 1: Background and Summary of Findings
i
Contents Volume 1.....................................................................................................................................1
Executive Summary .................................................................................................................1
Introduction............................................................................................................................12
Motivation for the Study .....................................................................................................12
Organization of the Final Report ........................................................................................13
Overview of the Study Area ...............................................................................................15
What Has Changed Since the Last Studies? ......................................................................20
Data Needs and Data Collection Efforts ................................................................................23
Assessment of Existing “Gaps” on Border Data .................................................................23
Data Collection Methods ....................................................................................................26
Overview of Data Collection Efforts ....................................................................................30
Measuring Border Wait Time and Delay .............................................................................32
Development of Future Conceptual Scenarios .......................................................................43
Overview of Conceptual Scenarios ....................................................................................43
Overview of Forecasting Methods for Volumes and Delays in the Conceptual Scenarios ..48
Summary of Future Border Crossing Volumes for Conceptual Scenarios...........................53
Summary of Future Border Crossing Delays for Conceptual Scenarios .............................55
Summary of Findings and Recommendations .......................................................................58
Economic Impacts of Delays ..............................................................................................58
Air Quality/Emissions Impacts of Delays ............................................................................65
Recommendations: Improvements to Consider ..................................................................68

SANDAG | Impacts of Border Delays at California-Baja California Land Ports of Entry Volume 1: Background and Summary of Findings
SANDAG | Impacts of Border Delays at California-Baja California Land Ports of Entry Volume 1: Background and Summary of Findings
1
Volume 1 Executive Summary The San Diego Association of Governments (SANDAG), the Imperial County Transportation Commission (ICTC) and the California Department of Transportation (Caltrans) collectively put forward the study on Impacts of Border Delays at California-Baja California Land Ports of Entry. This study presents a technically sound assessment of the economic impact of delays experienced at the California land ports of entry on the regional economy. In this way, it is similar to prior efforts, but also considers impacts on emerging industry clusters, subregions, and value added. Further, the study examines how emissions affect regional air quality and quantifies emissions (including greenhouse gases) at the border as a result of crossborder delays. Collectively, the study provides the partner agencies and other stakeholders with information on the importance of reducing border-crossing delays. The methods, research, analysis, and findings of the final report are summarized and contained in three distinct volumes (Volumes 1, 2, and 3).
The study gathered much of the data needed for the analyses through survey efforts, including:
• More than 11,000 surveys on border-crossing behavior and characteristics (divided into an economic component and an air quality/emissions component),
• More than 12,000 direct measurements of border-crossing times for passenger and commercial vehicles throughout the six land ports of entry located along the California-Baja California border region
• 20 interviews with businesses located in the California-Baja California border region with significant links to the other side of the border to assess, qualitatively, the impacts that delays at the land ports of entry have on their operations and revenues.
This data, along with travel demand modeling data, was then processed to identify base year (2016) border-crossing conditions and was used in the development of future estimates of border-crossing volumes, delays, spending and emissions for a series of future conceptual scenarios.1 These conceptual scenarios are meant to represent potential future conditions for the border region in terms of border-crossing capacity and operational processes. The conceptual scenarios for future years can be summarized based on the following characteristics:
• Baseline Scenario includes certain planned improvements to border-crossing capacity completed by the year 2025, such as Phase 3 improvements at San Ysidro,2 modernization of the cargo and pedestrian facilities at Otay Mesa, and Phase 1
1 A matrix of the conceptual scenarios considered in the analysis is presented in Table 22, in the Development of Future Conceptual Scenarios section. 2 Phase 3 improvements at San Ysidro include the addition of 10 southbound POV lanes with additional southbound primary inspection booths and 8 northbound POV lanes with 15 additional northbound inspection booths. This work was completed in 2019. Source: General Services Administration
SANDAG | Impacts of Border Delays at California-Baja California Land Ports of Entry Volume 1: Background and Summary of Findings
2
improvements at Calexico West.3 This scenario is estimated for all currently-existing land ports of entry (POEs).
• Baseline Scenario plus Capacity Enhancements and Transit and Active Transportation considers significant border crossing capacity improvements in year 2025 such as the additional POE at Otay Mesa East (OME), improvements at existing POEs like Calexico East with the expansion of the All-American Canal Bridge, plus future transit and bicycle/pedestrian access improvements in the vicinity of the POEs in years 2025 and 2035. It is assumed that Otay Mesa East POE capacity is planned to be phased; at opening day it will be in a 5x5 configuration and expanded to a 10x10 configuration at a later date.4 Thus, the results from the SR 11 Binational Travel Demand Model (BTDM) with a 5x5 configuration at Otay Mesa East represent the first Baseline Scenario plus Capacity Enhancement for years 2025 and 2035, and the results from the SR 11 BTDM with a 10x10 configuration at Otay Mesa East for 2035 represent the second Baseline Scenario plus Capacity Enhancement.
3 Phase 1 improvements at Calexico West include the addition of 5 southbound POV lanes and a southbound bridge over the New River as well as 10 northbound POV lanes. This work was completed in 2018. Source: General Services Administration 4 The 5x5 configuration for OME entails 5 personal vehicle (POV) and 5 Commercial lanes in both directions – so 10 total northbound lanes and 10 southbound, resulting in 20 total. The 10x10 entails 10 POV and 10 Commercial lanes in directions, resulting in 40 lanes total (20 northbound and 20 southbound).
SANDAG | Impacts of Border Delays at California-Baja California Land Ports of Entry Volume 1: Background and Summary of Findings
3
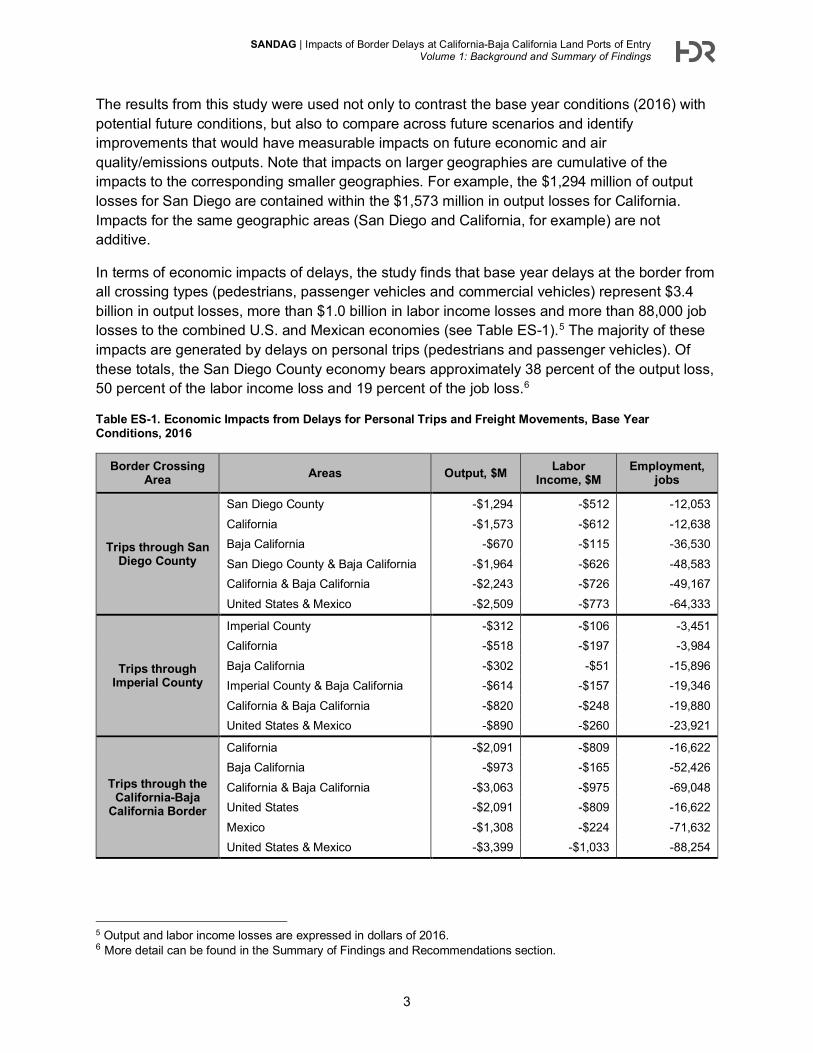
The results from this study were used not only to contrast the base year conditions (2016) with potential future conditions, but also to compare across future scenarios and identify improvements that would have measurable impacts on future economic and air quality/emissions outputs. Note that impacts on larger geographies are cumulative of the impacts to the corresponding smaller geographies. For example, the $1,294 million of output losses for San Diego are contained within the $1,573 million in output losses for California. Impacts for the same geographic areas (San Diego and California, for example) are not additive.
In terms of economic impacts of delays, the study finds that base year delays at the border from all crossing types (pedestrians, passenger vehicles and commercial vehicles) represent $3.4 billion in output losses, more than $1.0 billion in labor income losses and more than 88,000 job losses to the combined U.S. and Mexican economies (see Table ES-1).5 The majority of these impacts are generated by delays on personal trips (pedestrians and passenger vehicles). Of these totals, the San Diego County economy bears approximately 38 percent of the output loss, 50 percent of the labor income loss and 19 percent of the job loss.6
Table ES-1. Economic Impacts from Delays for Personal Trips and Freight Movements, Base Year Conditions, 2016
Border Crossing Area Areas Output, $M Labor
Income, $M Employment,
jobs
Trips through San Diego County
San Diego County -$1,294 -$512 -12,053 California -$1,573 -$612 -12,638 Baja California -$670 -$115 -36,530 San Diego County & Baja California -$1,964 -$626 -48,583 California & Baja California -$2,243 -$726 -49,167 United States & Mexico -$2,509 -$773 -64,333
Trips through Imperial County
Imperial County -$312 -$106 -3,451 California -$518 -$197 -3,984 Baja California -$302 -$51 -15,896 Imperial County & Baja California -$614 -$157 -19,346 California & Baja California -$820 -$248 -19,880 United States & Mexico -$890 -$260 -23,921
Trips through the California-Baja
California Border
California -$2,091 -$809 -16,622 Baja California -$973 -$165 -52,426 California & Baja California -$3,063 -$975 -69,048 United States -$2,091 -$809 -16,622 Mexico -$1,308 -$224 -71,632 United States & Mexico -$3,399 -$1,033 -88,254
5 Output and labor income losses are expressed in dollars of 2016. 6 More detail can be found in the Summary of Findings and Recommendations section.
SANDAG | Impacts of Border Delays at California-Baja California Land Ports of Entry Volume 1: Background and Summary of Findings
4
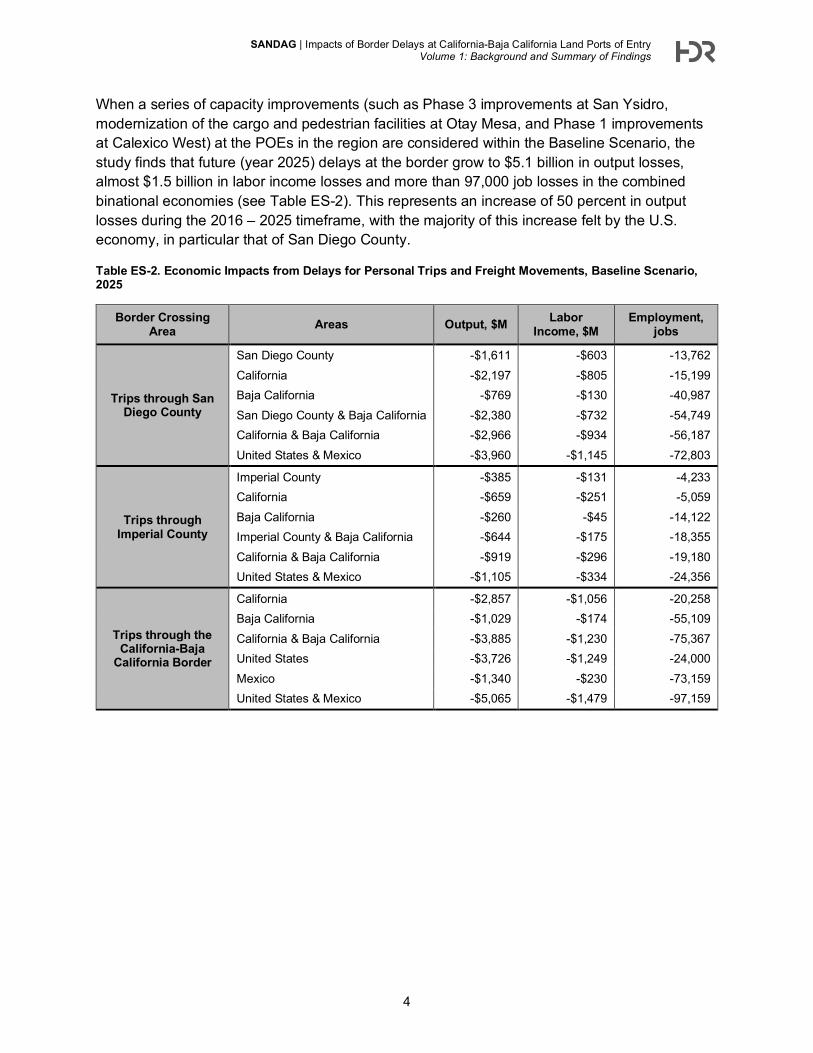
When a series of capacity improvements (such as Phase 3 improvements at San Ysidro, modernization of the cargo and pedestrian facilities at Otay Mesa, and Phase 1 improvements at Calexico West) at the POEs in the region are considered within the Baseline Scenario, the study finds that future (year 2025) delays at the border grow to $5.1 billion in output losses, almost $1.5 billion in labor income losses and more than 97,000 job losses in the combined binational economies (see Table ES-2). This represents an increase of 50 percent in output losses during the 2016 – 2025 timeframe, with the majority of this increase felt by the U.S. economy, in particular that of San Diego County.
Table ES-2. Economic Impacts from Delays for Personal Trips and Freight Movements, Baseline Scenario, 2025
Border Crossing Area Areas Output, $M Labor
Income, $M Employment,
jobs
Trips through San Diego County
San Diego County -$1,611 -$603 -13,762 California -$2,197 -$805 -15,199 Baja California -$769 -$130 -40,987 San Diego County & Baja California -$2,380 -$732 -54,749 California & Baja California -$2,966 -$934 -56,187 United States & Mexico -$3,960 -$1,145 -72,803
Trips through Imperial County
Imperial County -$385 -$131 -4,233 California -$659 -$251 -5,059 Baja California -$260 -$45 -14,122 Imperial County & Baja California -$644 -$175 -18,355 California & Baja California -$919 -$296 -19,180 United States & Mexico -$1,105 -$334 -24,356
Trips through the California-Baja
California Border
California -$2,857 -$1,056 -20,258 Baja California -$1,029 -$174 -55,109 California & Baja California -$3,885 -$1,230 -75,367 United States -$3,726 -$1,249 -24,000 Mexico -$1,340 -$230 -73,159 United States & Mexico -$5,065 -$1,479 -97,159
SANDAG | Impacts of Border Delays at California-Baja California Land Ports of Entry Volume 1: Background and Summary of Findings
5
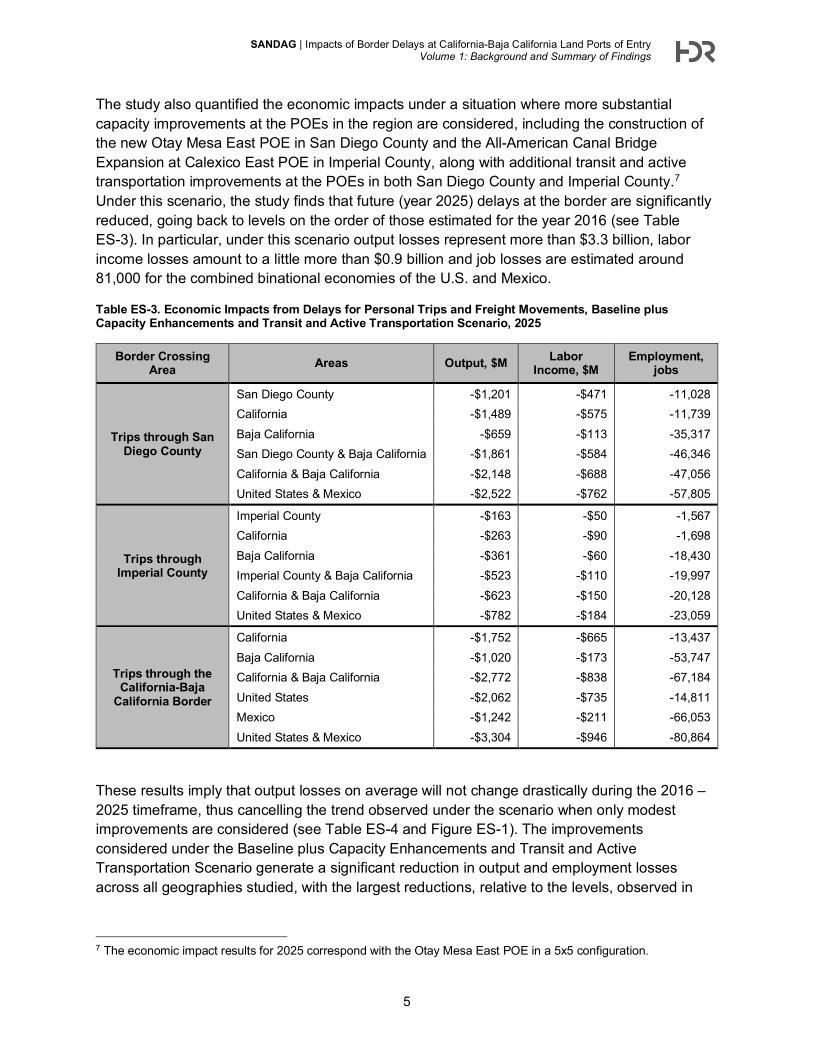
The study also quantified the economic impacts under a situation where more substantial capacity improvements at the POEs in the region are considered, including the construction of the new Otay Mesa East POE in San Diego County and the All-American Canal Bridge Expansion at Calexico East POE in Imperial County, along with additional transit and active transportation improvements at the POEs in both San Diego County and Imperial County.7 Under this scenario, the study finds that future (year 2025) delays at the border are significantly reduced, going back to levels on the order of those estimated for the year 2016 (see Table ES-3). In particular, under this scenario output losses represent more than $3.3 billion, labor income losses amount to a little more than $0.9 billion and job losses are estimated around 81,000 for the combined binational economies of the U.S. and Mexico.
Table ES-3. Economic Impacts from Delays for Personal Trips and Freight Movements, Baseline plus Capacity Enhancements and Transit and Active Transportation Scenario, 2025
Border Crossing Area Areas Output, $M Labor
Income, $M Employment,
jobs
Trips through San Diego County
San Diego County -$1,201 -$471 -11,028 California -$1,489 -$575 -11,739 Baja California -$659 -$113 -35,317 San Diego County & Baja California -$1,861 -$584 -46,346 California & Baja California -$2,148 -$688 -47,056 United States & Mexico -$2,522 -$762 -57,805
Trips through Imperial County
Imperial County -$163 -$50 -1,567 California -$263 -$90 -1,698 Baja California -$361 -$60 -18,430 Imperial County & Baja California -$523 -$110 -19,997 California & Baja California -$623 -$150 -20,128 United States & Mexico -$782 -$184 -23,059
Trips through the California-Baja
California Border
California -$1,752 -$665 -13,437 Baja California -$1,020 -$173 -53,747 California & Baja California -$2,772 -$838 -67,184 United States -$2,062 -$735 -14,811 Mexico -$1,242 -$211 -66,053 United States & Mexico -$3,304 -$946 -80,864
These results imply that output losses on average will not change drastically during the 2016 – 2025 timeframe, thus cancelling the trend observed under the scenario when only modest improvements are considered (see Table ES-4 and Figure ES-1). The improvements considered under the Baseline plus Capacity Enhancements and Transit and Active Transportation Scenario generate a significant reduction in output and employment losses across all geographies studied, with the largest reductions, relative to the levels, observed in
7 The economic impact results for 2025 correspond with the Otay Mesa East POE in a 5x5 configuration.
SANDAG | Impacts of Border Delays at California-Baja California Land Ports of Entry Volume 1: Background and Summary of Findings
6
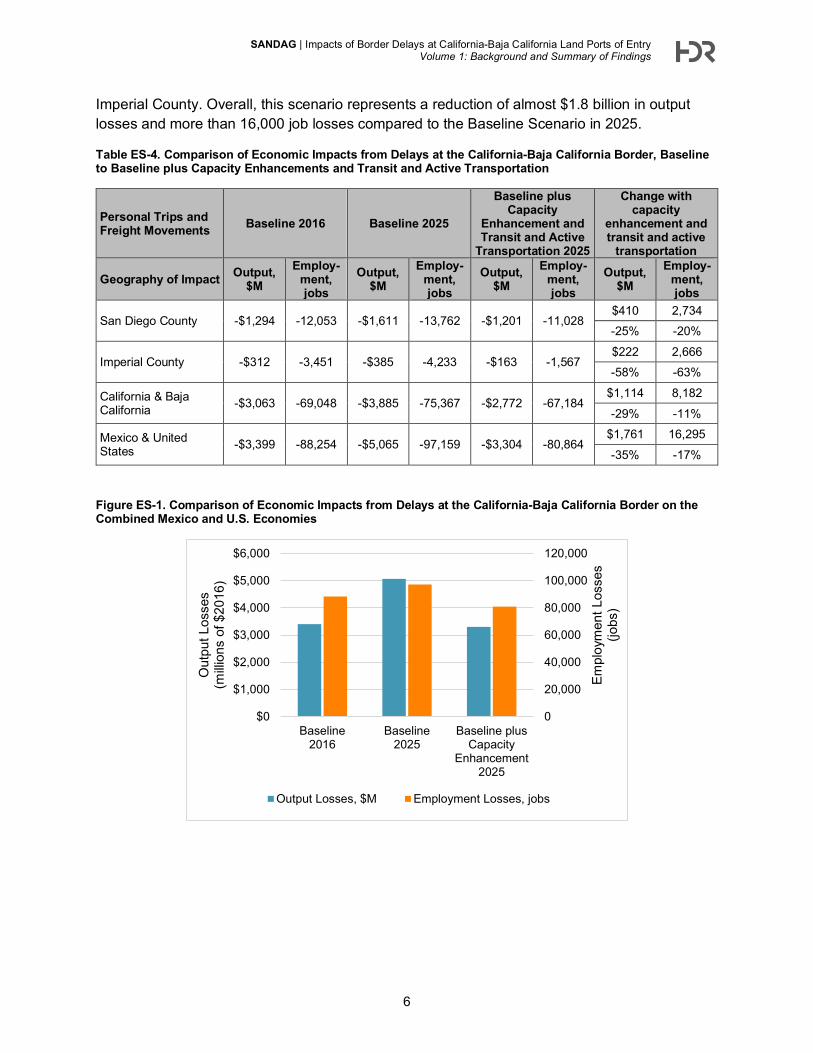
Imperial County. Overall, this scenario represents a reduction of almost $1.8 billion in output losses and more than 16,000 job losses compared to the Baseline Scenario in 2025.
Table ES-4. Comparison of Economic Impacts from Delays at the California-Baja California Border, Baseline to Baseline plus Capacity Enhancements and Transit and Active Transportation
Personal Trips and Freight Movements Baseline 2016 Baseline 2025
Baseline plus Capacity
Enhancement and Transit and Active
Transportation 2025
Change with capacity
enhancement and transit and active
transportation
Geography of Impact Output, $M
Employ-ment, jobs
Output, $M
Employ-ment, jobs
Output, $M
Employ-ment, jobs
Output, $M
Employ-ment, jobs
San Diego County -$1,294 -12,053 -$1,611 -13,762 -$1,201 -11,028 $410 2,734 -25% -20%
Imperial County -$312 -3,451 -$385 -4,233 -$163 -1,567 $222 2,666 -58% -63%
California & Baja California -$3,063 -69,048 -$3,885 -75,367 -$2,772 -67,184
$1,114 8,182
-29% -11%
Mexico & United States -$3,399 -88,254 -$5,065 -97,159 -$3,304 -80,864
$1,761 16,295
-35% -17%
Figure ES-1. Comparison of Economic Impacts from Delays at the California-Baja California Border on the Combined Mexico and U.S. Economies
0
20,000
40,000
60,000
80,000
100,000
120,000
$0
$1,000
$2,000
$3,000
$4,000
$5,000
$6,000
Baseline2016
Baseline2025
Baseline plusCapacity
Enhancement2025
Empl
oym
ent L
osse
s (jo
bs)
Out
put L
osse
s (m
illion
s of
$20
16)
Output Losses, $M Employment Losses, jobs
SANDAG | Impacts of Border Delays at California-Baja California Land Ports of Entry Volume 1: Background and Summary of Findings
7
These quantitative economic results are complemented with 20 interviews to businesses with ties to the border that focused on the qualitative impacts of border delays on their supply chain, logistics, employment, and customer service. The survey responses were analyzed and identified the following trends across the California-Baja California border region:
• Local adaptability to border delay: The interview responses indicate that many workers and customers traveling across the border are relatively tolerant to small changes in border delay, especially when border wait times are as expected, albeit long.
• Importance of accessibility: Many companies express border delay concerns not only in terms of the monetary costs from border delay increases, but also in the missed opportunities and potential benefits from improvements in crossing times and efficient processing.
• Desire to reduce border delays: Several of the companies expressed that they are currently implementing measures to alleviate the effects of border delays. The current strategies largely comprise a reallocation of resources and working around the current extreme border wait time peaks, based on interview information.
• Desire for improved processing measures: The unpredictability of wait times was listed as the most impactful aspect of border delay, even more than the wait times themselves. Unpredictable wait times make it difficult for businesses to plan logistics accordingly. Inefficient processing at the border was cited as another factor that increases border delay.
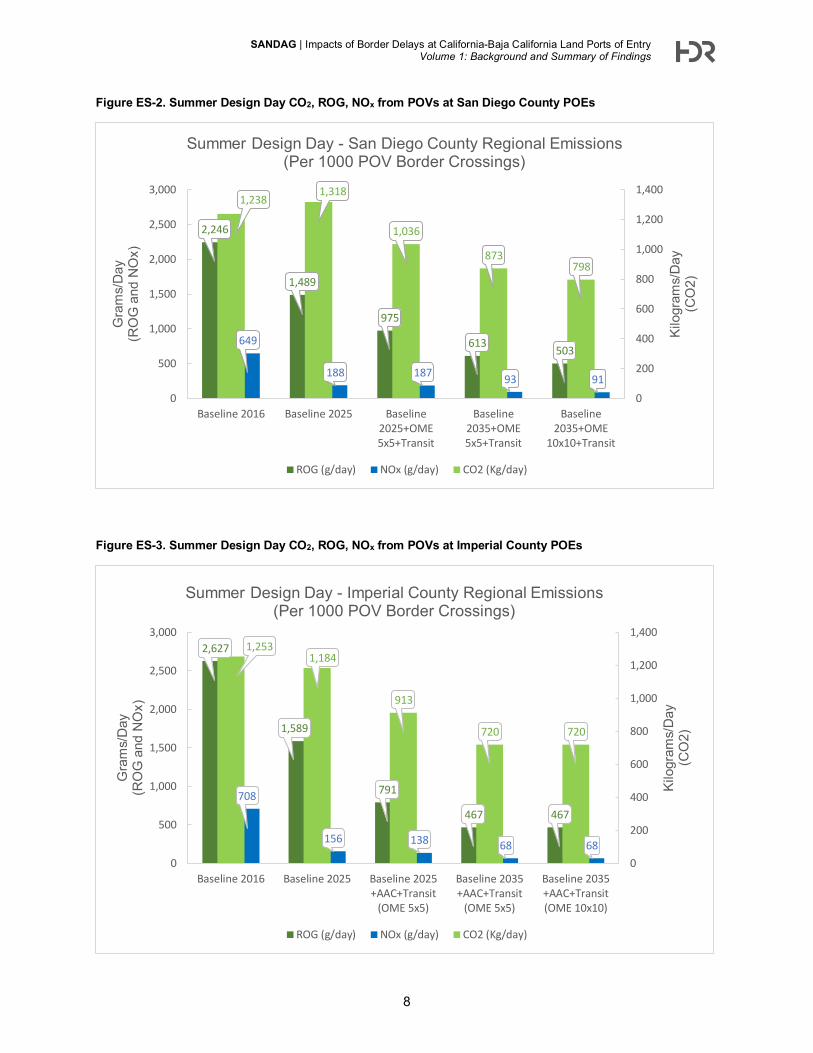
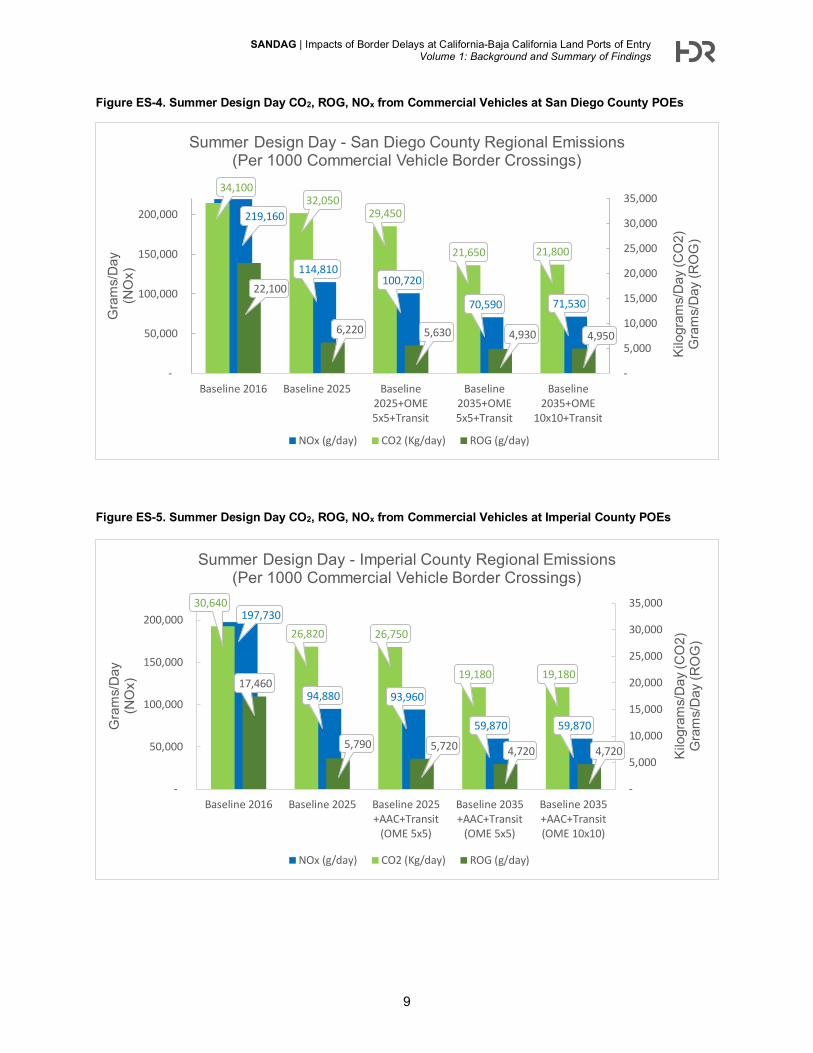
In terms of air quality/emissions results, the study finds that the planned infrastructure improvements and policies to expand capacity are needed by 2025 and 2035 so that growing delay and queuing do not overwhelm emission reductions derived from the lower polluting fuels and more efficient vehicles. Typical weekly average day emissions of CO2, ROG, and NOX per 1,000 vehicles crossing the border are shown in figures Figure ES-2 through Figure ES-5 below.8 The figures present emission levels during the summer for passenger vehicles (privately-owned vehicles or POVs) and commercial vehicles by scenario and by future year.9 The significance of these pollutants lies in their contribution to pollution concerns on a county-wide scale and therefore they are presented at that geographical level.
8 These pollutants are precursors to regional pollutants such as ground-level ozone, or have a contribution to anthropogenic climate change. More information about this is provided in Volume 3. 9 In these graphs the Baseline Scenario is listed as “Baseline,” the Baseline plus Capacity Enhancements and Transit and Active Transportation Scenario is listed as “Baseline+OME” for San Diego County and “Baseline+AAC” for Imperial County. The year to which the analysis applies is also listed as part of the scenario name in the graphs.
SANDAG | Impacts of Border Delays at California-Baja California Land Ports of Entry Volume 1: Background and Summary of Findings
8
Figure ES-2. Summer Design Day CO2, ROG, NOx from POVs at San Diego County POEs
Figure ES-3. Summer Design Day CO2, ROG, NOx from POVs at Imperial County POEs
2,246
1,489
975
613 503649
188 187 93 91
1,2381,318
1,036
873798
0
200
400
600
800
1,000
1,200
1,400
0
500
1,000
1,500
2,000
2,500
3,000
Baseline 2016 Baseline 2025 Baseline2025+OME5x5+Transit
Baseline2035+OME5x5+Transit
Baseline2035+OME
10x10+Transit
Kilo
gram
s/D
ay(C
O2)
Gra
ms/
Day
(RO
G a
nd N
Ox)
Summer Design Day - San Diego County Regional Emissions(Per 1000 POV Border Crossings)
ROG (g/day) NOx (g/day) CO2 (Kg/day)
2,627
1,589
791
467 467708
156 138 68 68
1,2531,184
913
720 720
0
200
400
600
800
1,000
1,200
1,400
0
500
1,000
1,500
2,000
2,500
3,000
Baseline 2016 Baseline 2025 Baseline 2025+AAC+Transit
(OME 5x5)
Baseline 2035+AAC+Transit
(OME 5x5)
Baseline 2035+AAC+Transit(OME 10x10)
Kilo
gram
s/D
ay(C
O2)
Gra
ms/
Day
(RO
G a
nd N
Ox)
Summer Design Day - Imperial County Regional Emissions(Per 1000 POV Border Crossings)
ROG (g/day) NOx (g/day) CO2 (Kg/day)
SANDAG | Impacts of Border Delays at California-Baja California Land Ports of Entry Volume 1: Background and Summary of Findings
9
Figure ES-4. Summer Design Day CO2, ROG, NOx from Commercial Vehicles at San Diego County POEs
Figure ES-5. Summer Design Day CO2, ROG, NOx from Commercial Vehicles at Imperial County POEs
219,160
114,810 100,720
70,590 71,530
34,10032,050
29,450
21,650 21,800
22,100
6,220 5,630 4,930 4,950
-
5,000
10,000
15,000
20,000
25,000
30,000
35,000
-
50,000
100,000
150,000
200,000
Baseline 2016 Baseline 2025 Baseline2025+OME5x5+Transit
Baseline2035+OME5x5+Transit
Baseline2035+OME
10x10+Transit
Kilo
gram
s/D
ay(C
O2)
Gra
ms/
Day
(RO
G)
Gra
ms/
Day
(NO
x)Summer Design Day - San Diego County Regional Emissions
(Per 1000 Commercial Vehicle Border Crossings)
NOx (g/day) CO2 (Kg/day) ROG (g/day)
197,730
94,880 93,960
59,870 59,870
30,640
26,820 26,750
19,180 19,180 17,460
5,790 5,720 4,720 4,720
-
5,000
10,000
15,000
20,000
25,000
30,000
35,000
-
50,000
100,000
150,000
200,000
Baseline 2016 Baseline 2025 Baseline 2025+AAC+Transit
(OME 5x5)
Baseline 2035+AAC+Transit
(OME 5x5)
Baseline 2035+AAC+Transit(OME 10x10)
Kilo
gram
s/D
ay (C
O2)
Gra
ms/
Day
(RO
G)
Gra
ms/
Day
(NO
x)
Summer Design Day - Imperial County Regional Emissions(Per 1000 Commercial Vehicle Border Crossings)
NOx (g/day) CO2 (Kg/day) ROG (g/day)
SANDAG | Impacts of Border Delays at California-Baja California Land Ports of Entry Volume 1: Background and Summary of Findings
10
The results shown in figures Figure ES-2 through Figure ES-5 illustrate trends in ongoing emission reductions through planned improvements at the POEs and the phase in of cleaner, more efficient, vehicles.10 By 2035 however, emissions reductions for some pollutants at the busier POEs can be seen bottoming out. This suggests the need for additional vehicle technology improvements and capacity enhancements to maintain the downward trajectory of emissions past 2035.
The emissions analysis shows that the planned infrastructure improvements and policies to expand capacity are needed by 2025 and 2035 so that growing delay and queuing does not overwhelm emission reductions derived from the lower polluting, more efficient vehicles and fuels.
The study identified several recommendations to improve conditions at the border. The recommended strategies may have positive impacts on border crossers and businesses that utilize crossings in the California-Baja California border region. Potential impacts include reductions in delays, changes in modal split from vehicle crossing to pedestrian crossings, and air quality/emissions improvement. Broadly, the types of recommended improvements can be summarized in the following categories:
• Investment in POE Infrastructure and Physical Capacity • Improved Operations at POEs • Improved Access to POEs • Corridor-Wide Improvements • Support for Coordination on Long-Term Strategies
In terms of capacity expansions at POEs, the study recommends that additional lanes and booths be added for motorized vehicles. There are several improvements categorized as Improved Operations at POEs. The study also recommends strategies to improve access to POEs including improved bike and pedestrian access as well as enhanced transit services at the border. The study finds that the development of an accurate real time northbound and southbound border wait time system, which could include RFID and Wi-Fi readers or other proven technology, to capture commercial vehicle wait time data has the potential to improve planning and routing decisions and reduce northbound delays for trucks.11 Corridor-wide improvement recommendations were also developed, including a Regional Border Management System (RBMS) to reduce delays for commercial and passenger vehicles due to efficient re-routing with advanced travel information. Finally, the study recommends agency support for
10 At Calexico East with the All American Canal improvements, additional primary inspection booths have not yet been approved by the U.S. federal government, though the study assumes that these primary inspection booths will be open by 2025. 11 SANDAG and Caltrans District 11 are currently implementing the first phases of the California Sustainable Freight Action Plan (CSFAP): Advanced Technology Corridors at Border Ports of Entry pilot project, which include installing the intelligent transportation systems (ITS) equipment that will measure southbound border wait times wait times at all of the California-Baja California POEs. This southbound border wait times project, which will start construction in Winter 2020, will provide cross-border passenger and commercial travelers with better information to aid them in travel decisions on where and when to travel across the border in the least amount of time. In Fall 2020, SANDAG will start the complementary northbound border wait time pilot project at the Otay Mesa and San Ysidro POEs in partnership with the Secretariat of Communications and Transportation of Mexico (SCT). Implementing Phase III of the CSFAP border pilot project, the data from both projects will integrate into the RBMS.
SANDAG | Impacts of Border Delays at California-Baja California Land Ports of Entry Volume 1: Background and Summary of Findings
11
binational planning processes and collaboration efforts to improve the chances of a successful implementation of several of the recommended strategies identified above.12
Finally, it is worth mentioning that the conditions at the border have significantly changed since a similar study was conducted in 2006-2007. In particular, the Great Recession in 2008-2009 and the increased rate of adoption of technological improvements and trusted traveler programs in the region have made the results from this study not comparable with previous efforts. In that sense, the current study truly provides a “fresh look” at the impacts of delays at the California-Baja California border and provides a new baseline.
Some recent events are not in the scope of the current study, which began in 2016 and has been completed in 2020. For example, uncertainty related to U.S.-Mexico trade that existed in 2018 has been resolved with the ratification of the United States-Mexico-Canada Agreement in 2020.13 Additionally, crossings at the U.S.-Mexico border have been restricted for the majority of 2020 due to the COVID-19 pandemic.14 However, the impacts of COVID-19 on the border are not included in this study as the pandemic began after the study data collection was completed. Although the study team acknowledges that the current economic and global health situation has impacted border crossing volumes, the current study is estimating the economic and air quality/emissions impacts in a typical border crossing dynamic.
12 Caltrans, ICTC, SCAG, and SANDAG are participating in the 2021 California-Baja California Border Master Plan Update, a binational effort to coordinate planning and delivery of projects at land port of entries and the transportation infrastructure serving them. 13 United States-Mexico-Canada Agreement, https://ustr.gov/usmca. Accessed September 4, 2020. 14 Department of Homeland Security, “DHS Measures on the Border to Limit the Further Spread of Coronavirus,” https://www.dhs.gov/news/2020/08/14/fact-sheet-dhs-measures-border-limit-further-spread-coronavirus. Accessed September 4, 2020.
SANDAG | Impacts of Border Delays at California-Baja California Land Ports of Entry Volume 1: Background and Summary of Findings
12
Introduction Motivation for the Study The California-Baja California border region is one of the most important and dynamic economic zones in North America. However, demand already outstrips supply at the region’s border crossings. In 2016, the regional border crossings processed more than $58.2 billion in goods (imports and exports), more than 55.5 million passengers in almost 31.1 million personal vehicles (POVs), more than 17.6 million pedestrians, and over 1.3 million commercial trucks.15 While the crossings have become a critical element of the binational region’s economic integration and competitiveness, growing demand has led to increased congestion at border crossings and generated delay and unreliable travel times for cars, pedestrians, and trucks. These delays and travel time unreliability at the border have the potential to reduce the region’s economic competitiveness and attractiveness to businesses, which can translate into lower levels of economic activity and growth.
In 2006, SANDAG and Caltrans conducted a study that showed how border delays cause significant reductions in economic output and employment.16 This study highlighted the need for improving border crossings and helped make the case for developing a third crossing between San Diego and Tijuana (the planned Otay Mesa East-Mesa de Otay II border crossing). Similarly, in 2007, the former Imperial Valley Association of Governments (IVAG) and Caltrans conducted an economic delay study for Imperial County border crossings. Much has changed since these earlier studies – the regional economy has rebounded from the Great Recession, the United States-Mexico-Canada Agreement has been ratified, and there are new emerging industry clusters that depend on crossborder trade.17
There is also a need to understand the regional and subregional impacts of the border trade. While residents of communities far from the border may perceive little interaction with the border and little to gain from border improvements, a large portion of Mexican imports to the United States contain U.S. materials as a result of crossborder production sharing. The border may have wide ranging economic impacts throughout San Diego and Imperial counties and beyond. In this sense, SANDAG and its stakeholders need to understand how the border trade affects value-added production in the established and emerging industrial clusters.
While the earlier border studies provide insight into the impacts of the border on the regional economy, the true impacts of border delays include pollution and barriers to social cohesiveness that affect the quality of life for residents of the binational region. Agencies and residents across the U.S. – Mexican border have increased their awareness of these non-economic effects and are starting to take steps to understand and address them.
15 U.S. Bureau of Transportation Statistics. https://www.bts.gov/content/border-crossingentry-data. Border crossing volumes are shown for northbound (U.S. inbound) movements of people and vehicles. 16 A 2006 study conducted by HDR on behalf of SANDAG estimates that combined U.S. and Mexico output is reduced by almost $6 billion (in dollars of 2005) and employment is reduced by more than 51 thousand jobs due to delays at the San Diego – Tijuana border. 17 United States-Mexico-Canada Agreement, https://ustr.gov/usmca
SANDAG | Impacts of Border Delays at California-Baja California Land Ports of Entry Volume 1: Background and Summary of Findings
13
Efforts to address emissions due to idling and delay at the border could be part of the strategies to meet both California and Mexico air quality goals, while improving the quality of life for residents of the binational region. Emission reductions benefit economically disadvantaged communities near the POEs on both sides of the border.
The objectives of this project for SANDAG, the Imperial County Transportation Commission (ICTC) and Caltrans were threefold. First, the partner agencies needed a technically sound assessment of the impact of delays experienced at the California-Baja California land POEs on the regional economy. In this sense, the study is similar to prior efforts, but it considers impacts on emerging industry clusters, subregions, and value added. Second, an assessment of emissions at the border as a result of crossborder wait times was needed to understand how emissions affect regional air quality and greenhouse gases. Third, the study provides the partner agencies and other stakeholders with information on the importance of reducing border-crossing wait times.
As a result, SANDAG commissioned the HDR team (led by HDR Inc., and supported by T. Kear Transportation Planning and Management, Inc., Crossborder Group and Sutra Research) to conduct the study on Impacts of Border Delays at the California-Baja California Land Ports of Entry. The study began in 2016 with the SR11 BTDM (Version 2.0) and was continued in 2020 with an updated version of the SR 11 BTDM from the “Otay Mesa East-Mesa de Otay II Port of Entry Innovation Analysis, Concept Design, Modeling, and Traffic and Revenue Study” (Tier II Traffic and Revenue) which became available in April 2020. For the remainder of this report (Volumes 1, 2, and 3) the HDR team is referred to as the Project Team. This report summarizes the findings of the Project Team.
Organization of the Final Report The Final Report for this study is broken down into three Volumes, with each volume focusing on a specific aspect of the study.
Volume 1 (this document) summarizes the information pertaining to both the Economic Impact Analysis and the Air Quality/Emissions Impact Analysis, covering general information on the study’s motivation, study area, data needs and collection, definitions of the conceptual scenarios, and the corresponding border delays and crossing volumes that characterize each scenario. The Volume concludes with a summary of the study results and recommendations to reduce delays and alleviate economic and air quality/emissions impacts. The Volume 1 Appendix (contained in a separate document) includes four reports in support of the content presented in Volume 1. Appendix A to Volume 1 contains the assessment of existing “gaps” on border data, completed at the beginning of this study effort in 2016. Appendix B summarizes the survey methodology and plan for the at-border data collection. Appendix C presents a summary of the at-border data collection results. Finally, Appendix D presents a white paper on border wait time technologies and information systems.
Volume 2 focuses on the estimation of economic impacts that result from delays. As such, it describes the economic methodology used, key inputs, and assumptions inherent to the Economic Impact Analysis. It also describes the risk component of this analysis and how it is incorporated. It concludes by summarizing the results and providing recommendations to
SANDAG | Impacts of Border Delays at California-Baja California Land Ports of Entry Volume 1: Background and Summary of Findings
14
reduce border-related economic impacts in the region. The Volume 2 Appendix contains five reports in support of the content presented in Volume 2.
Finally, Volume 3 focuses on the quantification of air quality/emissions impacts that result from delays. This volume presents the methodology used in the analysis, describes the POE layouts and the processes analyzed, provides an overview of the conceptual scenarios and presents results from the analysis of emissions generated by vehicle delays at the land ports of entry. A brief discussion of those results is followed by recommendations to reduce delays and air quality/emissions impacts.
SANDAG | Impacts of Border Delays at California-Baja California Land Ports of Entry Volume 1: Background and Summary of Findings
15
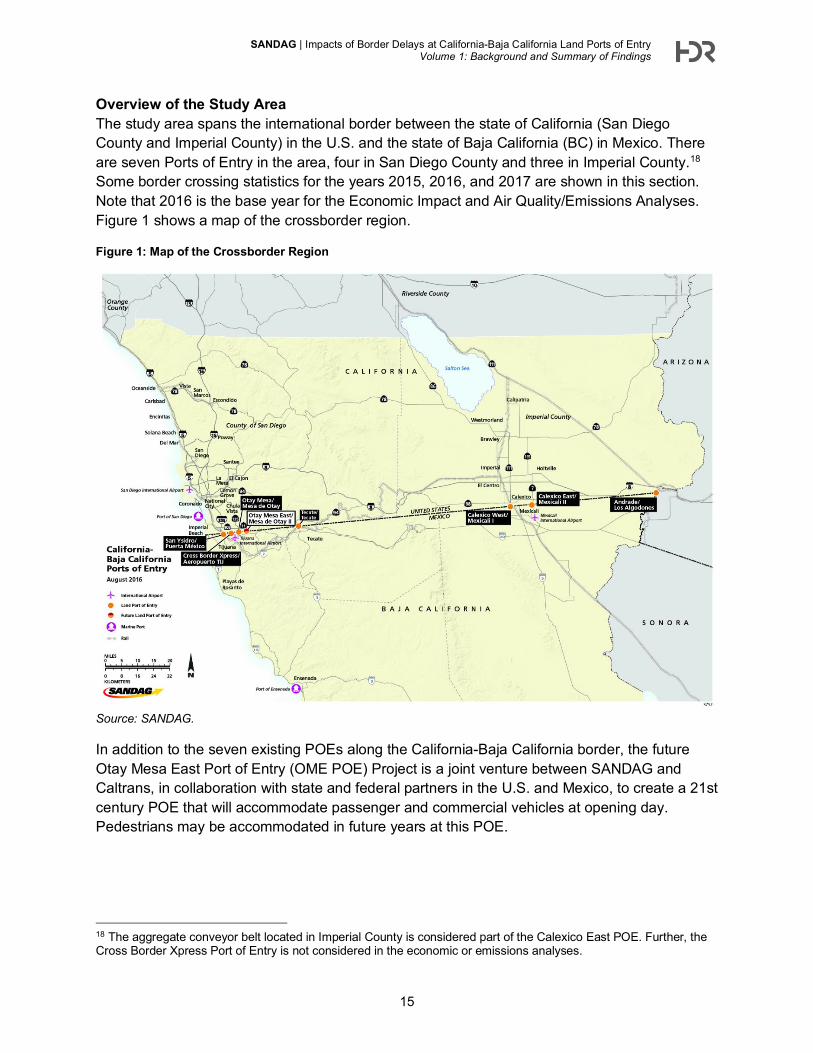
Overview of the Study Area The study area spans the international border between the state of California (San Diego County and Imperial County) in the U.S. and the state of Baja California (BC) in Mexico. There are seven Ports of Entry in the area, four in San Diego County and three in Imperial County.18 Some border crossing statistics for the years 2015, 2016, and 2017 are shown in this section. Note that 2016 is the base year for the Economic Impact and Air Quality/Emissions Analyses. Figure 1 shows a map of the crossborder region.
Figure 1: Map of the Crossborder Region
Source: SANDAG.
In addition to the seven existing POEs along the California-Baja California border, the future Otay Mesa East Port of Entry (OME POE) Project is a joint venture between SANDAG and Caltrans, in collaboration with state and federal partners in the U.S. and Mexico, to create a 21st century POE that will accommodate passenger and commercial vehicles at opening day. Pedestrians may be accommodated in future years at this POE.
18 The aggregate conveyor belt located in Imperial County is considered part of the Calexico East POE. Further, the Cross Border Xpress Port of Entry is not considered in the economic or emissions analyses.
SANDAG | Impacts of Border Delays at California-Baja California Land Ports of Entry Volume 1: Background and Summary of Findings
16
As discussed throughout the study, the OME POE is anticipated to have a 5x5 configuration, which entails 5 POV and 5 commercial lanes in both directions, at opening day with the flexibility to expand in future years to a 10x10 configuration in order to meet future demand.
Major highways State Route 905 and State Route 125 will connect passenger and commercial vehicles to this future POE. In addition, the project partners are currently constructing the final segments of State Route 11, the four-lane tolled road connecting directly to the OME POE.
SAN DIEGO COUNTY The San Diego region includes the land border crossings at San Ysidro, CA (crossing with Tijuana, BC), Otay Mesa, CA (crossing with Mesa de Otay, BC), and Tecate, CA (crossing with Tecate, BC). The main metropolitan areas are San Diego (U.S.) and Tijuana (Mexico). The population estimate in 2016 for San Diego County is about 3.26 million people.19 The 2015 census population estimate for Tijuana, Mexico is 1.7 million people.20,21 Both regions have an international airport. San Diego has a seaport in the city, and the closest seaport in Baja California is in Ensenada. In general, these crossings are subject to coastal and Mediterranean climates with warmer, dryer environments to the east.
San Ysidro straddles the border between metropolitan Tijuana and the community of San Ysidro (12 miles to the south of downtown San Diego, with a population of approximately 32,400 people).22 San Ysidro is a crossing for privately owned vehicles (POVs), buses, and pedestrians. Major highways I-5 and I-805 connect vehicles to this crossing. This crossing is also served by two transit centers (San Ysidro and Virginia Avenue) that offer bus connections (Metropolitan Transit System or MTS, Greyhound, and other operators), Trolley connections to the UC San Diego Blue Line, and taxi, jitney, and ride-hailing services. These services, routes, and transit centers are depicted in Figure 2.
19 U.S. Census Bureau, 2012-2016 American Community Survey 5-Year Estimates. Retrieved from https://factfinder.census.gov/faces/nav/jsf/pages/community_facts.xhtml 20 Instituto Nacional de Estadística y Geografía (INEGI). Dirección General de Estadísticas Sociodemográficas (Encuesta Intercensal 2015) www.inegi.org.mx 21 For a same year comparison, the ACS 2010 population estimate for San Diego County is 3.02 million. 22 U.S. Census Bureau, 2016 ACS 5-Year Population Estimate for 92173 zip code.
SANDAG | Impacts of Border Delays at California-Baja California Land Ports of Entry Volume 1: Background and Summary of Findings
17
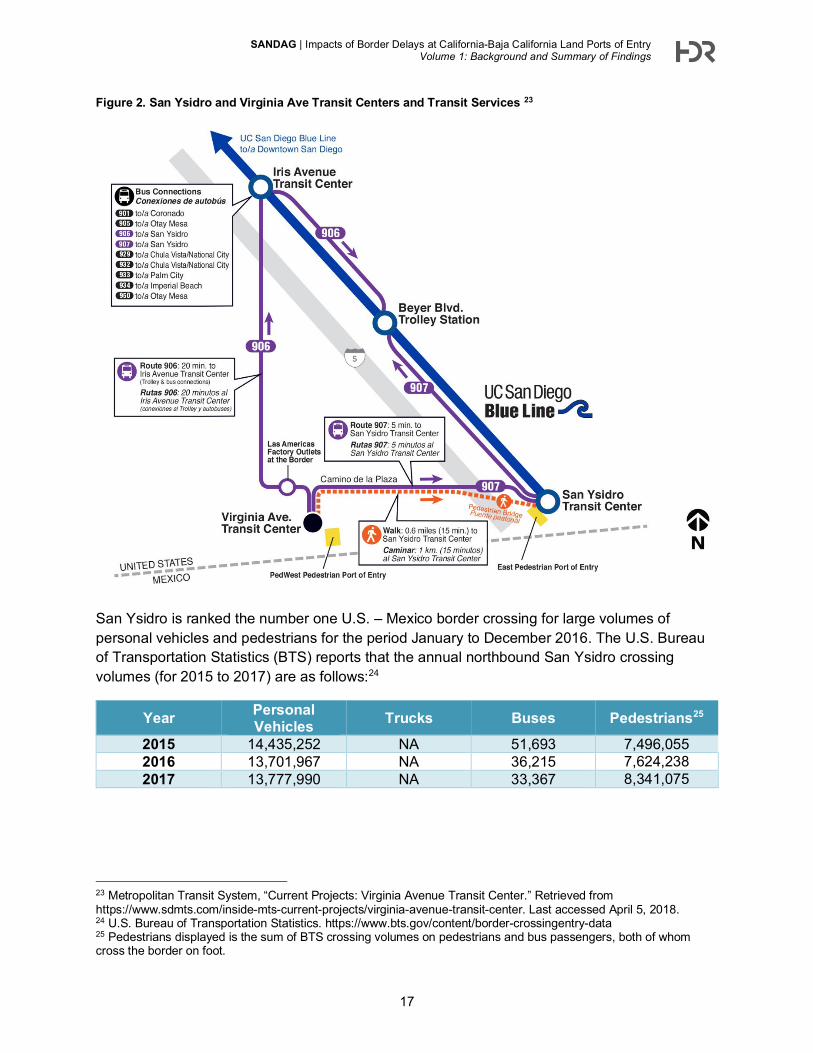
Figure 2. San Ysidro and Virginia Ave Transit Centers and Transit Services 23
San Ysidro is ranked the number one U.S. – Mexico border crossing for large volumes of personal vehicles and pedestrians for the period January to December 2016. The U.S. Bureau of Transportation Statistics (BTS) reports that the annual northbound San Ysidro crossing volumes (for 2015 to 2017) are as follows:24
Year Personal Vehicles Trucks Buses Pedestrians25
2015 14,435,252 NA 51,693 7,496,055 2016 13,701,967 NA 36,215 7,624,238 2017 13,777,990 NA 33,367 8,341,075
23 Metropolitan Transit System, “Current Projects: Virginia Avenue Transit Center.” Retrieved from https://www.sdmts.com/inside-mts-current-projects/virginia-avenue-transit-center. Last accessed April 5, 2018. 24 U.S. Bureau of Transportation Statistics. https://www.bts.gov/content/border-crossingentry-data 25 Pedestrians displayed is the sum of BTS crossing volumes on pedestrians and bus passengers, both of whom cross the border on foot.
SANDAG | Impacts of Border Delays at California-Baja California Land Ports of Entry Volume 1: Background and Summary of Findings
18
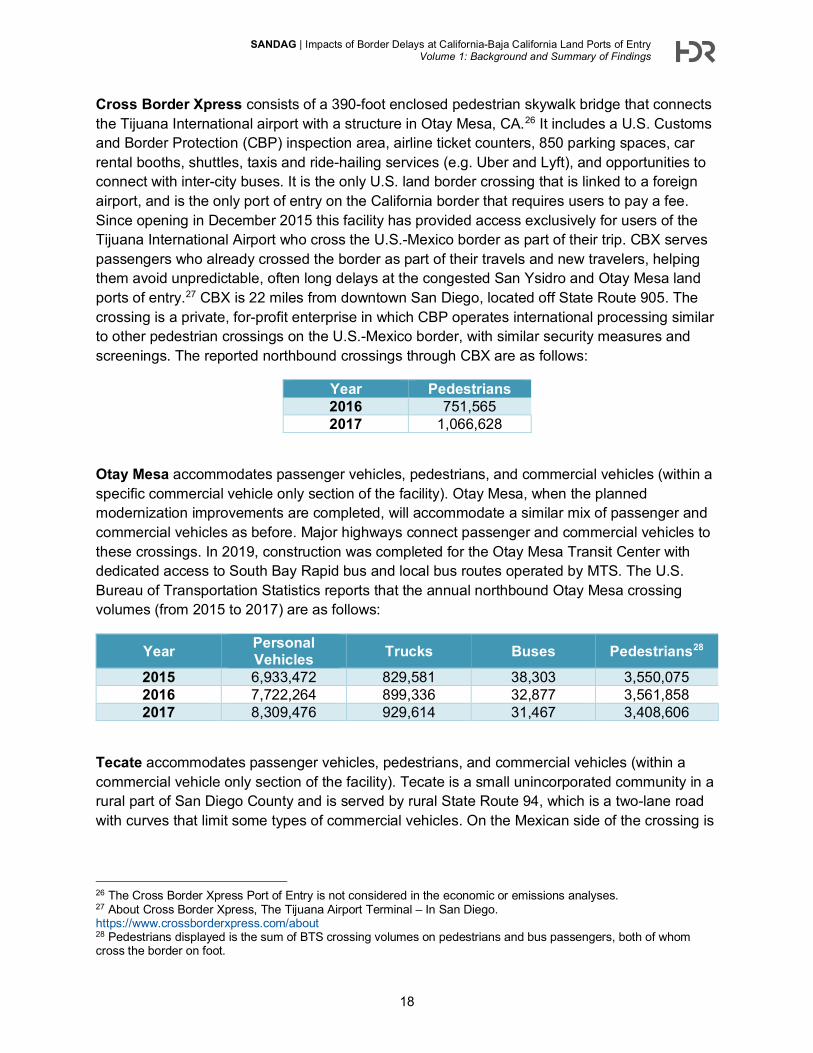
Cross Border Xpress consists of a 390-foot enclosed pedestrian skywalk bridge that connects the Tijuana International airport with a structure in Otay Mesa, CA.26 It includes a U.S. Customs and Border Protection (CBP) inspection area, airline ticket counters, 850 parking spaces, car rental booths, shuttles, taxis and ride-hailing services (e.g. Uber and Lyft), and opportunities to connect with inter-city buses. It is the only U.S. land border crossing that is linked to a foreign airport, and is the only port of entry on the California border that requires users to pay a fee. Since opening in December 2015 this facility has provided access exclusively for users of the Tijuana International Airport who cross the U.S.-Mexico border as part of their trip. CBX serves passengers who already crossed the border as part of their travels and new travelers, helping them avoid unpredictable, often long delays at the congested San Ysidro and Otay Mesa land ports of entry.27 CBX is 22 miles from downtown San Diego, located off State Route 905. The crossing is a private, for-profit enterprise in which CBP operates international processing similar to other pedestrian crossings on the U.S.-Mexico border, with similar security measures and screenings. The reported northbound crossings through CBX are as follows:
Year Pedestrians 2016 751,565 2017 1,066,628
Otay Mesa accommodates passenger vehicles, pedestrians, and commercial vehicles (within a specific commercial vehicle only section of the facility). Otay Mesa, when the planned modernization improvements are completed, will accommodate a similar mix of passenger and commercial vehicles as before. Major highways connect passenger and commercial vehicles to these crossings. In 2019, construction was completed for the Otay Mesa Transit Center with dedicated access to South Bay Rapid bus and local bus routes operated by MTS. The U.S. Bureau of Transportation Statistics reports that the annual northbound Otay Mesa crossing volumes (from 2015 to 2017) are as follows:
Year Personal Vehicles Trucks Buses Pedestrians28
2015 6,933,472 829,581 38,303 3,550,075 2016 7,722,264 899,336 32,877 3,561,858 2017 8,309,476 929,614 31,467 3,408,606
Tecate accommodates passenger vehicles, pedestrians, and commercial vehicles (within a commercial vehicle only section of the facility). Tecate is a small unincorporated community in a rural part of San Diego County and is served by rural State Route 94, which is a two-lane road with curves that limit some types of commercial vehicles. On the Mexican side of the crossing is
26 The Cross Border Xpress Port of Entry is not considered in the economic or emissions analyses. 27 About Cross Border Xpress, The Tijuana Airport Terminal – In San Diego. https://www.crossborderxpress.com/about 28 Pedestrians displayed is the sum of BTS crossing volumes on pedestrians and bus passengers, both of whom cross the border on foot.
SANDAG | Impacts of Border Delays at California-Baja California Land Ports of Entry Volume 1: Background and Summary of Findings
19
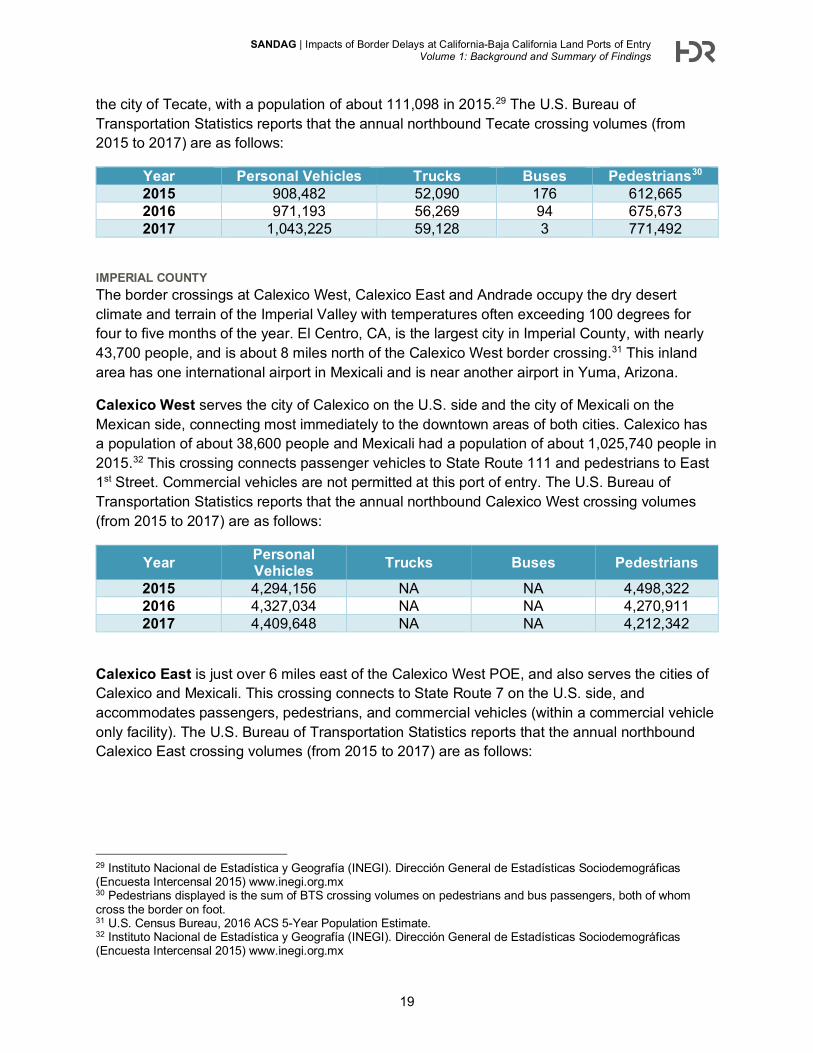
the city of Tecate, with a population of about 111,098 in 2015.29 The U.S. Bureau of Transportation Statistics reports that the annual northbound Tecate crossing volumes (from 2015 to 2017) are as follows:
Year Personal Vehicles Trucks Buses Pedestrians30 2015 908,482 52,090 176 612,665 2016 971,193 56,269 94 675,673 2017 1,043,225 59,128 3 771,492
IMPERIAL COUNTY The border crossings at Calexico West, Calexico East and Andrade occupy the dry desert climate and terrain of the Imperial Valley with temperatures often exceeding 100 degrees for four to five months of the year. El Centro, CA, is the largest city in Imperial County, with nearly 43,700 people, and is about 8 miles north of the Calexico West border crossing.31 This inland area has one international airport in Mexicali and is near another airport in Yuma, Arizona.
Calexico West serves the city of Calexico on the U.S. side and the city of Mexicali on the Mexican side, connecting most immediately to the downtown areas of both cities. Calexico has a population of about 38,600 people and Mexicali had a population of about 1,025,740 people in 2015.32 This crossing connects passenger vehicles to State Route 111 and pedestrians to East 1st Street. Commercial vehicles are not permitted at this port of entry. The U.S. Bureau of Transportation Statistics reports that the annual northbound Calexico West crossing volumes (from 2015 to 2017) are as follows:
Year Personal Vehicles Trucks Buses Pedestrians
2015 4,294,156 NA NA 4,498,322 2016 4,327,034 NA NA 4,270,911 2017 4,409,648 NA NA 4,212,342
Calexico East is just over 6 miles east of the Calexico West POE, and also serves the cities of Calexico and Mexicali. This crossing connects to State Route 7 on the U.S. side, and accommodates passengers, pedestrians, and commercial vehicles (within a commercial vehicle only facility). The U.S. Bureau of Transportation Statistics reports that the annual northbound Calexico East crossing volumes (from 2015 to 2017) are as follows:
29 Instituto Nacional de Estadística y Geografía (INEGI). Dirección General de Estadísticas Sociodemográficas (Encuesta Intercensal 2015) www.inegi.org.mx 30 Pedestrians displayed is the sum of BTS crossing volumes on pedestrians and bus passengers, both of whom cross the border on foot. 31 U.S. Census Bureau, 2016 ACS 5-Year Population Estimate. 32 Instituto Nacional de Estadística y Geografía (INEGI). Dirección General de Estadísticas Sociodemográficas (Encuesta Intercensal 2015) www.inegi.org.mx
SANDAG | Impacts of Border Delays at California-Baja California Land Ports of Entry Volume 1: Background and Summary of Findings
20
Year Personal Vehicles Trucks Buses Pedestrians33
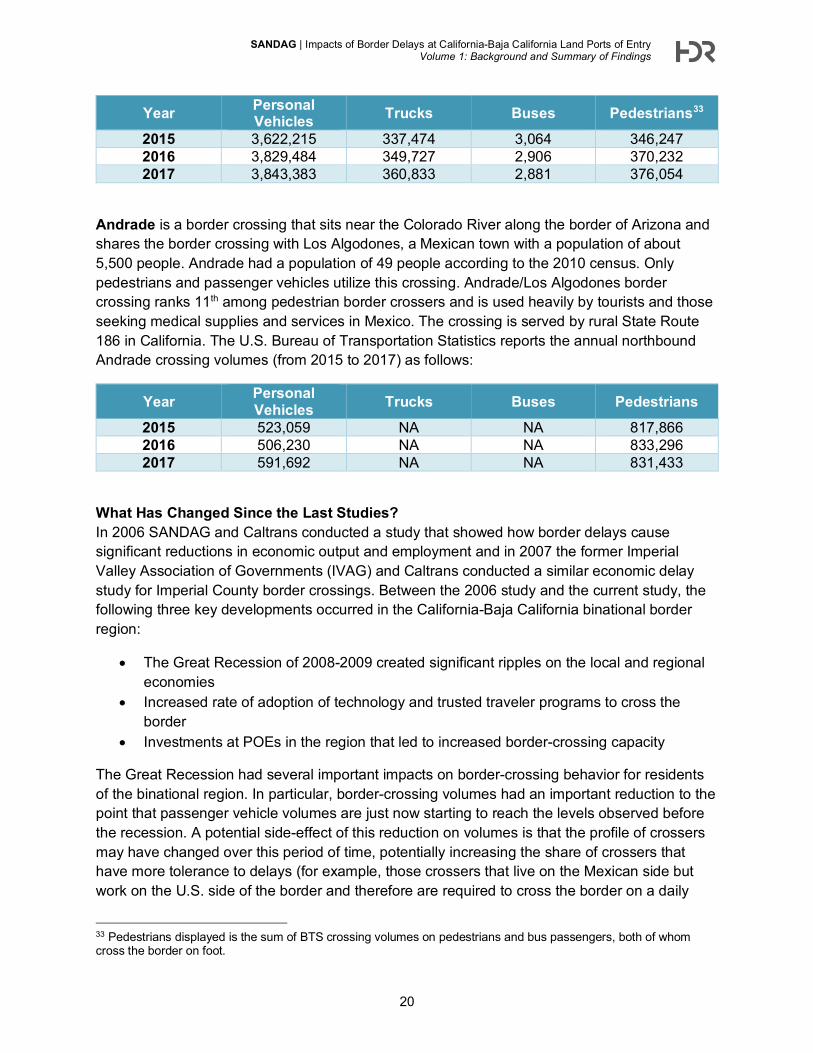
2015 3,622,215 337,474 3,064 346,247 2016 3,829,484 349,727 2,906 370,232 2017 3,843,383 360,833 2,881 376,054
Andrade is a border crossing that sits near the Colorado River along the border of Arizona and shares the border crossing with Los Algodones, a Mexican town with a population of about 5,500 people. Andrade had a population of 49 people according to the 2010 census. Only pedestrians and passenger vehicles utilize this crossing. Andrade/Los Algodones border crossing ranks 11th among pedestrian border crossers and is used heavily by tourists and those seeking medical supplies and services in Mexico. The crossing is served by rural State Route 186 in California. The U.S. Bureau of Transportation Statistics reports the annual northbound Andrade crossing volumes (from 2015 to 2017) as follows:
Year Personal Vehicles Trucks Buses Pedestrians
2015 523,059 NA NA 817,866 2016 506,230 NA NA 833,296 2017 591,692 NA NA 831,433
What Has Changed Since the Last Studies? In 2006 SANDAG and Caltrans conducted a study that showed how border delays cause significant reductions in economic output and employment and in 2007 the former Imperial Valley Association of Governments (IVAG) and Caltrans conducted a similar economic delay study for Imperial County border crossings. Between the 2006 study and the current study, the following three key developments occurred in the California-Baja California binational border region:
• The Great Recession of 2008-2009 created significant ripples on the local and regional economies
• Increased rate of adoption of technology and trusted traveler programs to cross the border
• Investments at POEs in the region that led to increased border-crossing capacity
The Great Recession had several important impacts on border-crossing behavior for residents of the binational region. In particular, border-crossing volumes had an important reduction to the point that passenger vehicle volumes are just now starting to reach the levels observed before the recession. A potential side-effect of this reduction on volumes is that the profile of crossers may have changed over this period of time, potentially increasing the share of crossers that have more tolerance to delays (for example, those crossers that live on the Mexican side but work on the U.S. side of the border and therefore are required to cross the border on a daily
33 Pedestrians displayed is the sum of BTS crossing volumes on pedestrians and bus passengers, both of whom cross the border on foot.
SANDAG | Impacts of Border Delays at California-Baja California Land Ports of Entry Volume 1: Background and Summary of Findings
21
basis). As a result of this potential shift to more delay-tolerant crossers and the fact that economic losses from delays are estimated based on survey data, the losses from delays may be perceived to be lower now than in previous years. However, it must be noted that this is no indication that the actual losses are lower than in previous years.
The increased rate of adoption of technology and trusted traveler programs has reduced the delays experienced by border crossers in the region.34 In particular, Ready Lane and SENTRI users have grown significantly between 2009 and 2017, thus reducing the passenger vehicle delays experienced at the California-Baja California POEs.35 Since these two types of vehicle crossers experience lower delays compared to General Lanes, the result has been an average reduction in delays at the region’s POEs, which in turn could be traced back to a reduction in economic losses at the regional level.
The investments at or in the immediate vicinity to the POEs in the region have led to an increase in border-crossing capacity. Some examples of specific improvements include the opening of El Chaparral at San Ysidro, the completion of SR-905 to Otay Mesa and the widening of Cesar Chavez between 2nd Street and State Route 98. These improvements have reduced average delays for both passenger vehicles and trucks in the region.
An additional change that was not listed above since it is more related to the definitions used in this analysis is that the current study relies on estimating the economic and air quality/emissions impacts of delays and not the impacts of wait times at the border. The concept of delay used in this report involved the identification, in conjunction with CBP, of “baseline” border crossing times for every lane and vehicle type at every POEs in the region that were then combined with total border-crossing measurements to develop a measure for delay. Previous studies had used measures of wait times (which based on the definition provided in this paragraph are larger than delays) to estimate economic impacts, and therefore direct comparisons between results presented on those previous studies and results from the current one are not applicable. A final consideration is that the economic relations between industries and consumers on both sides of the border may have changed over that period. This is reflected in the use of different input-output multiplier values to estimate the economic impacts of delays.36 The current efforts are, therefore, a true “fresh look” to impacts resulting from delays at the border.
Some recent events are not in the scope of the current study, which began in 2016 and has been completed in 2020. For example, uncertainty related to U.S.-Mexico trade that existed in 2018 has been resolved with the ratification of the United States-Mexico-Canada Agreement in 2020.37 Additionally, crossings at the U.S.-Mexico border have been restricted for the majority of
34 Since January of 2009, travelers using land POEs are required to have a passport to cross into the United States. 35 For example, the share of SENTRI traffic at San Ysidro grew from 18 percent to 39 percent between 2009 and 2017 and the share of SENTRI at Calexico West grew from 18 percent to 44 percent during the same timeframe. 36 IMPLAN multipliers (commercially available) were used to estimate economic impacts in the U.S. side of the border and multipliers from the Baja California Input-Output Model (developed by COLEF) were used to estimate impacts on the Mexican side of the border. IMPLAN multipliers are updated annually while the Baja California Input-Output Model was updated in 2016 (its previous update occurred in 2004). 37 United States-Mexico-Canada Agreement, https://ustr.gov/usmca. Accessed September 4, 2020.
SANDAG | Impacts of Border Delays at California-Baja California Land Ports of Entry Volume 1: Background and Summary of Findings
22
2020 due to the COVID-19 pandemic.38 However, the impacts of COVID-19 on the border are not included in this study as the pandemic began after the study data collection was completed. Although the study team acknowledges that the current economic and global health situation has impacted border crossing volumes, the current study is estimating the economic and air quality/emissions impacts in a typical border crossing dynamic.
38 Department of Homeland Security, “DHS Measures on the Border to Limit the Further Spread of Coronavirus,” https://www.dhs.gov/news/2020/08/14/fact-sheet-dhs-measures-border-limit-further-spread-coronavirus. Accessed September 4, 2020.
SANDAG | Impacts of Border Delays at California-Baja California Land Ports of Entry Volume 1: Background and Summary of Findings
23
Data Needs and Data Collection Efforts The estimation of the impacts studied as part of the Impacts of Border Delays at the California-Baja California Land Ports of Entry was done through the creation of analytical models that required a significant and varied dataset. This section outlines the data required for the study, and the steps taken to inform data collection.
Assessment of Existing “Gaps” on Border Data In 2016, early in the study effort, the Project Team created a report to identify the “data gaps” for key inputs to the economic and air quality/emissions analyses. The Project Team began by identifying the data required to conduct the assessment of economic impacts of delays at the border for the six land POEs in the California-Baja California region to perform the tasks outlined in the study. Then they combined information from a literature review with their knowledge of recent border projects to develop a table to compare the available data from recent studies with the identified data and key inputs necessary for the study. Areas where the necessary data for this study was not previously available were identified as “data gaps,” and informed the content and goals of the survey and data collection task of this study. For the more detailed data gap analysis, see Appendix A to Volume 1.
The primary data needed to conduct the assessment of economic and air quality/emissions impacts of delays at the border is organized by four categories: economic information, emissions information, border-crossing wait time information; and traffic and volume data. The following key inputs were identified.
• Economic Information o Origin-Destination o Trip purpose o Crossing frequency o Trip-related expenditure o Productivity loss due to delays o Wait time thresholds to cancel cross border trips o Border crossers’ propensity to switch modes (motorized vs. non-motorized)
• Emissions Information o Vehicle model year o Odometer reading o Fuel type o Compliance with smog testing o Country where fuel is purchased
• Border Crossing Wait Times o Wait times by vehicle type during peak and non-peak days o Queue lengths by vehicle type o Breakdown of wait time by segment of the border-crossing trip
• Traffic and Volume Data o Volume/traffic counts for passenger vehicles, trucks and pedestrians at the six
land POEs in the California-Baja California Border
SANDAG | Impacts of Border Delays at California-Baja California Land Ports of Entry Volume 1: Background and Summary of Findings
24
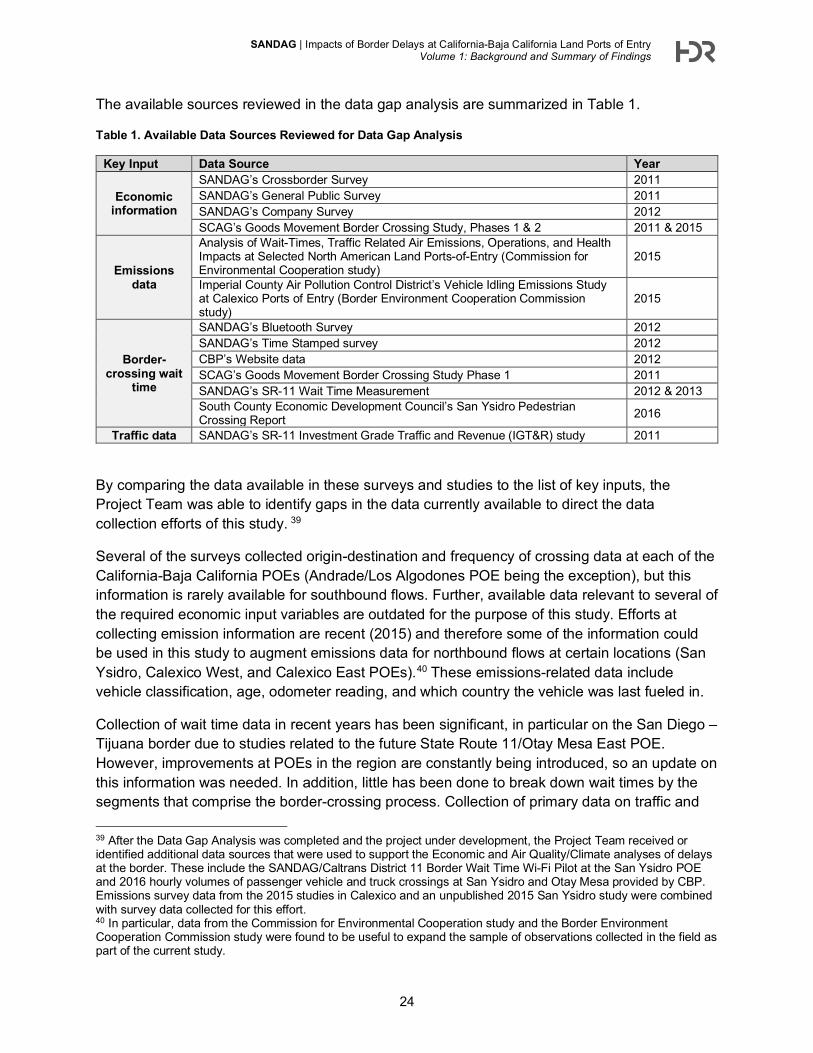
The available sources reviewed in the data gap analysis are summarized in Table 1.
Table 1. Available Data Sources Reviewed for Data Gap Analysis
Key Input Data Source Year
Economic information
SANDAG’s Crossborder Survey 2011 SANDAG’s General Public Survey 2011 SANDAG’s Company Survey 2012 SCAG’s Goods Movement Border Crossing Study, Phases 1 & 2 2011 & 2015
Emissions data
Analysis of Wait-Times, Traffic Related Air Emissions, Operations, and Health Impacts at Selected North American Land Ports-of-Entry (Commission for Environmental Cooperation study)
2015
Imperial County Air Pollution Control District’s Vehicle Idling Emissions Study at Calexico Ports of Entry (Border Environment Cooperation Commission study)
2015
Border-crossing wait
time
SANDAG’s Bluetooth Survey 2012 SANDAG’s Time Stamped survey 2012 CBP’s Website data 2012 SCAG’s Goods Movement Border Crossing Study Phase 1 2011 SANDAG’s SR-11 Wait Time Measurement 2012 & 2013 South County Economic Development Council’s San Ysidro Pedestrian Crossing Report 2016
Traffic data SANDAG’s SR-11 Investment Grade Traffic and Revenue (IGT&R) study 2011
By comparing the data available in these surveys and studies to the list of key inputs, the Project Team was able to identify gaps in the data currently available to direct the data collection efforts of this study. 39
Several of the surveys collected origin-destination and frequency of crossing data at each of the California-Baja California POEs (Andrade/Los Algodones POE being the exception), but this information is rarely available for southbound flows. Further, available data relevant to several of the required economic input variables are outdated for the purpose of this study. Efforts at collecting emission information are recent (2015) and therefore some of the information could be used in this study to augment emissions data for northbound flows at certain locations (San Ysidro, Calexico West, and Calexico East POEs).40 These emissions-related data include vehicle classification, age, odometer reading, and which country the vehicle was last fueled in.
Collection of wait time data in recent years has been significant, in particular on the San Diego – Tijuana border due to studies related to the future State Route 11/Otay Mesa East POE. However, improvements at POEs in the region are constantly being introduced, so an update on this information was needed. In addition, little has been done to break down wait times by the segments that comprise the border-crossing process. Collection of primary data on traffic and
39 After the Data Gap Analysis was completed and the project under development, the Project Team received or identified additional data sources that were used to support the Economic and Air Quality/Climate analyses of delays at the border. These include the SANDAG/Caltrans District 11 Border Wait Time Wi-Fi Pilot at the San Ysidro POE and 2016 hourly volumes of passenger vehicle and truck crossings at San Ysidro and Otay Mesa provided by CBP. Emissions survey data from the 2015 studies in Calexico and an unpublished 2015 San Ysidro study were combined with survey data collected for this effort. 40 In particular, data from the Commission for Environmental Cooperation study and the Border Environment Cooperation Commission study were found to be useful to expand the sample of observations collected in the field as part of the current study.
SANDAG | Impacts of Border Delays at California-Baja California Land Ports of Entry Volume 1: Background and Summary of Findings
25
volume data is not as prevalent as that for wait times (there is one study conducted by SANDAG that collected such data), but this is not surprising due to the availability of secondary sources such as CBP, Caltrans Performance Measurement System (PeMS) and BTS on traffic volumes and border-crossing trips.
As a result, data collection efforts were focused on information reflecting the economic behavior of northbound and southbound crossers, emission information at POEs for which there is no available emission data, as well as wait times that represent base year conditions at the border. More specifically, the following information was identified and used to inform the primary data collection effort of this study:
• Economic information o Trip purpose o Expenditure categories and amounts o Degree of expenditure substitution between the two countries o Impact of delays on productivity o Wait time thresholds for cancelling border-crossing trips
• Emission information o Vehicle age o Class o Odometer o Domicile o Certification standards o Fuel type/source o Participation in vehicle emission inspection and maintenance programs
• Border Wait Times o Wait times by vehicle type (passenger vehicles and trucks) during peak and non-
peak days o Queue lengths by vehicle type o Breakdown of wait time by segment of the border-crossing trip
• Traffic and volume data o Vehicle occupancy
The necessary economic and emission information and vehicle occupancy data above was used to formulate and was ultimately gathered through the Economic Impact Survey instrument and the Greenhouse Gas (GHG)/Air Emission Survey instrument. The Economic Impact Survey and the GHG/Air Emission Survey, together with the CBX survey, are collectively referred to as the SANDAG Border Survey dataset. More information on the data collection efforts and results from the SANDAG Border Survey is detailed in the subsequent sections (see Data Collection Plans: At-Border Survey Methodology and Plan and Overview of Data Collection Efforts: The SANDAG Border Survey, At-Border Survey). Information on border wait times identified above was gathered through the Border Wait Time data collection. Details on this effort are presented in the Border Wait Time Data Collection Methodology section and the Measuring Border Wait Time section of this report. The Project Team used the available secondary sources for traffic and volume data as much as possible to limit the primary data collection efforts to inputs that
SANDAG | Impacts of Border Delays at California-Baja California Land Ports of Entry Volume 1: Background and Summary of Findings
26
were unavailable elsewhere. In addition, the Project Team also performed economic outreach surveys to businesses in the Cali – Baja region as part of the Economic Impact Analysis. An overview of the effort and results are presented in Volume 2.
Data Collection Methods The data collection methods and efforts of Project Team member Crossborder Group, undertaken as part of the study, are summarized below. These include all components of the SANDAG Border Survey, as well as the border crossing and wait times data collection efforts. In the case of the survey work, two survey instruments (the Economic Impact Survey and the GHG/Air Emission Survey) were used to collect information necessary to assess the economic and air quality/emissions impacts of delays at the border (which was identified in the assessment of data “gaps”).
The data collection approach and survey instruments were developed by the Project Team to maintain consistency with previous SANDAG and ICTC efforts (including the 2006 study), while addressing several new factors, including border wait time and queue data, inputs to air emission modeling, and regional changes in border infrastructure.
AT-BORDER SURVEY METHODOLOGY AND PLAN The sampling goals developed for both components of the SANDAG Border Survey (i.e., the Economic Impact component and the GHG/Air Emission component) are summarized below. Ultimately, the survey sampling goals for each component were exceeded.
In order to adequately survey the broad range of crossers along the California-Baja California border by geography, mode (privately-owned vehicle or POV, pedestrian, or commercial), and lane type (General, Ready, SENTRI; or, for commercial crossings, FAST or Free and Secure Trade, Regular and Empty), each population was divided into groups – or clusters. For purposes of this study, the first-stage cluster was essentially the POE; the second-stage cluster was the mode or vehicle type; and the third-stage cluster was the lane or classification type (when applicable). The Project Team’s goal was to ensure the core sampling selection remained consistent with past at-border surveys undertaken by SANDAG and others. In all clusters, each survey target was sampled in a similar fashion to increase randomization, avoid potential survey bias (as much as possible), and increase surveying efficiency.
The survey sampling goals were informed by the volume of border crossings between California and Baja California in 2015, as well as the various modes and types of lanes at each POE (when applicable). Initial sample sizes that are proportional to border crossing levels at low-volume POEs were adjusted to ensure a minimum level of statistical validity. The adjusted sampling goals (those adjusted to meet statistical validity) for the Economic Impact Survey and the GHG/Air Emission Survey are summarized in Table 2 through Table 5.
SANDAG | Impacts of Border Delays at California-Baja California Land Ports of Entry Volume 1: Background and Summary of Findings
27
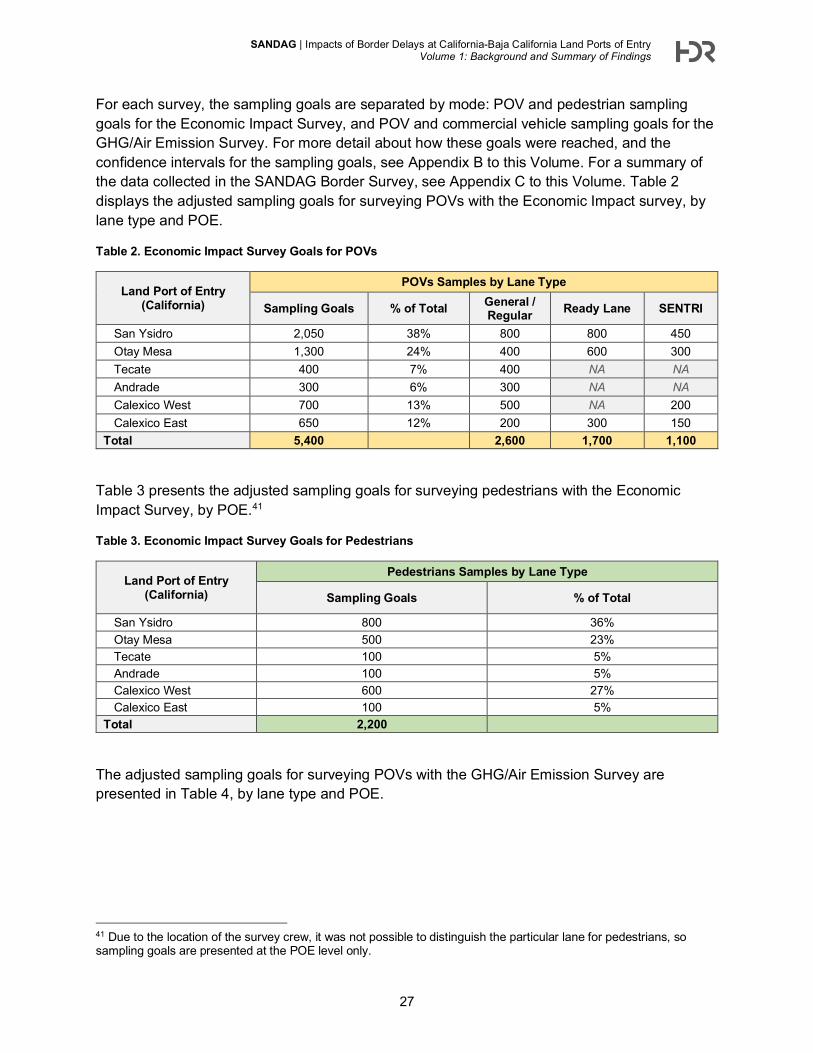
For each survey, the sampling goals are separated by mode: POV and pedestrian sampling goals for the Economic Impact Survey, and POV and commercial vehicle sampling goals for the GHG/Air Emission Survey. For more detail about how these goals were reached, and the confidence intervals for the sampling goals, see Appendix B to this Volume. For a summary of the data collected in the SANDAG Border Survey, see Appendix C to this Volume. Table 2 displays the adjusted sampling goals for surveying POVs with the Economic Impact survey, by lane type and POE.
Table 2. Economic Impact Survey Goals for POVs
Land Port of Entry (California)
POVs Samples by Lane Type
Sampling Goals % of Total General / Regular Ready Lane SENTRI
San Ysidro 2,050 38% 800 800 450 Otay Mesa 1,300 24% 400 600 300 Tecate 400 7% 400 NA NA Andrade 300 6% 300 NA NA Calexico West 700 13% 500 NA 200 Calexico East 650 12% 200 300 150
Total 5,400 2,600 1,700 1,100
Table 3 presents the adjusted sampling goals for surveying pedestrians with the Economic Impact Survey, by POE.41
Table 3. Economic Impact Survey Goals for Pedestrians
Land Port of Entry (California)
Pedestrians Samples by Lane Type
Sampling Goals % of Total
San Ysidro 800 36% Otay Mesa 500 23% Tecate 100 5% Andrade 100 5% Calexico West 600 27% Calexico East 100 5%
Total 2,200
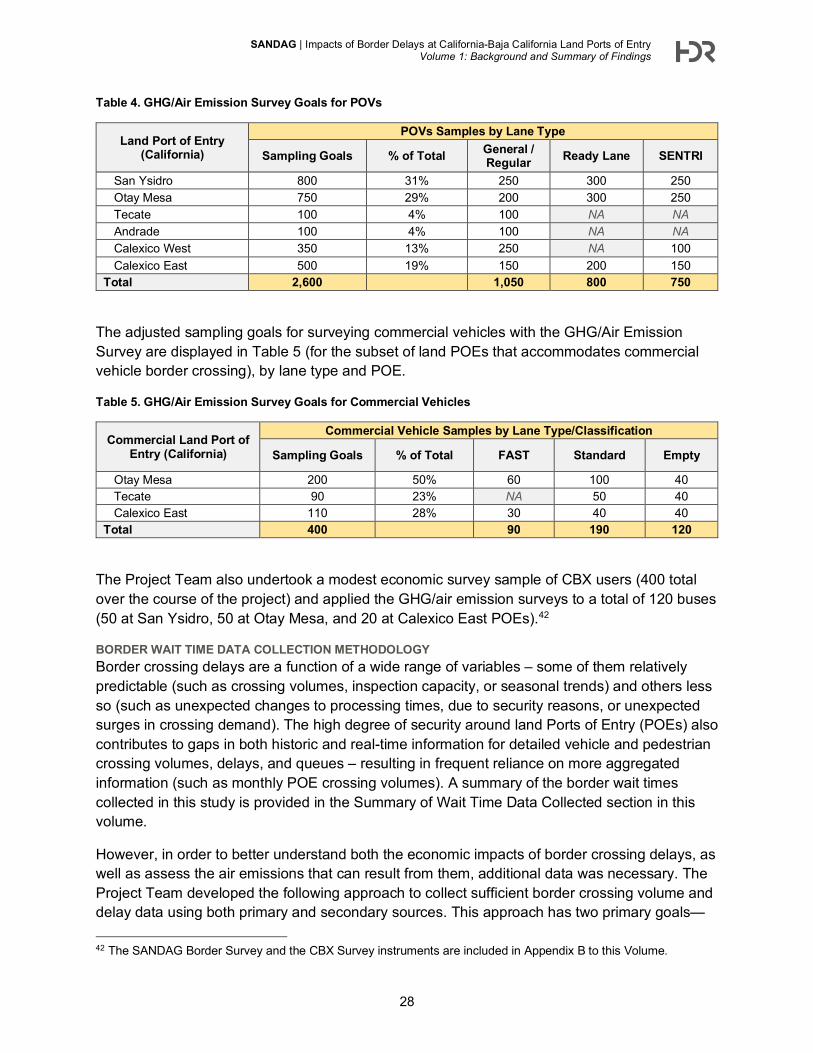
The adjusted sampling goals for surveying POVs with the GHG/Air Emission Survey are presented in Table 4, by lane type and POE.
41 Due to the location of the survey crew, it was not possible to distinguish the particular lane for pedestrians, so sampling goals are presented at the POE level only.
SANDAG | Impacts of Border Delays at California-Baja California Land Ports of Entry Volume 1: Background and Summary of Findings
28
Table 4. GHG/Air Emission Survey Goals for POVs
Land Port of Entry (California)
POVs Samples by Lane Type
Sampling Goals % of Total General / Regular Ready Lane SENTRI
San Ysidro 800 31% 250 300 250 Otay Mesa 750 29% 200 300 250 Tecate 100 4% 100 NA NA Andrade 100 4% 100 NA NA Calexico West 350 13% 250 NA 100 Calexico East 500 19% 150 200 150
Total 2,600 1,050 800 750
The adjusted sampling goals for surveying commercial vehicles with the GHG/Air Emission Survey are displayed in Table 5 (for the subset of land POEs that accommodates commercial vehicle border crossing), by lane type and POE.
Table 5. GHG/Air Emission Survey Goals for Commercial Vehicles
Commercial Land Port of Entry (California)
Commercial Vehicle Samples by Lane Type/Classification
Sampling Goals % of Total FAST Standard Empty
Otay Mesa 200 50% 60 100 40 Tecate 90 23% NA 50 40 Calexico East 110 28% 30 40 40
Total 400 90 190 120
The Project Team also undertook a modest economic survey sample of CBX users (400 total over the course of the project) and applied the GHG/air emission surveys to a total of 120 buses (50 at San Ysidro, 50 at Otay Mesa, and 20 at Calexico East POEs).42
BORDER WAIT TIME DATA COLLECTION METHODOLOGY Border crossing delays are a function of a wide range of variables – some of them relatively predictable (such as crossing volumes, inspection capacity, or seasonal trends) and others less so (such as unexpected changes to processing times, due to security reasons, or unexpected surges in crossing demand). The high degree of security around land Ports of Entry (POEs) also contributes to gaps in both historic and real-time information for detailed vehicle and pedestrian crossing volumes, delays, and queues – resulting in frequent reliance on more aggregated information (such as monthly POE crossing volumes). A summary of the border wait times collected in this study is provided in the Summary of Wait Time Data Collected section in this volume.
However, in order to better understand both the economic impacts of border crossing delays, as well as assess the air emissions that can result from them, additional data was necessary. The Project Team developed the following approach to collect sufficient border crossing volume and delay data using both primary and secondary sources. This approach has two primary goals—
42 The SANDAG Border Survey and the CBX Survey instruments are included in Appendix B to this Volume.
SANDAG | Impacts of Border Delays at California-Baja California Land Ports of Entry Volume 1: Background and Summary of Findings
29
the collection of sufficient border crosser volume and delay data to quantify economic impacts of border delay, and the estimation of annual air emission impacts of border delay.
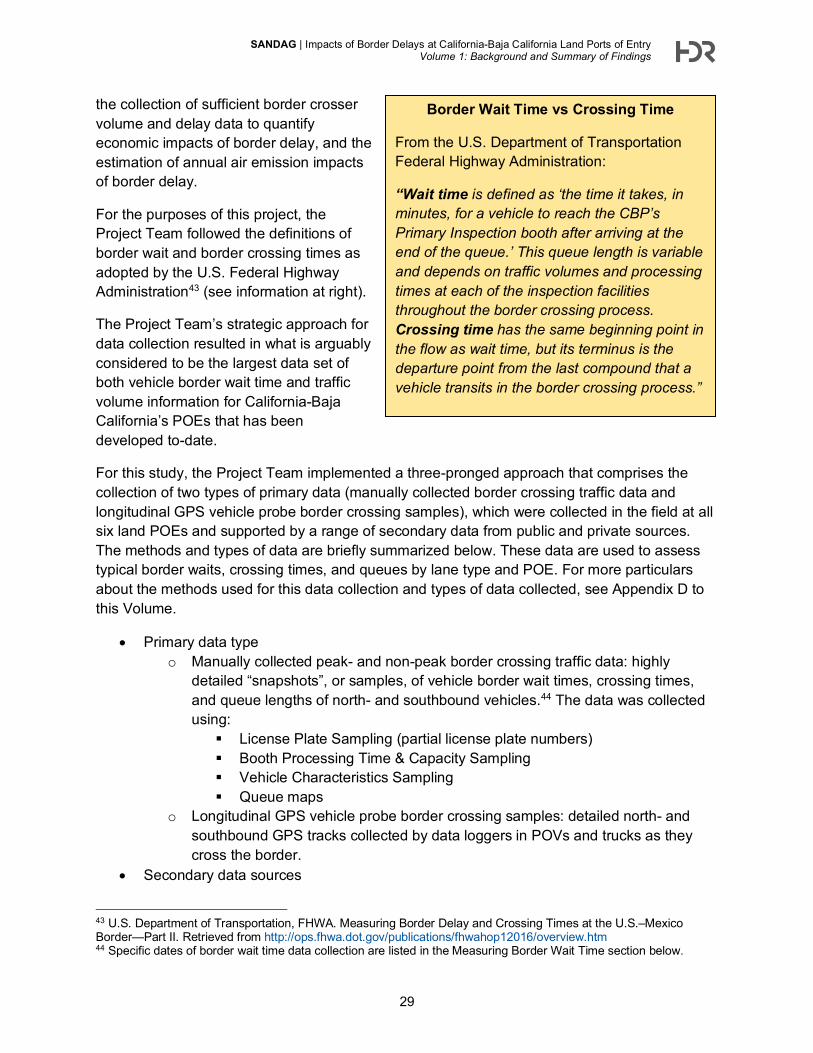
For the purposes of this project, the Project Team followed the definitions of border wait and border crossing times as adopted by the U.S. Federal Highway Administration43 (see information at right).
The Project Team’s strategic approach for data collection resulted in what is arguably considered to be the largest data set of both vehicle border wait time and traffic volume information for California-Baja California’s POEs that has been developed to-date.
For this study, the Project Team implemented a three-pronged approach that comprises the collection of two types of primary data (manually collected border crossing traffic data and longitudinal GPS vehicle probe border crossing samples), which were collected in the field at all six land POEs and supported by a range of secondary data from public and private sources. The methods and types of data are briefly summarized below. These data are used to assess typical border waits, crossing times, and queues by lane type and POE. For more particulars about the methods used for this data collection and types of data collected, see Appendix D to this Volume.
• Primary data type o Manually collected peak- and non-peak border crossing traffic data: highly
detailed “snapshots”, or samples, of vehicle border wait times, crossing times, and queue lengths of north- and southbound vehicles.44 The data was collected using: License Plate Sampling (partial license plate numbers) Booth Processing Time & Capacity Sampling Vehicle Characteristics Sampling Queue maps
o Longitudinal GPS vehicle probe border crossing samples: detailed north- and southbound GPS tracks collected by data loggers in POVs and trucks as they cross the border.
• Secondary data sources
43 U.S. Department of Transportation, FHWA. Measuring Border Delay and Crossing Times at the U.S.–Mexico Border—Part II. Retrieved from http://ops.fhwa.dot.gov/publications/fhwahop12016/overview.htm 44 Specific dates of border wait time data collection are listed in the Measuring Border Wait Time section below.
Border Wait Time vs Crossing Time
From the U.S. Department of Transportation Federal Highway Administration:
“Wait time is defined as ‘the time it takes, in minutes, for a vehicle to reach the CBP’s Primary Inspection booth after arriving at the end of the queue.’ This queue length is variable and depends on traffic volumes and processing times at each of the inspection facilities throughout the border crossing process. Crossing time has the same beginning point in the flow as wait time, but its terminus is the departure point from the last compound that a vehicle transits in the border crossing process.”
SANDAG | Impacts of Border Delays at California-Baja California Land Ports of Entry Volume 1: Background and Summary of Findings
30
o CBP/USDOT Northbound Border Crossing Data (BTS) o North- and southbound PeMS Traffic Data (Caltrans)
Overview of Data Collection Efforts The result of implementing the above-described data collection methodologies led to arguably the most comprehensive dataset of border-crossing behavior across the entire California-Baja California border region. An overview of the datasets is presented below, broken down by the two primary data collection activities (i.e., the at-border survey work and the wait time measurements).
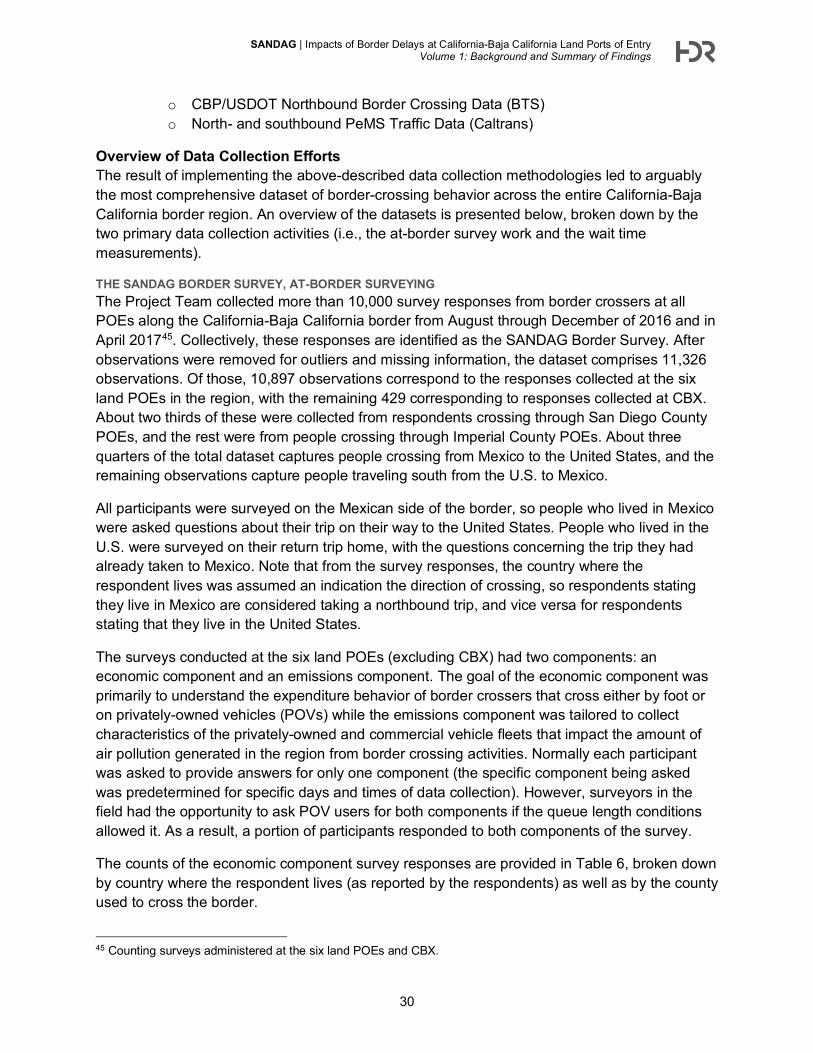
THE SANDAG BORDER SURVEY, AT-BORDER SURVEYING The Project Team collected more than 10,000 survey responses from border crossers at all POEs along the California-Baja California border from August through December of 2016 and in April 201745. Collectively, these responses are identified as the SANDAG Border Survey. After observations were removed for outliers and missing information, the dataset comprises 11,326 observations. Of those, 10,897 observations correspond to the responses collected at the six land POEs in the region, with the remaining 429 corresponding to responses collected at CBX. About two thirds of these were collected from respondents crossing through San Diego County POEs, and the rest were from people crossing through Imperial County POEs. About three quarters of the total dataset captures people crossing from Mexico to the United States, and the remaining observations capture people traveling south from the U.S. to Mexico.
All participants were surveyed on the Mexican side of the border, so people who lived in Mexico were asked questions about their trip on their way to the United States. People who lived in the U.S. were surveyed on their return trip home, with the questions concerning the trip they had already taken to Mexico. Note that from the survey responses, the country where the respondent lives was assumed an indication the direction of crossing, so respondents stating they live in Mexico are considered taking a northbound trip, and vice versa for respondents stating that they live in the United States.
The surveys conducted at the six land POEs (excluding CBX) had two components: an economic component and an emissions component. The goal of the economic component was primarily to understand the expenditure behavior of border crossers that cross either by foot or on privately-owned vehicles (POVs) while the emissions component was tailored to collect characteristics of the privately-owned and commercial vehicle fleets that impact the amount of air pollution generated in the region from border crossing activities. Normally each participant was asked to provide answers for only one component (the specific component being asked was predetermined for specific days and times of data collection). However, surveyors in the field had the opportunity to ask POV users for both components if the queue length conditions allowed it. As a result, a portion of participants responded to both components of the survey.
The counts of the economic component survey responses are provided in Table 6, broken down by country where the respondent lives (as reported by the respondents) as well as by the county used to cross the border.
45 Counting surveys administered at the six land POEs and CBX.
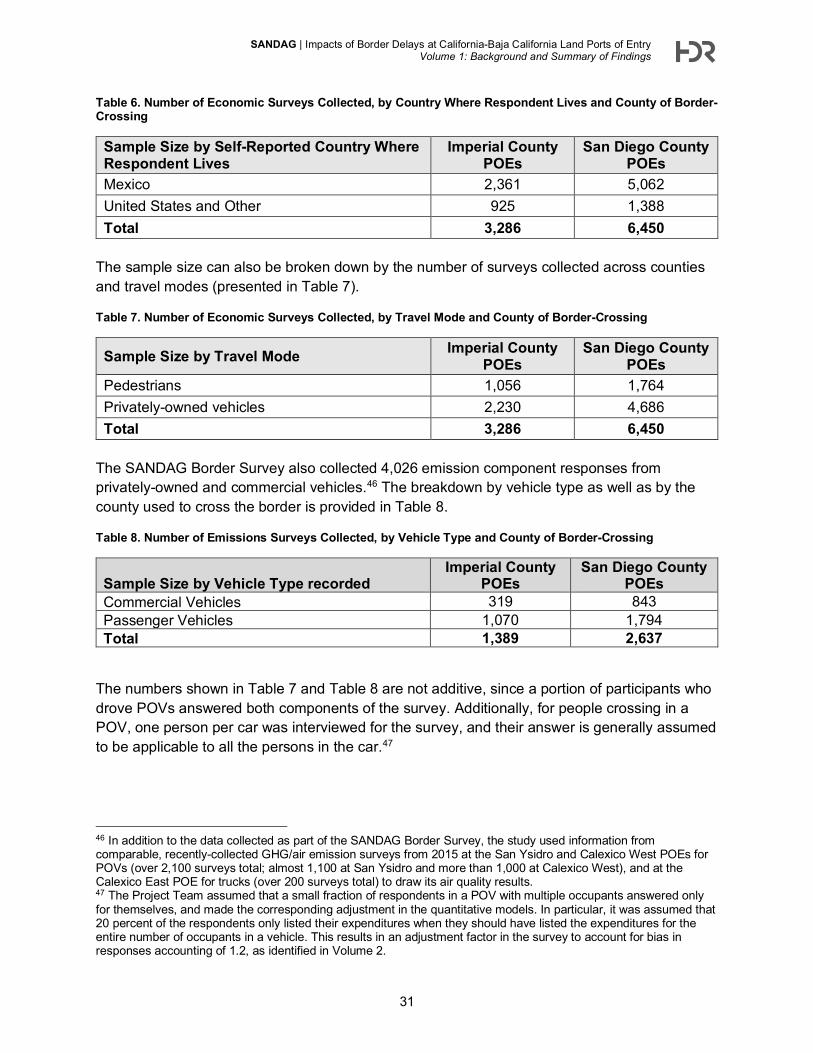
SANDAG | Impacts of Border Delays at California-Baja California Land Ports of Entry Volume 1: Background and Summary of Findings
31
Table 6. Number of Economic Surveys Collected, by Country Where Respondent Lives and County of Border-Crossing
Sample Size by Self-Reported Country Where Respondent Lives
Imperial County POEs
San Diego County POEs
Mexico 2,361 5,062 United States and Other 925 1,388 Total 3,286 6,450
The sample size can also be broken down by the number of surveys collected across counties and travel modes (presented in Table 7).
Table 7. Number of Economic Surveys Collected, by Travel Mode and County of Border-Crossing
Sample Size by Travel Mode Imperial County POEs
San Diego County POEs
Pedestrians 1,056 1,764 Privately-owned vehicles 2,230 4,686 Total 3,286 6,450
The SANDAG Border Survey also collected 4,026 emission component responses from privately-owned and commercial vehicles.46 The breakdown by vehicle type as well as by the county used to cross the border is provided in Table 8.
Table 8. Number of Emissions Surveys Collected, by Vehicle Type and County of Border-Crossing
Sample Size by Vehicle Type recorded Imperial County
POEs San Diego County
POEs Commercial Vehicles 319 843 Passenger Vehicles 1,070 1,794 Total 1,389 2,637
The numbers shown in Table 7 and Table 8 are not additive, since a portion of participants who drove POVs answered both components of the survey. Additionally, for people crossing in a POV, one person per car was interviewed for the survey, and their answer is generally assumed to be applicable to all the persons in the car.47
46 In addition to the data collected as part of the SANDAG Border Survey, the study used information from comparable, recently-collected GHG/air emission surveys from 2015 at the San Ysidro and Calexico West POEs for POVs (over 2,100 surveys total; almost 1,100 at San Ysidro and more than 1,000 at Calexico West), and at the Calexico East POE for trucks (over 200 surveys total) to draw its air quality results. 47 The Project Team assumed that a small fraction of respondents in a POV with multiple occupants answered only for themselves, and made the corresponding adjustment in the quantitative models. In particular, it was assumed that 20 percent of the respondents only listed their expenditures when they should have listed the expenditures for the entire number of occupants in a vehicle. This results in an adjustment factor in the survey to account for bias in responses accounting of 1.2, as identified in Volume 2.
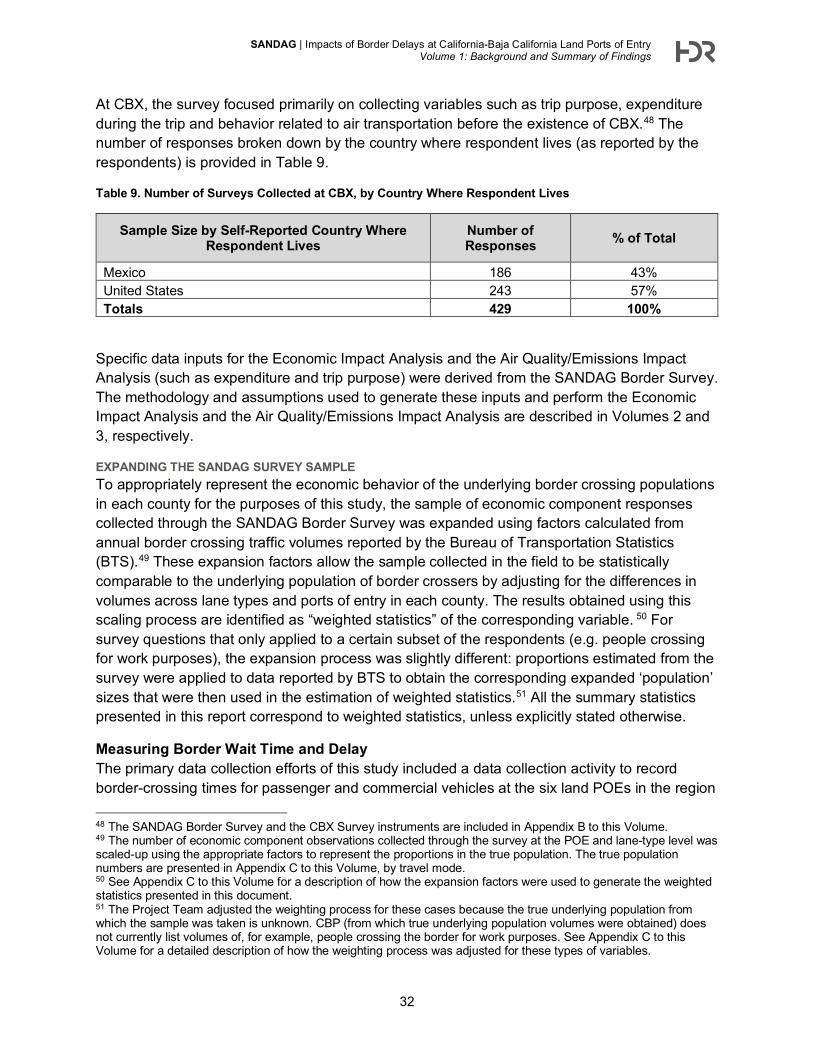
SANDAG | Impacts of Border Delays at California-Baja California Land Ports of Entry Volume 1: Background and Summary of Findings
32
At CBX, the survey focused primarily on collecting variables such as trip purpose, expenditure during the trip and behavior related to air transportation before the existence of CBX.48 The number of responses broken down by the country where respondent lives (as reported by the respondents) is provided in Table 9.
Table 9. Number of Surveys Collected at CBX, by Country Where Respondent Lives
Sample Size by Self-Reported Country Where Respondent Lives
Number of Responses % of Total
Mexico 186 43% United States 243 57% Totals 429 100%
Specific data inputs for the Economic Impact Analysis and the Air Quality/Emissions Impact Analysis (such as expenditure and trip purpose) were derived from the SANDAG Border Survey. The methodology and assumptions used to generate these inputs and perform the Economic Impact Analysis and the Air Quality/Emissions Impact Analysis are described in Volumes 2 and 3, respectively.
EXPANDING THE SANDAG SURVEY SAMPLE To appropriately represent the economic behavior of the underlying border crossing populations in each county for the purposes of this study, the sample of economic component responses collected through the SANDAG Border Survey was expanded using factors calculated from annual border crossing traffic volumes reported by the Bureau of Transportation Statistics (BTS).49 These expansion factors allow the sample collected in the field to be statistically comparable to the underlying population of border crossers by adjusting for the differences in volumes across lane types and ports of entry in each county. The results obtained using this scaling process are identified as “weighted statistics” of the corresponding variable. 50 For survey questions that only applied to a certain subset of the respondents (e.g. people crossing for work purposes), the expansion process was slightly different: proportions estimated from the survey were applied to data reported by BTS to obtain the corresponding expanded ‘population’ sizes that were then used in the estimation of weighted statistics.51 All the summary statistics presented in this report correspond to weighted statistics, unless explicitly stated otherwise.
Measuring Border Wait Time and Delay The primary data collection efforts of this study included a data collection activity to record border-crossing times for passenger and commercial vehicles at the six land POEs in the region
48 The SANDAG Border Survey and the CBX Survey instruments are included in Appendix B to this Volume. 49 The number of economic component observations collected through the survey at the POE and lane-type level was scaled-up using the appropriate factors to represent the proportions in the true population. The true population numbers are presented in Appendix C to this Volume, by travel mode. 50 See Appendix C to this Volume for a description of how the expansion factors were used to generate the weighted statistics presented in this document. 51 The Project Team adjusted the weighting process for these cases because the true underlying population from which the sample was taken is unknown. CBP (from which true underlying population volumes were obtained) does not currently list volumes of, for example, people crossing the border for work purposes. See Appendix C to this Volume for a detailed description of how the weighting process was adjusted for these types of variables.
SANDAG | Impacts of Border Delays at California-Baja California Land Ports of Entry Volume 1: Background and Summary of Findings
33
(separate from the SANDAG Border Survey discussed above).52 The Project Team recorded data on border-crossing time and used it to derive measures for “baseline” crossing time and delays at crossing for both passenger vehicles and commercial vehicles at all six land POEs in the study area.53
For passenger vehicles, measurements of border-crossing time were conducted at all land POEs during the following days: July 1, 4, and 5 and October 16 and 17, 2016, amounting to five days at each POE in total. For commercial vehicles, the measurements were conducted also during five days at each POE on the following days: October 12, 13, and 14 (Tecate POE), October 19, 20, and 21, 2016 (Calexico East POE) and February 10, 13, and 14, 2017 (Otay Mesa POE), March 1 and 2, 2017 (Calexico East and Tecate POEs), March 8 and 9, 2017 (Otay Mesa POE). A summary of the results for this activity is presented in this section and is a key input to the both the Economic Impact and the Air Quality Analyses.
The data collection effort included collecting more than 12,000 observations on border crossing times for passenger vehicles using the General Purpose, Ready Lanes and SENTRI lanes for northbound trips and a representative general lane for southbound trips across all six land POEs in the region.54 It also included collecting more than 3,700 observations on border crossing times for commercial vehicles using the Regular and FAST lanes for northbound trips and a representative general lane for southbound trips for those POEs that handle commercial vehicle traffic.55 At the same time, the effort included collecting information on more than 120 crossings using GPS loggers to accurately capture the border crossing time for passenger vehicles across the San Ysidro, Otay Mesa, Calexico East and Calexico West POEs.
The information on border-crossing times collected in the field was used to define a “baseline” border-crossing time that represents an “acceptable time” that vehicles need to undergo in order to cross the border. To do this, a statistical analysis of the total border crossing dataset was used to identify percentiles in the data that would appropriately represent this “acceptable” crossing time. The specific percentiles were discussed with CPB staff to determine good representations of acceptable border-crossing times at each POE and lane type.
The identification of a baseline border-crossing time for passenger and commercial vehicles allows for the estimation of average delay times for each lane type at each POE. Average delay is calculated by subtracting the baseline crossing time from the average border-crossing time for each corresponding lane type and POE.
SUMMARY OF WAIT TIME DATA COLLECTED The average border-crossing times, baseline border-crossing times, and resulting average delays at the border for passenger vehicles are presented in Table 10, by POE and lane type
52 Border crossing time was measured for these vehicles using a time-stamp methodology (with one observer placed on one side of the border where vehicles queue and another one at the exit of the Federal inspection complex at the other side of the border). See Appendix B to this Volume for a full description of the methodology. 53 The concept of delays at the border is a slight departure from the concept of wait time introduced earlier in this report. This study focuses on the estimation of economic and air quality impacts as a result of delays at the border. 54 The method used to collect POV border crossing time is license plate sampling (last 5-digits of a license plate at the beginning of the queue and at the exit of the border crossing compound) as described in the Border-Crossing Wait Time Data Collection Methodology section of this report. 55 The method used to collect truck total crossing data is the same as that used for POVs.
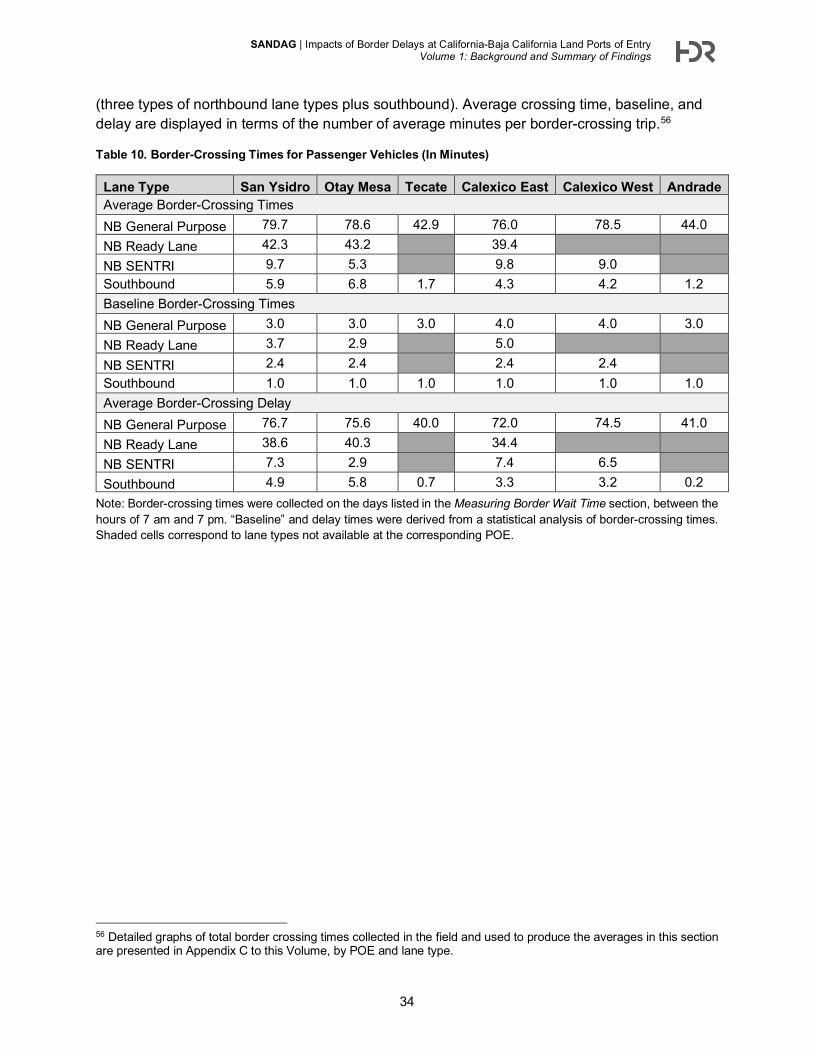
SANDAG | Impacts of Border Delays at California-Baja California Land Ports of Entry Volume 1: Background and Summary of Findings
34
(three types of northbound lane types plus southbound). Average crossing time, baseline, and delay are displayed in terms of the number of average minutes per border-crossing trip.56
Table 10. Border-Crossing Times for Passenger Vehicles (In Minutes)
Lane Type San Ysidro Otay Mesa Tecate Calexico East Calexico West Andrade Average Border-Crossing Times NB General Purpose 79.7 78.6 42.9 76.0 78.5 44.0 NB Ready Lane 42.3 43.2 39.4
NB SENTRI 9.7 5.3 9.8 9.0
Southbound 5.9 6.8 1.7 4.3 4.2 1.2 Baseline Border-Crossing Times NB General Purpose 3.0 3.0 3.0 4.0 4.0 3.0 NB Ready Lane 3.7 2.9 5.0 NB SENTRI 2.4 2.4 2.4 2.4 Southbound 1.0 1.0 1.0 1.0 1.0 1.0 Average Border-Crossing Delay NB General Purpose 76.7 75.6 40.0 72.0 74.5 41.0 NB Ready Lane 38.6 40.3 34.4 NB SENTRI 7.3 2.9 7.4 6.5 Southbound 4.9 5.8 0.7 3.3 3.2 0.2
Note: Border-crossing times were collected on the days listed in the Measuring Border Wait Time section, between the hours of 7 am and 7 pm. “Baseline” and delay times were derived from a statistical analysis of border-crossing times. Shaded cells correspond to lane types not available at the corresponding POE.
56 Detailed graphs of total border crossing times collected in the field and used to produce the averages in this section are presented in Appendix C to this Volume, by POE and lane type.
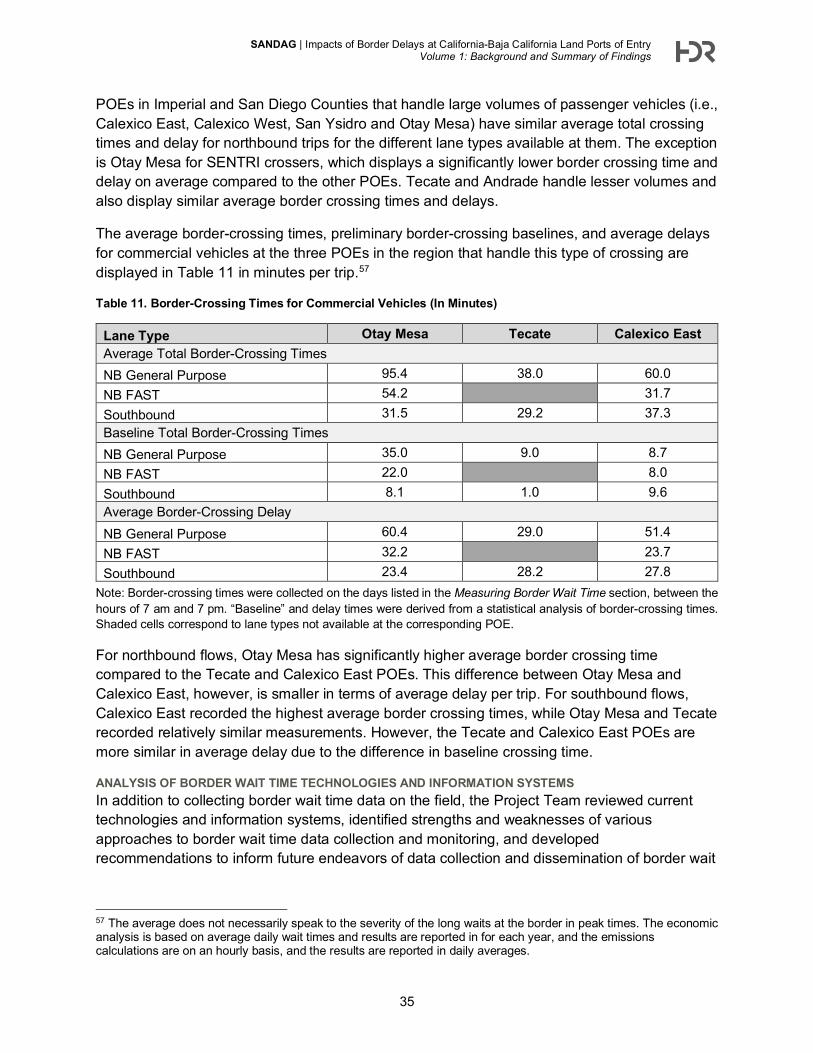
SANDAG | Impacts of Border Delays at California-Baja California Land Ports of Entry Volume 1: Background and Summary of Findings
35
POEs in Imperial and San Diego Counties that handle large volumes of passenger vehicles (i.e., Calexico East, Calexico West, San Ysidro and Otay Mesa) have similar average total crossing times and delay for northbound trips for the different lane types available at them. The exception is Otay Mesa for SENTRI crossers, which displays a significantly lower border crossing time and delay on average compared to the other POEs. Tecate and Andrade handle lesser volumes and also display similar average border crossing times and delays.
The average border-crossing times, preliminary border-crossing baselines, and average delays for commercial vehicles at the three POEs in the region that handle this type of crossing are displayed in Table 11 in minutes per trip.57
Table 11. Border-Crossing Times for Commercial Vehicles (In Minutes)
Lane Type Otay Mesa Tecate Calexico East Average Total Border-Crossing Times NB General Purpose 95.4 38.0 60.0 NB FAST 54.2 31.7 Southbound 31.5 29.2 37.3 Baseline Total Border-Crossing Times NB General Purpose 35.0 9.0 8.7 NB FAST 22.0 8.0 Southbound 8.1 1.0 9.6 Average Border-Crossing Delay NB General Purpose 60.4 29.0 51.4 NB FAST 32.2 23.7 Southbound 23.4 28.2 27.8
Note: Border-crossing times were collected on the days listed in the Measuring Border Wait Time section, between the hours of 7 am and 7 pm. “Baseline” and delay times were derived from a statistical analysis of border-crossing times. Shaded cells correspond to lane types not available at the corresponding POE.
For northbound flows, Otay Mesa has significantly higher average border crossing time compared to the Tecate and Calexico East POEs. This difference between Otay Mesa and Calexico East, however, is smaller in terms of average delay per trip. For southbound flows, Calexico East recorded the highest average border crossing times, while Otay Mesa and Tecate recorded relatively similar measurements. However, the Tecate and Calexico East POEs are more similar in average delay due to the difference in baseline crossing time.
ANALYSIS OF BORDER WAIT TIME TECHNOLOGIES AND INFORMATION SYSTEMS In addition to collecting border wait time data on the field, the Project Team reviewed current technologies and information systems, identified strengths and weaknesses of various approaches to border wait time data collection and monitoring, and developed recommendations to inform future endeavors of data collection and dissemination of border wait
57 The average does not necessarily speak to the severity of the long waits at the border in peak times. The economic analysis is based on average daily wait times and results are reported in for each year, and the emissions calculations are on an hourly basis, and the results are reported in daily averages.
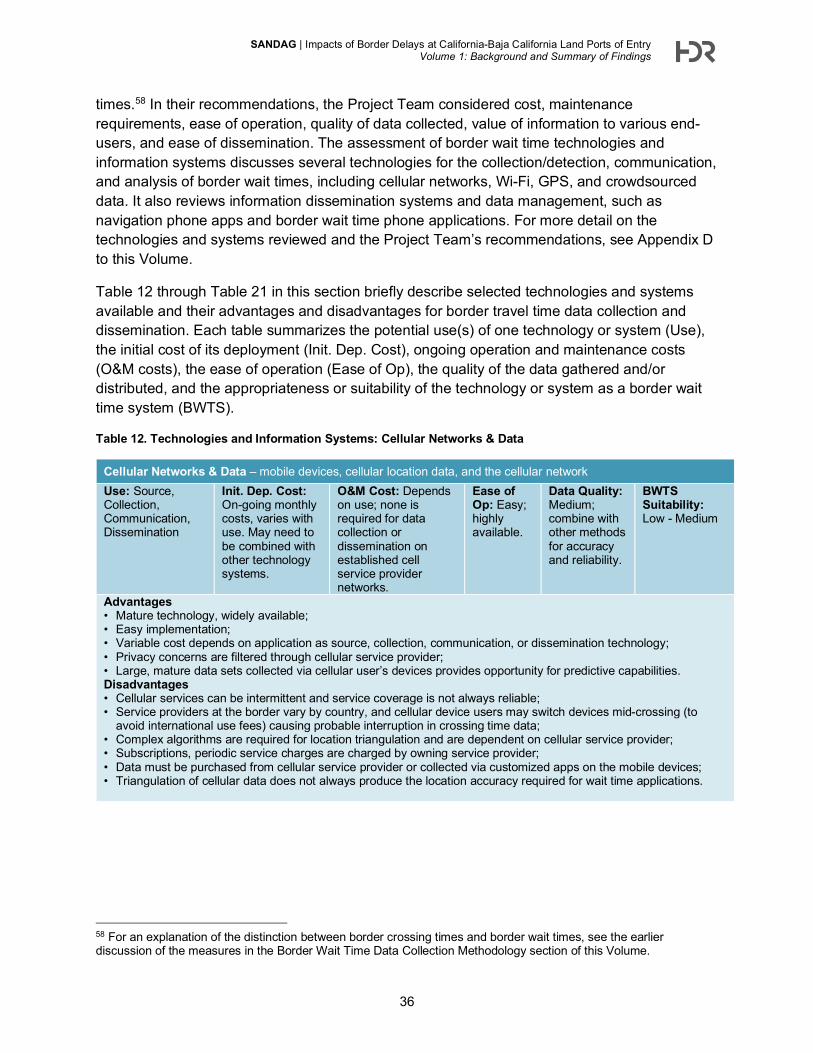
SANDAG | Impacts of Border Delays at California-Baja California Land Ports of Entry Volume 1: Background and Summary of Findings
36
times.58 In their recommendations, the Project Team considered cost, maintenance requirements, ease of operation, quality of data collected, value of information to various end-users, and ease of dissemination. The assessment of border wait time technologies and information systems discusses several technologies for the collection/detection, communication, and analysis of border wait times, including cellular networks, Wi-Fi, GPS, and crowdsourced data. It also reviews information dissemination systems and data management, such as navigation phone apps and border wait time phone applications. For more detail on the technologies and systems reviewed and the Project Team’s recommendations, see Appendix D to this Volume.
Table 12 through Table 21 in this section briefly describe selected technologies and systems available and their advantages and disadvantages for border travel time data collection and dissemination. Each table summarizes the potential use(s) of one technology or system (Use), the initial cost of its deployment (Init. Dep. Cost), ongoing operation and maintenance costs (O&M costs), the ease of operation (Ease of Op), the quality of the data gathered and/or distributed, and the appropriateness or suitability of the technology or system as a border wait time system (BWTS).
Table 12. Technologies and Information Systems: Cellular Networks & Data
Cellular Networks & Data – mobile devices, cellular location data, and the cellular network Use: Source, Collection, Communication, Dissemination
Init. Dep. Cost: On-going monthly costs, varies with use. May need to be combined with other technology systems.
O&M Cost: Depends on use; none is required for data collection or dissemination on established cell service provider networks.
Ease of Op: Easy; highly available.
Data Quality: Medium; combine with other methods for accuracy and reliability.
BWTS Suitability: Low - Medium
Advantages • Mature technology, widely available; • Easy implementation; • Variable cost depends on application as source, collection, communication, or dissemination technology; • Privacy concerns are filtered through cellular service provider; • Large, mature data sets collected via cellular user’s devices provides opportunity for predictive capabilities. Disadvantages • Cellular services can be intermittent and service coverage is not always reliable; • Service providers at the border vary by country, and cellular device users may switch devices mid-crossing (to
avoid international use fees) causing probable interruption in crossing time data; • Complex algorithms are required for location triangulation and are dependent on cellular service provider; • Subscriptions, periodic service charges are charged by owning service provider; • Data must be purchased from cellular service provider or collected via customized apps on the mobile devices; • Triangulation of cellular data does not always produce the location accuracy required for wait time applications.
58 For an explanation of the distinction between border crossing times and border wait times, see the earlier discussion of the measures in the Border Wait Time Data Collection Methodology section of this Volume.
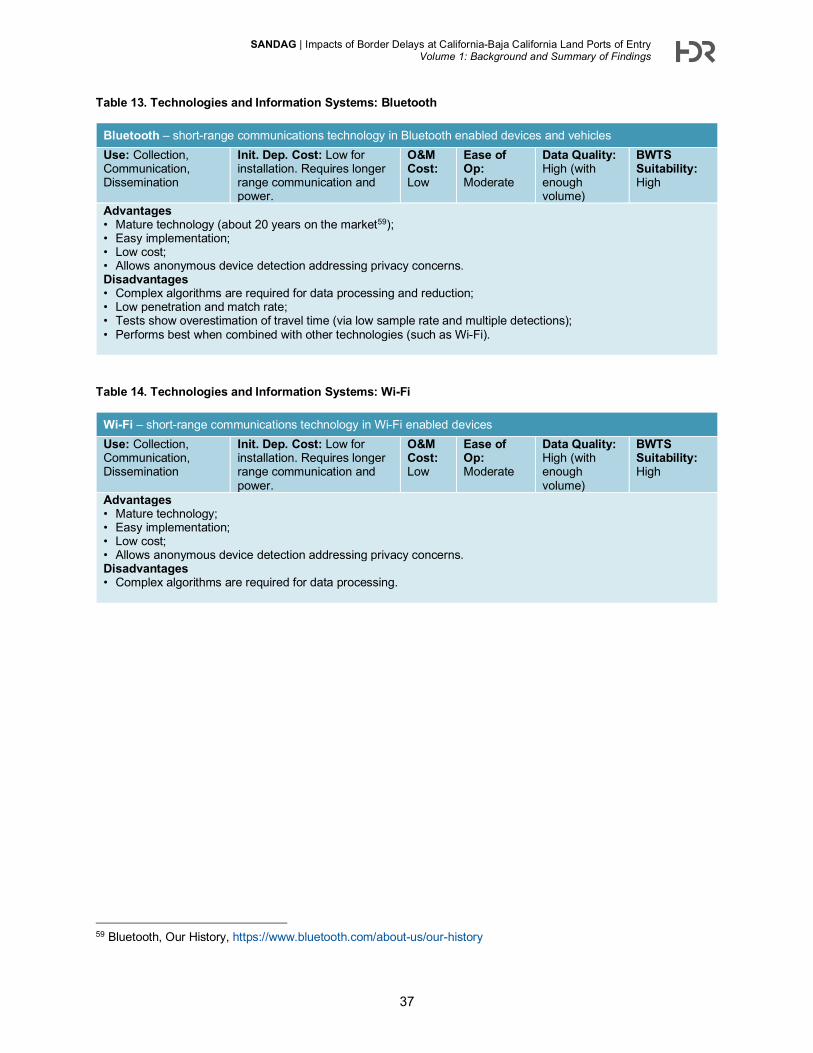
SANDAG | Impacts of Border Delays at California-Baja California Land Ports of Entry Volume 1: Background and Summary of Findings
37
Table 13. Technologies and Information Systems: Bluetooth
Bluetooth – short-range communications technology in Bluetooth enabled devices and vehicles Use: Collection, Communication, Dissemination
Init. Dep. Cost: Low for installation. Requires longer range communication and power.
O&M Cost: Low
Ease of Op: Moderate
Data Quality: High (with enough volume)
BWTS Suitability: High
Advantages • Mature technology (about 20 years on the market59); • Easy implementation; • Low cost; • Allows anonymous device detection addressing privacy concerns. Disadvantages • Complex algorithms are required for data processing and reduction; • Low penetration and match rate; • Tests show overestimation of travel time (via low sample rate and multiple detections); • Performs best when combined with other technologies (such as Wi-Fi).
Table 14. Technologies and Information Systems: Wi-Fi
Wi-Fi – short-range communications technology in Wi-Fi enabled devices Use: Collection, Communication, Dissemination
Init. Dep. Cost: Low for installation. Requires longer range communication and power.
O&M Cost: Low
Ease of Op: Moderate
Data Quality: High (with enough volume)
BWTS Suitability: High
Advantages • Mature technology; • Easy implementation; • Low cost; • Allows anonymous device detection addressing privacy concerns. Disadvantages • Complex algorithms are required for data processing.
59 Bluetooth, Our History, https://www.bluetooth.com/about-us/our-history
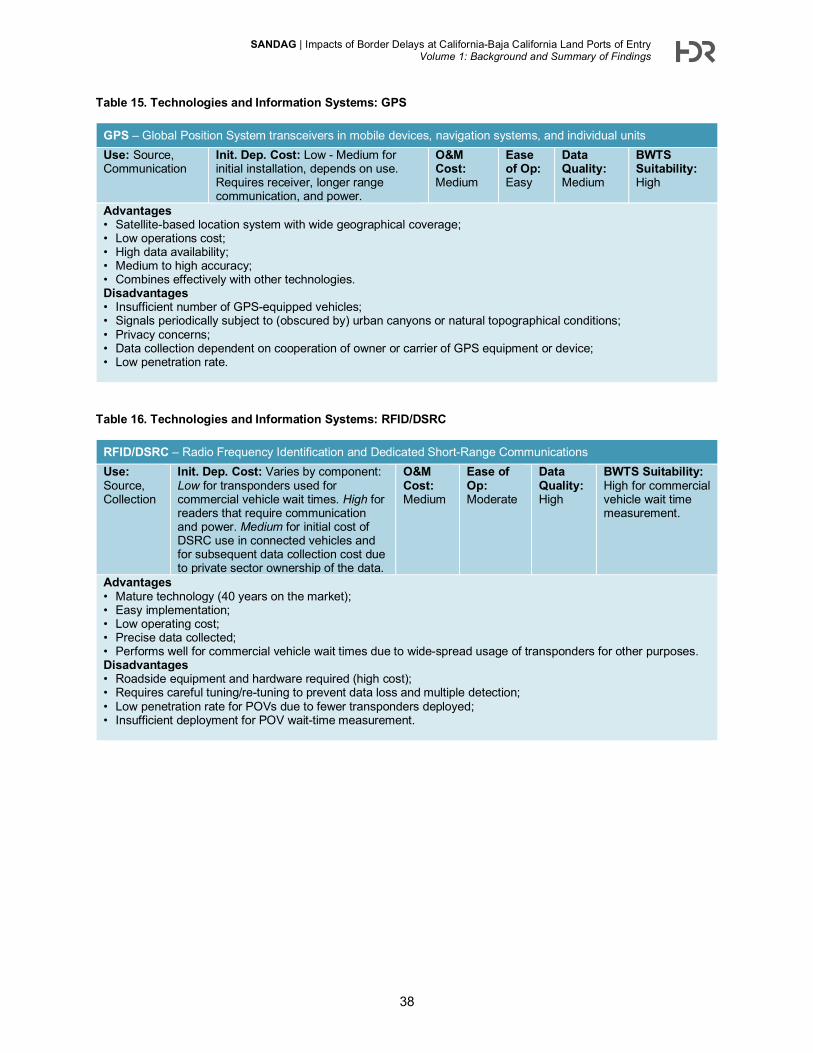
SANDAG | Impacts of Border Delays at California-Baja California Land Ports of Entry Volume 1: Background and Summary of Findings
38
Table 15. Technologies and Information Systems: GPS
GPS – Global Position System transceivers in mobile devices, navigation systems, and individual units Use: Source, Communication
Init. Dep. Cost: Low - Medium for initial installation, depends on use. Requires receiver, longer range communication, and power.
O&M Cost: Medium
Ease of Op: Easy
Data Quality: Medium
BWTS Suitability: High
Advantages • Satellite-based location system with wide geographical coverage; • Low operations cost; • High data availability; • Medium to high accuracy; • Combines effectively with other technologies. Disadvantages • Insufficient number of GPS-equipped vehicles; • Signals periodically subject to (obscured by) urban canyons or natural topographical conditions; • Privacy concerns; • Data collection dependent on cooperation of owner or carrier of GPS equipment or device; • Low penetration rate.
Table 16. Technologies and Information Systems: RFID/DSRC
RFID/DSRC – Radio Frequency Identification and Dedicated Short-Range Communications Use: Source, Collection
Init. Dep. Cost: Varies by component: Low for transponders used for commercial vehicle wait times. High for readers that require communication and power. Medium for initial cost of DSRC use in connected vehicles and for subsequent data collection cost due to private sector ownership of the data.
O&M Cost: Medium
Ease of Op: Moderate
Data Quality: High
BWTS Suitability: High for commercial vehicle wait time measurement.
Advantages • Mature technology (40 years on the market); • Easy implementation; • Low operating cost; • Precise data collected; • Performs well for commercial vehicle wait times due to wide-spread usage of transponders for other purposes. Disadvantages • Roadside equipment and hardware required (high cost); • Requires careful tuning/re-tuning to prevent data loss and multiple detection; • Low penetration rate for POVs due to fewer transponders deployed; • Insufficient deployment for POV wait-time measurement.
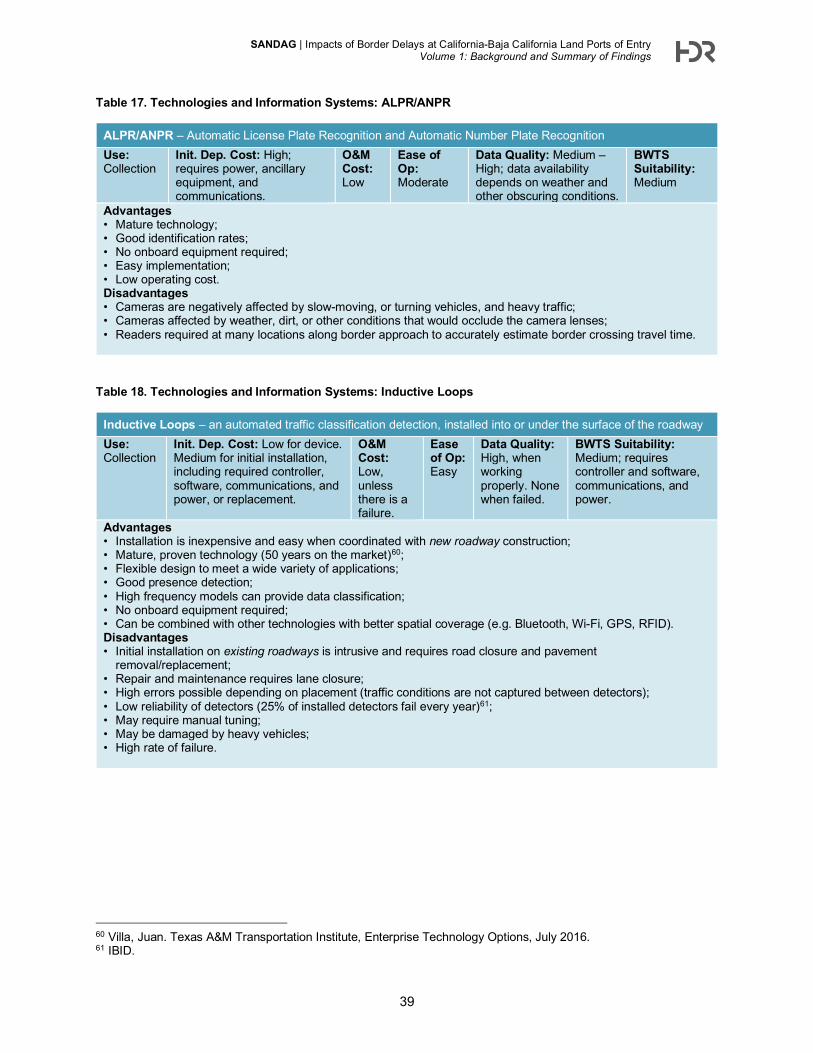
SANDAG | Impacts of Border Delays at California-Baja California Land Ports of Entry Volume 1: Background and Summary of Findings
39
Table 17. Technologies and Information Systems: ALPR/ANPR
ALPR/ANPR – Automatic License Plate Recognition and Automatic Number Plate Recognition Use: Collection
Init. Dep. Cost: High; requires power, ancillary equipment, and communications.
O&M Cost: Low
Ease of Op: Moderate
Data Quality: Medium – High; data availability depends on weather and other obscuring conditions.
BWTS Suitability: Medium
Advantages • Mature technology; • Good identification rates; • No onboard equipment required; • Easy implementation; • Low operating cost. Disadvantages • Cameras are negatively affected by slow-moving, or turning vehicles, and heavy traffic; • Cameras affected by weather, dirt, or other conditions that would occlude the camera lenses; • Readers required at many locations along border approach to accurately estimate border crossing travel time.
Table 18. Technologies and Information Systems: Inductive Loops
Inductive Loops – an automated traffic classification detection, installed into or under the surface of the roadway Use: Collection
Init. Dep. Cost: Low for device. Medium for initial installation, including required controller, software, communications, and power, or replacement.
O&M Cost: Low, unless there is a failure.
Ease of Op: Easy
Data Quality: High, when working properly. None when failed.
BWTS Suitability: Medium; requires controller and software, communications, and power.
Advantages • Installation is inexpensive and easy when coordinated with new roadway construction; • Mature, proven technology (50 years on the market)60; • Flexible design to meet a wide variety of applications; • Good presence detection; • High frequency models can provide data classification; • No onboard equipment required; • Can be combined with other technologies with better spatial coverage (e.g. Bluetooth, Wi-Fi, GPS, RFID). Disadvantages • Initial installation on existing roadways is intrusive and requires road closure and pavement
removal/replacement; • Repair and maintenance requires lane closure; • High errors possible depending on placement (traffic conditions are not captured between detectors); • Low reliability of detectors (25% of installed detectors fail every year)61; • May require manual tuning; • May be damaged by heavy vehicles; • High rate of failure.
60 Villa, Juan. Texas A&M Transportation Institute, Enterprise Technology Options, July 2016. 61 IBID.
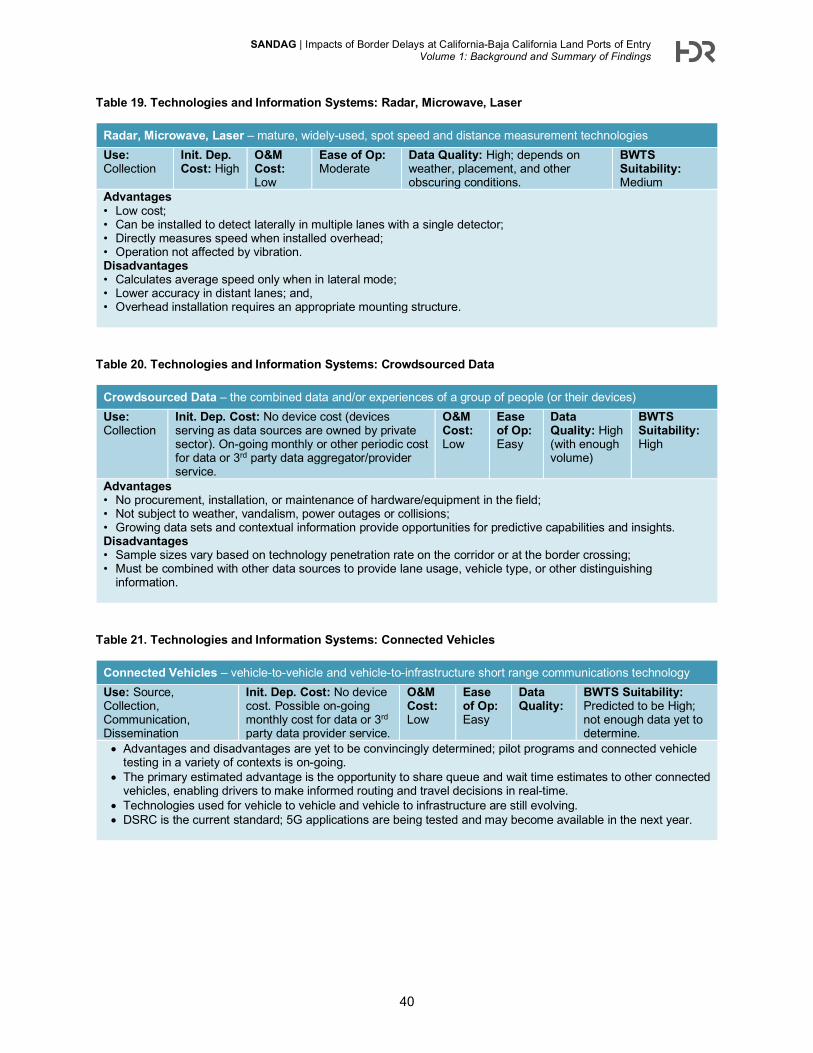
SANDAG | Impacts of Border Delays at California-Baja California Land Ports of Entry Volume 1: Background and Summary of Findings
40
Table 19. Technologies and Information Systems: Radar, Microwave, Laser
Radar, Microwave, Laser – mature, widely-used, spot speed and distance measurement technologies Use: Collection
Init. Dep. Cost: High
O&M Cost: Low
Ease of Op: Moderate
Data Quality: High; depends on weather, placement, and other obscuring conditions.
BWTS Suitability: Medium
Advantages • Low cost; • Can be installed to detect laterally in multiple lanes with a single detector; • Directly measures speed when installed overhead; • Operation not affected by vibration. Disadvantages • Calculates average speed only when in lateral mode; • Lower accuracy in distant lanes; and, • Overhead installation requires an appropriate mounting structure.
Table 20. Technologies and Information Systems: Crowdsourced Data
Crowdsourced Data – the combined data and/or experiences of a group of people (or their devices) Use: Collection
Init. Dep. Cost: No device cost (devices serving as data sources are owned by private sector). On-going monthly or other periodic cost for data or 3rd party data aggregator/provider service.
O&M Cost: Low
Ease of Op: Easy
Data Quality: High (with enough volume)
BWTS Suitability: High
Advantages • No procurement, installation, or maintenance of hardware/equipment in the field; • Not subject to weather, vandalism, power outages or collisions; • Growing data sets and contextual information provide opportunities for predictive capabilities and insights. Disadvantages • Sample sizes vary based on technology penetration rate on the corridor or at the border crossing; • Must be combined with other data sources to provide lane usage, vehicle type, or other distinguishing
information.
Table 21. Technologies and Information Systems: Connected Vehicles
Connected Vehicles – vehicle-to-vehicle and vehicle-to-infrastructure short range communications technology Use: Source, Collection, Communication, Dissemination
Init. Dep. Cost: No device cost. Possible on-going monthly cost for data or 3rd party data provider service.
O&M Cost: Low
Ease of Op: Easy
Data Quality:
BWTS Suitability: Predicted to be High; not enough data yet to determine.
• Advantages and disadvantages are yet to be convincingly determined; pilot programs and connected vehicle testing in a variety of contexts is on-going.
• The primary estimated advantage is the opportunity to share queue and wait time estimates to other connected vehicles, enabling drivers to make informed routing and travel decisions in real-time.
• Technologies used for vehicle to vehicle and vehicle to infrastructure are still evolving. • DSRC is the current standard; 5G applications are being tested and may become available in the next year.
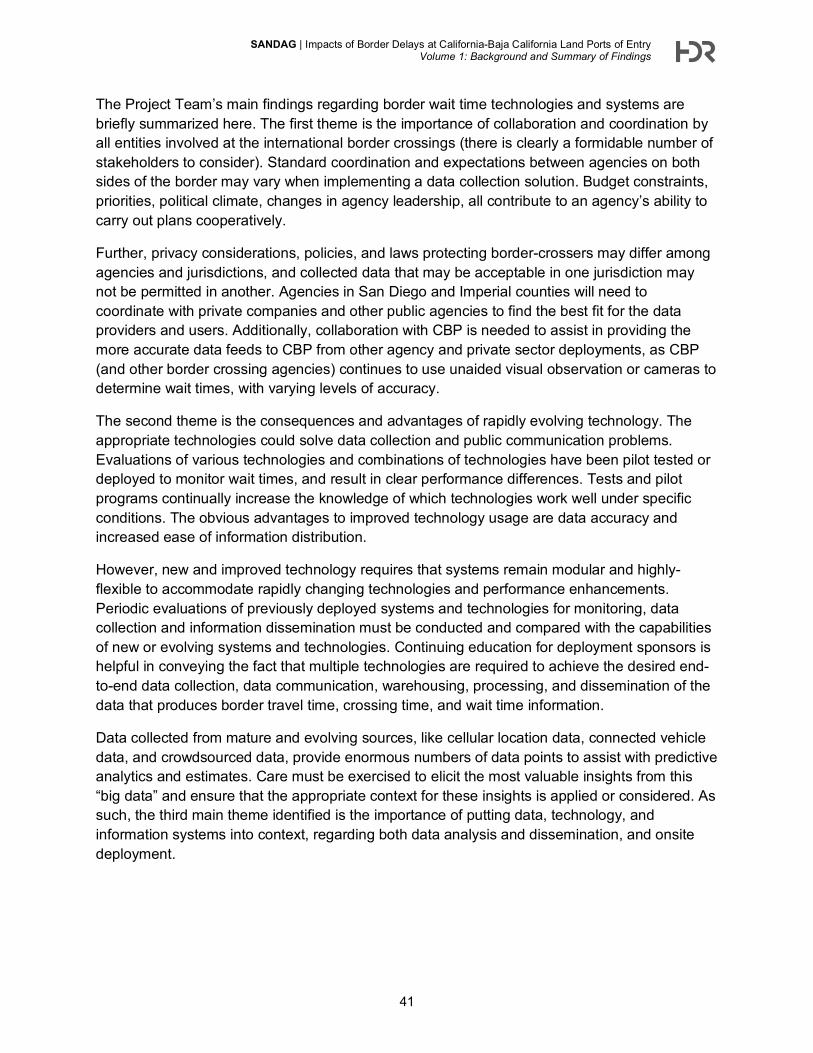
SANDAG | Impacts of Border Delays at California-Baja California Land Ports of Entry Volume 1: Background and Summary of Findings
41
The Project Team’s main findings regarding border wait time technologies and systems are briefly summarized here. The first theme is the importance of collaboration and coordination by all entities involved at the international border crossings (there is clearly a formidable number of stakeholders to consider). Standard coordination and expectations between agencies on both sides of the border may vary when implementing a data collection solution. Budget constraints, priorities, political climate, changes in agency leadership, all contribute to an agency’s ability to carry out plans cooperatively.
Further, privacy considerations, policies, and laws protecting border-crossers may differ among agencies and jurisdictions, and collected data that may be acceptable in one jurisdiction may not be permitted in another. Agencies in San Diego and Imperial counties will need to coordinate with private companies and other public agencies to find the best fit for the data providers and users. Additionally, collaboration with CBP is needed to assist in providing the more accurate data feeds to CBP from other agency and private sector deployments, as CBP (and other border crossing agencies) continues to use unaided visual observation or cameras to determine wait times, with varying levels of accuracy.
The second theme is the consequences and advantages of rapidly evolving technology. The appropriate technologies could solve data collection and public communication problems. Evaluations of various technologies and combinations of technologies have been pilot tested or deployed to monitor wait times, and result in clear performance differences. Tests and pilot programs continually increase the knowledge of which technologies work well under specific conditions. The obvious advantages to improved technology usage are data accuracy and increased ease of information distribution.
However, new and improved technology requires that systems remain modular and highly-flexible to accommodate rapidly changing technologies and performance enhancements. Periodic evaluations of previously deployed systems and technologies for monitoring, data collection and information dissemination must be conducted and compared with the capabilities of new or evolving systems and technologies. Continuing education for deployment sponsors is helpful in conveying the fact that multiple technologies are required to achieve the desired end-to-end data collection, data communication, warehousing, processing, and dissemination of the data that produces border travel time, crossing time, and wait time information.
Data collected from mature and evolving sources, like cellular location data, connected vehicle data, and crowdsourced data, provide enormous numbers of data points to assist with predictive analytics and estimates. Care must be exercised to elicit the most valuable insights from this “big data” and ensure that the appropriate context for these insights is applied or considered. As such, the third main theme identified is the importance of putting data, technology, and information systems into context, regarding both data analysis and dissemination, and onsite deployment.
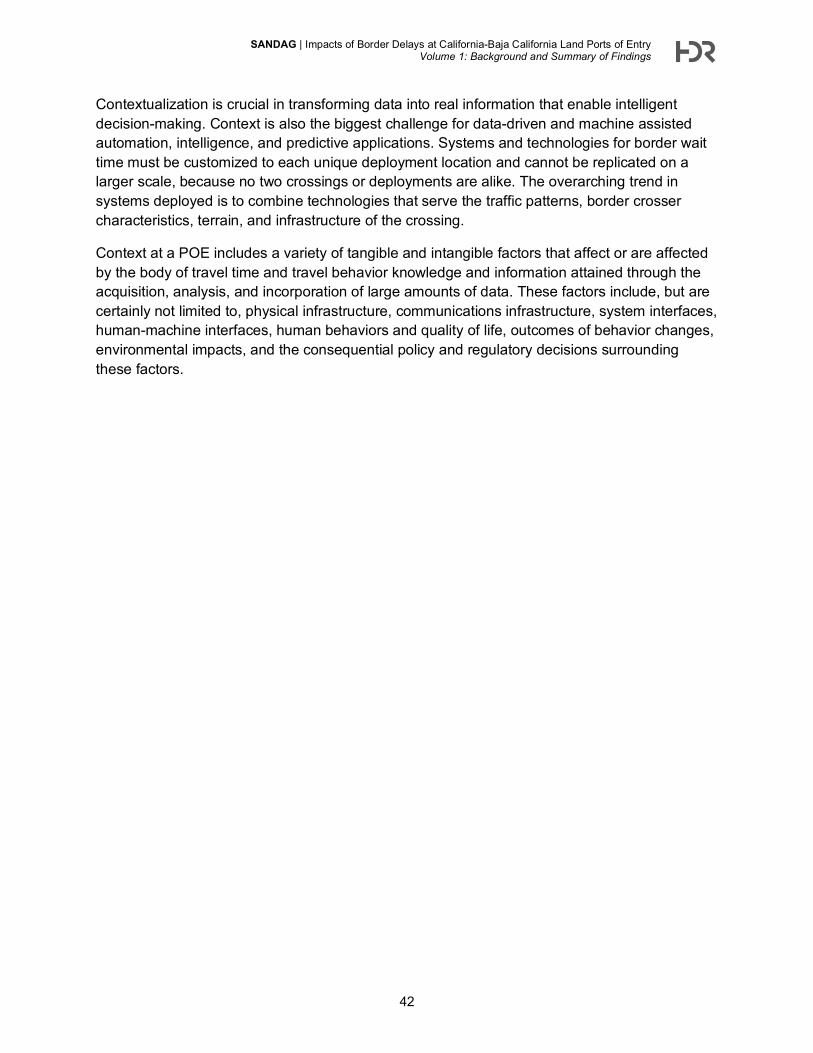
SANDAG | Impacts of Border Delays at California-Baja California Land Ports of Entry Volume 1: Background and Summary of Findings
42
Contextualization is crucial in transforming data into real information that enable intelligent decision-making. Context is also the biggest challenge for data-driven and machine assisted automation, intelligence, and predictive applications. Systems and technologies for border wait time must be customized to each unique deployment location and cannot be replicated on a larger scale, because no two crossings or deployments are alike. The overarching trend in systems deployed is to combine technologies that serve the traffic patterns, border crosser characteristics, terrain, and infrastructure of the crossing.
Context at a POE includes a variety of tangible and intangible factors that affect or are affected by the body of travel time and travel behavior knowledge and information attained through the acquisition, analysis, and incorporation of large amounts of data. These factors include, but are certainly not limited to, physical infrastructure, communications infrastructure, system interfaces, human-machine interfaces, human behaviors and quality of life, outcomes of behavior changes, environmental impacts, and the consequential policy and regulatory decisions surrounding these factors.
SANDAG | Impacts of Border Delays at California-Baja California Land Ports of Entry Volume 1: Background and Summary of Findings
43
Development of Future Conceptual Scenarios The Impacts of Border Delays at the California-Baja California Land Ports of Entry study estimates both economic and air quality/emissions impacts of delays for year 2025 and air quality/emissions impacts are estimated for year 2035. The estimation of future impacts is primarily dependent on the future of border-crossing volumes and delays experienced at the border. Given the uncertainty surrounding the characteristics of border crossing trips between now and year 2025, the Project Team relied on a scenario analysis approach to tackle this issue. The Project Team developed conceptual scenarios for the existing and planned land POEs to analyze the impact that future border-crossing conditions will have on the economy and air quality of the region. This section describes the characteristics of the future conceptual scenarios analyzed in this study.
Overview of Conceptual Scenarios The future conceptual scenarios analyzed as part of this study are defined for each border subregion (i.e., San Diego County-Tijuana/Tecate and Imperial County-Mexicali), POE, and year of analysis. The scenario for 2016 represents existing conditions. The conceptual scenarios for future years and both subregions can be summarized based on the following characteristics:62
• Baseline Scenario includes certain planned improvements to border-crossing capacity, without the Otay Mesa East (OME) POE. This scenario is estimated for all currently existing POEs.
• Baseline Scenario plus Capacity Enhancements and Transit and Active Transportation considers significant border crossing capacity improvements in year 2025 such as the additional POE at Otay Mesa East, improvements at existing POEs like Calexico East with the expansion of the All-American Canal bridge, and transit and bicycle/pedestrian access improvements in the vicinity of the POEs in years 2025 and 2035. The Otay Mesa East POE capacity is planned to be phased; at opening day it will be in a 5x5 configuration and expanded to a 10x10 configuration at a later date. 63 Thus, the results from the SR 11 BTDM with a 5x5 configuration at Otay Mesa East represent the first Baseline Scenario plus Capacity Enhancement for years 2025 and 2035, and the results from the SR 11 BTDM with a 10x10 configuration at Otay Mesa East for 2035 represent the second Baseline Scenario plus Capacity Enhancement.
• Sensitivity Scenario describes changes to future volumes or wait times due to changes in policies, level of economic activity, or other factors, such as changes due to the USMCA trade agreement. This scenario is estimated for all POEs.
The conceptual scenarios match the mode types available for each land POE. Broadly, each POE has a Baseline scenario that represents existing border-crossing volumes and
62 Even though the USMCA trade agreement has entered into force as of July 1, 2020, the scenarios described here assume that future conditions are based on extrapolation of current conditions and that USMCA is not likely to cause significant changes through 2025. 63 The 5x5 configuration for OME entails 5 POV and 5 Commercial lanes in both directions – so 10 total NB lanes and 10 SB lanes (20 bidirectional total). The 10x10 configuration entails 10 POV and 10 Commercial lanes in directions – so 20 NB lanes and 20 SB lanes (40 bidirectional total).
SANDAG | Impacts of Border Delays at California-Baja California Land Ports of Entry Volume 1: Background and Summary of Findings
44
circumstances. For all of the POEs (except Andrade) the baseline includes some planned improvements. San Ysidro and Otay Mesa POEs have additional baseline scenarios that include the existence of the future Otay Mesa East (OME) POE. Similarly, Calexico West and East POEs have baseline scenarios that incorporate capacity improvements at the All-American Canal. For each of the four largest POEs (San Ysidro, Otay Mesa, Calexico West, and Calexico East) there is a scenario that includes enhanced transit service and bike and pedestrian access improvements, designated as Transit and Active Transportation scenarios.
For the economic and air quality/emissions analyses, the conceptual scenarios comprise the most likely growth in traffic volumes for 2025. The emissions analysis also considers 2035 as a year to be analyzed, with an additional OME configuration, and the economic analysis additionally considers a sensitivity scenario with a +/-10 percent change in crossing volumes and/or wait times, to represent changes in policies, level of economic activity, or other factors. A tabular explanation of the scenarios and sensitivity analysis utilized in this project is presented in Table 22.
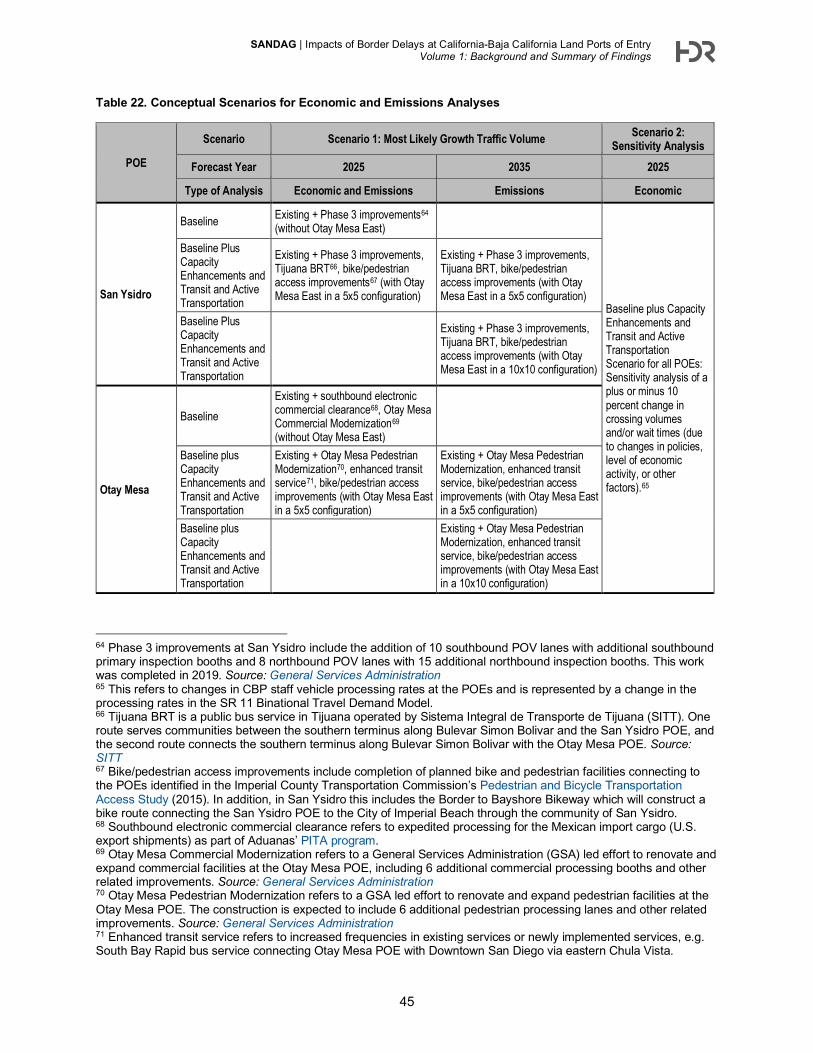
SANDAG | Impacts of Border Delays at California-Baja California Land Ports of Entry Volume 1: Background and Summary of Findings
45
Table 22. Conceptual Scenarios for Economic and Emissions Analyses
POE
Scenario Scenario 1: Most Likely Growth Traffic Volume Scenario 2: Sensitivity Analysis
Forecast Year 2025 2035 2025
Type of Analysis Economic and Emissions Emissions Economic
San Ysidro
Baseline Existing + Phase 3 improvements64 (without Otay Mesa East)
Baseline plus Capacity Enhancements and Transit and Active Transportation Scenario for all POEs: Sensitivity analysis of a plus or minus 10 percent change in crossing volumes and/or wait times (due to changes in policies, level of economic activity, or other factors).65
Baseline Plus Capacity Enhancements and Transit and Active Transportation
Existing + Phase 3 improvements, Tijuana BRT66, bike/pedestrian access improvements67 (with Otay Mesa East in a 5x5 configuration)
Existing + Phase 3 improvements, Tijuana BRT, bike/pedestrian access improvements (with Otay Mesa East in a 5x5 configuration)
Baseline Plus Capacity Enhancements and Transit and Active Transportation
Existing + Phase 3 improvements, Tijuana BRT, bike/pedestrian access improvements (with Otay Mesa East in a 10x10 configuration)
Otay Mesa
Baseline Existing + southbound electronic commercial clearance68, Otay Mesa Commercial Modernization69 (without Otay Mesa East)
Baseline plus Capacity Enhancements and Transit and Active Transportation
Existing + Otay Mesa Pedestrian Modernization70, enhanced transit service71, bike/pedestrian access improvements (with Otay Mesa East in a 5x5 configuration)
Existing + Otay Mesa Pedestrian Modernization, enhanced transit service, bike/pedestrian access improvements (with Otay Mesa East in a 5x5 configuration)
Baseline plus Capacity Enhancements and Transit and Active Transportation
Existing + Otay Mesa Pedestrian Modernization, enhanced transit service, bike/pedestrian access improvements (with Otay Mesa East in a 10x10 configuration)
64 Phase 3 improvements at San Ysidro include the addition of 10 southbound POV lanes with additional southbound primary inspection booths and 8 northbound POV lanes with 15 additional northbound inspection booths. This work was completed in 2019. Source: General Services Administration 65 This refers to changes in CBP staff vehicle processing rates at the POEs and is represented by a change in the processing rates in the SR 11 Binational Travel Demand Model. 66 Tijuana BRT is a public bus service in Tijuana operated by Sistema Integral de Transporte de Tijuana (SITT). One route serves communities between the southern terminus along Bulevar Simon Bolivar and the San Ysidro POE, and the second route connects the southern terminus along Bulevar Simon Bolivar with the Otay Mesa POE. Source: SITT 67 Bike/pedestrian access improvements include completion of planned bike and pedestrian facilities connecting to the POEs identified in the Imperial County Transportation Commission’s Pedestrian and Bicycle Transportation Access Study (2015). In addition, in San Ysidro this includes the Border to Bayshore Bikeway which will construct a bike route connecting the San Ysidro POE to the City of Imperial Beach through the community of San Ysidro. 68 Southbound electronic commercial clearance refers to expedited processing for the Mexican import cargo (U.S. export shipments) as part of Aduanas’ PITA program. 69 Otay Mesa Commercial Modernization refers to a General Services Administration (GSA) led effort to renovate and expand commercial facilities at the Otay Mesa POE, including 6 additional commercial processing booths and other related improvements. Source: General Services Administration 70 Otay Mesa Pedestrian Modernization refers to a GSA led effort to renovate and expand pedestrian facilities at the Otay Mesa POE. The construction is expected to include 6 additional pedestrian processing lanes and other related improvements. Source: General Services Administration 71 Enhanced transit service refers to increased frequencies in existing services or newly implemented services, e.g. South Bay Rapid bus service connecting Otay Mesa POE with Downtown San Diego via eastern Chula Vista.
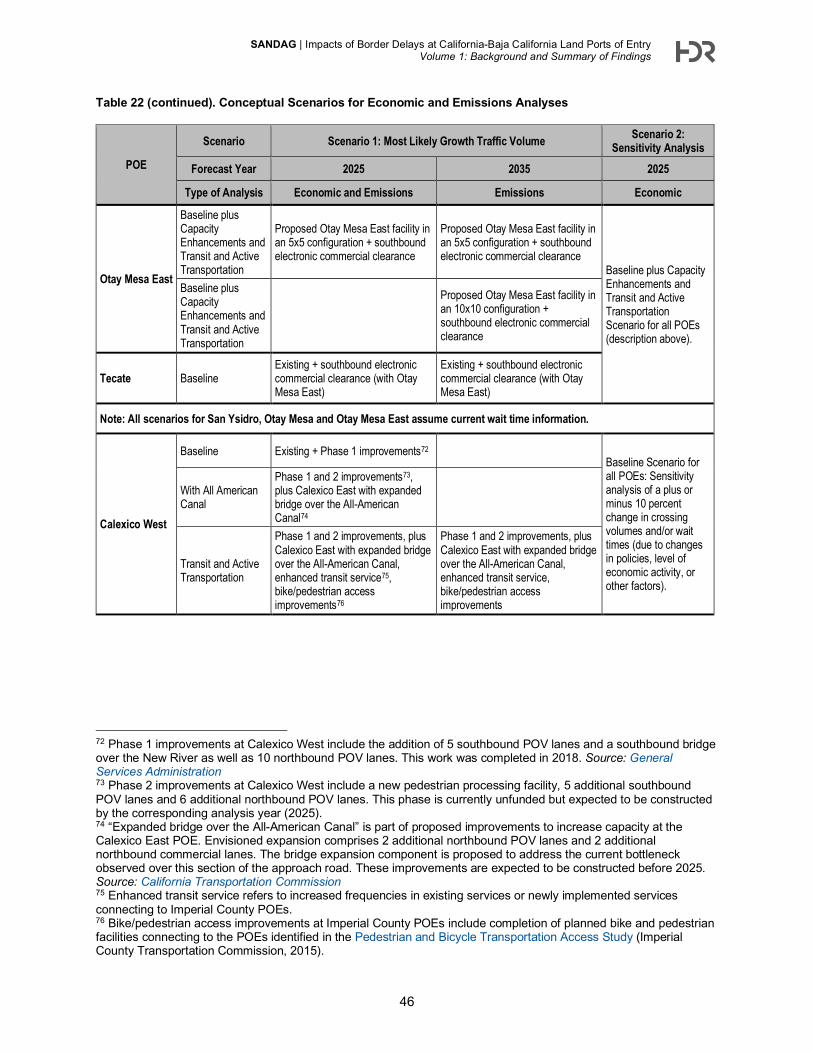
SANDAG | Impacts of Border Delays at California-Baja California Land Ports of Entry Volume 1: Background and Summary of Findings
46
Table 22 (continued). Conceptual Scenarios for Economic and Emissions Analyses
POE
Scenario Scenario 1: Most Likely Growth Traffic Volume Scenario 2: Sensitivity Analysis
Forecast Year 2025 2035 2025
Type of Analysis Economic and Emissions Emissions Economic
Otay Mesa East
Baseline plus Capacity Enhancements and Transit and Active Transportation
Proposed Otay Mesa East facility in an 5x5 configuration + southbound electronic commercial clearance
Proposed Otay Mesa East facility in an 5x5 configuration + southbound electronic commercial clearance
Baseline plus Capacity Enhancements and Transit and Active Transportation Scenario for all POEs (description above).
Baseline plus Capacity Enhancements and Transit and Active Transportation
Proposed Otay Mesa East facility in an 10x10 configuration + southbound electronic commercial clearance
Tecate Baseline Existing + southbound electronic commercial clearance (with Otay Mesa East)
Existing + southbound electronic commercial clearance (with Otay Mesa East)
Note: All scenarios for San Ysidro, Otay Mesa and Otay Mesa East assume current wait time information.
Calexico West
Baseline Existing + Phase 1 improvements72 Baseline Scenario for all POEs: Sensitivity analysis of a plus or minus 10 percent change in crossing volumes and/or wait times (due to changes in policies, level of economic activity, or other factors).
With All American Canal
Phase 1 and 2 improvements73, plus Calexico East with expanded bridge over the All-American Canal74
Transit and Active Transportation
Phase 1 and 2 improvements, plus Calexico East with expanded bridge over the All-American Canal, enhanced transit service75, bike/pedestrian access improvements76
Phase 1 and 2 improvements, plus Calexico East with expanded bridge over the All-American Canal, enhanced transit service, bike/pedestrian access improvements
72 Phase 1 improvements at Calexico West include the addition of 5 southbound POV lanes and a southbound bridge over the New River as well as 10 northbound POV lanes. This work was completed in 2018. Source: General Services Administration 73 Phase 2 improvements at Calexico West include a new pedestrian processing facility, 5 additional southbound POV lanes and 6 additional northbound POV lanes. This phase is currently unfunded but expected to be constructed by the corresponding analysis year (2025). 74 “Expanded bridge over the All-American Canal” is part of proposed improvements to increase capacity at the Calexico East POE. Envisioned expansion comprises 2 additional northbound POV lanes and 2 additional northbound commercial lanes. The bridge expansion component is proposed to address the current bottleneck observed over this section of the approach road. These improvements are expected to be constructed before 2025. Source: California Transportation Commission 75 Enhanced transit service refers to increased frequencies in existing services or newly implemented services connecting to Imperial County POEs. 76 Bike/pedestrian access improvements at Imperial County POEs include completion of planned bike and pedestrian facilities connecting to the POEs identified in the Pedestrian and Bicycle Transportation Access Study (Imperial County Transportation Commission, 2015).
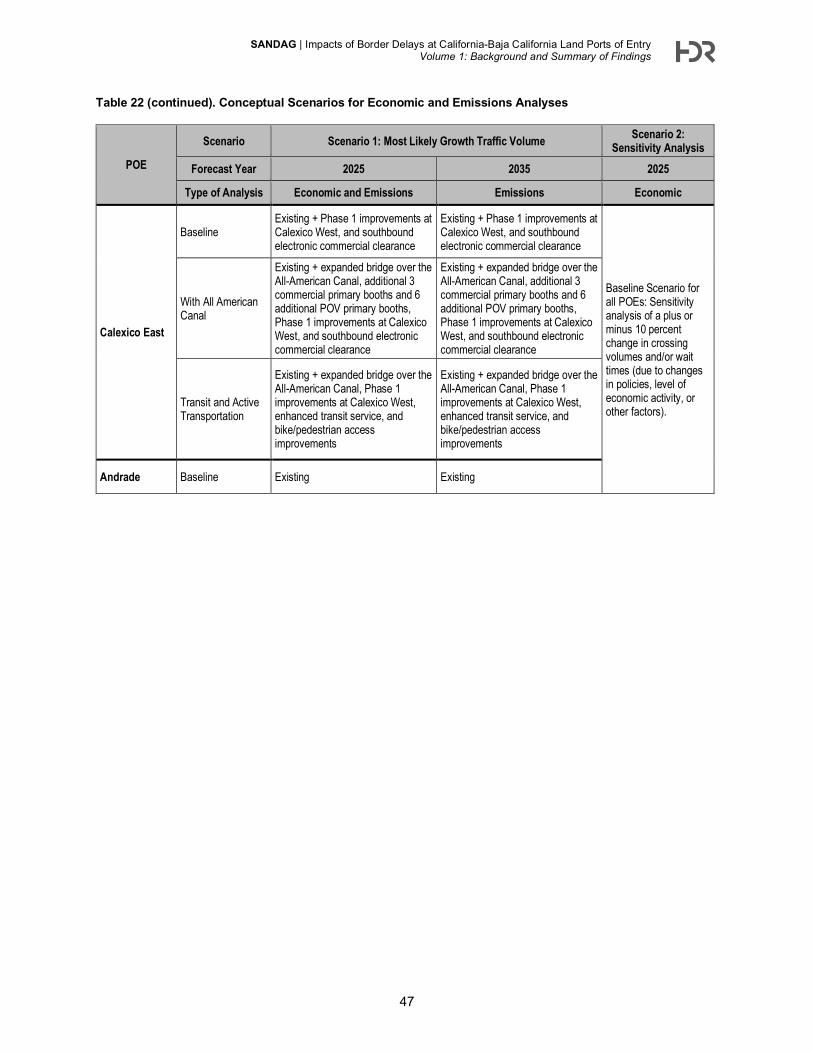
SANDAG | Impacts of Border Delays at California-Baja California Land Ports of Entry Volume 1: Background and Summary of Findings
47
Table 22 (continued). Conceptual Scenarios for Economic and Emissions Analyses
POE
Scenario Scenario 1: Most Likely Growth Traffic Volume Scenario 2: Sensitivity Analysis
Forecast Year 2025 2035 2025
Type of Analysis Economic and Emissions Emissions Economic
Calexico East
Baseline Existing + Phase 1 improvements at Calexico West, and southbound electronic commercial clearance
Existing + Phase 1 improvements at Calexico West, and southbound electronic commercial clearance
Baseline Scenario for all POEs: Sensitivity analysis of a plus or minus 10 percent change in crossing volumes and/or wait times (due to changes in policies, level of economic activity, or other factors).
With All American Canal
Existing + expanded bridge over the All-American Canal, additional 3 commercial primary booths and 6 additional POV primary booths, Phase 1 improvements at Calexico West, and southbound electronic commercial clearance
Existing + expanded bridge over the All-American Canal, additional 3 commercial primary booths and 6 additional POV primary booths, Phase 1 improvements at Calexico West, and southbound electronic commercial clearance
Transit and Active Transportation
Existing + expanded bridge over the All-American Canal, Phase 1 improvements at Calexico West, enhanced transit service, and bike/pedestrian access improvements
Existing + expanded bridge over the All-American Canal, Phase 1 improvements at Calexico West, enhanced transit service, and bike/pedestrian access improvements
Andrade Baseline Existing Existing
SANDAG | Impacts of Border Delays at California-Baja California Land Ports of Entry Volume 1: Background and Summary of Findings
48
Overview of Forecasting Methods for Volumes and Delays in the Conceptual Scenarios The estimation of future economic and air quality impacts of delays at the border is driven to a large extent by the future border-crossing volumes and the delays that will be experienced by border-crossers. Therefore, forecasts for these two variables need to be developed for each of the conceptual scenarios analyzed in this study. The methodology used in the estimation of future border crossing volumes and delays is presented in this section.
FORECASTING FUTURE VOLUMES OF BORDER-CROSSING TRAFFIC The current study estimated growth rates to forecast northbound border-crossing trips, by POE, for the years 2025 and 2035. In the quantitative assessment of impacts of delays, the analytical tools assumed that all northbound border-crossing trips in the region are matched, on an annual basis and by mode of crossing, by an equal number of southbound border-crossing movements.77 Therefore, even though the border-crossing volume forecast was performed for unidirectional movements, the result of the forecasting exercise led to an estimation of the total number of crossings in both directions.
The forecasting methodology used base year (2016) northbound volumes as a starting point to forecast future values for border-crossing traffic.78 The SR 11 Binational Travel Demand Model (BTDM) was the main source of input into the estimation of future volumes for the different scenarios (Tier II Traffic and Revenue, April 2020). In particular, it provides forecasts of future volumes for the POEs included in that model (i.e., San Ysidro, Otay Mesa, and Otay Mesa East) for all scenario types. Therefore, to seek congruence in the future traffic forecasts at San Ysidro, Otay Mesa, and Otay Mesa East between this study and the studies conducted for the SR 11/Otay Mesa East POE project, the forecasting methodology used in this analysis of impacts relied on northbound future volumes extracted from the SR 11 BTDM as the basis to estimate future northbound volumes at those POEs.
The future northbound border-crossing volumes for the other POEs in the region for all scenario types were developed using a technique called “transferring of sensitivities” (described below), which, in addition to the SR 11 BTDM data, utilizes BTS data and U.S. Census data to inform the estimation. Further, to incorporate the impact of the transit and active transportation improvements in the northbound forecasts of volumes in the Baseline plus Capacity Enhancements and Transit and Active Transportation Scenario, the study used a series of off-model techniques to adjust vehicle and pedestrian volumes (also described below). For the purposes of this report, in the paragraphs below the volumes of northbound crossings and the forecast of northbound border-crossing volumes are referred to simply as volumes or volume forecasts.
Forecasts Using Transfer of Sensitivities Approach This section defines the first step in the estimation of future volumes for all conceptual scenarios. The growth rates were derived using forecasts generated by the SR 11 BTDM and
77 The reason for using northbound flows as the relevant variable in the forecasting method is due to the larger amount of detail collected on northbound movements across the border. 78 Base year (2016) northbound border crossing volumes are sourced from the BTS Border Crossing/Entry database.
SANDAG | Impacts of Border Delays at California-Baja California Land Ports of Entry Volume 1: Background and Summary of Findings
49
data on base year (2016) conditions. By design, the methodology achieves consistency between this study and the study for the SR 11/Otay Mesa East POE Project.
The SR 11 BTDM was designed to model the behavior of crossers at certain POEs in the San Diego County-Tijuana border subregion (i.e. San Ysidro, Otay Mesa, and the hypothetical Otay Mesa East). There are no binational travel demand models for the remaining POEs in the California-Baja California region (i.e., Tecate, Calexico West, Calexico East, and Andrade). Therefore, the estimation of future border-crossing volumes for these POEs was done by “transferring the sensitivities” from the SR 11 BTDM results in a sketch-planning level of analysis for the Baseline and the Baseline with Capacity Enhancement Scenarios (in both the 5x5 and 10x10 configurations).
The transfer of sensitivities utilized the results from the SR 11 BTDM in terms of future growth rates in border-crossing volumes for each POE modeled, and adjusted those rates to better represent the reality of the POEs not included in the SR 11 BTDM. Growth rates were adjusted using commonly-used adjustment factors generated from comparable and quantitative characteristics of the POEs. The compounded average growth rate (CAGR) adjustment for unmodeled POEs is relative to the factors for the POEs modeled by the SR 11 BTDM. In other words, the ratio of adjustment factors between the POE to which the rate was transferred and the POE modeled in the SR 11 BTDM was used to adjust growth rates. The POE characteristics used to generate the adjustment factors in this process include:
• Crossing Volume: the number of total northbound border-crossers at the POE in 2016 (by mode)79
• Past Growth: the historical CAGR in total northbound border-crossers from 2011 to 2016 (by mode)80
• Population: the population adjacent to the POEs in 201681 • Capacity: the number of total lanes at the POE82
These adjustment factors are a proxy for differences across San Ysidro, Otay Mesa and other non-modeled POEs, such as the difference in transit service levels, the difference in commercial traffic levels and distribution, and the differences in pedestrian infrastructure. Finally, the growth rates for border-crossing volumes and delays resulting from these adjustments were then applied to the base year volumes and delays to generate future values that correspond to the conceptual scenarios for the POEs not modeled in the SR 11 BTDM.83
79 U.S. DOT, Bureau of Transportation Statistics, Border Crossing/Entry Data 80 U.S. DOT, Bureau of Transportation Statistics, Border Crossing/Entry Data. The year 2011 was chosen as the starting point in order to include as much history in the growth rate as possible without including the negative impacts of the Great Recession on crossing volumes. For POEs with no history of crossing (Otay Mesa East), adjustment factors were generated from San Diego County averages. 81 U.S. Census 2016 Population Estimates and the Instituto Nacional de Estadística y Geografía (INEGI) 2016 Population Estimates. 82 Specific POE layout and configuration assumptions are detailed in Volume 3. 83 Preliminary analysis used volumes from the SR 11 BTDM (Version 2.0, February 12, 2018), and further adjustments were required to account for latent demand from capacity enhancements. Latent or induced demand due to a new POE was estimated based on the results presented in the San Diego Association of Governments (2014),
SANDAG | Impacts of Border Delays at California-Baja California Land Ports of Entry Volume 1: Background and Summary of Findings
50
This methodology was the first step in estimating growth rates to forecast volumes for all the conceptual scenarios. The second step was to estimate and analyze the impact of the transit and active transportation improvements in the Baseline plus Capacity Enhancements and Transit and Active Transportation Scenario with the off-model techniques.
Forecasts Using Off-Model Adjustments Approach With the transit and active transportation improvements in the Baseline plus Capacity Enhancements and Transit and Active Transportation Scenario, it is expected that some border-crossings would shift from a motorized mode to a non-motorized one due to the improvements considered.84 Since the SR 11 BTDM does not consider active transportation or transit crossing modes, “off-model” adjustments were conducted on border-crossing volumes for both motorized and non-motorized crossers that capture the expected modal shifts.
Generally, the Project Team used an elasticity and other transit-related assumptions to capture the potential increase of pedestrian crossings and estimate the portion that is a diversion from motorized traffic. Therefore, this procedure estimated the amount of border crossing trips that would likely “switch” from a motorized mode to a non-motorized one. These estimated modal “switches” were combined with the initial set of border crossing volumes in the Baseline Scenario plus Capacity Enhancements (derived through the methodology described in the previous section) to determine the number of motorized and non-motorized crossers under the full Baseline Scenario plus Capacity Enhancements and Transit and Active Transportation Scenario.
Based on a qualitative analysis of the transit and access improvements considered in the Baseline Scenario plus Capacity Enhancements and Transit and Active Transportation Scenario, the off-model adjustment consisted of characterizing the demand for border crossing transit ridership with respect to the frequency and availability of transit at a given POE, and estimating a corresponding measure of improvement.85 This measure and literature on border crossing sensitivities formed the basis for the off-model adjustments.86
Transit frequency improvements were quantified by first estimating the percent change in level of service (LOS) with respect to bus frequency, and then estimating the percent change in ridership level for frequency improvements, based on ridership elasticity with respect to the LOS improvement. Improvements of additional bus lines and routes were quantified by estimating the new ridership created by the new line. The result was an estimate of additional transit ridership due to the LOS improvements described under this scenario.
To link the increase in transit ridership due to LOS improvements to the number of non-motorized border-crossing trips, an assumption was made for the share of additional transit
SR 11/Otay Mesa East (OME) Port of Entry (POE) Investment Grade Traffic and Revenue Study, page 76. In 2020, data from the updated SR 11 model (Tier II Traffic and Revenue, April 2020) was used to update the growth rates in this analysis, and an adjustment for latent demand was not required. 84 Non-motorized or transit and active transportation refer to pedestrians, cyclists, and transit riders; those who walk across the border. 85 Even though the adjustments should include both transit and bike/pedestrian access improvements, only transit improvements could be quantified in terms of the increases in the level of service to its users. 86 Sensitivities were taken from the Victoria Transportation Policy Institute (www.vtpi.org)
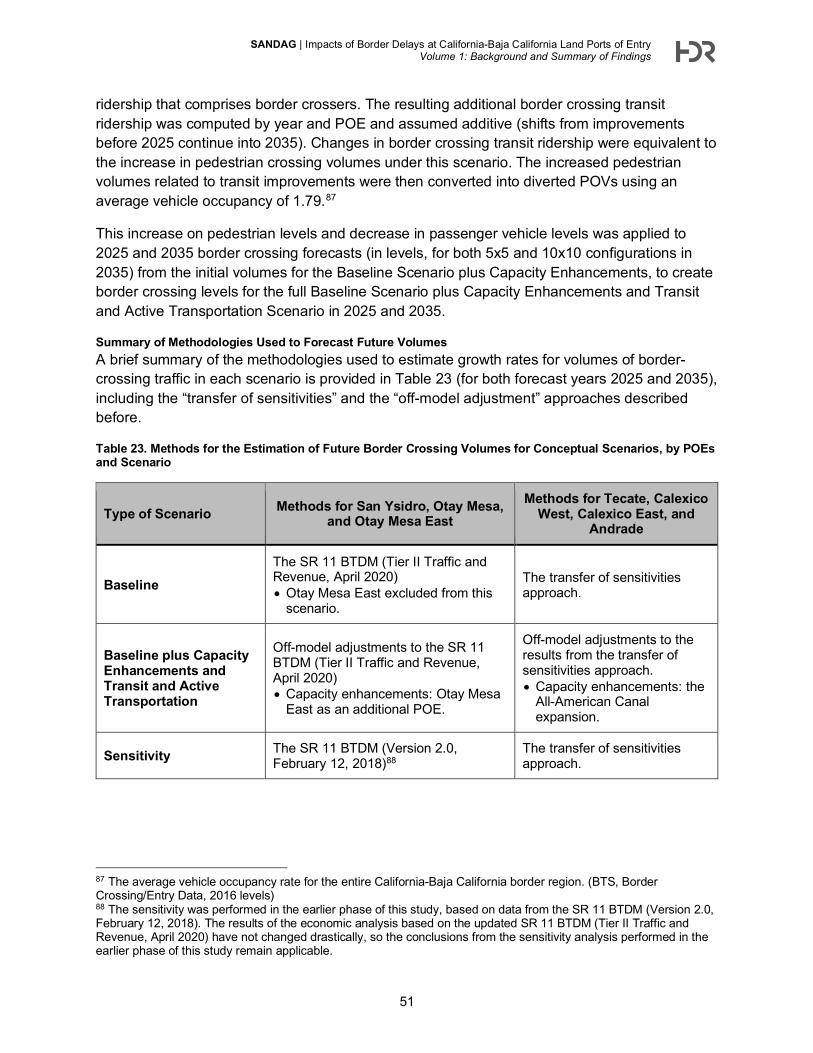
SANDAG | Impacts of Border Delays at California-Baja California Land Ports of Entry Volume 1: Background and Summary of Findings
51
ridership that comprises border crossers. The resulting additional border crossing transit ridership was computed by year and POE and assumed additive (shifts from improvements before 2025 continue into 2035). Changes in border crossing transit ridership were equivalent to the increase in pedestrian crossing volumes under this scenario. The increased pedestrian volumes related to transit improvements were then converted into diverted POVs using an average vehicle occupancy of 1.79.87
This increase on pedestrian levels and decrease in passenger vehicle levels was applied to 2025 and 2035 border crossing forecasts (in levels, for both 5x5 and 10x10 configurations in 2035) from the initial volumes for the Baseline Scenario plus Capacity Enhancements, to create border crossing levels for the full Baseline Scenario plus Capacity Enhancements and Transit and Active Transportation Scenario in 2025 and 2035.
Summary of Methodologies Used to Forecast Future Volumes A brief summary of the methodologies used to estimate growth rates for volumes of border-crossing traffic in each scenario is provided in Table 23 (for both forecast years 2025 and 2035), including the “transfer of sensitivities” and the “off-model adjustment” approaches described before.
Table 23. Methods for the Estimation of Future Border Crossing Volumes for Conceptual Scenarios, by POEs and Scenario
Type of Scenario Methods for San Ysidro, Otay Mesa, and Otay Mesa East
Methods for Tecate, Calexico West, Calexico East, and
Andrade
Baseline The SR 11 BTDM (Tier II Traffic and Revenue, April 2020) • Otay Mesa East excluded from this
scenario.
The transfer of sensitivities approach.
Baseline plus Capacity Enhancements and Transit and Active Transportation
Off-model adjustments to the SR 11 BTDM (Tier II Traffic and Revenue, April 2020) • Capacity enhancements: Otay Mesa
East as an additional POE.
Off-model adjustments to the results from the transfer of sensitivities approach. • Capacity enhancements: the
All-American Canal expansion.
Sensitivity The SR 11 BTDM (Version 2.0, February 12, 2018)88
The transfer of sensitivities approach.
87 The average vehicle occupancy rate for the entire California-Baja California border region. (BTS, Border Crossing/Entry Data, 2016 levels) 88 The sensitivity was performed in the earlier phase of this study, based on data from the SR 11 BTDM (Version 2.0, February 12, 2018). The results of the economic analysis based on the updated SR 11 BTDM (Tier II Traffic and Revenue, April 2020) have not changed drastically, so the conclusions from the sensitivity analysis performed in the earlier phase of this study remain applicable.
SANDAG | Impacts of Border Delays at California-Baja California Land Ports of Entry Volume 1: Background and Summary of Findings
52
FORECASTING FUTURE DELAYS FOR BORDER-CROSSING TRIPS The current study estimated growth rates to forecast northbound and southbound border-crossing delays, by POE and mode, for the years 2025 and 2035. Base year (2016) delays were used as a starting point to forecast future delays.89 Growth rates for delays were taken from two sources, based on the POE. For San Ysidro, Otay Mesa, and Otay Mesa East, growth rates for delays were generated by the SR 11 BTDM wait times for these POEs, for each scenario. For the remaining POEs in the California-Baja California region (i.e., Tecate, Calexico West, Calexico East, and Andrade), growth rates for delays for each scenario were developed using a framework that relied on forecasted volumes by POE as the main input.
The framework is commonly used for land port of entry (POE) emissions analyses and leverages approaches developed for the U.S. Federal Highway Administration (FHWA) and the U.S. – Mexico Joint Working Committee on Transportation Planning in the United States-Mexico POE Emissions and Border Wait-Time Analysis Template (JWC template)90. In particular, the framework utilizes queue models to study each process at the POE, along with forecasted volumes for each lane type, to estimate how much delay and queuing POVs and commercial vehicles will experience as they cross the border (more details about the JWC template are presented in Volume 3). This framework was employed in the emissions analysis performed in 2018 as part of this study effort, before data from the updated SR 11 BTDM (April 2020) was available.
The characteristics of the different future scenarios were incorporated into the framework to create scenario-specific queue models for each POE. Those queue models were then combined with the corresponding POE-specific border-crossing volumes forecasted for each vehicle type under each scenario to estimate future delays at the scenario level for each direction of movement (northbound and southbound).91
However, neither the SR 11 BTDM nor the framework estimate delays for pedestrian flows. Therefore, it was assumed that at the county level, pedestrian delays would grow in future years at the same rate as passenger vehicle delays at the county level. For each Imperial County POE, the analysis assumed that growth in pedestrian delay at a given POE was equal to the county-wide growth in delay, for each direction and each scenario. For Tecate, the analysis assumed the growth rates from the economic analysis performed in 2018 for pedestrian delay. Finally, growth rates for pedestrian delay at San Ysidro and Otay Mesa were set such that the county-wide growth in pedestrian delay was equal to the county-wide growth in passenger vehicle delay. The growth rate of delay for pedestrians was combined with the 2016 measures of delays for pedestrian delay at the POE level to estimate future pedestrian delays under each scenario.
89 Base year (2016) border delays on both directions were identified through data collection efforts performed as part of this study (see Summary of Wait Time Data Collected section in this Volume) 90 FHWA, United States-Mexico Land Ports-of-Entry Emissions and Border Wait-Time White Paper and Analysis Template. 2012. 91 The basis of the queuing models in the draft emissions analysis in 2018 was a preliminary set of forecasted border crossing volumes (by scenario), which were derived from volume growth rates generated by the SR 11 BTDM (Version 2.0, February 12, 2018).
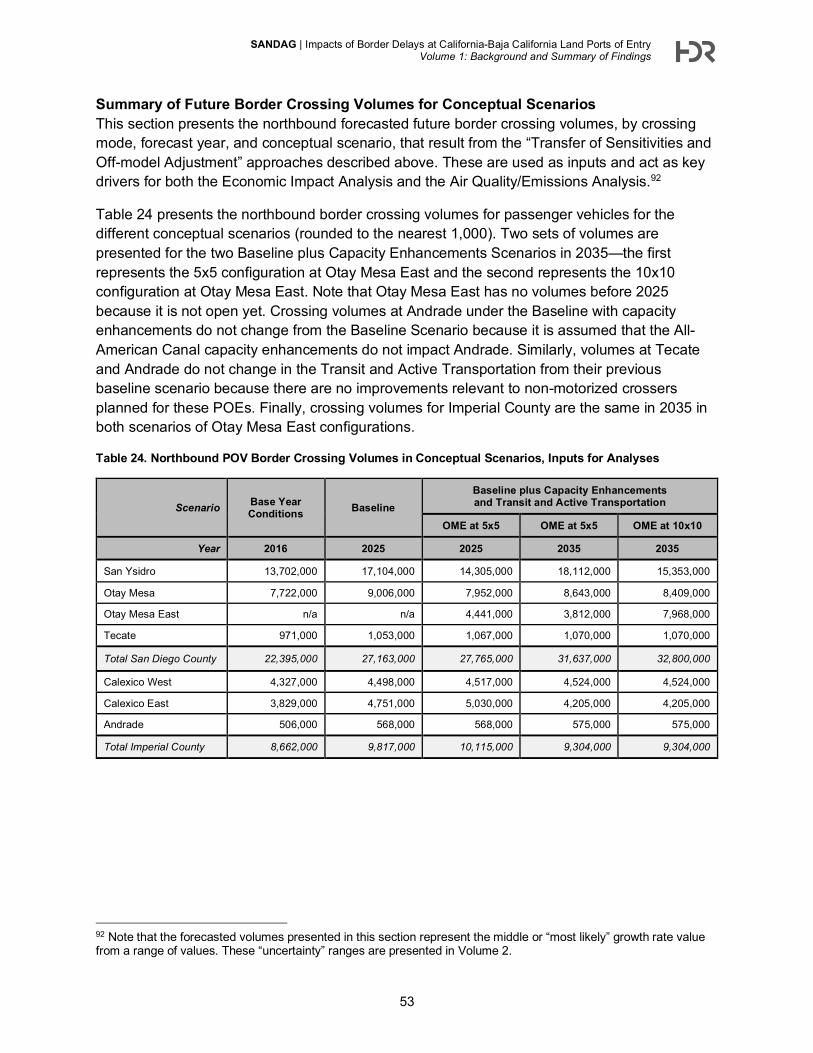
SANDAG | Impacts of Border Delays at California-Baja California Land Ports of Entry Volume 1: Background and Summary of Findings
53
Summary of Future Border Crossing Volumes for Conceptual Scenarios This section presents the northbound forecasted future border crossing volumes, by crossing mode, forecast year, and conceptual scenario, that result from the “Transfer of Sensitivities and Off-model Adjustment” approaches described above. These are used as inputs and act as key drivers for both the Economic Impact Analysis and the Air Quality/Emissions Analysis.92
Table 24 presents the northbound border crossing volumes for passenger vehicles for the different conceptual scenarios (rounded to the nearest 1,000). Two sets of volumes are presented for the two Baseline plus Capacity Enhancements Scenarios in 2035—the first represents the 5x5 configuration at Otay Mesa East and the second represents the 10x10 configuration at Otay Mesa East. Note that Otay Mesa East has no volumes before 2025 because it is not open yet. Crossing volumes at Andrade under the Baseline with capacity enhancements do not change from the Baseline Scenario because it is assumed that the All-American Canal capacity enhancements do not impact Andrade. Similarly, volumes at Tecate and Andrade do not change in the Transit and Active Transportation from their previous baseline scenario because there are no improvements relevant to non-motorized crossers planned for these POEs. Finally, crossing volumes for Imperial County are the same in 2035 in both scenarios of Otay Mesa East configurations.
Table 24. Northbound POV Border Crossing Volumes in Conceptual Scenarios, Inputs for Analyses
Scenario Base Year Conditions Baseline
Baseline plus Capacity Enhancements and Transit and Active Transportation
OME at 5x5 OME at 5x5 OME at 10x10
Year 2016 2025 2025 2035 2035
San Ysidro 13,702,000 17,104,000 14,305,000 18,112,000 15,353,000
Otay Mesa 7,722,000 9,006,000 7,952,000 8,643,000 8,409,000
Otay Mesa East n/a n/a 4,441,000 3,812,000 7,968,000
Tecate 971,000 1,053,000 1,067,000 1,070,000 1,070,000
Total San Diego County 22,395,000 27,163,000 27,765,000 31,637,000 32,800,000
Calexico West 4,327,000 4,498,000 4,517,000 4,524,000 4,524,000
Calexico East 3,829,000 4,751,000 5,030,000 4,205,000 4,205,000
Andrade 506,000 568,000 568,000 575,000 575,000
Total Imperial County 8,662,000 9,817,000 10,115,000 9,304,000 9,304,000
92 Note that the forecasted volumes presented in this section represent the middle or “most likely” growth rate value from a range of values. These “uncertainty” ranges are presented in Volume 2.
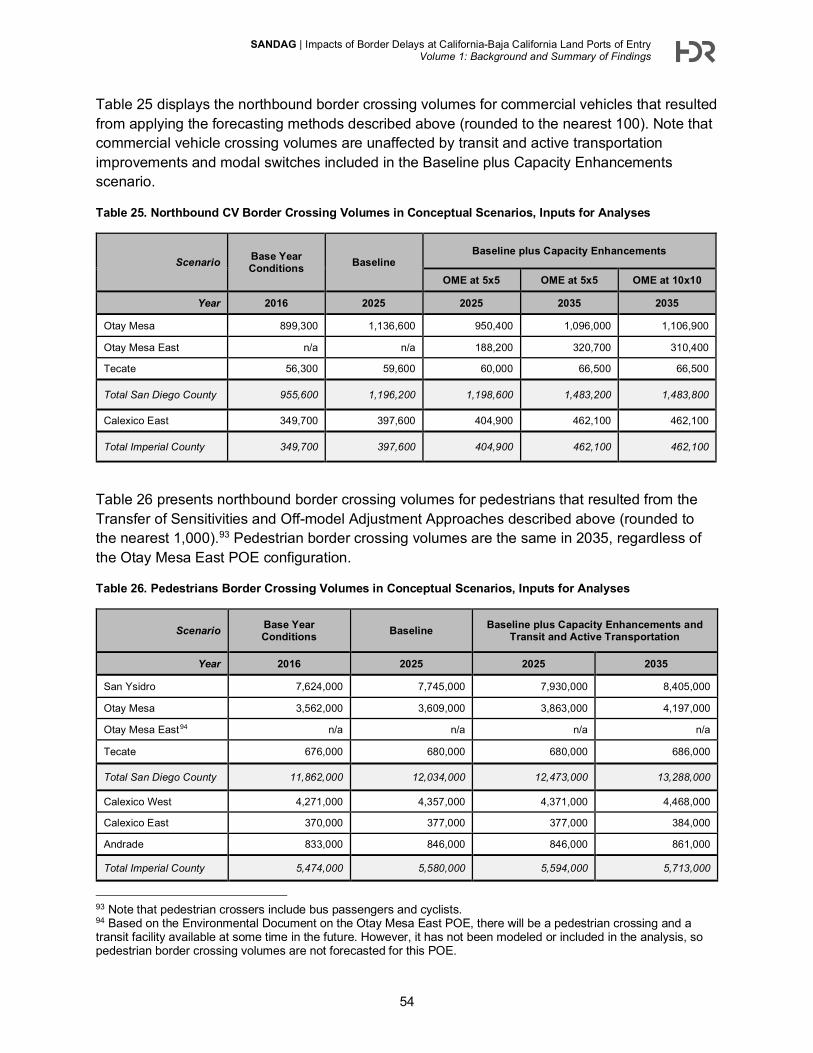
SANDAG | Impacts of Border Delays at California-Baja California Land Ports of Entry Volume 1: Background and Summary of Findings
54
Table 25 displays the northbound border crossing volumes for commercial vehicles that resulted from applying the forecasting methods described above (rounded to the nearest 100). Note that commercial vehicle crossing volumes are unaffected by transit and active transportation improvements and modal switches included in the Baseline plus Capacity Enhancements scenario.
Table 25. Northbound CV Border Crossing Volumes in Conceptual Scenarios, Inputs for Analyses
Scenario Base Year Conditions Baseline
Baseline plus Capacity Enhancements
OME at 5x5 OME at 5x5 OME at 10x10
Year 2016 2025 2025 2035 2035
Otay Mesa 899,300 1,136,600 950,400 1,096,000 1,106,900
Otay Mesa East n/a n/a 188,200 320,700 310,400
Tecate 56,300 59,600 60,000 66,500 66,500
Total San Diego County 955,600 1,196,200 1,198,600 1,483,200 1,483,800
Calexico East 349,700 397,600 404,900 462,100 462,100
Total Imperial County 349,700 397,600 404,900 462,100 462,100
Table 26 presents northbound border crossing volumes for pedestrians that resulted from the Transfer of Sensitivities and Off-model Adjustment Approaches described above (rounded to the nearest 1,000).93 Pedestrian border crossing volumes are the same in 2035, regardless of the Otay Mesa East POE configuration.
Table 26. Pedestrians Border Crossing Volumes in Conceptual Scenarios, Inputs for Analyses
Scenario Base Year Conditions Baseline Baseline plus Capacity Enhancements and
Transit and Active Transportation
Year 2016 2025 2025 2035
San Ysidro 7,624,000 7,745,000 7,930,000 8,405,000
Otay Mesa 3,562,000 3,609,000 3,863,000 4,197,000
Otay Mesa East94 n/a n/a n/a n/a
Tecate 676,000 680,000 680,000 686,000
Total San Diego County 11,862,000 12,034,000 12,473,000 13,288,000
Calexico West 4,271,000 4,357,000 4,371,000 4,468,000
Calexico East 370,000 377,000 377,000 384,000
Andrade 833,000 846,000 846,000 861,000
Total Imperial County 5,474,000 5,580,000 5,594,000 5,713,000
93 Note that pedestrian crossers include bus passengers and cyclists. 94 Based on the Environmental Document on the Otay Mesa East POE, there will be a pedestrian crossing and a transit facility available at some time in the future. However, it has not been modeled or included in the analysis, so pedestrian border crossing volumes are not forecasted for this POE.
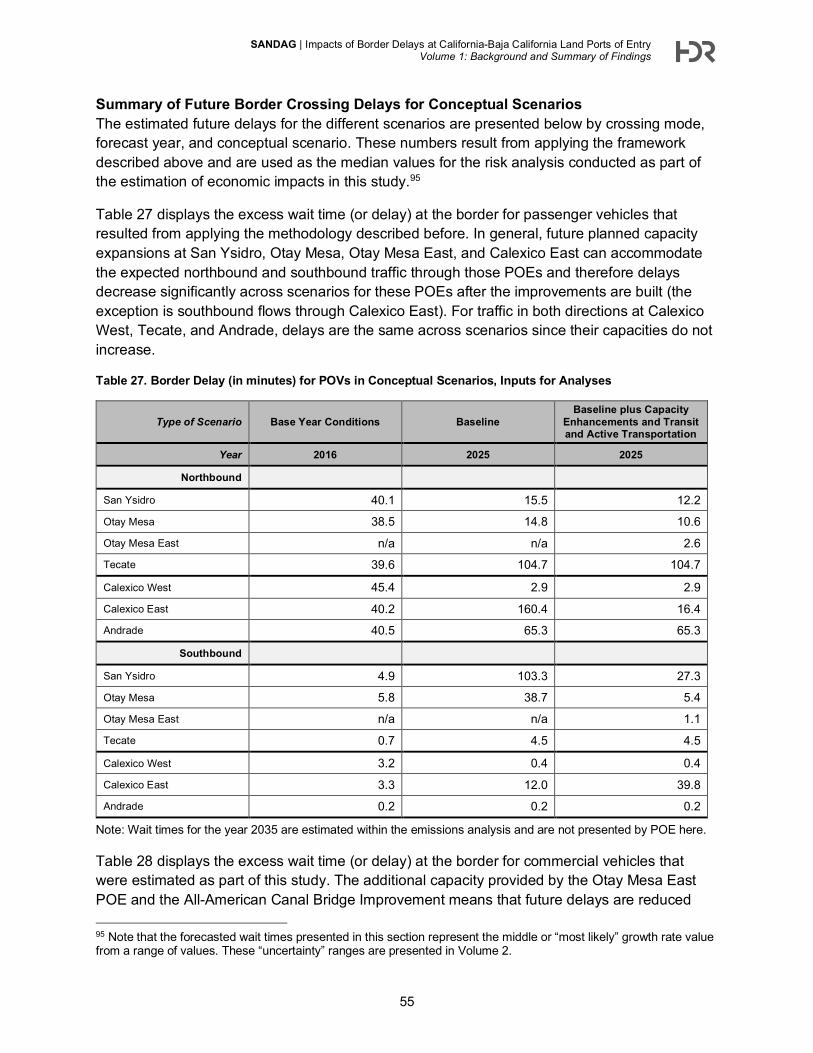
SANDAG | Impacts of Border Delays at California-Baja California Land Ports of Entry Volume 1: Background and Summary of Findings
55
Summary of Future Border Crossing Delays for Conceptual Scenarios The estimated future delays for the different scenarios are presented below by crossing mode, forecast year, and conceptual scenario. These numbers result from applying the framework described above and are used as the median values for the risk analysis conducted as part of the estimation of economic impacts in this study.95
Table 27 displays the excess wait time (or delay) at the border for passenger vehicles that resulted from applying the methodology described before. In general, future planned capacity expansions at San Ysidro, Otay Mesa, Otay Mesa East, and Calexico East can accommodate the expected northbound and southbound traffic through those POEs and therefore delays decrease significantly across scenarios for these POEs after the improvements are built (the exception is southbound flows through Calexico East). For traffic in both directions at Calexico West, Tecate, and Andrade, delays are the same across scenarios since their capacities do not increase.
Table 27. Border Delay (in minutes) for POVs in Conceptual Scenarios, Inputs for Analyses
Type of Scenario Base Year Conditions Baseline Baseline plus Capacity
Enhancements and Transit and Active Transportation
Year 2016 2025 2025
Northbound
San Ysidro 40.1 15.5 12.2
Otay Mesa 38.5 14.8 10.6
Otay Mesa East n/a n/a 2.6
Tecate 39.6 104.7 104.7
Calexico West 45.4 2.9 2.9
Calexico East 40.2 160.4 16.4
Andrade 40.5 65.3 65.3
Southbound
San Ysidro 4.9 103.3 27.3
Otay Mesa 5.8 38.7 5.4
Otay Mesa East n/a n/a 1.1
Tecate 0.7 4.5 4.5
Calexico West 3.2 0.4 0.4
Calexico East 3.3 12.0 39.8
Andrade 0.2 0.2 0.2
Note: Wait times for the year 2035 are estimated within the emissions analysis and are not presented by POE here.
Table 28 displays the excess wait time (or delay) at the border for commercial vehicles that were estimated as part of this study. The additional capacity provided by the Otay Mesa East POE and the All-American Canal Bridge Improvement means that future delays are reduced
95 Note that the forecasted wait times presented in this section represent the middle or “most likely” growth rate value from a range of values. These “uncertainty” ranges are presented in Volume 2.
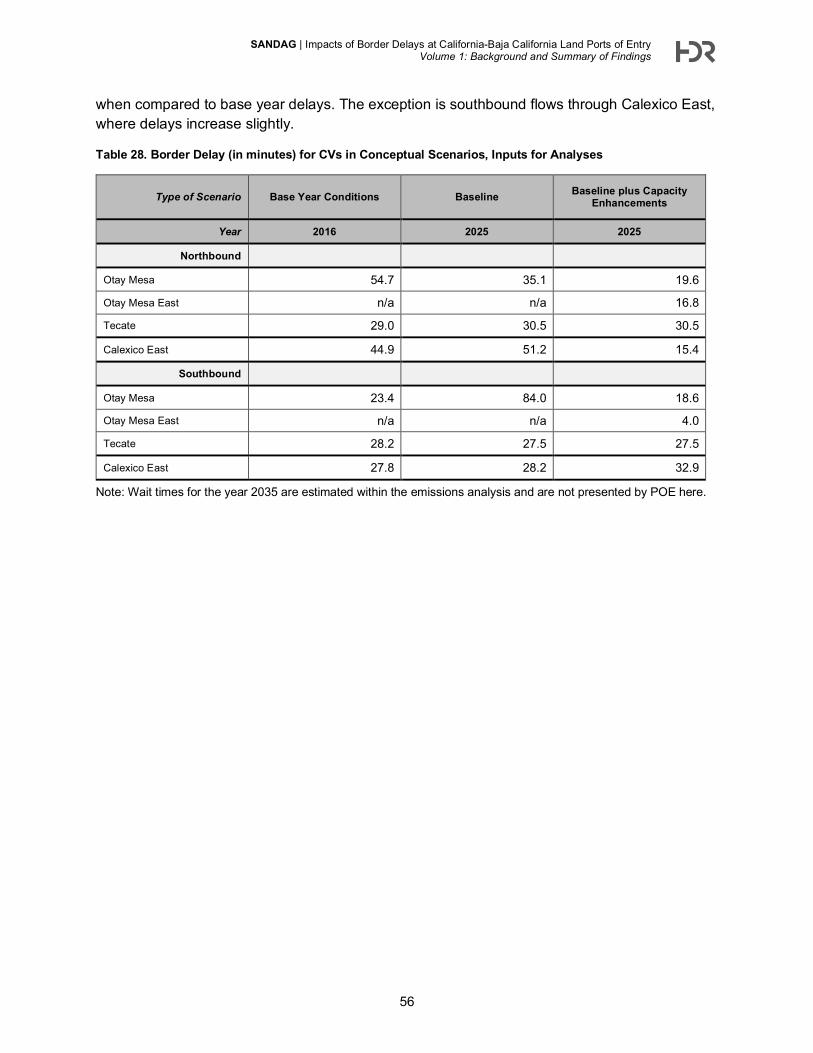
SANDAG | Impacts of Border Delays at California-Baja California Land Ports of Entry Volume 1: Background and Summary of Findings
56
when compared to base year delays. The exception is southbound flows through Calexico East, where delays increase slightly.
Table 28. Border Delay (in minutes) for CVs in Conceptual Scenarios, Inputs for Analyses
Type of Scenario Base Year Conditions Baseline Baseline plus Capacity Enhancements
Year 2016 2025 2025
Northbound
Otay Mesa 54.7 35.1 19.6
Otay Mesa East n/a n/a 16.8
Tecate 29.0 30.5 30.5
Calexico East 44.9 51.2 15.4
Southbound
Otay Mesa 23.4 84.0 18.6
Otay Mesa East n/a n/a 4.0
Tecate 28.2 27.5 27.5
Calexico East 27.8 28.2 32.9
Note: Wait times for the year 2035 are estimated within the emissions analysis and are not presented by POE here.
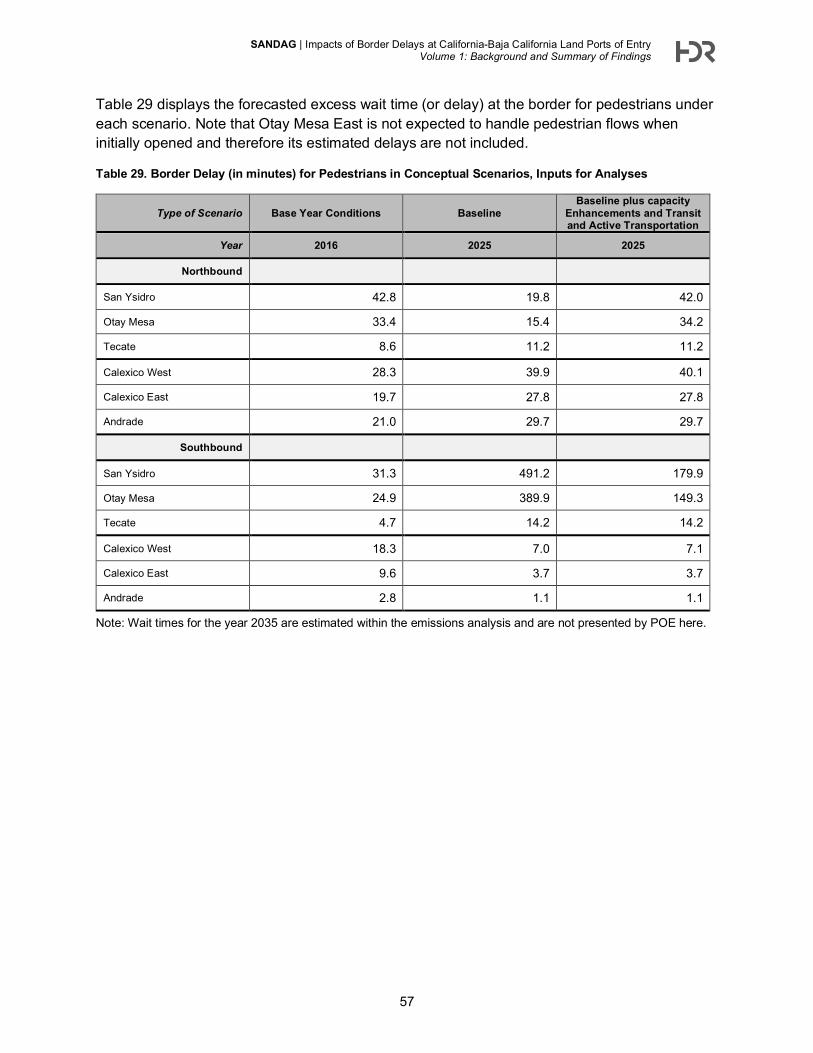
SANDAG | Impacts of Border Delays at California-Baja California Land Ports of Entry Volume 1: Background and Summary of Findings
57
Table 29 displays the forecasted excess wait time (or delay) at the border for pedestrians under each scenario. Note that Otay Mesa East is not expected to handle pedestrian flows when initially opened and therefore its estimated delays are not included.
Table 29. Border Delay (in minutes) for Pedestrians in Conceptual Scenarios, Inputs for Analyses
Type of Scenario Base Year Conditions Baseline Baseline plus capacity
Enhancements and Transit and Active Transportation
Year 2016 2025 2025
Northbound
San Ysidro 42.8 19.8 42.0
Otay Mesa 33.4 15.4 34.2
Tecate 8.6 11.2 11.2
Calexico West 28.3 39.9 40.1
Calexico East 19.7 27.8 27.8
Andrade 21.0 29.7 29.7
Southbound
San Ysidro 31.3 491.2 179.9
Otay Mesa 24.9 389.9 149.3
Tecate 4.7 14.2 14.2
Calexico West 18.3 7.0 7.1
Calexico East 9.6 3.7 3.7
Andrade 2.8 1.1 1.1
Note: Wait times for the year 2035 are estimated within the emissions analysis and are not presented by POE here.
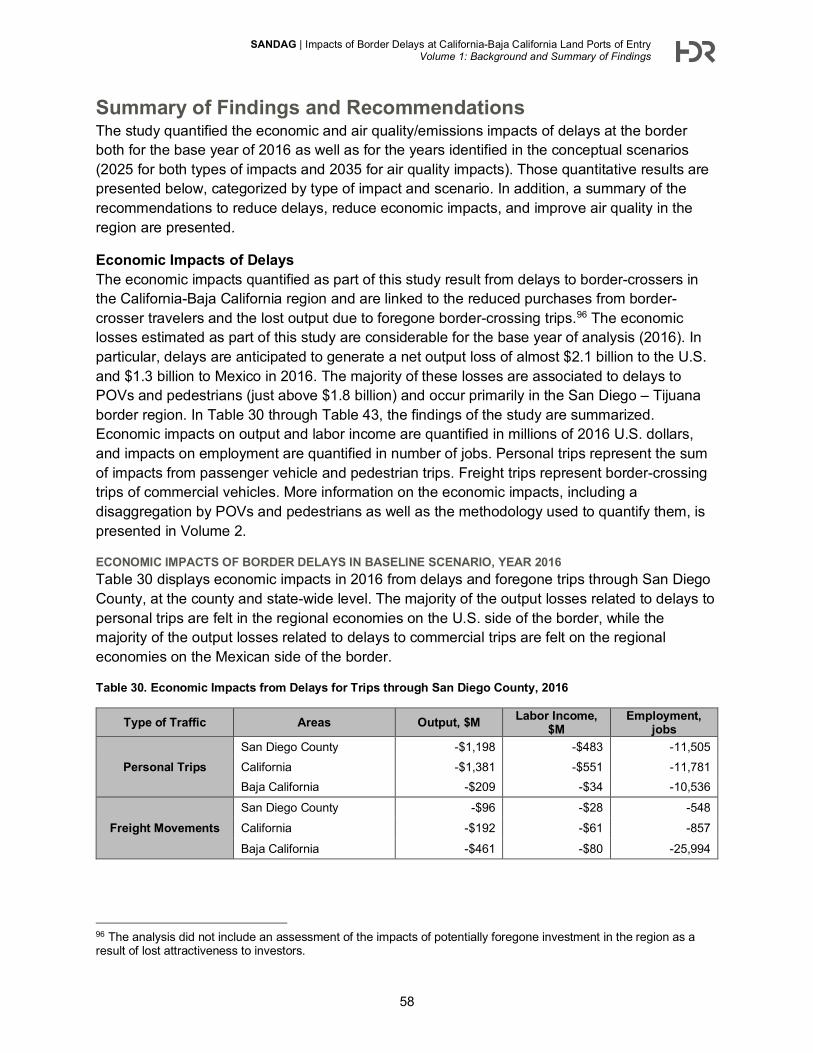
SANDAG | Impacts of Border Delays at California-Baja California Land Ports of Entry Volume 1: Background and Summary of Findings
58
Summary of Findings and Recommendations The study quantified the economic and air quality/emissions impacts of delays at the border both for the base year of 2016 as well as for the years identified in the conceptual scenarios (2025 for both types of impacts and 2035 for air quality impacts). Those quantitative results are presented below, categorized by type of impact and scenario. In addition, a summary of the recommendations to reduce delays, reduce economic impacts, and improve air quality in the region are presented.
Economic Impacts of Delays The economic impacts quantified as part of this study result from delays to border-crossers in the California-Baja California region and are linked to the reduced purchases from border-crosser travelers and the lost output due to foregone border-crossing trips.96 The economic losses estimated as part of this study are considerable for the base year of analysis (2016). In particular, delays are anticipated to generate a net output loss of almost $2.1 billion to the U.S. and $1.3 billion to Mexico in 2016. The majority of these losses are associated to delays to POVs and pedestrians (just above $1.8 billion) and occur primarily in the San Diego – Tijuana border region. In Table 30 through Table 43, the findings of the study are summarized. Economic impacts on output and labor income are quantified in millions of 2016 U.S. dollars, and impacts on employment are quantified in number of jobs. Personal trips represent the sum of impacts from passenger vehicle and pedestrian trips. Freight trips represent border-crossing trips of commercial vehicles. More information on the economic impacts, including a disaggregation by POVs and pedestrians as well as the methodology used to quantify them, is presented in Volume 2.
ECONOMIC IMPACTS OF BORDER DELAYS IN BASELINE SCENARIO, YEAR 2016 Table 30 displays economic impacts in 2016 from delays and foregone trips through San Diego County, at the county and state-wide level. The majority of the output losses related to delays to personal trips are felt in the regional economies on the U.S. side of the border, while the majority of the output losses related to delays to commercial trips are felt on the regional economies on the Mexican side of the border.
Table 30. Economic Impacts from Delays for Trips through San Diego County, 2016
Type of Traffic Areas Output, $M Labor Income, $M
Employment, jobs
Personal Trips San Diego County -$1,198 -$483 -11,505 California -$1,381 -$551 -11,781 Baja California -$209 -$34 -10,536
Freight Movements San Diego County -$96 -$28 -548 California -$192 -$61 -857
Baja California -$461 -$80 -25,994
96 The analysis did not include an assessment of the impacts of potentially foregone investment in the region as a result of lost attractiveness to investors.
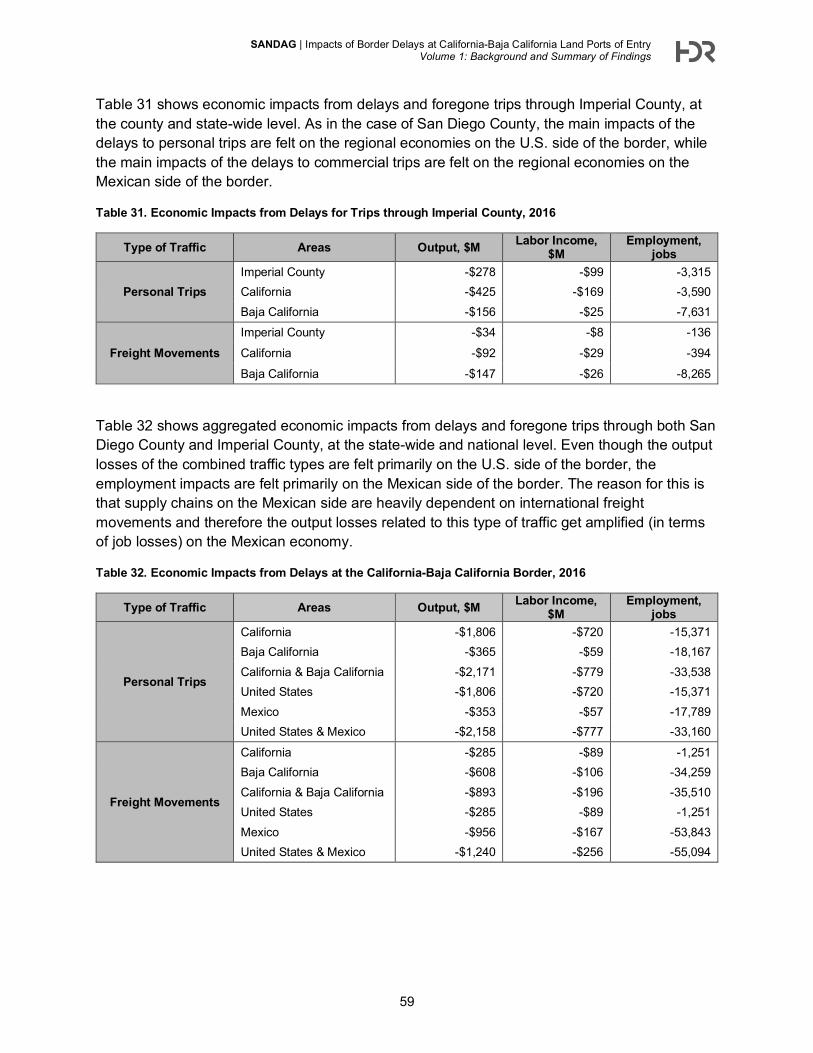
SANDAG | Impacts of Border Delays at California-Baja California Land Ports of Entry Volume 1: Background and Summary of Findings
59
Table 31 shows economic impacts from delays and foregone trips through Imperial County, at the county and state-wide level. As in the case of San Diego County, the main impacts of the delays to personal trips are felt on the regional economies on the U.S. side of the border, while the main impacts of the delays to commercial trips are felt on the regional economies on the Mexican side of the border.
Table 31. Economic Impacts from Delays for Trips through Imperial County, 2016
Type of Traffic Areas Output, $M Labor Income, $M
Employment, jobs
Personal Trips Imperial County -$278 -$99 -3,315 California -$425 -$169 -3,590 Baja California -$156 -$25 -7,631
Freight Movements Imperial County -$34 -$8 -136
California -$92 -$29 -394
Baja California -$147 -$26 -8,265
Table 32 shows aggregated economic impacts from delays and foregone trips through both San Diego County and Imperial County, at the state-wide and national level. Even though the output losses of the combined traffic types are felt primarily on the U.S. side of the border, the employment impacts are felt primarily on the Mexican side of the border. The reason for this is that supply chains on the Mexican side are heavily dependent on international freight movements and therefore the output losses related to this type of traffic get amplified (in terms of job losses) on the Mexican economy.
Table 32. Economic Impacts from Delays at the California-Baja California Border, 2016
Type of Traffic Areas Output, $M Labor Income, $M
Employment, jobs
Personal Trips
California -$1,806 -$720 -15,371 Baja California -$365 -$59 -18,167 California & Baja California -$2,171 -$779 -33,538 United States -$1,806 -$720 -15,371 Mexico -$353 -$57 -17,789 United States & Mexico -$2,158 -$777 -33,160
Freight Movements
California -$285 -$89 -1,251 Baja California -$608 -$106 -34,259 California & Baja California -$893 -$196 -35,510 United States -$285 -$89 -1,251 Mexico -$956 -$167 -53,843 United States & Mexico -$1,240 -$256 -55,094
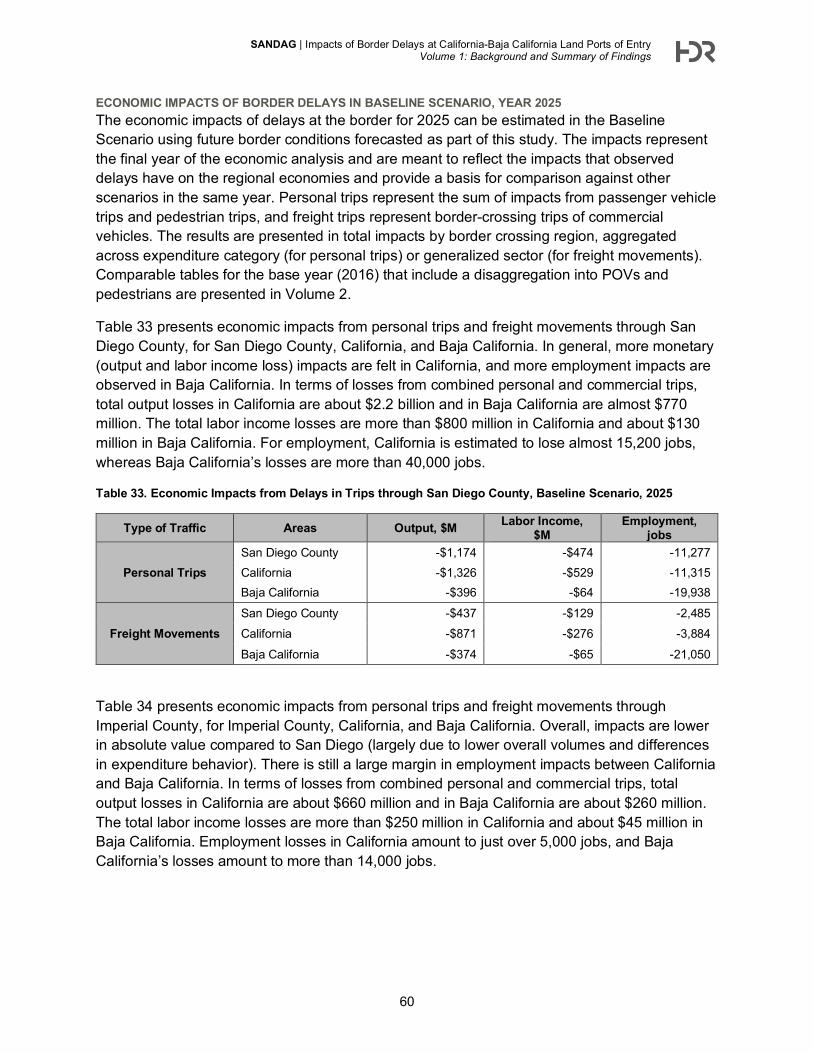
SANDAG | Impacts of Border Delays at California-Baja California Land Ports of Entry Volume 1: Background and Summary of Findings
60
ECONOMIC IMPACTS OF BORDER DELAYS IN BASELINE SCENARIO, YEAR 2025 The economic impacts of delays at the border for 2025 can be estimated in the Baseline Scenario using future border conditions forecasted as part of this study. The impacts represent the final year of the economic analysis and are meant to reflect the impacts that observed delays have on the regional economies and provide a basis for comparison against other scenarios in the same year. Personal trips represent the sum of impacts from passenger vehicle trips and pedestrian trips, and freight trips represent border-crossing trips of commercial vehicles. The results are presented in total impacts by border crossing region, aggregated across expenditure category (for personal trips) or generalized sector (for freight movements). Comparable tables for the base year (2016) that include a disaggregation into POVs and pedestrians are presented in Volume 2.
Table 33 presents economic impacts from personal trips and freight movements through San Diego County, for San Diego County, California, and Baja California. In general, more monetary (output and labor income loss) impacts are felt in California, and more employment impacts are observed in Baja California. In terms of losses from combined personal and commercial trips, total output losses in California are about $2.2 billion and in Baja California are almost $770 million. The total labor income losses are more than $800 million in California and about $130 million in Baja California. For employment, California is estimated to lose almost 15,200 jobs, whereas Baja California’s losses are more than 40,000 jobs.
Table 33. Economic Impacts from Delays in Trips through San Diego County, Baseline Scenario, 2025
Type of Traffic Areas Output, $M Labor Income, $M
Employment, jobs
Personal Trips San Diego County -$1,174 -$474 -11,277 California -$1,326 -$529 -11,315 Baja California -$396 -$64 -19,938
Freight Movements San Diego County -$437 -$129 -2,485 California -$871 -$276 -3,884
Baja California -$374 -$65 -21,050
Table 34 presents economic impacts from personal trips and freight movements through Imperial County, for Imperial County, California, and Baja California. Overall, impacts are lower in absolute value compared to San Diego (largely due to lower overall volumes and differences in expenditure behavior). There is still a large margin in employment impacts between California and Baja California. In terms of losses from combined personal and commercial trips, total output losses in California are about $660 million and in Baja California are about $260 million. The total labor income losses are more than $250 million in California and about $45 million in Baja California. Employment losses in California amount to just over 5,000 jobs, and Baja California’s losses amount to more than 14,000 jobs.
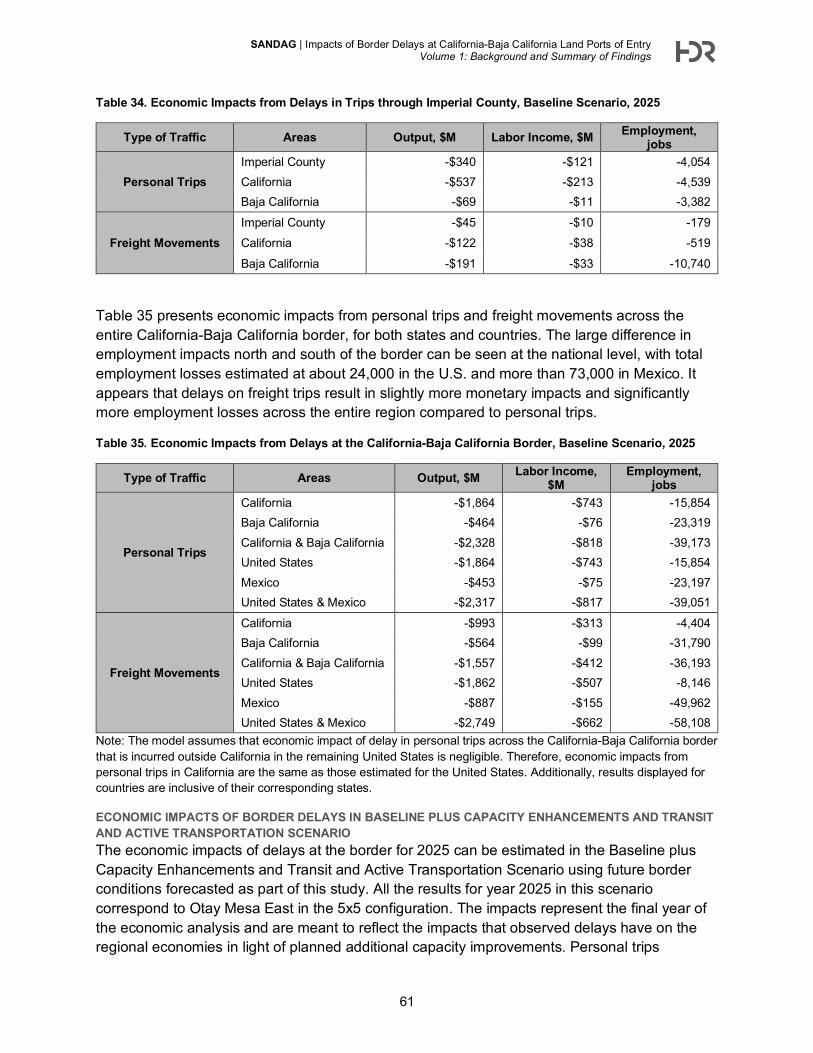
SANDAG | Impacts of Border Delays at California-Baja California Land Ports of Entry Volume 1: Background and Summary of Findings
61
Table 34. Economic Impacts from Delays in Trips through Imperial County, Baseline Scenario, 2025
Type of Traffic Areas Output, $M Labor Income, $M Employment, jobs
Personal Trips Imperial County -$340 -$121 -4,054 California -$537 -$213 -4,539 Baja California -$69 -$11 -3,382
Freight Movements Imperial County -$45 -$10 -179 California -$122 -$38 -519
Baja California -$191 -$33 -10,740
Table 35 presents economic impacts from personal trips and freight movements across the entire California-Baja California border, for both states and countries. The large difference in employment impacts north and south of the border can be seen at the national level, with total employment losses estimated at about 24,000 in the U.S. and more than 73,000 in Mexico. It appears that delays on freight trips result in slightly more monetary impacts and significantly more employment losses across the entire region compared to personal trips.
Table 35. Economic Impacts from Delays at the California-Baja California Border, Baseline Scenario, 2025
Type of Traffic Areas Output, $M Labor Income, $M
Employment, jobs
Personal Trips
California -$1,864 -$743 -15,854 Baja California -$464 -$76 -23,319 California & Baja California -$2,328 -$818 -39,173 United States -$1,864 -$743 -15,854 Mexico -$453 -$75 -23,197 United States & Mexico -$2,317 -$817 -39,051
Freight Movements
California -$993 -$313 -4,404 Baja California -$564 -$99 -31,790 California & Baja California -$1,557 -$412 -36,193 United States -$1,862 -$507 -8,146 Mexico -$887 -$155 -49,962 United States & Mexico -$2,749 -$662 -58,108
Note: The model assumes that economic impact of delay in personal trips across the California-Baja California border that is incurred outside California in the remaining United States is negligible. Therefore, economic impacts from personal trips in California are the same as those estimated for the United States. Additionally, results displayed for countries are inclusive of their corresponding states.
ECONOMIC IMPACTS OF BORDER DELAYS IN BASELINE PLUS CAPACITY ENHANCEMENTS AND TRANSIT AND ACTIVE TRANSPORTATION SCENARIO The economic impacts of delays at the border for 2025 can be estimated in the Baseline plus Capacity Enhancements and Transit and Active Transportation Scenario using future border conditions forecasted as part of this study. All the results for year 2025 in this scenario correspond to Otay Mesa East in the 5x5 configuration. The impacts represent the final year of the economic analysis and are meant to reflect the impacts that observed delays have on the regional economies in light of planned additional capacity improvements. Personal trips
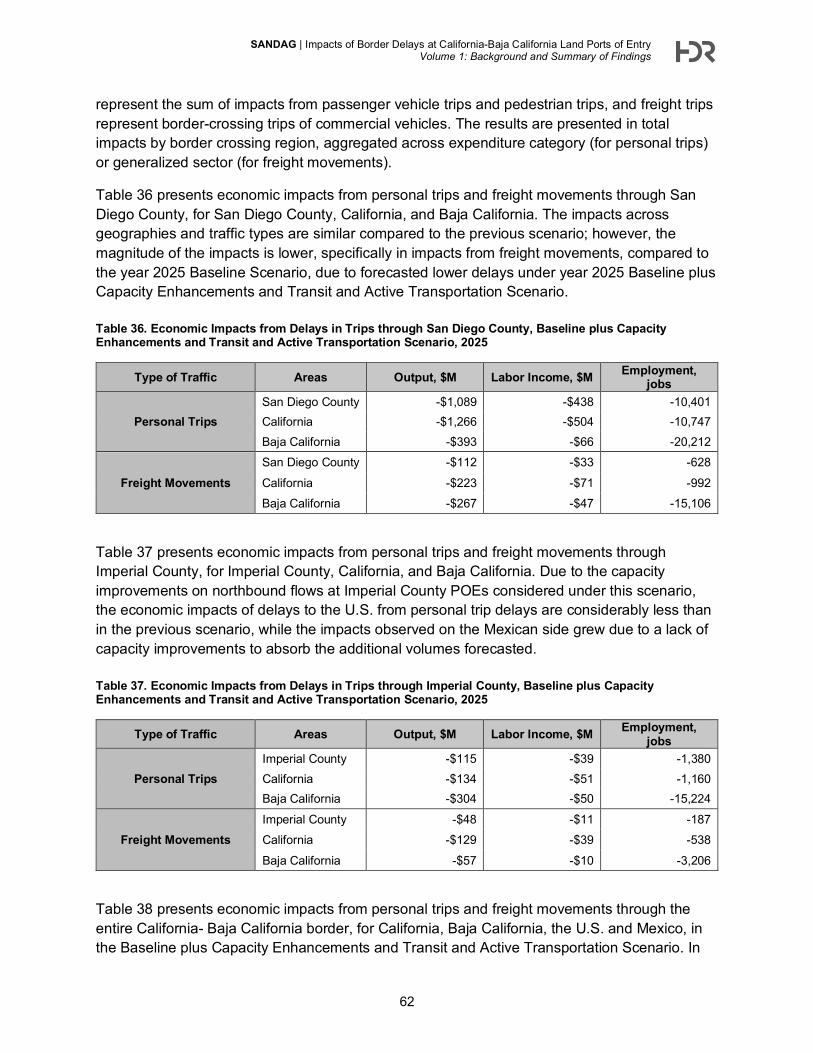
SANDAG | Impacts of Border Delays at California-Baja California Land Ports of Entry Volume 1: Background and Summary of Findings
62
represent the sum of impacts from passenger vehicle trips and pedestrian trips, and freight trips represent border-crossing trips of commercial vehicles. The results are presented in total impacts by border crossing region, aggregated across expenditure category (for personal trips) or generalized sector (for freight movements).
Table 36 presents economic impacts from personal trips and freight movements through San Diego County, for San Diego County, California, and Baja California. The impacts across geographies and traffic types are similar compared to the previous scenario; however, the magnitude of the impacts is lower, specifically in impacts from freight movements, compared to the year 2025 Baseline Scenario, due to forecasted lower delays under year 2025 Baseline plus Capacity Enhancements and Transit and Active Transportation Scenario. Table 36. Economic Impacts from Delays in Trips through San Diego County, Baseline plus Capacity Enhancements and Transit and Active Transportation Scenario, 2025
Type of Traffic Areas Output, $M Labor Income, $M Employment, jobs
Personal Trips San Diego County -$1,089 -$438 -10,401 California -$1,266 -$504 -10,747 Baja California -$393 -$66 -20,212
Freight Movements San Diego County -$112 -$33 -628
California -$223 -$71 -992 Baja California -$267 -$47 -15,106
Table 37 presents economic impacts from personal trips and freight movements through Imperial County, for Imperial County, California, and Baja California. Due to the capacity improvements on northbound flows at Imperial County POEs considered under this scenario, the economic impacts of delays to the U.S. from personal trip delays are considerably less than in the previous scenario, while the impacts observed on the Mexican side grew due to a lack of capacity improvements to absorb the additional volumes forecasted. Table 37. Economic Impacts from Delays in Trips through Imperial County, Baseline plus Capacity Enhancements and Transit and Active Transportation Scenario, 2025
Type of Traffic Areas Output, $M Labor Income, $M Employment, jobs
Personal Trips Imperial County -$115 -$39 -1,380 California -$134 -$51 -1,160 Baja California -$304 -$50 -15,224
Freight Movements Imperial County -$48 -$11 -187 California -$129 -$39 -538
Baja California -$57 -$10 -3,206
Table 38 presents economic impacts from personal trips and freight movements through the entire California- Baja California border, for California, Baja California, the U.S. and Mexico, in the Baseline plus Capacity Enhancements and Transit and Active Transportation Scenario. In
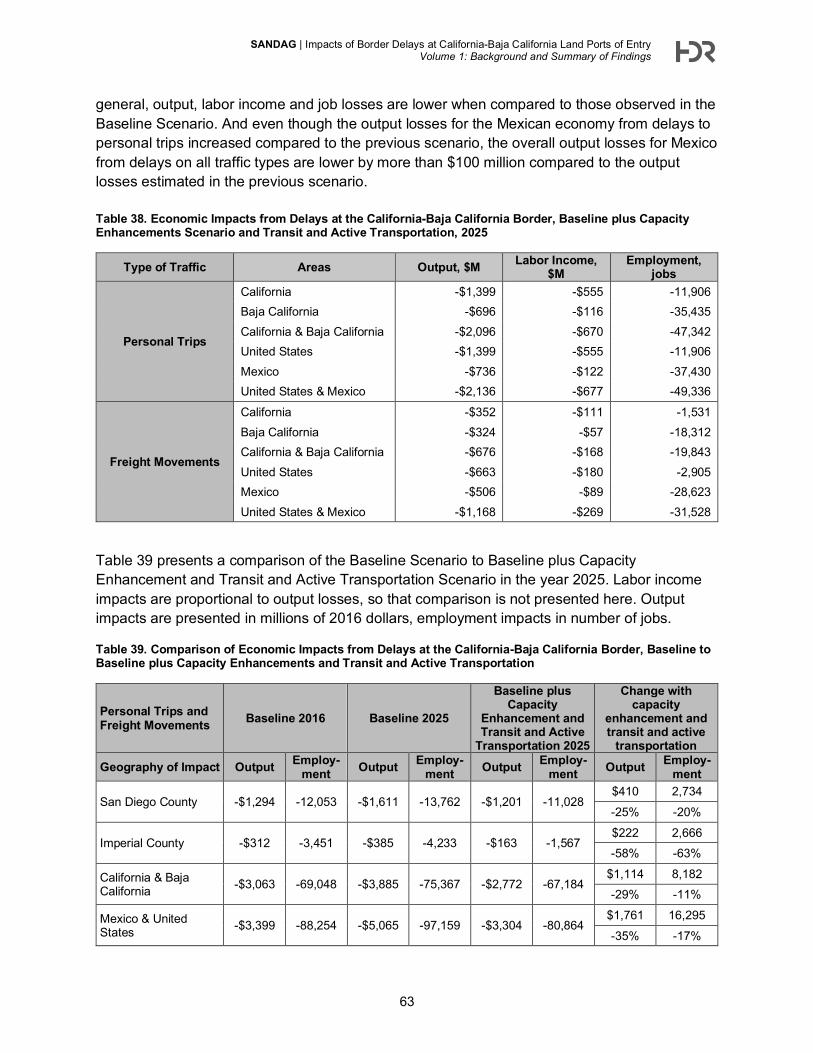
SANDAG | Impacts of Border Delays at California-Baja California Land Ports of Entry Volume 1: Background and Summary of Findings
63
general, output, labor income and job losses are lower when compared to those observed in the Baseline Scenario. And even though the output losses for the Mexican economy from delays to personal trips increased compared to the previous scenario, the overall output losses for Mexico from delays on all traffic types are lower by more than $100 million compared to the output losses estimated in the previous scenario. Table 38. Economic Impacts from Delays at the California-Baja California Border, Baseline plus Capacity Enhancements Scenario and Transit and Active Transportation, 2025
Type of Traffic Areas Output, $M Labor Income, $M
Employment, jobs
Personal Trips
California -$1,399 -$555 -11,906 Baja California -$696 -$116 -35,435 California & Baja California -$2,096 -$670 -47,342 United States -$1,399 -$555 -11,906 Mexico -$736 -$122 -37,430 United States & Mexico -$2,136 -$677 -49,336
Freight Movements
California -$352 -$111 -1,531 Baja California -$324 -$57 -18,312 California & Baja California -$676 -$168 -19,843 United States -$663 -$180 -2,905 Mexico -$506 -$89 -28,623 United States & Mexico -$1,168 -$269 -31,528
Table 39 presents a comparison of the Baseline Scenario to Baseline plus Capacity Enhancement and Transit and Active Transportation Scenario in the year 2025. Labor income impacts are proportional to output losses, so that comparison is not presented here. Output impacts are presented in millions of 2016 dollars, employment impacts in number of jobs.
Table 39. Comparison of Economic Impacts from Delays at the California-Baja California Border, Baseline to Baseline plus Capacity Enhancements and Transit and Active Transportation
Personal Trips and Freight Movements Baseline 2016 Baseline 2025
Baseline plus Capacity
Enhancement and Transit and Active
Transportation 2025
Change with capacity
enhancement and transit and active
transportation Geography of Impact Output Employ-
ment Output Employ-ment Output Employ-
ment Output Employ-ment
San Diego County -$1,294 -12,053 -$1,611 -13,762 -$1,201 -11,028 $410 2,734
-25% -20%
Imperial County -$312 -3,451 -$385 -4,233 -$163 -1,567 $222 2,666 -58% -63%
California & Baja California -$3,063 -69,048 -$3,885 -75,367 -$2,772 -67,184
$1,114 8,182 -29% -11%
Mexico & United States -$3,399 -88,254 -$5,065 -97,159 -$3,304 -80,864
$1,761 16,295
-35% -17%
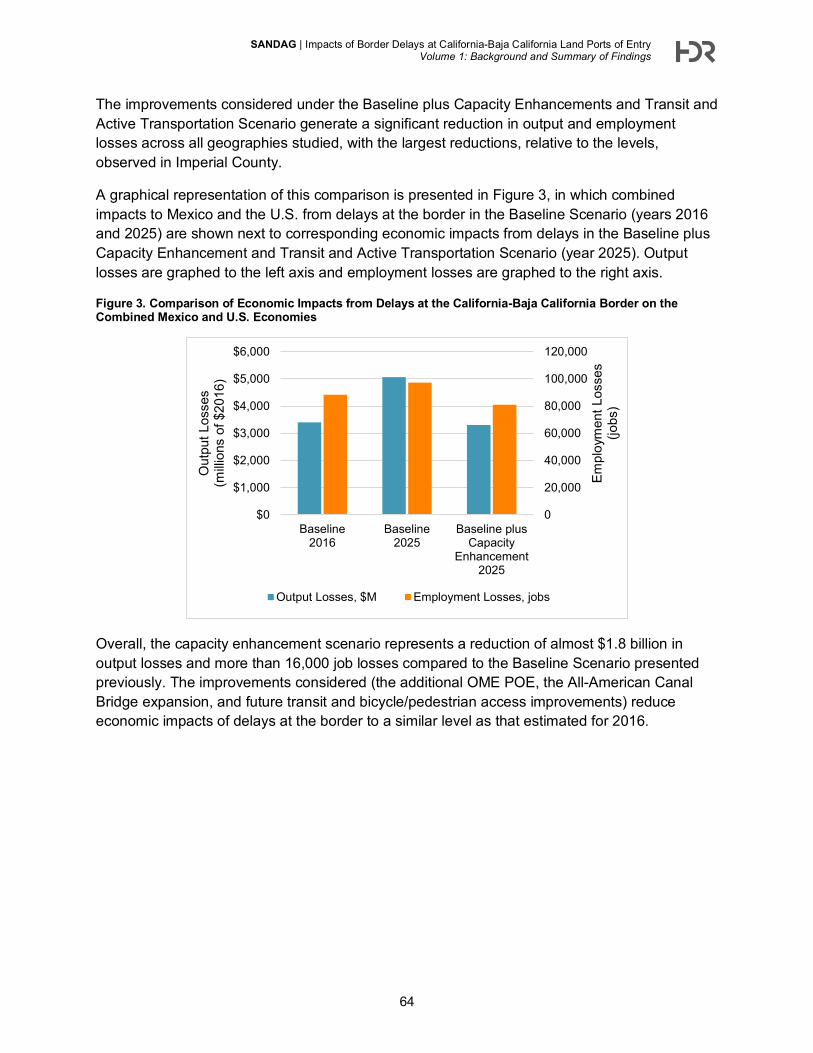
SANDAG | Impacts of Border Delays at California-Baja California Land Ports of Entry Volume 1: Background and Summary of Findings
64
The improvements considered under the Baseline plus Capacity Enhancements and Transit and Active Transportation Scenario generate a significant reduction in output and employment losses across all geographies studied, with the largest reductions, relative to the levels, observed in Imperial County.
A graphical representation of this comparison is presented in Figure 3, in which combined impacts to Mexico and the U.S. from delays at the border in the Baseline Scenario (years 2016 and 2025) are shown next to corresponding economic impacts from delays in the Baseline plus Capacity Enhancement and Transit and Active Transportation Scenario (year 2025). Output losses are graphed to the left axis and employment losses are graphed to the right axis.
Figure 3. Comparison of Economic Impacts from Delays at the California-Baja California Border on the Combined Mexico and U.S. Economies
Overall, the capacity enhancement scenario represents a reduction of almost $1.8 billion in output losses and more than 16,000 job losses compared to the Baseline Scenario presented previously. The improvements considered (the additional OME POE, the All-American Canal Bridge expansion, and future transit and bicycle/pedestrian access improvements) reduce economic impacts of delays at the border to a similar level as that estimated for 2016.
0
20,000
40,000
60,000
80,000
100,000
120,000
$0
$1,000
$2,000
$3,000
$4,000
$5,000
$6,000
Baseline2016
Baseline2025
Baseline plusCapacity
Enhancement2025
Empl
oym
ent L
osse
s (jo
bs)
Out
put L
osse
s (m
illion
s of
$20
16)
Output Losses, $M Employment Losses, jobs
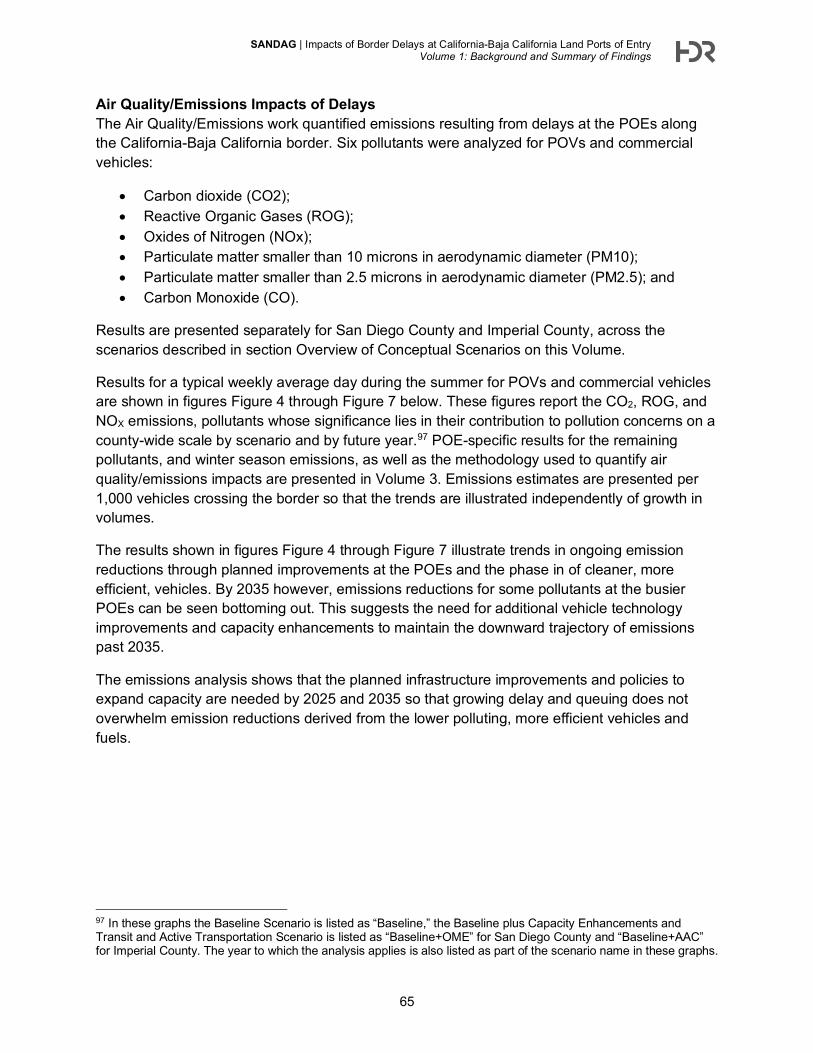
SANDAG | Impacts of Border Delays at California-Baja California Land Ports of Entry Volume 1: Background and Summary of Findings
65
Air Quality/Emissions Impacts of Delays The Air Quality/Emissions work quantified emissions resulting from delays at the POEs along the California-Baja California border. Six pollutants were analyzed for POVs and commercial vehicles:
• Carbon dioxide (CO2); • Reactive Organic Gases (ROG); • Oxides of Nitrogen (NOx); • Particulate matter smaller than 10 microns in aerodynamic diameter (PM10); • Particulate matter smaller than 2.5 microns in aerodynamic diameter (PM2.5); and • Carbon Monoxide (CO).
Results are presented separately for San Diego County and Imperial County, across the scenarios described in section Overview of Conceptual Scenarios on this Volume.
Results for a typical weekly average day during the summer for POVs and commercial vehicles are shown in figures Figure 4 through Figure 7 below. These figures report the CO2, ROG, and NOX emissions, pollutants whose significance lies in their contribution to pollution concerns on a county-wide scale by scenario and by future year.97 POE-specific results for the remaining pollutants, and winter season emissions, as well as the methodology used to quantify air quality/emissions impacts are presented in Volume 3. Emissions estimates are presented per 1,000 vehicles crossing the border so that the trends are illustrated independently of growth in volumes.
The results shown in figures Figure 4 through Figure 7 illustrate trends in ongoing emission reductions through planned improvements at the POEs and the phase in of cleaner, more efficient, vehicles. By 2035 however, emissions reductions for some pollutants at the busier POEs can be seen bottoming out. This suggests the need for additional vehicle technology improvements and capacity enhancements to maintain the downward trajectory of emissions past 2035.
The emissions analysis shows that the planned infrastructure improvements and policies to expand capacity are needed by 2025 and 2035 so that growing delay and queuing does not overwhelm emission reductions derived from the lower polluting, more efficient vehicles and fuels.
97 In these graphs the Baseline Scenario is listed as “Baseline,” the Baseline plus Capacity Enhancements and Transit and Active Transportation Scenario is listed as “Baseline+OME” for San Diego County and “Baseline+AAC” for Imperial County. The year to which the analysis applies is also listed as part of the scenario name in these graphs.

SANDAG | Impacts of Border Delays at California-Baja California Land Ports of Entry Volume 1: Background and Summary of Findings
66
Figure 4. Summer Design Day CO2, ROG, NOx from POVs at San Diego County POEs
Figure 5. Summer Design Day CO2, ROG, NOx from POVs at Imperial County POEs
2,246
1,489
975
613 503649
188 187 93 91
1,2381,318
1,036
873798
0
200
400
600
800
1,000
1,200
1,400
0
500
1,000
1,500
2,000
2,500
3,000
Baseline 2016 Baseline 2025 Baseline2025+OME5x5+Transit
Baseline2035+OME5x5+Transit
Baseline2035+OME
10x10+Transit
Kilo
gram
s/D
ay(C
O2)
Gra
ms/
Day
(RO
G a
nd N
Ox)
Summer Design Day - San Diego County Regional Emissions(Per 1000 POV Border Crossings)
ROG (g/day) NOx (g/day) CO2 (Kg/day)
2,627
1,589
791
467 467708
156 138 68 68
1,2531,184
913
720 720
0
200
400
600
800
1,000
1,200
1,400
0
500
1,000
1,500
2,000
2,500
3,000
Baseline 2016 Baseline 2025 Baseline 2025+AAC+Transit
(OME 5x5)
Baseline 2035+AAC+Transit
(OME 5x5)
Baseline 2035+AAC+Transit(OME 10x10)
Kilo
gram
s/D
ay(C
O2)
Gra
ms/
Day
(RO
G a
nd N
Ox)
Summer Design Day - Imperial County Regional Emissions(Per 1000 POV Border Crossings)
ROG (g/day) NOx (g/day) CO2 (Kg/day)
SANDAG | Impacts of Border Delays at California-Baja California Land Ports of Entry Volume 1: Background and Summary of Findings
67
Figure 6. Summer Design Day CO2, ROG, NOx from Commercial Vehicles at San Diego County POEs
Figure 7. Summer Design Day CO2, ROG, NOx from Commercial Vehicles at Imperial County POEs
219,160
114,810 100,720
70,590 71,530
34,10032,050
29,450
21,650 21,800
22,100
6,220 5,630 4,930 4,950
-
5,000
10,000
15,000
20,000
25,000
30,000
35,000
-
50,000
100,000
150,000
200,000
Baseline 2016 Baseline 2025 Baseline2025+OME5x5+Transit
Baseline2035+OME5x5+Transit
Baseline2035+OME
10x10+Transit
Kilo
gram
s/D
ay(C
O2)
Gra
ms/
Day
(RO
G)
Gra
ms/
Day
(NO
x)Summer Design Day - San Diego County Regional Emissions
(Per 1000 Commercial Vehicle Border Crossings)
NOx (g/day) CO2 (Kg/day) ROG (g/day)
197,730
94,880 93,960
59,870 59,870
30,640
26,820 26,750
19,180 19,180 17,460
5,790 5,720 4,720 4,720
-
5,000
10,000
15,000
20,000
25,000
30,000
35,000
-
50,000
100,000
150,000
200,000
Baseline 2016 Baseline 2025 Baseline 2025+AAC+Transit
(OME 5x5)
Baseline 2035+AAC+Transit
(OME 5x5)
Baseline 2035+AAC+Transit(OME 10x10)
Kilo
gram
s/D
ay (C
O2)
Gra
ms/
Day
(RO
G)
Gra
ms/
Day
(NO
x)
Summer Design Day - Imperial County Regional Emissions(Per 1000 Commercial Vehicle Border Crossings)
NOx (g/day) CO2 (Kg/day) ROG (g/day)
SANDAG | Impacts of Border Delays at California-Baja California Land Ports of Entry Volume 1: Background and Summary of Findings
68
Recommendations: Improvements to Consider The Project Team developed several recommendations to improve conditions at the border. The recommended strategies may have significant impacts on border crossers and businesses that utilize crossings in the California-Baja California border region. Potential impacts include reductions in delays, changes in modal split, and air quality improvement. Broadly, the types of recommended improvements can be summarized in the following categories:
• Investment in POE Infrastructure and Physical Capacity • Improved Operations at POEs • Improved Access to POEs • Corridor-Wide Improvements • Support for Coordination on Long-Term Strategies
Specific improvements considered under each category are listed in Tables 40 through 44, as well as the impact they are anticipated to have in either border-crossing wait times/delay or modal splits between motorized vehicles and pedestrians.
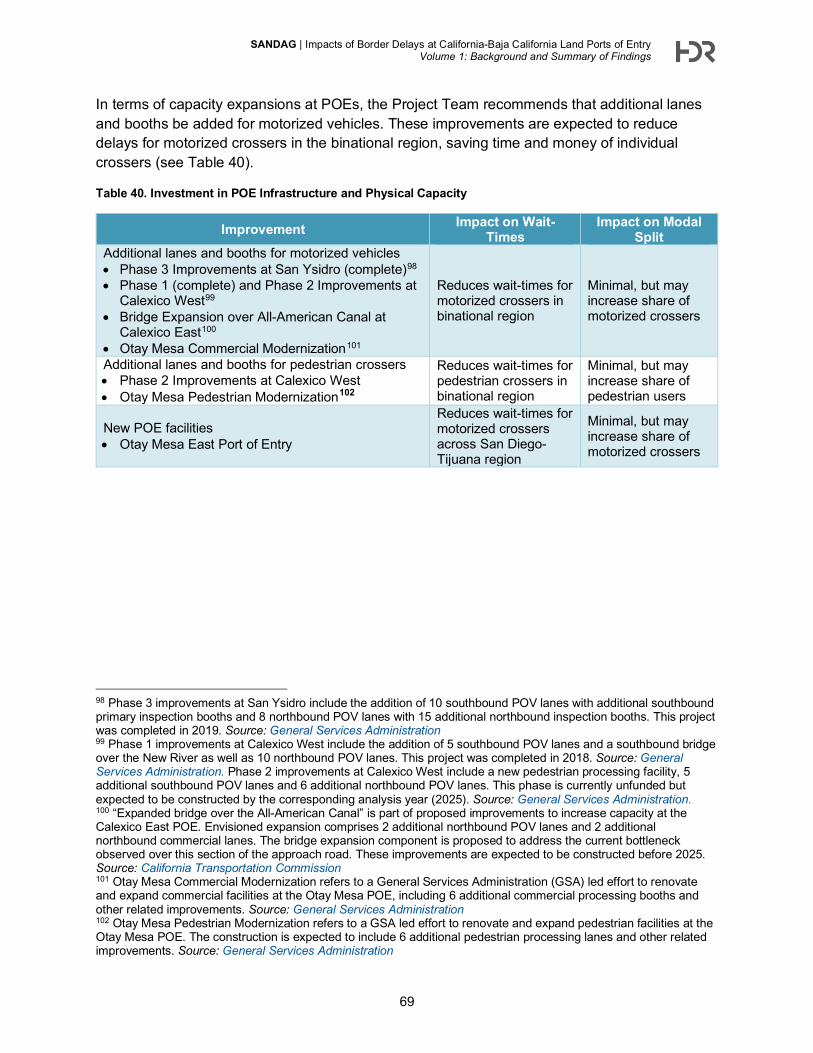
SANDAG | Impacts of Border Delays at California-Baja California Land Ports of Entry Volume 1: Background and Summary of Findings
69
In terms of capacity expansions at POEs, the Project Team recommends that additional lanes and booths be added for motorized vehicles. These improvements are expected to reduce delays for motorized crossers in the binational region, saving time and money of individual crossers (see Table 40).
Table 40. Investment in POE Infrastructure and Physical Capacity
Improvement Impact on Wait-Times
Impact on Modal Split
Additional lanes and booths for motorized vehicles • Phase 3 Improvements at San Ysidro (complete)98 • Phase 1 (complete) and Phase 2 Improvements at
Calexico West99 • Bridge Expansion over All-American Canal at
Calexico East100 • Otay Mesa Commercial Modernization101
Reduces wait-times for motorized crossers in binational region
Minimal, but may increase share of motorized crossers
Additional lanes and booths for pedestrian crossers • Phase 2 Improvements at Calexico West • Otay Mesa Pedestrian Modernization102
Reduces wait-times for pedestrian crossers in binational region
Minimal, but may increase share of pedestrian users
New POE facilities • Otay Mesa East Port of Entry
Reduces wait-times for motorized crossers across San Diego-Tijuana region
Minimal, but may increase share of motorized crossers
98 Phase 3 improvements at San Ysidro include the addition of 10 southbound POV lanes with additional southbound primary inspection booths and 8 northbound POV lanes with 15 additional northbound inspection booths. This project was completed in 2019. Source: General Services Administration 99 Phase 1 improvements at Calexico West include the addition of 5 southbound POV lanes and a southbound bridge over the New River as well as 10 northbound POV lanes. This project was completed in 2018. Source: General Services Administration. Phase 2 improvements at Calexico West include a new pedestrian processing facility, 5 additional southbound POV lanes and 6 additional northbound POV lanes. This phase is currently unfunded but expected to be constructed by the corresponding analysis year (2025). Source: General Services Administration. 100 “Expanded bridge over the All-American Canal” is part of proposed improvements to increase capacity at the Calexico East POE. Envisioned expansion comprises 2 additional northbound POV lanes and 2 additional northbound commercial lanes. The bridge expansion component is proposed to address the current bottleneck observed over this section of the approach road. These improvements are expected to be constructed before 2025. Source: California Transportation Commission
101 Otay Mesa Commercial Modernization refers to a General Services Administration (GSA) led effort to renovate and expand commercial facilities at the Otay Mesa POE, including 6 additional commercial processing booths and other related improvements. Source: General Services Administration 102 Otay Mesa Pedestrian Modernization refers to a GSA led effort to renovate and expand pedestrian facilities at the Otay Mesa POE. The construction is expected to include 6 additional pedestrian processing lanes and other related improvements. Source: General Services Administration
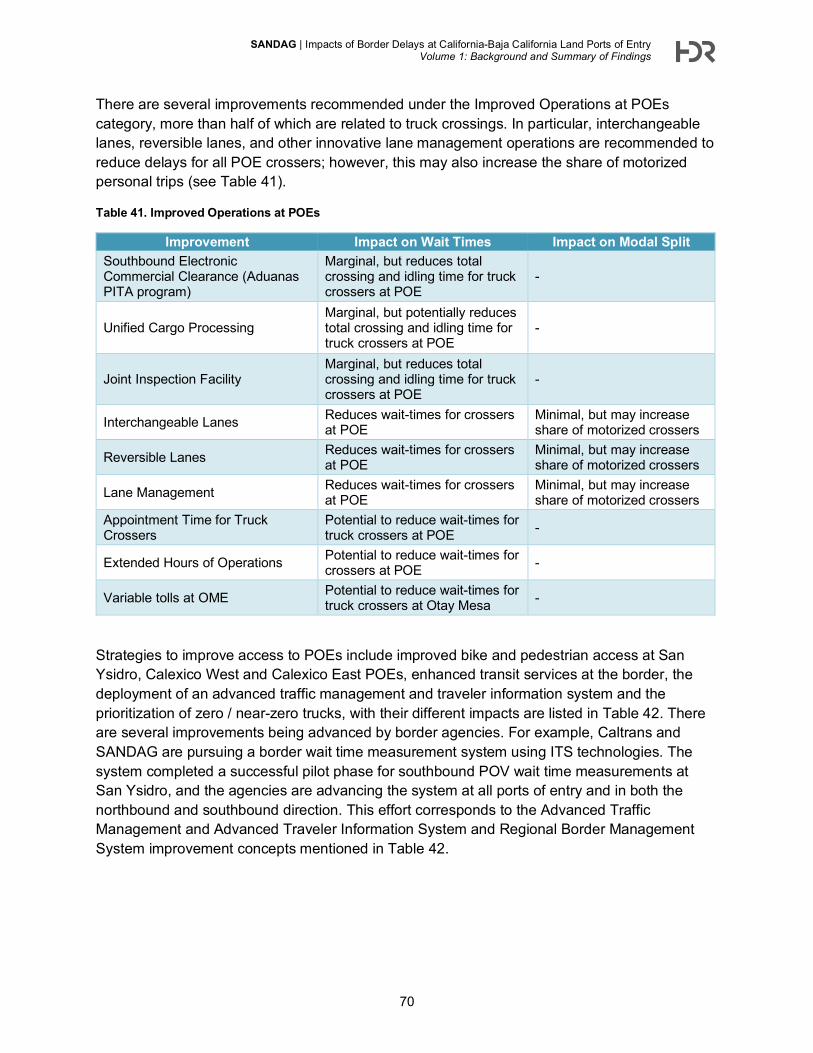
SANDAG | Impacts of Border Delays at California-Baja California Land Ports of Entry Volume 1: Background and Summary of Findings
70
There are several improvements recommended under the Improved Operations at POEs category, more than half of which are related to truck crossings. In particular, interchangeable lanes, reversible lanes, and other innovative lane management operations are recommended to reduce delays for all POE crossers; however, this may also increase the share of motorized personal trips (see Table 41).
Table 41. Improved Operations at POEs
Improvement Impact on Wait Times Impact on Modal Split Southbound Electronic Commercial Clearance (Aduanas PITA program)
Marginal, but reduces total crossing and idling time for truck crossers at POE
-
Unified Cargo Processing Marginal, but potentially reduces total crossing and idling time for truck crossers at POE
-
Joint Inspection Facility Marginal, but reduces total crossing and idling time for truck crossers at POE
-
Interchangeable Lanes Reduces wait-times for crossers at POE
Minimal, but may increase share of motorized crossers
Reversible Lanes Reduces wait-times for crossers at POE
Minimal, but may increase share of motorized crossers
Lane Management Reduces wait-times for crossers at POE
Minimal, but may increase share of motorized crossers
Appointment Time for Truck Crossers
Potential to reduce wait-times for truck crossers at POE -
Extended Hours of Operations Potential to reduce wait-times for crossers at POE -
Variable tolls at OME Potential to reduce wait-times for truck crossers at Otay Mesa -
Strategies to improve access to POEs include improved bike and pedestrian access at San Ysidro, Calexico West and Calexico East POEs, enhanced transit services at the border, the deployment of an advanced traffic management and traveler information system and the prioritization of zero / near-zero trucks, with their different impacts are listed in Table 42. There are several improvements being advanced by border agencies. For example, Caltrans and SANDAG are pursuing a border wait time measurement system using ITS technologies. The system completed a successful pilot phase for southbound POV wait time measurements at San Ysidro, and the agencies are advancing the system at all ports of entry and in both the northbound and southbound direction. This effort corresponds to the Advanced Traffic Management and Advanced Traveler Information System and Regional Border Management System improvement concepts mentioned in Table 42.
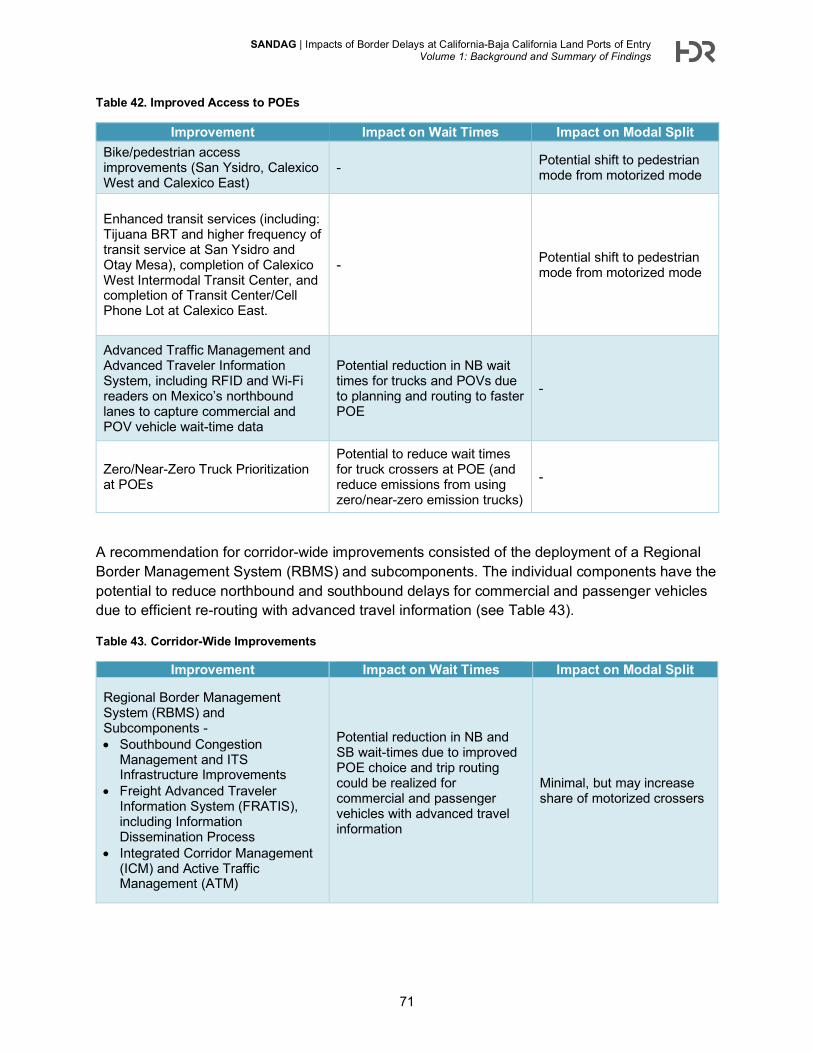
SANDAG | Impacts of Border Delays at California-Baja California Land Ports of Entry Volume 1: Background and Summary of Findings
71
Table 42. Improved Access to POEs
Improvement Impact on Wait Times Impact on Modal Split Bike/pedestrian access improvements (San Ysidro, Calexico West and Calexico East)
- Potential shift to pedestrian mode from motorized mode
Enhanced transit services (including: Tijuana BRT and higher frequency of transit service at San Ysidro and Otay Mesa), completion of Calexico West Intermodal Transit Center, and completion of Transit Center/Cell Phone Lot at Calexico East.
- Potential shift to pedestrian mode from motorized mode
Advanced Traffic Management and Advanced Traveler Information System, including RFID and Wi-Fi readers on Mexico’s northbound lanes to capture commercial and POV vehicle wait-time data
Potential reduction in NB wait times for trucks and POVs due to planning and routing to faster POE
-
Zero/Near-Zero Truck Prioritization at POEs
Potential to reduce wait times for truck crossers at POE (and reduce emissions from using zero/near-zero emission trucks)
-
A recommendation for corridor-wide improvements consisted of the deployment of a Regional Border Management System (RBMS) and subcomponents. The individual components have the potential to reduce northbound and southbound delays for commercial and passenger vehicles due to efficient re-routing with advanced travel information (see Table 43).
Table 43. Corridor-Wide Improvements
Improvement Impact on Wait Times Impact on Modal Split
Regional Border Management System (RBMS) and Subcomponents - • Southbound Congestion
Management and ITS Infrastructure Improvements
• Freight Advanced Traveler Information System (FRATIS), including Information Dissemination Process
• Integrated Corridor Management (ICM) and Active Traffic Management (ATM)
Potential reduction in NB and SB wait-times due to improved POE choice and trip routing could be realized for commercial and passenger vehicles with advanced travel information
Minimal, but may increase share of motorized crossers
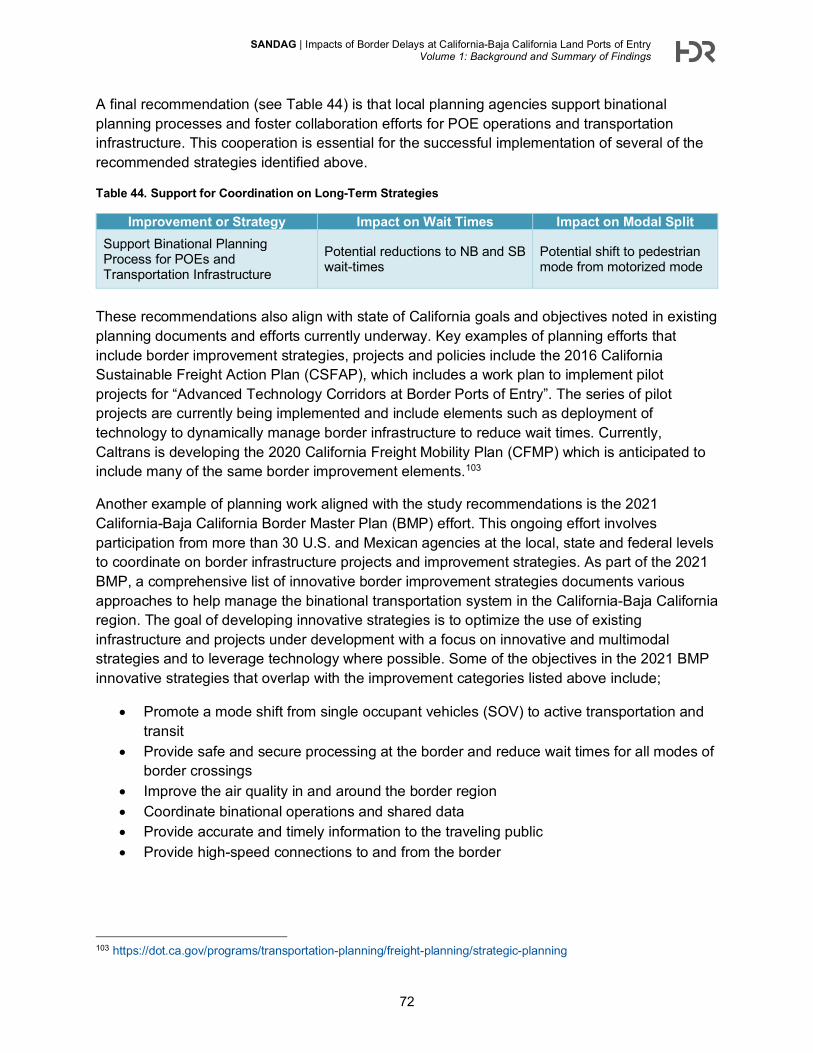
SANDAG | Impacts of Border Delays at California-Baja California Land Ports of Entry Volume 1: Background and Summary of Findings
72
A final recommendation (see Table 44) is that local planning agencies support binational planning processes and foster collaboration efforts for POE operations and transportation infrastructure. This cooperation is essential for the successful implementation of several of the recommended strategies identified above.
Table 44. Support for Coordination on Long-Term Strategies
Improvement or Strategy Impact on Wait Times Impact on Modal Split Support Binational Planning Process for POEs and Transportation Infrastructure
Potential reductions to NB and SB wait-times
Potential shift to pedestrian mode from motorized mode
These recommendations also align with state of California goals and objectives noted in existing planning documents and efforts currently underway. Key examples of planning efforts that include border improvement strategies, projects and policies include the 2016 California Sustainable Freight Action Plan (CSFAP), which includes a work plan to implement pilot projects for “Advanced Technology Corridors at Border Ports of Entry”. The series of pilot projects are currently being implemented and include elements such as deployment of technology to dynamically manage border infrastructure to reduce wait times. Currently, Caltrans is developing the 2020 California Freight Mobility Plan (CFMP) which is anticipated to include many of the same border improvement elements.103
Another example of planning work aligned with the study recommendations is the 2021 California-Baja California Border Master Plan (BMP) effort. This ongoing effort involves participation from more than 30 U.S. and Mexican agencies at the local, state and federal levels to coordinate on border infrastructure projects and improvement strategies. As part of the 2021 BMP, a comprehensive list of innovative border improvement strategies documents various approaches to help manage the binational transportation system in the California-Baja California region. The goal of developing innovative strategies is to optimize the use of existing infrastructure and projects under development with a focus on innovative and multimodal strategies and to leverage technology where possible. Some of the objectives in the 2021 BMP innovative strategies that overlap with the improvement categories listed above include;
• Promote a mode shift from single occupant vehicles (SOV) to active transportation and transit
• Provide safe and secure processing at the border and reduce wait times for all modes of border crossings
• Improve the air quality in and around the border region • Coordinate binational operations and shared data • Provide accurate and timely information to the traveling public • Provide high-speed connections to and from the border
103 https://dot.ca.gov/programs/transportation-planning/freight-planning/strategic-planning
Related Documents