School of Life Sciences Research Proceedings Honours project © The School of Life Sciences [2015-2016] | 1 A Comparison of the Diversity and Distribution of Over-Wintering Shorebirds on an Intertidal mudflat in the Firth of Forth, Scotland from 2013 to 2015. Holly Brown Bsc (hons) Marine Biology Abstract Intertidal flats provide a major feeding area for shorebirds. They are a predictable and rich source of food due to cyclic tides and large numbers of benthic invertebrates. However, human interference has led to the loss of a number of these habitats which in turn has led to a major decline in shorebird populations globally. In order to conserve these important habitats, it is of great importance that the distribution and use of these intertidal flats by shorebirds is well understood. This study looks at the abundance/ diversity of shorebirds in relation to a number of environmental factors on an intertidal flat within the Firth of Forth. This will allow for a better understanding of which areas on shore are preferred by shorebirds and whether environmental factors such as temperature, salinity, benthic invertebrate distribution or sediment structure have an effect on the distribution of these birds. The intertidal flat chosen was divided into three zones and sampling/ bird observations were carried out during the winter of 2015/16. Eight different shorebird species were chosen and their distribution on shore was noted across four observation days. Sediment samples were collected to analyse the sediment structure and benthic invertebrate community to determine if they are related to shorebird distribution. Other relevant environmental factors were also recorded on these sampling days. Results of this study were also compared to a similar study done within the same area on shore in 2013/14 to determine any changes in shorebird populations across the past 2 years. Contents 1. Introduction 1.1. Shorebird background 1.2. Study Site 1.2.1. Forth Estuary 1.2.2. Cramond 1.3. Recent Shorebird population Structures 1.4. Birds of Interest 1.5. Aims 2. Materials and Methods 2.1. Bird Observation 2.2. Field sampling 2.3. Benthic Invertebrate Identification 2.4. Granulometric analysis 2.5. Organic matter analysis 2.6. Statistical Analysis 3. Results 3.1. Bird Observation 3.2. Environmental conditions 3.3. Benthic Invertebrate analysis 3.4. Granulometric Analysis 3.5. Results comparison with previous study 4. Discussion 5. Conclusion 6. Acknowledgements 7. References 8. Appendix 1. Introduction Human interference with intertidal flats, including construction work and tourism, has led to the loss and degradation of suitable coastal habitats for overwintering migratory shorebirds (VanDusen, Fegley et al., 2012). Due to cyclic tides, intertidal flats provide predictable access to food resources, constituting a major feeding area for shorebirds (Drouet, Turpin et al., 2015). The loss of suitable coastal habitats for shorebird use, has led to a decrease in shorebird populations (Granadeiro, Santos et al., 2007). Flats are a major staging area for migratory and over- wintering birds. Upon arriving at intertidal flats, migratory shorebirds rebuild their fat stores rapidly, which have been depleted after hours of flying, by feeding on the organisms found on shore (Botton, Loveland et al., 1994). This allows birds to regain enough energy to continue with their migration. Without these vital ‘stop-over’ points many birds would not have the resources to survive migration (Skagen & Knopf, 1994). It is not only migratory birds which utilise these flats, overwintering birds and permanent residents also take advantage of the resources. Shorebirds are important to intertidal flats for a number of reasons; they provide nutrients for invertebrates,

Welcome message from author
This document is posted to help you gain knowledge. Please leave a comment to let me know what you think about it! Share it to your friends and learn new things together.
Transcript
School of Life Sciences
Research Proceedings
Honours project
© The School of Life Sciences [2015-2016] | 1
A Comparison of the Diversity and Distribution of Over-Wintering
Shorebirds on an Intertidal mudflat in the Firth of Forth, Scotland from
2013 to 2015.
Holly Brown
Bsc (hons) Marine Biology
Abstract
Intertidal flats provide a major feeding area for shorebirds. They are a predictable and rich source of food
due to cyclic tides and large numbers of benthic invertebrates. However, human interference has led to
the loss of a number of these habitats which in turn has led to a major decline in shorebird populations
globally. In order to conserve these important habitats, it is of great importance that the distribution and
use of these intertidal flats by shorebirds is well understood. This study looks at the abundance/ diversity
of shorebirds in relation to a number of environmental factors on an intertidal flat within the Firth of
Forth. This will allow for a better understanding of which areas on shore are preferred by shorebirds and
whether environmental factors such as temperature, salinity, benthic invertebrate distribution or sediment
structure have an effect on the distribution of these birds. The intertidal flat chosen was divided into three
zones and sampling/ bird observations were carried out during the winter of 2015/16. Eight different
shorebird species were chosen and their distribution on shore was noted across four observation days.
Sediment samples were collected to analyse the sediment structure and benthic invertebrate community to
determine if they are related to shorebird distribution. Other relevant environmental factors were also
recorded on these sampling days. Results of this study were also compared to a similar study done within
the same area on shore in 2013/14 to determine any changes in shorebird populations across the past 2
years.
Contents
1. Introduction
1.1. Shorebird background
1.2. Study Site
1.2.1. Forth Estuary
1.2.2. Cramond
1.3. Recent Shorebird population Structures
1.4. Birds of Interest
1.5. Aims
2. Materials and Methods
2.1. Bird Observation
2.2. Field sampling
2.3. Benthic Invertebrate Identification
2.4. Granulometric analysis
2.5. Organic matter analysis
2.6. Statistical Analysis
3. Results
3.1. Bird Observation
3.2. Environmental conditions
3.3. Benthic Invertebrate analysis
3.4. Granulometric Analysis
3.5. Results comparison with previous study
4. Discussion
5. Conclusion
6. Acknowledgements
7. References
8. Appendix
1. Introduction
Human interference with intertidal flats, including construction
work and tourism, has led to the loss and degradation of suitable
coastal habitats for overwintering migratory shorebirds
(VanDusen, Fegley et al., 2012). Due to cyclic tides, intertidal
flats provide predictable access to food resources, constituting a
major feeding area for shorebirds (Drouet, Turpin et al., 2015).
The loss of suitable coastal habitats for shorebird use, has led to
a decrease in shorebird populations (Granadeiro, Santos et al.,
2007). Flats are a major staging area for migratory and over-
wintering birds. Upon arriving at intertidal flats, migratory
shorebirds rebuild their fat stores rapidly, which have been
depleted after hours of flying, by feeding on the organisms found
on shore (Botton, Loveland et al., 1994). This allows birds to
regain enough energy to continue with their migration. Without
these vital ‘stop-over’ points many birds would not have the
resources to survive migration (Skagen & Knopf, 1994). It is
not only migratory birds which utilise these flats, overwintering
birds and permanent residents also take advantage of the
resources. Shorebirds are important to intertidal flats for a
number of reasons; they provide nutrients for invertebrates,
© The School of Life Sciences [2015-2016] | 2
phytobenthos and microbes via their droppings and they are also
very good indicators of ecosystem health and productivity
(Chafer & Loyn, 2015).
In order to implement the correct management strategies to
conserve these important intertidal flats, it is important that there
is good understanding of bird distribution at both a local and
regional scale within the flats (Granadeiro et al., 2007). This is
possible with co-ordinated research.
1.1. Shorebird Background
The term Shorebird refers to any bird which carries out many of
its activities, such as feeding or resting, within the coastal area
(Baird, Evans et al., 1985). Not only are waders (Scolopacidae)
included in this term, but a variety of other birds which use
coastal habitats regularly i.e. Gulls (Laridae) and wildfowl
(Anatidae) are included also (Mendonça, Raffaelli et al., 2007).
Shorebirds obtain a large proportion of their daily energy
requirements (if not all) by feeding on intertidal areas
(Mendonça, Rafaelli et al., 2007) rich in small invertebrates.
The method in which shorebirds obtain their prey is seen to differ
between species, and indeed individuals, due to inter- and intra-
specific variation in bill length and shape (Nebel, Jackson et al.,
2005). The differentiations in bill morphology between different
shorebird species leads to alternative prey available to birds, thus
reducing inter-specific competition on the shore (Colwell,
2010). For example, long billed species mainly use touch to find
prey due to their touch sensitive bill tips which can detect prey
whilst probing, whereas short billed species generally use sight
(van de Kam, de Goeij et al., 2004). Differences in bill length
also allows access to prey at different depths within the sediment
(Chafer & Loyn, 2015).
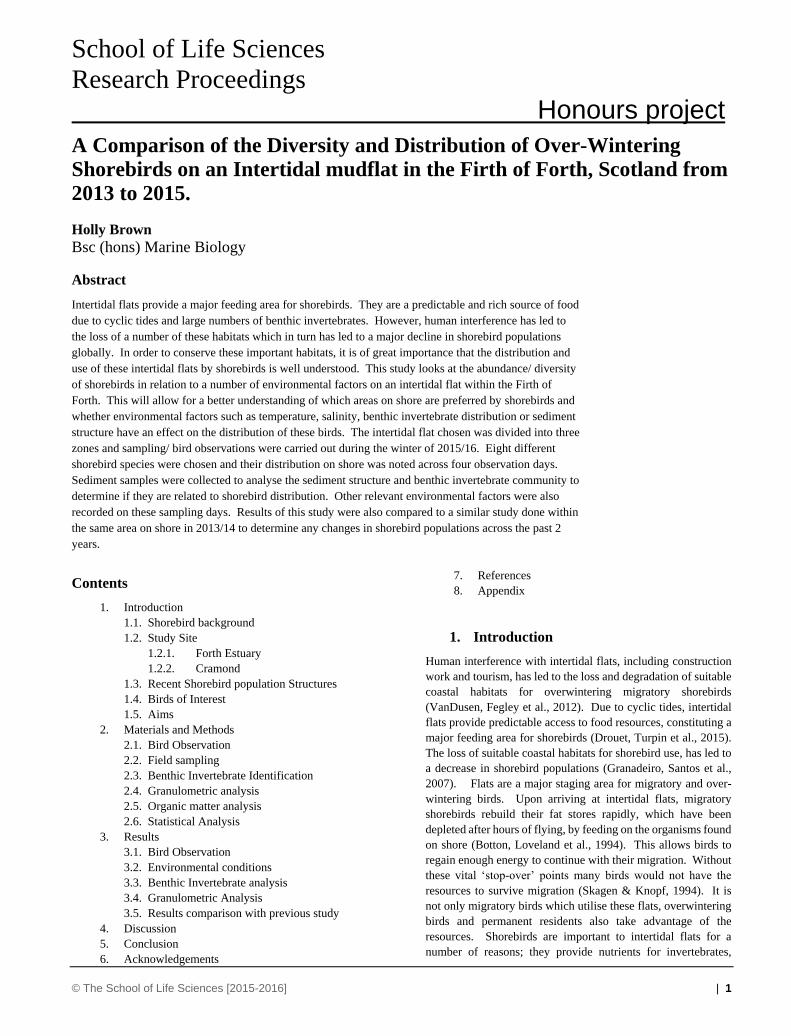
A number of bird species have adapted their bill shape/ length
to the predominant food type within the individual’s diet (Durell,
2000). For example birds may adapt the bill tip and bill width
to coincide with the prey they primarily seek out. Oystercatchers
are an example of this, and have the ability to alter bill
morphology periodically (Figure 1), throughout the year
allowing the birds to adapt to varying circumstances (Goss-
Custard, 1996). This ability to alter bill shape so readily,
mitigates intra-specific competition between birds within the
same feeding area.
The distribution of shorebirds has been seen to be related to
the distribution and abundance of their preferred prey, as seen
in a study by Norazlimi and Ramli (2014). The study was
conducted to determine the abundance and diversity of
shorebirds living in a mudflat of Jeram and Remis beach in
Malaysia. The study concluded that tidal stage and human
disturbance were two of the major factors affecting
shorebird distribution on mudflats. In the current study human
disturbance will be noted to determine any changes in shorebird
distribution.
Sediment grain size may also play a major, yet indirect, role
in shorebird distribution by directly affecting the densities of
invertebrates found across areas of the intertidal flat, as seen in
a previous study (VanDusen, Fegley et al., 2012). The study
highlights the importance of prey availability and abundance in
relation to shorebird communities on shore.
1.2 Study Site
1.2.1 Forth Estuary
The Firth of Forth is located on the East coast of Scotland and is
the second most important estuary for wintering shorebirds in
Scotland and the eleventh most important throughout the entire
UK (SNH, 2004). An abundance of invertebrate rich intertidal
flats are present throughout the Firth of Forth thus, providing key
feeding grounds for a number of migratory and
internationally/nationally important birds. An area covering
most of the Forth has been designated as a Special Protection
Area (SPA) and is therefore protected, for use by birds. The area
is also designated as a Site of Special Scientific Interest (SSSI)
(SNH, 2011). The entire Firth of Forth has been designated a
RAMSAR site due to its importance as a wetland (JNCC, 2015).
Historically, the Firth of Forth was used as an area for the
disposal of domestic, industrial and agricultural effluent leading
Figure 1: Morphology of three main bill-tip shapes of Oystercatchers.
Lateral, Frontal and Dorsal view (Goss-Custard, 1996).
© The School of Life Sciences [2015-2016] | 3
to a depletion of water quality in the Forth (SNH, 2011)
However, within the last two decades pollution control by
regulatory authorities and the implementation of treatment
plants has led to drastic improvements in water quality (SNH,
2011). This led to the health of the Forth improving dramatically
allowing a number of shorebirds to re-establish within the Firth
of Forth (SNH, 2011). However, findings from 2011 show that
bird populations across the Forth were seen to be declining again
(SNH, 2011).
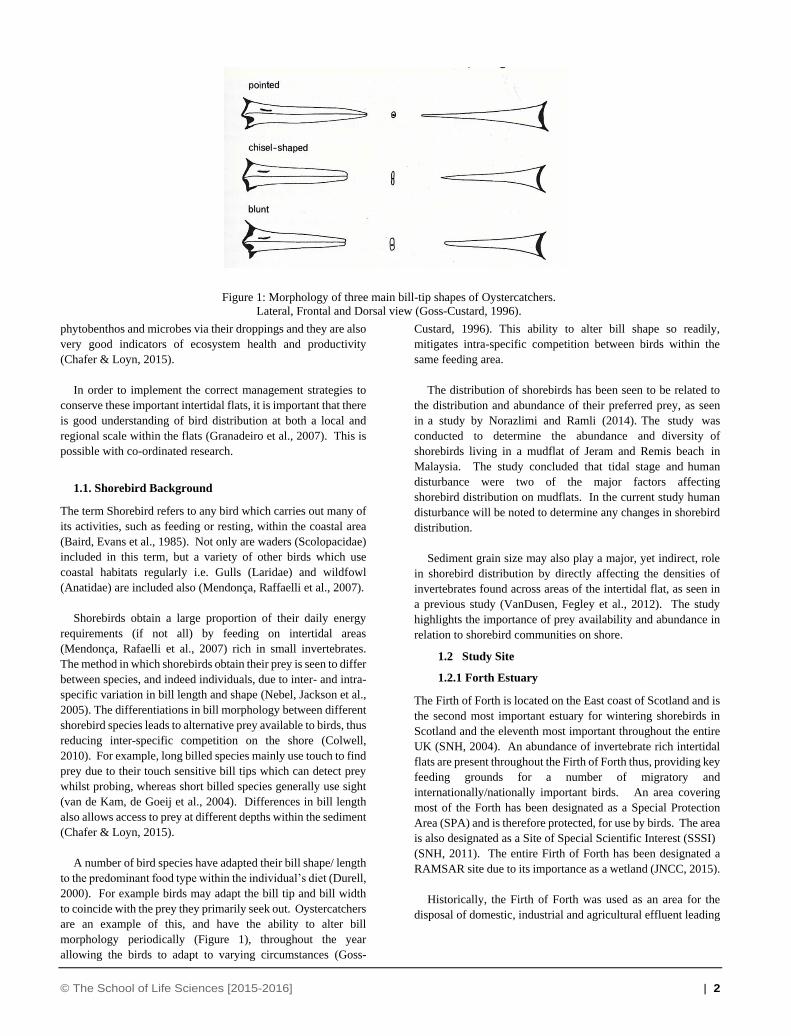
1.2.2 Cramond
Cramond is a small town situated on the south coast of the
Forth Estuary not far from Edinburgh. The area of tidal sands
extending from Hound point to Granton form an area known as
Drum Sands. The sands have been designated as a site of special
scientific interest (SSSI) and form part of the Firth of Forth’s
Special Protection Area (SPA) (Gittings, 2012).
A small island-‘Cramond Island’- sits within Drum Sands and
a causeway present allows pedestrian access to the island during
low water. The area is popular with dog walkers and families
however, only the East side is easily accessible and used for
recreational activities.
It is the ‘muddy’ West side of the causeway which is of
particular interest in this study. The sediment here is composed
of mainly shell fragments and mud. There are numerous rocky
outcrops present on the shore and a sparse covering of Fucus
vesiculosus and Fucus spiralis is present. The River Almond
which runs directly into the West side of Drum sands is a major
defining characteristic of this area.
Low water exposes the entire area of mudflats providing a major
feeding ground for hundreds of waders and waterfowl. Access
to the mudflats on the West side of Cramond is restricted which
limits the number of visitors to the area. This makes the mudflats
an ideal area for over-wintering shorebirds to feed on as
disturbance is minimal.
Figure 2: Map of Cramond. Approximate study site highlighted with black dotted line. Red square shows site in within
Scotland. Map created using ArcGIS pro software.
© The School of Life Sciences [2015-2016] | 4
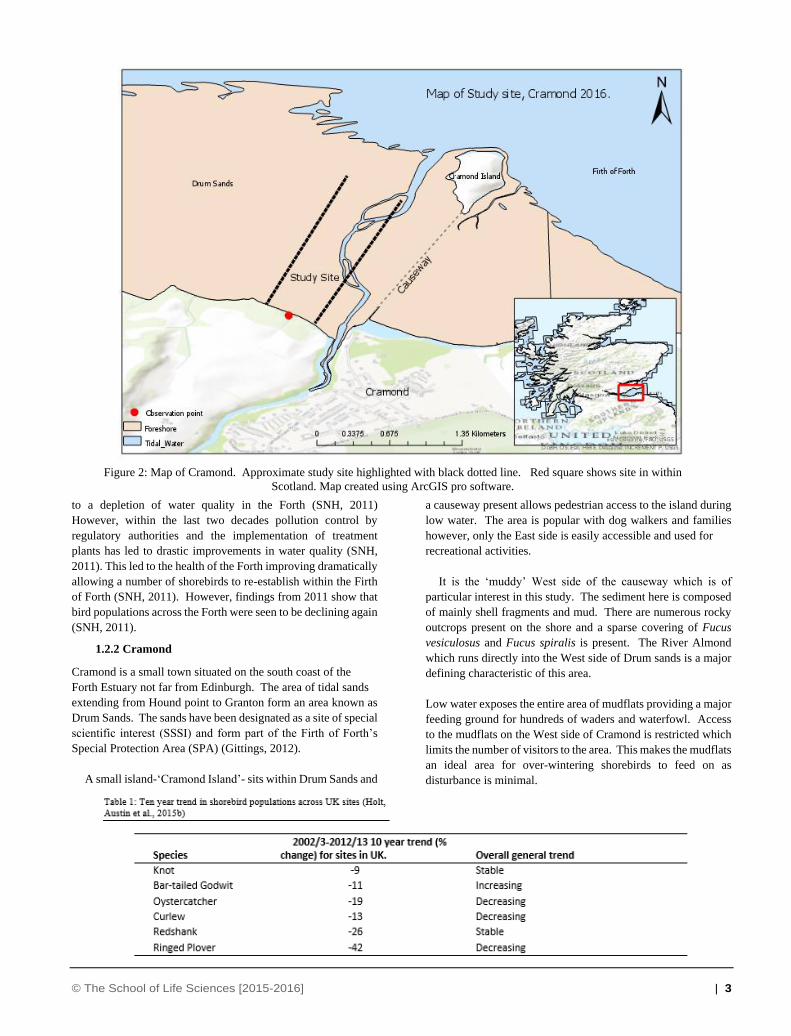
1.3 Recent shorebird Population Structures
Trends in shorebird populations have shown an overall decrease
in recent years (VanDusen , Fegley al., 2012). Table 1 shows
the general % change of the most abundant shorebird species
across sites throughout the UK during a 10 year period from
2002/3 to 2012/13. The decline in these populations is likely
due to harsh winters seen in recent years, however it has not been
proven that this is the definitive reason for such declines. (Holt,
Austin et al., 2015).
1.4 Birds of Interest
This study focused on eight species of bird known to be found at
Cramond. These species include: Curlew (Numenius arquata),
Oystercatcher (Haematopus ostralegus), Knot (Calidris
canutus), Turnstone (Arenaria interpres), Redshank (Tringa
tetanus), Bar-tailed Godwit (Limosa lapponica), Little stint
(Calidrus minuta) and Lapwing (Vanellus vanellus). Although
lapwings are not wading birds, they have been observed in large
numbers on the study site and are deemed ‘red status’ within the
UK (indicates the species has undergone severe breeding or
wintering population declines in the UK of more than
50% within the last 25 years (Woodward, Bray et al., 2015) and
so were included in this study.
Of these species, four are internationally important (Knot,
Bar-tailed godwit, Redshank and Turnstone) and two are
nationally important (Curlew and Oystercatcher) (SNH, 2004).
These birds therefore are of great conservation importance. A
number of the above species are known to be declining in
numbers throughout the UK (table 1) however the reasons for
these declines are unknown (SNH, 2011).
A similar study was conducted in 2013/14 at the same site
within the Firth of Forth by Dean Woodfin Jones (Jones, 2014).
The study compares two different shores, the West and East side
of Cramond, looking at environmental factors and human
disturbances which directly affect the diversity and distribution
of shorebirds at different areas on shore. Only the results from
the West side of Jones, 2014 study will be used for comparison
with the current study.
1.5 Aims
Primarily, to investigate effects of differences in
sediment particle size, benthic invertebrate species
composition and density and sediment organic matter
on shorebird abundance/ diversity between the upper,
mid and lower shore.
To compare findings with a previous study to
determine any changes in shorebird diversity (Jones,
2014).
To investigate the cause of any changes in shorebird
diversity from the previous study, i.e. any changes in
benthic invertebrate density or sediment granulometry
or organic matter presence.
2. Materials and Methods
2.1 Bird Observation
Prior to conducting the shorebird surveys, two preliminary visits
were carried out to the site chosen to find a suitable area to
survey the birds from and to compile a list of shorebird species
known to forage on the chosen site.
Shorebird surveys were conducted on 4 dates between the
15th of October and the 12th of December 2015 by a single
observer. All observations were conducted on days without
rainfall and average air temperatures of between 7°C and 15°
C. The area used by the observer to survey the birds was at
least 15m from the birds to prevent any disturbance to their
natural behaviour. All areas of the shore were visible from
this vantage point. Observations were conducted 2 hours
after low tide to ensure counts were not being made lower on
shore than any samples had been taken. A ‘new’ lower shore
was designated whilst field sampling. Counts were conducted
at 15 minute intervals until high tide was reached and all
birds had flown from the site. Counts were recorded on
paper, per species and later compiled to a spread sheet in excel.
In order to easily distinguish between lower, mid and upper
shore whilst surveying, wooden stakes already present on shore
were used in conjunction with prominent shore features such as
large rocks. As the entire shore was visible from the vantage
point it was possible to prevent double counting of birds which
moved from one area of the shore to the other: - only the final
position of the birds was counted during the time interval.
In order to identify the birds present on shore Centon, field
5.5°, 12x50mm binoculars were used. Any birds which were
unable to be identified on site were counted and their shore
position noted before taking a photograph to enable later
identification. If any disturbance to the birds occurred i.e.
dog barking or human presence on shore, counts were stopped
and birds were left to re-settle on the shore.
2.2 Field sampling
Field sampling took place over one day in October 2015 during
low water on the shore. Sediment samples were collected
for benthic invertebrate identification using box quadrats
(Width 32cm, Depth 29cm) and were placed into pre-
labelled 5L buckets. Three replicate samples were taken
randomly from each of the three shore sampling points (high,
mid and lower). Two samples were sieved on site using a
0.5mm mesh sieve and preserved with 70% ethanol, the third
was left as it would be used to give representative samples
for sediment analysis and organic matter. It was not possible
to sample down at the low water mark due the sediment being
unstable and therefore posing a safety risk. It was therefore
necessary to have an obvious marker for the new ‘lower shore
area’ which would also be used for bird observations. Areas
were distinguished using wooden stakes already present on
shore and surrounding prominent features such as rocks, to
ensure sample areas were the same areas in which the bird
surveys were being conducted.
Small water samples were taken, from the holes left by
the quadrats after invertebrate sample collection was done, to
later be analysed at the laboratory for salinity using a
refractometer.
© The School of Life Sciences [2015-2016] | 5
A thermometer was used on site to determine water temperatures
at each sampling site.
Once back at the laboratory representative samples (200g)
were removed from the un-sieved buckets to be used for
granulometry and organic matter. The remaining sample was
sieved and 70% ethanol added. All samples were placed in cold
storage.
2.3 Benthic Invertebrate Identification
Samples containing the sieved sediment were analysed in the
laboratory by first carefully removing all benthic invertebrates
and placing them into petri dishes containing ethanol for further
preservation. The individual organisms were then identified
using a dissection microscope (Olympus 5230) and
identification literature (Fish & Fish, 2011). Where possible,
organisms were identified to species level, however, many
organisms were in poor condition after sieving, due to a number
of small pebbles present in samples disfiguring invertebrates. A
list of species and their corresponding sample site was compiled
and later analysed.
2.4 Granulometric Analysis
The three representative samples from each area on shore were
placed in separate porcelain dishes, weighed and then dried in an
oven for 48 hours until a constant weight was achieved. Each
sample was then covered with water and 20ml of sodium
hexametaphosphate was added to each. Each sample was stirred
for 10 minutes, left for 24 hours and then stirred for a further 10
minutes. The now disaggregated sediment was then wet sieved
using a 63 µm sieve to assess silt content.
The contents of the sieve were placed back into porcelain
dishes and dried, again to a constant weight. The new weight was
recorded and the difference between this and the initial weight
was assumed to be the 63 µm portion of the sample.
The remaining dried sediment was then passed through a
sieve stack (mesh sizes were: 4000µm, 2000µm, 1000µm,
500µm, 250µm, 125µm, 63µm, <63µm) using a sieve shaker
(Octagon digital 200 sieve shaker). The contents of each sieve
were weighed and recorded. Median Phi values were obtained
to determine the sediment type and calculations were done to
determine skewness and sorting of sediment particles. The
following equations were used to determine skewness and
sorting, respectively:
2.5 Organic matter analysis
A small portion (20g) of sediment was removed from the
samples used for granulometry (prior to drying) to carry out
organic matter content analysis. The samples were placed in
small porcelain dishes, weighed and then placed in a muffle
furnace at 500°C for 24 hours and then at 600°C for a further 24
hours. Once cooled, the samples were reweighed and the weight
loss recorded. The percentage of organic matter was then
calculated.
2.6 Data Analysis
Multivariate data analyses were carried out using PRIMER 6 to
analyse bird observation data, including cluster analysis,
ANOSIM and SIMPER tests. Bray Curtis similarity index and
log transformed data were used. Log transformed data were used
for multivariate analyses to reduce the influence of dominant
species on the results. Diversity indices were also calculated
from the raw data using PRIMER 6 (Pielou’s evenness and
Shannon Wiener diversity). Univariate statistical analysis was
carried out using IBM SPSS statistics 22 to determine if there
were any significant differences in shorebird abundance/
diversity between sample sites. One way ANOVA was used to
investigate bird abundance due to the normal distribution of data
and Kruskal-Wallis tests were used for bird diversity (although
data were normally distributed, results of Levene’s test were
<0.05 and therefore ANOVA results were not valid- Kruskal
Wallis analysis was used as alternative). Post-hoc Tukey tests
were carried out on any significantly different data after one-way
ANOVA was carried out.
In order to analyse the invertebrate count data, cluster analysis,
ANOSIM and SIMPER testing (with Bray Curtis similarity
index and log transformed data) were carried out. PRIMER 6
was used to conduct this analysis. PRIMER 6 was also used to
calculate diversity indices (Shannon Wiener diversity and
Pielou’s evenness) using raw data. One way ANOVA was
carried out to determine any differences in invertebrate
diversity between sites. Post-hoc Tukey tests were carried out
on significant data. Differences in invertebrate abundance
between sites were tested using a Kruskal-Wallis test due to the
non-parametric nature of the data. Tests were carried out using
IBM SPSS statistics 22.
Environmental conditions (temperature, salinity and organic
carbon content) were analysed by conducting Kruskal Wallis
tests (due to non- normally distributed data), using IBM SPSS
statistics 22, to determine any significant differences between
sites. Mann-Whitney U tests were used with Bonferroni
correction on any non-parametric data which was significantly
different to determine which sites were different from each
other. All significances were accepted as P≤0.05. All tables
and figures were produced using Microsoft Excel 2013.
3. Results
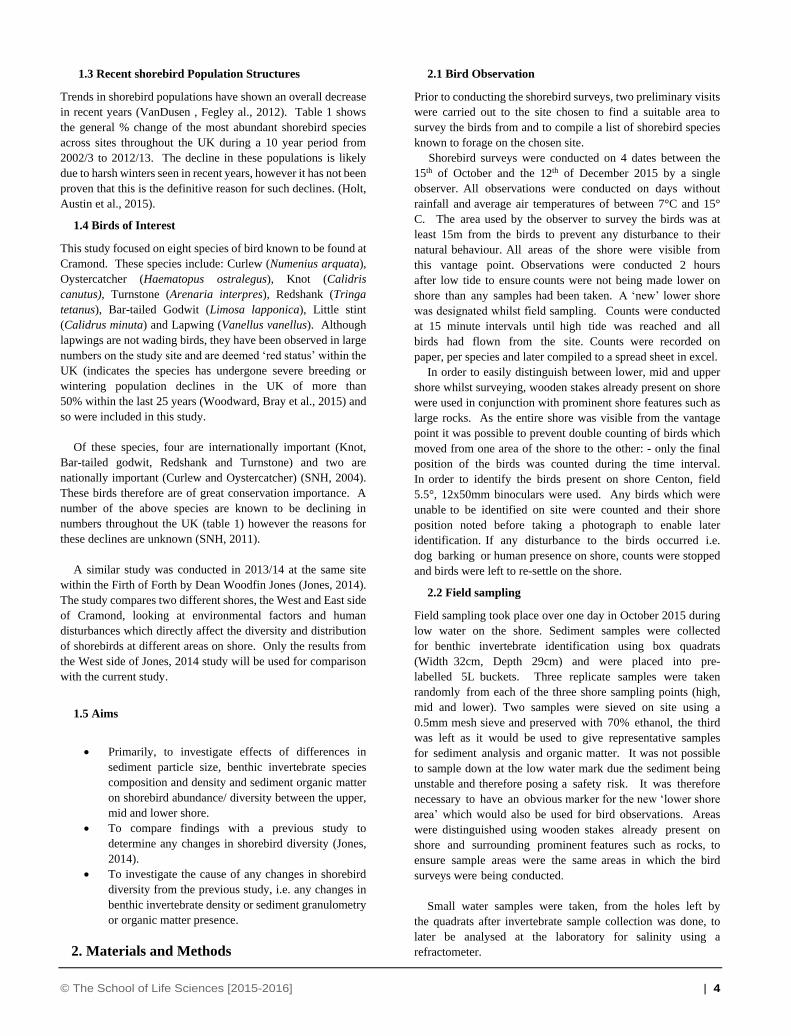
3.1 Bird Observations
The average abundance (Figure 3) of individual shore birds was
highest at low shore (LS) whilst species diversity (Figure 4) was
© The School of Life Sciences [2015-2016] | 6
highest on the high shore (HS) according to results of Shannon
Wiener Diversity (Table 2). Pielou’s evenness values for each
area on shore showed a relatively even spread of abundance
across the species present (Table 2). There was no significant
difference, however, between the abundance or diversity of
shorebirds when comparing all three areas of the shore (high,
mid and low). There was also no significant difference between
the abundance of birds across the four observation days
(P>0.05).
Figure 3: Average shorebird abundance across three sample sites (LS=
low shore, MS= mid shore, HS= high shore). Total number of
replicates for each site was 24, six replicate counts were conducted
each day over a total of 4 days. Data sharing a letter are not
significantly different to each other (P≥0.05). Data not sharing a letter
are significantly different to each other (P≤0.05). Data shown are mean
± standard error of the mean (SEM).
Figure 4: Average shorebird diversity across three sample sites (LS=
low shore, MS= mid shore, HS=high shore). Total number of species
=8. Data sharing a letter are not significantly different to each other
(P≥0.05). Data not sharing a letter are significantly different to each
other (P≤0.05). Data are mean values ± standard error of the mean
(SEM).
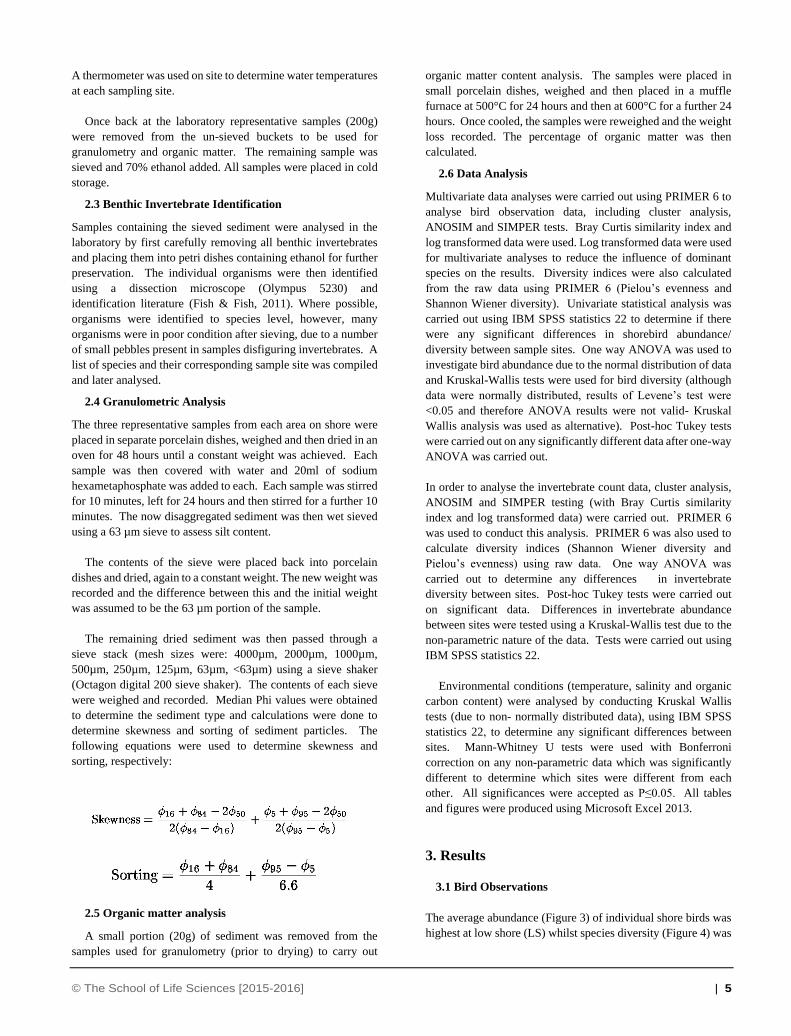
Figure 5: Average shorebird abundance by species across three sample
sites (LS= low shore, MS= mid shore, HS= high shore). Total number
of shorebird species present = 8. Data shown are mean ± standard error
of the mean (SEM).
© The School of Life Sciences [2015-2016] | 7
It is clear that the two most dominant species present on shore
were Redshanks and Curlews (figure 5), with Redshanks having
a predominantly higher abundance on the lower shore.
Redshank distribution decreased with distance from the
water’s edge. Curlews on the other hand appeared to prefer mid
shore (MS) and although their abundance decreases towards
high shore, they were still present in higher numbers at high
shore than Redshanks. Oystercatchers were observed on all
three areas of the shore, however, their abundance decreased
dramatically at high shore. It can be seen in Figure 5 that the
abundance of Oystercatchers on the lower shore was in fact
slightly higher than that observed of Curlews, although the
presence of Oystercatchers at high shore was next to none.
Lapwings were predominantly observed at high shore with
very few birds seen feeding on the lower shore. Little stints on
the other hand, were observed mainly on the lower shore.
Turnstone were observed on only one observation day and
were seen only on the mid shore. Knots were only observed on
the mid and high shore with no presence seen on the lower
shore. Bar-tailed godwits were not observed on any area of
the shore across any of the observation days.
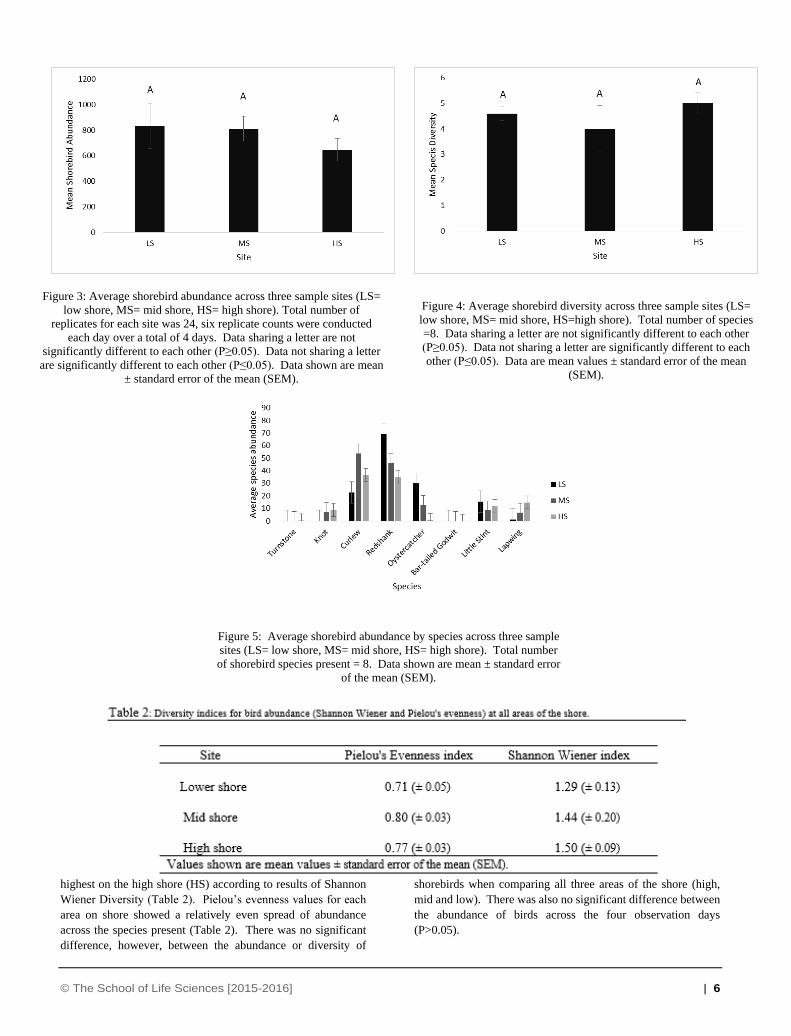
Results from the cluster analysis carried out on bird data
(Figure 6) highlight almost 100% similarity between
sample sites LS1 and LS2 (Lower shore sample site 1 and 2).
There is little distinct grouping throughout the rest of
the sites highlighting no distinct differences between the
sample sites.
However, it can be seen that HS4 (high shore sample site 4) has
Figure 6: Cluster analysis of shorebird abundance across the three sample sites with Bray Curtis similarity. Six replicates were taken
at each zone across 4 observation days (LS= low shore, MS=mid shore, HS= high shore).
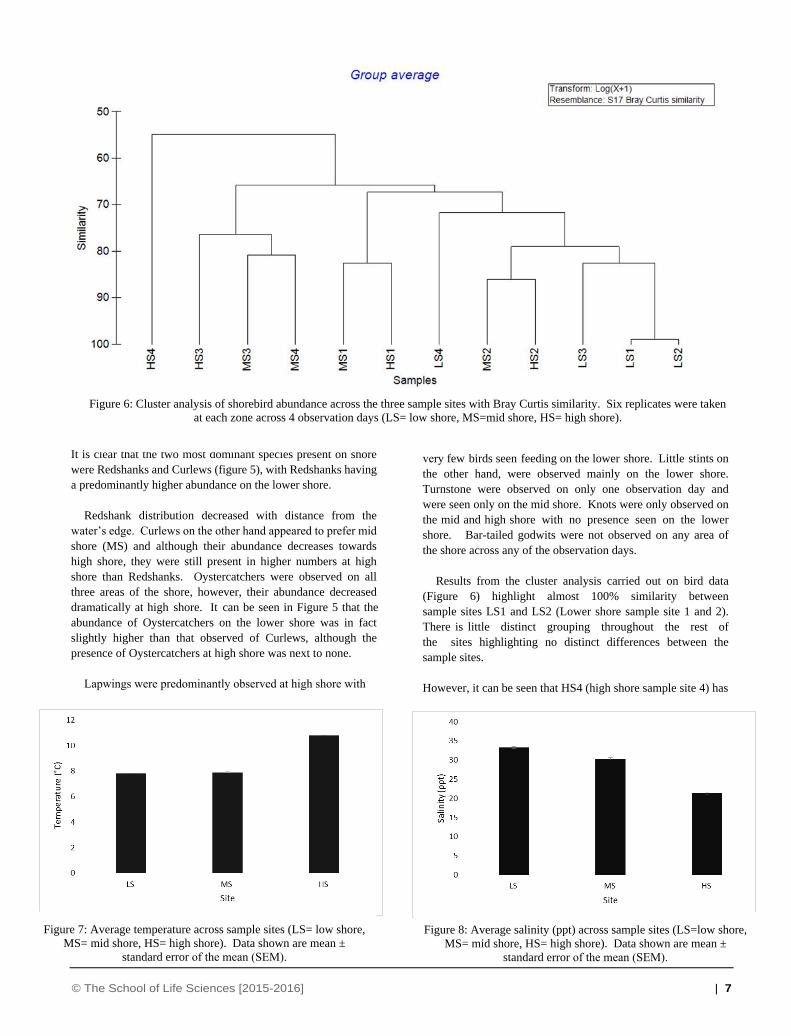
Figure 7: Average temperature across sample sites (LS= low shore,
MS= mid shore, HS= high shore). Data shown are mean ±
standard error of the mean (SEM).
Figure 8: Average salinity (ppt) across sample sites (LS=low shore,
MS= mid shore, HS= high shore). Data shown are mean ±
standard error of the mean (SEM).
© The School of Life Sciences [2015-2016] | 8
a dissimilarity of around 55% when comparing it to all other
sample sites. Results of the ANOSIM give an R value of 0.269
and a P value of 3.6%. This shows there is no significant
differences in species composition between sites. When looking
at which species contribute to the differences between each site,
results of SIMPER analysis show that Oystercatchers contribute
the most to differences between species composition on lower
shore and high/mid shore. Lapwings are seen to contribute the
most to the differences seen between mid and high shore.
All birds, with the exception of Knot, Turnstone and Bar-
tailed Godwit were present in all areas of the shore to some
extent. Bar-tailed Godwits were not observed on shore
throughout any of the observation days which was contrary to a
previous study carried out in the same location (Jones, 2014).
Oystercatchers generally were not present on the upper shore
and it became clear that upon departure from the site, the birds
were flying across to the Shore of Cramond Island. Many of the
birds preferred feeding when there was a film of water over the
sediment- which explains the high abundance on the low shore.
Disturbance on shore was minimal due to access to the West
side of Cramond being difficult. Throughout the observation
period only one pedestrian was seen on shore collecting mussels.
Pedestrian presence was moderate on the East side with dogs
barking occasionally. A large proportion of birds flew from the
site upon hearing dog barks. The site was under a flight path for
Edinburgh airport however, the presence of planes low in the sky
did not appear to affect birds on shore in any way. The presence
of pedestrians crossing the causeway to Cramond Island was
also moderate however, again did not cause any disturbance to
the birds.
3.2 Environmental Conditions
The highest temperature (Figure 7) was recorded on the upper
shore with an average of 10.1°C obtained, whereas the lowest
temperature was recorded on the Lower shore with an average
temperature of 7.8°C obtained. After analysing the results using
a Kruskal Wallis test it is clear that there is a significant
difference in temperature between each site with results of the
statistical analysis giving a P value of 0.048. Mann- Whitney U
tests did not distinguish which sites the significant difference lies
between, as all pairwise comparisons showed no significant
difference. The differences may lie between lower shore and
high shore, and mid shore and high shore, which can be seen in
Figure 7.
Salinity on shore (Figure 8) was analysed using the same
statistical test and indicated significant differences between each
site (P= 0.025). However, after conducting Mann- Whitney U
analysis to determine any significant differences between sites,
it is unclear where these differences lie. When looking at figure
8, it may be that the difference is between lower shore and high
shore as salinity can be seen to be higher on lower shore than
that of the high shore. Salinity varied greatly from lower shore
to high shore with an average of 33.3 seen on the lower shore
and an average of 21.3 seen on the high shore.
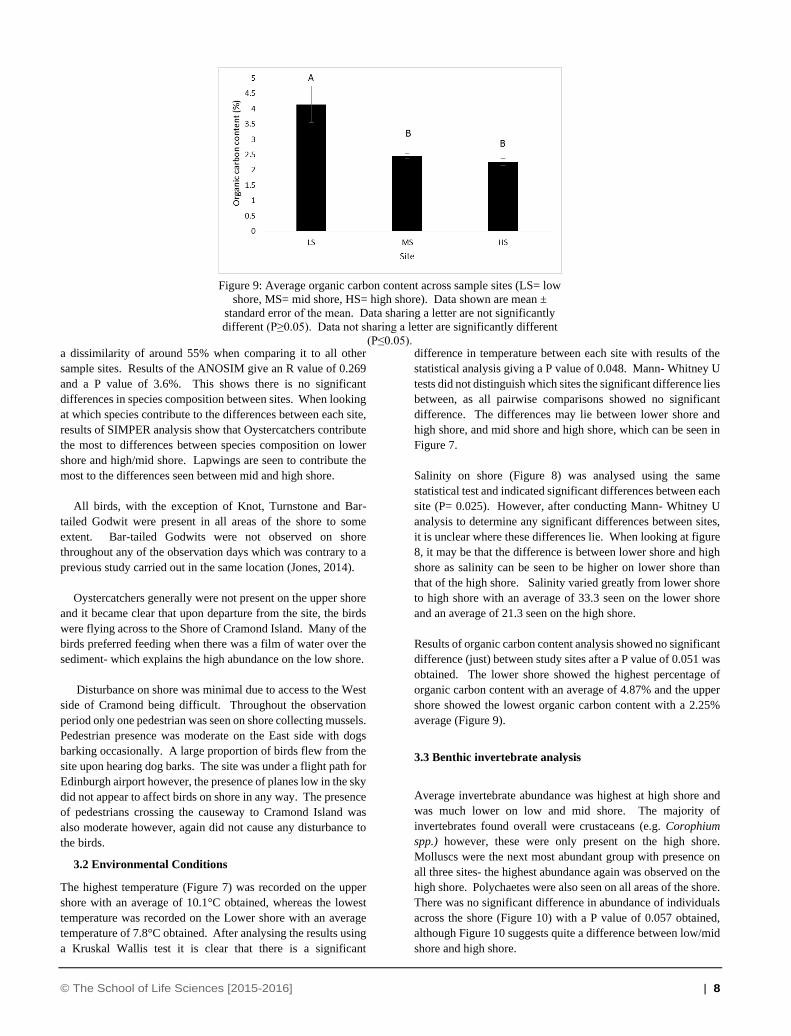
Results of organic carbon content analysis showed no significant
difference (just) between study sites after a P value of 0.051 was
obtained. The lower shore showed the highest percentage of
organic carbon content with an average of 4.87% and the upper
shore showed the lowest organic carbon content with a 2.25%
average (Figure 9).
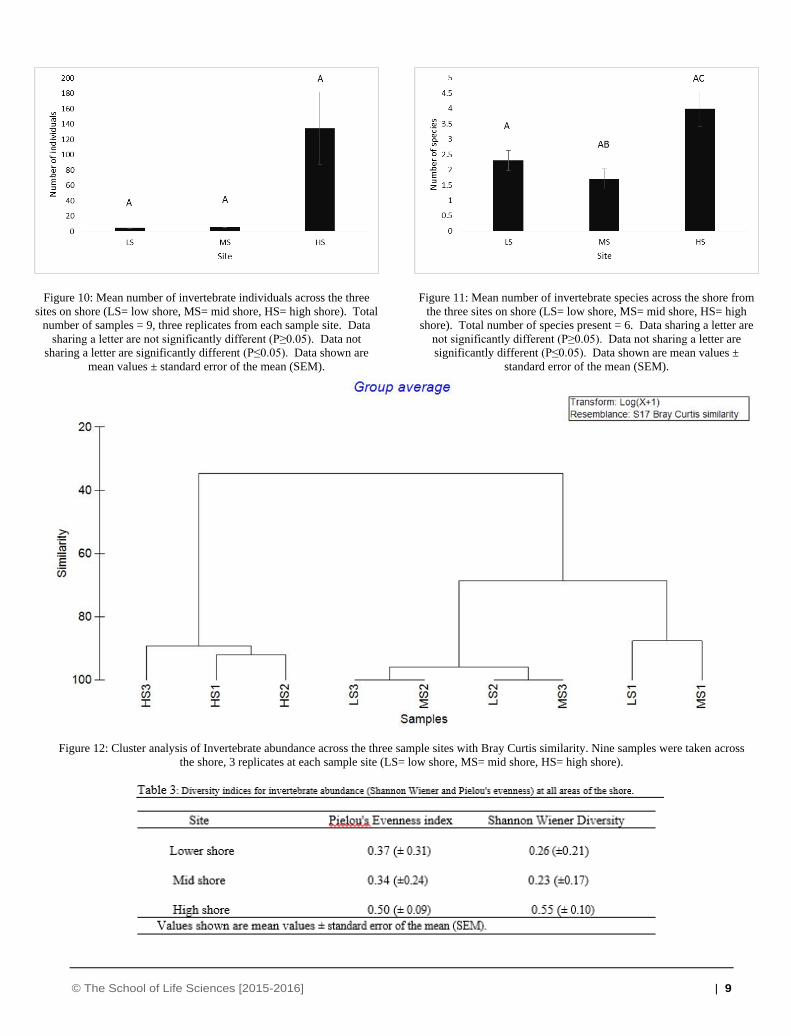
3.3 Benthic invertebrate analysis
Average invertebrate abundance was highest at high shore and
was much lower on low and mid shore. The majority of
invertebrates found overall were crustaceans (e.g. Corophium
spp.) however, these were only present on the high shore.
Molluscs were the next most abundant group with presence on
all three sites- the highest abundance again was observed on the
high shore. Polychaetes were also seen on all areas of the shore.
There was no significant difference in abundance of individuals
across the shore (Figure 10) with a P value of 0.057 obtained,
although Figure 10 suggests quite a difference between low/mid
shore and high shore.
Figure 9: Average organic carbon content across sample sites (LS= low
shore, MS= mid shore, HS= high shore). Data shown are mean ±
standard error of the mean. Data sharing a letter are not significantly
different (P≥0.05). Data not sharing a letter are significantly different
(P≤0.05).
© The School of Life Sciences [2015-2016] | 9
Figure 10: Mean number of invertebrate individuals across the three
sites on shore (LS= low shore, MS= mid shore, HS= high shore). Total
number of samples = 9, three replicates from each sample site. Data
sharing a letter are not significantly different (P≥0.05). Data not
sharing a letter are significantly different (P≤0.05). Data shown are
mean values ± standard error of the mean (SEM).
Figure 11: Mean number of invertebrate species across the shore from
the three sites on shore (LS= low shore, MS= mid shore, HS= high
shore). Total number of species present = 6. Data sharing a letter are
not significantly different (P≥0.05). Data not sharing a letter are
significantly different (P≤0.05). Data shown are mean values ±
standard error of the mean (SEM).
Figure 12: Cluster analysis of Invertebrate abundance across the three sample sites with Bray Curtis similarity. Nine samples were taken across
the shore, 3 replicates at each sample site (LS= low shore, MS= mid shore, HS= high shore).
© The School of Life Sciences [2015-2016] | 10
Average species diversity was highest on the high shore
according to Shannon Wiener diversity (Table 3). Lowest
diversity was seen mid shore (Figure 11). There was no
significant difference in diversity between low shore and mid
shore or high shore, however a significant difference in species
diversity was observed between mid-shore and high shore.
Cluster analysis shows three distinct groups, with high shore
being dissimilar to lower and mid shore with a similarity of less
than 40%. Low shore and mid shore are relatively similar with
similarity of around 70% (Figure 12). All three high shore sites,
although are dissimilar have a similarity of around 90%.
ANOSIM tests gave an R value of 0.621 and a P value of 3.6%,
showing that there was a significant difference between sites,
however the high P value shows that this difference is not a large
one. The main difference in species composition between lower
and high shore was crustaceans shown from the results of
SIMPER analysis. Polychaetes contributed the most to the
difference in composition between low and mid shore and
crustaceans contributed the biggest difference in species
composition between mid and high shore.
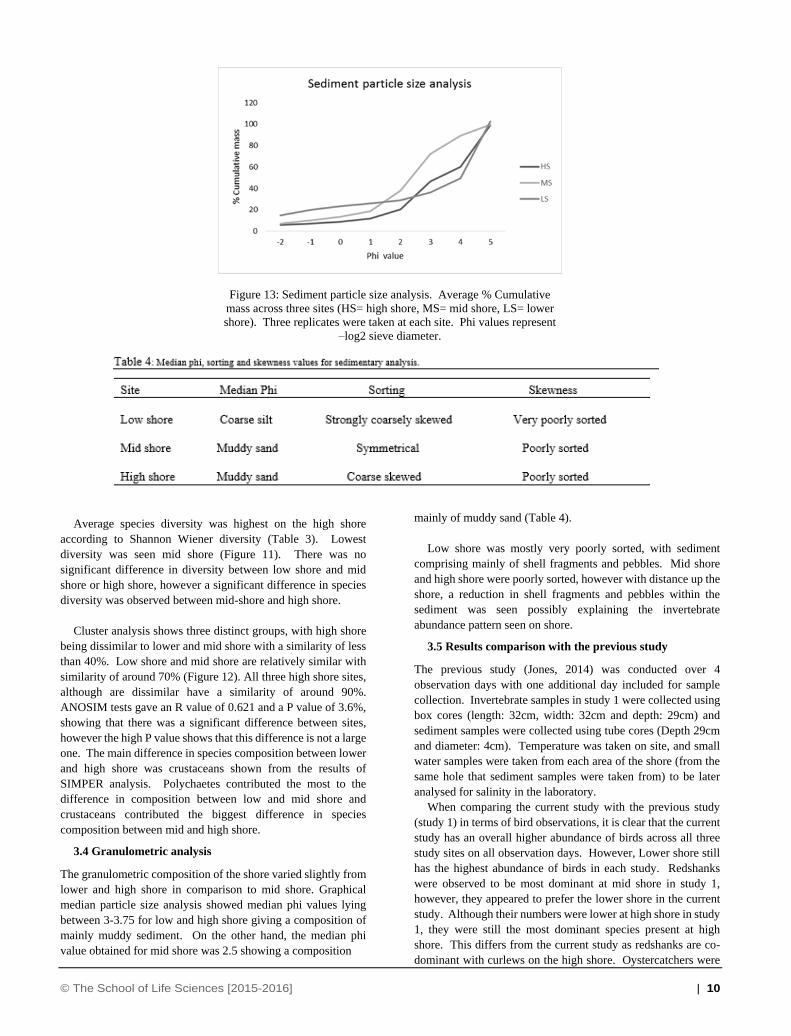
3.4 Granulometric analysis
The granulometric composition of the shore varied slightly from
lower and high shore in comparison to mid shore. Graphical
median particle size analysis showed median phi values lying
between 3-3.75 for low and high shore giving a composition of
mainly muddy sediment. On the other hand, the median phi
value obtained for mid shore was 2.5 showing a composition
mainly of muddy sand (Table 4).
Low shore was mostly very poorly sorted, with sediment
comprising mainly of shell fragments and pebbles. Mid shore
and high shore were poorly sorted, however with distance up the
shore, a reduction in shell fragments and pebbles within the
sediment was seen possibly explaining the invertebrate
abundance pattern seen on shore.
3.5 Results comparison with the previous study
The previous study (Jones, 2014) was conducted over 4
observation days with one additional day included for sample
collection. Invertebrate samples in study 1 were collected using
box cores (length: 32cm, width: 32cm and depth: 29cm) and
sediment samples were collected using tube cores (Depth 29cm
and diameter: 4cm). Temperature was taken on site, and small
water samples were taken from each area of the shore (from the
same hole that sediment samples were taken from) to be later
analysed for salinity in the laboratory.
When comparing the current study with the previous study
(study 1) in terms of bird observations, it is clear that the current
study has an overall higher abundance of birds across all three
study sites on all observation days. However, Lower shore still
has the highest abundance of birds in each study. Redshanks
were observed to be most dominant at mid shore in study 1,
however, they appeared to prefer the lower shore in the current
study. Although their numbers were lower at high shore in study
1, they were still the most dominant species present at high
shore. This differs from the current study as redshanks are co-
dominant with curlews on the high shore. Oystercatchers were
Figure 13: Sediment particle size analysis. Average % Cumulative
mass across three sites (HS= high shore, MS= mid shore, LS= lower
shore). Three replicates were taken at each site. Phi values represent
–log2 sieve diameter.
© The School of Life Sciences [2015-2016] | 11
seen to prefer low shore with their numbers decreasing up the
shore further from the water line- a pattern similar to both
studies. Bar-tailed Godwits and knots were present on all three
sites in small numbers in study 1, however in the current study
bar-tailed godwits were not observed on any areas of the shore
across all days. Knots showed a similar pattern in both studies
with small presence on each area of the shore with the exception
of mid shore- no knots were observed on mid shore in the current
study. Curlews were observed in large numbers on the low shore
in study 1 and their presence decreased with distance from the
low shore. A dissimilar pattern was observed in the current
study with curlew abundance being most dominant on mid shore.
It is obvious that curlew numbers are much higher in the current
study. Dunlin were observed on low shore and mid shore during
study 1 however, were not observed during the current study on
any site.
Shorebird diversity was seen to be highest on the lower shore
in the previous study however appears to be highest on the high
shore in the current study. There were three species observed on
shore in the current study that were not included in study 1:
Little stint, turnstone and lapwing. Lapwings were most
dominant on high shore while the other two species were seen
present on all areas of the shore in small numbers.
Study 1 observed overall lower average temperatures with the
highest temperature observed at 7.1°C on the lower shore and
the lowest temperature observed on the upper shore at 6.8°C- a
whole 4°C lower than that of the current study.
Study 1 showed salinity to be highest at mid shore with an
average value of 29.9 low shore was seen to have the lowest
salinity at 28.5. Salinity decreases with distance from low shore
in the current study with a maximum average salinity of 33.3
seen on low shore- 5 lower than observed on low shore in study
1. Salinity in study 1 is 8 higher on high shore than the current
study.
The previous study conducted showed an overall higher
average abundance of invertebrates found at each sample site
with the exception of high shore. High shore in the current study
had an overall higher average abundance of invertebrates than
study 1.
Crustaceans appeared to be the most dominant taxa found in
study 1 with the highest abundance found on the low shore,
followed by mid shore. The current study also shows an overall
dominance of crustaceans, however only on high shore which is
very different in comparison to study 1 in which crustaceans are
present in very small numbers on high shore. Polychaetes were
found on all areas of the shore in study 1, with the highest
abundance observed on the high shore. Polychaetes were only
found on high shore in the current study. Molluscs too were
found on all three areas of the shore with the highest abundance
observed on mid shore in study 1. A similar pattern was
observed in the current study however the highest abundance
was seen on high shore.
3. Discussion
The optimal foraging theory considers the optimum food intake
in relation to energy expenditure (Macarthur & Pianka, 1966).
It is to the bird’s advantage to consume more energy than it is
using. The simplest optimal foraging model, known as Ideal
Free Distribution (IFD), is used to predict the equilibrium of
organisms amongst patch resources/ habitats (Kennedy & Gray,
1993). It works on the assumption that birds are able to use prior
knowledge of the area to determine patch quality (where a patch
is a cluster of invertebrates within sediment) to reduce energy
loss (van Gils, Schenk et al., 2003). Due to many birds always
returning to the same site to feed (Coleman & Milton, 2012), this
becomes possible as shorebirds begin to recognise the patches
with the highest energy available, and so waste less energy
moving between patches of lower energy intake, reducing
overall energy expenditure (van Gils et al., 2003). This is
important in conserving energy, allowing the birds to build up
their fat stores.
Intertidal flats are the most productive in the world (Masero,
2003) and provide high numbers of prey with minimum
disturbance for shorebirds. Shorebirds use areas such as the
intertidal flat in this study to build up energy reserves. Birds
require energy to maintain body temperature, to fly to and from
feeding grounds and to gather food (Evans, 1976). They are
faced with the conflicting problems of predation and surviving
cold weather. It is advantageous to the birds to increase their fat
reserves to overcome the cold weather, however it is also
advantageous to remain lean to avoid predation (Rehfisch, Insley
et al., 2003). It is therefore essential that intertidal flats become
the forefront of conservation efforts, before shorebird numbers
deplete further due to the loss of suitable feeding grounds. In
order to do so, it is first necessary to understand the use of these
habitats by shorebirds to implement appropriate management
strategies (Gill & Handel, 1990).
The results of this study aim to help understand the use of
intertidal flats by shorebirds, by observing the distribution of
shorebirds across the shore, whilst also taking environmental
factors into account. The highest abundance of birds in this
study was observed on the lower shore which may be explained
according to a number of factors. The sediment on the lower
shore was very poorly sorted, which leads to the assumption that
the sediment here has poor porosity, leading to a film of water
forming on the surface of the sediment (Nelson, 1994). This film
of water leads to increased availability of invertebrates within
the sediment (VanDusen, Fegley et al., 2012) and therefore bird
abundance on this area of the shore also increases. This did not
significantly affect the spread of birds across all areas of the
shore and it remains that the birds did not prefer one area of the
shore significantly more than another area.
The low numbers of invertebrates collected during this study
may have been a consequence of a number of factors. Possibly
more care should have been taken when sampling i.e. reducing
noise and vibrations when collecting samples to prevent scaring
invertebrates deeper into the ground. Due to time restraints
replicates were kept to a maximum of two when sampling,
© The School of Life Sciences [2015-2016] | 12
The increase in birds observed may be due to construction of
Queensferry crossing. Construction work causes an increase in
disturbance, which may lead to birds leaving their
current feeding sites (Smit & Visser, 1993) in order to find sites
which are less disturbed. Due to the site of interest in this
study being far enough from the bridge construction to avoid
disturbance it is possible that the birds usually found on
intertidal areas by the new Forth Bridge have been forced to
move to the current study site to feed.
There was a number of individual species observed in study
1 which were not present in the current study; Dunlin, Bar-
tailed godwit and grey plover were not observed on any
of the observation days carried out during this study.
This may possibly be due to a decrease in invertebrate
abundance throughout the study site leaving birds with a
lack of prey available.
The increase in bird abundance seen may not be a continuing
trend due to their most likely being slight differences in
conditions and disturbance on observation days between the
two studies. The differences in invertebrate abundance may
also be down to slightly altering sample sites.
It should be noted that none of the trends seen in this report
can be assumed as ongoing due to its small scale.
Further research should be carried out to help understand or
predict the effects of anthropogenic activities on
intertidal areas (Granadeiro, Santos et al., 2007). This will
then help determine why there are a number of fluctuating
shorebird populations and why these alterations are happening
as currently data on trends of shorebird populations are poor
or non-existent (Simmons, Kolberg et al., 2015). This
will help implement further management strategies to the
site to help prevent further declines in populations.
4. Conclusion
however in future studies, increasing the number of replicates at
each sample site would be advantageous.
The observed abundance of shorebirds in relation to
invertebrates across the sample sites in the current study does not
portray the relationship expected. In relation to the Ideal Free
Distribution model, the area of the shore containing the highest
abundance of invertebrates, in theory, should have had the
highest abundance of shorebirds present. This was not the case
in this study as the lowest abundance of shorebirds was observed
on the area of the shore with the highest abundance of
invertebrates. This may be due to the human disturbance of the
East side of Cramond being closer to the high shore, on the West
side, than any other area of the shore. It has been seen that
shorebirds change their feeding behaviour when humans are
present to reduce any risks perceived (Thomas, Kvitek et al.,
2003).
Sedimentary analysis appears to have had no effect on the
abundance/diversity of birds on any area of the shore. The very
poorly sorted sediment on lower shore may explain the lack of
invertebrates present on this area of shore- however, does not
explain why the abundance of birds was not highest on this area
of the shore. The sediment becomes less poorly sorted on mid/
high shore which may explain the slight increase in invertebrate
abundance/diversity. This does not explain the substantial
increase in invertebrate abundance present on high shore
however.
Upon comparison there are a number of dissimilarities
between the current study and study 1 which was carried out
during the winter months of 2013/14. In a report by Scottish
Natural Heritage (SNH, 2011) it was observed that the number
of Curlews present within the Firth of Forth Site of Special
Scientific Interest (SSSI) had almost doubled in numbers since
2000. This runs parallel with the results obtained in this study
which show a dramatic increase in the number of Curlew present
across the shore in comparison to Study 1, highlighting an
obvious trend in increasing curlew populations. It is not only
Curlews which can be seen increasing in population, the overall
abundance of birds seen in 2015/16 is much higher than was seen
in 2013/14. Results of invertebrate counts do not coincide with
the increase in bird population observed as overall there was a
decrease in invertebrate abundance across all areas of the shore
from 2015/16 in comparison to 2013/14.
Organic carbon content in the study carried out this year was
a lot lower than that seen in study 1, this may explain the large
decrease in invertebrate abundance seen in the current study
compared to study 1. This decrease in organic carbon content
observed may be a result of increased overall temperatures seen
across the shore in the present study. The increase
in temperature makes it possible for microbial organisms to
breakdown organic matter quicker- thus reducing its presence (Kaiser, Attril et al., 2011). However, this does not give explanation as to why shorebird abundance was much higher in the present study.
Overall, due to the highest abundance of birds seen on
lower shore, in both studies, it may be concluded that
shorebirds prefer this area of shore. Possibly due to its
very poorly sorted sediment, which leads to the assumption
that the sediment has poor porosity, therefore allowing a film
of water to form. This increases the availability of
invertebrates for birds to feed on. However, results from
the current study reveal very few invertebrates were
present on the lower shore, which does not account for the
increase in bird abundance. Results of this 2015/16 study
show an increase in bird populations which, when compared to the study done in 2013/14 (Jones, 2014) and trends seen in local bird populations from 2002/3-2012/13 (Table 1), appears to be a solitary occurrence since the site was last seen designated as a RAMSAR site and a special protected area in 2001 (JNCC, 2015). This indicates that the bird populations are beginning to increase, which highlights the need for the area to remain a RAMSAR site and special protected area. This will
© The School of Life Sciences [2015-2016] | 13
give bird populations the chance to increase more substantially over the next few years without being disturbed. The reason for the increase in bird abundance/diversity in this study when compared to the previous study is unclear. The reduced carbon
content seen in this study in comparison to study 1 is most
likely due to the increased temperatures seen on shore in this
study. The higher temperatures are likely to lead to a faster
depletion in carbon content. However, the reduced abundance/
diversity of benthic invertebrates seen in this study when
compared to study 1 are un-explained and should not have led
to an increase in bird populations when taking the Ideal Free
distribution into account. Further studies should be carried out
to determine if the increase in bird populations seen in this
study is an on-going trend or isolated to this study only.
6. Acknowledgements
I would like to thank my project mentor Teresa Fernandes for all
her help and encouragement during my final year project. Also
a huge thank you to Hugh Barras for helping me with my field
sampling, equipment and lab techniques throughout my project
and for keeping me positive when things got tough. Also a big
thanks to the lab technicians at Heriot Watt for helping me find
any equipment I required.
© The School of Life Sciences [2015-2016] | 14
7. References
Baird D, Evans PR, Milne H, Pienkowski MW (1985) Utilization by
shorebirds of benthic invertebrate production in intertidal areas.
Oceanography and marine biology 23: 573-597.
Botton ML, Loveland RE, Jacobsen TR (1994) Site selection by
migratory shorebirds in Delaware Bay, and its relationship to beach
characteristics and abundance of horseshoe crab (Limulus polyphemus)
eggs. The Auk: 605-616.
Chafer C, Loyn RD (2015) Shorebird counts. In Oz Coasts, Marine &
coastal environmental group, Canberra: Geoscience Australia.
Coleman JT, Milton DA (2012) Feeding and roost site fidelity of two
migratory shorebirds in Moreton Bay, South-Eastern Queensland,
Australia. Sunbird: Journal of the Queensland Ornithological Society,
The 42: 41.
Colwell MA (2010) Shorebird ecology, conservation, and management.
Univ of California Press.
Drouet S, Turpin V, Godet L, Cognie B, Cosson RP, Decottignies P
(2015) Utilisation of intertidal mudflats by the Dunlin Calidris alpina
in relation to microphytobenthic biofilms. Journal of Ornithology 156:
75-83.
Durell SELVD (2000) Individual feeding specialisation in shorebirds:
population consequences and conservation implications. Biological
Reviews of the Cambridge Philosophical Society 75: 503-518.
Evans PR (1976) Energy balance and optimal foraging strategies in
shorebirds: some implications for their distributions and movements in
the non-breeding season. Ardea 64: 117-139.
Fish JD, Fish S (2011) A Student's Guide to the Seashore. Cambridge
University Press,
Gill RE, Handel CM (1990) The Importance of Subarctic Intertidal
Habitats to Shorebirds: A Study of the Central Yukon-Kuskokwim
Delta, Alaska. The Condor 92: 709-725
Gittings BM (2012) Drum sands. In The Gazetteer for Scotland, http://www.scottish-places.info/ (viewed January 2016).
Goss-Custard JD (1996) The Oystercatcher. Oxford University Press
Inc., New York.
Granadeiro JP, Santos CD, Dias MP, Palmeirim JM (2007)
Environmental factors drive habitat partitioning in birds feeding in
intertidal flats: implications for conservation. Hydrobiologia 587:
291-302.
Holt CA, Austin GE, Cabrade NA, Mellan HJ, Hearn RD, Stroud DA,
Wolton SR, Musgrove AJ (2015) Waterbirds in the UK 2013/14: The
Wetland Bird Survey. In BTO, RSPB, JNCC, WWT (eds) Thetland:
British Trust for Ornithology.
JNCC (2015) UK Ramsar sites. In http://jncc.defra.gov.uk/page-1389.(viewed: January 2016).
Jones DW (2014) The Diversity and Distribution of Over-wintering
shorebirds on two dissimilar soft-bodied shores within the Firth of
Forth, Scotland. In Heriot-Watt University.
Kaiser MJ, Attril MJ, Jennings S, Thomas DN, Barnes DK, A., Brierly
AS, Hiddink JG, Kaartokallio H, Polunin NV, C., Raffaelli DG (2011)
Marine Ecology: processes, systems and impacts. Oxford University
Press, United States.
Kennedy M, Gray RD (1993) Can Ecological Theory Predict the
Distribution of Foraging Animals? A Critical Analysis of Experiments
on the Ideal Free Distribution. Oikos 68: 158-166.
Macarthur RH, Pianka ER (1966) On Optimal use of Patchy
Environment. The American Naturalist 100: 603-609.
Masero JA (2003) Assessing alternative anthropogenic habitats for
conserving waterbirds: salinas as buffer areas against the impact of
natural habitat loss for shorebirds APA. Biodiversity & Conservation
12: 1157-1173.
Mendonça VM, Raffaelli DG, Boyle PR (2007) Interactions between
shorebirds and benthic invertebrates at Culbin Sands lagoon, NE
Scotland: Effects of avian predation on their prey community density
and structure. Scientia Marina 71: 579-591.
Nebel S, Jackson DL, Elner RW (2005) Functional association of bill
morphology and foraging behaviour in calidrid sandpipers. Animal
Biology 55: 235-243.
Nelson P, H. (1994) Pemeability- Porosity arrangement in sedementary
rocks. The Log Analyst 35: 38-62.
Norazlimi N, Ramli R (2014) Temporal Variation of Shorebirds
Population in Two Different Mudflats Areas. World Academy of
Science, Engineering and Technology, International Journal of
Biological, Biomolecular, Agricultural, Food and Biotechnological
Engineering 8: 1265-1271.
Rehfisch MM, Insley H, Swann B (2003) Fidelity, Of Overwintering
Shorebirds to roosts on the Moray Basin, Scotland: Implications for
predicting Impacts of habitat loss. Ardea 91: 53-70.
Simmons RE, Kolberg H, Braby R, Erni B (2015) Declines in migrant
shorebird populations from a winter-quarter perspective. Conservation
Biology 29: 877-887.
Skagen SK, Knopf FL (1994) Migrating shorebirds and habitat dynamics
at a prairie wetland complex. The Wilson Bulletin: 91-105.
Smit CJ, Visser GJM (1993) Effects of Disturbance on Shorebirds:a
summary of existing knowledge from the Dutch Wadden Sea and Delta
area. Wader study group bulletin 68: 6-19.
SNH (2004) Firth of Forth: Site of Special Scientific Interest. In file:///C:/Users/Asus/Downloads/site8163-doc1%20(3).pdf.(viewed december 2015).
SNH (2011) Firth of Forth: Site of Special Scientific Interest. In Site
management statement, file:///C:/Users/Asus/Downloads/site8163-doc3%20(7).pdf. (viewed: December 2015).
Thomas K, Kvitek RG, Bretz C (2003) Effects of human activity on the
foraging behavior of sanderlings Calidris alba. Biological Conservation
109: 67-71.
van de Kam J, de Goeij P, Moore SJ, Ens B, Piersma T, Zwarts L
(2004) Shorebirds : an illustrated behavioural ecology. KNNV
Publishers, Utrecht.
van Gils JA, Schenk IW, Bos O, Piersma T (2003) Incompletely
informed shorebirds that face a digestive constraint maximize net
energy gain when exploiting patches. The American Naturalist 161:
777-793.

© The School of Life Sciences [2015-2016] | 15
VanDusen BM, Fegley SR, Peterson CH (2012) Prey Distribution, Physical Habitat Features, and Guild Traits Interact to Produce Contrasting Shorebird Assemblages among Foraging Patches. Plos One 7: 14.
Woodward I, Bray J, Marchant J, Austin J, Calladine J (2015) A review
of literature on the qualifying interest species of Special Protections
Areas (SPAs) in the Firth of Forth and development related influences.
In Scottish Natural Heritage Commissioned Report No 804.
8. Appendix
Raw data, previous study data and statistcal justification available on
request.
Related Documents

![Final Project Proposal[1]](https://static.cupdf.com/doc/110x72/577d33c01a28ab3a6b8ba2a8/final-project-proposal1.jpg)