Welcome message from author
This document is posted to help you gain knowledge. Please leave a comment to let me know what you think about it! Share it to your friends and learn new things together.
Transcript

Portfolio 1
Sales
jindalongchul
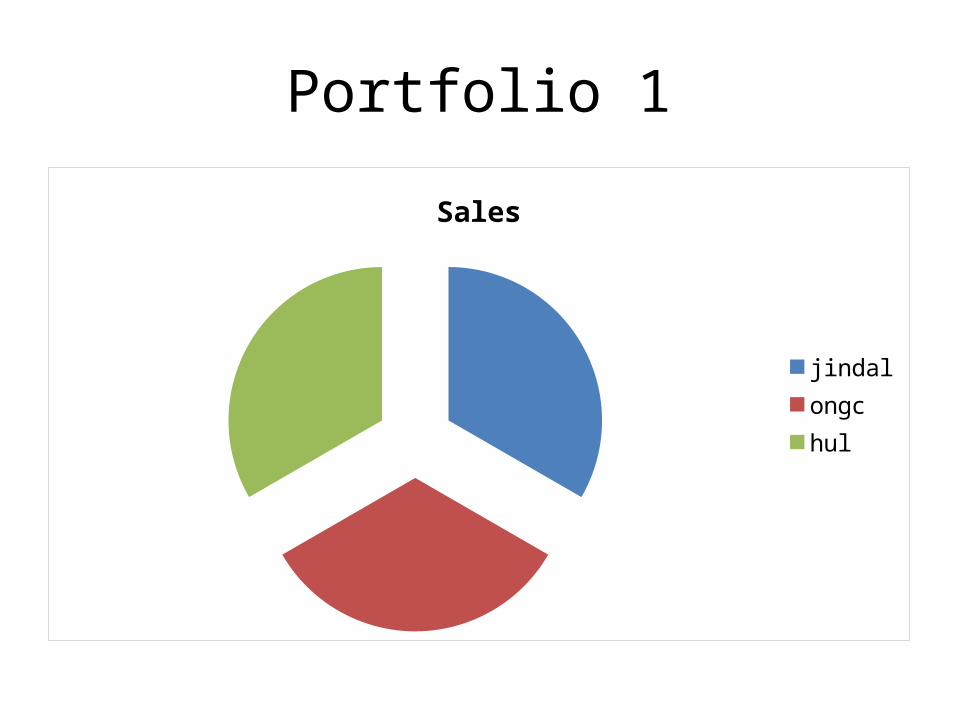
Oil and Natural Gas Corporation Limited (ONGC)
• Incorporated on 23 June 1993
• A state-owned oil and gas company in India
• It contributes 77% of India‘s crude oil production and 81% of India‘s natural oil production
R S SharmaChairman &
Managing Director
R S SharmaChairman & Managing Director
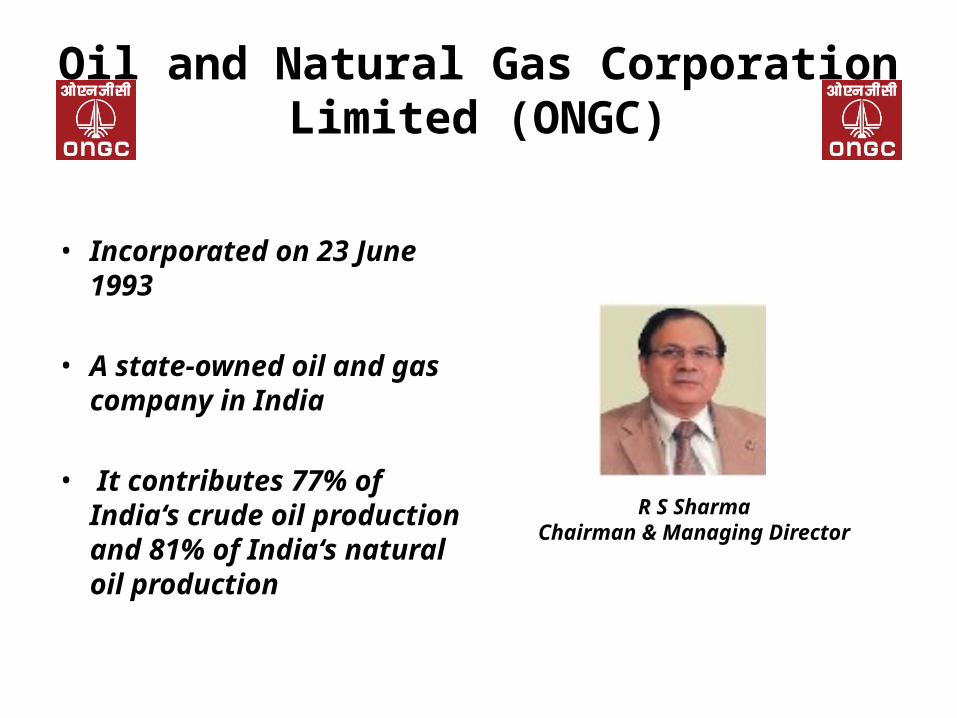
ONGC
Year Market Price Dividend (RS) (%)
2010 1098.5 15 150
2009 779.7 32 320
2008 981.35 32 320
2007 878.15 31 310
2006 864.27 38 380
2005 582.62 45 450
ONGC
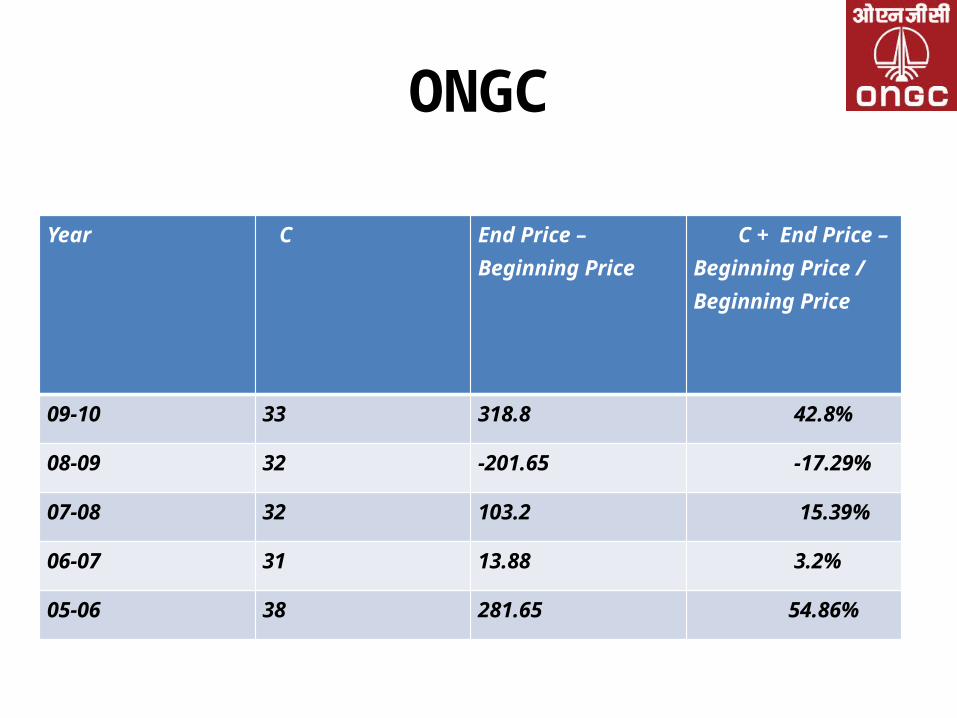
Year C End Price – Beginning Price
C + End Price – Beginning Price / Beginning Price
09-10 33 318.8 42.8%
08-09 32 -201.65 -17.29%
07-08 32 103.2 15.39%
06-07 31 13.88 3.2%
05-06 38 281.65 54.86%
ONGC
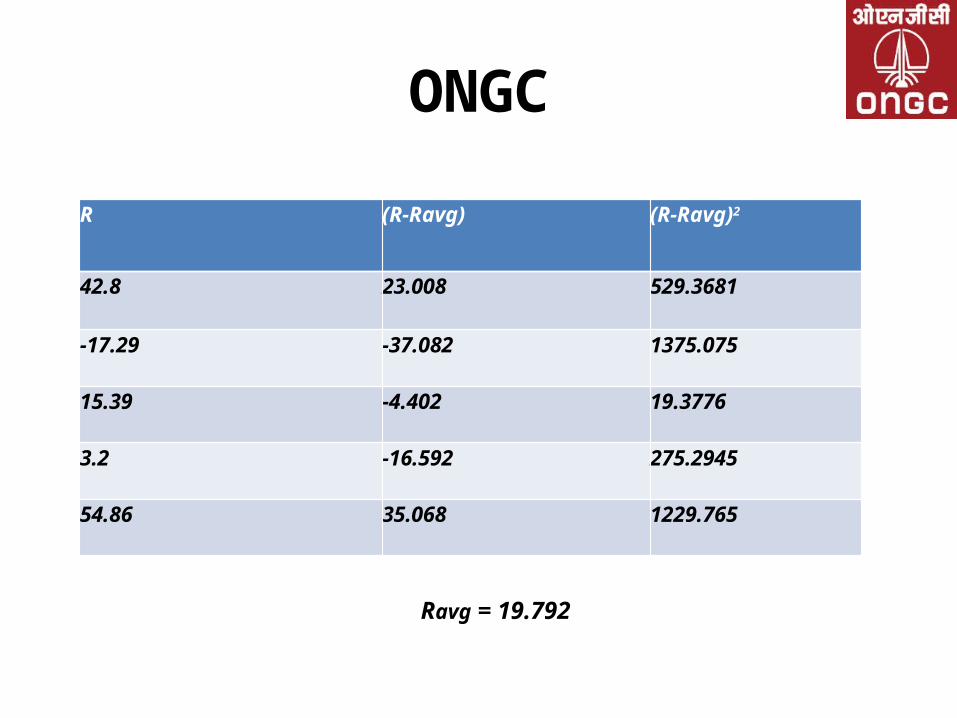
R (R-Ravg) (R-Ravg)2
42.8 23.008 529.3681
-17.29 -37.082 1375.075
15.39 -4.402 19.3776
3.2 -16.592 275.2945
54.86 35.068 1229.765
Ravg = 19.792
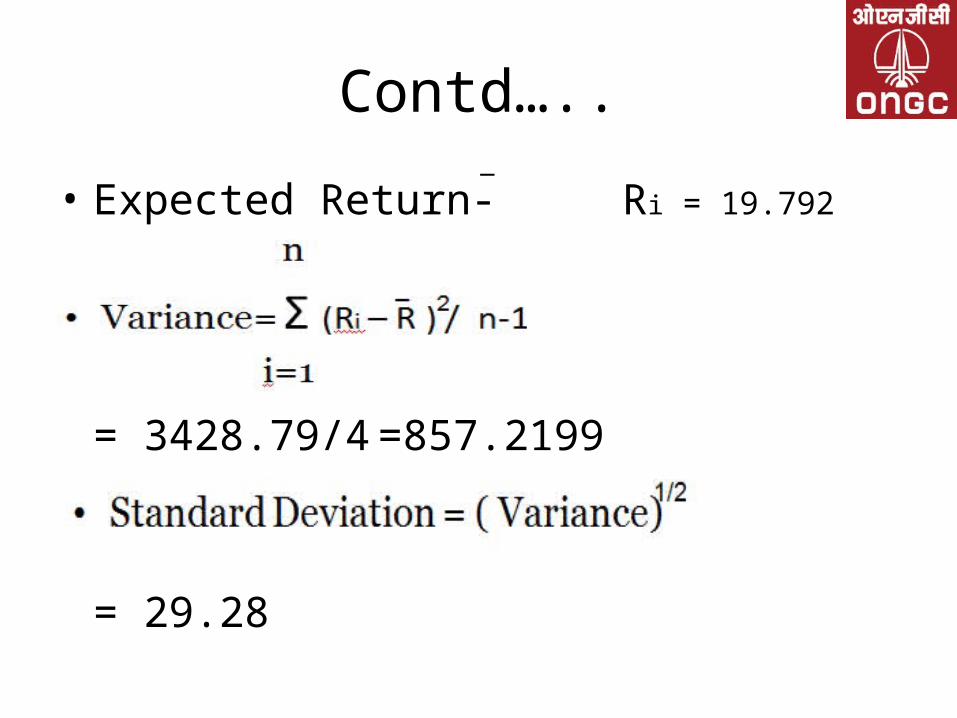
Contd…..
• Expected Return- Ri = 19.792
= 3428.79/4 =857.2199
= 29.28
_
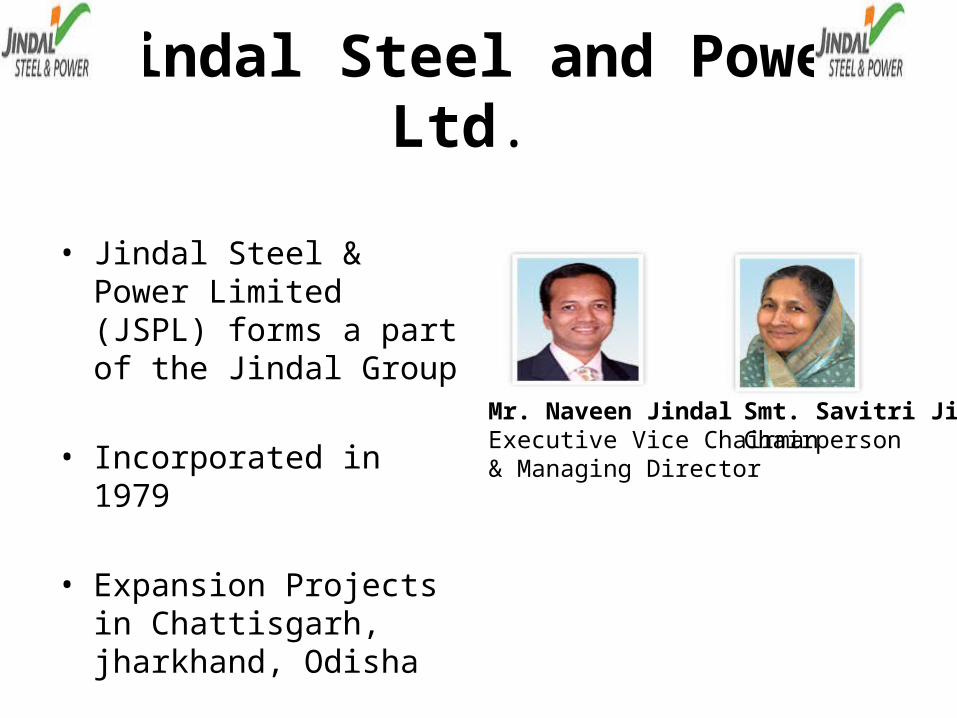
Jindal Steel and Power Ltd.
• Jindal Steel & Power Limited (JSPL) forms a part of the Jindal Group
• Incorporated in 1979
• Expansion Projects in Chattisgarh, jharkhand, Odisha
Mr. Naveen JindalExecutive Vice Chairman & Managing Director
Smt. Savitri JindalChairperson
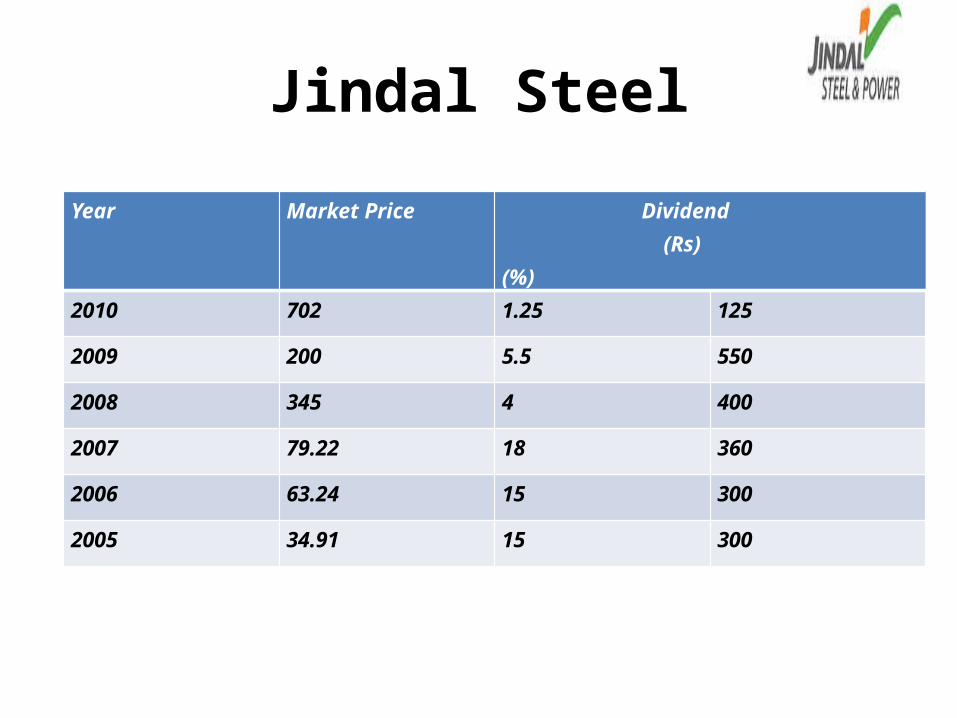
Jindal Steel
Year Market Price Dividend (Rs) (%)
2010 702 1.25 125
2009 200 5.5 550
2008 345 4 400
2007 79.22 18 360
2006 63.24 15 300
2005 34.91 15 300
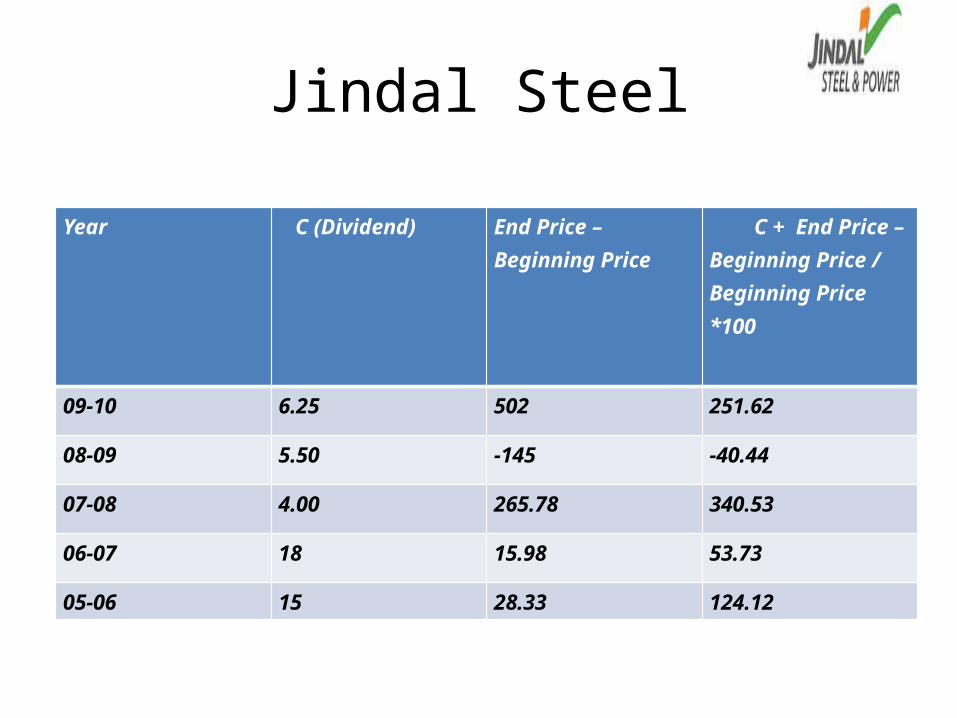
Jindal Steel
Year C (Dividend) End Price – Beginning Price
C + End Price – Beginning Price / Beginning Price *100
09-10 6.25 502 251.62
08-09 5.50 -145 -40.44
07-08 4.00 265.78 340.53
06-07 18 15.98 53.73
05-06 15 28.33 124.12

Jindal Steel
R (R-Ravg) (R-Ravg)2
251.62 105.72 11176.72
-40.44 -186.34 34722.6
340.53 194.63 37880.84
53.73 -92.17 8495.31
124.12 -21.78 474.37
Ravg = 145.912
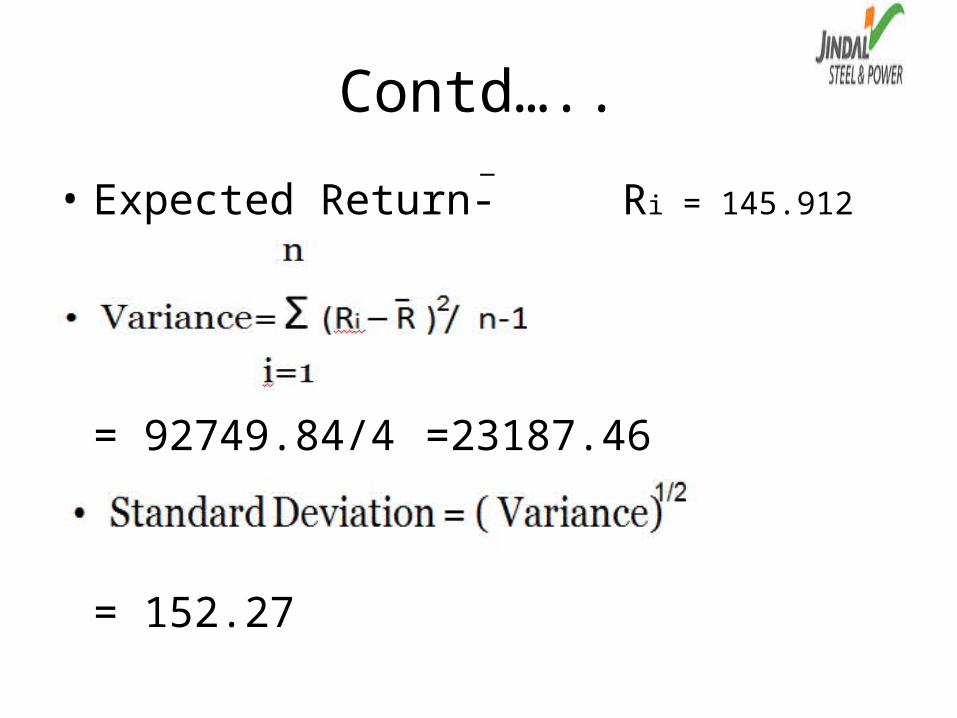
Contd…..
• Expected Return- Ri = 145.912
= 92749.84/4 =23187.46
= 152.27
_
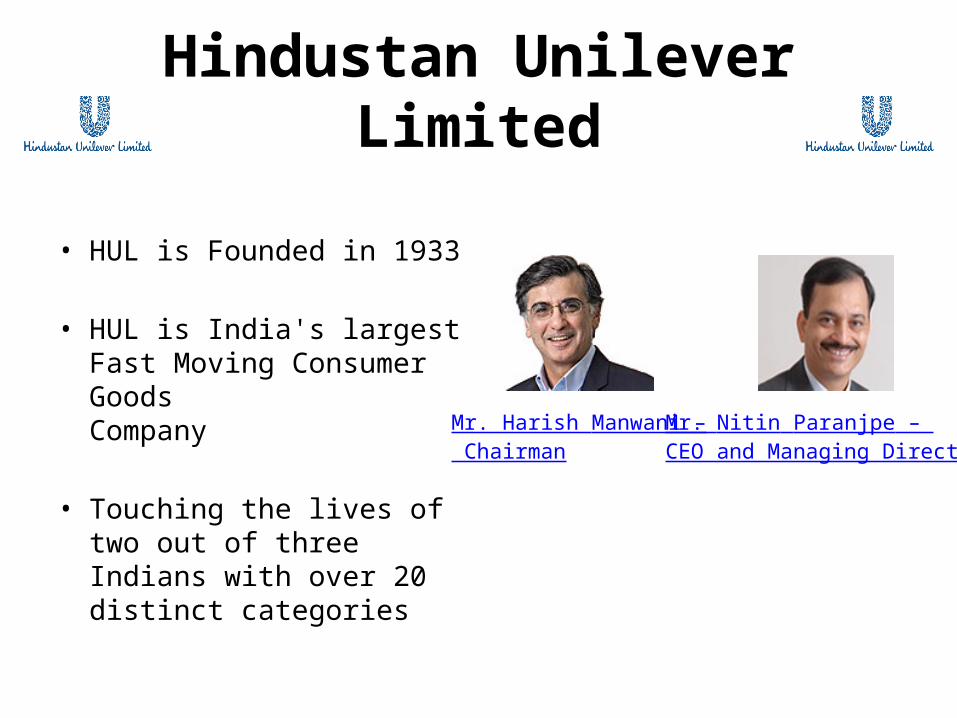
Hindustan Unilever Limited
• HUL is Founded in 1933
• HUL is India's largest Fast Moving Consumer GoodsCompany
• Touching the lives of two out of three Indians with over 20 distinct categories
Mr. Nitin Paranjpe – CEO and Managing Director
Mr. Harish Manwani – Chairman
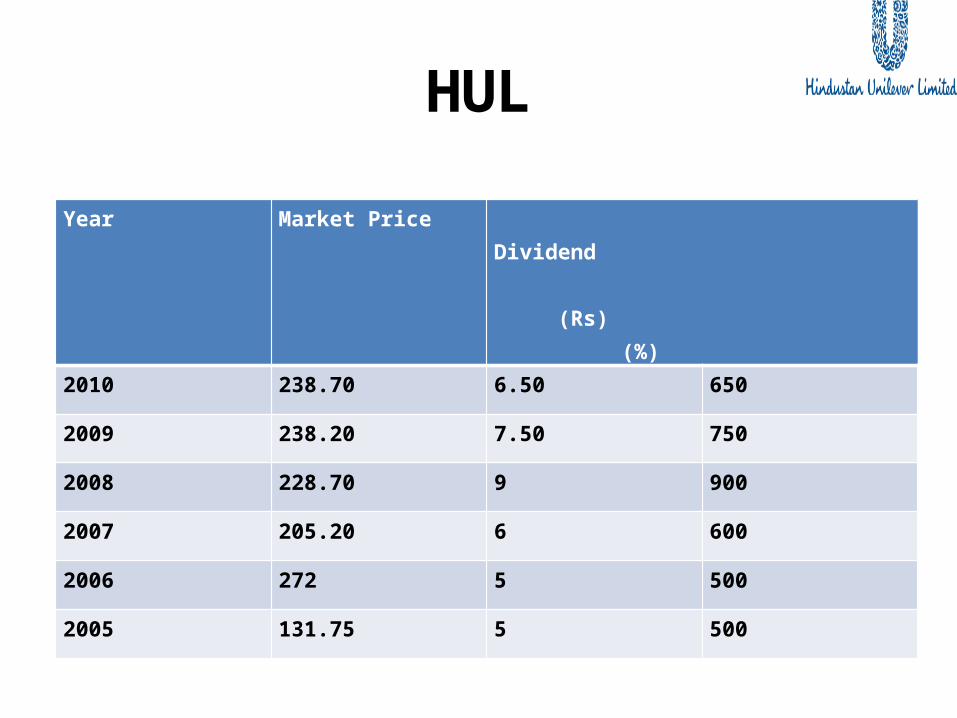
HUL
Year Market Price Dividend (Rs) (%)
2010 238.70 6.50 650
2009 238.20 7.50 750
2008 228.70 9 900
2007 205.20 6 600
2006 272 5 500
2005 131.75 5 500
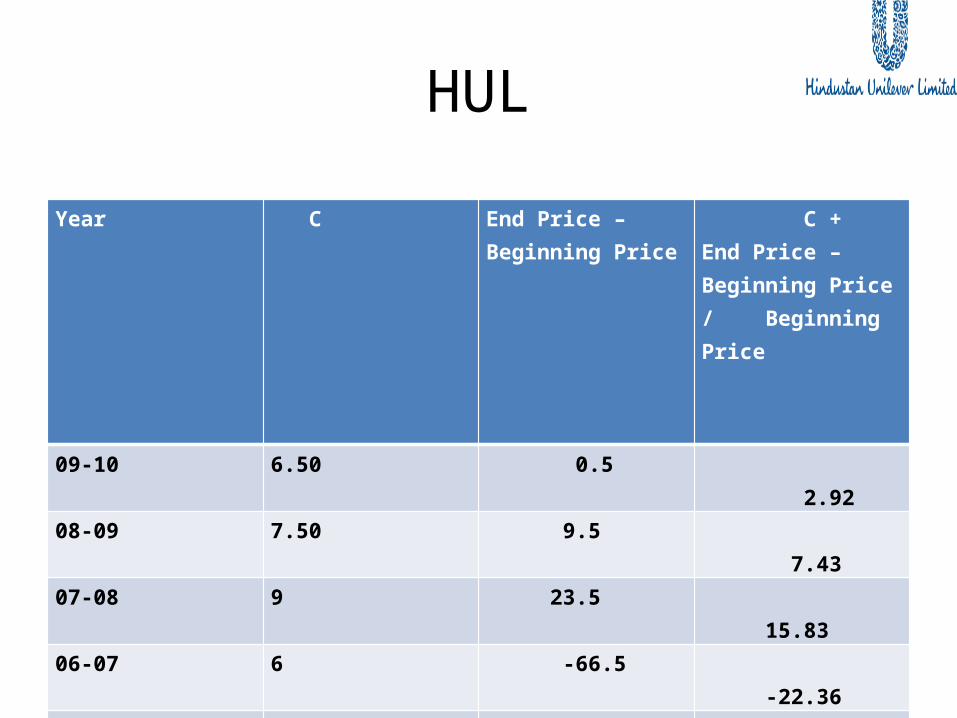
HUL
Year C End Price – Beginning Price
C + End Price – Beginning Price / Beginning Price
09-10 6.50 0.5 2.92
08-09 7.50 9.5 7.43
07-08 9 23.5 15.83
06-07 6 -66.5 -22.36
05-06 5 140.25 110.24
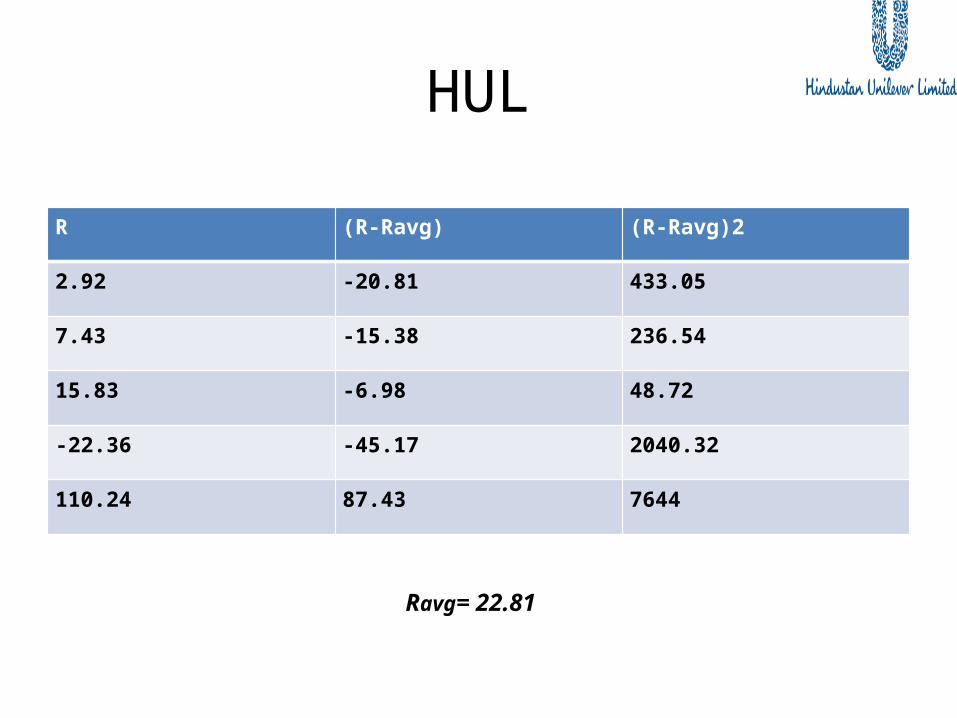
HUL
R (R-Ravg) (R-Ravg)2
2.92 -20.81 433.05
7.43 -15.38 236.54
15.83 -6.98 48.72
-22.36 -45.17 2040.32
110.24 87.43 7644
Ravg= 22.81
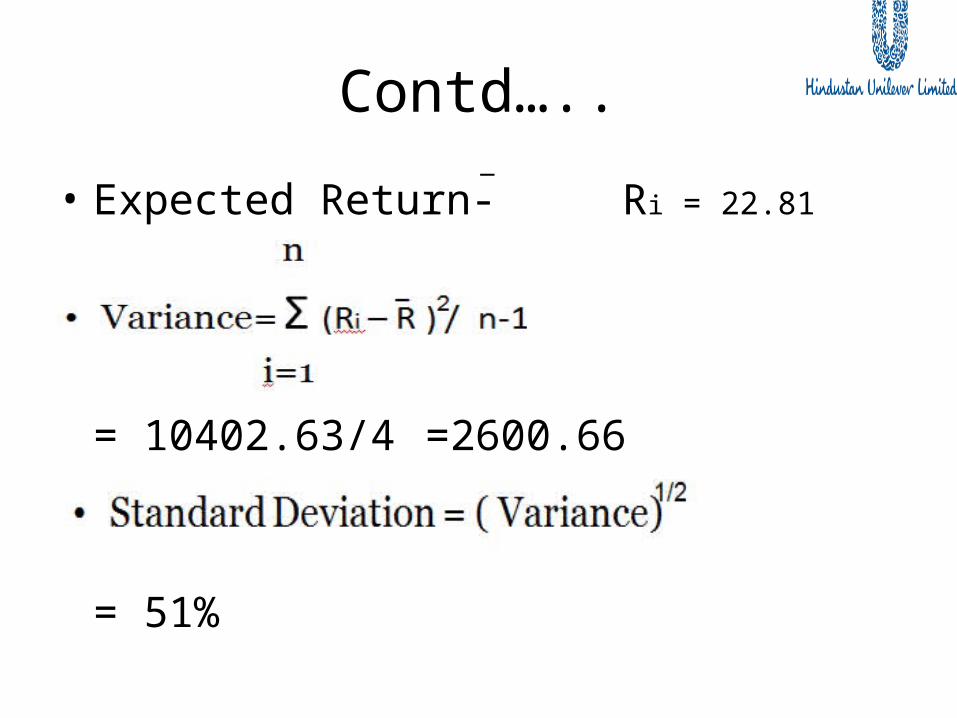
Contd…..
• Expected Return- Ri = 22.81
= 10402.63/4 =2600.66
= 51%
_
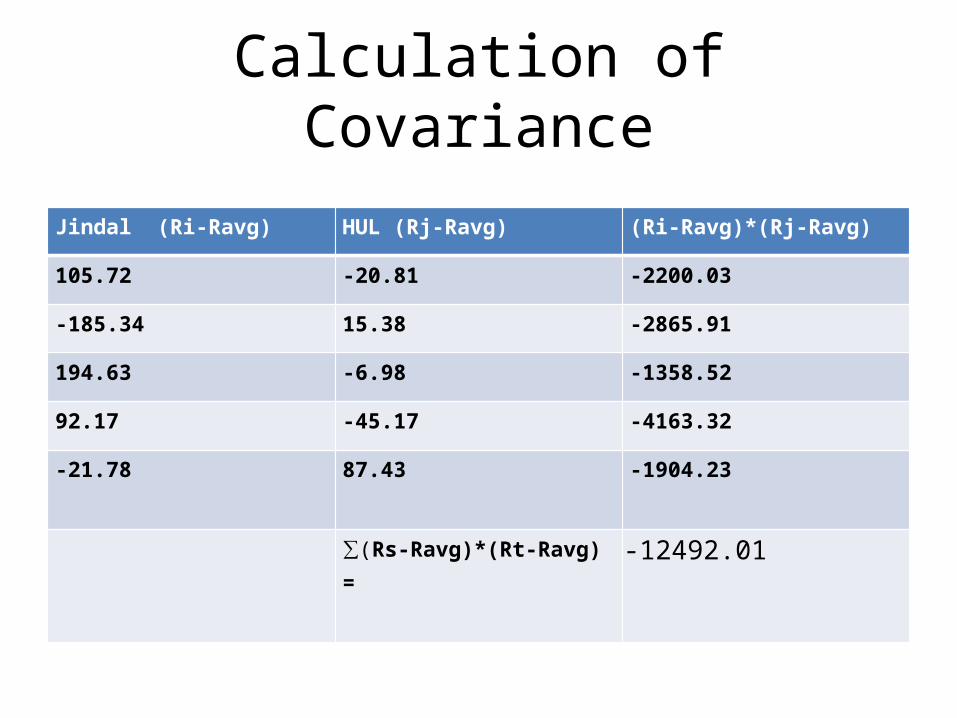
Calculation of Covariance
Jindal (Ri-Ravg) HUL (Rj-Ravg) (Ri-Ravg)*(Rj-Ravg)
105.72 -20.81 -2200.03
-185.34 15.38 -2865.91
194.63 -6.98 -1358.52
92.17 -45.17 -4163.32
-21.78 87.43 -1904.23
∑(Rs-Ravg)*(Rt-Ravg) = -12492.01
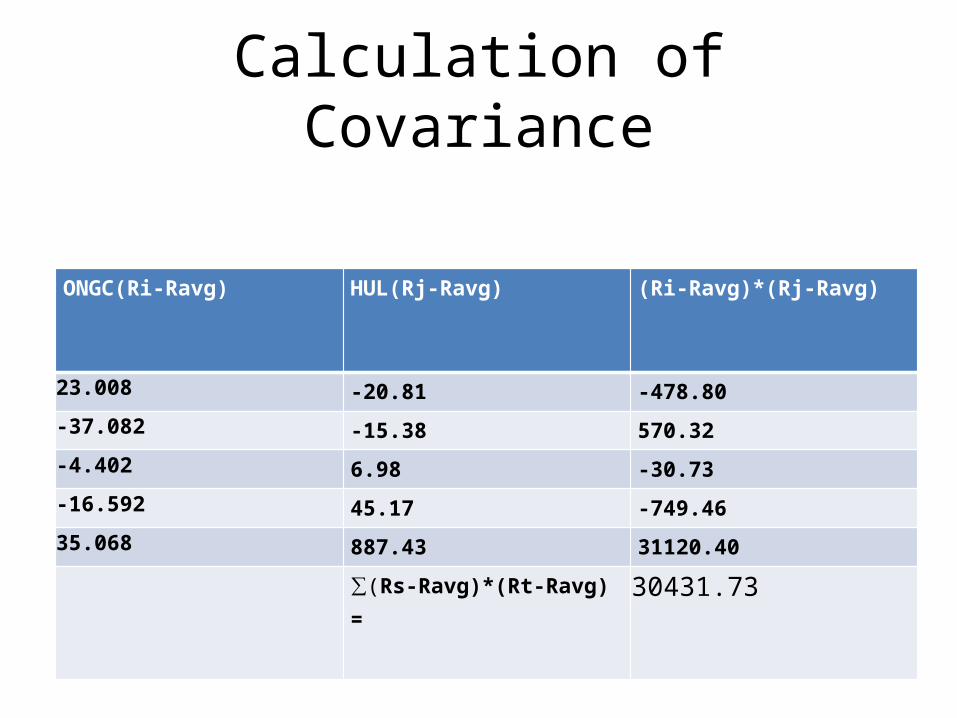
Calculation of Covariance
ONGC(Ri-Ravg) HUL(Rj-Ravg) (Ri-Ravg)*(Rj-Ravg)
23.008 -20.81 -478.80
-37.082 -15.38 570.32
-4.402 6.98 -30.73
-16.592 45.17 -749.46
35.068 887.43 31120.40
∑(Rs-Ravg)*(Rt-Ravg) = 30431.73
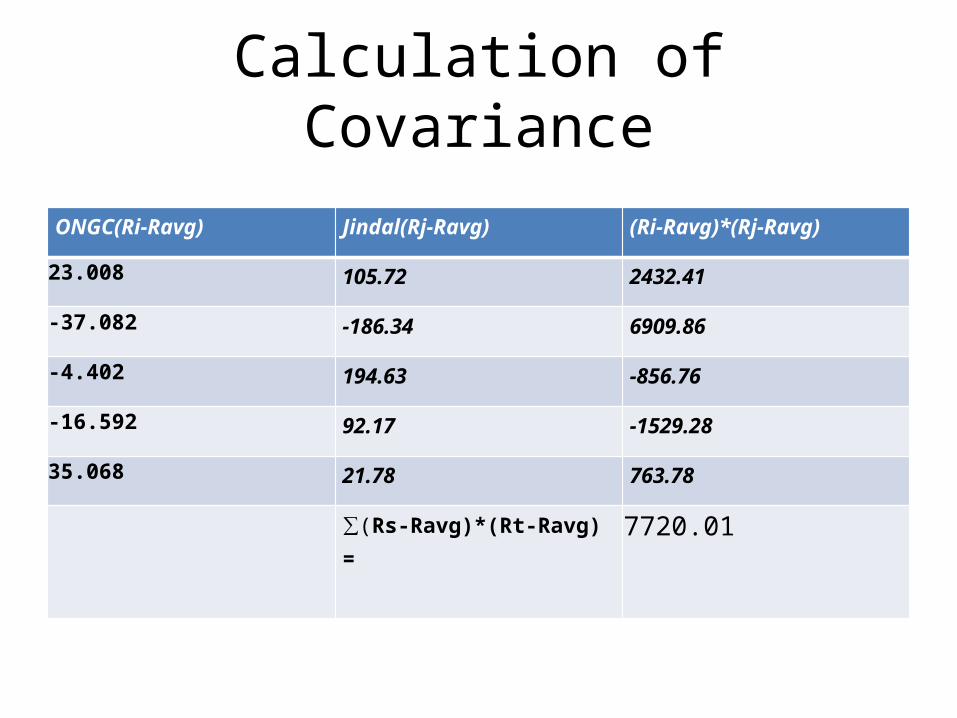
Calculation of Covariance
ONGC(Ri-Ravg) Jindal(Rj-Ravg) (Ri-Ravg)*(Rj-Ravg)
23.008 105.72 2432.41
-37.082 -186.34 6909.86
-4.402 194.63 -856.76
-16.592 92.17 -1529.28
35.068 21.78 763.78
∑(Rs-Ravg)*(Rt-Ravg) = 7720.01
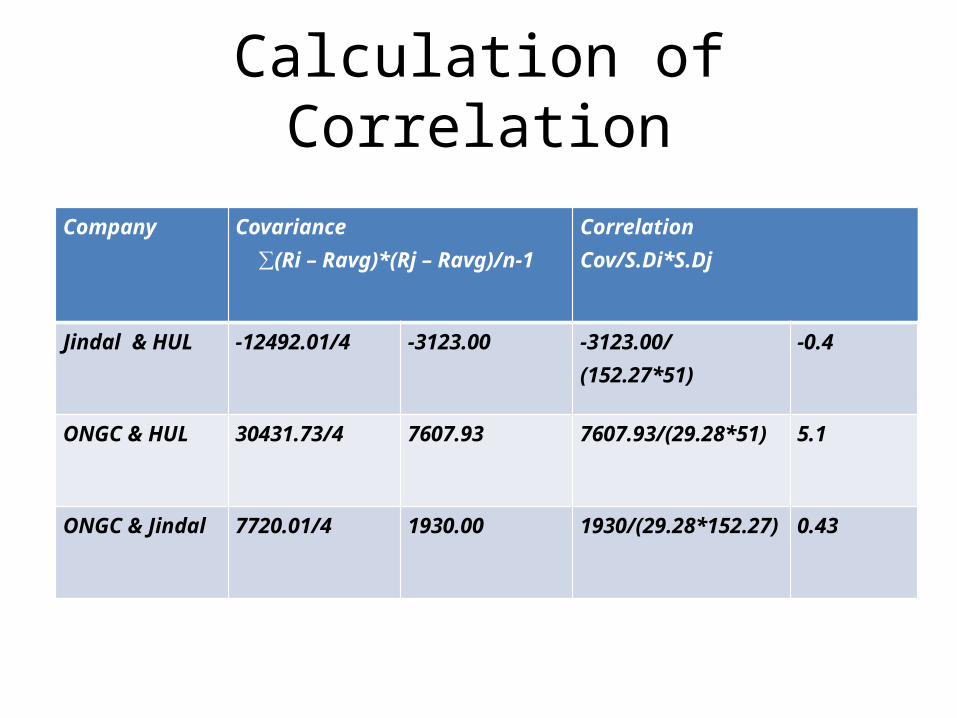
Calculation of Correlation
Company Covariance ∑(Ri – Ravg)*(Rj – Ravg)/n-1
Correlation Cov/S.Di*S.Dj
Jindal & HUL -12492.01/4 -3123.00 -3123.00/(152.27*51) -0.4
ONGC & HUL 30431.73/4 7607.93 7607.93/(29.28*51) 5.1
ONGC & Jindal 7720.01/4 1930.00 1930/(29.28*152.27) 0.43
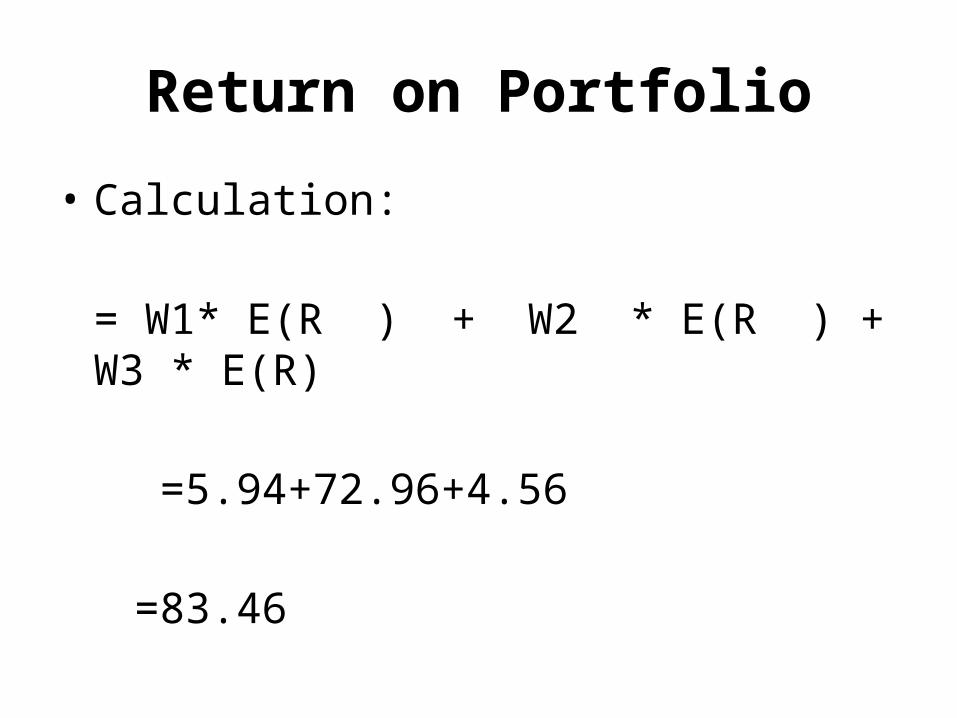
Return on Portfolio
• Calculation:
= W1* E(R ) + W2 * E(R ) + W3 * E(R)
=5.94+72.96+4.56
=83.46
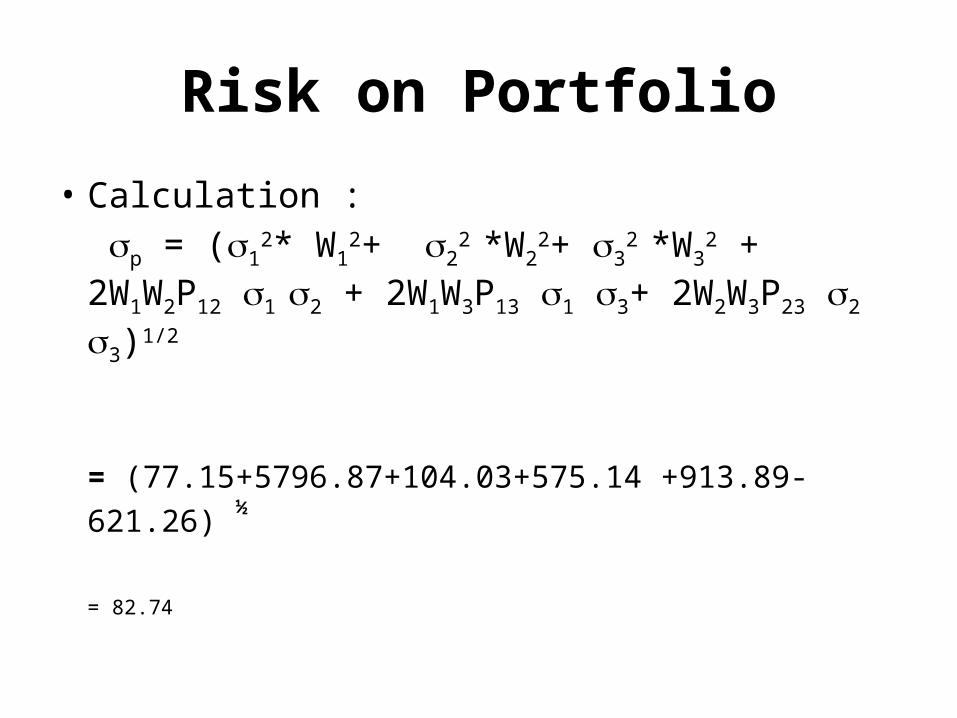
Risk on Portfolio
• Calculation : p = (1
2* W12+ 2
2 *W22+ 3
2 *W32 + 2W1W2P12
1 2 + 2W1W3P13 1 3+ 2W2W3P23 2 3)1/2
= (77.15+5796.87+104.03+575.14 +913.89-621.26) ½
= 82.74
Portfolio 2
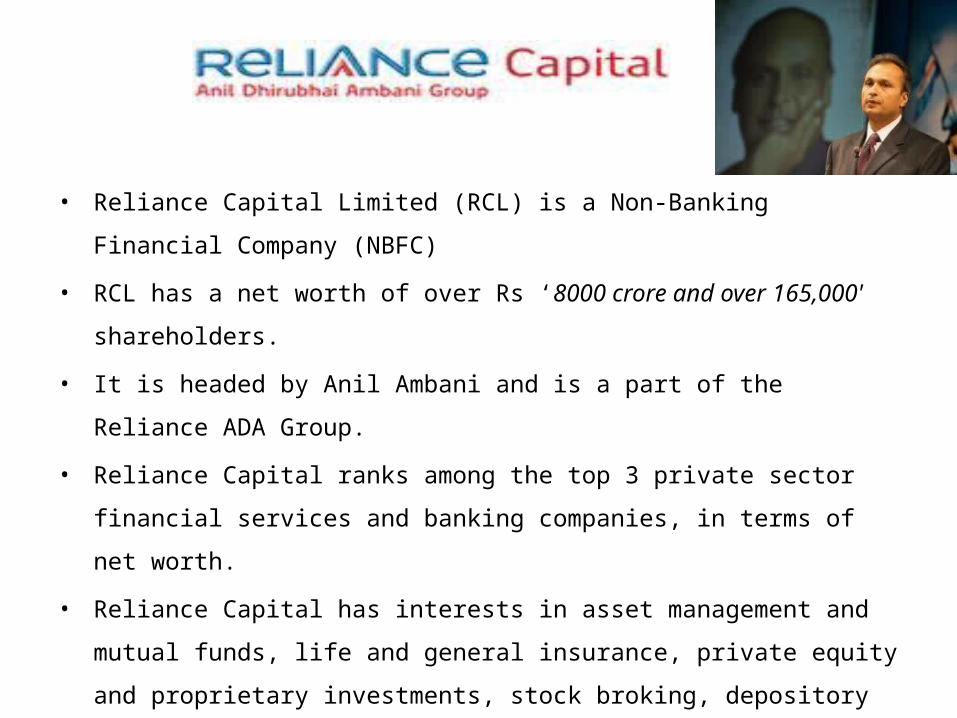
• Reliance Capital Limited (RCL) is a Non-Banking Financial Company
(NBFC)
• RCL has a net worth of over Rs ‘8000 crore and over 165,000'
shareholders.
• It is headed by Anil Ambani and is a part of the Reliance ADA Group.
• Reliance Capital ranks among the top 3 private sector financial services and
banking companies, in terms of net worth.
• Reliance Capital has interests in asset management and mutual funds, life
and general insurance, private equity and proprietary investments, stock
broking, depository services, distribution of financial products, consumer
finance and other activities in financial services.
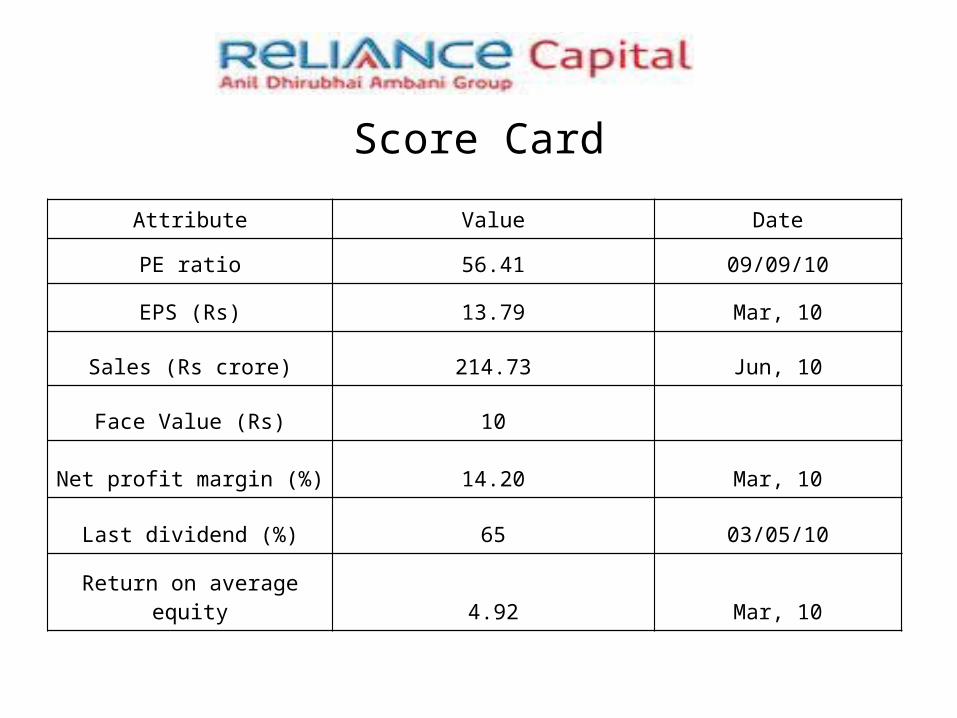
Attribute Value Date
PE ratio 56.41 09/09/10
EPS (Rs) 13.79 Mar, 10
Sales (Rs crore) 214.73 Jun, 10
Face Value (Rs) 10
Net profit margin (%) 14.20 Mar, 10
Last dividend (%) 65 03/05/10
Return on average equity 4.92 Mar, 10
Score Card
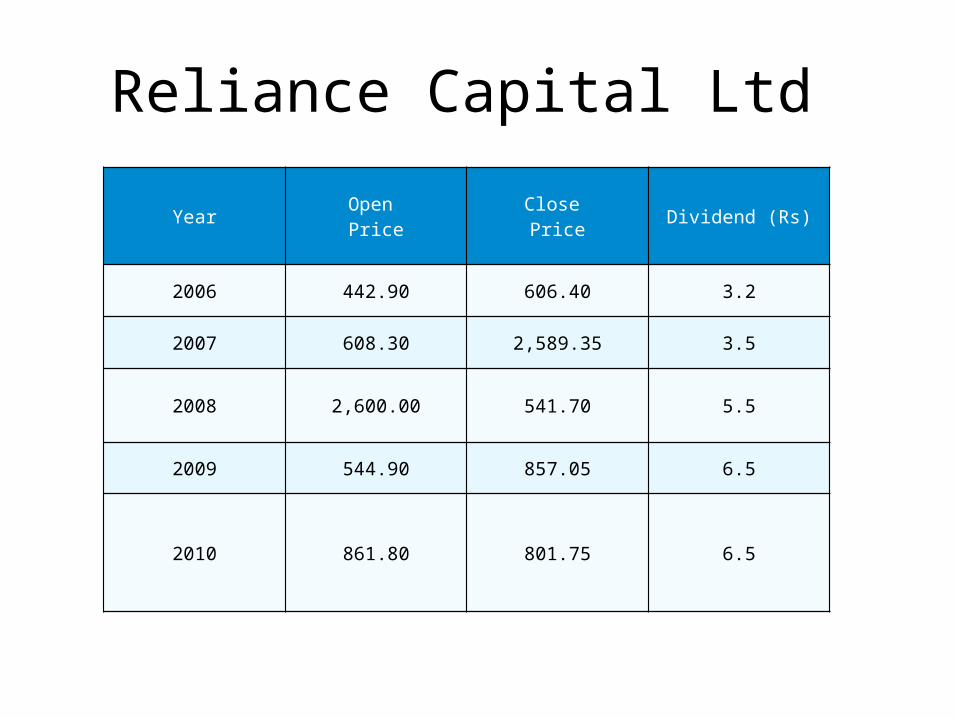
Reliance Capital Ltd
Year Open Price
Close Price Dividend (Rs)
2006 442.90 606.40 3.2
2007 608.30 2,589.35 3.5
2008 2,600.00 541.70 5.5
2009 544.90 857.05 6.5
2010 861.80 801.75 6.5
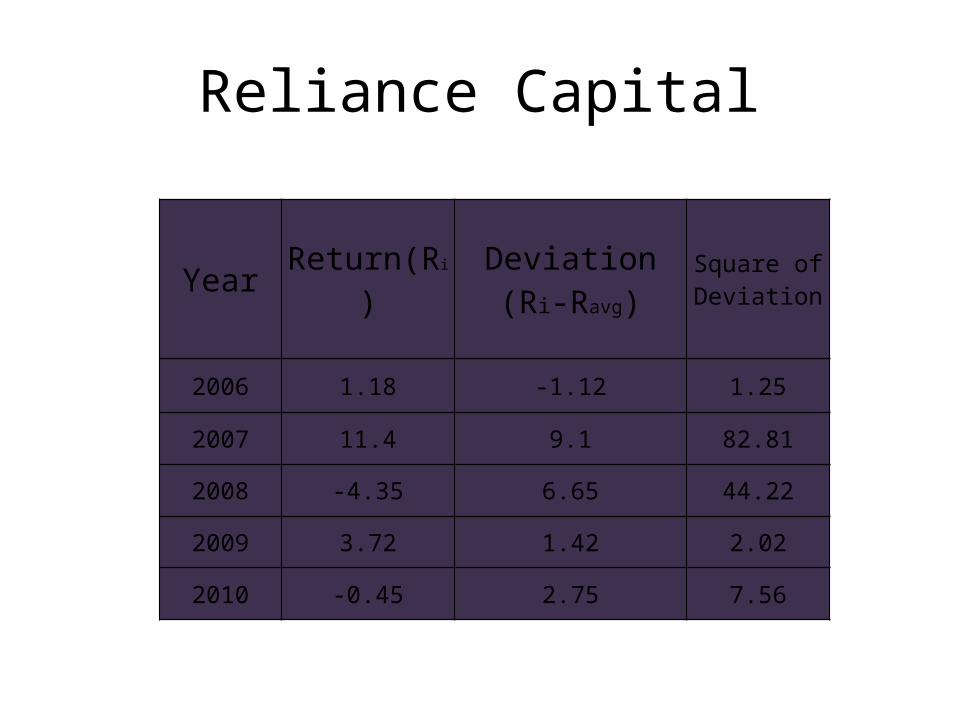
Reliance Capital
Year Return(Ri) Deviation(Ri-Ravg)
Square of Deviation
2006 1.18 -1.12 1.25
2007 11.4 9.1 82.81
2008 -4.35 6.65 44.22
2009 3.72 1.42 2.02
2010 -0.45 2.75 7.56
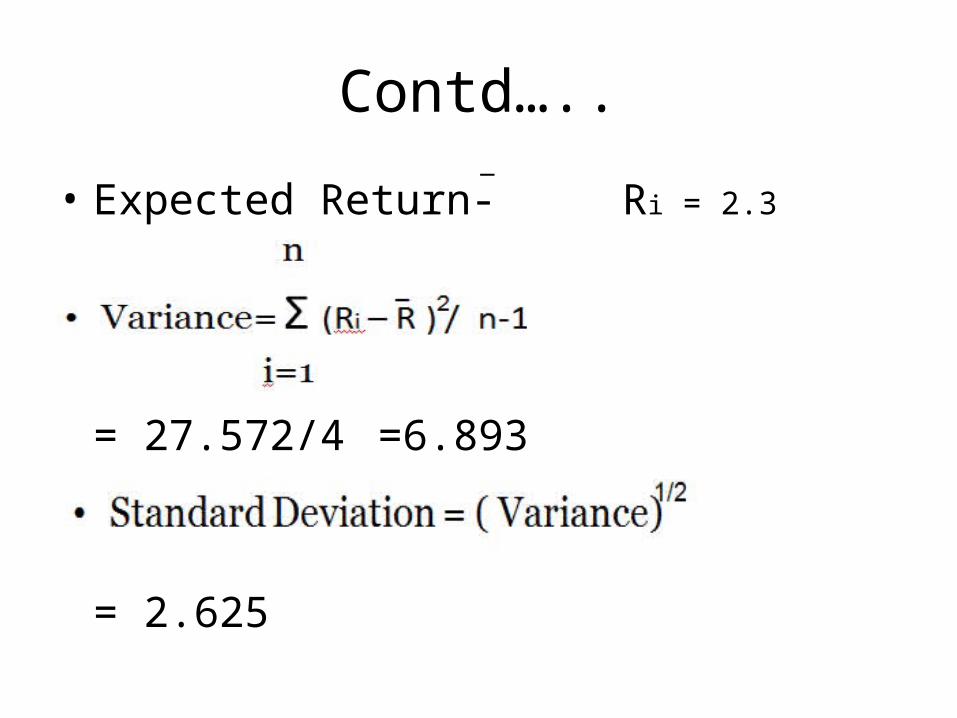
Contd…..
• Expected Return- Ri = 2.3
= 27.572/4 =6.893
= 2.625
_

• Type- Public. Founded-1945.
• Founder(s) JRD Tata
• Headquarters Mumbai, Maharashtra, India
• Key people Ratan Tata, Chairman
Ravi Kant, Vice Chairman
• Revenue $14.250 billion (2009)
• Operating income $10.40 billion
• Net income $1.198 billion
• Total assets $15.430 billion
• Total equity $763 million
• Parent Tata Group Subsidiaries- Jaguar, Land Rover, TDCV Hispano
Carrocera.
Tata Motors Ltd.

Tata Motors Ltd
Attribute Value DatePE ratio 26.14 13/09/10EPS (Rs) 39.26 Mar, 10
Sales (Rs crore) 10,416.26 Jun, 10Face Value (Rs) 10
Net profit margin (%) 6.28 Mar, 10
Last bonus 3:5 28/09/95Last dividend (%) 150 27/05/10
Return on average equity 14.96 Mar, 10
Score Card
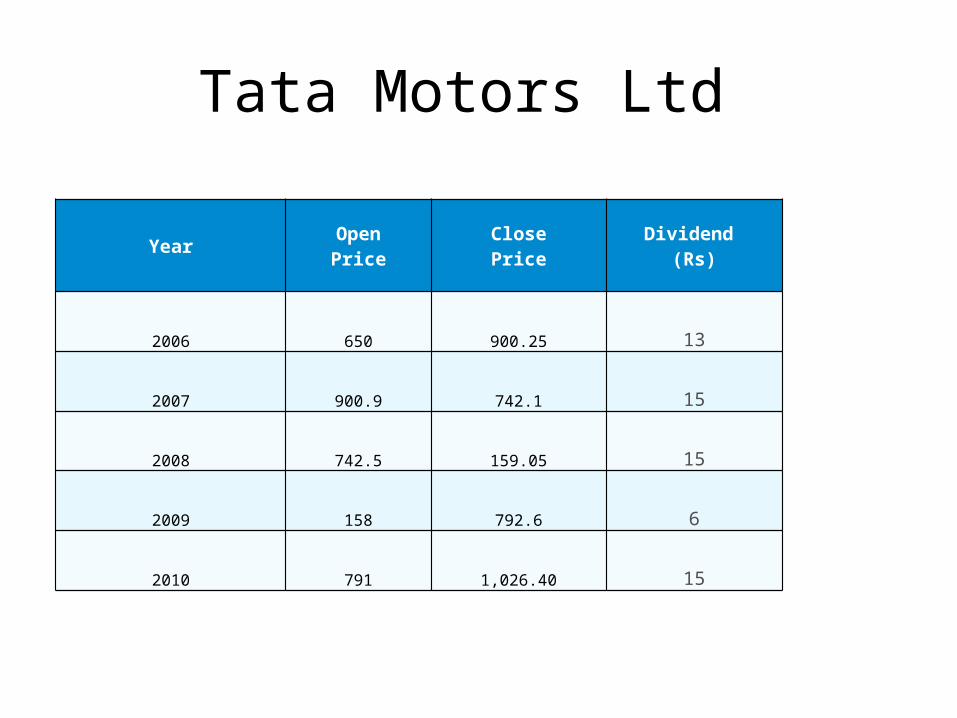
Tata Motors Ltd
Year OpenPrice
ClosePrice
Dividend (Rs)
2006 650 900.25 13
2007 900.9 742.1 15
2008 742.5 159.05 15
2009 158 792.6 6
2010 791 1,026.40 15
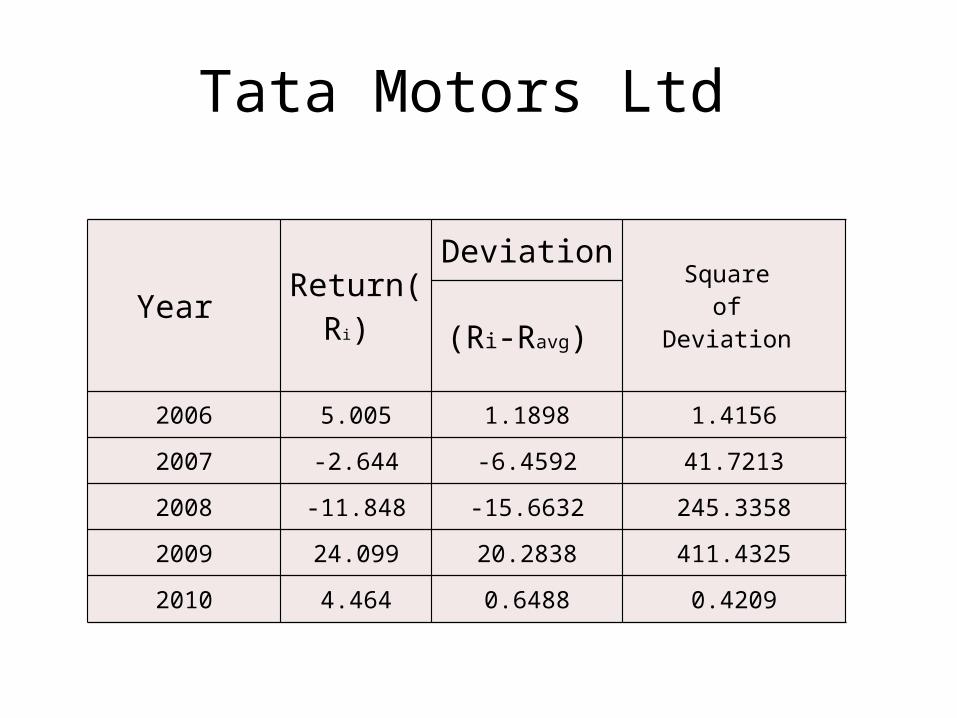
Tata Motors Ltd
Year Return(Ri)
DeviationSquare
of Deviation (Ri-Ravg)
2006 5.005 1.1898 1.4156
2007 -2.644 -6.4592 41.7213
2008 -11.848 -15.6632 245.3358
2009 24.099 20.2838 411.4325
2010 4.464 0.6488 0.4209
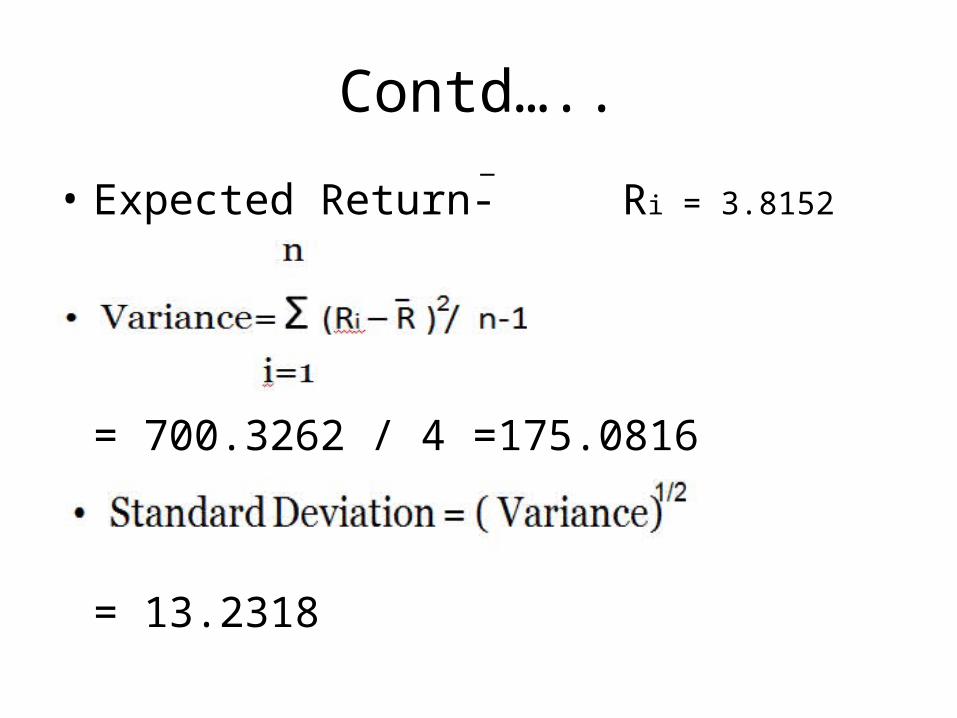
Contd…..
• Expected Return- Ri = 3.8152
= 700.3262 / 4=175.0816
= 13.2318
_
• Founded on April 5, 1974
• This group has grown to become a major player in the Financial Services
space.
• It was founded by 3 people. Mr. R. Thyagarajan, Mr. AVS Raja and Mr. T.
Jayaraman.
• Helping Create Wealth. Empowering people through prosperity. The
relentless pursuit of this mission, since their inception in 1974 has given the
Shriram Group their raison d'être and our distinct identity.
• The Group’s reputation for effectiveness, transparency and integrity has
helped it to become one of India’s largest Financial Services Network.
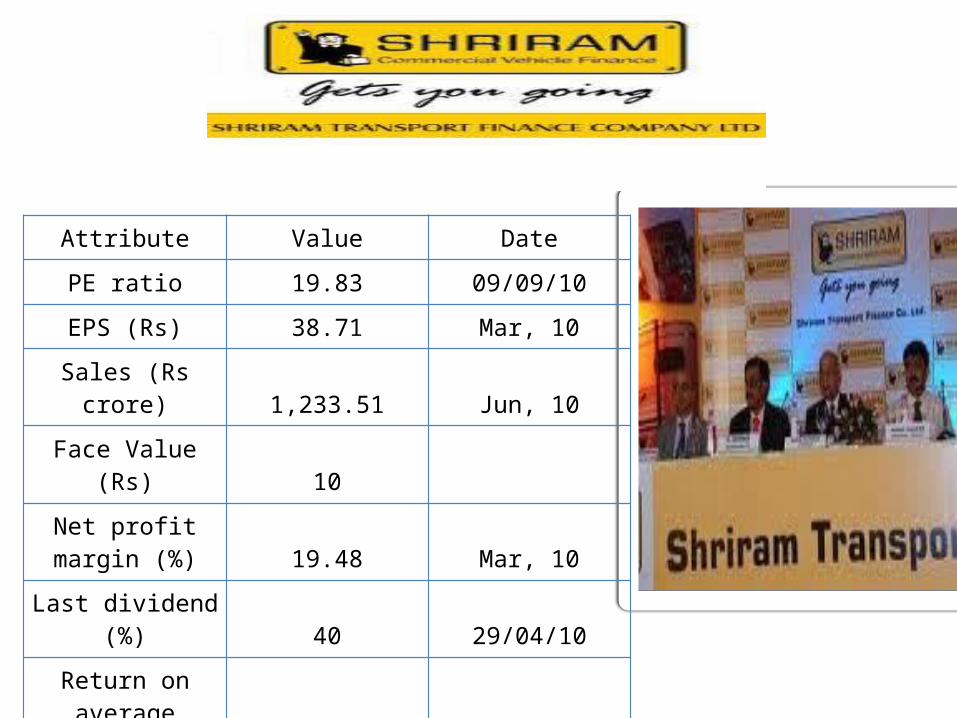
Attribute Value DatePE ratio 19.83 09/09/10EPS (Rs) 38.71 Mar, 10
Sales (Rs crore) 1,233.51 Jun, 10Face Value (Rs) 10
Net profit margin (%) 19.48 Mar, 10
Last dividend (%) 40 29/04/10Return on average
equity 22.99 Mar, 10
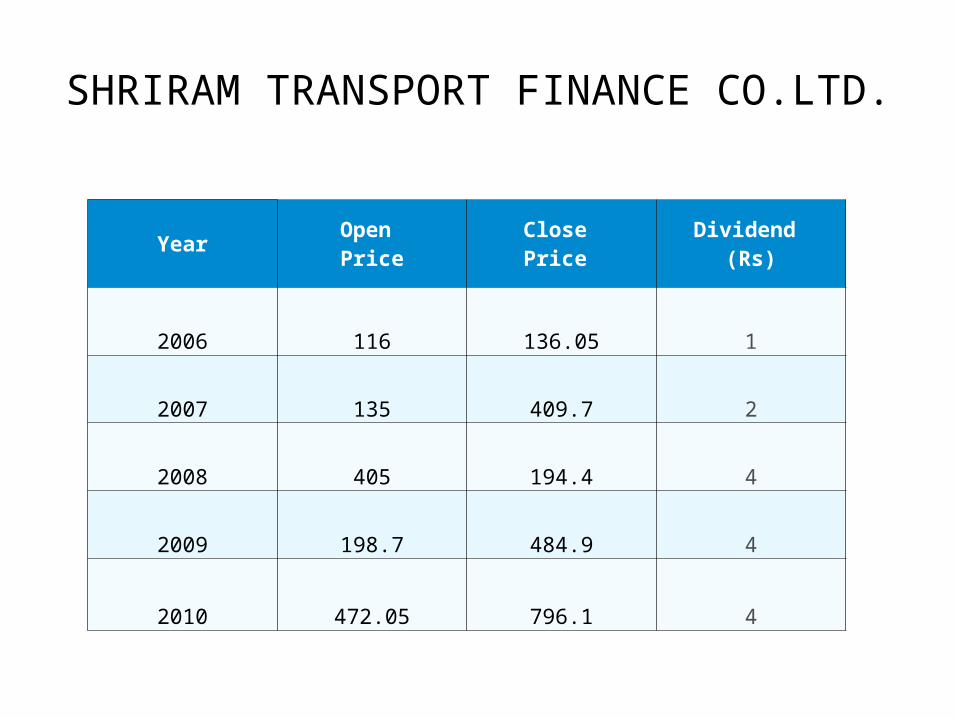
SHRIRAM TRANSPORT FINANCE CO.LTD.
Year Open Price
Close Price
Dividend (Rs)
2006 116 136.05 1
2007 135 409.7 2
2008 405 194.4 4
2009 198.7 484.9 4
2010 472.05 796.1 4
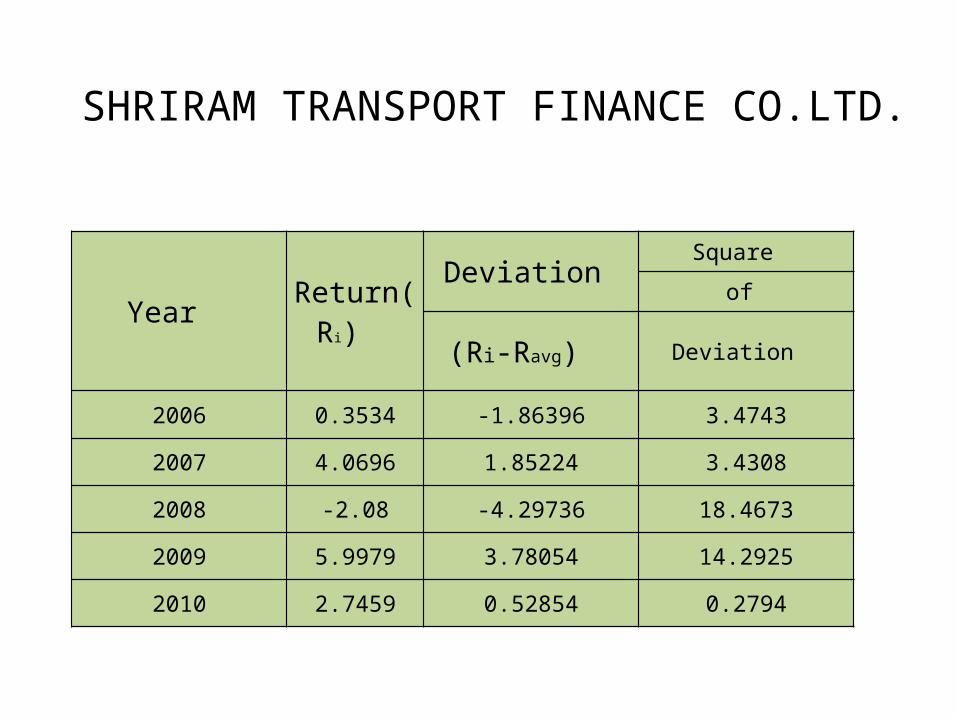
Year Return(Ri) Deviation Square
of
(Ri-Ravg) Deviation
2006 0.3534 -1.86396 3.4743
2007 4.0696 1.85224 3.4308
2008 -2.08 -4.29736 18.4673
2009 5.9979 3.78054 14.2925
2010 2.7459 0.52854 0.2794
SHRIRAM TRANSPORT FINANCE CO.LTD.
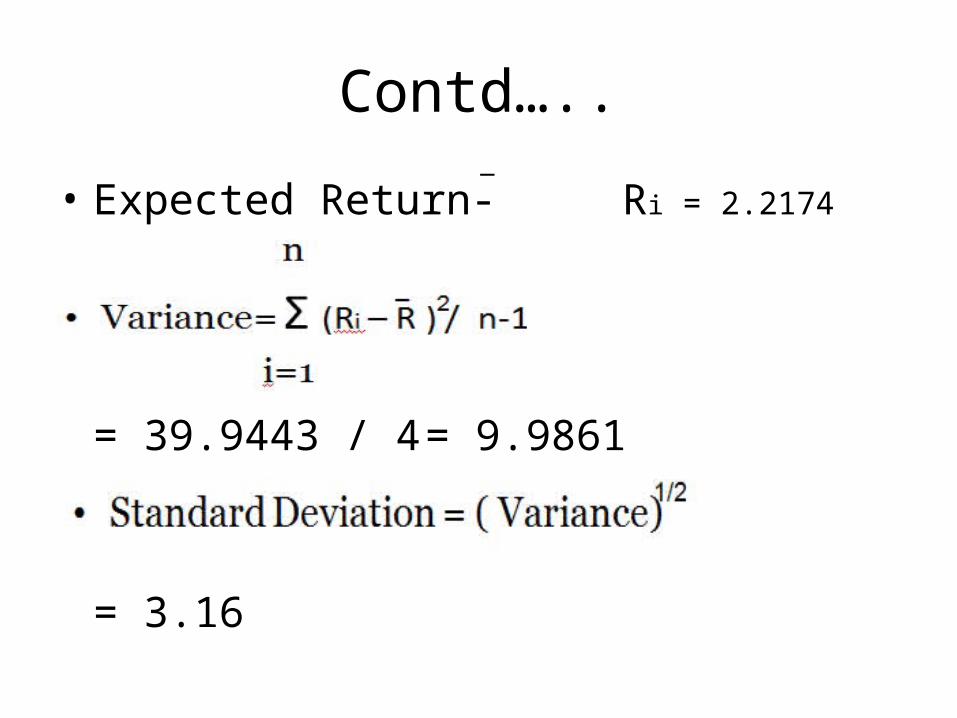
Contd…..
• Expected Return- Ri = 2.2174
= 39.9443 / 4 = 9.9861
= 3.16
_
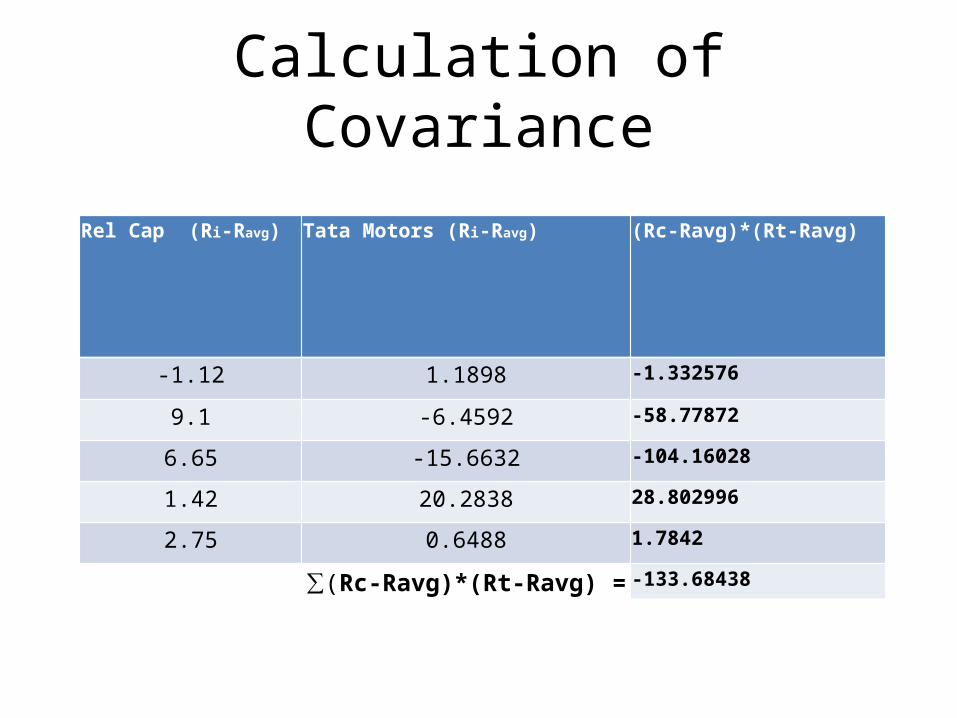
Calculation of Covariance
Rel Cap (Ri-Ravg) Tata Motors (Ri-Ravg) (Rc-Ravg)*(Rt-Ravg)
-1.12 1.1898 -1.332576
9.1 -6.4592 -58.77872
6.65 -15.6632 -104.16028
1.42 20.2838 28.802996
2.75 0.6488 1.7842
∑(Rc-Ravg)*(Rt-Ravg) = -133.68438
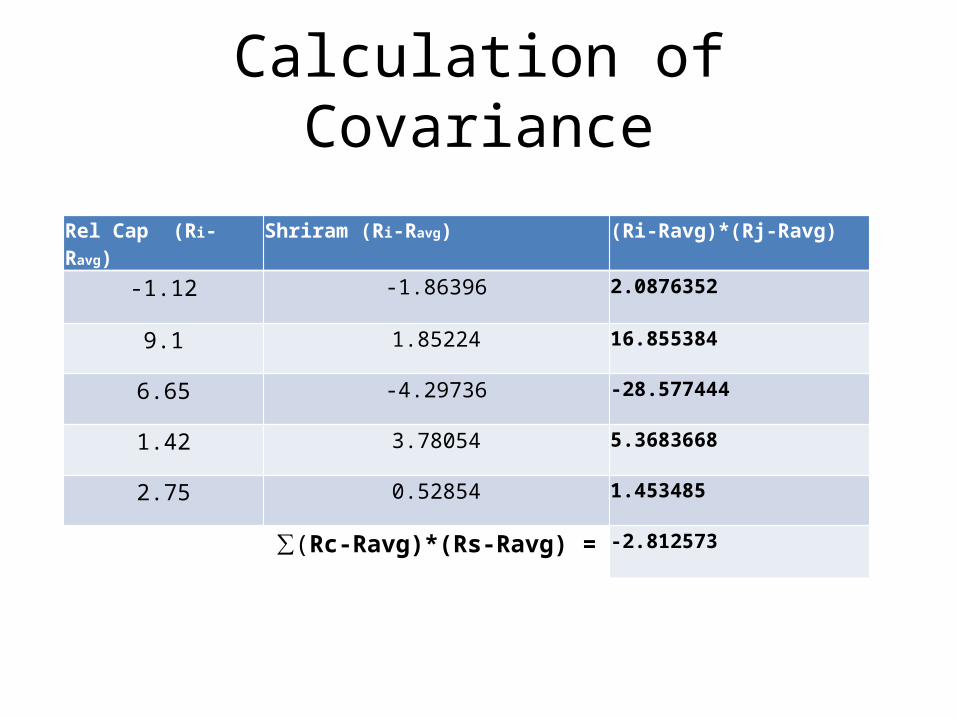
Calculation of Covariance
Rel Cap (Ri-Ravg) Shriram (Ri-Ravg) (Ri-Ravg)*(Rj-Ravg)
-1.12 -1.86396 2.0876352
9.1 1.85224 16.855384
6.65 -4.29736 -28.577444
1.42 3.78054 5.3683668
2.75 0.52854 1.453485
∑(Rc-Ravg)*(Rs-Ravg) = -2.812573

Calculation of Covariance
Shriram (Ri-Ravg) Tata Motors (Ri-Ravg) (Rs-Ravg)*(Rt-Ravg)
-1.86396 1.1898 -2.217739608
1.85224 -6.4592 -11.96398861
-4.29736 -15.6632 67.31040915
3.78054 20.2838 76.68371725
0.52854 0.6488 0.342916752
∑(Rs-Ravg)*(Rt-Ravg) = 130.1553149
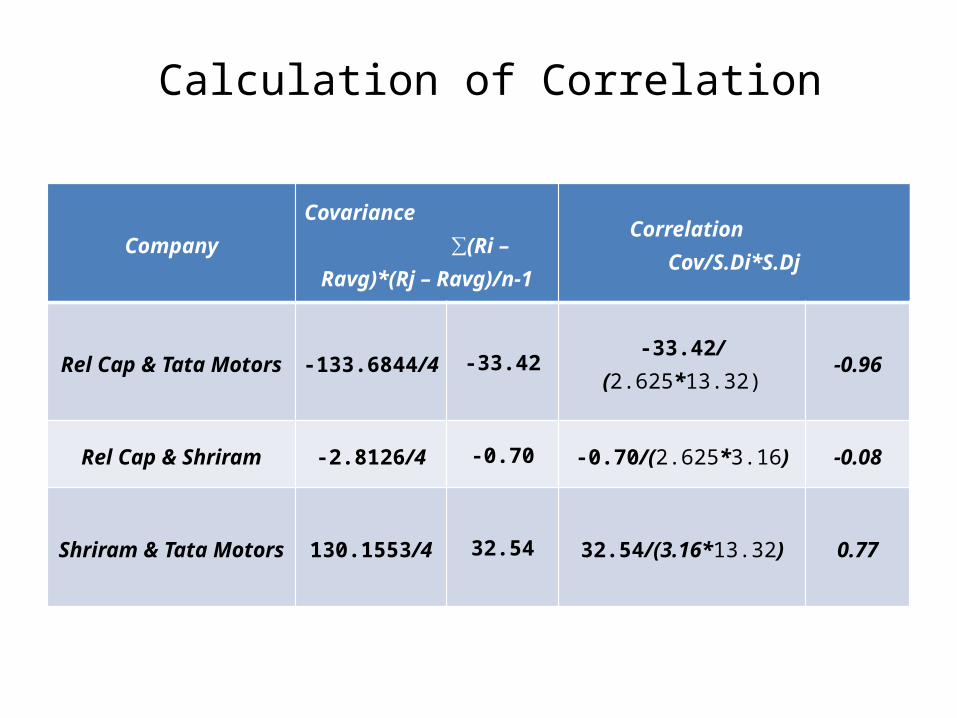
CompanyCovariance ∑(Ri – Ravg)*(Rj –
Ravg)/n-1Correlation Cov/S.Di*S.Dj
Rel Cap & Tata Motors -133.6844/4 -33.42 -33.42/(2.625*13.32) -0.96
Rel Cap & Shriram -2.8126/4 -0.70 -0.70/(2.625*3.16) -0.08
Shriram & Tata Motors 130.1553/4 32.54 32.54/(3.16*13.32) 0.77
Calculation of Correlation
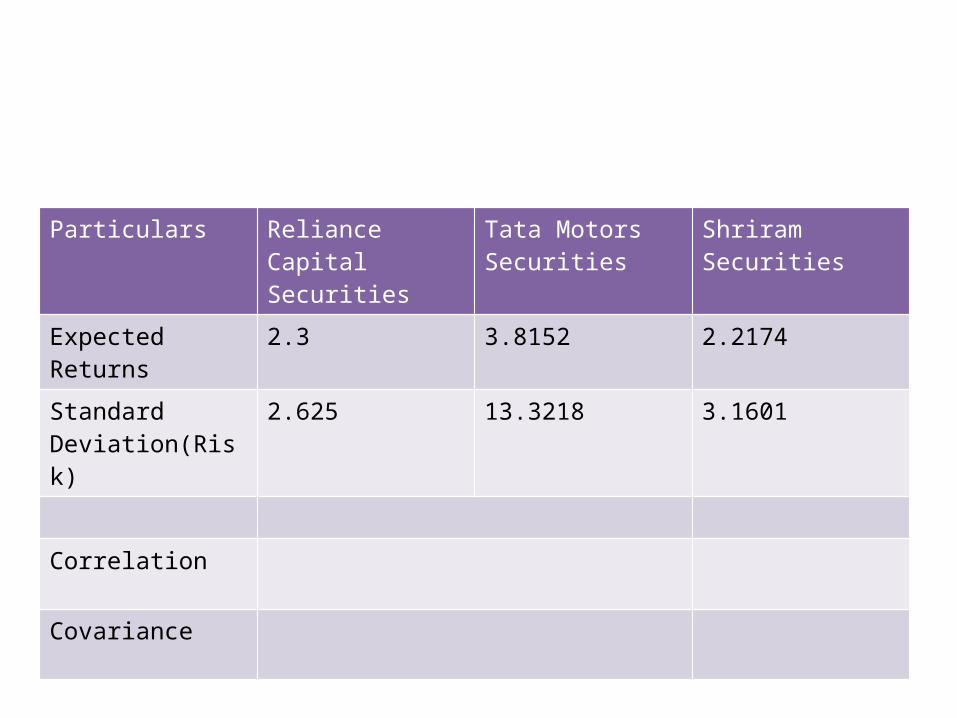
Particulars Reliance Capital Securities
Tata Motors Securities
Shriram Securities
Expected Returns 2.3 3.8152 2.2174
Standard Deviation(Risk)
2.625 13.3218 3.1601
Correlation
Covariance
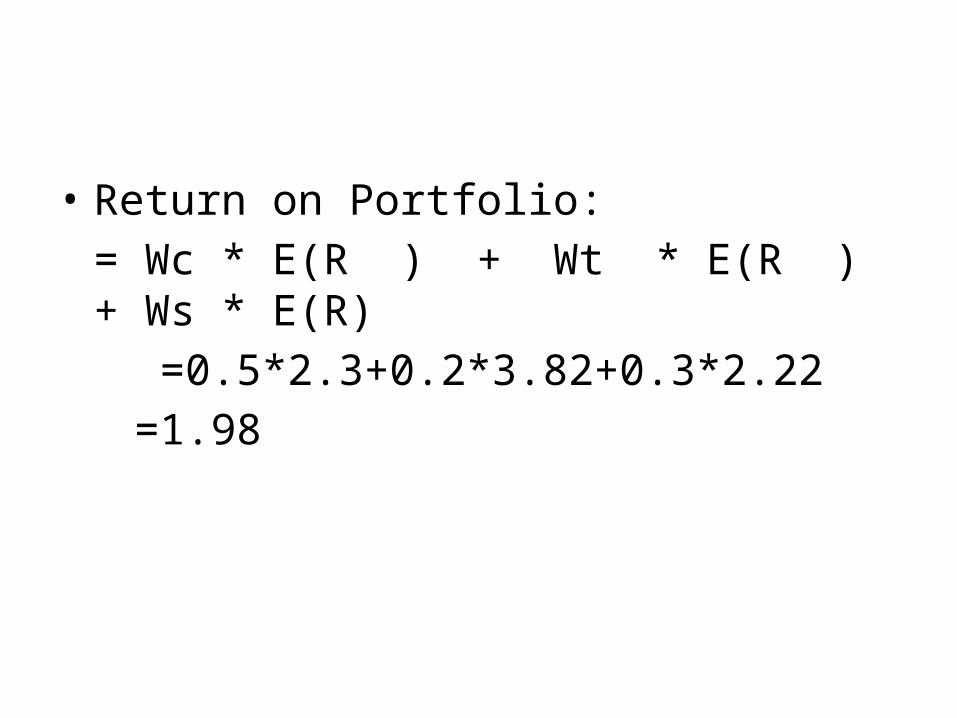
• Return on Portfolio:= Wc * E(R ) + Wt * E(R ) + Ws * E(R)
=0.5*2.3+0.2*3.82+0.3*2.22 =1.98
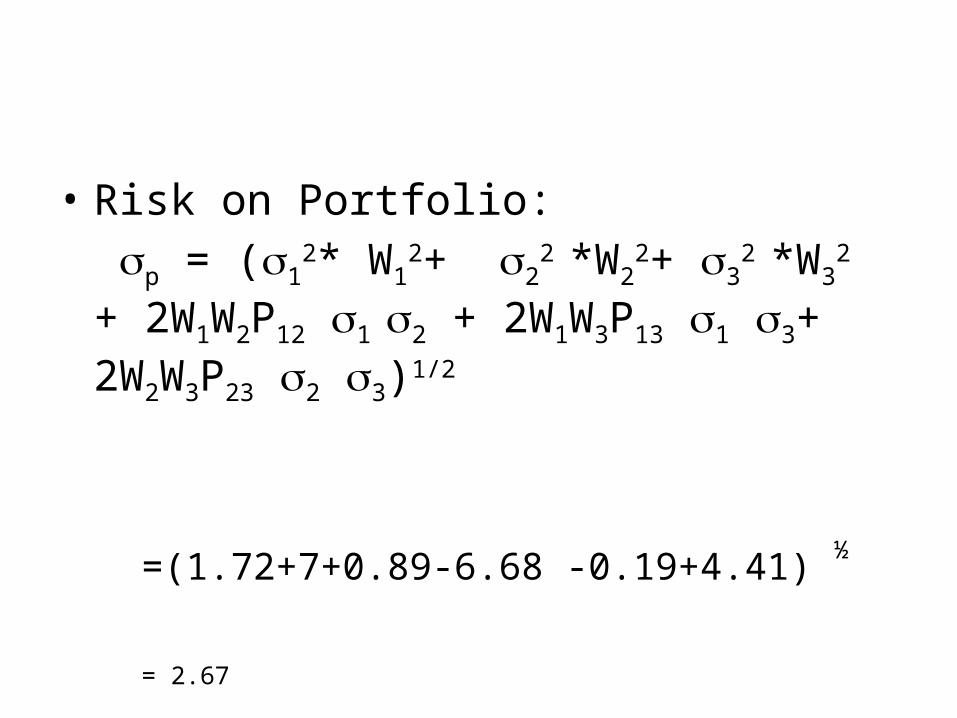
• Risk on Portfolio: p = (1
2* W12+ 2
2 *W22+ 3
2 *W32 +
2W1W2P12 1 2 + 2W1W3P13 1 3+ 2W2W3P23 2 3)1/2
=(1.72+7+0.89-6.68 -0.19+4.41) ½
= 2.67
Related Documents