Redondo Beach Residential Real Estate Market Conditions February 2015

February 2015 Redondo Beach Real Estate Market Trends Update
Jul 17, 2015
Welcome message from author
This document is posted to help you gain knowledge. Please leave a comment to let me know what you think about it! Share it to your friends and learn new things together.
Transcript

Table of
Contents
Key Statistics for February
Sales 2015 Residential Sales Stats Year-to-Year Total Sales by Map Area Median 2015 Median Sales Stats Year-to-Year Median Sales by Map Area Listings 2015 Active Listings by Map Area 2015 Total Active Listings vs. Total Sales Year-to-Year Active Listings by Map Area Inventory 2015 Months of Inventory by Map Area Year-to-Year Months of Inventory
Outlook for March
About Hady Chahine Contact Information
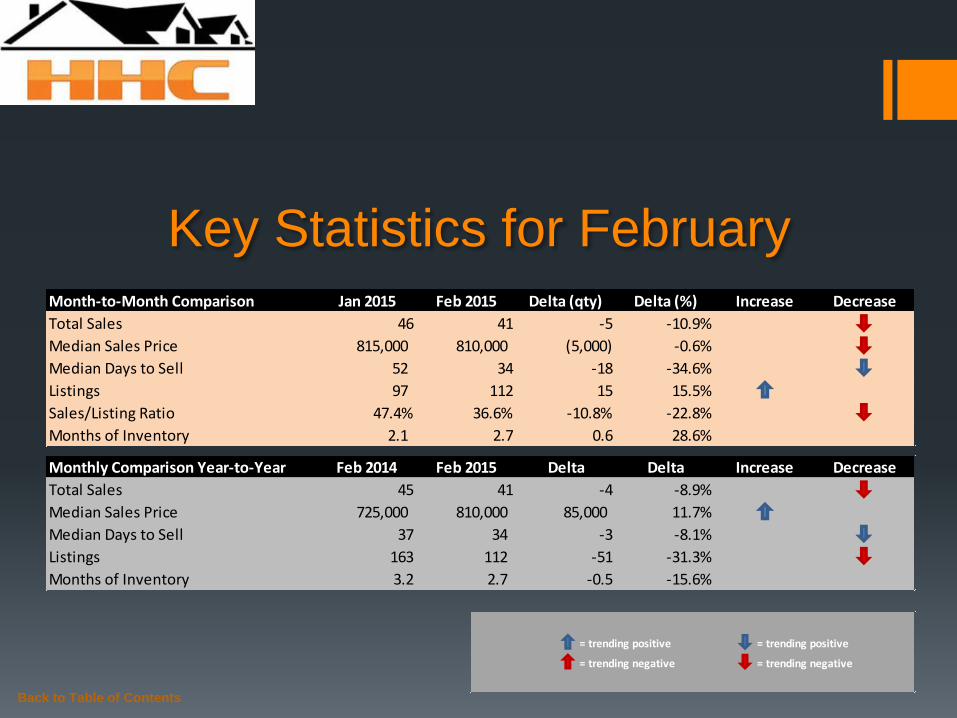
Key Statistics for February
Back to Table of Contents
= trending positive = trending positive
= trending negative = trending negative
Month-to-Month Comparison Jan 2015 Feb 2015 Delta (qty) Delta (%) Increase Decrease
Total Sales 46 41 -5 -10.9%
Median Sales Price 815,000 810,000 (5,000) -0.6%
Median Days to Sell 52 34 -18 -34.6%
Listings 97 112 15 15.5%
Sales/Listing Ratio 47.4% 36.6% -10.8% -22.8%
Months of Inventory 2.1 2.7 0.6 28.6%
Monthly Comparison Year-to-Year Feb 2014 Feb 2015 Delta Delta Increase Decrease
Total Sales 45 41 -4 -8.9%
Median Sales Price 725,000 810,000 85,000 11.7%
Median Days to Sell 37 34 -3 -8.1%
Listings 163 112 -51 -31.3%
Months of Inventory 3.2 2.7 -0.5 -15.6%
Back to Table of Contents
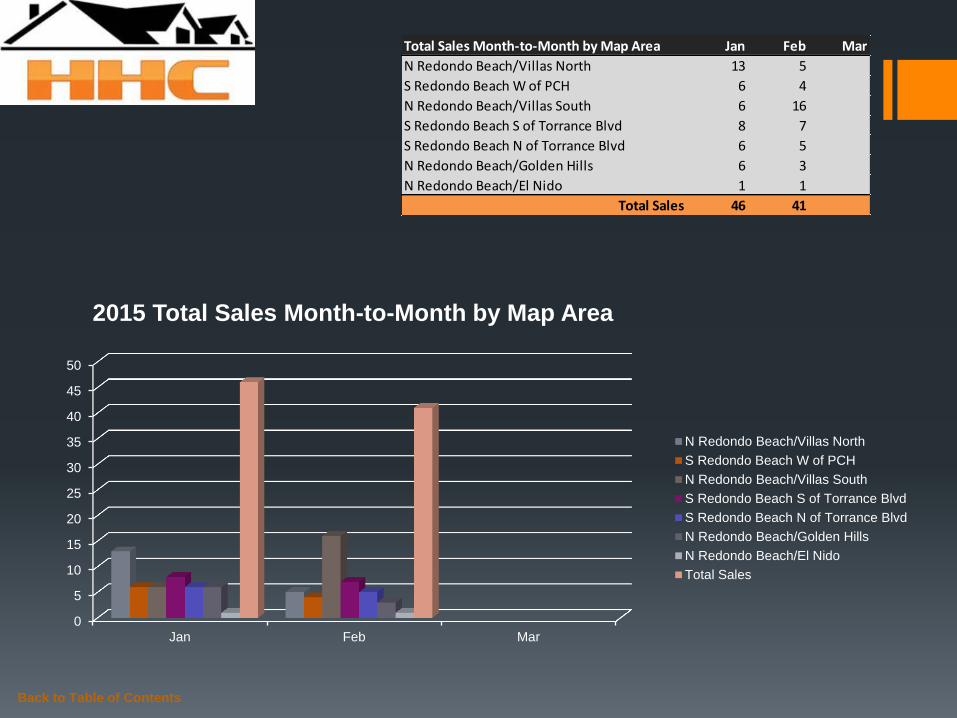
Total Sales Month-to-Month by Map Area Jan Feb Mar
N Redondo Beach/Villas North 13 5
S Redondo Beach W of PCH 6 4
N Redondo Beach/Villas South 6 16
S Redondo Beach S of Torrance Blvd 8 7
S Redondo Beach N of Torrance Blvd 6 5
N Redondo Beach/Golden Hills 6 3
N Redondo Beach/El Nido 1 1
Total Sales 46 41
0
5
10
15
20
25
30
35
40
45
50
Jan Feb Mar
2015 Total Sales Month-to-Month by Map Area
N Redondo Beach/Villas North
S Redondo Beach W of PCH
N Redondo Beach/Villas South
S Redondo Beach S of Torrance Blvd
S Redondo Beach N of Torrance Blvd
N Redondo Beach/Golden Hills
N Redondo Beach/El Nido
Total Sales
Back to Table of Contents
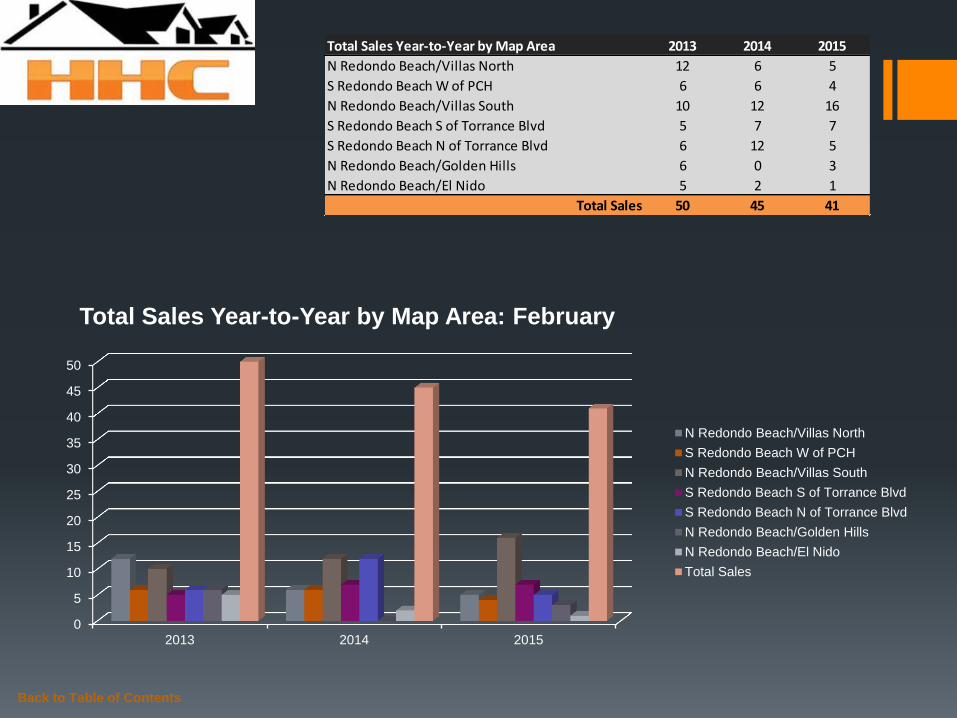
Total Sales Year-to-Year by Map Area 2013 2014 2015
N Redondo Beach/Villas North 12 6 5
S Redondo Beach W of PCH 6 6 4
N Redondo Beach/Villas South 10 12 16
S Redondo Beach S of Torrance Blvd 5 7 7
S Redondo Beach N of Torrance Blvd 6 12 5
N Redondo Beach/Golden Hills 6 0 3
N Redondo Beach/El Nido 5 2 1
Total Sales 50 45 41
0
5
10
15
20
25
30
35
40
45
50
2013 2014 2015
Total Sales Year-to-Year by Map Area: February
N Redondo Beach/Villas North
S Redondo Beach W of PCH
N Redondo Beach/Villas South
S Redondo Beach S of Torrance Blvd
S Redondo Beach N of Torrance Blvd
N Redondo Beach/Golden Hills
N Redondo Beach/El Nido
Total Sales
Back to Table of Contents
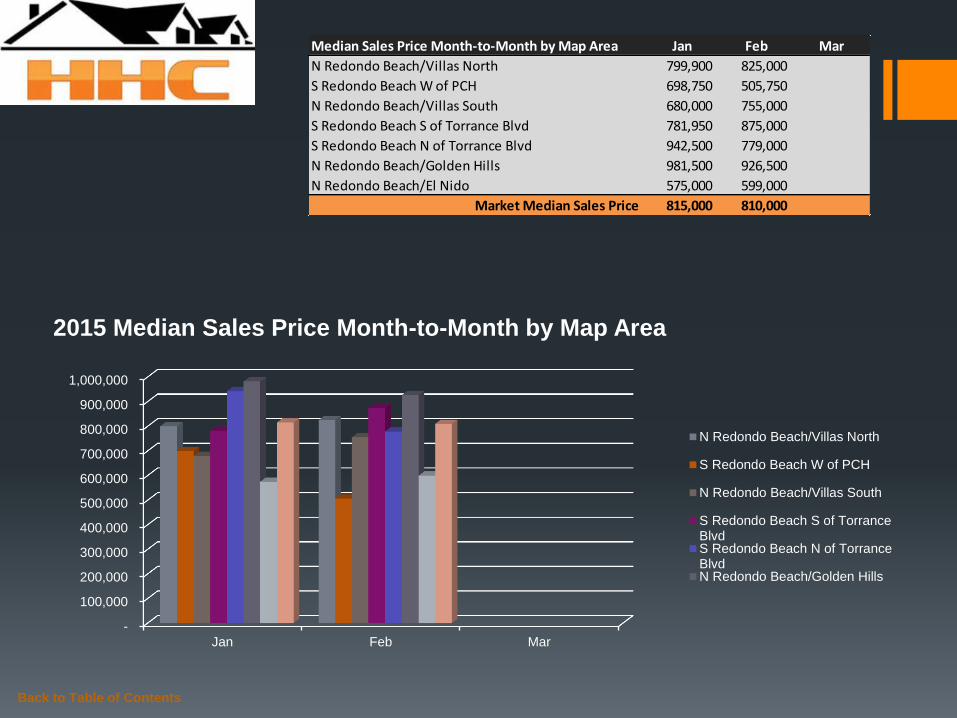
Median Sales Price Month-to-Month by Map Area Jan Feb Mar
N Redondo Beach/Villas North 799,900 825,000
S Redondo Beach W of PCH 698,750 505,750
N Redondo Beach/Villas South 680,000 755,000
S Redondo Beach S of Torrance Blvd 781,950 875,000
S Redondo Beach N of Torrance Blvd 942,500 779,000
N Redondo Beach/Golden Hills 981,500 926,500
N Redondo Beach/El Nido 575,000 599,000
Market Median Sales Price 815,000 810,000
-
100,000
200,000
300,000
400,000
500,000
600,000
700,000
800,000
900,000
1,000,000
Jan Feb Mar
2015 Median Sales Price Month-to-Month by Map Area
N Redondo Beach/Villas North
S Redondo Beach W of PCH
N Redondo Beach/Villas South
S Redondo Beach S of TorranceBlvdS Redondo Beach N of TorranceBlvdN Redondo Beach/Golden Hills
Back to Table of Contents
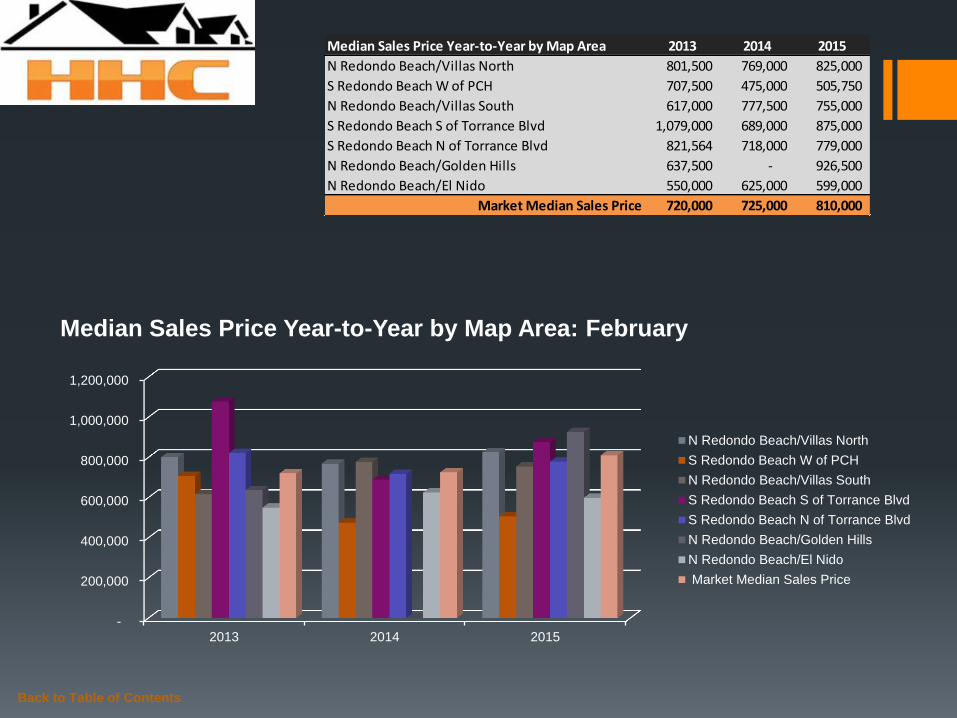
Median Sales Price Year-to-Year by Map Area 2013 2014 2015
N Redondo Beach/Villas North 801,500 769,000 825,000
S Redondo Beach W of PCH 707,500 475,000 505,750
N Redondo Beach/Villas South 617,000 777,500 755,000
S Redondo Beach S of Torrance Blvd 1,079,000 689,000 875,000
S Redondo Beach N of Torrance Blvd 821,564 718,000 779,000
N Redondo Beach/Golden Hills 637,500 - 926,500
N Redondo Beach/El Nido 550,000 625,000 599,000
Market Median Sales Price 720,000 725,000 810,000
-
200,000
400,000
600,000
800,000
1,000,000
1,200,000
2013 2014 2015
Median Sales Price Year-to-Year by Map Area: February
N Redondo Beach/Villas North
S Redondo Beach W of PCH
N Redondo Beach/Villas South
S Redondo Beach S of Torrance Blvd
S Redondo Beach N of Torrance Blvd
N Redondo Beach/Golden Hills
N Redondo Beach/El Nido
Market Median Sales Price
Back to Table of Contents
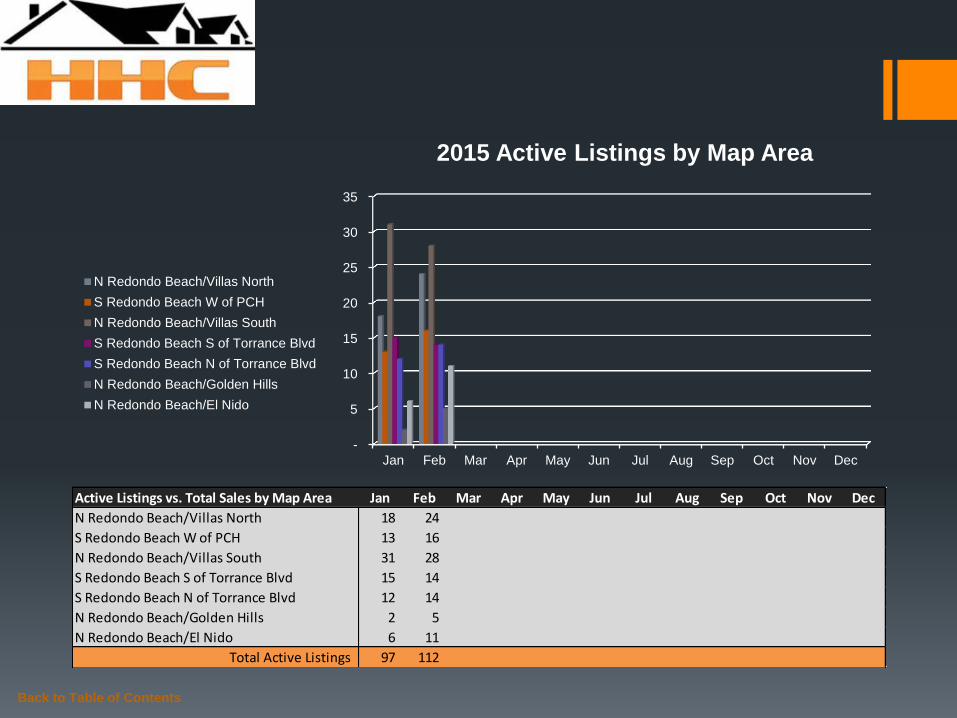
Active Listings vs. Total Sales by Map Area Jan Feb Mar Apr May Jun Jul Aug Sep Oct Nov Dec
N Redondo Beach/Villas North 18 24
S Redondo Beach W of PCH 13 16
N Redondo Beach/Villas South 31 28
S Redondo Beach S of Torrance Blvd 15 14
S Redondo Beach N of Torrance Blvd 12 14
N Redondo Beach/Golden Hills 2 5
N Redondo Beach/El Nido 6 11
Total Active Listings 97 112
-
5
10
15
20
25
30
35
Jan Feb Mar Apr May Jun Jul Aug Sep Oct Nov Dec
2015 Active Listings by Map Area
N Redondo Beach/Villas North
S Redondo Beach W of PCH
N Redondo Beach/Villas South
S Redondo Beach S of Torrance Blvd
S Redondo Beach N of Torrance Blvd
N Redondo Beach/Golden Hills
N Redondo Beach/El Nido
Back to Table of Contents
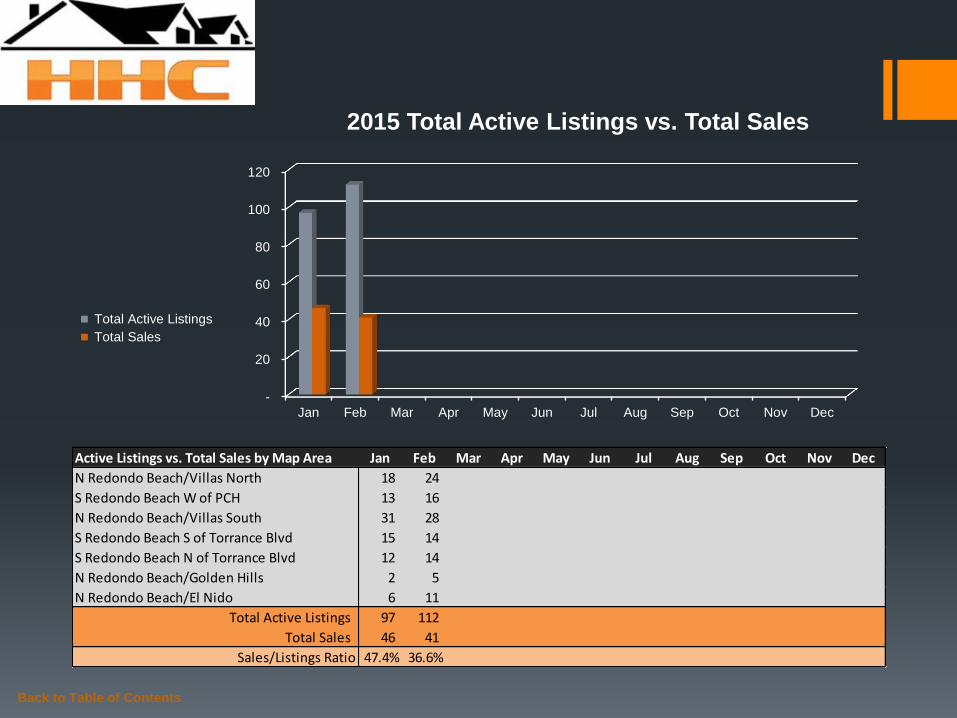
Active Listings vs. Total Sales by Map Area Jan Feb Mar Apr May Jun Jul Aug Sep Oct Nov Dec
N Redondo Beach/Villas North 18 24
S Redondo Beach W of PCH 13 16
N Redondo Beach/Villas South 31 28
S Redondo Beach S of Torrance Blvd 15 14
S Redondo Beach N of Torrance Blvd 12 14
N Redondo Beach/Golden Hills 2 5
N Redondo Beach/El Nido 6 11
Total Active Listings 97 112
Total Sales 46 41
Sales/Listings Ratio 47.4% 36.6%
-
20
40
60
80
100
120
Jan Feb Mar Apr May Jun Jul Aug Sep Oct Nov Dec
2015 Total Active Listings vs. Total Sales
Total Active Listings
Total Sales
Back to Table of Contents
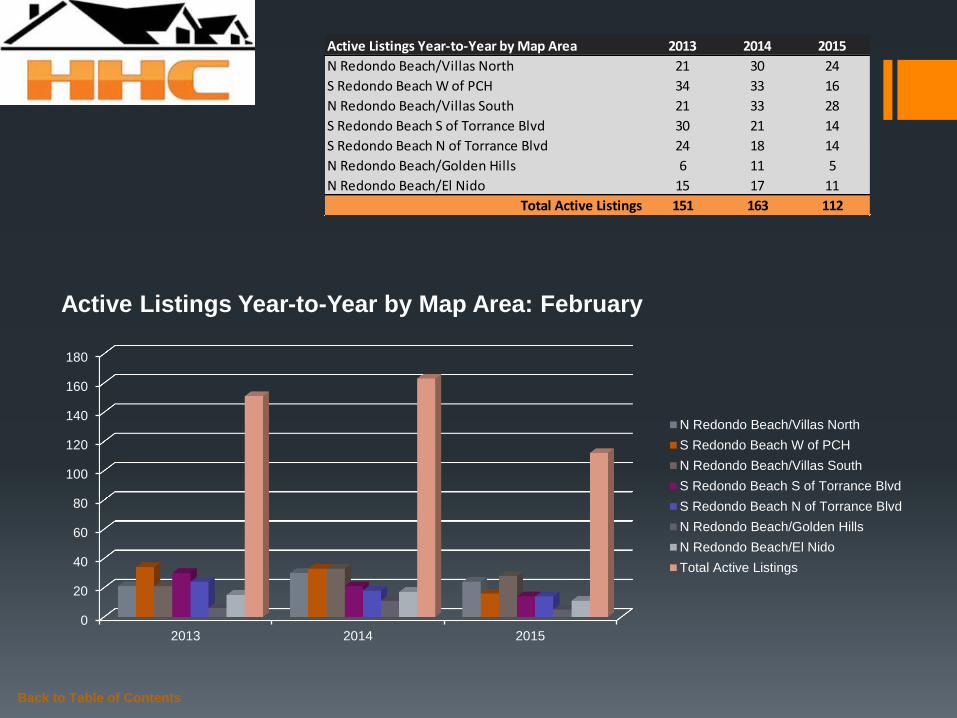
Active Listings Year-to-Year by Map Area 2013 2014 2015
N Redondo Beach/Villas North 21 30 24
S Redondo Beach W of PCH 34 33 16
N Redondo Beach/Villas South 21 33 28
S Redondo Beach S of Torrance Blvd 30 21 14
S Redondo Beach N of Torrance Blvd 24 18 14
N Redondo Beach/Golden Hills 6 11 5
N Redondo Beach/El Nido 15 17 11
Total Active Listings 151 163 112
0
20
40
60
80
100
120
140
160
180
2013 2014 2015
Active Listings Year-to-Year by Map Area: February
N Redondo Beach/Villas North
S Redondo Beach W of PCH
N Redondo Beach/Villas South
S Redondo Beach S of Torrance Blvd
S Redondo Beach N of Torrance Blvd
N Redondo Beach/Golden Hills
N Redondo Beach/El Nido
Total Active Listings
Back to Table of Contents
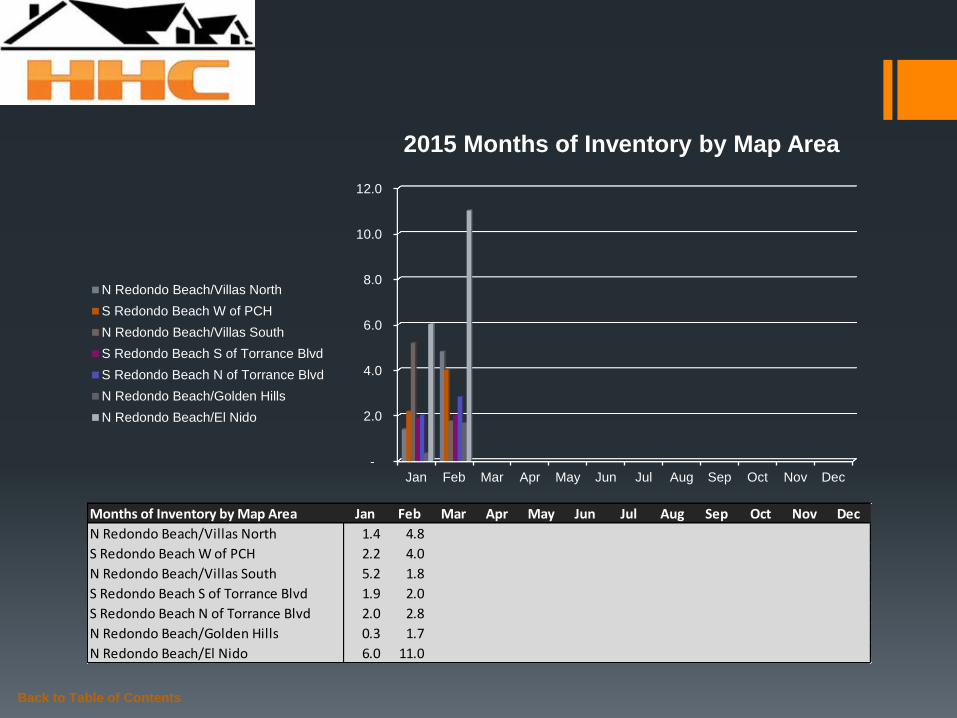
Months of Inventory by Map Area Jan Feb Mar Apr May Jun Jul Aug Sep Oct Nov Dec
N Redondo Beach/Villas North 1.4 4.8
S Redondo Beach W of PCH 2.2 4.0
N Redondo Beach/Villas South 5.2 1.8
S Redondo Beach S of Torrance Blvd 1.9 2.0
S Redondo Beach N of Torrance Blvd 2.0 2.8
N Redondo Beach/Golden Hills 0.3 1.7
N Redondo Beach/El Nido 6.0 11.0
-
2.0
4.0
6.0
8.0
10.0
12.0
Jan Feb Mar Apr May Jun Jul Aug Sep Oct Nov Dec
2015 Months of Inventory by Map Area
N Redondo Beach/Villas North
S Redondo Beach W of PCH
N Redondo Beach/Villas South
S Redondo Beach S of Torrance Blvd
S Redondo Beach N of Torrance Blvd
N Redondo Beach/Golden Hills
N Redondo Beach/El Nido
Back to Table of Contents
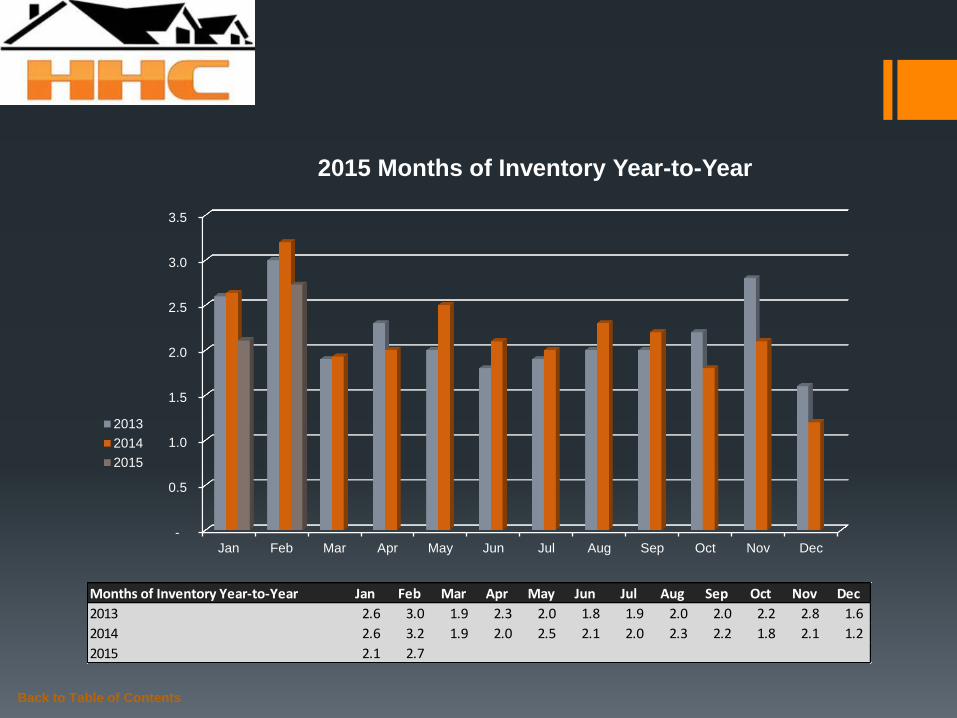
Months of Inventory Year-to-Year Jan Feb Mar Apr May Jun Jul Aug Sep Oct Nov Dec
2013 2.6 3.0 1.9 2.3 2.0 1.8 1.9 2.0 2.0 2.2 2.8 1.6
2014 2.6 3.2 1.9 2.0 2.5 2.1 2.0 2.3 2.2 1.8 2.1 1.2
2015 2.1 2.7
-
0.5
1.0
1.5
2.0
2.5
3.0
3.5
Jan Feb Mar Apr May Jun Jul Aug Sep Oct Nov Dec
2015 Months of Inventory Year-to-Year
2013
2014
2015
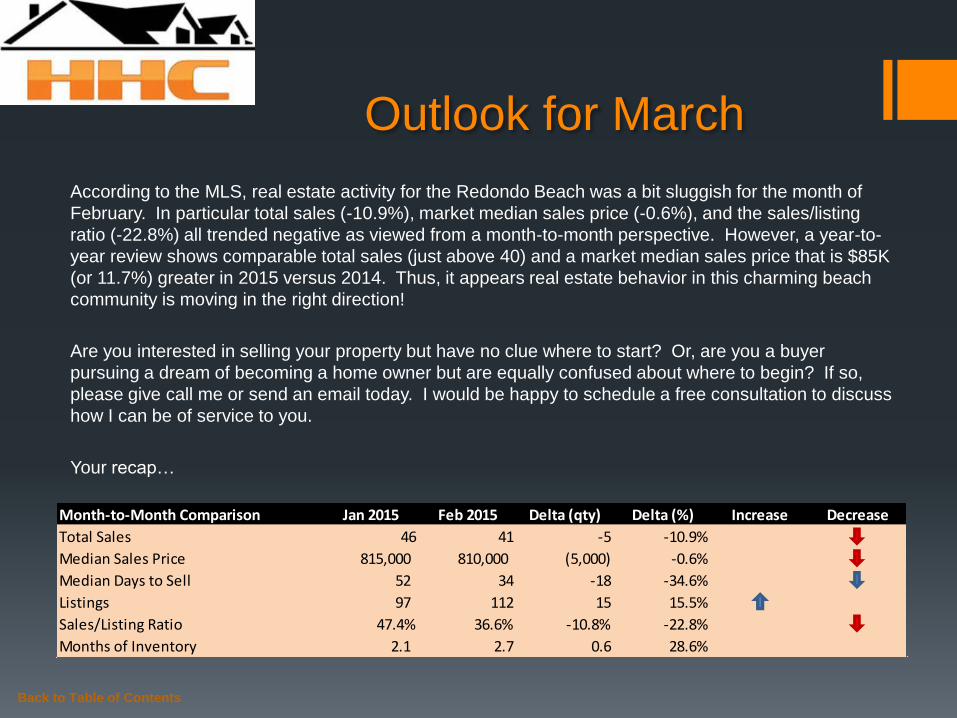
Outlook for March
According to the MLS, real estate activity for the Redondo Beach was a bit sluggish for the month of
February. In particular total sales (-10.9%), market median sales price (-0.6%), and the sales/listing
ratio (-22.8%) all trended negative as viewed from a month-to-month perspective. However, a year-to-
year review shows comparable total sales (just above 40) and a market median sales price that is $85K
(or 11.7%) greater in 2015 versus 2014. Thus, it appears real estate behavior in this charming beach
community is moving in the right direction!
Are you interested in selling your property but have no clue where to start? Or, are you a buyer
pursuing a dream of becoming a home owner but are equally confused about where to begin? If so,
please give call me or send an email today. I would be happy to schedule a free consultation to discuss
how I can be of service to you.
Your recap…
Back to Table of Contents
Month-to-Month Comparison Jan 2015 Feb 2015 Delta (qty) Delta (%) Increase Decrease
Total Sales 46 41 -5 -10.9%
Median Sales Price 815,000 810,000 (5,000) -0.6%
Median Days to Sell 52 34 -18 -34.6%
Listings 97 112 15 15.5%
Sales/Listing Ratio 47.4% 36.6% -10.8% -22.8%
Months of Inventory 2.1 2.7 0.6 28.6%
Serving South Bay Home Buyers and Sellers Since 2001
RE/MAX Top 4 Team in California – 2012
RE/MAX 100% Club - 2011
Shorewood Realtors Top 5% in Overall Sales 2001-2006, 2008-2010
Back to Table of Contents
About
Hady Chahine…

The information being provided by CARETS (CLAW, CRISNet MLS, DAMLS, CRMLS, i-Tech MLS, and/or VCRDS) is for the visitor’s personal, non-commercial use and may not be used for
any purpose other than to identify prospective properties visitor may be interested in purchasing. Any information relating to a property referenced on this web site comes from the Internet
Data Exchange (IDX) program of CARETS. This web site may reference real estate listing(s) held by a brokerage firm other than the broker and/or agent who owns this web site. The accuracy
of all information, regardless of source, including but not limited to square footages and lot sizes, is deemed reliable but not guaranteed and should be personally verified through personal
inspection by and/or with the appropriate professionals.
Back to Table of Contents
Listings MLS BLOG Website
Related Documents