Redondo Beach Residential Real Estate Market Conditions May 2016

Welcome message from author
This document is posted to help you gain knowledge. Please leave a comment to let me know what you think about it! Share it to your friends and learn new things together.
Transcript

7/25/2019 Redondo Beach Real Estate Market Conditions - May 2016
http://slidepdf.com/reader/full/redondo-beach-real-estate-market-conditions-may-2016 1/15
Redondo BeachResidential Real Estate
Market ConditionsMay 2016

7/25/2019 Redondo Beach Real Estate Market Conditions - May 2016
http://slidepdf.com/reader/full/redondo-beach-real-estate-market-conditions-may-2016 2/15
Table ofContents
Key Statistics for May
Sales
2016 Residential Sales Stats
Year-to-Year Total Sales by Map Area
Median
2016 Median Sales Stats
Year-to-Year Median Sales by Map Area
Listings2016 Active Listings by Map Area
2016 Total Active Listings vs. Total Sales
Year-to-Year Active Listings by Map Area
Inventory
2016 Months of Inventory by Map Area
Year-to-Year Months of Inventory
Summary
About Hady Chahine
Contact Information
7/25/2019 Redondo Beach Real Estate Market Conditions - May 2016
http://slidepdf.com/reader/full/redondo-beach-real-estate-market-conditions-may-2016 3/15
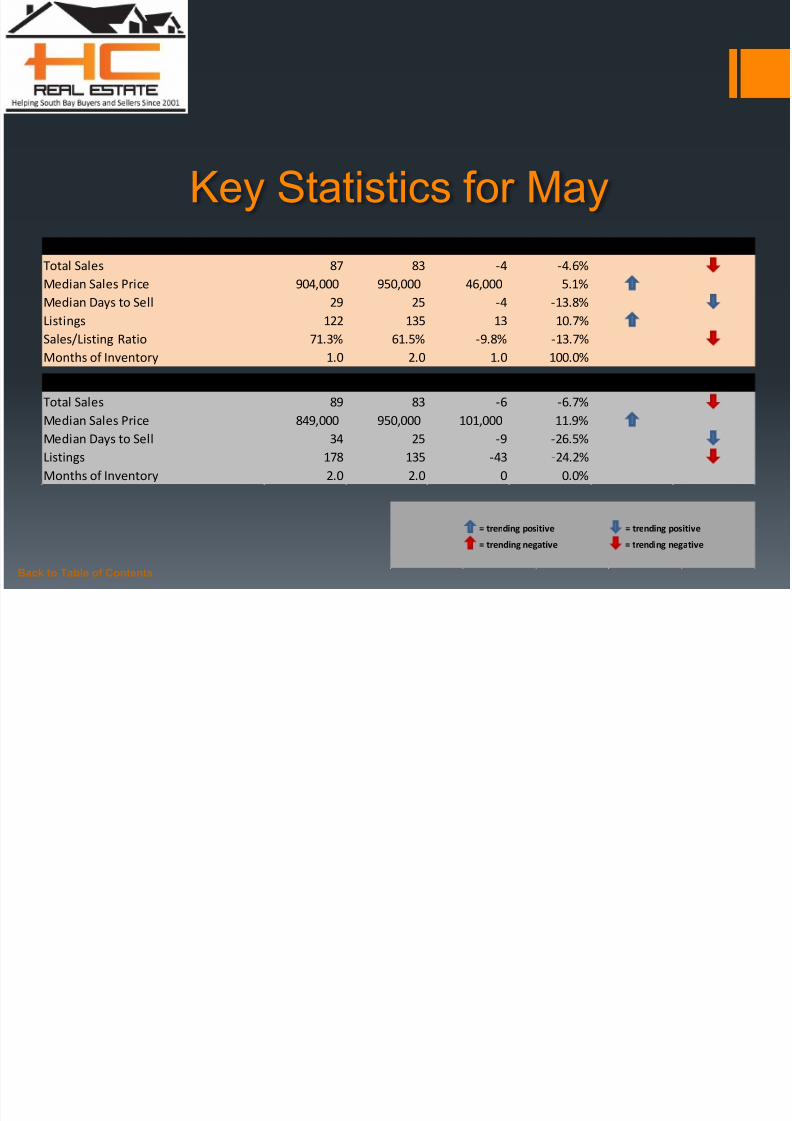
Key Statistics for May
Back to Table of Contents
= trending positive = trending positive
= trending negative = trending negative
Month-to-Month Comparison Apr 2016 May 2016 Delta (qty) Delta (%) Increase Decrease
Total Sales 87 83 -4 -4.6%
Median Sales Price 904,000 950,000 46,000 5.1%
Median Days to Sell 29 25 -4 -13.8%
Listings 122 135 13 10.7%
Sales/Listing Ratio 71.3% 61.5% -9.8% -13.7%
Months of Inventory 1.0 2.0 1.0 100.0%
Monthly Comparison Year-to-Year May 2015 May 2016 Delta Delta Increase Decrease
Total Sales 89 83 -6 -6.7%
Median Sales Price 849,000 950,000 101,000 11.9%
Median Days to Sell 34 25 -9 -26.5%
Listings 178 135 -43 -24.2%
Months of Inventory 2.0 2.0 0 0.0%
7/25/2019 Redondo Beach Real Estate Market Conditions - May 2016
http://slidepdf.com/reader/full/redondo-beach-real-estate-market-conditions-may-2016 4/15
Back to Table of Contents
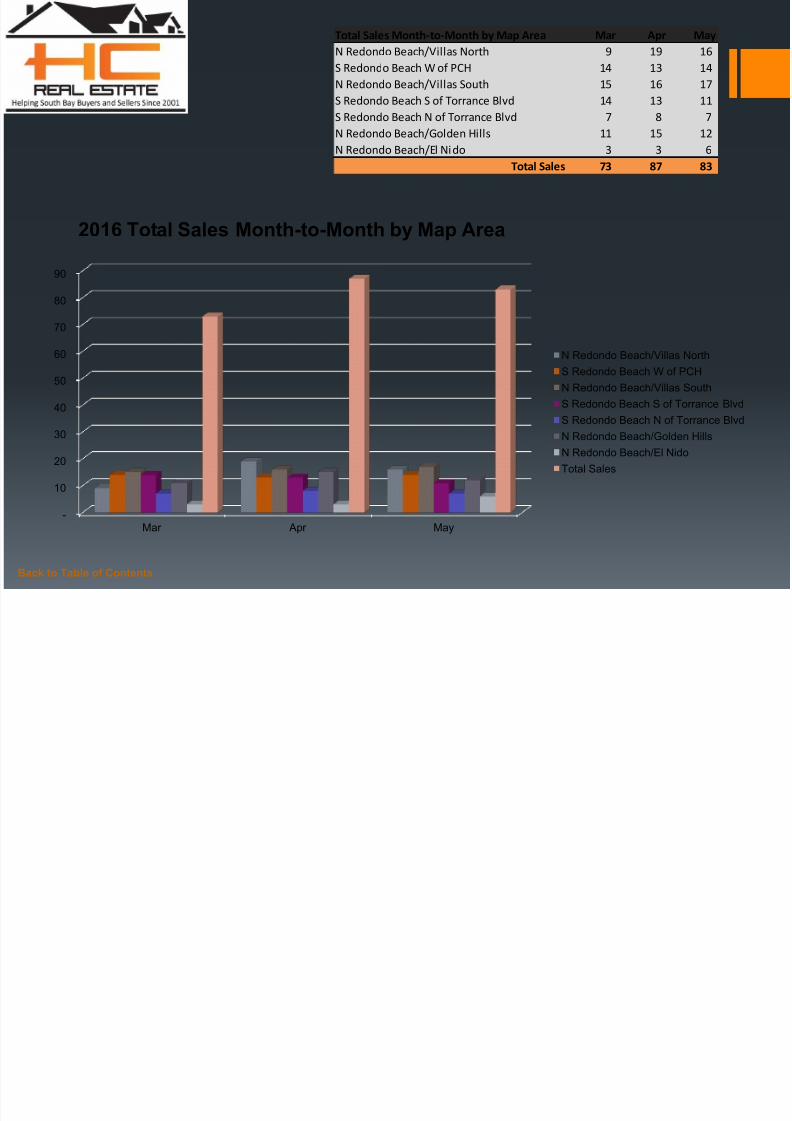
Total Sales Month-to-Month by Map Area Mar Apr May
N Redondo Beach/Villas North 9 19 16
S Redondo Beach W of PCH 14 13 14
N Redondo Beach/Villas South 15 16 17
S Redondo Beach S of Torrance Blvd 14 13 11
S Redondo Beach N of Torrance Blvd 7 8 7
N Redondo Beach/Golden Hills 11 15 12 N Redondo Beach/El Nido 3 3 6
Total Sales 73 87 83
-
10
20
30
40
50
60
70
80
90
Mar Apr May
2016 Total Sales Month-to-Month by Map Area
N Redondo Beach/Villas North
S Redondo Beach W of PCH
N Redondo Beach/Villas South
S Redondo Beach S of Torrance Blvd
S Redondo Beach N of Torrance Blvd
N Redondo Beach/Golden Hills
N Redondo Beach/El Nido
Total Sales
7/25/2019 Redondo Beach Real Estate Market Conditions - May 2016
http://slidepdf.com/reader/full/redondo-beach-real-estate-market-conditions-may-2016 5/15
Back to Table of Contents
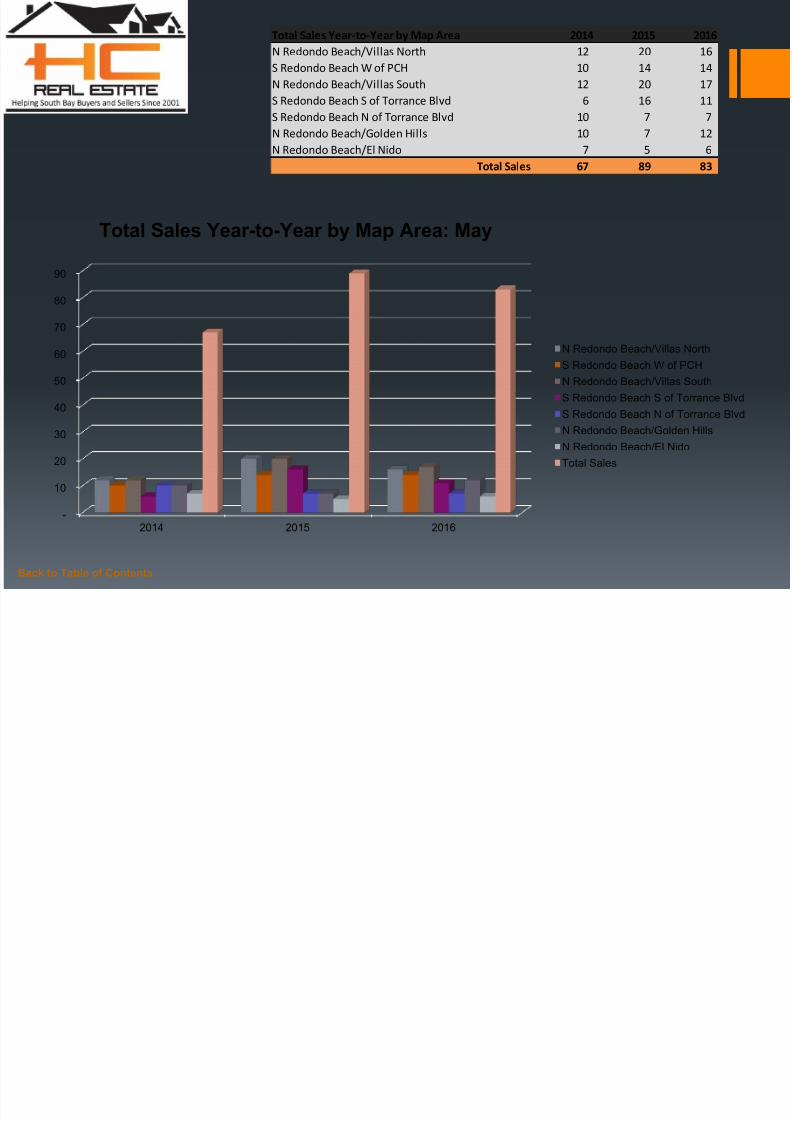
Total Sales Year-to-Year by Map Area 2014 2015 2016
N Redondo Beach/Villas North 12 20 16
S Redondo Beach W of PCH 10 14 14
N Redondo Beach/Villas South 12 20 17
S Redondo Beach S of Torrance Blvd 6 16 11
S Redondo Beach N of Torrance Blvd 10 7 7
N Redondo Beach/Golden Hills 10 7 12 N Redondo Beach/El Nido 7 5 6
Total Sales 67 89 83
-
10
20
30
40
50
60
70
80
90
2014 2015 2016
Total Sales Year-to-Year by Map Area: May
N Redondo Beach/Villas North
S Redondo Beach W of PCH
N Redondo Beach/Villas South
S Redondo Beach S of Torrance Blvd
S Redondo Beach N of Torrance BlvdN Redondo Beach/Golden Hills
N Redondo Beach/El Nido
Total Sales
7/25/2019 Redondo Beach Real Estate Market Conditions - May 2016
http://slidepdf.com/reader/full/redondo-beach-real-estate-market-conditions-may-2016 6/15
Back to Table of Contents
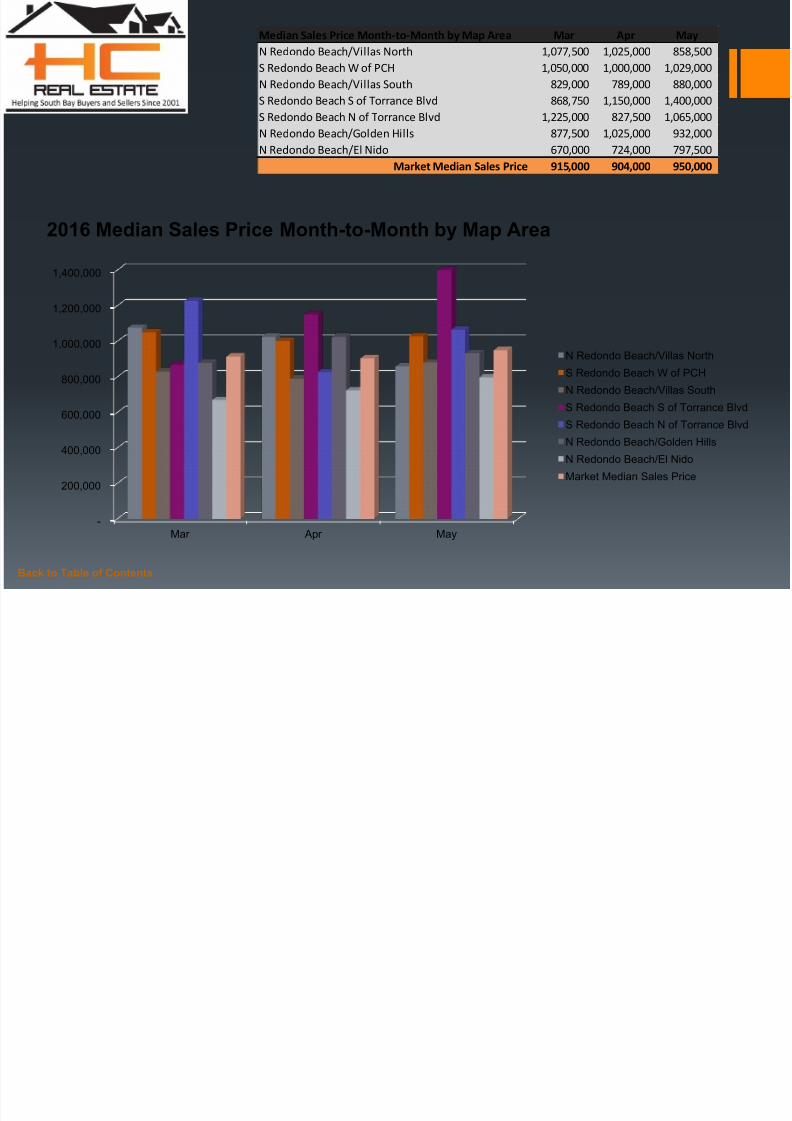
Median Sales Price Month-to-Month by Map Area Mar Apr May
N Redondo Beach/Villas North 1,077,500 1,025,000 858,500
S Redondo Beach W of PCH 1,050,000 1,000,000 1,029,000
N Redondo Beach/Villas South 829,000 789,000 880,000
S Redondo Beach S of Torrance Blvd 868,750 1,150,000 1,400,000
S Redondo Beach N of Torrance Blvd 1,225,000 827,500 1,065,000
N Redondo Beach/Golden Hills 877,500 1,025,000 932,000 N Redondo Beach/El Nido 670,000 724,000 797,500
Market Median Sales Price 915,000 904,000 950,000
-
200,000
400,000
600,000
800,000
1,000,000
1,200,000
1,400,000
Mar Apr May
2016 Median Sales Price Month-to-Month by Map Area
N Redondo Beach/Villas North
S Redondo Beach W of PCH
N Redondo Beach/Villas South
S Redondo Beach S of Torrance Blvd
S Redondo Beach N of Torrance Blvd
N Redondo Beach/Golden Hills
N Redondo Beach/El Nido
Market Median Sales Price
7/25/2019 Redondo Beach Real Estate Market Conditions - May 2016
http://slidepdf.com/reader/full/redondo-beach-real-estate-market-conditions-may-2016 7/15Back to Table of Contents
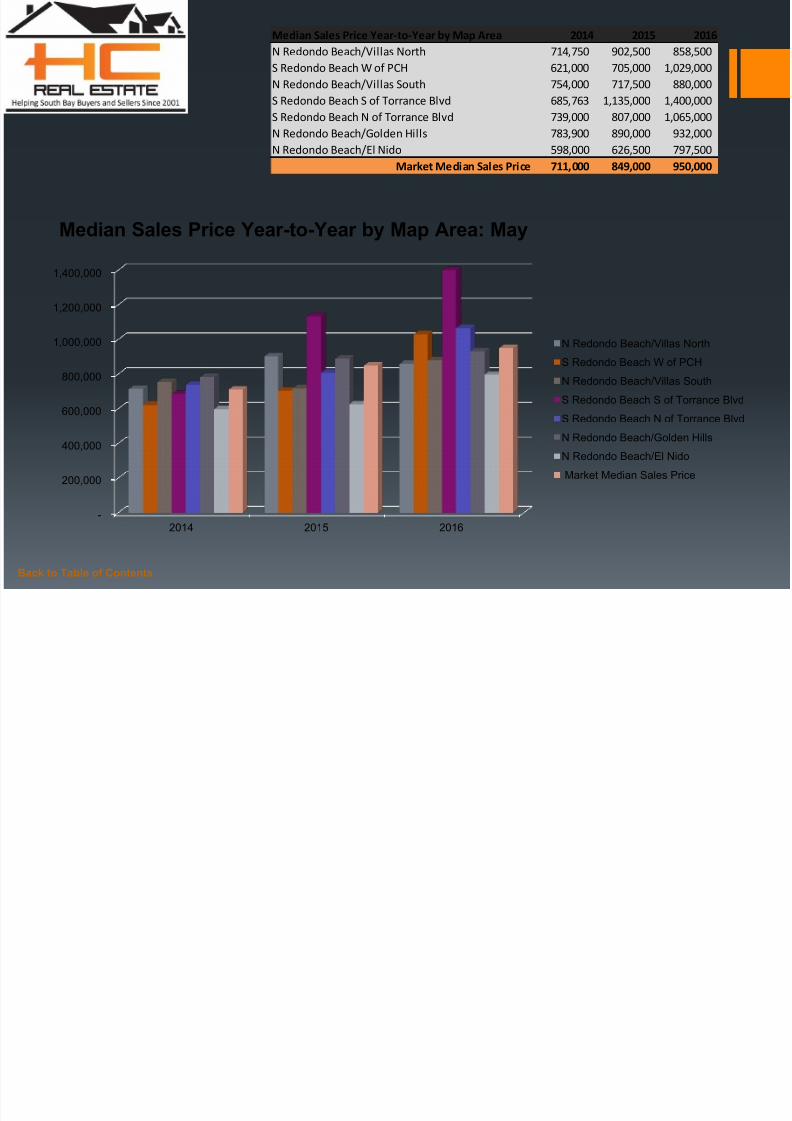
Median Sales Price Year-to-Year by Map Area 2014 2015 2016
N Redondo Beach/Villas North 714,750 902,500 858,500
S Redondo Beach W of PCH 621,000 705,000 1,029,000
N Redondo Beach/Villas South 754,000 717,500 880,000
S Redondo Beach S of Torrance Blvd 685,763 1,135,000 1,400,000
S Redondo Beach N of Torrance Blvd 739,000 807,000 1,065,000
N Redondo Beach/Golden Hills 783,900 890,000 932,000 N Redondo Beach/El Nido 598,000 626,500 797,500
Market Median Sales Price 711,000 849,000 950,000
-
200,000
400,000
600,000
800,000
1,000,000
1,200,000
1,400,000
2014 2015 2016
Median Sales Price Year-to-Year by Map Area: May
N Redondo Beach/Villas North
S Redondo Beach W of PCH
N Redondo Beach/Villas South
S Redondo Beach S of Torrance Blvd
S Redondo Beach N of Torrance Blvd
N Redondo Beach/Golden Hills
N Redondo Beach/El Nido
Market Median Sales Price
7/25/2019 Redondo Beach Real Estate Market Conditions - May 2016
http://slidepdf.com/reader/full/redondo-beach-real-estate-market-conditions-may-2016 8/15Back to Table of Contents
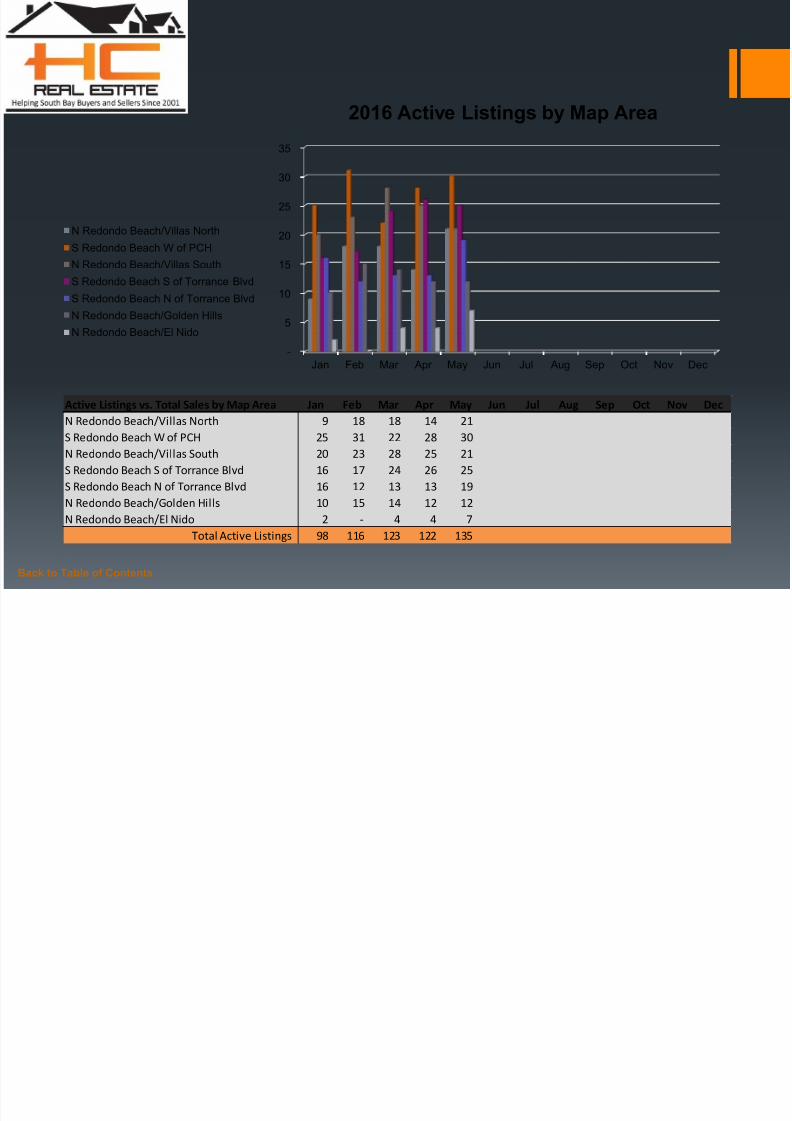
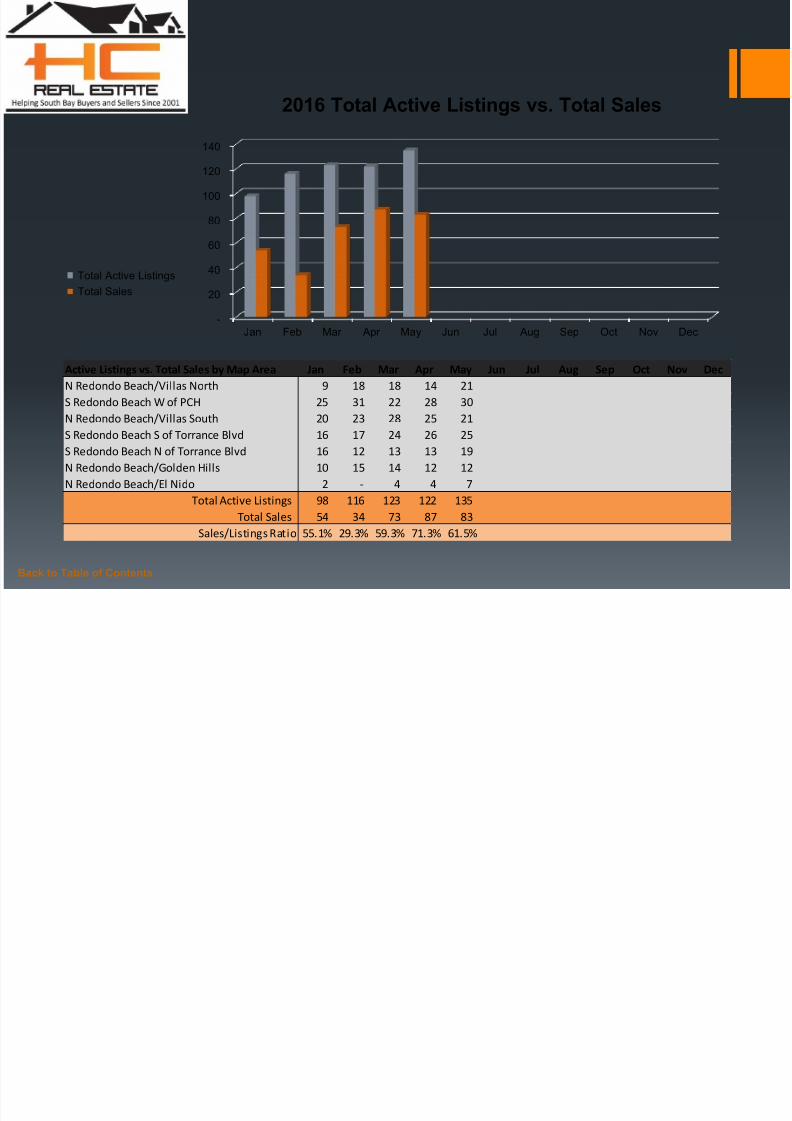
Active Listings vs. Total Sales by Map Area Jan Feb Mar Apr May Jun Jul Aug Sep Oct Nov Dec
N Redondo Beach/Villas North 9 18 18 14 21
S Redondo Beach W of PCH 25 31 22 28 30
N Redondo Beach/Villas South 20 23 28 25 21
S Redondo Beach S of Torrance Blvd 16 17 24 26 25
S Redondo Beach N of Torrance Blvd 16 12 13 13 19
N Redondo Beach/Golden Hills 10 15 14 12 12
N Redondo Beach/El Nido 2 - 4 4 7
Total Active Listings 98 116 123 122 135
-
5
10
15
20
25
30
35
Jan Feb Mar Apr May Jun Jul Aug Sep Oct Nov Dec
2016 Active Listings by Map Area
N Redondo Beach/Villas North
S Redondo Beach W of PCH
N Redondo Beach/Villas South
S Redondo Beach S of Torrance Blvd
S Redondo Beach N of Torrance Blvd
N Redondo Beach/Golden Hills
N Redondo Beach/El Nido
7/25/2019 Redondo Beach Real Estate Market Conditions - May 2016
http://slidepdf.com/reader/full/redondo-beach-real-estate-market-conditions-may-2016 9/15
7/25/2019 Redondo Beach Real Estate Market Conditions - May 2016
http://slidepdf.com/reader/full/redondo-beach-real-estate-market-conditions-may-2016 10/15Back to Table of Contents
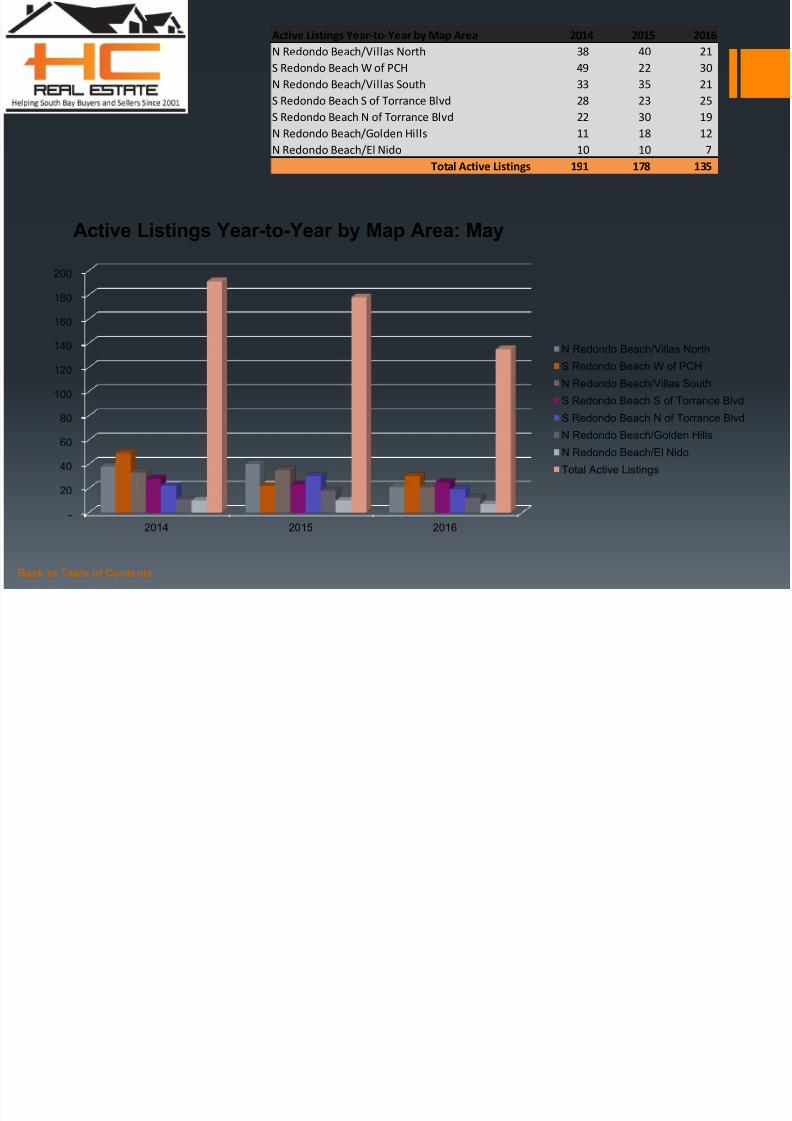
Active Listings Year-to-Year by Map Area 2014 2015 2016
N Redondo Beach/Villas North 38 40 21
S Redondo Beach W of PCH 49 22 30
N Redondo Beach/Villas South 33 35 21
S Redondo Beach S of Torrance Blvd 28 23 25
S Redondo Beach N of Torrance Blvd 22 30 19
N Redondo Beach/Golden Hills 11 18 12 N Redondo Beach/El Nido 10 10 7
Total Active Listings 191 178 135
-
20
40
60
80
100
120
140
160
180
200
2014 2015 2016
Active Listings Year-to-Year by Map Area: May
N Redondo Beach/Villas North
S Redondo Beach W of PCH
N Redondo Beach/Villas South
S Redondo Beach S of Torrance Blvd
S Redondo Beach N of Torrance Blvd
N Redondo Beach/Golden Hills
N Redondo Beach/El Nido
Total Active Listings
7/25/2019 Redondo Beach Real Estate Market Conditions - May 2016
http://slidepdf.com/reader/full/redondo-beach-real-estate-market-conditions-may-2016 11/15Back to Table of Contents
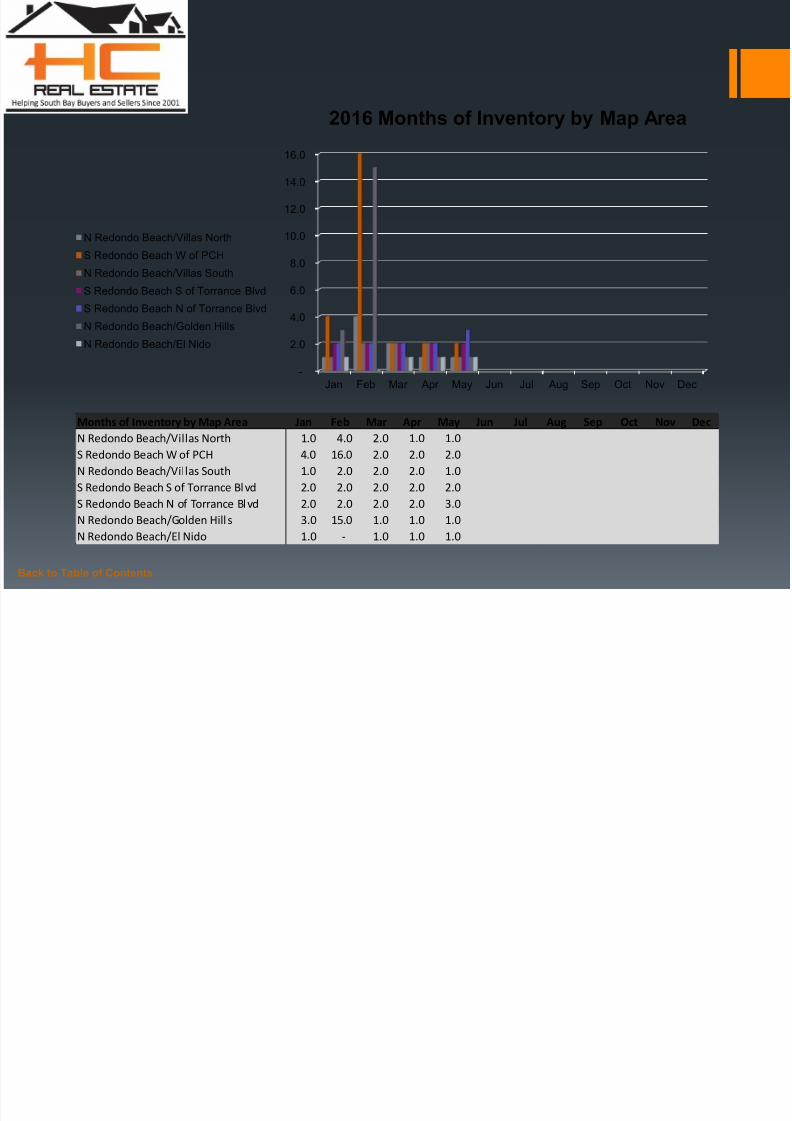
Months of Inventory by Map Area Jan Feb Mar Apr May Jun Jul Aug Sep Oct Nov Dec
N Redondo Beach/Villas North 1.0 4.0 2.0 1.0 1.0
S Redondo Beach W of PCH 4.0 16.0 2.0 2.0 2.0
N Redondo Beach/Villas South 1.0 2.0 2.0 2.0 1.0
S Redondo Beach S of Torrance Blvd 2.0 2.0 2.0 2.0 2.0
S Redondo Beach N of Torrance Blvd 2.0 2.0 2.0 2.0 3.0
N Redondo Beach/Golden Hill s 3.0 15.0 1.0 1.0 1.0
N Redondo Beach/El Nido 1.0 - 1.0 1.0 1.0
-
2.0
4.0
6.0
8.0
10.0
12.0
14.0
16.0
Jan Feb Mar Apr May Jun Jul Aug Sep Oct Nov Dec
2016 Months of Inventory by Map Area
N Redondo Beach/Villas North
S Redondo Beach W of PCH
N Redondo Beach/Villas SouthS Redondo Beach S of Torrance Blvd
S Redondo Beach N of Torrance Blvd
N Redondo Beach/Golden Hills
N Redondo Beach/El Nido
7/25/2019 Redondo Beach Real Estate Market Conditions - May 2016
http://slidepdf.com/reader/full/redondo-beach-real-estate-market-conditions-may-2016 12/15Back to Table of Contents
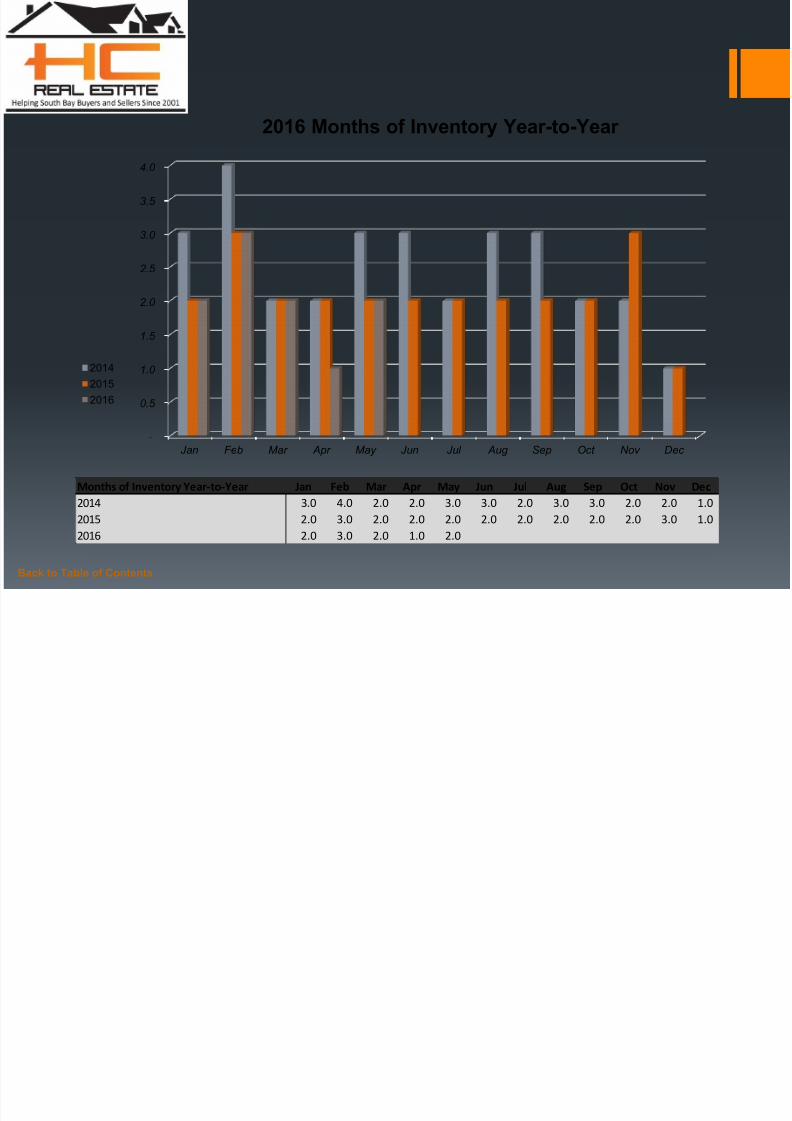
Months of Inventory Year-to-Year Jan Feb Mar Apr May Jun Jul Aug Sep Oct Nov Dec
2014 3.0 4.0 2.0 2.0 3.0 3.0 2.0 3.0 3.0 2.0 2.0 1.0
2015 2.0 3.0 2.0 2.0 2.0 2.0 2.0 2.0 2.0 2.0 3.0 1.0
2016 2.0 3.0 2.0 1.0 2.0
-
0.5
1.0
1.5
2.0
2.5
3.0
3.5
4.0
Jan Feb Mar Apr May Jun Jul Aug Sep Oct Nov Dec
2016 Months of Inventory Year-to-Year
2014
2015
2016
7/25/2019 Redondo Beach Real Estate Market Conditions - May 2016
http://slidepdf.com/reader/full/redondo-beach-real-estate-market-conditions-may-2016 13/15
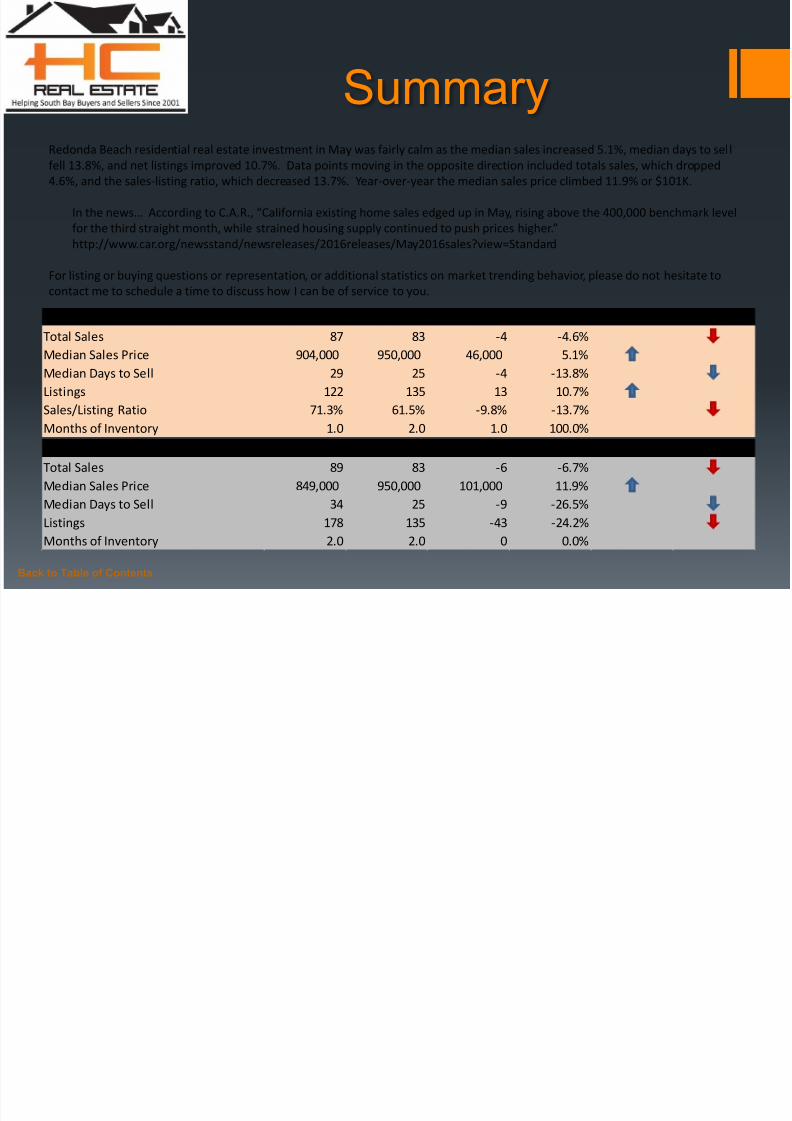
SummaryRedonda Beach residential real estate investment in May was fairly calm as the median sales increased 5.1%, median days to sell
fell 13.8%, and net listings improved 10.7%. Data points moving in the opposite direction included totals sales, which dropped
4.6%, and the sales-listing ratio, which decreased 13.7%. Year-over-year the median sales price climbed 11.9% or $101K.
In the news… According to C.A.R., “California existing home sales edged up in May, rising above the 400,000 benchmark level
for the third straight month, while strained housing supply continued to push prices higher.”
http://www.car.org/newsstand/newsreleases/2016releases/May2016sales?view=Standard
For listing or buying questions or representation, or additional statistics on market trending behavior, please do not hesitate tocontact me to schedule a time to discuss how I can be of service to you.
Back to Table of Contents
Monthly Comparison Year-to-Year May 2015 May 2016 Delta Delta Increase Decrease
Total Sales 89 83 -6 -6.7%
Median Sales Price 849,000 950,000 101,000 11.9%
Median Days to Sell 34 25 -9 -26.5%
Listings 178 135 -43 -24.2%
Months of Inventory 2.0 2.0 0 0.0%
Month-to-Month Comparison Apr 2016 May 2016 Delta (qty) Delta (%) Increase Decrease
Total Sales 87 83 -4 -4.6%
Median Sales Price 904,000 950,000 46,000 5.1%
Median Days to Sell 29 25 -4 -13.8%
Listings 122 135 13 10.7%
Sales/Listing Ratio 71.3% 61.5% -9.8% -13.7%Months of Inventory 1.0 2.0 1.0 100.0%

7/25/2019 Redondo Beach Real Estate Market Conditions - May 2016
http://slidepdf.com/reader/full/redondo-beach-real-estate-market-conditions-may-2016 14/15
Serving South Bay Home Buyers and Sellers Since 2001
RE/MAX Top 4 Team in California – 2012 RE/MAX 100% Club - 2011
Shorewood Realtors Top 5% in Overall Sales 2001-2006, 2008-2010
Back to Table of Contents
About
Hady Chahine…

7/25/2019 Redondo Beach Real Estate Market Conditions - May 2016
http://slidepdf.com/reader/full/redondo-beach-real-estate-market-conditions-may-2016 15/15
The information being provided by CARETS (CLAW, CRISNet MLS, DAMLS, CRMLS, i-Tech MLS, and/or VCRDS) is for the visitor’s personal, non-commercial use and may not be used for
any purpose other than to identify prospective properties visitor may be interested in purchasing. Any information relating to a property referenced on this web site comes from the Internet
Data Exchange (IDX) program of CARETS. This web site may reference real estate listing(s) held by a brokerage firm other than the broker and/or agent who owns this web site. The accuracy
of all information, regardless of source, including but not limited to square footages and lot sizes, is deemed reliable but not guaranteed and should be personally verified through personal
inspection by and/or with the appropriate professionals.
Back to Table of Contents
Listings MLS BLOGWebsite
Hady Chahine
• [email protected]• 310-404-5361
Related Documents