Exploring school students’ views of the nature of science Luis Jiro Suzuri-Hernandez PhD Thesis Department of Education November 2010

Welcome message from author
This document is posted to help you gain knowledge. Please leave a comment to let me know what you think about it! Share it to your friends and learn new things together.
Transcript
Exploring school students’ views of the nature
of science
Luis Jiro Suzuri-Hernandez
PhD Thesis
Department of Education
November 2010
2
ABSTRACT
This study aimed to develop, validate, and use a fixed-response test to assess in a
quick manner the views of the nature of science (NoS) of groups of secondary school
students and to explore the issues involved in developing such tests. The Nature of
Science Test (NoST) used episodes from the history of science as contexts for
questions. For each aspect of the NoS probed, three options were presented, using a
cartoon format: a “desired” position and more positivist and relativist alternatives.
The NoST was validated by an international expert panel and trialled with students in
England (n=168). Only 50-60% of respondents gave a consistent response to the
same question presented in different contexts.
To explore this further, parallel forms of the test—with different contexts—were
administered several weeks apart to English students (n=169), while a test-retest trial
using the same form of the NoST twice was conducted with a smaller sample (n=49).
A sample of Mexican students (n=185) also completed one form of the test, to
explore culture and language effects. Two focus groups in England and twelve in
Mexico (n=6 and 36 students, respectively) probed the reasons behind students’
views and checked the interpretation of their written responses.
Almost all students had mixed profiles, where desired views of some aspects of the
NoS coexisted with alternative ones. Again, only 50-60% of respondents gave a
consistent response to the same question across contexts, and test-retest variability
was similar. In the focus groups, most students engaged adequately with the central
issue raised by each question, justifying their responses coherently. English students
selected slightly more “desirable” views than Mexican students, but differences in
reasons for choices were negligible. Together, these findings suggest that students’
may posses an incoherent and unstable understanding of the NoS. A single
administration of one form of the NoST does not appear reliable enough for the
summative assessment of individuals, but can provide more reliable data at the
population level. The quality of focus group discussions suggests that this technique
could be used effectively for formative assessment within the classroom.
3
TABLE OF CONTENTS
1. CHAPTER 1 INTRODUCTION............................................................................................. 11
2. CHAPTER 2 LITERATURE REVIEW: THE NATURE OF SCIENCE ........................... 16
2.1. WHAT IS THE NATURE OF SCIENCE? ................................................................................... 16 2.1.1. Logical positivism ........................................................................................................ 19 2.1.2. Falsificationism............................................................................................................ 22 2.1.3. Kuhnian philosophy of science..................................................................................... 24 2.1.4. Post-Kuhnian philosophy of science ............................................................................ 29 2.1.5. The Strong Programme in the sociology of science ..................................................... 34 2.1.6. Recent developments in understanding the nature of science ...................................... 35
2.2. THE NATURE OF SCIENCE IN SCIENCE EDUCATION.............................................................. 40
3. CHAPTER 3 LITERATURE REVIEW: ASSESSMENTS OF VIEWS OF THE NATURE
OF SCIENCE ..................................................................................................................................... 50
3.1. VALIDITY AND RELIABILITY............................................................................................... 50 3.2. DEVELOPMENT OF ASSESSMENT INSTRUMENTS OF VIEWS OF THE NATURE OF SCIENCE ..... 53
3.2.1. Early attempts to assess views of the nature of science................................................ 55 3.2.2. The first standardised NoS instruments........................................................................ 56 3.2.3. The turning point—Aikenhead’s Views on Science-Technology-Society test ............... 62 3.2.4. Qualitative assessment—Lederman’s Views of the Nature of Science test................... 70 3.2.5. Contextual methods of assessing views of the NoS....................................................... 77 3.2.6. The next generation—new standardised NoS instruments ........................................... 78
4. CHAPTER 4 RATIONALE OF THE NATURE OF SCIENCE TEST.............................. 87
4.1. OVERVIEW OF THE RATIONALE .......................................................................................... 87 4.2. SOURCES OF THE CONTENT FRAMEWORK........................................................................... 89
4.2.1. Ideas of the nature of science implied by definitions of scientific literacy ................... 90 4.2.2. Ideas of the nature of science advocated by educational policy documents................. 91 4.2.3. Ideas of the nature of science advocated by educational researchers.......................... 92 4.2.4. Ideas of the nature of science supported by empirical research .................................. 97
4.3. DEFINING THE FRAMEWORK FOR THE NOST .................................................................... 100 4.4. THE NATURE OF SCIENCE PROFILES.................................................................................. 104 4.5. THE CONTEXTS OF THE NATURE OF SCIENCE TEST .......................................................... 112 4.6. THE QUESTIONING STYLE................................................................................................. 121 4.7. THE NOS QUESTIONS ....................................................................................................... 124 4.8. THE CONCEPT CARTOONS................................................................................................. 125 4.9. INFERENCE VERSUS DATA QUESTIONS.............................................................................. 126 4.10. THE LANGUAGE OF THE TEST ........................................................................................... 128

4
4.11. THE NEXT STEPS............................................................................................................... 130
5. CHAPTER 5 METHODS ................................................................................................... 131
5.1. THE PILOT STUDY............................................................................................................. 131 5.1.1. Objectives of the pilot study ....................................................................................... 132 5.1.2. How to assess the reliability of the NoST? ................................................................. 133 5.1.3. Students’ responses to the NoST................................................................................. 134 5.1.4. Experts’ responses to the NoST.................................................................................. 138
5.2. THE MAIN STUDY ............................................................................................................. 142 5.2.1. Overview of the main study and research questions .................................................. 142 5.2.2. The test-retest trial and the parallel forms trial ......................................................... 145 5.2.3. Focus groups .............................................................................................................. 147 5.2.4. Students’ views of the NoS.......................................................................................... 152 5.2.5. English and Mexican students’ views of the NoS ....................................................... 152
6. CHAPTER 6 RESULTS: THE PILOT STUDY .................................................................. 156
6.1. STUDENTS’ OVERALL SCORES—PART I OF THE NOST ..................................................... 156 6.2. EXPERTS’ OPINIONS—PART I OF THE NOST .................................................................... 159 6.3. STUDENTS’ RESPONSES FOR INDIVIDUAL QUESTIONS—PART II OF THE NOST................. 163 6.4. UNANSWERED QUESTIONS AND QUESTIONS WITH MORE THAN ONE ANSWER—PART II OF
THE NOST...................................................................................................................................... 166 6.5. CONSISTENCY OF STUDENTS’ PROFILES OF RESPONSES BETWEEN THE YELLOW AND GREEN
VERSIONS OF THE QUESTIONNAIRE ................................................................................................. 168 6.6. EXPERTS’ OPINIONS REGARDING THE VALIDITY OF THE INSTRUMENT.............................. 175 6.7. RESEARCH QUESTIONS TO ADDRESS IN THE MAIN STUDY................................................. 186
7. CHAPTER 7 RESULTS: WRITTEN ADMINISTRATIONS OF THE NOST................ 187
7.1. OVERVIEW OF THE RESULTS OF THE MAIN STUDY ............................................................ 187 7.2. STUDENTS’ VIEWS OF THE NATURE OF SCIENCE ............................................................... 188
7.2.1. Responses to Part I of the NoST—the data vs. explanations questions ...................... 189 7.2.2. Responses to Part II of the NoST—the nature of science questions ........................... 194 7.2.3. Correlation between responses to Part I and Part II of the NoST.............................. 207 7.2.4. Consistency of responses over time—the test-retest trial ........................................... 211 7.2.5. Consistency of responses across contexts—the parallel forms trial........................... 215 7.2.6. Mexican students’ views of the NoS, compared with views of English students......... 220
7.3. SUMMARY OF THE FINDINGS OF THE TEST-RETEST AND PARALLEL FORMS TRIALS........... 228
8. CHAPTER 8 RESULTS: THE FOCUS GROUPS.............................................................. 230
8.1. STUDENTS’ INTERPRETATIONS OF THE NATURE OF SCIENCE TEST................................... 230 8.1.1. Students’ interpretations and justifications of responses to Question 1..................... 232 8.1.2. Students’ interpretations and justifications of answers to Question 2 ....................... 240 8.1.3. Students’ interpretations and justifications of answers to Question 3 ....................... 243
5
8.1.4. Students’ interpretations and justifications of answers to Question 4 ....................... 249 8.1.5. Students’ interpretations and justifications of answers to Question 5 ....................... 253 8.1.6. Students’ interpretations and justifications of answers to Question 6 ....................... 259 8.1.7. Students’ interpretations and justifications of answers to Question 7 ....................... 263
8.2. SUMMARY OF THE FINDINGS FROM THE FOCUS GROUPS ................................................... 266 8.2.1. Do questions capture and/or represent students’ views of the NoS?.......................... 266 8.2.2. Do students offer examples with which to explain their views? ................................. 272 8.2.3. What are students’ views of the NoS? ........................................................................ 273 8.2.4. What do students’ views and reasoning suggest of their understanding of the NoS?. 275 8.2.5. Are there any differences between the responses of Mexican and English students? 278 8.2.6. How does the NoST perform as a summative assessment instrument? ...................... 279 8.2.7. Could the NoST function as a formative assessment instrument? .............................. 280
9. CHAPTER 9 CONCLUSIONS............................................................................................ 283
9.1. ADDRESSING THE RESEARCH QUESTIONS ......................................................................... 283 9.1.1. Is the NoST a valid and reliable assessment instrument? .......................................... 283 9.1.2. What are students’ views of the nature of science?.................................................... 286 9.1.3. What are the differences between the views of English and Mexican students? ........ 290
9.2. LIMITATIONS OF THE STUDY ............................................................................................ 291 9.3. IMPLICATIONS OF THE RESEARCH..................................................................................... 293 9.4. FURTHER RESEARCH ........................................................................................................ 296 9.5. FINAL WORDS .................................................................................................................. 297
10. APPENDIX 1 PILOT STUDY TESTS........................................................................ 299
11. APPENDIX 2 MAIN STUDY TESTS......................................................................... 324
12. APPENDIX 3 MAIN STUDY TESTS, SPANISH VERSION................................... 349
13. APPENDIX 4 PRO-FORMA ....................................................................................... 374
14. APPENDIX 5 MAIN STUDY DOCUMENTS............................................................ 384
15. APPENDIX 6 INFORMED CONSENTS ................................................................... 390
16. REFERENCES................................................................................................................... 394
6
LIST OF TABLES TABLE 1 PHILOSOPHICAL COMMITMENTS OF PROJECT 2061 AND THE BRITISH NATIONAL CURRICULUM
.................................................................................................................................................... 46 TABLE 2 NON-CONTROVERSIAL ASPECTS OF THE NOS SUITABLE FOR SCIENCE TEACHING (FROM
LEDERMAN, 2007, PP. 833-835)................................................................................................... 48 TABLE 3 TYPES OF VALIDITY (ADAPTED FROM SATTERLY, 1981 AND SUPPLEMENTED WITH STATEMENTS
FROM BLACK, 1998).................................................................................................................... 52 TABLE 4 INSTRUMENTS FOR ASSESSING THE NOS (ADAPTED AND EXPANDED FROM LEDERMAN, 2007)54 TABLE 5 DESCRIPTION OF THE PROFILES BUILT BY IBRAHIM ET AL. (2009, P. 258) ............................... 85 TABLE 6 CONCEPTIONS OF SCIENTIFIC LITERACY (FROM NORRIS AND PHILLIPS, 2003, P. 225) ............ 90 TABLE 7 MOST PREVALENT VIEWS OF THE NOS IN INTERNATIONAL POLICY DOCUMENTS (FROM
MCCOMAS ET AL., 1998, P. 6) ..................................................................................................... 91 TABLE 8 ASPECTS OF THE NOS ADVOCATED AS RELEVANT AND ACCESSIBLE FOR INSTRUCTION.......... 96 TABLE 9 THEMES ABOUT THE NOS THAT SHOULD BE TAUGHT TO SCHOOL STUDENTS (FROM OSBORNE
ET AL., 2003, PP. 705-706)........................................................................................................... 97 TABLE 10 EPISTEMOLOGICAL IDEAS FOR ENGAGING WITH ISSUES INVOLVING SCIENCE (FROM RYDER,
2001)........................................................................................................................................... 99 TABLE 11 WIDELY-HELD MYTHS ABOUT SCIENCE (FROM MCCOMAS, 1998)...................................... 100 TABLE 12 IDEAS OF THE NOS IMPLIED BY GIERE’S MODEL OF SCIENTIFIC THINKING.......................... 102 TABLE 13 ASPECTS OF THE NOS INCLUDED IN THE FRAMEWORK FOR THE NOST ............................... 104 TABLE 14 PROFILE DESCRIPTORS FOR EACH OF THE ASPECTS OF THE NOS ......................................... 106 TABLE 15 PROFILE DESCRIPTORS FOR THE “ROLE OF CREATIVITY”..................................................... 106 TABLE 16 STAGES OF KITCHENER AND KING’S MODEL OF REFLECTIVE JUDGEMENT (KITCHENER AND
KING, 1981) .............................................................................................................................. 110 TABLE 17 FORMS OF EPISTEMOLOGICAL REASONING (FROM LEACH ET AL., 2000)............................. 111 TABLE 18 BROWN ET AL.’S NOS RUBRIC (BROWN ET AL., 2006) ........................................................ 112 TABLE 19 BOOKLETS SENT TO EACH PARTICIPATING SCHOOL............................................................. 135 TABLE 20 NUMBER OF COMPLETED BOOKLETS PER SCHOOL............................................................... 137 TABLE 21 QUESTIONS POSED TO EXPERTS IN THE ELECTRONIC PRO-FORMA ....................................... 139 TABLE 22 SCHOOLS AND SET-UPS FOR THE TEST-RETEST TRIAL.......................................................... 146 TABLE 23 FOCUS GROUP QUESTION GUIDE.......................................................................................... 150 TABLE 24 PERCENTAGES OF CORRECT ANSWERS FOR PART I OF EACH FORM OF THE NOST ............... 158 TABLE 25 EXPERTS’ RESPONSES TO EACH STATEMENT OF PART I OF THE NOST................................. 160 TABLE 26 PERCENTAGES OF UNANSWERED QUESTIONS AND QUESTIONS WITH MORE THAN ONE ANSWER
.................................................................................................................................................. 166 TABLE 27 PERCENTAGES OF RESPONSES FOR EACH QUESTION OF PART II OF THE NOST ACROSS
ADMINISTRATIONS OF THE R AND L TEST FORMS, N=~60 RESPONSES. (IN QUESTIONS 2 AND 4, THE
THIRD ANSWER OPTION IS A RELATIVIST ONE; IN QUESTION 3 IT IS AN EMPIRICIST ONE) ........... 170 TABLE 28 CONTINGENCY TABLES OF OBSERVED FREQUENCIES FOR QUESTION 2 OF THE R AND L TEST
FORMS. EACH CELL SHOWS THE NUMBER OF RESPONSES RECEIVED FOR EACH COMBINATION OF
7
VIEWS ACROSS TEST FORMS (BETWEEN PARENTHESES ARE INDICATED THE CORRESPONDING
FREQUENCIES) ........................................................................................................................... 172 TABLE 29 CONTINGENCY TABLES OF EXPECTED FREQUENCIES FOR QUESTION 2 OF THE R AND L TEST
FORMS. EACH CELL SHOWS THE CALCULATED NUMBER OF EXPECTED RESPONSES FOR EACH
COMBINATION OF VIEWS ACROSS TEST FORMS (BETWEEN PARENTHESES ARE INDICATED THE
CORRESPONDING FREQUENCIES)................................................................................................ 173 TABLE 30 OBSERVED AND EXPECTED FREQUENCIES OF AGREEMENT AND VALUES OF COHEN’S KAPPA
(Κ) FOR EACH OF THE QUESTIONS OF THE R AND L TEST FORMS................................................ 173 TABLE 31 EXPERTS' (N=9) AFFIRMATIVE RESPONSES TO THE PRO-FORMA QUESTIONS ABOUT THE
VALIDITY OF THE QUESTIONS OF THE NOST .............................................................................. 175 TABLE 32 EXPERTS' (N=9) AFFIRMATIVE RESPONSES TO THE PRO-FORMA QUESTIONS ABOUT THE
VALIDITY OF THE FRAMEWORK OF THE NOST ........................................................................... 176 TABLE 33 NUMBERS OF COMPLETED TESTS PER SCHOOL (N/A, NON-APPLICABLE)............................ 189 TABLE 34 PERCENTAGES OF CORRECTLY IDENTIFIED STATEMENTS .................................................... 191 TABLE 35 PEARSON'S CORRELATIONS COEFFICIENTS FOR SCORES TO PART I IN THE TEST-RETEST AND
THE PARALLEL FORMS TRIALS ................................................................................................... 194 TABLE 36 FREQUENCIES OF POPULAR, DESIRED AND RELATIVIST RESPONSES TO EACH QUESTION OF
PART II OF THE NOST. (LINE IN BOLD REPRESENTS THE DATA FROM THE G TEST FORM; BROKEN
LINE THE DATA FROM THE W FORM).......................................................................................... 195 TABLE 37 INDIVIDUAL STUDENTS’ OVERALL NOS PROFILES............................................................... 205 TABLE 38 CORRELATIONS BETWEEN SCORES ON PART I AND ON EVERY PART II QUESTION ............... 209 TABLE 39 PERCENTAGES OF STUDENTS THAT SCORE 4 OR 5 POINTS IN PART I AND SELECT A DESIRED
ANSWER OPTION IN PART II OF THE G FORM OF THE NOST (N=270).......................................... 210 TABLE 40 PERCENTAGES OF STUDENTS THAT SCORE 4 AND 5 POINTS IN PART I AND SELECT A DESIRED
ANSWER OPTION IN PART II OF THE W FORM OF THE NOST (N=171)......................................... 211 TABLE 41 PERCENTAGES OF RESPONSES FOR EACH QUESTION OF PART II OF THE NOST ACROSS BOTH
ADMINISTRATIONS OF THE G TEST FORM, N=49 RESPONSES. (IN QUESTIONS 2 AND 4, THE THIRD
ANSWER OPTION IS A RELATIVIST ONE; IN QUESTION 3 IT IS AN EMPIRICIST ONE)...................... 212 TABLE 42 PERCENTAGES OF CONSISTENT RESPONSES (POPULAR, DESIRED AND RELATIVIST) ACROSS
BOTH ADMINISTRATIONS OF THE G TEST FORM (N=49).............................................................. 213 TABLE 43 COHERENT AND CONSISTENT PROFILES OF THE NOS ACROSS CONTEXTS—TEST-RETEST TRIAL
(N=49)....................................................................................................................................... 213 TABLE 44 COHEN’S KAPPA FOR EACH OF THE QUESTIONS OF PART II OF THE NOST .......................... 214 TABLE 45 PERCENTAGES OF RESPONSES FOR EACH QUESTION OF PART II OF THE NOST ACROSS THE G
AND THE W TEST FORMS, N=169. (IN QUESTIONS 2 AND 4, THE THIRD ANSWER OPTION IS A
RELATIVIST ONE; IN QUESTION 3 IT IS AN EMPIRICIST ONE) ....................................................... 216 TABLE 46 PERCENTAGES OF CONSISTENT RESPONSES (POPULAR, DESIRED OR RELATIVIST) ACROSS THE
G AND THE W TEST FORMS (N=169) .......................................................................................... 217 TABLE 47 COHERENT AND CONTEXT-INDEPENDENT PROFILES OF THE NOS ACROSS CONTEXTS—
PARALLEL FORMS TRIAL (N=169 RESPONSES)............................................................................ 218

8
TABLE 48 COHEN’S KAPPA FOR EACH OF THE QUESTIONS OF PART II OF THE NOST. ......................... 219 TABLE 49 NUMBERS OF COMPLETED TESTS PER CLASS ....................................................................... 220 TABLE 50 PERCENTAGES OF CORRECTLY IDENTIFIED STATEMENTS. (ENGLISH PERCENTAGES ARE
SHOWN IN BRACKETS)................................................................................................................ 222 TABLE 51 INDIVIDUAL STUDENTS’ OVERALL NOS PROFILES............................................................... 224 TABLE 52 PERCENTAGES OF POPULAR, DESIRED AND RELATIVIST RESPONSES ACROSS EACH QUESTION
OF PART II OF THE NOST—ENGLAND VS. MEXICO. (THE LINE IN BOLD REPRESENTS THE DATA
FROM THE G TEST FORM; THE BROKEN LINE THE DATA FROM THE W FORM) ............................. 225 TABLE 53 CORRELATIONS BETWEEN SCORES TO PART I AND RESPONSE SELECTED IN PART II OF THE
NOST. (ENGLISH CORRELATION COEFFICIENTS ARE SHOWN IN PARENTHESIS) .......................... 226 TABLE 54 PERCENTAGES OF MEXICAN STUDENTS THAT SCORE 4 TO 5 POINTS IN PART I AND SELECT A
DESIRED RESPONSE IN PART II OF THE G FORM OF THE NOST (N=90). (ENGLISH PERCENTAGES
ARE SHOWN IN PARENTHESIS).................................................................................................... 226 TABLE 55 PERCENTAGES OF MEXICAN STUDENTS THAT SCORE 4 TO 5 POINTS IN PART I AND SELECT A
DESIRED RESPONSE IN PART II OF THE W FORM OF THE NOST (N=95). (ENGLISH PERCENTAGES
ARE SHOWN IN PARENTHESIS).................................................................................................... 227 TABLE 56 MOST AND LEAST SELECTED OPTIONS IN THE FOCUS GROUPS AND IN ADMINISTRATIONS
(PARALLEL FORMS AND TEST-RETEST TRIALS) OF THE NOST (SAMPLE SIZES ARE SHOWN IN
BRACKETS) ................................................................................................................................ 272 TABLE 57 STUDENTS’ RESPONSES TO QUESTIONS 2 TO 7 OF THE NOST; P, POPULAR; E, EMPIRICIST; R,
RELATIVIST; D, DESIRED. THE FORWARD SLASH (/) INDICATES STUDENTS THAT DID NOT PROVIDE
AN ANSWER ............................................................................................................................... 276

9
LIST OF FIGURES FIGURE 1 SAMPLE QUESTION FROM THE TOUS (COOLEY AND KLOPFER, 1961)................................... 56 FIGURE 2 SAMPLE CONTEXT AND QUESTION OF THE COST (COTHAM AND SMITH, 1981) .................... 58 FIGURE 3 SAMPLE QUESTION FROM KOULAIDIS’S AND OGBORN’S (1989) PHILOSOPHY OF SCIENCE
QUESTIONNAIRE .......................................................................................................................... 60 FIGURE 4 SAMPLE QUESTION FROM THE VOSTS (AIKENHEAD ET AL., 1987) ....................................... 64 FIGURE 5 SAMPLE QUESTION FROM THE COCTS (VAZQUEZ-ALONSO ET AL., 2006)............................ 69 FIGURE 6 SAMPLE QUESTION FROM VNOS-A (LEDERMAN AND O’ MALLEY, 1990) ............................ 71 FIGURE 7 SAMPLE QUESTION FROM THE VNOS-B (LEDERMAN ET AL., 1998) ...................................... 75 FIGURE 8 SAMPLE QUESTION FROM THE VNOS-C (LEDERMAN AND ABD-EL-KHALICK, 2000A) ......... 75 FIGURE 9 SAMPLE QUESTION FROM THE VNOS-D (LEDERMAN AND KHISFE, 2002) ............................ 76 FIGURE 10 SAMPLE QUESTION FROM THE VNOS-E (LEDERMAN AND KO, 2004) ................................. 76 FIGURE 11 SAMPLE “CRITICAL INCIDENT” (NOTT AND WELLINGTON, 1998) ........................................ 77 FIGURE 12 SAMPLE QUESTION FROM SUSSI (LIANG ET AL., 2008)....................................................... 79 FIGURE 13 SAMPLE QUESTION FROM THE VES QUESTIONNAIRE (TSAI AND LIU, 2005) ........................ 80 FIGURE 14 SAMPLE QUESTION FROM VOSE (CHEN, 2006) ................................................................... 82 FIGURE 15 SAMPLE QUESTION FROM VASM (IBRAHIM ET AL., 2009)................................................... 84 FIGURE 16 EXAMPLES OF (A) QUESTION 1 (PART I OF THE NOST) THAT TARGETS STUDENTS’ ABILITY
TO DISCRIMINATE BETWEEN DATA AND EXPLANATIONS AND (B) QUESTION 3 (PART II OF THE
NOST) THAT TARGETS STUDENTS’ UNDERSTANDING OF ONE ASPECT OF THE NOS...................... 88 FIGURE 17 GIERE ET AL.’S (2006) MODEL OF SCIENTIFIC REASONING ................................................. 101 FIGURE 18 RELATIONSHIPS BETWEEN THE “DESIRED” ASPECTS OF THE NOS CONTENT FRAMEWORK . 108 FIGURE 19 THE STORY OF GOLDBERGER’S DISCOVERY OF THE CAUSE AND CURE OF PELLAGRA, AS
PRESENTED IN ONE OF THE SIX FORMS OF THE NOST................................................................. 119 FIGURE 20 QUESTION 2 FROM THE PILOT VERSION OF THE TEST—THE THEORY-LADENNESS OF
OBSERVATION............................................................................................................................ 123 FIGURE 21 ANSWER OPTIONS FOR QUESTION 2 OF THE NOST ............................................................. 124 FIGURE 22 QUESTION 1 FROM THE PILOT VERSION OF THE TEST—DATA VS. INFERENCES .................. 128 FIGURE 23 DIAGRAM OF THE PILOT AND MAIN STUDIES, AND SUMMARY OF THE RESEARCH QUESTIONS
.................................................................................................................................................. 141 FIGURE 24 CORRESPONDENCES BETWEEN OBSERVABLE CONSISTENCY OF RESPONSES AND INFERRED
VIEWS, OR UNDERSTANDING, OF THE NOS................................................................................. 144 FIGURE 25 MEAN SCORES FOR EACH OF THE SIX FORMS OF THE NOST. WHITE BARS STAND FOR YELLOW
BOOKLETS; GREY BARS FOR GREEN BOOKLETS .......................................................................... 157 FIGURE 26 OVERALL PERCENTAGES OF RESPONSES PER QUESTION IN THE YELLOW (N=183) AND GREEN
(N=177) BOOKLETS.................................................................................................................... 164 FIGURE 27 EXPERTS’ BEST OR “DESIRED” ANSWER OPTIONS FOR EACH QUESTION OF THE NOST
(DESIRED VIEWS ARE SHOWN IN GREY; ALTERNATIVE VIEWS ARE SHOWN IN WHITE) ................ 177 FIGURE 28 MEAN SCORES FOR PART I IN THE G AND W TEST FORMS OF THE NOST ........................... 190 FIGURE 29 MEAN SCORES FOR PART I OF THE G AND W TEST FORMS—ENGLAND VS. MEXICO.......... 221
10
ACKNOWLEDGEMENTS
The present work received support from Consejo Nacional de Ciencia y Tecnología
(CONACyT), Scholarship No. 167248, and from Dirección General de Relaciones
Internacionales, Secretaría de Educación Pública (DGIRI-SEP), Mexico.
Chapter 1. Introduction
11
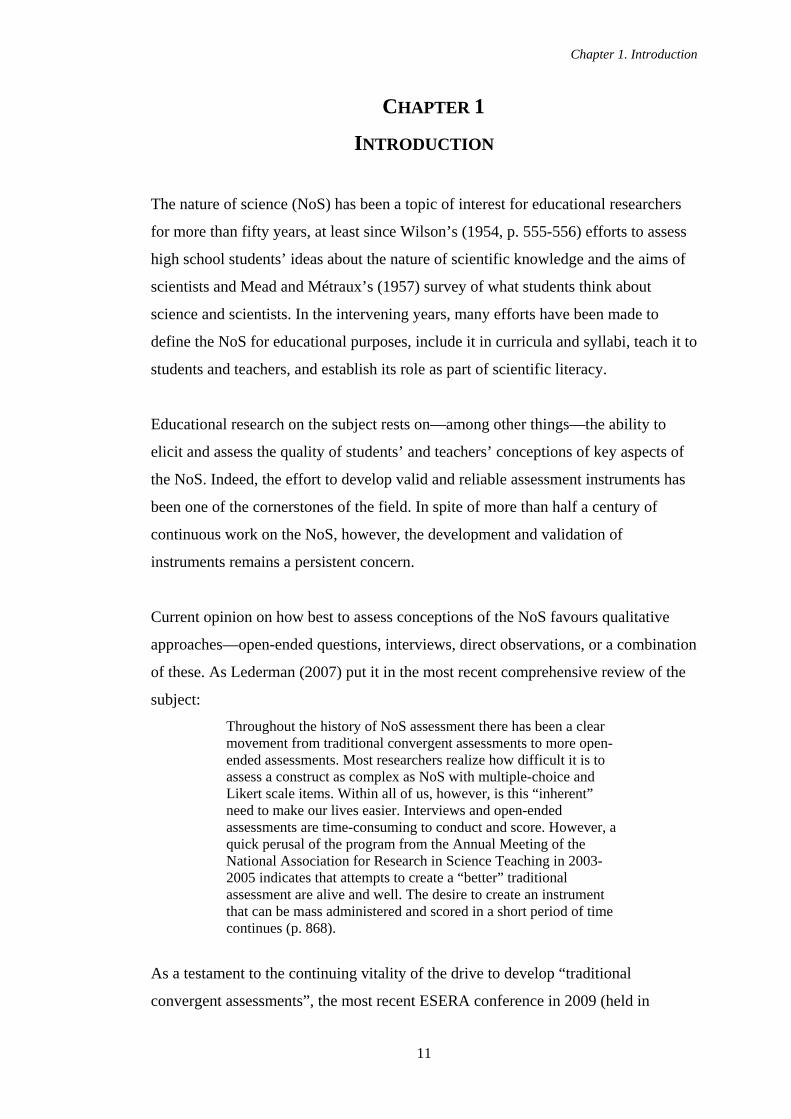
1. CHAPTER 1
INTRODUCTION
The nature of science (NoS) has been a topic of interest for educational researchers
for more than fifty years, at least since Wilson’s (1954, p. 555-556) efforts to assess
high school students’ ideas about the nature of scientific knowledge and the aims of
scientists and Mead and Métraux’s (1957) survey of what students think about
science and scientists. In the intervening years, many efforts have been made to
define the NoS for educational purposes, include it in curricula and syllabi, teach it to
students and teachers, and establish its role as part of scientific literacy.
Educational research on the subject rests on—among other things—the ability to
elicit and assess the quality of students’ and teachers’ conceptions of key aspects of
the NoS. Indeed, the effort to develop valid and reliable assessment instruments has
been one of the cornerstones of the field. In spite of more than half a century of
continuous work on the NoS, however, the development and validation of
instruments remains a persistent concern.
Current opinion on how best to assess conceptions of the NoS favours qualitative
approaches—open-ended questions, interviews, direct observations, or a combination
of these. As Lederman (2007) put it in the most recent comprehensive review of the
subject:
Throughout the history of NoS assessment there has been a clear movement from traditional convergent assessments to more open-ended assessments. Most researchers realize how difficult it is to assess a construct as complex as NoS with multiple-choice and Likert scale items. Within all of us, however, is this “inherent” need to make our lives easier. Interviews and open-ended assessments are time-consuming to conduct and score. However, a quick perusal of the program from the Annual Meeting of the National Association for Research in Science Teaching in 2003-2005 indicates that attempts to create a “better” traditional assessment are alive and well. The desire to create an instrument that can be mass administered and scored in a short period of time continues (p. 868).
As a testament to the continuing vitality of the drive to develop “traditional
convergent assessments”, the most recent ESERA conference in 2009 (held in
Chapter 1. Introduction
12
Istanbul) included in its programme at least four independent efforts to develop and
validate just these kinds of instruments.
Reducing the aims of developing fixed-response instruments to the fulfilment of an
“inherent need to make our lives easier” underestimates not only the assessment
needs of national and international initiatives that seek to incorporate the NoS into
curricula, but also the plight of science teachers who have to implement, and assess,
such reforms. It also minimises the statistical value of data produced by large-scale
assessments, especially given that, as Lederman (2007) himself recognised,
at this point, the arguments [in support of an understanding of the NoS as an instructional outcome] are primarily intuitive, with little empirical support. Much like the general goal of scientific literacy, until we reach a critical mass of individuals who posses adequate understandings of the NoS, we have no way of knowing whether achievement of the goal has accomplished what has been assumed (p. 832).
But this begs the question. How will we know when a critical mass of individuals
with adequate understandings of the NoS has been reached? And, no less important,
how will we know if their understandings of the NoS are adequate?
A number of educational roles have been ascribed to the NoS. It has been deemed
relevant to activities such as engaging with technological products in everyday
contexts, making informed decisions about socioscientific issues, appreciating the
cultural merits of science, assimilating the moral norms of the scientific community,
and facilitating the learning of science content (for more details, see Thomas and
Durant, 1987; Matthews, 1994; Driver et al., 1996). In spite of this, and in light of a
number of criticisms embodied in Lederman’s remarks, the case for including the
NoS in curricula worldwide and allocating resources to its teaching would certainly
be advanced by a robust and wide-ranging body of empirical evidence about its
benefits.
Besides providing empirical support with which to justify research on, and advocacy
of, the NoS as an educational outcome, future progress in the field presupposes the
ability to obtain valid and reliable data on students’ and teachers’ conceptions. In his
Chapter 1. Introduction
13
review of the literature, Lederman (2007) lists a number of future directions
suggested by the current state of scholarship on the field. Of these, at least six
evidently call for means to assess conceptions of the NoS:
how do teachers’ conceptions of NoS develop over time?
what is the influence of one’s worldview on conceptions of NoS?
what is the relative effectiveness of the various interventions designed to
improve teachers’ and students’ conceptions?
is the NoS learned better by students and teachers if it is embedded within
traditional subject matter or as a separate “pull-out” topic?
how are teachers’ conceptions of the NoS affected during translation into
classroom practice? and
are the NoS and scientific inquiry universal, or are conceptions influenced by
the particular scientific discipline? (pp. 869-871).
Arguing in favour of fixed-response instruments in no way intends to ignore or
underestimate the substantial criticisms that have been directed against them (for
example, by Aikenhead, 1988; Lederman, 1992), but rather to call attention to the
important role they are capable of fulfilling alongside other forms of assessment.
Apart from the needs of the educational community discussed above, the present
study was motivated in a more immediate manner by the recent inclusion of the NoS
in Mexico’s secondary science curriculum (Ministry of Public Education, 2006),
which states that instruction must “encourage students to reflect upon the nature of
science and technology, with an emphasis on its validity and tentative character” (p.
42).
It is against this background that the development of the Nature of Science Test
(NoST) took place. One of the main aims of the present work was to design and
validate an instrument suitable for the mass examination of 16-year old students’
views of the NoS that also addressed some of the most pointed criticisms levelled at
previous assessment instruments, namely, their questionable content validity, overt
reliance on unitary scores rather than subscales, abstract questioning style, and
assumption of “immaculate perception” (Munby, 1982)—i.e., mistakenly believing
Chapter 1. Introduction
14
that students, teachers and/or researchers attach the same meanings to words,
concepts, and constructs.
In this regard, the main design features of the NoST are its
exclusive focus on epistemological aspects of the NoS—not on enquiry skills
and/or attitudes to science;
built-in subscales based on a framework of plausible alternative ideas of the
NoS;
context-based, multiple-choice questions;
jargon-free, simple text—as validated through consultation with 16-year old
students; and
use of the “concept cartoon” format to facilitate students engagement and
understanding of the test.
Following the development phase, the study aimed (a) to determine whether the
NoST is capable of eliciting information, in a rapid and uncomplicated manner,
about students’ views of the NoS in a form capable of informing practice and (b) to
assess the validity and reliability of the information elicited.
A review of the literature on the subject of the NoS and its assessment is presented in
the next two chapters of this thesis. Chapter 2 provides an account of the historical
development of ideas about the NoS, with an emphasis on those key ideas that have
driven philosophical thinking about science and, for this reason, merit
consideration—albeit in simplified form—by students. This chapter ends with a brief
consideration of how the NoS has been portrayed in an educational milieu. Chapter 3
then provides a detailed account, organised around changing psychometric trends, of
some instruments that have been developed in the past to explore and evaluate
students’ views of the NoS.
Chapter 4 presents the rationale underlying the development of the NoST. Among
the topics covered by this chapter are the sources consulted (scientific literacy
definitions, curriculum reform projects, academic opinion, and empirical research) to
come up with the content framework of the NoST and the NoS profiles, the
Chapter 1. Introduction
15
questioning style, the use of contexts, the complexity of the language, and the design
of the questions.
Chapter 5 details the research questions of—and the methods used to conduct and
analyse—the pilot and main studies, respectively. The pilot study was mainly
concerned with evaluating the adequacy of the NoST and obtaining feedback with
which to improve its validity and reliability. The main study then aimed to explore
students’ views of the NoS, corroborate their validity and reliability, compare the
views of English and Mexican students, and ascertain the suitability of the NoST as
an instrument capable of eliciting information from large numbers of students.
Chapters 6, 7, and 8 present and discuss the results of both the pilot study and the
main study, with a brief discussion of how the findings from the first influenced the
planning and execution of the second. In the case of the pilot study, the main findings
are concerned with the consistency of students’ responses across different versions of
the NoST and the opinion of an expert panel regarding its validity and adequacy.
In the case of the main study, it is worth mentioning that both sources of data—the
written tests and the focus group discussions—were used to explore students’ views
of the NoS and corroborate the validity and reliability of these views, with the
ultimate aim of evaluating the performance of the NoST as a fixed-response
instrument suitable for assessing large groups of students relatively quickly. Also, in
both Chapters 7 and 8 the performance of English and Mexican students is
compared.
Finally, Chapter 9 reviews the main conclusions of the study, with an emphasis on
addressing the research questions; expands on the implications of the study for
teachers, curriculum planners, and researchers; discusses the limitations of the study;
and suggests some directions for future research. The Appendices show samples of
the tests used in the pilot and the main studies, both in English and Spanish, together
with supplementary materials like consent forms and instructions for participating
experts and teachers.
Chapter 2. The nature of science
16
2. CHAPTER 2
LITERATURE REVIEW: THE NATURE OF SCIENCE
This chapter provides a historical account of the development of ideas about the
nature of science (NoS) during the twentieth century, both from a general,
philosophical point of view and from a narrower, educational one. It aims to sketch,
first, how philosophers, historians, and sociologists have arrived at a progressively
richer image of science. It will then focus on how the NoS has been conceptualised
for educational purposes, and the rationale that underpins its inclusion in curricula as
an educational objective. The relevance of these topics will come into sharper relief
when details of the design and development of the Nature of Science Test (NoST)
are discussed in detail in Chapter 4.
2.1. WHAT IS THE NATURE OF SCIENCE? The following paragraphs about the history of ideas in the philosophy of science are
meant to help flesh out the target of the NoST. In this sense, this chapter will attempt
to present a picture of the nature of science that could reasonably be considered
adequate and nuanced, in light of developments in scholarship on the subject. The
historical narrative, besides illustrating the maturation, contrast, and interrelatedness
of ideas, has the benefit of presenting conceptions that have been to some degree
superseded and, thus, could be thought of as less developed or incomplete
alternatives to current understandings about science. The following account intends,
then, to provide a list of the sources of the ideas that found their way into the NoST.
Elucidating the nature of science—“what science is, how it works, and what makes
science different from other ways of investigating the world” (Godfrey-Smith, 2003,
p. 1)—is a task that has engaged the efforts of philosophers, historians, sociologists,
psychologists, and scientists. These efforts can be traced back to Plato’s conception
of knowledge as justified belief and Aristotle’s ideas on the role of the senses in the
production of knowledge (Godfrey-Smith, 2003; Shuttleworth, 2009). Indeed, as
Cover and Curd (1998) put it, “debate about the nature of science—about its scope,
methods, and aims—is as old as science itself” (p. 1), whether one is inclined to find
Chapter 2. The nature of science
17
the origins of modern science in Ancient Greece or in the work carried out during the
sixteenth and seventeenth centuries by natural philosophers like Galileo and Boyle.
It is worth saying at the outset that defining science has proved to be an extremely
challenging task. A good deal has been accomplished in this regard, resulting in an
overall picture of science that, at least compared with previous ones, such as the
empiricism of the eighteenth century, is widely seen as a better approximation to
actual scientific practice while accounting for much of what makes scientific
knowledge reliable and different from other kinds. However, it needs to be
acknowledged that there is “no general account of science and scientific method to
be had that applies to all sciences at all historical stages in their development”
(Chalmers, 1999, p. 247). Or, as Driver et al. (1996) aptly put it:
Philosophers of science have adopted—and continue to adopt—a range of positions on the major questions and issues about science and scientific knowledge. And it is problematic, at best, to suggest that such views “progress” or “approach the truth”. […] The ideas of today’s philosophers of science do not overturn, or subsume, those of earlier writers. Indeed, more recent studies of scientific practice have tended to emphasize the variety, and local contingency, of scientific practices, rather than painting a picture of a general “method” or “approach” (pp. 24-25).
In light of the overwhelming variety and complexity of scholarship on the NoS, its
treatment in this section will be deliberately limited in scope, both thematically and
temporally. It will focus on epistemological developments that took place, for the
most part, throughout the twentieth century, with an emphasis on the milestones and
turning points in thinking about the NoS.
The focus on the epistemology of science is due to its relevance for science
education and its accessibility to students, especially compared with other, more
abstract areas of philosophy such as metaphysics. In no way does this constitute an
endorsement of the epistemological over the metaphysical dimension of scientific
knowledge. However, since epistemology is mainly concerned with accounting for
the production and justification of knowledge, it has a strong influence on
educational initiatives that strive to impart a sense of how science produces
knowledge and why it is trustworthy.
Chapter 2. The nature of science
18
Centring attention mostly on insights from the last century, on the other hand, is a
response to the vigorous and systematic enquiry into the NoS that began in the first
decades of the twentieth century, in large part through the work of the group of
philosophers that formed the Vienna Circle after World War I. Their work
recapitulated many previous philosophical ideas and debates about knowledge (for
instance, between the rationalism and empiricism of the seventeenth and eighteenth
centuries) and paved the way for new and bold insights.
The following account is based on more comprehensive and detailed ones provided
by philosophers and/or scientists as overviews of the discipline (see, for example,
Harré, 1972; Abimbola, 1983; Laudan, 1990; Kosso, 1992; Wolpert, 1993;
Matthews, 1994; Giere, 1997; Carey, 1998; Chalmers, 1999; Rosenberg, 2000;
Okasha, 2002; Godfrey-Smith, 2003). For the purposes of the present account, the
history of scholarship on the nature of science during the last century will be
organised around six more or less clearly defined stages, or strands, of thought: (a)
logical positivism, (b) falsificationism, (c) Kuhnian philosophy of science, (d) post-
Kuhnian philosophy of science, (e) the Strong Programme in the sociology of
science, and (f) more recent developments, namely, realism, Bayesianism, and new
experimentalism.
In very broad strokes, thinking about the NoS has ranged from the belief in the pre-
eminent role of experience as the source of true knowledge to the belief that
knowledge results from the activities of social networks of scientists that determine
which claims constitute genuine scientific knowledge (Godfrey-Smith, 2003). Or
from the positivist view that posits that empirical knowledge is restricted to sense
experience and theories are abstract structures that may or may not represent the
world, to the realist view that theories, even though imagined by scientists and
positing objects beyond experience, do constitute a form of empirical knowledge
(Harré, 1972). It is not uncommon for adherents of these views to be critical of each
other, although there have been efforts to come up with accounts meshing differing
viewpoints (for an overview of these debates, see Laudan, 1990).
Chapter 2. The nature of science
19
2.1.1. LOGICAL POSITIVISM
Logical positivism (later known as “logical empiricism”) is an approach to
describing the NoS built upon the empiricist tradition of the seventeenth, eighteenth,
and nineteenth centuries (for a classic account of logical positivist ideas, see Ayer,
1936). Empiricism maintains, in essence, that sense experience is the source of
knowledge, since experience is all the mind can come to know with any certainty. In
addition, claims made about the world need to be tested—by carrying out
observations—against experience. Only those that match the results of observation
merit trust. In the light of the pre-eminent and decisive role accorded to experience,
logical positivism tends to be somewhat sceptical about the possibility of acquiring
true knowledge about unobservable entities or processes that scientists nevertheless
make use of (as quarks or the Big Bang in today’s physics).
Together with its empiricist orientation, logical positivism advocated reason—
particularly deductive logic—as the means to extract knowledge out of sense
experience and to justify it. One of the stated aims of the logical positivist tradition
was to provide a logic-driven account of scientific knowledge, i.e., elucidate the
logical relations that exist among claims made by scientific laws and theories, as well
as the relations between these kinds of claims and empirical ones resulting from
observation. The almost exclusive focus on logic would prove, in time, detrimental to
the logical positivist programme, because it neglected the historical, sociological, and
psychological dimensions of science and scientists.
According to the logical positivists, the limit imposed by experience meant that
science should, by applying the principles of logic, aim only to record, generalise,
and predict the patterns that govern experience. Science should then test these
generalisations and predictions against experience to ascertain their truthfulness.
Their idea of what constitutes an explanation followed similar lines: explaining
something means demonstrating that it is the logical consequence of a
generalisation—such as law—and a set of specific circumstances.
One of the main challenges faced by this view was the “problem of induction”, as
famously formulated by the empiricist philosopher David Hume (Hume, 1739/1978).
Developing an inductive logic that could produce, and justify, knowledge was one of
Chapter 2. The nature of science
20
the longstanding—and largely unfulfilled—projects of logical positivism. It was a
natural consequence of believing that experience is the source of knowledge:
according to the logical empiricists, scientists had to dedicate themselves to amassing
large amounts of observations and, from them, draw justified conclusions. However,
what are the grounds for believing that the patterns of behaviour observed in the past
will continue to happen in the future? Are scientists justified in inferring
generalisations out of observations made in the past, however many there may be?
How can past observations be used to predict future behaviour? Those are the
questions posed by the problem of induction.
Hume’s answer to these questions was that there is no logical reason capable of
guaranteeing the validity of an induction. He criticised, on the basis of it being a
tautology, the argument that claimed that induction works because it has worked
many times in the past, since it attempts to prove the validity of inductive logic with
an induction. After much work to solve this puzzle, it became evident that no number
of individual observations, no matter how large, could verify the truthfulness of a
generalisation. As a matter of fact, in much scientific research scientists work with a
rather small number of observations (technical difficulty and expense play a
considerable role in this) from which to come up with, or support, generalisations.
Furthermore, deriving generalisations from data does not cover completely the main
aims of science, one of which is coming up with explanations for why things happen
as they do—what are the unobservable causes of observable phenomena?
The second main problem was the challenge presented by the Duhem-Quine thesis
(Quine, 1953), which attacked logical positivism’s view of testing. Essentially, what
the Duhem-Quine thesis asserts is that a given hypothesis cannot be tested in
isolation, as the logical positivists implied: since predictions are necessarily deduced
from more than one premise, testing always involves a set of interrelated claims and
assumptions (for instance, about the validity of the background theories and/or laws,
the way equipments work, or what the ideal experimental conditions amount to).
The immediate consequence of the Duhem-Quine thesis for logical positivism is that
it makes it difficult (if not impossible) to pinpoint which claim (i.e., the hypothesis or
any of its accompanying assumptions) is responsible for a failed prediction. And if
Chapter 2. The nature of science
21
the faulty assumption cannot be located with certainty, deciding whether the
hypothesis being tested is likely to be false turns out to be a complicated matter.
Experience turns out then not to be the ultimate arbiter of truthfulness it was
supposed to be: a failed prediction could nevertheless turn out to be correct in the
future or, vice versa, a successful prediction could match an observation by accident.
A third criticism of logical positivism concerned scientists’ reliance on unobservable
objects or processes. Logical positivists believed that scientific knowledge should,
ultimately, refer to what is observable. However, throughout history, scientists had
come up with abstract, unobservable, or counter-intuitive objects and processes not
only to explain why and how things happened but also to successfully predict the
future behaviour of phenomena. Logical positivists discouraged this practice, arguing
that it was impossible to subject these constructs to a direct test against experience.
Unfortunately for them, exemplary episodes in the history of science, such as
Copernicus’ heliocentric model, Galileo’s pendulum laws, and Einstein’s theories of
relativity, posited unobservable objects or processes that contradicted sense
experience and, thus, were impossible to test directly.
For the logical positivists, entities or processes such as “atoms”, “genes”, and
“gravity” were just abstract descriptions of observable phenomena—since, for them,
there was no way of checking if they represent real objects behind or beneath
experience. Actual scientific practice is at odds with this strongly-held belief:
scientists usually talk of, and more importantly treat, unobservable concepts as if
they were real. In fact, unobservable entities at one time have ended up becoming
observable (like microbes). Furthermore, exhaustive and diverse testing, notable
predictive successes, and an unlikely coherency among not just individual concepts
but whole scientific disciplines appeared to be strong reasons in support of the reality
of entities beyond the observable.
Logical positivist philosophers tried to address these criticisms, with varying degrees
of success. They continued to make refinements to their thinking, for example, by
acknowledging that communicable statements of sensations—rather than individuals’
private sensations—are the actual touchstone of scientific knowledge. Nevertheless,
Chapter 2. The nature of science
22
in the end, the decline of logical positivism proved to be inevitable, its contribution
being that it allowed more fruitful attempts to understand science to flourish.
The weaknesses of logical positivism were exploited by successive philosophers,
historians, and/or sociologists to buttress their own views. The difficulties associated
with verifying a claim inspired falsificationism; blindness to the historical and
sociological dimensions of science spurred Kuhn’s account of science and the Strong
Programme in the sociology of science; post-Kuhnian philosophies seized upon the
Duhem-Quine thesis to formulate the ideas behind “research traditions” and
“research programmes”; the failure to resolve the problem of induction has been
addressed, more successfully, by Bayesianism; the advocacy of logic as the basis of
the scientific activity was undermined by Feyerabend’s anarchic ideas on method;
and the existence of unobservable entities was taken up, and developed, by realist
philosophers.
2.1.2. FALSIFICATIONISM
Falsificationism, as first formulated by Karl Popper (Popper, 1953), is a kind of
empiricism and, as such, one of its main challenges was addressing the problem of
induction. Its central claim is that “a hypothesis is scientific if and only if it has the
potential to be refuted by some possible observation” (Godfrey-Smith, 2003, p. 58).
In other words, to be considered scientific a claim cannot be compatible with all
possible observations—there must be some capable of proving it false (that is, of
falsifying it). This core falsificationist belief represents the main point of departure
from logical positivist ideas about testing.
Popper held that it was virtually impossible to verify or confirm a claim (i.e.,
determine if it is true, or even likely to be true), even if it had managed to pass a lot
of empirical tests and fitted all available observations. It does not matter if a given
theory makes a huge number of predictions that turn out to be true: the possibility
always remains that an unforeseen piece of evidence against the theory could come
to light or, alternatively, a prediction made by the theory could fail to occur. In short,
the only thing that can produce certain knowledge is demonstrating that a claim is
false and, to do this, just one instance that falsifies it is needed. In this way, Popper
Chapter 2. The nature of science
23
bypassed Hume’s problem of induction—a problem that had proven insoluble for
logical positivism.
Another way in which falsificationism improved upon logical positivism was in
proposing that scientists should try to come up with bold, creative, imaginative,
and/or risky ideas to test rigorously and attempt to falsify. Coming up with these
conjectures is not a matter of following a prescribed logic, either deductive or
inductive, as the logical positivists advocated, but of exercising creativity for
explanatory ends. According to this view, science is a two-step process, the first of
which consists of coming up with theories about how the world works and the
second of testing and criticising them.
Unfortunately for falsificationism, Popper failed to give due consideration to the
social practices within science: he believed that individual scientists should be open-
minded enough to give due consideration to new ideas and to what the empirical
evidence implied, while at the same time being critical and rigorous enough to
subject these ideas to fair tests and accept falsifying results. In reality, scientists can
be as closed-minded as non-scientists and are rarely rigorously critical of their own
ideas. However, other scientists, through public debates and/or published criticism,
fulfil this necessary balancing role.
Falsificationism also advocates an extreme form of fallibilism, the idea that absolute
certainty in scientific knowledge is unwarranted: it is always possible that a new
discovery or insight will prove a theory wrong. Fallibilism has the telling advantage
of describing accurately the historical record of most (if not all) scientific theories:
all theories are subject to change—and have changed—in the light of newly
discovered evidence. Famous examples are the falsification of Newtonian mechanics
by relativity, classical electrodynamics by quantum theory, and the theory of
phlogiston by the oxygen theory of combustion.
Controversially, the extreme fallibilism advocated by Popper not only denied
absolute certainty, it also rejected that there is reason to believe that the likelihood of
a claim or theory being true increases as it passes more and more tests—all
knowledge is, then, equally uncertain until proven false. The apparent successes of
Chapter 2. The nature of science
24
theories should be judged as tentative at best. However, as will be discussed later,
there are good reasons to believe that a claim that has survived a number of tests is
more likely to be true than a claim that has not been tested at all or that has been
found in conflict with the evidence.
Even though falsificationism addresses the difficulty posed by the argument that
induction cannot verify a claim about the world, it nevertheless remains vulnerable to
the Duhem-Quine thesis. Falsifying evidence—like verifying evidence—cannot be
conclusive: it could always be the case that another claim, different from the
hypothesis being tested but part of the network of background assumptions, theories,
and laws, could be responsible for the failure to pass a test.
Another drawback of the falsificationist view is that it seems not to match closely to
actual scientific practice. It is quite common for scientists to keep believing in, and
working on developing, a theory in the face of apparently falsifying data. As a
famous example, Galileo refused to acknowledge the truth of the Aristotelian
account of motion even though his own failed to describe accurately the actual
motion of pendulums, cannonballs, and assorted falling objects (for a fuller account,
see Matthews, 1994, Ch 6).
In both the insights of and the objections against falsificationism lay the seeds of
post-falsificationist accounts of science, such as Kuhn’s ideas about the role of
paradigms and revolutionary change in science, Lakatos’s ideas about the
preservation of core scientific claims in the face of falsification, and Feyerabend’s
criticism of the scientific method.
2.1.3. KUHNIAN PHILOSOPHY OF SCIENCE
Thomas Kuhn’s (Kuhn, 1962) ideas about the NoS represent a sharp break with those
of logical positivism and falsificationism. For one thing, Kuhn stopped thinking
about science at the level of individual claims and broadened the focus to include
whole sets of interrelated claims, assumptions, and beliefs. Furthermore, he
downplayed the role of evidence and reason in scientific decisions, bringing to the
fore the social dynamics and structures within scientific communities. No less
Chapter 2. The nature of science
25
important, Kuhn paid close attention to the historical development of scientific
disciplines.
One of Kuhn’s novel ideas was applying the idea of a “paradigm” (traditionally
understood as an example of something) to science. In its broadest sense, a Kuhnian
paradigm is a worldview shared by a group of scientists that helps to guide their
work, defines what can be observed, which kinds of questions can be asked, which
are the proper answers to them, how to conduct research, and how to interpret
observations. Kuhn himself was not initially clear on the meaning of paradigms, but
they were evidently not intended as synonyms for “theories”.
Essentially, paradigms have two main components: a set of assumptions that
commands consensus among scientists and a set of “exemplars” of how to solve—
through applying the shared assumptions—problems in a particular scientific
discipline. In their turn, these shared assumptions comprise a range of ideas such as
scientists’ aims, values, and habits; methodological assumptions for collecting and
analysing data; knowledge claims about the world and rules for assessing their
worth; directions for applying laws and theories to real world scenarios; and
metaphysical principles.
According to Kuhn, the overall development of science followed a process that starts
with a disorganised and unfocused pre-scientific stage that, as observations
accumulate and order is imposed, reaches a stage of so-called “normal science”—i.e.,
when a paradigm becomes established. Scientists then labour to extend and refine the
paradigm by proposing conjectures and testing them, like Popper proposed.
However, in the process, they make new discoveries that do not fit the paradigm and,
try as they may, resist being assimilated into it. According to falsificationism, the
proper response to these anomalous findings would be to abandon the falsified
claims and restructure the paradigm accordingly. However, according to Kuhn,
scientists should keep (and do keep) trying to accommodate these anomalies to the
paradigm. But if anomalies keep accumulating, their sheer number and/or
significance precipitate a state of crisis called “a scientific revolution”.
Chapter 2. The nature of science
26
During revolutionary science the rules and assumptions that held the paradigm
together break down and some scientists stop work on the paradigm. Instead, they
dedicate themselves to putting together new paradigms capable of assimilating the
anomalies. Scientists migrate to the paradigm that best explains away the anomalies
until the old paradigm is abandoned completely. The process then starts anew: the
new paradigm will tend to accumulate previously unforeseen anomalies, degenerate,
and be replaced by a better, more fruitful paradigm. Classic examples of scientific
revolutions cited by Kuhn were the shift from Ptolemaic to Copernican astronomy,
Aristotelian to Galilean mechanics, Newtonian to Einsteinian physics, and
phlogiston-based to oxygen-based combustion.
One of Kuhn’s main criticisms of empiricism and falsificationism centred on their
belief that scientists must be open to whatever the results of empirical testing turn out
to be, especially if they falsify a valued claim. Kuhn countered that, during periods of
normal science, scientists rarely (if ever) exhibit that kind of openness—scientists
tend to hold on to those ideas that have served them well in the past. Indeed, sticking
to the paradigm in the face of contradictory evidence can be a sensible and
productive attitude, since the increased effort to resolve these inconsistencies makes
a resolution more likely.
As a consequence of his ideas, Kuhn ended up undermining logical positivist claims
to rationality and progress. However, Kuhn acknowledged that, in spite of the closed-
mindedness of normal scientists, they do share standards of rationality, justification,
and progress that assist them in evaluating the adequacy of a solution to a problem—
or puzzle, as he called them. These standards allow scientists to make rational
decisions based on the evidence. So, within normal periods scientists’ closed-
mindedness and biases are balanced by the results of testing. However, across
paradigms things change: standards no longer bind scientists, rationality and progress
are no longer evident, and it is even difficult to compare scientists’ solutions to
problems. It is as if, as Kuhn claimed, scientists no longer spoke the same language
or altogether lived in different worlds.
One of Kuhn’s boldest claims was that the success of science (i.e., its effectiveness in
describing and predicting the behaviour of natural phenomena) depends on features
Chapter 2. The nature of science
27
that go against highly-regarded scientific qualities such as rationality and open-
mindedness. The efficacy of normal science depends on a concerted and cooperative
effort—involving a large number of scientists—to deepen and extend the
applicability of the paradigm in the face of falsification. To achieve these high levels
of cooperation scientists have to agree on the fundamental assumptions under which
they labour; otherwise they would spend most of their time and effort debating,
questioning, and deciding upon the best set of assumptions (which is what happens in
pre-scientific and revolutionary stages). In-depth debate, criticism, and dissent are, if
not closed off, unwelcome.
In essence, Kuhn’s overall view of scientific progress is one where scientists work
dogmatically and in concert to exhaust the explanatory potential of a paradigm, force
its breakdown, and usher in a new paradigm. The unpleasant consequence of such a
view—at least for empiricist aspirations—is that scientific progress is limited to
periods of normal science, outside of which there is no way (since standards of
justification are not shared across paradigms during revolutions) to decide rationally
if choosing a new paradigm represents genuine progress. Regarding this issue, the
contrast with falsificationism is stark: Popper saw closed-mindedness as a bad thing
for science; Kuhn saw it not only as a good thing, but as an essential one.
Worryingly for empiricism in general, decisions about whether to abandon a
paradigm, once empirical evidence against it has been found, do not depend on the
evidence alone. Scientists can and will tolerate falsifying evidence in order to explore
as much as possible the potential of the paradigm. Only when a critical mass of
empirical inadequacies and anomalies is reached, and a new paradigm has appeared,
do scientists contemplate abandoning their old one. For Kuhn, a balance must be
achieved between resisting the radical falsificationist drive to abandon a paradigm at
the first sign of troubling observations and the temptation not to abandon a
previously fruitful one that is not working anymore, explanation-wise.
Even though Kuhn acknowledged that there are criteria (predictive success,
coherence with the paradigms of adjacent scientific disciplines, fruitfulness, ability to
explain disparate phenomena) that can assist scientists in making a rational choice
between competing paradigms, he also believed that choosing a paradigm was not a
Chapter 2. The nature of science
28
straightforward matter, easily soluble by rational discourse alone. Sometimes one
paradigm will appear to make more accurate predictions; another will account for
more data or pose new problems to solve. Choosing a paradigm requires making
trade-offs among these criteria, and scientists do not have the benefit of hindsight
when evaluating rival paradigms.
Complicating matters further, scientists who adhere to different paradigms do not
share the same standards of what constitutes adequate, trustworthy evidence or of
how to justify a claim; they do not even share the same meanings of concepts (they
“speak different languages”). Consequently, they cannot compare paradigms without
bias: scientists favouring one paradigm will think it is the best and will not be able to
convince scientists who favour rival paradigms. Scientists will not be able to offer
compelling reasons for others to switch paradigms. Kuhn called this inability to
communicate “incommensurability”. For the reasons discussed in this and the
previous paragraph, the mechanism behind the dramatic shifts represented by
scientific revolutions depends to a large extent on idiosyncratic beliefs, shared
values, personal interests, contingent historical and social circumstances, rhetorical
devices, and political alliances, among other factors.
Incommensurability is a consequence of taking seriously the Duhem-Quine thesis, as
applied to the meaning of words rather than just to the claims and assumptions of a
paradigm. Just as individual claims cannot be tested in isolation from the whole
network of claims and assumptions that structure a paradigm or theory, the meaning
of individual concepts cannot be established in isolation from the whole network of
interrelated concepts that articulate a paradigm or theory—a concept is meaningless
by itself.
One of the strengths of Kuhn’s approach to the NoS was the value placed on the
history of science as a means of corroborating philosophical accounts of it. There is
ample historical evidence that radical changes in the way scientists view the world
have happened in the past, with the shift from an Aristotelian conception of the
world—based on “commonsense and empirical descriptions” of the world—to a
Galilean one—based on “abstract, idealized and mathematical descriptions”
(Matthews, 1994, p. 135)—as a momentous episode in the history of science.
Chapter 2. The nature of science
29
However, history also offers counterexamples to Kuhn’s ideas: the revolution in
biology brought about by genetics in the first decade of the twentieth century and the
one brought about by molecular biology later in the same century do not appear to
involve anything as dramatic as a Kuhnian revolution.
Several criticisms have been raised against Kuhn’s views. Some of the most relevant
centred on Kuhn’s claims that (a) scientific disciplines in normal periods are
organised by only one paradigm at any given time; (b) normal scientists should have
faith-like confidence in their paradigm; (c) debate and criticism preclude consensus
necessary for normal science and, consequently, endanger its efficacy; (d)
incommensurability across paradigms makes it impossible to compare paradigms in a
rational manner; (e) the history of science reflects the cycle of normal science
followed by revolutionary change; (f) progress in the growth of knowledge only
takes place in normal science, but not necessarily across revolutions; and (g) the
accumulation of empirical anomalies can only be resolved by a revolution with its
consequent paradigm replacement. Counterarguments to these claims were made by
subsequent philosophical views on the NoS, as will be seen in the following sections.
2.1.4. POST-KUHNIAN PHILOSOPHY OF SCIENCE
Kuhn’s account of the NoS proved to be very influential. Subsequent developments
in the field resulted from dialogue with many of Kuhn’s ideas, either by building
upon them or by criticising them. Two currents of thought arising out of Kuhn’s
views that have furthered our understanding of the NoS were pursued by the
philosophers Imre Lakatos and Paul Feyerabend.
Imre Lakatos (Lakatos, 1970) refined Kuhn’s paradigms by proposing the idea of
“research programmes”. A research programme is similar to a paradigm in terms of
what it contains. However, a scientific field can have more than one research
programme operating simultaneously (a feature that Kuhn did not think applied to
paradigms in periods of normal science). Research programmes compete with each
other to solve more problems or explain away more anomalies. Lakatos’s picture of
science is much more complex and rich than Kuhn’s: some sciences may follow a
single, paradigm-like research programme—say, molecular biology in the biological
sciences—while others may labour under more than one competing research
Chapter 2. The nature of science
30
programme. What is more, a paradigm-like research programme can split into two or
more research programmes, or an adventurous one might separate temporarily from
the main one.
Research programmes have two main components: a “hard core” and a “protective
belt”. The hard core includes the most important and central ideas of a programme
(the laws of motion and gravitation in the case of Newtonian mechanics; natural
selection and random mutation in the case of Darwinian evolution), whereas the
protective belt includes less important ideas, such as mathematical techniques (such
as calculus and statistics) that allow building, out of theories, models that can be
applied to real world scenarios.
Lakatos thought that Kuhn’s view of the NoS fostered irrationality, by positing that
non-scientific factors (politics or rhetoric, for instance) play a crucial role in deciding
the success of a paradigm. Research programmes constitute his rebuttal of this idea,
because Lakatos held that the success of a given research programme is a rational
affair, one responsive to how the world actually is. Like Kuhn, Lakatos believed that
it is rational not to abandon a research programme at the first sign of falsifying
evidence. The development of the explanatory potential of the research programme
depends on scientists committing themselves to exploring as fully as possible the
theories that make up the programme, before replacing it with another.
The mechanism proposed by Lakatos for how to change, in a rational manner, a
claim in the face of apparent refutation prescribed two things: (a) changes should be
confined, as much as possible, to the claims and assumptions that make up the
protective belt, since they are less essential for the integrity of the research
programme (any changes to the hard core might result in the replacement of the
research programme) and (b) changes need to be “progressive”, that is, they must
contribute to the development of the research programme by extending its scope and
improving its precision. A progressive programme continually makes new, more
precise predictions. In this, Lakatos followed Popper, who—as part of his more
mature views on falsificationism—barred making any saving ad hoc changes to
claims once they had been refuted.
Chapter 2. The nature of science
31
Like Kuhn, Lakatos placed great trust in history as a guide for the philosophy of
science, particularly because his account fitted some episodes from the history of
science better than Kuhn’s. Indeed, competition among research programmes better
describes some episodes in the history of both biology and psychology where a
revolution and the subsequent replacement of a paradigm did not occur. In Lakatos’s
(and Popper’s) views, revolutions are not as common in the history of science as
Kuhn suggests.
The philosopher Larry Laudan (Laudan, 1977) further refined Lakatos’s ideas,
suggesting that theories within the hard core could move from one research
programme (or “research tradition”, as Laudan called them) to another and back
again. In consequence, scientific change does not necessarily involve revolutions,
where one paradigm vanquishes another, or the full replacement of one research
programme by another. Effective communication across paradigms or research
programmes is not hindered by incommensurability. These ideas made Lakatos’s
ideas more flexible and helped to account for some episodes in the history of science,
such as the assimilation of Carnot’s ideas about heat, which were initially developed
within a thermodynamic framework that defined heat as a fluid, into the novel kinetic
framework that defined it as the result of the vibrations of molecules in bodies.
Unlike Lakatos, who did not provide a clear solution to the problem of whether
rational change between research programmes represents a step forward in the
growth of knowledge, for Laudan, pursuing the programme with the highest rate of
predictive and problem-solving success represents a measure of progress. Laudan
conceded, though, that sometimes a change to a progressive programme might
involve losing or giving up some achievements of the degenerating programme.
Paul Feyerabend’s (Feyerabend, 1975) view of the NoS has been called
“epistemological anarchism” because it is based on two things, intellectual freedom
and creativity. His view contrasts markedly with Kuhn’s view of proper scientific
behaviour and attitudes when during a period of normal science. Kuhn advocated an
uncritical posture toward the accepted facts and claims of a paradigm: according to
Feyerabend, scientists should not be constrained in any way. The strong emphasis on
unbridled creativity is also at odds with logical positivism’s belief that experience
Chapter 2. The nature of science
32
and logic should constrain scientists’ claims and be the source of scientific
knowledge.
Feyerabend’s epistemological anarchism advocates complete freedom from
methodological constraints, since scientific progress depends on the ready
availability of alternatives to explore. Normal science, with its indoctrination,
dogmatism, and closed-mindedness, does not foster the creation of ideas about how
the world works. Feyerabend believed that Kuhn had underestimated the role of
creativity in science while overestimating the control that paradigms were capable of
exerting: in spite of the pervasive effects of the indoctrination to which scientists are
subjected at school and university, a few will remain willing to try out new ideas—
and they will be responsible for scientific progress. Indeed, the milestones of science
tend to celebrate the products of the ingenuity and originality of scientists, not their
commitment to what others might think.
Feyerabend claimed that history supported his anarchic views: scientists continually
strain against received wisdom. Such was the case for famous scientists such as
Copernicus, Galileo, Newton, Darwin, and Einstein. Thus, attempting to establish
methodological and discursive rules is futile and can only be counterproductive.
In spite of their disagreements, Feyerabend shared with Kuhn the belief in the
incommensurability of paradigms, given that observations are never neutral but
inevitably “contaminated” by, or laden with, the theories, biases, experiences, and
expectations that led a scientist to make it. As such, argued Feyerabend, observations
cannot be used as the basis for deciding whether a paradigm or research programme
is more empirically adequate than another.
“Theory-ladenness of observation” is implied by the holistic nature of the Duhem-
Quine thesis: if all claims that form the network that is scientific knowledge are
interrelated in some way, that means that empirical claims—observations,
measurements, experimental results, historical findings—have a theoretical
component from which they cannot be isolated. Observations are not pure reports of
experience: they are seen through the lens of theory. At their most basic, data are
Chapter 2. The nature of science
33
expressed in an invented scientific language that bears no necessary relation to the
way the world is.
Theory-ladenness of observation undermines belief in the neutrality, objectivity, and
trustworthiness of facts. Feyerabend exemplified the extent to which experience can
be misleading with Galileo’s defence of the Copernican model against the
Aristotelian worldview. Galileo’s reasons in favour of the heliocentric model
contradicted everyday experience: our senses tell us that the Earth does not move
while the Sun clearly does and objects dropped from high places fall in a straight line
(they are not deflected by the Earth’s motion as expected). Galileo’s insight consisted
in ignoring what perception told him to be the case and believing that there was
another way of explaining these apparent anomalies.
Appearances can shackle thought and inhibit our ability to understand the world. And
only imagination can help us out of this situation (Feyerabend, 1975). Feyerabend
argued that the success of Galileo depended on his ability to step imaginatively
outside the accepted, commonsense worldview and “see” things anew. As history
shows, science only progresses meaningfully when scientists manage to imagine
alternative ways of explaining the world or gain new perspectives on old problems.
This is another reason why indoctrination and closed-mindedness are damaging to
science: only if scientists are free to criticise widely-shared worldviews can they find
new vantage points and successful solutions to anomalies.
One of the main criticisms raised against Feyerabend’s ideas centred on his lack of
interest in providing a way to select the best ideas, those that describe the world more
accurately or explain it more deeply. If, as Feyerabend advocated, no restrictions are
imposed on the number or quality of ideas that scientists can come up with, the end
result of such a situation would be an overabundance of ideas of which scientists
cannot say anything certain. If logical positivists focused too narrowly on the
justification and testing of claims at the expense of creativity, Feyerabend
downplayed the necessity of justifying ideas by testing them against experience.
Chapter 2. The nature of science
34
2.1.5. THE STRONG PROGRAMME IN THE SOCIOLOGY OF SCIENCE
Broadly speaking, there have been two main approaches to the sociological study of
science: a traditional approach—associated with the work of the sociologist Robert
Merton (Merton, 1973)—and a newer, more radical one, represented by the work of
a group of sociologists based in Edinburgh. Their views of the NoS drew on Kuhn’s
most extreme and controversial ideas (such as incommensurability and the belief that
the world changes in some way when paradigms change), the Duhem-Quine thesis,
Feyerabend’s anarchic propositions, and the realisation that observations are laden
with the personal, professional, and social background of scientists. This approach
was given the name of the Strong Programme in the sociology of science (Barnes et
al., 1996).
The aim of the Strong Programme was to explore the causes of scientists’ beliefs and
how are they justified, how these beliefs affect scientists’ behaviour, and how beliefs
change with time. The following summary of the Strong Programme’s claims will be
enriched with insights from other sociologists not of the Edinburgh School that,
nevertheless, could be reasonably considered fellow travellers (for example, Shapin
and Schaffer, 1985; Latour and Woolgar, 1986).
Merton had set the stage for the Strong Programme by proposing that there are
agreed norms or habits (usually unstated) that regulate scientists’ behaviour.
According to him, these norms are (a) indifference to the personal attributes and
social background of scientists; (b) shared ownership of published ideas and
findings; (c) interest in the common good of the scientific enterprise, at the expense
of personal benefit; and (d) scepticism and a critical attitude towards untested claims.
In addition, scientists are motivated to pursue knowledge and uphold these norms by
the desire for symbolic recognition for being the first to discover a phenomenon,
invent a device, or come up with an idea. Merton’s account was not entirely without
problems, since the desire for recognition can come into conflict with any of the four
norms.
The view that scientists are not disinterested seekers of knowledge, obedient only to
data and reason, was one of the starting points of the Strong Programme. Sociologists
argued that scientists are part of a community, not unlike other communities of like-
Chapter 2. The nature of science
35
minded individuals, and, as such, their beliefs and behaviours are determined by
socially established norms and/or habits enforced by the community—not only by
logic and/or the real world. Negotiation, persuasion, conflict, hierarchies, and the
exercise of power play a role in determining how science works. And the same
applies to scientific standards of what constitutes a good explanation, argument, or
justification.
By the reckoning of both classic and Strong Programme sociology of science, if
scientific beliefs are caused by social conventions from within the community of
scientists, for example, about what is a good explanation, it stands to reason that they
will also be susceptible to outside interests from politics, religion, economics, and
morality. If this is so, and scientific beliefs are not caused by nature, the truthfulness
of scientific knowledge—its claim to represent the world as it is—is somewhat
undermined. (Granted, the Strong Programme still saw scientific knowledge as the
best source of expertise about the natural world, and useful for prediction and other
forms of practical action.)
The Strong Programme fell into a relativist position that neglected the role that
testing plays in establishing the truthfulness of scientific claims. According to the
relativist viewpoint, the scientific strategy is no better than others as far as
discovering and justifying knowledge of the world is concerned. What is more, facts
are not discovered: they are invented. In a very real sense, relativism claims that our
ideas, rather than our perceptions, as logical positivists intended, determine what the
world is like. For instance, according to Latour (1988), nature is produced by the
decisions scientists agree on, and according to Goodman (1978), new “worlds” are
literally created when theories are invented by scientists.
2.1.6. RECENT DEVELOPMENTS IN UNDERSTANDING THE NATURE OF SCIENCE
Developments in the study of the NoS after Kuhn emphasised the role that
theoretical, personal, historical, and sociological considerations play in the
development of scientific knowledge, at the expense of that played by empirical
testing. Current thinking (Worrall, 1982; Hacking, 1983; Howson and Urbach, 1989)
on the NoS has looked back in the direction of empiricism, acknowledging the
crucial role played by experience in justifying knowledge. Consequently, currents of
Chapter 2. The nature of science
36
thought such as realism, Bayesianism, and new experimentalism have reappraised
the role of the real world as an arbiter of truthfulness, while also acknowledging the
important role played by ingenuity and creativity in the construction of knowledge.
Scientific realism (Worrall, 1982) holds an alternative attitude to some of the
problems described earlier. Broadly speaking, it takes issue with both the logical
positivist claim that sensation is all that can be known with any certainty and with the
relativist views first adopted by Kuhn and later developed further by the Strong
Programme in the sociology of science. For scientific realists, science aims to give as
accurate an account of the world as possible, both of what is accessible to the senses
and what is not. And even though each individual can have a different perspective on
the world, and thoughts—through actions—can have a causal effect on it, realists
assume that the world exists and works independently of what those thoughts might
be.
Scientific realism does acknowledge that scientific knowledge could fail—as it has
frequently done in the past—in its task of describing and explaining the world,
especially at the frontiers of science, but counters that it is highly unlikely that
widely-tested ideas, such as the microbial theory of disease, atomic theory, or
molecular biology, could turn out to be completely wrong. So, although scientific
realists advocate a cautious belief in scientific knowledge and openness to revision,
they also believe that reliable, truthful knowledge of the world is a reasonable
aspiration. According to the realist point of view, rational belief implies the
possibility of assigning different degrees and kinds of confidence to different ideas:
usually, although not always, theories about more easily observable entities and
processes may command more trust than theories about less observable ones.
One of the main challenges to scientific realism comes from logical positivism,
which argues that, as a matter of logic, for every set of data there is a very large, if
not limitless, number of possible explanations. This is called the problem of the
“underdetermination of theory by evidence”: no finite amount of data can settle
which hypothesis, out of several alternative ones, is the correct one. About this,
scientific realism argues that the reliability of rival alternatives can be tested by
comparing how accurately they describe phenomena or predict future behaviour.
Chapter 2. The nature of science
37
Thus, some hypotheses will turn out to be more reliable than others, although not
necessarily true. However, as knowledge and technology develop and new evidence
becomes available, bold ideas can stop being mere speculations (at some point in the
past microbes and genes were as speculative as quarks are today).
Regarding post-Kuhnian claims (see Garrison, 1986; Parusnikova, 1992) that the
theories scientists come up with create or construct reality, rather than the other way
around, realists argue that there is a subtle but very real difference between the ideas
used to describe the world and the world itself—as history has shown, not all ideas
are equally well-suited to the task of explaining natural phenomena and predicting
their future behaviour (for a comprehensive review of scientific realism, see Leplin,
1984). In science, it is not uncommon for scientists to come up with more than one
alternative structure or mechanism capable of explaining the data. When this
happens, testing provides reasons for choosing one over the other. And should the
tests prove inconclusive, the professional judgment of scientists may play a defining
role: non-empirical factors such as compatibility with other theories, degree of
generality, and/or simplicity can be called upon to make a decision.
Instead of focusing on developing an inductive logic to account for the relationship
between evidence and theory, as logical positivism tried to do, scientific realism
appeals to the form of reasoning called “inference to the best explanation” (Lipton,
1991) to explain the relationship between evidence and theory. Rather than drawing
generalisations out of a limited amount of data or deductively valid conclusions from
true premises, scientists infer non-deductively a theoretical structure or mechanism
capable of explaining the available data; once this has been done, they deduce
predictions from the theory and test them against new data. This is akin to Popper’s
falsificationist hypothetico-deductive method, with the difference that, according to
realists, successful predictions do constitute grounds for believing that the hypothesis
may be approaching the truth of how things are.
Without a doubt, one of the most uncomfortable of the unsolved problems faced by
the philosophy of science—specifically, by logical positivism—is the challenge
posed by induction: under what circumstances, if any, are scientists entitled to
believe that a given piece of evidence supports a conjecture? To some extent, the
Chapter 2. The nature of science
38
inability of logical positivists to account for how accumulating evidence could help
to justify scientific knowledge motivated the radical proposals of Kuhnian and post-
Kuhnian philosophies of science, with their emphases on the irrational aspects of the
evaluation of scientific claims, theories, and paradigms.
Bayesianism is one of the strongest contenders when it comes to shedding some light
on how evidence can actually support claims about the world. At the core of
Bayesianism is Thomas Bayes’s probability theorem. Essentially, Bayes’s theorem
says that observations can increase or decrease the probability of a hypothesis being
true: if the evidence agrees with the hypothesis, its likelihood of being true increases;
vice versa, if the evidence contradicts the hypothesis, its likelihood of being true
decreases. Bayesianism advocates a constant process of adjustment, where the initial
probability of a hypothesis is constantly updated in the light of new evidence
(Howson and Urbach, 1989).
Even though Bayesianism does not guarantee near absolute certainty, of the sort that
the logical positivists wished for, it does acknowledge the effect of evidence in
determining confidence in a given claim. Furthermore, it sees the scientific strategy
as one of continuous testing and evaluation of hypotheses, where the improvement,
and even replacement, of claims is a commonplace feature. An important hurdle
faced by Bayesianism, however, is the uncertainty associated with setting a value for
the initial probability of a hypothesis, a basic parameter for calculating subsequent
increases or decreases in probability.
One insight to come out of these more recent attempts to understand the NoS is the
realisation that science, instead of following a recipe-like method, relies on a
versatile strategy that encompasses a variety of aims. As Godfrey-Smith (2003)
summarised it, in science testing strives to
Chapter 2. The nature of science
39
choose between rival hypotheses about the hidden structure of the world. These hypotheses will sometimes be expressed using mathematical models, sometimes using linguistic descriptions, and sometimes in other ways. Sometimes the “hidden structures” postulated will be causal mechanisms, sometimes they will be mathematical relationships that may be hard to interpret in terms of cause and effect, and sometimes they will have some other form. Sometimes the aim is to work out a whole new kind of explanation, and sometimes it is just to work out the details (like the value of a key parameter). Sometimes the aim is to understand general patterns, and sometimes it is to reconstruct particular events in the past (p. 211).
Science is thus characterised by this attempt to bring conjectures—themselves a
product of a scientists’ imagination, not of logic or the data alone—into as close a
contact as possible with experience. And on the success of this strategy appears to
rest the truthfulness of scientific knowledge of the world as it is, at least compared
with other kinds of knowledge.
Finally, “new experimentalism” tackles the problem of theory-ladenness of
observation by reassessing the role of experiment in science. According to this
philosophical approach, experimentation can have, according to Ian Hacking (1983),
a life of its own independent of large-scale theoretical assumptions: scientists can
establish the reliability of their experimental procedures without appealing to the
assumptions of the theory that the experiment is testing (Kosso, 1992). Furthermore,
the assumptions that underlie an experiment are rarely the ones that underlie the
theory that is being tested by the experiment: the biochemical basis of molecular
biology has nothing to do with the large-scale biological claims of Darwinian
evolutionary theory, for instance.
One of the immediate consequences of new experimentalism is that experimental
knowledge can grow, to some extent, independently of theoretical knowledge. So,
when paradigms or research programmes change, the accumulated experimental
knowledge can be transferred to the new one. It is highly unlikely that all
experimental equipment will suddenly stop working, and all experimental effects
disappear, immediately after a scientific revolution (although they could be
reinterpreted). This insight nicely complements Laudan’s idea that ideas belonging to
the hard core of a research programme can be taken up by other programmes.
Chapter 2. The nature of science
40
New experimentalists claim that a hypothesis can be said to be supported by the
evidence, but only if it passes a test it would be unlikely to pass if it were false.
Furthermore, in order to consider a hypothesis supported by the evidence, the
possible sources of error need to be recognised and corrected. Identifying the sources
of error does require a guiding theory, but this theory can itself be developed
experimentally through trial and error. Under these conditions, experiments can lend
support to conjectures and help decide between rival claims.
In spite of the partially successful efforts to achieve a rapprochement between the
extremes of logical positivism and falsificationism, on the one hand, and Kuhnian
and post-Kuhnian philosophy of science on the other, there is still vigorous debate in
the philosophy of science as to the aims, methods, and products of science. However,
there clearly has been some progress in elucidating how science works. Traditional
images of the lone and dispassionate scientist working to uncover the secrets of the
universe are no longer considered adequate, and the more radical relativist ideas have
been tempered by a reappraisal of the role of evidence in science.
Conceptions of science arrived at by philosophers, sociologists, and scientists
themselves have found their way, consciously or unconsciously, into classrooms,
both as content and as the underlying rationale of curricula and teaching strategies.
How then have these conceptions of the NoS been translated into the educational
milieu? That is the question that will be addressed in the next section.
2.2. THE NATURE OF SCIENCE IN SCIENCE EDUCATION Coming up with, and recognising the importance of, an adequate picture of science
that is suitable for teaching is one of the first challenges faced by curriculum reform,
a challenge certainly relevant for the purposes of developing an instrument to
measure students’ understandings of the NoS. The lack of consensus amongst
philosophers and sociologists about the NoS poses a challenge for science education
that is different from the one posed by teaching accepted scientific knowledge about
which there is no expert disagreement.
Chapter 2. The nature of science
41
Clearly, the ideas about the NoS that might be taught and assessed at school need to
be less detailed and sophisticated than those discussed in the previous section. If
anything, the purpose of the above account of the philosophy of science is intended
to provide a coherent and comprehensive starting point from which to select and
simplify ideas that 16-year old students should be aware of.
Besides providing an historical account of the portrayal of the NoS in curricula,
delineating the different conceptions about it that have found their way into
classrooms can help to establish which kinds of ideas students are likely to have been
exposed to and which beliefs about science they are likely to hold—and,
consequently, might be worth exploring.
For the most part, philosophy of science and science education have developed
separately (Duschl, 1985). Indeed, as Ennis (1979) put it, “[w]ith some exceptions
philosophers of science have not shown much explicit interest in the problems of
science education” (cited in Matthews, 1994, p. 83). Nonetheless, even if it is true
that, in the past, science educators have largely ignored up-to-date philosophical
discourse about science when developing curricula, teaching units, or textbooks,
implicit conceptions of it necessarily creep into these materials:
Whenever science is taught, philosophy, to some degree, is also taught. Minimally, the teacher’s own epistemology, or conception of science, is conveyed to students and contributes to the image of science that they develop in class (Matthews, 1994, p. 83).
For most of the twentieth-century history of science teaching, the NoS has remained
an implicit component of curricula. Only in the last twenty to thirty years has it
received significant attention from the education community, as evidenced by its
explicit incorporation into science curricula worldwide and the impetus of academic
investigation in the form of research groups, international conferences, journals, and
published articles. The following account will focus on science education in the
United States and Britain, countries about which a more complete historical account
is available. This review draws upon more comprehensive ones written by Hunt
(1994), Lederman (1992; 2007), Matthews (1994; 1998), McComas, Clough, and
Almazroa (1998), McComas and Olson (1998), and DeBoer (2000).
Chapter 2. The nature of science
42
Science education in the United States has had three competing orientations: (a)
theoretical, that focuses on the concepts, laws, and theories of the scientific
disciplines; (b) applied, that emphasises the application of scientific knowledge to
everyday objects and problems; and (c) liberal or contextual, that incorporates the
historical, cultural, and philosophical dimensions of science. At the beginning of the
twentieth century the theoretical orientation, with its strong reliance on mathematics
and abstract examples, dominated school science. This orientation was attuned to the
rationalist and empiricist traditions that, at the turn of the century, occupied the
minds of philosophers, especially those belonging to the Vienna Circle in the 1920s,
who emphasised mathematics and logic in their approach to the study of science
(Matthews, 1994).
During the first half of the century, up until the 1950s, the theoretical approach
gradually gave way to a more applied orientation, with an emphasis on the health,
welfare, vocational, and humanitarian aspects of science. Science had to be made
relevant not only for the individual but for society at large, which meant emphasising
its interactions with society. Together with the theoretical, this orientation left little
room for philosophical concerns, so—apart from linking science with society—the
NoS received little, if any, attention (Matthews, 1994). This applied orientation
constituted an improvement, in terms of acknowledging the NoS, on the theoretical:
it certainly recognised the influence science has in personal and social matters.
In the first fifty years of the twentieth century, there were also some isolated efforts
to teach science within a broader cultural, historical, and philosophical context (for
example, Conant, 1945; Klopfer and Cooley, 1963). However, the launch of Sputnik
in the late 1950s delayed serious consideration of the NoS as a desired educational
outcome: American scientists and professional associations campaigned for reform
towards a more theoretical curriculum capable of producing the scientists they
thought were needed to keep ahead in science and technology. This trend lasted until
the mid-1970s, when government support was withdrawn and assessment of the
reforms indicated only moderate success, particularly regarding the scientific
knowledge of non-scientists (Matthews, 1994). The period after the launch of the
Sputnik represented one of vigorous inquiry into the NoS: Kuhn’s book The
Chapter 2. The nature of science
43
Structure of Scientific Revolutions was published in 1962. Insights from Kuhnian and
post-Kuhnian philosophy of science would not reach classrooms until the 1980s, as
will be detailed below, with the advent of constructivist approaches to science
teaching.
In Britain, science education at the start of the twentieth century was characterised by
a “dry, verbal, [and] didactic pedagogy” (Matthews, 1994, p. 20) that was being
challenged by Henry Armstrong’s (Armstrong, 1903) heuristic “discovery method”,
a teaching strategy that attempted to give students the conceptual tools necessary to
place them in the role of the scientist. Besides the emphasis on discovery, this
pedagogical approach favoured paying attention to the history of science. Like
theoretical orientations in the United States, discovery approaches tended to favour a
simplified empiricist position, with induction playing a central role. During the
1960s, the Nuffield Science Courses revived the discovery aspect of Armstrong’s
strategy, thus prolonging an inductivist view of the NoS (Hunt, 1994; Matthews,
1994). With the advent of the National Curriculum for England and Wales in the late
1980s, the NoS acquired a more prominent role in science education.
During the 1960s, the image of science owed much to inductivism in both Britain
and the United States, even though Kuhnian and post-Kuhnian philosophies were
flourishing. Hodson (1991, p. 20) has argued, echoing Martin (1979), that “science
curriculum developments have been uninformed by developments in the philosophy
of science and […] the views of science implicit in many recent curriculum proposals
have been confused, often contradictory, and based on ‘dubious or discarded
philosophies of science.’” Indeed, in support of this claim, Abd-El-Khalick et al.
(2008) found that, during the past forty years, textbooks have paid little attention to
the NoS and, when they have, they have done a poor job of portraying it. Worse,
textbooks from the 1960s fared better, in their treatment of the NoS, than those
published in later years.
As evidenced by the study of Abd-El-Khalick et al. (2008), common features of
science textbooks—and most likely of classrooms, given teachers’ reliance on
textbooks—are the lack of emphasis on the epistemological role of social practices in
science (collaboration, communication, peer review, criticism), the creative, and the
Chapter 2. The nature of science
44
theory-laden, or theory-driven, aspects of science; the perpetuation of the myth of the
scientific method as a recipe-like, universal process; and the naïve treatment of the
tentativeness of scientific knowledge. On a more positive note, the textbooks
analysed did address the empirical, inferential, explanatory, and predictive aspects of
the NoS, while emphasising “testing” over “proving” scientific claims.
In the United States, Klopfer’s “Case Histories in the Development of Student
Understanding of Science and Scientists” were the first curriculum materials
expressly designed to improve students’ views of the NoS (Klopfer and Cooley,
1963). They used historic episodes to convey ideas about science to students. Other
notable efforts in this regard have been Aikenhead’s (1979) curriculum, “Science: A
Way of Knowing”, which aimed, as regards the NoS, to develop a “realistic, non-
mythical understanding of the nature, processes, and social aspect of science”
(Lederman, 1992, p. 336). In Britain, ten years after the start of the Nuffield Science
Courses, the British Association for Science Education (ASE, 1981) advocated
tacking account of the history, philosophy, and social repercussions of science and,
for this purpose, funded two reform projects: the “Science and Society” and “Science
in Its Social Context” (SISCON) courses (Hunt, 1994; Matthews, 1994).
In parallel with efforts like those of Aikenhead and the ASE, constructivist
approaches began to take hold in schools. Constructivism is a heterogeneous
approach but, broadly speaking, it is committed to the individual and social
construction of knowledge (indeed, “sociological constructivism” is associated with
the Strong Programme in the sociology of science), that is, to the idea that scientific
knowledge is creative, not absolute, and historically- and culturally-embedded
(Glasersfeld, 1989; Matthews, 1994). These views clash with, and broaden,
traditional inductivist science teaching, incorporating insights from post-positivist
philosophies of science.
Constructivism brought to the fore ideas that had remained implicit or ignored in
previous approaches to the teaching of science (Garrison, 1986), such as,
Chapter 2. The nature of science
45
observations are theory laden,
observations and inferences are not clearly separate things,
theories are underdetermined by observations, and
theories cannot be straightforwardly falsified or verified (the Duhem-Quine
thesis).
In the light of the acknowledgement of the above contributions from the philosophy
and sociology of science, nowadays the NoS is no longer an anomaly in science
curricula, with the United States (AAAS, 1989), England and Wales (Department of
Education and Science and the Welsh Office, 1989), Australia (Curriculum
Corporation, 1994), New Zealand (Ministry of Education, 1993), Canada (Council of
Ministers of Education, 1997), Denmark (Nielsen and Thomsen, 1990), The
Netherlands (Physics Curriculum Development Project, 1986), South Africa
(Department of Education of South Africa, 2002), Hong Kong (Curriculum
Development Council, 1998), and Mexico (Ministry of Public Education, 2006)
among the countries that have included the NoS as an educational outcome. As such
these curricula belong to the liberal or contextual orientation in the teaching of
science. All of these reform initiatives are a response, to a greater or lesser degree, to
a perceived crisis of scientific literacy, especially among those that do not pursue a
scientific career, compounded by a diminished interest in pursuing these kinds of
careers (for a comprehensive review, see Gregory and Miller, 1998).
Even though there are many different conceptions of scientific literacy, teaching
about the NoS has been considered an important aspect of scientific literacy in
general (Driver et al., 1996). In this view, knowledge about science is just as
important as knowledge of science. By way of example, Table 1 shows the stated
philosophical commitments of the American Association for the Advancement of
Science Project 2061 (AAAS, 1989) and the first version of the British National
Curriculum (DES/WO, 1989). The ideas of the NoS included in the National
Curriculum have been categorised, for the purposes of the present account, in a
manner similar to the one used by Matthews (1994) for those of Project 2061.
Although not uncontroversial, a comparison of these commitments with the account
of the history of ideas about the NoS on the previous pages shows that, at least at the
level of policy, the picture of the NoS acknowledges the current state of scholarship
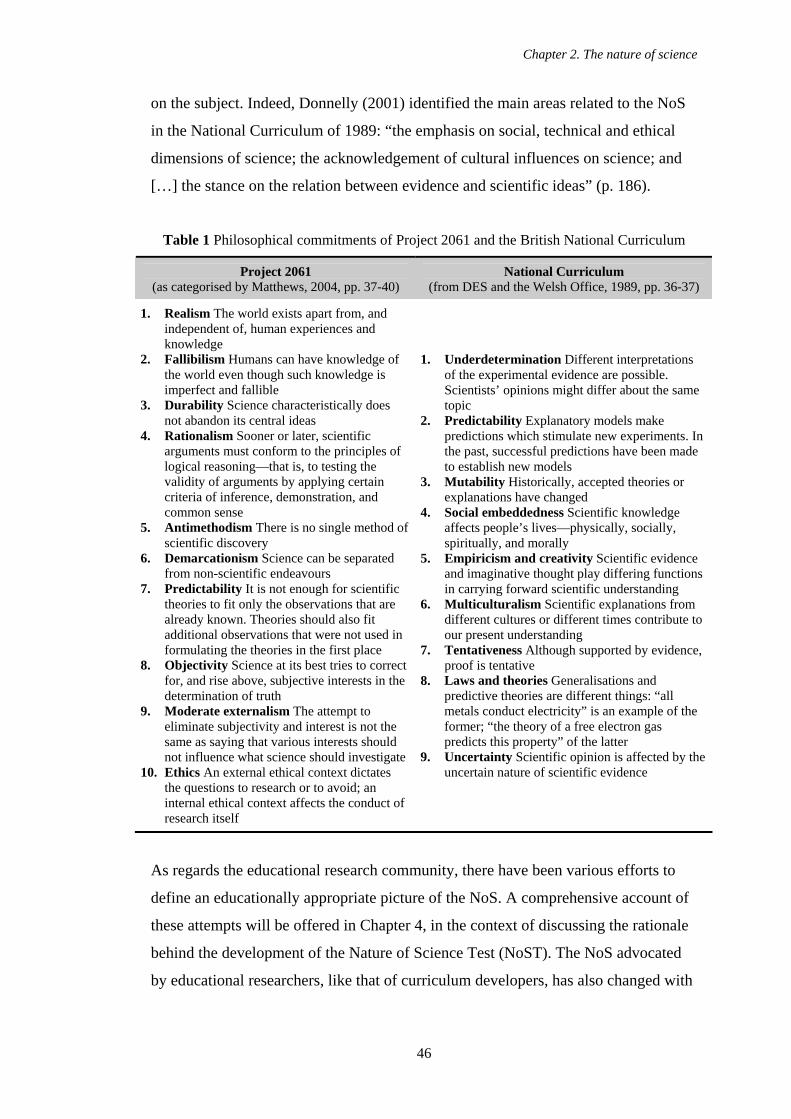
Chapter 2. The nature of science
46
on the subject. Indeed, Donnelly (2001) identified the main areas related to the NoS
in the National Curriculum of 1989: “the emphasis on social, technical and ethical
dimensions of science; the acknowledgement of cultural influences on science; and
[…] the stance on the relation between evidence and scientific ideas” (p. 186).
Table 1 Philosophical commitments of Project 2061 and the British National Curriculum
Project 2061 (as categorised by Matthews, 2004, pp. 37-40)
National Curriculum (from DES and the Welsh Office, 1989, pp. 36-37)
1. Realism The world exists apart from, and independent of, human experiences and knowledge
2. Fallibilism Humans can have knowledge of the world even though such knowledge is imperfect and fallible
3. Durability Science characteristically does not abandon its central ideas
4. Rationalism Sooner or later, scientific arguments must conform to the principles of logical reasoning—that is, to testing the validity of arguments by applying certain criteria of inference, demonstration, and common sense
5. Antimethodism There is no single method of scientific discovery
6. Demarcationism Science can be separated from non-scientific endeavours
7. Predictability It is not enough for scientific theories to fit only the observations that are already known. Theories should also fit additional observations that were not used in formulating the theories in the first place
8. Objectivity Science at its best tries to correct for, and rise above, subjective interests in the determination of truth
9. Moderate externalism The attempt to eliminate subjectivity and interest is not the same as saying that various interests should not influence what science should investigate
10. Ethics An external ethical context dictates the questions to research or to avoid; an internal ethical context affects the conduct of research itself
1. Underdetermination Different interpretations of the experimental evidence are possible. Scientists’ opinions might differ about the same topic
2. Predictability Explanatory models make predictions which stimulate new experiments. In the past, successful predictions have been made to establish new models
3. Mutability Historically, accepted theories or explanations have changed
4. Social embeddedness Scientific knowledge affects people’s lives—physically, socially, spiritually, and morally
5. Empiricism and creativity Scientific evidence and imaginative thought play differing functions in carrying forward scientific understanding
6. Multiculturalism Scientific explanations from different cultures or different times contribute to our present understanding
7. Tentativeness Although supported by evidence, proof is tentative
8. Laws and theories Generalisations and predictive theories are different things: “all metals conduct electricity” is an example of the former; “the theory of a free electron gas predicts this property” of the latter
9. Uncertainty Scientific opinion is affected by the uncertain nature of scientific evidence
As regards the educational research community, there have been various efforts to
define an educationally appropriate picture of the NoS. A comprehensive account of
these attempts will be offered in Chapter 4, in the context of discussing the rationale
behind the development of the Nature of Science Test (NoST). The NoS advocated
by educational researchers, like that of curriculum developers, has also changed with
Chapter 2. The nature of science
47
time as a natural response to developments in the philosophy, history, and sociology
of science (Abd-El-Khalick and Lederman, 2000).
Historically, educational research on students’ views of the NoS has been mixed with
research on “scientific enquiry”, or the processes of collecting and analysing data,
making hypotheses, conducting experiments, and inferring generalisations or
explanations (Lederman, 2007). Although closely related, the NoS and scientific
enquiry are different topics: for example, research on scientific enquiry could involve
looking at how students construct graphs and tables out of raw data, how they
interpret them and look for patterns. On the same topic, research into students’ views
of the NoS could involve assessing students’ understandings of the epistemological
implications of observing and inferring, whether observations or inferences are truer
and why.
Even though there is a lack of consensus, both in philosophical and educational
circles, on what is the nature of science, researchers in the latter have had, by
necessity, to come up with curriculum content and targets for assessment (different
conceptions of the NoS from the educational literature will be addressed in Section
4.2). Driver, Leach, Millar, and Scott (1996) have offered a clear and detailed
appraisal of what understanding the NoS entails:
In the broadest terms, we mean [by the NoS] those ideas which a student (or an adult) has about science, as distinct from their ideas about the natural world itself (their “scientific knowledge”). At the heart of this is their understanding of the nature and status of scientific knowledge: how the body of public knowledge called science has been established and is added to; what our grounds are for considering it reliable knowledge; how the agreement which characterizes much of science (and essentially of all school science) is maintained. This in turn involves understanding of the social organization and practices of science, whereby knowledge claims are “transmuted” into public knowledge, and of the influence of science or the wider culture, and vice versa. Issues surrounding the application of scientific knowledge in practical situations are an important focus, as the lack of consensus about these invites a re-evaluation of claims about the status of particular kinds of knowledge. A related issue is about the purpose of scientific work (in seeking explanation) and the boundaries of its areas of interest (pp. 13-14).
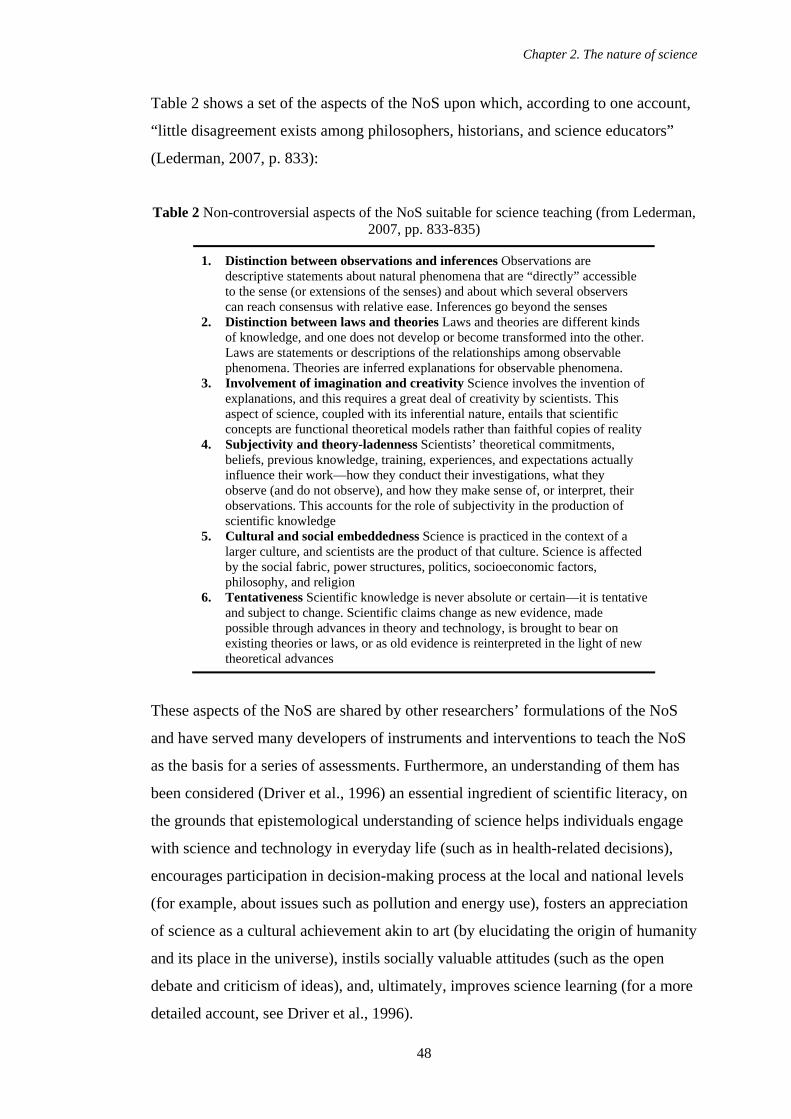
Chapter 2. The nature of science
48
Table 2 shows a set of the aspects of the NoS upon which, according to one account,
“little disagreement exists among philosophers, historians, and science educators”
(Lederman, 2007, p. 833):
Table 2 Non-controversial aspects of the NoS suitable for science teaching (from Lederman, 2007, pp. 833-835)
1. Distinction between observations and inferences Observations are descriptive statements about natural phenomena that are “directly” accessible to the sense (or extensions of the senses) and about which several observers can reach consensus with relative ease. Inferences go beyond the senses
2. Distinction between laws and theories Laws and theories are different kinds of knowledge, and one does not develop or become transformed into the other. Laws are statements or descriptions of the relationships among observable phenomena. Theories are inferred explanations for observable phenomena.
3. Involvement of imagination and creativity Science involves the invention of explanations, and this requires a great deal of creativity by scientists. This aspect of science, coupled with its inferential nature, entails that scientific concepts are functional theoretical models rather than faithful copies of reality
4. Subjectivity and theory-ladenness Scientists’ theoretical commitments, beliefs, previous knowledge, training, experiences, and expectations actually influence their work—how they conduct their investigations, what they observe (and do not observe), and how they make sense of, or interpret, their observations. This accounts for the role of subjectivity in the production of scientific knowledge
5. Cultural and social embeddedness Science is practiced in the context of a larger culture, and scientists are the product of that culture. Science is affected by the social fabric, power structures, politics, socioeconomic factors, philosophy, and religion
6. Tentativeness Scientific knowledge is never absolute or certain—it is tentative and subject to change. Scientific claims change as new evidence, made possible through advances in theory and technology, is brought to bear on existing theories or laws, or as old evidence is reinterpreted in the light of new theoretical advances
These aspects of the NoS are shared by other researchers’ formulations of the NoS
and have served many developers of instruments and interventions to teach the NoS
as the basis for a series of assessments. Furthermore, an understanding of them has
been considered (Driver et al., 1996) an essential ingredient of scientific literacy, on
the grounds that epistemological understanding of science helps individuals engage
with science and technology in everyday life (such as in health-related decisions),
encourages participation in decision-making process at the local and national levels
(for example, about issues such as pollution and energy use), fosters an appreciation
of science as a cultural achievement akin to art (by elucidating the origin of humanity
and its place in the universe), instils socially valuable attitudes (such as the open
debate and criticism of ideas), and, ultimately, improves science learning (for a more
detailed account, see Driver et al., 1996).
Chapter 2. The nature of science
49
In summary, from the previous account it can be glimpsed that conceptions of the
NoS in curricula have ranged from the positivist or empiricist (as exemplified by
discovery learning) to the Kuhnian or post-Kuhnian (as embodied by
constructivism). More modern conceptions of the NoS for educational purposes
(such as those advocated from the 1980s onwards) take a more nuanced view of the
NoS. Having seen how the NoS has been conceptualised for an educational milieu,
the next chapter will deal with the efforts to assess students’ views of the NoS, with
particular emphasis on the features of a variety of assessment instruments and the
challenges inherent in their development.
Chapter 3. NoS assessment instruments
50
3. CHAPTER 3
LITERATURE REVIEW: ASSESSMENTS OF VIEWS OF THE
NATURE OF SCIENCE
This chapter will provide a chronological account of some of the most significant
assessment instruments that have been developed to date to assess students’ and
teachers’ views of the NoS. Close attention will be paid to those aspects of the NoS
covered by each instrument, its rationale and style of questioning, and to whether
there is any evidence in favour of, or against, its validity and/or reliability—key
issues in determining the usefulness, both for research and instruction, of a given
instrument.
3.1. VALIDITY AND RELIABILITY It is not surprising that two of the main issues concerning the development and use of
instruments to assess views of the NoS are their validity and reliability. So it is worth
clarifying at the outset the meanings of these two important and inter-related
concepts, “separate dimensions or perspectives of the same problem, which interact
with one another” as one author has put it (Black, 1998, p. 37).
Traditionally, reliability has been understood as a measure of the consistency of
respondents’ performance on a test: hypothetically, if a test is perfectly reliable and
two identical students took it, their scores would also be identical (Stobart and Gipps,
1997, p. 42). In less hypothetical terms, Gipps (2004) has pointed out that “accuracy
of measurement” lies at the heart of the concept of reliability, and the underlying
question is, “would an assessment produce the same or similar score on two
occasions or if given by two assessors?” (p. 67). One important caveat about
reliability is that, no matter how high, it does not guarantee validity: “No body of
reliability data, regardless of the elegance of the methods used to analyze it, is worth
very much if the measure to which it applies is irrelevant or redundant” (Wood,
1991, p. 132). And if reliability deals with accuracy and consistency, validity is
concerned rather with whether a test measures “what it is supposed to measure”
(Satterly, 1981, pp. 223-224).
Chapter 3. NoS assessment instruments
51
It has also been argued that validity is not a property of a test but of the inferences
made on the basis of the test results:
one cannot meaningfully talk of an assessment or test being valid or invalid, but only its interpretation as valid or invalid for some specified purpose. In the general sense, however, we can think of the test measuring whatever causes, or enables, some individuals to get high but others low scores on that test (Satterly, 1981, pp. 223-224).
Traditionally, validity has been subdivided into four categories: face, content,
criterion (itself made up of predictive and concurrent validities), and construct
validity. Of the four, face validity is somewhat controversial: it is usually confused or
conjoined with content validity. Satterly (1981, p. 226), echoing Cattell (1996),
argues that they are not the same and pejoratively calls face validity “faith validity”,
claiming that whereas “claims for content validity are substantiated by evidence that
the test measures what it claims to measure, face validity claims are
unsubstantiated.” Satterly’s criticism centres on the fact that tests that boast face
validity often lack any correlation with external criteria and, consequently, tend to
base their validity on the opinions of test constructors and/or users. However, relying
on the judgment of external, impartial experts on the field of study can help
overcome this criticism against face validity. Indeed, content (and construct) validity
“tends to be based on professional judgments about the relevance of the test content
to the content of a particular domain” (Gipps, 2004, p. 59).
The four types of validity (Table 3) are assessed through different methods.
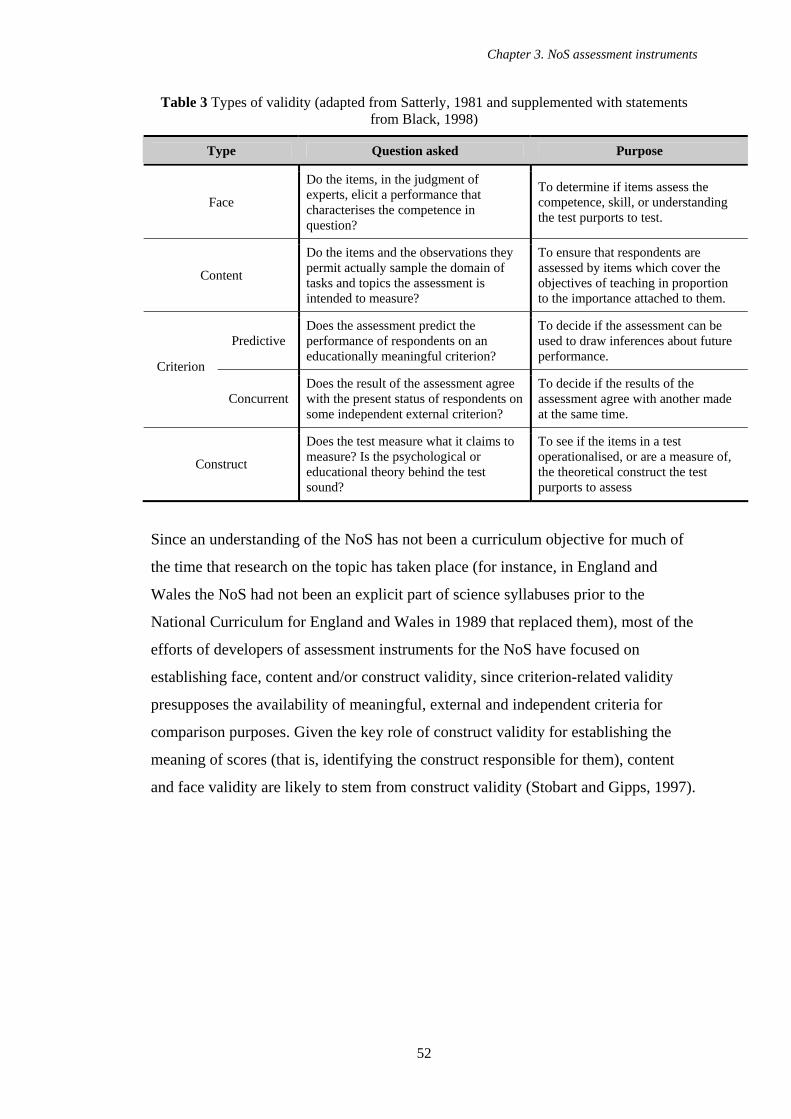
Chapter 3. NoS assessment instruments
52
Table 3 Types of validity (adapted from Satterly, 1981 and supplemented with statements from Black, 1998)
Type Question asked Purpose
Face
Do the items, in the judgment of experts, elicit a performance that characterises the competence in question?
To determine if items assess the competence, skill, or understanding the test purports to test.
Content
Do the items and the observations they permit actually sample the domain of tasks and topics the assessment is intended to measure?
To ensure that respondents are assessed by items which cover the objectives of teaching in proportion to the importance attached to them.
Predictive Does the assessment predict the performance of respondents on an educationally meaningful criterion?
To decide if the assessment can be used to draw inferences about future performance.
Criterion
Concurrent Does the result of the assessment agree with the present status of respondents on some independent external criterion?
To decide if the results of the assessment agree with another made at the same time.
Construct
Does the test measure what it claims to measure? Is the psychological or educational theory behind the test sound?
To see if the items in a test operationalised, or are a measure of, the theoretical construct the test purports to assess
Since an understanding of the NoS has not been a curriculum objective for much of
the time that research on the topic has taken place (for instance, in England and
Wales the NoS had not been an explicit part of science syllabuses prior to the
National Curriculum for England and Wales in 1989 that replaced them), most of the
efforts of developers of assessment instruments for the NoS have focused on
establishing face, content and/or construct validity, since criterion-related validity
presupposes the availability of meaningful, external and independent criteria for
comparison purposes. Given the key role of construct validity for establishing the
meaning of scores (that is, identifying the construct responsible for them), content
and face validity are likely to stem from construct validity (Stobart and Gipps, 1997).
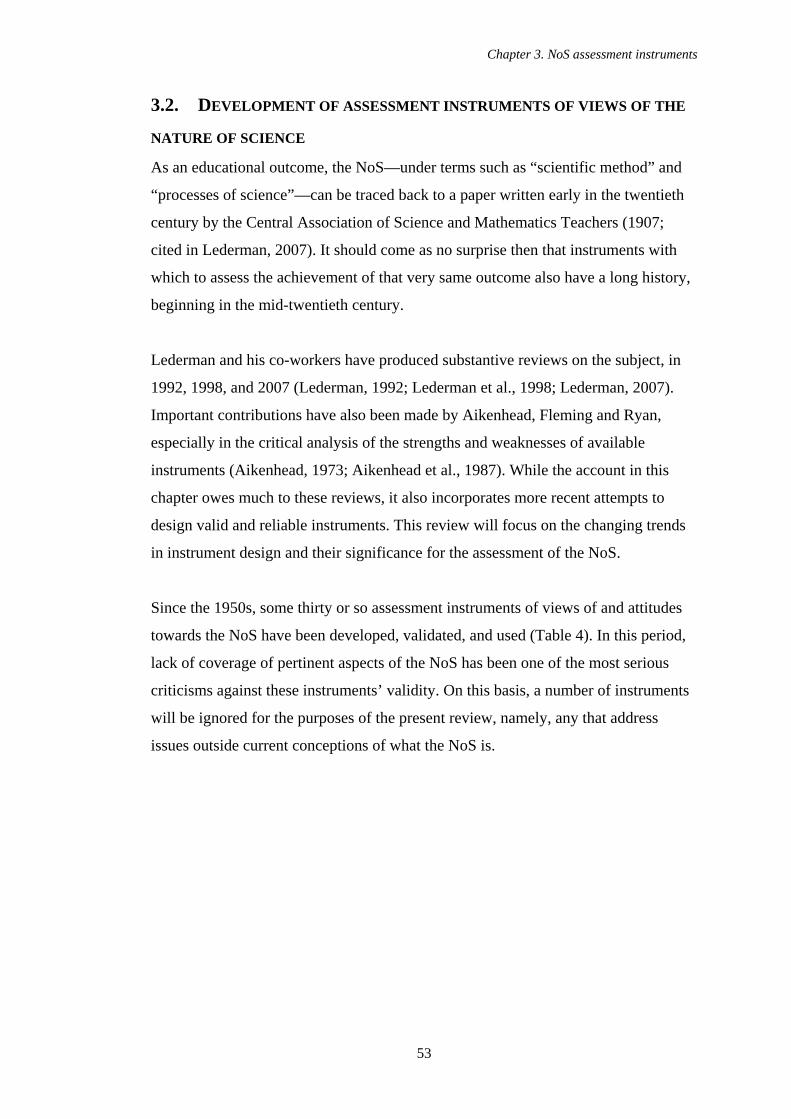
Chapter 3. NoS assessment instruments
53
3.2. DEVELOPMENT OF ASSESSMENT INSTRUMENTS OF VIEWS OF THE
NATURE OF SCIENCE As an educational outcome, the NoS—under terms such as “scientific method” and
“processes of science”—can be traced back to a paper written early in the twentieth
century by the Central Association of Science and Mathematics Teachers (1907;
cited in Lederman, 2007). It should come as no surprise then that instruments with
which to assess the achievement of that very same outcome also have a long history,
beginning in the mid-twentieth century.
Lederman and his co-workers have produced substantive reviews on the subject, in
1992, 1998, and 2007 (Lederman, 1992; Lederman et al., 1998; Lederman, 2007).
Important contributions have also been made by Aikenhead, Fleming and Ryan,
especially in the critical analysis of the strengths and weaknesses of available
instruments (Aikenhead, 1973; Aikenhead et al., 1987). While the account in this
chapter owes much to these reviews, it also incorporates more recent attempts to
design valid and reliable instruments. This review will focus on the changing trends
in instrument design and their significance for the assessment of the NoS.
Since the 1950s, some thirty or so assessment instruments of views of and attitudes
towards the NoS have been developed, validated, and used (Table 4). In this period,
lack of coverage of pertinent aspects of the NoS has been one of the most serious
criticisms against these instruments’ validity. On this basis, a number of instruments
will be ignored for the purposes of the present review, namely, any that address
issues outside current conceptions of what the NoS is.
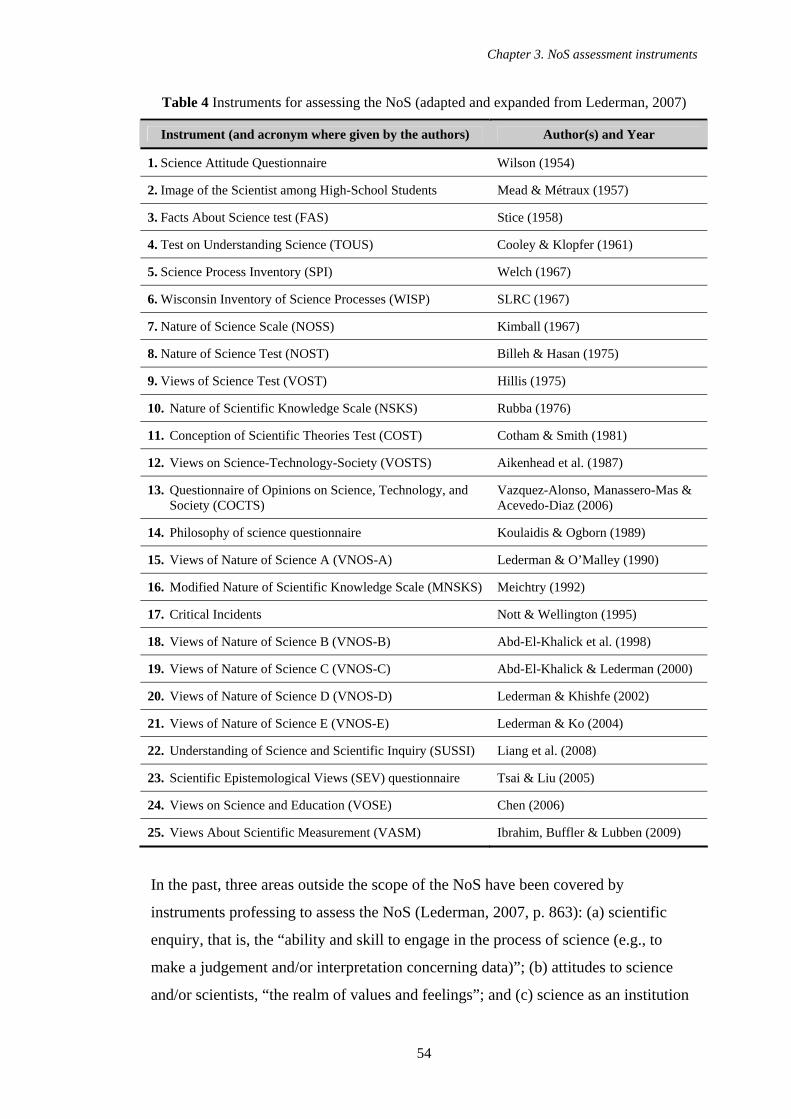
Chapter 3. NoS assessment instruments
54
Table 4 Instruments for assessing the NoS (adapted and expanded from Lederman, 2007)
Instrument (and acronym where given by the authors) Author(s) and Year
1. Science Attitude Questionnaire Wilson (1954)
2. Image of the Scientist among High-School Students Mead & Métraux (1957)
3. Facts About Science test (FAS) Stice (1958)
4. Test on Understanding Science (TOUS) Cooley & Klopfer (1961)
5. Science Process Inventory (SPI) Welch (1967)
6. Wisconsin Inventory of Science Processes (WISP) SLRC (1967)
7. Nature of Science Scale (NOSS) Kimball (1967)
8. Nature of Science Test (NOST) Billeh & Hasan (1975)
9. Views of Science Test (VOST) Hillis (1975)
10. Nature of Scientific Knowledge Scale (NSKS) Rubba (1976)
11. Conception of Scientific Theories Test (COST) Cotham & Smith (1981)
12. Views on Science-Technology-Society (VOSTS) Aikenhead et al. (1987)
13. Questionnaire of Opinions on Science, Technology, and Society (COCTS)
Vazquez-Alonso, Manassero-Mas & Acevedo-Diaz (2006)
14. Philosophy of science questionnaire Koulaidis & Ogborn (1989)
15. Views of Nature of Science A (VNOS-A) Lederman & O’Malley (1990)
16. Modified Nature of Scientific Knowledge Scale (MNSKS) Meichtry (1992)
17. Critical Incidents Nott & Wellington (1995)
18. Views of Nature of Science B (VNOS-B) Abd-El-Khalick et al. (1998)
19. Views of Nature of Science C (VNOS-C) Abd-El-Khalick & Lederman (2000)
20. Views of Nature of Science D (VNOS-D) Lederman & Khishfe (2002)
21. Views of Nature of Science E (VNOS-E) Lederman & Ko (2004)
22. Understanding of Science and Scientific Inquiry (SUSSI) Liang et al. (2008)
23. Scientific Epistemological Views (SEV) questionnaire Tsai & Liu (2005)
24. Views on Science and Education (VOSE) Chen (2006)
25. Views About Scientific Measurement (VASM) Ibrahim, Buffler & Lubben (2009)
In the past, three areas outside the scope of the NoS have been covered by
instruments professing to assess the NoS (Lederman, 2007, p. 863): (a) scientific
enquiry, that is, the “ability and skill to engage in the process of science (e.g., to
make a judgement and/or interpretation concerning data)”; (b) attitudes to science
and/or scientists, “the realm of values and feelings”; and (c) science as an institution
Chapter 3. NoS assessment instruments
55
rather than a strategy, “with little or no emphasis placed upon the epistemological
characteristics of the development of scientific knowledge.” Examples of instruments
with questionable validity on these grounds are the Facts About Science Test (Stice,
1958), Science Attitude Scale (Allen, 1959), Processes of Science Test (Biological
Sciences Curriculum Study, 1962), Inventory of Science Attitudes, Interests, and
Appreciations (Swan, 1966), Test on the Social Aspects of Science (Korth, 1969),
Science Attitude Inventory (Moore and Sutman, 1970), Test of Science-Related
Attitudes (Fraser, 1978), and the Test of Enquiry Skills (Fraser, 1980).
3.2.1. EARLY ATTEMPTS TO ASSESS VIEWS OF THE NATURE OF SCIENCE
Development of assessment instruments began in earnest with Wilson’s Science
Attitude Questionnaire (1954), a questionnaire designed to measure qualitatively
high school students’ views of the NoS and the role of science in society. Even
though largely concerned with assessing attitudes (and thus having poor content
validity), Wilson’s instrument is of historical significance, both as the first to address
concerns about students’ understanding of how science works, and as a psychometric
trendsetter in the assessment of the NoS. Nonetheless, despite its key status, the
Science Attitude Questionnaire was not developed any further after being validated
with a sample of American high school students (Aikenhead, 1973).
Three years after Wilson’s study, Mead and Métraux (1957) conducted one of the
largest studies ever conducted of students’ views about the NoS. Approximately
35,000 high school students from across the United States were asked to write an
essay about their opinions about science and scientists. A randomly selected sample
of essays was analysed qualitatively to find patterns in students’ attitudes. The choice
of a qualitative approach resulted from Mead and Métraux’s interest not only in
students’ favourable or unfavourable attitudes towards science and/or scientists, but
on why students “feel as they do” (p. 385). The two researchers felt quantitative data
to be “too sparse” for their purposes.
In 1958, Stice, on behalf of the Educational Testing Service, developed the Facts
About Science test (FAS; 1958) with the express purpose of evaluating the effect of a
television show on the Cincinnati School System (Aikenhead, 1973). The FAS
consisted of seventy-eight multiple-choice questions with three alternative answer
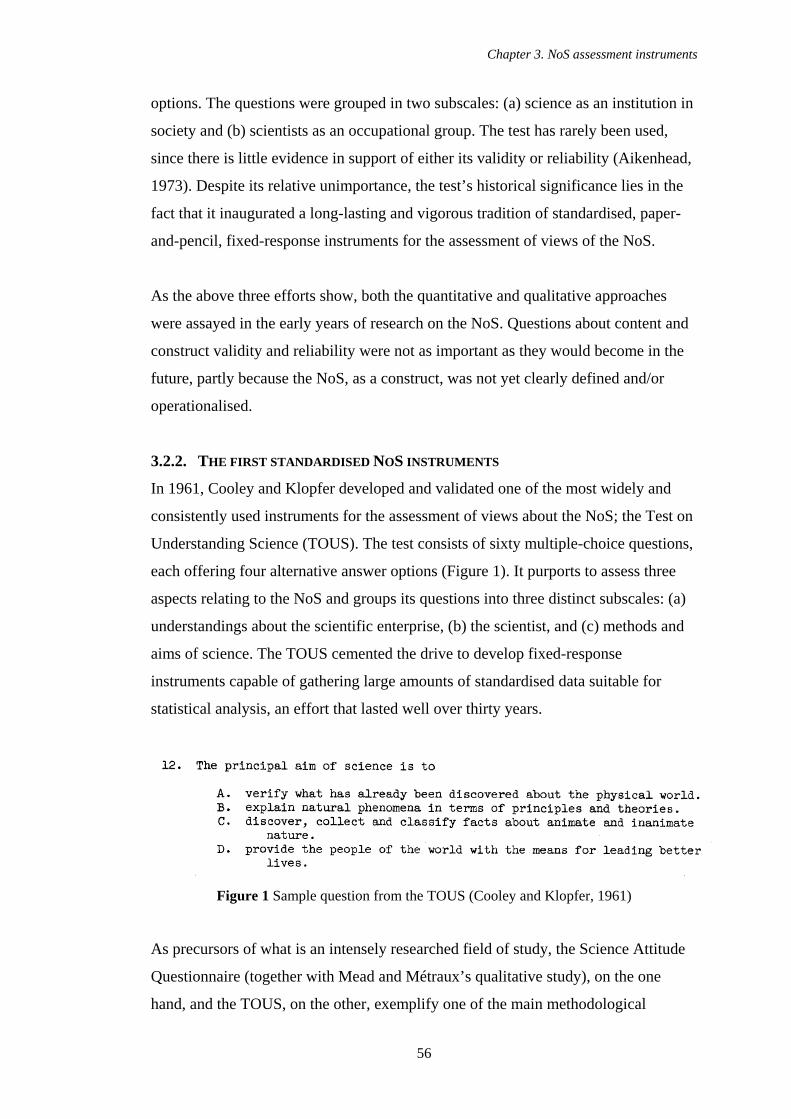
Chapter 3. NoS assessment instruments
56
options. The questions were grouped in two subscales: (a) science as an institution in
society and (b) scientists as an occupational group. The test has rarely been used,
since there is little evidence in support of either its validity or reliability (Aikenhead,
1973). Despite its relative unimportance, the test’s historical significance lies in the
fact that it inaugurated a long-lasting and vigorous tradition of standardised, paper-
and-pencil, fixed-response instruments for the assessment of views of the NoS.
As the above three efforts show, both the quantitative and qualitative approaches
were assayed in the early years of research on the NoS. Questions about content and
construct validity and reliability were not as important as they would become in the
future, partly because the NoS, as a construct, was not yet clearly defined and/or
operationalised.
3.2.2. THE FIRST STANDARDISED NOS INSTRUMENTS
In 1961, Cooley and Klopfer developed and validated one of the most widely and
consistently used instruments for the assessment of views about the NoS; the Test on
Understanding Science (TOUS). The test consists of sixty multiple-choice questions,
each offering four alternative answer options (Figure 1). It purports to assess three
aspects relating to the NoS and groups its questions into three distinct subscales: (a)
understandings about the scientific enterprise, (b) the scientist, and (c) methods and
aims of science. The TOUS cemented the drive to develop fixed-response
instruments capable of gathering large amounts of standardised data suitable for
statistical analysis, an effort that lasted well over thirty years.
Figure 1 Sample question from the TOUS (Cooley and Klopfer, 1961)
As precursors of what is an intensely researched field of study, the Science Attitude
Questionnaire (together with Mead and Métraux’s qualitative study), on the one
hand, and the TOUS, on the other, exemplify one of the main methodological
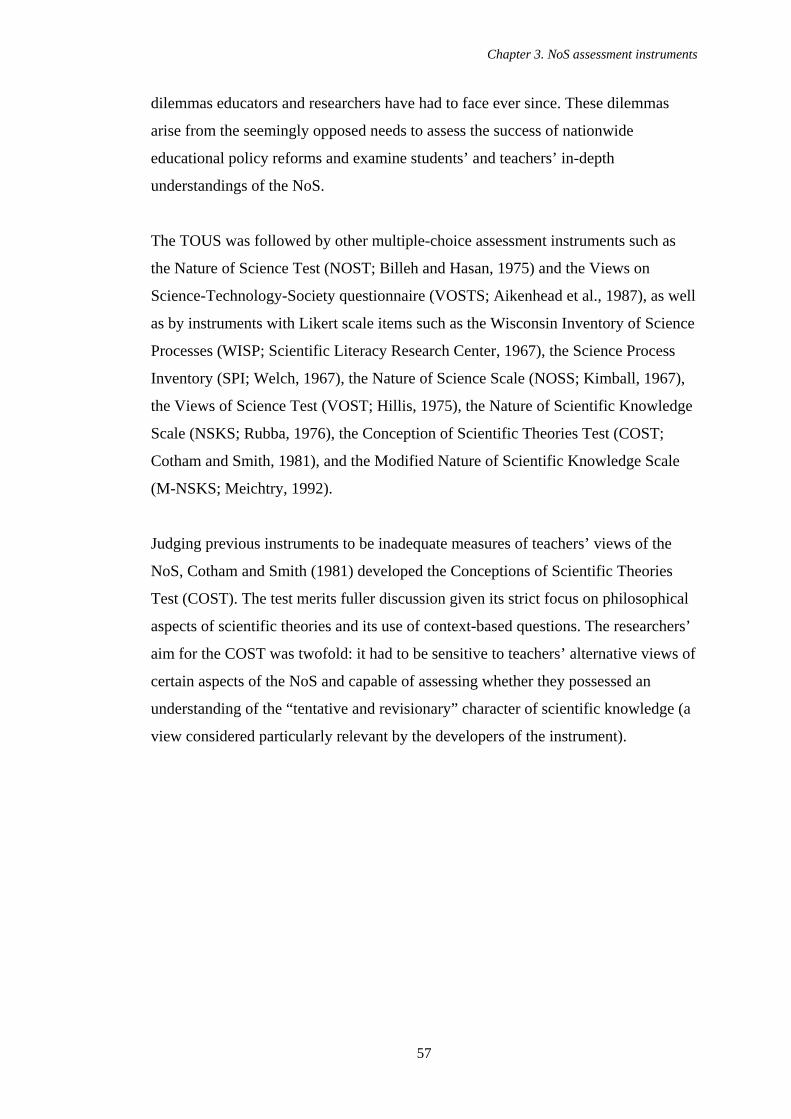
Chapter 3. NoS assessment instruments
57
dilemmas educators and researchers have had to face ever since. These dilemmas
arise from the seemingly opposed needs to assess the success of nationwide
educational policy reforms and examine students’ and teachers’ in-depth
understandings of the NoS.
The TOUS was followed by other multiple-choice assessment instruments such as
the Nature of Science Test (NOST; Billeh and Hasan, 1975) and the Views on
Science-Technology-Society questionnaire (VOSTS; Aikenhead et al., 1987), as well
as by instruments with Likert scale items such as the Wisconsin Inventory of Science
Processes (WISP; Scientific Literacy Research Center, 1967), the Science Process
Inventory (SPI; Welch, 1967), the Nature of Science Scale (NOSS; Kimball, 1967),
the Views of Science Test (VOST; Hillis, 1975), the Nature of Scientific Knowledge
Scale (NSKS; Rubba, 1976), the Conception of Scientific Theories Test (COST;
Cotham and Smith, 1981), and the Modified Nature of Scientific Knowledge Scale
(M-NSKS; Meichtry, 1992).
Judging previous instruments to be inadequate measures of teachers’ views of the
NoS, Cotham and Smith (1981) developed the Conceptions of Scientific Theories
Test (COST). The test merits fuller discussion given its strict focus on philosophical
aspects of scientific theories and its use of context-based questions. The researchers’
aim for the COST was twofold: it had to be sensitive to teachers’ alternative views of
certain aspects of the NoS and capable of assessing whether they possessed an
understanding of the “tentative and revisionary” character of scientific knowledge (a
view considered particularly relevant by the developers of the instrument).
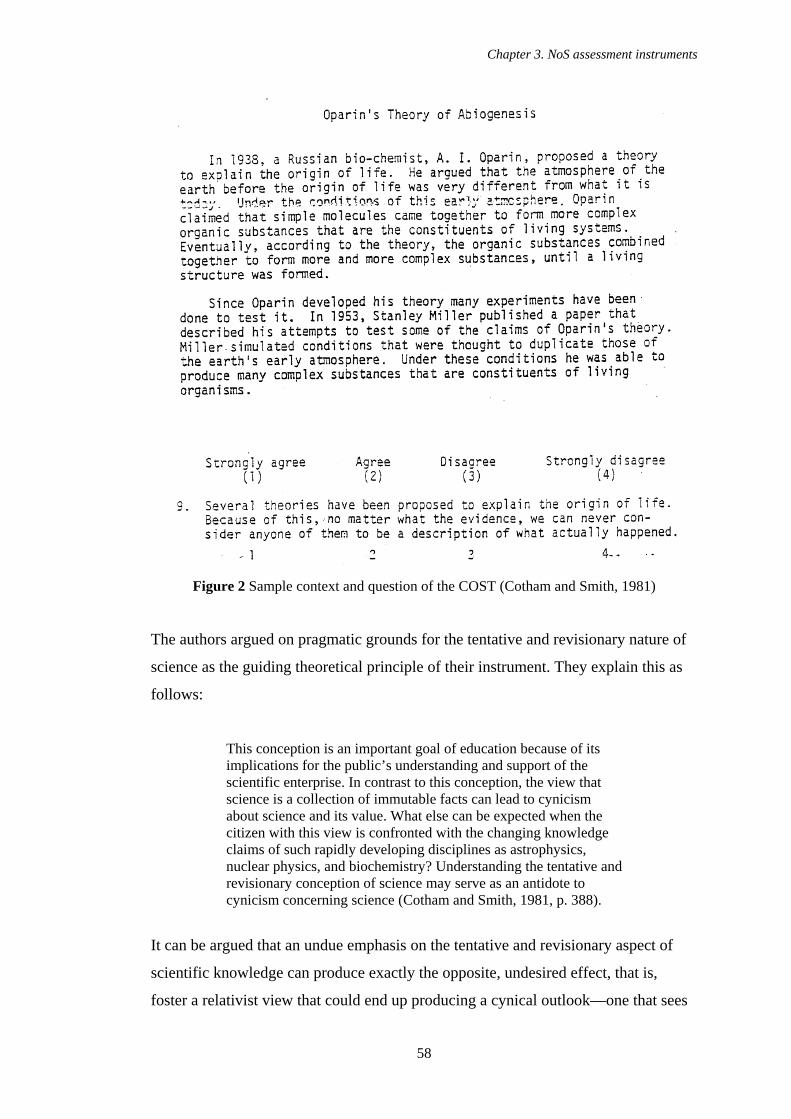
Chapter 3. NoS assessment instruments
58
Figure 2 Sample context and question of the COST (Cotham and Smith, 1981)
The authors argued on pragmatic grounds for the tentative and revisionary nature of
science as the guiding theoretical principle of their instrument. They explain this as
follows:
This conception is an important goal of education because of its implications for the public’s understanding and support of the scientific enterprise. In contrast to this conception, the view that science is a collection of immutable facts can lead to cynicism about science and its value. What else can be expected when the citizen with this view is confronted with the changing knowledge claims of such rapidly developing disciplines as astrophysics, nuclear physics, and biochemistry? Understanding the tentative and revisionary conception of science may serve as an antidote to cynicism concerning science (Cotham and Smith, 1981, p. 388).
It can be argued that an undue emphasis on the tentative and revisionary aspect of
scientific knowledge can produce exactly the opposite, undesired effect, that is,
foster a relativist view that could end up producing a cynical outlook—one that sees
Chapter 3. NoS assessment instruments
59
science both as an enterprise no different than other knowledge-seeking ones and as
unreliable knowledge. The view advocated by Cotham and Smith could be seen as
paying insufficient attention to those scientific ideas that have proved resilient across
centuries and that underpin the “changing knowledge claims of […] rapidly
developing disciplines” (p. 388), such as the atomic/molecular model or Lavoisier’s
oxygen model of combustion.
COST was organised in four subscales: ontological implications of science; testing of
theories; generation of theories; and theory choice. Each subscale in turn comprises
two alternative and opposing philosophical positions about scientific theories: (a)
ontologically speaking, theories are realist (i.e., true descriptions of unobservable
reality) or instrumentalist (i.e., they are not committed to the existence of the entities
they postulate); (b) theories are tested and may either be proved conclusively or can
never be proved conclusively; (c) theories are generated either inductively or
imaginatively; (d) theories are chosen on the basis of objective criteria or subjective
criteria. The COST relied on Likert scale items to discriminate respondents’
agreement with one or other view (Figure 2).
The decision about which aspects of the nature of theories to include in the COST
was made on the basis of a review of the philosophical literature (for example, the
writings of Carl Hempel and Thomas Kuhn) as well as information provided, through
interviews and questionnaires, by trainee and in-service elementary teachers. This
empirical approach to the building of an instrument’s underlying framework predates
Aikenhead’s Views on Science-Technology-Society (VOSTS) questionnaire and, as
such, is worthy of mention here.
One novel characteristic of the COST was the inclusion of contexts (a characteristic
that would feature prominently in future NoS instruments) that “couch” the
questions. The contexts were short accounts (two or three paragraphs at the most) of
particular scientific theories, accompanied by some historical facts. The four contexts
used were Bohr’s atomic theory; Darwin’s evolutionary theory; Oparin’s abiogenesis
theory; and plate tectonics.
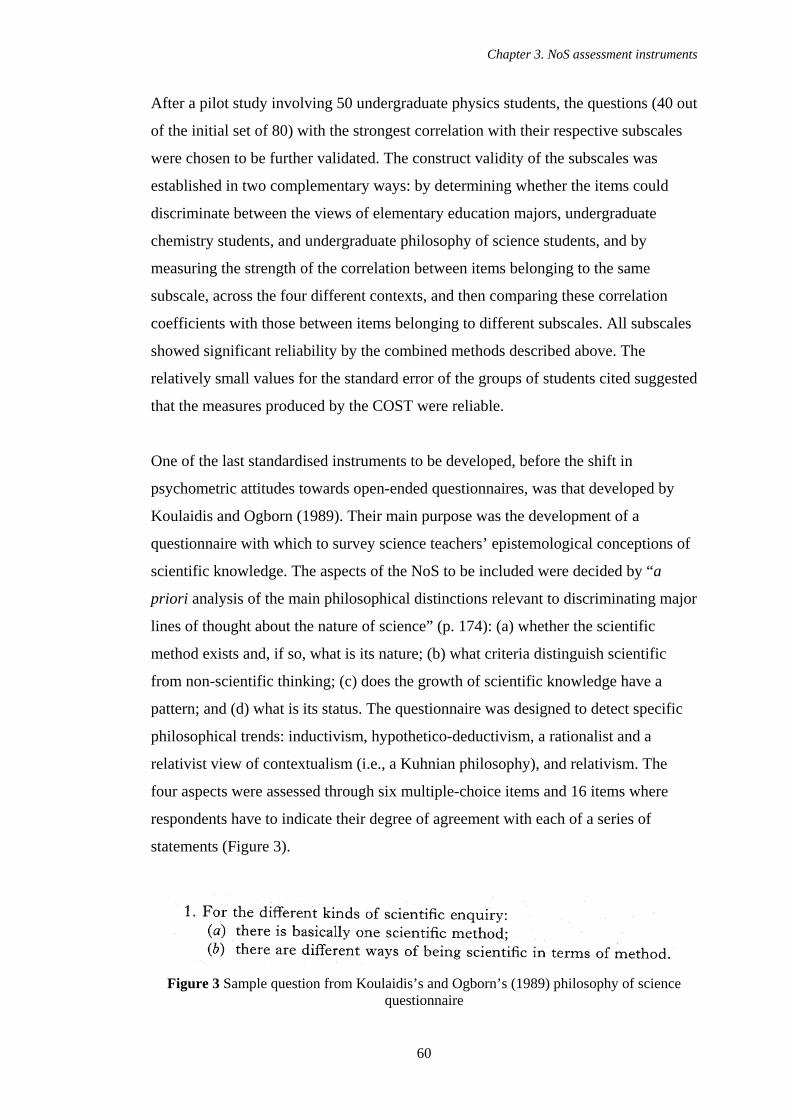
Chapter 3. NoS assessment instruments
60
After a pilot study involving 50 undergraduate physics students, the questions (40 out
of the initial set of 80) with the strongest correlation with their respective subscales
were chosen to be further validated. The construct validity of the subscales was
established in two complementary ways: by determining whether the items could
discriminate between the views of elementary education majors, undergraduate
chemistry students, and undergraduate philosophy of science students, and by
measuring the strength of the correlation between items belonging to the same
subscale, across the four different contexts, and then comparing these correlation
coefficients with those between items belonging to different subscales. All subscales
showed significant reliability by the combined methods described above. The
relatively small values for the standard error of the groups of students cited suggested
that the measures produced by the COST were reliable.
One of the last standardised instruments to be developed, before the shift in
psychometric attitudes towards open-ended questionnaires, was that developed by
Koulaidis and Ogborn (1989). Their main purpose was the development of a
questionnaire with which to survey science teachers’ epistemological conceptions of
scientific knowledge. The aspects of the NoS to be included were decided by “a
priori analysis of the main philosophical distinctions relevant to discriminating major
lines of thought about the nature of science” (p. 174): (a) whether the scientific
method exists and, if so, what is its nature; (b) what criteria distinguish scientific
from non-scientific thinking; (c) does the growth of scientific knowledge have a
pattern; and (d) what is its status. The questionnaire was designed to detect specific
philosophical trends: inductivism, hypothetico-deductivism, a rationalist and a
relativist view of contextualism (i.e., a Kuhnian philosophy), and relativism. The
four aspects were assessed through six multiple-choice items and 16 items where
respondents have to indicate their degree of agreement with each of a series of
statements (Figure 3).
Figure 3 Sample question from Koulaidis’s and Ogborn’s (1989) philosophy of science
questionnaire
Chapter 3. NoS assessment instruments
61
From the responses obtained from a sample of 94 young science teachers from urban
schools and trainee science teachers, the authors identified those that held,
consistently, each of the above philosophical positions. However, the authors warned
that it was “improper to assume without evidence that teachers […] have clearly
identifiable and more or less self-consistent philosophical positions or, if they do,
whether these positions accord with any that are identifiable from the work of
philosophers of science” (p. 174). This interpretative hurdle—which negatively
affects construct validity—constitutes one of the main reasons behind the advocacy
of open-ended, qualitative instruments with which to assess views of the NoS that
was to come.
Many of the early instruments in Table 4 share a common framework of ideas about
the NoS taken directly from outlines extracted from the literature on the philosophy
of science (Doran et al., 1974). Indeed, much of the research on views of the NoS,
especially that between the 1950s and well into the 1990s, has been carried out under
the assumption that, arguably, the “tentative and revisionary” (Lederman and
O'Malley, 1990, p. 225) nature of scientific knowledge constitutes its main attribute.
This assumption was suggested by Schwab’s (1962) claim that such an
understanding of the nature of science results from the teaching science as enquiry
and represents a desirable educational outcome. The assumption was successively
adopted because science educators believed this property of scientific knowledge
could be grasped by students of all ages (Lederman and O'Malley, 1990).
The uninterrupted effort dedicated to the design and development of instruments for
the assessment of views of the NoS has operated under this somewhat unwarranted
view of scientific knowledge ever since. As Clough (2007) has argued,
stating that scientific knowledge is tentative does reflect the changes in scientific knowledge that have occurred throughout history. However, the tenet ignores the durable character of well-supported scientific knowledge. Students who claim that science is tentative without acknowledging the durability of well-supported scientific knowledge can hardly be said to understand the nature of science (no page).
Chapter 3. NoS assessment instruments
62
The extent to which it is warranted to emphasise the tentativeness of scientific
knowledge over its durability is a matter of some debate. However, it bears saying
that a disproportionate emphasis on tentativeness of knowledge could have the
unintended consequence of marginalising other important aspects of the nature of
science.
So, developers of past instruments assumed that the tentativeness of scientific
knowledge encapsulated an individual’s particular position on one or other end of the
opposing dichotomies that characterise the NoS philosophical spectrum, such as the
realist/instrumentalist, the conclusive/tentative, the subjectivist/objectivist, and the
inductivist/inventive dichotomies (Lederman and O'Malley, 1990). Cotham and
Smith (1981) were the first to propose the use of the tentativeness of scientific
knowledge as an indicator of people’s views, a notion that was subsequently picked
up by researchers such as Aikenhead et al. (1987) during the development and
validation of the VOSTS instrument, and Lederman and O’Malley (1990) during the
development and validation of the VNOS instrument, respectively—two of the most
influential NoS assessment instruments (see below).
3.2.3. THE TURNING POINT—AIKENHEAD’S VIEWS ON SCIENCE-TECHNOLOGY-
SOCIETY TEST
Ironically, it was Aikenhead, Ryan, and Fleming (1987), authors of the fixed-
response instrument with the most widely recognised validity and
comprehensiveness, who, after identifying many of the potential pitfalls of pencil-
and-paper, fixed-response instruments, first came to realise the need to supplement
the deficiencies of traditional forms of assessment that did not rely on interviewing
respondents. One of the main methodological differences between their approach to
the design of NoS assessment instruments and past attempts was the way in which
the answer options were drafted: previous instruments’ questions had been largely
theory-driven, drawn from reviews of the literature, whereas Aikenhead et al.’s
instrument was empirically-driven by students’ views.
Aikenhead et al. developed the Views on Science-Technology-Society (VOSTS)
(1987) questionnaire in response to various criticisms made against traditional paper-
and-pencil instruments. One of their main points of contention was that
Chapter 3. NoS assessment instruments
63
tests harbor the implicit assumption that both the student and the researcher perceive the same meaning in the item. Munby (Munby, 1982, p. 207) referred to this questionable assumption as “the doctrine of immaculate perception.” When students process and respond to an objectively scored item, they subjectively make their own meaning out of the item (Aikenhead et al., 1987, p. 148).
With VOSTS, the trio of researchers also focused exclusively on eliciting
respondents’ conceptual understanding, or views, and not their attitudes towards
science, a distinction they nevertheless reckoned as “extremely fuzzy” (p. 146).
Strictly speaking, the VOSTS questionnaire is actually two distinct tests: an open-
ended survey that asks students to agree/disagree with a given statement about
science or scientists and explain the reasons for their decision (a format similar to
what would later be used by Lederman et al. for the VNOS instrument), and a
multiple-choice questionnaire whose options were devised from students’ answers to
the open-ended survey (Figure 4).
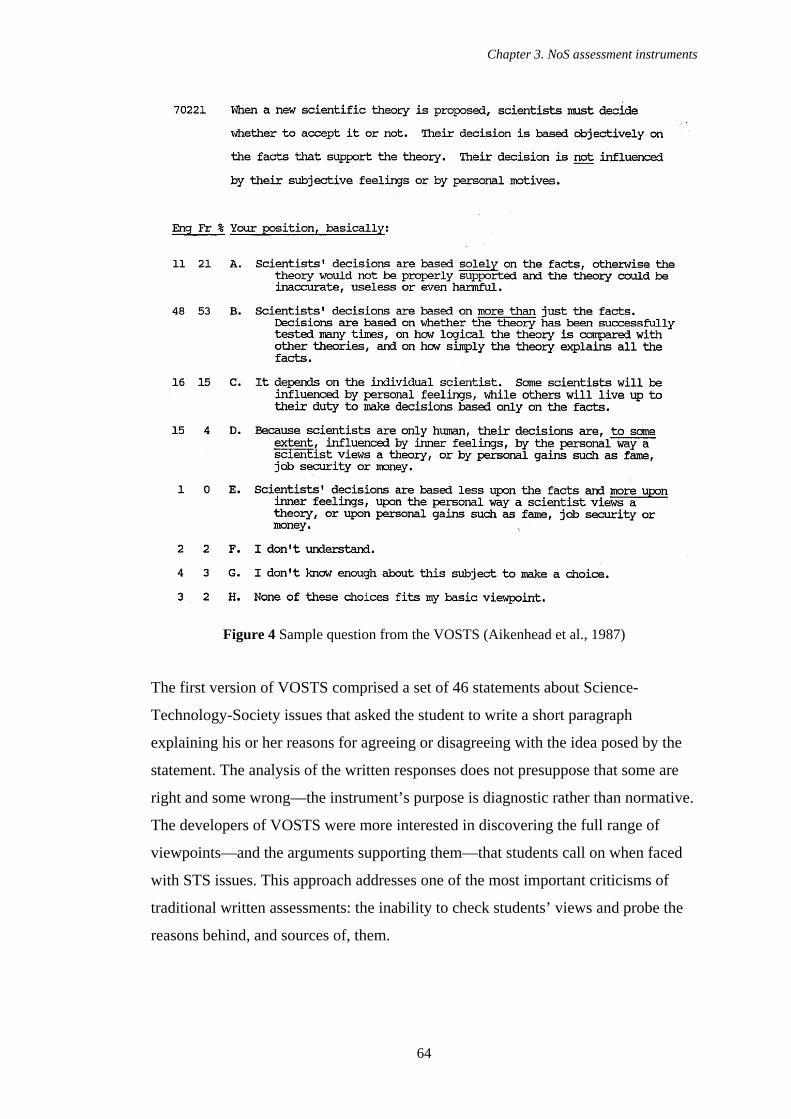
Chapter 3. NoS assessment instruments
64
Figure 4 Sample question from the VOSTS (Aikenhead et al., 1987)
The first version of VOSTS comprised a set of 46 statements about Science-
Technology-Society issues that asked the student to write a short paragraph
explaining his or her reasons for agreeing or disagreeing with the idea posed by the
statement. The analysis of the written responses does not presuppose that some are
right and some wrong—the instrument’s purpose is diagnostic rather than normative.
The developers of VOSTS were more interested in discovering the full range of
viewpoints—and the arguments supporting them—that students call on when faced
with STS issues. This approach addresses one of the most important criticisms of
traditional written assessments: the inability to check students’ views and probe the
reasons behind, and sources of, them.
Chapter 3. NoS assessment instruments
65
For this version of VOSTS (form CDN-1), Aikenhead et al. went beyond the narrow
limits of the epistemology of science that previous NoS assessment instruments
covered to encompass areas related to the sociology and the ethics of science. In
taking this approach, VOSTS distinguishes itself from the majority of previous
instruments, with their strict focus on the philosophy of science or science processes.
Nevertheless, as Aikenhead et al. (1987) acknowledge, the formulation of the
statements then follows the top-down, theory-driven approach used by previous
researchers when designing their questionnaires:
While VOSTS continues to reflect the epistemology of science represented in these theoretical models, it also draws upon investigations in the social context of science which have given additional perspectives on STS (Ziman, 1980; Gauld, 1982)—views that up until now were usually ignored in the philosophy of science literature. Some examples include the role of women in science, the communication of scientists with the general public, scientists and values, the effect of social interactions on knowledge discovered, and socioscientific decision making (pp. 148-149).
Given the broad scope of the STS perspective, not all of the issues included in
VOSTS are of equal interest for the purposes of studying views of the NoS.
Especially relevant are (a) the nature of scientific models; (b) the nature of
classification schemes; (c) the tentativeness of scientific knowledge; (d) the scientific
approach to generating knowledge; (e) the social nature of scientific knowledge; (f)
the motivation behind the generation of scientific knowledge; and (g) the honesty
and objectivity of scientists.
Of the 46 statements, some were adapted from previous instruments with Likert
scales—such as the NOSS, the SPI, and the TSAS—while others were originally
written for VOSTS so as to cover as many STS topics as possible. The set was
administered to Canadian students with the aim of improving unclear statements.
This process of validation produced form CDN-2.
The analysis of a sub-sample of responses (30% of the total) to VOSTS CND-1
yielded several interesting findings. First, students’ agreement or disagreement with
a given statement was not always adequately supported by the given reason(s). For
instance, for some statements students agreed and disagreed in equal numbers but
Chapter 3. NoS assessment instruments
66
puzzlingly offered roughly the same explanation for their decision. The researchers
concluded that students’ agreement or disagreement was often misleading and, as
such, did not produce reliable data about students’ views. Even so, VOSTS items
were able to tease out a range of reasons for holding or rejecting all the statements
administered. From this wealth of data, the researchers were able to construct a
catalogue of categories that, by paraphrasing students’ responses, allowed the further
classification of students’ views.
The second version of VOSTS—developed by Aikenhead and Ryan (1992)—is a
logical outgrowth of the work done with forms CDN-1 and 2, since the time-
consuming nature of the qualitative analysis of students’ written responses
constitutes a serious impediment to the widespread use of an instrument. Aikenhead
and Ryan used the empirically-derived categories as answer options, thus turning the
original statements into the stems of multiple-choice questions. Apart from easing
the analysis of response data, these questions have added bonuses: their meaning has
been checked against students’ views themselves; the danger of misinterpretation of
questions by students is reduced, since they are themselves the source of the answer
options; and the ambiguity and lack of depth of Likert scale items is avoided.
The development of this second, multiple-choice version of VOSTS (Aikenhead and
Ryan, 1992) followed a five-step sequence that reflected the development of the first
version and drew on the insights gained after its administration. The first step
entailed broadening and revising the scope of the STS framework upon which
questions were constructed. Frameworks of past instruments and published literature
on the epistemology and sociology of science and technology were drawn upon to
refine the VOSTS framework. Regarding the NoS, the new framework included the
nature of observations, scientific models, and classification schemes; the
tentativeness of scientific knowledge; hypothesis, theories and laws; the scientific
approach to investigations; precision and uncertainty in scientific/technological
knowledge; logical reasoning; the fundamental assumptions for all science; the
epistemological status of scientific knowledge; and paradigms versus the coherence
of concepts across disciplines.
Chapter 3. NoS assessment instruments
67
With the above framework as a guideline, Aikenhead and Ryan developed new
statements that, together with the older ones, were given to students to rate and
justify in writing. The second step involved analysing students’ written arguments
and teasing out the categories—i.e., students’ positions—that emerged from the data.
Given that these common categories were to be used as the rough versions of the
multiple-choice answer options, care was taken to ensure that they paraphrased
students’ expressions and incorporated as much of their vernacular language as
possible—whilst also taking care not to compromise clarity. The rationale for student
trialling was that, the more diverse the sample of students, the more representative of
the range of views would be the questions. At the end of this step, the items had the
layout of a multiple-choice question: each statement was followed by between five
and 13 of the paraphrased student positions.
The purpose of the third step was to get feedback from students about how well
questions performed the job of capturing their views. Approximately ten students
were asked to repeat the process delineated in the first step and write explanations for
some statements they either agreed or disagreed with. Students were then presented
with the multiple-choice options for the statements they had rated and were asked to
choose which option, if any, best mirrored their written response. Researchers
categorised students’ paragraphs and compared them with the options chosen. Those
students whose written response and multiple-choice answer showed an important
discrepancy were interviewed to ascertain the cause of the discrepancy. Meanings
were clarified, ambiguity was identified and corrected, and the wording of the items
was polished in the light of the comments or suggestions made by students.
In the fourth and penultimate step, the clarity and interpretation of each item was
rechecked with the help of students. Students answered several multiple-choice
questions and explained why they agreed or disagreed with each question and what
they thought of the different options provided. After this step, the researchers were
satisfied that students interpreted the questions in the intended ways.
Finally, the revised items were applied to a large sample in order to determine which
answer options were least frequently chosen, with the aim of eliminating them and
shortening the questions. If, however, the less frequently chosen options represented
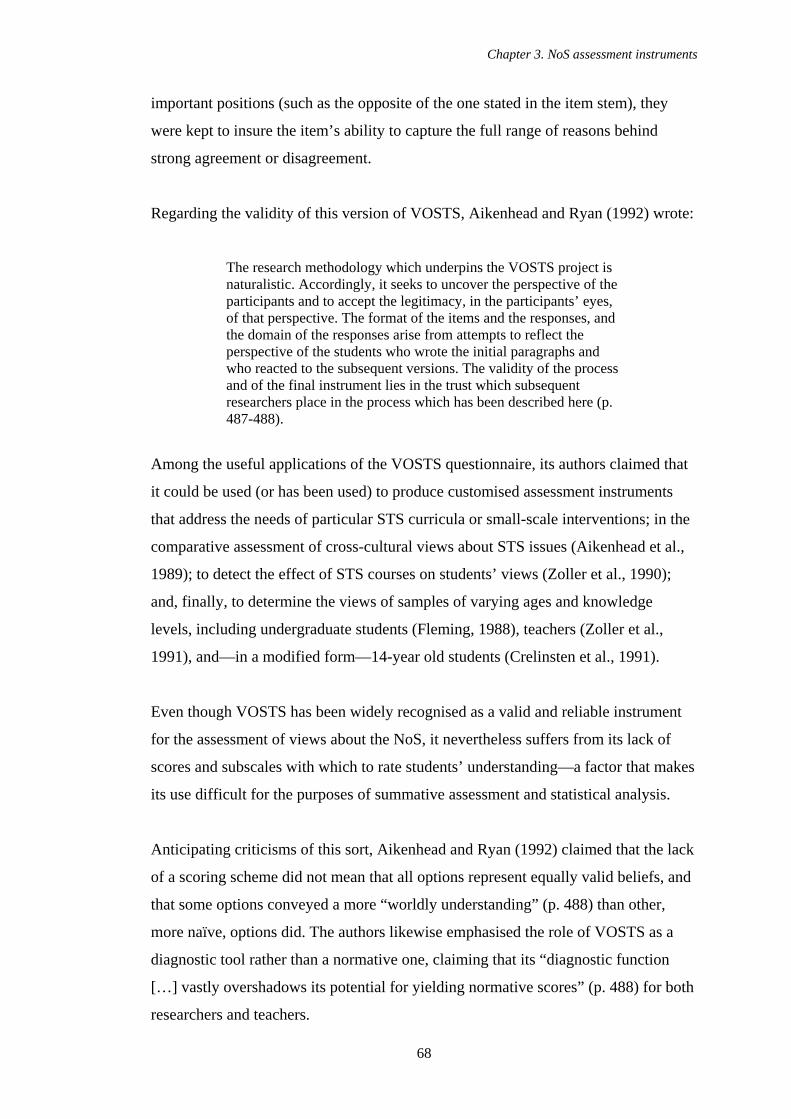
Chapter 3. NoS assessment instruments
68
important positions (such as the opposite of the one stated in the item stem), they
were kept to insure the item’s ability to capture the full range of reasons behind
strong agreement or disagreement.
Regarding the validity of this version of VOSTS, Aikenhead and Ryan (1992) wrote:
The research methodology which underpins the VOSTS project is naturalistic. Accordingly, it seeks to uncover the perspective of the participants and to accept the legitimacy, in the participants’ eyes, of that perspective. The format of the items and the responses, and the domain of the responses arise from attempts to reflect the perspective of the students who wrote the initial paragraphs and who reacted to the subsequent versions. The validity of the process and of the final instrument lies in the trust which subsequent researchers place in the process which has been described here (p. 487-488).
Among the useful applications of the VOSTS questionnaire, its authors claimed that
it could be used (or has been used) to produce customised assessment instruments
that address the needs of particular STS curricula or small-scale interventions; in the
comparative assessment of cross-cultural views about STS issues (Aikenhead et al.,
1989); to detect the effect of STS courses on students’ views (Zoller et al., 1990);
and, finally, to determine the views of samples of varying ages and knowledge
levels, including undergraduate students (Fleming, 1988), teachers (Zoller et al.,
1991), and—in a modified form—14-year old students (Crelinsten et al., 1991).
Even though VOSTS has been widely recognised as a valid and reliable instrument
for the assessment of views about the NoS, it nevertheless suffers from its lack of
scores and subscales with which to rate students’ understanding—a factor that makes
its use difficult for the purposes of summative assessment and statistical analysis.
Anticipating criticisms of this sort, Aikenhead and Ryan (1992) claimed that the lack
of a scoring scheme did not mean that all options represent equally valid beliefs, and
that some options conveyed a more “worldly understanding” (p. 488) than other,
more naïve, options did. The authors likewise emphasised the role of VOSTS as a
diagnostic tool rather than a normative one, claiming that its “diagnostic function
[…] vastly overshadows its potential for yielding normative scores” (p. 488) for both
researchers and teachers.
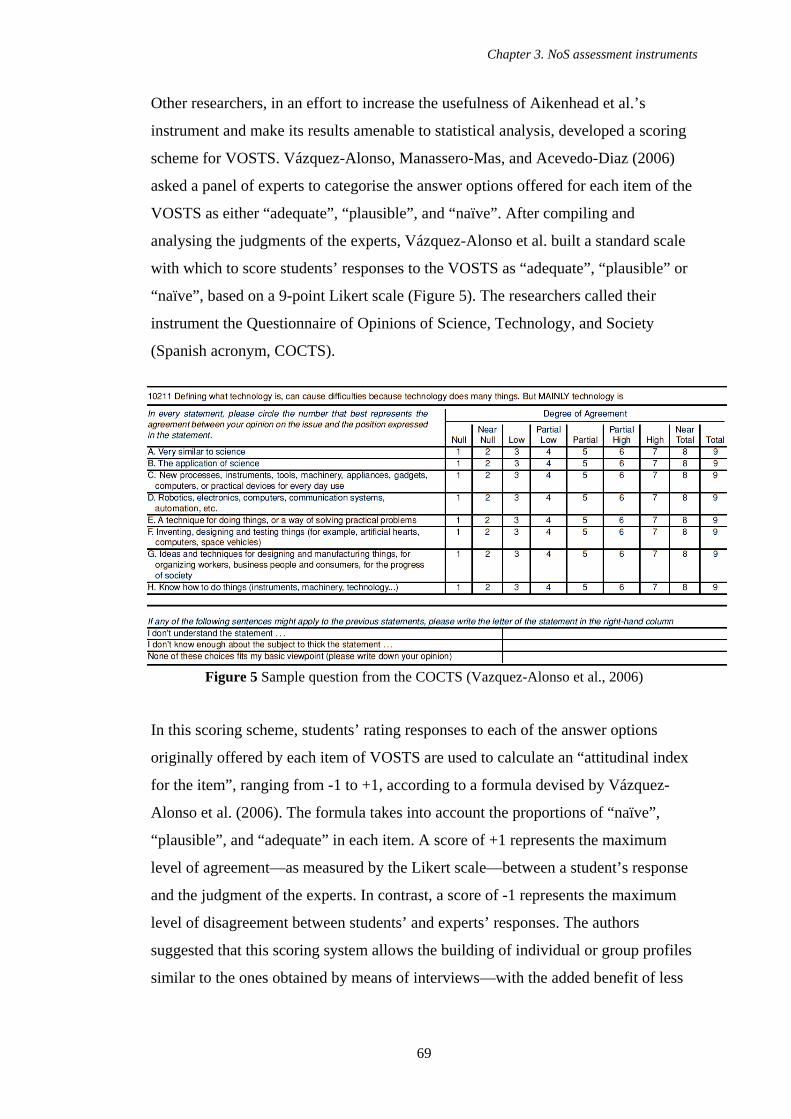
Chapter 3. NoS assessment instruments
69
Other researchers, in an effort to increase the usefulness of Aikenhead et al.’s
instrument and make its results amenable to statistical analysis, developed a scoring
scheme for VOSTS. Vázquez-Alonso, Manassero-Mas, and Acevedo-Diaz (2006)
asked a panel of experts to categorise the answer options offered for each item of the
VOSTS as either “adequate”, “plausible”, and “naïve”. After compiling and
analysing the judgments of the experts, Vázquez-Alonso et al. built a standard scale
with which to score students’ responses to the VOSTS as “adequate”, “plausible” or
“naïve”, based on a 9-point Likert scale (Figure 5). The researchers called their
instrument the Questionnaire of Opinions of Science, Technology, and Society
(Spanish acronym, COCTS).
Figure 5 Sample question from the COCTS (Vazquez-Alonso et al., 2006)
In this scoring scheme, students’ rating responses to each of the answer options
originally offered by each item of VOSTS are used to calculate an “attitudinal index
for the item”, ranging from -1 to +1, according to a formula devised by Vázquez-
Alonso et al. (2006). The formula takes into account the proportions of “naïve”,
“plausible”, and “adequate” in each item. A score of +1 represents the maximum
level of agreement—as measured by the Likert scale—between a student’s response
and the judgment of the experts. In contrast, a score of -1 represents the maximum
level of disagreement between students’ and experts’ responses. The authors
suggested that this scoring system allows the building of individual or group profiles
similar to the ones obtained by means of interviews—with the added benefit of less
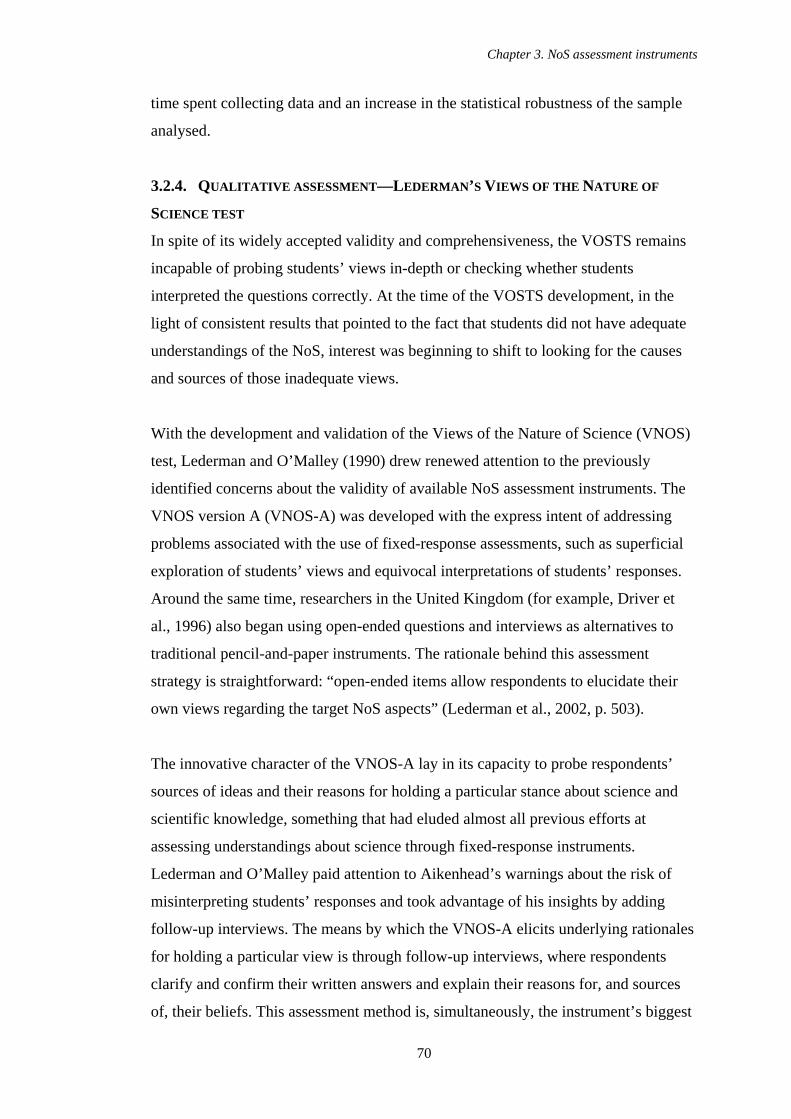
Chapter 3. NoS assessment instruments
70
time spent collecting data and an increase in the statistical robustness of the sample
analysed.
3.2.4. QUALITATIVE ASSESSMENT—LEDERMAN’S VIEWS OF THE NATURE OF
SCIENCE TEST
In spite of its widely accepted validity and comprehensiveness, the VOSTS remains
incapable of probing students’ views in-depth or checking whether students
interpreted the questions correctly. At the time of the VOSTS development, in the
light of consistent results that pointed to the fact that students did not have adequate
understandings of the NoS, interest was beginning to shift to looking for the causes
and sources of those inadequate views.
With the development and validation of the Views of the Nature of Science (VNOS)
test, Lederman and O’Malley (1990) drew renewed attention to the previously
identified concerns about the validity of available NoS assessment instruments. The
VNOS version A (VNOS-A) was developed with the express intent of addressing
problems associated with the use of fixed-response assessments, such as superficial
exploration of students’ views and equivocal interpretations of students’ responses.
Around the same time, researchers in the United Kingdom (for example, Driver et
al., 1996) also began using open-ended questions and interviews as alternatives to
traditional pencil-and-paper instruments. The rationale behind this assessment
strategy is straightforward: “open-ended items allow respondents to elucidate their
own views regarding the target NoS aspects” (Lederman et al., 2002, p. 503).
The innovative character of the VNOS-A lay in its capacity to probe respondents’
sources of ideas and their reasons for holding a particular stance about science and
scientific knowledge, something that had eluded almost all previous efforts at
assessing understandings about science through fixed-response instruments.
Lederman and O’Malley paid attention to Aikenhead’s warnings about the risk of
misinterpreting students’ responses and took advantage of his insights by adding
follow-up interviews. The means by which the VNOS-A elicits underlying rationales
for holding a particular view is through follow-up interviews, where respondents
clarify and confirm their written answers and explain their reasons for, and sources
of, their beliefs. This assessment method is, simultaneously, the instrument’s biggest
Chapter 3. NoS assessment instruments
71
strength and liability. By its very nature the VNOS-A is unsuitable for large-scale
assessment required by nationwide curriculum reform efforts. On the other hand, the
VNOS-A instrument addresses concerns raised by traditional paper-and-pencil,
fixed-response instruments, in particular, the lack of construct validity of the views
elicited.
Figure 6 Sample question from VNOS-A (Lederman and O’ Malley, 1990)
Originally, the VNOS-A comprised seven open-ended items (Figure 6) that covered
the underlying dimensions of the tentativeness of scientific knowledge discussed
above. The application of the instrument to 69 students from a small rural high
school in western Oregon, spanning all four science classes (physical science,
biology, chemistry, and physics), brought to light several relevant issues concerning
the assessment of understanding of the NoS and confirmed Aikenhead’s concerns
about fixed-response tests. From their study, Lederman and O’Malley concluded that
the follow-up interviews fulfilled several research aims. They
validated the written questionnaire by eliciting what students believe are the
purpose and the meaning of the items;
probed students’ reasons for their beliefs, as well as their sources, providing a
fuller account of students’ views;
unearthed what kind, if any, of experiences effected a change in students’
views about the NoS; and
reduced the misinterpretation on the part of the researchers of what students
actually mean to say (p. 288).
Unexpectedly, the authors found out that students’ views about the tentativeness of
science were inconsistent: whereas two of the items revealed that students held an
absolutist stance, the responses to the remaining two items revealed that their views
corresponded to a tentative stance. This led the researchers to conclude that it “is
possible for students to compartmentalize their views with respect to the type of
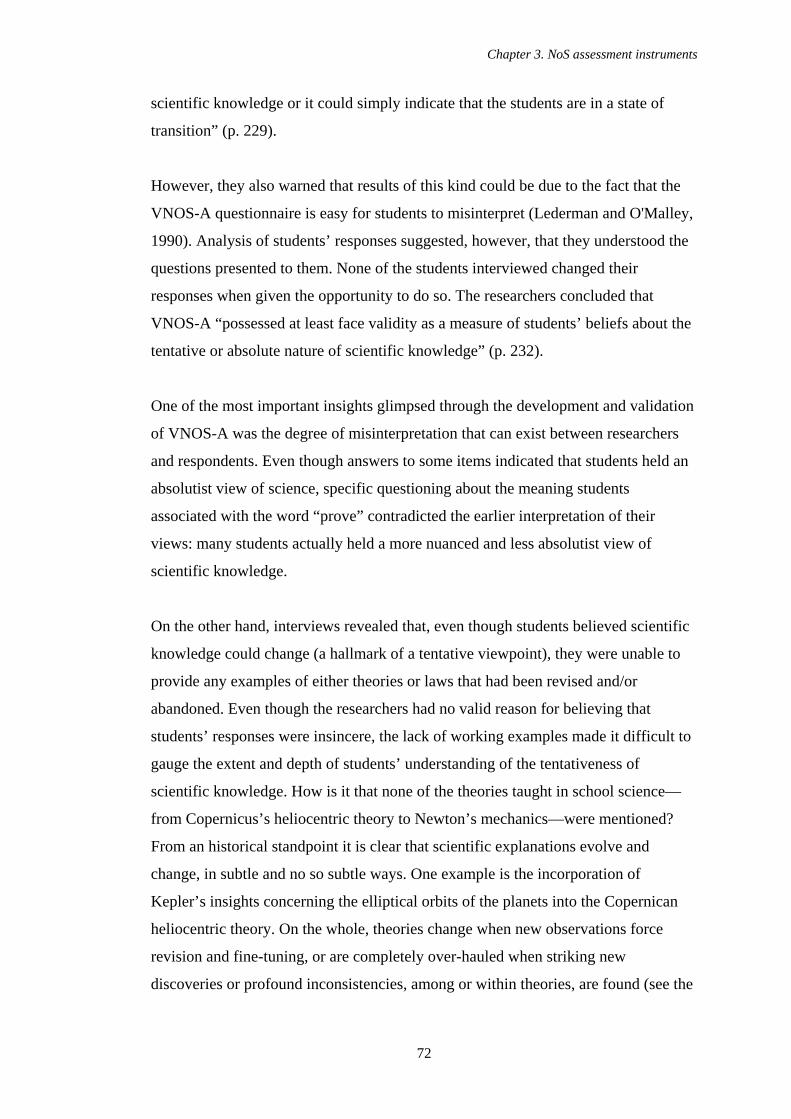
Chapter 3. NoS assessment instruments
72
scientific knowledge or it could simply indicate that the students are in a state of
transition” (p. 229).
However, they also warned that results of this kind could be due to the fact that the
VNOS-A questionnaire is easy for students to misinterpret (Lederman and O'Malley,
1990). Analysis of students’ responses suggested, however, that they understood the
questions presented to them. None of the students interviewed changed their
responses when given the opportunity to do so. The researchers concluded that
VNOS-A “possessed at least face validity as a measure of students’ beliefs about the
tentative or absolute nature of scientific knowledge” (p. 232).
One of the most important insights glimpsed through the development and validation
of VNOS-A was the degree of misinterpretation that can exist between researchers
and respondents. Even though answers to some items indicated that students held an
absolutist view of science, specific questioning about the meaning students
associated with the word “prove” contradicted the earlier interpretation of their
views: many students actually held a more nuanced and less absolutist view of
scientific knowledge.
On the other hand, interviews revealed that, even though students believed scientific
knowledge could change (a hallmark of a tentative viewpoint), they were unable to
provide any examples of either theories or laws that had been revised and/or
abandoned. Even though the researchers had no valid reason for believing that
students’ responses were insincere, the lack of working examples made it difficult to
gauge the extent and depth of students’ understanding of the tentativeness of
scientific knowledge. How is it that none of the theories taught in school science—
from Copernicus’s heliocentric theory to Newton’s mechanics—were mentioned?
From an historical standpoint it is clear that scientific explanations evolve and
change, in subtle and no so subtle ways. One example is the incorporation of
Kepler’s insights concerning the elliptical orbits of the planets into the Copernican
heliocentric theory. On the whole, theories change when new observations force
revision and fine-tuning, or are completely over-hauled when striking new
discoveries or profound inconsistencies, among or within theories, are found (see the
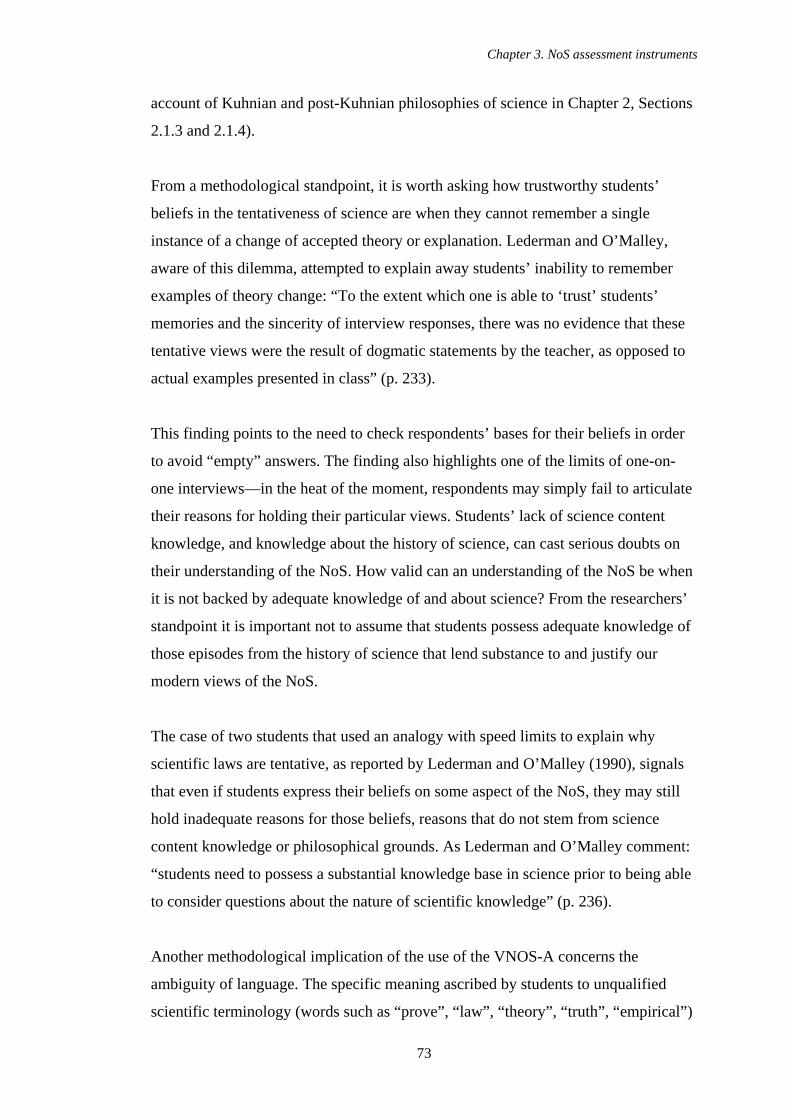
Chapter 3. NoS assessment instruments
73
account of Kuhnian and post-Kuhnian philosophies of science in Chapter 2, Sections
2.1.3 and 2.1.4).
From a methodological standpoint, it is worth asking how trustworthy students’
beliefs in the tentativeness of science are when they cannot remember a single
instance of a change of accepted theory or explanation. Lederman and O’Malley,
aware of this dilemma, attempted to explain away students’ inability to remember
examples of theory change: “To the extent which one is able to ‘trust’ students’
memories and the sincerity of interview responses, there was no evidence that these
tentative views were the result of dogmatic statements by the teacher, as opposed to
actual examples presented in class” (p. 233).
This finding points to the need to check respondents’ bases for their beliefs in order
to avoid “empty” answers. The finding also highlights one of the limits of one-on-
one interviews—in the heat of the moment, respondents may simply fail to articulate
their reasons for holding their particular views. Students’ lack of science content
knowledge, and knowledge about the history of science, can cast serious doubts on
their understanding of the NoS. How valid can an understanding of the NoS be when
it is not backed by adequate knowledge of and about science? From the researchers’
standpoint it is important not to assume that students possess adequate knowledge of
those episodes from the history of science that lend substance to and justify our
modern views of the NoS.
The case of two students that used an analogy with speed limits to explain why
scientific laws are tentative, as reported by Lederman and O’Malley (1990), signals
that even if students express their beliefs on some aspect of the NoS, they may still
hold inadequate reasons for those beliefs, reasons that do not stem from science
content knowledge or philosophical grounds. As Lederman and O’Malley comment:
“students need to possess a substantial knowledge base in science prior to being able
to consider questions about the nature of scientific knowledge” (p. 236).
Another methodological implication of the use of the VNOS-A concerns the
ambiguity of language. The specific meaning ascribed by students to unqualified
scientific terminology (words such as “prove”, “law”, “theory”, “truth”, “empirical”)
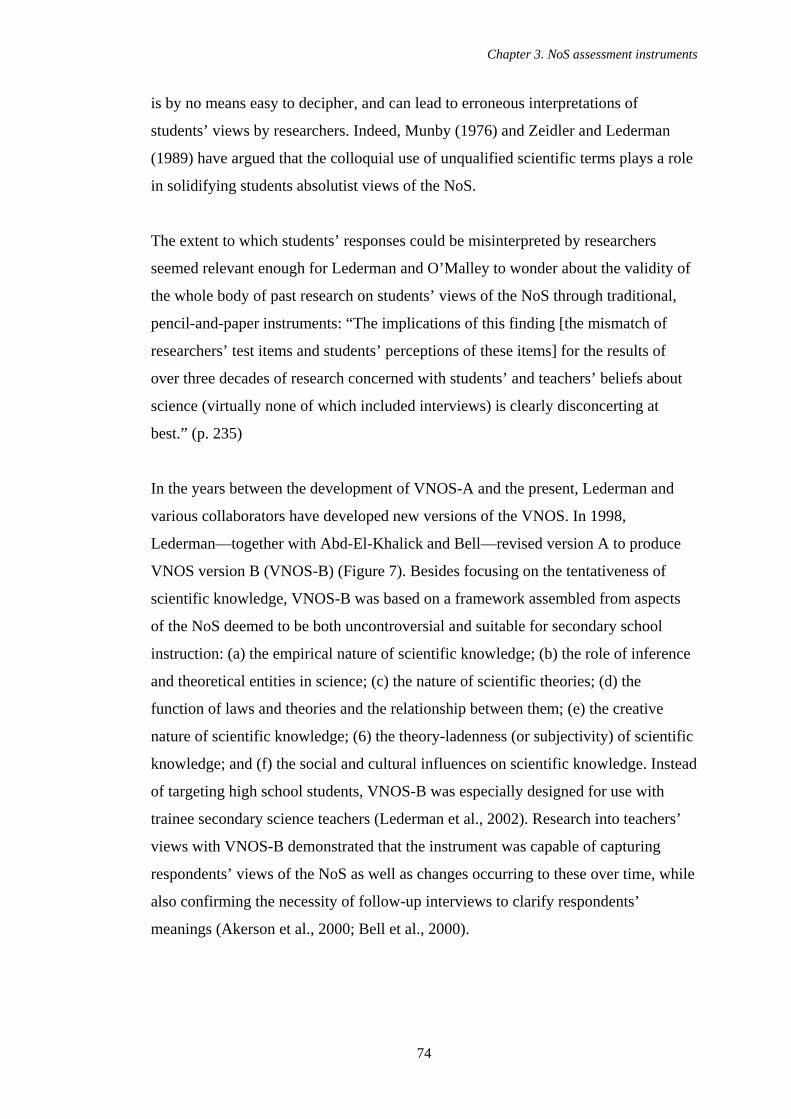
Chapter 3. NoS assessment instruments
74
is by no means easy to decipher, and can lead to erroneous interpretations of
students’ views by researchers. Indeed, Munby (1976) and Zeidler and Lederman
(1989) have argued that the colloquial use of unqualified scientific terms plays a role
in solidifying students absolutist views of the NoS.
The extent to which students’ responses could be misinterpreted by researchers
seemed relevant enough for Lederman and O’Malley to wonder about the validity of
the whole body of past research on students’ views of the NoS through traditional,
pencil-and-paper instruments: “The implications of this finding [the mismatch of
researchers’ test items and students’ perceptions of these items] for the results of
over three decades of research concerned with students’ and teachers’ beliefs about
science (virtually none of which included interviews) is clearly disconcerting at
best.” (p. 235)
In the years between the development of VNOS-A and the present, Lederman and
various collaborators have developed new versions of the VNOS. In 1998,
Lederman—together with Abd-El-Khalick and Bell—revised version A to produce
VNOS version B (VNOS-B) (Figure 7). Besides focusing on the tentativeness of
scientific knowledge, VNOS-B was based on a framework assembled from aspects
of the NoS deemed to be both uncontroversial and suitable for secondary school
instruction: (a) the empirical nature of scientific knowledge; (b) the role of inference
and theoretical entities in science; (c) the nature of scientific theories; (d) the
function of laws and theories and the relationship between them; (e) the creative
nature of scientific knowledge; (6) the theory-ladenness (or subjectivity) of scientific
knowledge; and (f) the social and cultural influences on scientific knowledge. Instead
of targeting high school students, VNOS-B was especially designed for use with
trainee secondary science teachers (Lederman et al., 2002). Research into teachers’
views with VNOS-B demonstrated that the instrument was capable of capturing
respondents’ views of the NoS as well as changes occurring to these over time, while
also confirming the necessity of follow-up interviews to clarify respondents’
meanings (Akerson et al., 2000; Bell et al., 2000).
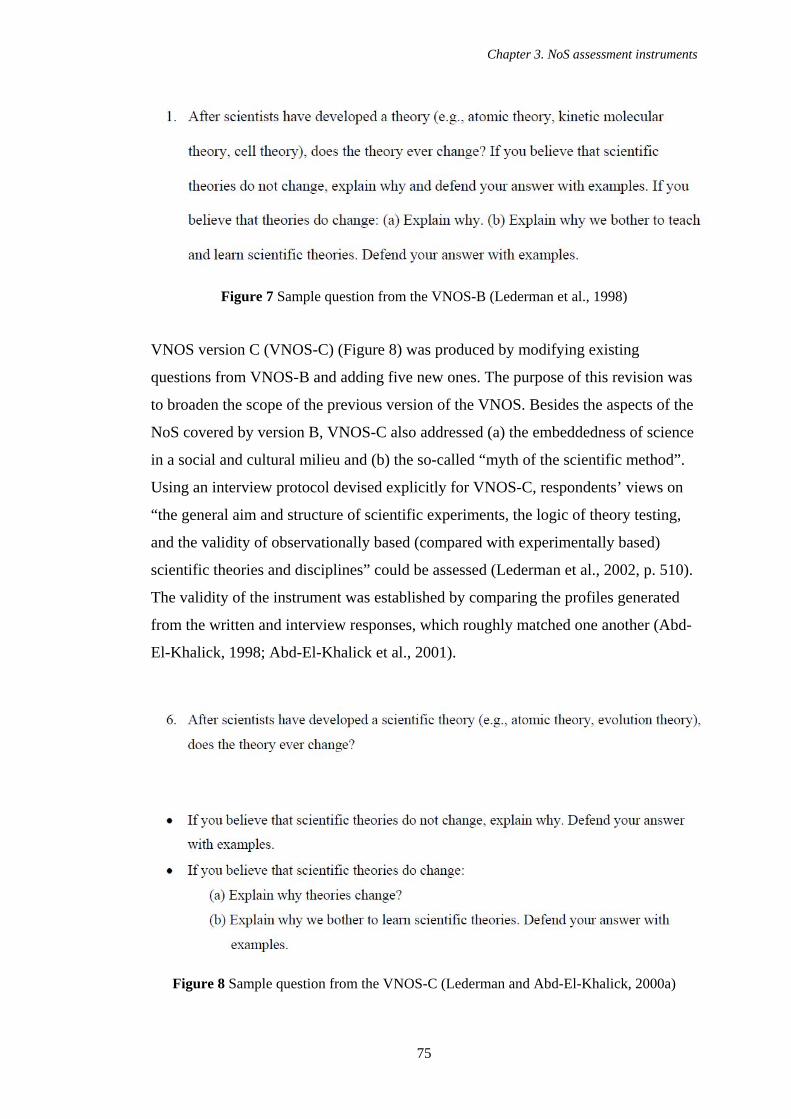
Chapter 3. NoS assessment instruments
75
Figure 7 Sample question from the VNOS-B (Lederman et al., 1998)
VNOS version C (VNOS-C) (Figure 8) was produced by modifying existing
questions from VNOS-B and adding five new ones. The purpose of this revision was
to broaden the scope of the previous version of the VNOS. Besides the aspects of the
NoS covered by version B, VNOS-C also addressed (a) the embeddedness of science
in a social and cultural milieu and (b) the so-called “myth of the scientific method”.
Using an interview protocol devised explicitly for VNOS-C, respondents’ views on
“the general aim and structure of scientific experiments, the logic of theory testing,
and the validity of observationally based (compared with experimentally based)
scientific theories and disciplines” could be assessed (Lederman et al., 2002, p. 510).
The validity of the instrument was established by comparing the profiles generated
from the written and interview responses, which roughly matched one another (Abd-
El-Khalick, 1998; Abd-El-Khalick et al., 2001).
Figure 8 Sample question from the VNOS-C (Lederman and Abd-El-Khalick, 2000a)
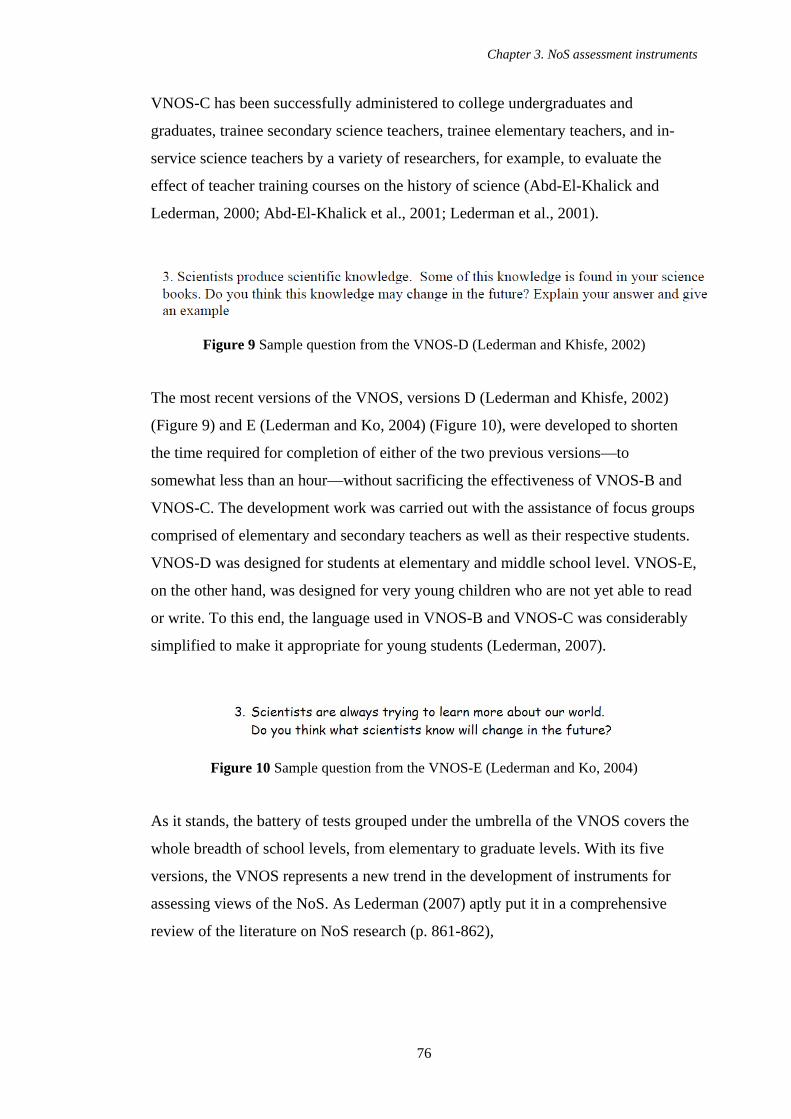
Chapter 3. NoS assessment instruments
76
VNOS-C has been successfully administered to college undergraduates and
graduates, trainee secondary science teachers, trainee elementary teachers, and in-
service science teachers by a variety of researchers, for example, to evaluate the
effect of teacher training courses on the history of science (Abd-El-Khalick and
Lederman, 2000; Abd-El-Khalick et al., 2001; Lederman et al., 2001).
Figure 9 Sample question from the VNOS-D (Lederman and Khisfe, 2002)
The most recent versions of the VNOS, versions D (Lederman and Khisfe, 2002)
(Figure 9) and E (Lederman and Ko, 2004) (Figure 10), were developed to shorten
the time required for completion of either of the two previous versions—to
somewhat less than an hour—without sacrificing the effectiveness of VNOS-B and
VNOS-C. The development work was carried out with the assistance of focus groups
comprised of elementary and secondary teachers as well as their respective students.
VNOS-D was designed for students at elementary and middle school level. VNOS-E,
on the other hand, was designed for very young children who are not yet able to read
or write. To this end, the language used in VNOS-B and VNOS-C was considerably
simplified to make it appropriate for young students (Lederman, 2007).
Figure 10 Sample question from the VNOS-E (Lederman and Ko, 2004)
As it stands, the battery of tests grouped under the umbrella of the VNOS covers the
whole breadth of school levels, from elementary to graduate levels. With its five
versions, the VNOS represents a new trend in the development of instruments for
assessing views of the NoS. As Lederman (2007) aptly put it in a comprehensive
review of the literature on NoS research (p. 861-862),
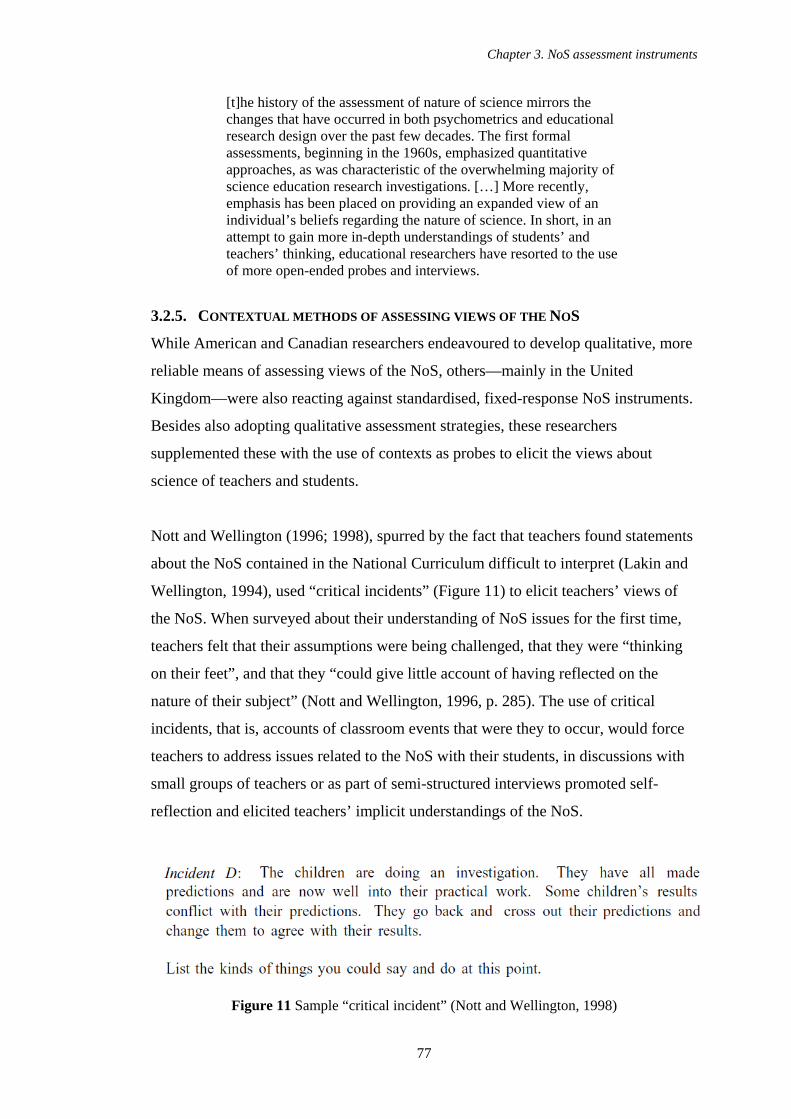
Chapter 3. NoS assessment instruments
77
[t]he history of the assessment of nature of science mirrors the changes that have occurred in both psychometrics and educational research design over the past few decades. The first formal assessments, beginning in the 1960s, emphasized quantitative approaches, as was characteristic of the overwhelming majority of science education research investigations. […] More recently, emphasis has been placed on providing an expanded view of an individual’s beliefs regarding the nature of science. In short, in an attempt to gain more in-depth understandings of students’ and teachers’ thinking, educational researchers have resorted to the use of more open-ended probes and interviews.
3.2.5. CONTEXTUAL METHODS OF ASSESSING VIEWS OF THE NOS
While American and Canadian researchers endeavoured to develop qualitative, more
reliable means of assessing views of the NoS, others—mainly in the United
Kingdom—were also reacting against standardised, fixed-response NoS instruments.
Besides also adopting qualitative assessment strategies, these researchers
supplemented these with the use of contexts as probes to elicit the views about
science of teachers and students.
Nott and Wellington (1996; 1998), spurred by the fact that teachers found statements
about the NoS contained in the National Curriculum difficult to interpret (Lakin and
Wellington, 1994), used “critical incidents” (Figure 11) to elicit teachers’ views of
the NoS. When surveyed about their understanding of NoS issues for the first time,
teachers felt that their assumptions were being challenged, that they were “thinking
on their feet”, and that they “could give little account of having reflected on the
nature of their subject” (Nott and Wellington, 1996, p. 285). The use of critical
incidents, that is, accounts of classroom events that were they to occur, would force
teachers to address issues related to the NoS with their students, in discussions with
small groups of teachers or as part of semi-structured interviews promoted self-
reflection and elicited teachers’ implicit understandings of the NoS.
Figure 11 Sample “critical incident” (Nott and Wellington, 1998)
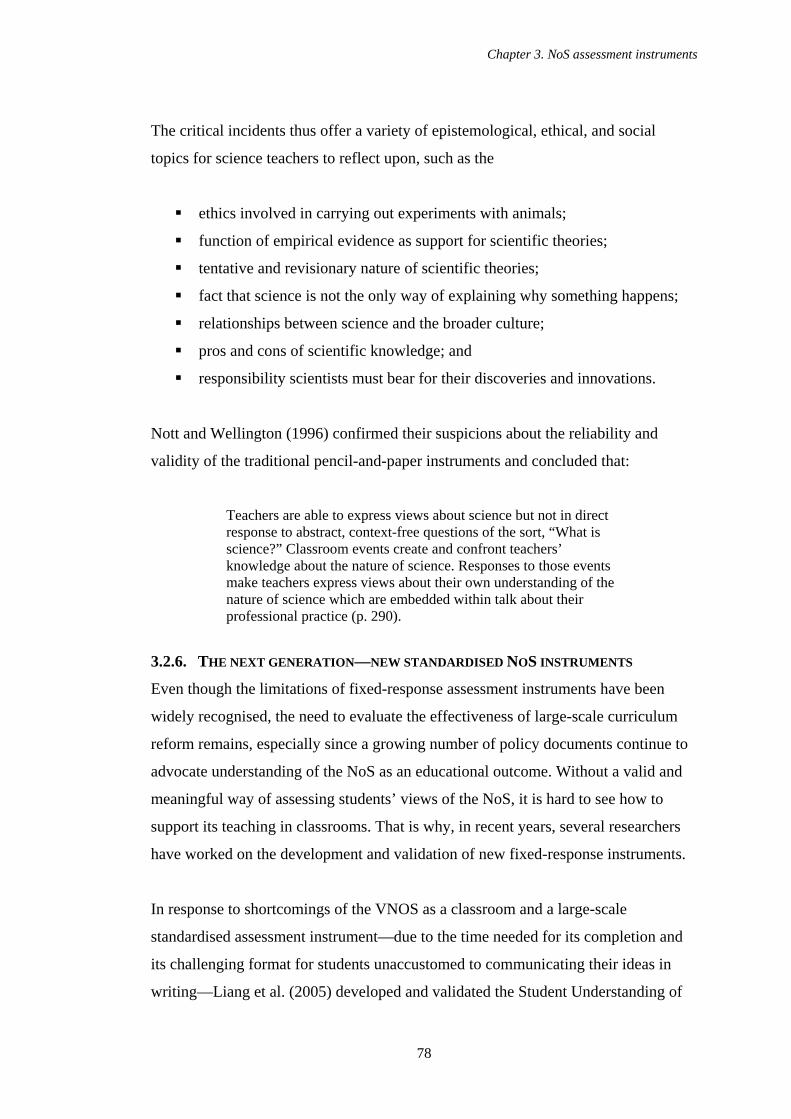
Chapter 3. NoS assessment instruments
78
The critical incidents thus offer a variety of epistemological, ethical, and social
topics for science teachers to reflect upon, such as the
ethics involved in carrying out experiments with animals;
function of empirical evidence as support for scientific theories;
tentative and revisionary nature of scientific theories;
fact that science is not the only way of explaining why something happens;
relationships between science and the broader culture;
pros and cons of scientific knowledge; and
responsibility scientists must bear for their discoveries and innovations.
Nott and Wellington (1996) confirmed their suspicions about the reliability and
validity of the traditional pencil-and-paper instruments and concluded that:
Teachers are able to express views about science but not in direct response to abstract, context-free questions of the sort, “What is science?” Classroom events create and confront teachers’ knowledge about the nature of science. Responses to those events make teachers express views about their own understanding of the nature of science which are embedded within talk about their professional practice (p. 290).
3.2.6. THE NEXT GENERATION—NEW STANDARDISED NOS INSTRUMENTS
Even though the limitations of fixed-response assessment instruments have been
widely recognised, the need to evaluate the effectiveness of large-scale curriculum
reform remains, especially since a growing number of policy documents continue to
advocate understanding of the NoS as an educational outcome. Without a valid and
meaningful way of assessing students’ views of the NoS, it is hard to see how to
support its teaching in classrooms. That is why, in recent years, several researchers
have worked on the development and validation of new fixed-response instruments.
In response to shortcomings of the VNOS as a classroom and a large-scale
standardised assessment instrument—due to the time needed for its completion and
its challenging format for students unaccustomed to communicating their ideas in
writing—Liang et al. (2005) developed and validated the Student Understanding of
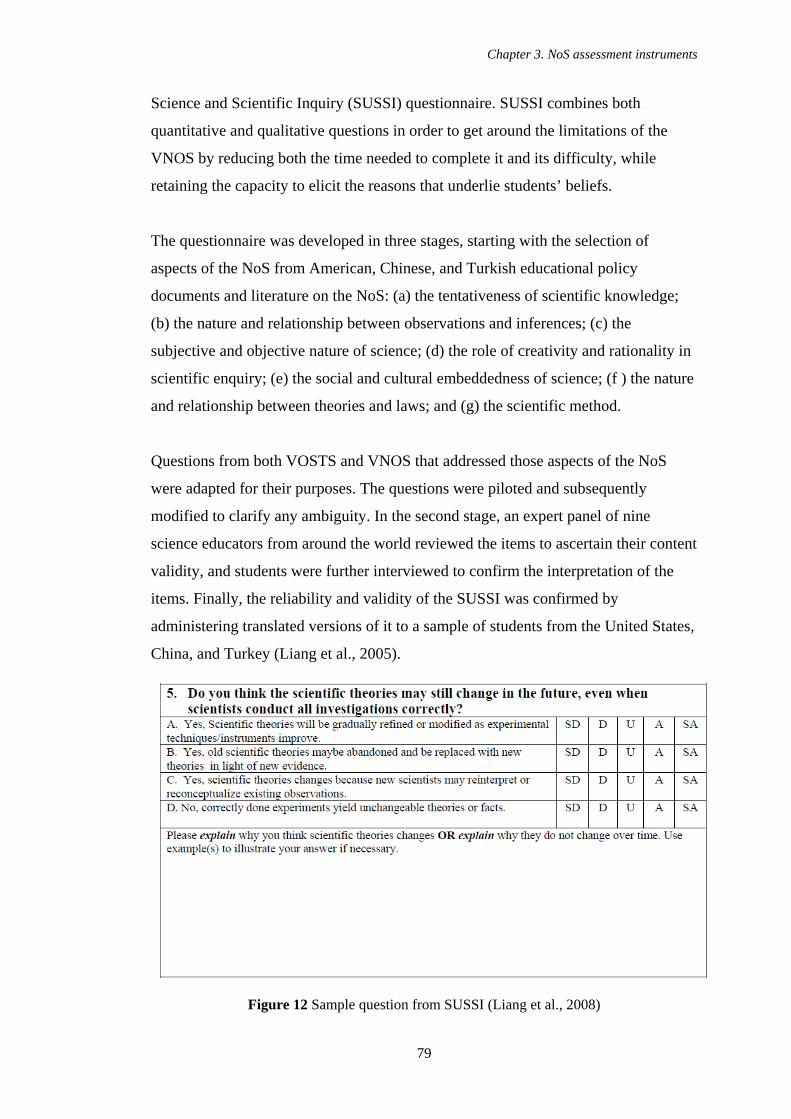
Chapter 3. NoS assessment instruments
79
Science and Scientific Inquiry (SUSSI) questionnaire. SUSSI combines both
quantitative and qualitative questions in order to get around the limitations of the
VNOS by reducing both the time needed to complete it and its difficulty, while
retaining the capacity to elicit the reasons that underlie students’ beliefs.
The questionnaire was developed in three stages, starting with the selection of
aspects of the NoS from American, Chinese, and Turkish educational policy
documents and literature on the NoS: (a) the tentativeness of scientific knowledge;
(b) the nature and relationship between observations and inferences; (c) the
subjective and objective nature of science; (d) the role of creativity and rationality in
scientific enquiry; (e) the social and cultural embeddedness of science; (f ) the nature
and relationship between theories and laws; and (g) the scientific method.
Questions from both VOSTS and VNOS that addressed those aspects of the NoS
were adapted for their purposes. The questions were piloted and subsequently
modified to clarify any ambiguity. In the second stage, an expert panel of nine
science educators from around the world reviewed the items to ascertain their content
validity, and students were further interviewed to confirm the interpretation of the
items. Finally, the reliability and validity of the SUSSI was confirmed by
administering translated versions of it to a sample of students from the United States,
China, and Turkey (Liang et al., 2005).
Figure 12 Sample question from SUSSI (Liang et al., 2008)
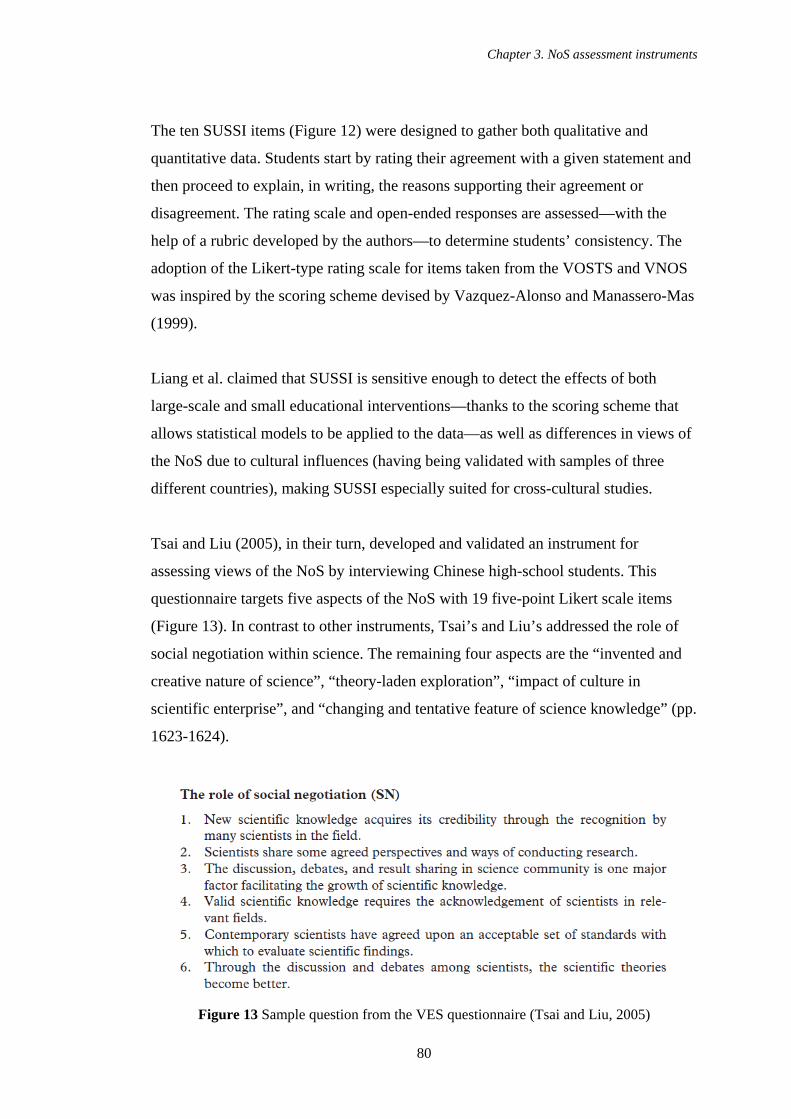
Chapter 3. NoS assessment instruments
80
The ten SUSSI items (Figure 12) were designed to gather both qualitative and
quantitative data. Students start by rating their agreement with a given statement and
then proceed to explain, in writing, the reasons supporting their agreement or
disagreement. The rating scale and open-ended responses are assessed—with the
help of a rubric developed by the authors—to determine students’ consistency. The
adoption of the Likert-type rating scale for items taken from the VOSTS and VNOS
was inspired by the scoring scheme devised by Vazquez-Alonso and Manassero-Mas
(1999).
Liang et al. claimed that SUSSI is sensitive enough to detect the effects of both
large-scale and small educational interventions—thanks to the scoring scheme that
allows statistical models to be applied to the data—as well as differences in views of
the NoS due to cultural influences (having being validated with samples of three
different countries), making SUSSI especially suited for cross-cultural studies.
Tsai and Liu (2005), in their turn, developed and validated an instrument for
assessing views of the NoS by interviewing Chinese high-school students. This
questionnaire targets five aspects of the NoS with 19 five-point Likert scale items
(Figure 13). In contrast to other instruments, Tsai’s and Liu’s addressed the role of
social negotiation within science. The remaining four aspects are the “invented and
creative nature of science”, “theory-laden exploration”, “impact of culture in
scientific enterprise”, and “changing and tentative feature of science knowledge” (pp.
1623-1624).
Figure 13 Sample question from the VES questionnaire (Tsai and Liu, 2005)
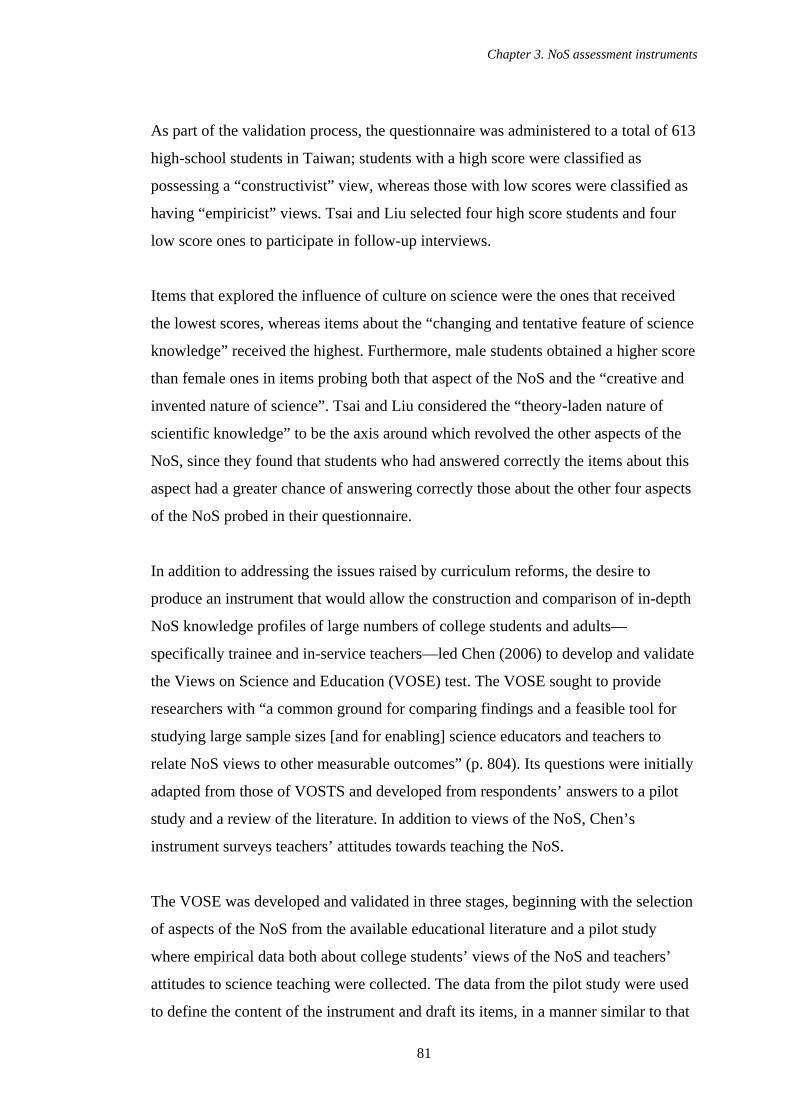
Chapter 3. NoS assessment instruments
81
As part of the validation process, the questionnaire was administered to a total of 613
high-school students in Taiwan; students with a high score were classified as
possessing a “constructivist” view, whereas those with low scores were classified as
having “empiricist” views. Tsai and Liu selected four high score students and four
low score ones to participate in follow-up interviews.
Items that explored the influence of culture on science were the ones that received
the lowest scores, whereas items about the “changing and tentative feature of science
knowledge” received the highest. Furthermore, male students obtained a higher score
than female ones in items probing both that aspect of the NoS and the “creative and
invented nature of science”. Tsai and Liu considered the “theory-laden nature of
scientific knowledge” to be the axis around which revolved the other aspects of the
NoS, since they found that students who had answered correctly the items about this
aspect had a greater chance of answering correctly those about the other four aspects
of the NoS probed in their questionnaire.
In addition to addressing the issues raised by curriculum reforms, the desire to
produce an instrument that would allow the construction and comparison of in-depth
NoS knowledge profiles of large numbers of college students and adults—
specifically trainee and in-service teachers—led Chen (2006) to develop and validate
the Views on Science and Education (VOSE) test. The VOSE sought to provide
researchers with “a common ground for comparing findings and a feasible tool for
studying large sample sizes [and for enabling] science educators and teachers to
relate NoS views to other measurable outcomes” (p. 804). Its questions were initially
adapted from those of VOSTS and developed from respondents’ answers to a pilot
study and a review of the literature. In addition to views of the NoS, Chen’s
instrument surveys teachers’ attitudes towards teaching the NoS.
The VOSE was developed and validated in three stages, beginning with the selection
of aspects of the NoS from the available educational literature and a pilot study
where empirical data both about college students’ views of the NoS and teachers’
attitudes to science teaching were collected. The data from the pilot study were used
to define the content of the instrument and draft its items, in a manner similar to that
Chapter 3. NoS assessment instruments
82
used by Aikenhead to develop VOSTS. The second stage involved the development
and testing of the questions, as well as the validation of the instrument’s content by a
panel of experts and its clarification through interviews with students. Finally, the
instrument was retested and interview data were used to determine its validity and
reliability (Chen, 2006).
The VOSE was based on a framework that includes many of the tenets of the NoS
used in the development of the VNOS series that have also been accepted by several
authors as both important and suitable for teaching (each representing a subcategory
in the questionnaire): (a) the tentativeness of scientific knowledge; (b) the theory-
ladenness of observation; (c) the inexistence of a unique scientific method; (d) the
relationship among hypotheses, laws, and theories; (e) the role of imagination; (f) the
validation of scientific knowledge; and (g) the subjective and objective nature of
science. Related to the above issues, VOSE included questions assessing teachers’
attitudes to teaching about the tentativeness of scientific knowledge, the nature of
observation, the scientific method, the relationship between theories and laws, and
the subjectivity of scientists (Chen, 2006).
Figure 14 Sample question from VOSE (Chen, 2006)
The questions of the VOSE pose either an abstract or a slightly contextualised
question and offer a series of statements to which the respondent has indicate his or
her degree of agreement (Figure 14). The data from the pilot study helped Chen to
Chapter 3. NoS assessment instruments
83
avoid over-generalised statements and clarify ambiguous ones, combine overlapping
and/or redundant answer statements, and separate those questions of the VOSTS that
asked respondents about “what science and scientists are like” (p. 807) from those
that ask what they ought to be like. In order to maximise the usefulness of the data
for statistical analyses, the VOSE produces a score for each subcategory and
incorporates a Likert scale and a scoring scheme along the lines of the one developed
by Vazquez-Alonso and Manassero-Mas (1999; 2006) for the VOSTS.
After finishing the validation of VOSE, Chen concluded that it was especially well
suited to the construction of in-depth profiles of respondents’ conceptions of the
NoS, being capable of portraying inconsistent positions within a respondent’s overall
profile. A comparative study of VOSE and VNOS with trainee teachers showed that
the domain covered by the former is more focused and that this facilitates its
application: the underlying reasons articulated by teachers to explain their answers to
the VNOS, although insightful, were not always relevant to the NoS aspects they
were being asked about. Furthermore, according to this study, teachers found it
harder and more frustrating to answer the VNOS than the VOSE, and required a
bigger effort to answer fully in the time allocated (Chen, 2006).
Ibrahim, Buffler, and Lubben (2009) have also developed a NoS assessment
instrument capable of producing profiles of students’ views. The Views About
Scientific Measurement (VASM) questionnaire comprises 14 items aimed at
investigating “the relationship between views on the NoS and the nature of scientific
measurement” (p. 250). The aspects of the NoS covered by the VASM are the (a)
nature of scientific knowledge; (b) use of creativity and the scientific method during
an experiment; (c) objective or subjective origins of scientific laws and theories; (d)
purpose of scientific experiments; (e) relationship between experiment and theory;
and (f) precedence of theoretical or experimental results (p. 250). The questions
addressing the first two aspects of the NoS were adapted from instruments developed
by Moss, Abrams and Robb (2001) and Lederman and O’Malley (1990),
respectively.
All the VASM questions are based on a context, for example, the measurement of the
magnetic field of the Earth and the diverse theories about its composition. Each
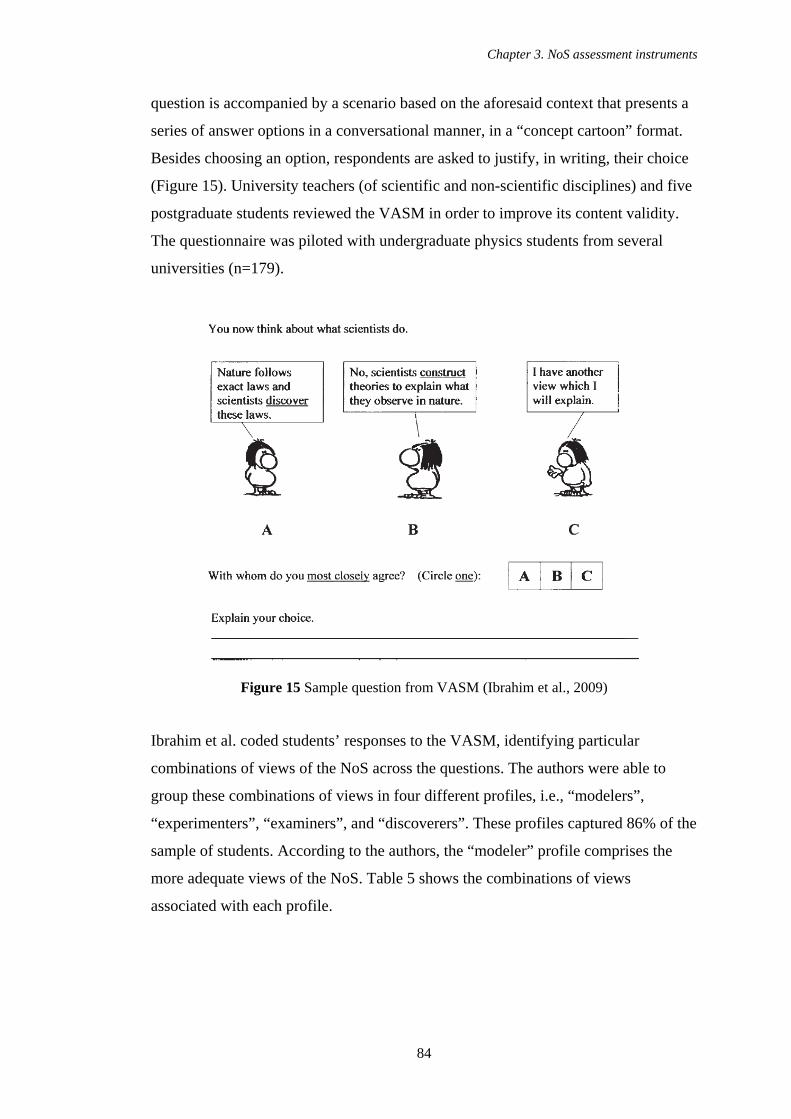
Chapter 3. NoS assessment instruments
84
question is accompanied by a scenario based on the aforesaid context that presents a
series of answer options in a conversational manner, in a “concept cartoon” format.
Besides choosing an option, respondents are asked to justify, in writing, their choice
(Figure 15). University teachers (of scientific and non-scientific disciplines) and five
postgraduate students reviewed the VASM in order to improve its content validity.
The questionnaire was piloted with undergraduate physics students from several
universities (n=179).
Figure 15 Sample question from VASM (Ibrahim et al., 2009)
Ibrahim et al. coded students’ responses to the VASM, identifying particular
combinations of views of the NoS across the questions. The authors were able to
group these combinations of views in four different profiles, i.e., “modelers”,
“experimenters”, “examiners”, and “discoverers”. These profiles captured 86% of the
sample of students. According to the authors, the “modeler” profile comprises the
more adequate views of the NoS. Table 5 shows the combinations of views
associated with each profile.
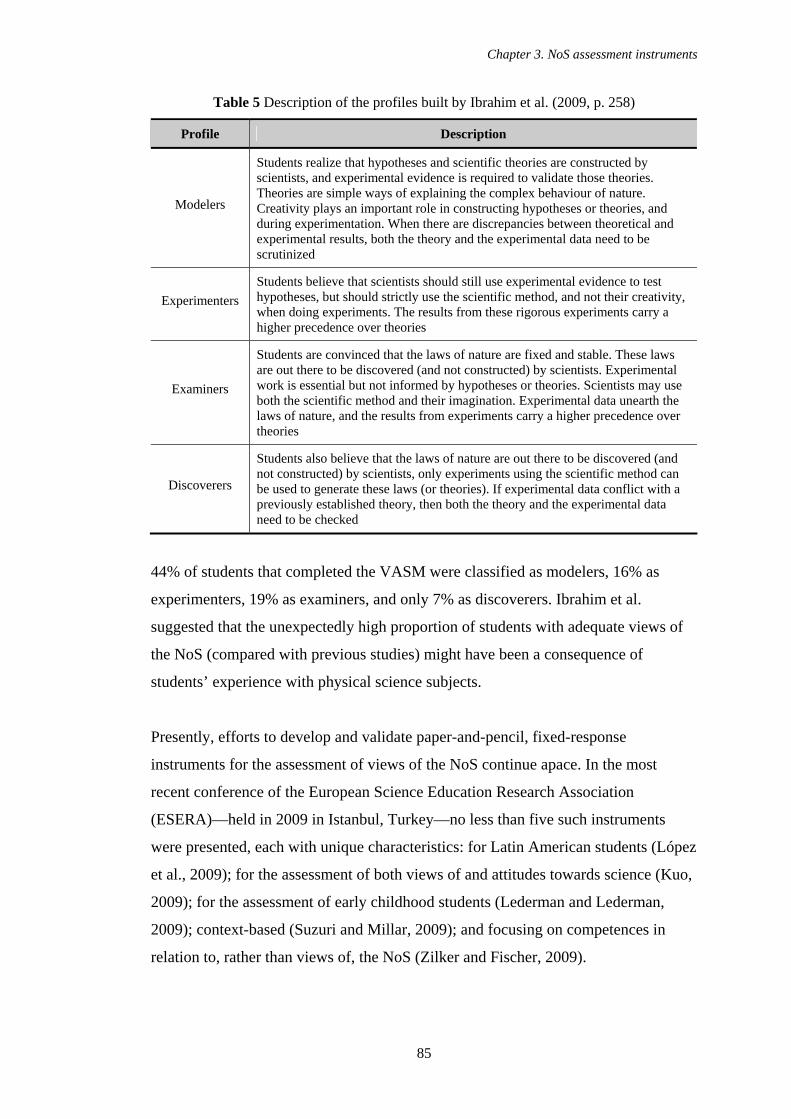
Chapter 3. NoS assessment instruments
85
Table 5 Description of the profiles built by Ibrahim et al. (2009, p. 258)
Profile Description
Modelers
Students realize that hypotheses and scientific theories are constructed by scientists, and experimental evidence is required to validate those theories. Theories are simple ways of explaining the complex behaviour of nature. Creativity plays an important role in constructing hypotheses or theories, and during experimentation. When there are discrepancies between theoretical and experimental results, both the theory and the experimental data need to be scrutinized
Experimenters Students believe that scientists should still use experimental evidence to test hypotheses, but should strictly use the scientific method, and not their creativity, when doing experiments. The results from these rigorous experiments carry a higher precedence over theories
Examiners
Students are convinced that the laws of nature are fixed and stable. These laws are out there to be discovered (and not constructed) by scientists. Experimental work is essential but not informed by hypotheses or theories. Scientists may use both the scientific method and their imagination. Experimental data unearth the laws of nature, and the results from experiments carry a higher precedence over theories
Discoverers
Students also believe that the laws of nature are out there to be discovered (and not constructed) by scientists, only experiments using the scientific method can be used to generate these laws (or theories). If experimental data conflict with a previously established theory, then both the theory and the experimental data need to be checked
44% of students that completed the VASM were classified as modelers, 16% as
experimenters, 19% as examiners, and only 7% as discoverers. Ibrahim et al.
suggested that the unexpectedly high proportion of students with adequate views of
the NoS (compared with previous studies) might have been a consequence of
students’ experience with physical science subjects.
Presently, efforts to develop and validate paper-and-pencil, fixed-response
instruments for the assessment of views of the NoS continue apace. In the most
recent conference of the European Science Education Research Association
(ESERA)—held in 2009 in Istanbul, Turkey—no less than five such instruments
were presented, each with unique characteristics: for Latin American students (López
et al., 2009); for the assessment of both views of and attitudes towards science (Kuo,
2009); for the assessment of early childhood students (Lederman and Lederman,
2009); context-based (Suzuri and Millar, 2009); and focusing on competences in
relation to, rather than views of, the NoS (Zilker and Fischer, 2009).
Chapter 3. NoS assessment instruments
86
These continuing efforts notwithstanding, Aikenhead’s VOSTS and Lederman’s
VNOS continue to be the most influential instruments available—an influence made
evident by researchers’ continued efforts to adapt and improve on them.
Unfortunately, and despite the best efforts to produce valid and reliable instruments
with which to assess students’ and teachers’ views of the NoS, there is still need for
instruments suitable for the summative assessment implied by the widespread
inclusion of the NoS in science curricula. Furthermore, the health of research on the
NoS itself depends, in large part, on the availability of assessments capable of
probing individual’s understanding of the NoS.
Chapter 4. Rationale of the NoST
87
4. CHAPTER 4
RATIONALE OF THE NATURE OF SCIENCE TEST
4.1. OVERVIEW OF THE RATIONALE Available instruments for assessing views of the NoS have been subjected to four
main lines of criticism: (a) questionable content validity, resulting from the
assessment of topics outside the scope of the NoS (such as attitudes to science and/or
scientific enquiry, or process, skills); (b) lack of subscales with which to build
knowledge profiles of respondents’ understandings of the NoS; (c) reliance on
abstract and ambiguous concepts (“science” or “scientists”) that place additional
cognitive demands on respondents; and (d) inherent problems related to the
equivocal interpretation of fixed-response items, i.e., respondents misinterpret
items—or interpret them in ways unintended by the researchers—while researchers
misinterpret responses (for a fuller account, see Lederman et al., 1998).
The rationale behind the design of the NoST attempts to deal explicitly with the
above criticisms by (a) selecting essential epistemological aspects of science that 16-
year olds should be familiar with; (b) defining subscales for the assessment of
students’ views and construction of profiles; (c) providing short scientific episodes as
contexts for the questions which specify and clarify the scope of the question and
alleviate the need to think up examples and; and (d) checking students’
interpretations through focus group interviews.
In the end, six forms of the test were prepared, each with a different story from the
history of science as a context. Each contains the same set of questions that, in their
turn, share the same general structure: an introductory segment that links the idea of
the NoS being assessed to the context, followed by a stem segment that poses the
question or a situation related to it and that leads to three alternative answer options
(Figure 16, Box B). A seventh question (Figure 16, Box A), dealing with the
difference between data and explanations, asks respondents to classify a series of
statements as one or the other.
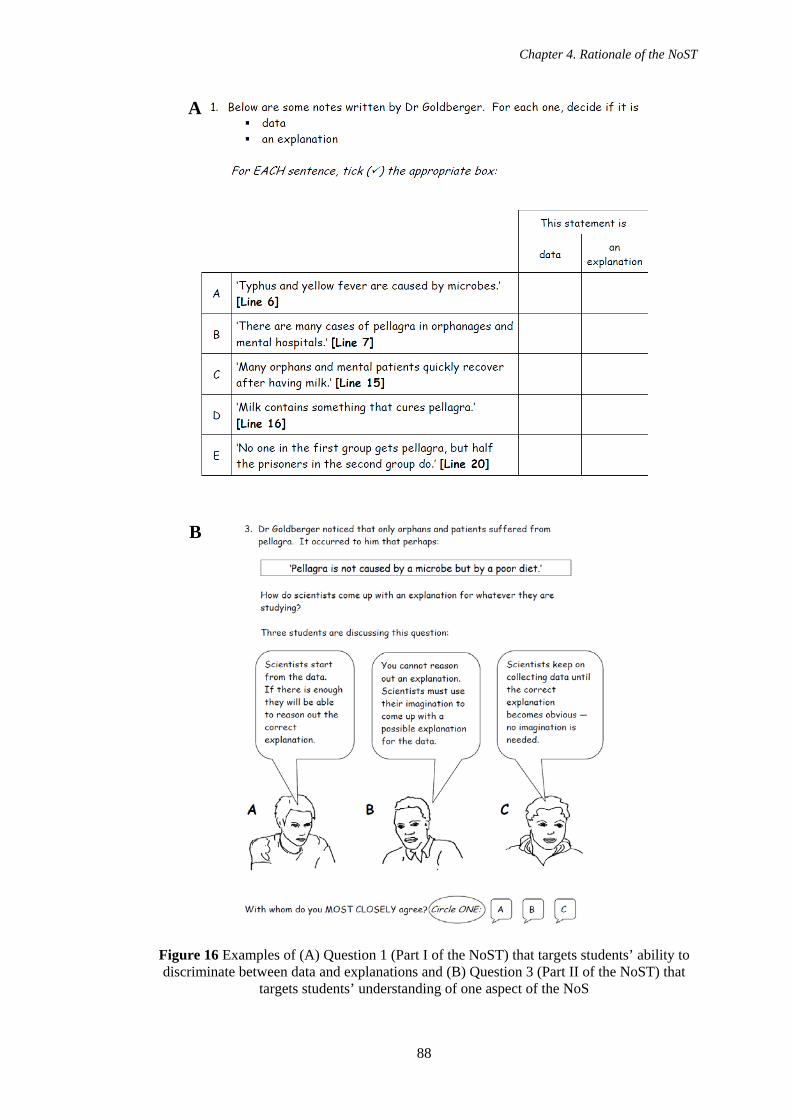
Chapter 4. Rationale of the NoST
88
Figure 16 Examples of (A) Question 1 (Part I of the NoST) that targets students’ ability to discriminate between data and explanations and (B) Question 3 (Part II of the NoST) that
targets students’ understanding of one aspect of the NoS
A
B
Chapter 4. Rationale of the NoST
89
The purpose of the Figure above is to familiarise the reader with the layout of the
NoST before presenting the rationale behind its development. What follows then is a
detailed account and justification of the underlying assumptions of the NoST,
starting with the framework of ideas about the NoS upon which it is based and the
nature of the subscales built into both framework and test, followed by the use of
episodes as contexts, the choices made—in terms of language—to facilitate students’
understanding of the test and minimise misconceptions, the drafting of the questions,
and, finally, the presentation of alternative positions through “concept cartoons”. All
these activities were carried out simultaneously, in that the framework and the form
of the test influenced each other in an iterative manner.
4.2. SOURCES OF THE CONTENT FRAMEWORK Adequate and explicit discussion of the assumptions underlying the choice of ideas
about the NoS to be assessed has been often seen as lacking from previous efforts to
design assessment instruments. As Alters (1997) has commented:
Two decades ago Lucas (1975) pointed out that the developers of current instruments of the time, NOSS, SPI, TSAS, and in particular TOUS, needed to “recognize that conflicting models of science exist” and recommended that they “explicitly specify the philosophic assumption(s) of the instruments” (p. 484). […] The basis for arrival at the tenets, whether in quantitative or qualitative instrumentation and related reporting, is almost universally absent from the literature (pp. 39-40).
In the light of this, the purpose of this section is to explicate the criteria that led to the
framework upon which the NoST is based.
To determine what to include in the framework, a survey of the educational literature
on the subject was conducted. From it, ideas about the NoS were compiled. Four
kinds of sources were used: (a) ideas about how science and scientists work, as
implied by recent definitions of scientific literacy; (b) educational policy documents
specifying what should be taught about the NoS; (c) academic discussion about
which ideas about the NoS are relevant and accessible for students; (d) research both
on what knowledge and skills are appropriate for instruction and/or needed to
exercise a functional scientific literacy and on widely-held misconceptions about
science. The aim was to draw ideas from as wide a range of sources as possible, in an
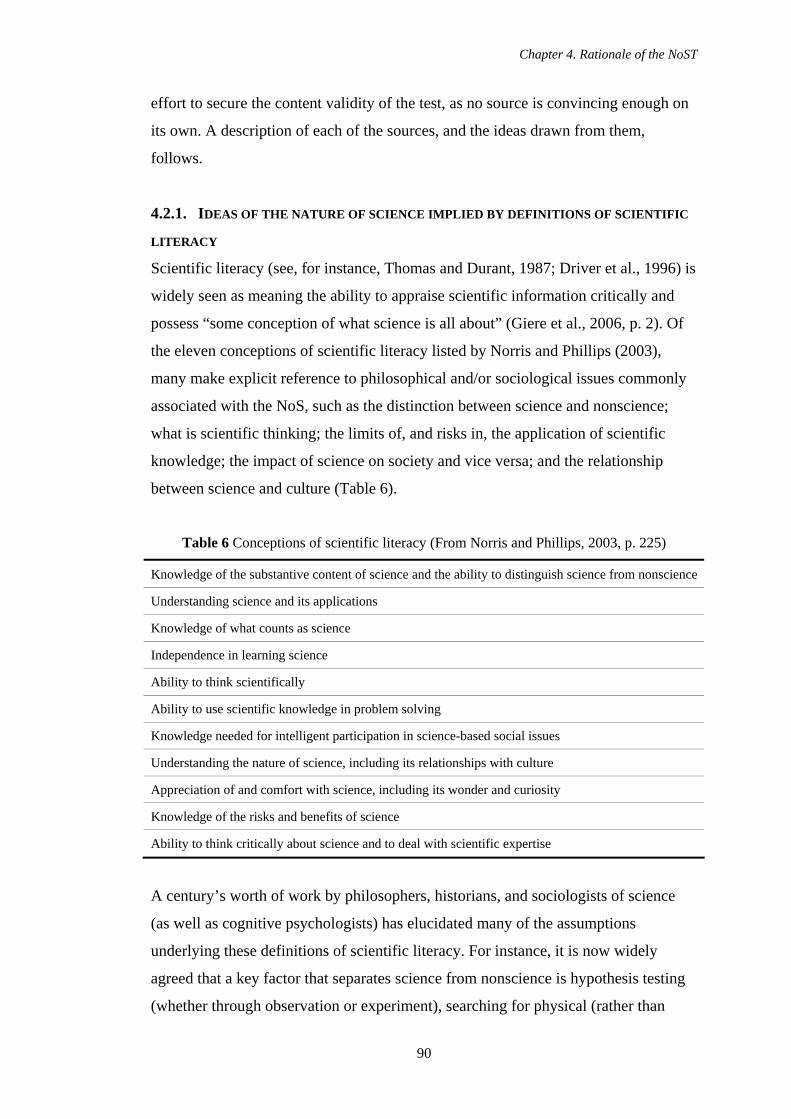
Chapter 4. Rationale of the NoST
90
effort to secure the content validity of the test, as no source is convincing enough on
its own. A description of each of the sources, and the ideas drawn from them,
follows.
4.2.1. IDEAS OF THE NATURE OF SCIENCE IMPLIED BY DEFINITIONS OF SCIENTIFIC
LITERACY
Scientific literacy (see, for instance, Thomas and Durant, 1987; Driver et al., 1996) is
widely seen as meaning the ability to appraise scientific information critically and
possess “some conception of what science is all about” (Giere et al., 2006, p. 2). Of
the eleven conceptions of scientific literacy listed by Norris and Phillips (2003),
many make explicit reference to philosophical and/or sociological issues commonly
associated with the NoS, such as the distinction between science and nonscience;
what is scientific thinking; the limits of, and risks in, the application of scientific
knowledge; the impact of science on society and vice versa; and the relationship
between science and culture (Table 6).
Table 6 Conceptions of scientific literacy (From Norris and Phillips, 2003, p. 225)
Knowledge of the substantive content of science and the ability to distinguish science from nonscience
Understanding science and its applications
Knowledge of what counts as science
Independence in learning science
Ability to think scientifically
Ability to use scientific knowledge in problem solving
Knowledge needed for intelligent participation in science-based social issues
Understanding the nature of science, including its relationships with culture
Appreciation of and comfort with science, including its wonder and curiosity
Knowledge of the risks and benefits of science
Ability to think critically about science and to deal with scientific expertise
A century’s worth of work by philosophers, historians, and sociologists of science
(as well as cognitive psychologists) has elucidated many of the assumptions
underlying these definitions of scientific literacy. For instance, it is now widely
agreed that a key factor that separates science from nonscience is hypothesis testing
(whether through observation or experiment), searching for physical (rather than
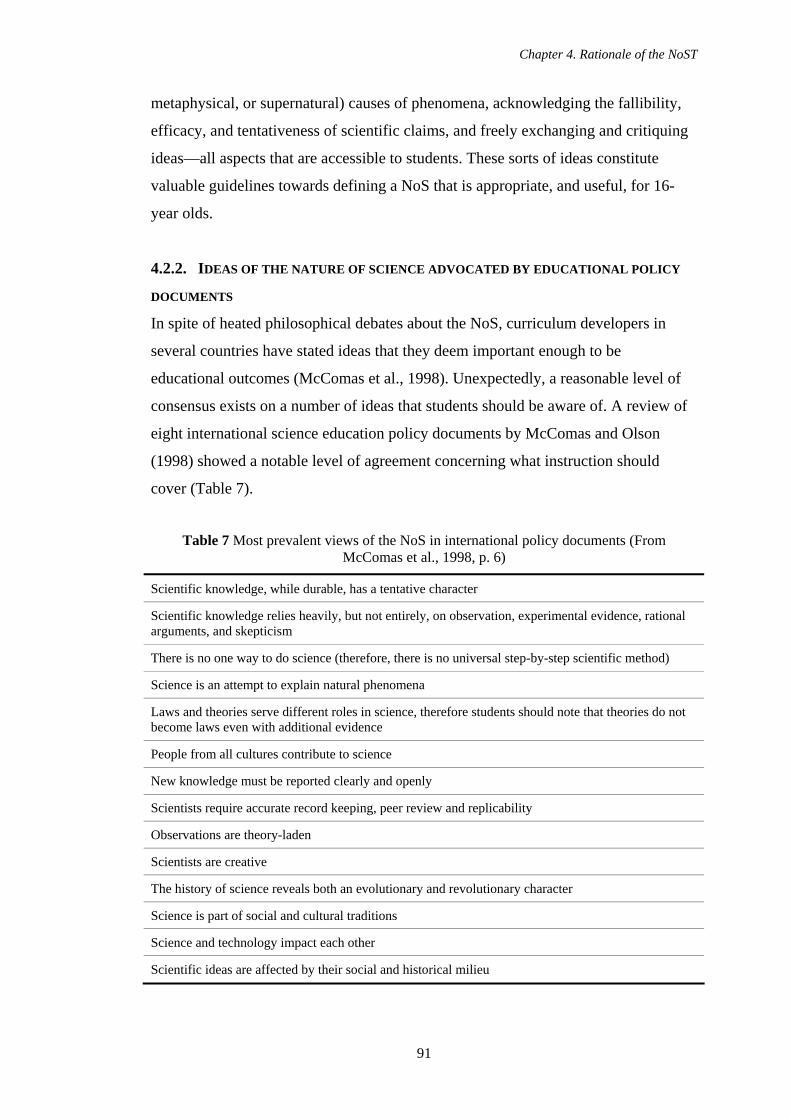
Chapter 4. Rationale of the NoST
91
metaphysical, or supernatural) causes of phenomena, acknowledging the fallibility,
efficacy, and tentativeness of scientific claims, and freely exchanging and critiquing
ideas—all aspects that are accessible to students. These sorts of ideas constitute
valuable guidelines towards defining a NoS that is appropriate, and useful, for 16-
year olds.
4.2.2. IDEAS OF THE NATURE OF SCIENCE ADVOCATED BY EDUCATIONAL POLICY
DOCUMENTS
In spite of heated philosophical debates about the NoS, curriculum developers in
several countries have stated ideas that they deem important enough to be
educational outcomes (McComas et al., 1998). Unexpectedly, a reasonable level of
consensus exists on a number of ideas that students should be aware of. A review of
eight international science education policy documents by McComas and Olson
(1998) showed a notable level of agreement concerning what instruction should
cover (Table 7).
Table 7 Most prevalent views of the NoS in international policy documents (From McComas et al., 1998, p. 6)
Scientific knowledge, while durable, has a tentative character
Scientific knowledge relies heavily, but not entirely, on observation, experimental evidence, rational arguments, and skepticism
There is no one way to do science (therefore, there is no universal step-by-step scientific method)
Science is an attempt to explain natural phenomena
Laws and theories serve different roles in science, therefore students should note that theories do not become laws even with additional evidence
People from all cultures contribute to science
New knowledge must be reported clearly and openly
Scientists require accurate record keeping, peer review and replicability
Observations are theory-laden
Scientists are creative
The history of science reveals both an evolutionary and revolutionary character
Science is part of social and cultural traditions
Science and technology impact each other
Scientific ideas are affected by their social and historical milieu
Chapter 4. Rationale of the NoST
92
The apparent consensus in policy documents might be illusory, however. As Osborne
et al. (2003, p. 693) have asked:
[D]o these curriculum documents represent a consensus or, alternatively, the kind of compromise which is often the product of reports produced by committees? That is, do they represent the lowest common denominator around which it is possible to achieve agreement rather than any coherent account of the nature of science?
Real or illusory, there is nevertheless overlap between the curricular conceptions of
the NoS and the elements included in, or implied by, several of the conceptions of
scientific literacy: the emphasis on scientific method and scientific thinking; the
social-embeddedness of science and its place in culture; and its empirical basis as a
distinctive feature—to name a few—are shared by both. Indeed, for Driver et al.
(1996), understanding the NoS is an integral component of scientific literacy: it
enables an understanding of both the scientific approach to enquiry and science as a
social enterprise, and enhances—and helps justify—the understanding of science
content. Similarly, McComas et al. (1998)—paraphrasing Shamos (1995)—have
argued that “while knowledge of science content may not be necessary for obtaining
science literacy, understanding the nature of science is prerequisite to such literacy”
(p. 9).
4.2.3. IDEAS OF THE NATURE OF SCIENCE ADVOCATED BY EDUCATIONAL
RESEARCHERS
From their vantage point, researchers have made attempts to define the NoS for
educational purposes, given its increased emphasis in curricula worldwide. The logic
of these efforts has centred on searching for relatively uncontroversial ideas about
science that, nevertheless, reflect its unique character and are relevant for, and
accessible to, students.
One of the main difficulties in trying to establish which ideas about science are
adequate, either for the purposes of curriculum reform or the design of assessment
instruments, has been the lack of philosophical consensus on what the NoS is or
should be. Echoing this fact, Alters (1997) subjected a set of ideas of the NoS—
originally advocated by educational researchers and curriculum developers—to the
Chapter 4. Rationale of the NoST
93
critical scrutiny of professional philosophers of science, while also sampling their
views. Alters concluded that “no agreed-on NoS exists” (p. 48) and, given the
existence of conflicting philosophical positions, a pluralistic approach to the teaching
and assessment of the NoS would better capture current understandings of it.
The practical needs of defining what to teach, teach it, and evaluate if it was actually
learnt, however, make such an approach unreasonable, if not unfeasible. This in turn
has led researchers to try to distil a set of agreed-on ideas about science from a
variety of theoretical rationales, leading to somewhat different sets of ideas. The
relative convergence achieved lends support to the notion that a teachable NoS
exists. A brief description of the rationales—and resulting ideas about science—may
help to clarify, and to justify, the reasons for selecting some ideas over others in
developing the instrument used in this study, and to locate this within the wider
scholarship on the topic. The account will also help to explain—in later sections—
some of the design features of the test itself (i.e., the use of contexts) as well as some
of the limitations of inferences derived from responses to it.
Hodson (1991), while acknowledging that there is no universally accepted account of
science available in the literature, suggested a set of ideas that he considered relevant
for the science curriculum and that makes sense of the “barrage” of somewhat
contradictory calls to abandon inductivism for Popperian hypothetico-deductivism,
or for Kuhnian and/or post-Kuhnian accounts (Table 8).
Openly opposing Alters’ suggestion, Smith and Scharmann (1999) advocated a non-
pluralistic understanding of the NoS that nevertheless is adequate for fostering a
responsible citizenship—associated with “intelligent consumers of scientific
knowledge” who “make intelligent decisions about scientific matters” (p. 496). To
arrive at an agreed-on NoS, they addressed one of the most contentious issues: the
demarcation between science and nonscience—an issue that, tellingly, appears in two
of the scientific literacy conceptions listed by Norris and Phillips (2003) in Table 6.
As a tentative solution to this issue, Smith and Scharmann proposed setting aside the
question of whether there is “an absolute dichotomy between science and
nonscience” (p. 498), and instead focusing on the questions “What are the
Chapter 4. Rationale of the NoST
94
characteristics of [a] field that make it more scientific or less scientific?” and “To
what extent is [a] field scientific?” From a review of a wide range of science
education and philosophy of science literature, they drew out a set of characteristics
that make a question, or field of enquiry, more scientific. Building on their work,
Niaz (2001) argued for the inclusion of three more aspects, dealing with competition,
underdetermination of theory by data, and inconsistency (Table 8).
Also arguing against Alters, Lederman (1998) claimed that the apparent lack of
consensus on the NoS among philosophers, historians, sociologists, scientists, and
science educators is largely irrelevant for educational purposes—that, at a level
appropriate for students, there is no controversy at all. Starting from the notion that
the tentative and revisionary nature of scientific knowledge is one of its essential
characteristics (and one accessible to students of all ages), Lederman (2007) argued
that tentativeness arises from the fact that scientific knowledge is “inferential,
creative, and socially and culturally embedded” (p. 834)—themselves core ideas of
the NoS (Table 8).
A few years later, Elby and Hammer (2001), echoing Smith and Scharmann’s
concerns, critiqued the notion of a “sophisticated relativist” view—as exemplified by
the emphasis placed by Lederman (1998) on the tentativeness of scientific
knowledge as one of its key features—made up of “blanket generalizations” about
science, and with tentativeness at its core:
[A]ccording to the consensus view reflected in commonly used surveys, epistemological sophistication consists of believing certain blanket generalizations about the nature of knowledge and learning, generalizations that do not attend to context. Such blanket generalizations, we argue, are neither correct nor productive. A brief example illustrates the gist of our criticism. The notion that scientific knowledge is tentative and evolving does not apply equally across all scientific knowledge. For instance, it would hardly be sophisticated for students to view as “tentative” the idea that the earth is round rather than flat. By contrast, they should take a more tentative stance toward theories about dinosaur extinction. Nonetheless, many surveys and interview protocols tally students as “sophisticated” not for attending to these contextual nuances, but for subscribing broadly to the view that knowledge is tentative (Elby and Hammer, 2001, p. 555-556).
Chapter 4. Rationale of the NoST
95
Elby and Hammer called attention to the extent to which the NoS can be seen as
being context-dependent. This brings into sharp relief the inadequacy of existing
assessment instruments—whether of a qualitative or a quantitative nature—that do
not take this into account. Their contention is convincing enough for requiring that
we take seriously the role of context in the assessment of the NoS. How valid and
reliable are assessments based on de-contextualised questions? How best can we
capture, without specifying a context, the nuances of a sophisticated understanding of
the NoS?
As part of their critique, Elby and Hammer advanced a set of ideas or “dimensions”
about science—themselves based on work done by Hofer and Pintrich (1997)—that
are not to be seen as strict generalisations, but rather as nuanced, context-dependent
notions (Table 8).
In a similar vein, Clough (2007) has argued that ideas or “tenets” about science
should rather be seen as questions. Tenets are simplistic and easily distorted by
researchers’, teachers’, and/or students’ preconceived ideas. They are also
susceptible to the context in which they are discussed. Like Elby and Hammer,
Clough contends that “most, if not all statements about the nature of science are
contextual” (p. 1) and, in the light of this, advanced a series of ideas that could be re-
conceptualised as questions (Table 8).
Table 8 summarises aspects and/or issues about science that different researchers
have advocated as important for basic instruction. A cursory glance at the set reveals
that several are shared with notions that appear—either explicitly or implicitly—both
in educational policy documents and in conceptions of scientific literacy discussed
earlier.
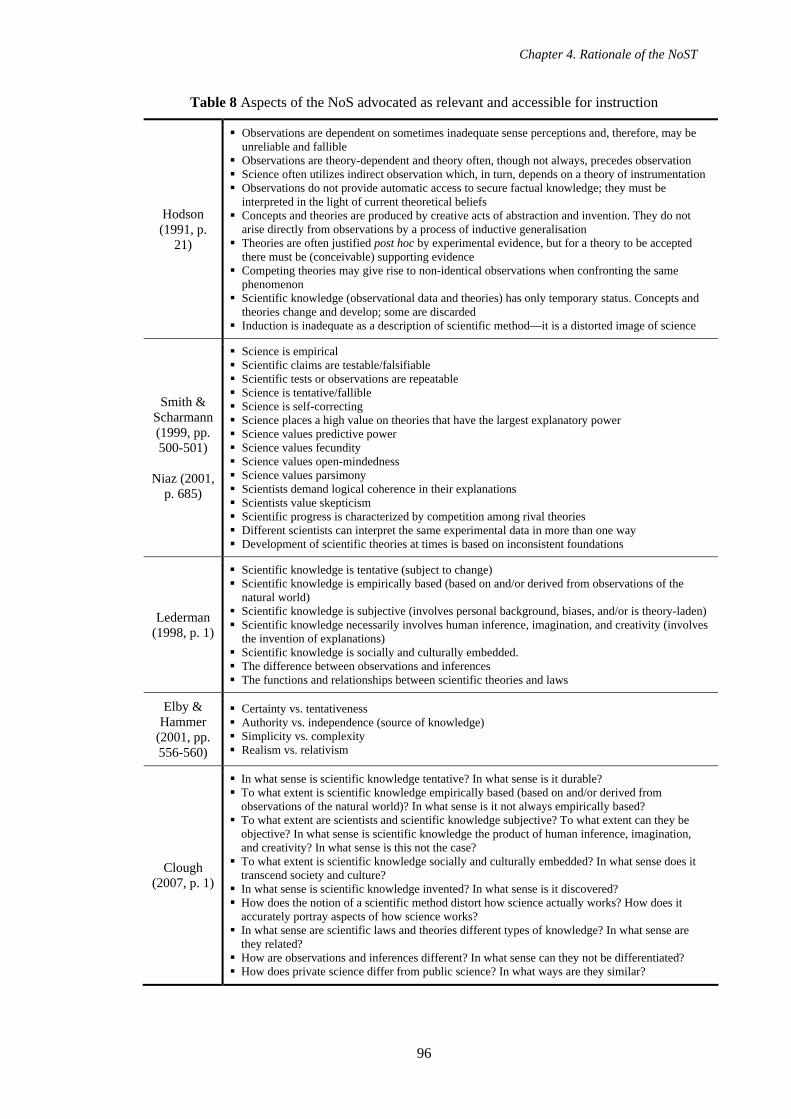
Chapter 4. Rationale of the NoST
96
Table 8 Aspects of the NoS advocated as relevant and accessible for instruction
Hodson (1991, p.
21)
Observations are dependent on sometimes inadequate sense perceptions and, therefore, may be unreliable and fallible
Observations are theory-dependent and theory often, though not always, precedes observation Science often utilizes indirect observation which, in turn, depends on a theory of instrumentation Observations do not provide automatic access to secure factual knowledge; they must be
interpreted in the light of current theoretical beliefs Concepts and theories are produced by creative acts of abstraction and invention. They do not
arise directly from observations by a process of inductive generalisation Theories are often justified post hoc by experimental evidence, but for a theory to be accepted
there must be (conceivable) supporting evidence Competing theories may give rise to non-identical observations when confronting the same
phenomenon Scientific knowledge (observational data and theories) has only temporary status. Concepts and
theories change and develop; some are discarded Induction is inadequate as a description of scientific method—it is a distorted image of science
Smith & Scharmann (1999, pp. 500-501)
Niaz (2001,
p. 685)
Science is empirical Scientific claims are testable/falsifiable Scientific tests or observations are repeatable Science is tentative/fallible Science is self-correcting Science places a high value on theories that have the largest explanatory power Science values predictive power Science values fecundity Science values open-mindedness Science values parsimony Scientists demand logical coherence in their explanations Scientists value skepticism Scientific progress is characterized by competition among rival theories Different scientists can interpret the same experimental data in more than one way Development of scientific theories at times is based on inconsistent foundations
Lederman (1998, p. 1)
Scientific knowledge is tentative (subject to change) Scientific knowledge is empirically based (based on and/or derived from observations of the
natural world) Scientific knowledge is subjective (involves personal background, biases, and/or is theory-laden) Scientific knowledge necessarily involves human inference, imagination, and creativity (involves
the invention of explanations) Scientific knowledge is socially and culturally embedded. The difference between observations and inferences The functions and relationships between scientific theories and laws
Elby & Hammer
(2001, pp. 556-560)
Certainty vs. tentativeness Authority vs. independence (source of knowledge) Simplicity vs. complexity Realism vs. relativism
Clough (2007, p. 1)
In what sense is scientific knowledge tentative? In what sense is it durable? To what extent is scientific knowledge empirically based (based on and/or derived from observations of the natural world)? In what sense is it not always empirically based?
To what extent are scientists and scientific knowledge subjective? To what extent can they be objective? In what sense is scientific knowledge the product of human inference, imagination, and creativity? In what sense is this not the case?
To what extent is scientific knowledge socially and culturally embedded? In what sense does it transcend society and culture?
In what sense is scientific knowledge invented? In what sense is it discovered? How does the notion of a scientific method distort how science actually works? How does it accurately portray aspects of how science works?
In what sense are scientific laws and theories different types of knowledge? In what sense are they related?
How are observations and inferences different? In what sense can they not be differentiated? How does private science differ from public science? In what ways are they similar?
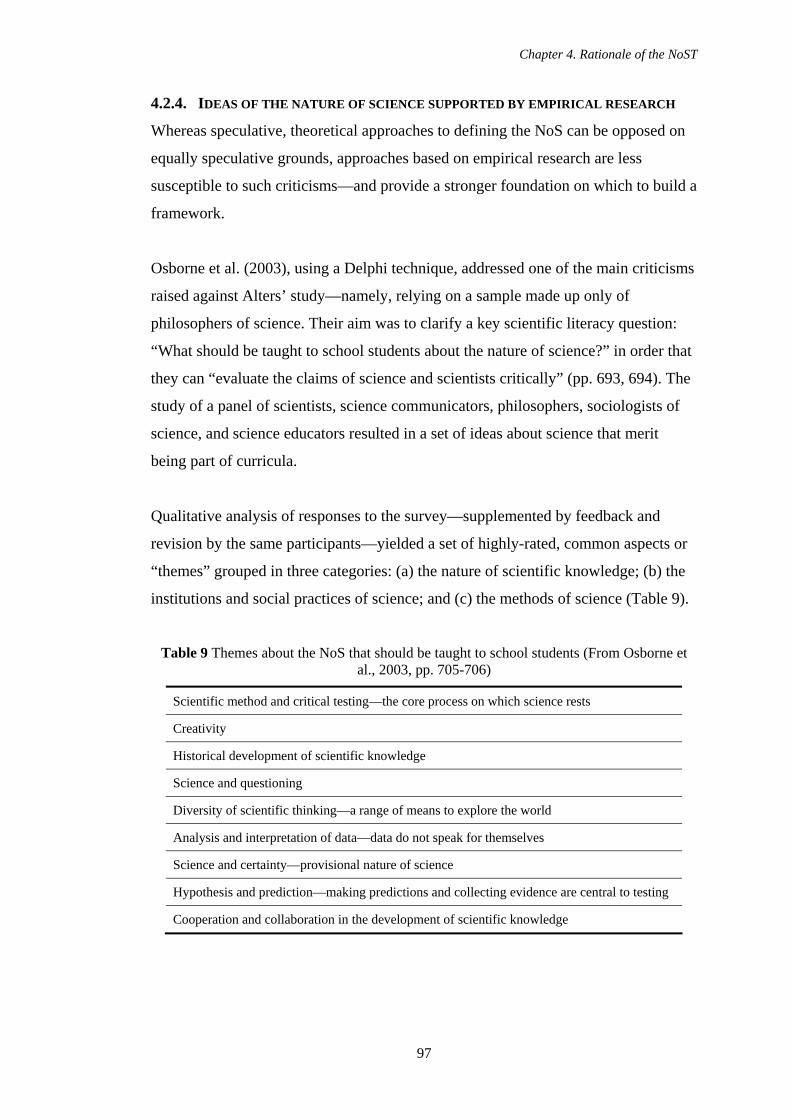
Chapter 4. Rationale of the NoST
97
4.2.4. IDEAS OF THE NATURE OF SCIENCE SUPPORTED BY EMPIRICAL RESEARCH
Whereas speculative, theoretical approaches to defining the NoS can be opposed on
equally speculative grounds, approaches based on empirical research are less
susceptible to such criticisms—and provide a stronger foundation on which to build a
framework.
Osborne et al. (2003), using a Delphi technique, addressed one of the main criticisms
raised against Alters’ study—namely, relying on a sample made up only of
philosophers of science. Their aim was to clarify a key scientific literacy question:
“What should be taught to school students about the nature of science?” in order that
they can “evaluate the claims of science and scientists critically” (pp. 693, 694). The
study of a panel of scientists, science communicators, philosophers, sociologists of
science, and science educators resulted in a set of ideas about science that merit
being part of curricula.
Qualitative analysis of responses to the survey—supplemented by feedback and
revision by the same participants—yielded a set of highly-rated, common aspects or
“themes” grouped in three categories: (a) the nature of scientific knowledge; (b) the
institutions and social practices of science; and (c) the methods of science (Table 9).
Table 9 Themes about the NoS that should be taught to school students (From Osborne et al., 2003, pp. 705-706)
Scientific method and critical testing—the core process on which science rests
Creativity
Historical development of scientific knowledge
Science and questioning
Diversity of scientific thinking—a range of means to explore the world
Analysis and interpretation of data—data do not speak for themselves
Science and certainty—provisional nature of science
Hypothesis and prediction—making predictions and collecting evidence are central to testing
Cooperation and collaboration in the development of scientific knowledge
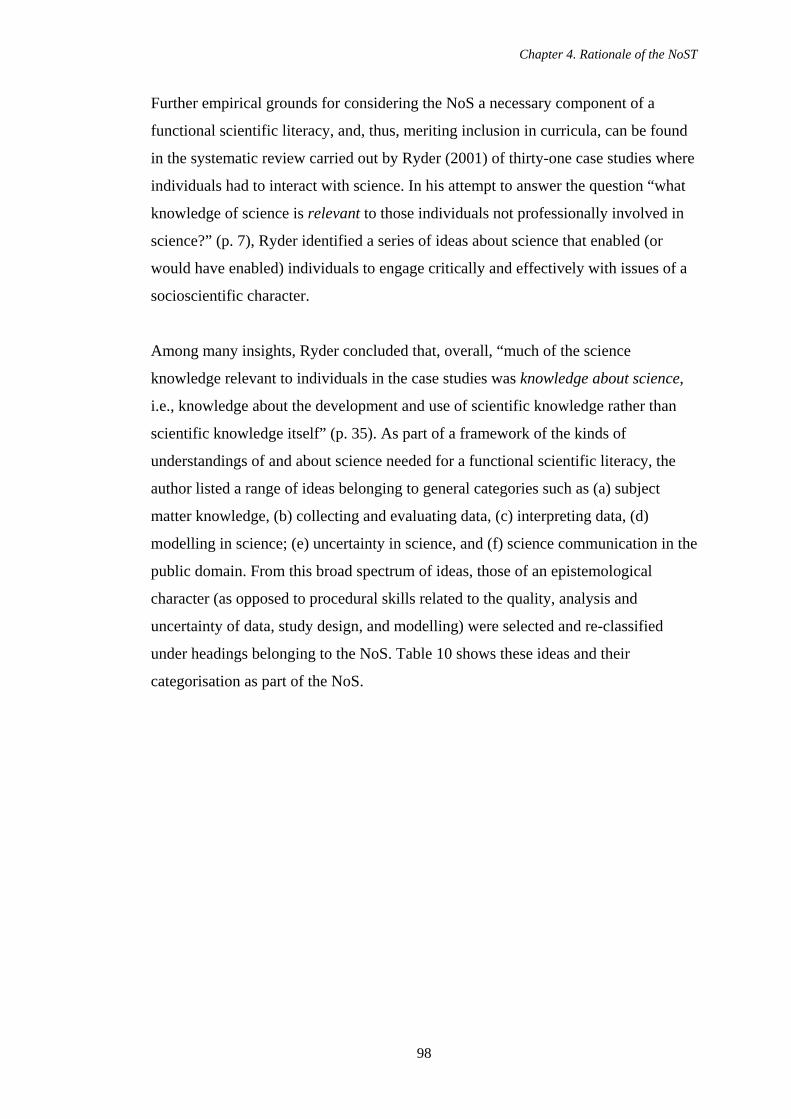
Chapter 4. Rationale of the NoST
98
Further empirical grounds for considering the NoS a necessary component of a
functional scientific literacy, and, thus, meriting inclusion in curricula, can be found
in the systematic review carried out by Ryder (2001) of thirty-one case studies where
individuals had to interact with science. In his attempt to answer the question “what
knowledge of science is relevant to those individuals not professionally involved in
science?” (p. 7), Ryder identified a series of ideas about science that enabled (or
would have enabled) individuals to engage critically and effectively with issues of a
socioscientific character.
Among many insights, Ryder concluded that, overall, “much of the science
knowledge relevant to individuals in the case studies was knowledge about science,
i.e., knowledge about the development and use of scientific knowledge rather than
scientific knowledge itself” (p. 35). As part of a framework of the kinds of
understandings of and about science needed for a functional scientific literacy, the
author listed a range of ideas belonging to general categories such as (a) subject
matter knowledge, (b) collecting and evaluating data, (c) interpreting data, (d)
modelling in science; (e) uncertainty in science, and (f) science communication in the
public domain. From this broad spectrum of ideas, those of an epistemological
character (as opposed to procedural skills related to the quality, analysis and
uncertainty of data, study design, and modelling) were selected and re-classified
under headings belonging to the NoS. Table 10 shows these ideas and their
categorisation as part of the NoS.
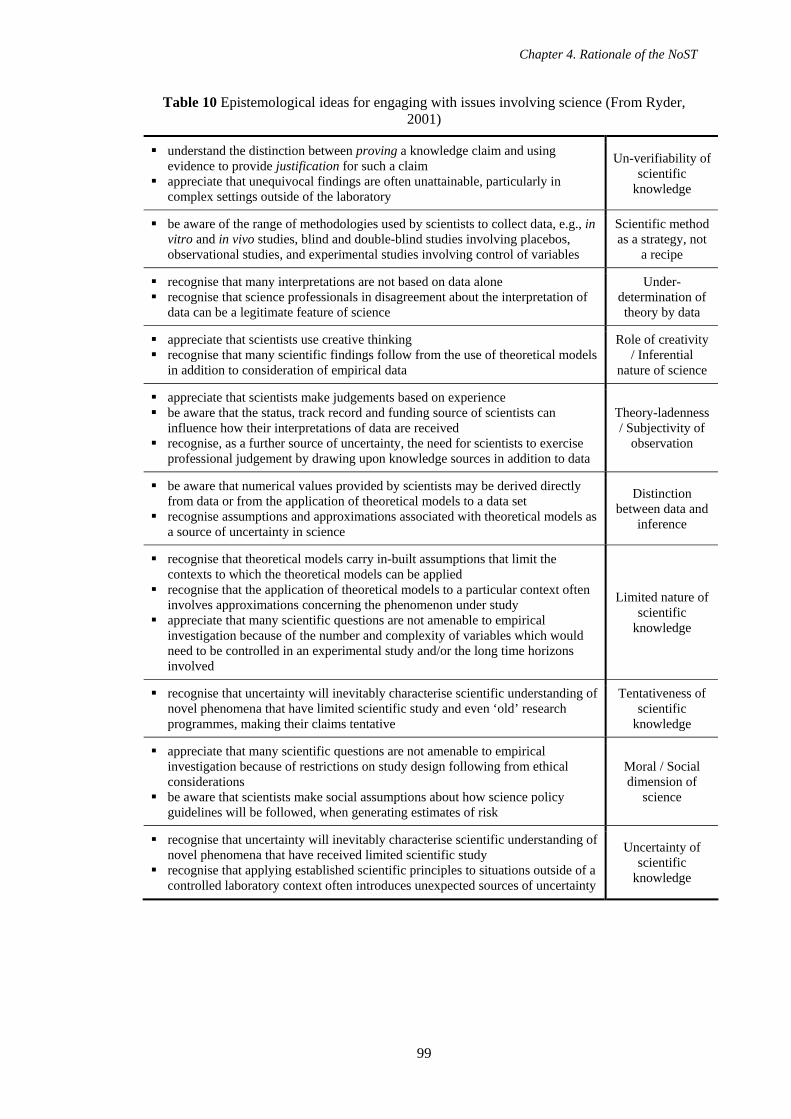
Chapter 4. Rationale of the NoST
99
Table 10 Epistemological ideas for engaging with issues involving science (From Ryder, 2001)
understand the distinction between proving a knowledge claim and using evidence to provide justification for such a claim
appreciate that unequivocal findings are often unattainable, particularly in complex settings outside of the laboratory
Un-verifiability of scientific
knowledge
be aware of the range of methodologies used by scientists to collect data, e.g., in vitro and in vivo studies, blind and double-blind studies involving placebos, observational studies, and experimental studies involving control of variables
Scientific method as a strategy, not
a recipe
recognise that many interpretations are not based on data alone recognise that science professionals in disagreement about the interpretation of
data can be a legitimate feature of science
Under-determination of theory by data
appreciate that scientists use creative thinking recognise that many scientific findings follow from the use of theoretical models
in addition to consideration of empirical data
Role of creativity / Inferential
nature of science
appreciate that scientists make judgements based on experience be aware that the status, track record and funding source of scientists can
influence how their interpretations of data are received recognise, as a further source of uncertainty, the need for scientists to exercise
professional judgement by drawing upon knowledge sources in addition to data
Theory-ladenness / Subjectivity of
observation
be aware that numerical values provided by scientists may be derived directly from data or from the application of theoretical models to a data set
recognise assumptions and approximations associated with theoretical models as a source of uncertainty in science
Distinction between data and
inference
recognise that theoretical models carry in-built assumptions that limit the contexts to which the theoretical models can be applied
recognise that the application of theoretical models to a particular context often involves approximations concerning the phenomenon under study
appreciate that many scientific questions are not amenable to empirical investigation because of the number and complexity of variables which would need to be controlled in an experimental study and/or the long time horizons involved
Limited nature of scientific
knowledge
recognise that uncertainty will inevitably characterise scientific understanding of novel phenomena that have limited scientific study and even ‘old’ research programmes, making their claims tentative
Tentativeness of scientific
knowledge
appreciate that many scientific questions are not amenable to empirical investigation because of restrictions on study design following from ethical considerations
be aware that scientists make social assumptions about how science policy guidelines will be followed, when generating estimates of risk
Moral / Social dimension of
science
recognise that uncertainty will inevitably characterise scientific understanding of novel phenomena that have received limited scientific study
recognise that applying established scientific principles to situations outside of a controlled laboratory context often introduces unexpected sources of uncertainty
Uncertainty of scientific
knowledge
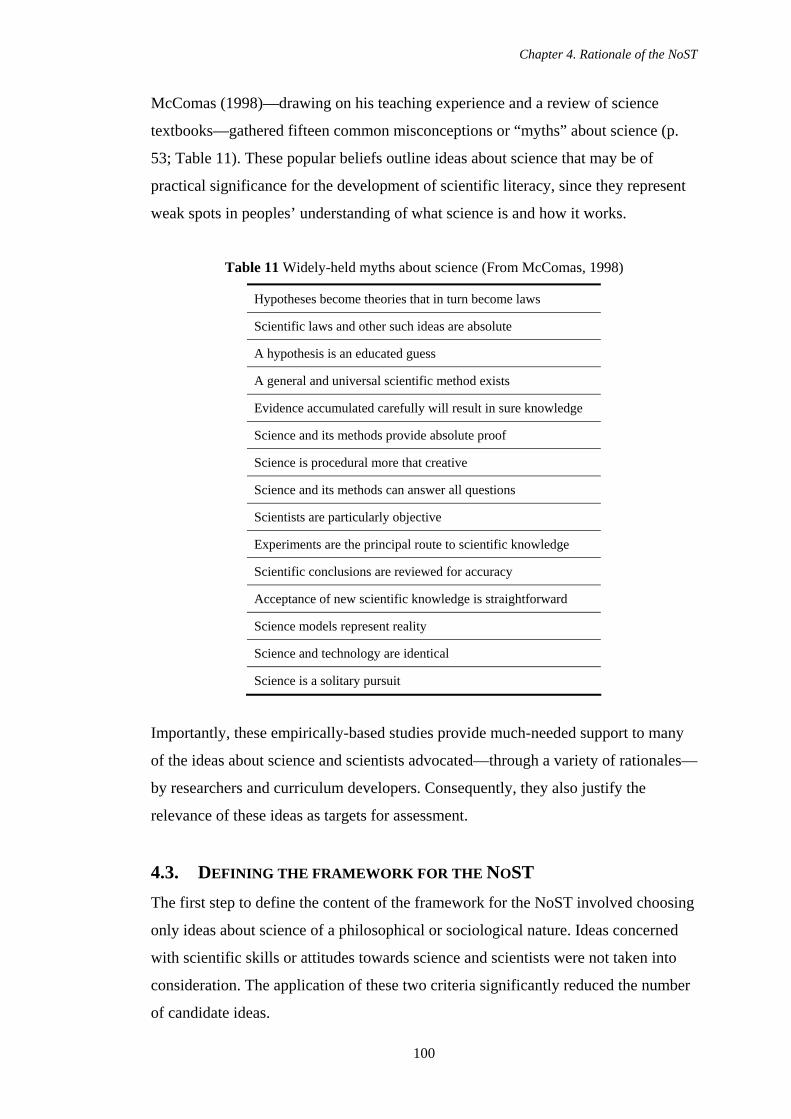
Chapter 4. Rationale of the NoST
100
McComas (1998)—drawing on his teaching experience and a review of science
textbooks—gathered fifteen common misconceptions or “myths” about science (p.
53; Table 11). These popular beliefs outline ideas about science that may be of
practical significance for the development of scientific literacy, since they represent
weak spots in peoples’ understanding of what science is and how it works.
Table 11 Widely-held myths about science (From McComas, 1998)
Hypotheses become theories that in turn become laws
Scientific laws and other such ideas are absolute
A hypothesis is an educated guess
A general and universal scientific method exists
Evidence accumulated carefully will result in sure knowledge
Science and its methods provide absolute proof
Science is procedural more that creative
Science and its methods can answer all questions
Scientists are particularly objective
Experiments are the principal route to scientific knowledge
Scientific conclusions are reviewed for accuracy
Acceptance of new scientific knowledge is straightforward
Science models represent reality
Science and technology are identical
Science is a solitary pursuit
Importantly, these empirically-based studies provide much-needed support to many
of the ideas about science and scientists advocated—through a variety of rationales—
by researchers and curriculum developers. Consequently, they also justify the
relevance of these ideas as targets for assessment.
4.3. DEFINING THE FRAMEWORK FOR THE NOST The first step to define the content of the framework for the NoST involved choosing
only ideas about science of a philosophical or sociological nature. Ideas concerned
with scientific skills or attitudes towards science and scientists were not taken into
consideration. The application of these two criteria significantly reduced the number
of candidate ideas.
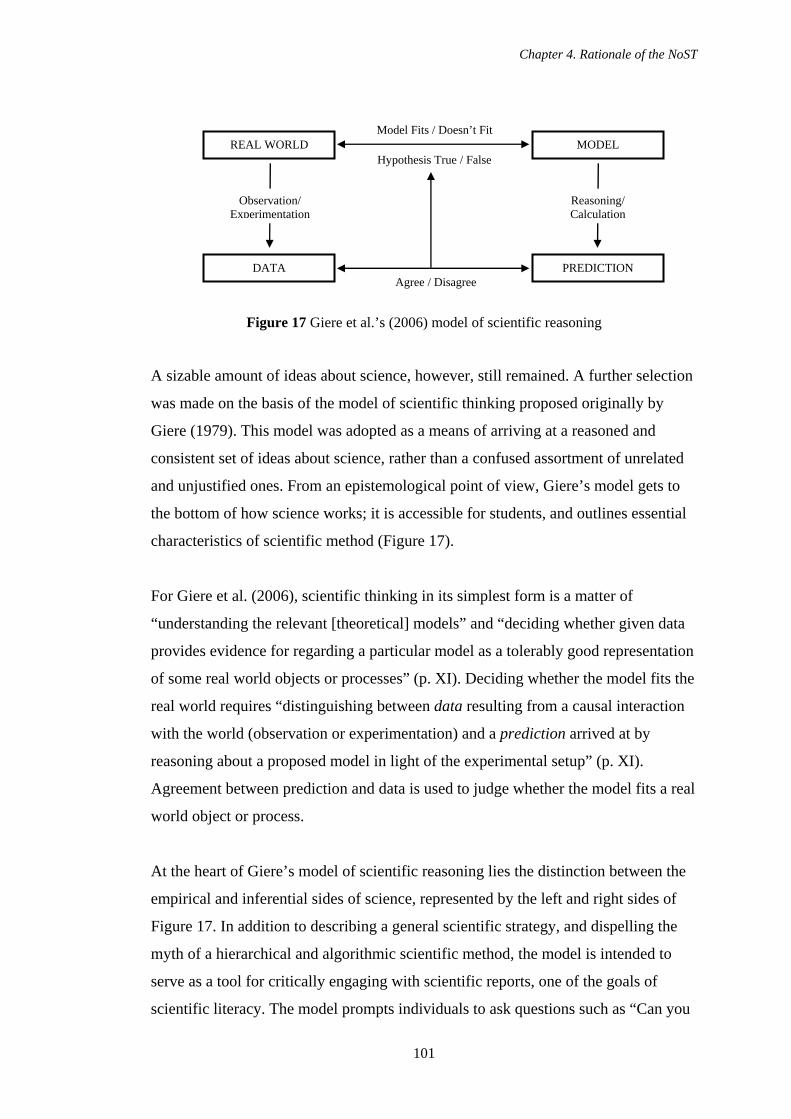
Chapter 4. Rationale of the NoST
101
Figure 17 Giere et al.’s (2006) model of scientific reasoning
A sizable amount of ideas about science, however, still remained. A further selection
was made on the basis of the model of scientific thinking proposed originally by
Giere (1979). This model was adopted as a means of arriving at a reasoned and
consistent set of ideas about science, rather than a confused assortment of unrelated
and unjustified ones. From an epistemological point of view, Giere’s model gets to
the bottom of how science works; it is accessible for students, and outlines essential
characteristics of scientific method (Figure 17).
For Giere et al. (2006), scientific thinking in its simplest form is a matter of
“understanding the relevant [theoretical] models” and “deciding whether given data
provides evidence for regarding a particular model as a tolerably good representation
of some real world objects or processes” (p. XI). Deciding whether the model fits the
real world requires “distinguishing between data resulting from a causal interaction
with the world (observation or experimentation) and a prediction arrived at by
reasoning about a proposed model in light of the experimental setup” (p. XI).
Agreement between prediction and data is used to judge whether the model fits a real
world object or process.
At the heart of Giere’s model of scientific reasoning lies the distinction between the
empirical and inferential sides of science, represented by the left and right sides of
Figure 17. In addition to describing a general scientific strategy, and dispelling the
myth of a hierarchical and algorithmic scientific method, the model is intended to
serve as a tool for critically engaging with scientific reports, one of the goals of
scientific literacy. The model prompts individuals to ask questions such as “Can you
REAL WORLD
DATA
Observation/ Experimentation
MODEL
PREDICTION
Reasoning/ Calculation
Model Fits / Doesn’t Fit
Hypothesis True / False
Agree / Disagree
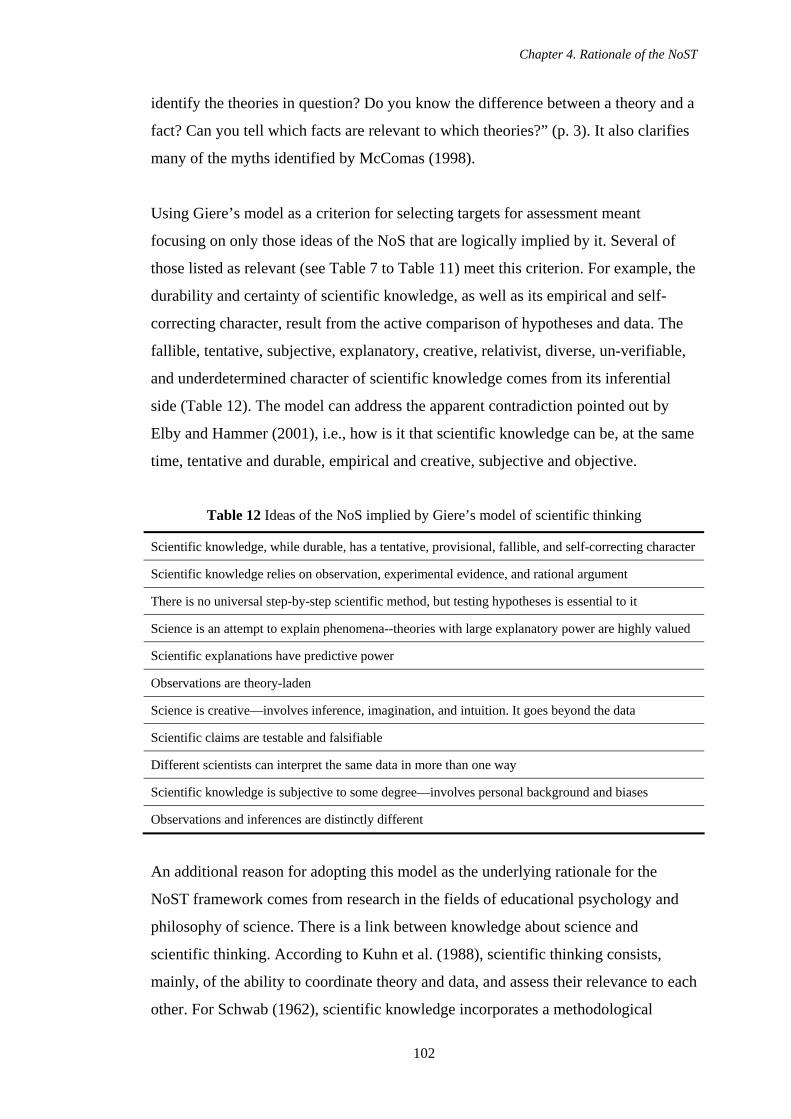
Chapter 4. Rationale of the NoST
102
identify the theories in question? Do you know the difference between a theory and a
fact? Can you tell which facts are relevant to which theories?” (p. 3). It also clarifies
many of the myths identified by McComas (1998).
Using Giere’s model as a criterion for selecting targets for assessment meant
focusing on only those ideas of the NoS that are logically implied by it. Several of
those listed as relevant (see Table 7 to Table 11) meet this criterion. For example, the
durability and certainty of scientific knowledge, as well as its empirical and self-
correcting character, result from the active comparison of hypotheses and data. The
fallible, tentative, subjective, explanatory, creative, relativist, diverse, un-verifiable,
and underdetermined character of scientific knowledge comes from its inferential
side (Table 12). The model can address the apparent contradiction pointed out by
Elby and Hammer (2001), i.e., how is it that scientific knowledge can be, at the same
time, tentative and durable, empirical and creative, subjective and objective.
Table 12 Ideas of the NoS implied by Giere’s model of scientific thinking
Scientific knowledge, while durable, has a tentative, provisional, fallible, and self-correcting character
Scientific knowledge relies on observation, experimental evidence, and rational argument
There is no universal step-by-step scientific method, but testing hypotheses is essential to it
Science is an attempt to explain phenomena--theories with large explanatory power are highly valued
Scientific explanations have predictive power
Observations are theory-laden
Science is creative—involves inference, imagination, and intuition. It goes beyond the data
Scientific claims are testable and falsifiable
Different scientists can interpret the same data in more than one way
Scientific knowledge is subjective to some degree—involves personal background and biases
Observations and inferences are distinctly different
An additional reason for adopting this model as the underlying rationale for the
NoST framework comes from research in the fields of educational psychology and
philosophy of science. There is a link between knowledge about science and
scientific thinking. According to Kuhn et al. (1988), scientific thinking consists,
mainly, of the ability to coordinate theory and data, and assess their relevance to each
other. For Schwab (1962), scientific knowledge incorporates a methodological
Chapter 4. Rationale of the NoST
103
component—empirical data—and an interpretive or heuristic one—concepts,
theories, laws. Both are indispensable for the creation of knowledge.
Ultimately, understanding data and theory as distinct but interrelated entities,
theories as imagined constructs that model and explain reality, and science as an
activity that develops theories and assesses their adequacy to data are all
epistemological insights. Indeed, one of the key issues in the philosophy of science is
the coordination of its empirical and explanatory sides:
In the long run, scientific theorizing is controlled by experience: progress in science is ultimately a matter of new hypotheses which are more strongly confirmed than old ones as the results of empirical tests come in. Science does not accept as knowledge what cannot be somehow subject to the test of experience. But at the same time, the obligation of science to explain our experience requires that it go beyond and beneath that experience in the things, properties, processes and events it appeals to in providing these explanations (Rosenberg, 2000, p. 87).
Further reduction, and refinement, of the set of ideas about the NoS to be tested
resulted from the questioning style adopted, the complexity of the language, and the
selection of scientific episodes as contexts—as will be detailed in the following
sections. Among the ideas initially considered—but that in the end were explicitly
left out by the above criteria—were the difference between science and nonscience
(religion, philosophy); attributes of science such as its systematic, dogmatic and rigid
character; the differences and relationships between laws and theories; scientific
progress; falsification and confirmation; and limitations in the application of
scientific knowledge
The final version of the framework of the NoST comprised seven ideas closely
associated with the NoS in all the sources reviewed: (a) the difference between data
and explanations; (d) the theory-ladenness (or partial subjectivity) of data; (c) the
role of creativity; (d) the nature of the scientific method; (e) the underdetermination
of explanations by data; (f) the grounds for acceptance of an explanation; and (g) the
tentativeness of scientific explanations (Table 13). The content of each aspect was
drawn from published literature on the subject (see Section 2.1 for references).
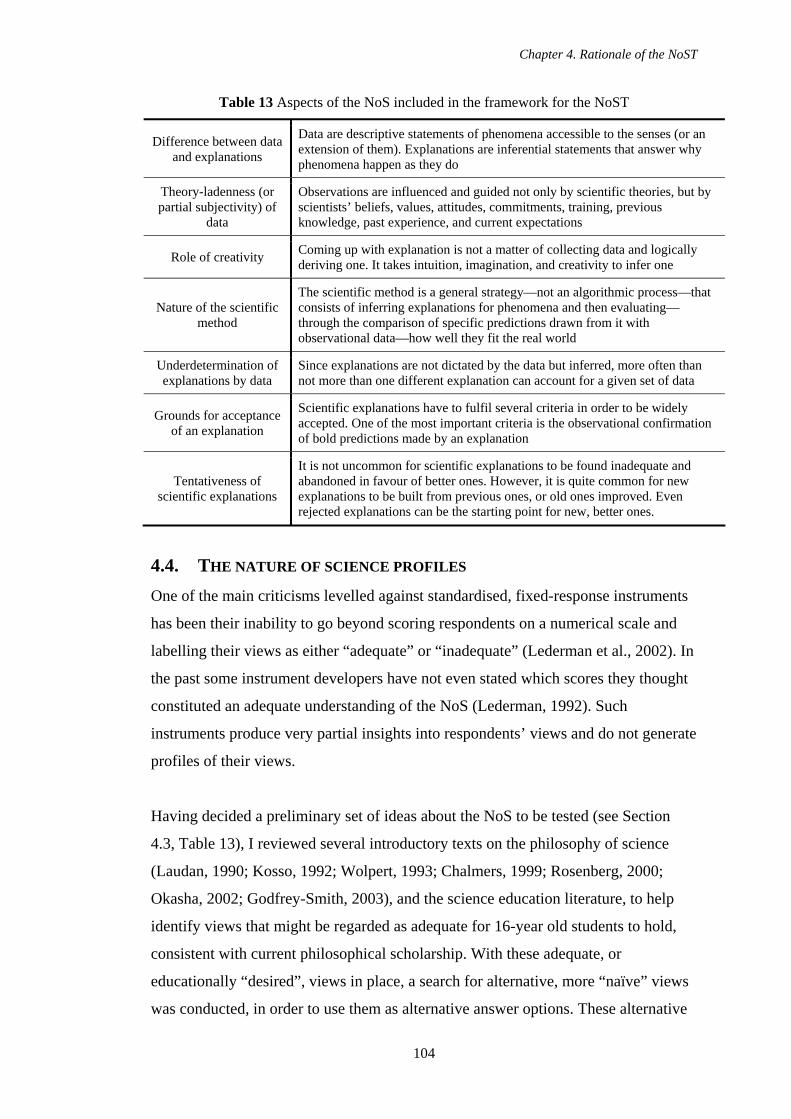
Chapter 4. Rationale of the NoST
104
Table 13 Aspects of the NoS included in the framework for the NoST
Difference between data and explanations
Data are descriptive statements of phenomena accessible to the senses (or an extension of them). Explanations are inferential statements that answer why phenomena happen as they do
Theory-ladenness (or partial subjectivity) of
data
Observations are influenced and guided not only by scientific theories, but by scientists’ beliefs, values, attitudes, commitments, training, previous knowledge, past experience, and current expectations
Role of creativity Coming up with explanation is not a matter of collecting data and logically deriving one. It takes intuition, imagination, and creativity to infer one
Nature of the scientific method
The scientific method is a general strategy—not an algorithmic process—that consists of inferring explanations for phenomena and then evaluating—through the comparison of specific predictions drawn from it with observational data—how well they fit the real world
Underdetermination of explanations by data
Since explanations are not dictated by the data but inferred, more often than not more than one different explanation can account for a given set of data
Grounds for acceptance of an explanation
Scientific explanations have to fulfil several criteria in order to be widely accepted. One of the most important criteria is the observational confirmation of bold predictions made by an explanation
Tentativeness of scientific explanations
It is not uncommon for scientific explanations to be found inadequate and abandoned in favour of better ones. However, it is quite common for new explanations to be built from previous ones, or old ones improved. Even rejected explanations can be the starting point for new, better ones.
4.4. THE NATURE OF SCIENCE PROFILES One of the main criticisms levelled against standardised, fixed-response instruments
has been their inability to go beyond scoring respondents on a numerical scale and
labelling their views as either “adequate” or “inadequate” (Lederman et al., 2002). In
the past some instrument developers have not even stated which scores they thought
constituted an adequate understanding of the NoS (Lederman, 1992). Such
instruments produce very partial insights into respondents’ views and do not generate
profiles of their views.
Having decided a preliminary set of ideas about the NoS to be tested (see Section
4.3, Table 13), I reviewed several introductory texts on the philosophy of science
(Laudan, 1990; Kosso, 1992; Wolpert, 1993; Chalmers, 1999; Rosenberg, 2000;
Okasha, 2002; Godfrey-Smith, 2003), and the science education literature, to help
identify views that might be regarded as adequate for 16-year old students to hold,
consistent with current philosophical scholarship. With these adequate, or
educationally “desired”, views in place, a search for alternative, more “naïve” views
was conducted, in order to use them as alternative answer options. These alternative
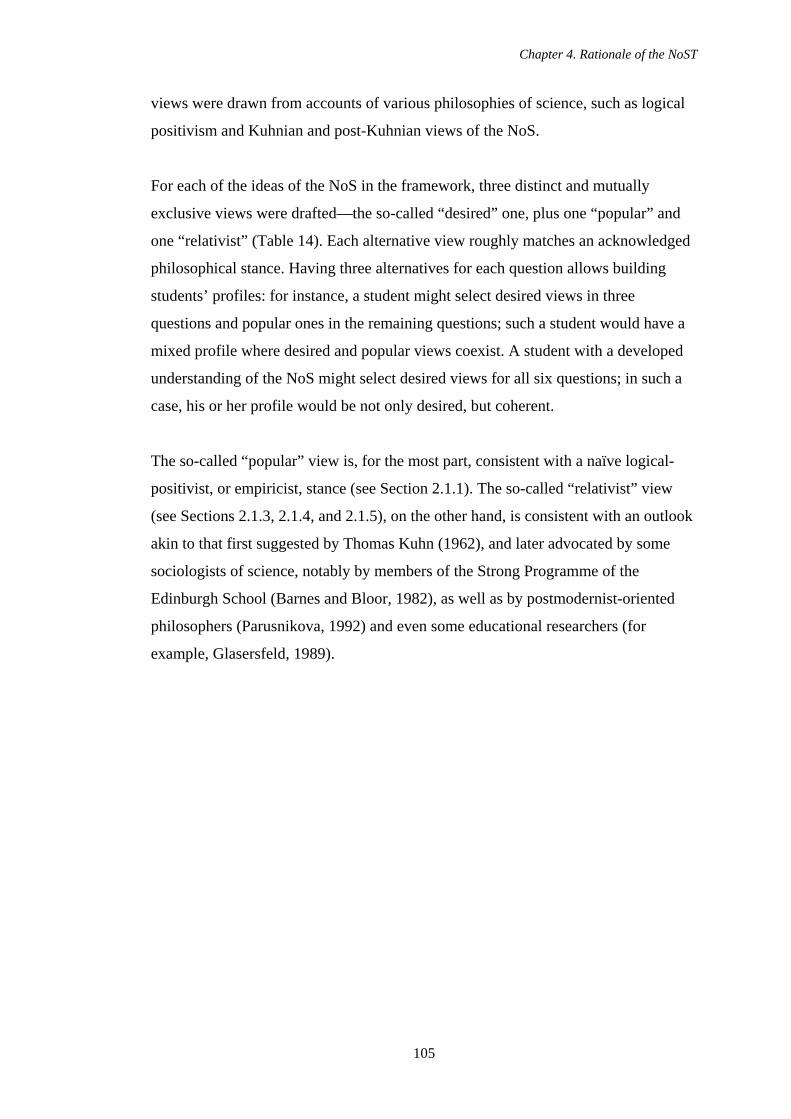
Chapter 4. Rationale of the NoST
105
views were drawn from accounts of various philosophies of science, such as logical
positivism and Kuhnian and post-Kuhnian views of the NoS.
For each of the ideas of the NoS in the framework, three distinct and mutually
exclusive views were drafted—the so-called “desired” one, plus one “popular” and
one “relativist” (Table 14). Each alternative view roughly matches an acknowledged
philosophical stance. Having three alternatives for each question allows building
students’ profiles: for instance, a student might select desired views in three
questions and popular ones in the remaining questions; such a student would have a
mixed profile where desired and popular views coexist. A student with a developed
understanding of the NoS might select desired views for all six questions; in such a
case, his or her profile would be not only desired, but coherent.
The so-called “popular” view is, for the most part, consistent with a naïve logical-
positivist, or empiricist, stance (see Section 2.1.1). The so-called “relativist” view
(see Sections 2.1.3, 2.1.4, and 2.1.5), on the other hand, is consistent with an outlook
akin to that first suggested by Thomas Kuhn (1962), and later advocated by some
sociologists of science, notably by members of the Strong Programme of the
Edinburgh School (Barnes and Bloor, 1982), as well as by postmodernist-oriented
philosophers (Parusnikova, 1992) and even some educational researchers (for
example, Glasersfeld, 1989).
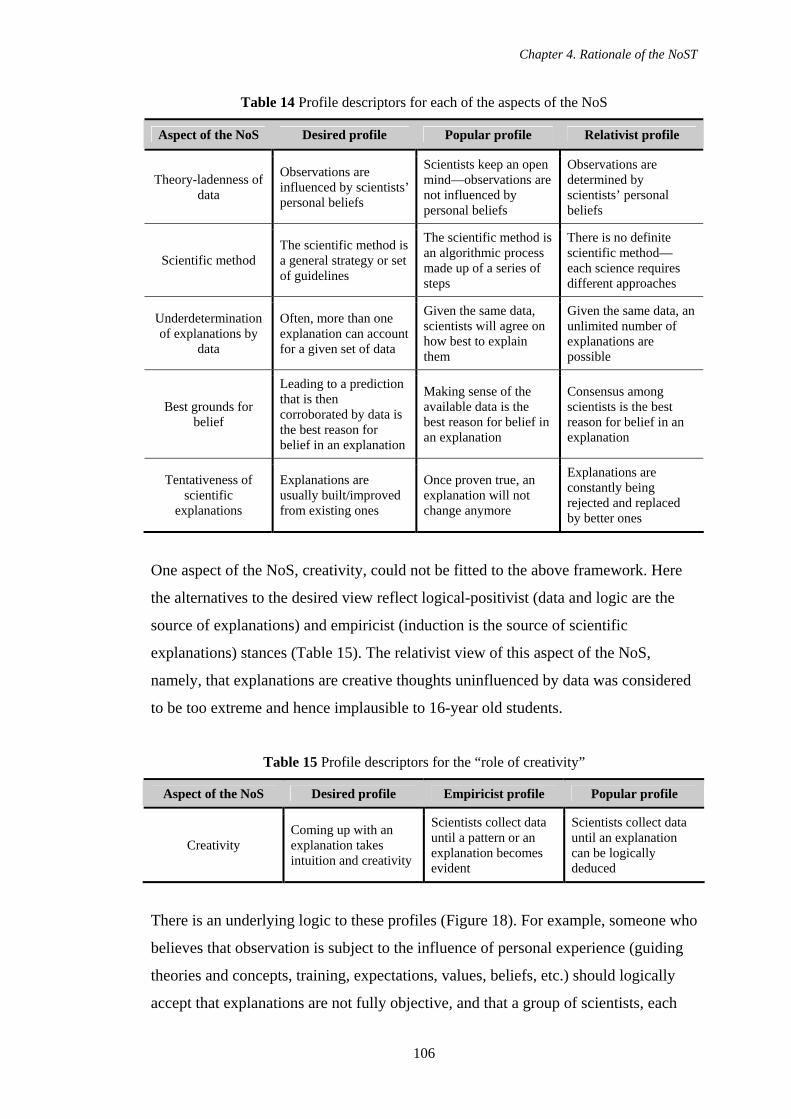
Chapter 4. Rationale of the NoST
106
Table 14 Profile descriptors for each of the aspects of the NoS
Aspect of the NoS Desired profile Popular profile Relativist profile
Theory-ladenness of data
Observations are influenced by scientists’ personal beliefs
Scientists keep an open mind—observations are not influenced by personal beliefs
Observations are determined by scientists’ personal beliefs
Scientific method The scientific method is a general strategy or set of guidelines
The scientific method is an algorithmic process made up of a series of steps
There is no definite scientific method—each science requires different approaches
Underdetermination of explanations by
data
Often, more than one explanation can account for a given set of data
Given the same data, scientists will agree on how best to explain them
Given the same data, an unlimited number of explanations are possible
Best grounds for belief
Leading to a prediction that is then corroborated by data is the best reason for belief in an explanation
Making sense of the available data is the best reason for belief in an explanation
Consensus among scientists is the best reason for belief in an explanation
Tentativeness of scientific
explanations
Explanations are usually built/improved from existing ones
Once proven true, an explanation will not change anymore
Explanations are constantly being rejected and replaced by better ones
One aspect of the NoS, creativity, could not be fitted to the above framework. Here
the alternatives to the desired view reflect logical-positivist (data and logic are the
source of explanations) and empiricist (induction is the source of scientific
explanations) stances (Table 15). The relativist view of this aspect of the NoS,
namely, that explanations are creative thoughts uninfluenced by data was considered
to be too extreme and hence implausible to 16-year old students.
Table 15 Profile descriptors for the “role of creativity”
Aspect of the NoS Desired profile Empiricist profile Popular profile
Creativity Coming up with an explanation takes intuition and creativity
Scientists collect data until a pattern or an explanation becomes evident
Scientists collect data until an explanation can be logically deduced
There is an underlying logic to these profiles (Figure 18). For example, someone who
believes that observation is subject to the influence of personal experience (guiding
theories and concepts, training, expectations, values, beliefs, etc.) should logically
accept that explanations are not fully objective, and that a group of scientists, each
Chapter 4. Rationale of the NoST
107
with a different background, could arrive at different explanations for the same data.
Furthermore, if theories are to some extent uncertain, it is logical to believe that they
can be improved and even replaced. Likewise, a belief in the importance of creativity
in the process of generating an explanation entails belief in their underdetermination
and tentativeness. On the other hand, believing that scientists keep an open mind,
unbiased by experience, is consistent with an empiricist or logical-positivist stance
which denies the role of creativity and the underdetermination of theory by data,
treats explanations as durable and sees “making sense of the data” as the best
grounds for accepting a claim.
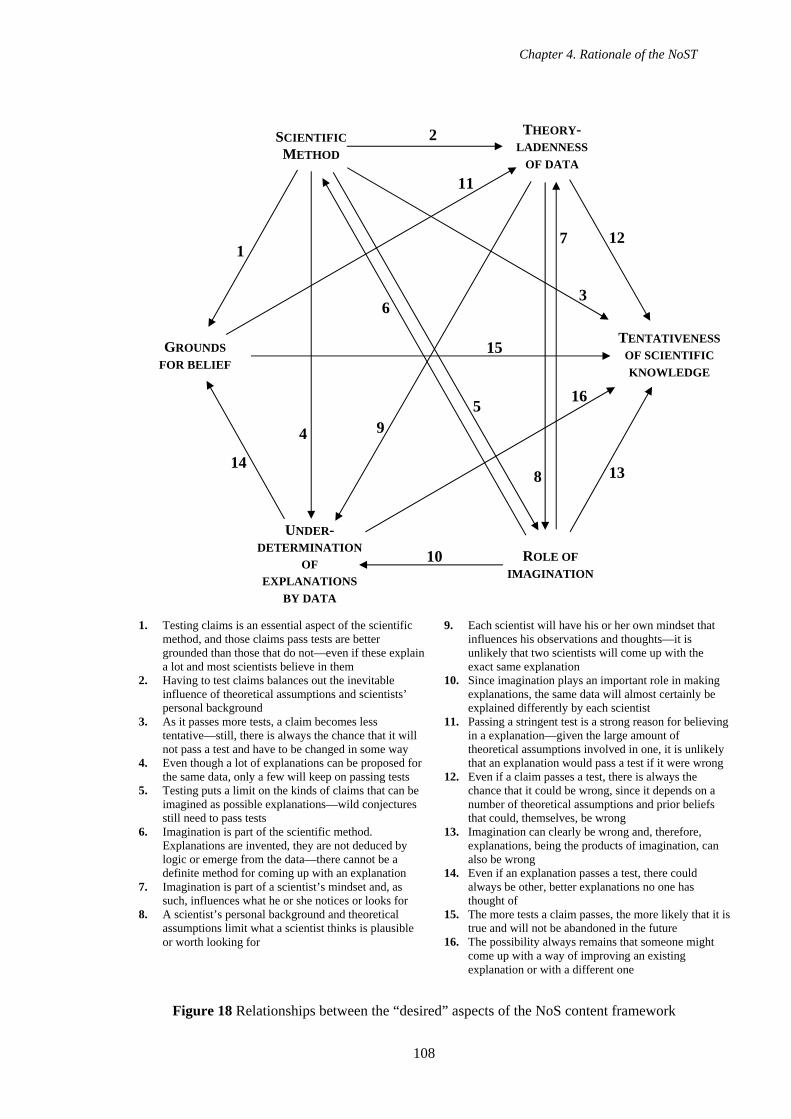
Chapter 4. Rationale of the NoST
108
Figure 18 Relationships between the “desired” aspects of the NoS content framework
SCIENTIFIC METHOD
THEORY-LADENNESS
OF DATA
UNDER-DETERMINATION
OF EXPLANATIONS
BY DATA
GROUNDS FOR BELIEF
TENTATIVENESS OF SCIENTIFIC KNOWLEDGE
ROLE OF IMAGINATION
1
2
3
4
5
6
7
8
9
10
11
12
13 14
15
16
1. Testing claims is an essential aspect of the scientific method, and those claims pass tests are better grounded than those that do not—even if these explain a lot and most scientists believe in them
2. Having to test claims balances out the inevitable influence of theoretical assumptions and scientists’ personal background
3. As it passes more tests, a claim becomes less tentative—still, there is always the chance that it will not pass a test and have to be changed in some way
4. Even though a lot of explanations can be proposed for the same data, only a few will keep on passing tests
5. Testing puts a limit on the kinds of claims that can be imagined as possible explanations—wild conjectures still need to pass tests
6. Imagination is part of the scientific method. Explanations are invented, they are not deduced by logic or emerge from the data—there cannot be a definite method for coming up with an explanation
7. Imagination is part of a scientist’s mindset and, as such, influences what he or she notices or looks for
8. A scientist’s personal background and theoretical assumptions limit what a scientist thinks is plausible or worth looking for
9. Each scientist will have his or her own mindset that influences his observations and thoughts—it is unlikely that two scientists will come up with the exact same explanation
10. Since imagination plays an important role in making explanations, the same data will almost certainly be explained differently by each scientist
11. Passing a stringent test is a strong reason for believing in a explanation—given the large amount of theoretical assumptions involved in one, it is unlikely that an explanation would pass a test if it were wrong
12. Even if a claim passes a test, there is always the chance that it could be wrong, since it depends on a number of theoretical assumptions and prior beliefs that could, themselves, be wrong
13. Imagination can clearly be wrong and, therefore, explanations, being the products of imagination, can also be wrong
14. Even if an explanation passes a test, there could always be other, better explanations no one has thought of
15. The more tests a claim passes, the more likely that it is true and will not be abandoned in the future
16. The possibility always remains that someone might come up with a way of improving an existing explanation or with a different one
Chapter 4. Rationale of the NoST
109
Besides possessing naïve views of the NoS, it is likely that many students also
possess inconsistent views that do not match any of the three fixed positions. Indeed,
research into students’ and teachers’ views of the NoS has suggested that these are
“fluid, fragmented, and compartmentalized” (Lederman et al., 2002, p. 513). If this is
the case, the test would still be able to capture students’ views, no matter how
inconsistent, since the multiple-choice format allows students to choose any
combination of responses.
There is some evidence supporting the view that the three profiles match students’
epistemological development, and that the desired view can be seen as the more
complex and mature one. Kitchener and King (1981) have developed a sequential
model of epistemological development that outlines “a sequence of increasingly
complex assumptions about knowledge and reality” (p. 91). This model has seven
stages (Table 16) derived from high school, college, and graduate students’ interview
responses to intellectual dilemmas, such as the debate between evolution and
creationism or the danger of chemical additives in foodstuffs. Kitchener and King
found that the stages of development correlate with students’ schooling level as
follows:
Older, better-educated subjects held more complex and sophisticated assumptions about the justification of beliefs than did younger subjects with less education. The 16- to 17-year-old high school students tended to justify their beliefs with absolute assumptions about knowledge or assumed there was no valid way to justify beliefs unless knowledge was manifest in data. By contrast, the 19- to 20-year old college students tended to assume that absolute knowledge was for practical reasons impossible to attain, and they tended to view the justification process as idiosyncratic. Graduate students (aged 24 to 34) tended to assume that knowledge claims needed to be and could be rationally justified as reasonable conjectures about reality (p. 112).
The researchers could not account for these differences in epistemological
development by appealing to factors such as “verbal ability, formal operations, socio-
economic status, and verbal fluency” and ended up suggesting that differences might
be explained by “maturation, education, selection into higher educational programs”
(p. 112-113) or a combination of these factors.
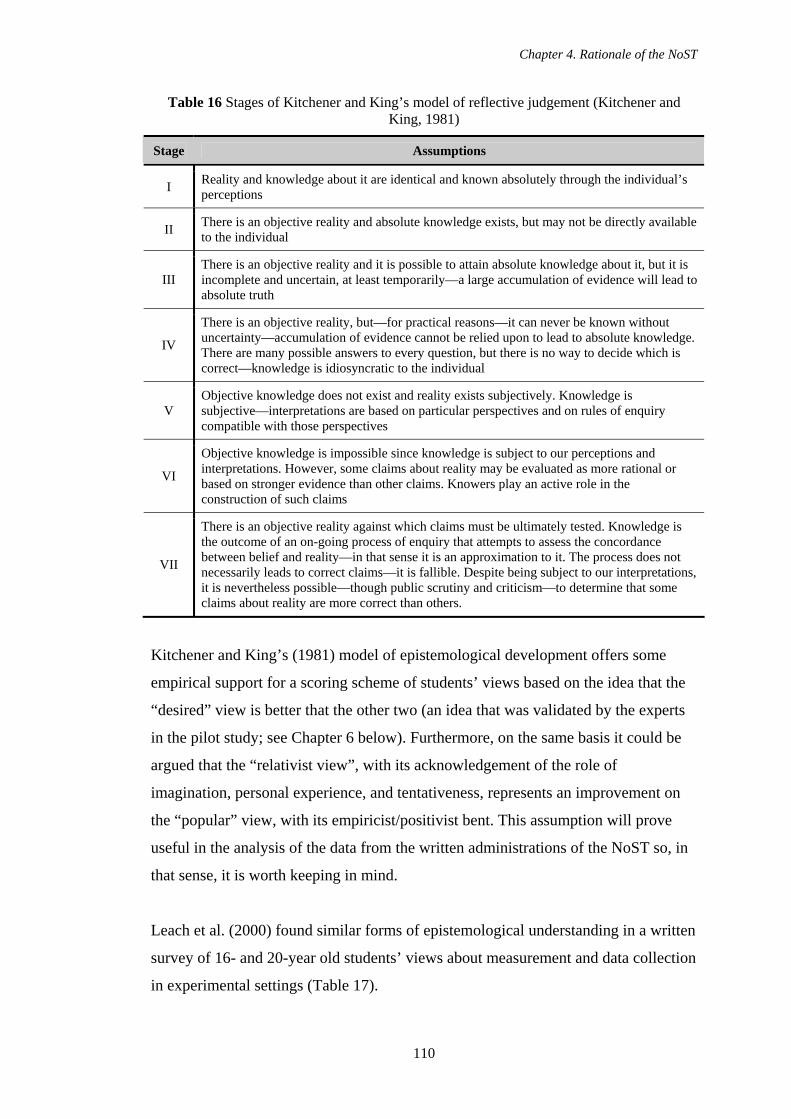
Chapter 4. Rationale of the NoST
110
Table 16 Stages of Kitchener and King’s model of reflective judgement (Kitchener and King, 1981)
Stage Assumptions
I Reality and knowledge about it are identical and known absolutely through the individual’s perceptions
II There is an objective reality and absolute knowledge exists, but may not be directly available to the individual
III There is an objective reality and it is possible to attain absolute knowledge about it, but it is incomplete and uncertain, at least temporarily—a large accumulation of evidence will lead to absolute truth
IV
There is an objective reality, but—for practical reasons—it can never be known without uncertainty—accumulation of evidence cannot be relied upon to lead to absolute knowledge. There are many possible answers to every question, but there is no way to decide which is correct—knowledge is idiosyncratic to the individual
V Objective knowledge does not exist and reality exists subjectively. Knowledge is subjective—interpretations are based on particular perspectives and on rules of enquiry compatible with those perspectives
VI
Objective knowledge is impossible since knowledge is subject to our perceptions and interpretations. However, some claims about reality may be evaluated as more rational or based on stronger evidence than other claims. Knowers play an active role in the construction of such claims
VII
There is an objective reality against which claims must be ultimately tested. Knowledge is the outcome of an on-going process of enquiry that attempts to assess the concordance between belief and reality—in that sense it is an approximation to it. The process does not necessarily leads to correct claims—it is fallible. Despite being subject to our interpretations, it is nevertheless possible—though public scrutiny and criticism—to determine that some claims about reality are more correct than others.
Kitchener and King’s (1981) model of epistemological development offers some
empirical support for a scoring scheme of students’ views based on the idea that the
“desired” view is better that the other two (an idea that was validated by the experts
in the pilot study; see Chapter 6 below). Furthermore, on the same basis it could be
argued that the “relativist view”, with its acknowledgement of the role of
imagination, personal experience, and tentativeness, represents an improvement on
the “popular” view, with its empiricist/positivist bent. This assumption will prove
useful in the analysis of the data from the written administrations of the NoST so, in
that sense, it is worth keeping in mind.
Leach et al. (2000) found similar forms of epistemological understanding in a written
survey of 16- and 20-year old students’ views about measurement and data collection
in experimental settings (Table 17).
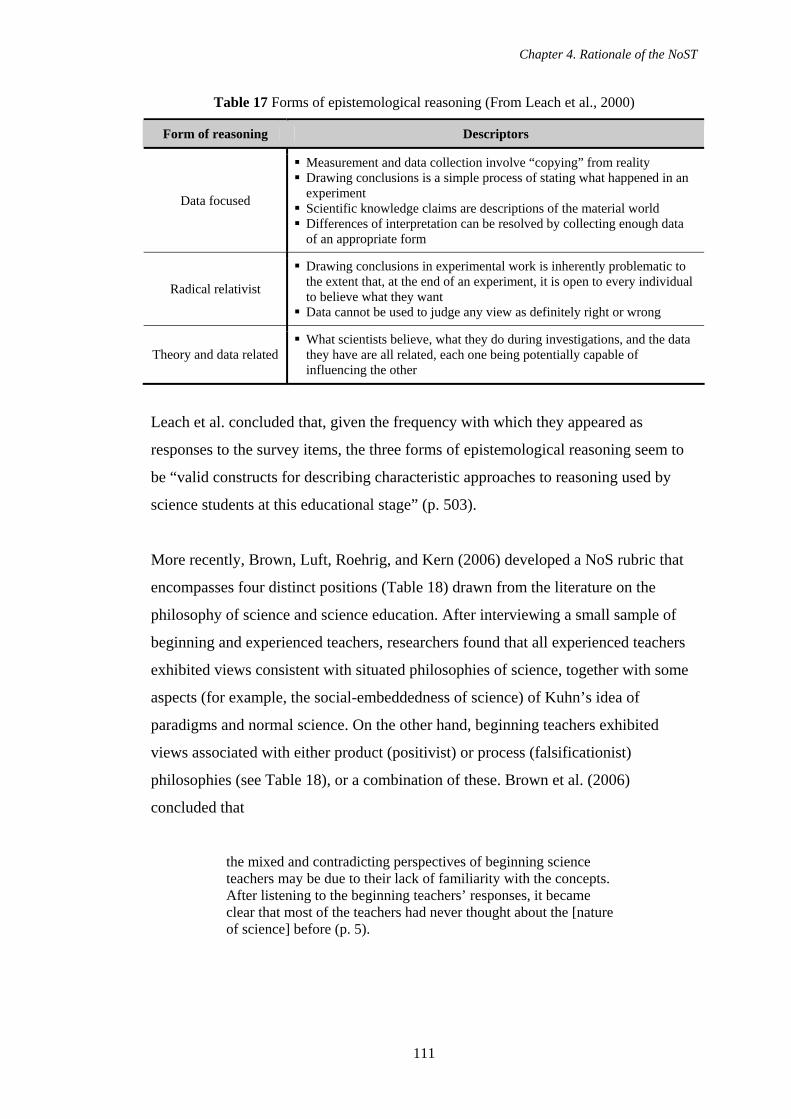
Chapter 4. Rationale of the NoST
111
Table 17 Forms of epistemological reasoning (From Leach et al., 2000)
Form of reasoning Descriptors
Data focused
Measurement and data collection involve “copying” from reality Drawing conclusions is a simple process of stating what happened in an experiment
Scientific knowledge claims are descriptions of the material world Differences of interpretation can be resolved by collecting enough data of an appropriate form
Radical relativist
Drawing conclusions in experimental work is inherently problematic to the extent that, at the end of an experiment, it is open to every individual to believe what they want
Data cannot be used to judge any view as definitely right or wrong
Theory and data related What scientists believe, what they do during investigations, and the data they have are all related, each one being potentially capable of influencing the other
Leach et al. concluded that, given the frequency with which they appeared as
responses to the survey items, the three forms of epistemological reasoning seem to
be “valid constructs for describing characteristic approaches to reasoning used by
science students at this educational stage” (p. 503).
More recently, Brown, Luft, Roehrig, and Kern (2006) developed a NoS rubric that
encompasses four distinct positions (Table 18) drawn from the literature on the
philosophy of science and science education. After interviewing a small sample of
beginning and experienced teachers, researchers found that all experienced teachers
exhibited views consistent with situated philosophies of science, together with some
aspects (for example, the social-embeddedness of science) of Kuhn’s idea of
paradigms and normal science. On the other hand, beginning teachers exhibited
views associated with either product (positivist) or process (falsificationist)
philosophies (see Table 18), or a combination of these. Brown et al. (2006)
concluded that
the mixed and contradicting perspectives of beginning science teachers may be due to their lack of familiarity with the concepts. After listening to the beginning teachers’ responses, it became clear that most of the teachers had never thought about the [nature of science] before (p. 5).
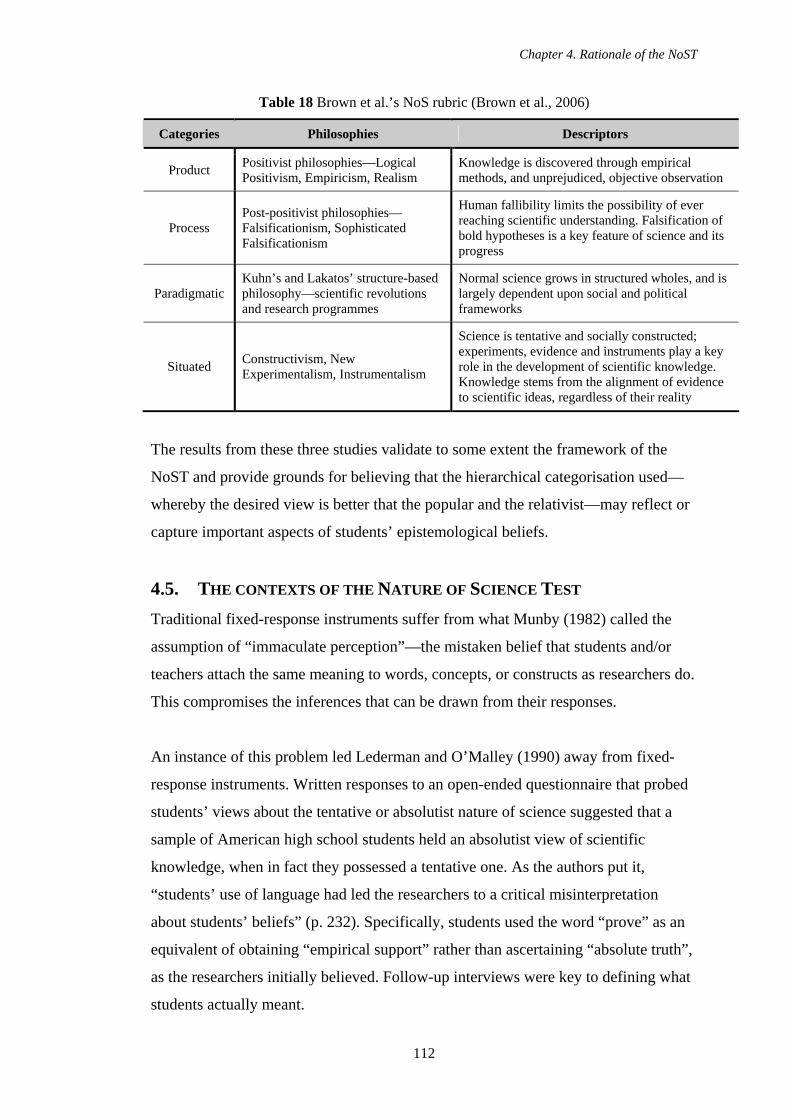
Chapter 4. Rationale of the NoST
112
Table 18 Brown et al.’s NoS rubric (Brown et al., 2006)
Categories Philosophies Descriptors
Product Positivist philosophies—Logical Positivism, Empiricism, Realism
Knowledge is discovered through empirical methods, and unprejudiced, objective observation
Process Post-positivist philosophies—Falsificationism, Sophisticated Falsificationism
Human fallibility limits the possibility of ever reaching scientific understanding. Falsification of bold hypotheses is a key feature of science and its progress
Paradigmatic Kuhn’s and Lakatos’ structure-based philosophy—scientific revolutions and research programmes
Normal science grows in structured wholes, and is largely dependent upon social and political frameworks
Situated Constructivism, New Experimentalism, Instrumentalism
Science is tentative and socially constructed; experiments, evidence and instruments play a key role in the development of scientific knowledge. Knowledge stems from the alignment of evidence to scientific ideas, regardless of their reality
The results from these three studies validate to some extent the framework of the
NoST and provide grounds for believing that the hierarchical categorisation used—
whereby the desired view is better that the popular and the relativist—may reflect or
capture important aspects of students’ epistemological beliefs.
4.5. THE CONTEXTS OF THE NATURE OF SCIENCE TEST Traditional fixed-response instruments suffer from what Munby (1982) called the
assumption of “immaculate perception”—the mistaken belief that students and/or
teachers attach the same meaning to words, concepts, or constructs as researchers do.
This compromises the inferences that can be drawn from their responses.
An instance of this problem led Lederman and O’Malley (1990) away from fixed-
response instruments. Written responses to an open-ended questionnaire that probed
students’ views about the tentative or absolutist nature of science suggested that a
sample of American high school students held an absolutist view of scientific
knowledge, when in fact they possessed a tentative one. As the authors put it,
“students’ use of language had led the researchers to a critical misinterpretation
about students’ beliefs” (p. 232). Specifically, students used the word “prove” as an
equivalent of obtaining “empirical support” rather than ascertaining “absolute truth”,
as the researchers initially believed. Follow-up interviews were key to defining what
students actually meant.
Chapter 4. Rationale of the NoST
113
Leach et al. (2000, p. 409) have stated clearly the relevance of this fallacious
assumption for research on views of the NoS, particularly for fixed-response
instruments:
The problems associated with interpreting students’ responses to [general, de-contextualised] items are well known. A major difficulty is that the researcher cannot know what specific instances students may have in mind when responding, or be sure how they are interpreting terms like “theoretical explanation”. So the same response from two respondents may arise from quite different reasoning and understanding; and very similar understandings on the part of two respondents may lead them, for largely contingent reasons, to give different responses. If so, the item lacks validity as a measure of students’ understanding of the aspect of the nature of science it is exploring. A more fundamental problem, however, lies in the assumption that each student has a unique understanding of the nature of science which can be revealed by his or her responses to questionnaire items of this kind.
Leach et al.’s argument is two-fold, and can be summarised as follows: assessing
students in a contextual void can lead to (a) the unwarranted assumption that they
hold unchanging views across contexts and/or (b) an equivocal interpretation of their
views, since the researcher might believe that students know the precise meaning of
key terms like “theory”. As discussed in Section 4.2, a more mature understanding of
the NoS should acknowledge the circumstances of a particular situation. In the light
of this, de-contextualised instruments can obscure respondents’ views by (a) eliciting
responses that are only partially representative of their thinking and/or (b) wholly
unrepresentative, if students misinterpreted the question. For these reasons, in the
NoST contexts are intended to help elicit more representative views of the NoS, as
well as fend off the risk of students misinterpreting a question.
Further evidence of the effects contexts can have on views of the NoS comes from
work with teachers. In a study of teachers’ epistemological beliefs, Koulaidis and
Ogborn (1989) found that biology teachers were more likely to favour an inductivist
viewpoint regarding the scientific method, whereas physics teachers favoured a more
Kuhnian outlook. Chemistry teachers exhibited more “eclectic” views—i.e., their
responses did not fit any pre-established stance. The researchers speculated that the
Chapter 4. Rationale of the NoST
114
status or prestige of a scientific discipline, its history, and the way it is taught could
be responsible for teachers’ differing views.
Building on the insights of Koulaidis and Ogborn, Nott and Wellington (1996) used
so-called “critical incidents” to elicit the views about science held by teachers.
Critical incidents are specific events which “make a teacher decide on a course of
action which involves some kind of explanation of the scientific enterprise” (p. 287).
They found that, among other things, critical incidents help teachers explore their
implicit understandings, by making them explicit, and to reflect on them. Nott and
Wellington concluded that “teachers are able to express views about science but not
in direct response to abstract, context-free questions of the sort, ‘What is science?’”
(p. 290). A lack of context can thus make it difficult to probe people’s views or,
worse, can elicit invalid ones.
Given their effect on teachers, it is only natural to suppose that abstract, context-free
questions can impair students’ ability to express or articulate their views. While
exploring students’ views of the tentativeness of scientific knowledge, Lederman and
O’Malley (1990) discovered that they are, for the most part, unable to provide
examples to illustrate or support their views. This suggests that students’ views are
just as likely to be the result of factual recall as of an understanding of the NoS, and
not of sustained reflection.
From the previous discussion it follows that even if a context is provided, it does not
guarantee reliable access to consistent views of the NoS—different contexts might
elicit different responses. Indeed, Leach et al. (2000) found a striking lack of
consistency in responses to contextualised survey items. No evidence was found to
suggest that students “hold unique epistemological positions that they use across a
wide range of contexts” (p. 521).
The degree of abstraction of questions about the NoS represents an especially serious
problem for most pencil-and-paper instruments: interviews allow interviewees to ask
for clarification of the purpose or meaning of any given question; interviewers in turn
can offer further explanation or concrete examples that illustrate the point. In the
case of pencil-and-paper instruments, these options are unavailable. The inclusion of
Chapter 4. Rationale of the NoST
115
historical episodes circumvents this problem to some degree. When faced with
uncertainty as to what a question means, respondents can use the episode to clarify
the terms and intent of the question.
A few instruments, notably Cotham and Smith’s COST (1981), Aikenhead and
Ryan’s VOSTS (1992), and Liang et al.’s SUSSI (2008), incorporate short
statements that contextualise items. However, due to their brevity, these contexts
raise the question of whether students truly understand the issue at hand and what is
being asked in relation to it. A fuller account makes this less likely. If respondents no
longer have to think of examples with which to illustrate the questions, they can
focus on the questions themselves and perhaps express more easily their implicit
understandings of the NoS.
Initially, different kinds of episodes were considered as contexts for the test—
hypothetical or made-up scenarios; historical episodes in science; current
socioscientific issues; practical laboratory experiences or set-ups; non-scientific,
everyday situations; examples of scientific principles, laws, or theories; and media
accounts of science. At this stage, the collection of contexts influenced the
development of the content framework of the NoST (Table 13), since both processes
were conducted in parallel. Many of the ideas that ended up in the framework—such
as the empirical basis of scientific knowledge, its tentative and durable character, the
underdetermination of data, and the key role of creativity—were also represented in
the stories. Eventually, after drafting questions for each of these contexts, it was
agreed that only historical episodes would be used.
To illustrate some of the considerations that led to rejecting the remaining kinds of
contexts, it can be said that current socioscientific issues, media accounts of science,
and laboratory experiences require considerable background knowledge for a full
understanding—something that, were it to be included, would considerably lengthen
the test. For their part, non-scientific, everyday situations are far removed from
science and this casts doubt on their validity as examples of scientific thinking. At a
more practical level, in many non-historical contexts, it was difficult to find all six
aspects of the NoS framework represented simultaneously. This required drafting
short paragraphs for each question, as Aikenhead did in VOSTS. This test layout was
Chapter 4. Rationale of the NoST
116
abandoned because it took up too much space and would take students longer to
complete.
A few historical contexts that included all—or most—of the aspects of the
framework were found in secondary school science textbooks. Those that did not
were successfully edited so as to incorporate the missing ones. Sampling historical
episodes from available textbooks has some added benefits: being in the form of
stories, they are easier to follow, compared with more abstract or partial accounts;
the language level is appropriate for 16-year old students (for more on language, see
Section 4.10); students may already possess a certain familiarity with them; and,
usually, they flesh out a more or less complete account of a scientific episode, which
minimises the need for additional background information.
The historical episodes are thus intended to provide a background against which the
respondent answers the questions. Rather than leaving them with a vague or general
idea of “science” or “scientists”, it gives them a specific image to have in mind. This
therefore exerts some measure of control on the kinds of examples a respondent
might draw upon. This is a validity concern for all instruments because people’s
mental image of science is a product not only of their schooling, but also of their
personal experiences and exposure to television programmes, science fiction stories,
and newspaper articles. In interviews with Canadian high school students about the
sources of their beliefs about science and scientists, Aikenhead (1988) found that, of
a little more than a hundred references made by students, almost half (46%) of them
cited television (news and movies) and films as the chief sources of their beliefs.
Newspapers (16%), magazines and books (11%), English or social studies classes
(8%), family members (8%), and personal experience (2%) accounted for another
45%. Dramatically, science classes accounted for only 10%. Tellingly, these results
were consistent with studies carried out in the United States, Australia, Israel, and
England (Aikenhead, 1988).
The treatment given to science by the above sources can differ markedly from that
given at school, to the extent that the media can sometimes give a wrong picture of,
or be at odds with, what is taught in classrooms. In the light of this multifaceted
blend of impressions about science, it is no wonder that students’ views might vary
Chapter 4. Rationale of the NoST
117
according to what happens to cross their mind when answering a test. Therefore,
scientific episodes were preferred over everyday, non-scientific contexts, such as
Kuhn’s (1988) tasks involving orange juice and tennis balls, because it can
reasonably be argued that questions set in these kinds of contexts may not elicit the
same views as similar questions set in actual scientific contexts.
In summary, contexts can have four desirable consequences for an assessment
instrument: (a) reducing misinterpretations of respondents by researchers, and vice
versa; (b) avoiding abstract questions, of the type “What is science?”, in order to let
respondents know the scope of the question; (c) tapping into views related to actual
and well-established scientific practice, insuring validity; and (d) reducing the
cognitive burden imposed by a lack of concrete examples respondents can use as an
aid in thinking their views through.
One of the main questions addressed at this point was the extent of the
contextualisation of questions. If they were too heavily contextualised, they could
easily become reading comprehension probes instead of probes of views of the NoS.
On the other hand, if there is no relationship between context and questions, there is
no justification for including the former. Since one of the main aims of the study has
to do with the validation of the test, it was decided to minimise the extent of
contextualisation so that parallel forms of the test could be prepared, each with a
different context. These forms could then be piloted and the reliability of students’
responses determined by comparing them across contexts. Comparisons of results
from tests with different contexts but the same questions can reveal, in less uncertain
terms, whether there is an effect due to context.
The versatile design of the test allows the assessment of all six aspects of the NoS
(see Table 14 and Table 15) with a single episode. What is more, the consistency of
respondents’ views can be explored by asking him or her to answer the same set of
questions in two or more contexts. A respondent might seem to have a mature view
of the NoS in completing one form of the test with a particular episode, but a
consistent pattern of responses across episodes would provide stronger evidence of
his or her view. If understandings of the NoS are situated and there is indeed a
Chapter 4. Rationale of the NoST
118
context-effect on students’ views, as many researchers have suggested, it might be
possible to explore this effect with the aid of the NoST.
The contextual episodes therefore needed to be written in as simple and
straightforward a manner as possible, in a style that 16-year olds could easily grasp.
Additionally, each episode had to present a complete, albeit brief, account of a story
from the history of science. With these criteria in mind, secondary science textbooks
were reviewed in search of episodes. After the first selection stage, a second one
focused on collecting episodes that touched upon matters associated with each of the
disciplines taught in school—physics, chemistry, biology, and Earth science. The
topics covered by the final set of six episodes are: (a) Dr Joseph Goldberger’s efforts
to find the cause and the cure for pellagra (from Campbell et al., 1991); (b)
Francesco Redi’s arguments against spontaneous generation (from Levesley et al.,
2008); (c) the development of the theory of plate tectonics by Alfred Wegener (from
Campbell et al., 1991); (d) Joseph Priestley and Antoine Lavoisier’s discovery of
oxygen (from Ellse, 1987; Giere et al., 2006); (e) the discovery of Neptune from
calculations made by Adams and Le Verrier (from Campbell et al., 1997); and (f)
Fresnel’s ideas on the wave-like nature of light (from Giere et al., 2006).
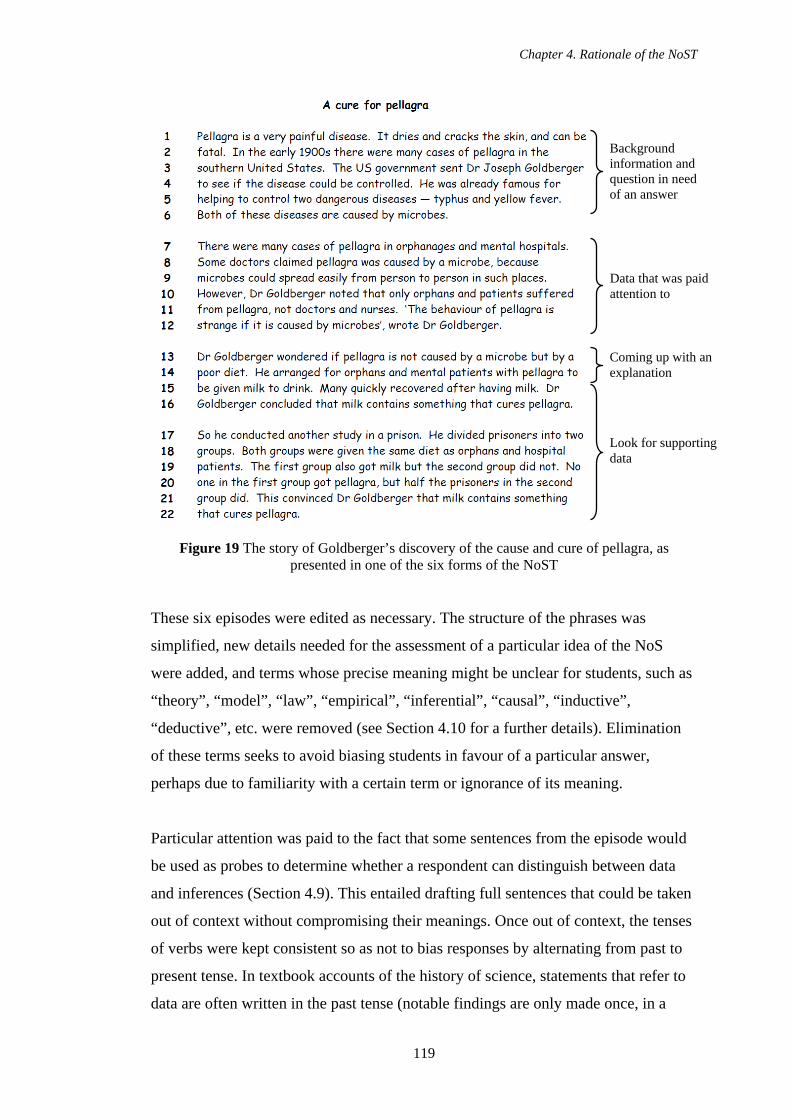
Chapter 4. Rationale of the NoST
119
Figure 19 The story of Goldberger’s discovery of the cause and cure of pellagra, as
presented in one of the six forms of the NoST
These six episodes were edited as necessary. The structure of the phrases was
simplified, new details needed for the assessment of a particular idea of the NoS
were added, and terms whose precise meaning might be unclear for students, such as
“theory”, “model”, “law”, “empirical”, “inferential”, “causal”, “inductive”,
“deductive”, etc. were removed (see Section 4.10 for a further details). Elimination
of these terms seeks to avoid biasing students in favour of a particular answer,
perhaps due to familiarity with a certain term or ignorance of its meaning.
Particular attention was paid to the fact that some sentences from the episode would
be used as probes to determine whether a respondent can distinguish between data
and inferences (Section 4.9). This entailed drafting full sentences that could be taken
out of context without compromising their meanings. Once out of context, the tenses
of verbs were kept consistent so as not to bias responses by alternating from past to
present tense. In textbook accounts of the history of science, statements that refer to
data are often written in the past tense (notable findings are only made once, in a
Data that was paid attention to
Coming up with an explanation
Background information and question in need of an answer
Look for supporting data
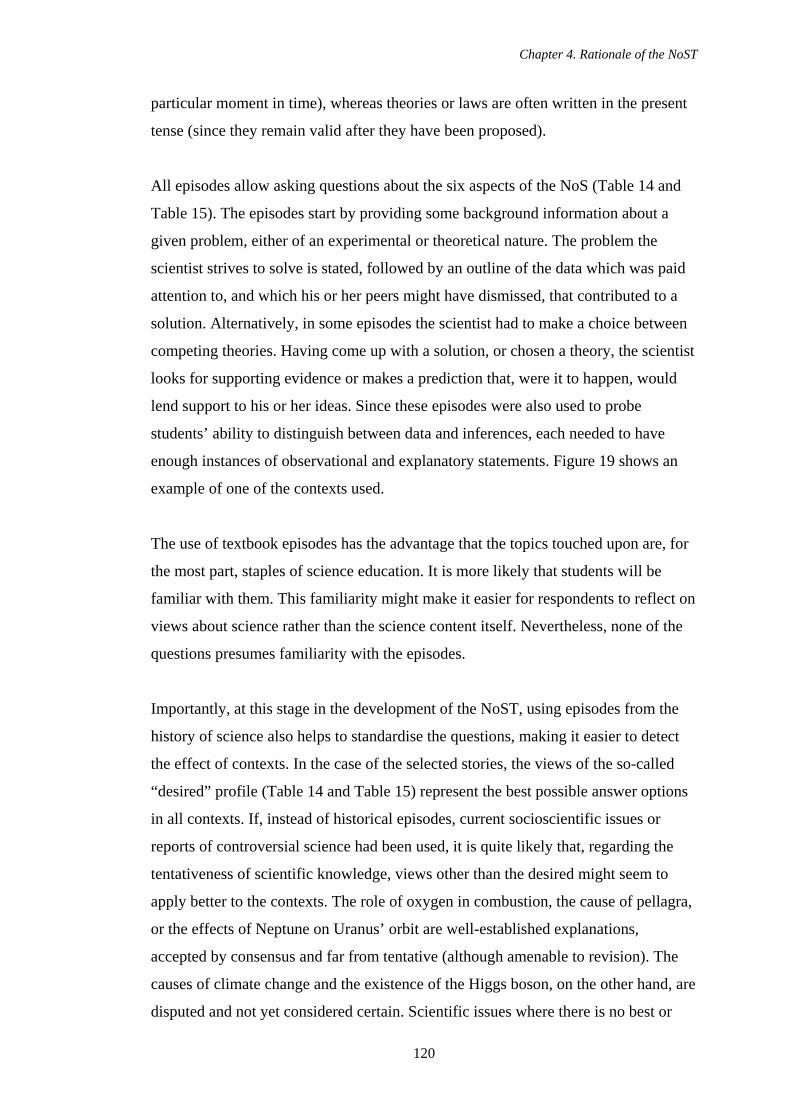
Chapter 4. Rationale of the NoST
120
particular moment in time), whereas theories or laws are often written in the present
tense (since they remain valid after they have been proposed).
All episodes allow asking questions about the six aspects of the NoS (Table 14 and
Table 15). The episodes start by providing some background information about a
given problem, either of an experimental or theoretical nature. The problem the
scientist strives to solve is stated, followed by an outline of the data which was paid
attention to, and which his or her peers might have dismissed, that contributed to a
solution. Alternatively, in some episodes the scientist had to make a choice between
competing theories. Having come up with a solution, or chosen a theory, the scientist
looks for supporting evidence or makes a prediction that, were it to happen, would
lend support to his or her ideas. Since these episodes were also used to probe
students’ ability to distinguish between data and inferences, each needed to have
enough instances of observational and explanatory statements. Figure 19 shows an
example of one of the contexts used.
The use of textbook episodes has the advantage that the topics touched upon are, for
the most part, staples of science education. It is more likely that students will be
familiar with them. This familiarity might make it easier for respondents to reflect on
views about science rather than the science content itself. Nevertheless, none of the
questions presumes familiarity with the episodes.
Importantly, at this stage in the development of the NoST, using episodes from the
history of science also helps to standardise the questions, making it easier to detect
the effect of contexts. In the case of the selected stories, the views of the so-called
“desired” profile (Table 14 and Table 15) represent the best possible answer options
in all contexts. If, instead of historical episodes, current socioscientific issues or
reports of controversial science had been used, it is quite likely that, regarding the
tentativeness of scientific knowledge, views other than the desired might seem to
apply better to the contexts. The role of oxygen in combustion, the cause of pellagra,
or the effects of Neptune on Uranus’ orbit are well-established explanations,
accepted by consensus and far from tentative (although amenable to revision). The
causes of climate change and the existence of the Higgs boson, on the other hand, are
disputed and not yet considered certain. Scientific issues where there is no best or
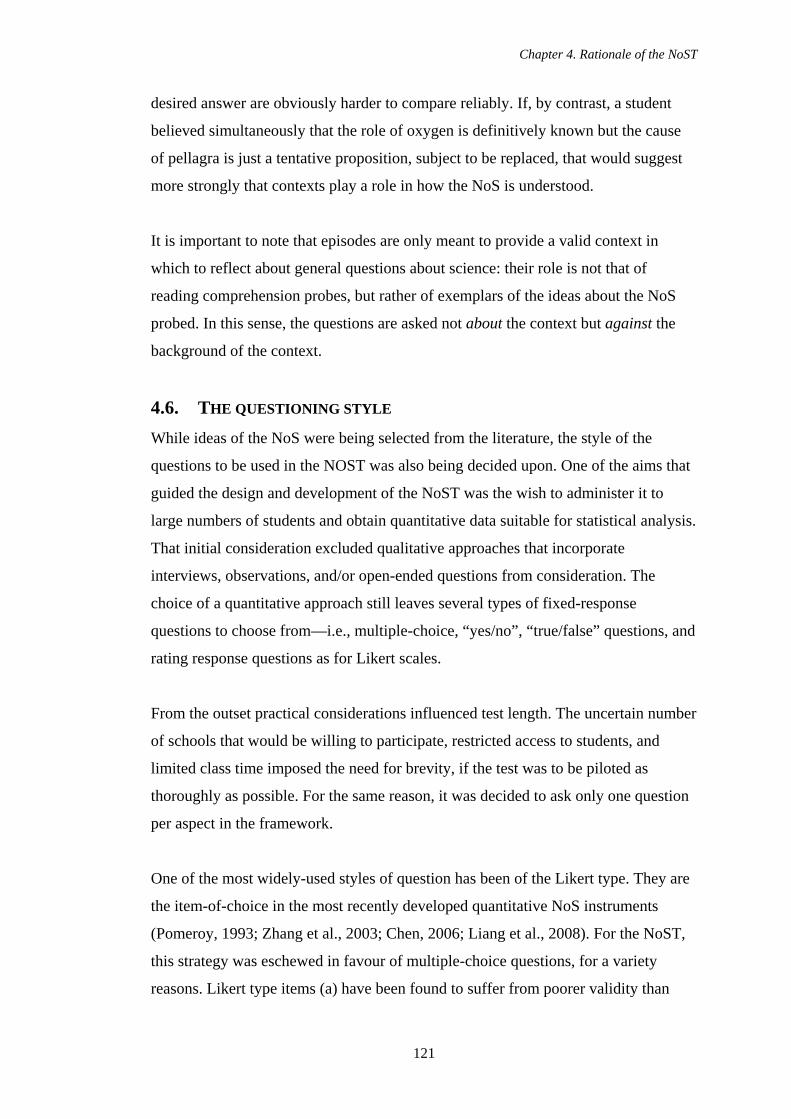
Chapter 4. Rationale of the NoST
121
desired answer are obviously harder to compare reliably. If, by contrast, a student
believed simultaneously that the role of oxygen is definitively known but the cause
of pellagra is just a tentative proposition, subject to be replaced, that would suggest
more strongly that contexts play a role in how the NoS is understood.
It is important to note that episodes are only meant to provide a valid context in
which to reflect about general questions about science: their role is not that of
reading comprehension probes, but rather of exemplars of the ideas about the NoS
probed. In this sense, the questions are asked not about the context but against the
background of the context.
4.6. THE QUESTIONING STYLE While ideas of the NoS were being selected from the literature, the style of the
questions to be used in the NOST was also being decided upon. One of the aims that
guided the design and development of the NoST was the wish to administer it to
large numbers of students and obtain quantitative data suitable for statistical analysis.
That initial consideration excluded qualitative approaches that incorporate
interviews, observations, and/or open-ended questions from consideration. The
choice of a quantitative approach still leaves several types of fixed-response
questions to choose from—i.e., multiple-choice, “yes/no”, “true/false” questions, and
rating response questions as for Likert scales.
From the outset practical considerations influenced test length. The uncertain number
of schools that would be willing to participate, restricted access to students, and
limited class time imposed the need for brevity, if the test was to be piloted as
thoroughly as possible. For the same reason, it was decided to ask only one question
per aspect in the framework.
One of the most widely-used styles of question has been of the Likert type. They are
the item-of-choice in the most recently developed quantitative NoS instruments
(Pomeroy, 1993; Zhang et al., 2003; Chen, 2006; Liang et al., 2008). For the NoST,
this strategy was eschewed in favour of multiple-choice questions, for a variety
reasons. Likert type items (a) have been found to suffer from poorer validity than
Chapter 4. Rationale of the NoST
122
other types, especially empirically-derived multiple-choice ones (Aikenhead, 1988);
(b) were originally devised as a comparative and quantitative assessment of
attitude—not knowledge (Aikenhead, 1988); (c) typically calculate global scores by
adding those for individual statements, unjustifiably assuming that they are all part of
a unique and homogeneous construct (in our case, the NoS; Vazquez-Alonso et al.,
2006) and making it difficult to construct profiles; (d) usually require more than one
statement per topic, in order to estimate reliability; (e) can produce data that is
difficult to interpret, especially when undecided or unreflective students agree or
disagree with all options, even mutually exclusive ones; (f) leave unexplored the
reasons students might have for agreeing with a given position (Aikenhead, 1988);
and (g) are necessarily one-dimensional (responses are codified according to an
agree/disagree scale), whereas multiple-choice questions can capture a wider range
of dimensions.
For the above reasons, multiple-choice questions were preferred. As a first
approach—and in parallel with the development of the framework—existing NoS
assessment instruments were reviewed in search of examples of multiple-choice
questions that could be used as models for new ones. Likewise, open-ended
questions from qualitative instruments, such as VNOS (Lederman et al., 2002), were
adapted into multiple-choice ones by adding answer options. None of these strategies
yielded much. On the one hand, many instruments were developed in the 1960s,
1970s, or 1980s and, since then, the NoS has been considerably updated and refined.
Consequently, few items fitted our framework. On the other hand, listing possible
answer options for an originally open-ended question proved to be a daunting task
and often resulted in a large number of options.
A variety of approaches were tried for drafting questions: varying the number of
distracters and correct answers; presenting incomplete statements to be completed by
filling a blank space; listing items to be ordered or grouped. Eventually it was
decided to keep the questions as simple as possible to minimise confusion for
students. The development of profiles also had a determining role in the final form of
the questions (see Section 4.4 for more details).
Chapter 4. Rationale of the NoST
123
At this stage of development, several criteria guided the design of the pilot version of
NoST: (a) include only one right answer per question, so as to keep the difficulty
level constant; (b) use the same number of distracters for each question, so that there
is an equal chance of picking the right answer across the test; (c) draft mutually
exclusive answer options; (d) draft questions and answer options that focus
exclusively on a single aspect of the NoS; and (e) do not contextualise questions to
the point that they become probes of reading comprehension or scientific enquiry
skills (Figure 20).
Figure 20 Question 2 from the pilot version of the test—the theory-ladenness of observation
One of the most important decisions—inasmuch as it determined the form of the
test—concerned the degree of contextualisation or, alternatively, abstractness of the
questions. On the one hand, it is desirable to provide a context for students to keep in
mind while answering the test (for reasons discussed in Section 4.5). On the other,
the more a question draws on the context, the more likely it can be that students’
responses will represent their comprehension of the context—or the level of their
science process skills—rather than their views of the NoS. In the light of this, it was
decided to minimise the effect of the contexts by drafting general questions but
setting these within specific contexts (see Section 4.7).
Although questions are de-contextualised—in the sense that they ask general
questions about science is still possible that the context has an influence on the
answers given. This is an issue to be explored empirically in this study.
Introductory segment
Stem segment
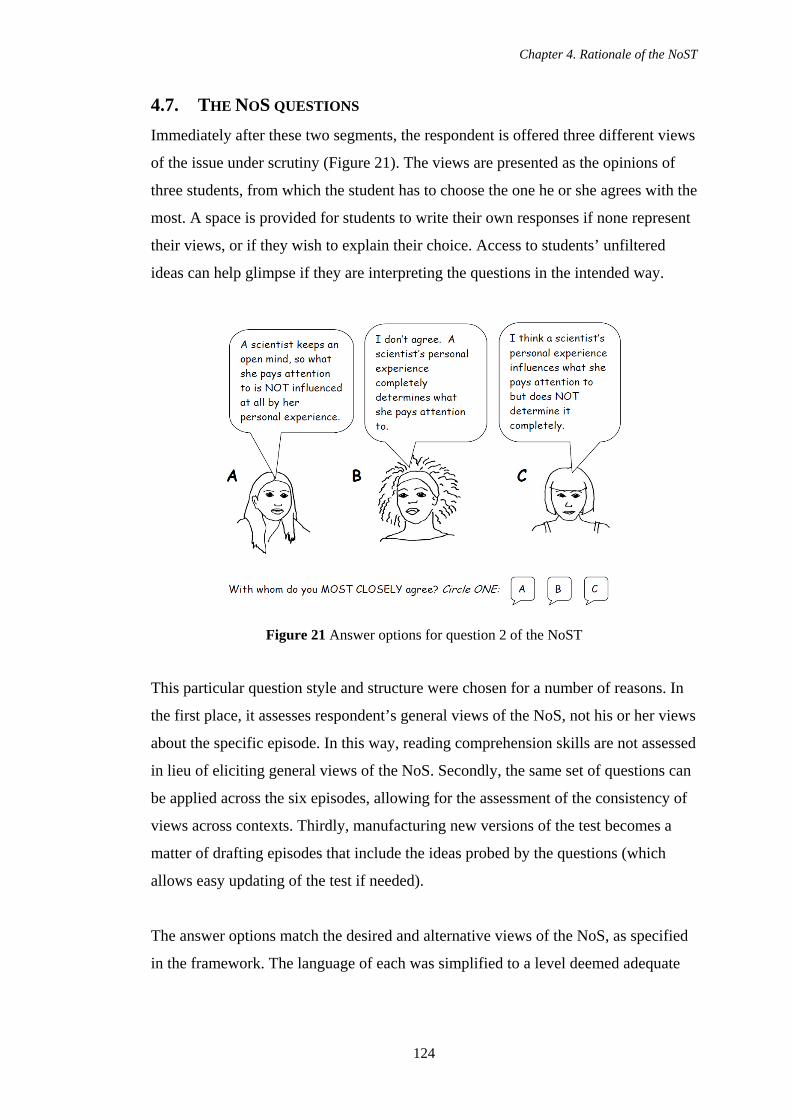
Chapter 4. Rationale of the NoST
124
4.7. THE NOS QUESTIONS Immediately after these two segments, the respondent is offered three different views
of the issue under scrutiny (Figure 21). The views are presented as the opinions of
three students, from which the student has to choose the one he or she agrees with the
most. A space is provided for students to write their own responses if none represent
their views, or if they wish to explain their choice. Access to students’ unfiltered
ideas can help glimpse if they are interpreting the questions in the intended way.
Figure 21 Answer options for question 2 of the NoST
This particular question style and structure were chosen for a number of reasons. In
the first place, it assesses respondent’s general views of the NoS, not his or her views
about the specific episode. In this way, reading comprehension skills are not assessed
in lieu of eliciting general views of the NoS. Secondly, the same set of questions can
be applied across the six episodes, allowing for the assessment of the consistency of
views across contexts. Thirdly, manufacturing new versions of the test becomes a
matter of drafting episodes that include the ideas probed by the questions (which
allows easy updating of the test if needed).
The answer options match the desired and alternative views of the NoS, as specified
in the framework. The language of each was simplified to a level deemed adequate
Chapter 4. Rationale of the NoST
125
for 16-year old students, and their order of presentation was chosen so as to mimic a
plausible conversation between three students.
The sequence of the questions themselves, reflected in the rationale, was patterned
on what is taken to be the standard school account of science, from data to
explanations. The first question of the test deals with the nature of observation,
specifically its theory-ladenness or subjectivity, followed by the role of creativity in
explaining observations and nature of the scientific method. The last three questions
address the character of scientific knowledge that results from applying the scientific
method: the underdetermination of theory, its trustworthiness, and its tentativeness or
durability. This account the narrative behind the sequence of the questions also
follows Giere’s model, in that it starts from the need to explain something, a need
fulfilled by imagining a plausible explanation and finally evaluating its
trustworthiness through comparisons of predictions deduced from it against
observational data.
4.8. THE CONCEPT CARTOONS Concept cartoons are a type of multiple-choice questions that integrate written text in
a dialogue format with a visual component, usually a line drawing. They allow the
presentation of a variety of views related to a central idea. Concept cartoons have
served a variety of educational purposes—according to Keogh and Naylor (1999),
they have been used in “the development of reading skills and vocabulary; problem
solving and thinking skills; enhancing motivation; resolving conflict; eliciting tacit
scientific understanding and making scientific ideas accessible” (pp. 341-342). Of
the above, eliciting tacit scientific understanding and making scientific ideas
accessible are especially relevant for our purposes.
Concept cartoons have been used in the past as probes with which to research
students’ scientific understanding (Ibrahim et al., 2009), and these efforts partly
inspired their use in the NoST. This strategy is particularly well-suited to the testing
of young people because it minimises the amount of writing, while the visual
element organises the information in an easy to read layout. Presenting information
in the form of a conversation has been recognised as an effective way of conveying
Chapter 4. Rationale of the NoST
126
information to the student, especially where divergent views are involved: “The use
of dialogue creates the opportunity to present alternative ideas, including one or more
views which are scientifically acceptable” (Keogh and Naylor, 1999, p. 432).
Aesthetically, cartoons are more appealing, engaging, and less threatening—
especially for younger students—than formats that rely exclusively on written text.
To minimise the risk of gender bias, all three cartoon characters in any given
question were selected to be either all male or all female. The frequency of the
appearance of each character was fixed in such a manner so as to avoid bias in favour
of any character—no character occupies the same position in the test regularly and
all characters at some point endorse desired and alternative views of the NoS. To
reduce an ethnic bias, cartoon characters included white, black, and Asian ethnicities.
The loose style of the line drawings also helps blur racial distinctions.
4.9. INFERENCE VERSUS DATA QUESTIONS The ability to distinguish between statements that report data and those that express
an inference has been advocated as an educational outcome (most recently, by
Lederman, 2007). From a strict epistemological standpoint, there is no “pure” data to
speak of since all data is theory-laden. However, from a more practical standpoint,
data and inferences occupy the opposite ends of a spectrum: a statement can be more
or less inferential according to its degree of closeness to experience. Furthermore, in
a given situation, distinguishing what needs to be explained from what is doing the
explaining is a matter that can be ascertained with some confidence.
Seeing science as an activity that develops theories and appraises their factual
adequacy presupposes being able to think of data and theory as separate and distinct
entities, the latter going beyond the observable to explain the former (Kuhn et al.,
1988). Norris and Phillips (2003) have even claimed that scientific literacy rests on
the capacity to “differentiate the status of scientific statements, from observations to
causal generalisations, to hypotheses, to descriptions of method” and “indicate the
role in reasoning played by various statements in science, whether they be statements
of evidence, predictions, or speculations” (p. 234).
Chapter 4. Rationale of the NoST
127
In the light of this, it was decided to include the distinction between observations and
inferences as a target for assessment, by drafting a question that explores whether
students are able to make this distinction. However, being able to distinguish
between both kinds of statements is a skill, not a view. Thus, the best way to
determine whether students are able to do this is not by asking them to define
“observation” and “inferences”, but to identify instances of both. In this sense, this
kind of assessment clashes with the overall design of the instrument, but constitutes a
more direct probe of this aspect of scientific thinking.
The use of episodes as contexts offers the opportunity to probe students’ ability to
distinguish between data and inferences without asking them to come up with
examples of their own or relying on de-contextualised statements. Question 1 of the
NoST offers respondents five statements, taken verbatim from the episode, that need
to be classified according to whether they report data or go beyond it. The statements
were carefully tailored to make them discrete units that could be taken out of context
without compromising their meaning.
Because data are usually things that were observed in the past, while theoretical
inferences, once formulated and accepted, continue to be seen as valid in the present,
statements from science textbooks that describe data are usually written in the past
tense, whereas inferences are sometimes written in the present tense. In order to
avoid biasing responses, the present tense was used for all statements employed in
Question 1.
It is worth acknowledging that assessing students’ ability to identify data and
inferences veers into the area of scientific process skills—an area that, for many
researchers, should not be confused with knowledge of the NoS, especially for
assessment purposes. However, in the case of NoST it was thought to be better,
validity-wise, to assess students’ ability to distinguish actual examples.
As mentioned in the opening paragraphs of this section, the ability to coordinate
theory and data and judge the adequacy of the latter to the former, underpins
scientific thinking. For the purposes of the present study, however, it was decided not
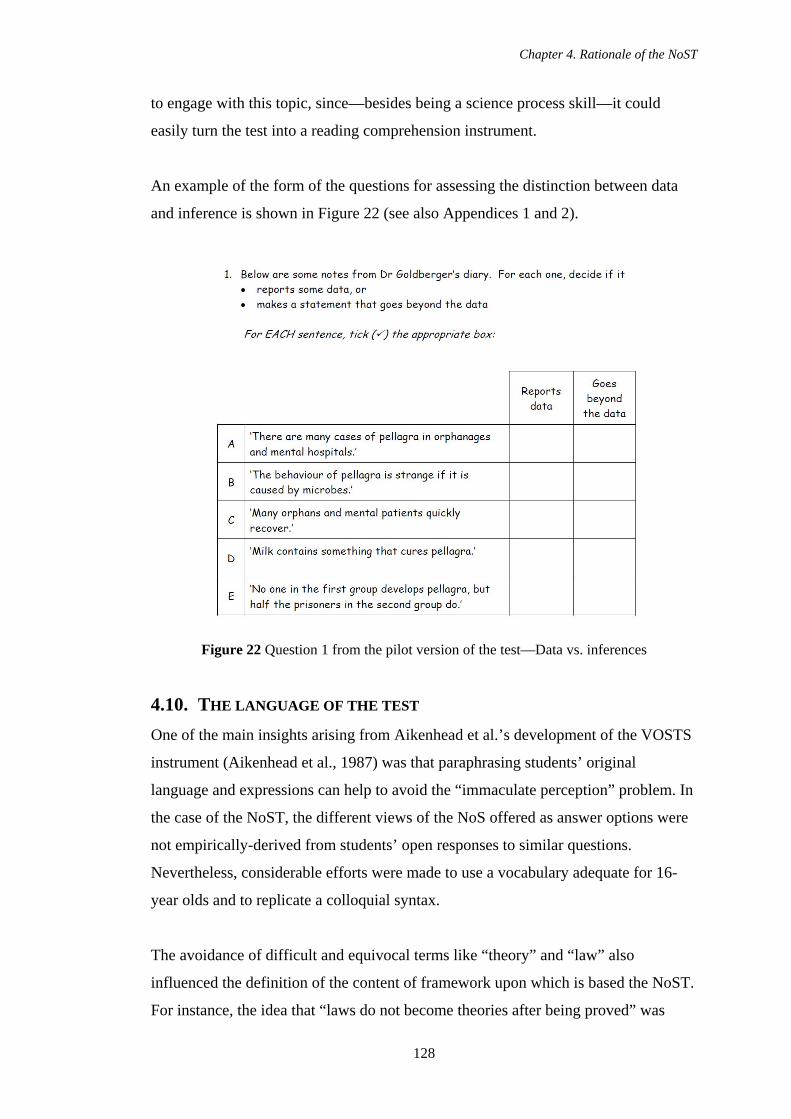
Chapter 4. Rationale of the NoST
128
to engage with this topic, since—besides being a science process skill—it could
easily turn the test into a reading comprehension instrument.
An example of the form of the questions for assessing the distinction between data
and inference is shown in Figure 22 (see also Appendices 1 and 2).
Figure 22 Question 1 from the pilot version of the test—Data vs. inferences
4.10. THE LANGUAGE OF THE TEST One of the main insights arising from Aikenhead et al.’s development of the VOSTS
instrument (Aikenhead et al., 1987) was that paraphrasing students’ original
language and expressions can help to avoid the “immaculate perception” problem. In
the case of the NoST, the different views of the NoS offered as answer options were
not empirically-derived from students’ open responses to similar questions.
Nevertheless, considerable efforts were made to use a vocabulary adequate for 16-
year olds and to replicate a colloquial syntax.
The avoidance of difficult and equivocal terms like “theory” and “law” also
influenced the definition of the content of framework upon which is based the NoST.
For instance, the idea that “laws do not become theories after being proved” was
Chapter 4. Rationale of the NoST
129
decided against, besides the considerations detailed in Section 4.3 of this chapter, on
the grounds that it would require students to understand unambiguously what is
meant by both terms, if their responses were to be valid and reliable.
Particular attention was paid to the choice of words with which to designate
observations and inferences. “Observation” was decided against because it could be
construed to mean only those instances when a scientist makes a measurement or
examines reports on a natural event. This would exclude experimental work where
situations are manipulated. “Fact” was not used because of its connotation of “proven
claim”. Instead, the term “data” was chosen. This is commonly used in secondary
science textbooks to refer to the results of observation and experiment. “Data”
implies something that has not been interpreted, different in kind from inferences.
Selecting a term to designate the speculative, inferential concepts and explanations of
science proved more difficult. On the one hand, words such as “theory”, “model”,
“law” and “hypothesis” have distinct and precise meanings that are not
interchangeable. “Opinion” could stand in for any or all of the above, but its meaning
is too ambiguous and downplays the fact that scientific explanations—whether
tentative or not—are not just groundless figments of the imagination that anyone can
come up with. “Assumption” suffers from the same problems “opinion” does.
“Explanation” is a word that captures the nature and function of theories, but not
necessarily of laws or hypotheses. Even though laws can be used to explain why an
event happens by showing it to be an instance a regular pattern in nature, laws are
mostly understood to be generalisations of the behaviour of sets of variables.
“Inference” seemed a more suitable word since it implies a statement with a certain
degree of uncertainty, a product of someone’s imagination built on existing data that
ultimately goes beyond it. It also manages to convey the speculative nature of
“theory”, “model”, “law”, “hypothesis”, and “explanation”. However, 16-year old
students might not be familiar with it. In the end, since none of the above terms is
sufficiently self-explanatory, “goes beyond the data” was used to characterise
inferential statements and minimise the chance of misunderstandings.
Chapter 4. Rationale of the NoST
130
As well as simplifying the vocabulary, care was taken to use terms consistent
throughout the various forms of the test. Inconsistencies arising from the
simultaneous use of different, overlapping terms could introduce another level of
ambiguity to responses. Simplifying the language of both contexts and questions
seeks, ultimately, to diminish the chance that a respondent might give an answer that
does not reflect his or her actual views. In this way, the frequently-voiced warning
against the assumption that students and researchers share the same meanings is
addressed.
4.11. THE NEXT STEPS The design of the NoST attempts to address some strong criticisms against paper-
and-pencil fixed-response instruments, by incorporating features intended to
facilitate the task of respondents and reduce the chance of misinterpretation of the
questions and responses to them. In spite of these measures, both the validity and
reliability of the test need to be determined, by consulting experts in the field of the
teaching of the NoS and trialling the test with students. In the following chapters, the
methods enacted to carry out this task will be described, before presenting and
discussing the results.
Chapter 5. Methods
131
5. CHAPTER 5
METHODS
5.1. THE PILOT STUDY Even though the design of the NoST attempts to address some of the criticisms raised
against the validity and reliability of past instruments, the effectiveness of the
assumptions behind the design still need to be tested. To uncover and correct any
issue that might jeopardise the validity and reliability of the NoST, booklets with all
six forms of the test were printed and sent to a number of secondary schools in
England to obtain feedback from students. At the same time, all forms of the NoST
were sent to a panel of international experts on the teaching of the NoS, asking them
to assess its purported content validity. In essence, the pilot study was a small-scale
trial of the design assumptions that underlie the test (for a full discussion of these
design assumptions, see Chapter 4).
On the whole, this pilot study follows many of the common steps carried out in prior
efforts to validate NoS assessment instruments (for reviews of these efforts, see
Lederman et al., 1998; Lederman, 2007), namely, an evaluation of its reliability from
students’ responses (although not in the usual way, as will be detailed below) and an
evaluation of its validity out of experts’ judgments. In the case of the NoST,
students’ responses were particularly important, since our items were not derived
empirically from a previous study of students’ likely responses to my questions, as
was the case for Aikenhead’s VOSTS questionnaire (1992). However, the design of
our instrument is based on insights from previous research—including
Aikenhead’s—on students’ and teachers’ views of the NoS, and on the likely
epistemological positions 16-year old students might hold (Kitchener and King,
1981).
In light of the perceived unreliability and lack of validity of previous instruments to
assess students’ views of the NoS, Aikenhead and co-workers (Aikenhead et al.,
1987) pioneered the approach of drawing statements—for use as test items—from
students’ actual ideas while adhering to students’ wording of their views. In this way,
they attempted to improve the validity of VOSTS by minimising the chance of
Chapter 5. Methods
132
students misinterpreting the questions and researchers misinterpreting the responses
given. In keeping with Aikenhead’s approach, the wording of questions and answer
options of the NoST was kept as simple as possible, avoiding unnecessary jargon and
simplifying the different philosophical positions on the NoS, but taking care not to
trivialise or misrepresent them.
5.1.1. OBJECTIVES OF THE PILOT STUDY
In the case of students, the pilot study was designed to find out several things,
namely, whether (a) students were able to identify “data” and “inferences”; (b) the
alternative views built into the NoST, for each aspect of the NoS, represented views
that students identified with; (c) students held views that were not anticipated in the
design of the NoST; and (d) responses were consistent when asked in different
contexts. Furthermore, any written comments left by students provided an indication
of whether or not they understood what was being asked, an indispensable
prerequisite before attributing any validity or reliability to results—and conclusions
drawn—from the NoST. Together, these insights contributed to establishing both the
validity and reliability of the test.
Regarding the experts, the pilot study was designed to find out if they believed the
NoST had any content validity at all, that is, whether (a) they agreed on the identities
of the data and the explanatory statements, (b) the questions, as written, address the
aspects of the NoS they purport to assess; (c) those aspects in the framework are
representative of the NoS and relevant for students; (d) “desired” answers
represented the best possible option given the circumstances of the specific context;
(e) remaining answer options represented alternative and plausible views to the
“desired”; and (f) the answer options were adequate simplifications of the
epistemological positions they embody.
Obtaining data from students and experts both resulted in a more robust assessment
of the test’s capabilities and limitations, and the feedback from students and experts
was used to improve the design of the NoST, so as to make its output more valid and
reliable, with the ultimate aim of exploring students’ views of the NoS.
Chapter 5. Methods
133
5.1.2. HOW TO ASSESS THE RELIABILITY OF THE NOST?
Traditionally, there have been four ways of measuring the reliability of a test, i.e.,
how consistent are the results it produces, namely, the (a) test-retest method, which
consists in administering the same test in two occasions—separated by a relatively
short period of time—to the same respondents, and where reliability depends on
respondents obtaining the same marks twice; (b) mark-remark method, which
consists in comparing the marks given to the same tests by two independent markers,
and where reliability depends on the marks given by each marker agreeing; (c)
parallel forms method, which consists in administering similar tests in two
occasions—again, separated by a relatively short period of time—to the same
respondents, and where reliability depends on respondents obtaining the same marks;
and (d) split-half method, which consists in administering a test once, dividing it in
half randomly and comparing the respondents’ performance in the two halves, and
where reliability depends on the performance in both halves being similar. A
variation of this last method consists in averaging all possible correlations across all
possible divisions of the test (Satterly, 1981, pp. 205-215; Stobart and Gipps, 1997,
p. 42; Gipps, 2004, p. 67).
Of these four methods of estimating reliability, the last is considered by experts to be
the least robust (Wood, 1991), since it is only a measure of internal consistency, that
is, “they [split-half methods] only identify consistent response behaviour: they say
nothing about stability over time or across forms of a test. A test that was
homogeneous would almost certainly have a higher coefficient of internal
consistency than a test that assessed many different abilities or attainments (i.e., was
heterogeneous)” (Gipps, 2004, p. 68).
From the outset, it appears clear enough that the mark-remark method is not suitable
for our purposes since, by virtue of the multiple-choice format, the NoST has been
designed to be objectively marked—there is no way to score it differently. Likewise,
the split-half method appears not be a suitable choice to estimate the reliability of the
NoST. Even though, as part of the rationale of the NoST, it was assumed, and argued
(see Figure 18 in Chapter 4), that a “desired” view of all six aspects probed by the
test represent a coherent picture of the NoS, it cannot likewise be argued that these
aspects actually comprise a single, homogeneous, one-dimensional construct called
Chapter 5. Methods
134
the “NoS”. A split-half method would almost certainly reflect this and produce a low
estimate of the reliability for the NoST. As Gipps (2004) has put it, “[o]ne problem
with the logic of internal consistency measures is that if the assessment contains a
mix of modes and contexts [or a mix of aspects or ideas, as is the case of the NoST],
so that all pupils have an optimum chance of doing well, then expecting internal
consistency is unjustified” (p. 68).
The test-retest and parallel forms methods of estimating reliability thus constitute the
best ways of estimating accurately the reliability of the NoST. Both methods rest on
the assumption that
[a]lthough a child’s obtained score will vary from test to test and from time to time, his or her true score on the attribute in question would remain the same provided the occasions are close together. Cattell (1973) has described this reliability as the dependability of the test. It is applicable if the testings are close enough together (say, about one month) for a little or no change to be expected by learning or maturation (Satterly, 1981, pp. 205-206).
One of the advantages of the parallel forms method over the test-retest one—and to
which it owes its robustness—is the fact that it takes into account all the main
sources of variation in students responses across test forms and over time, namely,
variations due to (a) the measurement procedure; (b) changes in the specific set of
tasks; (c) changes in the individual from day to day; and (d) changes in the
individual’s speed of work (Gipps, 2004, p. 68). For this reason, together with the
limited number of students available due to access restrictions, the parallel forms
method was chosen for the pilot study.
5.1.3. STUDENTS’ RESPONSES TO THE NOST
A small sample of secondary schools in England (chosen on the basis of whether a
teacher there was believed to have an interest in the NoS, how science works, or
ideas-about-science) were contacted and asked to participate in the pilot study. Ten
schools were willing to participate. As discussed in Chapter 4, six forms of the NoST
were prepared, each with a different episode from the history of science as a context.
For the purpose of determining the consistency of students’ responses across contexts
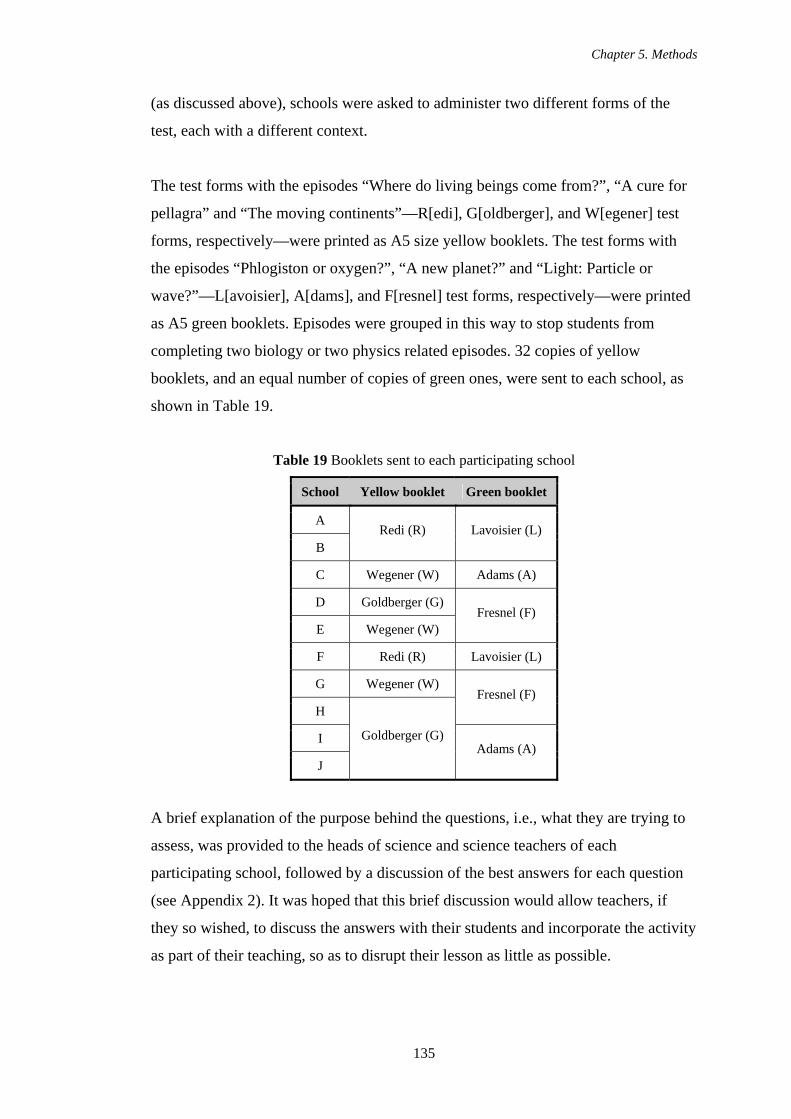
Chapter 5. Methods
135
(as discussed above), schools were asked to administer two different forms of the
test, each with a different context.
The test forms with the episodes “Where do living beings come from?”, “A cure for
pellagra” and “The moving continents”—R[edi], G[oldberger], and W[egener] test
forms, respectively—were printed as A5 size yellow booklets. The test forms with
the episodes “Phlogiston or oxygen?”, “A new planet?” and “Light: Particle or
wave?”—L[avoisier], A[dams], and F[resnel] test forms, respectively—were printed
as A5 green booklets. Episodes were grouped in this way to stop students from
completing two biology or two physics related episodes. 32 copies of yellow
booklets, and an equal number of copies of green ones, were sent to each school, as
shown in Table 19.
Table 19 Booklets sent to each participating school
School Yellow booklet Green booklet
A
B Redi (R) Lavoisier (L)
C Wegener (W) Adams (A)
D Goldberger (G)
E Wegener (W) Fresnel (F)
F Redi (R) Lavoisier (L)
G Wegener (W)
H Fresnel (F)
I
J
Goldberger (G) Adams (A)
A brief explanation of the purpose behind the questions, i.e., what they are trying to
assess, was provided to the heads of science and science teachers of each
participating school, followed by a discussion of the best answers for each question
(see Appendix 2). It was hoped that this brief discussion would allow teachers, if
they so wished, to discuss the answers with their students and incorporate the activity
as part of their teaching, so as to disrupt their lesson as little as possible.
Chapter 5. Methods
136
Participating schools were also sent the NoS framework that underpins PART II of the
NoST (see Chapter 4, Sections 4.3 and 4.4). This framework shows which answer
options are seen as corresponding to “desired”, “popular”, and “relativist” positions.
Briefly, the “popular” view runs along the lines of empiricist and positivist discourse
on the NoS; the “relativist” corresponds roughly with an extreme post-positivist,
Kuhnian discourse; and the “desired” presents a more nuanced conception of the
NoS that incorporates many of the views of a post-positivist and Kuhnian philosophy
of science, while at the same time recognising science’s commitment to the testing of
theoretical hypotheses against data from the real world.
Furthermore, a brief explanation of the rationale behind the answer options for each
question accompanied the letter sent to participating schools. In this, it was made
clear that
it would be difficult to argue that there is just one right answer—though there is (for most of them) one option that would be more widely accepted than the others. We are interested in how students think about these issues—not in marking their views ‘right’ or ‘wrong’. If you go over the questions with them afterwards, it is probably worth making the point that people do hold different views on many of them—and it is more important to be able to discuss them, to recognise their strengths and weaknesses, and to give examples to support your viewpoint.
Again, the purpose of this explanation was to help teachers to integrate the activity to
their teaching programme.
Teachers were asked to administer one of the forms of the test—either a yellow or a
green booklet—and wait for students to finish completing it before giving them the
second one. Teachers were asked to collect the first booklet before handing out the
second in order to stop students from copying directly from their prior responses.
This would help determine how consistent students’ responses were across test
forms. Finally, students were to be made aware that the interest of the research
centred only on their views about some aspects of how science and scientists work,
and their responses would not be considered part of their grades. Their identities and
responses would be kept in a confidential and anonymous manner, not to be
disclosed to anyone outside the team involved in the research project.
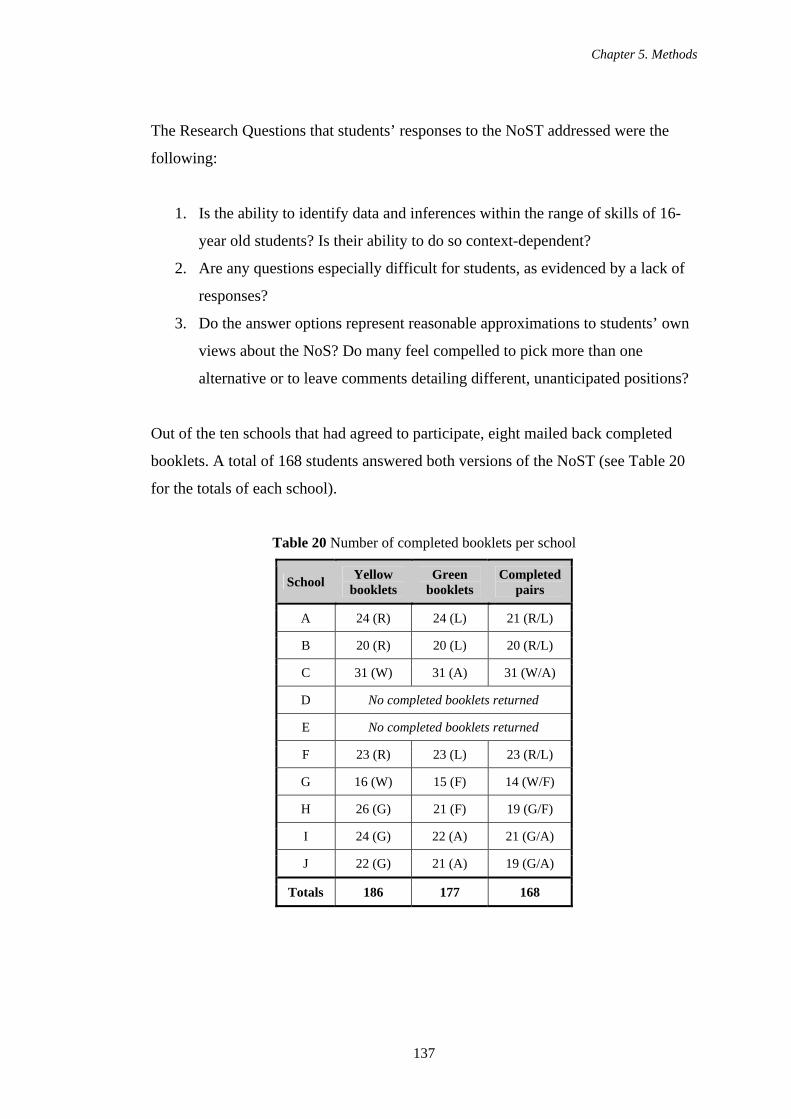
Chapter 5. Methods
137
The Research Questions that students’ responses to the NoST addressed were the
following:
1. Is the ability to identify data and inferences within the range of skills of 16-
year old students? Is their ability to do so context-dependent?
2. Are any questions especially difficult for students, as evidenced by a lack of
responses?
3. Do the answer options represent reasonable approximations to students’ own
views about the NoS? Do many feel compelled to pick more than one
alternative or to leave comments detailing different, unanticipated positions?
Out of the ten schools that had agreed to participate, eight mailed back completed
booklets. A total of 168 students answered both versions of the NoST (see Table 20
for the totals of each school).
Table 20 Number of completed booklets per school
School Yellow booklets
Green booklets
Completed pairs
A 24 (R) 24 (L) 21 (R/L)
B 20 (R) 20 (L) 20 (R/L)
C 31 (W) 31 (A) 31 (W/A)
D No completed booklets returned
E No completed booklets returned
F 23 (R) 23 (L) 23 (R/L)
G 16 (W) 15 (F) 14 (W/F)
H 26 (G) 21 (F) 19 (G/F)
I 24 (G) 22 (A) 21 (G/A)
J 22 (G) 21 (A) 19 (G/A)
Totals 186 177 168
Chapter 5. Methods
138
5.1.4. EXPERTS’ RESPONSES TO THE NOST
While the student phase of the pilot study was underway, a number of international
experts on the teaching and assessment of views of the NoS were contacted, via e-
mail, and asked if they would be willing to participate on the validation of the NoST.
These experts come from a variety of countries, both English-speaking and non
English-speaking, and all have published widely about the topic in peer-reviewed
journals. Since the target audience of the NoST is secondary school students’ views
of the NoS, it was decided not to approach practicing philosophers, sociologists, or
historians of science, but rather researchers with experience in educational settings.
The purpose of the NoST, its format and content, and the aims of the pilot study were
explained to the experts contacted. In order to collect and systematise their opinions,
an electronic pro-forma was developed and sent by e-mail to those experts who
agreed to participate, together with digital copies of two test forms of the NoST—
that is, two different tests with the same questions but with two different episodes—
and a copy of the framework upon which the NoST was based for ease of reference.
The questions included in the pro-forma are presented in Table 21. Experts were
instructed to choose, as they saw fit, one of the test forms and complete the pro-
forma on the basis of the test form chosen. Afterwards, they were asked if their
comments, critiques, and/or judgements would apply equally to the second test form.
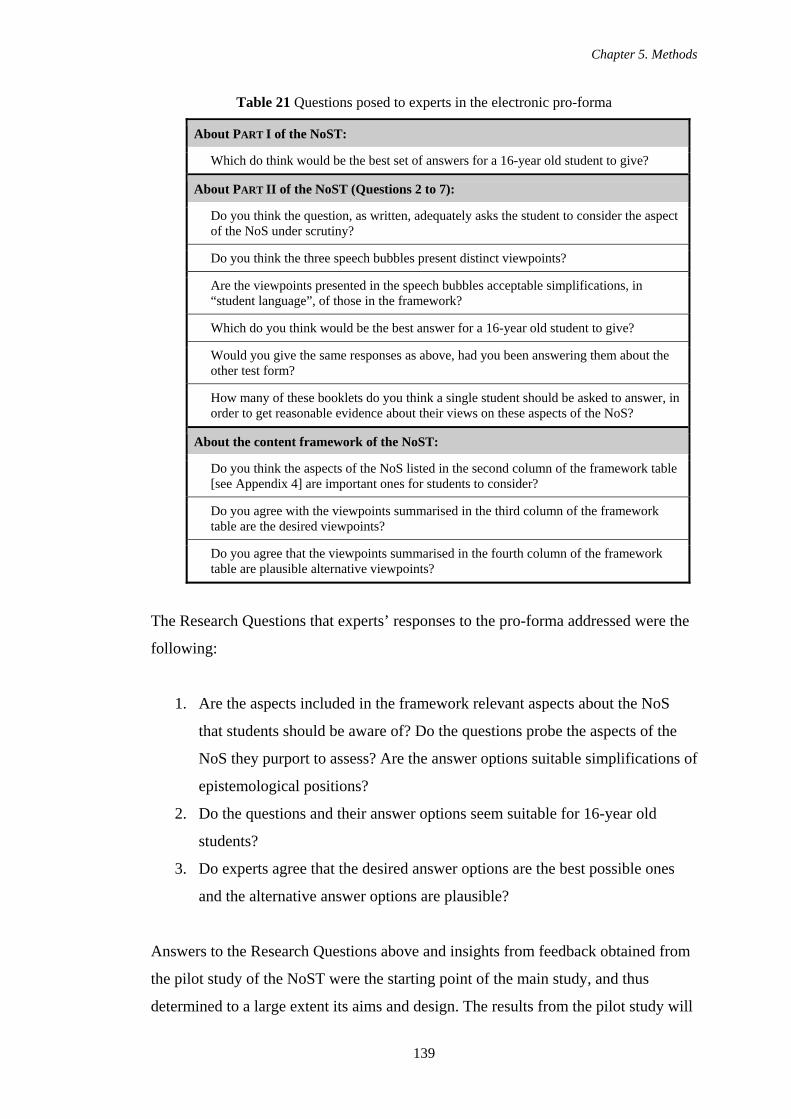
Chapter 5. Methods
139
Table 21 Questions posed to experts in the electronic pro-forma
About PART I of the NoST:
Which do think would be the best set of answers for a 16-year old student to give?
About PART II of the NoST (Questions 2 to 7):
Do you think the question, as written, adequately asks the student to consider the aspect of the NoS under scrutiny?
Do you think the three speech bubbles present distinct viewpoints?
Are the viewpoints presented in the speech bubbles acceptable simplifications, in “student language”, of those in the framework?
Which do you think would be the best answer for a 16-year old student to give?
Would you give the same responses as above, had you been answering them about the other test form?
How many of these booklets do you think a single student should be asked to answer, in order to get reasonable evidence about their views on these aspects of the NoS?
About the content framework of the NoST:
Do you think the aspects of the NoS listed in the second column of the framework table [see Appendix 4] are important ones for students to consider?
Do you agree with the viewpoints summarised in the third column of the framework table are the desired viewpoints?
Do you agree that the viewpoints summarised in the fourth column of the framework table are plausible alternative viewpoints?
The Research Questions that experts’ responses to the pro-forma addressed were the
following:
1. Are the aspects included in the framework relevant aspects about the NoS
that students should be aware of? Do the questions probe the aspects of the
NoS they purport to assess? Are the answer options suitable simplifications of
epistemological positions?
2. Do the questions and their answer options seem suitable for 16-year old
students?
3. Do experts agree that the desired answer options are the best possible ones
and the alternative answer options are plausible?
Answers to the Research Questions above and insights from feedback obtained from
the pilot study of the NoST were the starting point of the main study, and thus
determined to a large extent its aims and design. The results from the pilot study will
Chapter 5. Methods
140
be presented and discussed in the next chapter, together with their implications for
the main study. For the moment, however, to help clarify the exposition in the
following section of the methods to be used in the main study, it is worth offering a
preview of some general questions that arose out of, or were suggested by, the pilot
study and that are worth pursuing in the main study:
1. How able are students to distinguish data from explanations?
2. What are students’ views of the NoS?
3. Is there any relationship between students’ ability to distinguish data from
explanations and their views of the NoS?
4. How valid and reliable are students’ responses?
Figure 23 schematises the phases of the pilot study, together with the Research
Questions addressed, and shows its relationship to the main study.
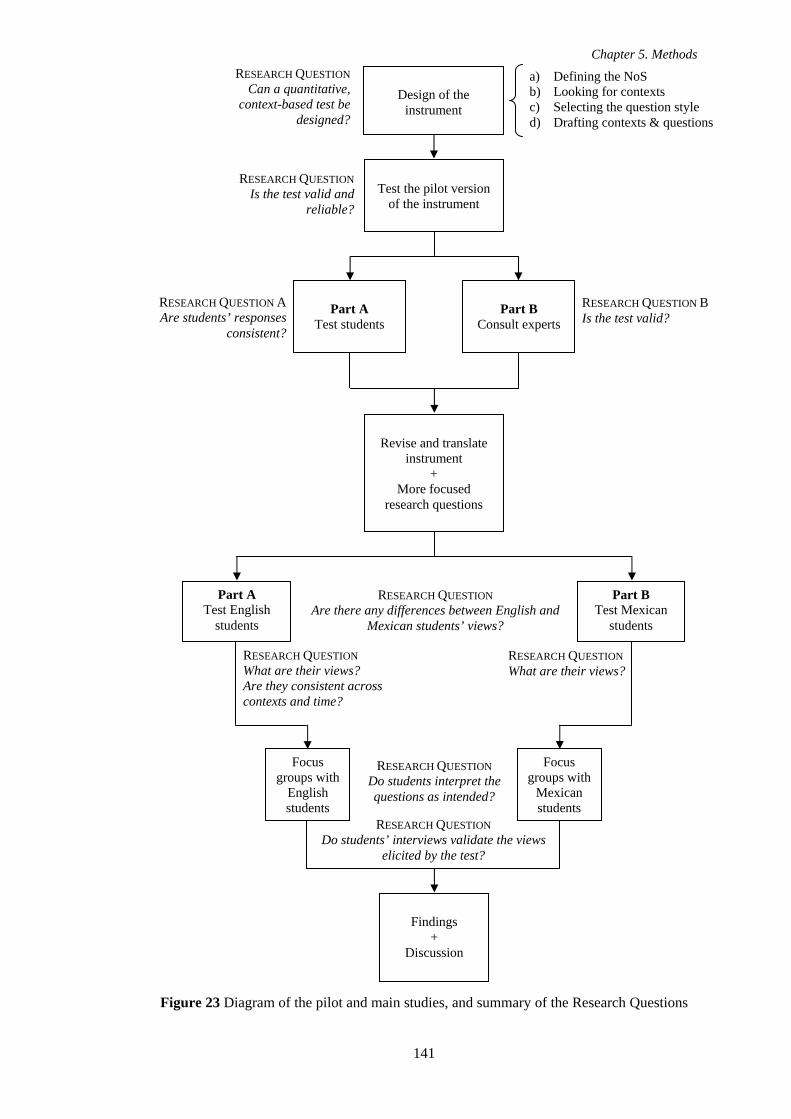
Chapter 5. Methods
141
Figure 23 Diagram of the pilot and main studies, and summary of the Research Questions
Design of the
instrument
Test the pilot version
of the instrument
Part A
Test students
Revise and translate
instrument +
More focused research questions
Part A Test English
students
Part B Test Mexican
students
Focus groups with
English students
Findings
+ Discussion
a) Defining the NoS b) Looking for contexts c) Selecting the question style d) Drafting contexts & questions
RESEARCH QUESTION
Can a quantitative, context-based test be
designed?
RESEARCH QUESTION A Are students’ responses
consistent?
Part B
Consult experts
RESEARCH QUESTION B Is the test valid?
Focus groups with
Mexican students
RESEARCH QUESTION What are their views? Are they consistent across contexts and time?
RESEARCH QUESTION What are their views?
RESEARCH QUESTION
Is the test valid and reliable?
RESEARCH QUESTION
Do students interpret the questions as intended?
RESEARCH QUESTION
Are there any differences between English and Mexican students’ views?
RESEARCH QUESTION
Do students’ interviews validate the views elicited by the test?
Chapter 5. Methods
142
5.2. THE MAIN STUDY As mentioned previously, the purpose of the main study was to pursue key questions
arising from the pilot study of the NoST, as will be discussed in Chapter 6. The main
study has thus been designed to address issues that can be grouped into three main
categories: (a) What are students’ views of the NoS and to what extent can they
distinguish data from explanations? (b) Are students’ answers to a single
administration of the NoST a valid and reliable measure of their views of the NoS?
(c) Are there any differences between the views of English and Mexican students?
In contrast with the pilot study, the main study was broadened to include the
assessment of Mexican students. This was done for two reasons, namely, to
compensate for the limited access to students in England and because it was
considered that conducting focus groups with Spanish speakers (the native language
of this researcher) would facilitate probing in-depth students’ interpretations of the
questions and views about the NoS, as well as their reasons for holding them.
5.2.1. OVERVIEW OF THE MAIN STUDY AND RESEARCH QUESTIONS
For convenience of presentation, the main study has been divided into three main
parts. The first deals with whether there is any effect of time and contexts on
students’ responses, as determined respectively by a test-retest trial and a parallel
forms trial—both crucial steps towards evaluating the reliability of the NoST.
The second part of the main study, on the other hand, addresses students’
understanding of the story and its accompanying statements, as well as of the
questions, answer options, and the meanings of certain key terms. This part thus
complements the evaluation of the validity of the NoST through experts’ judgment
(made in the pilot study) and the evaluation of its reliability through the test-retest
and parallel forms trials.
Finally, the last part is dedicated to exploring and comparing the views of the NoS of
English and Mexican students. The results from this part of the study will also
contribute to evaluating the validity and reliability of the NoST.
Chapter 5. Methods
143
Specifically, the research questions the main study intends to address are:
1. How able are students to distinguish data from explanations?
a) Does their skill at identifying data and explanations depend on the
context?
2. What are students’ views of the NoS?
a) Are students’ responses consistent with any of the three coherent profiles
built into the NoST?
b) Are students’ responses consistent, over time and across contexts?
c) Are there any differences between the views of the NoS held by English
and Mexican students?
3. Is there any relationship between students’ ability to distinguish data from
explanations and their views of the NoS?
4. How valid and reliable are students’ responses?
a) Do students interpret the test questions in the intended way?
b) Do students justify their views adequately?
c) Do responses to the test represent adequately students’ views of the NoS?
In Research Question 2, above, reference is made to three different kinds of
consistency of students’ responses to the NoST: (i) consistency with any of the
three in-built profiles, (ii) consistency over time, and (iii) consistency across
contexts. Students exhibit the first kind when all, or all but one, of their responses
belong to the same type of answer option along the NoST—either popular, relativist,
or desired. Students exhibit the second kind when they select the same response to
the same question in both administrations of the same test form, that is, with the
same context, of the NoST. Finally, students exhibit the third kind when they select
the same response to the same question in both administrations of two different test
forms with different contexts.
From students’ observable consistency of responses, or lack thereof, inferences about
their views of the NoS can be made (Figure 24). For practical purposes, in what
follows the term “views” will refer to students’ understanding of the NoS; as such,
students’ views are meant to be thought of as inferences about students’
understanding drawn from their responses to the NoST. For the purposes of this
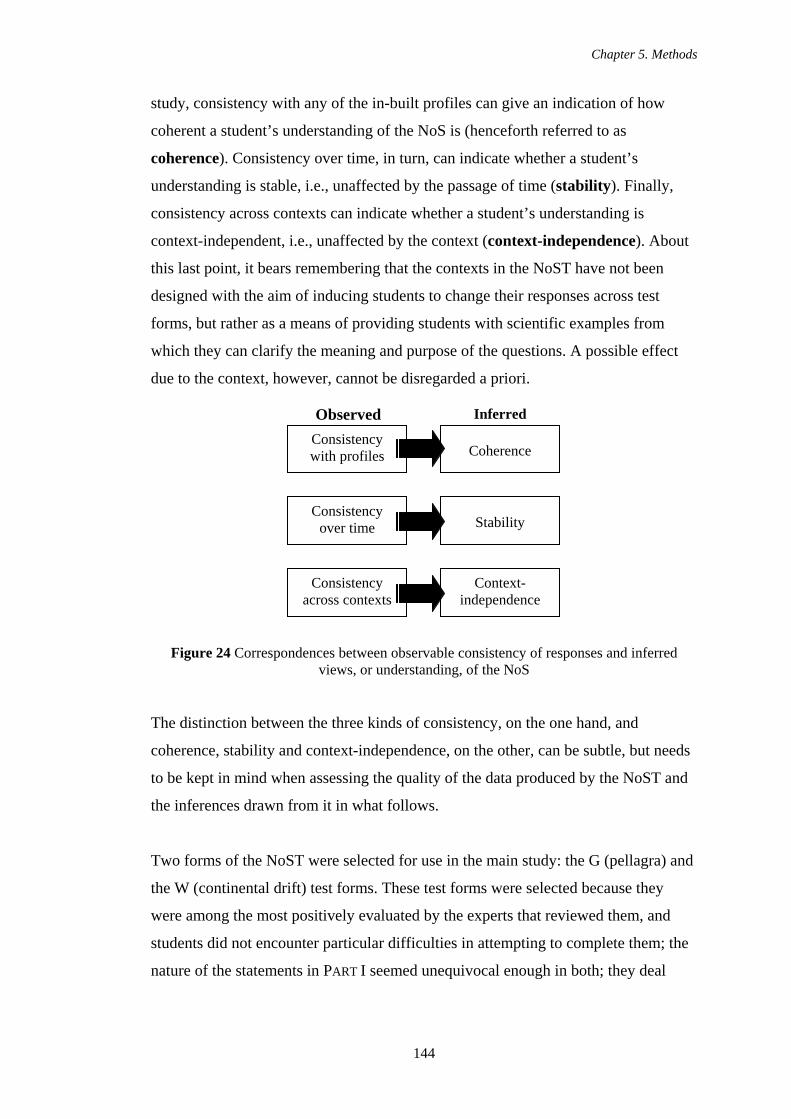
Chapter 5. Methods
144
study, consistency with any of the in-built profiles can give an indication of how
coherent a student’s understanding of the NoS is (henceforth referred to as
coherence). Consistency over time, in turn, can indicate whether a student’s
understanding is stable, i.e., unaffected by the passage of time (stability). Finally,
consistency across contexts can indicate whether a student’s understanding is
context-independent, i.e., unaffected by the context (context-independence). About
this last point, it bears remembering that the contexts in the NoST have not been
designed with the aim of inducing students to change their responses across test
forms, but rather as a means of providing students with scientific examples from
which they can clarify the meaning and purpose of the questions. A possible effect
due to the context, however, cannot be disregarded a priori.
Figure 24 Correspondences between observable consistency of responses and inferred views, or understanding, of the NoS
The distinction between the three kinds of consistency, on the one hand, and
coherence, stability and context-independence, on the other, can be subtle, but needs
to be kept in mind when assessing the quality of the data produced by the NoST and
the inferences drawn from it in what follows.
Two forms of the NoST were selected for use in the main study: the G (pellagra) and
the W (continental drift) test forms. These test forms were selected because they
were among the most positively evaluated by the experts that reviewed them, and
students did not encounter particular difficulties in attempting to complete them; the
nature of the statements in PART I seemed unequivocal enough in both; they deal
Coherence
Stability
Context-independence
Consistency with profiles
Consistency over time
Consistency across contexts
Observed Inferred
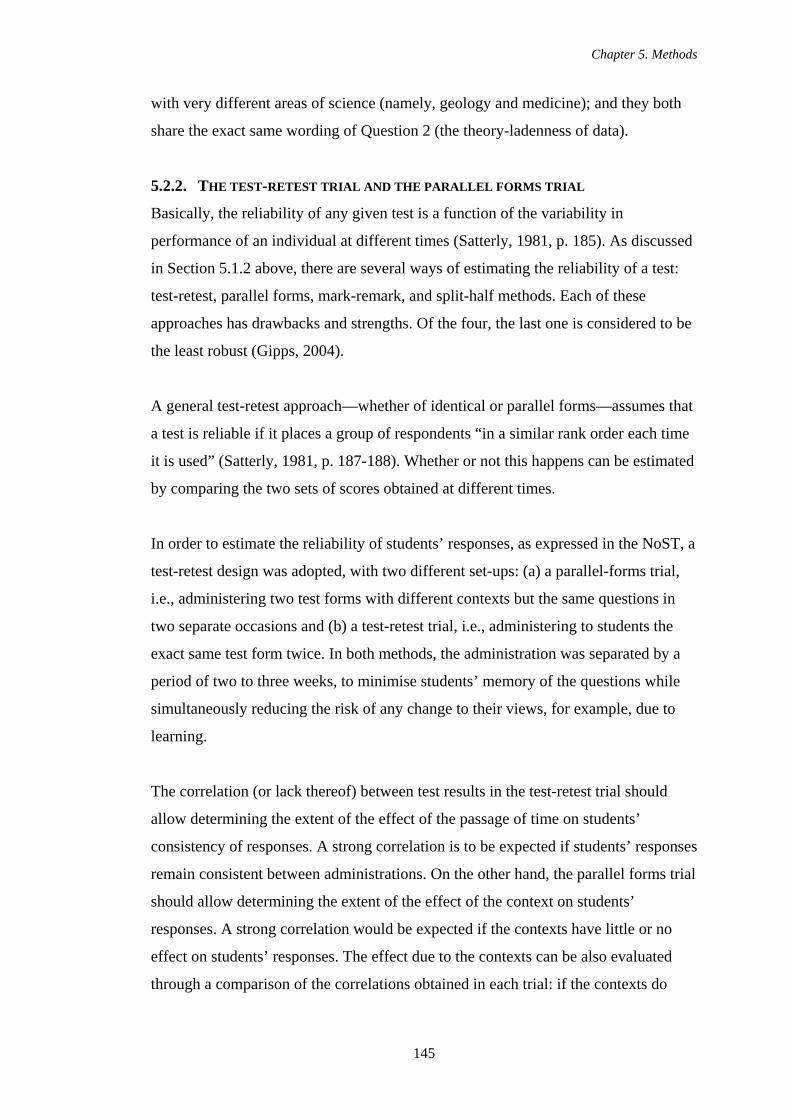
Chapter 5. Methods
145
with very different areas of science (namely, geology and medicine); and they both
share the exact same wording of Question 2 (the theory-ladenness of data).
5.2.2. THE TEST-RETEST TRIAL AND THE PARALLEL FORMS TRIAL
Basically, the reliability of any given test is a function of the variability in
performance of an individual at different times (Satterly, 1981, p. 185). As discussed
in Section 5.1.2 above, there are several ways of estimating the reliability of a test:
test-retest, parallel forms, mark-remark, and split-half methods. Each of these
approaches has drawbacks and strengths. Of the four, the last one is considered to be
the least robust (Gipps, 2004).
A general test-retest approach—whether of identical or parallel forms—assumes that
a test is reliable if it places a group of respondents “in a similar rank order each time
it is used” (Satterly, 1981, p. 187-188). Whether or not this happens can be estimated
by comparing the two sets of scores obtained at different times.
In order to estimate the reliability of students’ responses, as expressed in the NoST, a
test-retest design was adopted, with two different set-ups: (a) a parallel-forms trial,
i.e., administering two test forms with different contexts but the same questions in
two separate occasions and (b) a test-retest trial, i.e., administering to students the
exact same test form twice. In both methods, the administration was separated by a
period of two to three weeks, to minimise students’ memory of the questions while
simultaneously reducing the risk of any change to their views, for example, due to
learning.
The correlation (or lack thereof) between test results in the test-retest trial should
allow determining the extent of the effect of the passage of time on students’
consistency of responses. A strong correlation is to be expected if students’ responses
remain consistent between administrations. On the other hand, the parallel forms trial
should allow determining the extent of the effect of the context on students’
responses. A strong correlation would be expected if the contexts have little or no
effect on students’ responses. The effect due to the contexts can be also evaluated
through a comparison of the correlations obtained in each trial: if the contexts do
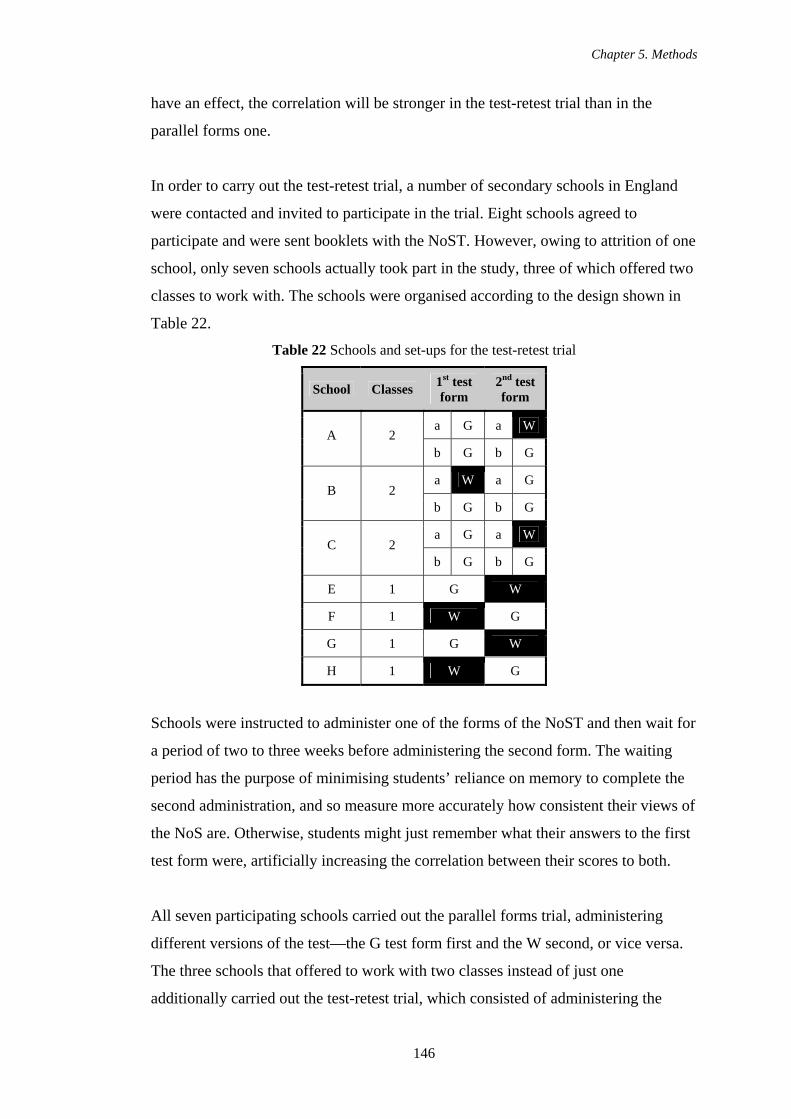
Chapter 5. Methods
146
have an effect, the correlation will be stronger in the test-retest trial than in the
parallel forms one.
In order to carry out the test-retest trial, a number of secondary schools in England
were contacted and invited to participate in the trial. Eight schools agreed to
participate and were sent booklets with the NoST. However, owing to attrition of one
school, only seven schools actually took part in the study, three of which offered two
classes to work with. The schools were organised according to the design shown in
Table 22.
Table 22 Schools and set-ups for the test-retest trial
School Classes 1st test form
2nd test form
a G a W A 2
b G b G
a W a G B 2
b G b G
a G a W C 2
b G b G
E 1 G W
F 1 W G
G 1 G W
H 1 W G
Schools were instructed to administer one of the forms of the NoST and then wait for
a period of two to three weeks before administering the second form. The waiting
period has the purpose of minimising students’ reliance on memory to complete the
second administration, and so measure more accurately how consistent their views of
the NoS are. Otherwise, students might just remember what their answers to the first
test form were, artificially increasing the correlation between their scores to both.
All seven participating schools carried out the parallel forms trial, administering
different versions of the test—the G test form first and the W second, or vice versa.
The three schools that offered to work with two classes instead of just one
additionally carried out the test-retest trial, which consisted of administering the
Chapter 5. Methods
147
same test twice. The disparity in the size of the samples of each trial owes to the fact
that the parallel forms one is a more stringent test of students’ reliability than the
latter: if students’ responses show any measure of consistency across different
contexts, it is then quite likely that their responses across the same context will also
be consistent. As such, the parallel forms trial provides better data to assess the
reliability of the questionnaire. As in the pilot study, consistency between tests will
be determined by calculating Cohen’s Kappa coefficient of inter-rater reliability.
5.2.3. FOCUS GROUPS
Even though the instrument was reviewed by a series of experts on the educational
research of the NoS, the question remains whether students and researchers share the
same understanding and interpretation of the questions and concepts included in the
test. The only way to effectively address this question is to interview students and
elicit their understanding of the various aspects under scrutiny, so as to compare it
with that of researchers.
Focus groups—a form of group interview that emphasises interaction among its
participants—have been used in the past in the development and design of research
instruments (Knodel et al., 1984; Vaughn et al., 1996), in particular for the creation
and refinement of survey items:
If the goal is to develop forced-choice responses, focus groups can assist in developing and refining the alternative responses. In addition, after an instrument prototype has been drafted, focus groups can be used as part of the field testing of the measure. A group of students can complete the instrument and then evaluate the administration procedures, form, and content (Vaughn et al., 1996, pp. 27-28).
Focus groups can help in this matter by “providing item wordings that effectively
convey the researcher’s intent to the survey respondent” (Morgan, 1996, p. 25) and,
consequently, improve both the instrument’s validity and its reliability. On the one
hand, improving an instrument’s validity is achieved by “making sure that the
questions mean the same thing to the respondents as they do to the researcher”,
whereas “finding item wordings that are appropriate for the widest possible range of
Chapter 5. Methods
148
respondents not only improves validity but also reduces unreliability by minimizing
differences in how respondents interpret the questions” (p. 26).
Used in this way, focus groups can minimise the questionable validity and reliability
associated with items generated in an “armchair” fashion—one of the driving
concerns behind Aikenhead and Ryan’s (1992) VOSTS instrument. The particular
ability of focus groups to produce a wealth of data by fostering interaction among its
participants, of initiating a chain-reaction of responses from an initial comment, and
of inviting spontaneous and genuine responses (not to mention the comfort and
stimulation the technique grants to its participants) seem particularly useful attributes
when attempting to clarify 16-year old students’ interpretations and meanings and
assess the adequacy of the language used to draft the test’s questions. Indeed,
according to Morgan (1996), ethnographic fieldwork has shown that, when the
language of the instrument is an issue,
it would be useful to hold a group discussion of the proposed items in crucial sections of the questionnaire prior to pretesting in the field. […] such groups make it much easier to detect when participants fail to understand a question as the researcher intended it. Pretesting with focus groups would not only locate such problems but also allow an immediate exploration of how to correct them (p. 27).
Given the above, focus groups seem an ideal tool to achieve the goal of clarifying
students’ interpretation of the test questions and, if necessary, improve the language
used to match their interpretations with those shared by researchers.
Obtaining Criminal Records Bureau (CRB) clearance for overseas students wishing
to work with children in England and Wales constitutes an obstacle to conducting
focus groups with English students. Consequently, alternatives to this strategy were
sought and the head of science of a Mexican public secondary school was contacted
and invited to participate in the study. She agreed and preparations were made to
conduct focus groups with Mexican students such as, for example, preparing versions
of the G and W test forms in Spanish and deciding which issues to discuss with
students.
Chapter 5. Methods
149
The translation of the questionnaires from English to Spanish was made
independently by two researchers in the area of Science Education. The translations
were then compared to find any discrepancies. Inconsistencies were discussed until
agreement on the wording that better reflected the intentions and meanings of the
original English version was reached.
In total, 12 focus groups, with three students each, were conducted, taking
approximately 45 minutes to an hour to complete. Participants’ ages ranged from 16
to 18 years of age. For the most part, they were selected without following a
particular criterion; only when a student declined to participate were volunteers
asked for. During the focus group interviews, students were encouraged to explain
their views and discuss amongst themselves when discrepancies between views
arose. Apart from their comments, an interview guide was also prepared to probe
some particular aspects of students’ understanding of the questionnaire. Table 23
shows the series of questions participants were asked. Focus group interviews were
recorded and transcribed in full for further analysis.
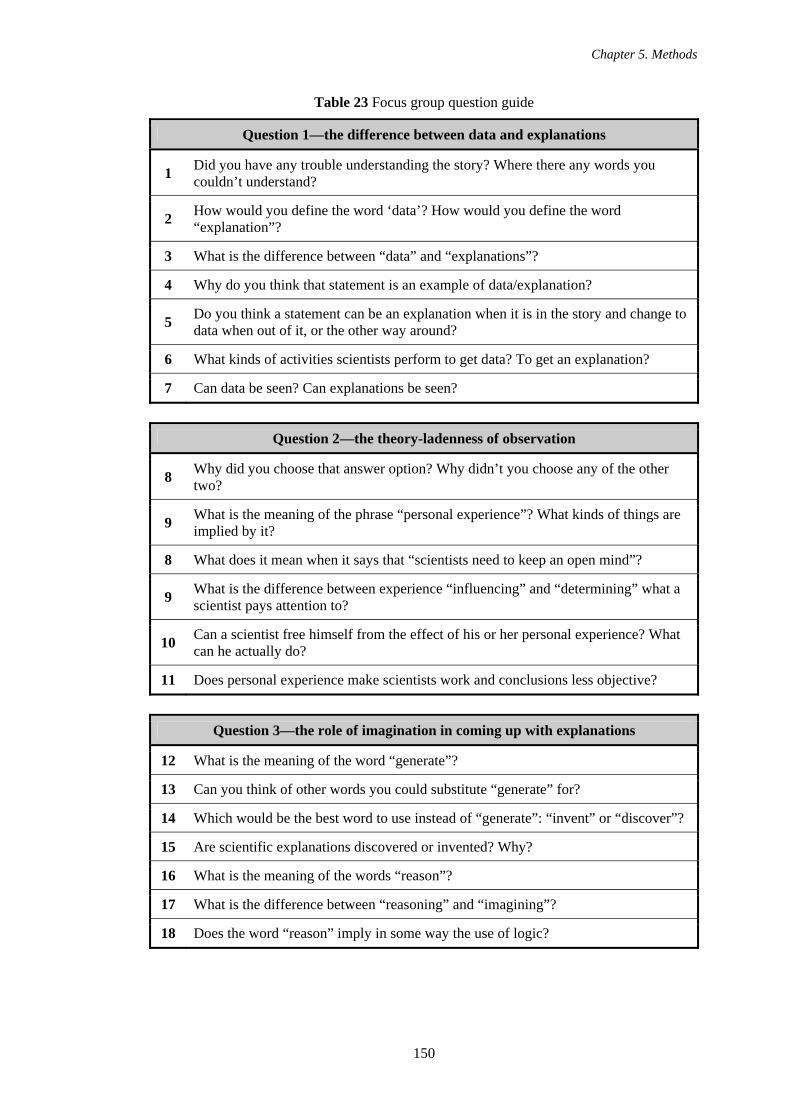
Chapter 5. Methods
150
Table 23 Focus group question guide
Question 1—the difference between data and explanations
1 Did you have any trouble understanding the story? Where there any words you couldn’t understand?
2 How would you define the word ‘data’? How would you define the word “explanation”?
3 What is the difference between “data” and “explanations”?
4 Why do you think that statement is an example of data/explanation?
5 Do you think a statement can be an explanation when it is in the story and change to data when out of it, or the other way around?
6 What kinds of activities scientists perform to get data? To get an explanation?
7 Can data be seen? Can explanations be seen?
Question 2—the theory-ladenness of observation
8 Why did you choose that answer option? Why didn’t you choose any of the other two?
9 What is the meaning of the phrase “personal experience”? What kinds of things are implied by it?
8 What does it mean when it says that “scientists need to keep an open mind”?
9 What is the difference between experience “influencing” and “determining” what a scientist pays attention to?
10 Can a scientist free himself from the effect of his or her personal experience? What can he actually do?
11 Does personal experience make scientists work and conclusions less objective?
Question 3—the role of imagination in coming up with explanations
12 What is the meaning of the word “generate”?
13 Can you think of other words you could substitute “generate” for?
14 Which would be the best word to use instead of “generate”: “invent” or “discover”?
15 Are scientific explanations discovered or invented? Why?
16 What is the meaning of the words “reason”?
17 What is the difference between “reasoning” and “imagining”?
18 Does the word “reason” imply in some way the use of logic?
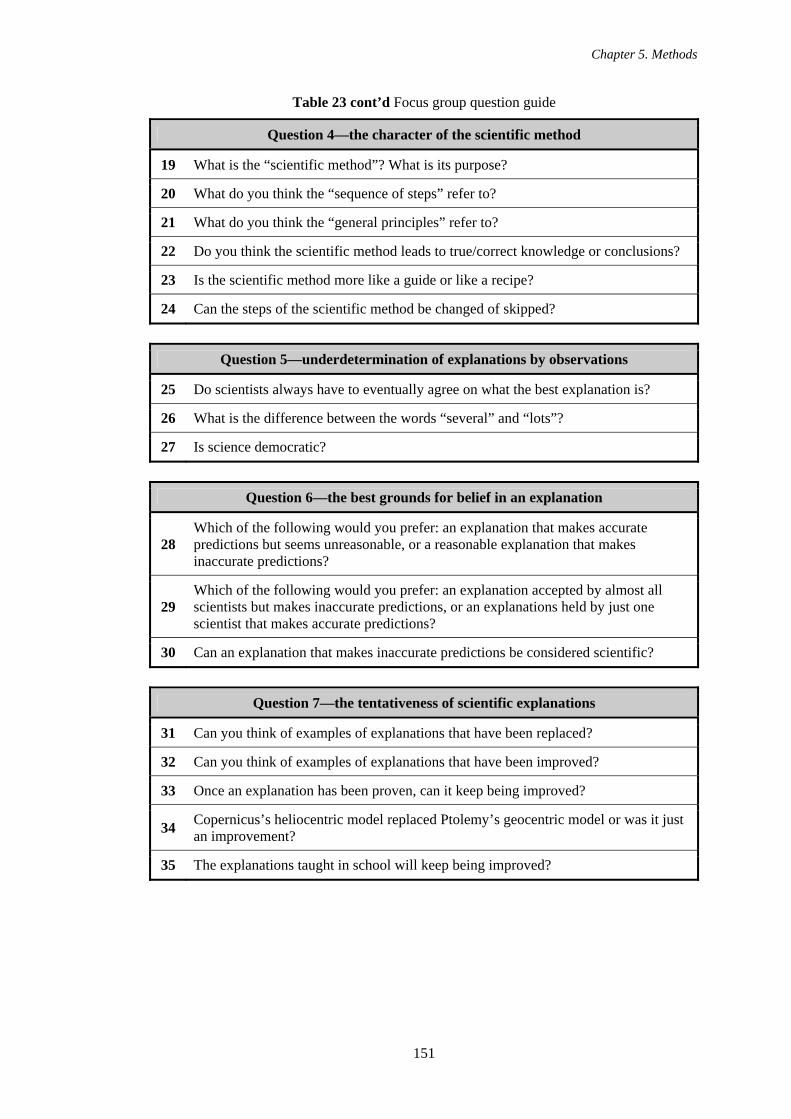
Chapter 5. Methods
151
Table 23 cont’d Focus group question guide
Question 4—the character of the scientific method
19 What is the “scientific method”? What is its purpose?
20 What do you think the “sequence of steps” refer to?
21 What do you think the “general principles” refer to?
22 Do you think the scientific method leads to true/correct knowledge or conclusions?
23 Is the scientific method more like a guide or like a recipe?
24 Can the steps of the scientific method be changed of skipped?
Question 5—underdetermination of explanations by observations
25 Do scientists always have to eventually agree on what the best explanation is?
26 What is the difference between the words “several” and “lots”?
27 Is science democratic?
Question 6—the best grounds for belief in an explanation
28 Which of the following would you prefer: an explanation that makes accurate predictions but seems unreasonable, or a reasonable explanation that makes inaccurate predictions?
29 Which of the following would you prefer: an explanation accepted by almost all scientists but makes inaccurate predictions, or an explanations held by just one scientist that makes accurate predictions?
30 Can an explanation that makes inaccurate predictions be considered scientific?
Question 7—the tentativeness of scientific explanations
31 Can you think of examples of explanations that have been replaced?
32 Can you think of examples of explanations that have been improved?
33 Once an explanation has been proven, can it keep being improved?
34 Copernicus’s heliocentric model replaced Ptolemy’s geocentric model or was it just an improvement?
35 The explanations taught in school will keep being improved?
Chapter 5. Methods
152
Even though conducting focus group interviews with English students was
problematic, the head of science of one secondary school agreed to participate in the
study and, under her supervision, carry interviews with groups of students about their
views and probe their understanding of the NoST questions—following the same
interview guide devised for the Mexican focus groups.
Focus group interviews were recorded and transcribed in full for further analysis.
The qualitative data obtained from both samples was compared to check for any
consistencies in students’ opinions and misunderstandings and to find particular
issues that may differ from country to country. Special attention will be put on
determining whether the translation into Spanish conveys the same meanings as the
English original or whether different and unforeseen meanings are transmitted to
students.
5.2.4. STUDENTS’ VIEWS OF THE NOS
Evaluating student’s views, or understanding, of the NoS with the NoST rests on the
assumption that it is reasonably valid and reliable. The results of the pilot study—
particularly pertaining to experts’ opinions on content validity—lend some support in
favour of the validity of the NoST. In this sense, the efforts to adapt the questions
and the answer options to a language-level that students can easily grasp were
likewise intended to increase both its reliability and validity. However, until actual
data from the test-retest and the parallel forms trials (see above) corroborates the
consistency of students’ responses, there are no grounds to take them at face value.
Evaluating students’ responses of the NoS will provide an idea, mainly, of several
things: (a) their skill at distinguishing observational from inferential statements; (b)
the degree of development in their views of how science works; (c) the degree of
correspondence between students’ skill in PART I and their views of the NoS; and (d)
the coherency of their views, as revealed by the their pattern of responses and its fit
with any of the in-built profiles.
5.2.5. ENGLISH AND MEXICAN STUDENTS’ VIEWS OF THE NOS
The first administration of the NoST is the best source of data about students’ views
of the NoS, since—owing to the design of the test-retest and parallel forms trials—it
Chapter 5. Methods
153
cannot be influenced by students’ memory of how they previously answered the
questions. Furthermore, it allows the comparison of the English sample with the
Mexican sample, as will be discussed below.
Students’ responses can be used to answer several important questions, for instance:
(a) Which questions received the most number of popular, relativist, and/or desired
responses? (b) How consistent are students’ responses with any of profiles of the
NoS? (c) How consistent are responses over time and across contexts? (d) Is there
any correlation between responses to PART I and to II?
In the case of the Mexican sample, the NoST was administered only once, before the
students were interviewed in the focus groups. In total, six classes completed both
test forms—G and W—of the NoST, with roughly one half of each class completing
one of the two. Five of the classes belonged to 5th grade (with an age range of 16-17
years) and one to 6th grade (with an age range of 17-18 years). None of the students
had ever received explicit instruction regarding the NoS. Their data will be used to
answer the same kinds of questions listed above and analysed accordingly.
Unfortunately, due to time constraints, it was impossible to administer the NoST
twice to Mexican students, with a two to three week gap between administrations.
Consequently, an analysis of the reliability—as determined through a test-retest and
parallel forms trial—could not be conducted.
Using the first administration of the test to English students as the source of data
allows the comparison of the two populations. Statistical analysis—e.g., unpaired t-
test—should help determine if there are any significant differences within samples
and between them.
Given the design of the NoST, students do not receive a unitary score for the whole
test (since that would defeat the purpose of the profiles). However, to determine the
correlation between PART I and PART II of the NoST, one point was given for each
question where the student chose a popular view, two points for each instance of a
relativist view, and three points for each of a desired view. No points were given
when the student failed to pick an answer option or picked more than one. The
Chapter 5. Methods
154
maximum possible score is then eighteen points (corresponding to a consistent
“desired” profile); the minimum, six points.
This scoring scheme follows the “Reflective Judgement” model proposed by
Kitchener and King (1981; Kitchener, 1983), itself based on data on students’
epistemic development (King et al., 1983). This model outlines a sequence of seven
stages of increasingly complex and nuanced reasoning styles, each characterised by a
“logically coherent network of assumptions and corresponding concepts that are used
to justify beliefs” (Kitchener and King, 1981, p. 91). According to this model, one’s
assumptions about reality and knowledge imply different ways of justifying one’s
beliefs—as these assumptions develop, so does the justification of beliefs. The first
stages of the model embody strictly empiricist assumptions, i.e., knowledge about an
objective reality comes directly from the individual’s perceptions of it and “a large
accumulation of evidence will lead to absolute truth” (p. 95). Likewise, since
knowledge is equally accessible to all, the conclusions of scientists that follow the
correct procedure must agree.
The epistemic development of individuals then gains in uncertainty about knowledge
and goes on to acquire a highly individualistic and, consequently, relativist
character—objective reality can never be known with certainty and, thus, absolute
knowledge is unattainable. Authorities, time, money, or amount of evidence cannot
be relied upon as criteria to ascertain the truth or the merits of knowledge;
“knowledge is idiosyncratic to the individual”, who ends up being the ultimate
“judge of his or her own truth” (p. 96). This relativist stance strengthens, and notions
such as reality existing “only subjectively” (p. 97) and knowledge being the product
of subjective interpretations of the evidence become common.
Eventually, the individual’s views acquire a more nuanced character—even though
absolute knowledge of reality is impossible (all knowledge is, to some degree,
uncertain and fallible due to the subjective nature of interpretation), some statements
can be deemed more rational or better supported by the available evidence.
Knowledge is constructed rather than discovered or derived directly from perception.
Finally, the individual comes to accept that through testing against “reality”, some
statements can be judged to be more adequate or correct, even though they are the

Chapter 5. Methods
155
product of potentially fallible perceptions and interpretations. The continuous
process of scientific inquiry insures that our beliefs approximate reality.
The stages of this model roughly correspond to developments in the philosophy of
science throughout the twentieth century, starting with the empiricist approach of the
logical positivists, followed, in the sixties, by Kuhnian philosophy of science, and
ending with a post-Kuhnian approach that re-evaluates the role of evidence in the
construction of reliable knowledge about reality.
Chapter 6. Results: The pilot study
156
6. CHAPTER 6
RESULTS: THE PILOT STUDY
As previously discussed, the pilot study sought to obtain feedback about the validity
and reliability of both parts of the NoST from secondary school students and
educational experts on the NoS. Accordingly, this chapter will first present the data
relating to PART I of the NoST (the assessment of students’ ability to identify “data”
and “inferences”) and, secondly, the data to PART II (the assessment of students’
views of aspects of the NoS). For each of these two main parts, the feedback from
students will be presented in the first place, followed by that from experts. The
discussion will centre on insights that contribute to the assessment of the validity and
reliability of the test itself, and not on the quality of students’ views per se.
6.1. STUDENTS’ OVERALL SCORES—PART I OF THE NOST To measure students’ performance in PART I of the NoST, for each of the five
statements that comprised Question 1 one point was given if the student correctly
identified a statement as either an “observation” or an “inference”. The maximum
possible score was thus five points. Figure 25 shows the overall scores for each of
the six test forms.
Broadly speaking, all six test forms appear to be equally difficult to complete, with
the average student identifying three out of five statements. However, there also
appears to be an effect on students’ performance that might be due to the context: in
the case of the A, G, and W test forms, students identified correctly, on average,
three or more statements; in contrast, in the F, L, and R test forms students identified,
on average, three or less statements. The large standard deviations in all test forms
suggest that there is considerable variation among students’ ability to discriminate
data from inferences. In each school, students’ responses exhibited the same
behaviour (data not shown).
These results are encouraging for the NoST as an assessment targeted to 16-year old
students. The large standard deviations suggest that Question 1 is able to discriminate
between students of a wide range of ability. Furthermore, Question 1 seems to have
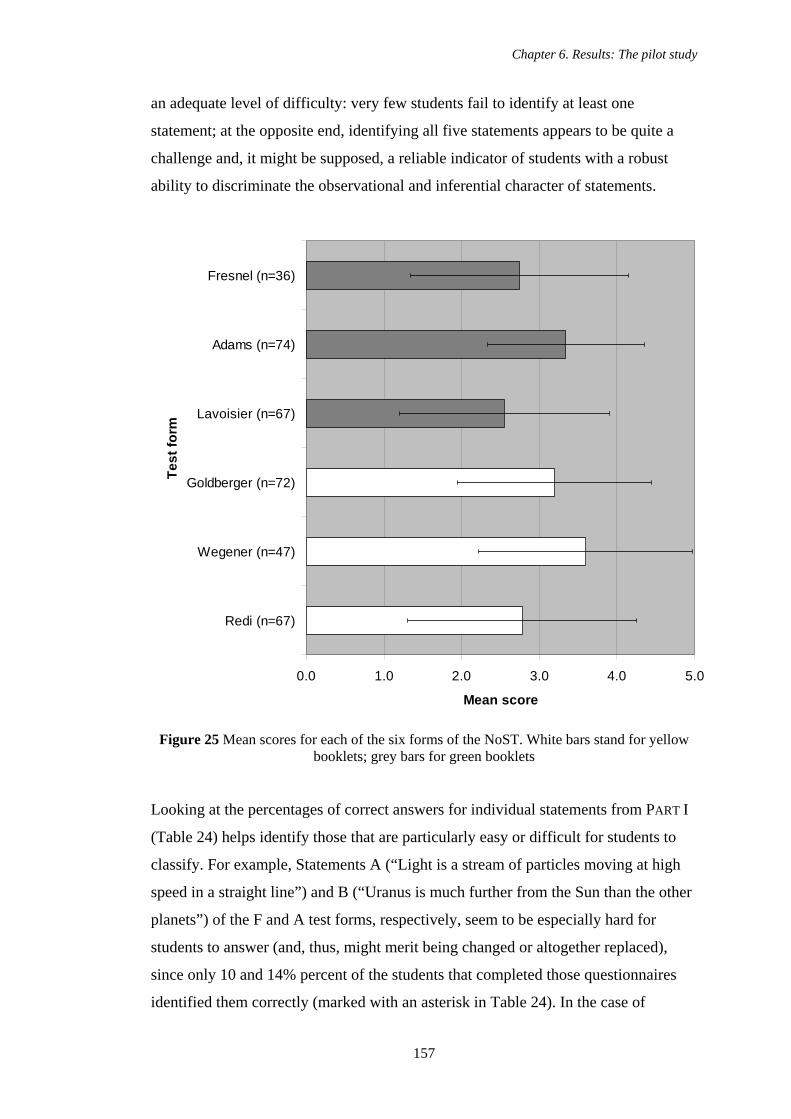
Chapter 6. Results: The pilot study
157
an adequate level of difficulty: very few students fail to identify at least one
statement; at the opposite end, identifying all five statements appears to be quite a
challenge and, it might be supposed, a reliable indicator of students with a robust
ability to discriminate the observational and inferential character of statements.
0.0 1.0 2.0 3.0 4.0 5.0
Redi (n=67)
Wegener (n=47)
Goldberger (n=72)
Lavoisier (n=67)
Adams (n=74)
Fresnel (n=36)
Test
form
Mean score
Figure 25 Mean scores for each of the six forms of the NoST. White bars stand for yellow booklets; grey bars for green booklets
Looking at the percentages of correct answers for individual statements from PART I
(Table 24) helps identify those that are particularly easy or difficult for students to
classify. For example, Statements A (“Light is a stream of particles moving at high
speed in a straight line”) and B (“Uranus is much further from the Sun than the other
planets”) of the F and A test forms, respectively, seem to be especially hard for
students to answer (and, thus, might merit being changed or altogether replaced),
since only 10 and 14% percent of the students that completed those questionnaires
identified them correctly (marked with an asterisk in Table 24). In the case of
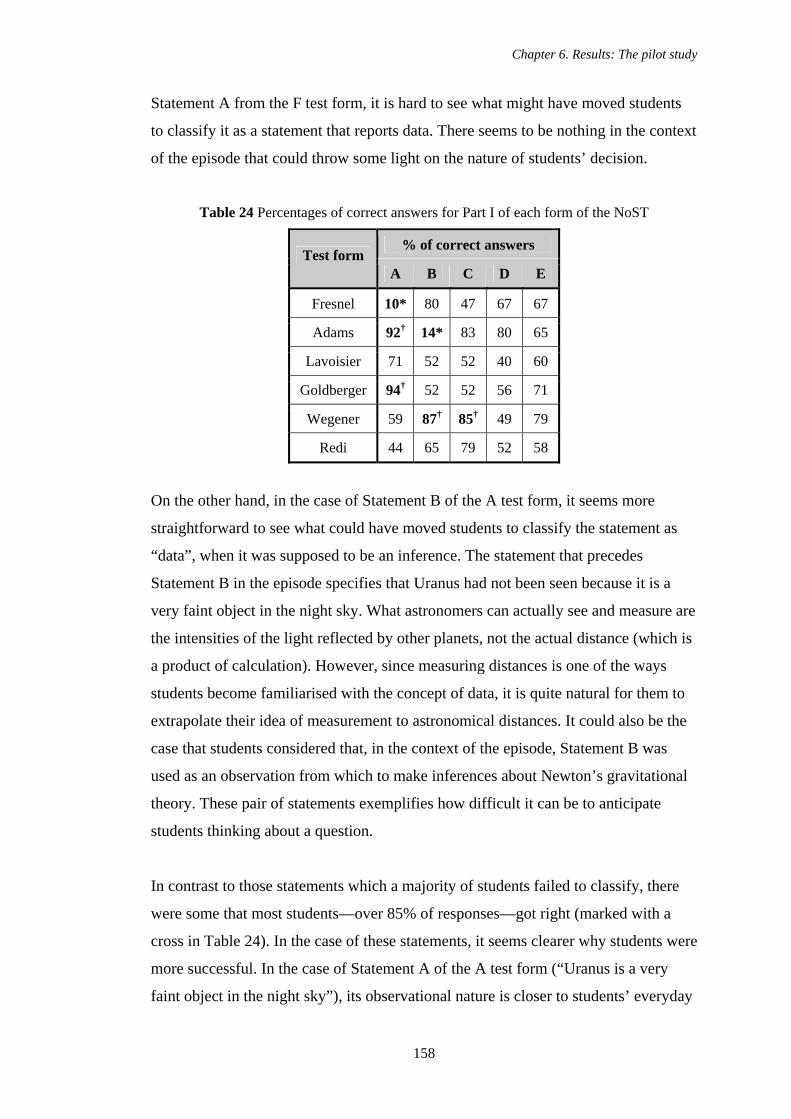
Chapter 6. Results: The pilot study
158
Statement A from the F test form, it is hard to see what might have moved students
to classify it as a statement that reports data. There seems to be nothing in the context
of the episode that could throw some light on the nature of students’ decision.
Table 24 Percentages of correct answers for Part I of each form of the NoST
% of correct answers Test form
A B C D E
Fresnel 10* 80 47 67 67
Adams 92† 14* 83 80 65
Lavoisier 71 52 52 40 60
Goldberger 94† 52 52 56 71
Wegener 59 87† 85† 49 79
Redi 44 65 79 52 58
On the other hand, in the case of Statement B of the A test form, it seems more
straightforward to see what could have moved students to classify the statement as
“data”, when it was supposed to be an inference. The statement that precedes
Statement B in the episode specifies that Uranus had not been seen because it is a
very faint object in the night sky. What astronomers can actually see and measure are
the intensities of the light reflected by other planets, not the actual distance (which is
a product of calculation). However, since measuring distances is one of the ways
students become familiarised with the concept of data, it is quite natural for them to
extrapolate their idea of measurement to astronomical distances. It could also be the
case that students considered that, in the context of the episode, Statement B was
used as an observation from which to make inferences about Newton’s gravitational
theory. These pair of statements exemplifies how difficult it can be to anticipate
students thinking about a question.
In contrast to those statements which a majority of students failed to classify, there
were some that most students—over 85% of responses—got right (marked with a
cross in Table 24). In the case of these statements, it seems clearer why students were
more successful. In the case of Statement A of the A test form (“Uranus is a very
faint object in the night sky”), its observational nature is closer to students’ everyday
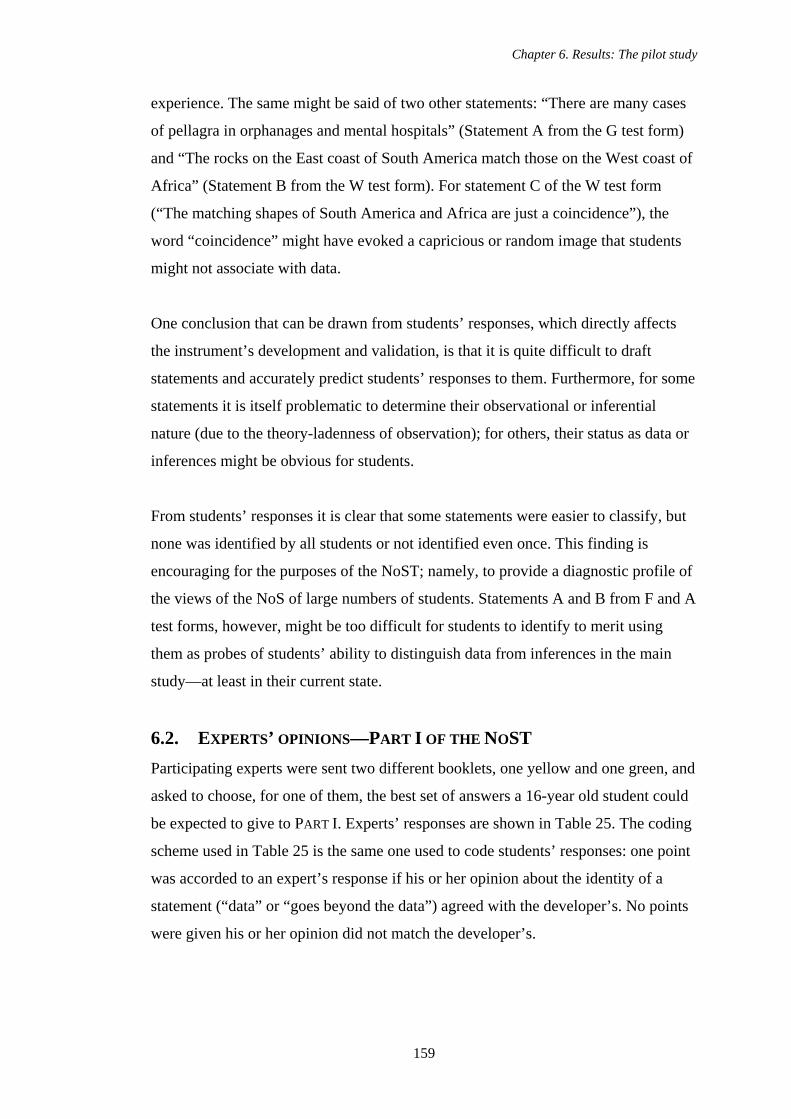
Chapter 6. Results: The pilot study
159
experience. The same might be said of two other statements: “There are many cases
of pellagra in orphanages and mental hospitals” (Statement A from the G test form)
and “The rocks on the East coast of South America match those on the West coast of
Africa” (Statement B from the W test form). For statement C of the W test form
(“The matching shapes of South America and Africa are just a coincidence”), the
word “coincidence” might have evoked a capricious or random image that students
might not associate with data.
One conclusion that can be drawn from students’ responses, which directly affects
the instrument’s development and validation, is that it is quite difficult to draft
statements and accurately predict students’ responses to them. Furthermore, for some
statements it is itself problematic to determine their observational or inferential
nature (due to the theory-ladenness of observation); for others, their status as data or
inferences might be obvious for students.
From students’ responses it is clear that some statements were easier to classify, but
none was identified by all students or not identified even once. This finding is
encouraging for the purposes of the NoST; namely, to provide a diagnostic profile of
the views of the NoS of large numbers of students. Statements A and B from F and A
test forms, however, might be too difficult for students to identify to merit using
them as probes of students’ ability to distinguish data from inferences in the main
study—at least in their current state.
6.2. EXPERTS’ OPINIONS—PART I OF THE NOST Participating experts were sent two different booklets, one yellow and one green, and
asked to choose, for one of them, the best set of answers a 16-year old student could
be expected to give to PART I. Experts’ responses are shown in Table 25. The coding
scheme used in Table 25 is the same one used to code students’ responses: one point
was accorded to an expert’s response if his or her opinion about the identity of a
statement (“data” or “goes beyond the data”) agreed with the developer’s. No points
were given his or her opinion did not match the developer’s.
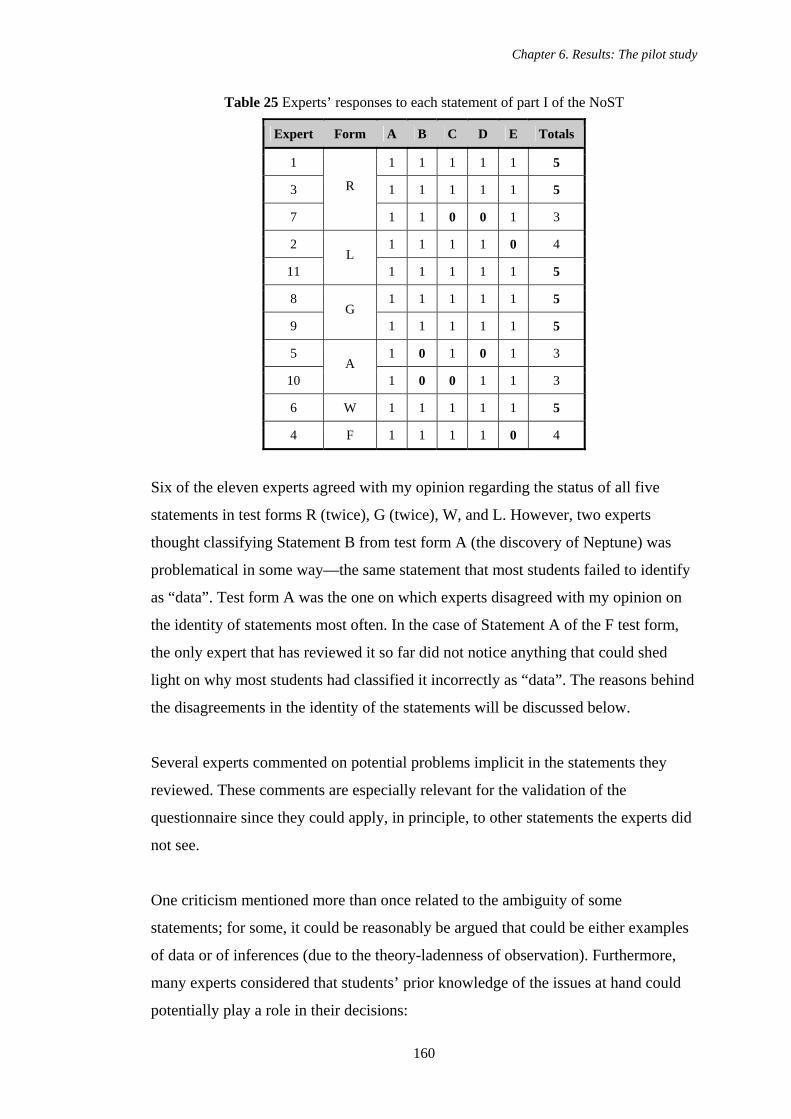
Chapter 6. Results: The pilot study
160
Table 25 Experts’ responses to each statement of part I of the NoST
Expert Form A B C D E Totals
1 1 1 1 1 1 5
3 1 1 1 1 1 5
7
R
1 1 0 0 1 3
2 1 1 1 1 0 4
11 L
1 1 1 1 1 5
8 1 1 1 1 1 5
9 G
1 1 1 1 1 5
5 1 0 1 0 1 3
10 A
1 0 0 1 1 3
6 W 1 1 1 1 1 5
4 F 1 1 1 1 0 4
Six of the eleven experts agreed with my opinion regarding the status of all five
statements in test forms R (twice), G (twice), W, and L. However, two experts
thought classifying Statement B from test form A (the discovery of Neptune) was
problematical in some way—the same statement that most students failed to identify
as “data”. Test form A was the one on which experts disagreed with my opinion on
the identity of statements most often. In the case of Statement A of the F test form,
the only expert that has reviewed it so far did not notice anything that could shed
light on why most students had classified it incorrectly as “data”. The reasons behind
the disagreements in the identity of the statements will be discussed below.
Several experts commented on potential problems implicit in the statements they
reviewed. These comments are especially relevant for the validation of the
questionnaire since they could apply, in principle, to other statements the experts did
not see.
One criticism mentioned more than once related to the ambiguity of some
statements; for some, it could be reasonably be argued that could be either examples
of data or of inferences (due to the theory-ladenness of observation). Furthermore,
many experts considered that students’ prior knowledge of the issues at hand could
potentially play a role in their decisions:
Chapter 6. Results: The pilot study
161
I can see how students might interpret statement E [from test form F, “Light: Particle or wave?”] as reporting data—if measuring the speed of light in water was seen as a simple process. Logically, I can see that measuring the angle of reflection (Statement B) and measuring the speed of light (Statement E) are similar: 16-year old students are unlikely to know what is involved in measuring the speed of light in water (other than the implication in the story that this had not been done at the time of the prediction).
(Expert 4)
They [i.e., students] will have a problem distinguishing between what is observed and the judgements or deductions following the observation. For Statement A, 16-year olds might find it difficult to understand Aristotle's postulates unless they have been exposed to the history of it, i.e., spontaneous generation in detail [From test form R “Where do living beings come from?”].
(Expert 7)
The role of outside information and previous knowledge is difficult to control for,
given the constraints of a multiple-choice test. The best that can be done within these
constraints is ensuring that the episodes provide enough information for students to
understand what scientists were attempting to do and what was at stake, without
having to be familiar with the episode itself.
One expert noticed a detail, regarding the way the statements were written, that calls
into question the validity of Part I of the NoST as a probe of students’ ability to
distinguish “data” from “inferences”: the verbs of the statements could act as
potential clues for students:
The verb used in the story for the statements may well determine the choice between “data” and “beyond the data”. For instance, the verb for [Statements] C and D is “conclude”; the verb for [Statements] B and E is “note” or “notice”. The most neutral verb is related to Statement A, i.e., “know”. This may affect the validity of this item in two ways: the responses may be determined by linguistic ability, or insight in the NoS. Also, the verbs used in one booklet may be more “neutral” than in others [From test form L, “Phlogiston or oxygen?”].
(Expert 11)
Chapter 6. Results: The pilot study
162
This issue is more serious even than the potential confounding role students’ prior
knowledge might play in their responses It might explain why some statements were
more easily categorised than others.
On a more pragmatic note, one of the experts suggested a way to make it easier for
those students to navigate the information contained in the contexts:
For students who come across the story for the first time, they may need to refer to the story to find more information to help them answer the question. They may find it difficult to locate where exactly the statements are found in the text. Suggest adding line numbers next to the text and to provide the corresponding line numbers for the statements (A, B, C, D and E) in the question.
(Expert 3)
The expression “beyond the data”, as a substitute for “inference”, constitutes,
according to one expert, a possible source of confusion for students: its meaning is
not clear and it could be open to many interpretations, and not necessarily that of
“inference”.
Another conclusion drawn from the experts’ opinions concerned the quality of the
episodes themselves. None of the eleven respondents criticised any of the episodes
they reviewed in terms of content, depth, clarity, or length. Neither did they suggest
making any changes to the stories or replacing them with others. They did, however,
suggest some small improvements. It seems that, in their current state, the contexts
provide a clear and reasonably complete account of the episode they deal with. Even
though they necessarily leave out many details of some quite complex research, they
appear to communicate the essence of the original enquiries and scientific practice in
general.
From experts’ criticisms and suggestions, steps taken to improve the NoST for its
subsequent use as a probe of students’ views of the NoS were:
Chapter 6. Results: The pilot study
163
number the lines of each episode to facilitate locating relevant information;
substitute the expression “goes beyond the data” for a less ambiguous one
that, at the same time, 16-year old students easily understand. Possible
options are “conjecture” or “explanation”;
make sure the identity of the statements is as clear as possible; maybe
emphasise in the question instructions that statements should be classified
according to their function in the episode;
replace verbs such as “notice” and “conclude” with ones that do not suggest
which are the correct answers; and
take care to avoid using generalisations, since these are also inferences but
can easily be seen as data (for example, the statement “Plants increase the
volume of gas” was initially categorised by me as “data”, but an expert
pointed out that it is generalising from individual observations with, for
example, mint plants).
6.3. STUDENTS’ RESPONSES FOR INDIVIDUAL QUESTIONS—PART II OF
THE NOST One of the main aims of administering the six forms of the NoST was determining
whether the answer options represented reasonable approximations to views of the
NoS that students might hold. This aim was accomplished by checking (a) if all
answer options were chosen by at least 5% of students (a figure selected arbitrarily as
the cutting-off point for considering that a view was present in the student sample)
and (b) if any answer options commanded 95% or more of students’ responses.
The first case could suggest that few students actually held that particular view and
that there might be other, more representative views about an aspect of the NoS that
might be worth exploring instead. Alternatively, such a finding could suggest that
something in the way the question and/or the answer options were written might be
biasing students against a specific option. The second case could suggest that the
view is quite common among 16-year old students and, thus, might not be worth
exploring in students of that age range. Alternatively, something in the questions
and/or the answer options might be biasing students in favour of a specific option.
Since these alternative scenarios could not be explored as part of the pilot study
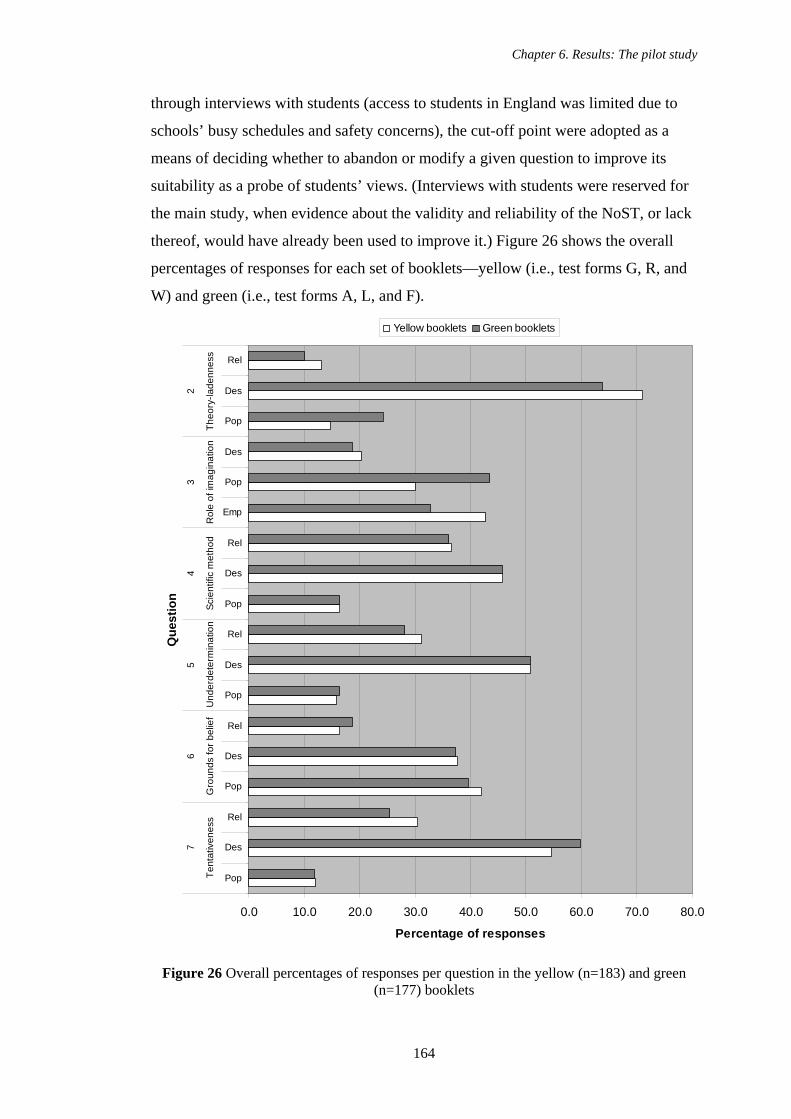
Chapter 6. Results: The pilot study
164
through interviews with students (access to students in England was limited due to
schools’ busy schedules and safety concerns), the cut-off point were adopted as a
means of deciding whether to abandon or modify a given question to improve its
suitability as a probe of students’ views. (Interviews with students were reserved for
the main study, when evidence about the validity and reliability of the NoST, or lack
thereof, would have already been used to improve it.) Figure 26 shows the overall
percentages of responses for each set of booklets—yellow (i.e., test forms G, R, and
W) and green (i.e., test forms A, L, and F).
0.0 10.0 20.0 30.0 40.0 50.0 60.0 70.0 80.0
Pop
Des
Rel
Pop
Des
Rel
Pop
Des
Rel
Pop
Des
Rel
Emp
Pop
Des
Pop
Des
Rel
Tent
ativ
enes
sG
roun
ds fo
r bel
ief
Und
erde
term
inat
ion
Scie
ntifi
c m
etho
dR
ole
of im
agin
atio
nTh
eory
-lade
nnes
s
76
54
32
Que
stio
n
Percentage of responses
Yellow booklets Green booklets
Figure 26 Overall percentages of responses per question in the yellow (n=183) and green
(n=177) booklets
Chapter 6. Results: The pilot study
165
Figure 26 shows that all answer options were selected by at least 10% of the
students. At the level of individual test forms, only one answer option was selected
by less than 5% of students: the relativist option of Question 1 of test form L was
selected by only 2.7% of students that completed that form (data for each test form
not shown). These results suggest that all options represent to some degree the views
of participating students. Furthermore, even though students were offered the
opportunity to leave written comments in the booklets, not a single one suggested an
alternative option, different from the three provided, to any of the questions.
The high frequencies of desired answer options in Questions 2 and 7 might be taken
to mean that many students identify with that view. However, a close review of those
questions reveals that, in both, the desired options are worded in such a way that,
compared with the other two, they provide students with a way out of committing to
the more definite views in the popular and the relativist options—in a sense, the
desired option represents a safe option. In the case of Question 2, the desired option
reads “A scientist personal experience influences what he/she pays attention to but
does NOT determine it completely”, whereas the corresponding option in Question 7
reads “Any scientific explanation we accept today might change in the future, or
even replaced by a different explanation”. As such, the desired option in Question 2
lies between the extremes of personal experience not influencing what a scientist
notices and determining it. On the other hand, the desired option in Question 7 lies
between explanations never changing and explanations changing all the time. These
questions might be improved by redrafting them to avoid offering middle ground,
uncommitted options.
The range of responses, as evidenced by the fact that all options were selected by at
least 10% of students, suggests that the NoST could be used to explore respondents’
pattern of responses across a form of the NoST and, with them, to construct a profile
of their views or understanding of the NoS However, it remains to be seen whether
respondents’ responses are consistent between contexts. Students’ response
consistency across contexts will be explored in Section 6.5, below.
Looking at the data in Figure 26, there appears to be little difference in the frequency
of each response between test forms in the yellow and green booklets. In questions
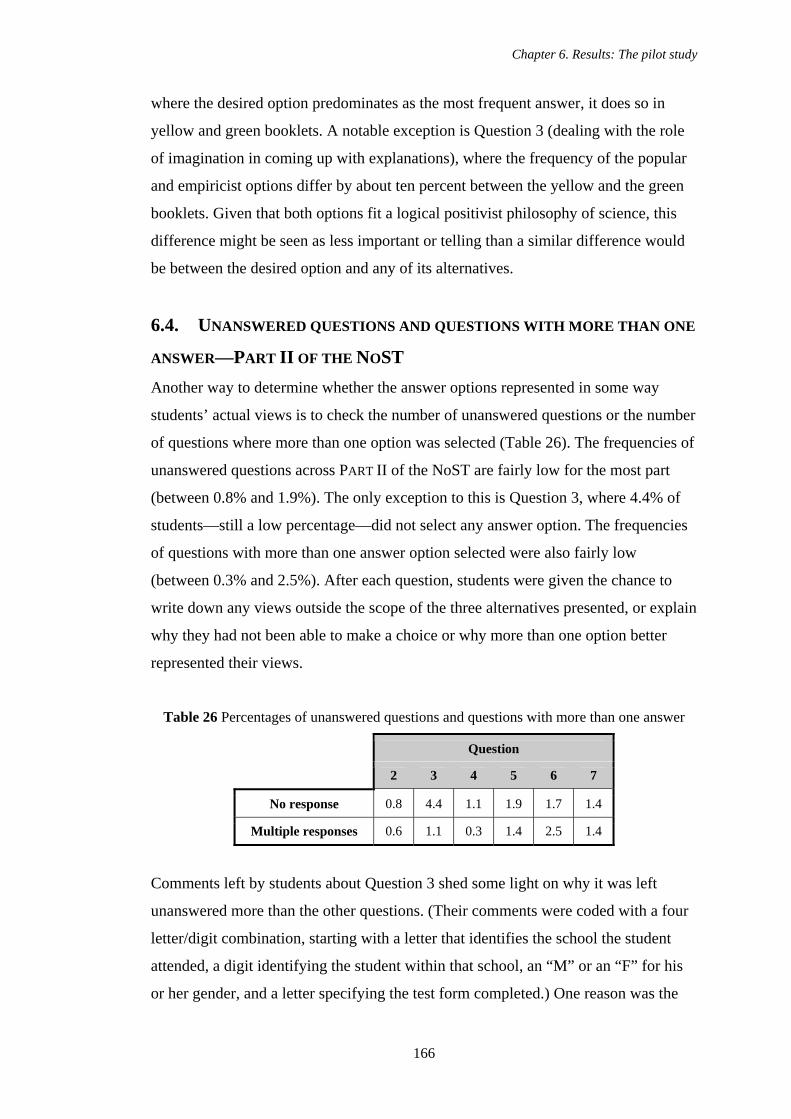
Chapter 6. Results: The pilot study
166
where the desired option predominates as the most frequent answer, it does so in
yellow and green booklets. A notable exception is Question 3 (dealing with the role
of imagination in coming up with explanations), where the frequency of the popular
and empiricist options differ by about ten percent between the yellow and the green
booklets. Given that both options fit a logical positivist philosophy of science, this
difference might be seen as less important or telling than a similar difference would
be between the desired option and any of its alternatives.
6.4. UNANSWERED QUESTIONS AND QUESTIONS WITH MORE THAN ONE
ANSWER—PART II OF THE NOST Another way to determine whether the answer options represented in some way
students’ actual views is to check the number of unanswered questions or the number
of questions where more than one option was selected (Table 26). The frequencies of
unanswered questions across PART II of the NoST are fairly low for the most part
(between 0.8% and 1.9%). The only exception to this is Question 3, where 4.4% of
students—still a low percentage—did not select any answer option. The frequencies
of questions with more than one answer option selected were also fairly low
(between 0.3% and 2.5%). After each question, students were given the chance to
write down any views outside the scope of the three alternatives presented, or explain
why they had not been able to make a choice or why more than one option better
represented their views.
Table 26 Percentages of unanswered questions and questions with more than one answer
Question
2 3 4 5 6 7
No response 0.8 4.4 1.1 1.9 1.7 1.4
Multiple responses 0.6 1.1 0.3 1.4 2.5 1.4
Comments left by students about Question 3 shed some light on why it was left
unanswered more than the other questions. (Their comments were coded with a four
letter/digit combination, starting with a letter that identifies the school the student
attended, a digit identifying the student within that school, an “M” or an “F” for his
or her gender, and a letter specifying the test form completed.) One reason was the
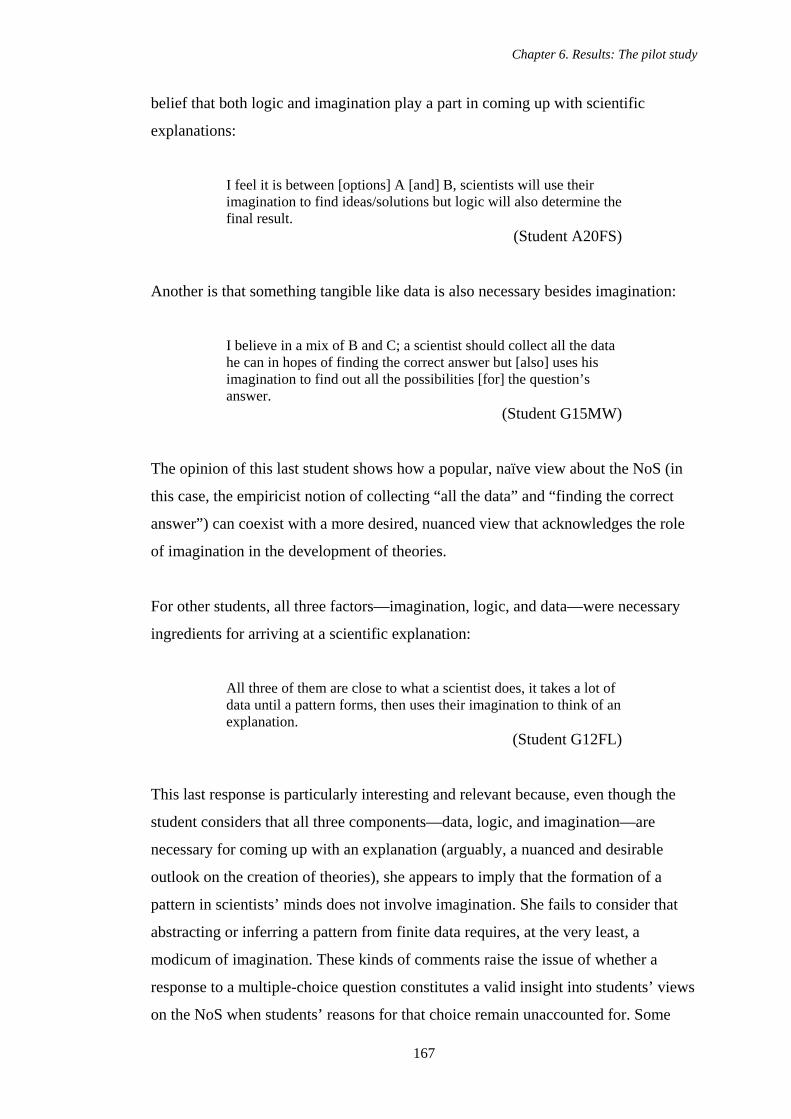
Chapter 6. Results: The pilot study
167
belief that both logic and imagination play a part in coming up with scientific
explanations:
I feel it is between [options] A [and] B, scientists will use their imagination to find ideas/solutions but logic will also determine the final result.
(Student A20FS)
Another is that something tangible like data is also necessary besides imagination:
I believe in a mix of B and C; a scientist should collect all the data he can in hopes of finding the correct answer but [also] uses his imagination to find out all the possibilities [for] the question’s answer.
(Student G15MW)
The opinion of this last student shows how a popular, naïve view about the NoS (in
this case, the empiricist notion of collecting “all the data” and “finding the correct
answer”) can coexist with a more desired, nuanced view that acknowledges the role
of imagination in the development of theories.
For other students, all three factors—imagination, logic, and data—were necessary
ingredients for arriving at a scientific explanation:
All three of them are close to what a scientist does, it takes a lot of data until a pattern forms, then uses their imagination to think of an explanation.
(Student G12FL)
This last response is particularly interesting and relevant because, even though the
student considers that all three components—data, logic, and imagination—are
necessary for coming up with an explanation (arguably, a nuanced and desirable
outlook on the creation of theories), she appears to imply that the formation of a
pattern in scientists’ minds does not involve imagination. She fails to consider that
abstracting or inferring a pattern from finite data requires, at the very least, a
modicum of imagination. These kinds of comments raise the issue of whether a
response to a multiple-choice question constitutes a valid insight into students’ views
on the NoS when students’ reasons for that choice remain unaccounted for. Some
Chapter 6. Results: The pilot study
168
form of interview with students would help determine the extent to which a particular
choice reflects students’ actual view.
Question 3 asks “How does a scientist come up with an explanation for whatever he
or she is studying?” and, in the light of students’ comments, it might be improved by
emphasising that it asks about the origin of scientific explanations and not about the
sequence of phases in a piece of research, for example, by asking “When a scientist
is studying something, where do his or her explanations come from?”
In the case of Question 6, the 2.5% of students that picked more than one answer
option might be due to the fact that all three answer options represent plausible and
adequate reasons for trusting any given explanation, to the point that they are
mutually supportive of each other. Students’ written comments reflected this.
From the results presented in this section, one important point to note is that
students’ written answers suggest that they understood what the questions asked and
the views the options offered—students engaged with the issue at hand. This is a
positive sign that the questions have at least some validity as probes of students’
views of the NoS.
Giving students the chance of writing their own answers—when none of the
available ones reflect their view—provides useful insights into students’ decisions:
this method could prove an invaluable resource for formative assessment purposes.
Given its usefulness, it might even be worth keeping it as a feature of the revised
NoST to be used in the main study, since the task of interpreting students’ responses
is facilitated by the fact that students are already thinking in terms of the NoS
framework provided. This feature could then work as an in-built mechanism for
assessing the test’s validity each time it is used.
6.5. CONSISTENCY OF STUDENTS’ PROFILES OF RESPONSES BETWEEN
THE YELLOW AND GREEN VERSIONS OF THE QUESTIONNAIRE One of the main research questions of the pilot study is determining how consistent
students’ responses are. As discussed in Chapter 5, a measure of the reliability of the
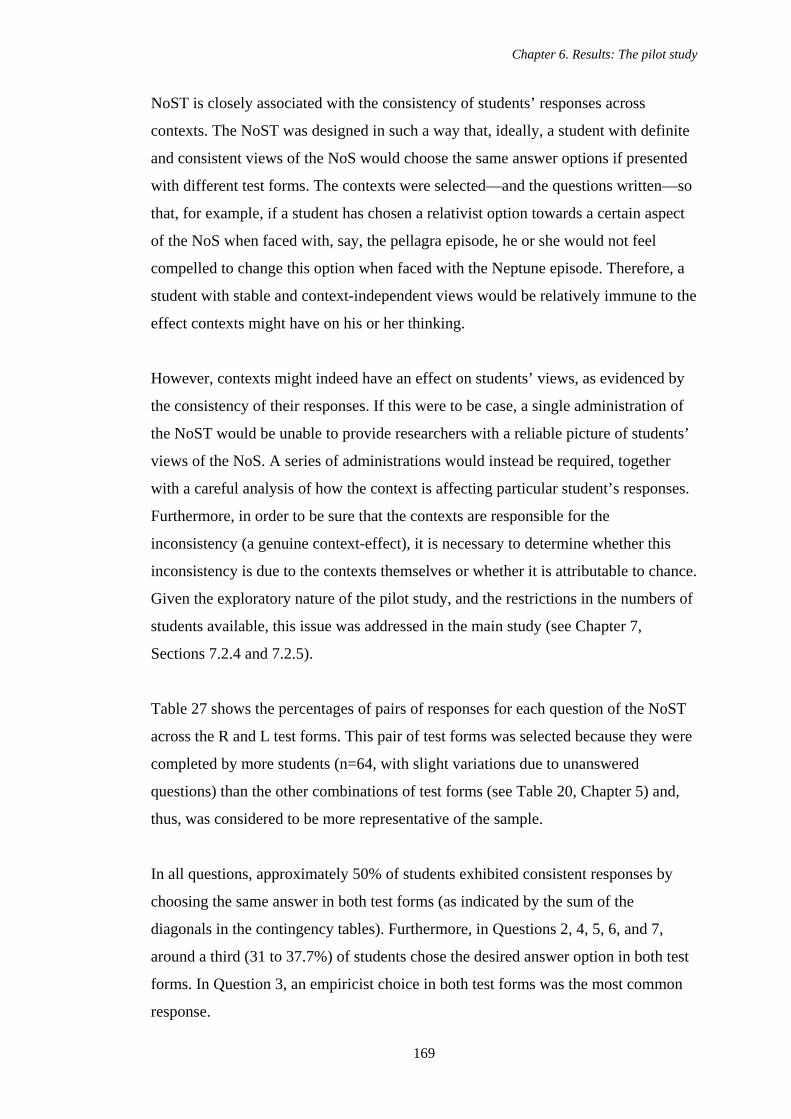
Chapter 6. Results: The pilot study
169
NoST is closely associated with the consistency of students’ responses across
contexts. The NoST was designed in such a way that, ideally, a student with definite
and consistent views of the NoS would choose the same answer options if presented
with different test forms. The contexts were selected—and the questions written—so
that, for example, if a student has chosen a relativist option towards a certain aspect
of the NoS when faced with, say, the pellagra episode, he or she would not feel
compelled to change this option when faced with the Neptune episode. Therefore, a
student with stable and context-independent views would be relatively immune to the
effect contexts might have on his or her thinking.
However, contexts might indeed have an effect on students’ views, as evidenced by
the consistency of their responses. If this were to be case, a single administration of
the NoST would be unable to provide researchers with a reliable picture of students’
views of the NoS. A series of administrations would instead be required, together
with a careful analysis of how the context is affecting particular student’s responses.
Furthermore, in order to be sure that the contexts are responsible for the
inconsistency (a genuine context-effect), it is necessary to determine whether this
inconsistency is due to the contexts themselves or whether it is attributable to chance.
Given the exploratory nature of the pilot study, and the restrictions in the numbers of
students available, this issue was addressed in the main study (see Chapter 7,
Sections 7.2.4 and 7.2.5).
Table 27 shows the percentages of pairs of responses for each question of the NoST
across the R and L test forms. This pair of test forms was selected because they were
completed by more students (n=64, with slight variations due to unanswered
questions) than the other combinations of test forms (see Table 20, Chapter 5) and,
thus, was considered to be more representative of the sample.
In all questions, approximately 50% of students exhibited consistent responses by
choosing the same answer in both test forms (as indicated by the sum of the
diagonals in the contingency tables). Furthermore, in Questions 2, 4, 5, 6, and 7,
around a third (31 to 37.7%) of students chose the desired answer option in both test
forms. In Question 3, an empiricist choice in both test forms was the most common
response.
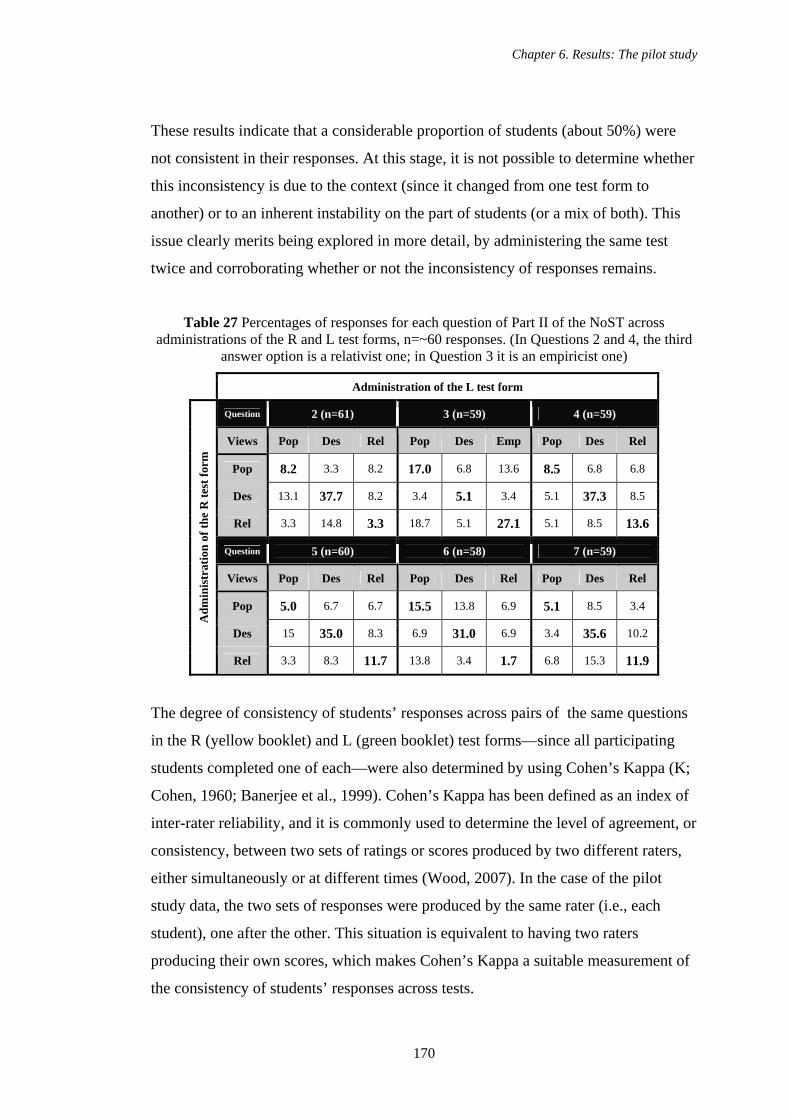
Chapter 6. Results: The pilot study
170
These results indicate that a considerable proportion of students (about 50%) were
not consistent in their responses. At this stage, it is not possible to determine whether
this inconsistency is due to the context (since it changed from one test form to
another) or to an inherent instability on the part of students (or a mix of both). This
issue clearly merits being explored in more detail, by administering the same test
twice and corroborating whether or not the inconsistency of responses remains.
Table 27 Percentages of responses for each question of Part II of the NoST across administrations of the R and L test forms, n=~60 responses. (In Questions 2 and 4, the third
answer option is a relativist one; in Question 3 it is an empiricist one)
Administration of the L test form
Question 2 (n=61) 3 (n=59) 4 (n=59)
Views Pop Des Rel Pop Des Emp Pop Des Rel
Pop 8.2 3.3 8.2 17.0 6.8 13.6 8.5 6.8 6.8
Des 13.1 37.7 8.2 3.4 5.1 3.4 5.1 37.3 8.5
Rel 3.3 14.8 3.3 18.7 5.1 27.1 5.1 8.5 13.6
Question 5 (n=60) 6 (n=58) 7 (n=59)
Views Pop Des Rel Pop Des Rel Pop Des Rel
Pop 5.0 6.7 6.7 15.5 13.8 6.9 5.1 8.5 3.4
Des 15 35.0 8.3 6.9 31.0 6.9 3.4 35.6 10.2
Adm
inis
trat
ion
of th
e R
test
form
Rel 3.3 8.3 11.7 13.8 3.4 1.7 6.8 15.3 11.9
The degree of consistency of students’ responses across pairs of the same questions
in the R (yellow booklet) and L (green booklet) test forms—since all participating
students completed one of each—were also determined by using Cohen’s Kappa (K;
Cohen, 1960; Banerjee et al., 1999). Cohen’s Kappa has been defined as an index of
inter-rater reliability, and it is commonly used to determine the level of agreement, or
consistency, between two sets of ratings or scores produced by two different raters,
either simultaneously or at different times (Wood, 2007). In the case of the pilot
study data, the two sets of responses were produced by the same rater (i.e., each
student), one after the other. This situation is equivalent to having two raters
producing their own scores, which makes Cohen’s Kappa a suitable measurement of
the consistency of students’ responses across tests.
Chapter 6. Results: The pilot study
171
Cohen’s Kappa coefficient ranges from values of -1.0 to 1.0. A value of 1.0
represents a perfect and consistent agreement between raters (or, in our case,
between a student’s responses to the same question in both tests). Conversely, a
value of -1.0 represents perfect and consistent disagreement. A value of 0.0
represents a random level of either agreement or disagreement, that is, no
relationship between the raters’ scores. For research purposes, the general consensus
suggests that Cohen’s Kappa values between 0.6 and 0.7 constitute adequate levels
of agreement between raters, although the intended use of the results determines the
acceptable level of agreement (for example, clinical diagnoses might require values
of up to 0.9) (Wood, 2007). The formula for Cohen’s Kappa is the following:
Κ = Observed frequency of agreement (Σ O) – Expected frequency of agreement (Σ E)
1 – Expected frequency of agreement (Σ E)
where the expected frequency of agreement (Σ E) is the agreement that would occur
by chance if raters score in a random manner.
Cohen’s Kappa was calculated between each pair of Questions 2 to 7 of PART II of
the NoST. Calculation of Kappa was made only for responses to the R and L test
forms, for the reason, as discussed above, that the number of students (from three
schools, A, B, and F) that answered both of these test forms was the largest by far
(64 students) of all pairs of test forms completed. Only those students who answered
all the questions, that is, left no blank questions or selected more than one answer
option, were included in the calculations.
The first step in calculating Kappa is drawing a contingency table for each pair of
sets of responses to each question. In our case, that means a contingency table for
each pair of questions, one from the yellow booklets (in this case, the R test form)
and one from the green booklets (in this case, the L test form). Table 28 shows an
example of one of the six contingency tables (one for each pair of Questions, 2 to 7)
for the R and L test forms From these tables, the sum of the observed frequencies (Σ
O) was calculated with the formula below (Table 30), for input into the equation of
Cohen’s Kappa above.
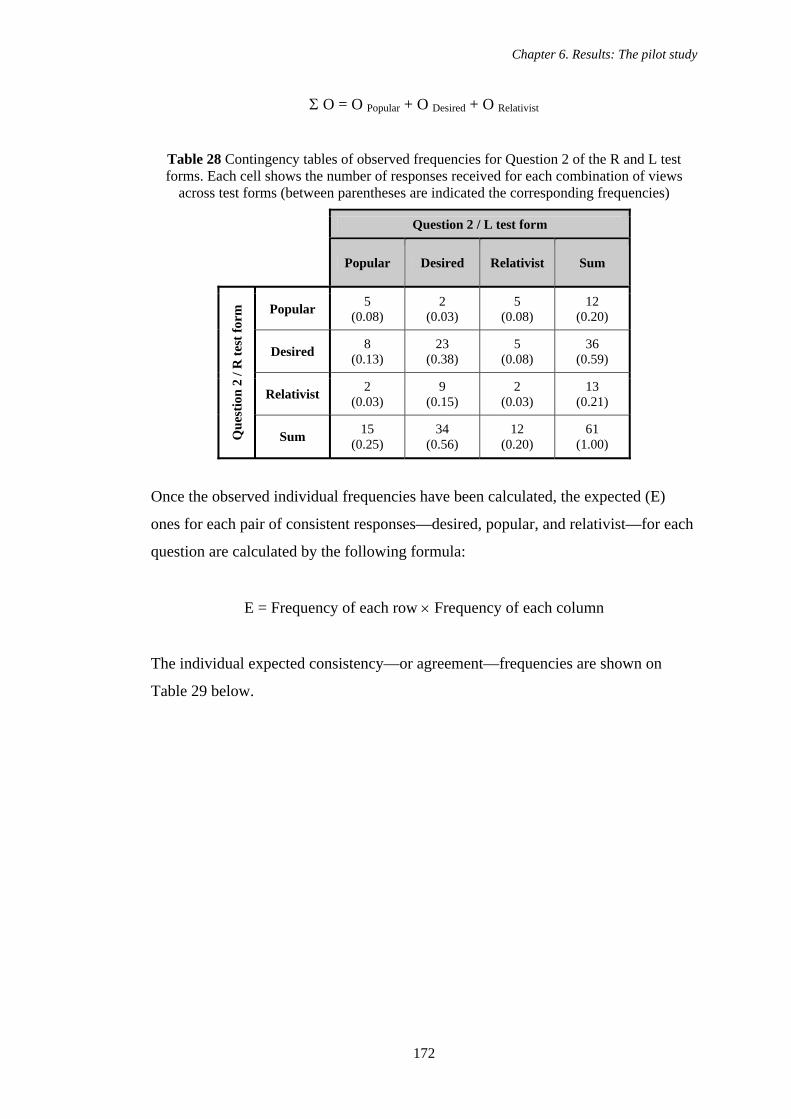
Chapter 6. Results: The pilot study
172
Σ O = O Popular + O Desired + O Relativist
Table 28 Contingency tables of observed frequencies for Question 2 of the R and L test forms. Each cell shows the number of responses received for each combination of views
across test forms (between parentheses are indicated the corresponding frequencies)
Question 2 / L test form Popular Desired Relativist Sum
Popular 5 (0.08)
2 (0.03)
5 (0.08)
12 (0.20)
Desired 8 (0.13)
23 (0.38)
5 (0.08)
36 (0.59)
Relativist 2 (0.03)
9 (0.15)
2 (0.03)
13 (0.21)
Que
stio
n 2
/ R te
st fo
rm
Sum 15 (0.25)
34 (0.56)
12 (0.20)
61 (1.00)
Once the observed individual frequencies have been calculated, the expected (E)
ones for each pair of consistent responses—desired, popular, and relativist—for each
question are calculated by the following formula:
E = Frequency of each row × Frequency of each column
The individual expected consistency—or agreement—frequencies are shown on
Table 29 below.
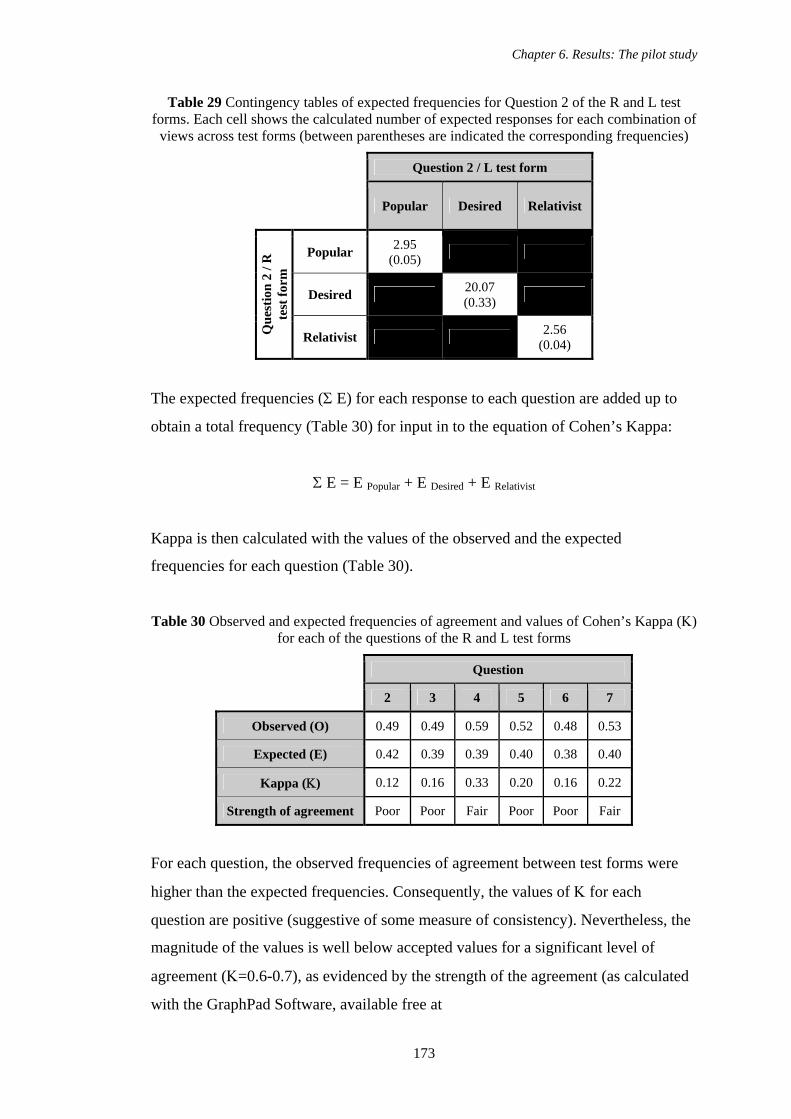
Chapter 6. Results: The pilot study
173
Table 29 Contingency tables of expected frequencies for Question 2 of the R and L test forms. Each cell shows the calculated number of expected responses for each combination of
views across test forms (between parentheses are indicated the corresponding frequencies)
Question 2 / L test form
Popular Desired Relativist
Popular 2.95 (0.05)
Desired 20.07 (0.33)
Que
stio
n 2
/ R
test
form
Relativist 2.56 (0.04)
The expected frequencies (Σ E) for each response to each question are added up to
obtain a total frequency (Table 30) for input in to the equation of Cohen’s Kappa:
Σ E = E Popular + E Desired + E Relativist
Kappa is then calculated with the values of the observed and the expected
frequencies for each question (Table 30).
Table 30 Observed and expected frequencies of agreement and values of Cohen’s Kappa (Κ) for each of the questions of the R and L test forms
Question
2 3 4 5 6 7
Observed (O) 0.49 0.49 0.59 0.52 0.48 0.53
Expected (E) 0.42 0.39 0.39 0.40 0.38 0.40
Kappa (Κ) 0.12 0.16 0.33 0.20 0.16 0.22
Strength of agreement Poor Poor Fair Poor Poor Fair
For each question, the observed frequencies of agreement between test forms were
higher than the expected frequencies. Consequently, the values of Κ for each
question are positive (suggestive of some measure of consistency). Nevertheless, the
magnitude of the values is well below accepted values for a significant level of
agreement (Κ=0.6-0.7), as evidenced by the strength of the agreement (as calculated
with the GraphPad Software, available free at
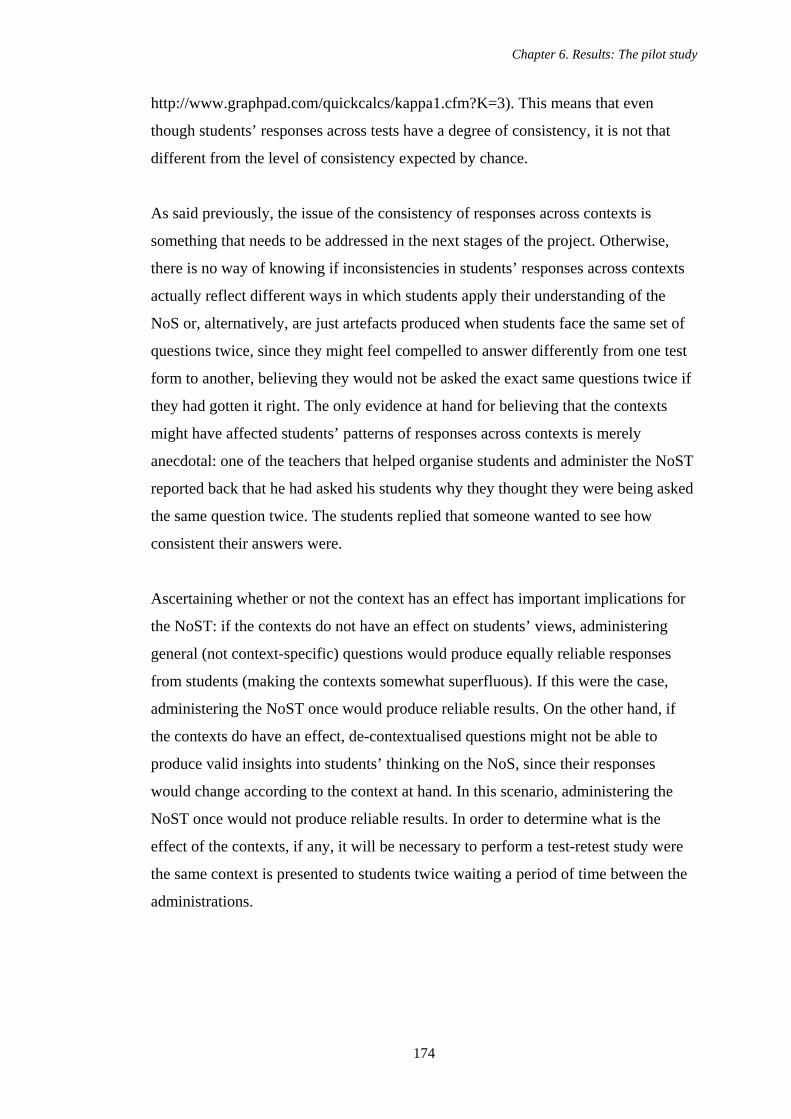
Chapter 6. Results: The pilot study
174
http://www.graphpad.com/quickcalcs/kappa1.cfm?K=3). This means that even
though students’ responses across tests have a degree of consistency, it is not that
different from the level of consistency expected by chance.
As said previously, the issue of the consistency of responses across contexts is
something that needs to be addressed in the next stages of the project. Otherwise,
there is no way of knowing if inconsistencies in students’ responses across contexts
actually reflect different ways in which students apply their understanding of the
NoS or, alternatively, are just artefacts produced when students face the same set of
questions twice, since they might feel compelled to answer differently from one test
form to another, believing they would not be asked the exact same questions twice if
they had gotten it right. The only evidence at hand for believing that the contexts
might have affected students’ patterns of responses across contexts is merely
anecdotal: one of the teachers that helped organise students and administer the NoST
reported back that he had asked his students why they thought they were being asked
the same question twice. The students replied that someone wanted to see how
consistent their answers were.
Ascertaining whether or not the context has an effect has important implications for
the NoST: if the contexts do not have an effect on students’ views, administering
general (not context-specific) questions would produce equally reliable responses
from students (making the contexts somewhat superfluous). If this were the case,
administering the NoST once would produce reliable results. On the other hand, if
the contexts do have an effect, de-contextualised questions might not be able to
produce valid insights into students’ thinking on the NoS, since their responses
would change according to the context at hand. In this scenario, administering the
NoST once would not produce reliable results. In order to determine what is the
effect of the contexts, if any, it will be necessary to perform a test-retest study were
the same context is presented to students twice waiting a period of time between the
administrations.
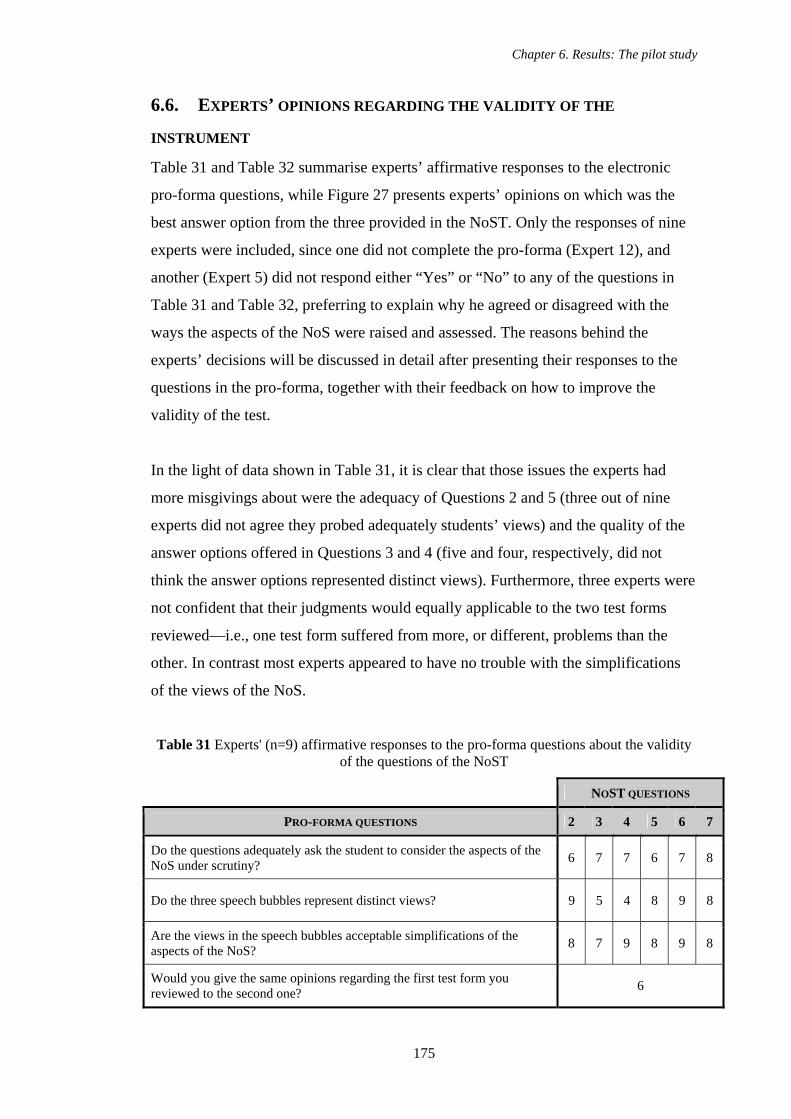
Chapter 6. Results: The pilot study
175
6.6. EXPERTS’ OPINIONS REGARDING THE VALIDITY OF THE
INSTRUMENT Table 31 and Table 32 summarise experts’ affirmative responses to the electronic
pro-forma questions, while Figure 27 presents experts’ opinions on which was the
best answer option from the three provided in the NoST. Only the responses of nine
experts were included, since one did not complete the pro-forma (Expert 12), and
another (Expert 5) did not respond either “Yes” or “No” to any of the questions in
Table 31 and Table 32, preferring to explain why he agreed or disagreed with the
ways the aspects of the NoS were raised and assessed. The reasons behind the
experts’ decisions will be discussed in detail after presenting their responses to the
questions in the pro-forma, together with their feedback on how to improve the
validity of the test.
In the light of data shown in Table 31, it is clear that those issues the experts had
more misgivings about were the adequacy of Questions 2 and 5 (three out of nine
experts did not agree they probed adequately students’ views) and the quality of the
answer options offered in Questions 3 and 4 (five and four, respectively, did not
think the answer options represented distinct views). Furthermore, three experts were
not confident that their judgments would equally applicable to the two test forms
reviewed—i.e., one test form suffered from more, or different, problems than the
other. In contrast most experts appeared to have no trouble with the simplifications
of the views of the NoS.
Table 31 Experts' (n=9) affirmative responses to the pro-forma questions about the validity of the questions of the NoST
NOST QUESTIONS
PRO-FORMA QUESTIONS 2 3 4 5 6 7
Do the questions adequately ask the student to consider the aspects of the NoS under scrutiny? 6 7 7 6 7 8
Do the three speech bubbles represent distinct views? 9 5 4 8 9 8
Are the views in the speech bubbles acceptable simplifications of the aspects of the NoS? 8 7 9 8 9 8
Would you give the same opinions regarding the first test form you reviewed to the second one? 6
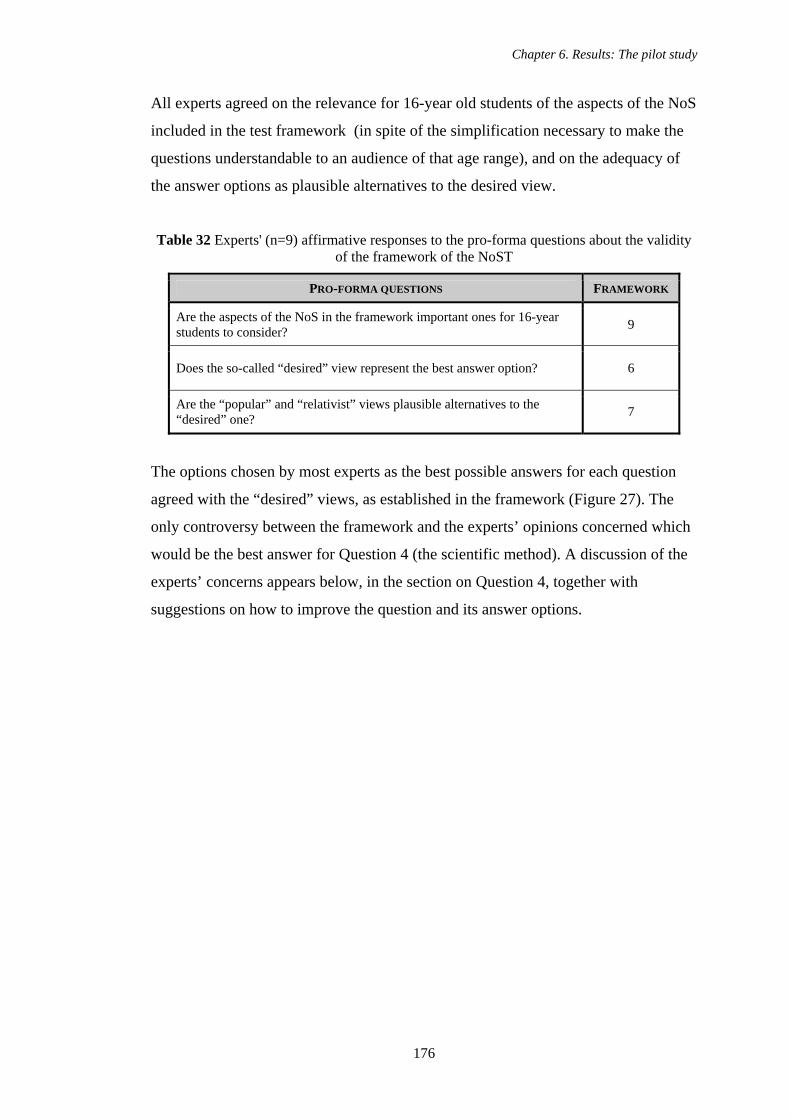
Chapter 6. Results: The pilot study
176
All experts agreed on the relevance for 16-year old students of the aspects of the NoS
included in the test framework (in spite of the simplification necessary to make the
questions understandable to an audience of that age range), and on the adequacy of
the answer options as plausible alternatives to the desired view.
Table 32 Experts' (n=9) affirmative responses to the pro-forma questions about the validity of the framework of the NoST
PRO-FORMA QUESTIONS FRAMEWORK
Are the aspects of the NoS in the framework important ones for 16-year students to consider? 9
Does the so-called “desired” view represent the best answer option? 6
Are the “popular” and “relativist” views plausible alternatives to the “desired” one? 7
The options chosen by most experts as the best possible answers for each question
agreed with the “desired” views, as established in the framework (Figure 27). The
only controversy between the framework and the experts’ opinions concerned which
would be the best answer for Question 4 (the scientific method). A discussion of the
experts’ concerns appears below, in the section on Question 4, together with
suggestions on how to improve the question and its answer options.
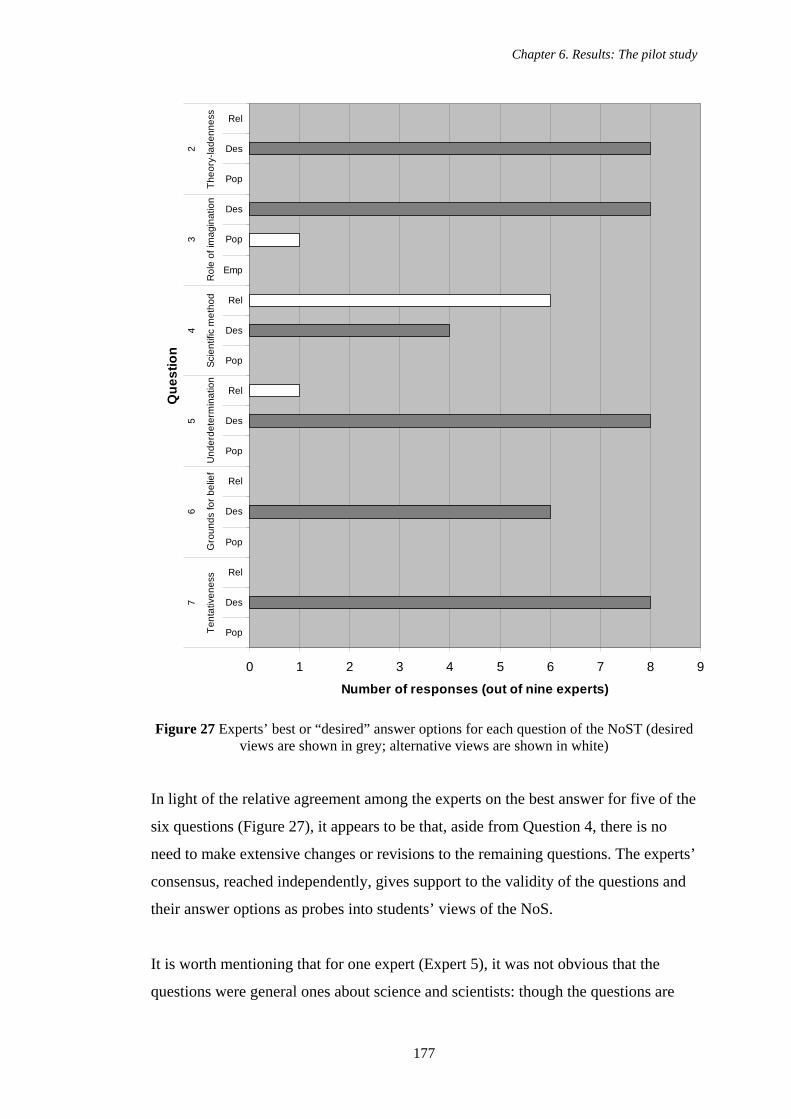
Chapter 6. Results: The pilot study
177
0 1 2 3 4 5 6 7 8 9
Pop
Des
Rel
Pop
Des
Rel
Pop
Des
Rel
Pop
Des
Rel
Emp
Pop
Des
Pop
Des
Rel
Tent
ativ
enes
sG
roun
ds fo
r bel
ief
Und
erde
term
inat
ion
Scie
ntifi
c m
etho
dR
ole
of im
agin
atio
nTh
eory
-lade
nnes
s
76
54
32
Que
stio
n
Number of responses (out of nine experts)
Figure 27 Experts’ best or “desired” answer options for each question of the NoST (desired views are shown in grey; alternative views are shown in white)
In light of the relative agreement among the experts on the best answer for five of the
six questions (Figure 27), it appears to be that, aside from Question 4, there is no
need to make extensive changes or revisions to the remaining questions. The experts’
consensus, reached independently, gives support to the validity of the questions and
their answer options as probes into students’ views of the NoS.
It is worth mentioning that for one expert (Expert 5), it was not obvious that the
questions were general ones about science and scientists: though the questions are
Chapter 6. Results: The pilot study
178
based on, or make reference to, the contexts provided, they were asked in the light of
the context but not about it. For instance, concerning Question 2 (a probe for the
theory-ladenness of data/the subjectivity of theory-choice) in test form A (the
discovery of Neptune), Expert 5 thought that the question did not adequately ask the
student to consider that aspect of the NoS and commented that:
The story tells nothing about personal beliefs. Both positions indicated (Newton does not work and there must be another planet) could have been possible. Until 1900 Newton’s physics was not at all undisputed.
(Expert 5)
In this heavily contextualised view of the questions, information not included in the
episode turns out to be crucial for expressing one’s view and selecting an answer
option. Consequently, for the expert it was not possible to choose any one of the
available options in Question 2:
All three bubbles are correct. It depends on the situation. If we are in a period of “normal” science, personal beliefs are not nearly as important for findings. If a scientist is working on developing new theories his/her beliefs are important (see, for example, discussions around the Copenhagen School). To which extent beliefs are important cannot be decided.
(Expert 5)
According to the same expert, Questions 4, 5, and 7 suffer from the same issue.
These remarks—although not echoed by the other experts—are quite eloquent about
the difference between asking general questions against the background of the
context and asking fully contextualised questions that depend on comprehension of
the episode and are therefore highly dependent on the information provided by it:
I have difficulty understanding the relation between the questions and the text base. The text does not contain any NoS or SI [Scientific Inquiry] content. So, the test is a test about knowledge and not about students’ competences (ability to apply knowledge).
(Expert 5)
Even though most experts implicitly or explicitly agreed that the questions were not
specifically about the context (but rather were informed by it), it is essential to clarify
Chapter 6. Results: The pilot study
179
this issue in the NoST, by somehow emphasising that its questions are about science
and scientists in general. Also, it is necessary to corroborate, through one-on-one
interviews or focus groups, that students do not feel the same way and, like Expert 5,
cannot reach a decision about the aspects of the NoS being probed.
Apart from Expert 5, all the other experts read the questions of the NoST as general,
rather than specific, questions applicable to scientific work more generally. For
example, Expert 2, on whether he would give the same answer to both versions,
commented the following:
The questions are not linked to the contexts in such a way that they make any changes to the answering. On question 2 [theory-ladenness of data / subjectivity of theory choice] alternative B is different in the two booklets, but this does not change the answering. […] I don’t think that students would answer one booklet differently from the other (except Q1). Even if the questions are context-based, all response alternatives are general.
(Expert 2)
However, two experts did express some concern that the contexts were underused or
disconnected from the questions. The following comment summarises this issue quite
clearly:
I am uncertain about the role of the contexts. To me it seems as if you would have got the same answers without including the contexts. I guess this is something you look at in your research. Secondly, a consequence of using the same question (and if the context has little influence) is that you test each NoS aspect with just ONE question. I would generally feel a bit uneasy about this. Rather than using booklets with the same questions/different contexts I would therefore prefer the NoS alternatives operationalised into different questions. Then it would be more reasonable for the students to do several booklets.
(Expert 1)
Using contexts and general questions was a deliberate decision, taken with the aim of
not probing students’ reading comprehension skills, as well as exploring the
reliability of the questions and the possibility of a context-effect. Concerning the
suggestion of operationalising the aspects of the NoS differently in each test form,
one of the main difficulties posed by this decision would have been the fact that
Chapter 6. Results: The pilot study
180
differently worded questions, even though addressing the same aspect of the NoS,
could be interpreted or understood quite differently by students. Even subtle changes
in the wording of the questions or its answer options could persuade a student to shift
his perspective to a different view from context to context. There would be no way of
determining whether his or her responses are consistent.
All experts offered criticisms and comments. What follows is an account of those
comments relevant for the purpose of improving the instrument’s validity, grouped
according to the test question they refer to.
Question 2—the theory-ladenness of observations
Many experts recommended clarifying meanings in order to improve the test’s
validity; for instance:
I think the appropriate response depends on what is meant by “personal beliefs”. If this is taken to mean that scientists select explanations without reference to empirical data, then [option] A is wrong. However, if it is taken as meaning that a scientist’s personal beliefs about the validity of a particular paradigm, then I can see how this would completely (or almost completely) determine which explanation was accepted.
(Expert 4)
Regarding this comment, it must be said that the question is asking about what
scientists “pay attention to”, and not about the selection of explanations.
Furthermore, it can be argued that even the selection of a given theory could be
linked to concerns unrelated to a given scientific paradigm, such as religious or
political beliefs, notions of beauty and parsimony, or even a belief in the superiority
of one’s ideas.
Other experts drew attention to the fact that the qualification of the answer options
through phrases such as “NOT influenced at all”, “completely determines”, and
“does NOT determine […] completely” could provide implicit clues about the nature
of a given statement, making it easier for students to classify it correctly without
having to understand whether it is observational or inferential (a concern raised in the
case of the atypically high proportion of students that picked the desired option for
Chapter 6. Results: The pilot study
181
this question; see Figure 26). Still other experts took issue with the philosophical
underpinnings of the question itself:
The aspect of [the] NoS under test seems to have two distinct meanings here: one is the theory-ladenness of observations and the other is about the personal beliefs/experiences of scientists. These are not the same. The question in this test covers the second but not the first point. Arguably the first point is more important.
(Expert 6)
Expert 6 is correct in pointing out the difference between the subjectivity of data
(due to effect of personal beliefs and experiences) and the theory-ladenness of
observation. However, although distinct, both issues are closely-related in the way
they challenge the objectivity of data. In a general sense (appropriate for 16-year old
students), a scientist’s personal experiences include those theories he believes in and
that allow him to interpret the data gathered through a variety of instruments,
themselves operating on still other theoretical assumptions. The relationship between
both aspects of the subjectivity of data is made explicit in standard accounts of this
issue: “Both the fact that our perceptions depend on some extent on our prior
knowledge and hence on our state of preparedness and our expectations and the fact
that observation statements presuppose the appropriate conceptual framework
indicate that it [i.e., the claim that unbiased facts must precede theory] is a demand
that is impossible to live up to” (Chalmers, 1999, p. 12)
Some experts lamented the small part contexts play in answering the questions. Even
though the rationale behind the development of the instrument deals explicitly with
why it was decided to pose general questions after presenting a definite context (see
Chapter 4), it is worth considering whether it would be useful, for the purposes of
assessing a student’s views of the NoS and his ability to apply this understanding to
different situations, to draft a series of questions with the same layout and content but
substituting the general notion of “scientists” for those names mentioned in the actual
episodes (i.e., Lavoisier, Wegener, etc.). Paired with the abstract questions, these
fully contextualised ones could allow probing whether students can apply their
general views to specific contexts. Achieving a consensus on which of the three
views best applies to each context would be a difficult task, but nevertheless a shift
in students’ responses between general and contextualised questions (about the same
Chapter 6. Results: The pilot study
182
aspect of the NoS) might be indicative of a nuanced understanding of the NoS. For
instance, a student might believe that, in general, most scientific explanations are
subject to change but in the case of, say, the theory of combustion it is highly
unlikely to do so. This idea echoes a suggestion made by Expert 1:
[A] consequence of using the same question (and if the context has little influence) is that you test each NoS aspect with just ONE question. I would generally feel a bit uneasy about this. Rather than using booklets with the same questions/different contexts I would therefore prefer the NoS alternatives operationalised into different questions. Then it would be more reasonable for the students to do several booklets.
(Expert 1)
Question 3—the role of imagination in coming up with an explanation
Many experts pointed out that using imagination to come up with a scientific
explanation and, through intellectual activity, reasoning an explanation are not
mutually exclusive. Also, the emergence of an explanation from the data could be
mediated by reason or imagination, so it is necessary to clarify what is meant by
“emerge”:
I can see that the three [options] represent different views, but […] I am not so sure the text speaks for itself. That an explanation “emerges” (option C) can mean it comes as an idea (imagination). You could say “emerges as a pattern”.
(Expert 1)
The role of imagination versus logic or reason seems to be a contentious issue.
Expert 4 even commented that “some ‘explanations’ are very data-driven, or involve
the use of established algorithms”, referring to the fact that imagination might be
irrelevant in coming up with some explanations. However, among philosophers of
science there appears to be widespread agreement that imagination is necessary to
come up with an explanation—no amount of logic or data can provide the ingenuity
necessary to come up with an explanation that goes beyond the data. As Harré (1972)
has put it,
Scientific work is as much a work of the imagination as it is work at the laboratory bench. It is by the aid of disciplined and rationally controlled imagination that hypotheses as to the nature of things
Chapter 6. Results: The pilot study
183
are invented. We must usually first imagine the mechanisms which produce their behaviour and which alone can suggest fruitful lines of further study. Science is not natural history, it is not the accumulation of facts. It is the building of a picture of the world. It is an intellectual enterprise aimed at understanding the world (pp. 23-24).
Question 4—the character of the scientific method
For several Experts (4, 6, 8, 9, 10, and 12), the best answer for Question 4 of the
NoST is the option that claims that “I don’t think there is a single scientific
method—scientists use whatever method they think is best for tackling the question
they are interested in”. They explained their thinking as follows:
Contrary to what you show here, there is no one scientific method other than to be internally consistent and to have explanations that fit with the real world. A scientist can make a significant contribution, for example, simply by designing new apparatus or techniques, enabling new data to be gathered—which may lead others to new question(s) or shed new light on existing or proposed explanations.
(Expert 12)
However, more than one expert argued that option C, “I think the scientific method is
a general approach that scientists use to guide their work. But it does NOT spell out
in detail what to do”, could be a valid answer:
I think [options] B and C may be confusing. B is saying that there is some general guidelines for scientists to follow (which is right) but C is saying there is not a single scientific method (which is also right). The point in C that “anything goes” also has some merit. I think alternative C needs to be made more specific, i.e., that there are no guidelines for science inquiry.
(Expert 1)
The divided opinion among experts on whether there is or is not a scientific method
suggest the question needs to be rewritten so as to emphasise that what is meant by
“general strategy”: a process of coming up with explanations and then testing these
against data from the real world, as outlined by Giere et al. (2006). It also needs to be
made clear that “methods” are not the same as “processes” (such as experimenting or
hypothesising) or “techniques” (such as chromatography or microscopy).
Chapter 6. Results: The pilot study
184
One expert suggested that the linear and non-linear nature of the mythical and the
actual scientific method could help to distinguish even more the options:
For speech bubbles A and B, there is need to clearly show a distinction between following a method linearly, step by step and doing all activities in a series of procedures without necessarily being linear.
(Expert 7)
Question 5—the underdetermination of explanations by data
Question 5 was the one that elicited least comments or criticisms. There was one
comment concerning how the answer depends on the maturity of the field of
research. If the field is mature enough, scientists are less likely to disagree on the
best explanation:
[I]t could be argued that the answer depends on the ‘maturity’ of the particular area of science. In a well established field where there is consensus about the theory, one would expect C [“If scientists have got the same data, they should all agree on the explanation”] to apply. A [“Even if scientists all have the same data, there could be more than one good explanation for it”].
(Expert 6)
This issue might not be of much concern at the level of 16-year old students, and it
could additionally be argued that all the contexts used illustrate relatively mature
fields of enquiry—or at least scientific issues where controversy has been
satisfactorily settled. This was one of the reasons behind the decision to search
secondary science textbooks for episodes from the history of science, rather than
using contemporary accounts of scientific inquiry.
Question 6—the grounds for belief in an explanation
One of the problems identified in this question was that all three options are good
reasons for trusting a scientific explanation:
Scientific consensus is an important aspect of sanctioning scientific knowledge (option B), as well as explanatory power (option A, even though the “all” qualifier needs attention). What is more, deduction also has its logical issues! I think a choice between these three criteria (explanatory power, consensus, and predictive power) is problematic.
Chapter 6. Results: The pilot study
185
(Expert 2)
The majority of the experts, however, did not see this as a major problem, maybe
because the question asks for the “best grounds” for trusting an explanation:
I think that the “best” answer is clear here—though all three statements are part of a complete answer.
(Expert 6)
Question 7—the tentativeness of scientific explanations
For some experts, the speculative nature of the options was a cause for concern:
I don’t know! I can see that [option] A is the desired answer, but can imagine a plausible case being argued for C. Empirically, there are few scientific explanations from the Enlightenment that we accept today, so one might argue for a similar trajectory of change (even though much change might involve accretion).
(Expert 4)
One way of reducing the speculative nature of the options could be to shift the focus
of the question from the future possibility of explanations changing to what status
should we accord to them today, something like “Which of the following options
best represents how we should consider scientific explanations: (a) as tentative
explanations that are likely to change in some way; (b) as sure things that are
unlikely to change; or (c) sceptically, since it is impossible to know if they will
change or not.” On the other hand, it could be reasonably argued that Kuhnian
revolutions—where a paradigm is replaced—are less common than gradual change
within a paradigm: some ideas are modified or abandoned, while other ideas are kept
(along the lines of Lakatos’s and Laudan’s ideas of progress and change; see Chapter
2).
One expert took issue with the idea that “any scientific explanation accepted today
might change”, which I believed to be the best answer, and contradicted Lederman’s
(1990) notion that all scientific knowledge is tentative and that a belief in this
tentativeness is an indicator of nuanced and complex views of the NoS:
Chapter 6. Results: The pilot study
186
Roger Penrose, in his book The Emperor’s New Mind (1989) discriminates between explanations of three categories: superb, useful and tentative. We don’t really expect superb explanations, such as the laws of chemistry, to fail.
(Expert 12)
This quote gives weight to the idea of asking about the perceived status of
explanations and not what will be their future destiny will be.
6.7. RESEARCH QUESTIONS TO ADDRESS IN THE MAIN STUDY One of the most striking findings of this pilot study is the extent (of about 50%) of
students’ apparent inconsistency of responses across test forms. This percentage is
worryingly high for the purposes of summative assessment since it suggests that
students’ performance in the NoST cannot be predicted accurately. In the light of the
results of the pilot study of the NoST, the main study will address the following
questions:
1. How able are students to distinguish data from explanations?
a) Does their skill at identifying data and explanations depend on the
context?
2. What are students’ views of the NoS?
a) Are students’ responses consistent with any of the three coherent profiles
built into the NoST?
b) Are students’ responses consistent, over time and across contexts?
c) Are there any differences between the views of the NoS held by English
and Mexican students?
3. Is there any relationship between students’ ability to distinguish data from
explanations and their views of the NoS?
4. How valid and reliable are students’ responses?
a) Do students interpret the test questions in the intended way?
b) Do students justify their views adequately?
c) Do responses to the test represent adequately students’ views of the NoS?
Chapter 7. Results: Written administrations
187
7. CHAPTER 7
RESULTS: WRITTEN ADMINISTRATIONS OF THE NOST
7.1. OVERVIEW OF THE RESULTS OF THE MAIN STUDY Once all revisions to the NoST, suggested by the results of the pilot study, had been
completed, attention was turned to assessing 16-year old students’ views of the NoS
using the improved test. The research questions addressed by the main study were,
again, the following:
1. How able are students to distinguish data from explanations?
a) Does their skill at identifying data and explanations depend on the
context?
2. What are students’ views of the NoS?
a) Are students’ views of the NoS consistent with any of the three coherent
profiles built into the NoST?
b) Are students’ views of the NoS consistent, over time and across contexts?
c) Are there any differences between the views of the NoS held by English
and Mexican students?
3. Is there any relationship between students’ ability to distinguish data from
explanations and their views of the NoS?
4. How valid and reliable are students’ responses?
a) Do students interpret the test questions in the intended way?
b) Do students justify their views adequately?
c) Do responses to the test represent adequately students’ views of the NoS?
The Research Questions addressed in the main study can be divided, according to
their aims, into two classes: those directly concerned with exploring students’ views
of the NoS (Research Questions 1-3) and those that focus on whether the selected
responses reflect students’ actual views of the NoS (Research Question 4). However,
in the case of Research Question 2(a), the degree of consistency of responses can
provide insights into both test reliability and the nature of students’ understanding of
the NoS. As is evident from the previous chapter, some questions of the main study
stem directly from findings of the pilot study, and aim to address some of the
Chapter 7. Results: Written administrations
188
questions it left unanswered. Even though both studies share the aim of verifying the
validity and reliability of the NoST as an assessment instrument, the main study is
also interested in students’ views for their own sake.
The presentation of the findings of the main study will focus, in the first place, on the
quantitative results (Chapter 7) and, secondly, on the qualitative ones (Chapter 8).
This sequence seems the most natural, not only because it reflects the chronological
implementation of the study, but because the main aim of the focus groups was to
determine the extent to which students’ responses to the NoST represent their actual
views. Thus, early acquaintance with the questions of the NoST, and the responses
given to them, will serve as the background for the presentation and discussion of the
focus group data. It will also help to justify the particular choice of interview topics
for the focus groups.
Where pertinent, however, insights derived from the focus groups will accompany
the discussion of the quantitative results in this chapter, explaining, complementing
and/or qualifying inferences drawn from them. Nevertheless, these insights will be
presented, discussed, and exemplified more fully in the next chapter.
7.2. STUDENTS’ VIEWS OF THE NATURE OF SCIENCE Of the eight secondary schools in England initially contacted, seven ended up taking
part in the study, returning completed sets of tests for analysis (Table 33). Schools A,
B, and C initially had agreed to take part in both the test-retest (i.e., the same test
form administered twice) and the parallel forms (i.e., two different test forms
administered once) trials but, in the end, only schools A and C did so. In total, 270
Goldberger (G) and 171 Wegener (W) test forms were returned, of which,
respectively, 169 pairs of tests comprised the data for the parallel forms trial and 49
pairs comprised the data for the test-retest trial (a total of 218 pairs of completed
tests).
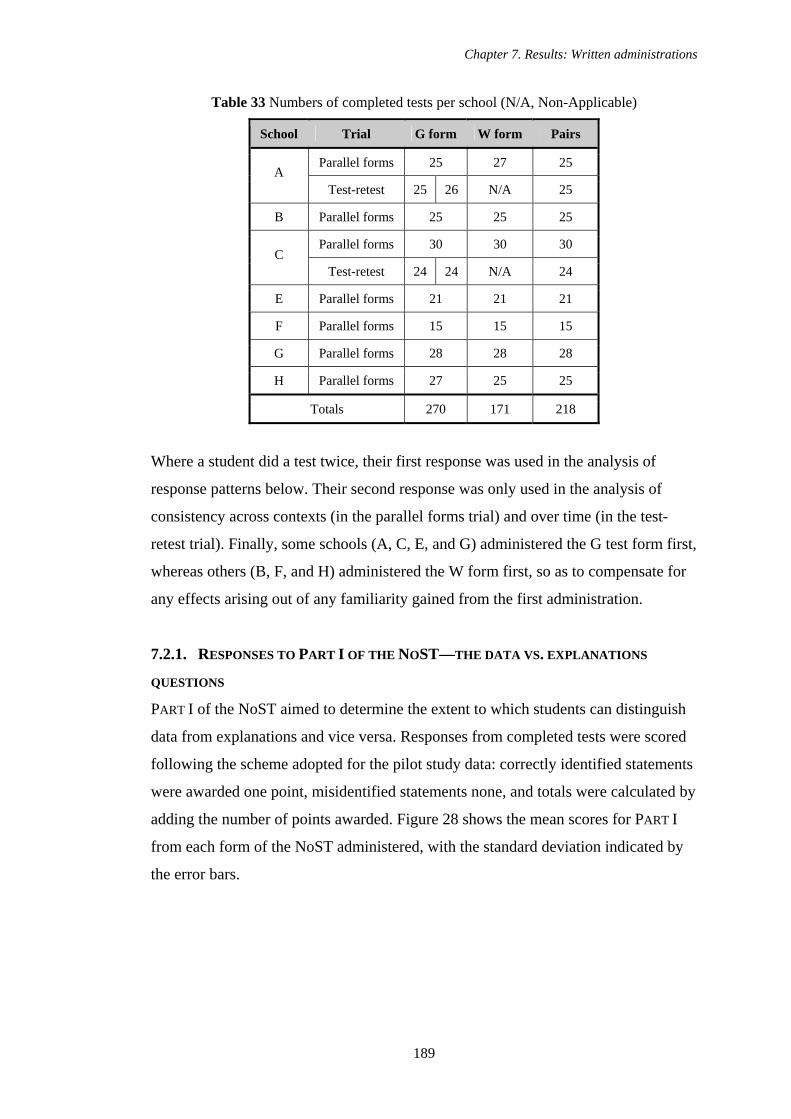
Chapter 7. Results: Written administrations
189
Table 33 Numbers of completed tests per school (N/A, Non-Applicable)
School Trial G form W form Pairs
Parallel forms 25 27 25 A
Test-retest 25 26 N/A 25
B Parallel forms 25 25 25
Parallel forms 30 30 30 C
Test-retest 24 24 N/A 24
E Parallel forms 21 21 21
F Parallel forms 15 15 15
G Parallel forms 28 28 28
H Parallel forms 27 25 25
Totals 270 171 218
Where a student did a test twice, their first response was used in the analysis of
response patterns below. Their second response was only used in the analysis of
consistency across contexts (in the parallel forms trial) and over time (in the test-
retest trial). Finally, some schools (A, C, E, and G) administered the G test form first,
whereas others (B, F, and H) administered the W form first, so as to compensate for
any effects arising out of any familiarity gained from the first administration.
7.2.1. RESPONSES TO PART I OF THE NOST—THE DATA VS. EXPLANATIONS
QUESTIONS
PART I of the NoST aimed to determine the extent to which students can distinguish
data from explanations and vice versa. Responses from completed tests were scored
following the scheme adopted for the pilot study data: correctly identified statements
were awarded one point, misidentified statements none, and totals were calculated by
adding the number of points awarded. Figure 28 shows the mean scores for PART I
from each form of the NoST administered, with the standard deviation indicated by
the error bars.
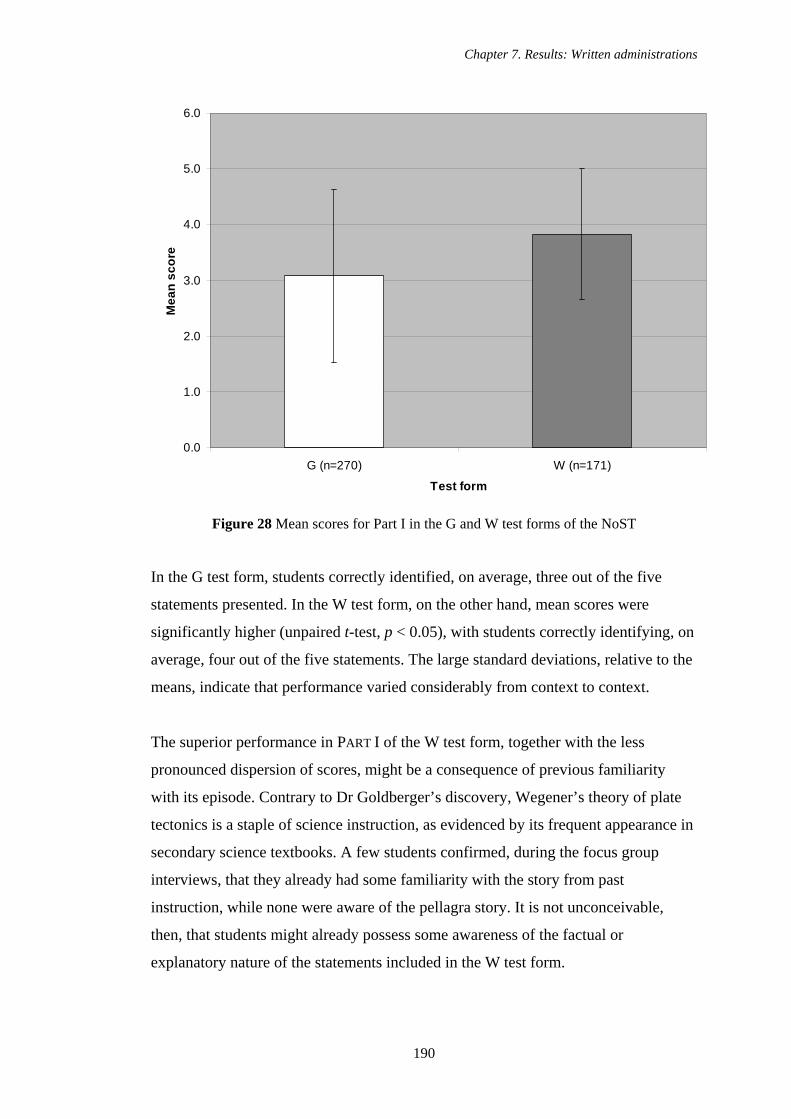
Chapter 7. Results: Written administrations
190
0.0
1.0
2.0
3.0
4.0
5.0
6.0
G (n=270) W (n=171)
Test form
Mea
n sc
ore
Figure 28 Mean scores for Part I in the G and W test forms of the NoST
In the G test form, students correctly identified, on average, three out of the five
statements presented. In the W test form, on the other hand, mean scores were
significantly higher (unpaired t-test, p < 0.05), with students correctly identifying, on
average, four out of the five statements. The large standard deviations, relative to the
means, indicate that performance varied considerably from context to context.
The superior performance in PART I of the W test form, together with the less
pronounced dispersion of scores, might be a consequence of previous familiarity
with its episode. Contrary to Dr Goldberger’s discovery, Wegener’s theory of plate
tectonics is a staple of science instruction, as evidenced by its frequent appearance in
secondary science textbooks. A few students confirmed, during the focus group
interviews, that they already had some familiarity with the story from past
instruction, while none were aware of the pellagra story. It is not unconceivable,
then, that students might already possess some awareness of the factual or
explanatory nature of the statements included in the W test form.
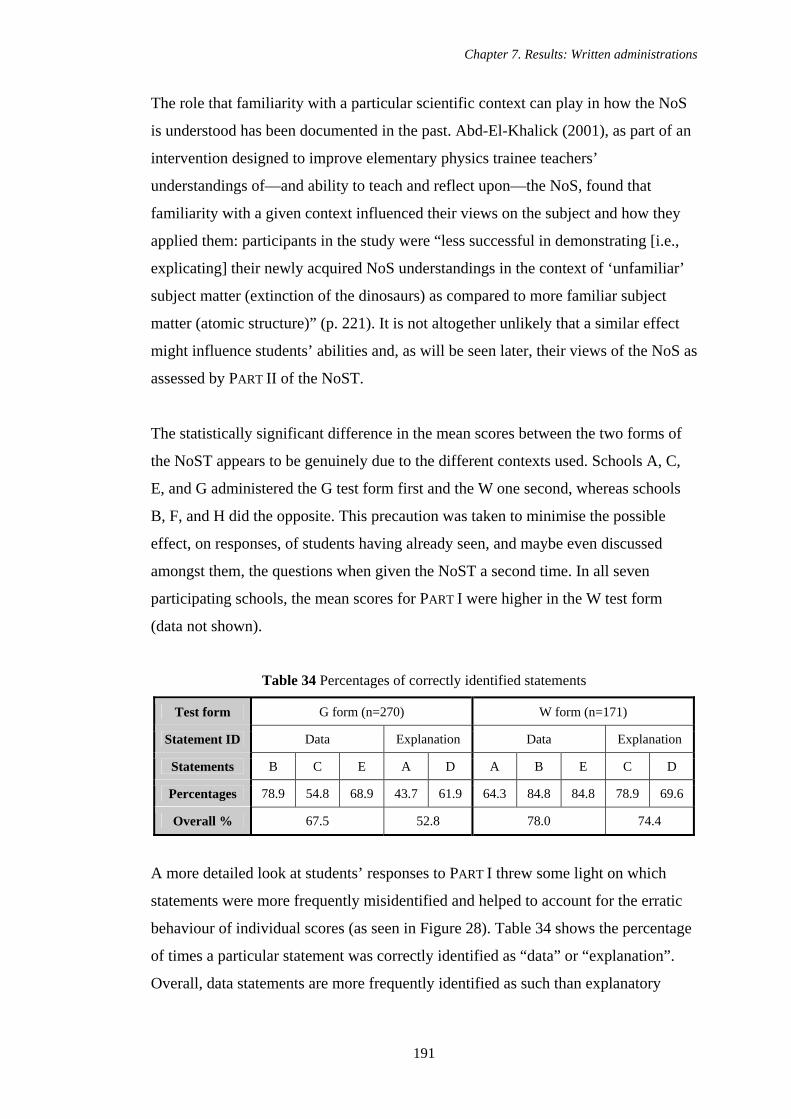
Chapter 7. Results: Written administrations
191
The role that familiarity with a particular scientific context can play in how the NoS
is understood has been documented in the past. Abd-El-Khalick (2001), as part of an
intervention designed to improve elementary physics trainee teachers’
understandings of—and ability to teach and reflect upon—the NoS, found that
familiarity with a given context influenced their views on the subject and how they
applied them: participants in the study were “less successful in demonstrating [i.e.,
explicating] their newly acquired NoS understandings in the context of ‘unfamiliar’
subject matter (extinction of the dinosaurs) as compared to more familiar subject
matter (atomic structure)” (p. 221). It is not altogether unlikely that a similar effect
might influence students’ abilities and, as will be seen later, their views of the NoS as
assessed by PART II of the NoST.
The statistically significant difference in the mean scores between the two forms of
the NoST appears to be genuinely due to the different contexts used. Schools A, C,
E, and G administered the G test form first and the W one second, whereas schools
B, F, and H did the opposite. This precaution was taken to minimise the possible
effect, on responses, of students having already seen, and maybe even discussed
amongst them, the questions when given the NoST a second time. In all seven
participating schools, the mean scores for PART I were higher in the W test form
(data not shown).
Table 34 Percentages of correctly identified statements
Test form G form (n=270) W form (n=171)
Statement ID Data Explanation Data Explanation
Statements B C E A D A B E C D
Percentages 78.9 54.8 68.9 43.7 61.9 64.3 84.8 84.8 78.9 69.6
Overall % 67.5 52.8 78.0 74.4
A more detailed look at students’ responses to PART I threw some light on which
statements were more frequently misidentified and helped to account for the erratic
behaviour of individual scores (as seen in Figure 28). Table 34 shows the percentage
of times a particular statement was correctly identified as “data” or “explanation”.
Overall, data statements are more frequently identified as such than explanatory
Chapter 7. Results: Written administrations
192
ones. On average, data statements from both test forms were correctly identified
72.7% of the time, whereas explanatory ones only 63.6%.
The slightly better performance of students in the W test form is also evident in the
percentages of individual statements identified. Statements B, C, E, and D from the
W form have the highest rates of correct identifications, matched only by a single
one from the G form (Statement B with 78.9%). Tellingly, Statements A and C from
the G test form were the ones more frequently misidentified (with only 43.7 and
61.9% of correct identifications, respectively). The effect of the context is thus
apparent also at the level of individual statements.
Apart from the noticeable unevenness in students’ overall ability to discriminate
between data and explanations, there is also considerable variability in their ability to
identify statements of the same kind. For instance, in the G test form, Data Statement
B was correctly identified 78.9% of the times, whereas Data Statement C was only
identified 54.8%. Something similar can be seen within the W test form.
Some comments made in the focus groups lead one to speculate about why some
statements were harder or easier to identify. In the case of statement A in the G form
(“Typhus an yellow fever are caused by microbes”), a few students thought that, in
the story they had read, scientists were not interested in studying the microbial
origins of those diseases; rather, they had used that piece of knowledge as
preliminary or introductory information from which to draw conclusions about
pellagra: “[it] is a datum that [doctors] obtained to draw conclusions about the new
disease” (student 1A); “that’s information about typhus and yellow fever, it’s just a
pointer; it if were an explanation, [the authors] would develop an argument about
what causes the disease” (student 4A). In this case, the position of the statement at
the beginning of the story and the argument might have influenced students to think
of it as data.
Difficulty in identifying data and inferences has been reported by previous
researchers. For example, Abd-El-Khalick (2001) reported how elementary science
majors had trouble recognising “the inferential and theory-laden nature of scientific
constructs and claims” and could not explicate “the crucial distinction between
Chapter 7. Results: Written administrations
193
inference and observation, or between a claim and the evidence supporting that
claim” (p. 222). In a subsequent study (2005), Abd-El-Khalick reported similar
findings—the difficulty to distinguish between a claim and the evidence that supports
it—in undergraduate and graduate preservice secondary teachers.
The same student incorrectly claimed that statement C (“Many orphans and mental
patients quickly recover after having milk”) was an example of an “explanation”,
since the therapeutic effects of milk had not been discovered. As such, for this
student the effects of milk were the target of the research: “[the disease] hadn’t been
studied previously, so its causes and its cure were unknown. […] The doctor is
giving a reason for why the patients recovered: because they drank milk”. It appears
that, for some students, what is already known (including well-supported
explanations) is data, and what is newly discovered must be an explanation. The fact
that the experiment strongly suggests that milk has something to do with preventing
pellagra might have also led some students to confuse the statement for an
explanation, when all it is saying is that patients got better after drinking milk; that
milk prevents or cures pellagra is the explanatory inference drawn from that data.
In the case of Statements B and E in the W test form, focus groups offered no easily
discernible reason for why students found them the easiest to classify in both test
forms, other than the fact that both “Some rocks and fossils on the East coast of
South America match those on the West coast of Africa” and “There are stripes of
rock of the same age on either side of the mid-Atlantic ridge” do not strongly suggest
an explanation of why something might happening, like Statement C in the G form
does.
On the whole, it seems students find it harder to identify explanatory statements. This
finding is supported by data from the focus groups suggesting that students’ find it
somewhat harder to define what an explanation is and how is it different from the
data. Leach (1996) noted a similar situation in the United Kingdom, in students of
the same age range as those that participated in this study: “By the end of
compulsory science education in the UK, it appears that the epistemological
reasoning drawn upon by young people in contexts familiar from their science
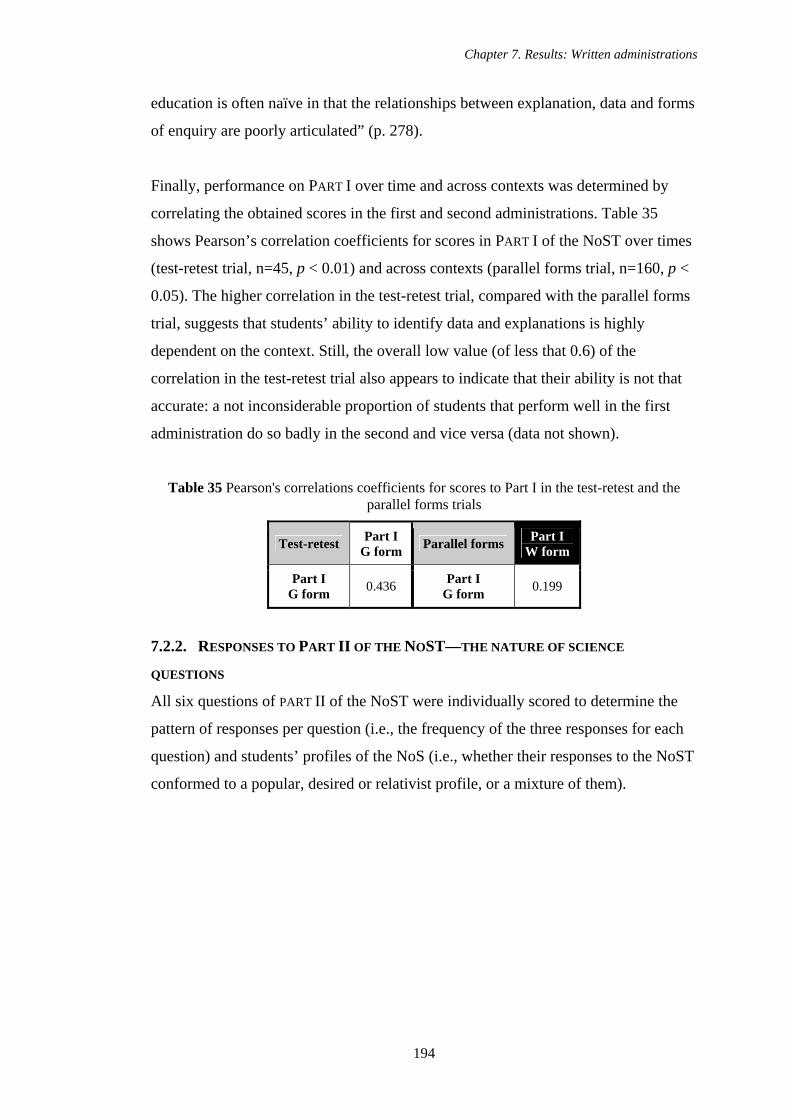
Chapter 7. Results: Written administrations
194
education is often naïve in that the relationships between explanation, data and forms
of enquiry are poorly articulated” (p. 278).
Finally, performance on PART I over time and across contexts was determined by
correlating the obtained scores in the first and second administrations. Table 35
shows Pearson’s correlation coefficients for scores in PART I of the NoST over times
(test-retest trial, n=45, p < 0.01) and across contexts (parallel forms trial, n=160, p <
0.05). The higher correlation in the test-retest trial, compared with the parallel forms
trial, suggests that students’ ability to identify data and explanations is highly
dependent on the context. Still, the overall low value (of less that 0.6) of the
correlation in the test-retest trial also appears to indicate that their ability is not that
accurate: a not inconsiderable proportion of students that perform well in the first
administration do so badly in the second and vice versa (data not shown).
Table 35 Pearson's correlations coefficients for scores to Part I in the test-retest and the parallel forms trials
Test-retest Part I G form Parallel forms Part I
W form
Part I G form 0.436 Part I
G form 0.199
7.2.2. RESPONSES TO PART II OF THE NOST—THE NATURE OF SCIENCE
QUESTIONS
All six questions of PART II of the NoST were individually scored to determine the
pattern of responses per question (i.e., the frequency of the three responses for each
question) and students’ profiles of the NoS (i.e., whether their responses to the NoST
conformed to a popular, desired or relativist profile, or a mixture of them).
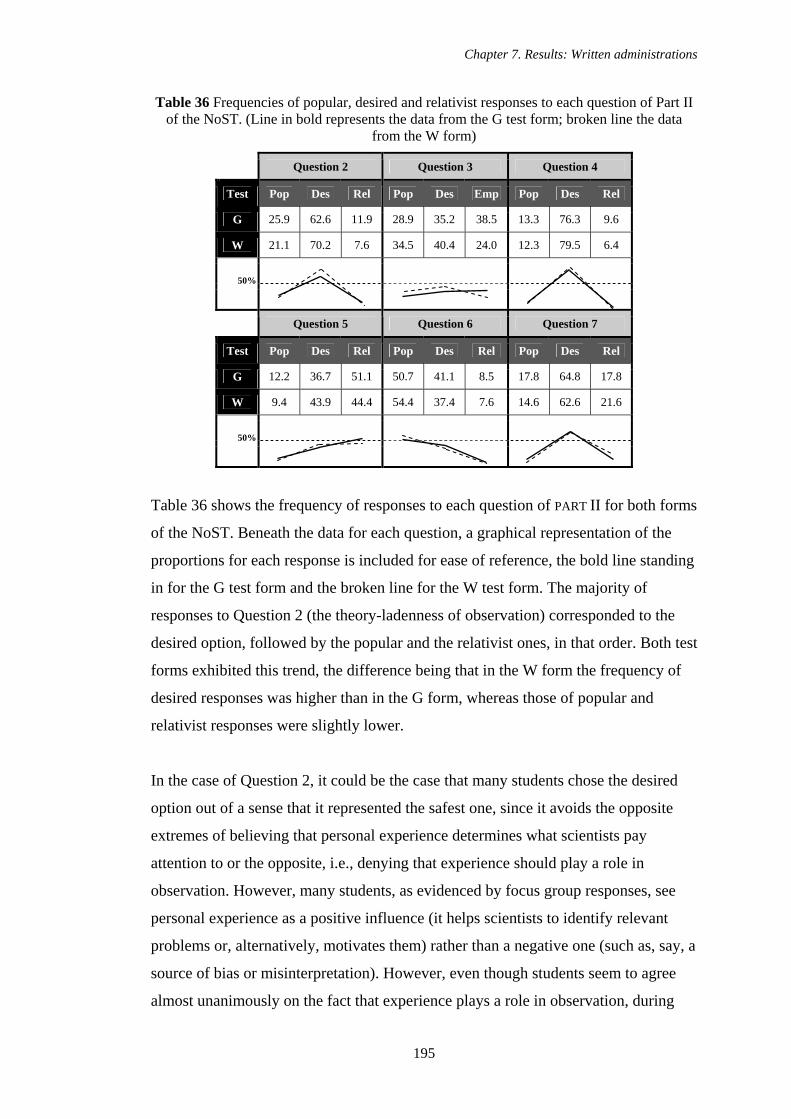
Chapter 7. Results: Written administrations
195
Table 36 Frequencies of popular, desired and relativist responses to each question of Part II of the NoST. (Line in bold represents the data from the G test form; broken line the data
from the W form)
Question 2 Question 3 Question 4
Test Pop Des Rel Pop Des Emp Pop Des Rel
G 25.9 62.6 11.9 28.9 35.2 38.5 13.3 76.3 9.6
W 21.1 70.2 7.6 34.5 40.4 24.0 12.3 79.5 6.4
50%
Question 5 Question 6 Question 7
Test Pop Des Rel Pop Des Rel Pop Des Rel
G 12.2 36.7 51.1 50.7 41.1 8.5 17.8 64.8 17.8
W 9.4 43.9 44.4 54.4 37.4 7.6 14.6 62.6 21.6
50%
Table 36 shows the frequency of responses to each question of PART II for both forms
of the NoST. Beneath the data for each question, a graphical representation of the
proportions for each response is included for ease of reference, the bold line standing
in for the G test form and the broken line for the W test form. The majority of
responses to Question 2 (the theory-ladenness of observation) corresponded to the
desired option, followed by the popular and the relativist ones, in that order. Both test
forms exhibited this trend, the difference being that in the W form the frequency of
desired responses was higher than in the G form, whereas those of popular and
relativist responses were slightly lower.
In the case of Question 2, it could be the case that many students chose the desired
option out of a sense that it represented the safest one, since it avoids the opposite
extremes of believing that personal experience determines what scientists pay
attention to or the opposite, i.e., denying that experience should play a role in
observation. However, many students, as evidenced by focus group responses, see
personal experience as a positive influence (it helps scientists to identify relevant
problems or, alternatively, motivates them) rather than a negative one (such as, say, a
source of bias or misinterpretation). However, even though students seem to agree
almost unanimously on the fact that experience plays a role in observation, during
Chapter 7. Results: Written administrations
196
the focus groups many students commented that, even though the personal
experience of scientists is helpful and influences what they pay attention to, scientists
also must keep an open mind to avoid being subjective. These nuances in students’
thinking are not captured by responses to this question of the NoST.
In contrast with the above findings, in a study of pre-service elementary teachers’
views of the NoS Abell (2001) found that few trainee teachers made reference to the
fact that “observations are not objective, but are guided by the ideas scientists bring
to an investigation” (p. 1100). Abd-El-Khalick (2001) found something similar in the
case of preservice elementary teachers: 40% of the participants in his study exhibited
naïve views about the theory-ladenness of observations, claiming that observations
are “based on givens perceived by the senses, and which therefore do not have any
personal input” (p. 221). Additionally, Lederman et al. (2002) compared the
understanding of the NoS of experts (people with PhDs in science education or
history and philosophy of science) versus non-experts (people with PhDs in
American literature, history, and education in general), and discovered that, whereas
experts responded to an astronomical controversy making references to differences in
the interpretation of observations due to “scientists’ different backgrounds and
training” (p. 508), non-experts made references to inadequacies and/or differences in
the data astronomers had. According to Lederman et al., such an objectivist view of
science fails to consider the role played by “scientists’ educational backgrounds,
training, philosophical perspectives, theoretical commitments, personal experiences,
and beliefs” (idem). Finally, similar results to those of Lederman et al. have been
reported by Abd-El-Khalick (2005), who found that only a minority of trainee
teachers (17.9% of his sample) appreciated the theory-ladenness of observations,
explaining away scientific controversies as a product of the scarcity of data, not of
scientists’ prior knowledge.
In spite of all these findings, in the case of the NoST interviews with students
suggest that they were aware of the role of scientists’ personal background in
science, and the high proportion of students that chose the desired option is not a
fluke due to the test.
Chapter 7. Results: Written administrations
197
Responses to Question 3 (the role of imagination in coming up with explanations)
diverge starkly from those observed in the previous question. In both test forms, all
three answer options had a somewhat similar frequency (25% to 40%), at least
compared with the other questions. Question 3 is also the only one where the
patterns, or trends, across test forms are not parallel to each other: in the G form, the
empiricist option is more frequent than the desired, the opposite of what happens on
the W form.
The difference between responses to Questions 2 and 3 may be significant, given that
both personal experience and imagination are interrelated: they both introduce an
important element of subjectivity to scientific research. Students, however, seem to
keep separate these two aspects of the NoS in their picture of how science works,
appearing more willing to concede a role for personal experience than for
imagination in scientific research.
The apparently divided opinion within the student sample about the role of
imagination in coming up with explanations, as evidenced by the rather similar
proportions of responses allocated to all three options, agrees with written comments
and focus group responses: many students emphasised—in writing and in
conversation—their belief that imagination, together with either reason and/or
enough data, is an essential ingredient when scientists try to come up with an
explanation. Students had lively discussions about their disagreements on this issue,
owing to uncertainty about the extent to which imagination participates in the
explanatory process. Furthermore, this is the question on which most written
comments were made in the test form booklet to clarify students’ view that data
and/or logic and imagination are key ingredients of explanations.
A null or limited role of imagination and creativity in science accords with the
literature on the subject. According to Abd-El-Khalick (2001; 2005), Abell (2001)
and Lederman et al. (2002), only a minority of people think of science as a creative
endeavour and of scientists as professionals involved in the invention of “constructs,
models, theories, and explanations” (Lederman et al., 2002, p. 223) and, when they
do concede a role for imagination, it is usually limited to making conjectures before
employing the objectivity-driven scientific method.
Chapter 7. Results: Written administrations
198
The proportions of responses to Question 4 (the character of the scientific method)
echo those to Question 2, although the proportions of popular and relativist
responses, compared with desired ones, in both test forms, are considerably lower
than those seen in Question 2. Notably, there is little difference between the
proportions of all three options across test forms: in this particular question, the
effect of the context appears to be almost negligible. The almost undivided support
of the idea that, even though scientific investigations do not all follow the same
series of steps, there are some principles that scientists do follow might be due to
successful instruction about the topic. Alternatively, this option could have been
identified as the safest one by students.
McComas (1998) identified the idea of a general and universal scientific method as
one the most pervasive myths about science, amply disseminated throughout science
textbooks. Contrary to issues such as the theory-ladenness of observation or the
underdetermination of theory by data, the idea of an algorithmic scientific method
could be easier to dispel through explicit instruction. There are also plenty of
examples teachers can draw upon to clarify the issue: physicists, chemists, and
biologists clearly do not follow the same steps, or techniques, in their respective
work, but all of them attempt to test their ideas against data obtained, either through
observation or experiment, from the world. Given the results shown in Table 36, it
could be hypothesised, for example, that the crucial role of imagination in the genesis
of scientific explanations has received less attention as a desired educational outcome
than an understanding of the scientific approach to inquiry.
Still, some comments made during the focus groups cast some doubt on how well
students understand the character of the scientific method. When asked about the
difference between “principles” and “steps” of the scientific method, few students
were able to articulate this difference. Their responses centred on the fact that steps
have to be followed in strict sequence, without omitting any one, whereas
“principles” do not necessarily follow a prescribed sequence and, in some cases, may
be omitted. Furthermore, when asked for examples of “steps” and “principles” to
clarify their views, students tended to mention the same things as examples of both:
fair tests, control of variables, hypotheses, observations, experiments, conclusions.
Chapter 7. Results: Written administrations
199
At this point, students agreed that reaching a conclusion, even though they had cited
it as an example of a “principle” of the scientific method, cannot be omitted from, or
be the starting point of, a scientific enquiry. Likewise, according to students,
observations and experiments are usually preceded by hypotheses. Thus, students’
notions of “step” and “principle” often clashed with the examples they provided.
Few students thought of the scientific method as a continuous process of creatively
coming up with explanations and subjecting them to tests against data obtained from
the world, particularly through deducing consequences out from those explanations
(i.e., making predictions) and seeing if they agree with observation or not. The idea
of a single, universal, orderly, and step-wise scientific method appears to be, still,
part of individuals’ understanding of science (Abd-El-Khalick, 2001; Lederman et
al., 2002). A scarce understanding of what is the scientific method, like that exhibited
by the students that participated in the focus groups, agrees with Moss, Abrams, and
Robb’s (2001) finding that pre-college students have more complete understandings
of the “nature of scientific knowledge” than of the “nature of the scientific
enterprise” (p. 776).
Question 5 (the underdetermination of theory by data) is the only one where the
relativist option accounts for more responses (around half of them) than the other two
individually. The positive effect of the context of the W test form is also apparent in
this question. The relativist response summarises a highly individualistic situation:
every scientist—given the same data—will come up with a different explanation.
The preponderance of this answer option contrasts markedly with the results in
Question 3, where a high proportion of students either chose that explanations are
reasoned from the data or that they emerge from the accumulation of it. How can
each scientist come up with his or her own explanation, as Question 5 proposes, if it
follows logically from the data and imagination plays no role in the process? This
incongruity suggests that students’ views are not well thought through, that their
views might not be coherent enough. Imagination, as the source of explanations,
would seem to be the best and most reasonable way to explain the existence of a
plurality of explanations that account for the same data.
Chapter 7. Results: Written administrations
200
A possible confounding factor in the interpretation of the multiple-choice responses
was revealed thanks to the focus groups: some students did not address the main
thesis of the answer options, i.e., whether data can determine a single, unequivocal
explanation. Some students rather focused on whether scientists will agree or
disagree on what the correct explanation should be. Some students claimed that all
scientists should always agree, in the end, on the right explanation, no matter how
many are initially on offer. Others thought that some scientists will never agree with
an explanation, even if it is the only one available—these students saw disagreement
as part of human nature. Unexpectedly, some students managed to combine the
extreme views about underdetermination of explanation by data in a single argument:
given the same set of data, all scientists will come with their own, different,
explanations but, in the end, the best parts of the multitude explanations will be
pieced together to come up with the best one.
Question 6 (the best grounds for acceptance of a theory) of the NoST also exhibits a
unique pattern of responses: taken individually, the popular response predominates
over the desired and the relativist ones. As in Question 3 (Table 36), there were more
popular responses to the W test form than to the G form, and fewer desired
responses. Question 6 is the only one where the popular response predominates over
the desired one. These results tend to agree with the responses given to Question 3,
where data were seen, on the whole, as the source of explanations.
Results from Question 6 mirror the conflict students appeared to suffer—as
evidenced in written comments and focus groups—when trying to decide on which
were the best grounds for belief in an explanation: whether it can be reasoned from
the data or whether predictions derived from it are confirmed. Some students ended
up choosing both. Even though the two of them are good reasons for belief, the
testing of predictions produces stronger evidence in favour of a given theory: nature
cannot be coaxed into satisfying predictions, whereas explanations can more easily
be created, or modified, to fit the evidence logically—even falsifying evidence.
A possible way to account for the comparatively smaller proportion of desired
responses (against popular ones) arose in the focus groups conducted in Mexico: for
some students, the word “prediction” carries a negative connotation, since it is
Chapter 7. Results: Written administrations
201
closely associated with the predictions made by astrologers in horoscopes. This
connotation was, however, not explicitly found in English students. Even so,
interviewed students in England showed a clear distrust of predictions that come true
when the theory from which they are deduced has a pseudoscientific, or absurd, ring
to it or just sounds too implausible to be true.
The low frequency of relativist responses to this question suggests that most students
do not believe that consensus is a strong reason for believing in an explanation, even
though, from their focus group responses, it is clear many believe that science is a
democratic enterprise, in the sense that it allows (or must allow) the airing of, and
respect for, diverging opinions. Curiously enough, from their school experience,
students are accustomed to accepting scientific ideas on the grounds that scientists on
the whole believe them to be true—or at least likely to be true. Nevertheless, this fact
seems not to predispose them unduly to think of consensus as a criterion for
justifying belief. Alternatively, perhaps students believe (maybe even explicitly) that
there has to be a reason for consensus, and that this reason is the empirical evidence.
In Question 7 (the tentativeness of scientific explanations), the number of popular
and relativist responses roughly matched one another. Similarly to Questions 2 and 4
(Table 36), students might have been attracted to the desired option (explanations
may need to be improved in the future) because it represents something of a middle
ground between the popular (true explanations will not need to be replaced in the
future) and the relativist (all explanations will be replaced in the future) positions.
Like in the present study, Abd-El-Khalick (2001) and Liang et al. (2008) found that a
majority (or close to one) of participants in their respective studies recognised that
scientific knowledge is tentative. In the first, 77% of participants acknowledged that
scientific theories eventually change because new discoveries are made, thanks to
advances in technology. In the latter, 40 to 52% of views about the tentativeness of
scientific knowledge were informed views. Furthermore, Moss et al. (2001) found, in
a study of pre-college students’ (a sample similar to that of this study) views of the
NoS, that students
Chapter 7. Results: Written administrations
202
described scientific knowledge as more than tentative or merely changing over time, but also as developmental in nature. This understanding that most science knowledge changes by building upon previous work further illustrates the extent of participants’ mature beliefs about the tentative nature of knowledge itself (p. 786).
This view—that scientific knowledge builds upon existing knowledge—is the exact
same view given by many students in the focus groups conducted as part of this
study in response to discussion about the issue raised by Question 7.
The results of the present study, together with those of Abd-El-Khalick (2001), Moss
et al. (2001), and Liang et al. (2008), contrast with those of Meichtry (1993) and
Rubba (1977, cited in Moss et al., 2001), who found, respectively, that students did
not have an adequate enough knowledge of the nature of scientific knowledge to
understand that it is tentative in nature and that it does not constitute absolute and
incontrovertible truth.
The preponderance of desired responses to Question 7 might not be as unambiguous
as it appears, though; focus groups revealed that some students claimed equivocally
that explanations are constantly improved from previous ones rather than replaced by
new ones. As a case in point, students mentioned that the Copernican theory did not
replace the Ptolemaic one, but rather that Copernicus (or Galileo) just took Ptolemy’s
theory and inverted the position of the Earth and the Sun. This view ignores the
multiple changes in the physical framework (for instance, due to Galileo’s
conception of inertia) that were needed to accommodate Copernicus’s theory.
However, given the depth of knowledge expected of a 16-year old student about that
particular historical episode, the notion that Copernicus adapted Ptolemy’s theory is
not quite so far-fetched, even if this particular episode is a canonical example of a
scientific revolution. The case could be made that many new theories have arisen out
of competition with existing ones, keeping some ideas and concepts in common (in
contrast with Kuhn’s strict notion of incommensurability among paradigms).
Laudan’s idea of “research traditions” acknowledges the possibility—denied by
Kuhn’s strict formulation of “paradigm”—of there being movement of theoretical
ideas in and out of a research tradition’s hard core. Moreover, theories can separate
Chapter 7. Results: Written administrations
203
from one research tradition and become incorporated into others. A common
example cited in this respect is the absorption of Carnot’s thermodynamic ideas,
initially developed within a research tradition that understood heat as a fluid (the so-
called “caloric”), into a rival tradition that understood heat as a result of the motion
of particles of matter (Godfrey-Smith, 2003, p. 108).
Even though many students appeared to believe that explanation comes from data,
and personal experience and imagination should have little or no influence on the
process, they nevertheless seem to agree with the view that explanations are fallible
and amenable to revision. However, data from focus groups suggests that many
students believe that scientists will most likely discover new facts that will require
the improvement of theories. This rationale is consistent with an idea of data as a
constraint on explanations. These students, however, frequently fail to mention that,
given a previously unknown observation, creative insight on the part of scientists is
indispensable for theory change. Likewise, reinterpretation of existing, well-known
data can lead to the proposal of a new, opposing theory (such as Lavoisier’s
reinterpretation of the data accounted for by the theory of phlogiston in terms of
combustion with oxygen).
From the foregoing analysis, one of the most remarkable findings is the extent to
which an overall view can mask students’ views about particular aspects of the NoS.
Scrutiny of responses to individual questions offers the opportunity to detect which
aspects are less well understood by students, while also helping to uncover
underlying incoherence in students’ understanding about science. These
incoherencies are not predictable a priori and, at this point, accounting for their
causes is speculative at best. The somewhat incoherent understanding of the NoS
exhibited by students’ responses calls attention to the fact that, to boast a desired
understanding of the NoS, it is not enough to exhibit desired views of some of the
aspects probed: a coherent picture is equally important.
The most noteworthy incoherencies identified among views of the NoS were the
following:
Chapter 7. Results: Written administrations
204
1. 60% to 70% of students agreed that personal experience should play a role in
what scientists observe, but more than half also agreed that the source of
scientific explanations is data, either to reason an explanation or for one to
emerge. Acknowledging the subjective (and positive) influence of personal
experience in scientific enquiry does not fit comfortably with an empiricist or
inductivist stance that glosses over the subjectivity implicit in coming up with
explanations. In contrast to the two thirds of students that acknowledged the
role played by personal experience, only a third of students conceded a role
for imagination in coming up with an explanation for the data.
2. Around half of students agreed with the position that each scientist can come
up with his or her own explanation (almost 90% chose that there can be more
than one explanation for the same data), but only a third allowed a role for
imagination in the process of coming up with an explanation.
Underdetermination of theory by data rests on the notion that there is not a
unique explanation that is logically determined by the data. As the history of
science shows, scientists can imagine alternative, competing theories—each
with its own set of conceptual entities and mechanisms—that explain the
same phenomena. Creativity presupposes, to some degree,
underdetermination, since data alone are not enough to deduce a theory.
3. 60% to 70% of students chose that explanations stem from the data (either
through reason or through an inductivist accumulation of data), whereas only
10% agreed with the notion that scientists will reach and agree on a single
correct explanation for a given set of data. If logic—either through deduction
or induction—is invoked as the intermediary between data and explanation,
there can be no room for several, or a lot, of explanations for the same
phenomenon.
4. The high proportion of students that agreed that explanations come from the
data, and the 50% that chose that the best explanation is the one that is
reasoned from the data, contrast with the relatively small proportion (less
than 20%) that held that an explanation will not be replaced once it has been
tested and judged to be true. Why would a true theory change or be replaced
it if it has been deduced, and is backed by, a body of data? Furthermore, it is
quite common that new theories stem from clever and creative thinking on
the part of scientists, and not exclusively from the discovery of new data. A
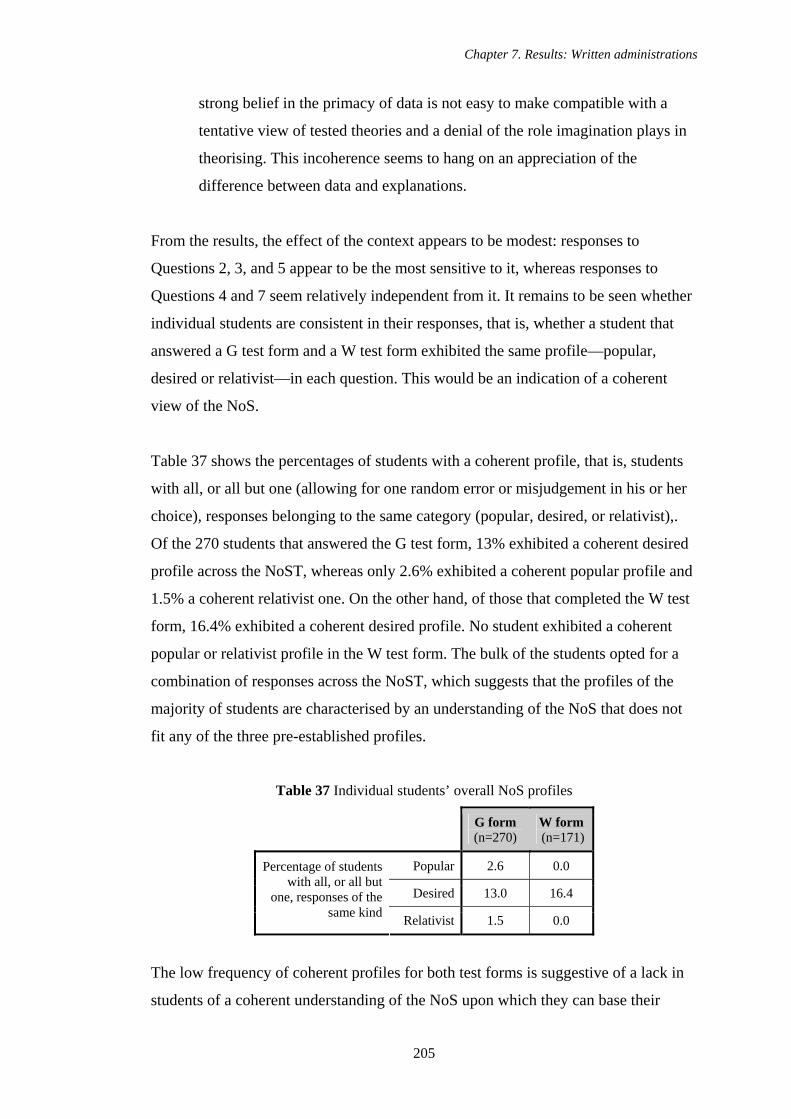
Chapter 7. Results: Written administrations
205
strong belief in the primacy of data is not easy to make compatible with a
tentative view of tested theories and a denial of the role imagination plays in
theorising. This incoherence seems to hang on an appreciation of the
difference between data and explanations.
From the results, the effect of the context appears to be modest: responses to
Questions 2, 3, and 5 appear to be the most sensitive to it, whereas responses to
Questions 4 and 7 seem relatively independent from it. It remains to be seen whether
individual students are consistent in their responses, that is, whether a student that
answered a G test form and a W test form exhibited the same profile—popular,
desired or relativist—in each question. This would be an indication of a coherent
view of the NoS.
Table 37 shows the percentages of students with a coherent profile, that is, students
with all, or all but one (allowing for one random error or misjudgement in his or her
choice), responses belonging to the same category (popular, desired, or relativist),.
Of the 270 students that answered the G test form, 13% exhibited a coherent desired
profile across the NoST, whereas only 2.6% exhibited a coherent popular profile and
1.5% a coherent relativist one. On the other hand, of those that completed the W test
form, 16.4% exhibited a coherent desired profile. No student exhibited a coherent
popular or relativist profile in the W test form. The bulk of the students opted for a
combination of responses across the NoST, which suggests that the profiles of the
majority of students are characterised by an understanding of the NoS that does not
fit any of the three pre-established profiles.
Table 37 Individual students’ overall NoS profiles
G form (n=270)
W form (n=171)
Popular 2.6 0.0
Desired 13.0 16.4
Percentage of students with all, or all but
one, responses of the same kind Relativist 1.5 0.0
The low frequency of coherent profiles for both test forms is suggestive of a lack in
students of a coherent understanding of the NoS upon which they can base their
Chapter 7. Results: Written administrations
206
views. Even though the relatively higher frequency of desired profiles, compared
with the number of popular and relativist ones, is an educationally encouraging
outcome, the widespread lack of coherency of students’ views to some extent
undermines this finding. Importantly, there also appears to be a slight effect of the
context on students’ profiles, as suggested by the higher frequency of desired profiles
and the lower frequency of popular and relativist ones in the W test form, compared
with the G form. Again, familiarity with the Wegener story might account for some
of this effect.
The greater frequency of a coherent desired profile than either of the alternatives
(Table 37) parallels the pattern of answer options chosen in response to each of the
questions individually (Table 36). In four of the questions (2, 3, 4, and 7) the desired
response has the highest frequency of responses (or shares the highest frequency, as
is the case in Question 3 of the G form), with rather small differences between the G
and W test forms. In this sense, in four of the questions (2, 3, 4, and 5) the W form
accumulated more desired responses than the G form. This finding is consistent with
the possible context effect seen in PART I of the NoST, where students completing
the W test form performed better (Figure 28; Table 34).
This apparent correspondence between better performances, albeit slightly, in PART I
and more desired responses in PART II of the W test form invites the question of
whether there could be a link between the ability to discriminate between data and
explanations and the maturity of students’ understanding of the NoS. The issue will
be explored further in Section 7.2.3, below.
Incoherent views of the NoS have been a common finding of previous efforts to
assess individuals’ views of the NoS. For example, Koulaidis and Ogborn (1989)
found that, of a sample of teachers, 60% had more or less identifiable philosophical
views, with chemistry teachers being more prone to have “eclectic” views and
physics teachers showing the greatest commitment to a particular philosophical
position. Like in the results of Questions 2, 4, and 7 of the NoST, “both relativism
and hypothetico-deductivism appear to get scant support [and nor] is inductivism
very popular” (p. 176).
Chapter 7. Results: Written administrations
207
Lederman and O’Malley (1990), while attempting to validate the first version of the
VNOS, discovered that
students, as a group, do not uniformly adhere to either an absolute or tentative view of scientific knowledge. That is, responses to questions two and three [of the VNOS-A] strongly favoured an absolutist view [i.e., scientific knowledge will not change] while the responses to questions one and four were more aligned with a tentative view. This might indicate that it is possible for students to compartmentalize their views with respect to the type of scientific knowledge or it could simply indicate that students are in a state of transition (p. 229).
This behaviour is strongly reminiscent of the patterns of students’ responses within
the NoST (Table 36).
Moss et al. (2001) discovered that pre-college students’ beliefs about the NoS were,
at times, sophisticated and, at others, less so. They argued that such inconsistencies
were “to be expected given human nature, particularly in adolescents” (p. 787).
Echoing the above, Abd-El-Khalick (2001) noted, in a study of an intervention
designed to improve trainee teachers views of the NoS, that “even though the naïve
views of 60% of participants were consistent with a ‘scientistic’ worldview, the
conceptions of many others were inconsistent and compartmentalized [i.e.,]
participants expressed informed views of three or four of the six target NoS aspects,
but elucidated naïve views of the remaining aspects. Indeed, only 3 of 30 participants
expressed informed views of all six NoS aspects” (p. 224).
Finally, Brown, Luft, Roehrig, and Kern (2006) also found that beginning science
teachers “exhibited mixed and contradicting perspectives of NoS [whereas]
experienced teachers […] exhibited more consistent results” (no page). Similar
inconsistencies have also been found in Turkey (Bora et al., 2006) and China (Zhang
et al., 2003).
7.2.3. CORRELATION BETWEEN RESPONSES TO PART I AND PART II OF THE NOST
Is there a relationship between the ability to identify data statements from
explanatory ones and understanding of the NoS? Do students that perform well in
PART I of the NoST also select desired responses in PART II? Ideally, a nuanced and
Chapter 7. Results: Written administrations
208
developed understanding of the NoS would be accompanied by, and grounded in, a
clear notion of what data and explanations are and the ability to distinguish one from
the other. A lack of practical understanding of their different characters would
certainly call into question the veracity of opting for a desired response in any of the
questions of PART II. For example, how believable is the view that explanations are
invented, rather than discovered, when held by someone that cannot properly
distinguish an example of data from an explanation?
Having calculated the overall scores for PART I and partial scores for PART II, it is
worth examining whether there is any relationship between the scores of both parts.
Underlying the perspective on the NoS—as defined in the NoST framework—is the
idea that scientific thinking is, essentially, a matter of proving and assessing
explanations (or theories) by considering the match between predictions—based on
theories—and observations. In its turn, this assessment is based on the fact that data
and models—being inferences—are to some degree different, since the former result
from an active interaction with the world (i.e., purposeful observation or
experimentation) whereas the latter are a product of the scientist’s intuition,
reasoning and imagination. Being able to distinguish between data and inferences is
thus an indispensable requirement, from a scientific literacy standpoint, of a nuanced
and functional view of the NoS. There is little point in understanding, for instance,
that the scientific method is a general strategy for testing inferred theories, models or
laws against observations of the real world if one cannot distinguish a piece of data
from an inference. Likewise, it is well and good to believe that scientific
explanations are tentative, but if one cannot identify an explanation when presented
with one, the belief is useless—and perhaps a result of rote learning of the NoS.
According to this rationale, it could be hypothesised that students that perform well
on PART I of the NoST would do so in PART II and vice versa—there should be a
correlation between PARTS I and II. However, given the different kinds of
performance that each part evaluates—ability versus knowledge—it may well be the
case that students are able to correctly classify the statements without possessing
desired views of the NoS or, on the contrary, fail to classify the statements but
exhibit adequate views of the NoS.
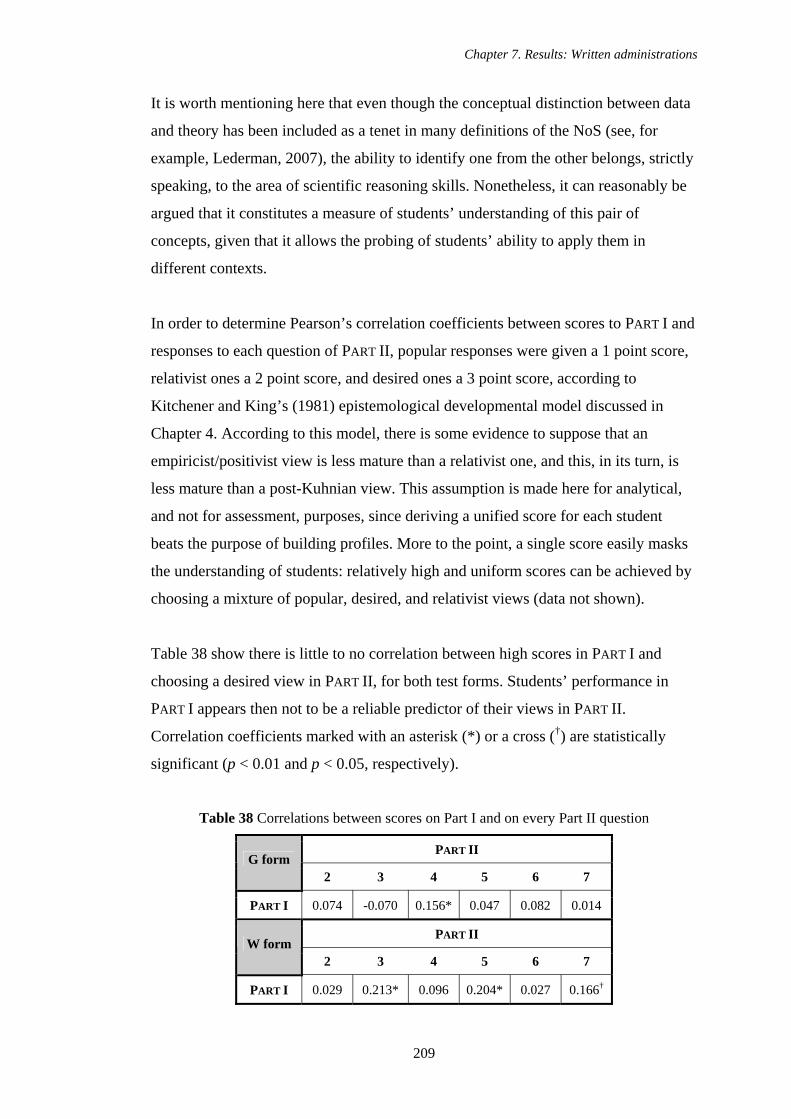
Chapter 7. Results: Written administrations
209
It is worth mentioning here that even though the conceptual distinction between data
and theory has been included as a tenet in many definitions of the NoS (see, for
example, Lederman, 2007), the ability to identify one from the other belongs, strictly
speaking, to the area of scientific reasoning skills. Nonetheless, it can reasonably be
argued that it constitutes a measure of students’ understanding of this pair of
concepts, given that it allows the probing of students’ ability to apply them in
different contexts.
In order to determine Pearson’s correlation coefficients between scores to PART I and
responses to each question of PART II, popular responses were given a 1 point score,
relativist ones a 2 point score, and desired ones a 3 point score, according to
Kitchener and King’s (1981) epistemological developmental model discussed in
Chapter 4. According to this model, there is some evidence to suppose that an
empiricist/positivist view is less mature than a relativist one, and this, in its turn, is
less mature than a post-Kuhnian view. This assumption is made here for analytical,
and not for assessment, purposes, since deriving a unified score for each student
beats the purpose of building profiles. More to the point, a single score easily masks
the understanding of students: relatively high and uniform scores can be achieved by
choosing a mixture of popular, desired, and relativist views (data not shown).
Table 38 show there is little to no correlation between high scores in PART I and
choosing a desired view in PART II, for both test forms. Students’ performance in
PART I appears then not to be a reliable predictor of their views in PART II.
Correlation coefficients marked with an asterisk (*) or a cross (†) are statistically
significant (p < 0.01 and p < 0.05, respectively).
Table 38 Correlations between scores on Part I and on every Part II question
PART II G form
2 3 4 5 6 7
PART I 0.074 -0.070 0.156* 0.047 0.082 0.014
PART II W form
2 3 4 5 6 7
PART I 0.029 0.213* 0.096 0.204* 0.027 0.166†
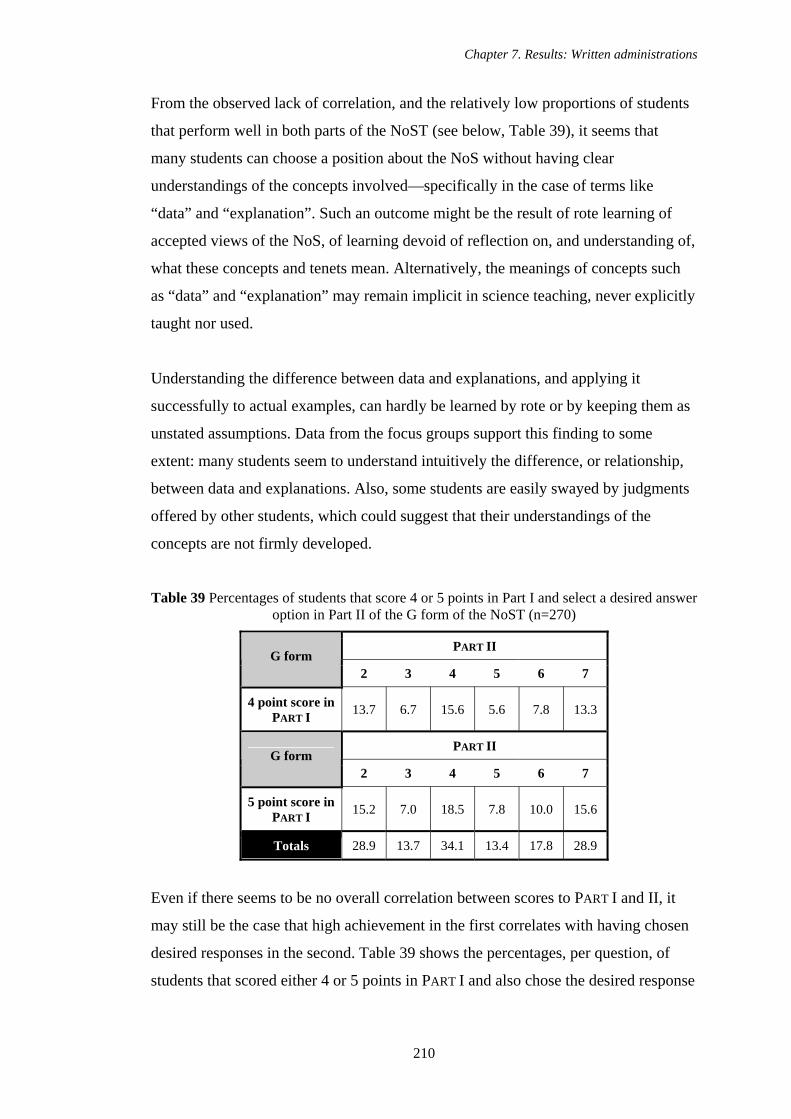
Chapter 7. Results: Written administrations
210
From the observed lack of correlation, and the relatively low proportions of students
that perform well in both parts of the NoST (see below, Table 39), it seems that
many students can choose a position about the NoS without having clear
understandings of the concepts involved—specifically in the case of terms like
“data” and “explanation”. Such an outcome might be the result of rote learning of
accepted views of the NoS, of learning devoid of reflection on, and understanding of,
what these concepts and tenets mean. Alternatively, the meanings of concepts such
as “data” and “explanation” may remain implicit in science teaching, never explicitly
taught nor used.
Understanding the difference between data and explanations, and applying it
successfully to actual examples, can hardly be learned by rote or by keeping them as
unstated assumptions. Data from the focus groups support this finding to some
extent: many students seem to understand intuitively the difference, or relationship,
between data and explanations. Also, some students are easily swayed by judgments
offered by other students, which could suggest that their understandings of the
concepts are not firmly developed.
Table 39 Percentages of students that score 4 or 5 points in Part I and select a desired answer option in Part II of the G form of the NoST (n=270)
PART II G form
2 3 4 5 6 7
4 point score in PART I 13.7 6.7 15.6 5.6 7.8 13.3
PART II G form
2 3 4 5 6 7
5 point score in PART I 15.2 7.0 18.5 7.8 10.0 15.6
Totals 28.9 13.7 34.1 13.4 17.8 28.9
Even if there seems to be no overall correlation between scores to PART I and II, it
may still be the case that high achievement in the first correlates with having chosen
desired responses in the second. Table 39 shows the percentages, per question, of
students that scored either 4 or 5 points in PART I and also chose the desired response
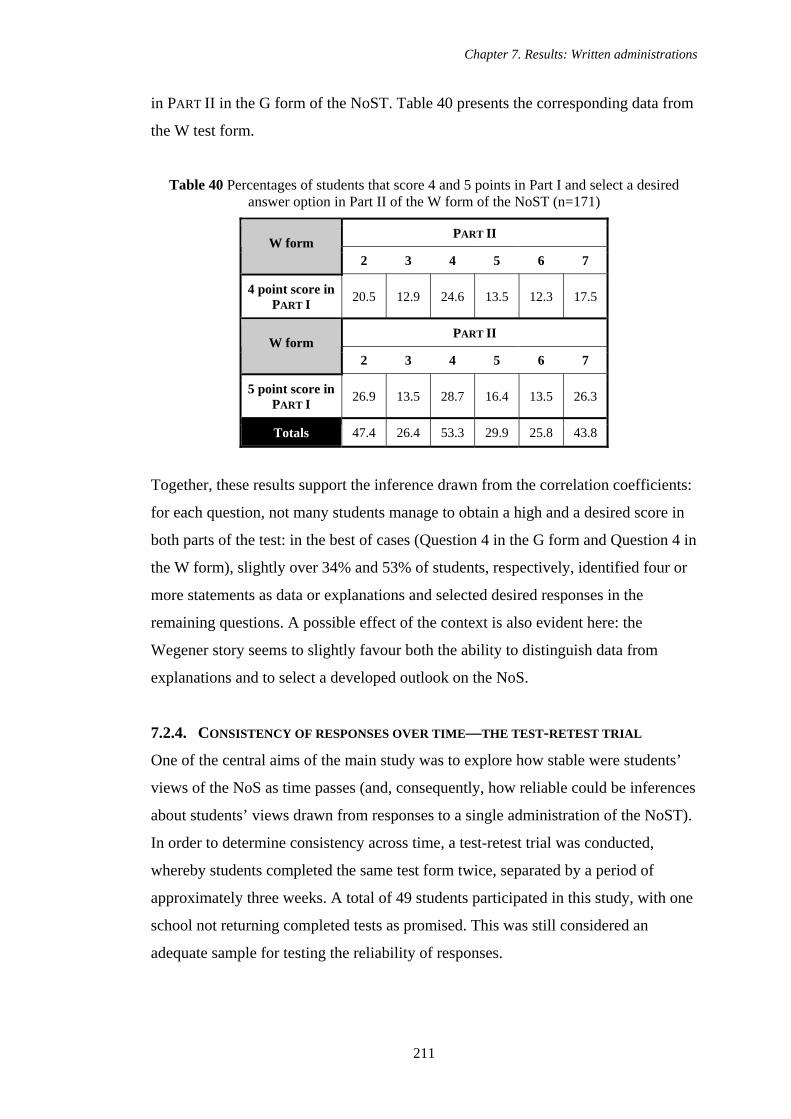
Chapter 7. Results: Written administrations
211
in PART II in the G form of the NoST. Table 40 presents the corresponding data from
the W test form.
Table 40 Percentages of students that score 4 and 5 points in Part I and select a desired answer option in Part II of the W form of the NoST (n=171)
PART II W form
2 3 4 5 6 7
4 point score in PART I 20.5 12.9 24.6 13.5 12.3 17.5
PART II W form
2 3 4 5 6 7
5 point score in PART I 26.9 13.5 28.7 16.4 13.5 26.3
Totals 47.4 26.4 53.3 29.9 25.8 43.8
Together, these results support the inference drawn from the correlation coefficients:
for each question, not many students manage to obtain a high and a desired score in
both parts of the test: in the best of cases (Question 4 in the G form and Question 4 in
the W form), slightly over 34% and 53% of students, respectively, identified four or
more statements as data or explanations and selected desired responses in the
remaining questions. A possible effect of the context is also evident here: the
Wegener story seems to slightly favour both the ability to distinguish data from
explanations and to select a developed outlook on the NoS.
7.2.4. CONSISTENCY OF RESPONSES OVER TIME—THE TEST-RETEST TRIAL
One of the central aims of the main study was to explore how stable were students’
views of the NoS as time passes (and, consequently, how reliable could be inferences
about students’ views drawn from responses to a single administration of the NoST).
In order to determine consistency across time, a test-retest trial was conducted,
whereby students completed the same test form twice, separated by a period of
approximately three weeks. A total of 49 students participated in this study, with one
school not returning completed tests as promised. This was still considered an
adequate sample for testing the reliability of responses.
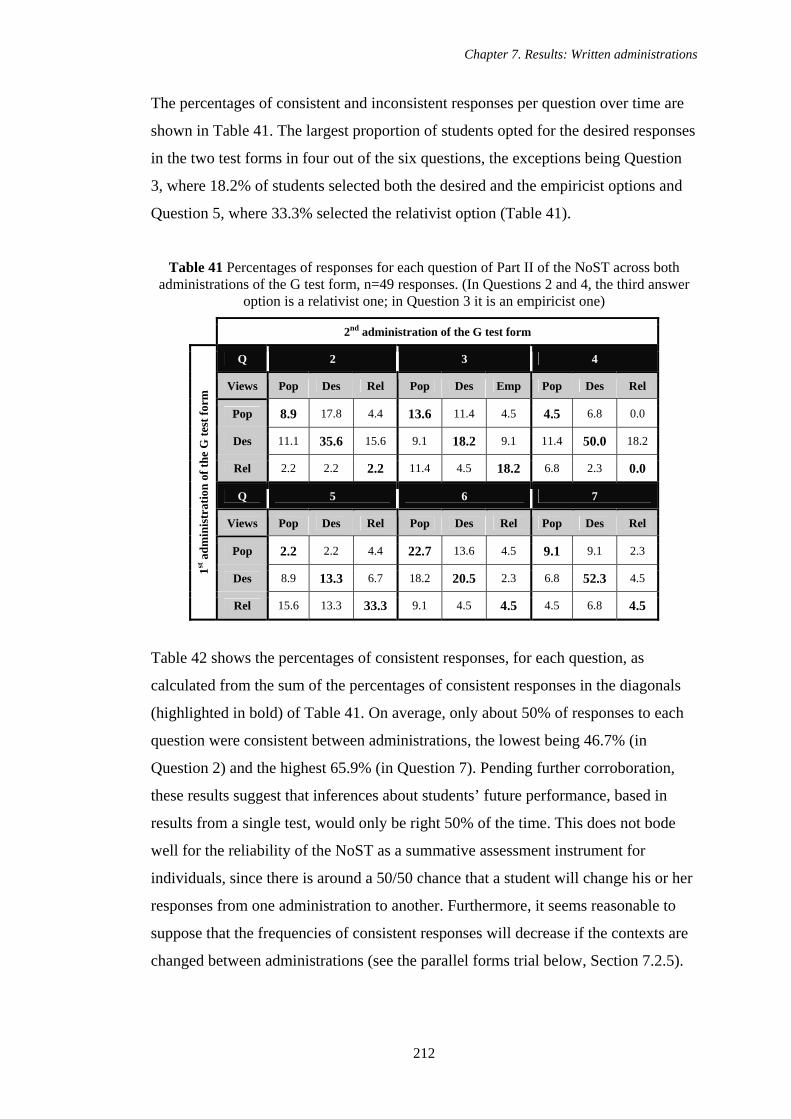
Chapter 7. Results: Written administrations
212
The percentages of consistent and inconsistent responses per question over time are
shown in Table 41. The largest proportion of students opted for the desired responses
in the two test forms in four out of the six questions, the exceptions being Question
3, where 18.2% of students selected both the desired and the empiricist options and
Question 5, where 33.3% selected the relativist option (Table 41).
Table 41 Percentages of responses for each question of Part II of the NoST across both administrations of the G test form, n=49 responses. (In Questions 2 and 4, the third answer
option is a relativist one; in Question 3 it is an empiricist one)
2nd administration of the G test form
Q 2 3 4
Views Pop Des Rel Pop Des Emp Pop Des Rel
Pop 8.9 17.8 4.4 13.6 11.4 4.5 4.5 6.8 0.0
Des 11.1 35.6 15.6 9.1 18.2 9.1 11.4 50.0 18.2
Rel 2.2 2.2 2.2 11.4 4.5 18.2 6.8 2.3 0.0
Q 5 6 7
Views Pop Des Rel Pop Des Rel Pop Des Rel
Pop 2.2 2.2 4.4 22.7 13.6 4.5 9.1 9.1 2.3
Des 8.9 13.3 6.7 18.2 20.5 2.3 6.8 52.3 4.5 1st a
dmin
istr
atio
n of
the
G te
st fo
rm
Rel 15.6 13.3 33.3 9.1 4.5 4.5 4.5 6.8 4.5
Table 42 shows the percentages of consistent responses, for each question, as
calculated from the sum of the percentages of consistent responses in the diagonals
(highlighted in bold) of Table 41. On average, only about 50% of responses to each
question were consistent between administrations, the lowest being 46.7% (in
Question 2) and the highest 65.9% (in Question 7). Pending further corroboration,
these results suggest that inferences about students’ future performance, based in
results from a single test, would only be right 50% of the time. This does not bode
well for the reliability of the NoST as a summative assessment instrument for
individuals, since there is around a 50/50 chance that a student will change his or her
responses from one administration to another. Furthermore, it seems reasonable to
suppose that the frequencies of consistent responses will decrease if the contexts are
changed between administrations (see the parallel forms trial below, Section 7.2.5).
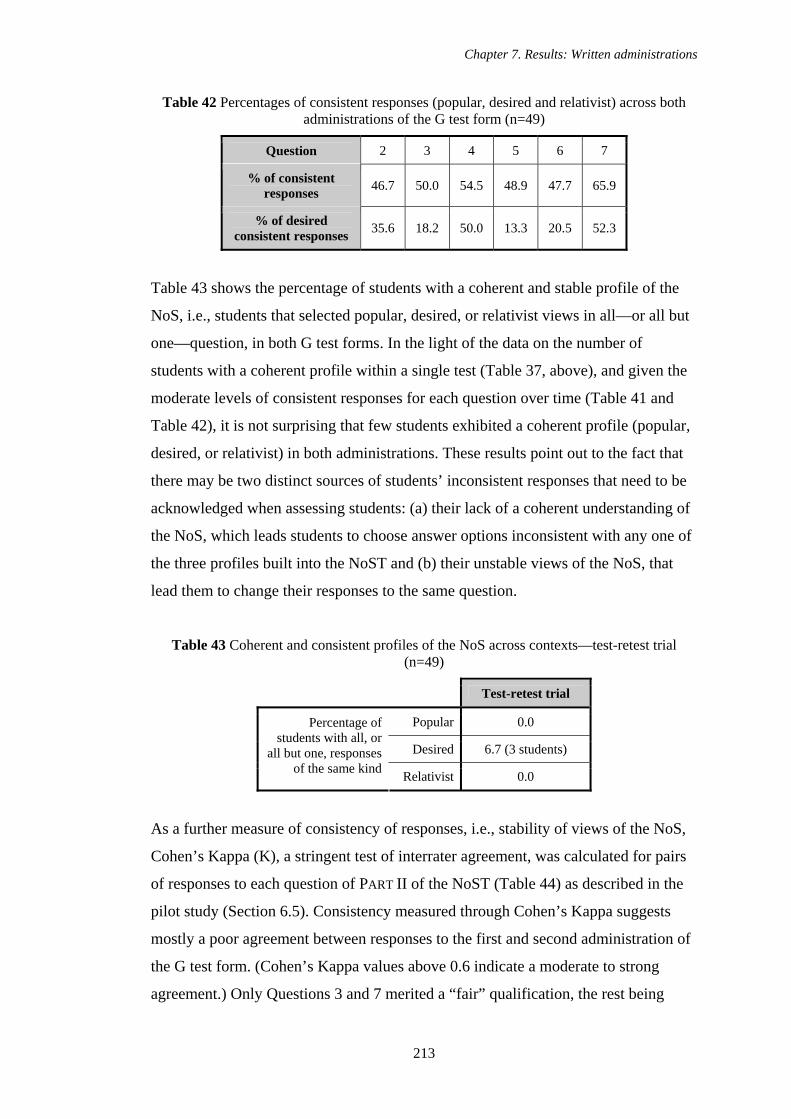
Chapter 7. Results: Written administrations
213
Table 42 Percentages of consistent responses (popular, desired and relativist) across both administrations of the G test form (n=49)
Question 2 3 4 5 6 7
% of consistent responses 46.7 50.0 54.5 48.9 47.7 65.9
% of desired consistent responses 35.6 18.2 50.0 13.3 20.5 52.3
Table 43 shows the percentage of students with a coherent and stable profile of the
NoS, i.e., students that selected popular, desired, or relativist views in all—or all but
one—question, in both G test forms. In the light of the data on the number of
students with a coherent profile within a single test (Table 37, above), and given the
moderate levels of consistent responses for each question over time (Table 41 and
Table 42), it is not surprising that few students exhibited a coherent profile (popular,
desired, or relativist) in both administrations. These results point out to the fact that
there may be two distinct sources of students’ inconsistent responses that need to be
acknowledged when assessing students: (a) their lack of a coherent understanding of
the NoS, which leads students to choose answer options inconsistent with any one of
the three profiles built into the NoST and (b) their unstable views of the NoS, that
lead them to change their responses to the same question.
Table 43 Coherent and consistent profiles of the NoS across contexts—test-retest trial (n=49)
Test-retest trial
Popular 0.0
Desired 6.7 (3 students)
Percentage of students with all, or
all but one, responses of the same kind Relativist 0.0
As a further measure of consistency of responses, i.e., stability of views of the NoS,
Cohen’s Kappa (K), a stringent test of interrater agreement, was calculated for pairs
of responses to each question of PART II of the NoST (Table 44) as described in the
pilot study (Section 6.5). Consistency measured through Cohen’s Kappa suggests
mostly a poor agreement between responses to the first and second administration of
the G test form. (Cohen’s Kappa values above 0.6 indicate a moderate to strong
agreement.) Only Questions 3 and 7 merited a “fair” qualification, the rest being
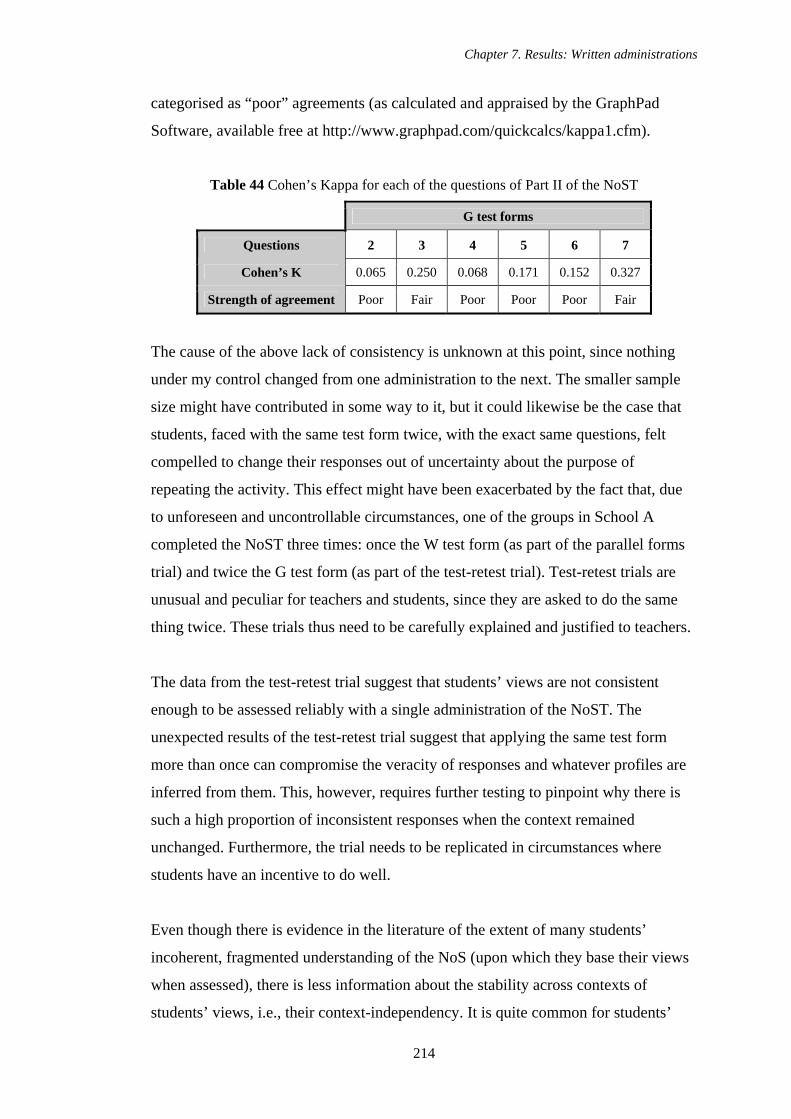
Chapter 7. Results: Written administrations
214
categorised as “poor” agreements (as calculated and appraised by the GraphPad
Software, available free at http://www.graphpad.com/quickcalcs/kappa1.cfm).
Table 44 Cohen’s Kappa for each of the questions of Part II of the NoST
G test forms
Questions 2 3 4 5 6 7
Cohen’s K 0.065 0.250 0.068 0.171 0.152 0.327
Strength of agreement Poor Fair Poor Poor Poor Fair
The cause of the above lack of consistency is unknown at this point, since nothing
under my control changed from one administration to the next. The smaller sample
size might have contributed in some way to it, but it could likewise be the case that
students, faced with the same test form twice, with the exact same questions, felt
compelled to change their responses out of uncertainty about the purpose of
repeating the activity. This effect might have been exacerbated by the fact that, due
to unforeseen and uncontrollable circumstances, one of the groups in School A
completed the NoST three times: once the W test form (as part of the parallel forms
trial) and twice the G test form (as part of the test-retest trial). Test-retest trials are
unusual and peculiar for teachers and students, since they are asked to do the same
thing twice. These trials thus need to be carefully explained and justified to teachers.
The data from the test-retest trial suggest that students’ views are not consistent
enough to be assessed reliably with a single administration of the NoST. The
unexpected results of the test-retest trial suggest that applying the same test form
more than once can compromise the veracity of responses and whatever profiles are
inferred from them. This, however, requires further testing to pinpoint why there is
such a high proportion of inconsistent responses when the context remained
unchanged. Furthermore, the trial needs to be replicated in circumstances where
students have an incentive to do well.
Even though there is evidence in the literature of the extent of many students’
incoherent, fragmented understanding of the NoS (upon which they base their views
when assessed), there is less information about the stability across contexts of
students’ views, i.e., their context-independency. It is quite common for students’
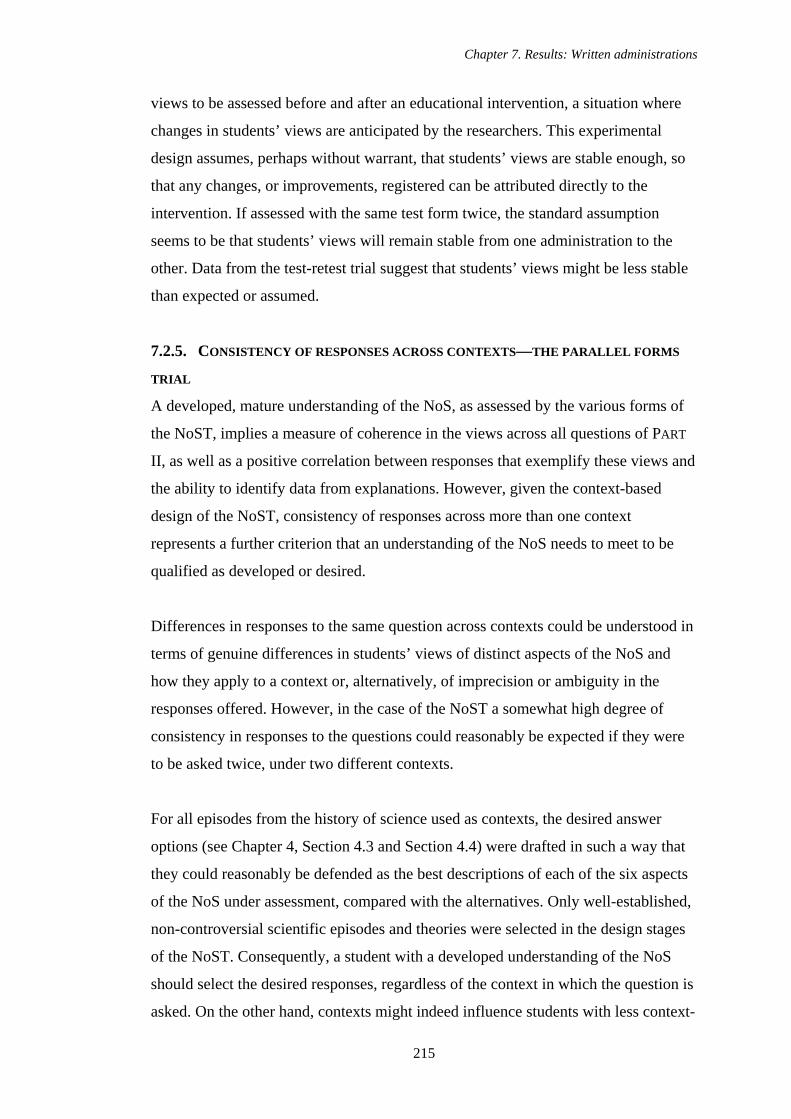
Chapter 7. Results: Written administrations
215
views to be assessed before and after an educational intervention, a situation where
changes in students’ views are anticipated by the researchers. This experimental
design assumes, perhaps without warrant, that students’ views are stable enough, so
that any changes, or improvements, registered can be attributed directly to the
intervention. If assessed with the same test form twice, the standard assumption
seems to be that students’ views will remain stable from one administration to the
other. Data from the test-retest trial suggest that students’ views might be less stable
than expected or assumed.
7.2.5. CONSISTENCY OF RESPONSES ACROSS CONTEXTS—THE PARALLEL FORMS
TRIAL
A developed, mature understanding of the NoS, as assessed by the various forms of
the NoST, implies a measure of coherence in the views across all questions of PART
II, as well as a positive correlation between responses that exemplify these views and
the ability to identify data from explanations. However, given the context-based
design of the NoST, consistency of responses across more than one context
represents a further criterion that an understanding of the NoS needs to meet to be
qualified as developed or desired.
Differences in responses to the same question across contexts could be understood in
terms of genuine differences in students’ views of distinct aspects of the NoS and
how they apply to a context or, alternatively, of imprecision or ambiguity in the
responses offered. However, in the case of the NoST a somewhat high degree of
consistency in responses to the questions could reasonably be expected if they were
to be asked twice, under two different contexts.
For all episodes from the history of science used as contexts, the desired answer
options (see Chapter 4, Section 4.3 and Section 4.4) were drafted in such a way that
they could reasonably be defended as the best descriptions of each of the six aspects
of the NoS under assessment, compared with the alternatives. Only well-established,
non-controversial scientific episodes and theories were selected in the design stages
of the NoST. Consequently, a student with a developed understanding of the NoS
should select the desired responses, regardless of the context in which the question is
asked. On the other hand, contexts might indeed influence students with less context-
Chapter 7. Results: Written administrations
216
independent understandings of the NoS, swaying them away from the desired
responses to either the popular or the relativist alternatives.
To determine the extent of the consistency of responses across contexts, responses
from students that completed two different test forms were compared. A sub-sample
of 169 students that completed both the G and the W test forms provided the data for
the analysis. Table 45 shows the percentages of responses for each question across
administrations of different forms of the NoST.
Table 45 Percentages of responses for each question of Part II of the NoST across the G and the W test forms, n=169. (In Questions 2 and 4, the third answer option is a relativist one; in
Question 3 it is an empiricist one)
Administration of the W test form
Q 2 3 4
Views Pop Des Rel Pop Des Emp Pop Des Rel
Pop 10.8 14.0 1.9 12.2 7.1 4.5 3.2 7.0 1.3
Des 8.3 50.3 3.2 5.8 26.3 4.5 6.3 68.4 5.7
Rel 7.6 7.6 2.5 16.7 5.1 17.9 3.8 3.2 1.3
Q 5 6 7
Views Pop Des Rel Pop Des Rel Pop Des Rel
Pop 1.9 4.5 1.9 32.9 15.4 6.0 6.6 6.6 3.9
Des 4.5 24.8 10.8 16.1 22.1 0.7 5.9 51.3 7.9
Adm
inis
trat
ion
of th
e G
test
form
Rel 3.2 15.9 32.5 2.7 2.0 2.0 0.7 8.6 8.6
Table 46 in turn shows the percentages of both overall and desired consistent
responses, for each question, as calculated from the sum of the percentages of
consistent responses in the diagonals (highlighted in bold) in Table 45. The majority
(57.0 to 72.8%; Table 46) of students that participated in the parallel forms trial
remained consistent across test forms, as seen from the percentages of students that
chose the empiricist (Emp), popular (Pop), desired (Des) or relativist (Rel) responses
the two times they completed the NoST (Table 45).
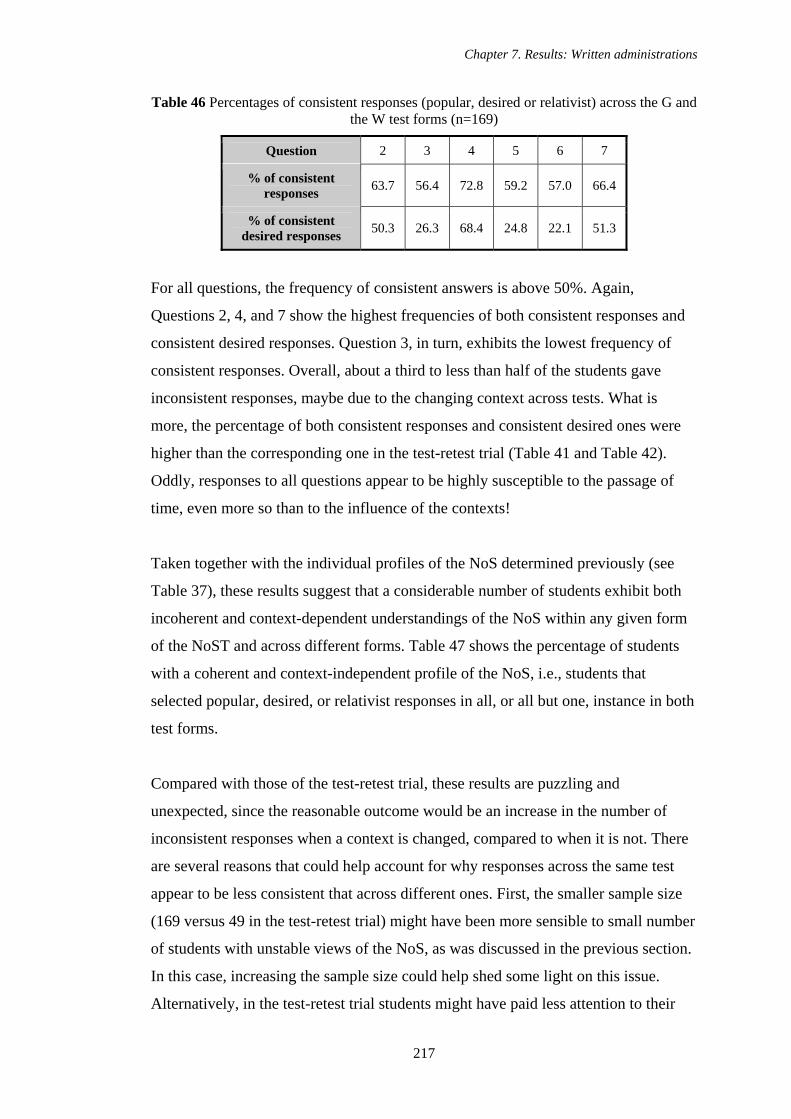
Chapter 7. Results: Written administrations
217
Table 46 Percentages of consistent responses (popular, desired or relativist) across the G and the W test forms (n=169)
Question 2 3 4 5 6 7
% of consistent responses 63.7 56.4 72.8 59.2 57.0 66.4
% of consistent desired responses 50.3 26.3 68.4 24.8 22.1 51.3
For all questions, the frequency of consistent answers is above 50%. Again,
Questions 2, 4, and 7 show the highest frequencies of both consistent responses and
consistent desired responses. Question 3, in turn, exhibits the lowest frequency of
consistent responses. Overall, about a third to less than half of the students gave
inconsistent responses, maybe due to the changing context across tests. What is
more, the percentage of both consistent responses and consistent desired ones were
higher than the corresponding one in the test-retest trial (Table 41 and Table 42).
Oddly, responses to all questions appear to be highly susceptible to the passage of
time, even more so than to the influence of the contexts!
Taken together with the individual profiles of the NoS determined previously (see
Table 37), these results suggest that a considerable number of students exhibit both
incoherent and context-dependent understandings of the NoS within any given form
of the NoST and across different forms. Table 47 shows the percentage of students
with a coherent and context-independent profile of the NoS, i.e., students that
selected popular, desired, or relativist responses in all, or all but one, instance in both
test forms.
Compared with those of the test-retest trial, these results are puzzling and
unexpected, since the reasonable outcome would be an increase in the number of
inconsistent responses when a context is changed, compared to when it is not. There
are several reasons that could help account for why responses across the same test
appear to be less consistent that across different ones. First, the smaller sample size
(169 versus 49 in the test-retest trial) might have been more sensible to small number
of students with unstable views of the NoS, as was discussed in the previous section.
In this case, increasing the sample size could help shed some light on this issue.
Alternatively, in the test-retest trial students might have paid less attention to their
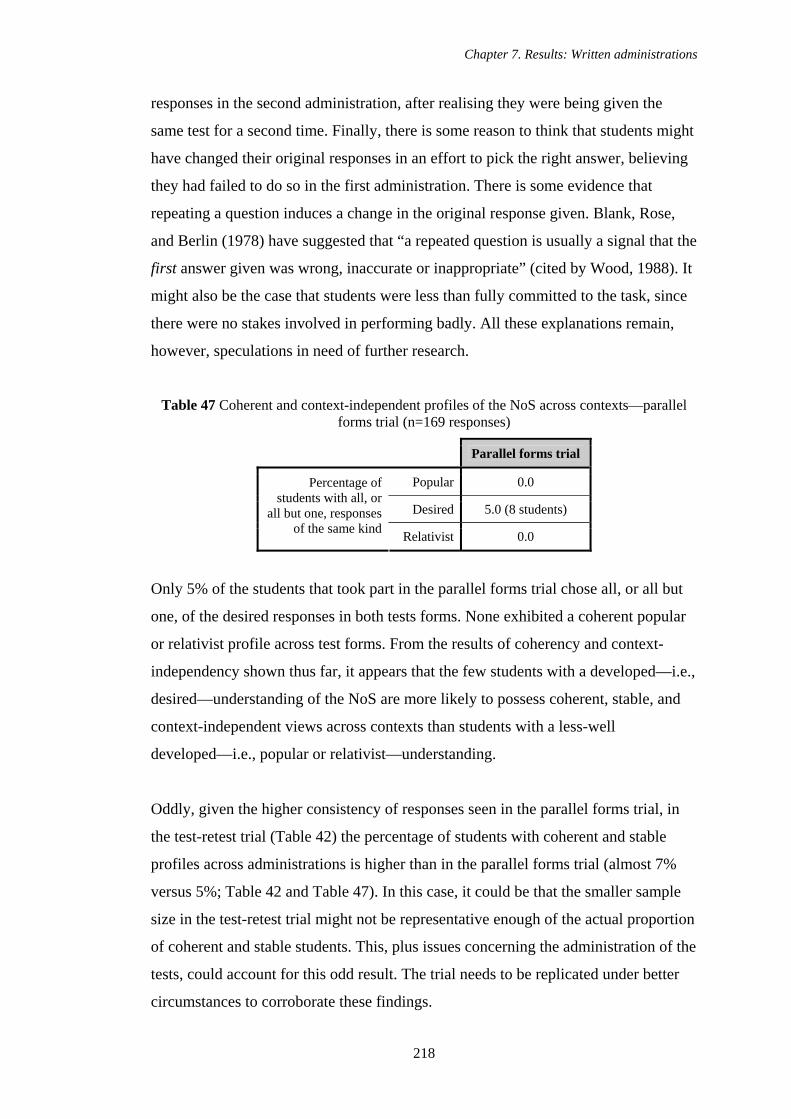
Chapter 7. Results: Written administrations
218
responses in the second administration, after realising they were being given the
same test for a second time. Finally, there is some reason to think that students might
have changed their original responses in an effort to pick the right answer, believing
they had failed to do so in the first administration. There is some evidence that
repeating a question induces a change in the original response given. Blank, Rose,
and Berlin (1978) have suggested that “a repeated question is usually a signal that the
first answer given was wrong, inaccurate or inappropriate” (cited by Wood, 1988). It
might also be the case that students were less than fully committed to the task, since
there were no stakes involved in performing badly. All these explanations remain,
however, speculations in need of further research.
Table 47 Coherent and context-independent profiles of the NoS across contexts—parallel forms trial (n=169 responses)
Parallel forms trial
Popular 0.0
Desired 5.0 (8 students)
Percentage of students with all, or
all but one, responses of the same kind Relativist 0.0
Only 5% of the students that took part in the parallel forms trial chose all, or all but
one, of the desired responses in both tests forms. None exhibited a coherent popular
or relativist profile across test forms. From the results of coherency and context-
independency shown thus far, it appears that the few students with a developed—i.e.,
desired—understanding of the NoS are more likely to possess coherent, stable, and
context-independent views across contexts than students with a less-well
developed—i.e., popular or relativist—understanding.
Oddly, given the higher consistency of responses seen in the parallel forms trial, in
the test-retest trial (Table 42) the percentage of students with coherent and stable
profiles across administrations is higher than in the parallel forms trial (almost 7%
versus 5%; Table 42 and Table 47). In this case, it could be that the smaller sample
size in the test-retest trial might not be representative enough of the actual proportion
of coherent and stable students. This, plus issues concerning the administration of the
tests, could account for this odd result. The trial needs to be replicated under better
circumstances to corroborate these findings.
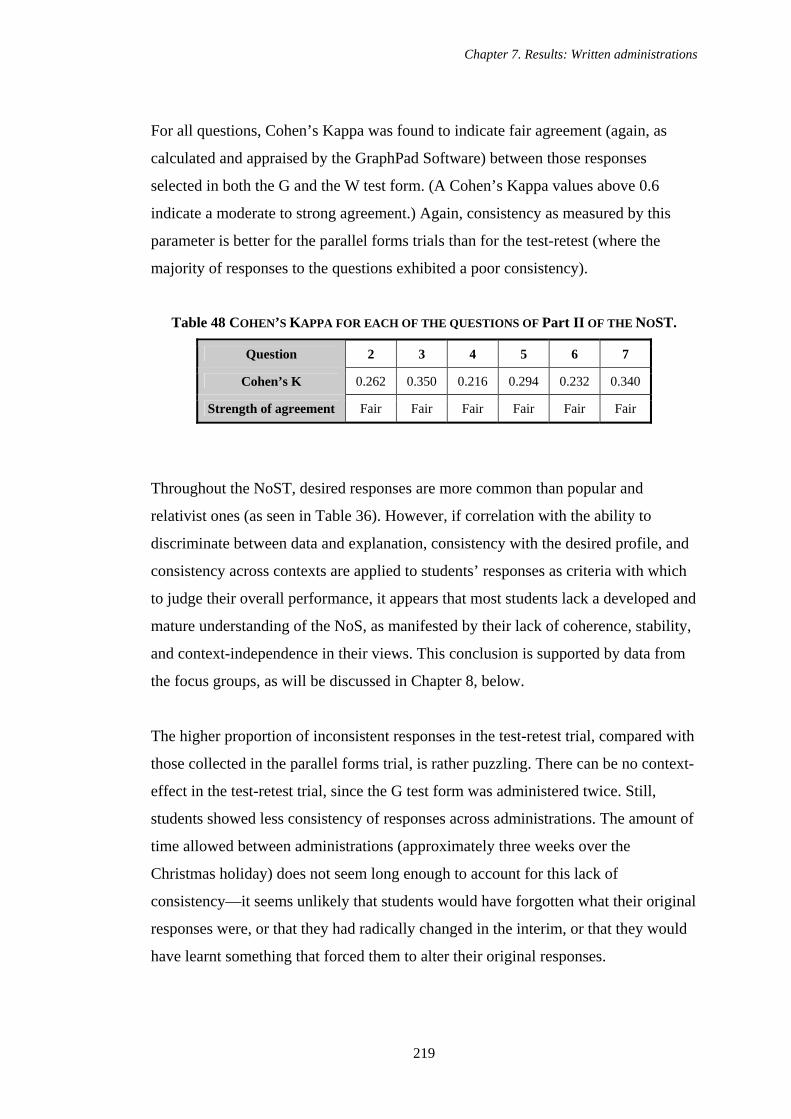
Chapter 7. Results: Written administrations
219
For all questions, Cohen’s Kappa was found to indicate fair agreement (again, as
calculated and appraised by the GraphPad Software) between those responses
selected in both the G and the W test form. (A Cohen’s Kappa values above 0.6
indicate a moderate to strong agreement.) Again, consistency as measured by this
parameter is better for the parallel forms trials than for the test-retest (where the
majority of responses to the questions exhibited a poor consistency).
Table 48 COHEN’S KAPPA FOR EACH OF THE QUESTIONS OF Part II OF THE NOST.
Question 2 3 4 5 6 7
Cohen’s K 0.262 0.350 0.216 0.294 0.232 0.340
Strength of agreement Fair Fair Fair Fair Fair Fair
Throughout the NoST, desired responses are more common than popular and
relativist ones (as seen in Table 36). However, if correlation with the ability to
discriminate between data and explanation, consistency with the desired profile, and
consistency across contexts are applied to students’ responses as criteria with which
to judge their overall performance, it appears that most students lack a developed and
mature understanding of the NoS, as manifested by their lack of coherence, stability,
and context-independence in their views. This conclusion is supported by data from
the focus groups, as will be discussed in Chapter 8, below.
The higher proportion of inconsistent responses in the test-retest trial, compared with
those collected in the parallel forms trial, is rather puzzling. There can be no context-
effect in the test-retest trial, since the G test form was administered twice. Still,
students showed less consistency of responses across administrations. The amount of
time allowed between administrations (approximately three weeks over the
Christmas holiday) does not seem long enough to account for this lack of
consistency—it seems unlikely that students would have forgotten what their original
responses were, or that they had radically changed in the interim, or that they would
have learnt something that forced them to alter their original responses.
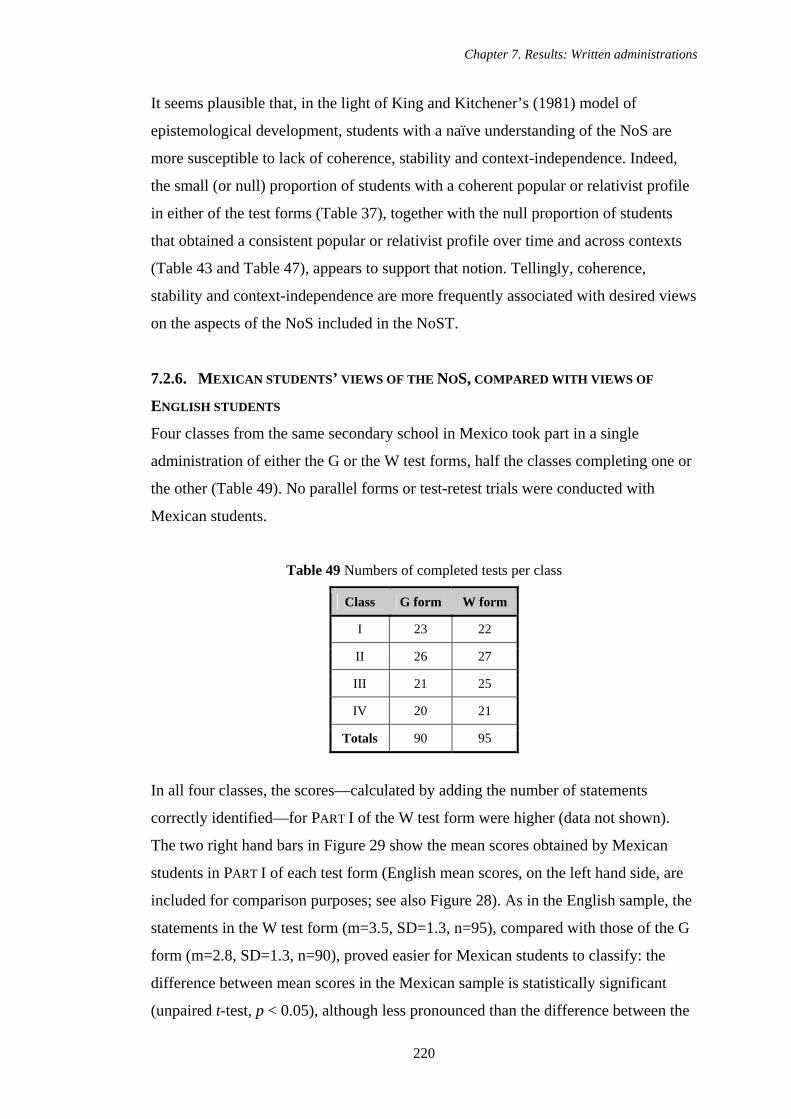
Chapter 7. Results: Written administrations
220
It seems plausible that, in the light of King and Kitchener’s (1981) model of
epistemological development, students with a naïve understanding of the NoS are
more susceptible to lack of coherence, stability and context-independence. Indeed,
the small (or null) proportion of students with a coherent popular or relativist profile
in either of the test forms (Table 37), together with the null proportion of students
that obtained a consistent popular or relativist profile over time and across contexts
(Table 43 and Table 47), appears to support that notion. Tellingly, coherence,
stability and context-independence are more frequently associated with desired views
on the aspects of the NoS included in the NoST.
7.2.6. MEXICAN STUDENTS’ VIEWS OF THE NOS, COMPARED WITH VIEWS OF
ENGLISH STUDENTS
Four classes from the same secondary school in Mexico took part in a single
administration of either the G or the W test forms, half the classes completing one or
the other (Table 49). No parallel forms or test-retest trials were conducted with
Mexican students.
Table 49 Numbers of completed tests per class
Class G form W form
I 23 22
II 26 27
III 21 25
IV 20 21
Totals 90 95
In all four classes, the scores—calculated by adding the number of statements
correctly identified—for PART I of the W test form were higher (data not shown).
The two right hand bars in Figure 29 show the mean scores obtained by Mexican
students in PART I of each test form (English mean scores, on the left hand side, are
included for comparison purposes; see also Figure 28). As in the English sample, the
statements in the W test form (m=3.5, SD=1.3, n=95), compared with those of the G
form (m=2.8, SD=1.3, n=90), proved easier for Mexican students to classify: the
difference between mean scores in the Mexican sample is statistically significant
(unpaired t-test, p < 0.05), although less pronounced than the difference between the
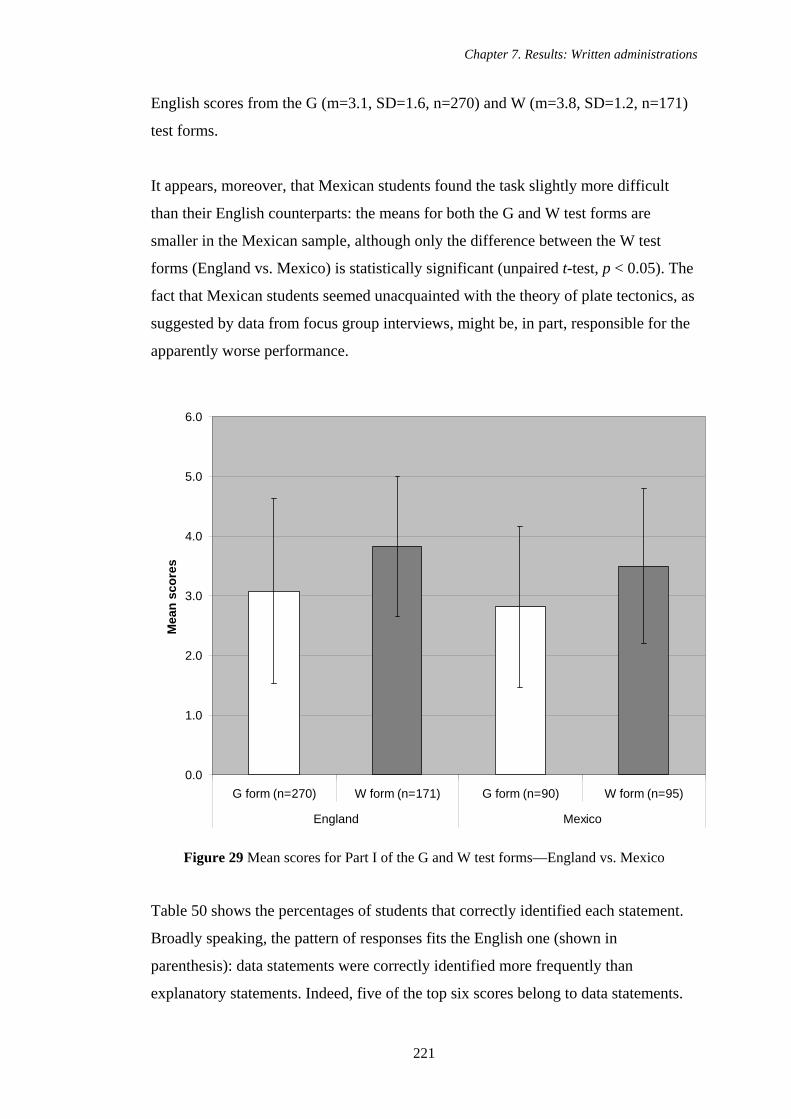
Chapter 7. Results: Written administrations
221
English scores from the G (m=3.1, SD=1.6, n=270) and W (m=3.8, SD=1.2, n=171)
test forms.
It appears, moreover, that Mexican students found the task slightly more difficult
than their English counterparts: the means for both the G and W test forms are
smaller in the Mexican sample, although only the difference between the W test
forms (England vs. Mexico) is statistically significant (unpaired t-test, p < 0.05). The
fact that Mexican students seemed unacquainted with the theory of plate tectonics, as
suggested by data from focus group interviews, might be, in part, responsible for the
apparently worse performance.
0.0
1.0
2.0
3.0
4.0
5.0
6.0
G form (n=270) W form (n=171) G form (n=90) W form (n=95)
England Mexico
Mea
n sc
ores
Figure 29 Mean scores for Part I of the G and W test forms—England vs. Mexico
Table 50 shows the percentages of students that correctly identified each statement.
Broadly speaking, the pattern of responses fits the English one (shown in
parenthesis): data statements were correctly identified more frequently than
explanatory statements. Indeed, five of the top six scores belong to data statements.
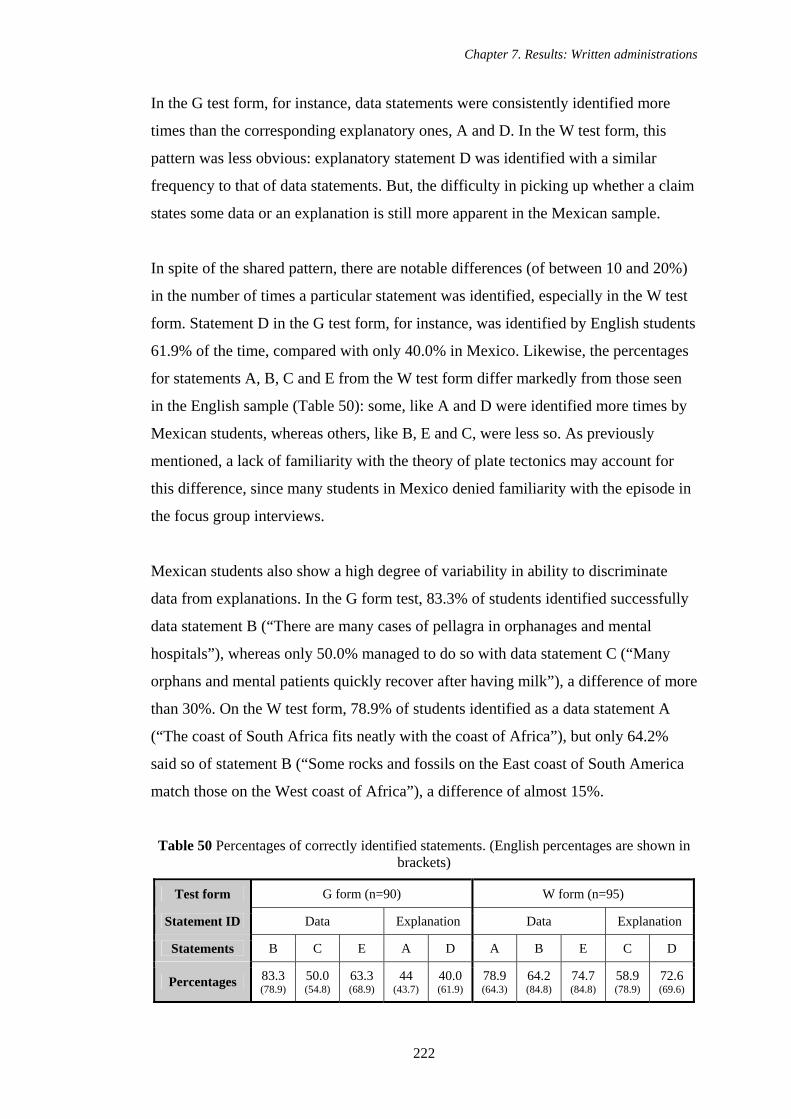
Chapter 7. Results: Written administrations
222
In the G test form, for instance, data statements were consistently identified more
times than the corresponding explanatory ones, A and D. In the W test form, this
pattern was less obvious: explanatory statement D was identified with a similar
frequency to that of data statements. But, the difficulty in picking up whether a claim
states some data or an explanation is still more apparent in the Mexican sample.
In spite of the shared pattern, there are notable differences (of between 10 and 20%)
in the number of times a particular statement was identified, especially in the W test
form. Statement D in the G test form, for instance, was identified by English students
61.9% of the time, compared with only 40.0% in Mexico. Likewise, the percentages
for statements A, B, C and E from the W test form differ markedly from those seen
in the English sample (Table 50): some, like A and D were identified more times by
Mexican students, whereas others, like B, E and C, were less so. As previously
mentioned, a lack of familiarity with the theory of plate tectonics may account for
this difference, since many students in Mexico denied familiarity with the episode in
the focus group interviews.
Mexican students also show a high degree of variability in ability to discriminate
data from explanations. In the G form test, 83.3% of students identified successfully
data statement B (“There are many cases of pellagra in orphanages and mental
hospitals”), whereas only 50.0% managed to do so with data statement C (“Many
orphans and mental patients quickly recover after having milk”), a difference of more
than 30%. On the W test form, 78.9% of students identified as a data statement A
(“The coast of South Africa fits neatly with the coast of Africa”), but only 64.2%
said so of statement B (“Some rocks and fossils on the East coast of South America
match those on the West coast of Africa”), a difference of almost 15%.
Table 50 Percentages of correctly identified statements. (English percentages are shown in brackets)
Test form G form (n=90) W form (n=95)
Statement ID Data Explanation Data Explanation
Statements B C E A D A B E C D
Percentages 83.3 (78.9)
50.0 (54.8)
63.3 (68.9)
44 (43.7)
40.0 (61.9)
78.9 (64.3)
64.2 (84.8)
74.7 (84.8)
58.9 (78.9)
72.6 (69.6)
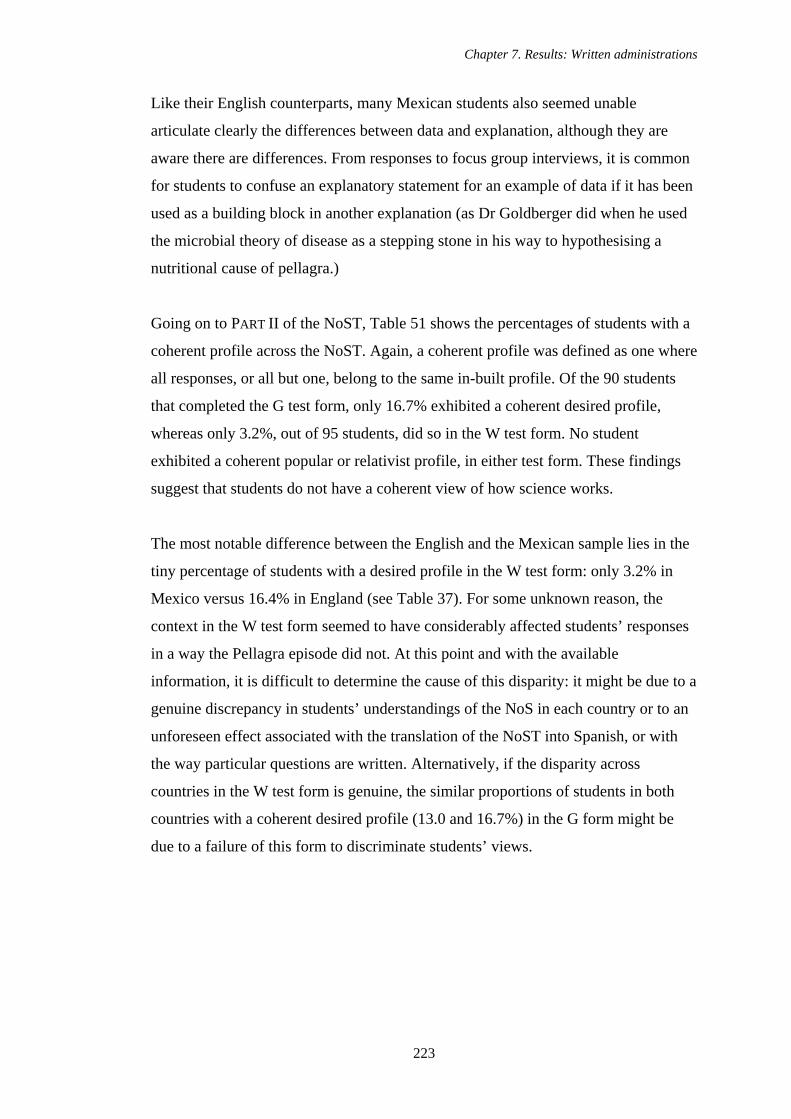
Chapter 7. Results: Written administrations
223
Like their English counterparts, many Mexican students also seemed unable
articulate clearly the differences between data and explanation, although they are
aware there are differences. From responses to focus group interviews, it is common
for students to confuse an explanatory statement for an example of data if it has been
used as a building block in another explanation (as Dr Goldberger did when he used
the microbial theory of disease as a stepping stone in his way to hypothesising a
nutritional cause of pellagra.)
Going on to PART II of the NoST, Table 51 shows the percentages of students with a
coherent profile across the NoST. Again, a coherent profile was defined as one where
all responses, or all but one, belong to the same in-built profile. Of the 90 students
that completed the G test form, only 16.7% exhibited a coherent desired profile,
whereas only 3.2%, out of 95 students, did so in the W test form. No student
exhibited a coherent popular or relativist profile, in either test form. These findings
suggest that students do not have a coherent view of how science works.
The most notable difference between the English and the Mexican sample lies in the
tiny percentage of students with a desired profile in the W test form: only 3.2% in
Mexico versus 16.4% in England (see Table 37). For some unknown reason, the
context in the W test form seemed to have considerably affected students’ responses
in a way the Pellagra episode did not. At this point and with the available
information, it is difficult to determine the cause of this disparity: it might be due to a
genuine discrepancy in students’ understandings of the NoS in each country or to an
unforeseen effect associated with the translation of the NoST into Spanish, or with
the way particular questions are written. Alternatively, if the disparity across
countries in the W test form is genuine, the similar proportions of students in both
countries with a coherent desired profile (13.0 and 16.7%) in the G form might be
due to a failure of this form to discriminate students’ views.
Chapter 7. Results: Written administrations
224
Table 51 Individual students’ overall NoS profiles
G form (n=90)
W form (n=95)
Popular 0.0 0.0
Desired 16.7 3.2
Percentage of students with all, or
all but one, responses of the
same kind Relativist 0.0 0.0
Table 52 presents the percentages of each answer option for all six questions of the
NoST. Data from the English sample are included for comparison (see Table 36 for
the original data). Overall, the Mexican sample reproduced the patterns seen in the
English one: in Questions 2, 4, and 7 the desired response is also the commonest one.
Curiously enough, the effect of the context is the opposite of what happened in the
English sample: the Goldberger episode, rather than the Wegener one, seems to
produce higher proportions of desired responses.
Questions 3 and 5, however, present notable deviations from the pattern of the
English sample. In the case of Question 3 (the role of imagination), Mexican students
favoured both the popular and the empiricist responses over the desired one, whereas
English students chose a similar proportion of the desired and the empiricist
responses, together with a smaller number of popular ones. Concerning the role of
imagination in the creation of explanations, then, Mexican students appear to hold
more naïve views.
Something analogous is evident in Question 5 (underdetermination of theory by
data): although both groups of students selected a high percentage of relativist
responses, a sizeable proportion of English students chose the desired response
(between 36 and 43%, depending on the context) whereas fewer Mexican students
did so (between 9 and 14%). Regarding the underdetermination of explanation by
data, Mexican students appear to be more relativist-minded. From the evidence
afforded by these two questions it appears that Mexican students have a more naïve
understanding of the NoS than their English counterparts.
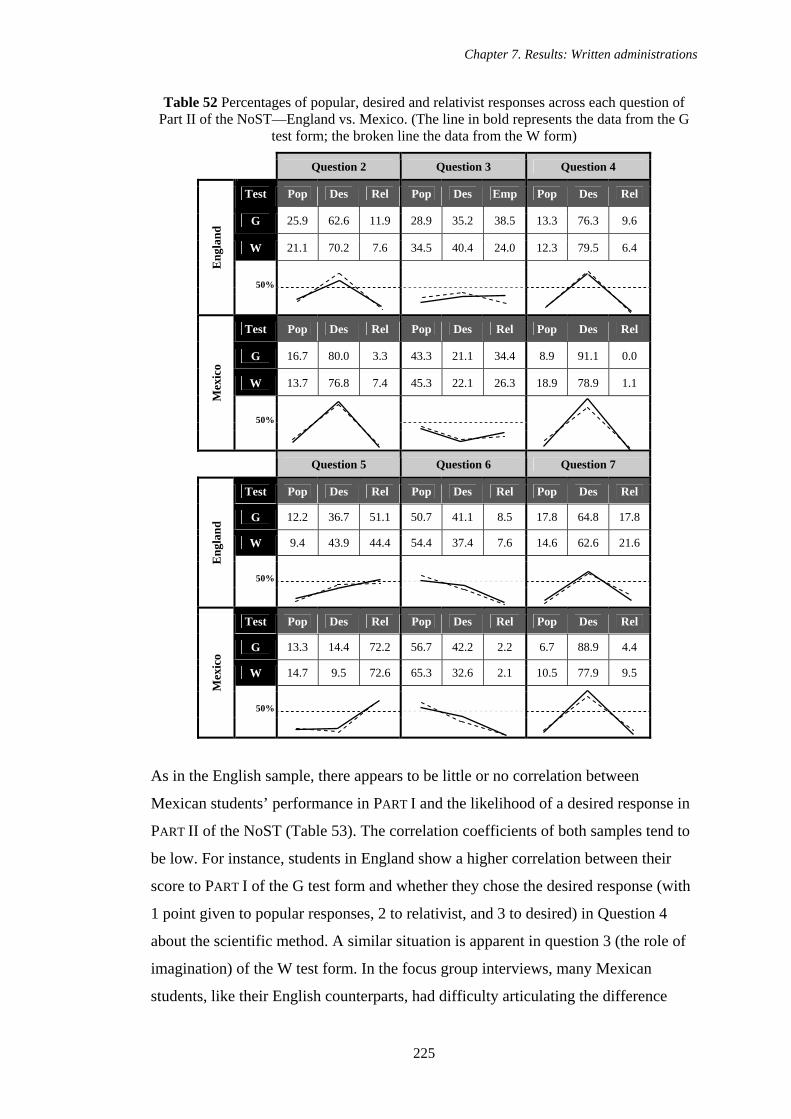
Chapter 7. Results: Written administrations
225
Table 52 Percentages of popular, desired and relativist responses across each question of Part II of the NoST—England vs. Mexico. (The line in bold represents the data from the G
test form; the broken line the data from the W form)
Question 2 Question 3 Question 4
Test Pop Des Rel Pop Des Emp Pop Des Rel
G 25.9 62.6 11.9 28.9 35.2 38.5 13.3 76.3 9.6
W 21.1 70.2 7.6 34.5 40.4 24.0 12.3 79.5 6.4
Eng
land
50%
Test Pop Des Rel Pop Des Rel Pop Des Rel
G 16.7 80.0 3.3 43.3 21.1 34.4 8.9 91.1 0.0
W 13.7 76.8 7.4 45.3 22.1 26.3 18.9 78.9 1.1
Mex
ico
50%
Question 5 Question 6 Question 7
Test Pop Des Rel Pop Des Rel Pop Des Rel
G 12.2 36.7 51.1 50.7 41.1 8.5 17.8 64.8 17.8
W 9.4 43.9 44.4 54.4 37.4 7.6 14.6 62.6 21.6
Eng
land
50%
Test Pop Des Rel Pop Des Rel Pop Des Rel
G 13.3 14.4 72.2 56.7 42.2 2.2 6.7 88.9 4.4
W 14.7 9.5 72.6 65.3 32.6 2.1 10.5 77.9 9.5
Mex
ico
50%
As in the English sample, there appears to be little or no correlation between
Mexican students’ performance in PART I and the likelihood of a desired response in
PART II of the NoST (Table 53). The correlation coefficients of both samples tend to
be low. For instance, students in England show a higher correlation between their
score to PART I of the G test form and whether they chose the desired response (with
1 point given to popular responses, 2 to relativist, and 3 to desired) in Question 4
about the scientific method. A similar situation is apparent in question 3 (the role of
imagination) of the W test form. In the focus group interviews, many Mexican
students, like their English counterparts, had difficulty articulating the difference
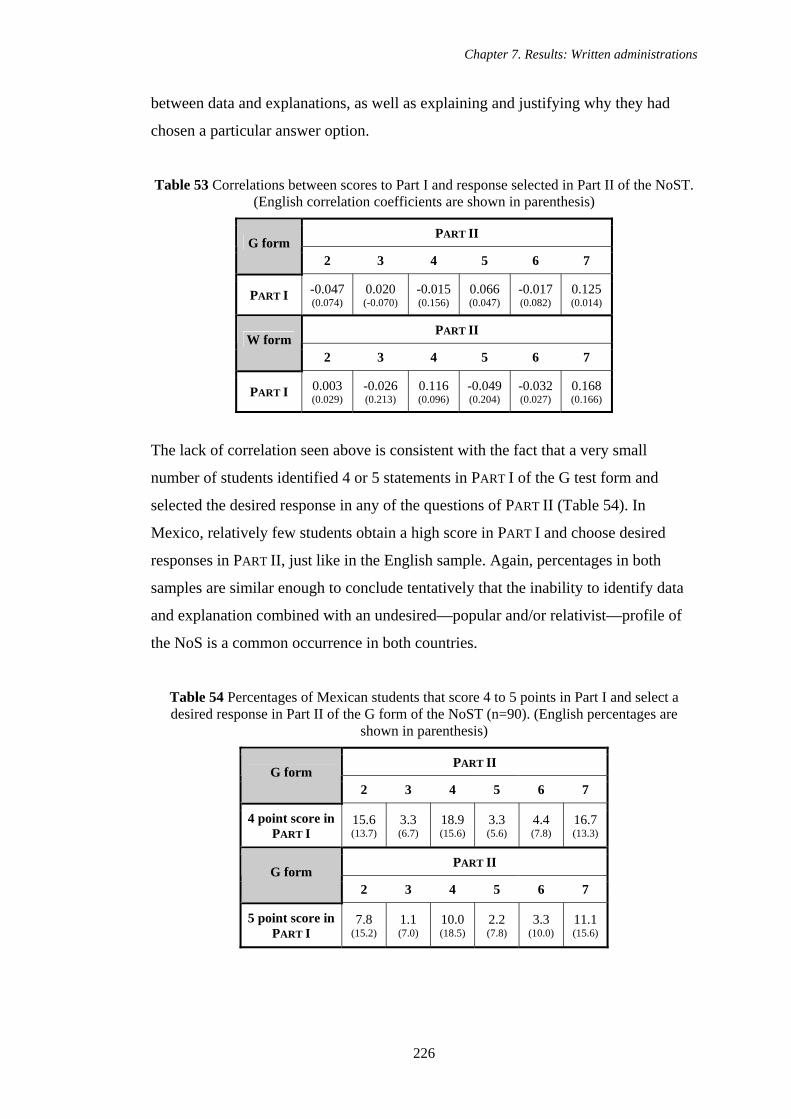
Chapter 7. Results: Written administrations
226
between data and explanations, as well as explaining and justifying why they had
chosen a particular answer option.
Table 53 Correlations between scores to Part I and response selected in Part II of the NoST. (English correlation coefficients are shown in parenthesis)
PART II G form
2 3 4 5 6 7
PART I -0.047 (0.074)
0.020 (-0.070)
-0.015 (0.156)
0.066 (0.047)
-0.017 (0.082)
0.125 (0.014)
PART II W form
2 3 4 5 6 7
PART I 0.003 (0.029)
-0.026 (0.213)
0.116 (0.096)
-0.049 (0.204)
-0.032 (0.027)
0.168 (0.166)
The lack of correlation seen above is consistent with the fact that a very small
number of students identified 4 or 5 statements in PART I of the G test form and
selected the desired response in any of the questions of PART II (Table 54). In
Mexico, relatively few students obtain a high score in PART I and choose desired
responses in PART II, just like in the English sample. Again, percentages in both
samples are similar enough to conclude tentatively that the inability to identify data
and explanation combined with an undesired—popular and/or relativist—profile of
the NoS is a common occurrence in both countries.
Table 54 Percentages of Mexican students that score 4 to 5 points in Part I and select a desired response in Part II of the G form of the NoST (n=90). (English percentages are
shown in parenthesis)
PART II G form
2 3 4 5 6 7
4 point score in PART I
15.6 (13.7)
3.3 (6.7)
18.9 (15.6)
3.3 (5.6)
4.4 (7.8)
16.7 (13.3)
PART II G form
2 3 4 5 6 7
5 point score in PART I
7.8 (15.2)
1.1 (7.0)
10.0 (18.5)
2.2 (7.8)
3.3 (10.0)
11.1 (15.6)
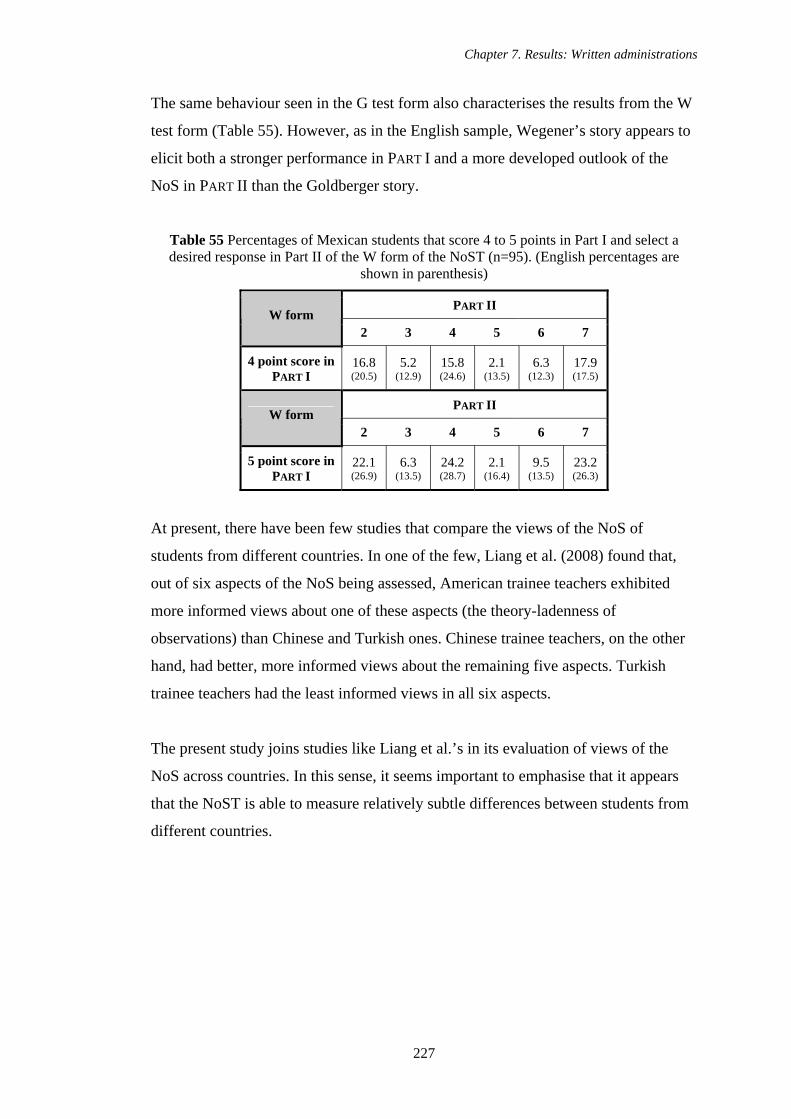
Chapter 7. Results: Written administrations
227
The same behaviour seen in the G test form also characterises the results from the W
test form (Table 55). However, as in the English sample, Wegener’s story appears to
elicit both a stronger performance in PART I and a more developed outlook of the
NoS in PART II than the Goldberger story.
Table 55 Percentages of Mexican students that score 4 to 5 points in Part I and select a desired response in Part II of the W form of the NoST (n=95). (English percentages are
shown in parenthesis)
PART II W form
2 3 4 5 6 7
4 point score in PART I
16.8 (20.5)
5.2 (12.9)
15.8 (24.6)
2.1 (13.5)
6.3 (12.3)
17.9 (17.5)
PART II W form
2 3 4 5 6 7
5 point score in PART I
22.1 (26.9)
6.3 (13.5)
24.2 (28.7)
2.1 (16.4)
9.5 (13.5)
23.2 (26.3)
At present, there have been few studies that compare the views of the NoS of
students from different countries. In one of the few, Liang et al. (2008) found that,
out of six aspects of the NoS being assessed, American trainee teachers exhibited
more informed views about one of these aspects (the theory-ladenness of
observations) than Chinese and Turkish ones. Chinese trainee teachers, on the other
hand, had better, more informed views about the remaining five aspects. Turkish
trainee teachers had the least informed views in all six aspects.
The present study joins studies like Liang et al.’s in its evaluation of views of the
NoS across countries. In this sense, it seems important to emphasise that it appears
that the NoST is able to measure relatively subtle differences between students from
different countries.
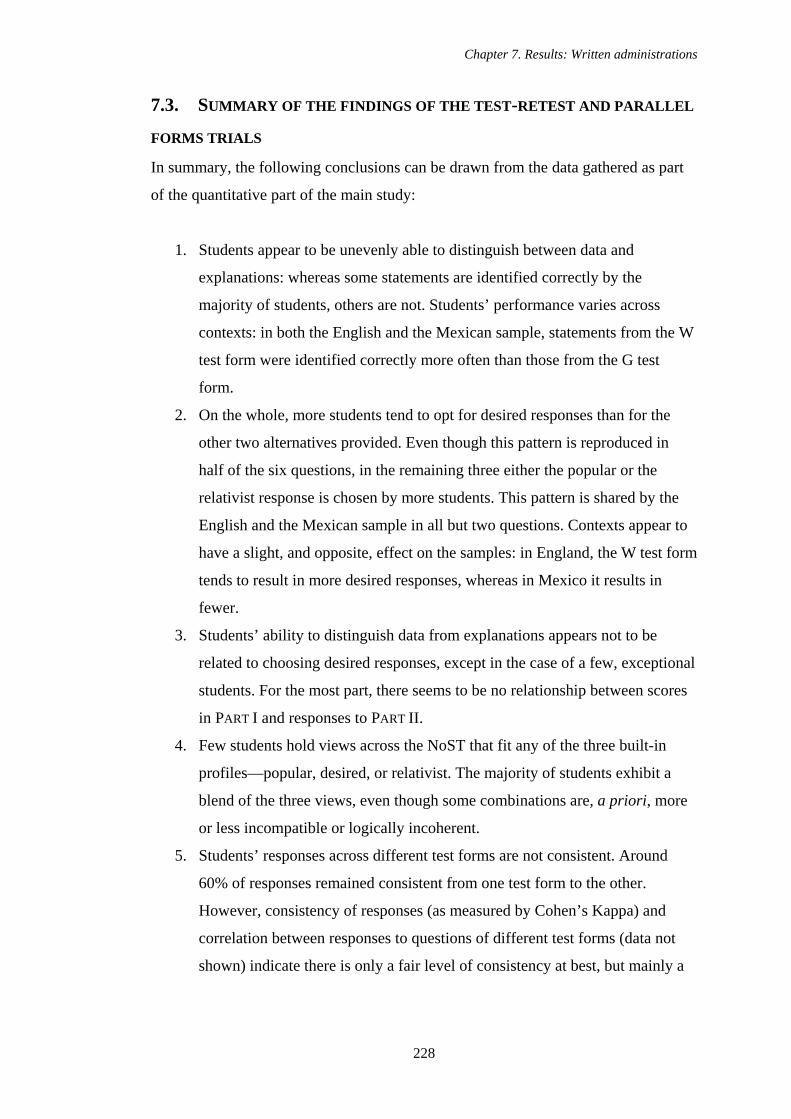
Chapter 7. Results: Written administrations
228
7.3. SUMMARY OF THE FINDINGS OF THE TEST-RETEST AND PARALLEL
FORMS TRIALS In summary, the following conclusions can be drawn from the data gathered as part
of the quantitative part of the main study:
1. Students appear to be unevenly able to distinguish between data and
explanations: whereas some statements are identified correctly by the
majority of students, others are not. Students’ performance varies across
contexts: in both the English and the Mexican sample, statements from the W
test form were identified correctly more often than those from the G test
form.
2. On the whole, more students tend to opt for desired responses than for the
other two alternatives provided. Even though this pattern is reproduced in
half of the six questions, in the remaining three either the popular or the
relativist response is chosen by more students. This pattern is shared by the
English and the Mexican sample in all but two questions. Contexts appear to
have a slight, and opposite, effect on the samples: in England, the W test form
tends to result in more desired responses, whereas in Mexico it results in
fewer.
3. Students’ ability to distinguish data from explanations appears not to be
related to choosing desired responses, except in the case of a few, exceptional
students. For the most part, there seems to be no relationship between scores
in PART I and responses to PART II.
4. Few students hold views across the NoST that fit any of the three built-in
profiles—popular, desired, or relativist. The majority of students exhibit a
blend of the three views, even though some combinations are, a priori, more
or less incompatible or logically incoherent.
5. Students’ responses across different test forms are not consistent. Around
60% of responses remained consistent from one test form to the other.
However, consistency of responses (as measured by Cohen’s Kappa) and
correlation between responses to questions of different test forms (data not
shown) indicate there is only a fair level of consistency at best, but mainly a
Chapter 7. Results: Written administrations
229
lack of consistency between responses—i.e., little context-independence of
students’ views of the NoS—to different contexts.
6. Equally, student’s responses over time are not consistent: a short period of
time between administrations of the same test form influences students’
views of the NoS. Around 50% of responses remained consistent from one
test administration to another. However, consistency of responses (as
measured by Cohen’s Kappa) and correlations between responses to
questions asked in two occasions indicate a low level of consistency—i.e., a
lack of stability in students’ views of the NoS.
7. There are striking similarities between responses of Mexican students and
those of their English counterparts, even though there are significant
differences between curricula (the NoS is a recent innovation in the Mexican
case). However, there are notable, unforeseen disparities between the
samples: students are affected differently by the contexts and Mexican
students tend to exhibit more naïve (popular and/or relativist) views about
some aspects of the NoS. Mexican students are also less able to distinguish
between data and explanations and their responses are less consistent with the
profiles of the NoS.
Chapter 8. Results: Focus groups
230
8. CHAPTER 8
RESULTS: THE FOCUS GROUPS
8.1. STUDENTS’ INTERPRETATIONS OF THE NATURE OF SCIENCE TEST In the best of circumstances, before an assessment instrument is used in research, its
validity has already been established by administering it to members of its target
audience and conducting follow-up interviews to confirm their responses and
interpretations. Due to difficulties in arranging access to 16-year old students within
schools in Britain (due to Criminal Records Bureau clearance), the development and
initial evaluation of the validity and reliability of the NoST was informed not by
interviews with students but by written feedback from students and experts, obtained
as part of the pilot study.
Instead of one-on-one interviews, it was decided to conduct focus groups with
Mexican students. The layout of the questions in the NoST, with its three differing
views, seemed ideally suited to a focus group approach, since this technique has been
recommended for eliciting discussion among participants (see Methods in Section
5.2.3). Focus groups were conducted in schools in Mexico rather than Britain for two
reasons: access to a larger number of students and no language barrier—it was
believed that focus groups with Spanish-speaking students’ would allow a much
more in-depth exploration of their views.
In light of the limited access to students, it was decided to postpone this important
step of the validation process until after completion of the pilot study. The main
study would then proceed with the evaluation of the validity of the NoST while
probing students’ views of the NoS and the reasons behind them. In this way, the
most would be made of the limited opportunities to talk to students.
Both aims were met by corroborating that the answer options reflected accurately
students’ views and that students’ interpretations of the questions matched those of
the test developers and the experts. Focus groups invited students to define and
provide examples of concepts such as “observation”, “explanation”, “personal
experience”, and “scientific method”. By explaining their views with their own
Chapter 8. Results: Focus groups
231
words, students provided a way of gauging whether their interpretations matched the
intended ones and whether they justified their views adequately. In the past, this
strategy has helped uncover misinterpretations and inconsistent justifications, as
documented respectively by Lederman and O’Malley (1990) and Aikenhead et al.
(1987).
Even though an exploration of the reasoning behind students’ views is relevant in
itself, it also contributes to the validation process: students might appear to hold
desired views of the NoS, but their reasons for doing so might be incongruous or
mistaken. If this were to be the case, inferences based on students’ responses might
lead users of the NoST to unwarranted or equivocal conclusions about students’
views. Therefore, exploring students’ rationales can help eventual users appreciate
the limits of the NoST—for instance, by revealing which aspects of the NoS play a
role in students’ thinking but are not covered by the test itself.
Focus groups were chosen for a number of reasons, chief among them that they have
been found to elicit diverse opinions and invite discussion among participants.
Interviewees usually feel compelled to explain and/or justify their views—to make
explicit their assumptions and rationales (Morgan, 1996). To make the most of the
limited time available, and fulfil the aims of this part of the main study, a focus
group guide was prepared and adhered to. The following discussion will, for the most
part, use this guide to organise and present students’ responses.
In total, 14 focus groups with three participants each (for a total of 42 students) were
conducted: 12 focus groups were conducted in a Mexican secondary school with
students of between 16 and 18 years of age and 2 were conducted in a British
secondary school with students of similar age. All groups lasted approximately one
hour, and were tape-recorded and transcribed in full for analysis. Two researchers in
the field of educational studies reviewed the recordings; interpretations of students’
responses were discussed and agreed upon by both.
In extracts from the transcripts, each student is given an alphanumerical code where
the numeral indicates the focus group that he or she belongs to while the letter
identifies each of the three participants. Focus groups 1 to 12 belong to the Mexican
Chapter 8. Results: Focus groups
232
sample; 13 and 14 to the English one. Within square brackets are shown the number
of times a particular idea was mentioned. When an idea was mentioned several times
by the same student, it was only counted once. The only exception to this rule occurs
in the discussion of Question 1, where a number of students were asked to justify
their decisions—about the classification of statements as either data or
explanations—more than once. Comments in Spanish have been translated
preserving as much as possible their original wording without losing any of its
meaning.
For each of the seven questions of the NoST, results from the focus groups will be
presented and discussed starting with students’ reasons for choosing a particular
answer option, followed by a brief account of any insights into students’
understandings uncovered in the course of the analysis. The account ends with
students’ interpretations of key terms found in the questions.
8.1.1. STUDENTS’ INTERPRETATIONS AND JUSTIFICATIONS OF RESPONSES TO
QUESTION 1
Before embarking in a detailed account of the findings of the focus groups in
Question 1 of the NoST, it is worth saying that no important differences were evident
between the responses of Mexican and English students. This is an interesting
finding, since it could mean that the ability to identify data from an explanation, and
vice versa, does not depend on the different national curricula. Still, the small sample
of English students is reason enough to be cautious—a larger sample would be
needed for corroboration purposes.
Focus groups aimed to find out if students were able to explain and/or justify their
choices correctly and explore students’ explicit understanding of “data” and
“explanations”. In each focus group, students were first asked to classify each of the
five statements of Question 1 as either data or an explanation. Then all three were
asked to justify their choice at least once. After hearing them out, they were asked to
define “data” and “explanations”, explain what makes them different, and say what
scientists have to do to obtain them.
Chapter 8. Results: Focus groups
233
In 21 separate occasions students classified a statement correctly and justified their
decision adequately, by explaining with accuracy the difference between data and
explanations as it applied to the statement at hand. In 20 separate occasions students
failed to classify a statement correctly and justified their decision inadequately,
exhibiting an unclear or inadequate understanding of the meanings of “data” and
“explanation”. Thus, in 41 out of 58 occasions (more than two thirds of the time)
students’ classifications agreed with the correctness of their justifications.
In 12 separate occasions students classified a statement correctly but provided an
equivocal, unclear, or incorrect justification. In 5 separate occasions students failed
to classify a statement correctly but gave a justification that suggested they
understand the meanings of “data” and “explanations”. This means that in 17 out of
58 occasions (less than a third of the time) students’ classifications did not agree with
the correctness of their justifications.
These findings lend some support to the view that the ability to distinguish between
observational and explanatory statements does reflect, at least to some extent, an
understanding of the character of data and explanations that students can put into
words. Below are examples of each of the four combinations above, starting with
students who correctly classified and justified their decisions:
Yeah, it’s data [“No one in the first group gets pellagra, but half the prisoners in the second group do”] because you can base something on it; for example, if you see that half of the ill people didn’t get sicker, you could then look for other explanations besides milk. Because it doesn’t work for all people, you would need to do more studies to clear that up.
(Student 1A)
[It’s an] explanation [“The sea bed slowly spreads, pushing the continents apart”], because, yes, they are explaining why the continents drifted apart. It had already been noticed that their shapes matched one another, so [scientists], well, they thought that sometime in the past [the continents] had been together—and in that way they explained why they are now apart, because the sea bed is spreading.
(Student 2B)
Chapter 8. Results: Focus groups
234
By contrast, the following three extracts are examples of, respectively, an incorrect
classification justified equivocally or incorrectly, a correct classification justified
equivocally (a false positive), and an incorrect identification justified by reasoning
that is correct (a false negative):
It is data [“Many orphans and mental patients quickly recover after having milk”], because that’s what happened first: it was seen that they were cured or got better. That, for me, is an explanation. And the next [statement], “Milk contains something that cures pellagra”, is data because we already had a precedent: [patients] had recovered before.
(Student 1C)
I thought that it was an explanation [“Typhus and yellow fever are caused by microbes’], because it’s answering a question—I mean, what is typhus and yellow fever. They are giving us an answer, so it’s more like an explanation because, well, it’s kind of more cultural, you could say. They are explaining to me what is typhus and yellow fever.
(Student 2A)
Yes [it’s an explanation], because it’s saying why: it says “Many orphans and mental patients quickly recover after having milk”, so it’s saying why they recover, that is, because they drank milk.
(Student 1B)
Even though students found it difficult to define “data” and “explanations” in their
own words, a large proportion seemed to understand, at least intuitively, their
meanings. The majority of students [38] made explicit reference to the empirical
(either observational or experimental) character of data, as exemplified by sayings
such as “data is that which is observed” (student 2B). Some students went on to
comment that data are known or established facts [13], specific or concrete cases [3],
quantitative measurements [5], or samples taken from the world [4]. Many also
added that data are the product of scientific research [27], observations [11], or
experiments [11]. Below are two examples of responses to this subject:
If it’s something [research] in biology where, for example, you have to work with soil or plants, you can go to a specific area under study and collect data—for instance, of plants that are dying or not, where they are located or something like that.
(Student 1B)
Chapter 8. Results: Focus groups
235
Can data be seen? Yeah, they can be seen. They are in everything that’s around us, in the environment. Depending on the situation scientists find themselves in, they can make observations in the environment and collect data or take a measurement, I don’t know, it all depends on what they are doing.
(Student 5A)
Curiously enough, and in stark contrast to the opinion of the majority, three students
explicitly claimed that some kinds of data cannot be seen or perceived but were
unable to give further clarification of what they meant.
In contrast to the widespread agreement on the nature of data, defining
“explanations” proved to be more challenging. A few students [9] appeared to be
very indecisive and inaccurate, even confusing both terms:
Interviewer: So, you think that the statement “Typhus and yellow fever are caused by microbes” is data. You’ve also told me that an explanation tells you why something happens or what causes something to happen. Wouldn’t that statement be an answer to what causes both those diseases?
Student 1C: It’s a data-explanation, then?
Almost half the students [21] claimed, correctly, that explaining something implied
saying why it happens, what were the reasons behind it. Some of the students [6] that
appeared not to find the right words relied instead on a “feeling” of explanation: one
can recognise an explanation, so they said, if after hearing or reading it there is a
distinct feeling of understanding:
[I] feel that an explanation is like an answer to a question that I [might] have.
(Student 2A)
[An explanation] is something that clarifies completely, for you, a topic or an issue. It gives you—how can I say it?—a full panorama and contains several data.
(Student 6A)
Chapter 8. Results: Focus groups
236
Asking students about the difference, or the relationship, between data and
explanations provided a measure of confirmation of their misunderstandings and
uncovered unanticipated ones. On the one hand, students believe that data must be
discrete, short, and/or fragmentary parcels of information [5]. Explanations, on the
other hand, must be long, well-developed arguments [8]. Alternatively, some
students felt that data are superficial [3], whereas explanations are in-depth
arguments [5]. This last idea, that explanations are more in-depth claims than data,
suggests that students intuitively grasp the essence of inferring from what is
apparent, from the surface of events: an inference implies going beyond (or deeper
into) what is apparent.
The origin of explanations appeared to baffle students more than that of data.
Students are less clear about what has to be done to come up with an explanation—
they seem to believe that explanations will spring automatically from the data [25], a
position akin to a naïve inductivism:
You know [to come up with an explanation, you have to] carry out activities in which the data are connected and, say, linked with each other—how can I say it? Link the data: that will lead you to an explanation.
(Student 2B)
A datum is like a piece of information: you research something and then, in order to reach a conclusion, you have to base it on certain data, certain kinds of information, [make] an explanation based on those data.
(Student 8C)
Well, I think that data are little pieces of information that help us to, well—when we put them together they allow us to draw explanations and conclusions.
(Student 8B)
Given the above, it seems that students believe that only data—and not other
explanations—can be used to build an explanation. In this sense, students’
conception of an explanation does not seem to include the “covering law” model of
explanation, whereby specific, observed conditions and a general, explanatory law
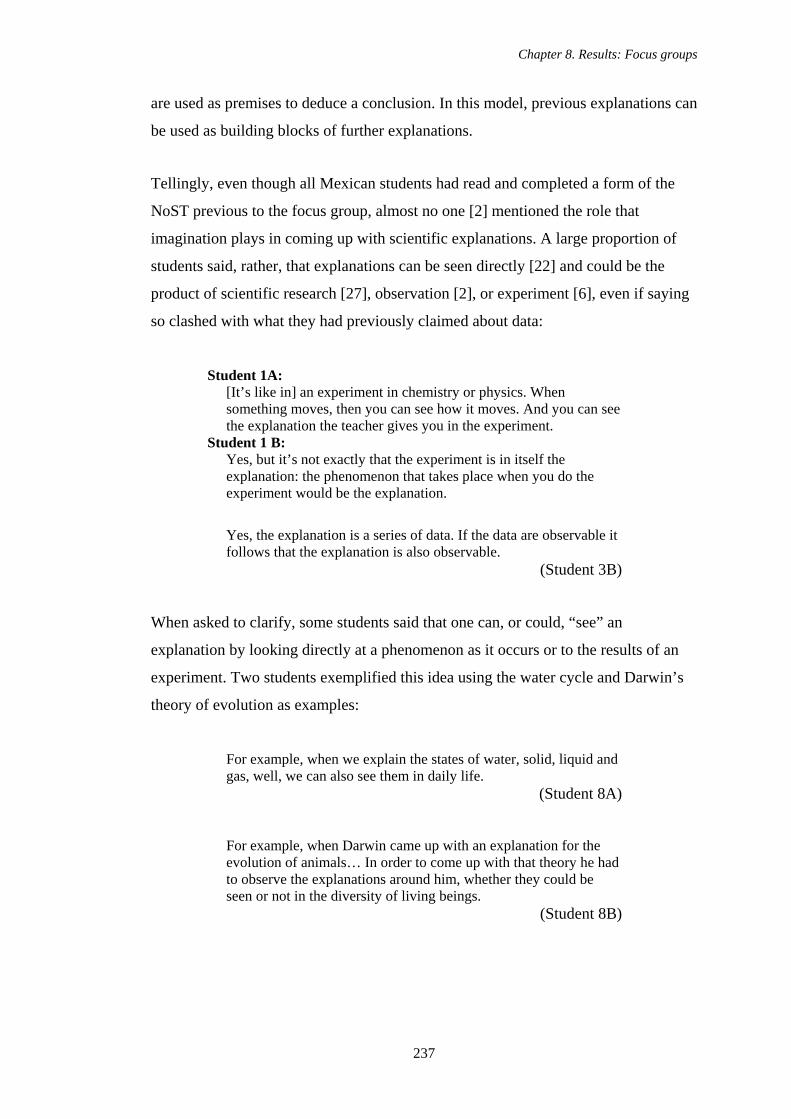
Chapter 8. Results: Focus groups
237
are used as premises to deduce a conclusion. In this model, previous explanations can
be used as building blocks of further explanations.
Tellingly, even though all Mexican students had read and completed a form of the
NoST previous to the focus group, almost no one [2] mentioned the role that
imagination plays in coming up with scientific explanations. A large proportion of
students said, rather, that explanations can be seen directly [22] and could be the
product of scientific research [27], observation [2], or experiment [6], even if saying
so clashed with what they had previously claimed about data:
Student 1A: [It’s like in] an experiment in chemistry or physics. When something moves, then you can see how it moves. And you can see the explanation the teacher gives you in the experiment.
Student 1 B: Yes, but it’s not exactly that the experiment is in itself the explanation: the phenomenon that takes place when you do the experiment would be the explanation.
Yes, the explanation is a series of data. If the data are observable it follows that the explanation is also observable.
(Student 3B)
When asked to clarify, some students said that one can, or could, “see” an
explanation by looking directly at a phenomenon as it occurs or to the results of an
experiment. Two students exemplified this idea using the water cycle and Darwin’s
theory of evolution as examples:
For example, when we explain the states of water, solid, liquid and gas, well, we can also see them in daily life.
(Student 8A)
For example, when Darwin came up with an explanation for the evolution of animals… In order to come up with that theory he had to observe the explanations around him, whether they could be seen or not in the diversity of living beings.
(Student 8B)
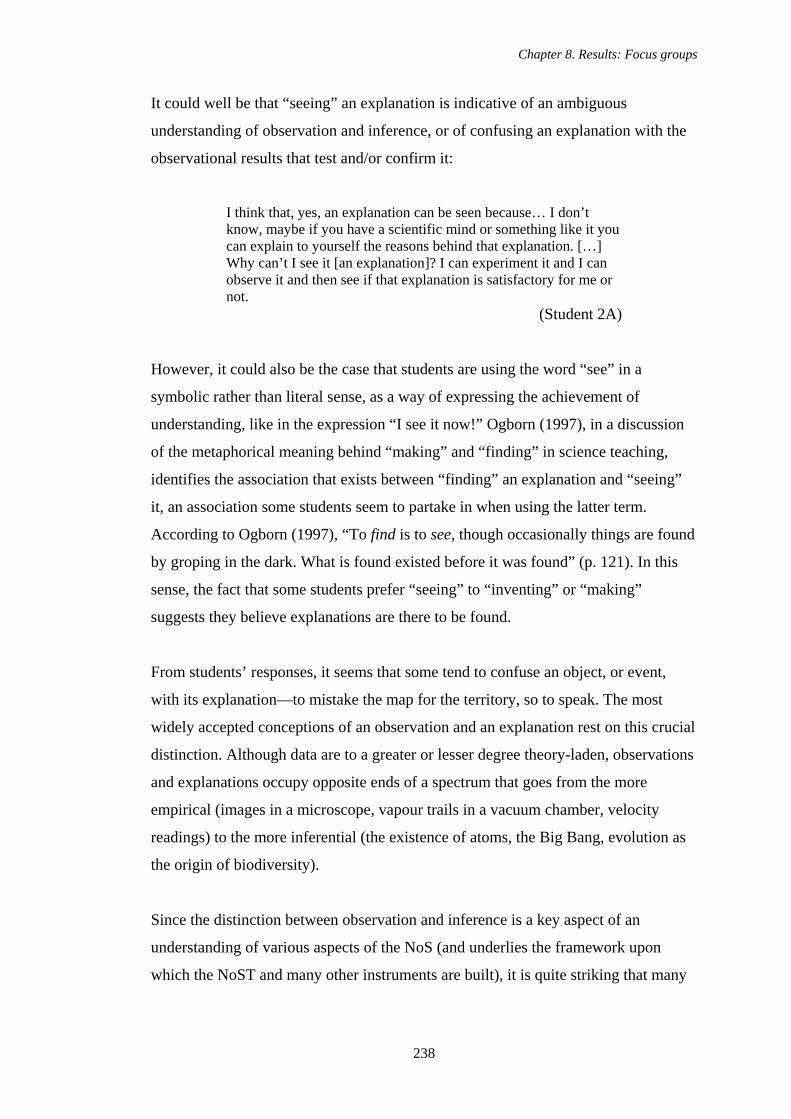
Chapter 8. Results: Focus groups
238
It could well be that “seeing” an explanation is indicative of an ambiguous
understanding of observation and inference, or of confusing an explanation with the
observational results that test and/or confirm it:
I think that, yes, an explanation can be seen because… I don’t know, maybe if you have a scientific mind or something like it you can explain to yourself the reasons behind that explanation. […] Why can’t I see it [an explanation]? I can experiment it and I can observe it and then see if that explanation is satisfactory for me or not.
(Student 2A)
However, it could also be the case that students are using the word “see” in a
symbolic rather than literal sense, as a way of expressing the achievement of
understanding, like in the expression “I see it now!” Ogborn (1997), in a discussion
of the metaphorical meaning behind “making” and “finding” in science teaching,
identifies the association that exists between “finding” an explanation and “seeing”
it, an association some students seem to partake in when using the latter term.
According to Ogborn (1997), “To find is to see, though occasionally things are found
by groping in the dark. What is found existed before it was found” (p. 121). In this
sense, the fact that some students prefer “seeing” to “inventing” or “making”
suggests they believe explanations are there to be found.
From students’ responses, it seems that some tend to confuse an object, or event,
with its explanation—to mistake the map for the territory, so to speak. The most
widely accepted conceptions of an observation and an explanation rest on this crucial
distinction. Although data are to a greater or lesser degree theory-laden, observations
and explanations occupy opposite ends of a spectrum that goes from the more
empirical (images in a microscope, vapour trails in a vacuum chamber, velocity
readings) to the more inferential (the existence of atoms, the Big Bang, evolution as
the origin of biodiversity).
Since the distinction between observation and inference is a key aspect of an
understanding of various aspects of the NoS (and underlies the framework upon
which the NoST and many other instruments are built), it is quite striking that many
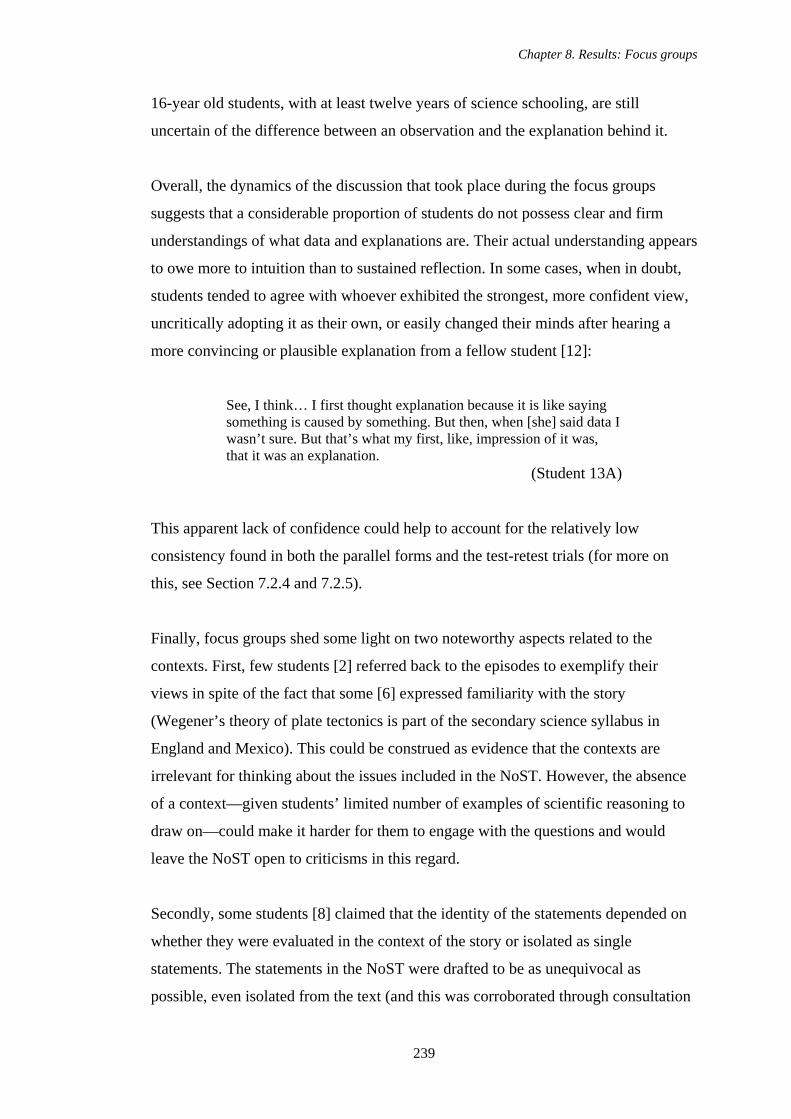
Chapter 8. Results: Focus groups
239
16-year old students, with at least twelve years of science schooling, are still
uncertain of the difference between an observation and the explanation behind it.
Overall, the dynamics of the discussion that took place during the focus groups
suggests that a considerable proportion of students do not possess clear and firm
understandings of what data and explanations are. Their actual understanding appears
to owe more to intuition than to sustained reflection. In some cases, when in doubt,
students tended to agree with whoever exhibited the strongest, more confident view,
uncritically adopting it as their own, or easily changed their minds after hearing a
more convincing or plausible explanation from a fellow student [12]:
See, I think… I first thought explanation because it is like saying something is caused by something. But then, when [she] said data I wasn’t sure. But that’s what my first, like, impression of it was, that it was an explanation.
(Student 13A)
This apparent lack of confidence could help to account for the relatively low
consistency found in both the parallel forms and the test-retest trials (for more on
this, see Section 7.2.4 and 7.2.5).
Finally, focus groups shed some light on two noteworthy aspects related to the
contexts. First, few students [2] referred back to the episodes to exemplify their
views in spite of the fact that some [6] expressed familiarity with the story
(Wegener’s theory of plate tectonics is part of the secondary science syllabus in
England and Mexico). This could be construed as evidence that the contexts are
irrelevant for thinking about the issues included in the NoST. However, the absence
of a context—given students’ limited number of examples of scientific reasoning to
draw on—could make it harder for them to engage with the questions and would
leave the NoST open to criticisms in this regard.
Secondly, some students [8] claimed that the identity of the statements depended on
whether they were evaluated in the context of the story or isolated as single
statements. The statements in the NoST were drafted to be as unequivocal as
possible, even isolated from the text (and this was corroborated through consultation
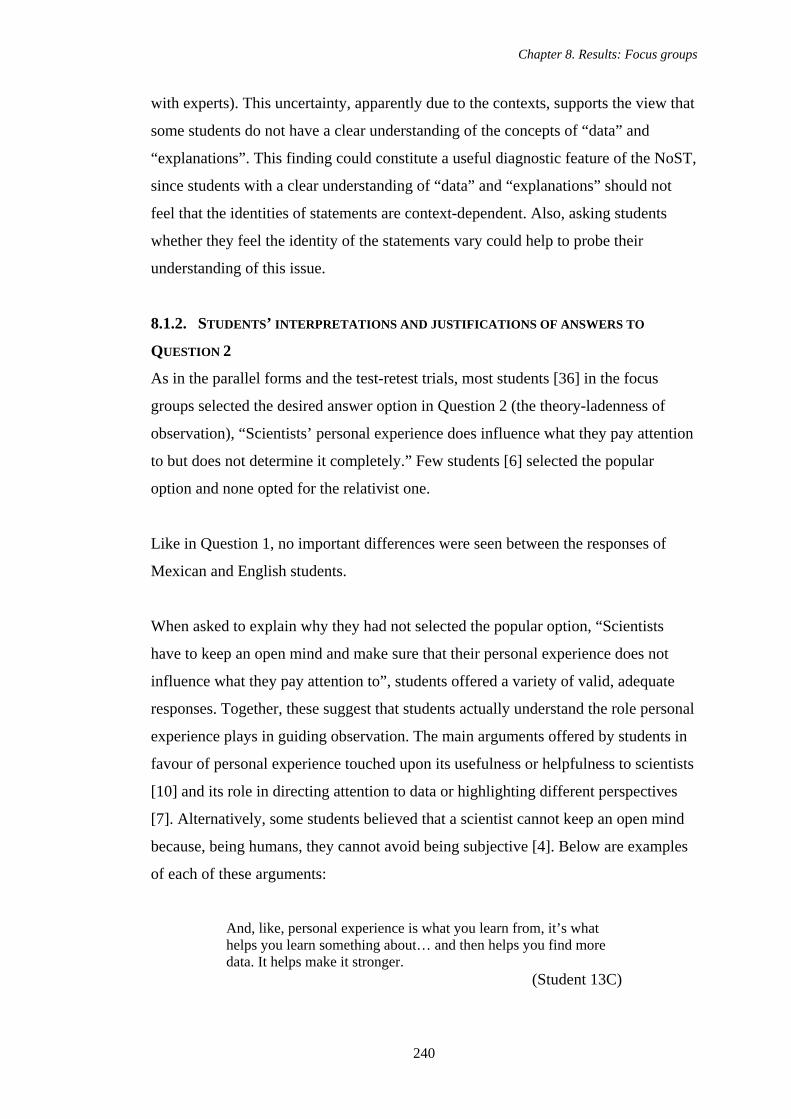
Chapter 8. Results: Focus groups
240
with experts). This uncertainty, apparently due to the contexts, supports the view that
some students do not have a clear understanding of the concepts of “data” and
“explanations”. This finding could constitute a useful diagnostic feature of the NoST,
since students with a clear understanding of “data” and “explanations” should not
feel that the identities of statements are context-dependent. Also, asking students
whether they feel the identity of the statements vary could help to probe their
understanding of this issue.
8.1.2. STUDENTS’ INTERPRETATIONS AND JUSTIFICATIONS OF ANSWERS TO
QUESTION 2
As in the parallel forms and the test-retest trials, most students [36] in the focus
groups selected the desired answer option in Question 2 (the theory-ladenness of
observation), “Scientists’ personal experience does influence what they pay attention
to but does not determine it completely.” Few students [6] selected the popular
option and none opted for the relativist one.
Like in Question 1, no important differences were seen between the responses of
Mexican and English students.
When asked to explain why they had not selected the popular option, “Scientists
have to keep an open mind and make sure that their personal experience does not
influence what they pay attention to”, students offered a variety of valid, adequate
responses. Together, these suggest that students actually understand the role personal
experience plays in guiding observation. The main arguments offered by students in
favour of personal experience touched upon its usefulness or helpfulness to scientists
[10] and its role in directing attention to data or highlighting different perspectives
[7]. Alternatively, some students believed that a scientist cannot keep an open mind
because, being humans, they cannot avoid being subjective [4]. Below are examples
of each of these arguments:
And, like, personal experience is what you learn from, it’s what helps you learn something about… and then helps you find more data. It helps make it stronger.
(Student 13C)
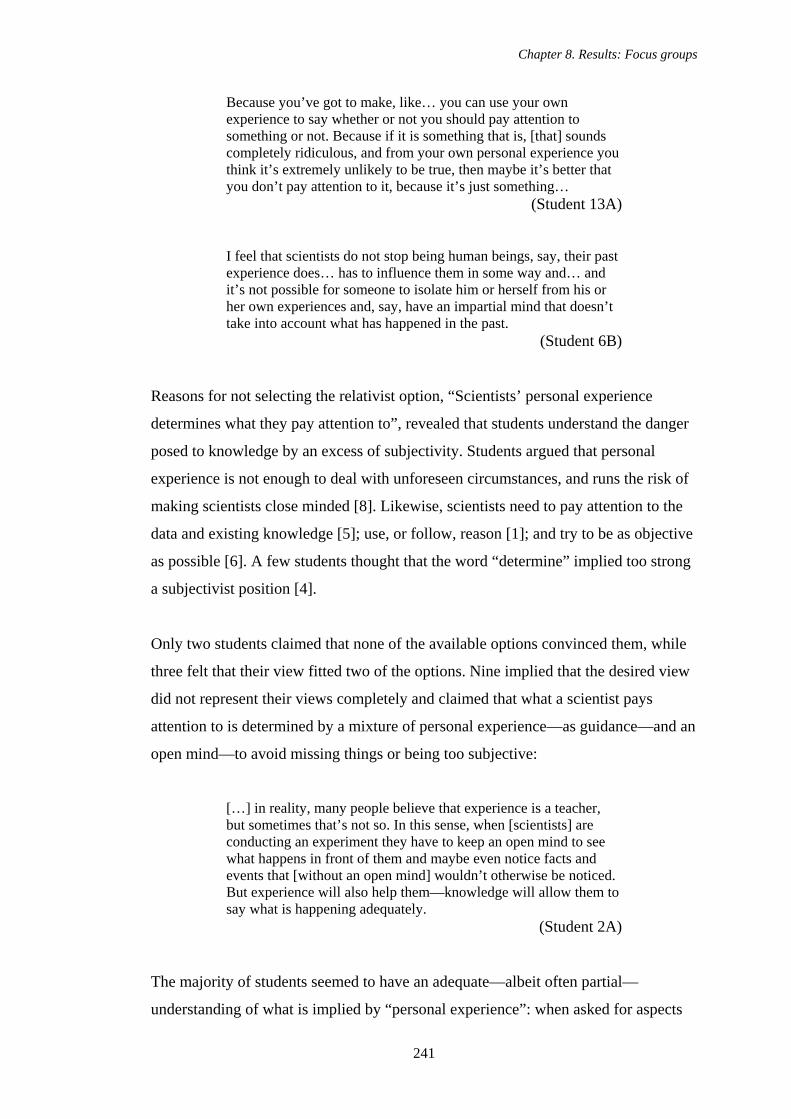
Chapter 8. Results: Focus groups
241
Because you’ve got to make, like… you can use your own experience to say whether or not you should pay attention to something or not. Because if it is something that is, [that] sounds completely ridiculous, and from your own personal experience you think it’s extremely unlikely to be true, then maybe it’s better that you don’t pay attention to it, because it’s just something…
(Student 13A)
I feel that scientists do not stop being human beings, say, their past experience does… has to influence them in some way and… and it’s not possible for someone to isolate him or herself from his or her own experiences and, say, have an impartial mind that doesn’t take into account what has happened in the past.
(Student 6B)
Reasons for not selecting the relativist option, “Scientists’ personal experience
determines what they pay attention to”, revealed that students understand the danger
posed to knowledge by an excess of subjectivity. Students argued that personal
experience is not enough to deal with unforeseen circumstances, and runs the risk of
making scientists close minded [8]. Likewise, scientists need to pay attention to the
data and existing knowledge [5]; use, or follow, reason [1]; and try to be as objective
as possible [6]. A few students thought that the word “determine” implied too strong
a subjectivist position [4].
Only two students claimed that none of the available options convinced them, while
three felt that their view fitted two of the options. Nine implied that the desired view
did not represent their views completely and claimed that what a scientist pays
attention to is determined by a mixture of personal experience—as guidance—and an
open mind—to avoid missing things or being too subjective:
[…] in reality, many people believe that experience is a teacher, but sometimes that’s not so. In this sense, when [scientists] are conducting an experiment they have to keep an open mind to see what happens in front of them and maybe even notice facts and events that [without an open mind] wouldn’t otherwise be noticed. But experience will also help them—knowledge will allow them to say what is happening adequately.
(Student 2A)
The majority of students seemed to have an adequate—albeit often partial—
understanding of what is implied by “personal experience”: when asked for aspects
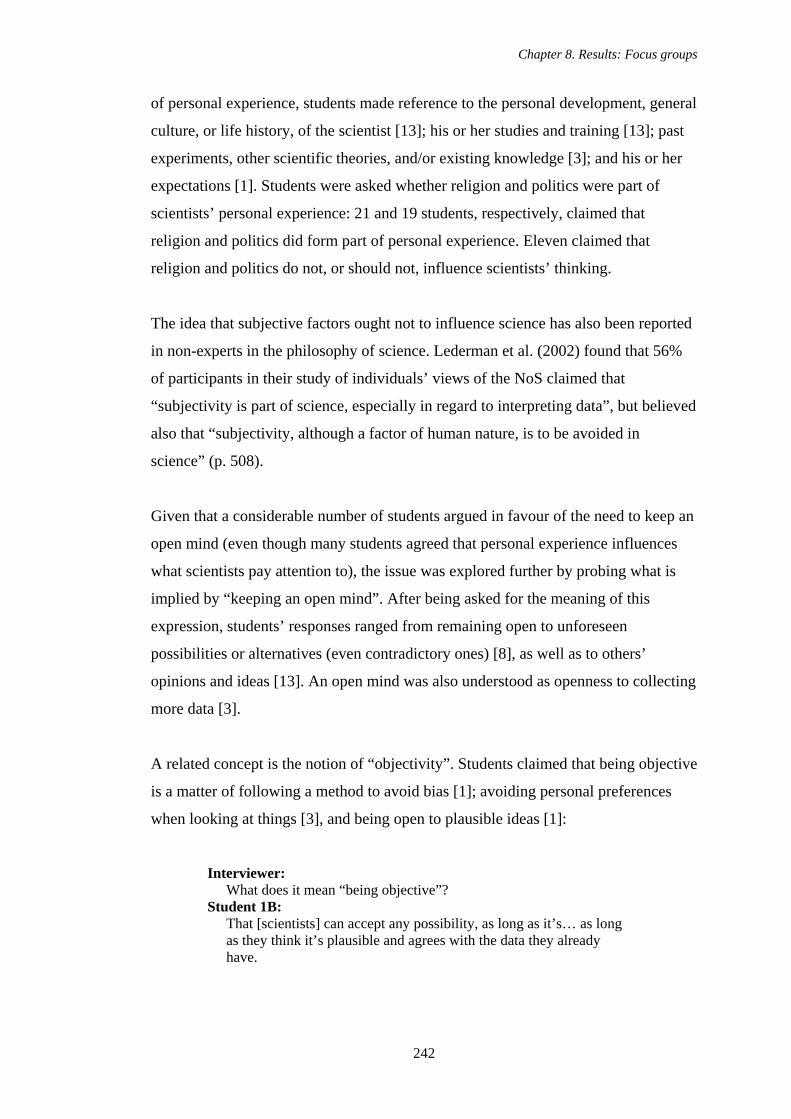
Chapter 8. Results: Focus groups
242
of personal experience, students made reference to the personal development, general
culture, or life history, of the scientist [13]; his or her studies and training [13]; past
experiments, other scientific theories, and/or existing knowledge [3]; and his or her
expectations [1]. Students were asked whether religion and politics were part of
scientists’ personal experience: 21 and 19 students, respectively, claimed that
religion and politics did form part of personal experience. Eleven claimed that
religion and politics do not, or should not, influence scientists’ thinking.
The idea that subjective factors ought not to influence science has also been reported
in non-experts in the philosophy of science. Lederman et al. (2002) found that 56%
of participants in their study of individuals’ views of the NoS claimed that
“subjectivity is part of science, especially in regard to interpreting data”, but believed
also that “subjectivity, although a factor of human nature, is to be avoided in
science” (p. 508).
Given that a considerable number of students argued in favour of the need to keep an
open mind (even though many students agreed that personal experience influences
what scientists pay attention to), the issue was explored further by probing what is
implied by “keeping an open mind”. After being asked for the meaning of this
expression, students’ responses ranged from remaining open to unforeseen
possibilities or alternatives (even contradictory ones) [8], as well as to others’
opinions and ideas [13]. An open mind was also understood as openness to collecting
more data [3].
A related concept is the notion of “objectivity”. Students claimed that being objective
is a matter of following a method to avoid bias [1]; avoiding personal preferences
when looking at things [3], and being open to plausible ideas [1]:
Interviewer: What does it mean “being objective”?
Student 1B: That [scientists] can accept any possibility, as long as it’s… as long as they think it’s plausible and agrees with the data they already have.
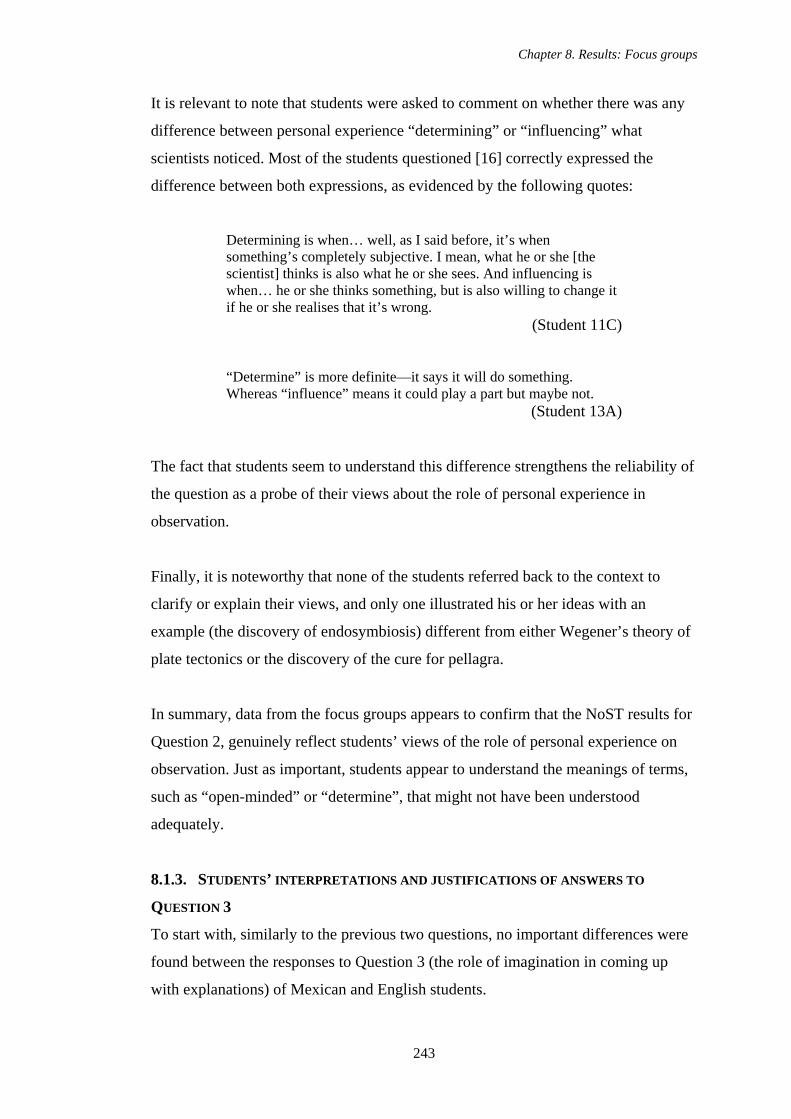
Chapter 8. Results: Focus groups
243
It is relevant to note that students were asked to comment on whether there was any
difference between personal experience “determining” or “influencing” what
scientists noticed. Most of the students questioned [16] correctly expressed the
difference between both expressions, as evidenced by the following quotes:
Determining is when… well, as I said before, it’s when something’s completely subjective. I mean, what he or she [the scientist] thinks is also what he or she sees. And influencing is when… he or she thinks something, but is also willing to change it if he or she realises that it’s wrong.
(Student 11C)
“Determine” is more definite—it says it will do something. Whereas “influence” means it could play a part but maybe not.
(Student 13A)
The fact that students seem to understand this difference strengthens the reliability of
the question as a probe of their views about the role of personal experience in
observation.
Finally, it is noteworthy that none of the students referred back to the context to
clarify or explain their views, and only one illustrated his or her ideas with an
example (the discovery of endosymbiosis) different from either Wegener’s theory of
plate tectonics or the discovery of the cure for pellagra.
In summary, data from the focus groups appears to confirm that the NoST results for
Question 2, genuinely reflect students’ views of the role of personal experience on
observation. Just as important, students appear to understand the meanings of terms,
such as “open-minded” or “determine”, that might not have been understood
adequately.
8.1.3. STUDENTS’ INTERPRETATIONS AND JUSTIFICATIONS OF ANSWERS TO
QUESTION 3
To start with, similarly to the previous two questions, no important differences were
found between the responses to Question 3 (the role of imagination in coming up
with explanations) of Mexican and English students.
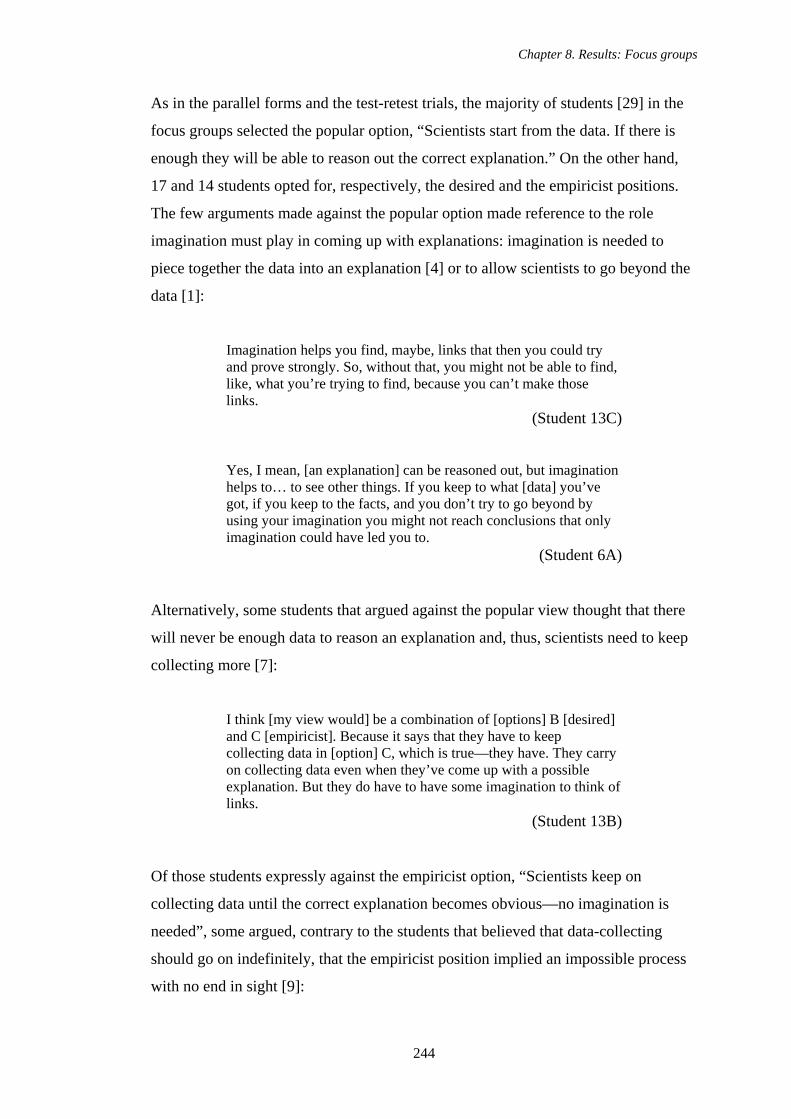
Chapter 8. Results: Focus groups
244
As in the parallel forms and the test-retest trials, the majority of students [29] in the
focus groups selected the popular option, “Scientists start from the data. If there is
enough they will be able to reason out the correct explanation.” On the other hand,
17 and 14 students opted for, respectively, the desired and the empiricist positions.
The few arguments made against the popular option made reference to the role
imagination must play in coming up with explanations: imagination is needed to
piece together the data into an explanation [4] or to allow scientists to go beyond the
data [1]:
Imagination helps you find, maybe, links that then you could try and prove strongly. So, without that, you might not be able to find, like, what you’re trying to find, because you can’t make those links.
(Student 13C)
Yes, I mean, [an explanation] can be reasoned out, but imagination helps to… to see other things. If you keep to what [data] you’ve got, if you keep to the facts, and you don’t try to go beyond by using your imagination you might not reach conclusions that only imagination could have led you to.
(Student 6A)
Alternatively, some students that argued against the popular view thought that there
will never be enough data to reason an explanation and, thus, scientists need to keep
collecting more [7]:
I think [my view would] be a combination of [options] B [desired] and C [empiricist]. Because it says that they have to keep collecting data in [option] C, which is true—they have. They carry on collecting data even when they’ve come up with a possible explanation. But they do have to have some imagination to think of links.
(Student 13B)
Of those students expressly against the empiricist option, “Scientists keep on
collecting data until the correct explanation becomes obvious—no imagination is
needed”, some argued, contrary to the students that believed that data-collecting
should go on indefinitely, that the empiricist position implied an impossible process
with no end in sight [9]:
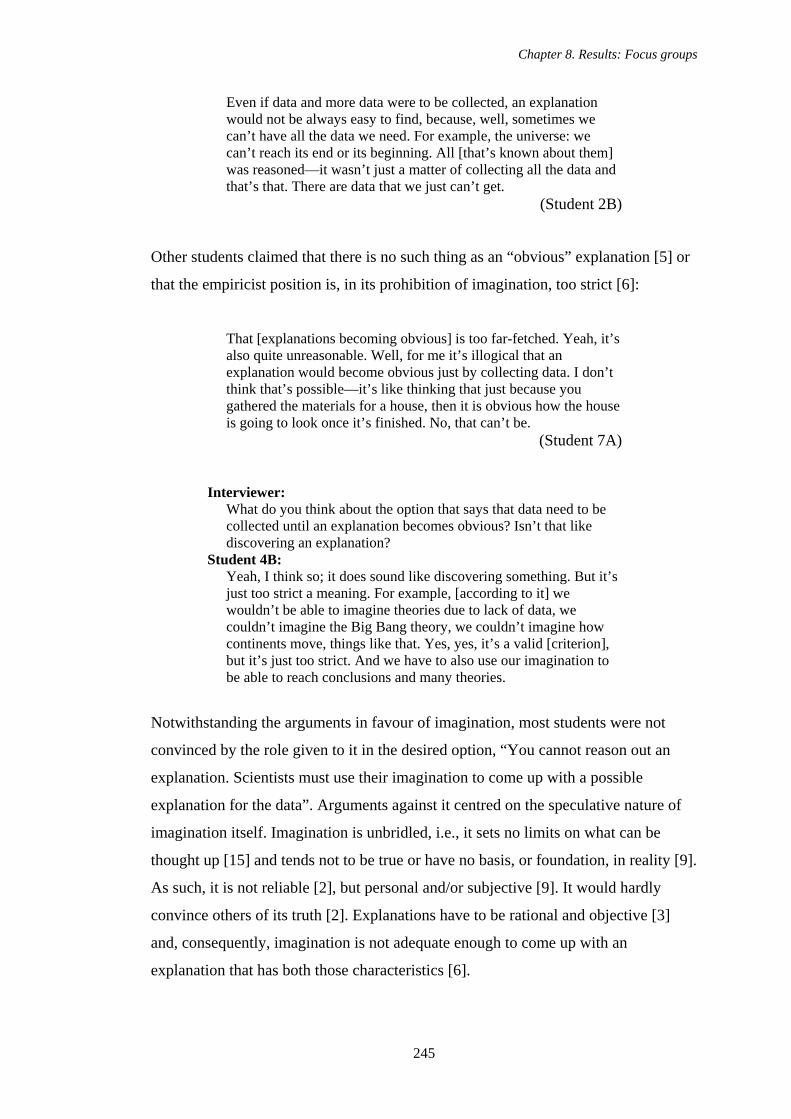
Chapter 8. Results: Focus groups
245
Even if data and more data were to be collected, an explanation would not be always easy to find, because, well, sometimes we can’t have all the data we need. For example, the universe: we can’t reach its end or its beginning. All [that’s known about them] was reasoned—it wasn’t just a matter of collecting all the data and that’s that. There are data that we just can’t get.
(Student 2B)
Other students claimed that there is no such thing as an “obvious” explanation [5] or
that the empiricist position is, in its prohibition of imagination, too strict [6]:
That [explanations becoming obvious] is too far-fetched. Yeah, it’s also quite unreasonable. Well, for me it’s illogical that an explanation would become obvious just by collecting data. I don’t think that’s possible—it’s like thinking that just because you gathered the materials for a house, then it is obvious how the house is going to look once it’s finished. No, that can’t be.
(Student 7A)
Interviewer: What do you think about the option that says that data need to be collected until an explanation becomes obvious? Isn’t that like discovering an explanation?
Student 4B: Yeah, I think so; it does sound like discovering something. But it’s just too strict a meaning. For example, [according to it] we wouldn’t be able to imagine theories due to lack of data, we couldn’t imagine the Big Bang theory, we couldn’t imagine how continents move, things like that. Yes, yes, it’s a valid [criterion], but it’s just too strict. And we have to also use our imagination to be able to reach conclusions and many theories.
Notwithstanding the arguments in favour of imagination, most students were not
convinced by the role given to it in the desired option, “You cannot reason out an
explanation. Scientists must use their imagination to come up with a possible
explanation for the data”. Arguments against it centred on the speculative nature of
imagination itself. Imagination is unbridled, i.e., it sets no limits on what can be
thought up [15] and tends not to be true or have no basis, or foundation, in reality [9].
As such, it is not reliable [2], but personal and/or subjective [9]. It would hardly
convince others of its truth [2]. Explanations have to be rational and objective [3]
and, consequently, imagination is not adequate enough to come up with an
explanation that has both those characteristics [6].
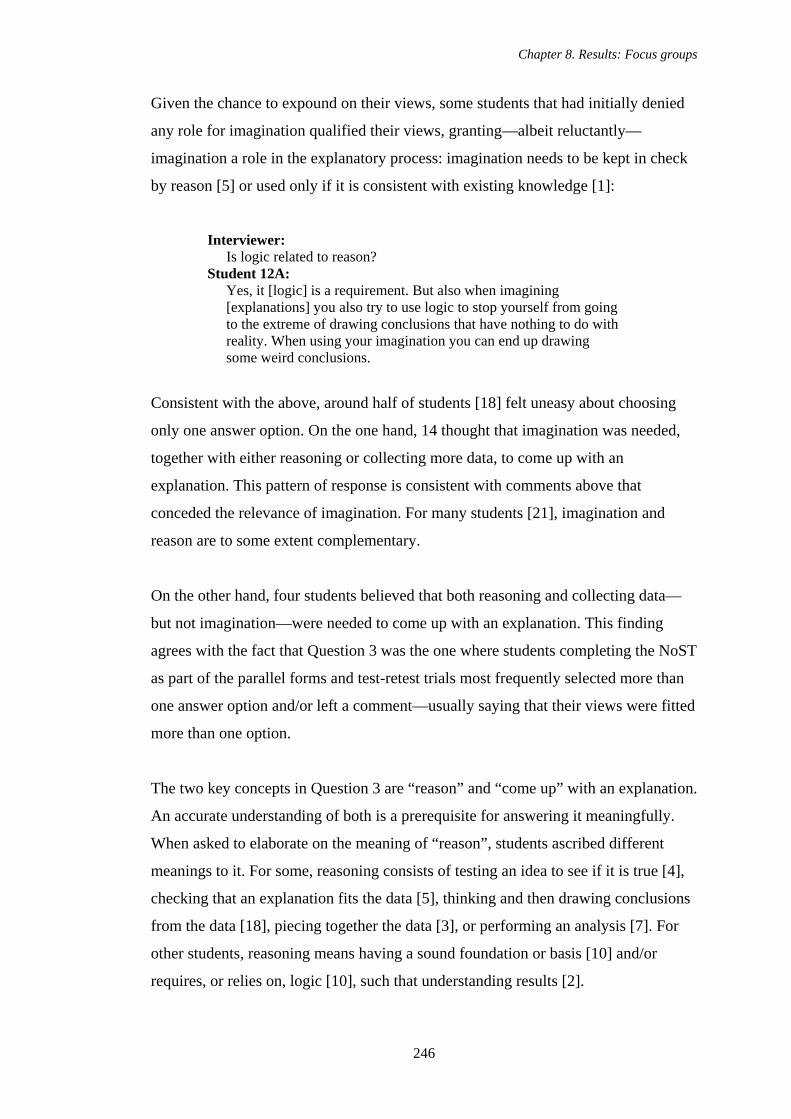
Chapter 8. Results: Focus groups
246
Given the chance to expound on their views, some students that had initially denied
any role for imagination qualified their views, granting—albeit reluctantly—
imagination a role in the explanatory process: imagination needs to be kept in check
by reason [5] or used only if it is consistent with existing knowledge [1]:
Interviewer: Is logic related to reason?
Student 12A: Yes, it [logic] is a requirement. But also when imagining [explanations] you also try to use logic to stop yourself from going to the extreme of drawing conclusions that have nothing to do with reality. When using your imagination you can end up drawing some weird conclusions.
Consistent with the above, around half of students [18] felt uneasy about choosing
only one answer option. On the one hand, 14 thought that imagination was needed,
together with either reasoning or collecting more data, to come up with an
explanation. This pattern of response is consistent with comments above that
conceded the relevance of imagination. For many students [21], imagination and
reason are to some extent complementary.
On the other hand, four students believed that both reasoning and collecting data—
but not imagination—were needed to come up with an explanation. This finding
agrees with the fact that Question 3 was the one where students completing the NoST
as part of the parallel forms and test-retest trials most frequently selected more than
one answer option and/or left a comment—usually saying that their views were fitted
more than one option.
The two key concepts in Question 3 are “reason” and “come up” with an explanation.
An accurate understanding of both is a prerequisite for answering it meaningfully.
When asked to elaborate on the meaning of “reason”, students ascribed different
meanings to it. For some, reasoning consists of testing an idea to see if it is true [4],
checking that an explanation fits the data [5], thinking and then drawing conclusions
from the data [18], piecing together the data [3], or performing an analysis [7]. For
other students, reasoning means having a sound foundation or basis [10] and/or
requires, or relies on, logic [10], such that understanding results [2].
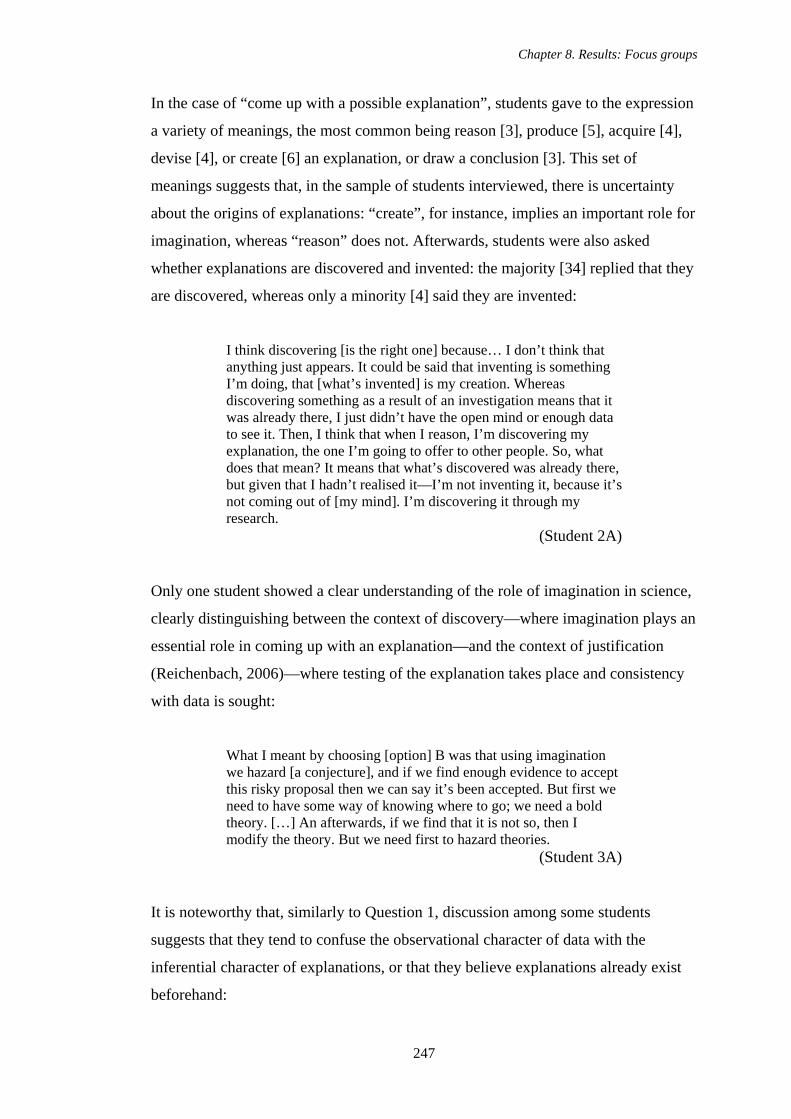
Chapter 8. Results: Focus groups
247
In the case of “come up with a possible explanation”, students gave to the expression
a variety of meanings, the most common being reason [3], produce [5], acquire [4],
devise [4], or create [6] an explanation, or draw a conclusion [3]. This set of
meanings suggests that, in the sample of students interviewed, there is uncertainty
about the origins of explanations: “create”, for instance, implies an important role for
imagination, whereas “reason” does not. Afterwards, students were also asked
whether explanations are discovered and invented: the majority [34] replied that they
are discovered, whereas only a minority [4] said they are invented:
I think discovering [is the right one] because… I don’t think that anything just appears. It could be said that inventing is something I’m doing, that [what’s invented] is my creation. Whereas discovering something as a result of an investigation means that it was already there, I just didn’t have the open mind or enough data to see it. Then, I think that when I reason, I’m discovering my explanation, the one I’m going to offer to other people. So, what does that mean? It means that what’s discovered was already there, but given that I hadn’t realised it—I’m not inventing it, because it’s not coming out of [my mind]. I’m discovering it through my research.
(Student 2A)
Only one student showed a clear understanding of the role of imagination in science,
clearly distinguishing between the context of discovery—where imagination plays an
essential role in coming up with an explanation—and the context of justification
(Reichenbach, 2006)—where testing of the explanation takes place and consistency
with data is sought:
What I meant by choosing [option] B was that using imagination we hazard [a conjecture], and if we find enough evidence to accept this risky proposal then we can say it’s been accepted. But first we need to have some way of knowing where to go; we need a bold theory. […] An afterwards, if we find that it is not so, then I modify the theory. But we need first to hazard theories.
(Student 3A)
It is noteworthy that, similarly to Question 1, discussion among some students
suggests that they tend to confuse the observational character of data with the
inferential character of explanations, or that they believe explanations already exist
beforehand:
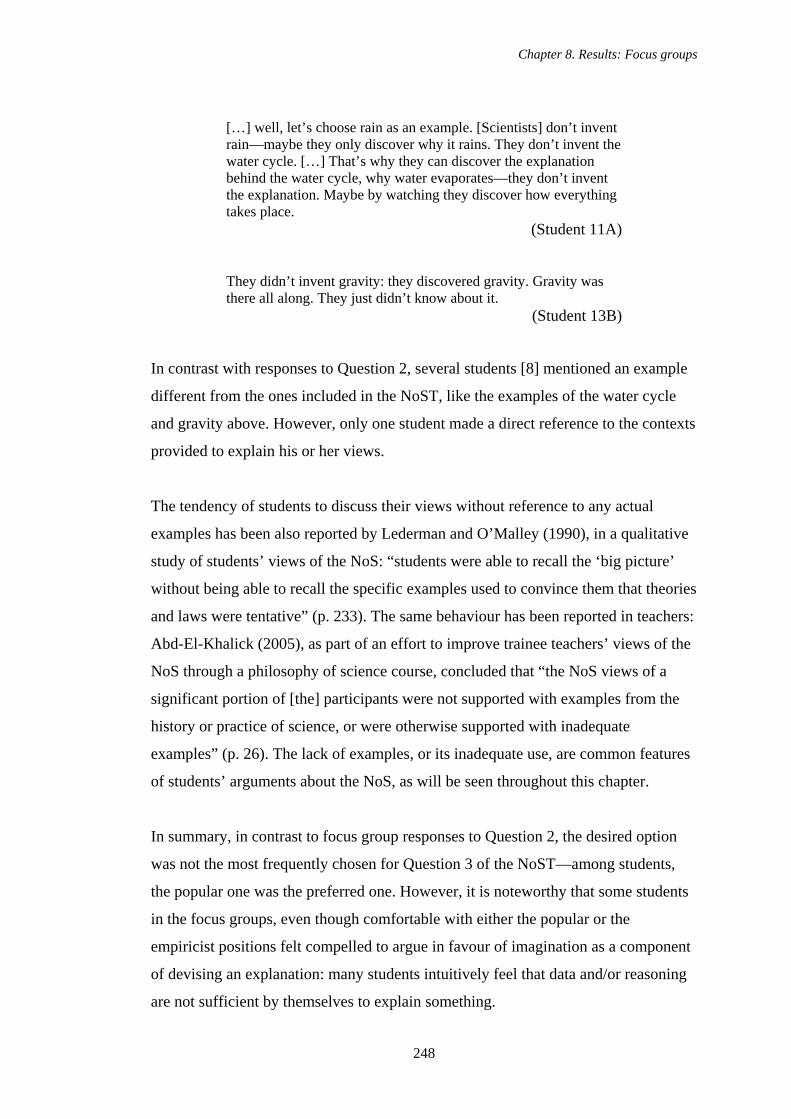
Chapter 8. Results: Focus groups
248
[…] well, let’s choose rain as an example. [Scientists] don’t invent rain—maybe they only discover why it rains. They don’t invent the water cycle. […] That’s why they can discover the explanation behind the water cycle, why water evaporates—they don’t invent the explanation. Maybe by watching they discover how everything takes place.
(Student 11A)
They didn’t invent gravity: they discovered gravity. Gravity was there all along. They just didn’t know about it.
(Student 13B)
In contrast with responses to Question 2, several students [8] mentioned an example
different from the ones included in the NoST, like the examples of the water cycle
and gravity above. However, only one student made a direct reference to the contexts
provided to explain his or her views.
The tendency of students to discuss their views without reference to any actual
examples has been also reported by Lederman and O’Malley (1990), in a qualitative
study of students’ views of the NoS: “students were able to recall the ‘big picture’
without being able to recall the specific examples used to convince them that theories
and laws were tentative” (p. 233). The same behaviour has been reported in teachers:
Abd-El-Khalick (2005), as part of an effort to improve trainee teachers’ views of the
NoS through a philosophy of science course, concluded that “the NoS views of a
significant portion of [the] participants were not supported with examples from the
history or practice of science, or were otherwise supported with inadequate
examples” (p. 26). The lack of examples, or its inadequate use, are common features
of students’ arguments about the NoS, as will be seen throughout this chapter.
In summary, in contrast to focus group responses to Question 2, the desired option
was not the most frequently chosen for Question 3 of the NoST—among students,
the popular one was the preferred one. However, it is noteworthy that some students
in the focus groups, even though comfortable with either the popular or the
empiricist positions felt compelled to argue in favour of imagination as a component
of devising an explanation: many students intuitively feel that data and/or reasoning
are not sufficient by themselves to explain something.
Chapter 8. Results: Focus groups
249
On the whole, students understand quite well the meaning of “reason”, associating it
with drawing on the data and/or using logic to reach a conclusion. However, their
understanding of the process of “coming up with an explanation” is quite variable
and oscillates between believing that explanations are discovered or invented. This
finding reflects to some degree some students’ confused and/or uncertain
understanding of the essential role imagination plays in the context of discovery.
8.1.4. STUDENTS’ INTERPRETATIONS AND JUSTIFICATIONS OF ANSWERS TO
QUESTION 4
As in the parallel forms and test-retest trials, the majority of students [36] in the
focus groups chose the desired answer option in Question 4 of the NoST (the
character of the scientific method), “Scientific investigations do not all follow the
same steps. But there are some general principles all scientists follow—that’s what
we call the scientific method.” A minority of students selected both the popular [5]
and the relativist options [1]. Only two students expressed explicitly ambivalence
between the options offered, opting for more than one or refraining from choosing
one.
Students whose views on the character of the scientific method did not match the
desired one—and a few that were ambivalent about it—argued that there is a
scientific method that conforms to a logical sequence of steps [8], i.e., “Every
investigation, no matter which science we’re talking about, follows the same series
of steps—this is the scientific method”:
I picked [option] B, but I’m not 100 per cent sure. Because, well… I do think that the steps are followed exactly. […] According to what it is you’re studying, maybe you call it [the step] the same [i.e., observation or hypothesising], but you do it differently in each field. Maybe experimentation won’t be the same in chemistry than in, I don’t know, physics. Maybe in both [sciences] you conduct experiments. However, it won’t be the same. But I think that even if there are some slight changes in each science, there is a list of steps.
(Student 9B)
Chapter 8. Results: Focus groups
250
The most common argument [22] against the popular position made reference to the
notion that different scientific fields, or problems, require different research methods
or approaches. A single set of steps would not be appropriate for all scientific
disciplines:
Because, well… for example, I say that in different areas you have to perform different kinds of studies. So, it’s not the same [method] for all. That’s why I chose [option] C [the desired one]. [Scientists] do follow more-or-less the same method, but focused to their different areas.
(Student 9C)
[T]he same [steps] must not be followed in every situation. In each area of science there’ll be different problems. [Scientists] might base their research on some general principles—but these don’t have all to be the same.
(Student 9A)
A second argument [10] against the popular position claimed that the scientific
method is not necessarily linear; there is liberty to shift or ignore some of its
elements:
Well, I agree with her because, yes, in some cases the steps of the scientific method can’t be followed exactly—some steps might be excluded. But, nevertheless [scientists] do follow the scientific method.
(Student 8A)
Against the relativist position, “Scientific investigations are all different. Scientists in
different fields tackle completely different problems—there is no such thing as a
scientific method”, students argued that, even though different fields may follow
different principles [8] the scientific method actually exists [9]; all fields have at least
some general principles they all follow when doing research [5]; and that the absence
of a scientific method would be too chaotic—some semblance of order is needed to
do research [4].
The ability to differentiate correctly between the popular and the desired options, as
well as the reliability of the question as a probe of students’ views, rests on a clear
understanding of the meanings of the key terms “principle” (understood as a
Chapter 8. Results: Focus groups
251
comprehensive and fundamental assumption, or a rule or code of conduct) and “step”
(understood as a stage in a process or an action, proceeding, or measure often
occurring as one in a series). For this reason, students’ understanding of these words
was explored. Only four students argued that steps of the scientific method are, in
some sense, equivalent to its principles:
To me, “steps” reminds me of, like, a cooking recipe—if I don’t have fulfilled a previous step I can’t go on to the next. “General principles” sounds more like an element, something that maybe needs to be there while others don’t need to be there. But, in the end, they’re both part of the same thing, aren’t they?
(Student 6B)
These four students that conflated “steps” with “principles” all chose the desired
option—there are principles that make up the scientific method.
Conversely, three students denied any similarity between both terms without going
any deeper into their respective differences, while 14 said that “steps” are more rigid
and specific to a given situation compared with “principles”. The latter, on the other
hand, are more broad, general, and applicable to a wider range of situations:
Step is an exact set of rules that you follow—so that you do this, then you do this, then you do this, and you do this. But a principle is more, kind of like a guideline that can be altered for each different thing.
(Student 13B)
While students appeared to grasp the conceptual difference between “step” and
“principle”, when asked for examples of each they appeared to make little distinction
between them: stating the research’s aims, doing background research, establishing a
theoretical framework, collecting observations, making hypotheses, conducting
experiments, analysing the data, and reaching conclusions were considered, by some,
to be examples of both steps and principles of the scientific method.
A noticeable difference was found between Mexican and English students: the
latter—from both focus groups—made references to “fair tests” as a principle of the
scientific method while the former did not. This difference is most likely due to
Chapter 8. Results: Focus groups
252
differences in the content of curricula, since the Mexican one does not emphasise this
particular idea.
Ideally, a student with a developed understanding of the scientific method would be
aware that it is not an algorithmic recipe comprising observation, hypothesising,
experimenting, and analysis as its steps. Rather, such a student would understand that
the scientific method is a set of assumptions about how science produces reliable,
truthful knowledge about the world: scientists come up with—by exercising their
imaginations—possible ways of explaining events in the world, and then subject
them to stringent tests to see if they merit belief. In this sense, some English students
could be seen as closer—compared with their Mexican peers—to such an
understanding, since they acknowledged fair testing as a principle of the scientific
method.
Students were also asked about the aims of the scientific method: why do scientists
make use of it? Responses were varied, and focused on the end-product of the
scientific method and/or the role it plays in research. Some views on the scientific
method were more naïve than others. The scientific method was seen, alternatively,
as a set of guidelines that organise scientific activity [13]; a way of coming up with
an explanation [11] or testing hypotheses [4]; a means to reach conclusions from the
data [9] or producing knowledge [2]; a source of universal claims that command
consensus among scientists [2] or of accurate claims [4] (this last view was expressed
only by English students).
As in previous questions, few students [1] referred back to the contexts provided to
explain or illustrate their points, and slightly more [4] gave examples, different from
the ones provided, with which to illustrate their claims (such as mathematics,
philosophy, research-based medicine, and the Miller-Urey abiogenesis experiment).
In summary, the findings of the focus groups corroborate to some extent those of the
parallel forms and test-retest trials: students seem aware of the fact that the scientific
method is not an algorithmic recipe that needs to be adhered to strictly. However,
few show any developed understanding of the scientific method as a strategy to test
explanatory hypotheses. As it stands, Question 4 is less successful than Questions 2
Chapter 8. Results: Focus groups
253
and 3 as a probe of students’ views about the scientific method. Clearly, the answer
options would need to be redrafted to clarify how the popular and the desired answer
are different, maybe spelling out what is understood by “scientific method” in each
case.
Students’ almost unanimous belief in a scientific method not made of steps is
noteworthy, as it could represent the successful abolition from classrooms of the
positivist idea of a logic-driven scientific method: students appear to be aware of—
albeit, in some cases, intuitively—the inadequacy of the more naïve view of the
scientific method as an algorithmic series of steps. They also appear to know that the
scientific method is a common feature of scientific disciples, even though not all
sciences—natural or social—apply the scientific method in the same manner.
However, this knowledge also appears to be somewhat superficial: few students, in
both Mexico and England, managed to explain why the scientific is not a recipe.
8.1.5. STUDENTS’ INTERPRETATIONS AND JUSTIFICATIONS OF ANSWERS TO
QUESTION 5
In Question 5 (underdetermination of explanation by data) a majority of students [28]
in the focus group chose the relativist position, “There are lots of good ways to
explain any set of data—I would expect every scientist to have his own explanation.”
A smaller number of students [7 and 10, respectively] opted, in turn, for the popular
and the desired ones. (Of these 17 students, 7 were undecided or claimed that more
than one answer option represented better his or her views.) This pattern of responses
matches the one seen, for this particular question, in the parallel forms and the test-
retest trials.
The few students that argued against the relativist position felt it was too subjective
[1], or claimed that scientists have to agree on an explanation eventually [1], or that
there is a limited number of ways of explaining a given phenomenon [3]:
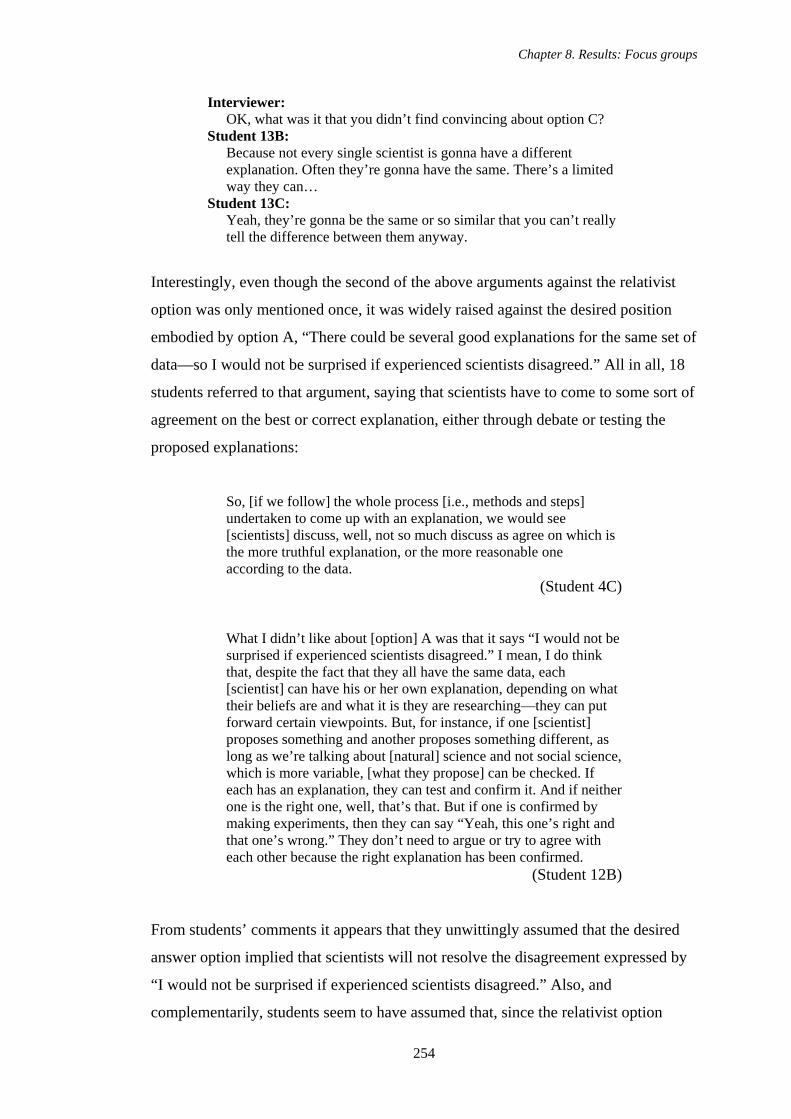
Chapter 8. Results: Focus groups
254
Interviewer: OK, what was it that you didn’t find convincing about option C?
Student 13B: Because not every single scientist is gonna have a different explanation. Often they’re gonna have the same. There’s a limited way they can…
Student 13C: Yeah, they’re gonna be the same or so similar that you can’t really tell the difference between them anyway.
Interestingly, even though the second of the above arguments against the relativist
option was only mentioned once, it was widely raised against the desired position
embodied by option A, “There could be several good explanations for the same set of
data—so I would not be surprised if experienced scientists disagreed.” All in all, 18
students referred to that argument, saying that scientists have to come to some sort of
agreement on the best or correct explanation, either through debate or testing the
proposed explanations:
So, [if we follow] the whole process [i.e., methods and steps] undertaken to come up with an explanation, we would see [scientists] discuss, well, not so much discuss as agree on which is the more truthful explanation, or the more reasonable one according to the data.
(Student 4C)
What I didn’t like about [option] A was that it says “I would not be surprised if experienced scientists disagreed.” I mean, I do think that, despite the fact that they all have the same data, each [scientist] can have his or her own explanation, depending on what their beliefs are and what it is they are researching—they can put forward certain viewpoints. But, for instance, if one [scientist] proposes something and another proposes something different, as long as we’re talking about [natural] science and not social science, which is more variable, [what they propose] can be checked. If each has an explanation, they can test and confirm it. And if neither one is the right one, well, that’s that. But if one is confirmed by making experiments, then they can say “Yeah, this one’s right and that one’s wrong.” They don’t need to argue or try to agree with each other because the right explanation has been confirmed.
(Student 12B)
From students’ comments it appears that they unwittingly assumed that the desired
answer option implied that scientists will not resolve the disagreement expressed by
“I would not be surprised if experienced scientists disagreed.” Also, and
complementarily, students seem to have assumed that, since the relativist option
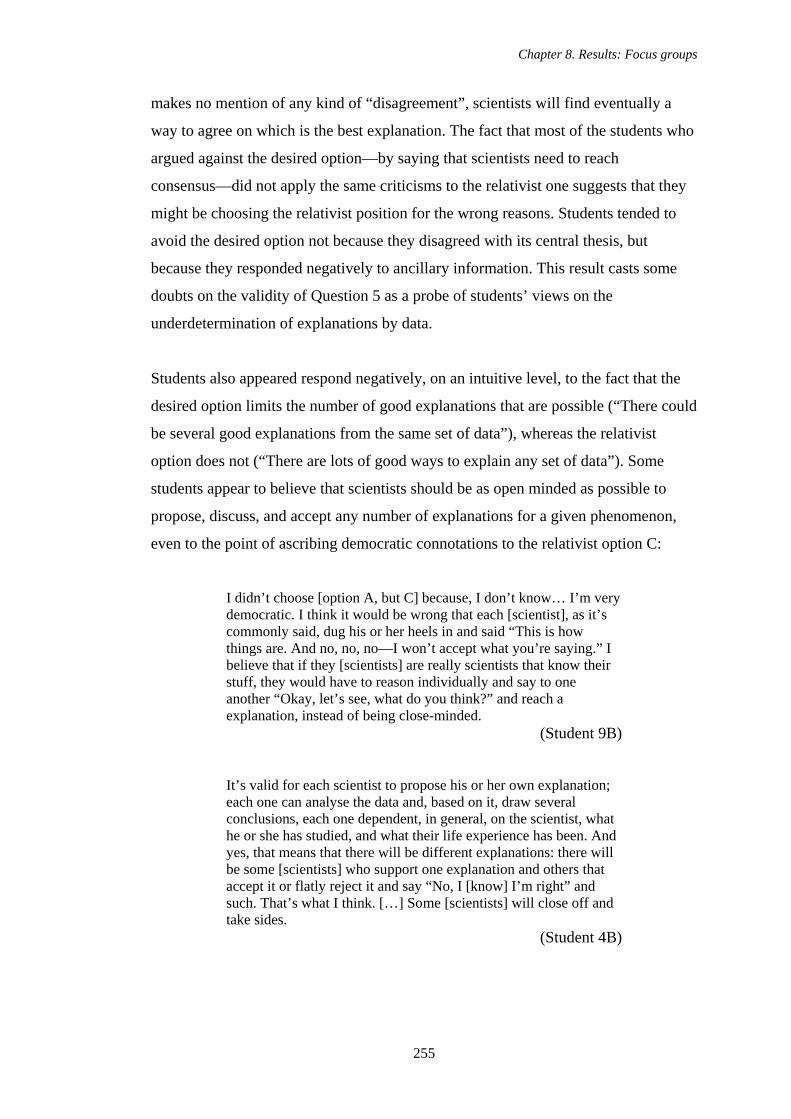
Chapter 8. Results: Focus groups
255
makes no mention of any kind of “disagreement”, scientists will find eventually a
way to agree on which is the best explanation. The fact that most of the students who
argued against the desired option—by saying that scientists need to reach
consensus—did not apply the same criticisms to the relativist one suggests that they
might be choosing the relativist position for the wrong reasons. Students tended to
avoid the desired option not because they disagreed with its central thesis, but
because they responded negatively to ancillary information. This result casts some
doubts on the validity of Question 5 as a probe of students’ views on the
underdetermination of explanations by data.
Students also appeared respond negatively, on an intuitive level, to the fact that the
desired option limits the number of good explanations that are possible (“There could
be several good explanations from the same set of data”), whereas the relativist
option does not (“There are lots of good ways to explain any set of data”). Some
students appear to believe that scientists should be as open minded as possible to
propose, discuss, and accept any number of explanations for a given phenomenon,
even to the point of ascribing democratic connotations to the relativist option C:
I didn’t choose [option A, but C] because, I don’t know… I’m very democratic. I think it would be wrong that each [scientist], as it’s commonly said, dug his or her heels in and said “This is how things are. And no, no, no—I won’t accept what you’re saying.” I believe that if they [scientists] are really scientists that know their stuff, they would have to reason individually and say to one another “Okay, let’s see, what do you think?” and reach a explanation, instead of being close-minded.
(Student 9B)
It’s valid for each scientist to propose his or her own explanation; each one can analyse the data and, based on it, draw several conclusions, each one dependent, in general, on the scientist, what he or she has studied, and what their life experience has been. And yes, that means that there will be different explanations: there will be some [scientists] who support one explanation and others that accept it or flatly reject it and say “No, I [know] I’m right” and such. That’s what I think. […] Some [scientists] will close off and take sides.
(Student 4B)
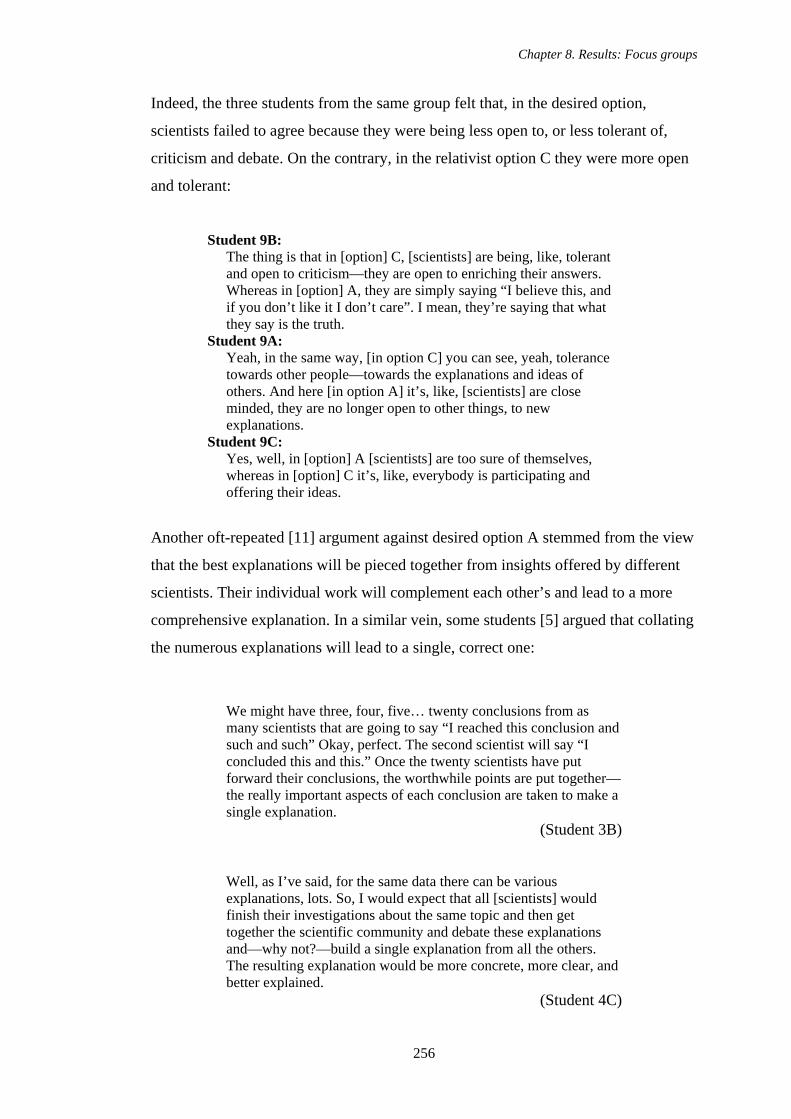
Chapter 8. Results: Focus groups
256
Indeed, the three students from the same group felt that, in the desired option,
scientists failed to agree because they were being less open to, or less tolerant of,
criticism and debate. On the contrary, in the relativist option C they were more open
and tolerant:
Student 9B: The thing is that in [option] C, [scientists] are being, like, tolerant and open to criticism—they are open to enriching their answers. Whereas in [option] A, they are simply saying “I believe this, and if you don’t like it I don’t care”. I mean, they’re saying that what they say is the truth.
Student 9A: Yeah, in the same way, [in option C] you can see, yeah, tolerance towards other people—towards the explanations and ideas of others. And here [in option A] it’s, like, [scientists] are close minded, they are no longer open to other things, to new explanations.
Student 9C: Yes, well, in [option] A [scientists] are too sure of themselves, whereas in [option] C it’s, like, everybody is participating and offering their ideas.
Another oft-repeated [11] argument against desired option A stemmed from the view
that the best explanations will be pieced together from insights offered by different
scientists. Their individual work will complement each other’s and lead to a more
comprehensive explanation. In a similar vein, some students [5] argued that collating
the numerous explanations will lead to a single, correct one:
We might have three, four, five… twenty conclusions from as many scientists that are going to say “I reached this conclusion and such and such” Okay, perfect. The second scientist will say “I concluded this and this.” Once the twenty scientists have put forward their conclusions, the worthwhile points are put together—the really important aspects of each conclusion are taken to make a single explanation.
(Student 3B)
Well, as I’ve said, for the same data there can be various explanations, lots. So, I would expect that all [scientists] would finish their investigations about the same topic and then get together the scientific community and debate these explanations and—why not?—build a single explanation from all the others. The resulting explanation would be more concrete, more clear, and better explained.
(Student 4C)
Chapter 8. Results: Focus groups
257
In contrast to all the students that held the view that scientists need to reach some
form of agreement, others believed that there will always be some grounds for
controversy [5] and/or that scientists do not have necessarily to agree with each other
[4]:
Interviewer: Do you think that scientists tend not to agree amongst themselves?
Student 6A: Most of time, I think they don’t—there is always someone that thinks the opposite of what you think. There’s people that may think like you do, but that don’t give you their support. Someone always has a different point of view [than yours]. I chose that there will always be an explanation that the majority likes but—I mean, not one that 100 per cent of scientists think is true, but one that the majority likes.
Student 9A: Well, it’s not their [scientist’s] obligation to agree… to believe the same thing. There must always be alternative, different points of view—because not everything can be narrowed down to a single idea.
Student 9C: Yeah, I think the same thing. I mean, [scientists] aren’t forced to come up with the same explanations.
This last argument was usually raised against the popular option B, “If experienced
scientists have got the same set of data, they should all agree on the correct
explanation.” Other criticisms against this position focused on the idea that a single
event can have many causal factors and, thus, not a single explanation [3]; scientists’
ways of reasoning [6] and/or perceiving [4] vary; scientists are influenced by their
personal background when coming up with explanations [7]; the data available to all
scientists might not be the same [3]; and/or scientists’ imaginations might lead them
to propose different explanations [2].
In order to determine whether students grasped the crucial difference between the
desired option A and the relativist C, some students were asked to define the words
“lots” and “several”. Of the 12 students that were asked this question expressly, nine
exhibited a clear understanding of the meanings of both words, whereas three proved
unable to articulate clearly what they mean and/or why they are different:
Chapter 8. Results: Focus groups
258
[I]f you say “several”, you’re putting a limit on it. And if you’re saying “lots” there could be any amount of explanations for any reason.
(Student 14 C)
Student 7C: I understood them to be synonyms—“several” and “lots”.
Student 7B: “Lots” I think means [scientists] just took into account all [explanations]. I think that’s what “lots” means: explanations without grounds. And, well, “several” means…
Student 7A: Well, “several”… I don’t know, that [and “lots”] are more like synonyms.
Finally, no student made any reference to the episodes provided to argue or illustrate
their views, but five provided examples of their own for those purposes (namely,
speculations on the size of the universe, the hypothesis of parallel universes,
Darwinian and Lamarckian evolution, global warming, and the Big Bang).
It appears that, compared with previous questions, students’ misinterpreted to a
larger extent the answer options provided. Generally speaking, they mistook what the
main issue of the question was. Instead of focusing on the logical underdetermination
of explanation by data, they focused on the openness necessary to come up with, and
debate, as many explanations as considered appropriate and the freedom necessary to
think differently. The fact that some students seemed not to understand the difference
between “lots” and “several” explanations further compounds the diminished
reliability of Question 5 as a probe of students’ views on underdetermination. Only
two students appeared to address, somewhat naïvely, the intended issue, since they
argued that data limits the number of possible explanations:
[…] you can’t draw such drastic conclusions [from the data]. You have to research, collect data, and then reach a logical conclusion. The process is straightforward: I have my previous research, my data, my hypothesis, and everything. From them, through a straightforward process, I draw a conclusion.
(Student 3B)
Chapter 8. Results: Focus groups
259
It says here that [option A] that there can be several explanations for the same data. So, I think that it’s like… [Scientists] have to use logic amongst them, in order to reach a shared answer. Because I don’t think that every, every, every scientist will come up with a different explanation from the same data. [Scientists] will always, given the logic [implicit] in the data, come up with a similar answer. Maybe not exactly the same answer, but a similar one, yeah.
(Student 7B)
The above notwithstanding, what seems clear is that students do have a fairly mature
understanding of why it is unlikely that only one explanation will result from the
same data. Students’ arguments against the popular option B are valid and sensible
reasons for not choosing that option. Interestingly, it appears that, even if students
did not address the intended issue, their views are more socially-oriented than
empirically-oriented: more students believed that explanations are improved with
contributions from all scientists involved in a particular field and debated until
consensus is reached. Few students, on the other hand, mentioned that consensus is,
crucially, dependent on testing explanations and determining which are better
supported by the evidence (see student 12B’s comment, above).
In summary, it seems the validity of Question 5 as a probe for students’ views on the
underdetermination of explanation by data is compromised by the way the answer
options were written. Interestingly, the questions still managed to elicit students’
views about a relevant aspect of the NoS.
8.1.6. STUDENTS’ INTERPRETATIONS AND JUSTIFICATIONS OF ANSWERS TO
QUESTION 6
For Question 6 (the best grounds for belief in an explanation), the majority of
students [28] selected the popular position, “We know it’s a good explanation if you
can reason it out from the data.” The only argument [1] made explicitly against this
answer option pointed out that an explanation needs to be testable—and eventually,
tested—to determine if it is good enough. Of the remaining students, 12 and three,
respectively, selected the desired and relativist positions. This pattern of responses is
similar to that in the parallel forms and the test-retest trials.
Chapter 8. Results: Focus groups
260
Most of the arguments against the desired position, “We know it’s a good
explanation if it leads to new predictions that turn out to be right”, centred on the
character of predictions. Some students [5] argued that it is impossible to predict
exactly what is going to happen in the future, while others thought that predictions
were groundless speculations [3], weak, intangible and/or haphazard propositions
[2], or risky and life-endangering [1].
Students’ criticisms of the word “predictions” cast some doubts on the validity of this
answer option. A scientific prediction is not an unlikely claim or a groundless
speculation, and neither could it be thought of to be haphazard, risky, or life-
threatening. If students associate such negative connotations with scientific
predictions, it is likely that their decision not to choose the desired option is not a
reliable measure of their understanding of this aspect of the NoS.
Some students [2] felt that reasonable explanations were a stronger criterion of
trustworthiness, compared with successful predictions, whereas one argued that not
every prediction can be checked to see if it turns out to be true. A pair of students
took issue with the phrase “new predictions”, saying either that he or she did not
understand what it meant or that predictions do not necessarily have to be new.
Arguments against the relativist position, “We know it’s a good explanation if
scientists all agree on it”, were less varied: many students claimed that consensus is
not enough as a criterion of trustworthiness, i.e., accepted explanations could still be
wrong [8] and consensus can be, itself, unreasonable [2]. Other students [5] thought
that consensus is not a suitable reason for trust because scientists tend not to agree on
whether an explanation is a good one. One student argued that, even if agreement
was reached, more data and research is needed to determine if an explanation is a
good one.
Only four students chose more than one answer option, three of them choosing both
the popular and the desired options and one of them all three. Furthermore, two
students thought that all three options had some merit and four (two of which had
selected more than one answer option) claimed that an explanation that has been
reasoned from the data—the popular option—leads to predictions that turn out to be
Chapter 8. Results: Focus groups
261
right—the desired option. One of these students believed that the popular option is
also the more comprehensive:
It can’t be that way because if it’s reasonable… if you have reasoned… The fact that an explanation has been based on reasoning means that it can’t fail. […] I reason on the basis of what I read, what I see, I mean, [that’s how] I reach a conclusion. Then, when [I check if I’m right], I see that my conclusion came to pass. I mean, if you reason you have to reach a conclusion.
(Student 3B)
Well, I say that it [i.e., option C] complements [option] B. But, well, I chose B because I thought it was the most comprehensive, and because [I agree] that an explanation is a good one if it’s been reasoned from the data, besides being complemented by C.
(Student 8A)
Surprisingly, only the student that selected all three options claimed, additionally,
that successful predictions—the desired option—would lead to consensus among
scientists—the relativist one:
So then, as [option] A says, when scientists reach agreement it’s because what they’ve concluded has been proven. And that’s why there can be confusions, if a hypothesis that has been proposed isn’t confirmed by the available data—that’s a problem. When something like that happens, it’s more difficult to keep working with the data that are available than to keep on looking for more data and, from it, come up with several new hypotheses—not just one. In that way, several different investigations can be carried out and whichever is more successful or correct can be presented to scientists for approval.
(Student 12A)
Some participating students were asked to choose between a pair of alternative
scenarios: in the first scenario, an explanation that has been reasoned from the data
leads to predictions that turn out to be wrong; in the second, an explanation that does
not appear to have been reasoned from the available data nevertheless leads to
successful predictions. An equal number of students [8] chose each of the scenarios,
whereas 5 others could not or would not choose one of the scenarios alone, preferring
either both or none at all:
Chapter 8. Results: Focus groups
262
[I chose] the first [option], because it’s reasonable. […] The other [option], I don’t know, maybe is due to sheer chance.
(Student 8A)
I will take the one that’s making predictions that come true. Because you can’t say anything’s unreasonable. For example, this rabbit’s foot might have, like…
(Student 13A)
Yes, but I don’t agree with any [of the options] because, for starters, even if they [i.e., the predictions] do turn out to be right, I mean, it could just be luck. There will come a time when they won’t turn out to be right and then [scientists] will turn against whoever made the predictions in the first place—they’re going to ask him “what’s up with that?” In the case of the other [scientist] that did base his predictions in the movement of the tectonic plates and the Earth’s crust, everybody knows that you can’t predict the movement of the tectonic plates. So, to start with, to arrive at a conclusion like that you need more than just one investigation—you need a lot of years of study and, even then, you won’t necessarily be able to reach a conclusion. You might reach a conclusion [and make a prediction] and it still might not come to pass. So, both [scenarios] have problems.
(Student 12A)
Students were also asked to choose between a scenario where scientists agree that an
explanation is a good one but its predictions turn out, systematically, to be false and a
scenario where most scientists do not trust an explanation but it leads to predictions
that turn out to be right. Only two students chose the first scenario, whereas nine
chose the second. Five students did not choose one of the scenarios but opted for
both—good explanations have to make correct predictions and command consensus:
I think that… if you keep that sole [scientist] under watch and he keeps making predictions and they keep turning out to be right, all of them, then the rest of the scientists would have to focus on him, pay attention to him, so as to see if he’s getting lucky—because if he’s right all the time, then it can’t be blind luck.
(Student 2B)
Chapter 8. Results: Focus groups
263
I think that if, in spite of experiments and everything, the [unlikely predictions] turn out to be right and [whoever proposed them] doesn’t receive any support (this is going to sound harsh), then the other scientists are going to look like fools. Because if it [i.e., the prediction] has been proven to be correct, even if only one scientist believes in it, and experiments confirm it—I mean, if the hypothesis that has been postulated is fulfilled—that means that it’s correct. Maybe not one hundred per cent correct, but the closest to being true. And if the other prediction is experimentally tested and checked and everything and it’s wrong, there would be no reason to keep supporting it. If the first has been scientifically-proven, through experiments, it should be supported because it’s the truer one.
(Student 12B)
Student 10A: Well, [I wouldn’t choose] any two of them. I would pay attention to what both [scientists] say. We can use, as a guide to reach an answer, what both proposed explanations say.
Student 10C: Well, the data would need to be put together with the explanations that each group [of scientists] gives and, from them, a conclusion could be drawn.
Finally, only one student referred back to the episode to explain his or her views or
make a point. Six students provided an example from their own background
knowledge to illustrate and explain their views.
On the whole, responses and accompanying discussions confirmed that students
interpret the question and its answers as intended, with the important exception of
some students’ interpretation of the word “predictions”. It also confirmed that, in the
case of Question 6, all three answer options are to some degree interrelated,
consensus being a consequence of successful predictions and these a consequence of
an explanation that fits the data. Still, as grounds for belief, the desired option
constitutes the strongest reason, since it can sway scientists’ opinions towards
agreement.
8.1.7. STUDENTS’ INTERPRETATIONS AND JUSTIFICATIONS OF ANSWERS TO
QUESTION 7
In the last question of the NoST, the desired position was the preferred one: 34
students opted for “The explanations we accept today may need to change. But that
does not mean they’ll be replaced—they will just be improved.” The relativist and
Chapter 8. Results: Focus groups
264
popular positions were selected by eleven and ten students, respectively. Of all of the
above, 13 students chose more than one answer option. As in previous questions, this
answer pattern matches the one seen in the parallel forms and test-retest trial, where
the desired position also predominated. Also, no important differences were observed
between Mexican and English students.
The only explicit arguments against the desired position focused on the fact that, in
the past, explanations have been abandoned and replaced [2], or, alternatively,
focused on the fact that even if new data is discovered, explanations will not change
but be enriched [1] and the essential aspects of a lot of phenomena have already been
discovered and will not change [1].
Students that did not opt for the popular position, “Scientists only accept an
explanation when it’s been tested and they know it’s true. So the explanations we
accept today will not be replaced in the future for better ones”, argued that
explanations are constantly being improved [9] or reformulated [1] through newly
developed technology; discoveries of new data will necessitate changing or replacing
existing explanations [9]; and things—phenomena and, consequently, their
explanations—are changing all the time [7] and there will always be things we do not
know about [2]. Alternatively, two students felt that unchanging explanations are
useless for society [1] and that scientists would accept an explanation even if had not
been tested and found out to be true [1].
On the other hand, arguments against the relativist position, “Explanations that
people accepted in the past have now been abandoned. So the explanations we accept
today will be replaced by better ones at some point in the future”, mentioned that
new explanations are based on previous ones that are not abandoned [13]; past
research cannot all be wrong [3]; old explanations remain valid [2]; most
explanations are close enough to the truth [1]; “replace” and “abandon” are too
strong ways of saying that explanations are subject to change [3]; and old
explanations only change [1].
Some students were asked explicitly whether they thought the shift from Ptolemy’s
geocentric model to Copernicus’s heliocentric model represented the replacement of
Chapter 8. Results: Focus groups
265
an explanation or the improvement of one. Of those students that responded, nine
claimed that Copernicus’s model replaced Ptolemy’s, whereas 18 claimed that it was
an improvement:
Well, the thing is that subjectivity is playing a role there (I keep going on about subjectivity). I believe that the switch from the geocentric model to the heliocentric one was… the first one said that the Earth was at the centre and all the planets went around it. The idea that the planets go around a centre was kept in both models—what was changed was the centre around which they travel. So it [i.e., the geocentric model] could just have been modified, although I feel it wasn’t. I keep feeling that it was abandoned. Although is depends how you look at it, doesn’t it? Maybe I’m wrong or he’s wrong, but we might reach an agreement if we talked about it.
(Student 4A)
Well, the thing is, though, with religion, you know—Yes, they said the Earth was in the centre of the Solar System, but at least they knew there was some kind of, you know, there was something in the centre and there were circular orbits around, then that just got improved. So, well, actually it is the Sun that’s in the middle. So even these religious… even the religious explanations, you know, you can still say, well, they have improved this.
(Student 13A)
In one focus group, students were asked the same question about the competing
explanations about the origin of life proposed by the theory of spontaneous
generation and germ theory: two students thought that germ theory was an
improvement of spontaneous generation; one thought it was a replacement:
I feel that it [i.e., spontaneous generation] was all changed. I mean, it wasn’t replaced exactly, it was… substituted. Yes, it was completely substituted [for another explanation]. The thing with the maggots was just a thought; [scientists] hadn’t proven it, until they went and investigated the matter. Then the idea was replaced completely.
(Student 10A)
I say that it [i.e., spontaneous generation] was modified—it explained the result but… When they [i.e., scientists] afterwards saw what was going on… well, they observed and realised that [the cause of the flies] wasn’t the meat: it was the flies themselves.
(Student 10C)
Chapter 8. Results: Focus groups
266
To confirm students’ understanding of what “replacing” an explanation means,
versus “improving” it, they were asked for examples of explanations they thought
had been replaced, as well as examples of those that had been improved. Besides the
geocentric model and spontaneous generation, students made reference, as examples
of the former, to the change of designation of Pluto from planet to dwarf planet, the
creation myth and the Big Bang, and the retraction of the claim that the MMR
vaccine caused autism. As examples of the latter, students mentioned Neo-
Darwinism, the addition of new kingdoms to taxonomic classifications of living
beings, and the development of better cures for cancer.
Finally, no students referred back to the episode to explain or clarify their views and
eight offered, unbidden, an example with which to illustrate their views. This finding
could be construed as evidence that episodes do not play a role in focusing students’
thinking. However, it could also be argued that given the small number of examples
provided by students and the apparent difficulty of coming up with instances of
replaced or improved explanations, offering a self-contained episode to students can
help them focus on something while completing the NoST.
Given the responses to the focus groups, it appears that students engaged adequately
with the issues presented in the question: they interpret the question as intended and
the options reflect their views on the matter.
8.2. SUMMARY OF THE FINDINGS FROM THE FOCUS GROUPS As previously noted, the aim of the focus groups was two-fold: on the one hand, to
validate the adequacy of the questions as probes with which to assess students’ views
of the NoS and, on the other, to explore in more depth students’ views of the NoS.
What follows is a brief summary of the main findings of this part of the main study.
8.2.1. DO QUESTIONS CAPTURE AND/OR REPRESENT STUDENTS’ VIEWS OF THE
NOS?
One of the main findings to emerge out of the focus groups was the absence of any
mention of alternative views—not already included as an answer option—for each of
the six questions of the NoST. In other words, none of the participating students
Chapter 8. Results: Focus groups
267
offered a view that diverged drastically from the three—i.e., popular, relativist, and
desired—comprising the test’s framework. Usually, those students that did not agree
with any of the answer options argued that a combination of them matched their own
views more adequately. The few that refused to choose any option did not propose a
different alternative to the ones offered. These findings suggest that the combined
views offered as answer options adequately cover the range of ideas 16-year old
students entertain about the NoS.
Tellingly, students did not suggest any changes or improvements to the way the
options were written, so as to make them more accurate representations of their
views. Taken together, these results lend some support to the claim that the NoST
has validity as an assessment instrument. However, a measure of caution is in order:
as has been documented elsewhere (Aikenhead, 1988; Lederman et al., 1998),
multiple-choice questions can unduly influence students’ decisions, introducing ideas
that were not initially considered or swaying students to take views they had not
contemplated previously. If this were to be the case, the validity of the NoST would
be compromised to some degree. On a positive note, asking students to reflect on
ideas they had not previously considered can produce richer insights into their
thinking. At the very least, researchers can be sure that students were exposed to a
range of plausible ideas and that their ultimate decision factored them in.
As further support for the validity of the NoST, it might be remembered that of all
the students that took part in the parallel forms and the test-retest trial, none came up
with any alternative view(s) to the three offered in each question, or suggested
changes to the wording of the answer options to approximate them to their actual
views. Written comments left by students were usually devoted to explaining why a
combination of views represented their views more adequately. Even when students
refused to choose any of the options, they did not offer different ones.
Importantly, the validity and reliability of the NoST as an assessment instrument can
be ascertained, to some extent, by the scrutinising the reasons with which students
justify their responses. In four out of the seven questions, students’ arguments
addressed adequately the issue at hand, evidencing an engagement with the central
Chapter 8. Results: Focus groups
268
thesis of the questions. As will be detailed in the following paragraphs, Questions 4,
5, and 6 of the NoST represent significant exceptions to the above.
Another way to determine the validity and reliability of the NoST involves checking
students’ interpretation of the questions and the answer options. As part of the focus
groups, assessing students’ interpretations entailed asking them to explain or
exemplify their understanding of key terms. For the most part, students exhibited a
clear and accurate grasp of relevant—and potentially fraught with meaning—ideas
such as “open mind”, “influence”, “reason”, and “change”. An accurate
understanding of these ideas increases confidence in the validity and reliability of the
NoST. Importantly, this research strategy highlighted some questions (namely, 4 and
6) of debatable validity, in the light of students’ interpretations.
In the case of Question 1 (exploring the difference between data and explanations),
correct and incorrect identifications of statements—as either data or explanations—
tended to be followed by, respectively, correct and incorrect justifications or
explanations of the differences between both concepts. Correlation between the
ability to classify a statement as an example of a datum or an explanation and explicit
knowledge of their meaning suggests that, for a majority of students, successful
performance in Question 1 is also a measure of explicit understanding.
The above notwithstanding, the validity of Question 1 is not ideal: 30% of the
instances when a student justified or explained him or herself were false negatives or
positives. Both undermine the validity and reliability of the NoST. False negatives
(i.e., when students failed to identify a statement but exhibited an adequate
understanding of the distinction between data and explanations) signal that explicit
knowledge does not translate necessarily into the ability to classify statements. False
positives (i.e., when students identified a statement but failed to exhibit an adequate
understanding of the distinction between data and explanations) evidence that
students’ ability is not necessarily based on explicit knowledge.
Ideally, students should possess both ability and knowledge. However, from the
standpoint of scientific literacy initiatives (see, for example, Norris and Phillips,
1994; Phillips and Norris, 1999; Norris and Phillips, 2003), it could be argued that
Chapter 8. Results: Focus groups
269
implicit knowledge that lends itself to application to a variety of contexts is more
valuable than explicit knowledge that cannot be applied. Assessing students’ ability
to discriminate data and explanations (especially when more than one statement is
used) might be a better measure of students’ understanding compared with direct,
explicit assessment of students’ views.
Methodologically, the use of episodes as the source of statements turned out to be an
unforeseen advantage, by offering further means with which to assess students’
understanding. During focus groups, some students expressed some uncertainty
about the identity of the statements, claiming that it depended on whether the
statements were isolated from or within the text. In designing the NoST, great care
was taken to draft statements in such a way that their identity would not alter when
taken out of context. Indeed, an analysis of the statements within the episodes should
confirm their intended identity. Therefore, students’ expressions of uncertainty can
be suggestive of a tentative understanding.
Regarding the multiple-choice questions of the NoST, students’ interpretations of—
and justifications in—Questions 2 (the theory-ladenness of data), 3 (the role of
imagination), and 7 (the tentativeness of scientific explanations) seemed
unproblematic: arguments in favour or against the answer options showed an
adequate grasp of the issues involved and of the central idea explored. In Questions 4
and 6, however, there was evidence of misinterpretation of one or more of the terms
used. In the case of Question 5, some unforeseen and significant problems became
clear during—and after the analysis of—students’ discussions.
Students’ engagement with Question 4 (the scientific method) was somewhat
problematic, even though students offered adequate arguments for and/or against the
three answer options. The quality of their arguments suggested that students
struggled with how best to describe what they understand by the “scientific method”
but, apparently, none believed that there is no “scientific method”—whatever this
might mean for them. Unfortunately, students’ interpretations of terms (namely,
“steps” and “principles”) used to describe different views of the character of the
scientific method did not match those intended when developing the question.
Chapter 8. Results: Focus groups
270
Even though few students held that the “principles” of the scientific method were the
same as its “steps”, and almost half of the students claimed they were different
things, when asked for examples some students proved unable to differentiate one
from the other, giving the same examples for both. Students’ understanding of both
terms appeared to be mainly intuitive. This could imply that students are responding
not to the central issue (the character of the scientific method) but to the connotations
of the words themselves.
Even though, for quite some time now, the picture of the scientific method as an
algorithm has been identified and described as a pervasive educational myth
(McComas, 1998; Abd-El-Khalick et al., 2008), it could be argued that instruction
has been fairly successful at correcting this misconception (as is widely advocated in
curricular reforms). The non-algorithmic character of the scientific method appears
to be easier to grasp, compared with more philosophically sophisticated aspects like
theory-ladenness of data and the underdetermination of explanations by data: at its
most basic, students only need to memorise that the scientific method is not a recipe.
The fact that students find it hard to articulate why the scientific method does not
follow steps suggests this might be the case. Also, it is not inconceivable that
students might have a negative impression of the word “step”, since “principles”
carries a more positive connotation—of guidance and flexibility, rather than
rigidness. This could help account for the high proportion of students that chose the
desired option in Question 4.
Drafting Question 4 proved to be particularly difficult during the development of the
NoST, and it was the question most challenged and criticised by the experts. It was
revised extensively, paying particular attention to the experts’ feedback. In the light
of students’ responses to it, it seems that its validity might still not be sufficient to
make it an adequate probe of students’ views of the character of the scientific
method. Fixing this question would require, first of all, avoiding negatively-charged
words such as “steps” and, secondly, making as explicit as possible the different
conceptions of the scientific method each option represents.
In the case of Question 5 (the underdetermination of explanation by data), some
students clearly did not engage with the central issue posed by the question. Instead
Chapter 8. Results: Focus groups
271
of focusing on whether there can be one, several, or many possible explanations for
the same data, their attention was drawn to whether scientists can, or should, agree
with each other in the end. This unforeseen outcome was triggered by the mention of
disagreement as a feature of scientists’ behaviour—as expressed in the desired
option. As it stands, the validity of Question 5 appears to be doubtful for the intended
purposes of summative assessment.
In spite of the above, and quite unexpectedly, Question 5 still managed to explore
students’ views about the nature and relevance of consensus and cooperation in
science, as well of the role of open-mindedness and the right to express one’s own
ideas freely in an atmosphere of tolerance. Correcting this question, so that it focuses
students on the intended idea (i.e., underdetermination) would require, mainly,
eliminating references to agreement or consensus in the answer options.
Like Question 4, the validity of 6 (about the grounds for belief in scientific
explanations) was also compromised to some degree by its phrasing: some students
did not choose the desired option because of the connotations they personally
ascribed to the word “prediction”, some of which were unwarranted (such as the fact
that predictions tend to fail or are dangerous) or not pertinent to science (such as
associating predictions with something astrologers do). Apart from this interpretation
problem, Question 6 seems to be valid and reliable as a probe.
It is worth mentioning that, on the whole, students’ preferences for the different
options reflected the results of the parallel forms and test-retest trials: for six out of
seven questions, the most and least frequently selected options matched those of the
two trials using written responses. Table 56 shows the most and least selected
options in each trial.
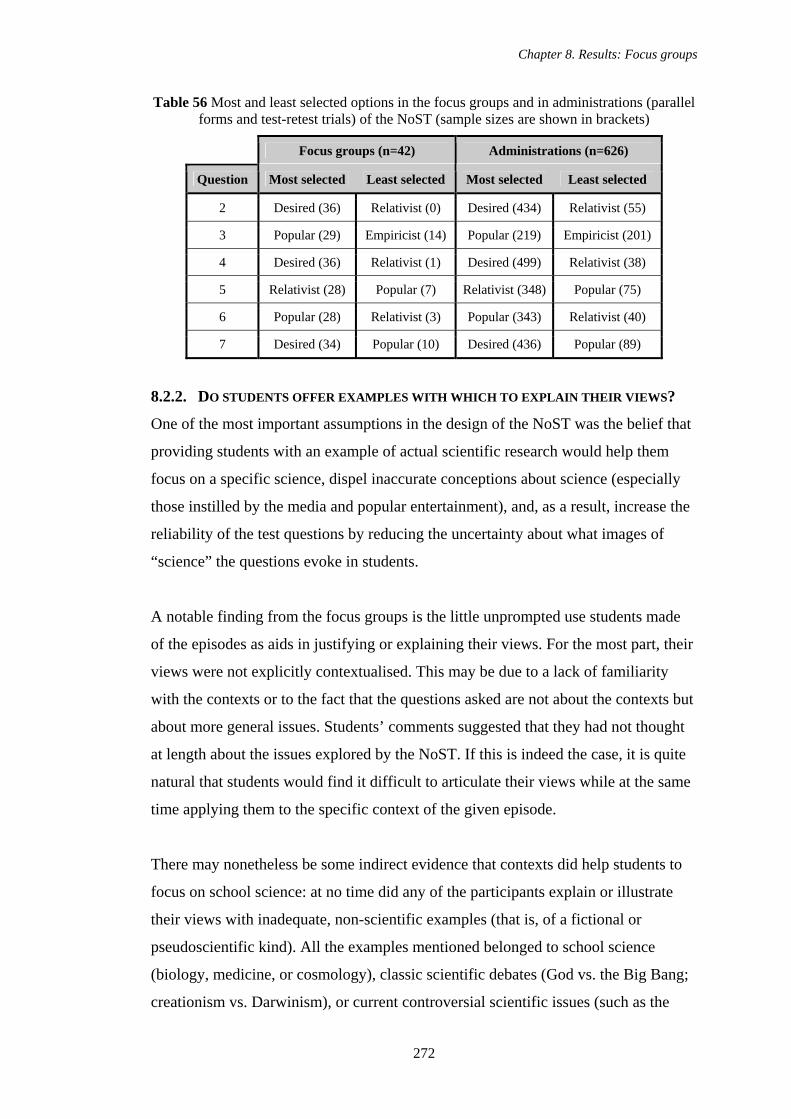
Chapter 8. Results: Focus groups
272
Table 56 Most and least selected options in the focus groups and in administrations (parallel forms and test-retest trials) of the NoST (sample sizes are shown in brackets)
Focus groups (n=42) Administrations (n=626)
Question Most selected Least selected Most selected Least selected
2 Desired (36) Relativist (0) Desired (434) Relativist (55)
3 Popular (29) Empiricist (14) Popular (219) Empiricist (201)
4 Desired (36) Relativist (1) Desired (499) Relativist (38)
5 Relativist (28) Popular (7) Relativist (348) Popular (75)
6 Popular (28) Relativist (3) Popular (343) Relativist (40)
7 Desired (34) Popular (10) Desired (436) Popular (89)
8.2.2. DO STUDENTS OFFER EXAMPLES WITH WHICH TO EXPLAIN THEIR VIEWS?
One of the most important assumptions in the design of the NoST was the belief that
providing students with an example of actual scientific research would help them
focus on a specific science, dispel inaccurate conceptions about science (especially
those instilled by the media and popular entertainment), and, as a result, increase the
reliability of the test questions by reducing the uncertainty about what images of
“science” the questions evoke in students.
A notable finding from the focus groups is the little unprompted use students made
of the episodes as aids in justifying or explaining their views. For the most part, their
views were not explicitly contextualised. This may be due to a lack of familiarity
with the contexts or to the fact that the questions asked are not about the contexts but
about more general issues. Students’ comments suggested that they had not thought
at length about the issues explored by the NoST. If this is indeed the case, it is quite
natural that students would find it difficult to articulate their views while at the same
time applying them to the specific context of the given episode.
There may nonetheless be some indirect evidence that contexts did help students to
focus on school science: at no time did any of the participants explain or illustrate
their views with inadequate, non-scientific examples (that is, of a fictional or
pseudoscientific kind). All the examples mentioned belonged to school science
(biology, medicine, or cosmology), classic scientific debates (God vs. the Big Bang;
creationism vs. Darwinism), or current controversial scientific issues (such as the
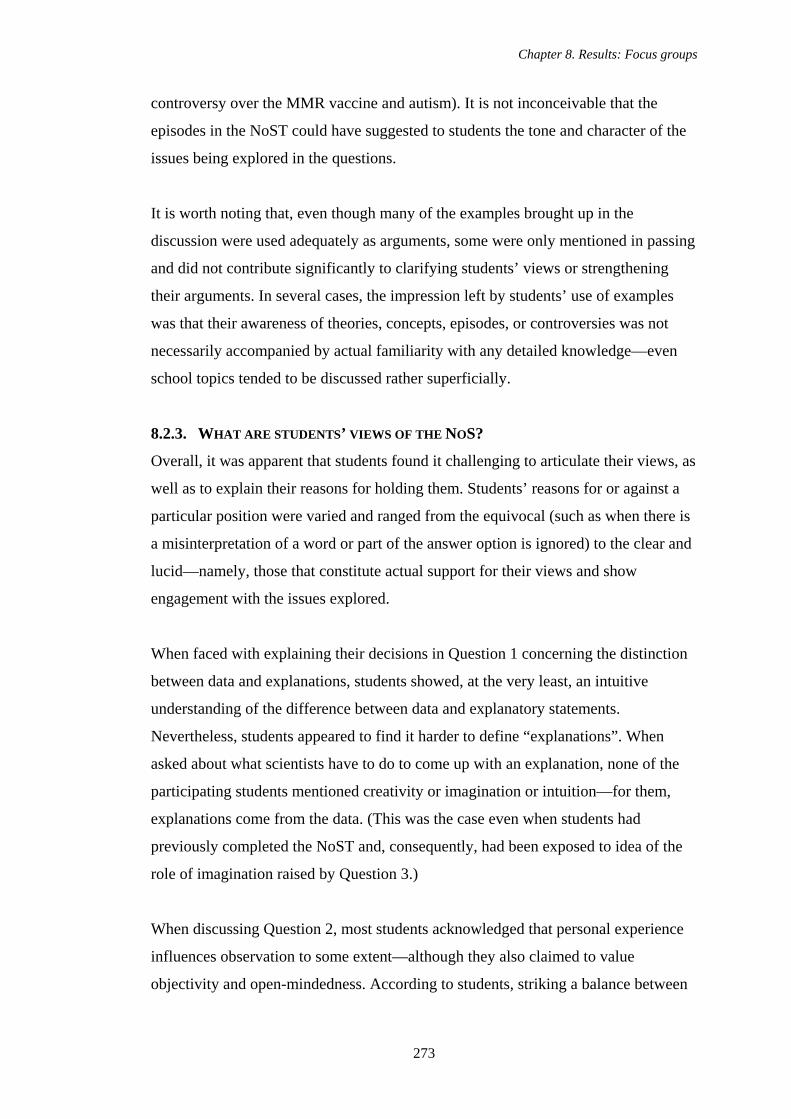
Chapter 8. Results: Focus groups
273
controversy over the MMR vaccine and autism). It is not inconceivable that the
episodes in the NoST could have suggested to students the tone and character of the
issues being explored in the questions.
It is worth noting that, even though many of the examples brought up in the
discussion were used adequately as arguments, some were only mentioned in passing
and did not contribute significantly to clarifying students’ views or strengthening
their arguments. In several cases, the impression left by students’ use of examples
was that their awareness of theories, concepts, episodes, or controversies was not
necessarily accompanied by actual familiarity with any detailed knowledge—even
school topics tended to be discussed rather superficially.
8.2.3. WHAT ARE STUDENTS’ VIEWS OF THE NOS?
Overall, it was apparent that students found it challenging to articulate their views, as
well as to explain their reasons for holding them. Students’ reasons for or against a
particular position were varied and ranged from the equivocal (such as when there is
a misinterpretation of a word or part of the answer option is ignored) to the clear and
lucid—namely, those that constitute actual support for their views and show
engagement with the issues explored.
When faced with explaining their decisions in Question 1 concerning the distinction
between data and explanations, students showed, at the very least, an intuitive
understanding of the difference between data and explanatory statements.
Nevertheless, students appeared to find it harder to define “explanations”. When
asked about what scientists have to do to come up with an explanation, none of the
participating students mentioned creativity or imagination or intuition—for them,
explanations come from the data. (This was the case even when students had
previously completed the NoST and, consequently, had been exposed to idea of the
role of imagination raised by Question 3.)
When discussing Question 2, most students acknowledged that personal experience
influences observation to some extent—although they also claimed to value
objectivity and open-mindedness. According to students, striking a balance between
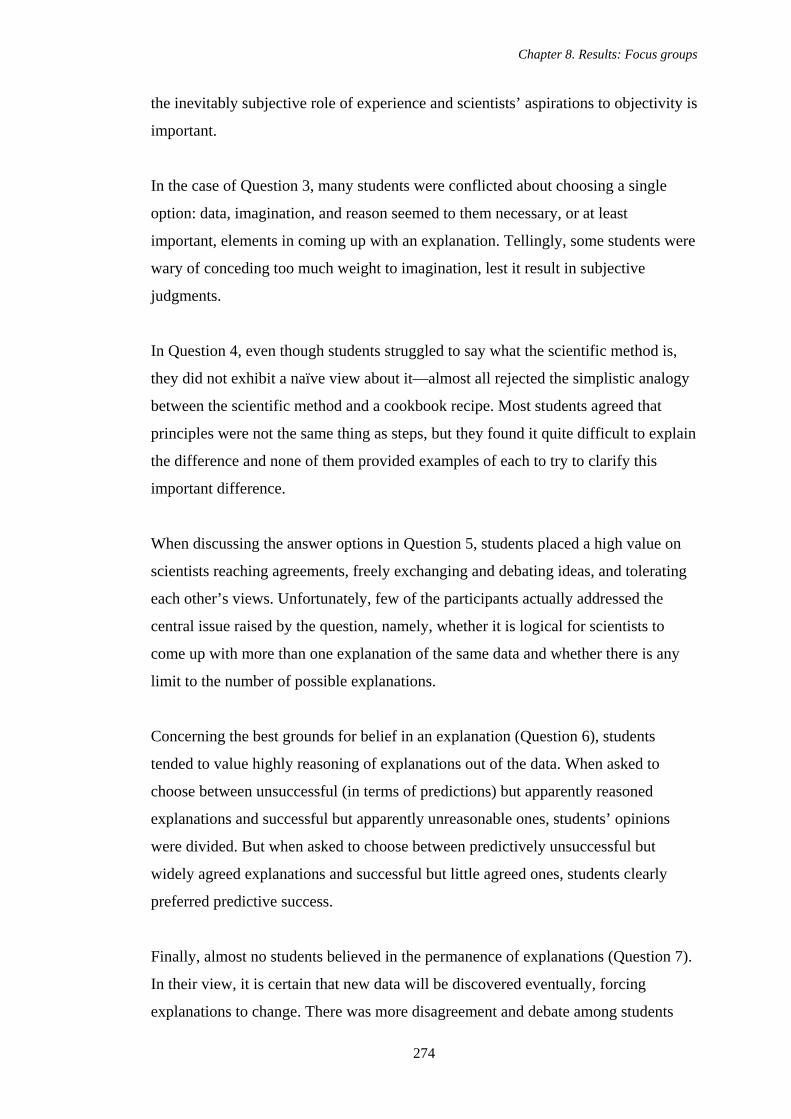
Chapter 8. Results: Focus groups
274
the inevitably subjective role of experience and scientists’ aspirations to objectivity is
important.
In the case of Question 3, many students were conflicted about choosing a single
option: data, imagination, and reason seemed to them necessary, or at least
important, elements in coming up with an explanation. Tellingly, some students were
wary of conceding too much weight to imagination, lest it result in subjective
judgments.
In Question 4, even though students struggled to say what the scientific method is,
they did not exhibit a naïve view about it—almost all rejected the simplistic analogy
between the scientific method and a cookbook recipe. Most students agreed that
principles were not the same thing as steps, but they found it quite difficult to explain
the difference and none of them provided examples of each to try to clarify this
important difference.
When discussing the answer options in Question 5, students placed a high value on
scientists reaching agreements, freely exchanging and debating ideas, and tolerating
each other’s views. Unfortunately, few of the participants actually addressed the
central issue raised by the question, namely, whether it is logical for scientists to
come up with more than one explanation of the same data and whether there is any
limit to the number of possible explanations.
Concerning the best grounds for belief in an explanation (Question 6), students
tended to value highly reasoning of explanations out of the data. When asked to
choose between unsuccessful (in terms of predictions) but apparently reasoned
explanations and successful but apparently unreasonable ones, students’ opinions
were divided. But when asked to choose between predictively unsuccessful but
widely agreed explanations and successful but little agreed ones, students clearly
preferred predictive success.
Finally, almost no students believed in the permanence of explanations (Question 7).
In their view, it is certain that new data will be discovered eventually, forcing
explanations to change. There was more disagreement and debate among students
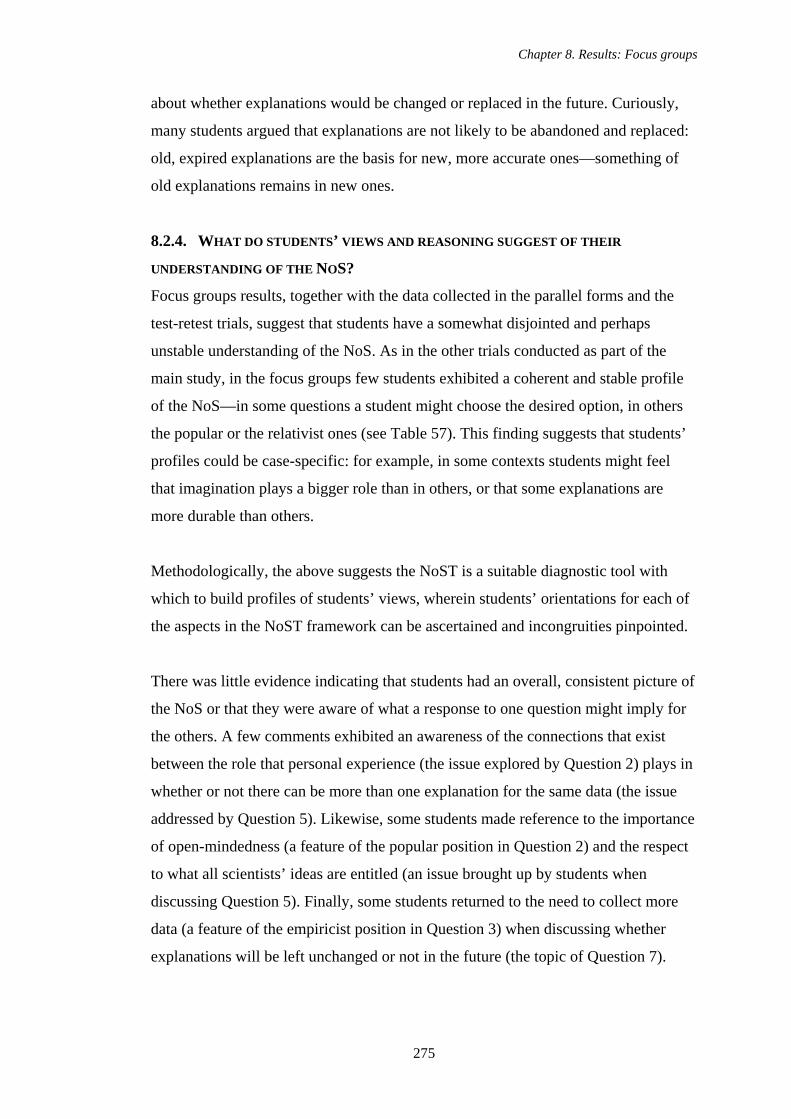
Chapter 8. Results: Focus groups
275
about whether explanations would be changed or replaced in the future. Curiously,
many students argued that explanations are not likely to be abandoned and replaced:
old, expired explanations are the basis for new, more accurate ones—something of
old explanations remains in new ones.
8.2.4. WHAT DO STUDENTS’ VIEWS AND REASONING SUGGEST OF THEIR
UNDERSTANDING OF THE NOS?
Focus groups results, together with the data collected in the parallel forms and the
test-retest trials, suggest that students have a somewhat disjointed and perhaps
unstable understanding of the NoS. As in the other trials conducted as part of the
main study, in the focus groups few students exhibited a coherent and stable profile
of the NoS—in some questions a student might choose the desired option, in others
the popular or the relativist ones (see Table 57). This finding suggests that students’
profiles could be case-specific: for example, in some contexts students might feel
that imagination plays a bigger role than in others, or that some explanations are
more durable than others.
Methodologically, the above suggests the NoST is a suitable diagnostic tool with
which to build profiles of students’ views, wherein students’ orientations for each of
the aspects in the NoST framework can be ascertained and incongruities pinpointed.
There was little evidence indicating that students had an overall, consistent picture of
the NoS or that they were aware of what a response to one question might imply for
the others. A few comments exhibited an awareness of the connections that exist
between the role that personal experience (the issue explored by Question 2) plays in
whether or not there can be more than one explanation for the same data (the issue
addressed by Question 5). Likewise, some students made reference to the importance
of open-mindedness (a feature of the popular position in Question 2) and the respect
to what all scientists’ ideas are entitled (an issue brought up by students when
discussing Question 5). Finally, some students returned to the need to collect more
data (a feature of the empiricist position in Question 3) when discussing whether
explanations will be left unchanged or not in the future (the topic of Question 7).
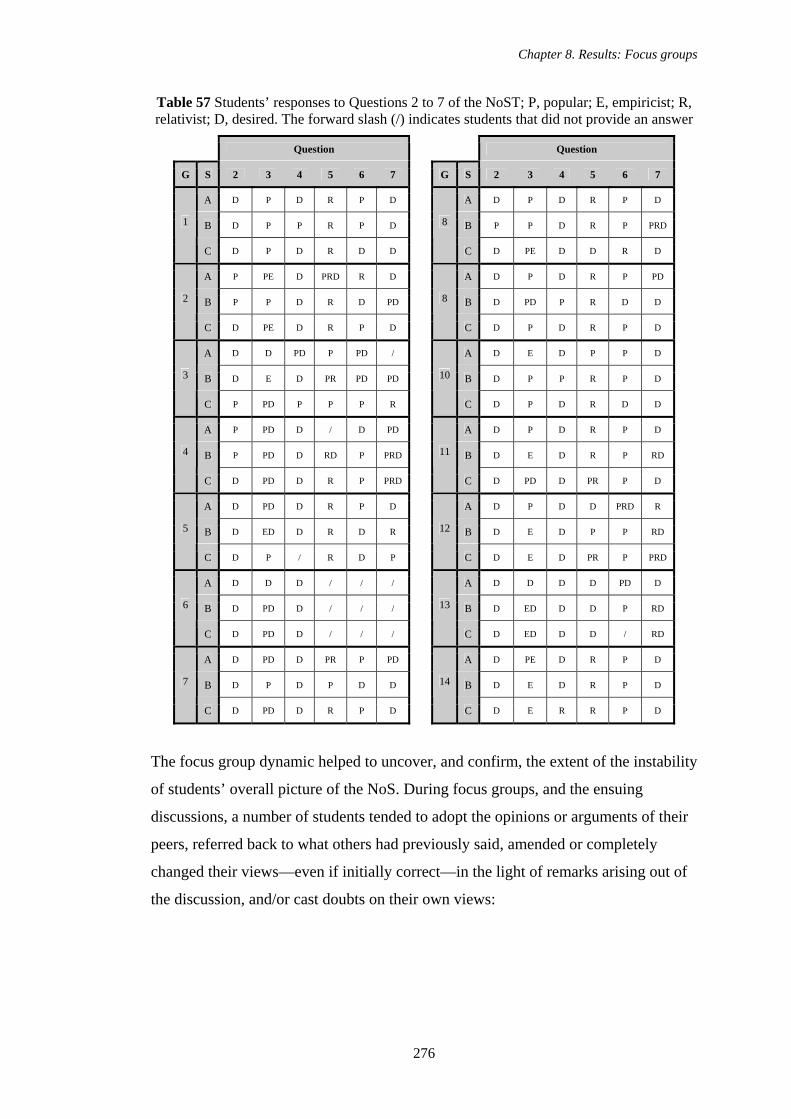
Chapter 8. Results: Focus groups
276
Table 57 Students’ responses to Questions 2 to 7 of the NoST; P, popular; E, empiricist; R, relativist; D, desired. The forward slash (/) indicates students that did not provide an answer
Question Question
G S 2 3 4 5 6 7 G S 2 3 4 5 6 7
A D P D R P D A D P D R P D
B D P P R P D B P P D R P PRD 1
C D P D R D D
8
C D PE D D R D
A P PE D PRD R D A D P D R P PD
B P P D R D PD B D PD P R D D 2
C D PE D R P D
8
C D P D R P D
A D D PD P PD / A D E D P P D
B D E D PR PD PD B D P P R P D 3
C P PD P P P R
10
C D P D R D D
A P PD D / D PD A D P D R P D
B P PD D RD P PRD B D E D R P RD 4
C D PD D R P PRD
11
C D PD D PR P D
A D PD D R P D A D P D D PRD R
B D ED D R D R B D E D P P RD 5
C D P / R D P
12
C D E D PR P PRD
A D D D / / / A D D D D PD D
B D PD D / / / B D ED D D P RD 6
C D PD D / / /
13
C D ED D D / RD
A D PD D PR P PD A D PE D R P D
B D P D P D D B D E D R P D 7
C D PD D R P D
14
C D E R R P D
The focus group dynamic helped to uncover, and confirm, the extent of the instability
of students’ overall picture of the NoS. During focus groups, and the ensuing
discussions, a number of students tended to adopt the opinions or arguments of their
peers, referred back to what others had previously said, amended or completely
changed their views—even if initially correct—in the light of remarks arising out of
the discussion, and/or cast doubts on their own views:
Chapter 8. Results: Focus groups
277
Interviewer: [Student 7A] thinks that imagination is necessary to come up with an explanation. Could you convince him otherwise?
Student 7B: I mean, yes, imagination is not…
Student 7A: What I meant by choosing option B [i.e., “You cannot reason out an explanation. Scientists must use their imagination to come up with a possible explanation for the data”] was that by using imagination we hazard a guess, and if we find enough evidence to accept this wild guess then we accept it. But first, in order to have, more or less, a direction to think in, or a direction where to go to we need a very bold theory, yeah? […] And afterwards, if we see that it’s not true, we then modify it. But first you have to hazard a guess, although obviously…
Student 7C: I don’t understand what you’re saying.
Student 7B: But why do you believe that an explanation can’t be reasoned?
Student 7A: Well… I don’t agree with that, but…
Student 7B: You know, what you’re referring to is not an explanation but a hypothesis. You’re not talking about the answer a scientist would reach. You’re referring to coming up with a hypothesis. If you start to look for answers from the imagination [rather than from the data], that’s what you get—a hypothesis. But if you want to come up with a logical explanation for things, which is what the option’s talking about, [you need to start from the data]. I mean, it’s more than obvious!
Student 7A: Uh, yeah, well… it would be a hypothesis then?
The possibility to discuss ideas also offered the unique opportunity—an opportunity
unavailable to students who completed the booklets individually—to enrich, or build
up, their thinking on the topic or to refrain from expressing their views. The
following exchange is an example of the first:
Interviewer: What would be the difference between discovering and inventing? When we talk about explanations, what would be more appropriate: discovering an explanation or inventing it?
Student 10A: Well, discovering would be a better fit.
Student 10B: Yeah, right?
Student 10C: However, inventing could also fit, because nevertheless… well, let’s say that [an explanation] was invented—[scientists] could still rule out things or add new things to it.
Chapter 8. Results: Focus groups
278
Student 10A: I would say, for example, I just remembered an explanation that was invented: remember that the chemistry teacher told us that Egyptians thought that some molecules produced a stinging feeling…
Student 10C: Yes, acids.
Student 10A: Yeah, and they thought that acids had little tips [that stung].
Student 10C: And alkalis had pores…
Student 10B: And acids fitted inside alkalis.
Student 10A: At first, this explanation could have been invented, but afterwards…
Student 10B: It was discovered.
Student 10A: Yeah, afterwards it was discovered.
In spite of examples like the above, the opportunity to engage in open discussion also
appeared to carry some drawbacks: some students appeared to adopt the most
comfortable, or shared, opinion out of convenience, rather than reflect on what might
be the best response. Other students appeared to be swayed by the personality, or
insistence, of their peers. In consequence, these students might appear to possess a
more or less developed view of the NoS than is the case.
8.2.5. ARE THERE ANY DIFFERENCES BETWEEN THE RESPONSES OF MEXICAN AND
ENGLISH STUDENTS?
There was little evidence of significant differences between English and Mexican
students. Broadly speaking, the range and nature of opinions were common to
students from both countries. The only notable difference appeared in the discussion
of question #4, where the two groups of English students made reference to “fair
tests” as an element of the scientific method. This difference is attributable to the
curriculum in each country.
In spite of this sole difference, it can be concluded that responses to the NoST were
very similar across countries. However, due to the disparity in the number of focus
groups held in each country (twelve in Mexico vs. two in England), a larger sample
Chapter 8. Results: Focus groups
279
of English students is necessary to ascertain whether there are differences in
students’ responses and what their extent might be.
8.2.6. HOW DOES THE NOST PERFORM AS A SUMMATIVE ASSESSMENT
INSTRUMENT?
The fact that some questions (namely, 4, 5, and 6) of the NoST suffer from what
appear to be interpretation problems on the part of students, together with the
evidence that many students seem to have unstable and disjointed views of the NoS,
do not strongly support the use of the NoST in its current form as a summative
assessment instrument. Results from the focus groups and the written administration
of the NoST confirm that the limitations of the multiple-choice format can be
overcome by talking to students, and corroborate that follow-up interviews are useful
means to verify the accuracy and validity of students’ responses.
Focus groups also had the added benefit of maximising the data output per session,
since the views from three different students are obtained in approximately the same
amount of time it would take to interview a single student, and with little extra effort
on the part of the interviewer. Furthermore, students in focus groups produce richer
information than a single student would have, since discussion is an integral part of
this technique: notably, unforeseen but relevant insights into students’ thinking about
the NoS can be elicited through this technique. The NoST—with its three answer
options—appears ideally suited to the focus group approach, since it provides
students with alternative positions to consider and debate.
Administering the NoST without recourse to follow-up interviews runs the risk of
misinterpreting students’ responses or producing a skewed picture of students’ views
of the NoS, particularly where Questions 4, 5, and 6 are concerned. To some extent,
allowing students to leave written comments clarifying or explaining their views, or
disagreement with the answer options, increases the reliability of the NoST.
However, analysing responses of this kind can be time-consuming in large-scale
assessment efforts.
Chapter 8. Results: Focus groups
280
8.2.7. COULD THE NOST FUNCTION AS A FORMATIVE ASSESSMENT INSTRUMENT?
In spite of the fact that the reliability of the NoST does not seem to warrant its use as
a summative assessment instrument, some its features and the outcomes of focus
groups suggest that it could be used very effectively for formative assessment
purposes.
During focus groups, the NoST stimulated meaningful discussion of the issues raised
by the answer options. The questions appear to be written at a level that students
readily understand and engage with, with little need for clarification by the
interviewer as evidenced by the following extract:
Interviewer: Let’s go to question number 7. “As a result of his work in 1927 Dr Goldberger claimed that pellagra is caused by a poor diet. Today, this is still the accepted explanation for the cause of pellagra and how to cure it. Once a scientific explanation has been accepted, will it always be accepted?” Option A says “Explanations that people accepted in the past have now been abandoned, so the explanations we accept today will be replaced by new ones at some point in the future.” B says “I disagree-the explanations we accept today may need to change, but that does not mean they’ll be replaced. They will just be improved.” And C says “Scientists only accept an explanation when it’s been tested and they know it’s true—so the explanations we accept today will not be replaced in the future by better ones.”
Student 13A: It’s B.
Student 13B: I don’t think it’s either of them, because…
Student 13A: It’s B.
Student 13B: Nah, I don’t think it’s either of them—It can’t be A, because they’re not necessarily going to be replaced. It can’t be B, because sometimes they will be replaced, because some of the things that happened in the past, or discoveries, were completely wrong, so they didn’t need to be improved—they needed to be replaced.
Student 13C: Yeah.
Student 13A: Well, eh, any explanation must… they’ve got to have some basis in fact. You can’t just make anything up of the top of your head and then, you know—you’ve got to have some evidence to [say that] any other theory that you come up with is an improvement.
Student 13B: In the past they’ve had explanations based on religion, but these explanations have nothing to do with science, they didn’t have anything to back them up or anything.
Chapter 8. Results: Focus groups
281
Student 13C: But in the future…
Student 13A: Well, the thing is, though, with religion, you know—Yes, they said the Earth was in the centre of the Solar System, but at least they knew there was some kind of, you know, there was something in the centre and there were circular orbits around, then that just got improved. So, well, actually is the Sun that’s in the middle. So even these religious… even the religious explanations, you know, you can still say, well, they were improved.
Student 13B: Mm, I suppose, yes.
Student 13C: And it also depends on how things change, if, like, they cure, I don’t know… If they make a cure for cancer in ten years, well, then, in a hundred years cancer might’ve changed, like, and that cure might not work anymore. So, it all depends… Everything has to be updated with the times, so as things change, you change, or views change. Like what you, it’s, like, it all depends on what changes.
Student 13B: I suppose…
Furthermore, even those questions whose validity is doubtful succeeded in eliciting
students’ views about aspects of the NoS, for instance the role of discussion,
agreement, and the open and free exchange and debate of ideas.
Even though there is little direct evidence that contexts play a crucial role in the
assessment, their inclusion in the design of the NoST could still make it a valuable
resource for researchers, teachers, and evaluators. Besides being an aid in exploring
students’ views of the NoS, the NoST could be easily repurposed or adapted to assess
other ideas of the NoS while keeping the structure of the episode more or less intact.
The abstract questions could also be easily contextualised, for example by asking
which of the answer options best describes or applies to the episode at hand.
Alternatively, students could be asked to explain how their views apply to the
context. Ultimately, and in spite of the above claims, addressing the criticism that
students might offer views unrelated to actual science (pseudoscience, science
fiction, and/or popular accounts) constitutes the more immediate advantage of the
contexts.
The fact that the NoST offers a series of answer options circumvents one of the
potential hurdles faced by open-ended assessment instruments: it provides students
Chapter 8. Results: Focus groups
282
with ideas upon which they can reflect and build their ideas from. Alternatively,
when students are not quite sure about which option to choose, they can be invited to
explain why they do not feel comfortable choosing any or criticise those offered. In
this way, students can narrow down what their beliefs amount to.
In conclusion, focus groups helped determine the validity of the NoST, directing
attention to questions that were interpreted in unanticipated ways by students and,
more specifically, to problematic aspects of the questions themselves. Furthermore,
insights provided by students suggested how to improve questions of doubtful
validity. Finally, the focus group approach, together with the NoST, proved to be a
promising and versatile formative assessment instrument, given that it invites
reflection and debate on aspects of the NoS that were not even originally
contemplated in the development of the instrument.
Chapter 9. Conclusions
283
9. CHAPTER 9
CONCLUSIONS
This chapter will review the main findings of the study in the light of the research
questions originally formulated, and will discuss some of the limitations of the
research. Following this, some implications—for researchers, curriculum planners,
and teachers—suggested by the findings will be considered. Finally, the chapter will
end with suggestions for further research.
9.1. ADDRESSING THE RESEARCH QUESTIONS Broadly speaking, the main research questions addressed by this study were: (a) Is
the NoST a valid and reliable assessment instrument? (b) What are students’ views
about the NoS? (c) What are the differences between the views of English and
Mexican students about the NoS?
9.1.1. IS THE NOST A VALID AND RELIABLE ASSESSMENT INSTRUMENT?
Establishing both the content and the construct validity of the NoST was done by
consulting a panel of educational experts in the teaching of the NoS and acting upon
their feedback. For the most part, they agreed that the aspects included in the NoST
content framework were relevant to 16-year old students; the questions portrayed the
targeted aspects of the NoS adequately; the answer option for each question that we
labelled “desired” did indeed represent the view we would wish students to hold; and
the alternative answer options offered were distinct and plausible. From these
remarks, adequate content and construct validity of the NoST were inferred.
Indirect corroboration of the construct validity came from both the written
administrations of the NoST, i.e., the test-retest and parallel forms trials, and the
focus groups: none of the participants suggested an alternative answer option
different from the popular, desired, or relativist ones included in the NoST
framework. Additionally, all answer options were chosen—and argued for, in the
focus groups—by at least a few students. These findings appear to suggest that the
NoST covers adequately the range of ideas about the NoS that students are likely to
possess and that all of these ideas are actually held.
Chapter 9. Conclusions
284
In spite of its apparent content and construct validity, the NoST appears not to be
reliable enough in its current form to be recommended for the summative assessment
of individuals, unless there is a supplementary way to corroborate students’ views
and interpretations. The evidence supporting this conclusion came from the written
test results and the student focus groups—two independent sources of data.
Besides providing valuable insights into students’ views (as will be discussed in
Section 9.1.2), focus groups provided insights into the ways students interpreted the
questions and justified their views, and into how accurately students’ responses were
interpreted by the researcher. The manner in which students justify their responses
can help to evaluate the reliability of a test, because if students manage to justify
their responses adequately while remaining on-topic, it strongly suggests they have
interpreted the questions as intended.
Data from the focus groups cast somewhat greater doubt on the validity and
reliability of three questions as compared to the others. In Question 5—the
underdetermination of explanation by data—some students did not address the issue
which it raised. In Questions 4 and 6—the scientific method and the best grounds for
belief in an explanation, respectively—some interpreted key terms or expressions
idiosyncratically, in a manner that deviated from the intended meanings, and/or could
not justify their views adequately or unambiguously. On the other hand, the majority
of students did interpret the remaining questions (1, 2, 3, and 7) as intended and, on
the whole, justified their views appropriately.
Contexts were included in the NoST as a means of increasing its reliability, by
helping to focus students’ attention on examples of actual scientific thinking, thereby
reducing uncertainty about the image of science they are holding in mind as they
answer more general questions about science. Evidence from the focus groups was
inconclusive as to whether contexts had influenced students’ views, but it often
appeared that they were ignored—with few students referring back to them to justify
their views. On the other hand, many may have approached the question with this
given example of scientific work in mind (as was intended), without making explicit
mention of it in their responses. In addition, few students recalled examples of their
Chapter 9. Conclusions
285
own and, if they did, treated them superficially. Together, these two findings cast
some doubt on the reliability of the NoST, since they suggest that the views of many
students are, to some extent, perfunctory—and not well supported by examples or
evidence.
The results of the test-retest and parallel forms trials also support the conclusion that
the NoST is not yet reliable enough to be used as a summative assessment
instrument. Between one third and one half of individual responses to the same
question were inconsistent in two administrations of the same test or in the
administration of tests with different contexts. Initially, it was thought that the
influence of the contexts on students’ responses could be determined by comparing
the outcomes of the test-retest and parallel forms trial. However, the results indicated
that many students’ views are not stable, to a very similar degree, whether or not the
context changes.
If a change of context is not responsible for inconsistency in students’ responses,
what then is its likely cause? Two alternatives suggest themselves, one due to the test
or the testing situation and the other to students’ views themselves. Some as yet
unidentified reason might have encouraged students, consciously or unconsciously,
to change their views when the test was administered again. Some students might
have been perplexed by being given what seemed to them (and indeed in some cases
was) the same test twice, and may have felt compelled to change their responses,
either as a natural reaction to being asked a similar question twice (see Blank et al.,
1978), or to increase their chances of getting the “right” answer on at least one
occasion. Or they might simply not have given much attention, or care, to the task
the second time. Alternatively, some students’ views might simply not be stable
enough to lead them to choose the same answer option on two occasions a few weeks
apart one from the other.
If the second alternative were to be corroborated, it would mean that the NoST
cannot be modified to produce more consistent responses by revising and improving
the existing questions, increasing their number, or administering the NoST more than
once. If students do not have a reasonably stable view of the NoS, then no test will be
able to measure these understanding reliably.
Chapter 9. Conclusions
286
Data from the focus groups may shed some light on this matter. During these
sessions, it was evident that some students were easily swayed by other participants’
views, sometimes replacing their own by those of more confident or vociferous
students. Additionally, some other students appeared not to have a clearly defined
view about certain aspects of the NoS, immediately adopting an idea suggested by
another participant during the course of the conversation. These findings, that some
students may not have stable views of the NoS, would account for the inconsistency
found in responses to the test-retest and parallel forms trials.
9.1.2. WHAT ARE STUDENTS’ VIEWS OF THE NATURE OF SCIENCE?
One of the advantageous methodological features of the NoST is the possibility to
build profiles of students’ understanding of the NoS, rather than just calculating a
single score. The results of the written administrations and the focus groups suggest
that all views represented in the NoST, and that constitute the profiles, are held by at
least some students.
Of the six epistemological aspects of science probed with the aid of multiple-choice
questions, a majority of students exhibited desired views in three of them: the theory-
ladenness of data, the nature of the scientific method, and the tentativeness of
scientific knowledge (Questions 2, 4, and 7, respectively). Regarding the role of
imagination in the generation of explanations (Q3), students’ views were more
evenly divided among the three positions—empiricist, popular, and desired.
Together, the empiricist and popular views accounted for the majority of students’
views. This results agree with those of Abd-El-Khalick (2001; 2005) and Lederman
et al. (2002) that indicate that the majority of participants in their respective studies
believed imagination played no (or little) role in science. In the case of the
underdetermination of explanations by data (Q5), the relativist option attracted a
little more than 50% of responses, with the desired option coming in second or third
place, depending on the country (see Section 9.1.3 for a summary of the differences
between students in England and Mexico). Finally, on the subject of the best grounds
for belief in explanations (Q6), the majority of students’ views were aligned with the
popular answer option, closely followed by the desired response.
Chapter 9. Conclusions
287
Even though in the focus groups the English sample was quite small, the overall
trends above for each of the questions in the written administrations were
corroborated by the focus groups: when interviewed students selected, overall,
approximately the same relative proportions of popular, relativist, and desired answer
options.
The problems concerning the validity of some of the questions discovered thanks to
the focus groups with students appear to be solvable. For instance, some
modifications that would improve Question 4 (the character of scientific method)
would be eliminating all mentions of “steps” and “principles” (since students do not
appear to understand these terms clearly) and clarifying the three different
conceptions of the NoS offered by the answer options. Apart from there being no
scientific method, the ideas that need to be conveyed to students are that the
scientific method is a research strategy that consists in inventing and testing
explanations (the desired view) and that it is a research strategy that starts with
making observations, deriving a hypothesis from them, conducting experiments, and
drawing conclusions about the behaviour of what was observed, in that order (the
popular view). The belief in a single, mechanistic or recipe-like scientific method has
not yet disappeared (Abd-El-Khalick, 2001; Lederman et al., 2002).
In the case of Question 5 (underdetermination of theory by data), it appears its
validity would be greatly improved if all mentions of agreement among scientists
were eliminated. Furthermore, the focus group results regarding this question suggest
it would be a good idea to probe social aspects of science that have a bearing on its
epistemology (like the roles of criticisms, public scrutiny, peer review, and
consensus).
The validity of Question 6 (the best grounds for belief in an explanation) could be
improved by clarifying what is meant by a “prediction”, so as to avoid any confusion
with astrological ones or risky gambles. Saying something like “We know it’s a good
explanation if it leads to new predictions about natural phenomena that turn out to be
right” could avoid the above confusion.
Chapter 9. Conclusions
288
Not only did the focus group results reflect those of the written administrations, but
the justifications given by most students were also consistent with their stated views.
Even though the reliability of the views elicited by some questions—most notably
Question 5—is somewhat questionable, during the focus groups these questions did
succeed in eliciting students’ views about relevant aspects of the NoS, such as the
role of debate, the possibility of consensus, and the importance of respecting the
ideas of others.
Most of the understandings of the NoS exhibited by students appeared to be intuitive,
rather than the product of sustained reflection or explicit instruction. In a few
instances, the effects of instruction seemed to be indicated by what appeared to be
memorisation of concepts or ideas: almost all students, for example, claimed that the
scientific method was not made up of “steps”, even though many failed to explain the
difference between “steps” and “principles”, and struggled to articulate the key
features, or the nature, of the scientific method. The constructivist emphasis on
letting students figure out the best way of testing a claim, either experimentally or by
thinking through its implications, rather than imposing a predetermined method
(Driver and Oldham, 1986; cited in Matthews, 2004, p. 143) might help to account
for this propensity to reject “recipes”.
Another instance where an effect due to instruction could reasonably be suspected is
students’ unwavering belief in the importance of open-mindedness, cooperation, and
tolerance among scientists. These beliefs chime well with the liberal and egalitarian
discourse adopted widely by curricula—and a particularly strong educational policy
in Mexico, where most of the focus group participants came from.
Besides being somewhat inconsistent—as evidenced by profiles where desired views
of the NoS coexist with naïve and/or relativist ones—and easily influenced by the
opinion of others, the views of most students are also, to some degree, superficial:
most students did not offer any examples with which to illustrate their thinking, even
when explicitly invited to do so. And when they did offer an example of their own,
they tended to simply mention it in passing, without exploring or explaining the
relationship between their views and the particulars of the example. A
compartmentalised, fragmented, or conflicting understanding of the NoS—one where
Chapter 9. Conclusions
289
mature views coexist with naïve ones—has been reported by several researchers,
most notably Koulaidis and Ogborn (1989), Lederman and O’Malley (1990), Moss et
al. (2001), Abd-El-Khalick (2001), and Brown et al. (2006). The findings of these
works are strikingly similar to the ones of the present study.
It is quite surprising that, even though curricula tend to include a representative
selection of scientific episodes of historical relevance, most students appear not to
remember any of them. In this sense, it is not far-fetched to conclude that their views
of the NoS are themselves de-contextualised, unsupported by a fleshed-out
knowledge of how scientific knowledge has developed and how scientists actually
work. In spite of this, it might be worth asking students explicitly to apply their
views to specific episodes, and exploring whether students’ views are transferable to
other contexts (see Section 9.4 for some suggestions for further research).
Given the above, the apparently memorised rather than understood character of some
students’ views, together with their superficiality, de-contextualisation and lack of
coherence, stability and context-independence, it is not inconceivable that their views
could be the result of on-the-spot thinking and not a reflection of deeper convictions
or beliefs.
In relation to the distinction between data and explanations (Question 1), results from
both the written administrations and focus groups suggest that most students find it
equally hard to classify examples of data and explanations, and that the specific
content of the statements does influence their success in this task. Leach (1996)
reported a similar finding. Additionally, the fact that some students struggled to
articulate the difference between both concepts (and particularly to articulate the
inferential character of explanations) suggested that these students understand only
intuitively the difference between “data” and “explanations”—a finding that
corroborates those of Abd-El-Khalick (2001; 2005) concerning preservice teachers
failure to recognise the inferential nature of scientific claims and the distinction
between a claim and the evidence that supports it.
One of the most interesting findings regarding students’ conceptions of the nature of
explanations—corroborated by the proportions of students that chose the desired
Chapter 9. Conclusions
290
answer option in Question 3—is that none of the participants in the focus groups,
when asked for what scientists need to do to procure an explanation, made reference
to creativity, imagination, or ingenuity. According to students, explanations have
their origins in data, with imagination playing a subsidiary role.
Finally, students’ ability to distinguish data from explanations appears not to be
related to possessing desired views of the NoS. There was no significant correlation
between performance on Question 1 of the test and aggregate “score” on the other six
questions.
9.1.3. WHAT ARE THE DIFFERENCES BETWEEN THE VIEWS OF ENGLISH AND
MEXICAN STUDENTS?
Quite surprisingly, there were few differences in the patterns of responses to each
question between English and Mexican students in the written administrations of the
NoST—both samples chose similar proportions of popular, relativist, and desired
answer options. The only instances where the pattern of written responses differed
between the two countries were in Questions 3 and 5. In the first case—concerning
the role of creativity—fewer Mexican students chose desired views and more chose
empiricist and popular views than their English counterparts, giving precedence to
data and reasoning over creativity in the generation of explanations. In the second, a
rather large number of Mexican students, compared with their English counterparts,
chose the relativist response about underdetermination of explanation by data.
There appear to be no obvious reasons that could help to account for either of these
differences. It could be argued, however, that the fact that some Mexican students
did not choose the desired answer option in Question 5 was because they mistakenly
assumed that it implied that scientists would never be able, or willing, to achieve
consensus. This, then, drove them to choose the relativist option, since it made no
reference to “agreement” and did not limit scientists’ thinking in any way.
Given the disparities between curricula (the Mexican curriculum only recently
incorporated the NoS as an educational outcome in 2006), it is noteworthy that only
few marked differences were found, such as the slight tendency for more Mexican
students to choose naïve—either relativist and/or popular—answer options.
Chapter 9. Conclusions
291
Furthermore, Mexican students appeared to be slightly less capable of distinguishing
data from explanations.
Corroborating the results from the written administrations of the NoST, the analysis
of the focus group data revealed few differences between English and Mexican
students’ views of the NoS and their justifications for these views. Apart from
mentions of local issues (such as the MMR vaccine controversy), the only other
notable difference centred on English students’ frequent references to “fair tests” as
part of the scientific method and the complete absence of this idea in Mexican
students’ responses. This finding could be attributed to curriculum differences, since
“fair tests” are a common feature of the teaching of the English National Curriculum
but not of Mexico’s secondary science curriculum.
These findings suggest that results from the written test are quite reliable at the
population level, that is, more trust can be placed in the information the NoST
produced about the level of understanding of the NoS of a group than in the
information produced about the understanding of an individual. If that is the case, it
could be argued that the NoST is a suitable instrument with which to measure
changes in understanding of the NoS of groups (such as a class or year cohort in a
school) over time (e.g., as a result of maturation, or before and after a teaching
intervention). This constitutes a positive outcome towards establishing the scope of
applicability of the NoST.
9.2. LIMITATIONS OF THE STUDY Availability of time and access to students were responsible for the most serious
limitations of this study. On the one hand, much time was spent devising the NoST
and its framework. With more time, interviews or focus groups with students could
have been conducted as part of the pilot study, with the aim of improving the NoST
before using it in the main study to explore students’ understanding. Such a strategy
would have certainly increased the validity of the results. On the other hand, the
difficulty in gaining sufficient access to schools in England precluded corroborating
the views, and exploring the reasons behind them, of more students. This restriction
led to somewhat smaller sample sizes than might have been ideal.
Chapter 9. Conclusions
292
The conclusions drawn about students’ views of the NoS and about their respective
validity and reliability are somewhat limited by the small sample size used in the
test-retest trial relative to the size of the one in the parallel forms trial. The higher
degree of inconsistency between administrations of tests with the same context,
compared with administrations of tests with different ones, was unexpected. Initially,
it had seemed reasonable to suppose that changing the context would have a bigger
effect than not changing it. In the case of the test-retest trial, the small sample size
could have been more susceptible to a few inconsistent students’ responses.
Alternatively, the results could have been affected by an inadequate implementation
by the teachers involved in administering the tests in some schools. Test-retest trials
are unusual and peculiar for schools, and need to be justified to teachers who, since
they are being asked to administer the exact same test twice, might not immediately
grasp their significance. Also, it has been found that “it can be difficult to persuade
pupils to take two tests close together for test-retest studies” (Gipps, 2004, p. 68).
Again, these negative effects could have been “averaged out” by having access to a
larger sample of schools.
The small sample size also affected the exploration, through focus groups, of
differences between students’ views of the NoS in England and Mexico. In this case,
a larger sample of English students could have increased the likelihood of identifying
differences between countries.
Another limitation is inherent in the design of the NoST, which addresses a limited
number of aspects of the NoS. For instance, in the current version of the NoST there
is no coverage of aspects related to scientists’ social practices such as the open
debate of ideas, the role of peer review, and public scrutiny. Even though ideas like
these are more closely associated with the sociology of science than its epistemology,
they nevertheless have a bearing on views of scientific knowledge. Adding and
validating questions that addressed these kinds of aspects would turn this limitation
into an advantage, and therefore represent an important suggestion for further work.
Methodologically speaking, the results of the study strongly suggest that the NoST in
its current form would not provide reliable data on students’ views if used by itself as
Chapter 9. Conclusions
293
an assessment instrument. The value of follow-up interviews—as has been amply
documented in the literature—was corroborated by the focus groups: fixed-response
instruments are susceptible to idiosyncratic interpretations on the part of students,
and the nature of these is difficult to predict in advance.
As was pointed out by a few of the experts consulted, the fact that the questions of
the NoST are not fully contextualised (rather, the contexts are used to frame the
questions) wasted the opportunity to explore directly the extent to which students
adapt their understanding of the NoS to different situations. As one of the experts
remarked, there might be no difference in outcomes if the questions were asked in
the abstract—with no previous reading of the episode—rather than in their current,
mostly de-contextualised, state.
The small number of questions of the NoST also represents a limitation to its
usefulness as an assessment instrument. A set of questions for each of the aspects in
the NoST content framework could allow the evaluation of the reliability of
responses by determining the internal consistency or correlation between those given
to each set.
9.3. IMPLICATIONS OF THE RESEARCH This study corroborated the pertinence of one of the main criticisms that have been
raised against selected-response assessment instruments in the past (for the most
recent overview, see Lederman, 2007, pp. 861-869), that is, their implicit adoption of
the doctrine of “immaculate perception” (Munby, 1982)—the false assumption that
students and researchers interpret the questions in a test, and the answers given, in
the same way.
In the light of the likelihood of students misinterpreting the questions, the present
study constitutes a convincing argument in favour of the careful validation of fixed-
response questionnaires by cross-checking students’ interpretations, either through
interviews or focus groups. Under the circumstances of this study, focus groups
proved to be a useful and practical technique for exploring students’ views of the
Chapter 9. Conclusions
294
NoS and their underlying rationale. As exemplified by the results of this study, focus
groups can have significant advantages. Unlike one-on-one interviews, they
foster debate among participants, by asking them to defend their views or,
alternatively, question those of others; in this way, focus groups invite
participants to make their reasons for holding a particular view, or their
objections to other views, explicit;
enrich the stock of ideas under discussion and the reasons behind them, since
students can react to and assess ideas or examples they were not originally
familiar with or had not considered previously;
can produce more fruitful data, since the views of several students can be
elicited and probed in approximately the same amount of time that it takes to
interview a single one;
allow new insights to develop out of the interaction among students, since
they can use the ideas of others to build, or develop, new ones;
test the consistency and stability of participants’ views by forcing them to test
their ideas against those of others;
turn students into a kind of researcher: students can question the adequacy
and pertinence of the views of others; conversely, students appear to be more
willing to defend their views against criticisms that come from their peers
than from a researcher;
are less threatening to students and, thus, help break the barrier that might get
in the way of getting data in a one-one-one interview—shy students can feel
more comfortable sharing their views with a researcher when accompanied
by their peers; and
produce a more relaxed atmosphere that can prove conducive to candid and
honest responses; students appeared to feel less inclined to give “desired”
answers when supported by their peers.
Furthermore, it appears that the concept cartoon format used by the NoST is ideally
suited to the focus group approach: students quickly grasp the alternative positions
when presented visually—through three cartoon students having a discussion—and
with little prompting start the discussion. From the point of view of the researcher, it
Chapter 9. Conclusions
295
easily allows the exploration not only of the reasons behind students’ views, but of
their reasons for not choosing the remaining answer options.
In spite of these advantages, focus groups have some drawbacks that need to be kept
in mind when conducting them and analysing the data they produce. It is not
uncommon for students to adopt the views of more confident, vociferous, or
persuasive students rashly and without thinking. Related to this, some students are
not accustomed to express and/or defend their ideas, and the focus group dynamic
might inhibit shy students. Furthermore, students unwilling to participate can hide
behind the responses of others or spread their unwillingness to other participants.
In the light of the results of both the written administrations and the focus groups,
future research in the field ought to take care to acknowledge that there could be an
inherent limit to the reliability of any given instrument, imposed by students’ own
incoherent and/or unstable understandings and, thus, unrelated to the features of the
test. If students’ views are themselves unreliable to some extent, as the results of this
study appear to suggest, a single administration of a test will not necessarily produce
accurate data. In this sense, it might be worth testing, when developing an
instrument, the extent to which students’ responses are consistent by conducting at
least a test-retest trial with the same sample of students—a practice that has not been
that common amongst developers of assessment instruments.
A possible educational implication of the findings of this study is that, in order to
achieve the educational outcomes involving the NoS and advocated by scientific
literacy initiatives, it might not be enough to teach adequate conceptions of the NoS
explicitly: teachers and curricula may need to emphasise the interconnectedness of
the various aspects of the NoS, as well as providing examples of historical and
contemporary scientific practice. A coherent and comprehensive framework on
which to articulate apparently disparate elements of the NoS might be as important as
sophisticated understandings of them. Given the results of this study, it can be argued
that it is not sensible to expect people to possess adequate knowledge of the NoS
without having also a reasonable background of some episodes of the history of
science and/or contemporary scientific work.
Chapter 9. Conclusions
296
9.4. FURTHER RESEARCH One of the immediate tasks following the end of this study would be the revision and
improvement of the NoST in the light of the findings, especially students’
misinterpretations. Once this has been attempted, a reassessment—by consulting
experts and interviewing students—of the validity of the questions as probes of
students’ views would be in order, so as to leave the test ready for use in the
assessment of understandings of the NoS. Furthermore, ascertaining the validity of
the NoST, with as much certainty as possible, would also contribute to determining
whether the NoST is a reliable test, or whether the thing it is trying to measure does
not exist as a stable variable in the sample being studied.
In order to corroborate the unexpected degree of inconsistency in the test-retest trial,
a larger sample of students would have to be used to ensure that small numbers of
students with unstable and/or context-dependent views do not affect the overall
pattern of results, as could have been the case in the relatively small sample used in
the test-retest trial in this study. Also, it might be worth extending the period between
administrations, so as to minimise any effects due to students feeling the need to
change their responses when faced with an identical test. A longer period of time
between administrations could also decrease students’ familiarity with the NoST.
If, in spite of a lengthier wait period, a similar degree of inconsistency in responses
remained, the scales would tip in favour of the hypothesis that students’ views of the
NoS are, in themselves, unstable and/or context-dependent, that is, that students do
not in fact have firm views of the NoS, or perhaps any considered views at all. In this
case, the alternative hypothesis—i.e., that students’ views are sensitive to the
context—would become less likely. In this regard, it might also be worth exploring
the existence and extent of a possible context-effect by administering different forms
of the NoST—with contexts other than Goldberger’s discovery of the cause and cure
of pellagra and Wegener’s theory of continental drift.
Likewise, increasing the number of focus groups held with English students could
help probe further whether there are any significant differences between English and
Chapter 9. Conclusions
297
Mexican students’ views of the NoS, or the causes of the differences seen in
responses to the written administrations of the NoST.
In the light of the results, exploring and validating the use of the NoST as a formative
assessment instrument, with focus groups, appears to be a fruitful avenue for future
research. This line of research could help determine the existence and extent of a
possible context-effect, by using more than one context in the focus groups, and
asking students to explain how the responses that best match their own would apply
to the different contexts, or whether different responses fit different contexts better.
This strategy could also lend itself to an exploration of the sophistication of students’
views, since it is possible that the same views of the NoS would not fit equally well
with both historical and contemporary scientific episodes. Students’ ability to apply
differentially their views of the NoS would constitute another measure of how
developed are their understandings of the NoS.
Finally, the slight differences between the views of Mexican and English students
also require attention, particularly in determining their origin. This could help
uncover whether they are due to differences in the curricula, teaching practices, or
other unanticipated factors. The study of nationality-dependent differences in views
of the NoS could also be extended to include other countries, by translating the NoST
into other languages different that English and Spanish.
9.5. FINAL WORDS This project set out to develop an assessment instrument that addresses some of the
most pointed criticisms raised against previous assessments, while allowing
educators to assess, rapidly and reliably, students’ views of the NoS. In an effort to
test its validity and reliability in as thorough and rigorous a manner as permitted by
the available means permitted, the NoST was subjected to the judgment of
educational experts in the field, its meanings were corroborated directly against
students’ verbally expressed views, and its reliability was subjected to test-retest and
parallel forms trials. These twin strategies are widely considered to be the more
robust alternatives for determining the reliability of a test (Stobart and Gipps, 1997;
Gipps, 2004). To the best of my knowledge, test-retest and parallel forms methods
Chapter 9. Conclusions
298
have not been a common feature in the validation of previous NoS assessments,
where split-half methods have been the preferred choice. Besides the careful design
of the test, the application of these two methods could be considered to be the main
original contribution of this study to scholarship in the field, since it provided
suggestive evidence that the NoS, as a construct in students’ minds, might not be a
stable enough notion to be assessed reliably. If corroborated, this finding could call
for the reappraisal of how the NoS is assessed.
In spite of the questionable reliability of the NoST when applied to the assessment of
individual students, its potential value as a formative assessment instrument should
not be underestimated. The consistency of responses between English and Mexican
students, both in the written administrations and the focus groups, strongly suggest
that the NoST can be used reliably at the population level, for example, to determine
how developed are the views of a class of students after an intervention.
Furthermore, students’ responses to, and attitudes in, the focus groups suggest that
the NoST could enable teachers to obtain useful information on their students’
understanding within the classroom situation. Individual questions could be used as
stimuli to elicit discussions in class, from which teachers might gain valuable
insights into his or her students’ thinking. Given the current interest in formative
assessment, particularly in secondary school (OECD, 2005), this application of the
NoST merits further exploration.

Appendix 1. Pilot study tests
299
10. APPENDIX 1
PILOT STUDY TESTS
Appendix 1. Pilot study tests
300
Appendix 1. Pilot study tests
301
Appendix 1. Pilot study tests
302
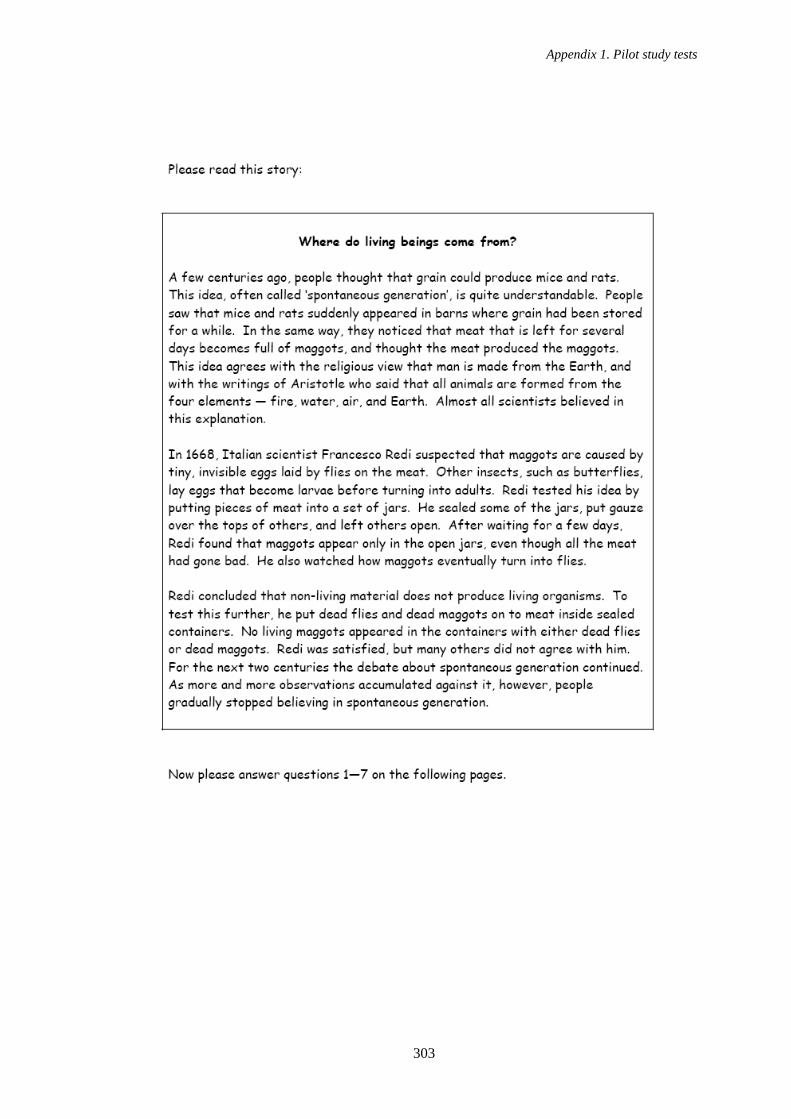
Appendix 1. Pilot study tests
303

Appendix 1. Pilot study tests
304
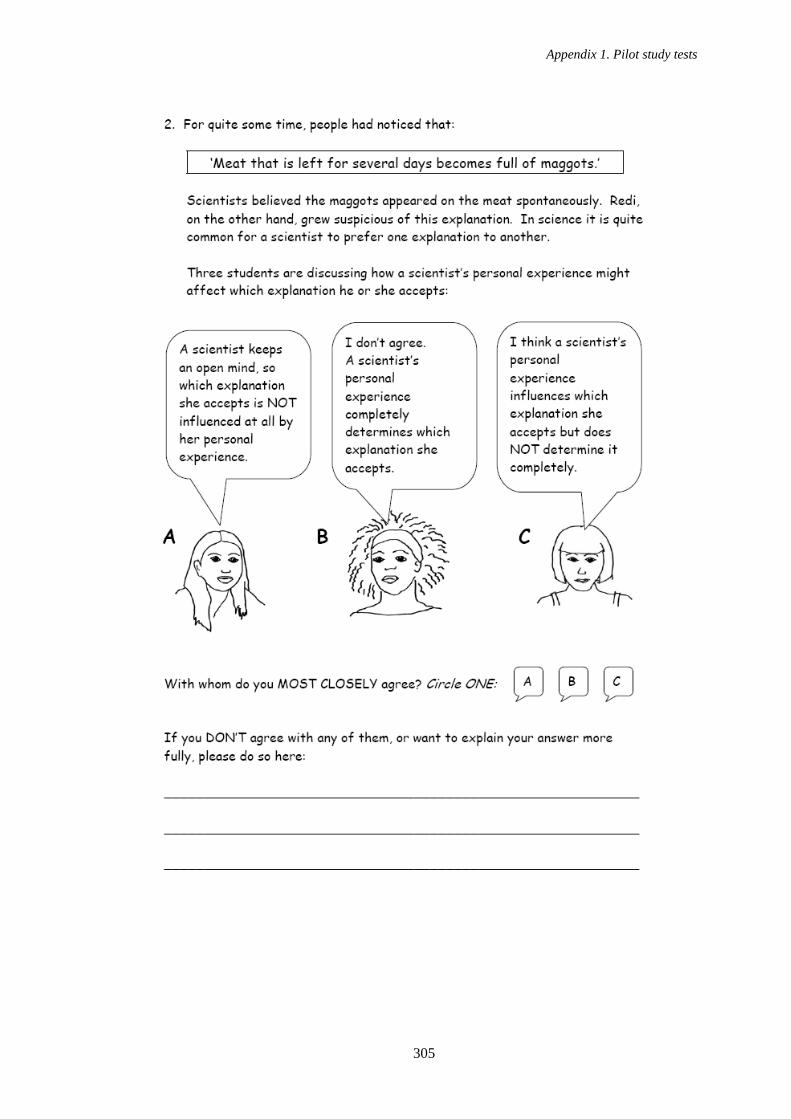
Appendix 1. Pilot study tests
305
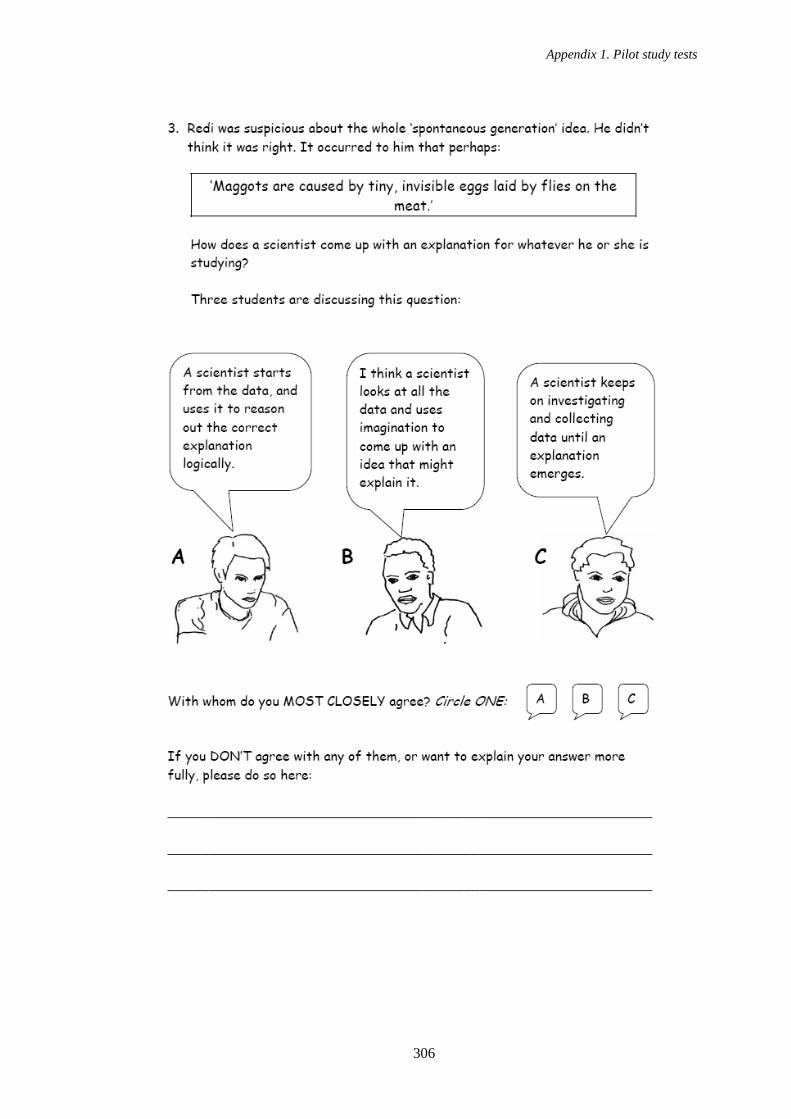
Appendix 1. Pilot study tests
306
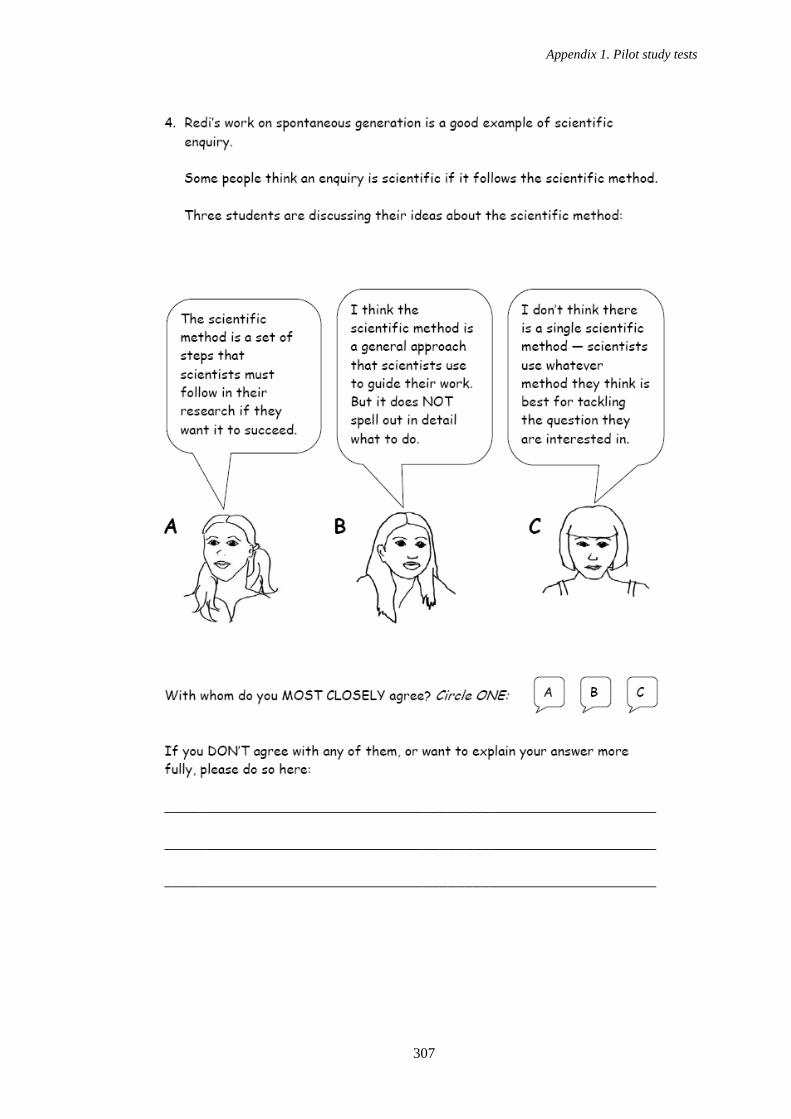
Appendix 1. Pilot study tests
307
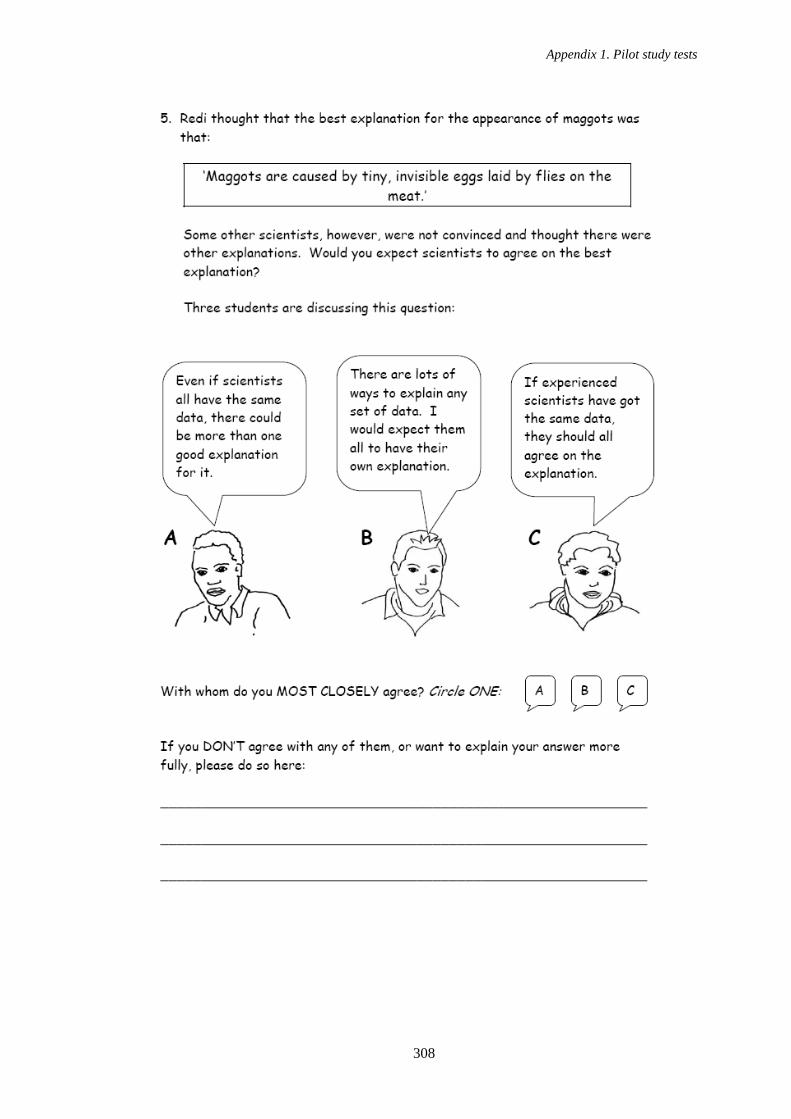
Appendix 1. Pilot study tests
308
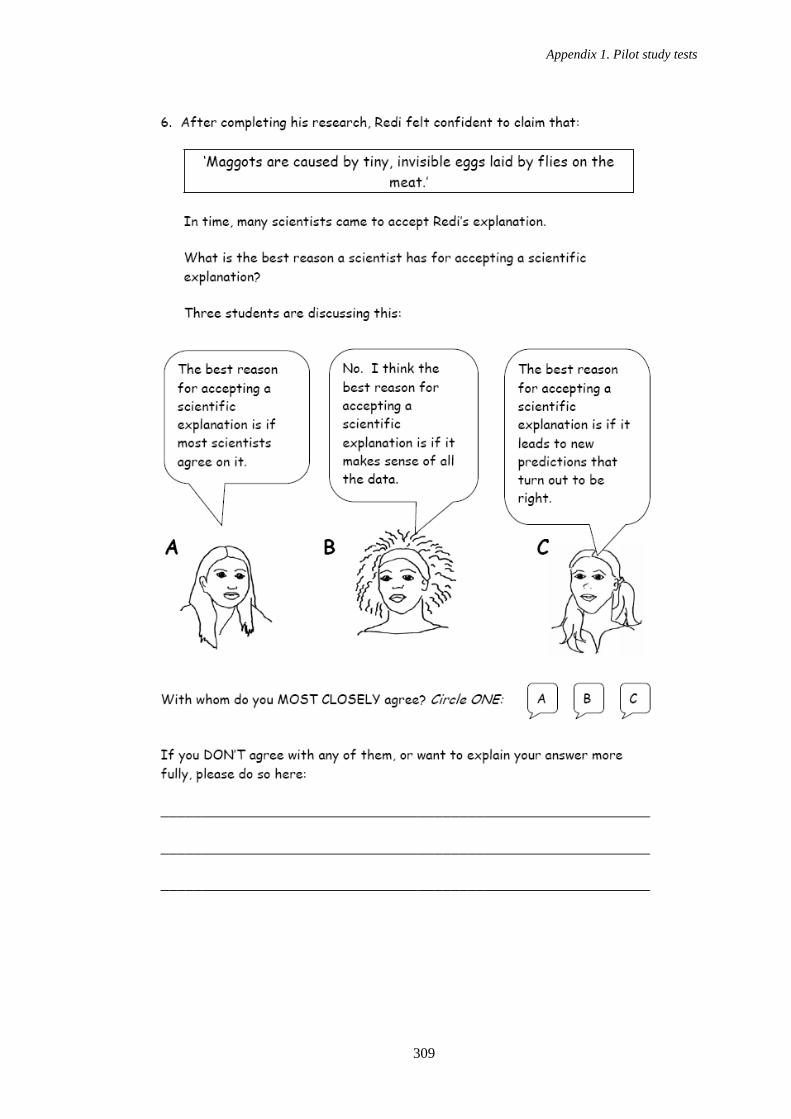
Appendix 1. Pilot study tests
309
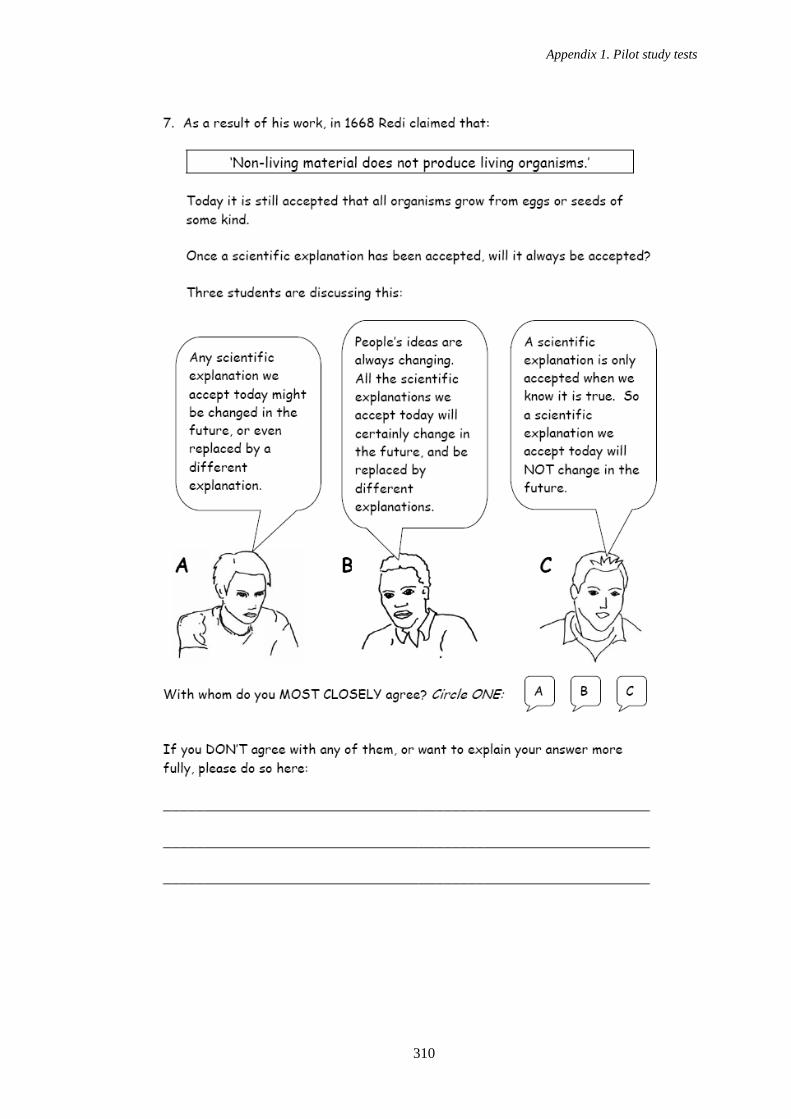
Appendix 1. Pilot study tests
310
Appendix 1. Pilot study tests
311
Appendix 1. Pilot study tests
312
Appendix 1. Pilot study tests
313
Appendix 1. Pilot study tests
314
Appendix 1. Pilot study tests
315

Appendix 1. Pilot study tests
316
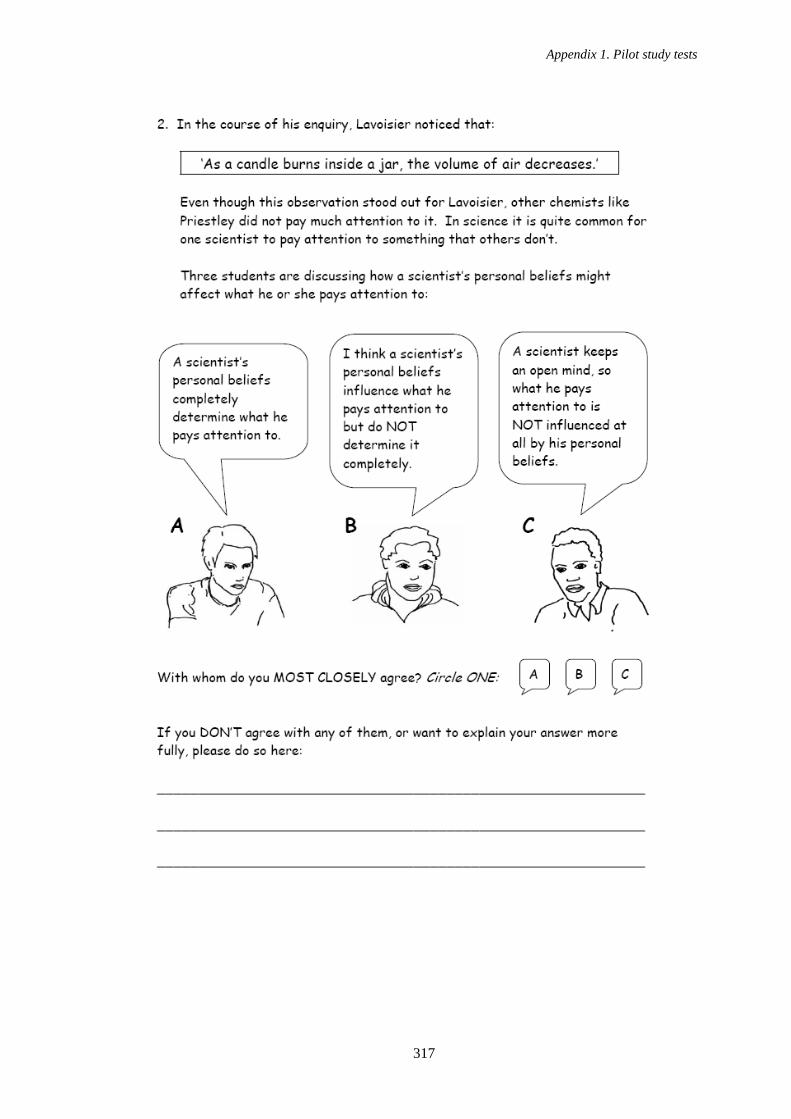
Appendix 1. Pilot study tests
317
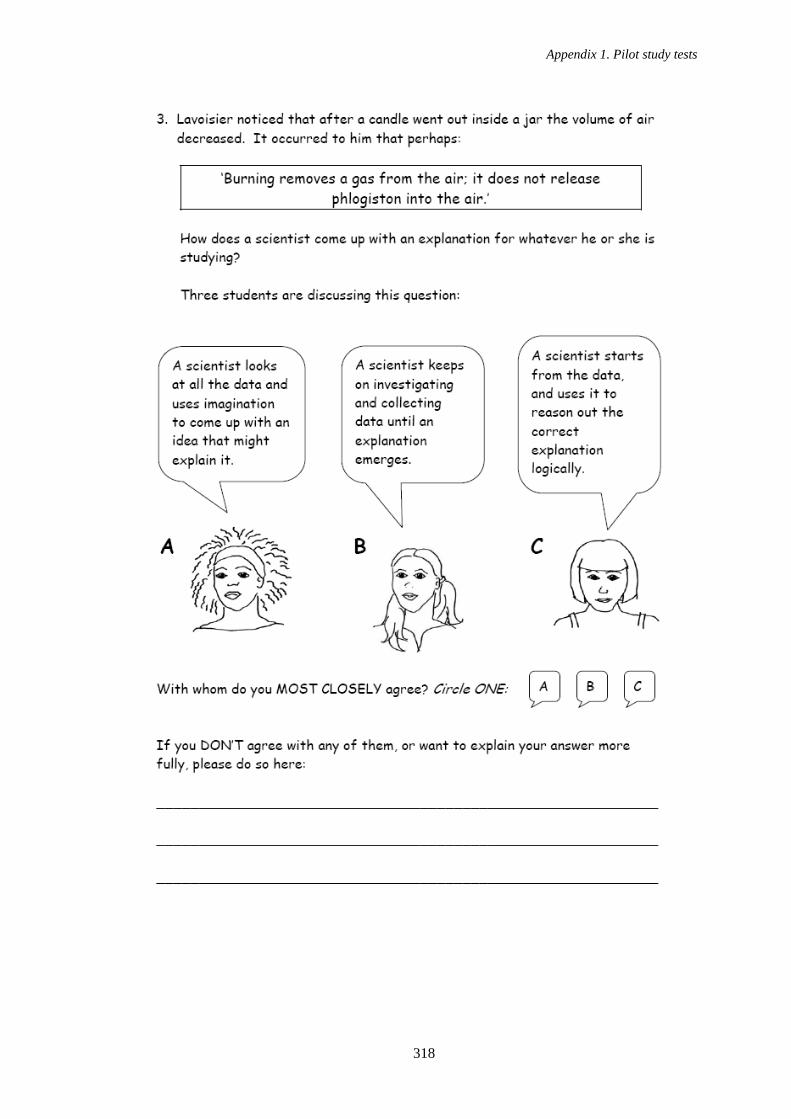
Appendix 1. Pilot study tests
318
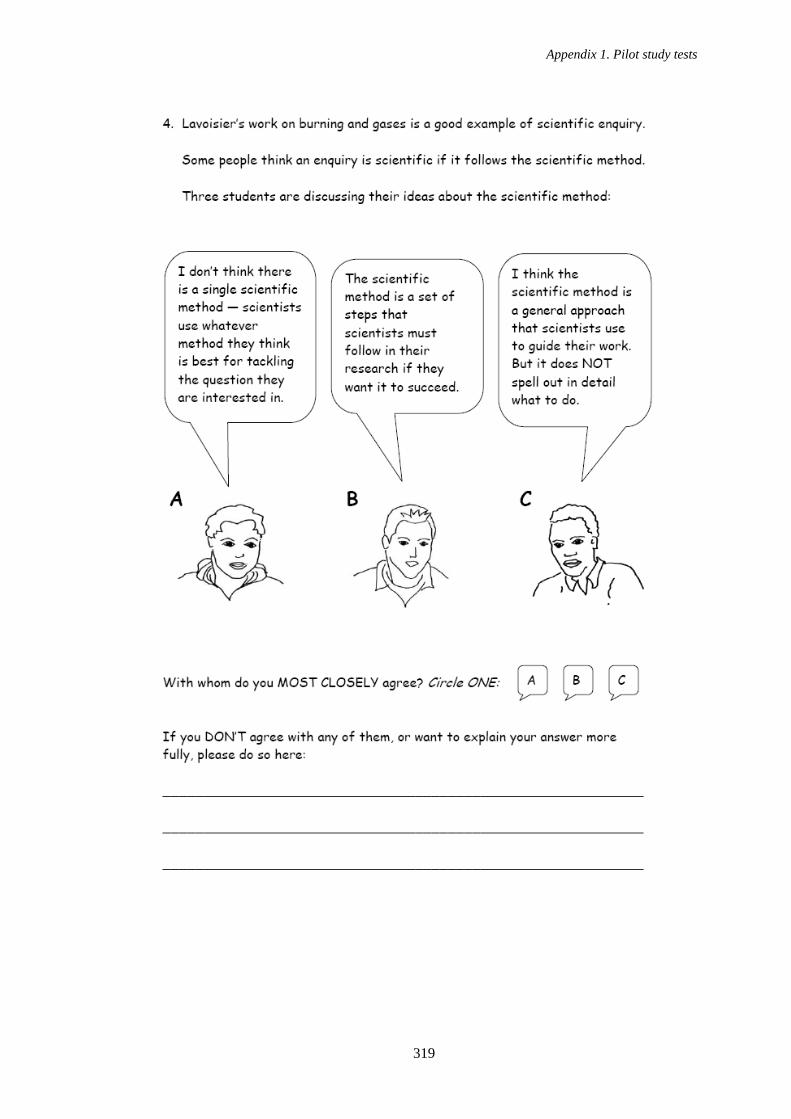
Appendix 1. Pilot study tests
319
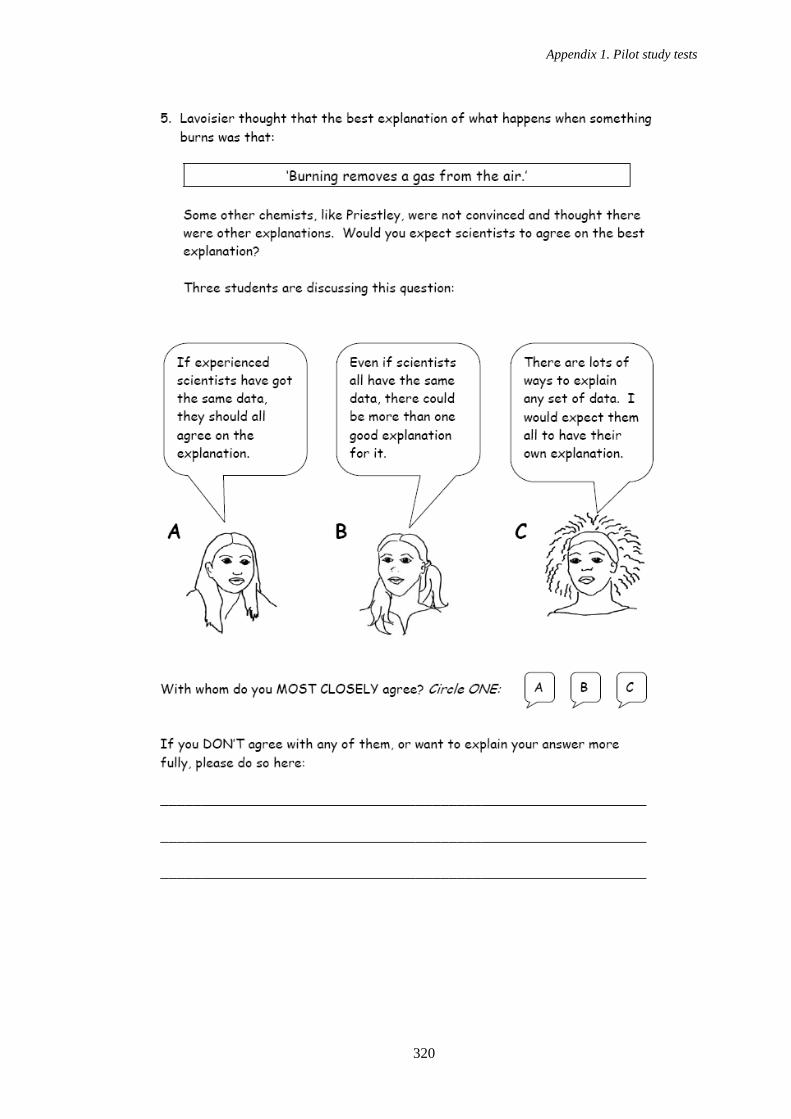
Appendix 1. Pilot study tests
320
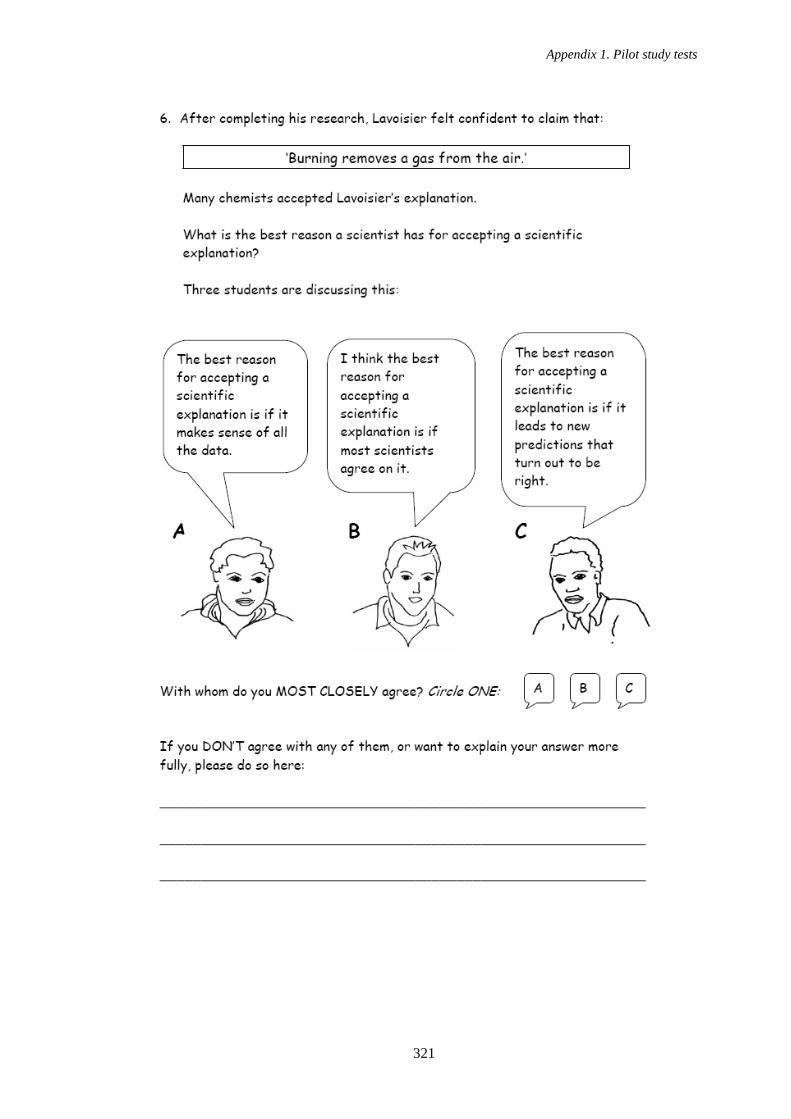
Appendix 1. Pilot study tests
321
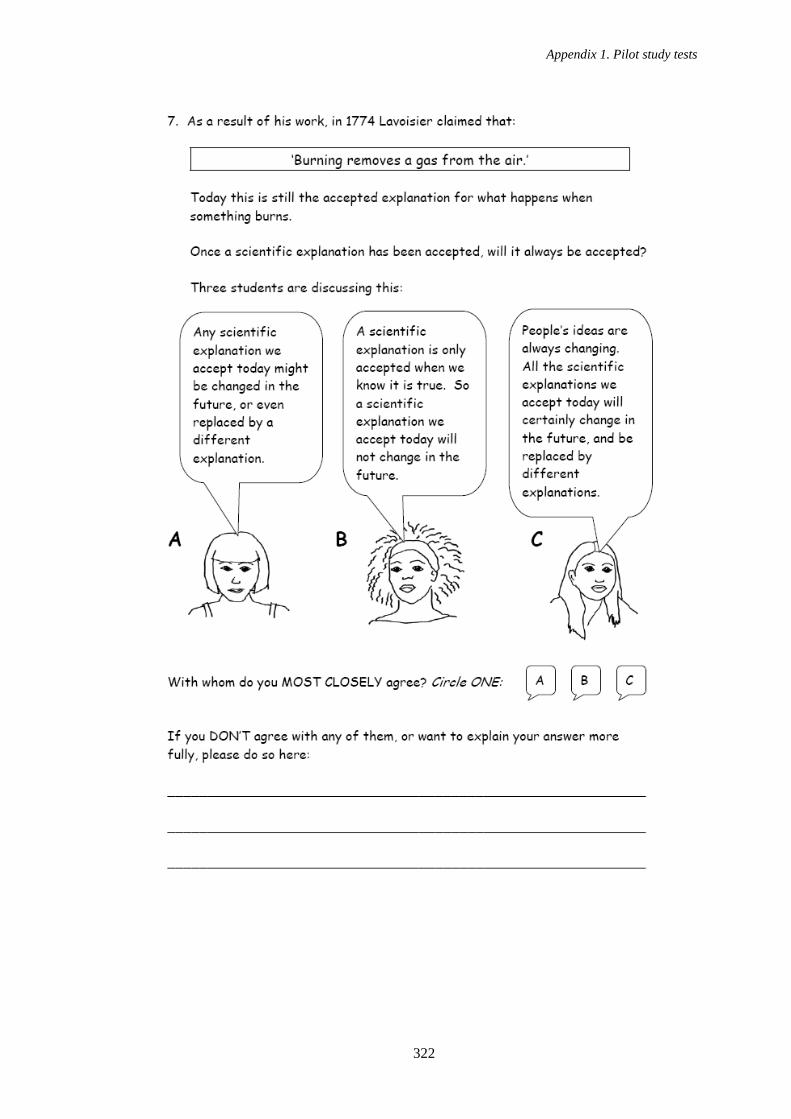
Appendix 1. Pilot study tests
322
Appendix 1. Pilot study tests
323

Appendix 2. Main study tests
324
11. APPENDIX 2
MAIN STUDY TESTS
Appendix 2. Main study tests
325
Appendix 2. Main study tests
326
Appendix 2. Main study tests
327
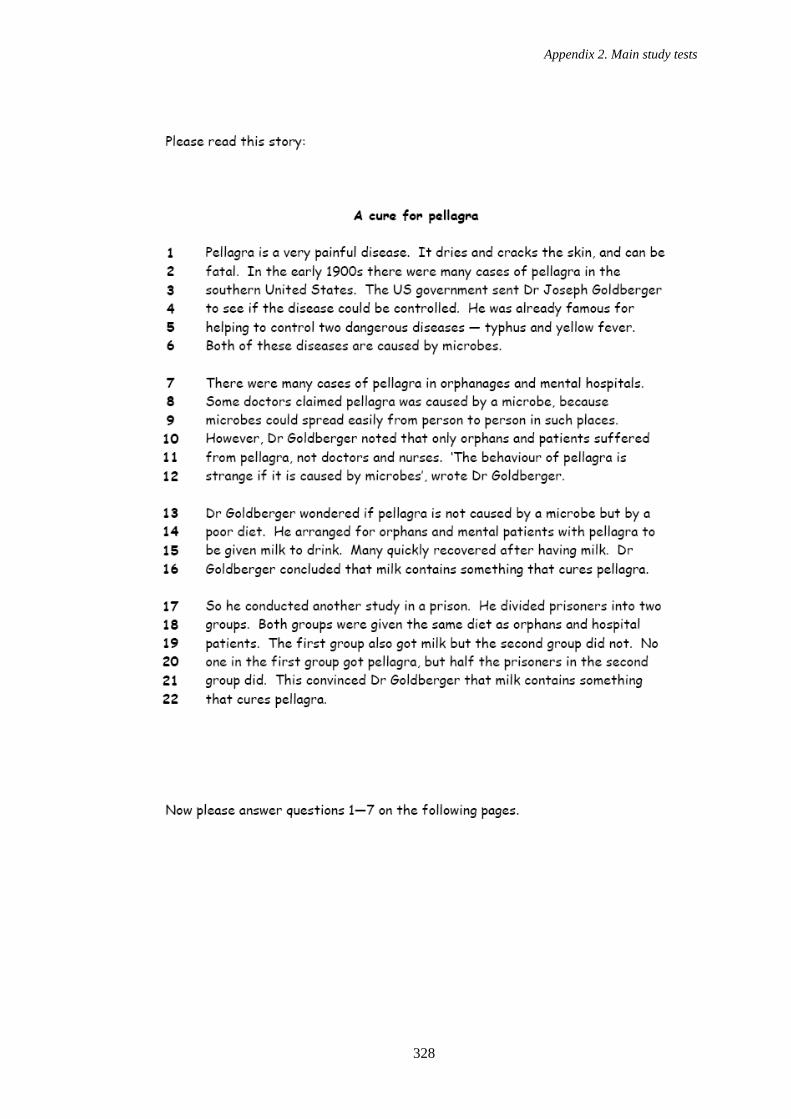
Appendix 2. Main study tests
328

Appendix 2. Main study tests
329
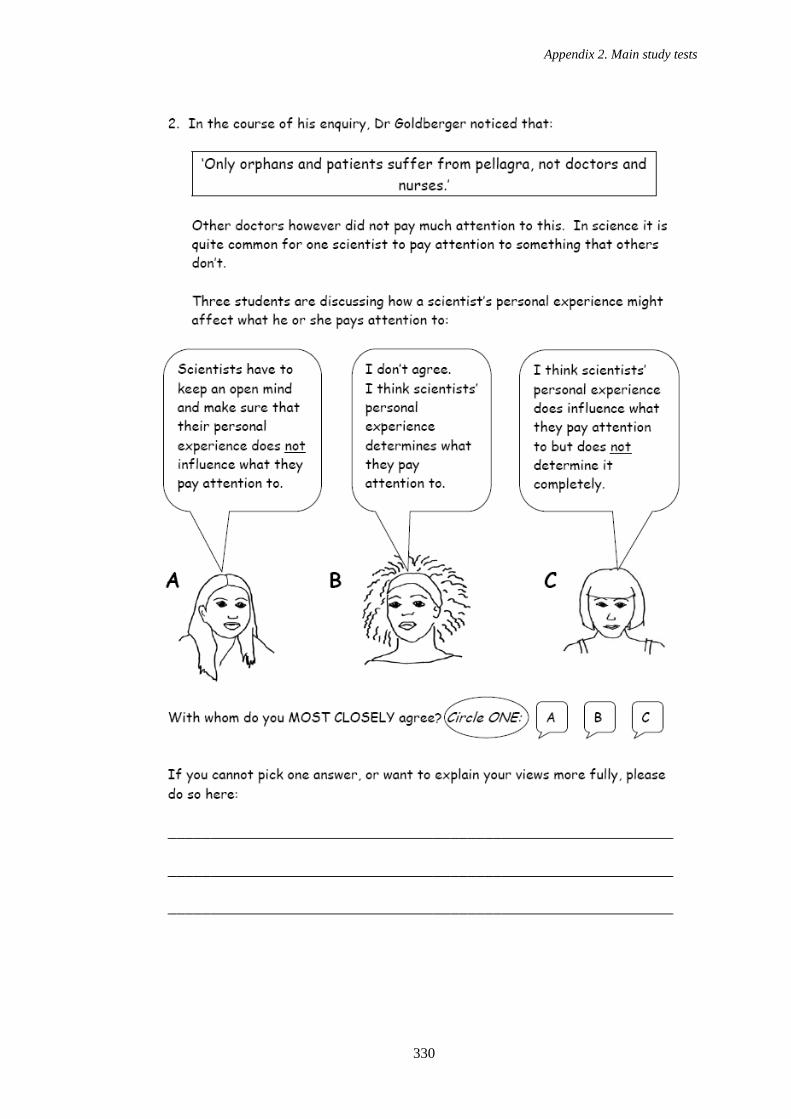
Appendix 2. Main study tests
330
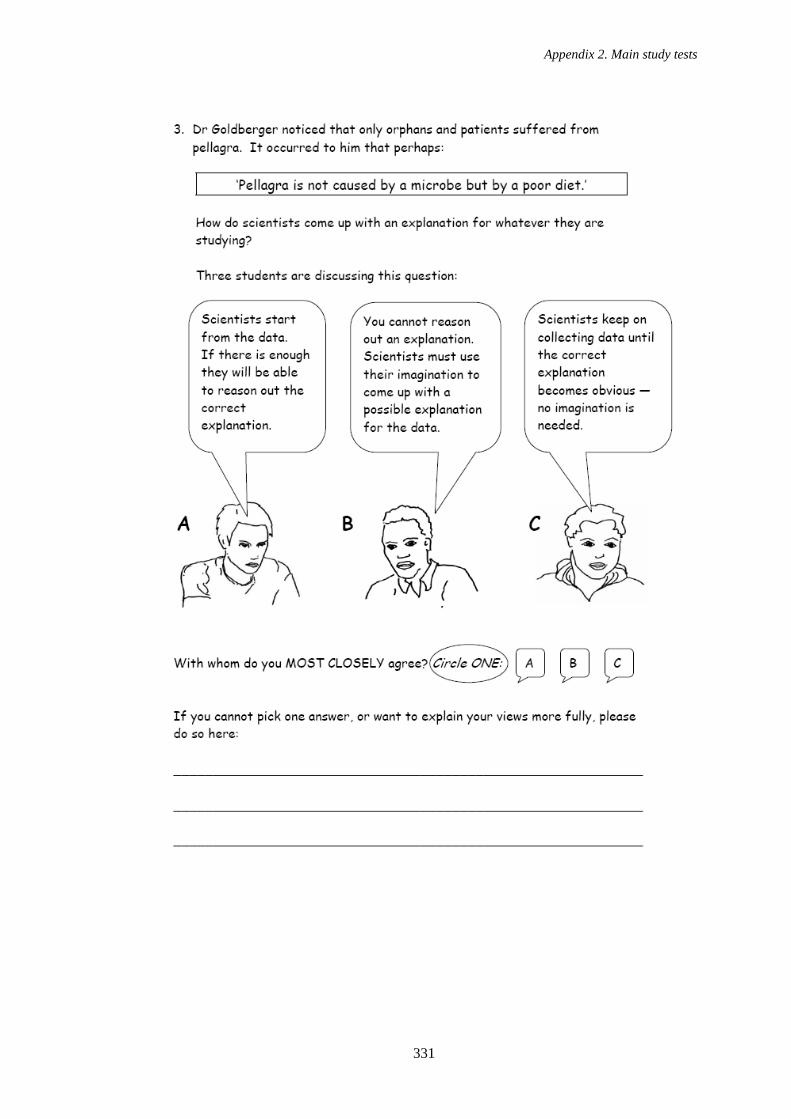
Appendix 2. Main study tests
331
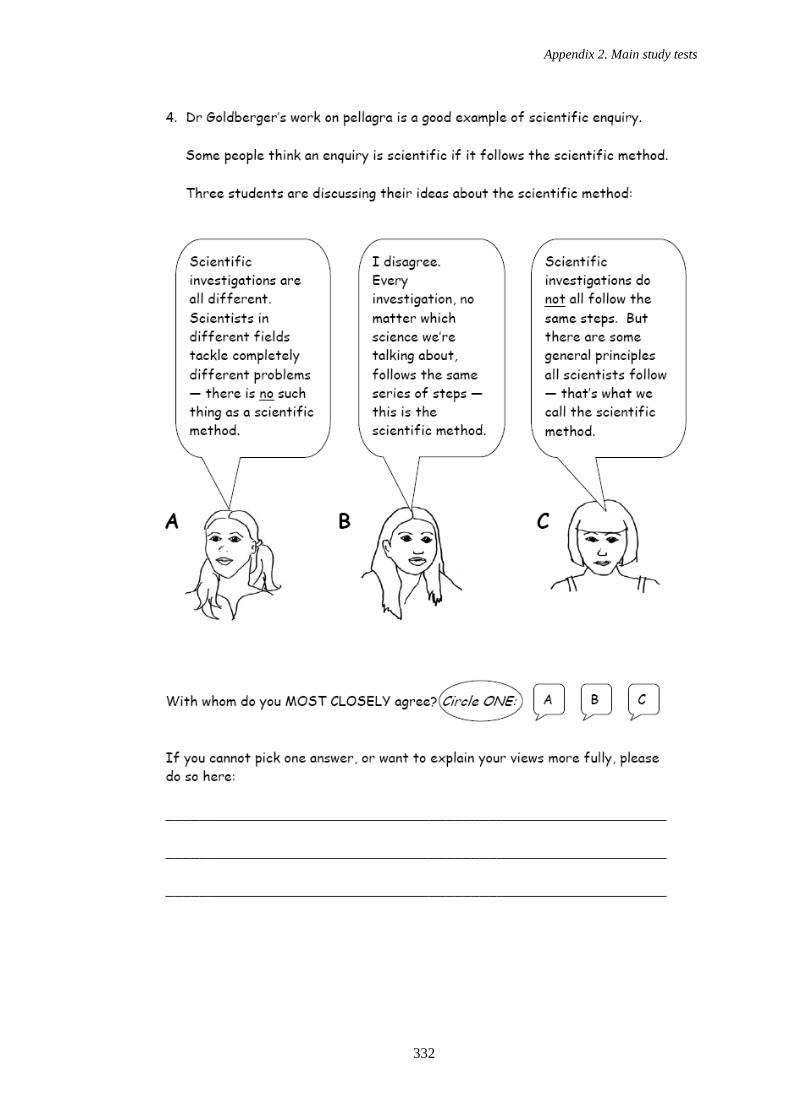
Appendix 2. Main study tests
332
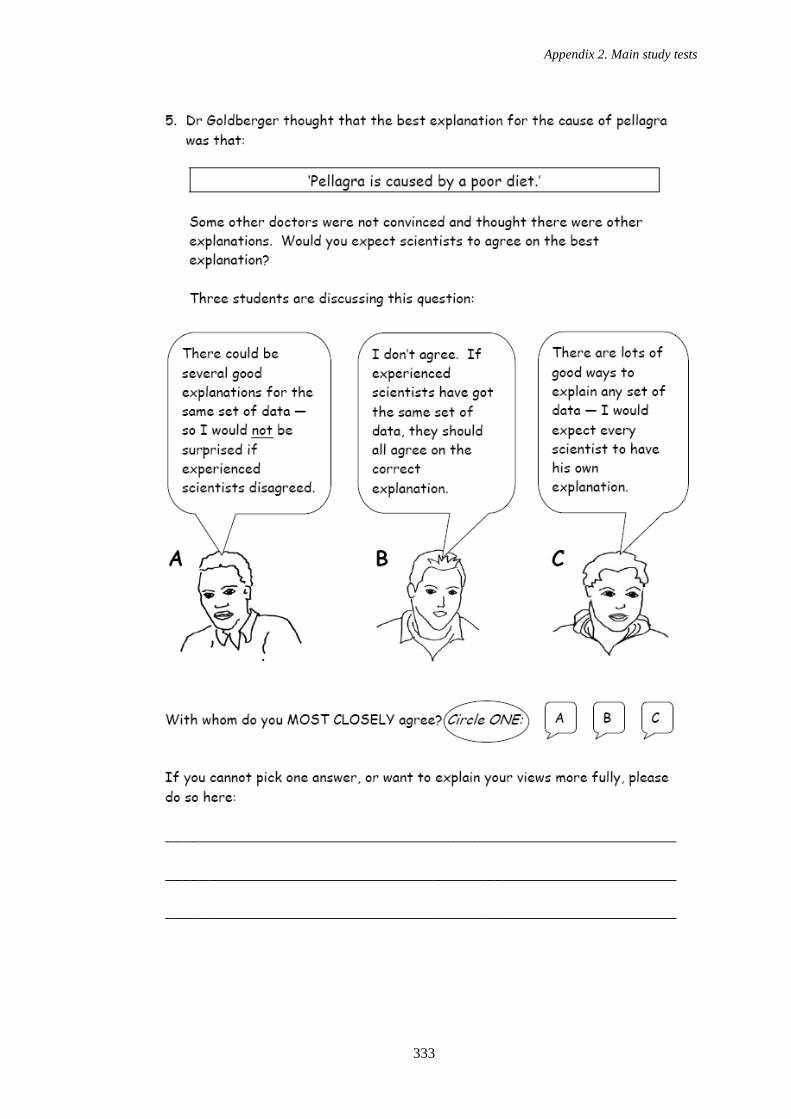
Appendix 2. Main study tests
333
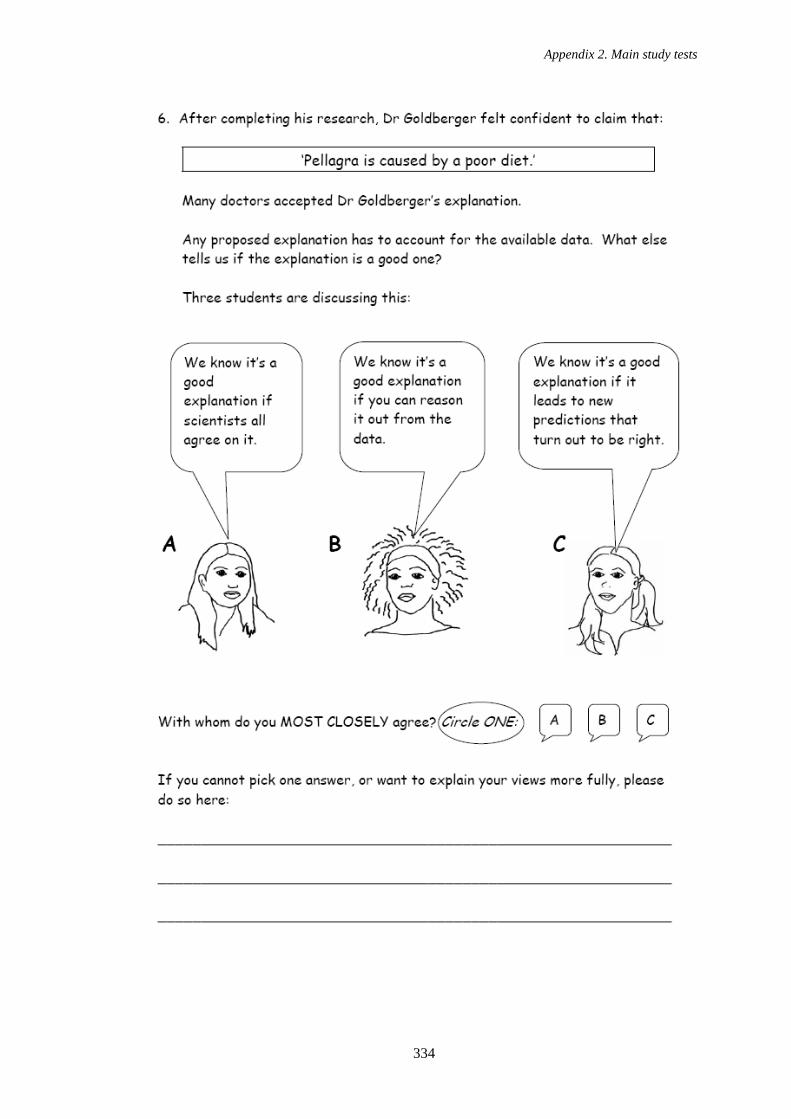
Appendix 2. Main study tests
334

Appendix 2. Main study tests
335
Appendix 2. Main study tests
336
Appendix 2. Main study tests
337
Appendix 2. Main study tests
338
Appendix 2. Main study tests
339
Appendix 2. Main study tests
340

Appendix 2. Main study tests
341
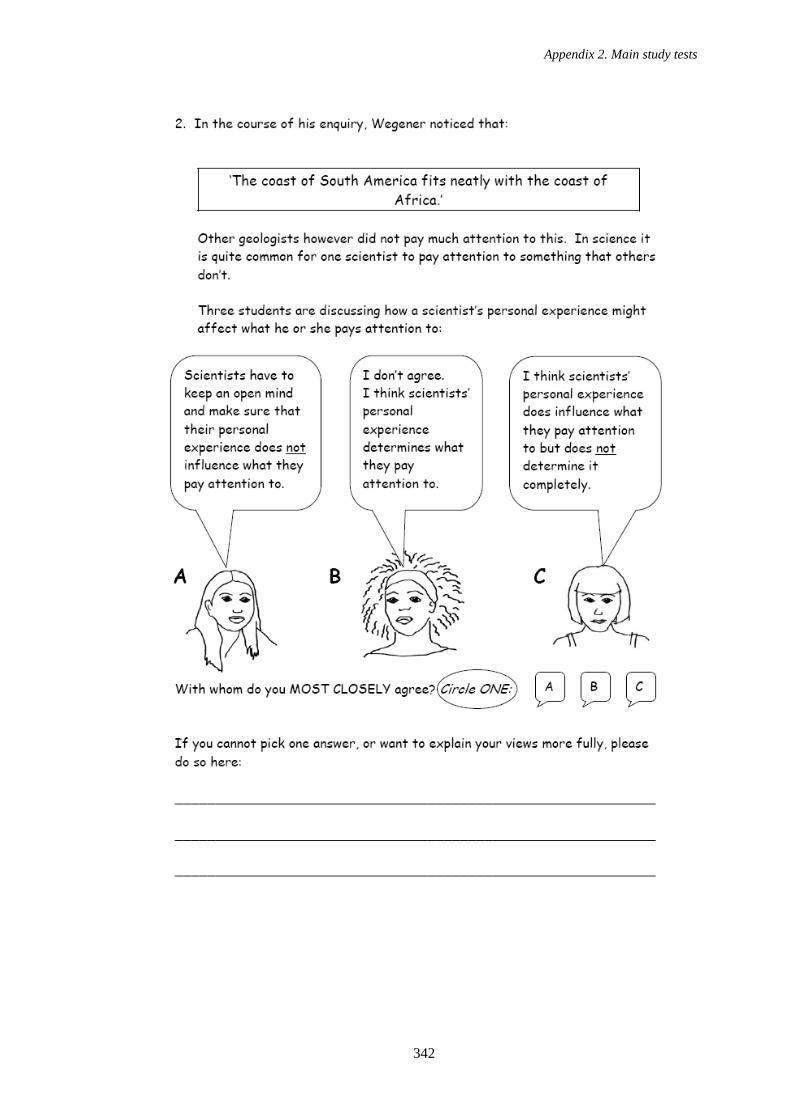
Appendix 2. Main study tests
342
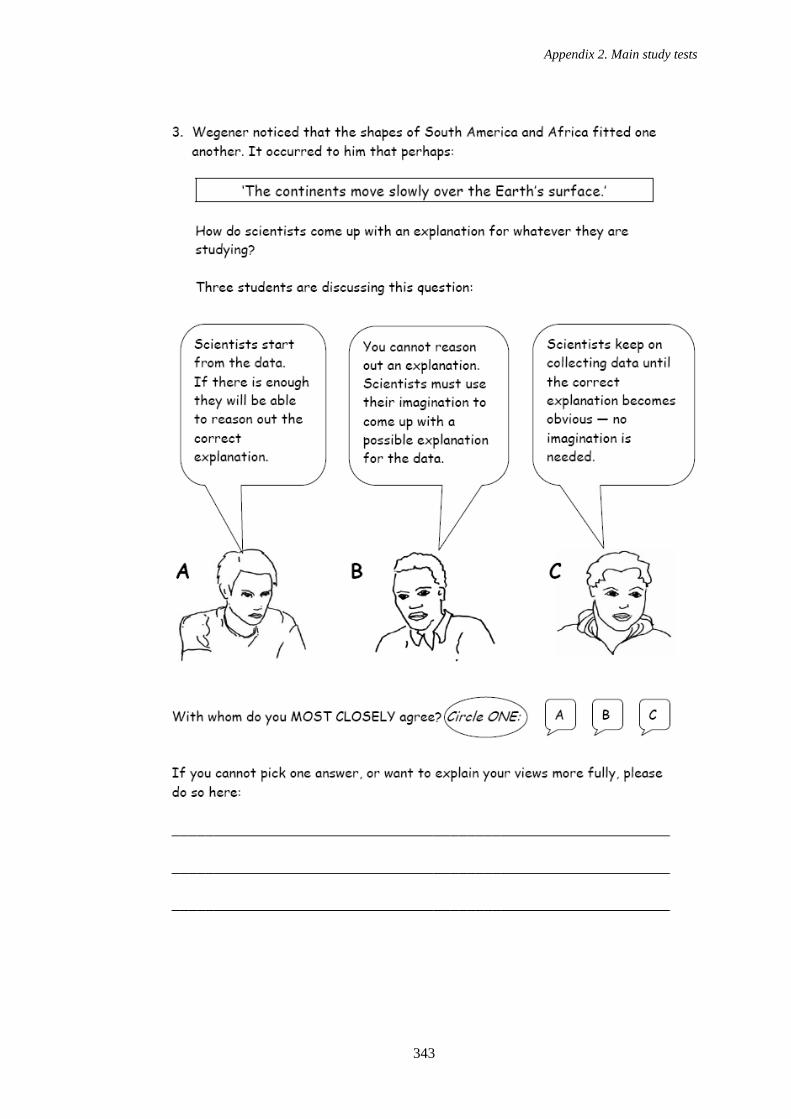
Appendix 2. Main study tests
343
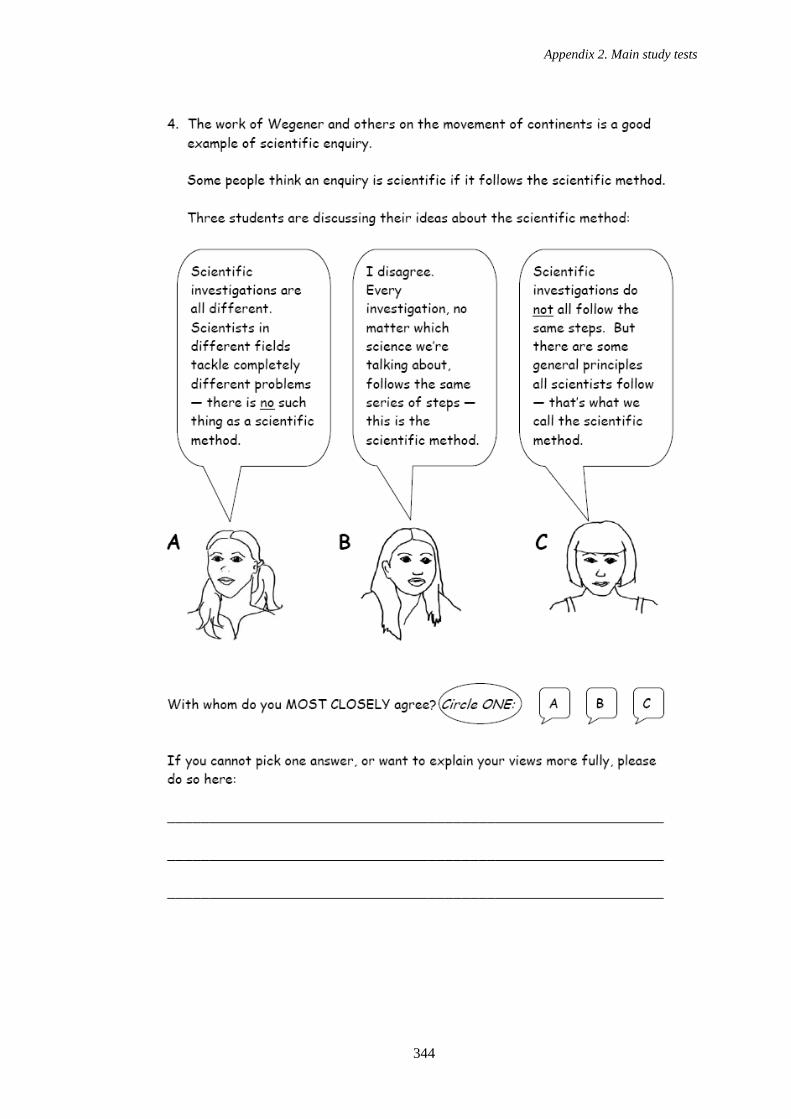
Appendix 2. Main study tests
344
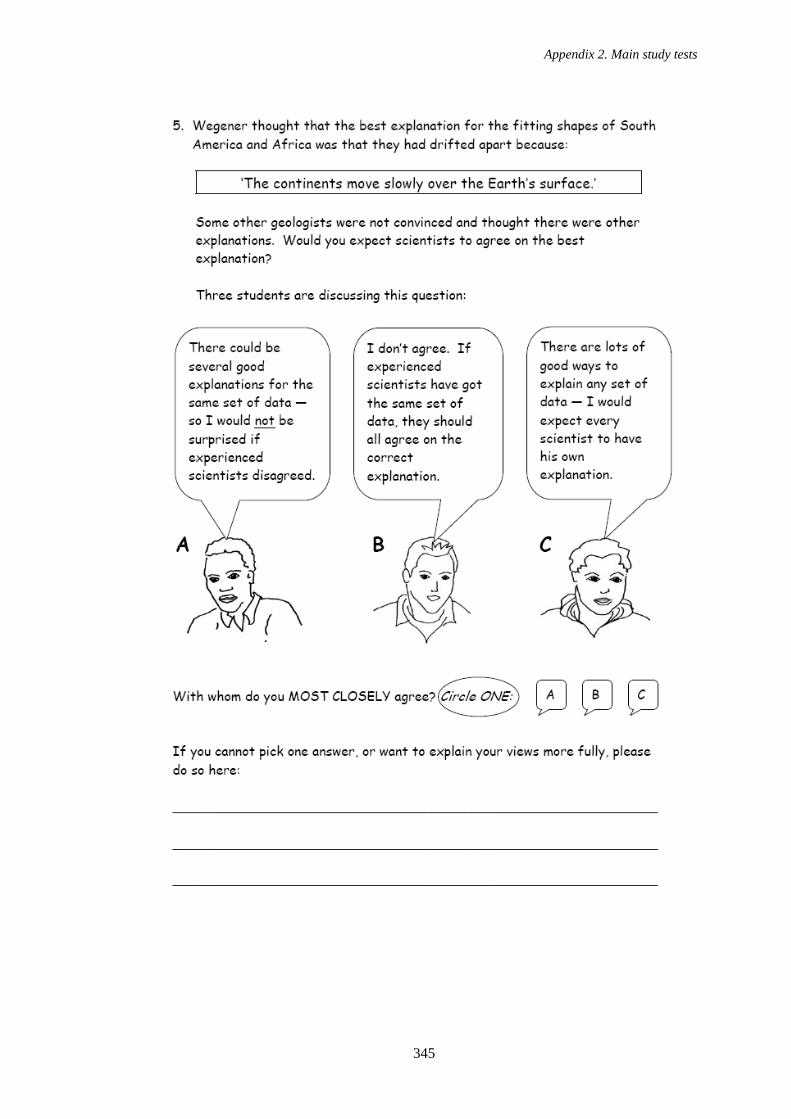
Appendix 2. Main study tests
345
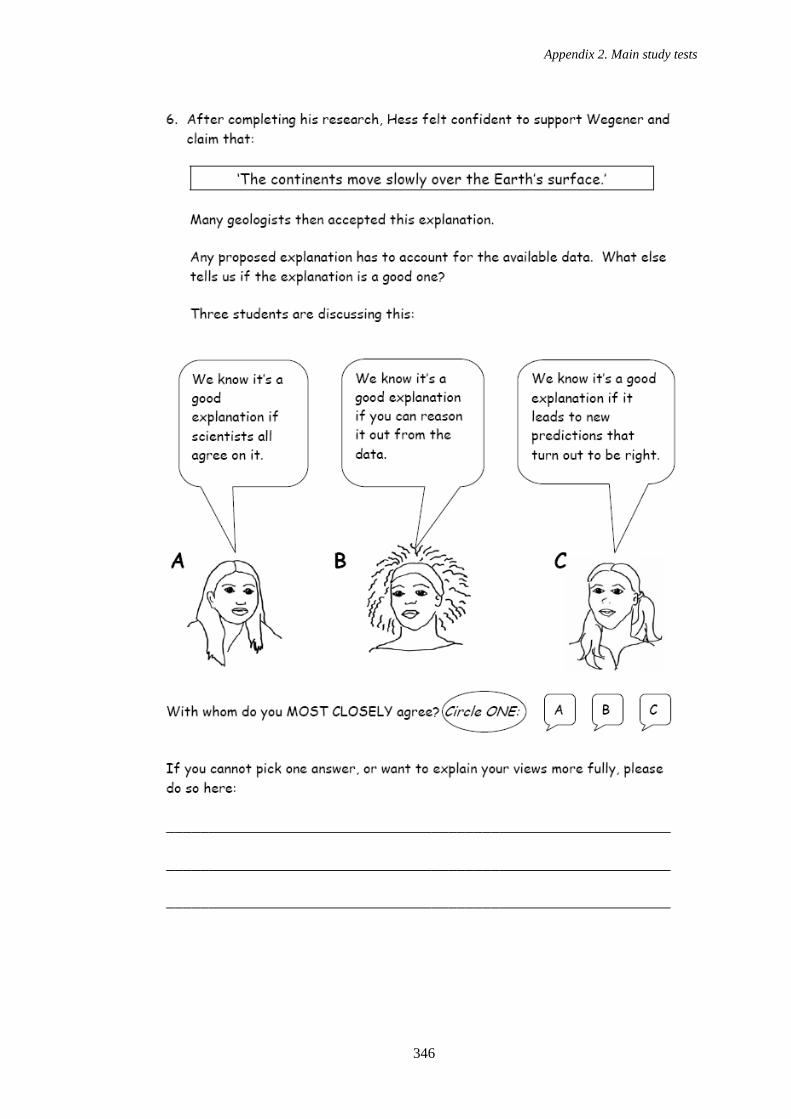
Appendix 2. Main study tests
346
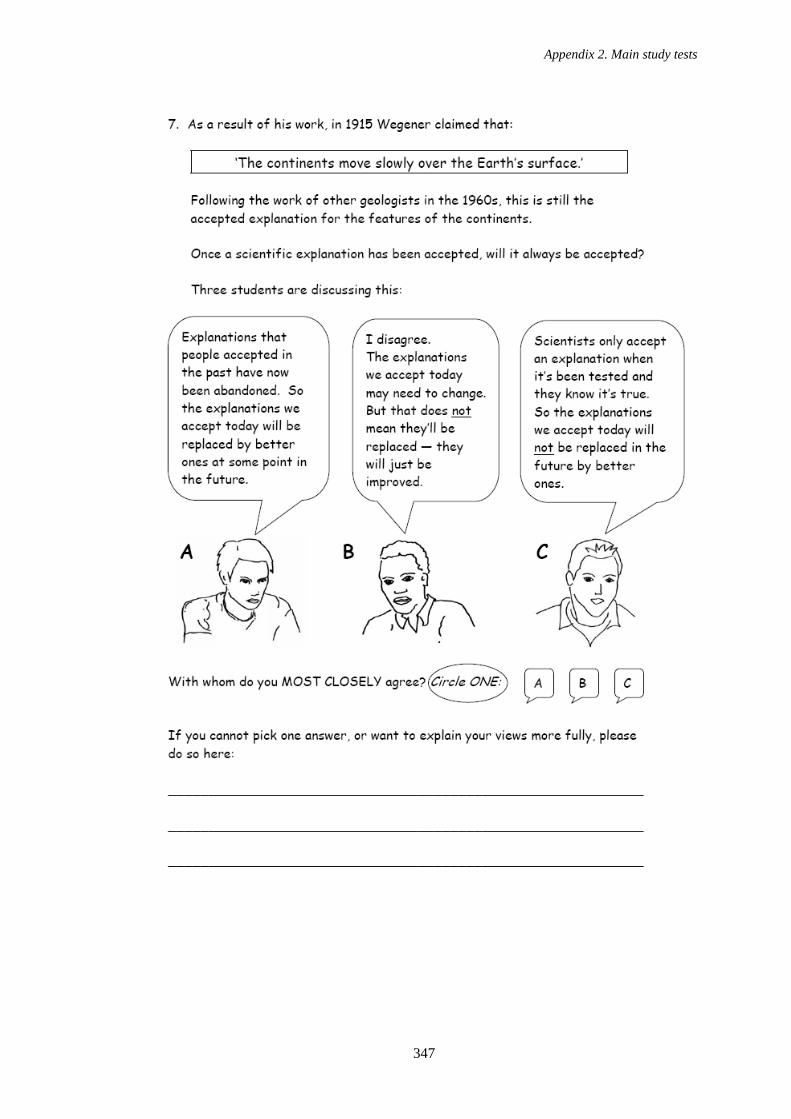
Appendix 2. Main study tests
347

Appendix 2. Main study tests
348

Appendix 3. Main study tests, Spanish version
349
12. APPENDIX 3
MAIN STUDY TESTS, SPANISH VERSION
Appendix 3. Main study tests, Spanish version
350
Appendix 3. Main study tests, Spanish version
351

Appendix 3. Main study tests, Spanish version
352
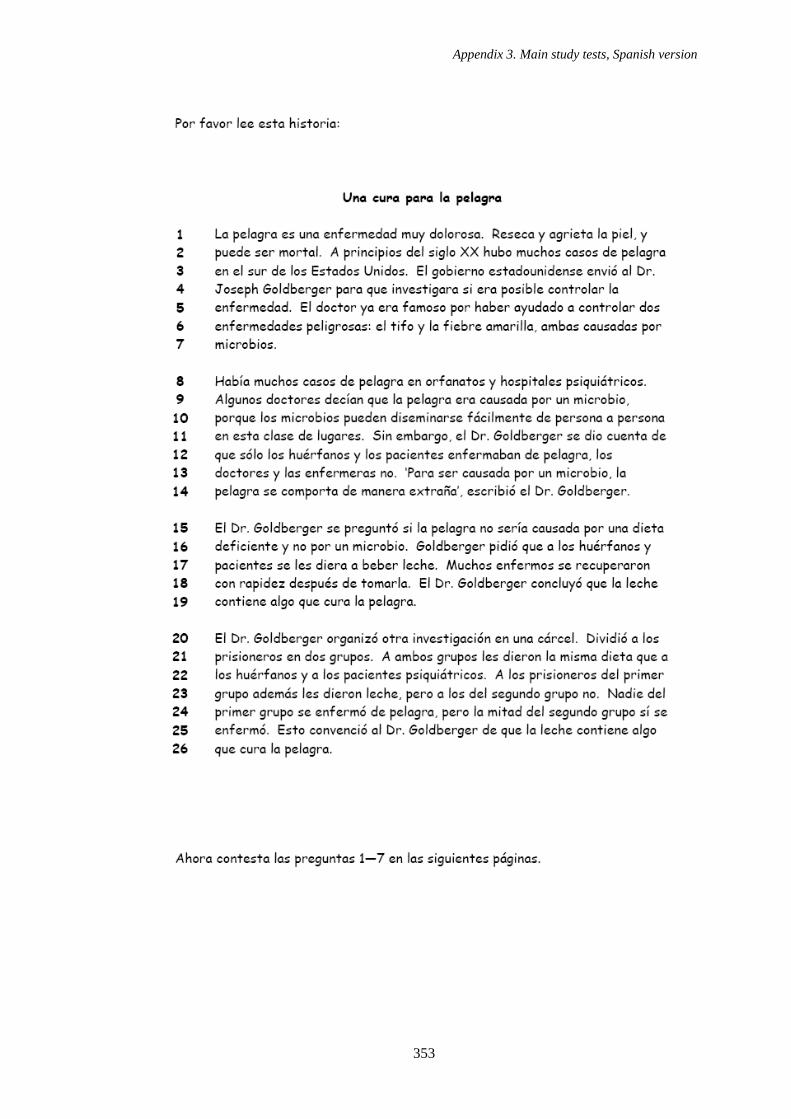
Appendix 3. Main study tests, Spanish version
353

Appendix 3. Main study tests, Spanish version
354
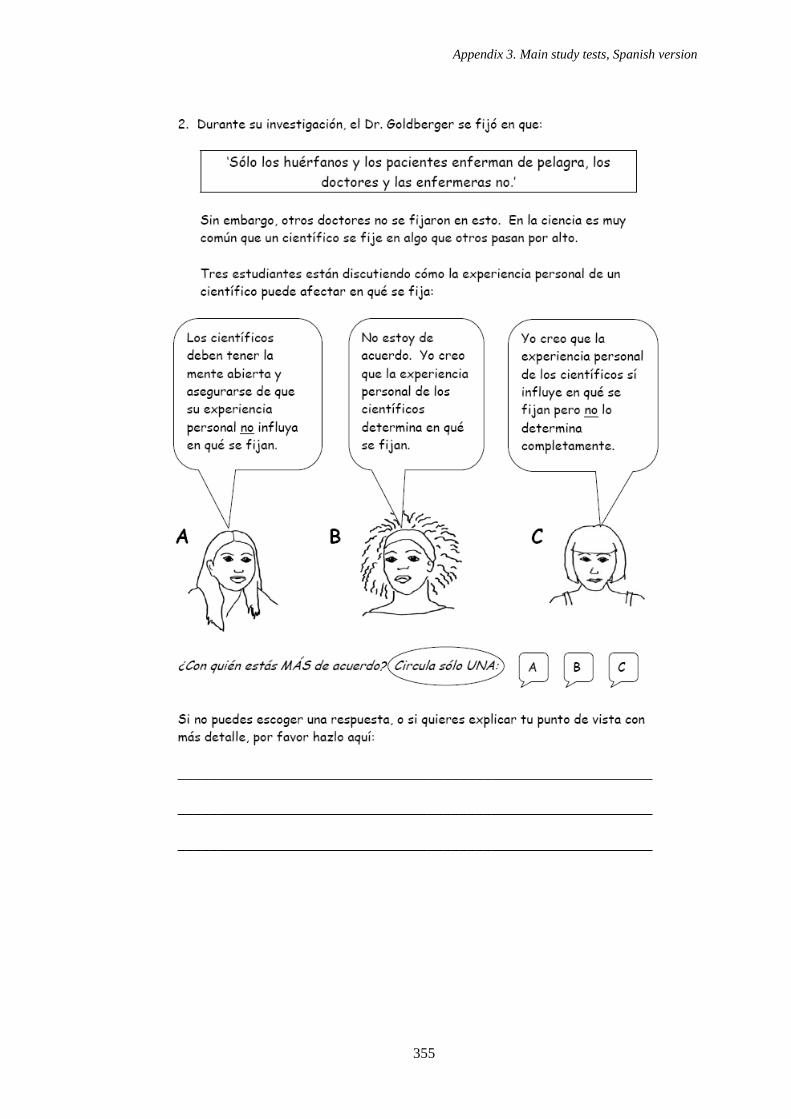
Appendix 3. Main study tests, Spanish version
355
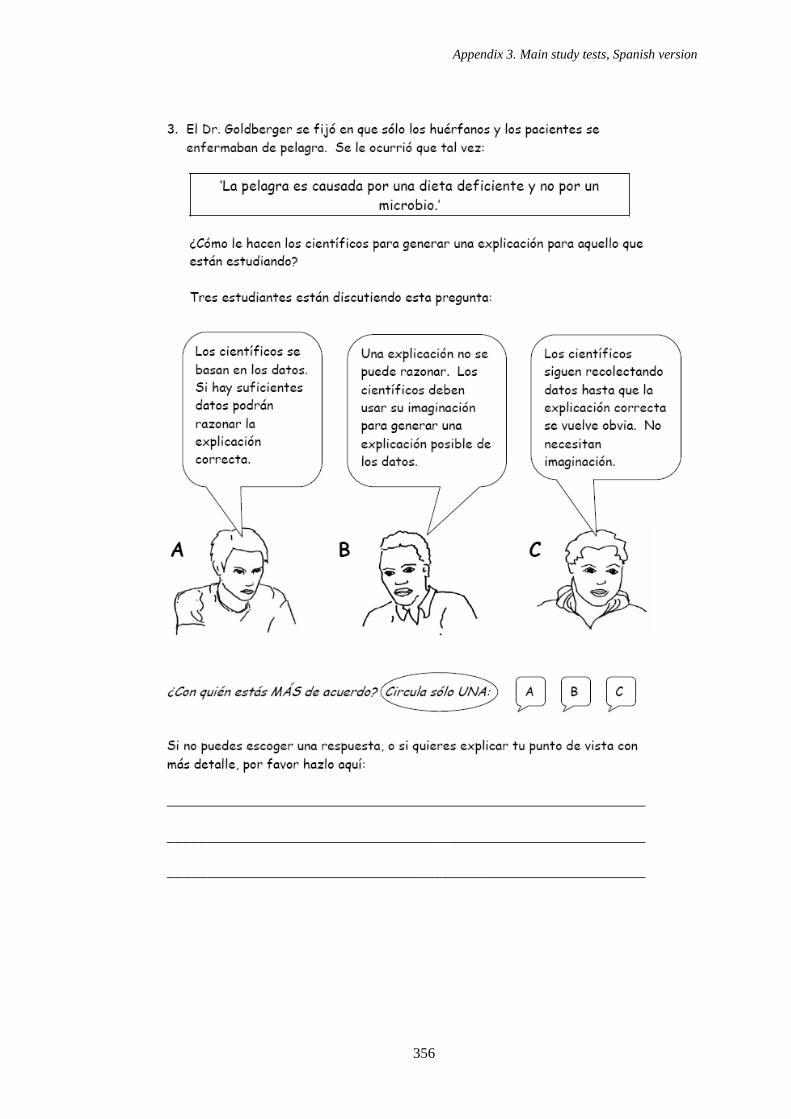
Appendix 3. Main study tests, Spanish version
356
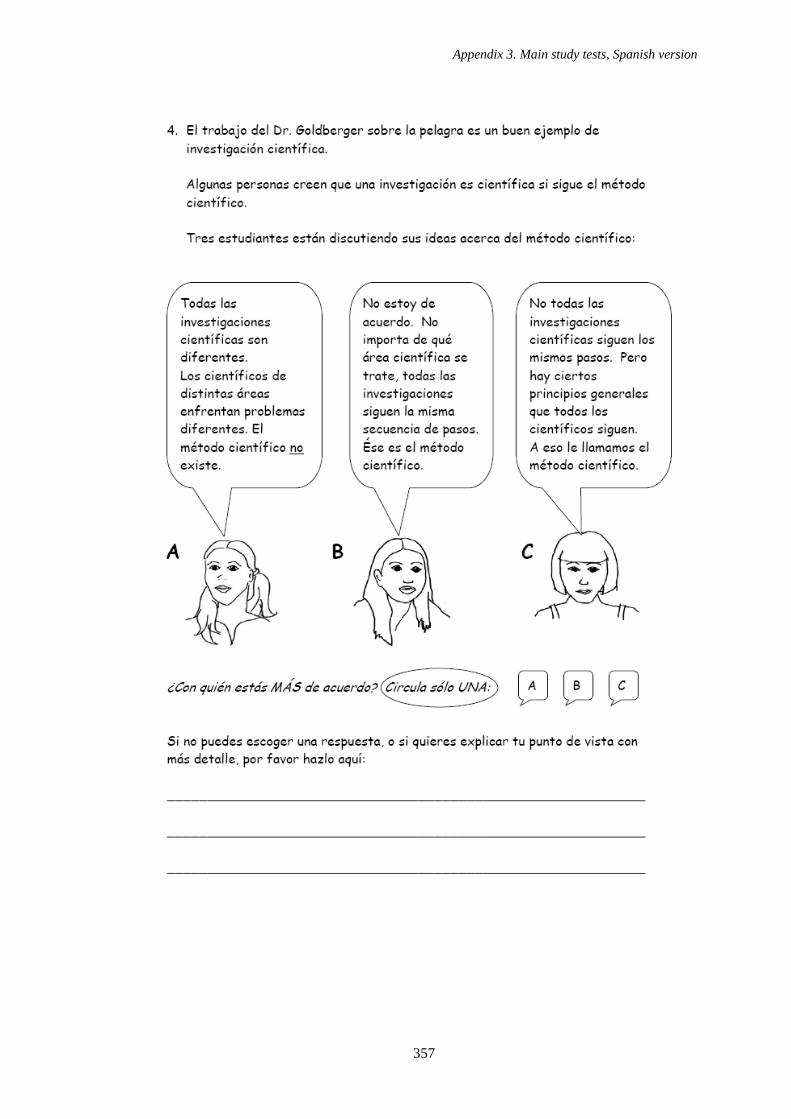
Appendix 3. Main study tests, Spanish version
357
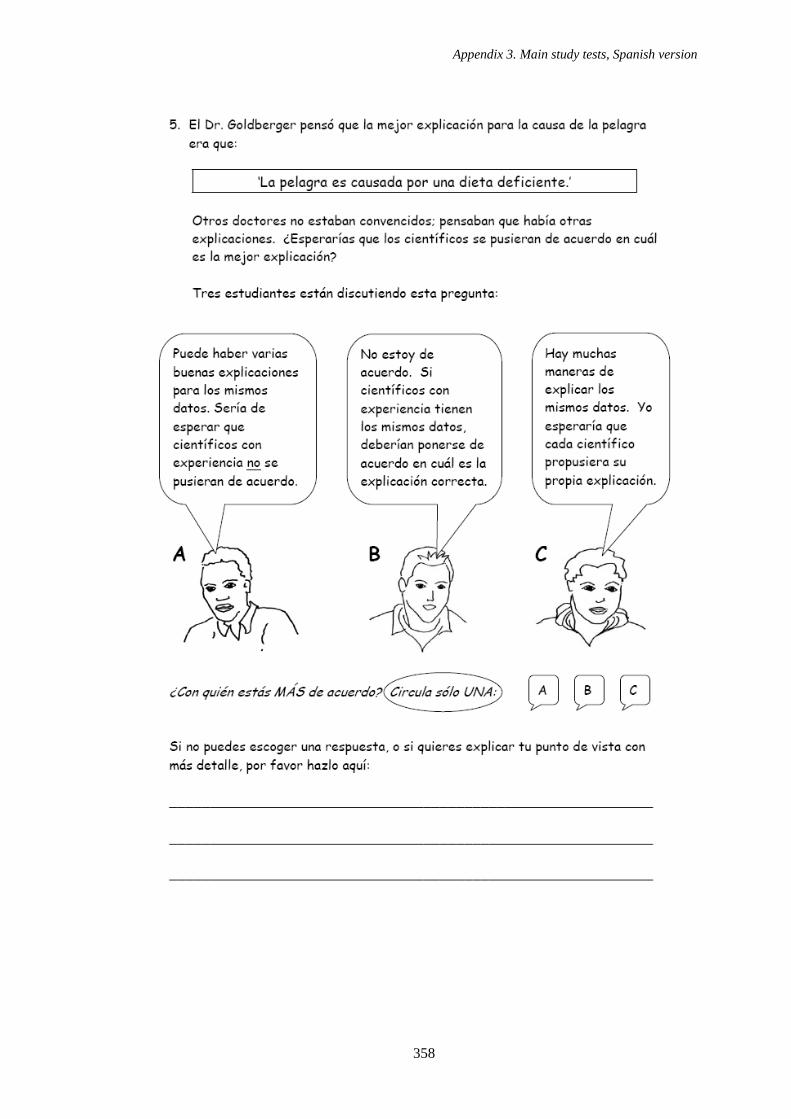
Appendix 3. Main study tests, Spanish version
358
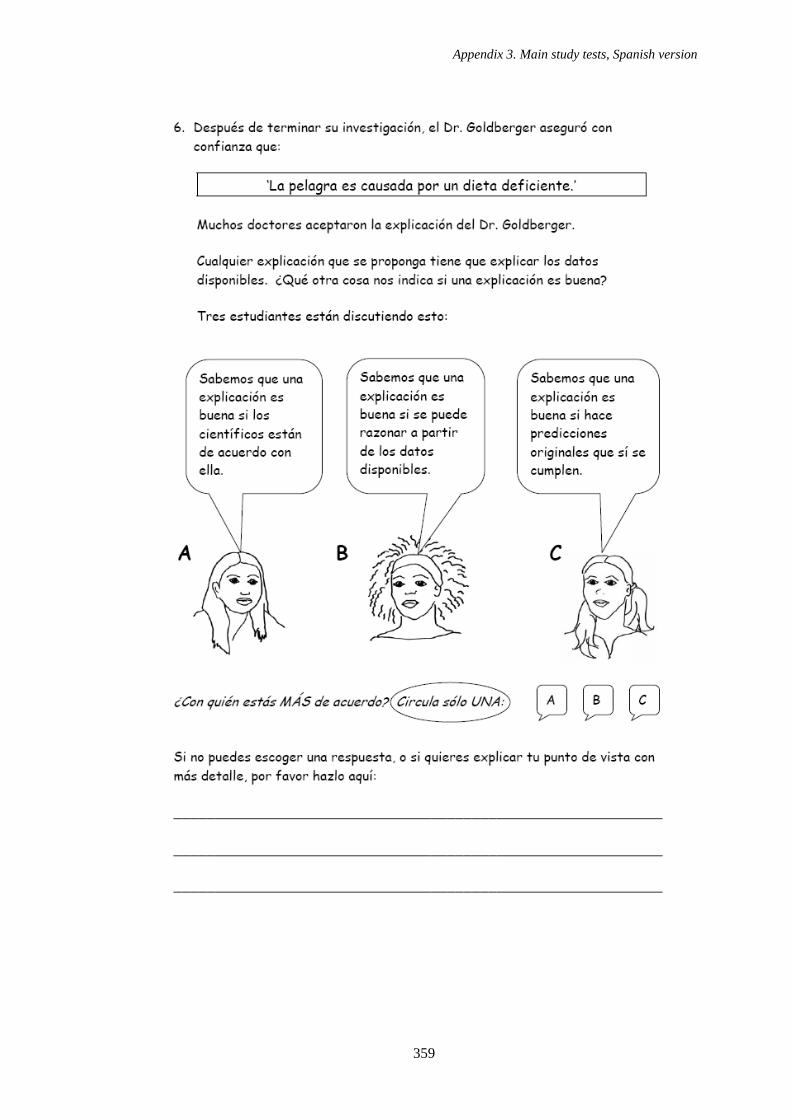
Appendix 3. Main study tests, Spanish version
359
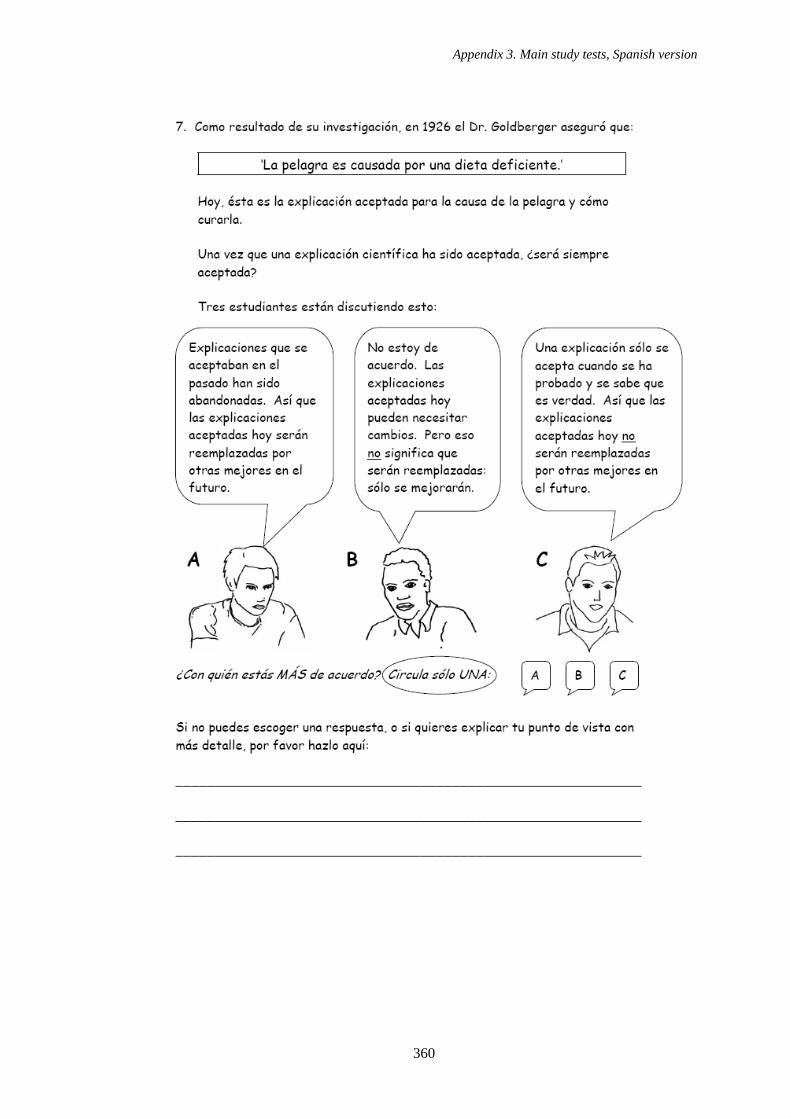
Appendix 3. Main study tests, Spanish version
360

Appendix 3. Main study tests, Spanish version
361
Appendix 3. Main study tests, Spanish version
362
Appendix 3. Main study tests, Spanish version
363
Appendix 3. Main study tests, Spanish version
364
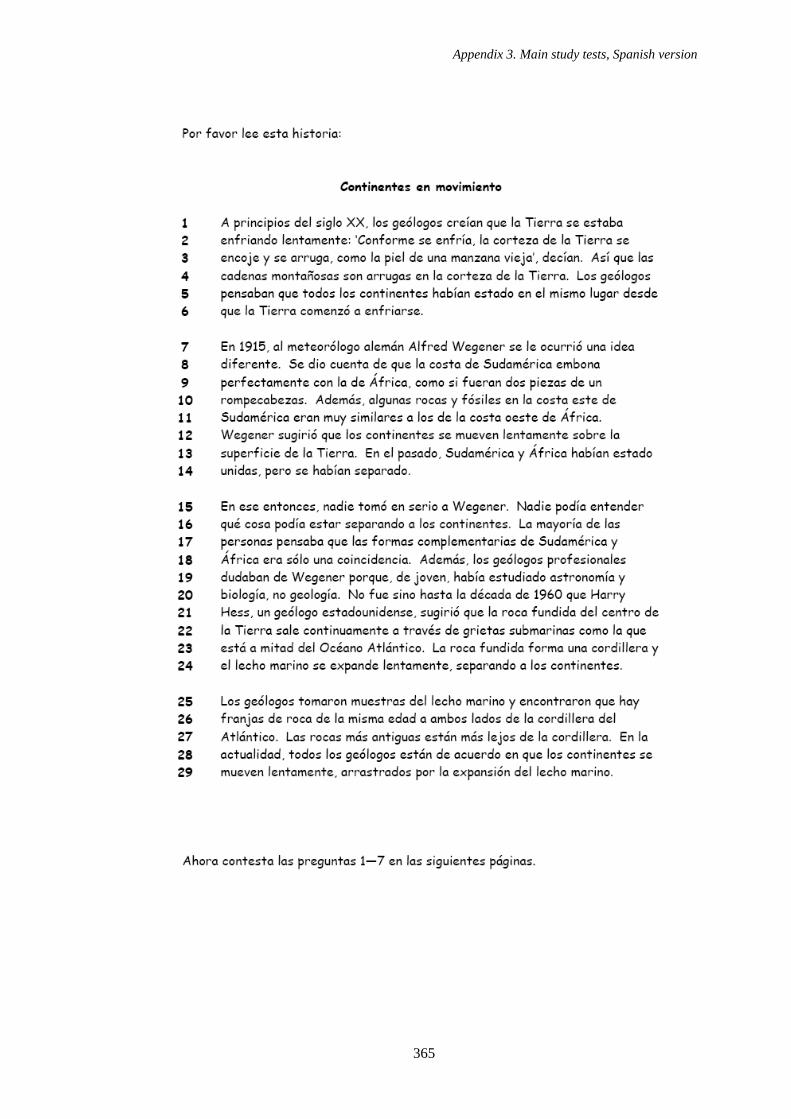
Appendix 3. Main study tests, Spanish version
365
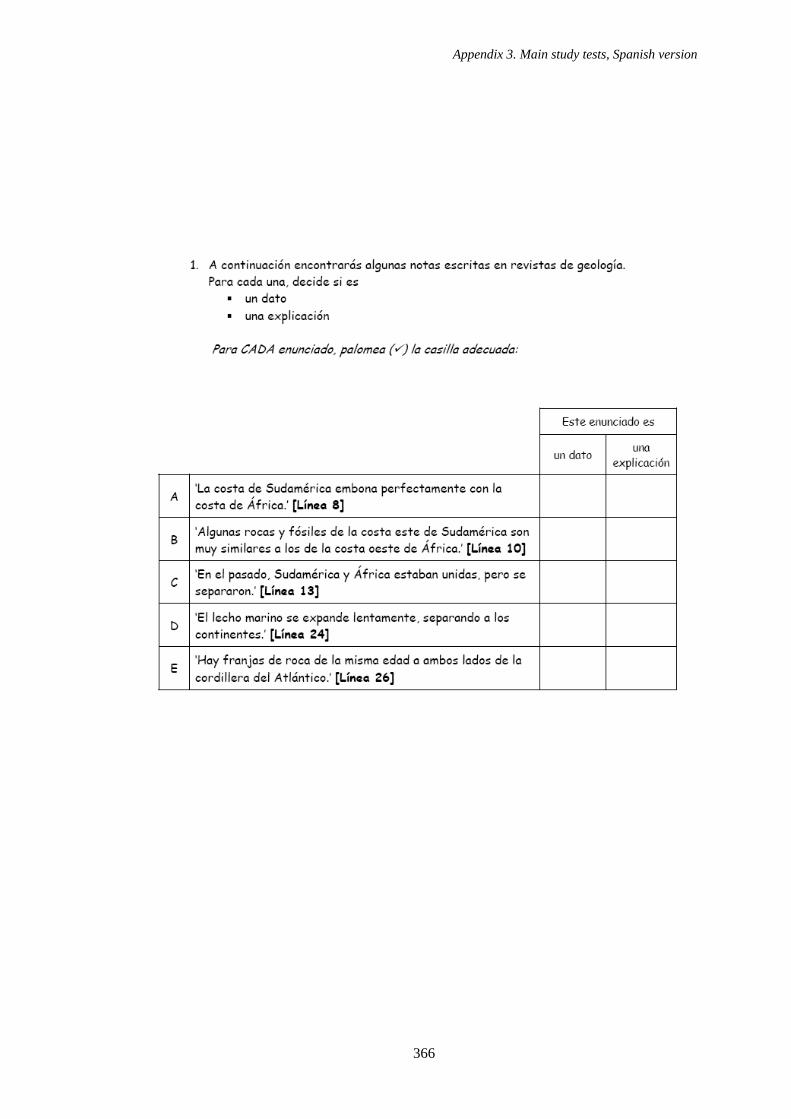
Appendix 3. Main study tests, Spanish version
366
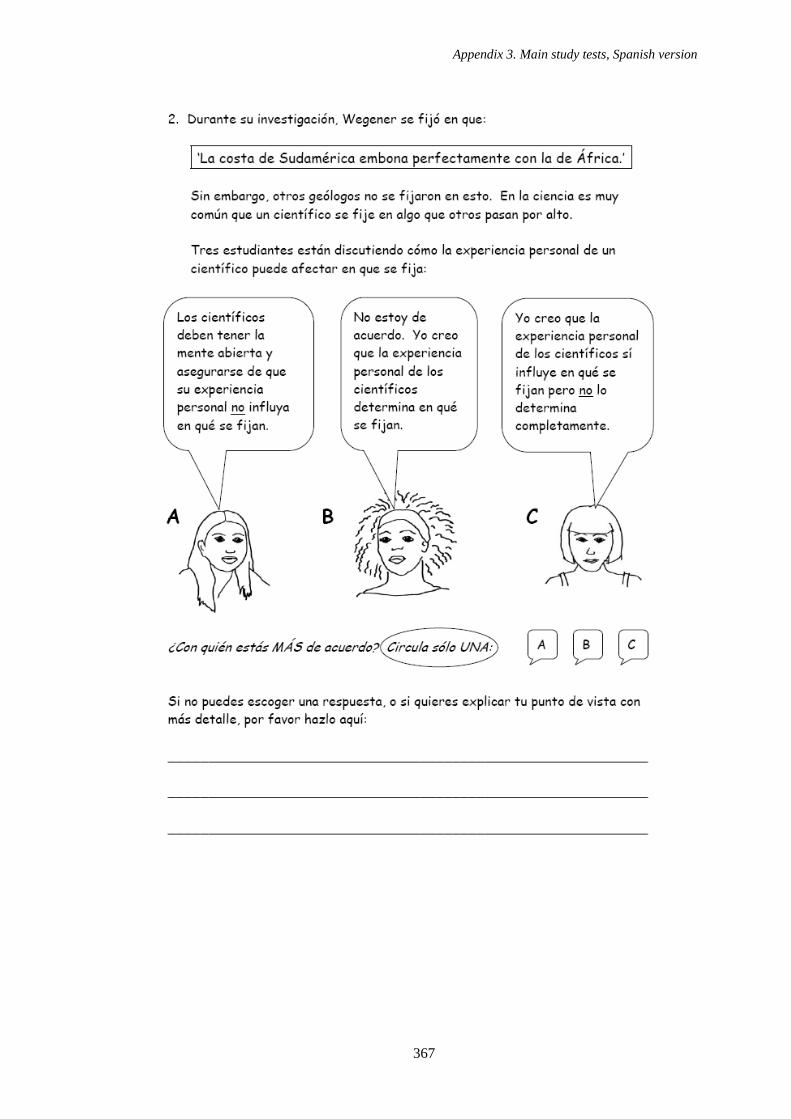
Appendix 3. Main study tests, Spanish version
367
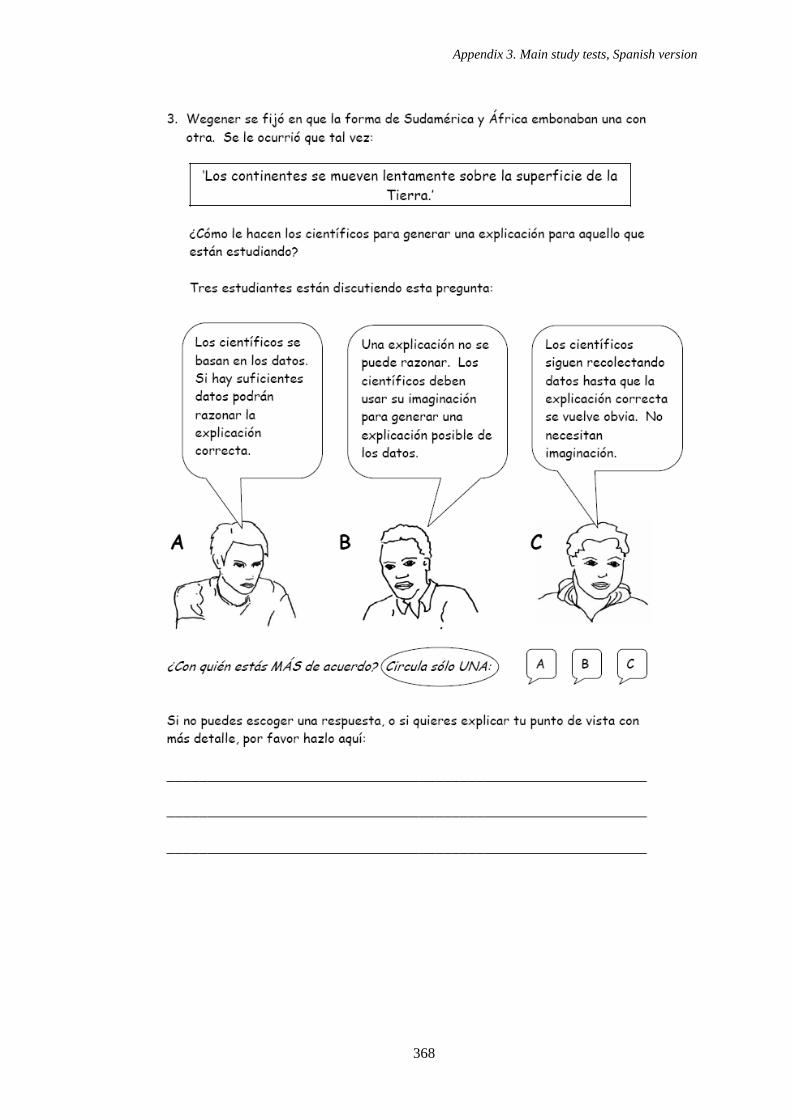
Appendix 3. Main study tests, Spanish version
368
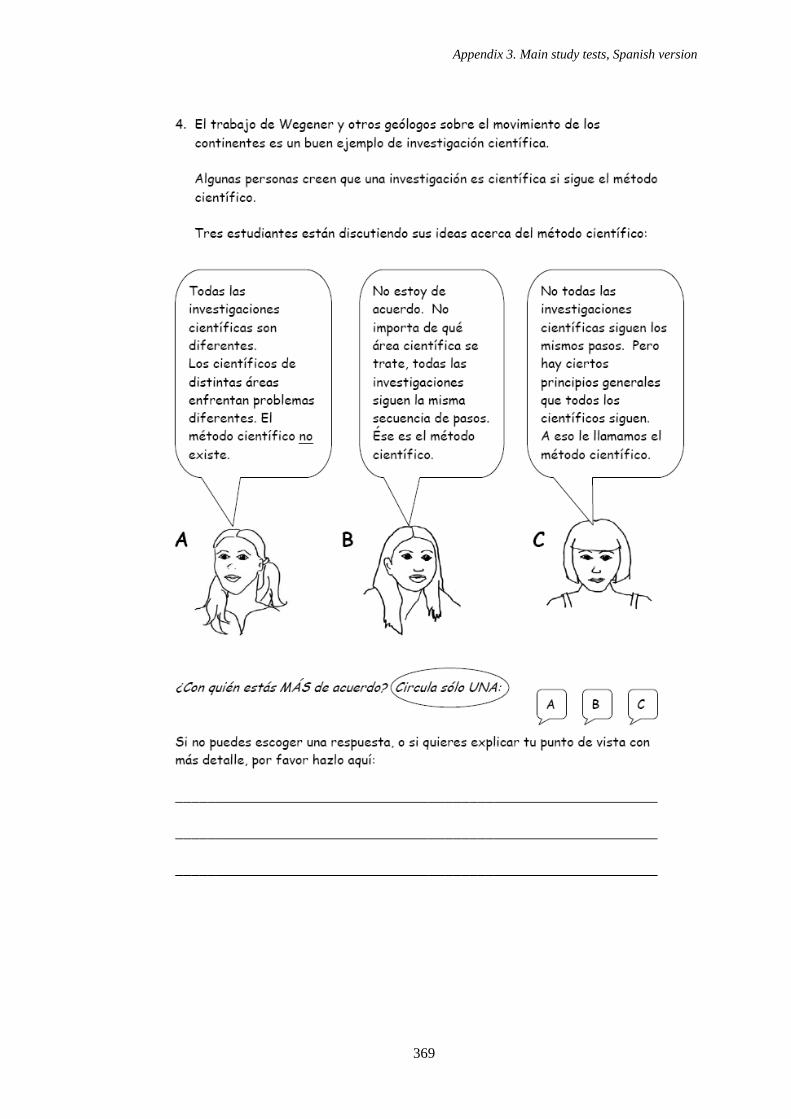
Appendix 3. Main study tests, Spanish version
369
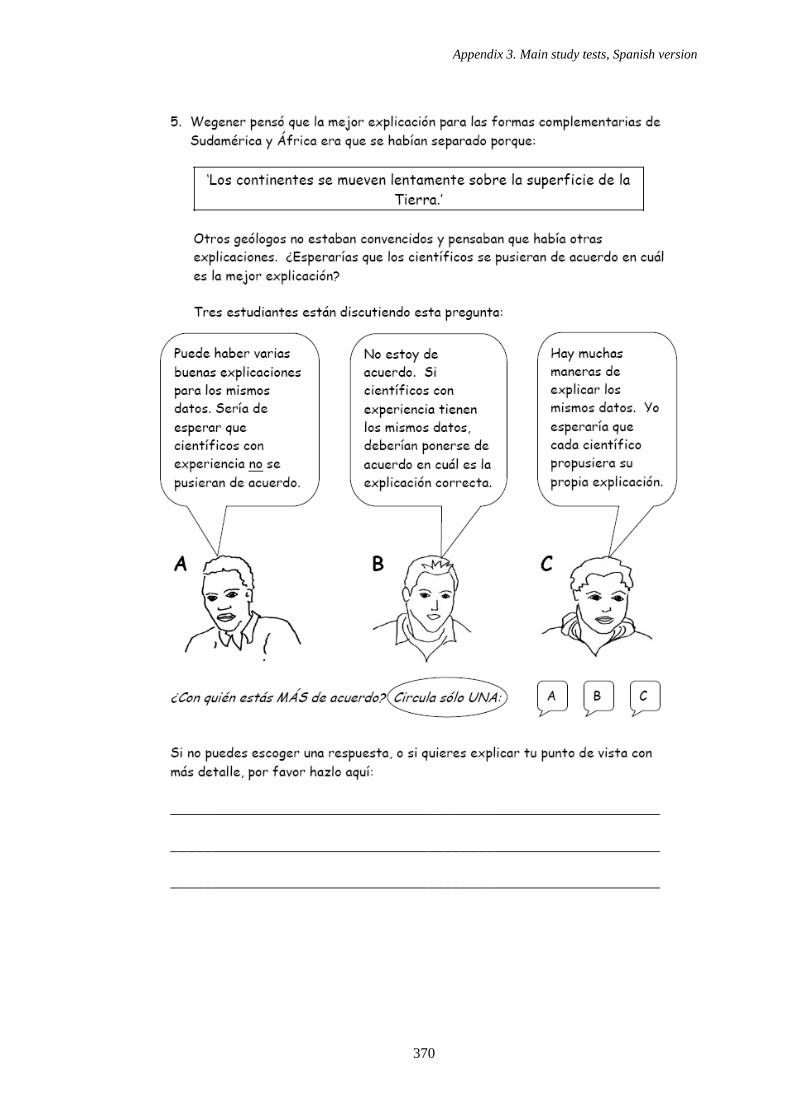
Appendix 3. Main study tests, Spanish version
370
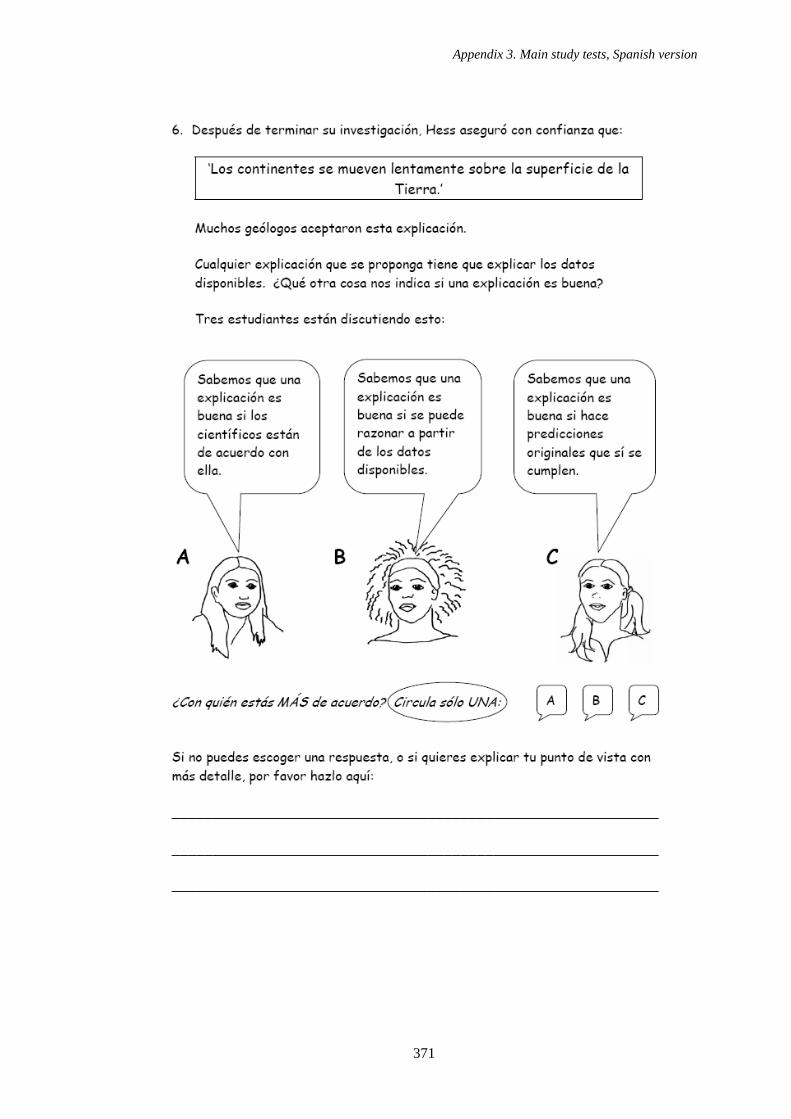
Appendix 3. Main study tests, Spanish version
371
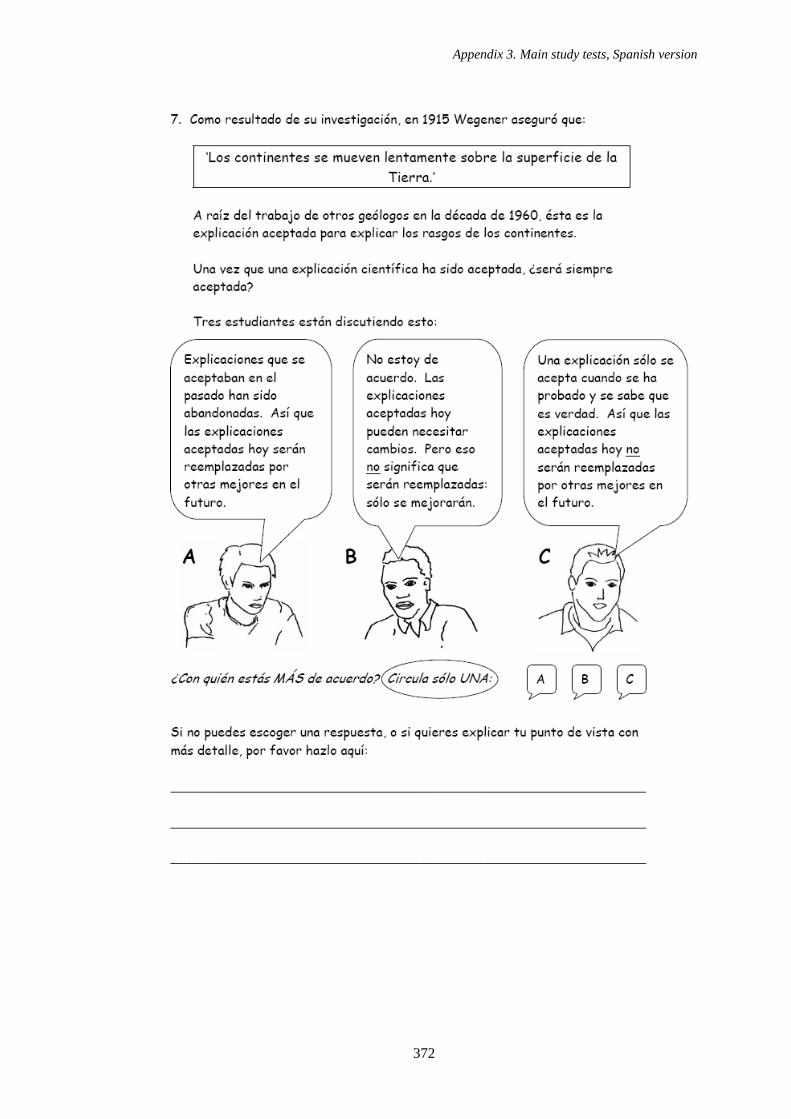
Appendix 3. Main study tests, Spanish version
372
Appendix 3. Main study tests, Spanish version
373

Appendix 5. Main study documents
374
13. APPENDIX 4
PRO-FORMA
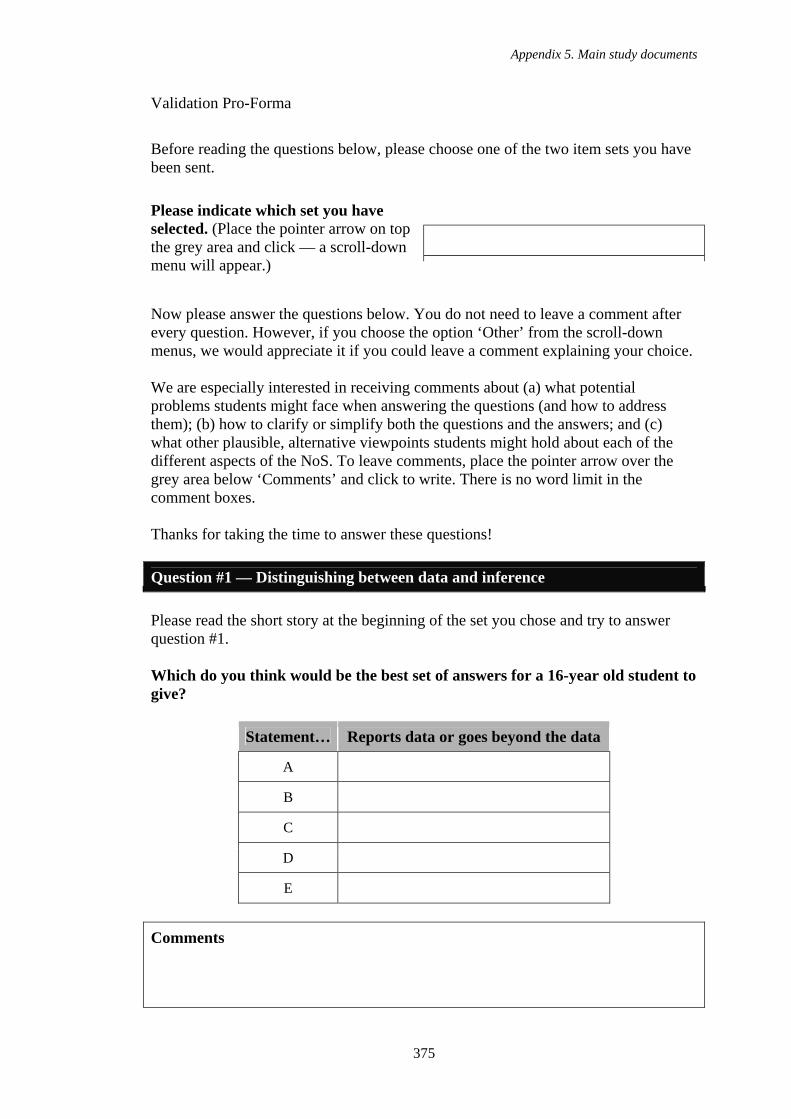
Appendix 5. Main study documents
375
Validation Pro-Forma
Before reading the questions below, please choose one of the two item sets you have been sent.
Please indicate which set you have selected. (Place the pointer arrow on top the grey area and click — a scroll-down menu will appear.) Now please answer the questions below. You do not need to leave a comment after every question. However, if you choose the option ‘Other’ from the scroll-down menus, we would appreciate it if you could leave a comment explaining your choice. We are especially interested in receiving comments about (a) what potential problems students might face when answering the questions (and how to address them); (b) how to clarify or simplify both the questions and the answers; and (c) what other plausible, alternative viewpoints students might hold about each of the different aspects of the NoS. To leave comments, place the pointer arrow over the grey area below ‘Comments’ and click to write. There is no word limit in the comment boxes. Thanks for taking the time to answer these questions! Question #1 — Distinguishing between data and inference Please read the short story at the beginning of the set you chose and try to answer question #1. Which do you think would be the best set of answers for a 16-year old student to give?
Statement… Reports data or goes beyond the data
A
B
C
D
E Comments

Appendix 5. Main study documents
376
Question #2 — Theory-ladenness of data / Subjectivity of theory-choice Do you think the question, as written, adequately asks the student to consider the aspect of the NoS under scrutiny?
Comments Do you think the three speech bubbles present distinct viewpoints?
Comments Are the viewpoints presented in the speech bubbles acceptable simplifications, in ‘student language’, of those in Table I?
Comments Which do you think would be the best answer for a 16-year old student to give?
Comments

Appendix 5. Main study documents
377
Question #3 — The role of imagination Do you think the question, as written, adequately asks the student to consider the aspect of the NoS under scrutiny?
Comments Do you think the three speech bubbles present distinct viewpoints?
Comments Are the viewpoints presented in the speech bubbles acceptable simplifications, in ‘student language’, of those in Table I?
Comments Which do you think would be the best answer for a 16-year old student to give?
Comments

Appendix 5. Main study documents
378
Question #4 — The scientific method of enquiry Do you think the question, as written, adequately asks the student to consider the aspect of the NoS under scrutiny?
Comments Do you think the three speech bubbles present distinct viewpoints?
Comments Are the viewpoints presented in the speech bubbles acceptable simplifications, in ‘student language’, of those in Table I?
Comments Which do you think would be the best answer for a 16-year old student to give?
Comments

Appendix 5. Main study documents
379
Question #5 — The underdetermination of explanation by data Do you think the question, as written, adequately asks the student to consider the aspect of the NoS under scrutiny?
Comments Do you think the three speech bubbles present distinct viewpoints?
Comments Are the viewpoints presented in the speech bubbles acceptable simplifications, in ‘student language’, of those in Table 1?
Comments Which do you think would be the best answer for a 16-year old student to give?
Comments

Appendix 5. Main study documents
380
Question #6 — The trustworthiness of scientific explanation Do you think the question, as written, adequately asks the student to consider the aspect of the NoS under scrutiny?
Comments Do you think the three speech bubbles present distinct viewpoints?
Comments Are the viewpoints presented in the speech bubbles acceptable simplifications, in ‘student language’, of those in Table 1?
Comments Which do you think would be the best answer for a 16-year old student to give?
Comments
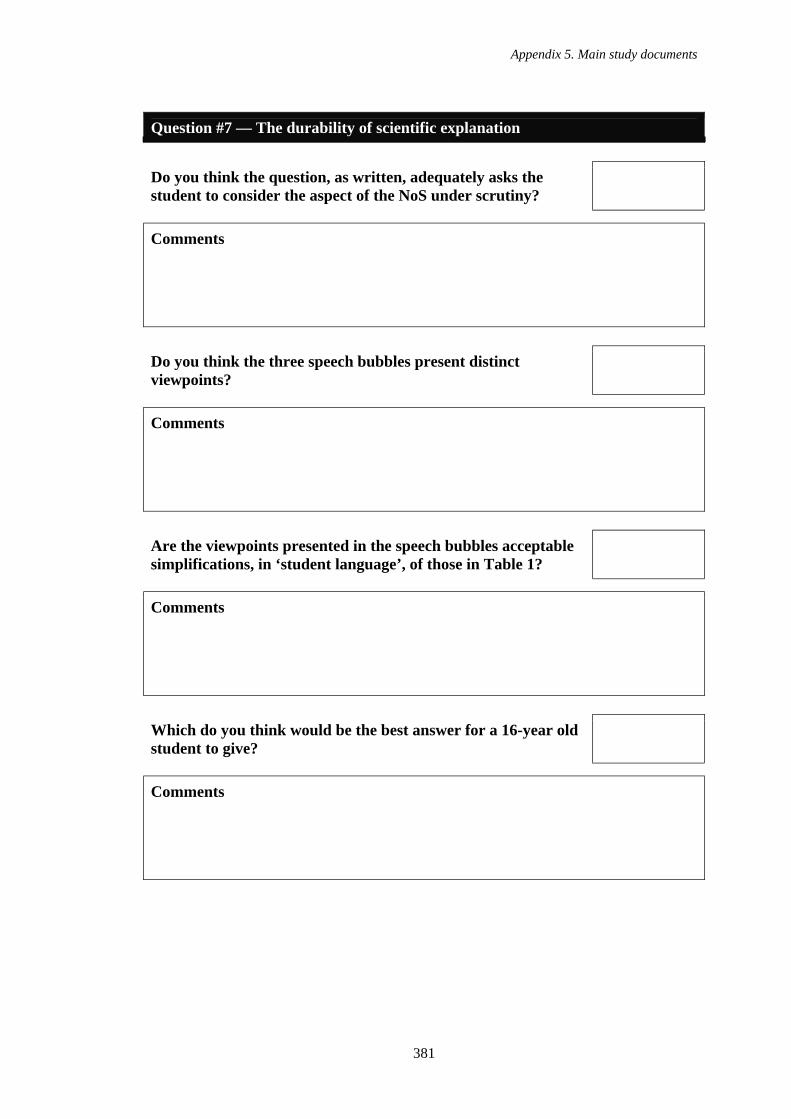
Appendix 5. Main study documents
381
Question #7 — The durability of scientific explanation Do you think the question, as written, adequately asks the student to consider the aspect of the NoS under scrutiny?
Comments Do you think the three speech bubbles present distinct viewpoints?
Comments Are the viewpoints presented in the speech bubbles acceptable simplifications, in ‘student language’, of those in Table 1?
Comments Which do you think would be the best answer for a 16-year old student to give?
Comments
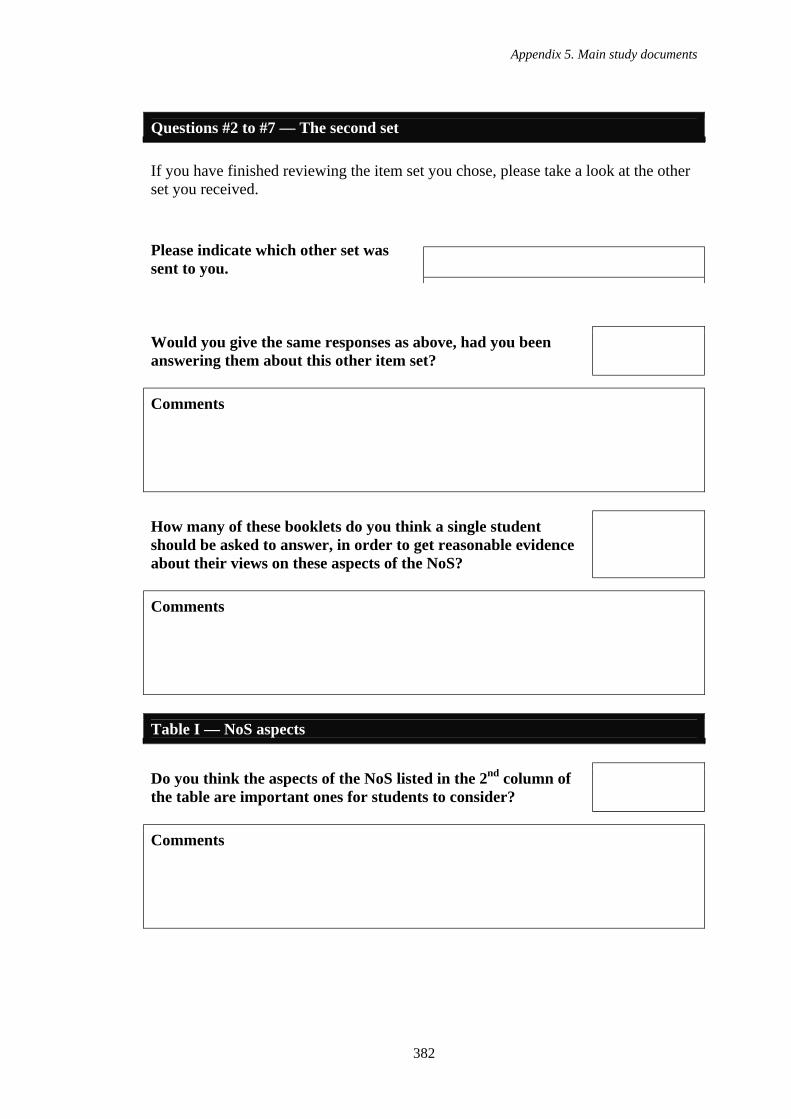
Appendix 5. Main study documents
382
Questions #2 to #7 — The second set If you have finished reviewing the item set you chose, please take a look at the other set you received.
Please indicate which other set was sent to you.
Would you give the same responses as above, had you been answering them about this other item set?
Comments How many of these booklets do you think a single student should be asked to answer, in order to get reasonable evidence about their views on these aspects of the NoS?
Comments Table I — NoS aspects Do you think the aspects of the NoS listed in the 2nd column of the table are important ones for students to consider?
Comments
Appendix 5. Main study documents
383
Do you agree that the viewpoints summarised in the 3rd column are the desired viewpoints?
Comments Do you agree that the viewpoints summarised in the 4th column are plausible alternative viewpoints?
Comments

Appendix 5. Main study documents
384
14. APPENDIX 5
MAIN STUDY DOCUMENTS

Appendix 5. Main study documents
385
Thinking about science, and how science works
A cure for pellagra
&
The moving continents
Discussion
1 The purpose of this question is to see if students can distinguish between data
(evidence) and explanations (which are inferential in nature). We would see the following as the best answers:
A cure for pellagra
This statement is
data an explanation
A ‘Typhus and yellow fever are caused by microbes.’ [Line 6]
B ‘There are many cases of pellagra in orphanages and mental hospitals.’ [Line 7]
C ‘Many orphans and mental patients quickly recover after having milk.’ [Line 15]
D ‘Milk contains something that cures pellagra.’ [Line 16]
E ‘No one in the first group gets pellagra, but half the prisoners in the second group do.’ [Line 20]
The moving continents
This statement is
data an explanation
A ‘The coast of South America fits neatly with the coast of Africa’ [line 7]
B ‘Some rocks and fossils on the East coast of South America match those on the West coast of Africa.’ [line 9]
C ‘In the past, South America and Africa were joined together, but had drifted apart.’ [line 11]
D ‘The sea bed slowly spreads, pushing the continents apart.’ [line 21]
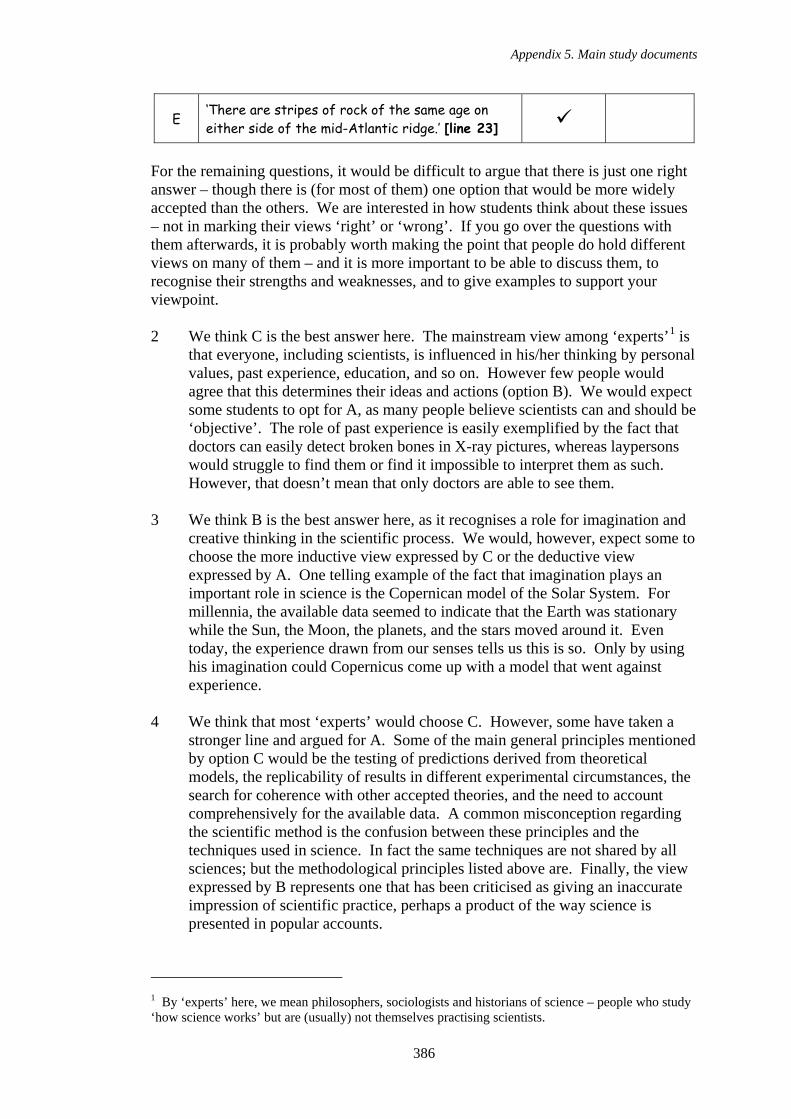
Appendix 5. Main study documents
386
E ‘There are stripes of rock of the same age on either side of the mid-Atlantic ridge.’ [line 23]
For the remaining questions, it would be difficult to argue that there is just one right answer – though there is (for most of them) one option that would be more widely accepted than the others. We are interested in how students think about these issues – not in marking their views ‘right’ or ‘wrong’. If you go over the questions with them afterwards, it is probably worth making the point that people do hold different views on many of them – and it is more important to be able to discuss them, to recognise their strengths and weaknesses, and to give examples to support your viewpoint. 2 We think C is the best answer here. The mainstream view among ‘experts’1 is
that everyone, including scientists, is influenced in his/her thinking by personal values, past experience, education, and so on. However few people would agree that this determines their ideas and actions (option B). We would expect some students to opt for A, as many people believe scientists can and should be ‘objective’. The role of past experience is easily exemplified by the fact that doctors can easily detect broken bones in X-ray pictures, whereas laypersons would struggle to find them or find it impossible to interpret them as such. However, that doesn’t mean that only doctors are able to see them.
3 We think B is the best answer here, as it recognises a role for imagination and
creative thinking in the scientific process. We would, however, expect some to choose the more inductive view expressed by C or the deductive view expressed by A. One telling example of the fact that imagination plays an important role in science is the Copernican model of the Solar System. For millennia, the available data seemed to indicate that the Earth was stationary while the Sun, the Moon, the planets, and the stars moved around it. Even today, the experience drawn from our senses tells us this is so. Only by using his imagination could Copernicus come up with a model that went against experience.
4 We think that most ‘experts’ would choose C. However, some have taken a
stronger line and argued for A. Some of the main general principles mentioned by option C would be the testing of predictions derived from theoretical models, the replicability of results in different experimental circumstances, the search for coherence with other accepted theories, and the need to account comprehensively for the available data. A common misconception regarding the scientific method is the confusion between these principles and the techniques used in science. In fact the same techniques are not shared by all sciences; but the methodological principles listed above are. Finally, the view expressed by B represents one that has been criticised as giving an inaccurate impression of scientific practice, perhaps a product of the way science is presented in popular accounts.
1 By ‘experts’ here, we mean philosophers, sociologists and historians of science – people who study ‘how science works’ but are (usually) not themselves practising scientists.
Appendix 5. Main study documents
387
5 We think A is the best answer here. We hope students will appreciate that any given data set might have more than one interpretation. If a student chooses B, it might be interesting to see if they have also chosen A for question 2. Both indicate a view of science as ‘objective’ – with conclusions determined by the data. The fact that scientists use their imaginations to come up with explanations makes option B highly unlikely, since logic by itself cannot be used to come up with an unambiguous explanation straight from the data. On the other hand, option C is too extreme: explanations are hard to come by, so it’s highly unlikely that each scientist could come up with a different good explanation for the same data.
6 For this question, it is harder to defend the view that any one answer is ‘best’.
Many ‘experts’ would probably choose C – based on the view that a good explanation should lead to predictions that can be tested. Option B is somewhat tautological: the data upon which an explanation is based cannot be, at the same time, proof of how good it is. In practice, we often decide to accept or reject a claim on the basis of A, so this is not a ‘wrong’ answer – though we might then ask what it is that leads to scientists agreeing. We would hope that students would see this agreement as resulting from C. Consensus by itself is not the strongest reason for accepting an explanation.
7 Although no one could say for sure what is the right answer to this, option B is
perhaps the safest choice. We are interested to see how many students choose C – which might suggest that they see scientific explanations as ‘discovered’ rather than ‘constructed’. Even though explanations have been abandoned in the past, and some current ones may well be abandoned in future, the most common pattern of scientific progress is characterised by accumulation and refinement of both data and explanations. Even though scientific revolutions do happen, their occurrence is less frequent than the process of building up or altering the knowledge we already have. Many experts would agree, for example, that it is highly improbable that the atomic-molecular model of chemical reactions that we currently accept will be replaced in the future by a completely different one. Even Newtonian mechanics, though superseded by quantum mechanics and general relativity, continues to be used as a matter of course in many disciplines, because it explains and predicts accurately in many situations, and continues to be taught in schools and universities.
Appendix 5. Main study documents
388
DEPARTMENT OF EDUCATIONAL STUDIES Heslington, York, YO10 5DD From Professor Robin Millar Direct Telephone +44 (0) 1904-433469 Direct Fax +44 (0) 1904-433444 e-mail [email protected] [address]
3 December 2009 Dear Assessing students’ ‘ideas about science’ Thank you for agreeing to administer some questions designed to probe students’ understanding of ‘ideas about science’ to two of your classes. In this package, you will find four bundles of 35 question booklets. I hope this is enough for the two classes you intend to use them with. All the booklets in each bundle are the same. The questions in the booklets are also the same, but asked in the context of two different science stories – the search for a cure for pellagra (the yellow booklets) and the theory of plate tectonics (the blue booklets). The four bundles are labelled to indicate which ones we would like you to administer to each class before and after the Christmas break. In Class A, we would like each student to complete one yellow and one blue booklet. In Class B, we would like each student to complete two yellow booklets. We need to be able to pair the booklets answered by the same student, so could you please ask students to enter their names on the front cover but assure them that this information will only be used to pair their two booklets and will not be retained. Please encourage them to answer the questions carefully even though it is not a test. For the second administration, you might want to say to the students in Class A that the questions in the two booklets are the same or very similar, before one of them comments on it or asks about it. You could explain that we are interested to see if their answers are the same or different, when thinking about a different science story. In Class B, you might want to explain that we are interested in how consistent their answers are, when asked to consider the same questions again a few weeks later. After the second administration, please feel free to discuss the questions with the students – but only after you have collected the completed booklets. Please do NOT do this after the first administration, as it might influence their answers on the second occasion. I have enclosed sheets summarising what we see as the ‘expected’ answers. You will also find in this package four plastic envelopes in which to store the completed tests – one for each bundle – and a stamped addressed envelope in which to return all the completed booklets. I would be also grateful if you (and any other colleague involved) could read and sign the ‘Informed Consent’ form, which is now routinely used when collecting research data. Please return this with the completed booklets. When we have completed the analysis of students’ answers, we will send you a short report on this, for your information. We will also send you, as editable Word files, the text of these

Appendix 5. Main study documents
389
two question booklets (plus four others of similar type developed during this project) that you may wish to use in your own teaching and share with colleagues in your department. Thank you again for helping with this work. With best wishes, Professor Robin Millar

Appendix 6. Informed consents
390
15. APPENDIX 6
INFORMED CONSENTS

Appendix 6. Informed consents
391
Department of Educational Studies Parents’ or Guardians’ Informed Consent: Questionnaire to elicit students’ understandings of ‘ideas about science’ I understand that my son/daughter is being invited to participate in a research study directed by Professor Robin Millar. I understand that the purpose of this research study is to explore the ideas held by Key Stage 4 students about scientific knowledge, and scientific enquiry. I understand that the data collected in this study will be handled and stored in a manner which ensures that only the research team can identify the data source, and that the names of students and schools will not be disclosed in any written report or oral presentation based on data from this study. Name: ___________________________________________ Signature: ________________________________________ Date: __________________
Appendix 6. Informed consents
392
Department of Educational Studies Students’ Informed Consent: Questionnaire to elicit students’ understandings of ‘ideas about science’ I understand that I am being invited to participate in a research study directed by Professor Robin Millar. I understand that the purpose of this research study is to explore the ideas held by Key Stage 4 students about scientific knowledge, and scientific enquiry. I understand that the data collected in this study will be handled and stored in a manner which ensures that only the research team can identify the data source, and that the names of students and schools will not be disclosed in any written report or oral presentation based on data from this study. Name: ___________________________________________ Signature: ________________________________________ Name: ___________________________________________ Signature: ________________________________________ Name: ___________________________________________ Signature: ________________________________________ Date: __________________

Appendix 6. Informed consents
393
Department of Educational Studies Teacher’s Informed Consent: Questionnaire to elicit students’ understandings of ‘ideas about science’ I understand that I am being invited to participate in a research study directed by Professor Robin Millar. I understand that the purpose of this research study is to explore the ideas held by Key Stage 4 students about scientific knowledge, and scientific enquiry. I understand that the data collected in this study will be handled and stored in a manner which ensures that only the research team can identify the data source, and that the names of students and schools will not be disclosed in any written report or oral presentation based on data from this study. Name: ___________________________________________ Signature: ________________________________________ Date: __________________
References
394
16. REFERENCES
Abd-El-Khalick, F. (1998) The influence of history of science courses in students' conceptions of the nature of science, Doctoral dissertation, Oregon State University.
Abd-El-Khalick, F. (2001) Embedding nature of science instruction in preservice elementary science courses: Abandoning scientism, but... Journal of Science Teacher Education 12 (3), 215-233.
Abd-El-Khalick, F. (2005) Developing deeper understandings of nature of science: The impact of a philosophy of science course on preservice science teachers' views and instructional planning, International Journal of Science Education 27 (1), 15-42.
Abd-El-Khalick, F., Bell, R. L. and Lederman, N. G. (1998) The nature of science and instructional practice: Making the unnatural natural, Science Education 82 (4), 417-437.
Abd-El-Khalick, F. and Lederman, N. G. (2000) Improving science teachers' conceptions of nature of science: A critical review of the literature, International Journal of Science Education 22 (7), 665-701.
Abd-El-Khalick, F. and Lederman, N. G. (2000) The influence of history of science courses on students' views of the nature of science, Journal of Research in Science Teaching 37, 1057.
Abd-El-Khalick, F., Lederman, N. G., Bell, R. L. and Schwartz, R. S. (2001). Views of Nature of Science Questionnaire (VNOS): Toward valid and meaningful assessment of learners' conceptions of nature of science. Annual Meeting of the Association for the Education of Teachers in Science, Costa Mesa, CA, The Association for Science Teacher Education.
Abd-El-Khalick, F., Waters, M. and Le, A.-P. (2008) Representations of nature of science in high school chemistry textbooks over the past four decades, Journal of Research in Science Teaching 45 (7), 835-855.
Abell, S. K. (2001) "That's what scientists have to do": Preservice elementary teachers' conceptions of the nature of science during a moon investigation, International Journal of Science Education 23 (11), 1095-1109.
Abimbola, I. O. (1983) The relevance of the "new" philosophy of science for the science curriculum, School Science and Mathematics 83, 181-193.
Aikenhead, G. S. (1973) The measurement of high school students' knowledge about science and scientists, Science Education 57 (4), 539-549.
Aikenhead, G. S. (1979) Science: A way of knowing, The Science Teacher 46 (6), 23-25.
Aikenhead, G. S. (1988) An analysis of four ways of assessing student beliefs about STS topics, Journal of Research in Science Teaching 25 (8), 607-629.
Aikenhead, G. S., Fleming, R. W. and Ryan, A. G. (1987) High-school graduates' beliefs about science-technology-society I: Methods and issues in monitoring student views, Science Education 71 (2), 145-161.
Aikenhead, G. S. and Ryan, A. G. (1992) The development of a new instrument: "Views on Science-Technology-Society" (VOSTS), Science Education 76 (5), 477-491.
Aikenhead, G. S., Ryan, A. G. and Desautels, J. (1989) Monitoring student views on STS topics. Annual meeting of the National Association for Research in Science Teaching, San Francisco, CA,
References
395
Akerson, V. L., Abd-El-Khalick, F. and Lederman, N. G. (2000) Influence of a reflective explicit activity-based approach on elementary teachers' conceptions of nature of science, Journal of Research in Science Teaching 37, 295.
Alters, B., J. (1997) Whose nature of science?, Journal of Research in Science Teaching 34 (1), 39-55.
Allen, H., Jr. (1959) Attitudes of certain high school seniors toward science and scientific careers. New York: Teachers College Press.
American Association for the Advancement of Science (1989) Project 2061: Science for all Americans. Washington, DC: American Association for the Advancement of Science.
Armstrong, H. E. (1903) The teaching of scientific method. London: Macmillan. Association for Science Education (1981) Education through science. Hatfield,
Herts: Association for Science Education. Ayer, A. J. (1936) Language, truth, and logic. London: V. Gollancz. Banerjee, M., Capozzoli, M., McSweeney, L. and Sinha, D. (1999) Beyond Kappa:
A review of interrater agreement measures, The Canadian Journal of Statistics 27 (1), 3-23.
Barnes, B. and Bloor, D. (1982) Relativism, rationalism, and the sociology of knowledge. In M. Hollis and S. Lukes (eds.) Rationality and relativism. Cambridge, MA: MIT Press.
Barnes, B., Bloor, D. and Henry, J. (1996) Scientific knowledge: A sociological analysis. Chicago: University of Chicago Press.
Bell, R. L., Lederman, N. G. and Abd-El-Khalick, F. (2000) Developing and acting upon one's conceptions of the nature of science: A follow-up study, Journal of Research in Science Teaching 37, 563.
Billeh, V. Y. and Hasan, O. E. (1975) Factors influencing teachers' gain in understanding the nature of science, Journal of Research in Science Teaching 12 (3), 209-219.
Biological Sciences Curriculum Study (1962) Processes of science test. New York: The Psychological Corporation.
Black, P. (1998) Testing: Friend or foe? Theory and practice of assessment and testing. London: Falmer Press.
Blank, M., Rose, S. A. and Berlin, L. J. (1978) The language of learning: The preschool years. New York: Grune and Stratton.
Bora, N. D., Aslan, O. and Cakiroglu, J. (2006) Investigating science teachers' and high school students' views on the nature of science in Turkey. National Association for Research in Science Teaching, San Francisco, CA,
Brown, M., Luft, J., Roehrig, G. and Kern, A. (2006) Beginning science teachers' perspectives on the nature of science: The development of a nature of science rubric. ASTE 2006 International Conference, Portland, OR,
Campbell, B., Lazonby, J., Millar, R. and Smyth, S. (1991) Science: The Salters' approach--GCSE volume 1, Year 10 units. Oxford: Heinemann Educational Publishers.
Campbell, B., Lazonby, J., Millar, R. and Smyth, S. (1997) Science: The Salters' approach--GCSE volume 2, Year 11 units. Oxford: Heinemann Educational Publishers.
Carey, S. S. (1998) A beginner's guide to scientific method. Belmont: Wadsworth Publishing Company.
References
396
Cattell, R. B. (1973) Personality and mood by questionnaire. New York: Jossey-Bass.
Cattell, R. B. (1996) The scientific analysis of personality. Chicago: Aldine Pub Co. Central Association for Science and Mathematics Teachers (1907) A consideration
of the principles that should determine the courses in biology in secondary schools, School Science and Mathematics 7, 241-247.
Clough, M. P. (2007) "Teaching the nature of science to secondary and post-secondary students: Questions rather than tenets." The Pantaneto Forum 1 (25), Not paginated
Cohen, J. (1960) A coefficient of agreement for nominal scales, Educational and Psychological Measurement 20 (1), 37-46.
Conant, J. B. (1945) General education in a free society: Report of the Harvard Committee. Cambridge, MA: Harvard University Press.
Cooley, W. W. and Klopfer, L. E. (1961) Test on understanding science. Princeton, NJ: Educational Testing Service.
Cotham, J. C. and Smith, E. L. (1981) Development and validation of the conceptions of scientific theories test, Journal of Research in Science Teaching 18 (5), 387-396.
Council of Ministers of Education (1997) Common framework of science learning outcomes K to 12. Toronto: Council of Ministers of Education.
Cover, J. A. and Curd, M. (1998) Philosophy of science: The central issues. New York: W. W. Norton.
Crelinsten, J., De Boerr, J. and Aikenhead, G. S. (1991) Students' understanding of science in its technological and social context: Design and test of a suitable evaluation instrument. Toronto: The Ontario Ministry of Education.
Curriculum Corporation (1994) A statement of science for Australian schools: A joint project of the states, territories and the Commonwealth of Australia initiated by the Australian Education Council. Carlton, Victoria: Curriculum Corporation.
Curriculum Development Council (1998) Science syllabus for secondary 1-3. Hong Kong: Curriculum Development Council.
Chalmers, A. F. (1999) What is this thing called science? Indianapolis: Hackett Publishing Company.
Chen, S. (2006) Development of an instrument to assess views on nature of science and attitudes toward teaching science, Science Education 90 (5), 803-819.
DeBoer, G. E. (2000) Scientific literacy: Another look at its historical and contemporary meanings and its relationship to science education reform, Journal of Research in Science Teaching 37 (6), 582-601.
Department of Education and Science and the Welsh Office (1989) Science in the National Curriculum. London: Her Majesty's Stationery Office.
Department of Education of South Africa (2002) Revised national curriculum statement for Grades R-9 (Schools): Natural sciences. Pretoria: Department of Education.
Donnelly, J. (2001) Contested terrain or unified project? "The nature of science" in the National Curriculum for England and Wales, International Journal of Science Education 23 (2), 181-95.
Doran, R. L., Guerin, R. O. and Cavalieri, J. (1974) An analysis of several instruments measuring "nature of science" objectives, Science Education 58 (3), 321-329.
References
397
Driver, R., Leach, J., Millar, R. and Scott, P. (1996) Young people's images of science. Berkshire, UK: Open University Press.
Driver, R. and Oldham, V. (1986) A constructivist approach to curriculum development in science, Studies in Science Education 13, 105-122.
Duschl, R. (1985) Science education and philosophy of science: Twenty-five years of mutually exclusive development, School Science and Mathematics 87 (7), 541-555.
Elby, A. and Hammer, D. (2001) On the substance of a sophisticated epistemology, Science Education 85 (5), 554-567.
Ellse, M. (1987) Science Year 8: Nuffield science for Key Stage 3. Essex: Longman Group UK Limited.
Ennis, R. H. (1979) Research in philosophy of science bearing on science education. In P. D. Asquith and H. E. Kyburg (eds.) Current research in philosophy of science (pp. 138-170). East Lansing, MI: Philosophy of Science Association.
Feyerabend, P. (1975) Against method: Outline of an anarchistic theory of knowledge. Atlantic Highlands, NJ: Humanities Press.
Fleming, R. W. (1988) Undergraduate science students' views on the relationship between science, technology, and society, International Journal of Science Education 10 (4), 449-463.
Fraser, B. J. (1978) Development of a test of science-related attitudes, Science Education 62, 509.
Fraser, B. J. (1980) Development and validation of a test of enquiry skills, Journal of Research in Science Teaching 17, 7.
Garrison, J. W. (1986) Some principles of postpositivist philosophy of science, Educational Researcher 15 (9), 12-18.
Gauld, C. (1982) The scientific attitude and science education: A critical reappraisal, Science Education 66 (1), 109-121.
Giere, R. N. (1979) Understanding scientific reasoning. New York: Holt, Rinehart and Winston.
Giere, R. N. (1997) Understanding scientific reasoning. Orlando: Harcourt Brace. Giere, R. N., Bickle, J. and Mauldin, R. F. (2006) Understanding scientific
reasoning. Belmont, CA: Thomson Wadsworth. Gipps, C. (2004) Beyond testing: Towards a theory of educational assessment.
Abingdon, Oxon: RoutledgeFalmer. Glasersfeld, E. v. (1989) Cognition, construction of knowledge, and teaching,
Synthese 80 (1), 121-140. Godfrey-Smith, P. (2003) Theory and reality: An introduction to the philosophy of
science. Chicago: The University of Chicago Press. Goodman, N. (1978) Ways of worldmaking. Indianapolis: Hackett. Gregory, J. and Miller, S. (1998) Science in public: Communication, culture, and
credibility. Cambridge, MA: Perseus Publishing. Hacking, I. (1983) Representing and intervening: Introductory topics in the
philosophy of natural science. New York: Cambridge University Press. Harré, R. (1972) The philosophies of science: An introductory survey. London:
Oxford University Press. Hillis, S. R. (1975) The development of an instrument to determine student views of
the tentativeness of science. In Research and curriculum development in science education: Science teacher behaviour and student affective and cognitive learning. Austin, TX: University of Texas Press.
References
398
Hodson, D. (1991) Philosophy of science and science education. In M. R. Matthews (ed.) History, philosophy, and science teaching: Selected readings. Toronto: OISE Press.
Hofer, B. K. and Pintrich, P. R. (1997) The development of epistemological theories: Beliefs about knowledge and knowing and their relation to learning, Review of Educational Research 67 (1), 88-140.
Howson, C. and Urbach, P. (1989) Scientific reasoning: The Bayesian approach. La Salle, IL: Open Court.
Hume, D. (1739/1978) A treatise of human nature. Oxford: Oxford University Press. Hunt, A. (1994) STS teaching in Britain. In J. Solomon and G. S. Aikenhead (eds.)
STS education: International perspectives on reform. New York: Teachers College Press.
Ibrahim, B., Buffler, A. and Lubben, F. (2009) Profiles of freshman physics students' views on the nature of science, Journal of Research in Science Teaching 46 (3), 248-264.
Keogh, B. and Naylor, S. (1999) Concept cartoons, teaching and learning in science: An evaluation, International Journal of Science Education 21 (4), 431-446.
Kimball, M. E. (1967) Understanding the nature of science: A comparison of scientists and science teachers, Journal of Research in Science Teaching 5, 110-120.
King, P. M., Kitchener, K. S., Davison, M. L. and Parker, C. A. (1983) The justification of beliefs in young adults: A longitudinal study, Human Development 26, 106-16.
Kitchener, K. S. (1983) Cognition, metacognition and epistemic cognition: A three-level model of cognitive processing, Human Development 26, 227-232.
Kitchener, K. S. and King, P. M. (1981) Reflective judgment: Concepts of justification and their relationship to age and education, Journal of Applied Developmental Psychology 2, 89-116.
Klopfer, L. E. and Cooley, W. W. (1963) The history of science cases for high schools in the development of student understanding of science and scientists: A report on the HOSC instruction project, Journal of Research in Science Teaching 1, 33-47.
Knodel, J., Havanon, N. and Pramualratana, A. (1984) Fertility transition in Thailand: A qualitative analysis, Population and Development Review 10, 297-328.
Korth, W. (1969) Test every senior project: Understanding the social aspects of science. 42nd Annual Meeting of the National Association for Research in Science Teaching,
Kosso, P. (1992) Reading the book of nature: An introduction to the philosophy of science. Cambridge: Cambridge University Press.
Koulaidis, V. and Ogborn, J. (1989) Philosophy of science: An empirical study of teachers' views, International Journal of Science Education 11 (2), 173-184.
Kuhn, D., Amsel, E. and O'Loughlin, M. (1988) The development of scientific thinking skills. New York: Academic Press.
Kuhn, T. S. (1962) The structure of scientific revolutions. Chicago: The University of Chicago Press.
Kuo, P.-C. (2009) High school students' attitudes toward science and views of nature of science: The development of a multifaceted questionnaire. ESERA Conference, Istanbul,
References
399
Lakatos, I. (1970) Falsification and the methodology of scientific research programmes. In I. Lakatos and A. Musgrave (eds.) Criticism and the growth of knowledge. Cambridge: Cambridge University Press.
Lakin, S. and Wellington, J. (1994) "Who will teach the nature of science?": Teachers' views of the nature of science and their implications for science education, International Journal of Science Education 16 (2), 175-190.
Latour, B. (1988) The pasteurization of France. Cambridge, MA: Harvard University Press.
Latour, B. and Woolgar, S. (1986) Laboratory life: The construction of scientific facts. Princeton, NJ: Princeton University Press.
Laudan, L. (1977) Progress and its problems: Towards a theory of scientific growth. London: Routledge & K. Paul.
Laudan, L. (1990) Science and relativism: Some key controversies in the philosophy of science. Chicago: University of Chicago Press.
Leach, J. (1996) Students' understanding of the nature of science. In W. Geoff, J. Osborne and P. Scott (eds.) Research in science education in Europe: Current issues and themes (pp. 269-282). London: RoutledgeFalmer.
Leach, J., Millar, R., Ryder, J. and Séré, M.-G. (2000) Epistemological understanding in science learning: The consistency of representations across contexts, Learning and Instruction 10, 497-527.
Lederman, J. S. and Khisfe, R. (2002). Views of nature of science, form D. Chicago, Illinois Institute of Technology.
Lederman, J. S. and Lederman, N. G. (2009) Development of a valid and reliable protocol for the assessment of early childhood students' conceptions of the nature of science and scientific inquiry. ESERA Conference, Istanbul,
Lederman, N. G. (1992) Students' and teachers' conceptions of the nature of science: A review of the research, Journal of Research in Science Teaching 29 (4), 331-359.
Lederman, N. G. (1998) "The state of science education: Subject matter without context." Electronic Journal of Science Education 3 (2), Not paginated
Lederman, N. G. (2007) Nature of science: Past, present, and future. In S. K. Abell and N. G. Lederman (eds.) Handbook of research on science education (pp. 831-879). Mahwah: Lawrence Erlbaum Associates.
Lederman, N. G., Abd-El-Khalick, F., Bell, R. L. and Schwartz, R. S. (2002) Views of nature of science questionnaire: Toward valid and meaningful assessment of learners' conceptions of nature of science, Journal of Research in Science Teaching 39 (6), 497-521.
Lederman, N. G. and Khishfe, R. (2002). Views of the nature of science, Form D. Chicago, Illinois Institute of Technology.
Lederman, N. G. and Ko, E. K. (2004). Views of the nature of science, Form E. Chicago, Illinois Institute of Technology.
Lederman, N. G. and O'Malley, M. (1990) Students' perceptions of tentativeness in science: Development, use, and sources of change, Science Education 74 (2), 225-239.
Lederman, N. G., Schwartz, R. S., Abd-El-Khalick, F. and Bell, R. L. (2001) Preservice teachers' understanding and teaching of nature of science: An intervention study, Canadian Journal of Science, Mathematics, and Technology Education 1, 135.
Lederman, N. G., Wade, P. D. and Bell, R. L. (1998) Assessing understanding of the nature of science: a historical perspective. In W. F. McComas (ed.) The
References
400
nature of science and science education: Rationales and strategies (pp. 331-350). Dordrecht, the Netherlands: Kluwer Academic Publishers.
Leplin, J., Ed. (1984). Scientific realism. Berkeley, CA, University of California Press.
Levesley, M., Johnson, P. and Gray, S. (2008) Exploring science: How science works, year 7. Essex: Pearson Education.
Liang, L. L., Chen, S., Chen, X., Kaya, O. N., Adams, A. D., Macklin, M. and Ebenezer, J. (2005) Student understanding of science and scientific inquiry (SUSSI): Development and validation of an assessment instrument. Eighth International History, Philosophy, Sociology and Science Teaching Conference Leeds, United Kingdom,
Liang, L. L., Chen, S., Chen, X., Kaya, O. N., Adams, A. D., Macklin, M. and Ebenezer, J. (2008) Preservice teachers' views about nature of scientific knowledge development: An international collaborative study, International Journal of Science and Mathematics Education 2008 (5), 987-1012.
Lipton, P. (1991) Inference to the best explanation. London: Routledge. López, V., González, C. and Gavilán, J. F. (2009) Validation of a questionnaire for
assessing secondary students' conceptions of science and learning science. ESERA Conference, Istanbul,
Lucas, A. M. (1975) Hidden assumptions in measures of knowledge about science and scientists., Science Education 59, 481-485.
Martin, M. (1979) Connections between philosophy of science and science education, Studies in Philosophy and Education 9 (329).
Matthews, M. R. (1994) Science teaching: The role of history and philosophy of science. New York: Routledge.
Matthews, M. R. (1998) Foreword and introduction. In W. F. McComas (ed.) The nature of science in science education: Rationales and strategies (pp. xi-xxi). Dordrecht, the Netherlands: Kluwer Academic Publishers.
McComas, W. F. (1998) The principal elements of the nature of science: Dispelling the myths. In W. F. McComas (ed.) The nature of science in science education: Rationales and strategies (pp. 53-70). Dordrecht, the Netherlands: Kluwer Academic Publishers.
McComas, W. F., Clough, M. P. and Almazroa, H. (1998) The role and character of the nature of science in science education. In W. F. McComas (ed.) The nature of science education in science education: Rationales and strategies (pp. 3-39). Dordrecht, the Netherlands: Kluwer Academic Publishers.
McComas, W. F. and Olson, J. K. (1998) The nature of science in international science education standards documents. In W. F. McComas (ed.) The nature of science in science education: Rationales and strategies (pp. 41-52). Dordrecht, the Netherlands: Kluwer Academic Publishers.
Mead, M. and Métraux, R. (1957) Image of the scientist among high school students, Science 126, 384-390.
Meichtry, Y. J. (1992) Influencing student understanding of the nature of science: Data from a case of curriculum development, Journal of Research in Science Teaching 29, 389-407.
Meichtry, Y. J. (1993) The impact of science curriculum on student views about the nature of science, Journal of Research in Science Teaching 30, 429-443.
Merton, R. K. (1973) The sociology of science: Theoretical and empirical investigations. Chicago: University of Chicago Press.
References
401
Ministry of Education (1993) Science in the New Zealand curriculum. Wellington: Learning Media.
Ministry of Public Education (2006) 2006 syllabus for basic secondary education: Science. Mexico City: General Department of Curricular Development.
Moore, R. W. and Sutman, F. X. (1970) The development, field test and validation of an inventory of scientific attitudes, Journal of Research in Science Teaching 7, 85-94.
Morgan, D. (1996) Focus groups as qualitative research. Thousand Oaks, California: Sage Publications.
Moss, D., Abrams, E. D. and Robb, J. (2001) Examining student conceptions of the nature of science International Journal of Science Education 23, 771-790.
Munby, H. (1982) The place of teachers' beliefs in research on teacher thinking and decision making, and an alternative methodology, Instructional Science 11, 201-225.
Niaz, M. (2001) Understanding nature of science as progressive transitions in heuristic principles, Science Education 85 (6), 684-690.
Nielsen, H. and Thomsen, P. (1990) History and philosophy of science in the Danish curriculum, International Journal of Science Education 12 (4), 308-316.
Norris, S. P. and Phillips, L. M. (1994) Interpreting pragmatic meaning when reading popular reports of science, Journal of Research in Science Teaching 31 (9), 947-967.
Norris, S. P. and Phillips, L. M. (2003) How literacy in its fundamental sense is central to scientific literacy, Science Education 87 (2), 224-240.
Nott, M. and Wellington, J. (1995). Probing teachers' views of the nature of science: How should we do it and where should we be looking? Proceedings of the Third International History, Philosophy, and Science Teaching Conference.
Nott, M. and Wellington, J. (1996) Probing teachers' views of the nature of science: How should we do it and where should we be looking? In G. Welford, J. Osborne and P. Scott (eds.) Research in Science Education in Europe (pp. 283-294). London: Falmer Press.
Nott, M. and Wellington, J. (1998) A programme for developing understanding of the nature of science in teacher education. In W. F. McComas (ed.) The nature of science in science education: Rationales and strategies (pp. 293-313). Dordrecht, the Netherlands: Kluwer Academic Publishers.
Ogborn, J. (1997) Constructivist metaphors of learning science, Science and Education 6, 121-133.
Okasha, S. (2002) Philosophy of science: A very short introduction. Oxford: Oxford University Press.
Organisation for Economic Co-operation and Development (2005) Formative assessment: Improving learning in secondary classrooms: OECD Publishing.
Osborne, J., Collins, S., Ratcliffe, M., Millar, R. and Duschl, R. (2003) What "ideas-about-science" should be taught in school science? A Delphi study of the expert community, Journal of Research in Science Teaching 40 (7), 692-720.
Parusnikova, Z. (1992) Is a postmodern philosophy of science possible?, Studies in History and Philosophy of Science 23 (1), 21-37.
Penrose, R. (1989) The emperor's new mind: Concerning computers, minds and the laws of physics. Oxford: Oxford University Press.
Phillips, L. M. and Norris, S. P. (1999) Interpreting popular reports of science: What happens when the reader's world meets the world on paper?, International Journal of Science Education 21 (3), 317-327.
References
402
Physics Curriculum Development Project (1986) Curriculummaterials. Utrecht: Utrecht University/Zeist NIB.
Pomeroy, D. (1993) Implications of teachers' beliefs about the nature of science, Science Education 77, 261-278.
Popper, K. (1953) The logic of scientific discovery. New York: Basic Books. Quine, W. V. (1953) Two dogmas of empiricism. In W. V. Quine (ed.) From a
logical point of view. Cambridge: Harvard University Press. Reichenbach, H. (2006) The philosophical significance of the theory of relativity. In
S. Gimel and A. Walz (eds.) Defending Einstein: Hans Reichenbach's writings on space, time and motion (pp. 95–160). New York: Cambridge University Press.
Rosenberg, A. (2000) Philosophy of science: A contemporary introduction. London: Routledge.
Rubba, P. A. (1976) Nature of scientific knowledge scale. Bloomington, IN: School of Education, Indiana University.
Rubba, P. A. (1977) The development, field testing, and validation of an instrument to assess secondary students' understanding of the nature of scientific knowledge.
Ryder, J. (2001) Identifying Science Understanding for Functional Scientific Literacy, Studies in Science Education 36, 1-44.
Satterly, D. (1981) Assessment in schools. Oxford: Basil Blackwell. Scientific Literacy Research Center (1967) Wisconsin inventory of science processes.
Madison, WI: University of Wisconsin. Schwab, J. J. (1962) The teaching of science as enquiry. In J. J. Schwab and P. F.
Brandwein (eds.) The teaching of science. Cambridge, Mass.: Harvard University Press.
Shamos, M. H. (1995) The myth of scientific literacy. New Brunswick, NJ: Rutgers University Press.
Shapin, S. and Schaffer, S. (1985) Leviathan and the air-pump: Hobbes, Boyle, and the experimental life. Princeton, NJ: Princeton University Press.
Shuttleworth, M. (2009). History of the philosophy of science. http://www.experiment-resources.com/history-of-the-philosophy-of-science.html.
Smith, M. U. and Scharmann, L. C. (1999) Defining versus describing the nature of science: a pragmatic analysis for classroom teachers and science educators, Science Education 83, 493-509.
Stice, G. (1958) Facts about science test. Princeton, New Jersey: Educational Testing Service.
Stobart, G. and Gipps, C. (1997) Assessment: A teacher's guide to the issues. London: Hodder and Stoughton.
Suzuri, J. and Millar, R. (2009) Development and validation of a multiple-choice, context-based instrument for the assessment of conceptions about the nature of science. ESERA Conference, Istanbul,
Swan, M. D. (1966) Science achievement as it relates to science curricula and programs at the sixth grade level in Montana public schools, Journal of Research in Science Teaching 4, 102.
Thomas, G. and Durant, J. (1987) Why should we promote the public understanding of science? In M. Shortland (ed.) Scientific literacy papers (pp. 1-14). Oxford: Oxford Department for External Studies.
References
403
Tsai, C.-C. and Liu, S.-Y. (2005) Developing a multi-dimensional instrument for assessing students' epistemological views toward science, International Journal of Science Education 27 (13), 1621-1638.
Vaughn, S., Schumm, J. S. and Sinagub, J. (1996) Focus group interviews in education and psychology. Thousand Oaks, California: Sage Publications.
Vazquez-Alonso, A. and Manassero-Mas, M.-A. (1999) Response and scoring models for the "Views on Science-Technology-Society" instrument, International Journal of Science Education 21, 231-247.
Vazquez-Alonso, A., Manassero-Mas, M.-A. and Acevedo-Diaz, J.-A. (2006) An analysis of complex multiple-choice Science-Technology-Society items: Methodological development and preliminary results, Science Education 90 (4), 681-706.
Welch, W. W. (1967) Science process inventory. Cambridge, MA: Harvard University Press.
Wilson, L. (1954) A study of opinions related to the nature of science and its purpose in society, Science Education 38 (2), 159-164.
Wolpert, L. (1993) The unnatural nature of science. London: Faber. Wood, D. (1988) How children think and learn. Oxford: Basil Blackwell. Wood, J. M. (2007). Understanding and computing Cohen's Kappa: A tutorial.
http://wpe.info/papers_table.html (September 10, 2009) Wood, R. (1991) Assessment and testing: A survey of research. Cambridge:
Cambridge University Press. Worrall, J. (1982) Scientific realism and scientific change, Philosophical Quarterly
32, 201-231. Zhang, B. H., Krajcik, J. S., Sutherland, L. M., Wang, L., Wu, J. and Qian, Y. (2003)
Opportunities and challenges of China's inquiry-based education reform in middle and high schools: Perspectives of science teachers and teacher educators, International Journal of Science and Mathematics Education 1, 477-503.
Zilker, I. and Fischer, H. E. (2009) Are historical contexts suitable for assessing students' competences in the field of nature of science and scientific inquiry? ESERA Conference, Istanbul,
Ziman, J. (1980) Teaching and learning about science and society. Cambridge: Cambridge University Press.
Zoller, U., Donn, S., Wild, R. and Beckett, P. (1991) Students' versus their teachers' beliefs and positions on science-technology-society oriented issues, International Journal of Science Education 13 (1), 25-35.
Zoller, U., Ebenezer, J., Morely, K., Paras, S., Sandberg, V., West, C., Wolthers, T. and Tan, S. H. (1990) Goal attainment in science-technology-society (STS) education and reality: The case of British Columbia, Science Education 74 (1), 19-36.
Related Documents


![Exploring young people's views on science education [PDF 713KB]](https://static.cupdf.com/doc/110x72/5867c4be1a28abd93f8bdd65/exploring-young-peoples-views-on-science-education-pdf-713kb.jpg)


