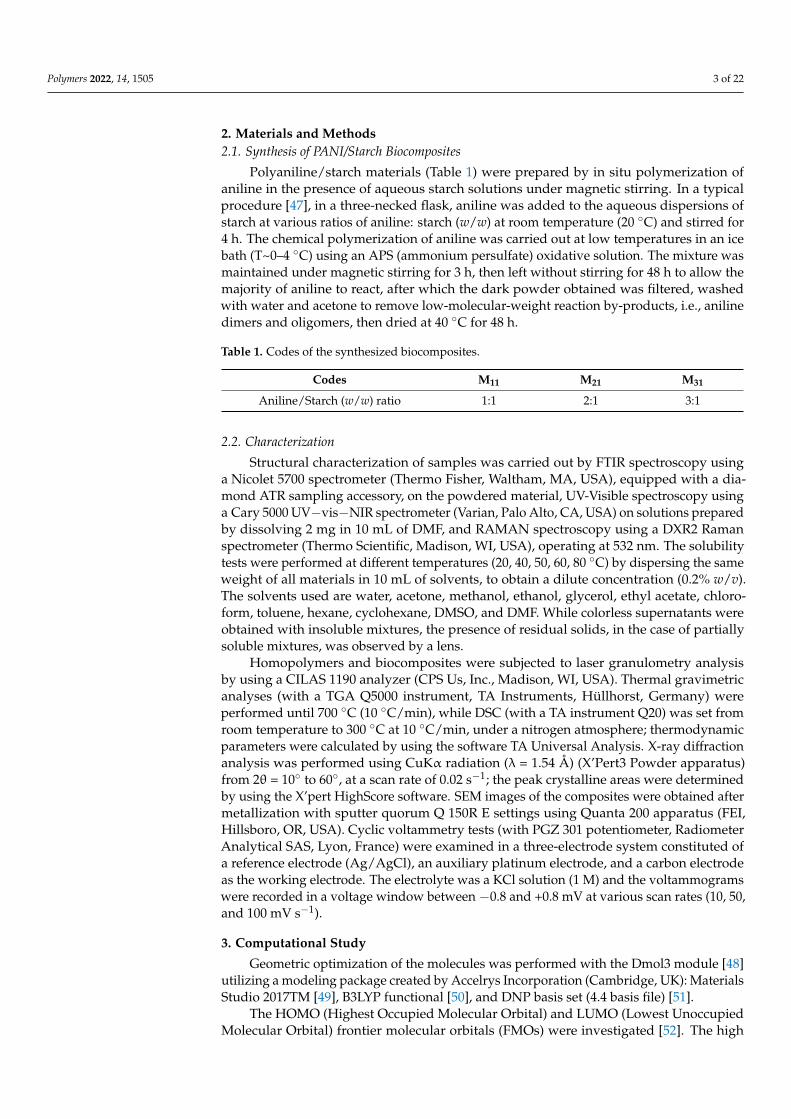
Citation: Boudjelida, S.; Djellali, S.; Ferkous, H.; Benguerba, Y.; Chikouche, I.; Carraro, M. Physicochemical Properties and Atomic-Scale Interactions in Polyaniline (Emeraldine Base)/Starch Bio-Based Composites: Experimental and Computational Investigations. Polymers 2022, 14, 1505. https:// doi.org/10.3390/polym14081505 Academic Editors: Evgenia G. Korzhikova-Vlakh and Pablo Marcelo Stefani Received: 28 January 2022 Accepted: 4 April 2022 Published: 7 April 2022 Publisher’s Note: MDPI stays neutral with regard to jurisdictional claims in published maps and institutional affil- iations. Copyright: © 2022 by the authors. Licensee MDPI, Basel, Switzerland. This article is an open access article distributed under the terms and conditions of the Creative Commons Attribution (CC BY) license (https:// creativecommons.org/licenses/by/ 4.0/). polymers Article Physicochemical Properties and Atomic-Scale Interactions in Polyaniline (Emeraldine Base)/Starch Bio-Based Composites: Experimental and Computational Investigations Soufiane Boudjelida 1,2 , Souad Djellali 3,4, * , Hana Ferkous 5,6 , Yacine Benguerba 7 , Imane Chikouche 8 and Mauro Carraro 2,9, * 1 Laboratory LMSE, University Mohamed El Bachir El Ibrahimi, Bordj Bou Arreridj 34030, Algeria; soufi[email protected] 2 Department of Chemical Sciences, University of Padova, Via Marzolo 1, 35131 Padova, Italy 3 Laboratoire de Physico-Chimie des Hauts Polymères, University Ferhat Abbas Setif-1, Setif 19000, Algeria 4 Department of Chemistry, Faculty of Sciences, University Ferhat Abbas Setif-1, Setif 19000, Algeria 5 Laboratoire de Génie mécanique et Matériaux, Faculté de Technologie, Université de 20 août 1955 de Skikda, Skikda 21000, Algeria; [email protected] 6 Département de Technologie, Université de 20 août 1955 de Skikda, Skikda 21000, Algeria 7 Department of Process Engineering, Faculty of Technology, University Ferhat Abbas Setif 1, Setif 19000, Algeria; [email protected] 8 Laboratoire Croissance et Caractérisation de Nouveaux Semi-Conducteurs, Faculté de Technologie, Université Sétif 1, Setif 19000, Algeria; [email protected] 9 ITM-CNR, UoS of Padova, Via Marzolo 1, 35131 Padova, Italy * Correspondence: [email protected] (S.D.); [email protected] (M.C.) Abstract: The processability of conductive polymers still represents a challenge. The use of potato starch as a steric stabilizer for the preparation of stable dispersions of polyaniline (emeraldine base, EB) is described in this paper. Biocomposites are obtained by oxidative polymerization of aniline in aqueous solutions containing different ratios of aniline and starch (% w/w). PANI-EB/Starch biocomposites are subjected to structural analysis (UV-Visible, RAMAN, ATR, XRD), thermal analysis (TGA, DSC), morphological analysis (SEM, Laser Granulometry), and electrochemical analysis using cyclic voltammetry. The samples were also tested for their solubility using various organic solvents. The results showed that, with respect to starch particles, PANI/starch biocomposites exhibit an overall decrease in particles size, which improves both their aqueous dispersion and solubility in organic solvents. Although X-ray diffraction and DSC analyses indicated a loss of crystallinity in biocomposites, the cyclic voltammetry tests revealed that all PANI-EB/Starch biocomposites possess improved redox exchange properties. Finally, the weak interactions at the atomic-level interactions between amylopectin–aniline and amylopectin–PANI were disclosed by the computational studies using DFT, COSMO-RS, and AIM methods. Keywords: biocomposites; polyaniline colloids; starch; steric stabilizer; cyclic voltammetry; DFT; AIM study; COSMO-RS 1. Introduction A variety of reports have emerged in recent decades documenting the use of sterically stabilized colloidal dispersions of conductive polymers, which are much more process- able than traditional ones [1]. In the case of dispersion polymerization, and when the reaction medium contains a soluble stabilizer, the macroscopic aggregation and precip- itation of the resulting conductive polymers can be avoided, leading to submicrometer well-dispersed particles [2]. In this context, several water-soluble polymers, such as cel- lulosic derivatives [3,4], poly(vinyl alcohol) [5], poly(ethylene oxide) [6], and poly(methyl vinyl ether) [7], were used as steric stabilizers to overcome the processing hardness of Polymers 2022, 14, 1505. https://doi.org/10.3390/polym14081505 https://www.mdpi.com/journal/polymers

Welcome message from author
This document is posted to help you gain knowledge. Please leave a comment to let me know what you think about it! Share it to your friends and learn new things together.
Transcript
�����������������
Citation: Boudjelida, S.; Djellali, S.;
Ferkous, H.; Benguerba, Y.;
Chikouche, I.; Carraro, M.
Physicochemical Properties and
Atomic-Scale Interactions in
Polyaniline (Emeraldine Base)/Starch
Bio-Based Composites: Experimental
and Computational Investigations.
Polymers 2022, 14, 1505. https://
doi.org/10.3390/polym14081505
Academic Editors: Evgenia G.
Korzhikova-Vlakh and Pablo
Marcelo Stefani
Received: 28 January 2022
Accepted: 4 April 2022
Published: 7 April 2022
Publisher’s Note: MDPI stays neutral
with regard to jurisdictional claims in
published maps and institutional affil-
iations.
Copyright: © 2022 by the authors.
Licensee MDPI, Basel, Switzerland.
This article is an open access article
distributed under the terms and
conditions of the Creative Commons
Attribution (CC BY) license (https://
creativecommons.org/licenses/by/
4.0/).
polymers
Article
Physicochemical Properties and Atomic-Scale Interactions inPolyaniline (Emeraldine Base)/Starch Bio-Based Composites:Experimental and Computational InvestigationsSoufiane Boudjelida 1,2, Souad Djellali 3,4,* , Hana Ferkous 5,6 , Yacine Benguerba 7 , Imane Chikouche 8
and Mauro Carraro 2,9,*
1 Laboratory LMSE, University Mohamed El Bachir El Ibrahimi, Bordj Bou Arreridj 34030, Algeria;[email protected]
2 Department of Chemical Sciences, University of Padova, Via Marzolo 1, 35131 Padova, Italy3 Laboratoire de Physico-Chimie des Hauts Polymères, University Ferhat Abbas Setif-1, Setif 19000, Algeria4 Department of Chemistry, Faculty of Sciences, University Ferhat Abbas Setif-1, Setif 19000, Algeria5 Laboratoire de Génie mécanique et Matériaux, Faculté de Technologie, Université de 20 août 1955 de Skikda,
Skikda 21000, Algeria; [email protected] Département de Technologie, Université de 20 août 1955 de Skikda, Skikda 21000, Algeria7 Department of Process Engineering, Faculty of Technology, University Ferhat Abbas Setif 1,
Setif 19000, Algeria; [email protected] Laboratoire Croissance et Caractérisation de Nouveaux Semi-Conducteurs, Faculté de Technologie, Université
Sétif 1, Setif 19000, Algeria; [email protected] ITM-CNR, UoS of Padova, Via Marzolo 1, 35131 Padova, Italy* Correspondence: [email protected] (S.D.); [email protected] (M.C.)
Abstract: The processability of conductive polymers still represents a challenge. The use of potatostarch as a steric stabilizer for the preparation of stable dispersions of polyaniline (emeraldine base,EB) is described in this paper. Biocomposites are obtained by oxidative polymerization of anilinein aqueous solutions containing different ratios of aniline and starch (% w/w). PANI-EB/Starchbiocomposites are subjected to structural analysis (UV-Visible, RAMAN, ATR, XRD), thermal analysis(TGA, DSC), morphological analysis (SEM, Laser Granulometry), and electrochemical analysisusing cyclic voltammetry. The samples were also tested for their solubility using various organicsolvents. The results showed that, with respect to starch particles, PANI/starch biocomposites exhibitan overall decrease in particles size, which improves both their aqueous dispersion and solubilityin organic solvents. Although X-ray diffraction and DSC analyses indicated a loss of crystallinity inbiocomposites, the cyclic voltammetry tests revealed that all PANI-EB/Starch biocomposites possessimproved redox exchange properties. Finally, the weak interactions at the atomic-level interactionsbetween amylopectin–aniline and amylopectin–PANI were disclosed by the computational studiesusing DFT, COSMO-RS, and AIM methods.
Keywords: biocomposites; polyaniline colloids; starch; steric stabilizer; cyclic voltammetry; DFT;AIM study; COSMO-RS
1. Introduction
A variety of reports have emerged in recent decades documenting the use of stericallystabilized colloidal dispersions of conductive polymers, which are much more process-able than traditional ones [1]. In the case of dispersion polymerization, and when thereaction medium contains a soluble stabilizer, the macroscopic aggregation and precip-itation of the resulting conductive polymers can be avoided, leading to submicrometerwell-dispersed particles [2]. In this context, several water-soluble polymers, such as cel-lulosic derivatives [3,4], poly(vinyl alcohol) [5], poly(ethylene oxide) [6], and poly(methylvinyl ether) [7], were used as steric stabilizers to overcome the processing hardness of
Polymers 2022, 14, 1505. https://doi.org/10.3390/polym14081505 https://www.mdpi.com/journal/polymers

Polymers 2022, 14, 1505 2 of 22
conductive polymers, which is related to their very low solubility in common solventsand/or infusibility, limiting their applications.
Polyaniline (PANI) is among the most studied and developed organic conductive poly-mers. Its large-scale applications stem from its good redox exchange properties, its simpleand cheap preparation methods as well as its great environmental stability [8,9]. However,as with other conductive polymers, polyaniline is very difficult to be processed and thepreparation of colloidal PANI-based dispersions seems to be a promising way to overcomesuch a problem [10]. Several workers have taken advantage of this approach to produceprocessable dispersions including PANI/poly(methyl methacrylate) particles stabilized inhydrocarbons [11], PANI stabilized with partially hydrolyzed poly(vinyl alcohol) [12] orwith poly(N-vinylpyrrolidone) [13], and PANI/hydroxypropyl cellulose [14].
Numerous studies were also conducted to exploit biopolymers issued from renew-able natural and agricultural resources, to develop novel bio-composites with conductivepolymers, thus leading to entirely new directions in the research of advanced functional ma-terials for a sustainable future [14,15]. In such a case, the water-soluble or water-dispersiblebiopolymers bind PANI chains and lead to stabilized colloids [16–18]. In this context,the “intelligent behavior” of PANI colloids prepared with chitosan or poly(N-isopropylacrylamide) [19,20], cellulose derivatives [21], nanocellulose [22] and pectin [23,24], assteric stabilizers, was reported.
The resulting biocomposites could not only improve the processability of PANI, butalso enhance its biocompatibility [25–27]. For example, PANI-based materials have beenused for the detection and analysis of bio-molecules (enzymes, antibodies, DNA, proteins,etc.), making them suitable candidates for biomedical applications [25,27,28]. On the otherhand, even if in vivo studies have shown that the emeraldine base form of PANI withelectroactive properties [29] did not provoke inflammatory responses in a rodent model,suggesting good tolerance and bio-/histo-compatibility [30], risks may arise from thepresence of polymerization by-products (benzidine, aniline dimers, and oligomers). Suchby-products, indeed, can be cytotoxic, also with carcinogenic effects. All in all, althoughtheir presence can be avoided by suitable washing steps [31], the use of PANI-basedmaterials still deserves many precautions.
In our work, we have used starch, which is the most abundant polysaccharide pro-duced by higher plants, and it is extracted intracellularly in the form of granules of2–100 µm in diameter [32]. In general, starches are semi-crystalline polymers made ofa mixture of amylose and amylopectin chains, with a crystallinity of about 20–45% [33].
Starch was used by several authors to develop stabilized latexes [34–36]. In thework of Pradeep et al. [34], in particular, flexible semiconducting thin films from purevulcanized natural rubber latex with enhanced electrical conductivity were produced. Otherstarch-stabilized colloids were also developed with bimetallic nanoparticles to improvethe stability and reactivity of nanoparticles [37–39], PLGA (polylactic-co-glycolic acid)nanospheres [40], and PMMA (polymethylmethacrylate) lattices [41].
The usage of starch as a non-toxic and biodegradable biopolymer to elaborate PANI-based composites has led to the formation of advanced functional materials for variousapplications (water remediation, energy generation, and storage, electrochemical, medicaland biomedical applications, etc.) [15,42–46]. In the same framework, we have attemptedto elaborate water dispersible and processable polyaniline using starch as a steric stabi-lizer. The oxidative chemical polymerization of polyaniline was performed in an aqueoussolution containing various ratios of aniline to starch (w/w). The obtained PANI/starchbiocomposites were characterized by spectroscopic, microscopic, thermal, and electro-chemical techniques, in order to assess the most promising PANI: starch ratio. Moreover,computational calculations based on DFT were carried out to find missing informationabout the interactions between starch–aniline and starch–polyaniline during the synthesisand in the final form of the biocomposites.
Polymers 2022, 14, 1505 3 of 22
2. Materials and Methods2.1. Synthesis of PANI/Starch Biocomposites
Polyaniline/starch materials (Table 1) were prepared by in situ polymerization ofaniline in the presence of aqueous starch solutions under magnetic stirring. In a typicalprocedure [47], in a three-necked flask, aniline was added to the aqueous dispersions ofstarch at various ratios of aniline: starch (w/w) at room temperature (20 ◦C) and stirred for4 h. The chemical polymerization of aniline was carried out at low temperatures in an icebath (T~0–4 ◦C) using an APS (ammonium persulfate) oxidative solution. The mixture wasmaintained under magnetic stirring for 3 h, then left without stirring for 48 h to allow themajority of aniline to react, after which the dark powder obtained was filtered, washedwith water and acetone to remove low-molecular-weight reaction by-products, i.e., anilinedimers and oligomers, then dried at 40 ◦C for 48 h.
Table 1. Codes of the synthesized biocomposites.
Codes M11 M21 M31
Aniline/Starch (w/w) ratio 1:1 2:1 3:1
2.2. Characterization
Structural characterization of samples was carried out by FTIR spectroscopy usinga Nicolet 5700 spectrometer (Thermo Fisher, Waltham, MA, USA), equipped with a dia-mond ATR sampling accessory, on the powdered material, UV-Visible spectroscopy usinga Cary 5000 UV−vis−NIR spectrometer (Varian, Palo Alto, CA, USA) on solutions preparedby dissolving 2 mg in 10 mL of DMF, and RAMAN spectroscopy using a DXR2 Ramanspectrometer (Thermo Scientific, Madison, WI, USA), operating at 532 nm. The solubilitytests were performed at different temperatures (20, 40, 50, 60, 80 ◦C) by dispersing the sameweight of all materials in 10 mL of solvents, to obtain a dilute concentration (0.2% w/v).The solvents used are water, acetone, methanol, ethanol, glycerol, ethyl acetate, chloro-form, toluene, hexane, cyclohexane, DMSO, and DMF. While colorless supernatants wereobtained with insoluble mixtures, the presence of residual solids, in the case of partiallysoluble mixtures, was observed by a lens.
Homopolymers and biocomposites were subjected to laser granulometry analysisby using a CILAS 1190 analyzer (CPS Us, Inc., Madison, WI, USA). Thermal gravimetricanalyses (with a TGA Q5000 instrument, TA Instruments, Hüllhorst, Germany) wereperformed until 700 ◦C (10 ◦C/min), while DSC (with a TA instrument Q20) was set fromroom temperature to 300 ◦C at 10 ◦C/min, under a nitrogen atmosphere; thermodynamicparameters were calculated by using the software TA Universal Analysis. X-ray diffractionanalysis was performed using CuKα radiation (λ = 1.54 Å) (X’Pert3 Powder apparatus)from 2θ = 10◦ to 60◦, at a scan rate of 0.02 s−1; the peak crystalline areas were determinedby using the X’pert HighScore software. SEM images of the composites were obtained aftermetallization with sputter quorum Q 150R E settings using Quanta 200 apparatus (FEI,Hillsboro, OR, USA). Cyclic voltammetry tests (with PGZ 301 potentiometer, RadiometerAnalytical SAS, Lyon, France) were examined in a three-electrode system constituted ofa reference electrode (Ag/AgCl), an auxiliary platinum electrode, and a carbon electrodeas the working electrode. The electrolyte was a KCl solution (1 M) and the voltammogramswere recorded in a voltage window between −0.8 and +0.8 mV at various scan rates (10, 50,and 100 mV s−1).
3. Computational Study
Geometric optimization of the molecules was performed with the Dmol3 module [48]utilizing a modeling package created by Accelrys Incorporation (Cambridge, UK): MaterialsStudio 2017TM [49], B3LYP functional [50], and DNP basis set (4.4 basis file) [51].
The HOMO (Highest Occupied Molecular Orbital) and LUMO (Lowest UnoccupiedMolecular Orbital) frontier molecular orbitals (FMOs) were investigated [52]. The high
Polymers 2022, 14, 1505 4 of 22
value of the energy ξHOMO justifies the inclination to transfer electrons to a suitable acceptormolecule. In contrast, the low value of the energy ξLUMO justifies the molecule’s capacityto accept electrons from donor molecules [53].
The electronic chemical potential (µ) and global hardness (η) were determined usingthe ξHOMO and ξLUMO energies [54–56]:
µ = (ξHOMO + ξLUMO)/2 (1)
η = (ξLUMO − ξHOMO)/2 (2)
The chemical potential µ is related to the electrophilicity index ω by the followingrelationship [57]:
ω = (µ2)/(2 η) (3)
ω indicates an electrophile’s capacity to gain an extra electrical charge [58].The optimal fraction of transferred electrons (∆N) is given by [59]:
∆N = −µ/η (4)
COSMO-RS (Conductor-like Screening Model for Real Solvents) is a thermodynamic-based quantum chemistry technique for determining chemical potentials in solutions [60].For each species in the solution, this technique can estimate sigma charge densities andchemical potentials. The computation is divided into two parts: first, the molecule wasgeometrically optimized; then, using the COSMOtherm program [61] (p. 2), sigma profilesand sigma potentials were computed using the acquired cosmo-files.
Intermolecular interactions may be calculated using the Atoms in Molecule (AIM)method. The main goal of AIM is to examine the character and strength of the bondinginteraction in molecular systems by using the electron density ρ(r) of the molecules as a tool.Based on the second derivative, ∇^2 ρ(r) sign [62,63], the kind of chemical bonds may beidentified at the bond critical point (BCP) where it is minimum. As a result, if the ρ value islarge and ∇^2 ρ(r) is negative, the bond is covalent (polar). On the other hand, positive∇^2 ρ(r) indicates that the kinetic energy G(r) is greater than the potential energy V(r) [64].The |V|/G ratio indicates that the system’s ability to group electrons, V(r), and its abilityto dilute them through electronic mobility, G(r), compete within the system. As a result,the ratio |V|/G > 1 indicates that an excess of electric charges is utilized to generatethe interaction, whereas |V|/G < 1 indicates the opposite. The total energy density,H(r) = V(r) + G(r), in the first situation, has a negative value, whereas in the second case, ithas a positive value. Thus, the categorization of interactions is based on the values of thatindicator: (i) pure interactions with closed layers, |V|/G < 1; (ii) interactions with closedlayers, 1 < |V|/G < 2; and (iii) interactions with the shared layer, |V|/G > 2. The firsttwo forms of interaction are ascribed to hydrogen bonding, whereas the third type isa covalent interaction. Furthermore, positive, ∇^2 ρ(r), and H values indicate electrostaticcontact, whereas negative values indicate a covalent bond. A partly covalent bond isdefined as a positive ∇^2 ρ(r) combined with a negative H value [65].
The Amsterdam Density Functional (ADF) program [66,67] was used to performAIM calculations. For molecular structure optimization, the DFT method was employed.The AIM research [67,68] used the def-TZVP basis set to describe exchange correlationeffects between these variables (Becke 3-Parameter, Lee, Yang, and Parr).
4. Results and Discussion4.1. Physico-Chemical Properties
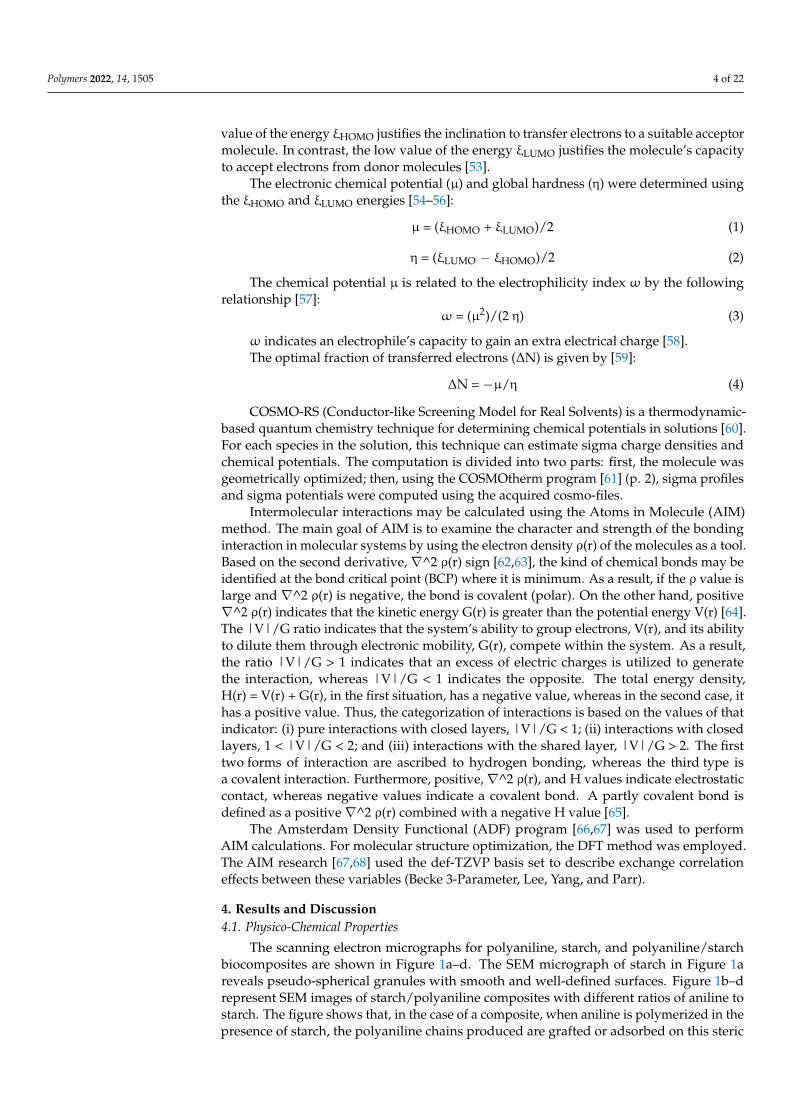
The scanning electron micrographs for polyaniline, starch, and polyaniline/starchbiocomposites are shown in Figure 1a–d. The SEM micrograph of starch in Figure 1areveals pseudo-spherical granules with smooth and well-defined surfaces. Figure 1b–drepresent SEM images of starch/polyaniline composites with different ratios of aniline tostarch. The figure shows that, in the case of a composite, when aniline is polymerized in thepresence of starch, the polyaniline chains produced are grafted or adsorbed on this steric
Polymers 2022, 14, 1505 5 of 22
stabilizer. At the lowest concentration of aniline, the surface of the starch granules is rougherthan that of pure starch, suggesting that aniline polymerization occurs on the surface ofthe granules of starch, forming an irregular coating over it [42,47]. However, as theconcentration of aniline increases, more of the starch surface is covered and an overgrowthof polyaniline is observed over the starch particles [45].
Polymers 2022, 14, x FOR PEER REVIEW 5 of 22
pseudo-spherical granules with smooth and well-defined surfaces. Figure 1b–d represent SEM images of starch/polyaniline composites with different ratios of aniline to starch. The figure shows that, in the case of a composite, when aniline is polymerized in the presence of starch, the polyaniline chains produced are grafted or adsorbed on this steric stabilizer. At the lowest concentration of aniline, the surface of the starch granules is rougher than that of pure starch, suggesting that aniline polymerization occurs on the surface of the granules of starch, forming an irregular coating over it [42,47]. However, as the concen-tration of aniline increases, more of the starch surface is covered and an overgrowth of polyaniline is observed over the starch particles [45].
Figure 1. SEM images of (a): starch, (b) PANI and PANI/starch biocomposites. (c): (1:1) and (d): (3:1).
From the analysis of particle size by laser granulometry, it can be seen that the parti-cles of the obtained PANI/starch materials exhibit a wide distribution of particle sizes re-vealing a high polydispersity of particles (relative mean variance of the particle size dis-tribution), which may indicate the occurrence of some aggregation of the biocomposites particles [69]. This statement is consistent with the findings of other authors [70,71]. Fur-thermore, as shown in Table 2, homopolymers and biocomposites particles exhibit aver-age diameters ranging from 28.8 µm to 68.9 µm. It is also worth noting that all composites possess particle sizes lower than that of polyaniline, whereby the composite with the high-est aniline content exhibits the lowest average diameter. Thus, the growing polyaniline chains may affect the intramolecular forces along the polymer chains of amylose and am-ylopectin, leading to smaller particles [15].
Table 2. Average particle diameters of PANI, STARCH, and PANI/starch biocomposites.
PANI EB Starch M11 M21 M31 Average diameter (µm) 68.9 38.9 40.2 31.5 28.8
Figure 1. SEM images of (a): starch, (b) PANI and PANI/starch biocomposites. (c): (1:1) and (d): (3:1).
From the analysis of particle size by laser granulometry, it can be seen that the particlesof the obtained PANI/starch materials exhibit a wide distribution of particle sizes revealinga high polydispersity of particles (relative mean variance of the particle size distribution),which may indicate the occurrence of some aggregation of the biocomposites particles [69].This statement is consistent with the findings of other authors [70,71]. Furthermore, asshown in Table 2, homopolymers and biocomposites particles exhibit average diametersranging from 28.8 µm to 68.9 µm. It is also worth noting that all composites possess particlesizes lower than that of polyaniline, whereby the composite with the highest aniline contentexhibits the lowest average diameter. Thus, the growing polyaniline chains may affect theintramolecular forces along the polymer chains of amylose and amylopectin, leading tosmaller particles [15].
Table 2. Average particle diameters of PANI, STARCH, and PANI/starch biocomposites.
PANI EB Starch M11 M21 M31
Average diameter (µm) 68.9 38.9 40.2 31.5 28.8
The capacity of the various solvents (water, acetone, methanol, ethanol, glycerol,ethyl acetate, chloroform, toluene, hexane, cyclohexane, DMSO, and DMF) to dissolvethe prepared materials was examined at different temperatures. The results obtained(Table 3) revealed that PANI-EB, starch, and PANI-EB/starch composites are insoluble in
Polymers 2022, 14, 1505 6 of 22
the majority of the solvents used even at high temperatures (80 ◦C). However, starch issoluble in DMSO but slightly soluble in water and DMF, whereas PANI-EB is slightly solublein DMSO and soluble in DMF, and it is well known that it is not soluble in most commonsolvents [72]. The solubility behavior of PANI-EB/starch biocomposites differed from thatof homopolymers where we noticed a good solubility in DMF and DMSO and an enhanceddispersion in water at 20–40 ◦C before more homogeneous mixtures were achieved athigher temperatures (60–80 ◦C). A further enhancement in the solubility was observedwith glycerol and chloroform mainly at higher temperatures (>40 ◦C) with good dispersionsat low temperatures. These findings indicate that the surfaces of the products have, atdifferent temperatures, different affinities for each solvent. Nevertheless, the remainingsolvents were not able to dissolve or even disperse PANI/starch biocomposites.
Table 3. Solubility test of PANI, STARCH, and PANI/starch biocomposites.
T ◦C Materials Acetone Methanol Ethanol Glycerol Ethyl Acetate Chloro-Form Toluene Hexane Cyclohexane DMSO Water DMF
20
M11 ∆ ∆ ∆ ∆ ∆ ∆ ∆ ∆ ∆ O ∆ XM21 ∆ ∆ ∆ ∆ ∆ ∆ ∆ ∆ ∆ O ∆ XM31 ∆ ∆ ∆ ∆ ∆ ∆ ∆ ∆ ∆ O ∆ X
PANI EB ∆ ∆ ∆ ∆ ∆ ∆ ∆ ∆ ∆ O ∆ XStarch ∆ ∆ ∆ ∆ ∆ ∆ ∆ ∆ ∆ X O O
40
M11 ∆ ∆ ∆ ∆ ∆ ∆ ∆ ∆ ∆ X ∆ XM21 ∆ ∆ ∆ ∆ ∆ ∆ ∆ ∆ ∆ X ∆ XM31 ∆ ∆ ∆ ∆ ∆ ∆ ∆ ∆ ∆ X ∆ X
PANI EB ∆ ∆ ∆ ∆ ∆ ∆ ∆ ∆ ∆ X ∆ XStarch ∆ ∆ ∆ ∆ ∆ ∆ ∆ ∆ ∆ X O O
60
M11 - ∆ ∆ O ∆ O ∆ ∆ ∆ X ∆ XM21 - ∆ ∆ O ∆ O ∆ ∆ ∆ X ∆ XM31 - ∆ ∆ O ∆ O ∆ ∆ ∆ X ∆ X
PANI EB - ∆ ∆ ∆ ∆ ∆ ∆ ∆ ∆ X ∆ XStarch - ∆ ∆ ∆ ∆ ∆ ∆ ∆ ∆ X X O
80
M11 - - - O ∆ - ∆ ∆ ∆ X ∆ XM21 - - - O ∆ - ∆ ∆ ∆ X ∆ XM31 - - - O ∆ - ∆ ∆ ∆ X ∆ X
PANI EB - - - ∆ ∆ - ∆ ∆ ∆ X ∆ XStarch - - - ∆ ∆ - ∆ ∆ ∆ X X X
∆: non-soluble, O: slightly (soluble/dispersion), X: soluble/good dispersion, -: evaporation of the solvents.
4.2. Structural Characterization
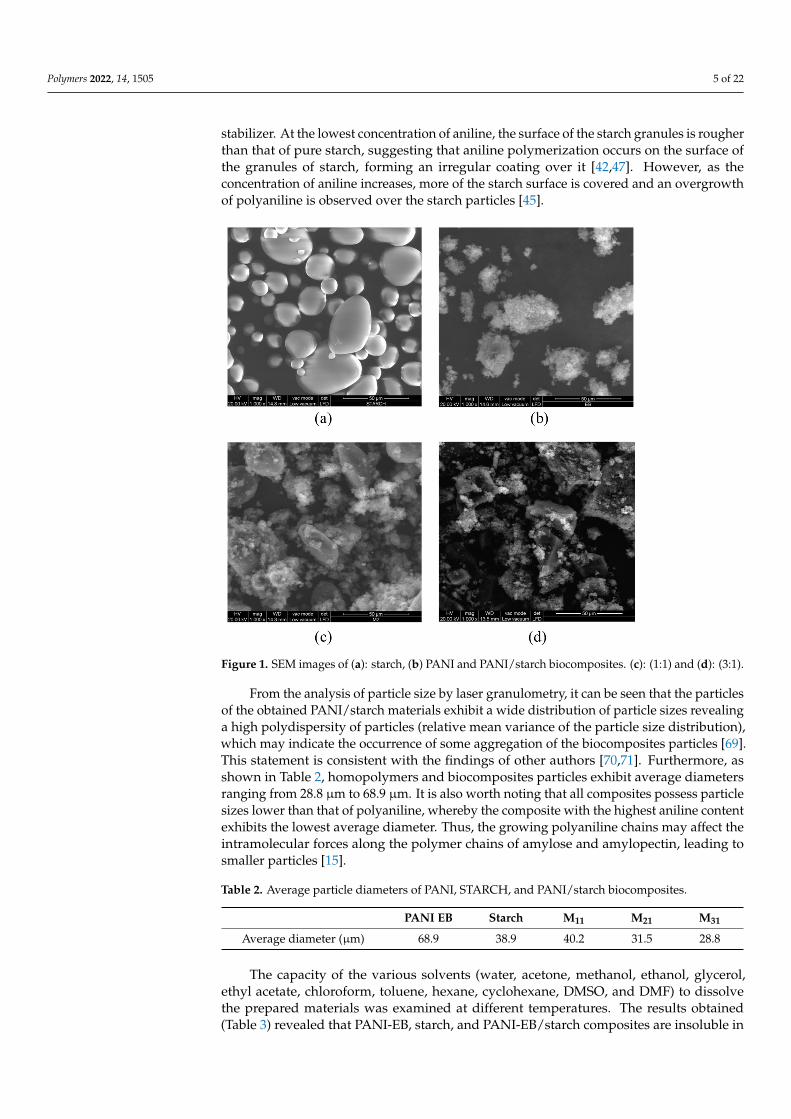
The UV-visible, FTIR, and RAMAN spectra of our products are shown in Figures 2–4,respectively. The UV-visible absorption spectra in Figure 2 display two broad absorptionbands around 315–360 nm and 560–600 nm for all composites, which confirm the occurrenceof the PANI-EB backbone structure. The first peak is assigned to π–π* transition occurringfrom the highest occupied molecular orbital to the lowest unoccupied molecular orbitalof the amine benzenoid rings, while the second peak is ascribed to benzenoid–quinoidrings’ charge transfer [73]. The difference in the relative intensities of the peaks observedcan be due to the variation in the quantities of benzenoid and quinoid units present in thematerials as the ratio of aniline to starch varies. Moreover, the red shift for the 3:1 samplemay be due to a higher amount of longer chains as well as to a growing contribution ofa less oxidized form of PANI [74,75].
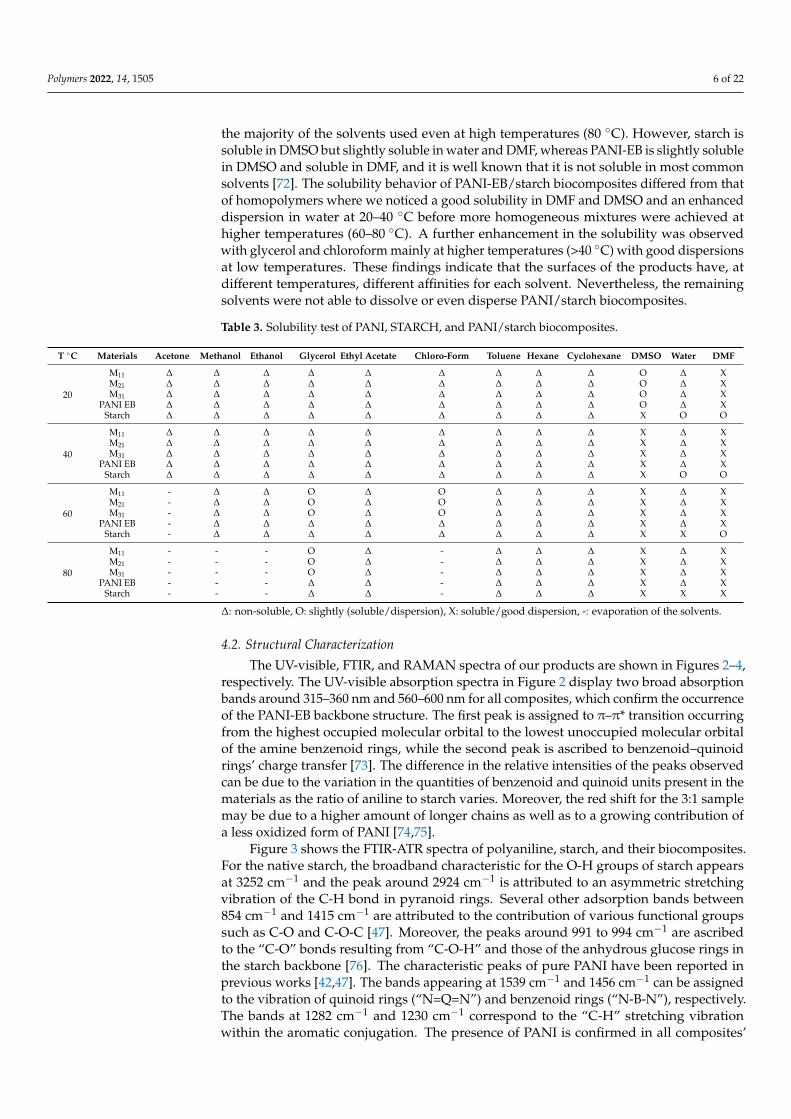
Figure 3 shows the FTIR-ATR spectra of polyaniline, starch, and their biocomposites.For the native starch, the broadband characteristic for the O-H groups of starch appearsat 3252 cm−1 and the peak around 2924 cm−1 is attributed to an asymmetric stretchingvibration of the C-H bond in pyranoid rings. Several other adsorption bands between854 cm−1 and 1415 cm−1 are attributed to the contribution of various functional groupssuch as C-O and C-O-C [47]. Moreover, the peaks around 991 to 994 cm−1 are ascribedto the “C-O” bonds resulting from “C-O-H” and those of the anhydrous glucose rings inthe starch backbone [76]. The characteristic peaks of pure PANI have been reported inprevious works [42,47]. The bands appearing at 1539 cm−1 and 1456 cm−1 can be assignedto the vibration of quinoid rings (“N=Q=N”) and benzenoid rings (“N-B-N”), respectively.The bands at 1282 cm−1 and 1230 cm−1 correspond to the “C-H” stretching vibrationwithin the aromatic conjugation. The presence of PANI is confirmed in all composites’
Polymers 2022, 14, 1505 7 of 22
spectra in which PANI and starch are present at different concentrations. As PANI ismore exposed on the surface of the particles, its signals dominate the spectra; moreover,the strong interaction between the chains may be responsible for the disappearance of sometypical starch bands [77].
Polymers 2022, 14, x FOR PEER REVIEW 7 of 22
Figure 2. UV-vis spectra of PANI, starch, and PANI/starch biocomposites in DMF.
Figure 3 shows the FTIR-ATR spectra of polyaniline, starch, and their biocomposites. For the native starch, the broadband characteristic for the O-H groups of starch appears at 3252 cm−1 and the peak around 2924 cm−1 is attributed to an asymmetric stretching vi-bration of the C-H bond in pyranoid rings. Several other adsorption bands between 854 cm−1 and 1415 cm−1 are attributed to the contribution of various functional groups such as C-O and C-O-C [47]. Moreover, the peaks around 991 to 994 cm−1 are ascribed to the “C-O” bonds resulting from “C-O-H” and those of the anhydrous glucose rings in the starch backbone [76]. The characteristic peaks of pure PANI have been reported in previous works [42,47]. The bands appearing at 1539 cm−1 and 1456 cm−1 can be assigned to the vibration of quinoid rings (“N=Q=N”) and benzenoid rings (“N-B-N”), respectively. The bands at 1282 cm−1 and 1230 cm−1 correspond to the “C-H” stretching vibration within the aromatic conjugation. The presence of PANI is confirmed in all composites’ spectra in which PANI and starch are present at different concentrations. As PANI is more exposed on the surface of the particles, its signals dominate the spectra; moreover, the strong in-teraction between the chains may be responsible for the disappearance of some typical starch bands [77].
Figure 3. FTIR-ATR spectra of PANI, starch, and PANI/starch biocomposites. The residual CO2 sig-nal may be due to the adsorption properties of PANI.
3500 3000 2500 2000 1500 1000 500
%T
Wavenumber (Cm-1)
M31
M21
M11
Starch PANI
Wavenumber (cm-1)
Tran
smitt
ance
(a.u
.)
Figure 2. UV-vis spectra of PANI, starch, and PANI/starch biocomposites in DMF.
Polymers 2022, 14, x FOR PEER REVIEW 7 of 22
Figure 2. UV-vis spectra of PANI, starch, and PANI/starch biocomposites in DMF.
Figure 3 shows the FTIR-ATR spectra of polyaniline, starch, and their biocomposites. For the native starch, the broadband characteristic for the O-H groups of starch appears at 3252 cm−1 and the peak around 2924 cm−1 is attributed to an asymmetric stretching vi-bration of the C-H bond in pyranoid rings. Several other adsorption bands between 854 cm−1 and 1415 cm−1 are attributed to the contribution of various functional groups such as C-O and C-O-C [47]. Moreover, the peaks around 991 to 994 cm−1 are ascribed to the “C-O” bonds resulting from “C-O-H” and those of the anhydrous glucose rings in the starch backbone [76]. The characteristic peaks of pure PANI have been reported in previous works [42,47]. The bands appearing at 1539 cm−1 and 1456 cm−1 can be assigned to the vibration of quinoid rings (“N=Q=N”) and benzenoid rings (“N-B-N”), respectively. The bands at 1282 cm−1 and 1230 cm−1 correspond to the “C-H” stretching vibration within the aromatic conjugation. The presence of PANI is confirmed in all composites’ spectra in which PANI and starch are present at different concentrations. As PANI is more exposed on the surface of the particles, its signals dominate the spectra; moreover, the strong in-teraction between the chains may be responsible for the disappearance of some typical starch bands [77].
Figure 3. FTIR-ATR spectra of PANI, starch, and PANI/starch biocomposites. The residual CO2 sig-nal may be due to the adsorption properties of PANI.
3500 3000 2500 2000 1500 1000 500
%T
Wavenumber (Cm-1)
M31
M21
M11
Starch PANI
Wavenumber (cm-1)
Tran
smitt
ance
(a.u
.)
Figure 3. FTIR-ATR spectra of PANI, starch, and PANI/starch biocomposites. The residual CO2
signal may be due to the adsorption properties of PANI.
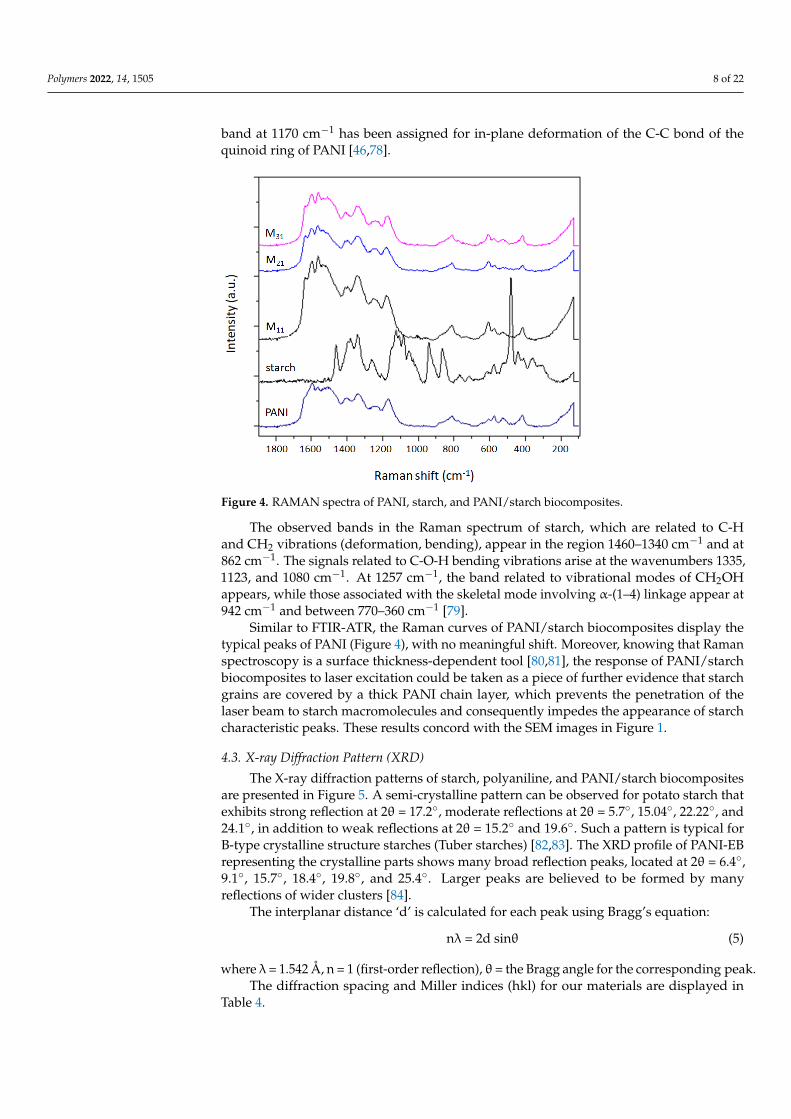
The Raman spectra of PANI, starch, and their biocomposites, obtained using an excitingwavelength of 532 nm, are displayed in Figure 4. This method is very efficient for under-standing the interaction among various components and provides information about thechemical structure of different domains in the composite systems.
From the spectrum of PANI, we can observe some characteristic bands rinsing fromcarbon–carbon, carbon–hydrogen, and carbon–nitrogen vibration modes. Benzenoid ringsexhibited C-C stretching modes between 1520 cm−1 and 1650 cm−1 and C-H bendingmodes between 1100 cm−1 and 1210 cm−1; however, quinoid rings give rise to C=N, andC-C ring stretching vibrations, which appeared at 1382 cm−1 and 1595 cm−1, respectively.Further bands are observed in the region 1210–1520 cm−1 for C-N stretching modes (amines,imines) and in the region 1100–1140 cm−1 characteristic of the PANI backbone. A weak
Polymers 2022, 14, 1505 8 of 22
band at 1170 cm−1 has been assigned for in-plane deformation of the C-C bond of thequinoid ring of PANI [46,78].
Polymers 2022, 14, x FOR PEER REVIEW 8 of 22
The Raman spectra of PANI, starch, and their biocomposites, obtained using an ex-citing wavelength of 532 nm, are displayed in Figure 4. This method is very efficient for understanding the interaction among various components and provides information about the chemical structure of different domains in the composite systems.
From the spectrum of PANI, we can observe some characteristic bands rinsing from carbon–carbon, carbon–hydrogen, and carbon–nitrogen vibration modes. Benzenoid rings exhibited C-C stretching modes between 1520 cm−1 and 1650 cm−1 and C-H bending modes between 1100 cm−1 and 1210 cm−1; however, quinoid rings give rise to C=N, and C-C ring stretching vibrations, which appeared at 1382 cm−1 and 1595 cm−1, respectively. Fur-ther bands are observed in the region 1210–1520 cm−1 for C-N stretching modes (amines, imines) and in the region 1100–1140 cm−1 characteristic of the PANI backbone. A weak band at 1170 cm−1 has been assigned for in-plane deformation of the C-C bond of the quin-oid ring of PANI [46,78].
The observed bands in the Raman spectrum of starch, which are related to C-H and CH2 vibrations (deformation, bending), appear in the region 1460–1340 cm−1 and at 862 cm−1. The signals related to C-O-H bending vibrations arise at the wavenumbers 1335, 1123, and 1080 cm−1. At 1257 cm−1, the band related to vibrational modes of CH2OH ap-pears, while those associated with the skeletal mode involving α-(1–4) linkage appear at 942 cm−1 and between 770–360 cm−1[79].
Similar to FTIR-ATR, the Raman curves of PANI/starch biocomposites display the typical peaks of PANI (Figure 4), with no meaningful shift. Moreover, knowing that Ra-man spectroscopy is a surface thickness-dependent tool [80,81], the response of PANI/starch biocomposites to laser excitation could be taken as a piece of further evidence that starch grains are covered by a thick PANI chain layer, which prevents the penetration of the laser beam to starch macromolecules and consequently impedes the appearance of starch characteristic peaks. These results concord with the SEM images in Figure 1.
Figure 4. RAMAN spectra of PANI, starch, and PANI/starch biocomposites.
4.3. X-ray Diffraction Pattern (XRD) The X-ray diffraction patterns of starch, polyaniline, and PANI/starch biocomposites
are presented in Figure 5. A semi-crystalline pattern can be observed for potato starch that exhibits strong reflection at 2θ = 17.2°, moderate reflections at 2θ = 5.7°, 15.04°, 22.22°, and 24.1°, in addition to weak reflections at 2θ = 15.2° and 19.6°. Such a pattern is typical for
Figure 4. RAMAN spectra of PANI, starch, and PANI/starch biocomposites.
The observed bands in the Raman spectrum of starch, which are related to C-Hand CH2 vibrations (deformation, bending), appear in the region 1460–1340 cm−1 and at862 cm−1. The signals related to C-O-H bending vibrations arise at the wavenumbers 1335,1123, and 1080 cm−1. At 1257 cm−1, the band related to vibrational modes of CH2OHappears, while those associated with the skeletal mode involving α-(1–4) linkage appear at942 cm−1 and between 770–360 cm−1 [79].
Similar to FTIR-ATR, the Raman curves of PANI/starch biocomposites display thetypical peaks of PANI (Figure 4), with no meaningful shift. Moreover, knowing that Ramanspectroscopy is a surface thickness-dependent tool [80,81], the response of PANI/starchbiocomposites to laser excitation could be taken as a piece of further evidence that starchgrains are covered by a thick PANI chain layer, which prevents the penetration of thelaser beam to starch macromolecules and consequently impedes the appearance of starchcharacteristic peaks. These results concord with the SEM images in Figure 1.
4.3. X-ray Diffraction Pattern (XRD)
The X-ray diffraction patterns of starch, polyaniline, and PANI/starch biocompositesare presented in Figure 5. A semi-crystalline pattern can be observed for potato starch thatexhibits strong reflection at 2θ = 17.2◦, moderate reflections at 2θ = 5.7◦, 15.04◦, 22.22◦, and24.1◦, in addition to weak reflections at 2θ = 15.2◦ and 19.6◦. Such a pattern is typical forB-type crystalline structure starches (Tuber starches) [82,83]. The XRD profile of PANI-EBrepresenting the crystalline parts shows many broad reflection peaks, located at 2θ = 6.4◦,9.1◦, 15.7◦, 18.4◦, 19.8◦, and 25.4◦. Larger peaks are believed to be formed by manyreflections of wider clusters [84].
The interplanar distance ‘d’ is calculated for each peak using Bragg’s equation:
nλ = 2d sinθ (5)
where λ = 1.542 Å, n = 1 (first-order reflection), θ = the Bragg angle for the corresponding peak.The diffraction spacing and Miller indices (hkl) for our materials are displayed in
Table 4.

Polymers 2022, 14, 1505 9 of 22
Polymers 2022, 14, x FOR PEER REVIEW 9 of 22
B-type crystalline structure starches (Tuber starches) [82,83]. The XRD profile of PANI-EB representing the crystalline parts shows many broad reflection peaks, located at 2θ = 6.4°, 9.1°, 15.7°, 18.4°, 19.8°, and 25.4°. Larger peaks are believed to be formed by many reflec-tions of wider clusters [84].
Figure 5. XRD diffractograms of starch, PANI, and PANI/starch biocomposites.
The interplanar distance ‘d’ is calculated for each peak using Bragg’s equation:
nλ = 2d sinθ (5)
where λ = 1.542 Å, n = 1 (first-order reflection), θ = the Bragg angle for the corresponding peak.
The diffraction spacing and Miller indices (hkl) for our materials are displayed in Table 4.
Table 4. Miller indices and diffraction spacing “d” of starch and PANI-EB.
Product 2θ (°) hkl d (Å)
PANI-EB
6.4 (001), (0–11) 13.81 9.1 (021), (0–21), (003) 9.72
15.7 (023), (030) 5.64 19.8 (0–13), (−113) 4.48 25.4 (1–24), (0–16) 3.51
Starch
5.7 (001) 15.51 11.4 (111) 7.76 15.04 (140) 5.89 17.25 (131) 5.14 19.59 (103) 4.53 22.22 (113) 4.00 24.1 (132) 3.69 26.58 (142) 3.35
The values of the degree of crystallinity (Xc%) were obtained as a ratio between the peaks crystalline area and the total area of the XRD pattern under the curve. The following equation is employed [85]:
Figure 5. XRD diffractograms of starch, PANI, and PANI/starch biocomposites.
Table 4. Miller indices and diffraction spacing “d” of starch and PANI-EB.
Product 2θ (◦) hkl d (Å)
PANI-EB
6.4 (001), (0–11) 13.819.1 (021), (0–21), (003) 9.7215.7 (023), (030) 5.6419.8 (0–13), (−113) 4.4825.4 (1–24), (0–16) 3.51
Starch
5.7 (001) 15.5111.4 (111) 7.76
15.04 (140) 5.8917.25 (131) 5.1419.59 (103) 4.5322.22 (113) 4.0024.1 (132) 3.69
26.58 (142) 3.35
The values of the degree of crystallinity (Xc%) were obtained as a ratio between thepeaks crystalline area and the total area of the XRD pattern under the curve. The followingequation is employed [85]:
Xc (%) = Hc/(Hc + Ha) × 100 (6)
where Hc and Ha are the intensities for the crystalline and amorphous profiles.The crystallinity degree values of polyaniline and starch, as well as of biocomposites
are summarized in Table 5. The native starch shows a high crystallinity (37%) whencompared with polyaniline (19%). For PANI–starch biocomposites, a contribution due todifferent starch content can be confirmed. Changes in XRD patterns could be noticed, whichmay reveal alterations in the ultrastructure of the microdomains of PANI and starch mainlydue to changes in the crystallinity. Such an observation is supported by the disappearanceof starch peaks at 2θ = 22.22◦ and 26.58◦ and all PANI-EB peaks. Thus, it appears that theexistence of aniline in the reaction medium and the PANI chains in propagation, partiallydestroy the original crystalline lattice of starch structure, and this is particularly evident forM21 and M31. On the other hand, it seems that polyaniline chains can form an organizedstructure, which is also reflected in the diffractograms, although with a lack of peaksattributed to the PANI-EB crystalline structure.
Polymers 2022, 14, 1505 10 of 22
Table 5. Degree of crystallinity of starch, PANI-EB, and their biocomposites.
Material Degree of Crystallinity (%)
Starch 37M11 28M21 25M31 21
PANI EB 19
4.4. Thermal Characterization
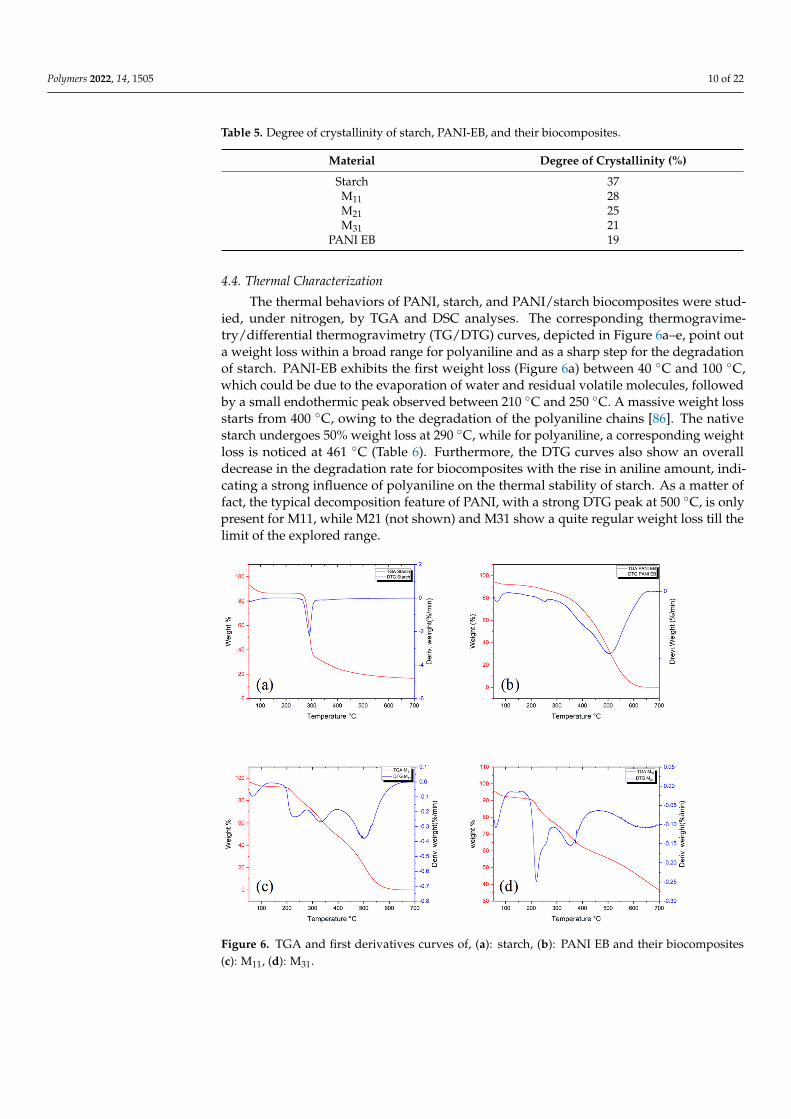
The thermal behaviors of PANI, starch, and PANI/starch biocomposites were stud-ied, under nitrogen, by TGA and DSC analyses. The corresponding thermogravime-try/differential thermogravimetry (TG/DTG) curves, depicted in Figure 6a–e, point outa weight loss within a broad range for polyaniline and as a sharp step for the degradationof starch. PANI-EB exhibits the first weight loss (Figure 6a) between 40 ◦C and 100 ◦C,which could be due to the evaporation of water and residual volatile molecules, followedby a small endothermic peak observed between 210 ◦C and 250 ◦C. A massive weight lossstarts from 400 ◦C, owing to the degradation of the polyaniline chains [86]. The nativestarch undergoes 50% weight loss at 290 ◦C, while for polyaniline, a corresponding weightloss is noticed at 461 ◦C (Table 6). Furthermore, the DTG curves also show an overalldecrease in the degradation rate for biocomposites with the rise in aniline amount, indi-cating a strong influence of polyaniline on the thermal stability of starch. As a matter offact, the typical decomposition feature of PANI, with a strong DTG peak at 500 ◦C, is onlypresent for M11, while M21 (not shown) and M31 show a quite regular weight loss till thelimit of the explored range.
Polymers 2022, 14, x FOR PEER REVIEW 11 of 22
Figure 6. TGA and first derivatives curves of, (a): starch, (b): PANI EB and their biocomposites (c): M11, (d): M31.
Detailed data can be derived from the TGA thermograms, which are related to the thermal stability such as T5, T50, and T95, defined as the temperature at which 5, 50 and 95% of the mass is volatilized, respectively. As observed in Table 6, PANI-EB and biocom-posites are remarkably more stable than starch.
Table 6. Thermal characteristics of PANI, starch, and PANI/starch biocomposites (% weight loss at specific temperatures).
Materials T 5% (°C) T 10% (°C) T 50% (°C) T 95% (°C) Residue (%) at 700 °C PANI EB 50 200 461.3 580.3 0
Starch 50.2 70.2 289.6 - 16.5 M11 66.6 206.9 384.6 552.9 0 M21 53.8 199.3 518.7 - 29.2 M31 56.6 200.1 568.0 - 36.0
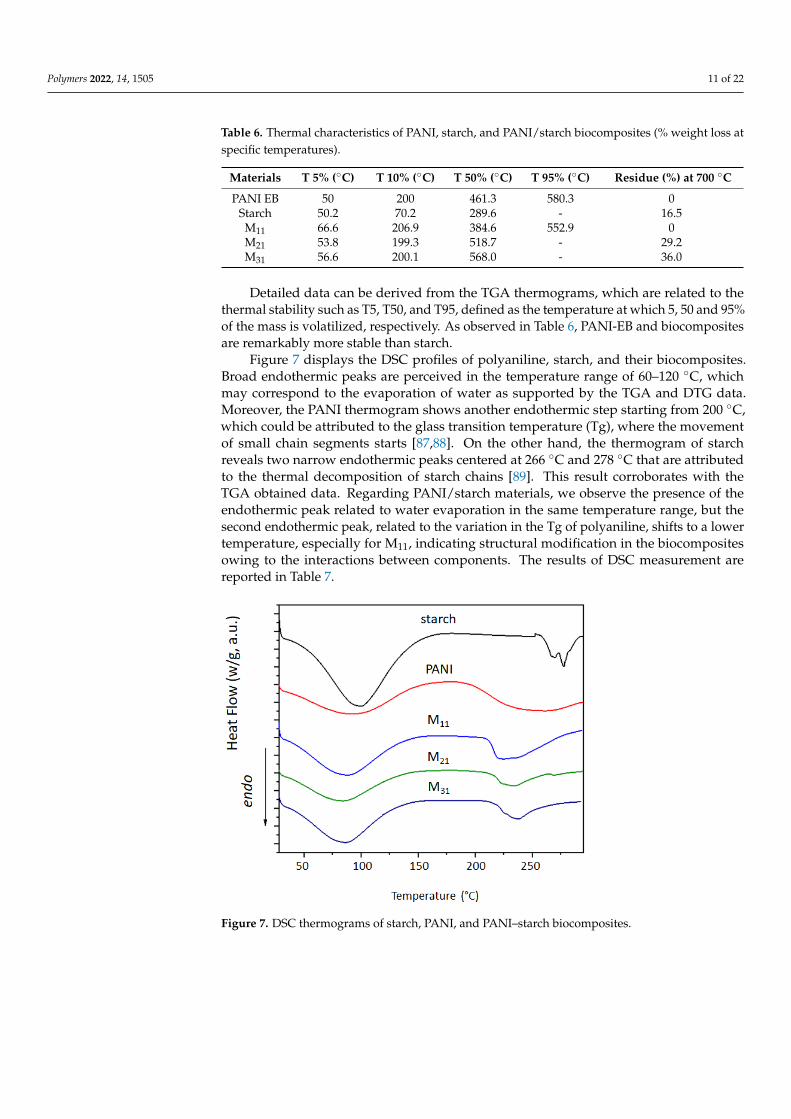
Figure 7 displays the DSC profiles of polyaniline, starch, and their biocomposites. Broad endothermic peaks are perceived in the temperature range of 60–120 °C, which may correspond to the evaporation of water as supported by the TGA and DTG data. Moreo-ver, the PANI thermogram shows another endothermic step starting from 200 °C, which could be attributed to the glass transition temperature (Tg), where the movement of small chain segments starts [87,88]. On the other hand, the thermogram of starch reveals two narrow endothermic peaks centered at 266 °C and 278 °C that are attributed to the thermal decomposition of starch chains [89]. This result corroborates with the TGA obtained data. Regarding PANI/starch materials, we observe the presence of the endothermic peak re-lated to water evaporation in the same temperature range, but the second endothermic peak, related to the variation in the Tg of polyaniline, shifts to a lower temperature, espe-cially for M11, indicating structural modification in the biocomposites owing to the inter-actions between components. The results of DSC measurement are reported in Table 7.
Figure 6. TGA and first derivatives curves of, (a): starch, (b): PANI EB and their biocomposites(c): M11, (d): M31.
Polymers 2022, 14, 1505 11 of 22
Table 6. Thermal characteristics of PANI, starch, and PANI/starch biocomposites (% weight loss atspecific temperatures).
Materials T 5% (◦C) T 10% (◦C) T 50% (◦C) T 95% (◦C) Residue (%) at 700 ◦C
PANI EB 50 200 461.3 580.3 0Starch 50.2 70.2 289.6 - 16.5M11 66.6 206.9 384.6 552.9 0M21 53.8 199.3 518.7 - 29.2M31 56.6 200.1 568.0 - 36.0
Detailed data can be derived from the TGA thermograms, which are related to thethermal stability such as T5, T50, and T95, defined as the temperature at which 5, 50 and 95%of the mass is volatilized, respectively. As observed in Table 6, PANI-EB and biocompositesare remarkably more stable than starch.
Figure 7 displays the DSC profiles of polyaniline, starch, and their biocomposites.Broad endothermic peaks are perceived in the temperature range of 60–120 ◦C, whichmay correspond to the evaporation of water as supported by the TGA and DTG data.Moreover, the PANI thermogram shows another endothermic step starting from 200 ◦C,which could be attributed to the glass transition temperature (Tg), where the movementof small chain segments starts [87,88]. On the other hand, the thermogram of starchreveals two narrow endothermic peaks centered at 266 ◦C and 278 ◦C that are attributedto the thermal decomposition of starch chains [89]. This result corroborates with theTGA obtained data. Regarding PANI/starch materials, we observe the presence of theendothermic peak related to water evaporation in the same temperature range, but thesecond endothermic peak, related to the variation in the Tg of polyaniline, shifts to a lowertemperature, especially for M11, indicating structural modification in the biocompositesowing to the interactions between components. The results of DSC measurement arereported in Table 7.
Polymers 2022, 14, x FOR PEER REVIEW 12 of 22
Figure 7. DSC thermograms of starch, PANI, and PANI–starch biocomposites.
Table 7. Data obtained from DSC thermograms of starch, PANI, and PANI–starch biocomposites.
Material 1st Peak 2nd Peak
Peak (°C) Onset (°C) ∆H (j/g)
Peak (°C) Onset (°C) ∆H (j/g)
M11 88.19 36.89 254.4 255.65 211.94 121.0
M21 84.49 34.28 231.5 233.19 215.19 52.58 270.08 266.57 1.854
M31 68.83 39.02 249.2 237.73 218.07 60.89 PANI EB 94.69 35.33 203.5 234.72 195.81 113.6
Starch 100.01 50.45 439.7 266.36 261.71 9.058 278.10 273.84 15.82
4.5. Cyclic Voltammetry The electroactivity of PANI and PANI-EB/starch composites was studied in the sup-
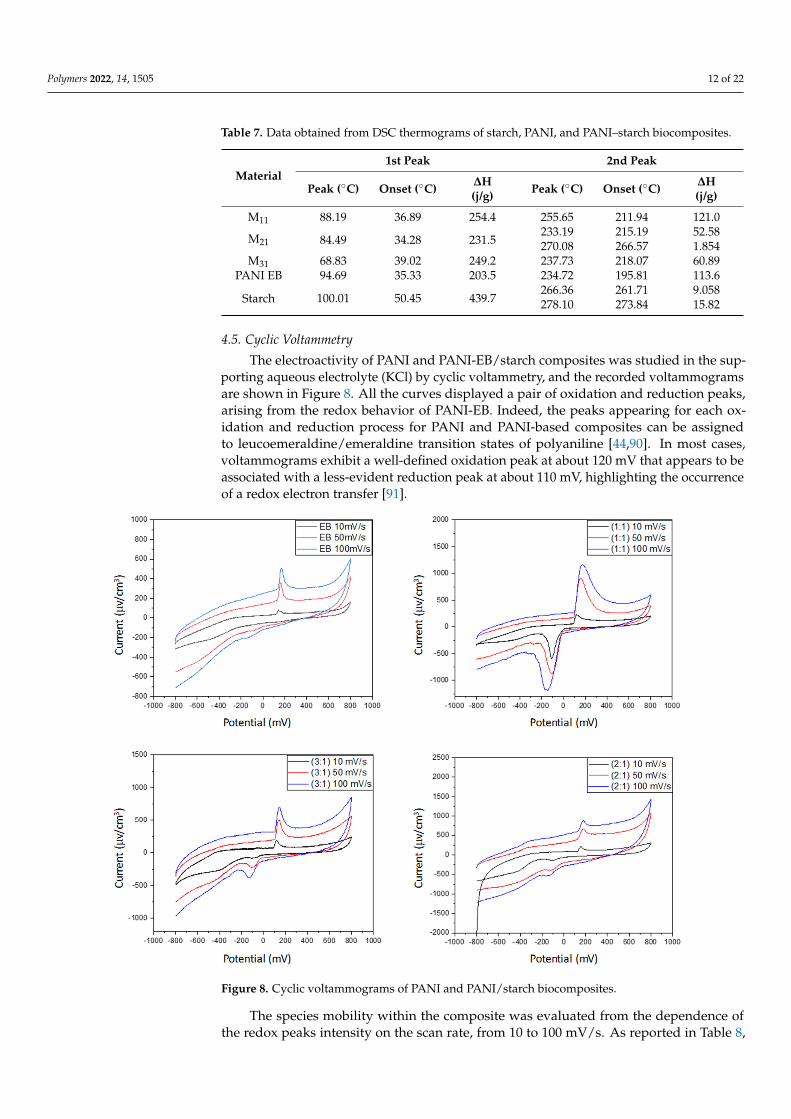
porting aqueous electrolyte (KCl) by cyclic voltammetry, and the recorded voltammo-grams are shown in Figure 8. All the curves displayed a pair of oxidation and reduction peaks, arising from the redox behavior of PANI-EB. Indeed, the peaks appearing for each oxidation and reduction process for PANI and PANI-based composites can be assigned to leucoemeraldine/emeraldine transition states of polyaniline [44,90]. In most cases, volt-ammograms exhibit a well-defined oxidation peak at about 120 mV that appears to be associated with a less-evident reduction peak at about 110 mV, highlighting the occur-rence of a redox electron transfer [91].
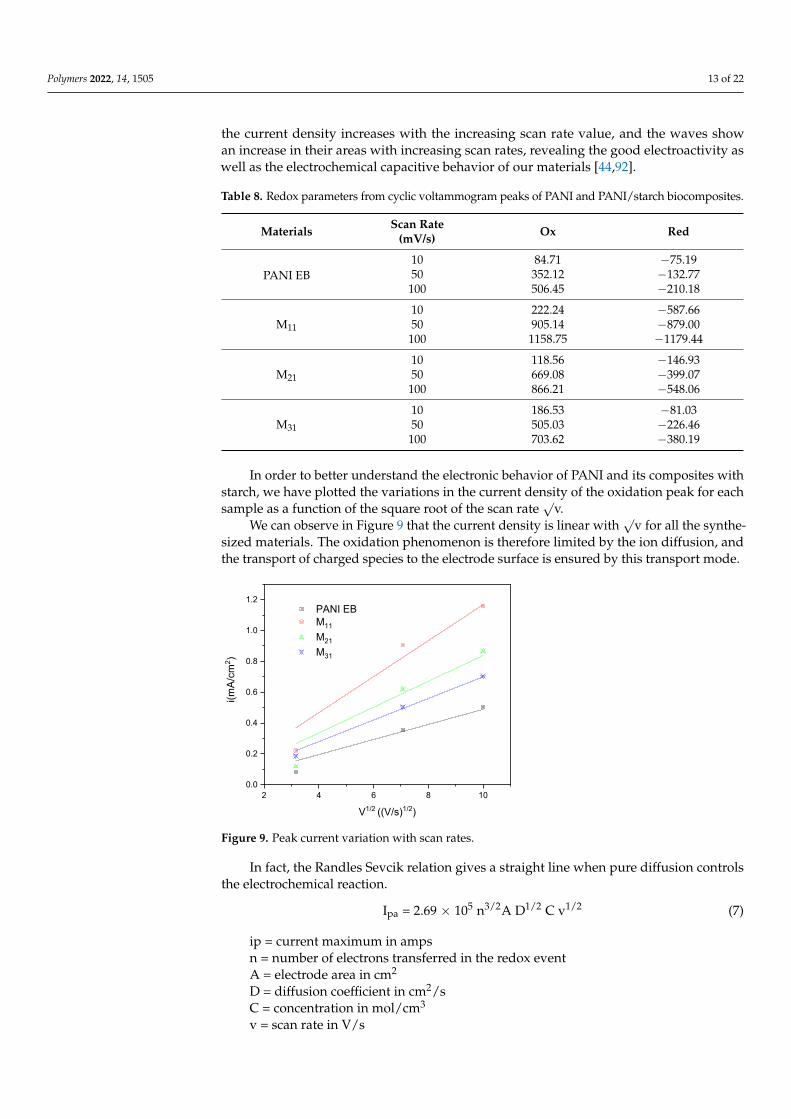
The species mobility within the composite was evaluated from the dependence of the redox peaks intensity on the scan rate, from 10 to 100 mV/s. As reported in Table 8, the current density increases with the increasing scan rate value, and the waves show an in-crease in their areas with increasing scan rates, revealing the good electroactivity as well as the electrochemical capacitive behavior of our materials [44,92].
Figure 7. DSC thermograms of starch, PANI, and PANI–starch biocomposites.
Polymers 2022, 14, 1505 12 of 22
Table 7. Data obtained from DSC thermograms of starch, PANI, and PANI–starch biocomposites.
Material1st Peak 2nd Peak
Peak (◦C) Onset (◦C) ∆H(j/g) Peak (◦C) Onset (◦C) ∆H
(j/g)
M11 88.19 36.89 254.4 255.65 211.94 121.0
M21 84.49 34.28 231.5233.19 215.19 52.58270.08 266.57 1.854
M31 68.83 39.02 249.2 237.73 218.07 60.89PANI EB 94.69 35.33 203.5 234.72 195.81 113.6
Starch 100.01 50.45 439.7266.36 261.71 9.058278.10 273.84 15.82
4.5. Cyclic Voltammetry
The electroactivity of PANI and PANI-EB/starch composites was studied in the sup-porting aqueous electrolyte (KCl) by cyclic voltammetry, and the recorded voltammogramsare shown in Figure 8. All the curves displayed a pair of oxidation and reduction peaks,arising from the redox behavior of PANI-EB. Indeed, the peaks appearing for each ox-idation and reduction process for PANI and PANI-based composites can be assignedto leucoemeraldine/emeraldine transition states of polyaniline [44,90]. In most cases,voltammograms exhibit a well-defined oxidation peak at about 120 mV that appears to beassociated with a less-evident reduction peak at about 110 mV, highlighting the occurrenceof a redox electron transfer [91].
1
Figure 8. Cyclic voltammograms of PANI and PANI/starch biocomposites.
The species mobility within the composite was evaluated from the dependence ofthe redox peaks intensity on the scan rate, from 10 to 100 mV/s. As reported in Table 8,
Polymers 2022, 14, 1505 13 of 22
the current density increases with the increasing scan rate value, and the waves showan increase in their areas with increasing scan rates, revealing the good electroactivity aswell as the electrochemical capacitive behavior of our materials [44,92].
Table 8. Redox parameters from cyclic voltammogram peaks of PANI and PANI/starch biocomposites.
Materials Scan Rate(mV/s) Ox Red
PANI EB10 84.71 −75.1950 352.12 −132.77
100 506.45 −210.18
M11
10 222.24 −587.6650 905.14 −879.00
100 1158.75 −1179.44
M21
10 118.56 −146.9350 669.08 −399.07
100 866.21 −548.06
M31
10 186.53 −81.0350 505.03 −226.46
100 703.62 −380.19
In order to better understand the electronic behavior of PANI and its composites withstarch, we have plotted the variations in the current density of the oxidation peak for eachsample as a function of the square root of the scan rate
√v.
We can observe in Figure 9 that the current density is linear with√
v for all the synthe-sized materials. The oxidation phenomenon is therefore limited by the ion diffusion, andthe transport of charged species to the electrode surface is ensured by this transport mode.
Polymers 2022, 14, x FOR PEER REVIEW 14 of 22
A = electrode area in cm2 D = diffusion coefficient in cm2/s C = concentration in mol/cm3 ν = scan rate in V/s Therefore, it is clear that the PANI synthesized by chemical oxidation polymerization
is a conductor material. Note that according to our results, the M11 sample is the best conductor among these materials.
2 4 6 8 100.0
0.2
0.4
0.6
0.8
1.0
1.2
i(mA/
cm2 )
V1/2 ((V/s)1/2)
PANI EB M11
M21
M31
Figure 9. Peak current variation with scan rates.
4.6. Computational Assessment The main electronic properties calculated for the aniline, PANI, and starch are sum-
marized in Table 9. As amylopectin is the most abundant component (85%) in the starch under investigation, it was considered a suitable model. According to the energy values, comparable values of the aniline isomers ξHOMO and ξLUMO indicate a quasi-equivalent ten-dency to donate or accept electrons. That said, isomers I1 and I2 have the highest values, showing that they are the more probable molecules participating in the polymerization process to produce the PANI chain (this is confirmed by the highest electron escaping tendency from an equilibrium system, µ = −3.027 eV). Both PANI and amylopectin are more reactive than the PANI parent species (isomers I1 or I2) (see Table 9). Regarding the gap values in Table 10, the amylopectin is the most stable in this set of polymers.
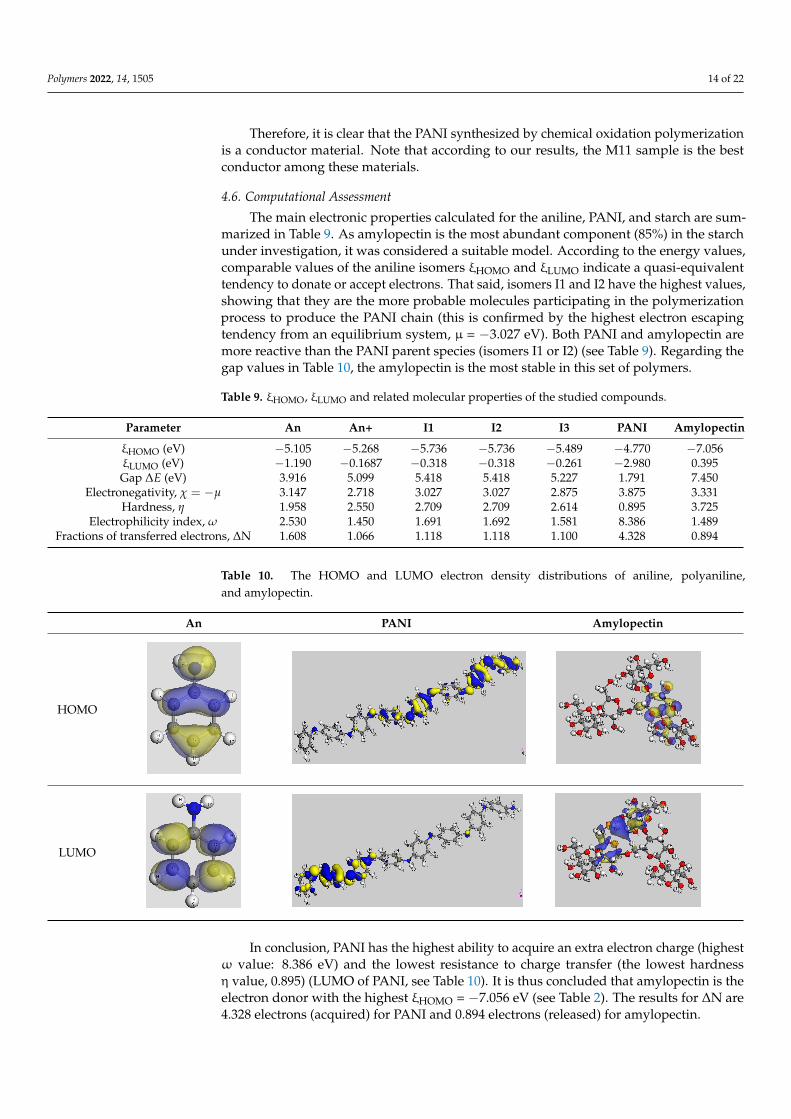
In conclusion, PANI has the highest ability to acquire an extra electron charge (high-est ω value: 8.386 eV) and the lowest resistance to charge transfer (the lowest hardness η value, 0.895) (LUMO of PANI, see Table 10). It is thus concluded that amylopectin is the electron donor with the highest ξHOMO = −7.056 eV (see Table 2). The results for ΔN are 4.328 electrons (acquired) for PANI and 0.894 electrons (released) for amylopectin.
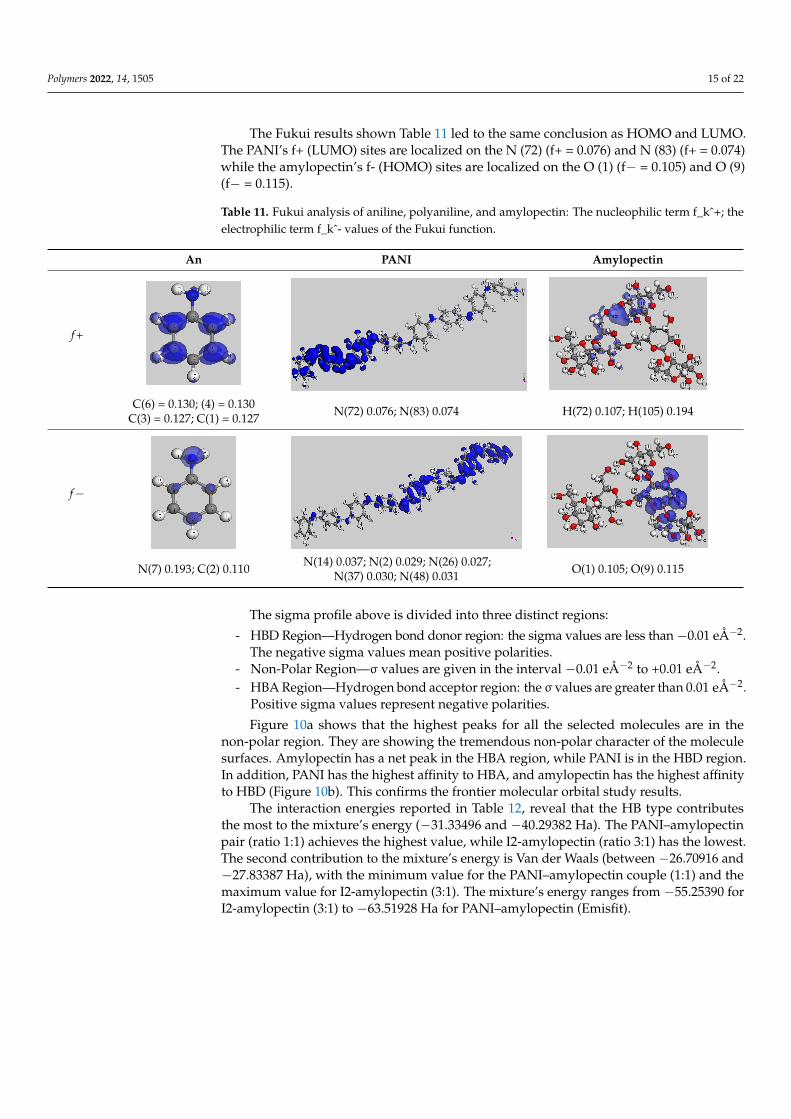
The Fukui results shown Table 11 led to the same conclusion as HOMO and LUMO. The PANI’s f+ (LUMO) sites are localized on the N (72) (f+ = 0.076) and N (83) (f+ = 0.074) while the amylopectin’s f- (HOMO) sites are localized on the O (1) (f− = 0.105) and O (9) (f− = 0.115).
Table 9. ξHOMO, ξLUMO and related molecular properties of the studied compounds.
Parameter An An+ I1 I2 I3 PANI Amylopectin ξHOMO (eV) −5.105 −5.268 −5.736 −5.736 −5.489 −4.770 −7.056 ξLUMO (eV) −1.190 −0.1687 −0.318 −0.318 −0.261 −2.980 0.395
Gap Δ𝐸 (eV) 3.916 5.099 5.418 5.418 5.227 1.791 7.450 Electronegativity, 𝜒 = −𝜇 3.147 2.718 3.027 3.027 2.875 3.875 3.331
Hardness, 𝜂 1.958 2.550 2.709 2.709 2.614 0.895 3.725
Figure 9. Peak current variation with scan rates.
In fact, the Randles Sevcik relation gives a straight line when pure diffusion controlsthe electrochemical reaction.
Ipa = 2.69 × 10⁵ n3/2A D1/2 C v1/2 (7)
ip = current maximum in ampsn = number of electrons transferred in the redox eventA = electrode area in cm2
D = diffusion coefficient in cm2/sC = concentration in mol/cm3
v = scan rate in V/s
Polymers 2022, 14, 1505 14 of 22
Therefore, it is clear that the PANI synthesized by chemical oxidation polymerizationis a conductor material. Note that according to our results, the M11 sample is the bestconductor among these materials.
4.6. Computational Assessment
The main electronic properties calculated for the aniline, PANI, and starch are sum-marized in Table 9. As amylopectin is the most abundant component (85%) in the starchunder investigation, it was considered a suitable model. According to the energy values,comparable values of the aniline isomers ξHOMO and ξLUMO indicate a quasi-equivalenttendency to donate or accept electrons. That said, isomers I1 and I2 have the highest values,showing that they are the more probable molecules participating in the polymerizationprocess to produce the PANI chain (this is confirmed by the highest electron escapingtendency from an equilibrium system, µ = −3.027 eV). Both PANI and amylopectin aremore reactive than the PANI parent species (isomers I1 or I2) (see Table 9). Regarding thegap values in Table 10, the amylopectin is the most stable in this set of polymers.
Table 9. ξHOMO, ξLUMO and related molecular properties of the studied compounds.
Parameter An An+ I1 I2 I3 PANI Amylopectin
ξHOMO (eV) −5.105 −5.268 −5.736 −5.736 −5.489 −4.770 −7.056ξLUMO (eV) −1.190 −0.1687 −0.318 −0.318 −0.261 −2.980 0.395Gap ∆E (eV) 3.916 5.099 5.418 5.418 5.227 1.791 7.450
Electronegativity, χ = −µ 3.147 2.718 3.027 3.027 2.875 3.875 3.331Hardness, η 1.958 2.550 2.709 2.709 2.614 0.895 3.725
Electrophilicity index, ω 2.530 1.450 1.691 1.692 1.581 8.386 1.489Fractions of transferred electrons, ∆N 1.608 1.066 1.118 1.118 1.100 4.328 0.894
Table 10. The HOMO and LUMO electron density distributions of aniline, polyaniline,and amylopectin.
An PANI Amylopectin
HOMO
Polymers 2022, 14, x FOR PEER REVIEW 15 of 22
Electrophilicity index, � 2.530 1.450 1.691 1.692 1.581 8.386 1.489 Fractions of transferred electrons, ΔN 1.608 1.066 1.118 1.118 1.100 4.328 0.894
Table 10. The HOMO and LUMO electron density distributions of aniline, polyaniline, and amylo-pectin.
An PANI Amylopectin
HOMO
LUMO
Table 11. Fukui analysis of aniline, polyaniline, and amylopectin: The nucleophilic term f_k^+; the electrophilic term f_k^- values of the Fukui function.
An PANI Amylopectin
f+
C(6) = 0.130;(4) = 0.130
C(3) = 0.127;C(1) = 0.127 N(72) 0.076; N(83) 0.074 H(72) 0.107; H(105) 0.194
f−
N(7) 0.193; C(2) 0.110 N(14) 0.037; N(2) 0.029; N(26) 0.027; N(37) 0.030; N(48) 0.031
O(1) 0.105; O(9) 0.115
The sigma profile above is divided into three distinct regions:
LUMO
Polymers 2022, 14, x FOR PEER REVIEW 15 of 22
Electrophilicity index, � 2.530 1.450 1.691 1.692 1.581 8.386 1.489 Fractions of transferred electrons, ΔN 1.608 1.066 1.118 1.118 1.100 4.328 0.894
Table 10. The HOMO and LUMO electron density distributions of aniline, polyaniline, and amylo-pectin.
An PANI Amylopectin
HOMO
LUMO
Table 11. Fukui analysis of aniline, polyaniline, and amylopectin: The nucleophilic term f_k^+; the electrophilic term f_k^- values of the Fukui function.
An PANI Amylopectin
f+
C(6) = 0.130;(4) = 0.130
C(3) = 0.127;C(1) = 0.127 N(72) 0.076; N(83) 0.074 H(72) 0.107; H(105) 0.194
f−
N(7) 0.193; C(2) 0.110 N(14) 0.037; N(2) 0.029; N(26) 0.027; N(37) 0.030; N(48) 0.031
O(1) 0.105; O(9) 0.115
The sigma profile above is divided into three distinct regions:
In conclusion, PANI has the highest ability to acquire an extra electron charge (highestω value: 8.386 eV) and the lowest resistance to charge transfer (the lowest hardnessη value, 0.895) (LUMO of PANI, see Table 10). It is thus concluded that amylopectin is theelectron donor with the highest ξHOMO = −7.056 eV (see Table 2). The results for ∆N are4.328 electrons (acquired) for PANI and 0.894 electrons (released) for amylopectin.
Polymers 2022, 14, 1505 15 of 22
The Fukui results shown Table 11 led to the same conclusion as HOMO and LUMO.The PANI’s f+ (LUMO) sites are localized on the N (72) (f+ = 0.076) and N (83) (f+ = 0.074)while the amylopectin’s f- (HOMO) sites are localized on the O (1) (f− = 0.105) and O (9)(f− = 0.115).
Table 11. Fukui analysis of aniline, polyaniline, and amylopectin: The nucleophilic term f_kˆ+; theelectrophilic term f_kˆ- values of the Fukui function.
An PANI Amylopectin
f +
Polymers 2022, 14, x FOR PEER REVIEW 15 of 22
Electrophilicity index, � 2.530 1.450 1.691 1.692 1.581 8.386 1.489 Fractions of transferred electrons, ΔN 1.608 1.066 1.118 1.118 1.100 4.328 0.894
Table 10. The HOMO and LUMO electron density distributions of aniline, polyaniline, and amylo-pectin.
An PANI Amylopectin
HOMO
LUMO
Table 11. Fukui analysis of aniline, polyaniline, and amylopectin: The nucleophilic term f_k^+; the electrophilic term f_k^- values of the Fukui function.
An PANI Amylopectin
f+
C(6) = 0.130;(4) = 0.130
C(3) = 0.127;C(1) = 0.127 N(72) 0.076; N(83) 0.074 H(72) 0.107; H(105) 0.194
f−
N(7) 0.193; C(2) 0.110 N(14) 0.037; N(2) 0.029; N(26) 0.027; N(37) 0.030; N(48) 0.031
O(1) 0.105; O(9) 0.115
The sigma profile above is divided into three distinct regions:
C(6) = 0.130; (4) = 0.130C(3) = 0.127; C(1) = 0.127 N(72) 0.076; N(83) 0.074 H(72) 0.107; H(105) 0.194
f−
Polymers 2022, 14, x FOR PEER REVIEW 15 of 22
Electrophilicity index, � 2.530 1.450 1.691 1.692 1.581 8.386 1.489 Fractions of transferred electrons, ΔN 1.608 1.066 1.118 1.118 1.100 4.328 0.894
Table 10. The HOMO and LUMO electron density distributions of aniline, polyaniline, and amylo-pectin.
An PANI Amylopectin
HOMO
LUMO
Table 11. Fukui analysis of aniline, polyaniline, and amylopectin: The nucleophilic term f_k^+; the electrophilic term f_k^- values of the Fukui function.
An PANI Amylopectin
f+
C(6) = 0.130;(4) = 0.130
C(3) = 0.127;C(1) = 0.127 N(72) 0.076; N(83) 0.074 H(72) 0.107; H(105) 0.194
f−
N(7) 0.193; C(2) 0.110 N(14) 0.037; N(2) 0.029; N(26) 0.027; N(37) 0.030; N(48) 0.031
O(1) 0.105; O(9) 0.115
The sigma profile above is divided into three distinct regions:
N(7) 0.193; C(2) 0.110 N(14) 0.037; N(2) 0.029; N(26) 0.027;N(37) 0.030; N(48) 0.031 O(1) 0.105; O(9) 0.115
The sigma profile above is divided into three distinct regions:
- HBD Region—Hydrogen bond donor region: the sigma values are less than−0.01 eÅ−2.The negative sigma values mean positive polarities.
- Non-Polar Region—σ values are given in the interval −0.01 eÅ−2 to +0.01 eÅ−2.- HBA Region—Hydrogen bond acceptor region: the σ values are greater than 0.01 eÅ−2.
Positive sigma values represent negative polarities.
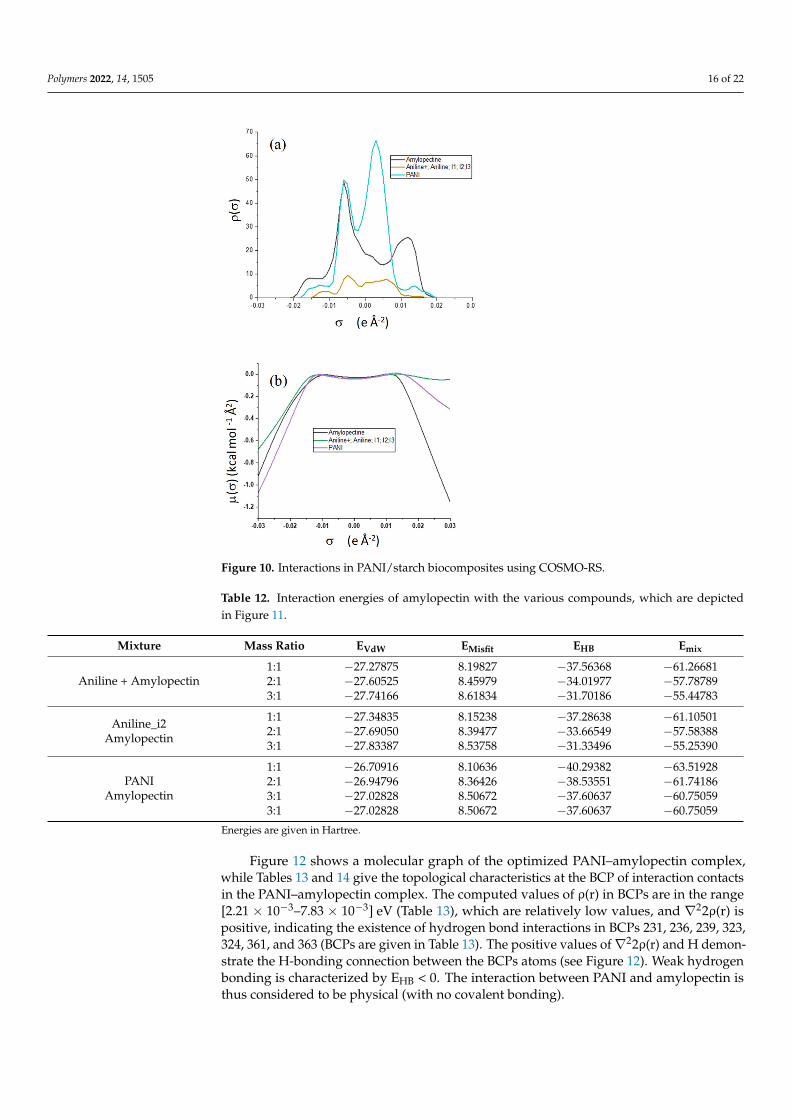
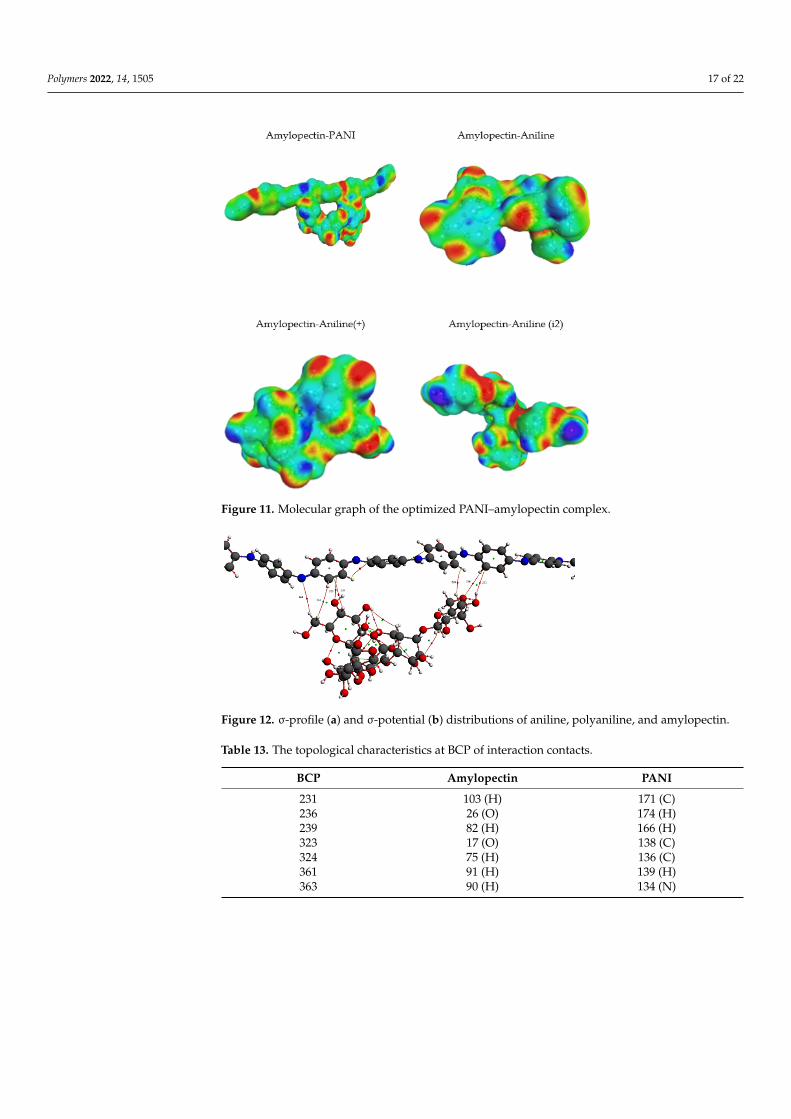
Figure 10a shows that the highest peaks for all the selected molecules are in thenon-polar region. They are showing the tremendous non-polar character of the moleculesurfaces. Amylopectin has a net peak in the HBA region, while PANI is in the HBD region.In addition, PANI has the highest affinity to HBA, and amylopectin has the highest affinityto HBD (Figure 10b). This confirms the frontier molecular orbital study results.
The interaction energies reported in Table 12, reveal that the HB type contributesthe most to the mixture’s energy (−31.33496 and −40.29382 Ha). The PANI–amylopectinpair (ratio 1:1) achieves the highest value, while I2-amylopectin (ratio 3:1) has the lowest.The second contribution to the mixture’s energy is Van der Waals (between −26.70916 and−27.83387 Ha), with the minimum value for the PANI–amylopectin couple (1:1) and themaximum value for I2-amylopectin (3:1). The mixture’s energy ranges from −55.25390 forI2-amylopectin (3:1) to −63.51928 Ha for PANI–amylopectin (Emisfit).
Polymers 2022, 14, 1505 16 of 22
Polymers 2022, 14, x FOR PEER REVIEW 16 of 22
In addition, PANI has the highest affinity to HBA, and amylopectin has the highest affin-ity to HBD (Figure 10b). This confirms the frontier molecular orbital study results.
Figure 10. σ-profile (a) and σ-potential (b) distributions of aniline, polyaniline, and amylopectin.
The interaction energies reported in Table 12, reveal that the HB type contributes the most to the mixture’s energy (−31.33496 and −40.29382 Ha). The PANI–amylopectin pair (ratio 1:1) achieves the highest value, while I2-amylopectin (ratio 3:1) has the lowest. The second contribution to the mixture’s energy is Van der Waals (between −26.70916 and −27.83387 Ha), with the minimum value for the PANI–amylopectin couple (1:1) and the maximum value for I2-amylopectin (3:1). The mixture’s energy ranges from −55.25390 for I2-amylopectin (3:1) to −63.51928 Ha for PANI–amylopectin (Emisfit).
Table 12. Interaction energies of amylopectin with the various compounds, which are depicted in Figure 11.
Mixture Mass Ratio EVdW EMisfit EHB Emix
Aniline + Amylopectin 1:1 −27.27875 8.19827 −37.56368 −61.26681 2:1 −27.60525 8.45979 −34.01977 −57.78789 3:1 −27.74166 8.61834 −31.70186 −55.44783
Aniline_i2 Amylopectin
1:1 −27.34835 8.15238 −37.28638 −61.10501 2:1 −27.69050 8.39477 −33.66549 −57.58388 3:1 −27.83387 8.53758 −31.33496 −55.25390
PANI Amylopectin
1:1 −26.70916 8.10636 −40.29382 −63.51928 2:1 −26.94796 8.36426 −38.53551 −61.74186 3:1 −27.02828 8.50672 −37.60637 −60.75059 3:1 −27.02828 8.50672 −37.60637 −60.75059
Energies are given in Hartree.
Figure 10. Interactions in PANI/starch biocomposites using COSMO-RS.
Table 12. Interaction energies of amylopectin with the various compounds, which are depictedin Figure 11.
Mixture Mass Ratio EVdW EMisfit EHB Emix
Aniline + Amylopectin1:1 −27.27875 8.19827 −37.56368 −61.266812:1 −27.60525 8.45979 −34.01977 −57.787893:1 −27.74166 8.61834 −31.70186 −55.44783
Aniline_i2Amylopectin
1:1 −27.34835 8.15238 −37.28638 −61.105012:1 −27.69050 8.39477 −33.66549 −57.583883:1 −27.83387 8.53758 −31.33496 −55.25390
PANIAmylopectin
1:1 −26.70916 8.10636 −40.29382 −63.519282:1 −26.94796 8.36426 −38.53551 −61.741863:1 −27.02828 8.50672 −37.60637 −60.750593:1 −27.02828 8.50672 −37.60637 −60.75059
Energies are given in Hartree.
Figure 12 shows a molecular graph of the optimized PANI–amylopectin complex,while Tables 13 and 14 give the topological characteristics at the BCP of interaction contactsin the PANI–amylopectin complex. The computed values of ρ(r) in BCPs are in the range[2.21 × 10⁻³–7.83 × 10⁻³] eV (Table 13), which are relatively low values, and ∇22ρ(r) ispositive, indicating the existence of hydrogen bond interactions in BCPs 231, 236, 239, 323,324, 361, and 363 (BCPs are given in Table 13). The positive values of∇22ρ(r) and H demon-strate the H-bonding connection between the BCPs atoms (see Figure 12). Weak hydrogenbonding is characterized by EHB < 0. The interaction between PANI and amylopectin isthus considered to be physical (with no covalent bonding).
Polymers 2022, 14, 1505 17 of 22Polymers 2022, 14, x FOR PEER REVIEW 17 of 22
Figure 11. Interactions in PANI/starch biocomposites using COSMO-RS.
Figure 12 shows a molecular graph of the optimized PANI–amylopectin complex, while Tables 13 and 14 give the topological characteristics at the BCP of interaction con-tacts in the PANI–amylopectin complex. The computed values of ρ(r) in BCPs are in the range [2.21 × 10⁻³–7.83 × 10⁻³] eV (Table 13), which are relatively low values, and ∇22ρ(r) is positive, indicating the existence of hydrogen bond interactions in BCPs 231, 236, 239, 323, 324, 361, and 363 (BCPs are given in Table 13). The positive values of ∇22ρ(r) and H demonstrate the H-bonding connection between the BCPs atoms (see Figure 12). Weak hydrogen bonding is characterized by EHB < 0. The interaction between PANI and amylo-pectin is thus considered to be physical (with no covalent bonding).
Figure 12. Molecular graph of the optimized PANI–amylopectin complex.
Table 13. The topological characteristics at BCP of interaction contacts.
BCP Amylopectin PANI 231 103 (H) 171 (C) 236 26 (O) 174 (H) 239 82 (H) 166 (H) 323 17 (O) 138 (C) 324 75 (H) 136 (C)
Figure 11. Molecular graph of the optimized PANI–amylopectin complex.
Polymers 2022, 14, x FOR PEER REVIEW 17 of 22
Figure 11. Interactions in PANI/starch biocomposites using COSMO-RS.
Figure 12 shows a molecular graph of the optimized PANI–amylopectin complex, while Tables 13 and 14 give the topological characteristics at the BCP of interaction con-tacts in the PANI–amylopectin complex. The computed values of ρ(r) in BCPs are in the range [2.21 × 10⁻³–7.83 × 10⁻³] eV (Table 13), which are relatively low values, and ∇22ρ(r) is positive, indicating the existence of hydrogen bond interactions in BCPs 231, 236, 239, 323, 324, 361, and 363 (BCPs are given in Table 13). The positive values of ∇22ρ(r) and H demonstrate the H-bonding connection between the BCPs atoms (see Figure 12). Weak hydrogen bonding is characterized by EHB < 0. The interaction between PANI and amylo-pectin is thus considered to be physical (with no covalent bonding).
Figure 12. Molecular graph of the optimized PANI–amylopectin complex.
Table 13. The topological characteristics at BCP of interaction contacts.
BCP Amylopectin PANI 231 103 (H) 171 (C) 236 26 (O) 174 (H) 239 82 (H) 166 (H) 323 17 (O) 138 (C) 324 75 (H) 136 (C)
Figure 12. σ-profile (a) and σ-potential (b) distributions of aniline, polyaniline, and amylopectin.
Table 13. The topological characteristics at BCP of interaction contacts.
BCP Amylopectin PANI
231 103 (H) 171 (C)236 26 (O) 174 (H)239 82 (H) 166 (H)323 17 (O) 138 (C)324 75 (H) 136 (C)361 91 (H) 139 (H)363 90 (H) 134 (N)

Polymers 2022, 14, 1505 18 of 22
Table 14. The topological characteristics at BCP of interaction contacts in the PANI–amylopectin complex.
BCP ρ(r) ∇2ρ(r) G(r) V(r) EHB (eV) H = G + V |V|/G
231 2.32 × 10⁻³ 7.35 × 10⁻³ 1.34 × 10⁻³ −8.45 × 10⁻⁴ −4.23 × 10⁻⁴ 4.96 × 10⁻⁴ 0.63236 3.48 × 10⁻³ 1.28 × 10⁻² 2.36 × 10⁻³ −1.52 × 10⁻³ −7.61 × 10⁻⁴ 8.33 × 10⁻⁴ 0.65239 6.91 × 10⁻³ 2.28 × 10⁻² 4.52 × 10⁻³ −3.34 × 10⁻³ −1.67 × 10⁻³ 1.18 × 10⁻³ 0.74323 7.83 × 10⁻³ 2.72 × 10⁻² 5.42 × 10⁻³ −4.04 × 10⁻³ −2.02 × 10⁻³ 1.38 × 10⁻³ 0.75324 5.60 × 10⁻³ 2.10 × 10⁻² 4.01 × 10⁻³ −2.76 × 10⁻³ −1.38 × 10⁻³ 1.25 × 10⁻³ 0.69361 2.21 × 10⁻³ 7.58 × 10⁻³ 1.37 × 10⁻³ −8.46 × 10⁻⁴ −4.23 × 10⁻⁴ 5.24 × 10⁻⁴ 0.62363 2.32 × 10⁻³ 7.35 × 10⁻³ 1.34 × 10⁻³ −8.45 × 10⁻³ −4.23 × 10⁻⁴ 4.96 × 10⁻⁴ 0.63
5. Conclusions
The results of this work demonstrate a facile method for the synthesis of polyani-line colloids. In particular, potato starch was employed as a steric stabilizer to obtainstable dispersions of polyaniline (emeraldine base). Polyaniline/starch biocompositeswith various aniline/starch ratios were thus synthesized via an oxidative polymerizationand characterized. To evaluate the effect of aniline/starch ratios variation, several tests(UV-vis, FTIR-ATR, Raman, XRD, TGA, DSC), as well as computational calculation (DFT,COSMO-RS, AIM), were performed. This study demonstrates the possibility of usingstarch as a steric stabilizer, and so to empower the processability of the polyaniline byimproving the solubility in DMSO and DMF and the dispersion behavior in water, as wellas in glycerol and chloroform, at higher temperatures.
The growth of polyaniline is observed on the starch particles’ surfaces. The particledimension and the degree of crystallinity appear to be strongly affected in the compositematerial, as demonstrated by the formation of smaller particles and the loss of the originalstarch crystalline lattice. Although less thermally stable, M11 appears to be the best interms of morphology and retention of crystallinity degree. The cyclic voltammetry testshows better electro-activity in terms of the electron exchange and capacitive behavior ofthe composite materials, with the ratio of 1:1 being the best composition among these mate-rials. Finally, the strong interactions between the PANI and amylopectin (the main starchcomponent) were investigated by the DFT, COSMO-RS, and AIM methods, demonstratingtheir purely physical nature.
These results attest that the prepared composites as promising versatile materials,which are expected to broaden the electrochemical applications of PANI.
Author Contributions: Conceptualization, methodology, and investigation: S.B.; writing and super-vision: S.D. and H.F.; writing-review and editing: M.C.; software and data correction: Y.B. and I.C.All authors have read and agreed to the published version of the manuscript.
Funding: This work was supported by the Department of Chemical Sciences of Padova University(grant number: P-DiSC#11NExuS_BIRD2019-UNIPD).
Acknowledgments: We acknowledge Nicola Dengo for his assistance with Raman analysis.
Conflicts of Interest: The authors declare no conflict of interest.
Abbreviations
(PANI-EB) polyaniline (emeraldine base), (FTIR) Fourier transform infrared, (XRD) X-raydiffraction analysis, (TGA) thermogravimetric analysis, (DTG) Derivative Thermogravimetry, (DSC)Differential scanning calorimetry, (SEM) Scanning Electron Microscopy, (DFT) Density-functionaltheory, (COSMO-RS) Conductor-like Screening Model for Real Solvents, (AIM methods) Atomsin Molecule, (DMSO) Dimethylsulfoxide, (DMF) Dimethylformamide, (ADF) The AmsterdamDensity Functional.
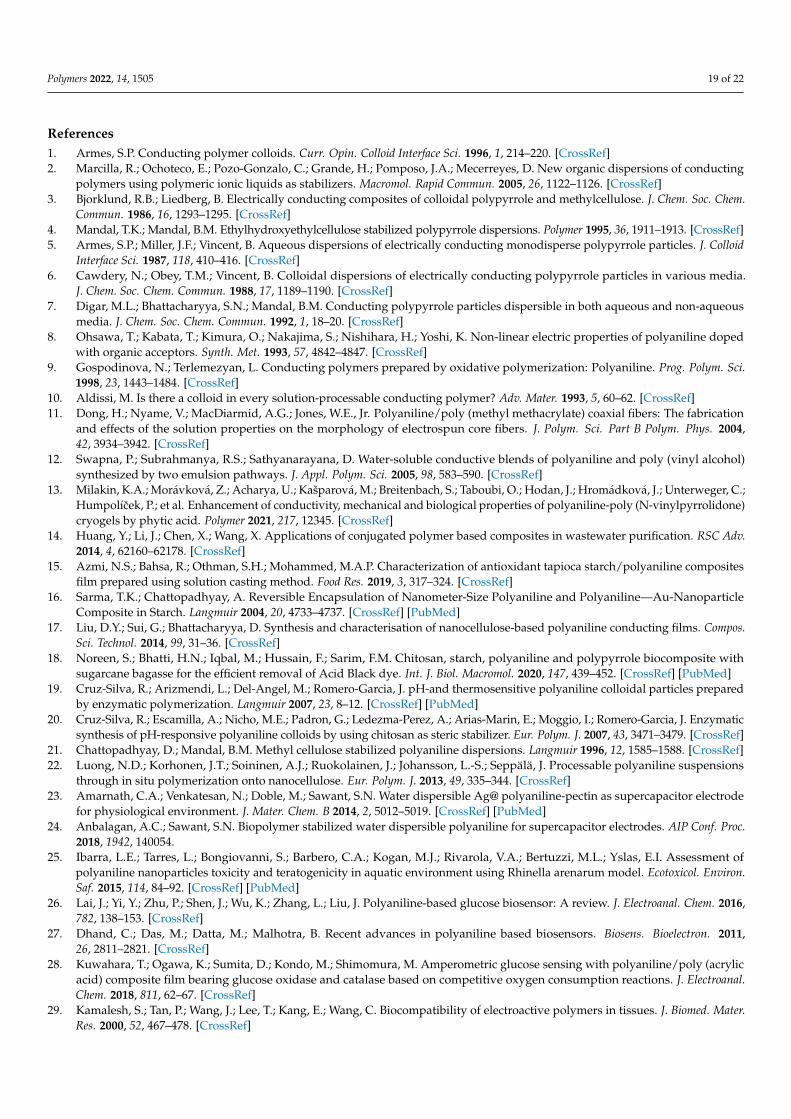
Polymers 2022, 14, 1505 19 of 22
References1. Armes, S.P. Conducting polymer colloids. Curr. Opin. Colloid Interface Sci. 1996, 1, 214–220. [CrossRef]2. Marcilla, R.; Ochoteco, E.; Pozo-Gonzalo, C.; Grande, H.; Pomposo, J.A.; Mecerreyes, D. New organic dispersions of conducting
polymers using polymeric ionic liquids as stabilizers. Macromol. Rapid Commun. 2005, 26, 1122–1126. [CrossRef]3. Bjorklund, R.B.; Liedberg, B. Electrically conducting composites of colloidal polypyrrole and methylcellulose. J. Chem. Soc. Chem.
Commun. 1986, 16, 1293–1295. [CrossRef]4. Mandal, T.K.; Mandal, B.M. Ethylhydroxyethylcellulose stabilized polypyrrole dispersions. Polymer 1995, 36, 1911–1913. [CrossRef]5. Armes, S.P.; Miller, J.F.; Vincent, B. Aqueous dispersions of electrically conducting monodisperse polypyrrole particles. J. Colloid
Interface Sci. 1987, 118, 410–416. [CrossRef]6. Cawdery, N.; Obey, T.M.; Vincent, B. Colloidal dispersions of electrically conducting polypyrrole particles in various media.
J. Chem. Soc. Chem. Commun. 1988, 17, 1189–1190. [CrossRef]7. Digar, M.L.; Bhattacharyya, S.N.; Mandal, B.M. Conducting polypyrrole particles dispersible in both aqueous and non-aqueous
media. J. Chem. Soc. Chem. Commun. 1992, 1, 18–20. [CrossRef]8. Ohsawa, T.; Kabata, T.; Kimura, O.; Nakajima, S.; Nishihara, H.; Yoshi, K. Non-linear electric properties of polyaniline doped
with organic acceptors. Synth. Met. 1993, 57, 4842–4847. [CrossRef]9. Gospodinova, N.; Terlemezyan, L. Conducting polymers prepared by oxidative polymerization: Polyaniline. Prog. Polym. Sci.
1998, 23, 1443–1484. [CrossRef]10. Aldissi, M. Is there a colloid in every solution-processable conducting polymer? Adv. Mater. 1993, 5, 60–62. [CrossRef]11. Dong, H.; Nyame, V.; MacDiarmid, A.G.; Jones, W.E., Jr. Polyaniline/poly (methyl methacrylate) coaxial fibers: The fabrication
and effects of the solution properties on the morphology of electrospun core fibers. J. Polym. Sci. Part B Polym. Phys. 2004,42, 3934–3942. [CrossRef]
12. Swapna, P.; Subrahmanya, R.S.; Sathyanarayana, D. Water-soluble conductive blends of polyaniline and poly (vinyl alcohol)synthesized by two emulsion pathways. J. Appl. Polym. Sci. 2005, 98, 583–590. [CrossRef]
13. Milakin, K.A.; Morávková, Z.; Acharya, U.; Kašparová, M.; Breitenbach, S.; Taboubi, O.; Hodan, J.; Hromádková, J.; Unterweger, C.;Humpolícek, P.; et al. Enhancement of conductivity, mechanical and biological properties of polyaniline-poly (N-vinylpyrrolidone)cryogels by phytic acid. Polymer 2021, 217, 12345. [CrossRef]
14. Huang, Y.; Li, J.; Chen, X.; Wang, X. Applications of conjugated polymer based composites in wastewater purification. RSC Adv.2014, 4, 62160–62178. [CrossRef]
15. Azmi, N.S.; Bahsa, R.; Othman, S.H.; Mohammed, M.A.P. Characterization of antioxidant tapioca starch/polyaniline compositesfilm prepared using solution casting method. Food Res. 2019, 3, 317–324. [CrossRef]
16. Sarma, T.K.; Chattopadhyay, A. Reversible Encapsulation of Nanometer-Size Polyaniline and Polyaniline—Au-NanoparticleComposite in Starch. Langmuir 2004, 20, 4733–4737. [CrossRef] [PubMed]
17. Liu, D.Y.; Sui, G.; Bhattacharyya, D. Synthesis and characterisation of nanocellulose-based polyaniline conducting films. Compos.Sci. Technol. 2014, 99, 31–36. [CrossRef]
18. Noreen, S.; Bhatti, H.N.; Iqbal, M.; Hussain, F.; Sarim, F.M. Chitosan, starch, polyaniline and polypyrrole biocomposite withsugarcane bagasse for the efficient removal of Acid Black dye. Int. J. Biol. Macromol. 2020, 147, 439–452. [CrossRef] [PubMed]
19. Cruz-Silva, R.; Arizmendi, L.; Del-Angel, M.; Romero-Garcia, J. pH-and thermosensitive polyaniline colloidal particles preparedby enzymatic polymerization. Langmuir 2007, 23, 8–12. [CrossRef] [PubMed]
20. Cruz-Silva, R.; Escamilla, A.; Nicho, M.E.; Padron, G.; Ledezma-Perez, A.; Arias-Marin, E.; Moggio, I.; Romero-Garcia, J. Enzymaticsynthesis of pH-responsive polyaniline colloids by using chitosan as steric stabilizer. Eur. Polym. J. 2007, 43, 3471–3479. [CrossRef]
21. Chattopadhyay, D.; Mandal, B.M. Methyl cellulose stabilized polyaniline dispersions. Langmuir 1996, 12, 1585–1588. [CrossRef]22. Luong, N.D.; Korhonen, J.T.; Soininen, A.J.; Ruokolainen, J.; Johansson, L.-S.; Seppälä, J. Processable polyaniline suspensions
through in situ polymerization onto nanocellulose. Eur. Polym. J. 2013, 49, 335–344. [CrossRef]23. Amarnath, C.A.; Venkatesan, N.; Doble, M.; Sawant, S.N. Water dispersible Ag@ polyaniline-pectin as supercapacitor electrode
for physiological environment. J. Mater. Chem. B 2014, 2, 5012–5019. [CrossRef] [PubMed]24. Anbalagan, A.C.; Sawant, S.N. Biopolymer stabilized water dispersible polyaniline for supercapacitor electrodes. AIP Conf. Proc.
2018, 1942, 140054.25. Ibarra, L.E.; Tarres, L.; Bongiovanni, S.; Barbero, C.A.; Kogan, M.J.; Rivarola, V.A.; Bertuzzi, M.L.; Yslas, E.I. Assessment of
polyaniline nanoparticles toxicity and teratogenicity in aquatic environment using Rhinella arenarum model. Ecotoxicol. Environ.Saf. 2015, 114, 84–92. [CrossRef] [PubMed]
26. Lai, J.; Yi, Y.; Zhu, P.; Shen, J.; Wu, K.; Zhang, L.; Liu, J. Polyaniline-based glucose biosensor: A review. J. Electroanal. Chem. 2016,782, 138–153. [CrossRef]
27. Dhand, C.; Das, M.; Datta, M.; Malhotra, B. Recent advances in polyaniline based biosensors. Biosens. Bioelectron. 2011,26, 2811–2821. [CrossRef]
28. Kuwahara, T.; Ogawa, K.; Sumita, D.; Kondo, M.; Shimomura, M. Amperometric glucose sensing with polyaniline/poly (acrylicacid) composite film bearing glucose oxidase and catalase based on competitive oxygen consumption reactions. J. Electroanal.Chem. 2018, 811, 62–67. [CrossRef]
29. Kamalesh, S.; Tan, P.; Wang, J.; Lee, T.; Kang, E.; Wang, C. Biocompatibility of electroactive polymers in tissues. J. Biomed. Mater.Res. 2000, 52, 467–478. [CrossRef]
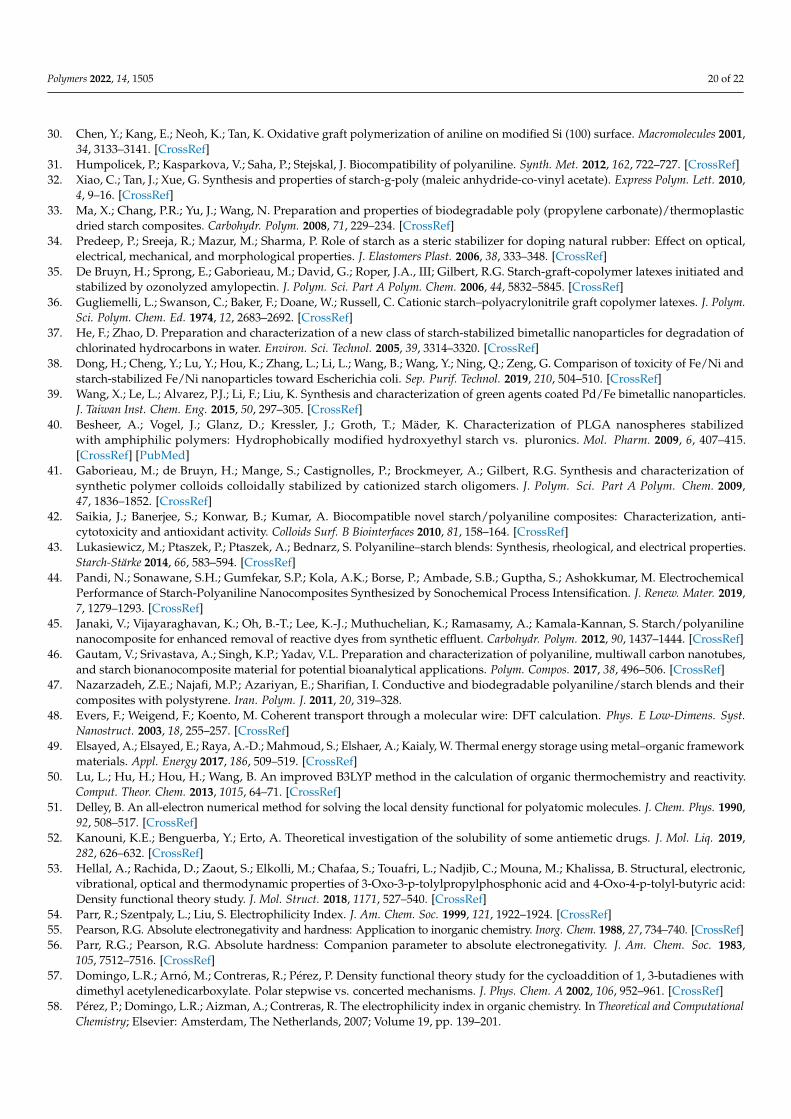
Polymers 2022, 14, 1505 20 of 22
30. Chen, Y.; Kang, E.; Neoh, K.; Tan, K. Oxidative graft polymerization of aniline on modified Si (100) surface. Macromolecules 2001,34, 3133–3141. [CrossRef]
31. Humpolicek, P.; Kasparkova, V.; Saha, P.; Stejskal, J. Biocompatibility of polyaniline. Synth. Met. 2012, 162, 722–727. [CrossRef]32. Xiao, C.; Tan, J.; Xue, G. Synthesis and properties of starch-g-poly (maleic anhydride-co-vinyl acetate). Express Polym. Lett. 2010,
4, 9–16. [CrossRef]33. Ma, X.; Chang, P.R.; Yu, J.; Wang, N. Preparation and properties of biodegradable poly (propylene carbonate)/thermoplastic
dried starch composites. Carbohydr. Polym. 2008, 71, 229–234. [CrossRef]34. Predeep, P.; Sreeja, R.; Mazur, M.; Sharma, P. Role of starch as a steric stabilizer for doping natural rubber: Effect on optical,
electrical, mechanical, and morphological properties. J. Elastomers Plast. 2006, 38, 333–348. [CrossRef]35. De Bruyn, H.; Sprong, E.; Gaborieau, M.; David, G.; Roper, J.A., III; Gilbert, R.G. Starch-graft-copolymer latexes initiated and
stabilized by ozonolyzed amylopectin. J. Polym. Sci. Part A Polym. Chem. 2006, 44, 5832–5845. [CrossRef]36. Gugliemelli, L.; Swanson, C.; Baker, F.; Doane, W.; Russell, C. Cationic starch–polyacrylonitrile graft copolymer latexes. J. Polym.
Sci. Polym. Chem. Ed. 1974, 12, 2683–2692. [CrossRef]37. He, F.; Zhao, D. Preparation and characterization of a new class of starch-stabilized bimetallic nanoparticles for degradation of
chlorinated hydrocarbons in water. Environ. Sci. Technol. 2005, 39, 3314–3320. [CrossRef]38. Dong, H.; Cheng, Y.; Lu, Y.; Hou, K.; Zhang, L.; Li, L.; Wang, B.; Wang, Y.; Ning, Q.; Zeng, G. Comparison of toxicity of Fe/Ni and
starch-stabilized Fe/Ni nanoparticles toward Escherichia coli. Sep. Purif. Technol. 2019, 210, 504–510. [CrossRef]39. Wang, X.; Le, L.; Alvarez, P.J.; Li, F.; Liu, K. Synthesis and characterization of green agents coated Pd/Fe bimetallic nanoparticles.
J. Taiwan Inst. Chem. Eng. 2015, 50, 297–305. [CrossRef]40. Besheer, A.; Vogel, J.; Glanz, D.; Kressler, J.; Groth, T.; Mäder, K. Characterization of PLGA nanospheres stabilized
with amphiphilic polymers: Hydrophobically modified hydroxyethyl starch vs. pluronics. Mol. Pharm. 2009, 6, 407–415.[CrossRef] [PubMed]
41. Gaborieau, M.; de Bruyn, H.; Mange, S.; Castignolles, P.; Brockmeyer, A.; Gilbert, R.G. Synthesis and characterization ofsynthetic polymer colloids colloidally stabilized by cationized starch oligomers. J. Polym. Sci. Part A Polym. Chem. 2009,47, 1836–1852. [CrossRef]
42. Saikia, J.; Banerjee, S.; Konwar, B.; Kumar, A. Biocompatible novel starch/polyaniline composites: Characterization, anti-cytotoxicity and antioxidant activity. Colloids Surf. B Biointerfaces 2010, 81, 158–164. [CrossRef]
43. Lukasiewicz, M.; Ptaszek, P.; Ptaszek, A.; Bednarz, S. Polyaniline–starch blends: Synthesis, rheological, and electrical properties.Starch-Stärke 2014, 66, 583–594. [CrossRef]
44. Pandi, N.; Sonawane, S.H.; Gumfekar, S.P.; Kola, A.K.; Borse, P.; Ambade, S.B.; Guptha, S.; Ashokkumar, M. ElectrochemicalPerformance of Starch-Polyaniline Nanocomposites Synthesized by Sonochemical Process Intensification. J. Renew. Mater. 2019,7, 1279–1293. [CrossRef]
45. Janaki, V.; Vijayaraghavan, K.; Oh, B.-T.; Lee, K.-J.; Muthuchelian, K.; Ramasamy, A.; Kamala-Kannan, S. Starch/polyanilinenanocomposite for enhanced removal of reactive dyes from synthetic effluent. Carbohydr. Polym. 2012, 90, 1437–1444. [CrossRef]
46. Gautam, V.; Srivastava, A.; Singh, K.P.; Yadav, V.L. Preparation and characterization of polyaniline, multiwall carbon nanotubes,and starch bionanocomposite material for potential bioanalytical applications. Polym. Compos. 2017, 38, 496–506. [CrossRef]
47. Nazarzadeh, Z.E.; Najafi, M.P.; Azariyan, E.; Sharifian, I. Conductive and biodegradable polyaniline/starch blends and theircomposites with polystyrene. Iran. Polym. J. 2011, 20, 319–328.
48. Evers, F.; Weigend, F.; Koento, M. Coherent transport through a molecular wire: DFT calculation. Phys. E Low-Dimens. Syst.Nanostruct. 2003, 18, 255–257. [CrossRef]
49. Elsayed, A.; Elsayed, E.; Raya, A.-D.; Mahmoud, S.; Elshaer, A.; Kaialy, W. Thermal energy storage using metal–organic frameworkmaterials. Appl. Energy 2017, 186, 509–519. [CrossRef]
50. Lu, L.; Hu, H.; Hou, H.; Wang, B. An improved B3LYP method in the calculation of organic thermochemistry and reactivity.Comput. Theor. Chem. 2013, 1015, 64–71. [CrossRef]
51. Delley, B. An all-electron numerical method for solving the local density functional for polyatomic molecules. J. Chem. Phys. 1990,92, 508–517. [CrossRef]
52. Kanouni, K.E.; Benguerba, Y.; Erto, A. Theoretical investigation of the solubility of some antiemetic drugs. J. Mol. Liq. 2019,282, 626–632. [CrossRef]
53. Hellal, A.; Rachida, D.; Zaout, S.; Elkolli, M.; Chafaa, S.; Touafri, L.; Nadjib, C.; Mouna, M.; Khalissa, B. Structural, electronic,vibrational, optical and thermodynamic properties of 3-Oxo-3-p-tolylpropylphosphonic acid and 4-Oxo-4-p-tolyl-butyric acid:Density functional theory study. J. Mol. Struct. 2018, 1171, 527–540. [CrossRef]
54. Parr, R.; Szentpaly, L.; Liu, S. Electrophilicity Index. J. Am. Chem. Soc. 1999, 121, 1922–1924. [CrossRef]55. Pearson, R.G. Absolute electronegativity and hardness: Application to inorganic chemistry. Inorg. Chem. 1988, 27, 734–740. [CrossRef]56. Parr, R.G.; Pearson, R.G. Absolute hardness: Companion parameter to absolute electronegativity. J. Am. Chem. Soc. 1983,
105, 7512–7516. [CrossRef]57. Domingo, L.R.; Arnó, M.; Contreras, R.; Pérez, P. Density functional theory study for the cycloaddition of 1, 3-butadienes with
dimethyl acetylenedicarboxylate. Polar stepwise vs. concerted mechanisms. J. Phys. Chem. A 2002, 106, 952–961. [CrossRef]58. Pérez, P.; Domingo, L.R.; Aizman, A.; Contreras, R. The electrophilicity index in organic chemistry. In Theoretical and Computational
Chemistry; Elsevier: Amsterdam, The Netherlands, 2007; Volume 19, pp. 139–201.
Polymers 2022, 14, 1505 21 of 22
59. Belakhdar, A.; Ferkous, H.; Djellali, S.; Sahraoui, R.; Lahbib, H.; Ben Amor, Y.; Erto, A.; Balsamo, M.; Benguerba, Y. Computationaland experimental studies on the efficiency of Rosmarinus officinalis polyphenols as green corrosion inhibitors for XC48 steel inacidic medium. Colloids Surf. A Physicochem. Eng. Asp. 2020, 606, 125458. [CrossRef]
60. Klamt, A. Conductor-like screening model for real solvents: A new approach to the quantitative calculation of solvationphenomena. J. Phys. Chem. 1995, 99, 2224–2235. [CrossRef]
61. Miller, M.B.; Chen, D.-L.; Xie, H.-B.; Luebke, D.R.; Johnson, J.K.; Enick, R.M. Solubility of CO2 in CO2-philic oligomers;COSMOtherm predictions and experimental results. Fluid Phase Equilibria 2009, 287, 26–32. [CrossRef]
62. Macchi, P.; Sironi, A. Chemical bonding in transition metal carbonyl clusters: Complementary analysis of theoretical andexperimental electron densities. Coord. Chem. Rev. 2003, 238, 383–412. [CrossRef]
63. Salehzadeh, S.; Gholiee, Y. A theoretical study on the encapsulation of halide anions by hexaprotonated form of aliphaticazacryptand 1, 4, 8, 11, 14, 18, 23, 27-octaazabicyclo [9.9.9] nonacosane in both the gas phase and solution. Comput. Theor. Chem.2015, 1060, 43–51. [CrossRef]
64. Grabowski, S.J.; Ugalde, J.M. Bond paths show preferable interactions: Ab initio and QTAIM studies on the X−H···π hydrogenbond. J. Phys. Chem. A 2010, 114, 7223–7229. [CrossRef] [PubMed]
65. Rozas, I.; Alkorta, I.; Elguero, J. Behavior of ylides containing N, O, and C atoms as hydrogen bond acceptors. J. Am. Chem. Soc.2000, 122, 11154–11161. [CrossRef]
66. Te Velde, G.T.; Bickelhaupt, F.M.; Baerends, E.J.; Fonseca Guerra, C.; van Gisbergen, S.J.; Snijders, J.G.; Ziegler, T. Chemistry withADF. J. Comput. Chem. 2001, 22, 931–967. [CrossRef]
67. Bououden, W.; Benguerba, Y.; Darwish, A.S.; Attoui, A.; Lemaoui, T.; Balsamo, M.; Erto, A.; Alnashef, I.M. Surface adsorption ofCrizotinib on carbon and boron nitride nanotubes as Anti-Cancer drug Carriers: COSMO-RS and DFT molecular insights. J. Mol.Liq. 2021, 338, 116666. [CrossRef]
68. Beck, A.D. Density-functional thermochemistry. III. The role of exact exchange. J. Chem. Phys. 1993, 98, 5648. [CrossRef]69. Sulimenko, T.; Stejskal, J.; Krivka, I.; Prokeš, J. Conductivity of colloidal polyaniline dispersions. Eur. Polym. J. 2001,
37, 219–226. [CrossRef]70. Do Nascimento, G.M.; Silva, C.H.; Temperini, M.L. Spectroscopic characterization of the structural changes of polyaniline
nanofibers after heating. Polym. Degrad. Stab. 2008, 93, 291–297. [CrossRef]71. Furukawa, Y.; Ueda, F.; Hyodo, Y.; Harada, I.; Nakajima, T.; Kawagoe, T.M. Vibrational spectra and structure of polyaniline.
Macromolecules 1988, 21, 1297–1305. [CrossRef]72. Skotheim, T.A.; Reynolds, J. Conjugated Polymers: Theory, Synthesis, Properties, and Characterization; CRC Press: Boca Raton, FL,
USA, 2006.73. Kang, E.; Neoh, K.; Tan, K. Polyaniline: A polymer with many interesting intrinsic redox states. Prog. Polym. Sci. 1998,
23, 277–324. [CrossRef]74. Goswami, S.; Nandy, S.; Calmeiro, T.R.; Igreja, R.; Martins, R.; Fortunato, E. Stress induced mechano-electrical writing-reading of
polymer film powered by contact electrification mechanism. Sci. Rep. 2016, 6, 19514. [CrossRef] [PubMed]75. Li, D.; Jiang, Y.; Wu, Z.; Chen, X.; Li, Y. Fabrication of self-assembled polyaniline films by doping-induced deposition. Thin Solid
Films 2000, 360, 24–27. [CrossRef]76. Liu, H.; Chaudhary, D.; Yusa, S.; Tadé, M.O. Glycerol/starch/Na+-montmorillonite nanocomposites: A XRD, FTIR, DSC and 1H
NMR study. Carbohydr. Polym. 2011, 83, 1591–1597. [CrossRef]77. Gautam, V.; Srivastava, A.; Singh, K.P.; Yadav, V.L. Vibrational and gravimetric analysis of polyaniline/polysaccharide composite
materials. Polym. Sci. Ser. A 2016, 58, 206–219. [CrossRef]78. Lindfors, T.; Ivaska, A. Raman based pH measurements with polyaniline. J. Electroanal. Chem. 2005, 580, 320–329. [CrossRef]79. Santha, N.; Sudha, K.; Vijayakumari, K.; Nayar, V.; Moorthy, A.S. Raman and infrared spectra of starch samples of sweet potato
and cassava. J. Chem. Sci. 1990, 102, 705–712. [CrossRef]80. Sovány, T.; Nikowitz, K.; Regdon, G., Jr.; Kása, P., Jr.; Pintye-Hódi, K. Raman spectroscopic investigation of film thickness. Polym.
Test. 2009, 28, 770–772. [CrossRef]81. Scharf, T.; Singer, I. Thickness of diamond-like carbon coatings quantified with Raman spectroscopy. Thin Solid Films 2003,
440, 138–144. [CrossRef]82. Tegge, G. Starch: Properties and Potential; Galliard, T., Ed.; Volume 13 of Critical Reports on Applied Chemistry; John Wiley & Sons:
Chichester, UK, 1987.83. Dome, K.; Podgorbunskikh, E.; Bychkov, A.; Lomovsky, O. Changes in the crystallinity degree of starch having different types of
crystal structure after mechanical pretreatment. Polymers 2020, 12, 641. [CrossRef]84. Łuzny, W.; Sniechowski, M.; Laska, J. Structural properties of emeraldine base and the role of water contents: X-ray diffraction
and computer modelling study. Synth. Met. 2002, 126, 27–35. [CrossRef]85. Doumeng, M.; Makhlouf, L.; Berthet, F.; Marsan, O.; Delbé, K.; Denape, J.; Chabert, F. A comparative study of the crystallinity of
polyetheretherketone by using density, DSC, XRD, and Raman spectroscopy techniques. Polym. Test. 2021, 93, 106878. [CrossRef]86. Lee, D.; Char, K. Thermal degradation behavior of polyaniline in polyaniline/Na+-montmorillonite nanocomposites. Polym.
Degrad. Stab. 2002, 75, 555–560. [CrossRef]87. Wei, Y.; Jang, G.-W.; Hsueh, K.F.; Scherr, E.M.; MacDiarmid, A.G.; Epstein, A.J. Thermal transitions and mechanical properties of
films of chemically prepared polyaniline. Polymer 1992, 33, 314–322. [CrossRef]
Polymers 2022, 14, 1505 22 of 22
88. Ding, L.; Wang, X.; Gregory, R. Thermal properties of chemically synthesized polyaniline (EB) powder. Synth. Met. 1999,104, 73–78. [CrossRef]
89. Hejna, A.; Lenza, J.; Formela, K.; Korol, J. Studies on the combined impact of starch source and multiple processing on selectedproperties of thermoplastic starch/ethylene-vinyl acetate blends. J. Polym. Environ. 2019, 27, 1112–1126. [CrossRef]
90. Htut, K.Z.; Kim, M.; Lee, E.; Lee, G.; Baeck, S.H.; Shim, S.E. Biodegradable polymer-modified graphene/polyaniline electrodesfor supercapacitors. Synth. Met. 2017, 227, 61–70. [CrossRef]
91. Aoki, A.; Umehara, R.; Banba, K. Conductive Polyaniline/Surfactant Ion Complex Langmuir—Blodgett Films. Langmuir 2009,25, 1169–1174. [CrossRef] [PubMed]
92. Aydinli, A.; Yuksel, R.; Unalan, H.E. Vertically aligned carbon nanotube–Polyaniline nanocomposite supercapacitor electrodes.Int. J. Hydrogen Energy 2018, 43, 18617–18625. [CrossRef]
Related Documents