ORIGINAL RESEARCH PEDIATRICS Evolution of T1 Relaxation, ADC, and Fractional Anisotropy during Early Brain Maturation: A Serial Imaging Study on Preterm Infants X J. Schneider, T. Kober, M.B. Graz, X R. Meuli, P.S. Hu ¨ppi, P. Hagmann, and A.C. Truttmann ABSTRACT BACKGROUND AND PURPOSE: The alteration of brain maturation in preterm infants contributes to neurodevelopmental disabilities during childhood. Serial imaging allows understanding of the mechanisms leading to dysmaturation in the preterm brain. The purpose of the present study was to provide reference quantitative MR imaging measures across time in preterm infants, by using ADC, fractional anisotropy, and T1 maps obtained by using the magnetization-prepared dual rapid acquisition of gradient echo technique. MATERIALS AND METHODS: We included preterm neonates born at 30 weeks of gestational age without major brain lesions on early cranial sonography and performed 3 MRIs (3T) from birth to term-equivalent age. Multiple measurements (ADC, fractional anisotropy, and T1 relaxation) were performed on each examination in 12 defined white and gray matter ROIs. RESULTS: We acquired 107 MRIs (35 early, 33 intermediary, and 39 at term-equivalent age) in 39 cerebral low-risk preterm infants. Measures of T1 relaxation time showed a gradual and significant decrease with time in a region- and hemispheric-specific manner. ADC values showed a similar decline with time, but with more variability than T1 relaxation. An increase of fractional anisotropy values was observed in WM regions and inversely a decrease in the cortex. CONCLUSIONS: The gradual change with time reflects the progressive maturation of the cerebral microstructure in white and gray matter. Our study provides reference trajectories from 25 to 40 weeks of gestation of T1 relaxation, ADC, and fractional anisotropy values in low-risk preterm infants. We speculate that deviation thereof might reflect disturbed cerebral maturation; the correlation of this disturbed maturation with neurodevelopmental outcome remains to be addressed. ABBREVIATIONS: FA fractional anisotropy; GA gestational age; MP2RAGE magnetization-prepared dual rapid acquisition of gradient echo; PLIC posterior limb of the internal capsule; R adj 2 correlation coefficient adjusted for the degree of freedom; TEA term-equivalent age; GRAPPA generalized autocalibrating partially parallel acquisition O ffering a prognosis for the neurodevelopment of very pre- term infants remains a challenge, as has recently been shown. 1 Yet, prematurity still carries a high burden of impairment in survivors, affecting motor, cognitive, and socioemotional de- velopment. 2,3 While the motor deficits are frequently linked to moderate or severe WM lesions such as cystic periventricular leu- komalacia or large intraparenchymal hemorrhage, the cognitive abnormalities are probably more related to the mixed picture of brain injury and alteration of cerebral development, 4 coined by Volpe as diffuse encephalopathy of prematurity. 5 A large body of work in the past decades has been devoted to new techniques of Received April 7, 2015; accepted after revision June 11. From the Clinic of Neonatology and Follow-up (J.S., M.B.G., A.C.T.), Department of Pediatrics, and Department of Radiology (T.K., R.M., P.H.), University Hospital Cen- ter and University of Lausanne, Lausanne, Switzerland; Advanced Clinical Imaging Technology (T.K.), Siemens Healthcare IM BM PI, Lausanne, Switzerland; LTS5 (T.K.), E ´ cole Polytechnique Fe ´de ´rale de Lausanne, Lausanne, Switzerland; and Division of Development and Growth (P.S.H.), Department of Pediatrics, University Hospital of Geneva, Geneva, Switzerland. Patric Hagmann and Anita C. Truttmann contributed equally to the study as last coauthors. This work was funded by a Special Program University Medicine from the Swiss National Science Foundation (number 33CM30 –124101). Patric Hagmann is finan- cially supported by the Leenaards Foundation. This work was supported by the Centre d’Imagerie BioMe ´dicale of the University of Lausanne, the Swiss Federal Institute of Technology Lausanne, the University of Geneva, the Centre Hospitalier Universitaire Vaudois, the Ho ˆpitaux Universitaires de Gene `ve, and the Leenaards and the Jeantet Foundations. Paper previously presented at: Annual Meeting of the European Society of Paedi- atric Research, October 11–14, 2013; Porto, Portugal; and Annual Meeting of the Pediatric Academic Societies, April 28 to May 1, 2012; Boston, Massachusetts. Please address correspondence to Anita C. Truttmann, MD, Service de Ne ´onatolo- gie, De ´partement me ´dico-chirurgical de Pe ´diatrie, Maternite ´–CHUV, Ave Pierre- Decker 2, 1011 Lausanne, Switzerland; e-mail: [email protected] Indicates open access to non-subscribers at www.ajnr.org Indicates article with supplemental on-line tables. Indicates article with supplemental on-line photo. http://dx.doi.org/10.3174/ajnr.A4510 AJNR Am J Neuroradiol ●:● ● 2016 www.ajnr.org 1 Published October 22, 2015 as 10.3174/ajnr.A4510 Copyright 2015 by American Society of Neuroradiology.

Welcome message from author
This document is posted to help you gain knowledge. Please leave a comment to let me know what you think about it! Share it to your friends and learn new things together.
Transcript
ORIGINAL RESEARCHPEDIATRICS
Evolution of T1 Relaxation, ADC, and Fractional Anisotropyduring Early Brain Maturation: A Serial Imaging Study on
Preterm InfantsX J. Schneider, T. Kober, M.B. Graz, X R. Meuli, P.S. Huppi, P. Hagmann, and A.C. Truttmann
ABSTRACT
BACKGROUND AND PURPOSE: The alteration of brain maturation in preterm infants contributes to neurodevelopmental disabilitiesduring childhood. Serial imaging allows understanding of the mechanisms leading to dysmaturation in the preterm brain. The purpose ofthe present study was to provide reference quantitative MR imaging measures across time in preterm infants, by using ADC, fractionalanisotropy, and T1 maps obtained by using the magnetization-prepared dual rapid acquisition of gradient echo technique.
MATERIALS AND METHODS: We included preterm neonates born at �30 weeks of gestational age without major brain lesions on earlycranial sonography and performed 3 MRIs (3T) from birth to term-equivalent age. Multiple measurements (ADC, fractional anisotropy, andT1 relaxation) were performed on each examination in 12 defined white and gray matter ROIs.
RESULTS: We acquired 107 MRIs (35 early, 33 intermediary, and 39 at term-equivalent age) in 39 cerebral low-risk preterm infants. Measuresof T1 relaxation time showed a gradual and significant decrease with time in a region- and hemispheric-specific manner. ADC values showeda similar decline with time, but with more variability than T1 relaxation. An increase of fractional anisotropy values was observed in WMregions and inversely a decrease in the cortex.
CONCLUSIONS: The gradual change with time reflects the progressive maturation of the cerebral microstructure in white and graymatter. Our study provides reference trajectories from 25 to 40 weeks of gestation of T1 relaxation, ADC, and fractional anisotropy valuesin low-risk preterm infants. We speculate that deviation thereof might reflect disturbed cerebral maturation; the correlation of thisdisturbed maturation with neurodevelopmental outcome remains to be addressed.
ABBREVIATIONS: FA � fractional anisotropy; GA � gestational age; MP2RAGE � magnetization-prepared dual rapid acquisition of gradient echo; PLIC � posteriorlimb of the internal capsule; Radj
2 � correlation coefficient adjusted for the degree of freedom; TEA � term-equivalent age; GRAPPA � generalized autocalibratingpartially parallel acquisition
Offering a prognosis for the neurodevelopment of very pre-
term infants remains a challenge, as has recently been
shown.1 Yet, prematurity still carries a high burden of impairment
in survivors, affecting motor, cognitive, and socioemotional de-
velopment.2,3 While the motor deficits are frequently linked to
moderate or severe WM lesions such as cystic periventricular leu-
komalacia or large intraparenchymal hemorrhage, the cognitive
abnormalities are probably more related to the mixed picture of
brain injury and alteration of cerebral development,4 coined by
Volpe as diffuse encephalopathy of prematurity.5 A large body of
work in the past decades has been devoted to new techniques of
Received April 7, 2015; accepted after revision June 11.
From the Clinic of Neonatology and Follow-up (J.S., M.B.G., A.C.T.), Department ofPediatrics, and Department of Radiology (T.K., R.M., P.H.), University Hospital Cen-ter and University of Lausanne, Lausanne, Switzerland; Advanced Clinical ImagingTechnology (T.K.), Siemens Healthcare IM BM PI, Lausanne, Switzerland; LTS5 (T.K.),Ecole Polytechnique Federale de Lausanne, Lausanne, Switzerland; and Division ofDevelopment and Growth (P.S.H.), Department of Pediatrics, University Hospital ofGeneva, Geneva, Switzerland.
Patric Hagmann and Anita C. Truttmann contributed equally to the study as lastcoauthors.
This work was funded by a Special Program University Medicine from the SwissNational Science Foundation (number 33CM30 –124101). Patric Hagmann is finan-cially supported by the Leenaards Foundation. This work was supported by theCentre d’Imagerie BioMedicale of the University of Lausanne, the Swiss FederalInstitute of Technology Lausanne, the University of Geneva, the Centre HospitalierUniversitaire Vaudois, the Hopitaux Universitaires de Geneve, and the Leenaardsand the Jeantet Foundations.
Paper previously presented at: Annual Meeting of the European Society of Paedi-atric Research, October 11–14, 2013; Porto, Portugal; and Annual Meeting of thePediatric Academic Societies, April 28 to May 1, 2012; Boston, Massachusetts.
Please address correspondence to Anita C. Truttmann, MD, Service de Neonatolo-gie, Departement medico-chirurgical de Pediatrie, Maternite–CHUV, Ave Pierre-Decker 2, 1011 Lausanne, Switzerland; e-mail: [email protected]
Indicates open access to non-subscribers at www.ajnr.org
Indicates article with supplemental on-line tables.
Indicates article with supplemental on-line photo.
http://dx.doi.org/10.3174/ajnr.A4510
AJNR Am J Neuroradiol ●:● ● 2016 www.ajnr.org 1
Published October 22, 2015 as 10.3174/ajnr.A4510
Copyright 2015 by American Society of Neuroradiology.
MR imaging, specifically addressing the question of the matura-
tion of the preterm brain.
Longitudinal imaging of the growing brain between 25 and 40
weeks of gestation allows assessing neuronal differentiation, gyral
maturation, connecting fiber development, and early myelina-
tion.6 To analyze these features of normal/abnormal maturation,
efficient tools and reference values are still lacking. Several au-
thors have described serial quantitative measures by using appar-
ent diffusion coefficients and fractional anisotropy (FA) in vari-
ous cohorts.7-11 These sequences probe tissue microstructure and
are used as markers of maturation, especially for axonal and den-
dritic organization and myelination. Recently, magnetization-
prepared dual rapid acquisition of gradient echo (MP2RAGE)
emerged as a new technique, which, by obtaining a purely T1-
weighted image, allows the extraction of whole-brain T1 tissue
relaxation time maps to provide quantitative tissue characteriza-
tion.12 The descriptive properties of T1 relaxometry are of particular
interest in the preterm population because they give structural infor-
mation about tissue, such as water content and lipid and macromol-
ecule composition, and draw a picture of the chronologic maturation
of myelin. Moreover, there is a lack of quantitative T1 values for the
assessment of brain development.11,13-15
In this serial imaging study in very preterm infants with cere-
bral low risk, we aimed to provide, for the first time, reference
values for T1 relaxation time, and we hypothesized that their evo-
lution is comparable with that of ADC and FA values, conferring
greater and more precise information about tissue structure.
MATERIALS AND METHODSPatientsNeonates born before 30 weeks of gestation between February
2011 and May 2013 in our level III neonatology unit were consid-
ered for inclusion during the first days of life. Noninclusion
criteria were the following: severe cardiorespiratory instability,
intraventricular hemorrhage grade III and/or parenchymal hemor-
rhagic infarction on early sonography, severe congenital malforma-
tions, and genetic abnormalities. Patients who subsequently devel-
oped severe lesions on MR imaging, who died during the study, or
who had abnormal neurologic assessment at term equivalent age
(TEA) according to the Hammersmith Neonatal Neurologic Exam-
ination16 were excluded from the final analysis. We thus defined the
remaining patients as “cerebral low-risk.” Neonatal variables were
registered prospectively from the medical records.
Ethics approval was provided by the local committee, and
written informed consent was obtained. Specific risks arising
from imaging children younger than 2 years of age were assessed
by the medical team and the institutional review board before the
MR imaging examination.
MR ImagingWe planned 3 sequential MRIs: The first was during the first 2–3
weeks of life, the third at TEA, and the second in-between (from
10 to 20 days of life for the first part of the cohort and at 34 –35
weeks of gestational age for the second part). All MRIs were per-
formed on a 3T Magnetom Trio system (Siemens, Erlangen, Ger-
many). A neonatal MR imaging– compatible incubator (Nomag;
LMT Medical Systems, Luebeck, Germany) equipped with a ded-
icated 8-channel neonatal head coil was used. Monitoring was
provided during scanning (temperature, heart rate, oxygen satu-
ration), and respiratory support was applied when necessary. Pa-
tients received no sedation and wore protective earmuffs
(MiniMuffs; Natus Medical, San Carlos, California). A neonatol-
ogist and a neonatal nurse were present throughout the examina-
tion. The cerebral MR imaging protocol included the following:
1) inversion recovery T1-weighted TSE axial (in-plane resolution,
0.6 mm; section thickness, 3 mm with 10% gap; 35 sections; TR,
8000 ms; TE, 17 ms; FOV, 160 mm; acceleration factor general-
ized autocalibrating partially parallel acquisition (GRAPPA) � 2;
measurement time, 3 minutes 14 seconds); 2) T2-weighted TSE
axial (in-plane resolution, 0.2 mm; section thickness, 2.5 mm with
a 10% gap; 35 sections; TR, 4520 ms; TE, 143 ms; FOV, 160 mm;
acceleration factor GRAPPA � 2; measurement time, 4 minutes
15 seconds); 3) T2-weighted TSE coronal (in-plane resolution, 0.4
mm; section thickness, 1.2 mm with a 10% gap; 100 sections; TR,
5410 ms; TE, 159 ms; FOV, 200 mm; acceleration factor
GRAPPA � 2; measurement time, 4 minutes 59 seconds); 4) 3D
MP2RAGE (in-plane resolution, 0.7 mm; section thickness, 1.2 mm;
TR, 4000 ms; TE, 3.17 ms; FOV, 190 mm; TI 1, 900 ms; TI 2, 2200 ms;
acceleration factor GRAPPA � 2; measurement time, 4 minutes 58
seconds); 5) DTI (in-plane resolution, 2 mm; section thickness, 2
mm with no gap; 43 sections; TR, 5200 ms; TE, 84 ms; FOV, 192 mm;
b-value 1, 0 s/mm2; b-value 2, 1000 s/mm2; diffusion encoding direc-
tions, 82 and 5 B0 images; acceleration factor GRAPPA � 3; mea-
surement time, 7 minutes 29 seconds). The standard ADC and FA
maps generated by the scanner software were used in this study. No
additional motion and eddy current corrections were performed.
The vendor computes ADC and FA maps according to Basser et al17
by using a least square estimation of the tensor.
Using T2, inversion recovery T1, and MP2RAGE, we calcu-
lated scores for severity at TEA according to Kidokoro et al,18
including 6 items in the WM and 7 items in the GM and cerebel-
lum. A global score (WM � GM and cerebellum score) was cal-
culated and classified as normal (0 –3), mild (4 –7), moderate (8 –
11), and severe (�12). Two neonatologists experienced in reading
MR imaging calculated the score. Intraventricular hemorrhages
were graded according to Papile,19 and WM and cerebellar lesions
were also described.
Twelve ROIs were identified with anatomic landmarks on 5
different sections for the WM (frontal, central, parietal, posterior
limb of internal capsule [PLIC]; corpus callosum genu and sp-
lenium; and optic radiations) and the GM (frontal, perirolandic,
and parietal cortices; thalamus; and lentiform nucleus). Freehand
ROIs were drawn to maximize the size and avoid the risk of
GM/WM contamination, as shown in On-line Fig 1. Each ROI
was placed on the DTI sequence to measure ADC and FA and on
the T1 map obtained from the MP2RAGE sequence to calculate
the effective T1 relaxation time.12
Neurodevelopmental OutcomeThe patients were offered neurodevelopmental follow-up at 6 and
18 months of corrected age. A developmental pediatrician blinded
to the neuroimaging findings performed a developmental assess-
ment by using the Bayley Scales of Infant Development II, which
entails a mental developmental index and a psychomotor devel-
2 Schneider ● 2016 www.ajnr.org
opmental index. The test mean is 100 � 15; a score �2 SDs means
a severe delay.
Statistical AnalysesStatistical analyses were performed by using Matlab R2014b
(MathWorks, Natick, Massachusetts) and STATA 13.0 (Stata-
Corp, College Station, Texas). The different associations were an-
alyzed with linear and quadratic regression. The correlation coef-
ficient adjusted for the df (Radj2) was used to identify the model
with the best explanatory power. The Pearson linear correlation
(R) was used to compare T1 relaxation time and ADC or FA
values. The dispersion of ADC and T1 values was compared with
a 1-sided t test applied on the normalized root mean square error
of each marker. Demographic and neonatal variables were com-
pared with the Student t test (continuous variables) and with the
Fisher exact test (categoric variables). Statistical significance was
defined as P � .05.
RESULTSDescription of the PopulationAmong 126 eligible patients, 51 preterm neonates were recruited.
Reasons for not being included were parental refusal (n � 26),
early death (n � 9), cardiorespiratory instability (n � 13), early
transfer to peripheral hospital (n � 11), or absent recruiting per-
son (n � 16). Twelve patients were excluded from the final anal-
ysis because of severe lesions on brain MR imaging (MR imaging
scores �8 or parenchymal hemorrhagic infarction), death, with-
drawal of consent, or abnormal neurologic examination findings
at TEA. We thus show the characteristics of the population based
on 39 cerebral low-risk preterm neonates (Table).
Conventional MR Imaging and Scoring SystemOne hundred seven MR imaging examinations were performed;
35 early, 33 intermediary, and 39 at TEA. Thirty patients under-
went 3 serial MRIs, 8 patients had 2, and 1 patient had only 1. The
assessment of the image quality allowed considering 86% of the
scans as good or with minimal motion artifacts.
Several mild cerebral lesions were diagnosed on the conven-
tional sequences, including intraventricular hemorrhages grade I
(n � 5) and grade II (n � 2), punctuate WM lesions (n � 3), and
punctuate cerebellar hemorrhages (n � 4). Two patients had 2
types of lesions (intraventricular hemorrhage grade I and punc-
tuate WM lesions).
The scoring system could be applied on 37 MRIs at TEA: The
global score was within the normal range for 16 and mildly ab-
normal for 21 patients, and no patient had a moderate or severe
score. The MR images and scoring system, including brain met-
rics, are detailed in On-line Table 1.
Quantitative Measures
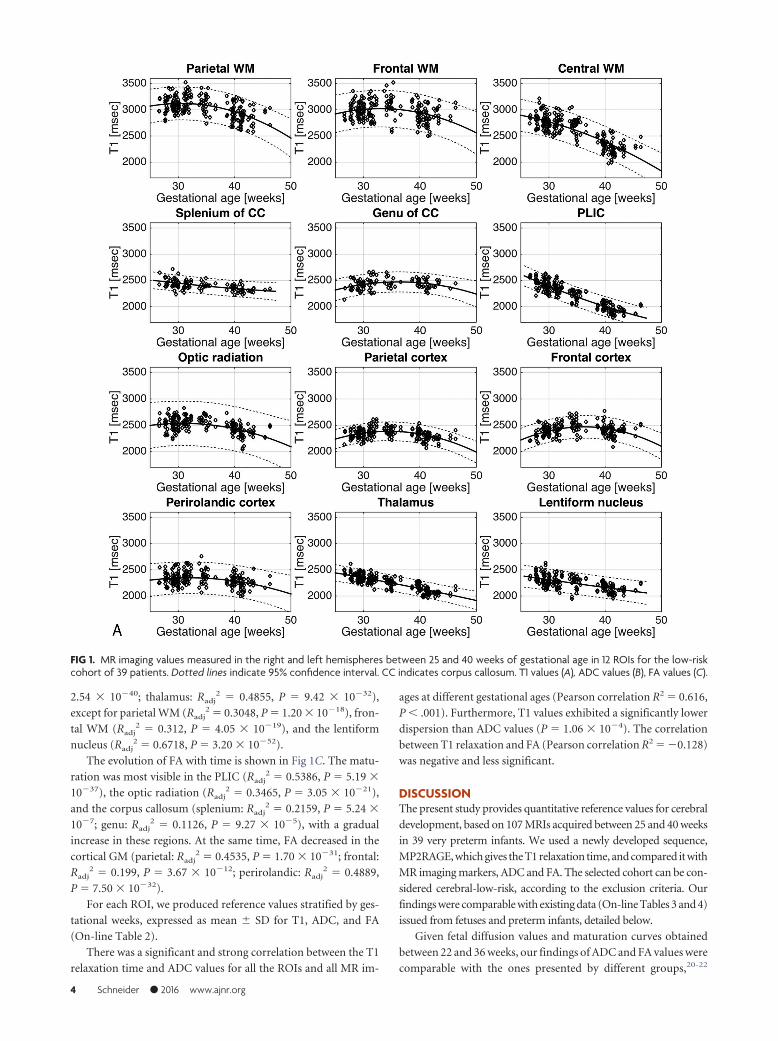
T1 Relaxation. In Fig 1A, T1 relaxation values (milliseconds)
measured in the 12 ROIs of the right and left hemispheres on the
serial images of the 39 patients are presented. Maturation in the
different cerebral regions was reflected by a gradual decrease of T1
with time. The PLIC matured the fastest (Radj2 � 0.8242, P �
8.09 � 10�81). The values in the WM of the corona radiata showed
a fast and continuous decrease until TEA (Radj2 � 0.663, P � 1.61 �
10�51). The parietal (Radj2 � 0.2833, P � 2.00 � 10�17) and frontal
WM (Radj2 � 0.0803, P � 5.65 � 10�6) matured along a shouldered
curve, which peaks around 30 weeks of gestational age (GA). The
deep GM matured simultaneous to WM, especially the thalamus
(Radj2 � 0.6814, P � 5.66 � 10�49) and the lentiform nucleus (Radj
2
� 0.3747, P � 1.06 � 10�24). The cortex showed little change with
time. The maturation in the different areas of the cortex at TEA was
gradual: first in the perirolandic, then in the parietal, and finally in the
frontal cortex (see On-line Table 2 for T1 values).
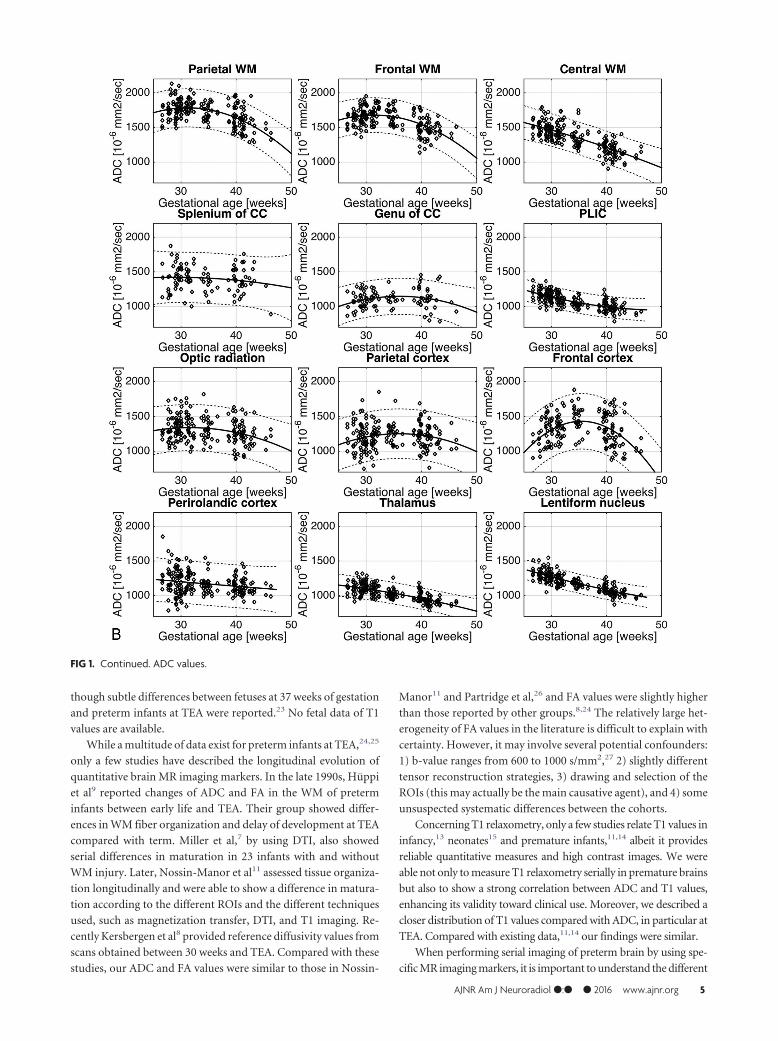
ADC values are represented in Fig 1B, and strengths of the
correlations were less strong in almost all the regions (PLIC:
Radj2 � 0.4816, P � 8.31 � 10�32; central WM: Radj
2 � 0.566, P �
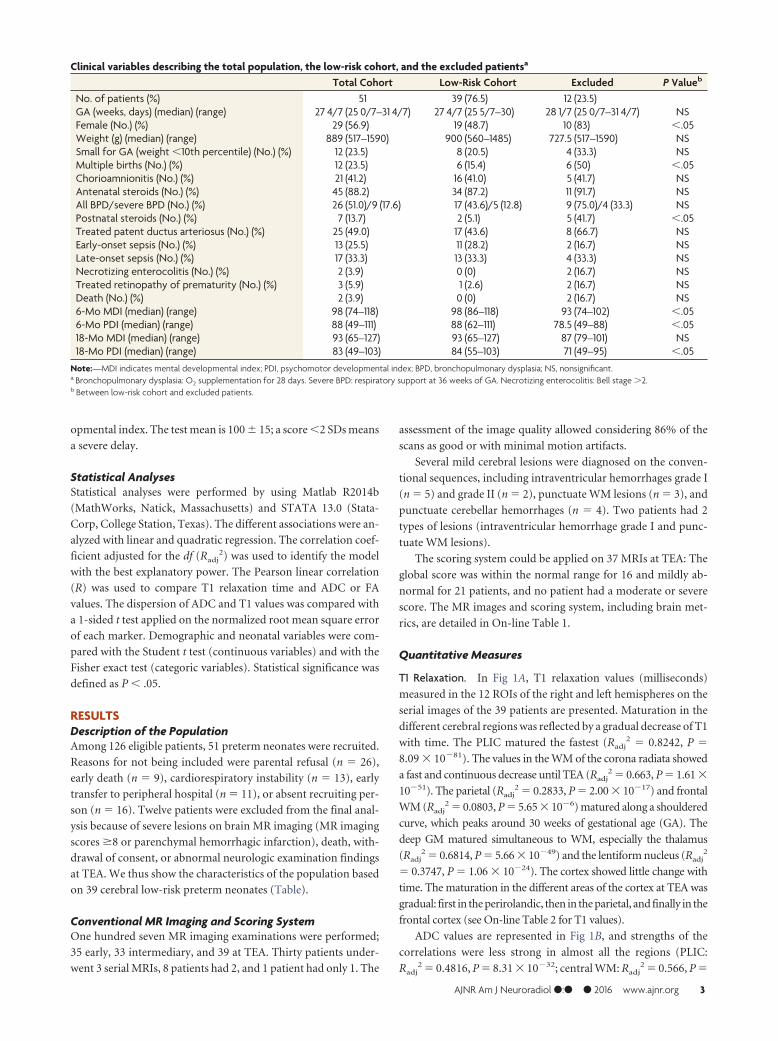
Clinical variables describing the total population, the low-risk cohort, and the excluded patientsa
Total Cohort Low-Risk Cohort Excluded P Valueb
No. of patients (%) 51 39 (76.5) 12 (23.5)GA (weeks, days) (median) (range) 27 4/7 (25 0/7–31 4/7) 27 4/7 (25 5/7–30) 28 1/7 (25 0/7–31 4/7) NSFemale (No.) (%) 29 (56.9) 19 (48.7) 10 (83) �.05Weight (g) (median) (range) 889 (517–1590) 900 (560–1485) 727.5 (517–1590) NSSmall for GA (weight �10th percentile) (No.) (%) 12 (23.5) 8 (20.5) 4 (33.3) NSMultiple births (No.) (%) 12 (23.5) 6 (15.4) 6 (50) �.05Chorioamnionitis (No.) (%) 21 (41.2) 16 (41.0) 5 (41.7) NSAntenatal steroids (No.) (%) 45 (88.2) 34 (87.2) 11 (91.7) NSAll BPD/severe BPD (No.) (%) 26 (51.0)/9 (17.6) 17 (43.6)/5 (12.8) 9 (75.0)/4 (33.3) NSPostnatal steroids (No.) (%) 7 (13.7) 2 (5.1) 5 (41.7) �.05Treated patent ductus arteriosus (No.) (%) 25 (49.0) 17 (43.6) 8 (66.7) NSEarly-onset sepsis (No.) (%) 13 (25.5) 11 (28.2) 2 (16.7) NSLate-onset sepsis (No.) (%) 17 (33.3) 13 (33.3) 4 (33.3) NSNecrotizing enterocolitis (No.) (%) 2 (3.9) 0 (0) 2 (16.7) NSTreated retinopathy of prematurity (No.) (%) 3 (5.9) 1 (2.6) 2 (16.7) NSDeath (No.) (%) 2 (3.9) 0 (0) 2 (16.7) NS6-Mo MDI (median) (range) 98 (74–118) 98 (86–118) 93 (74–102) �.056-Mo PDI (median) (range) 88 (49–111) 88 (62–111) 78.5 (49–88) �.0518-Mo MDI (median) (range) 93 (65–127) 93 (65–127) 87 (79–101) NS18-Mo PDI (median) (range) 83 (49–103) 84 (55–103) 71 (49–95) �.05
Note:—MDI indicates mental developmental index; PDI, psychomotor developmental index; BPD, bronchopulmonary dysplasia; NS, nonsignificant.a Bronchopulmonary dysplasia: O2 supplementation for 28 days. Severe BPD: respiratory support at 36 weeks of GA. Necrotizing enterocolitis: Bell stage �2.b Between low-risk cohort and excluded patients.
AJNR Am J Neuroradiol ●:● ● 2016 www.ajnr.org 3
2.54 � 10�40; thalamus: Radj2 � 0.4855, P � 9.42 � 10�32),
except for parietal WM (Radj2 � 0.3048, P � 1.20 � 10�18), fron-
tal WM (Radj2 � 0.312, P � 4.05 � 10�19), and the lentiform
nucleus (Radj2 � 0.6718, P � 3.20 � 10�52).
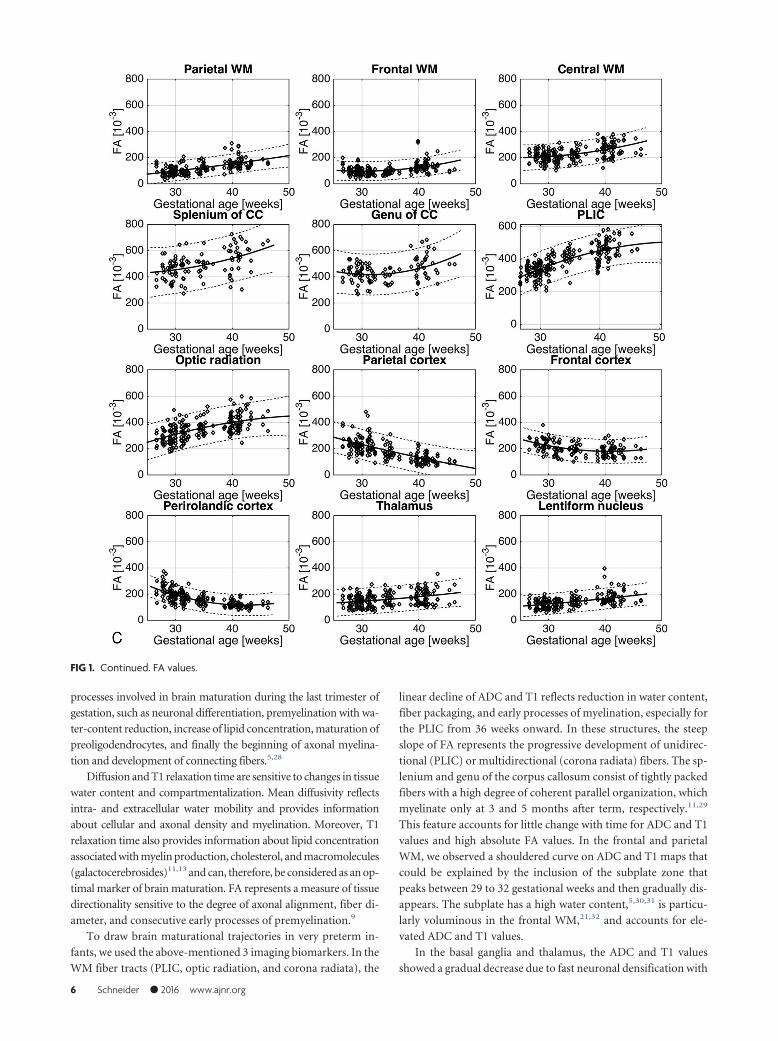
The evolution of FA with time is shown in Fig 1C. The matu-
ration was most visible in the PLIC (Radj2 � 0.5386, P � 5.19 �
10�37), the optic radiation (Radj2 � 0.3465, P � 3.05 � 10�21),
and the corpus callosum (splenium: Radj2 � 0.2159, P � 5.24 �
10�7; genu: Radj2 � 0.1126, P � 9.27 � 10�5), with a gradual
increase in these regions. At the same time, FA decreased in the
cortical GM (parietal: Radj2 � 0.4535, P � 1.70 � 10�31; frontal:
Radj2 � 0.199, P � 3.67 � 10�12; perirolandic: Radj
2 � 0.4889,
P � 7.50 � 10�32).
For each ROI, we produced reference values stratified by ges-
tational weeks, expressed as mean � SD for T1, ADC, and FA
(On-line Table 2).
There was a significant and strong correlation between the T1
relaxation time and ADC values for all the ROIs and all MR im-
ages at different gestational ages (Pearson correlation R2 � 0.616,
P � .001). Furthermore, T1 values exhibited a significantly lower
dispersion than ADC values (P � 1.06 � 10�4). The correlation
between T1 relaxation and FA (Pearson correlation R2 � �0.128)
was negative and less significant.
DISCUSSIONThe present study provides quantitative reference values for cerebral
development, based on 107 MRIs acquired between 25 and 40 weeks
in 39 very preterm infants. We used a newly developed sequence,
MP2RAGE, which gives the T1 relaxation time, and compared it with
MR imaging markers, ADC and FA. The selected cohort can be con-
sidered cerebral-low-risk, according to the exclusion criteria. Our
findings were comparable with existing data (On-line Tables 3 and 4)
issued from fetuses and preterm infants, detailed below.
Given fetal diffusion values and maturation curves obtained
between 22 and 36 weeks, our findings of ADC and FA values were
comparable with the ones presented by different groups,20-22
FIG 1. MR imaging values measured in the right and left hemispheres between 25 and 40 weeks of gestational age in 12 ROIs for the low-riskcohort of 39 patients. Dotted lines indicate 95% confidence interval. CC indicates corpus callosum. T1 values (A), ADC values (B), FA values (C).
4 Schneider ● 2016 www.ajnr.org
though subtle differences between fetuses at 37 weeks of gestation
and preterm infants at TEA were reported.23 No fetal data of T1
values are available.
While a multitude of data exist for preterm infants at TEA,24,25
only a few studies have described the longitudinal evolution of
quantitative brain MR imaging markers. In the late 1990s, Huppi
et al9 reported changes of ADC and FA in the WM of preterm
infants between early life and TEA. Their group showed differ-
ences in WM fiber organization and delay of development at TEA
compared with term. Miller et al,7 by using DTI, also showed
serial differences in maturation in 23 infants with and without
WM injury. Later, Nossin-Manor et al11 assessed tissue organiza-
tion longitudinally and were able to show a difference in matura-
tion according to the different ROIs and the different techniques
used, such as magnetization transfer, DTI, and T1 imaging. Re-
cently Kersbergen et al8 provided reference diffusivity values from
scans obtained between 30 weeks and TEA. Compared with these
studies, our ADC and FA values were similar to those in Nossin-
Manor11 and Partridge et al,26 and FA values were slightly higher
than those reported by other groups.8,24 The relatively large het-
erogeneity of FA values in the literature is difficult to explain with
certainty. However, it may involve several potential confounders:
1) b-value ranges from 600 to 1000 s/mm2,27 2) slightly different
tensor reconstruction strategies, 3) drawing and selection of the
ROIs (this may actually be the main causative agent), and 4) some
unsuspected systematic differences between the cohorts.
Concerning T1 relaxometry, only a few studies relate T1 values in
infancy,13 neonates15 and premature infants,11,14 albeit it provides
reliable quantitative measures and high contrast images. We were
able not only to measure T1 relaxometry serially in premature brains
but also to show a strong correlation between ADC and T1 values,
enhancing its validity toward clinical use. Moreover, we described a
closer distribution of T1 values compared with ADC, in particular at
TEA. Compared with existing data,11,14 our findings were similar.
When performing serial imaging of preterm brain by using spe-
cific MR imaging markers, it is important to understand the different
FIG 1. Continued. ADC values.
AJNR Am J Neuroradiol ●:● ● 2016 www.ajnr.org 5
processes involved in brain maturation during the last trimester of
gestation, such as neuronal differentiation, premyelination with wa-
ter-content reduction, increase of lipid concentration, maturation of
preoligodendrocytes, and finally the beginning of axonal myelina-
tion and development of connecting fibers.5,28
Diffusion and T1 relaxation time are sensitive to changes in tissue
water content and compartmentalization. Mean diffusivity reflects
intra- and extracellular water mobility and provides information
about cellular and axonal density and myelination. Moreover, T1
relaxation time also provides information about lipid concentration
associated with myelin production, cholesterol, and macromolecules
(galactocerebrosides)11,13 and can, therefore, be considered as an op-
timal marker of brain maturation. FA represents a measure of tissue
directionality sensitive to the degree of axonal alignment, fiber di-
ameter, and consecutive early processes of premyelination.9
To draw brain maturational trajectories in very preterm in-
fants, we used the above-mentioned 3 imaging biomarkers. In the
WM fiber tracts (PLIC, optic radiation, and corona radiata), the
linear decline of ADC and T1 reflects reduction in water content,
fiber packaging, and early processes of myelination, especially for
the PLIC from 36 weeks onward. In these structures, the steep
slope of FA represents the progressive development of unidirec-
tional (PLIC) or multidirectional (corona radiata) fibers. The sp-
lenium and genu of the corpus callosum consist of tightly packed
fibers with a high degree of coherent parallel organization, which
myelinate only at 3 and 5 months after term, respectively.11,29
This feature accounts for little change with time for ADC and T1
values and high absolute FA values. In the frontal and parietal
WM, we observed a shouldered curve on ADC and T1 maps that
could be explained by the inclusion of the subplate zone that
peaks between 29 to 32 gestational weeks and then gradually dis-
appears. The subplate has a high water content,5,30,31 is particu-
larly voluminous in the frontal WM,21,32 and accounts for ele-
vated ADC and T1 values.
In the basal ganglia and thalamus, the ADC and T1 values
showed a gradual decrease due to fast neuronal densification with
FIG 1. Continued. FA values.
6 Schneider ● 2016 www.ajnr.org
ongoing myelination, as described starting around 26 weeks.29 In
FA, these subcortical GM structures exhibited little change with
time because of the low directionality of neuronal and glial con-
tent. In the frontal and parietal cortex, the evolution of ADC and
T1 values showed a shouldered curve with maximum values
around 35 weeks, possibly related to programmed cell death and
additional neuropil before 35 weeks33,34 and higher neuronal at-
tenuation afterward. The perirolandic cortex seemed to mature
faster than other cortical regions, and this accelerated maturation
has been described in areas with primary function, such as the
sensorimotor cortex.34,35 The observed decline of the FA is attrib-
uted to the preferential reduction in the radial component of wa-
ter diffusivity, reflecting the loss of the radial glial cells and the
extension of dendrites of pyramidal cells.32-35
The present study has a number of limitations. We assumed
that our cohort was at cerebral low-risk, given their clinical evo-
lution and the absence of major cerebral lesions. Neurodevelop-
mental outcome at 6 and 18 months showed that no patient had
cerebral palsy, blindness, or hearing loss, and the distribution of
developmental scores was typical for this population of preterm
infants. Furthermore, because patients with moderate or severe
brain lesions were scarce, we could not compare their values with
those obtained from the selected low-risk patients. Finally, com-
parison with healthy control fetuses and term neonates was not
available.
In this study, we propose reference values of T1 relaxometry,
which could represent a precise and complementary tool to inves-
tigate brain development with time. We speculate that deviation
of the described trajectories might reflect disturbed maturation,
and this could add valuable information for the diagnosis of en-
cephalopathy of prematurity.4,5 Kinney and Volpe28 described
“altered developmental trajectories, combined with acquired in-
sults and reparative phenomena” to characterize this entity, in
which all the structures detailed above are affected. Oligodendro-
cyte differentiation, axonal growth, subplate organization, and
maturation of the subcortical structures represent features that
are likely to be affected by prematurity.
CONCLUSIONSOur study evaluated, longitudinally and serially, the cerebral de-
velopmental trajectories of a cohort of cerebral low-risk preterm
infants born at fewer than 30 weeks of gestation. On the successive
MP2RAGE and DTI sequences, we observed a gradual decline
with time of ADC and T1 relaxation time and changes of FA in the
described 12 ROIs, reflecting the specific and sequential matura-
tional changes occurring during development in the WM and GM
microstructures. T1 maps confer high contrast, are easy to analyze,
and thus appear as a promising complementary biomarker of cere-
bral maturation. We provide reference values for T1 relaxation,
ADC, and FA, and we speculate that deviation thereof might reflect
disturbed cerebral maturation; the correlation of this disturbed mat-
uration with neurodevelopmental outcome remains to be addressed.
ACKNOWLEDGMENTSWe thank Professor J.-F. Tolsa for his tremendous support.
Disclosures: Juliane Schneider—RELATED: Swiss National Science Foundation, Com-ments: National Grant (No. 33CM30 –124101) allocated to a multidisciplinary projecton brain development in preterm infants, performed in 3 academic sites, of whichthe University Hospital of Lausanne is 1 partner; Support for Travel to Meetings forthe Study or Other Purposes: Swiss National Science Foundation (National Grant(No. 33CM30 –124101). Tobias Kober—UNRELATED: Employment: I have been an em-ployee of Siemens Healthcare Switzerland since 2011. Petra S. Huppi—RELATED:Grant: Swiss National Science Foundation*; UNRELATED: Grants/Grants Pending:Swiss National Science Foundation,* European Commission,* Nestle Research Cen-ter.* Patric Hagmann—RELATED: Grant: Leenaards Foundation*; UNRELATED:Grants/Grants Pending: Swiss National Science Foundation.* Anita Truttmann—RELATED: Grant: Swiss National Science Foundation.* Money paid to the institution.
REFERENCES1. Van’t Hooft J, van der Lee JH, Opmeer BC, et al. Predicting develop-
mental outcomes in premature infants by term equivalent MRI:systematic review and meta-analysis. Syst Rev 2015;4:71 CrossRefMedline
2. Moore T, Hennessy EM, Myles J, et al. Neurological and develop-mental outcome in extremely preterm children born in England in1995 and 2006: the EPICure studies. BMJ 2012;345:e7961 CrossRefMedline
3. Marret S, Marchand-Martin L, Picaud JC, et al; EPIPAGE StudyGroup. Brain injury in very preterm children and neurosensory andcognitive disabilities during childhood: the EPIPAGE cohort study.PLoS One 2013;8:e62683 CrossRef Medline
4. Back SA, Miller SP. Brain injury in premature neonates: a primarycerebral dysmaturation disorder? Ann Neurol 2014;75:469 – 86CrossRef Medline
5. Volpe JJ. Brain injury in premature infants: a complex amalgam ofdestructive and developmental disturbances. Lancet Neurol 2009;8:110 –24 CrossRef Medline
6. Volpe JJ. Neuronal proliferation, migration, organization, and my-elination. In: Neurology of the Newborn. 5th ed. New York: Saunders;2008:51–117
7. Miller SP, Vigneron DB, Henry RG, et al. Serial quantitative diffu-sion tensor MRI of the premature brain: development in newbornswith and without injury. J Magn Reson Imaging 2002;16:621–32CrossRef Medline
8. Kersbergen KJ, Leemans A, Groenendaal F, et al. Microstructuralbrain development between 30 and 40 weeks corrected age in a lon-gitudinal cohort of extremely preterm infants. Neuroimage 2014;103:214 –24 CrossRef Medline
9. Huppi PS, Maier SE, Peled S, et al. Microstructural development ofhuman newborn cerebral white matter assessed in vivo by diffusiontensor magnetic resonance imaging. Pediatr Res 1998;44:584 –90CrossRef Medline
10. Chau V, Synnes A, Grunau RE, et al. Abnormal brain maturation inpreterm neonates associated with adverse developmental out-comes. Neurology 2013;81:2082– 89 CrossRef Medline
11. Nossin-Manor R, Card D, Morris D, et al. Quantitative MRI in thevery preterm brain: assessing tissue organization and myelinationusing magnetization transfer, diffusion tensor and T1 imaging.Neuroimage 2013;64:505–16 CrossRef Medline
12. Marques JP, Kober T, Krueger G, et al. MP2RAGE, a self bias-fieldcorrected sequence for improved segmentation and T1-mapping athigh field. Neuroimage 2010;49:1271– 81 CrossRef Medline
13. Deoni SC, Dean DC 3rd, O’Muircheartaigh J, et al. Investigatingwhite matter development in infancy and early childhood usingmyelin water faction and relaxation time mapping. Neuroimage2012;63:1038 –53 CrossRef Medline
14. Williams LA, Gelman N, Picot PA, et al. Neonatal brain: regionalvariability of in vivo MR imaging relaxation rates at 3.0 T—initialexperience. Radiology 2005;235:595– 603 CrossRef Medline
15. Maitre NL, Slaughter JC, Stark AR, et al. Validation of a brain MRIrelaxometry protocol to measure effects of preterm birth at a flexi-ble postnatal age. BMC Pediatr 2014;14:84 CrossRef Medline
16. Dubowitz LM, Dubowitz V, Palmer P, et al. A new approach to the
AJNR Am J Neuroradiol ●:● ● 2016 www.ajnr.org 7
neurological assessment of the preterm and full-term newborn in-fant. Brain Dev 1980;2:3–14 CrossRef Medline
17. Basser PJ, Mattiello J, LeBihan D. MR diffusion tensor spectroscopyand imaging. Biophys J 1994;66:259 – 67 CrossRef Medline
18. Kidokoro H, Neil JJ, Inder TE. New MR imaging assessment tool todefine brain abnormalities in very preterm infants at term. AJNRAm J Neuroradiol 2013;34:2208 –14 CrossRef Medline
19. Papile LA, Burstein J, Burstein R, et al. Incidence and evolution ofsubependymal and intraventricular hemorrhage: a study of infantswith birth weights less than 1,500 gm. J Pediatr 1978;92:529 –34CrossRef Medline
20. Schneider MM, Berman JI, Baumer FM, et al. Normative apparentdiffusion coefficient values in the developing fetal brain. AJNR Am JNeuroradiol 2009;30:1799 – 803 CrossRef Medline
21. Schneider JF, Confort-Gouny S, Le Fur Y, et al. Diffusion-weightedimaging in normal fetal brain maturation. Eur Radiol 2007;17:2422–29 CrossRef Medline
22. Trivedi R, Gupta RK, Husain N, et al. Region-specific maturation ofcerebral cortex in human fetal brain: diffusion tensor imaging andhistology. Neuroradiology 2009;51:567–76 CrossRef Medline
23. Viola A, Confort-Gouny S, Schneider JF, et al. Is brain maturationcomparable in fetuses and premature neonates at term equivalentage? AJNR Am J Neuroradiol 2011;32:1451–58 CrossRef Medline
24. Rose J, Vassar R, Cahill-Rowley K, et al. Brain microstructural devel-opment at near-term age in very-low-birth-weight preterm infants:an atlas-based diffusion imaging study. Neuroimage 2014;86:244 –56 CrossRef Medline
25. Oishi K, Mori S, Donohue PK, et al. Multi-contrast human neonatalbrain atlas: application to normal neonate development analysis.Neuroimage 2011;56:8 –20 CrossRef Medline
26. Partridge SC, Mukherjee P, Henry RG, et al. Diffusion tensorimaging: serial quantitation of white matter tract maturity in pre-mature newborns. Neuroimage 2004;22:1302–14 CrossRef Medline
27. Chung AW, Thomas DL, Ordidge RJ, et al. Diffusion tensor param-eters and principal eigenvector coherence: relation to b-value inter-vals and field strength. Magn Reson Imaging 2013;31:742– 47CrossRef Medline
28. Kinney HC, Volpe JJ. Modeling the encephalopathy of prematurity
in animals: the important role of translational research. Neurol ResInt 2012;2012:295389 CrossRef Medline
29. Counsell SJ, Maalouf EF, Fletcher AM, et al. MR imaging assessmentof myelination in the very preterm brain. AJNR Am J Neuroradiol2002;23:872– 81 Medline
30. Kostovic I, Jovanov-Milosevic N, Rados M, et al. Perinatal and earlypostnatal reorganization of the subplate and related cellular com-partments in the human cerebral wall as revealed by histologicaland MRI approaches. Brain Struct Funct 2014;219:231–53 CrossRefMedline
31. Raybaud C, Ahmad T, Rastegar N, et al. The premature brain: devel-opmental and lesional anatomy. Neuroradiology 2013;55(suppl 2):23– 40 CrossRef Medline
32. Dudink J, Buijs J, Govaert P, et al. Diffusion tensor imaging of thecortical plate and subplate in very-low-birth-weight infants. PediatrRadiol 2010;40:1397– 404 CrossRef Medline
33. McKinstry RC, Mathur A, Miller JH, et al. Radial organization ofdeveloping preterm human cerebral cortex revealed by non-inva-sive water diffusion anisotropy MRI. Cereb Cortex 2002;12:1237– 43CrossRef Medline
34. Ball G, Srinivasan L, Aljabar P, et al. Development of cortical micro-structure in the preterm human brain. Proc Natl Acad Sci U S A2013;110:9541– 46 CrossRef Medline
35. Deipolyi AR, Mukherjee P, Gill K, et al. Comparing microstructuraland macrostructural development of the cerebral cortex in prema-ture newborns: diffusion tensor imaging versus cortical gyration.Neuroimage 2005;27:579 – 86 CrossRef Medline
36. Rose J, Butler EE, Lamont LE, et al. Neonatal brain structure on MRIand diffusion tensor imaging, sex, and neurodevelopment in very-low-birthweight preterm children. Dev Med Child Neurol 2009;51:526 –35 CrossRef Medline
37. Cheong JL, Thompson DK, Wand HX, et al. Abnormal white mattersignal on MR Imaging is related to abnormal tissue microstructure.AJNR Am J Neuroradiol 2009;30:623–28 CrossRef Medline
38. Jones RA, Palasis S, Grattan-Smith JD. MRI of the neonatal brain:optimization of spin-echo parameters. AJR Am J Roentgenol 2004;182:367–72 Medline
8 Schneider ● 2016 www.ajnr.org
Related Documents