European Technology Update European Technology Update October 27, 2010 Thierry Monjauze Thierry Monjauze Managing Director 63 Brook Street London W1K 4HS United Kingdom Phone: +44 20 7518 8901 [email protected] Francois Morin Vice President 63 Brook Street www.harriswilliams.com This report has been prepared by Harris Williams & Co. Ltd and approved by Sturgeon Ventures LLP in accordance with Conduct Of Business rules COBS 4 of the FSA Handbook. Harris Williams & Co. Ltd is an authorised representative of Sturgeon Ventures LLP which is Authorised and Regulated by the Financial Services Authority. This report is being made by Harris Williams & Co Ltd. Investment banking services are provided by Harris Williams LLC, a registered broker-dealer and member of FINRA and SIPC, and Harris Williams & Co. Ltd. Harris Williams & Co. is a trade name under which Harris Williams LLC and Harris Williams & Co. Ltd conduct business in the U.S. and Europe, respectively. 63 Brook Street London W1K 4HS United Kingdom Phone: +44 20 7518 8907 [email protected]

Welcome message from author
This document is posted to help you gain knowledge. Please leave a comment to let me know what you think about it! Share it to your friends and learn new things together.
Transcript
European Technology UpdateEuropean Technology UpdateOctober 27, 2010
Thierry MonjauzeThierry MonjauzeManaging Director63 Brook StreetLondon W1K 4HSUnited KingdomPhone: +44 20 7518 [email protected]
Francois MorinVice President63 Brook Street
www.harriswilliams.comThis report has been prepared by Harris Williams & Co. Ltd and approved by Sturgeon Ventures LLP in accordance with Conduct Of Business rules COBS 4 of the FSA Handbook.
Harris Williams & Co. Ltd is an authorised representative of Sturgeon Ventures LLP which is Authorised and Regulated by the Financial Services Authority. This report is being made by Harris Williams & Co Ltd. Investment banking services are provided by Harris Williams LLC, a registered broker-dealer and member of FINRA and SIPC, and Harris
Williams & Co. Ltd. Harris Williams & Co. is a trade name under which Harris Williams LLC and Harris Williams & Co. Ltd conduct business in the U.S. and Europe, respectively.
63 Brook StreetLondon W1K 4HSUnited KingdomPhone: +44 20 7518 [email protected]
Recent Developments
Verifone and Gemalto entered into an EMV payments joint venture and VeriFone is in exclusive negotiations to acquire Gemalto’s POS solutions division
Japanese social gaming company DeNA agreed to acquire U.S.-based iPhone game developer Ngmoco for $400 million in one of the largest iPhone app deals
Austrian IT services firm S&T is in discussions to be acquired by Japanese telecom group KDDI1
IBM is rumoured to be preparing a bid for U.K.-based software company Micro Focus1
Company Specific
News
p
Yahoo! is rumoured to be considering a bid for online deal site Groupon2
U.K. video game developer All Things Digital is rumoured to be targeted by Electronic Arts1
Online travel agent TravelPartner has agreed to be acquired by European Travel Interactive, a portfolio company of Segulah Advisors
Technicolor is in the process of selling PRN in addition to the recently announced sale of its 50% interest in Screenvisionto Shamrock Capital for $60 million
Frog Capital has acquired a more than 10% stake in AIM-listed identity verification services provider GB Group Italian software provider Think3 has been acquired by Versata Enterprises Enterprise software provider Autonomy has stated that it expects to announce its next major acquisition this fall Exponent Private Equity is contemplating strategic alternatives for trainline, a British online retailer of train tickets HIG Capital invested £30.5 million in U.K. marketing services provider Engine Group and has committed an additional
£30 million to be invested over the next two years Dansk Kapitalanlaeg has acquired a 31% stake in Danish IT security company Secunia System-on-chip developer UltraSoC has raised £2 million from Octopus Investments Textbroker.com developer Sario Marketing has raised a multi-million Euro financing round from ViewPoint Capital
Partners Spanish deal site Groupalia has raised €5 million from Nauta Capital and Caixa Capital U.K. veterinary medicine and pet product online retailer MedicAnimal.com has raised £5 million in a round led by Iris
Capital Internet video provider Veebeam has raised $6 million from Amadeus Capital Partners, Intel Capital Partners and Oak
I t t P tInvestment Partners Austrian augmented reality browser provider Mobilizy, developer of Wikitude, raised a round of financing from Gamma
Capital Partners and tecnet Capital noris network, a German outsourced IT services provider, has raised a round of financing from BayBG Online gambling company Betfair priced its IPO on the LSE at £13 per share, valuing the company at £1.4 billion, and
saw a 19% first day share price rise Intel reported a 59% jump in third-quarter profits on an 18% increase in revenue Microsoft announced that Windows Phone 7 mobile operating system will launch on HTC, Samsung, Dell and LG
phones in November Apple posted a 67% rise in revenue and a 70% increase in profit for its fourth fiscal quarter, although iPad sales came in
lower than expectations on supply limitationslower than expectations on supply limitations Ebay announced a 23% rise in earnings for the third quarter with particularly strong performance at PayPal unit Amazon reported that third quarter profits rose by 15% as revenue rose 39% for the period Texas Instruments reported a 60% rise in third quarter profits on a 28% increase in revenue Facebook is currently on track to generate up to $1 billion in revenue for 2010, but is operating slightly above breakeven
as the company focuses on gaining users and improving the user experience As Google faces continuing pressure from various European governments regarding data collection for its Street View
product, the Company made its first admission that in some cases it improperly collected personal data
Consumers are now spending more time on social networking sites than email, according to a global study by TNS Strategy Analytics expects the number of social networking members globally to double by 2015, attributing much of the
Industry T d
Strategy Analytics expects the number of social networking members globally to double by 2015, attributing much of the growth to Asia
Russians are the most active social networkers globally with 75% of the population visiting a social networking site during the month of August, according to comScore
Television grew by 16% in the first half of 2010 and regained its position as the largest advertising medium in the U.K. after losing the title to the internet last year
U.K online marketing spend grew by 13.3% in the third quarter, which was the fastest budget growth of any ad sector DowJones announced that third quarter U.S. venture funding was down 5% to $5.5 billion invested in 662 companies U.S. mobile ad spending is forecasted to reach $743 million in 2010, up 79% from 2009, and exceed $2.5 billion in 2014 Global tablet P.C. sales are expected to hit 208 million units by 2014 according to Gartner, which will adversely impact
sales of e-readers, gaming devices and media players, but have a limited impact on consumer notebook sales
Trends
, g g p y , p SearchIgnite reported that the U.S. paid search market grew by 5.8% in Q3 with Google commanding 80.2% of the
market Online advertising in the U.S. achieved a record half-year in 2010 at $12.1 billion, an 11.3% increase over the same
period in 2009, according to Interactive Advertising Bureau and PricewaterhouseCoopers Flurry reported that virtual goods are generating four times the revenue as advertisements on iPhone social apps Millennial Media noted that Android ad revenues have exceeded that of the iPhone on its network
Source: Industry news sources.(1) Source: MergerMarket.(2) Source: StrategyEye.
1
Public Market Trading Statistics
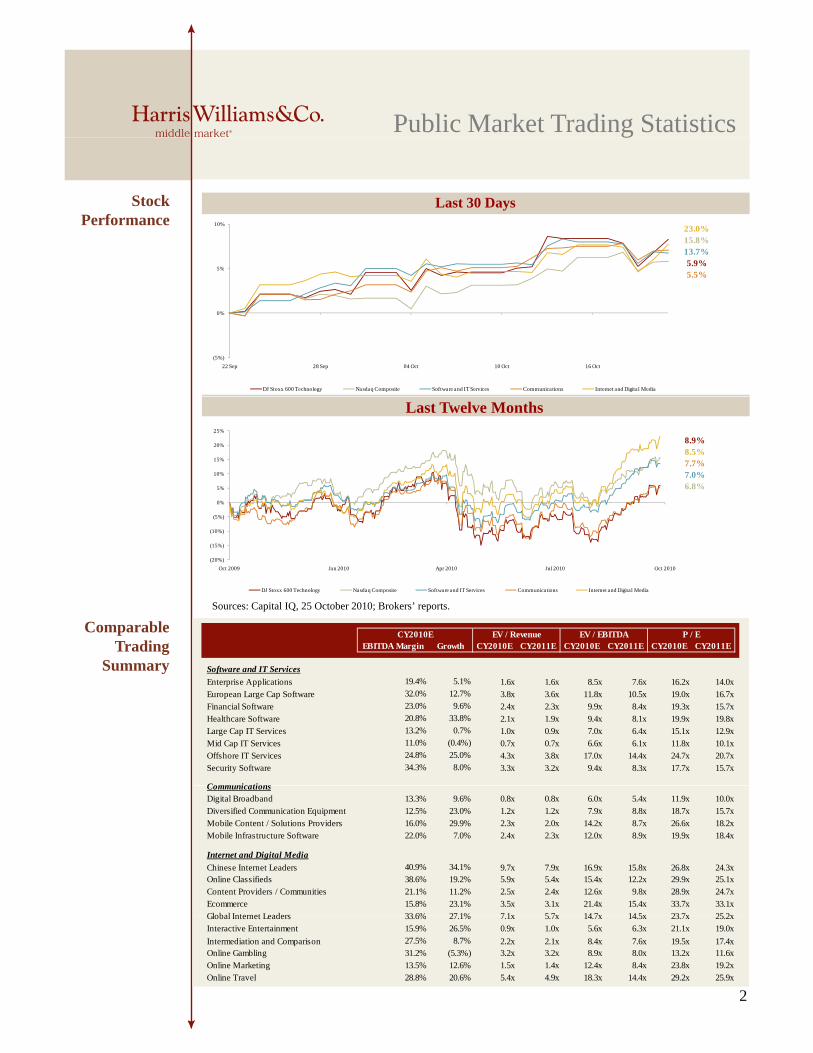
Stock Performance
5%
10%
Last 30 Days
g
23.0%15.8%13.7%5.9%
(5%)
0%
5%
22 Sep 28 Sep 04 Oct 10 Oct 16 Oct
DJ Stoxx 600 Technology Nasdaq Composite Software and IT Services Communications Internet and Digita l Media
5.5%
Last Twelve Months
8.9%8.5%7.7%7.0%6.8%
(5%)
0%
5%
10%
15%
20%
25%
CY2010EEBITDA Margin Growth CY2010E CY2011E CY2010E CY2011E CY2010E CY2011E
P / EEV / Revenue EV / EBITDAComparable
Trading
Sources: Capital IQ, 25 October 2010; Brokers’ reports.
(20%)
(15%)
(10%)
Oct 2009 Jan 2010 Apr 2010 Jul 2010 Oct 2010
DJ Stoxx 600 Technology Nasdaq Composite Software and IT Services Communications Internet and Digital Media
Software and IT Services
Enterprise Applications 19.4% 5.1% 1.6x 1.6x 8.5x 7.6x 16.2x 14.0x
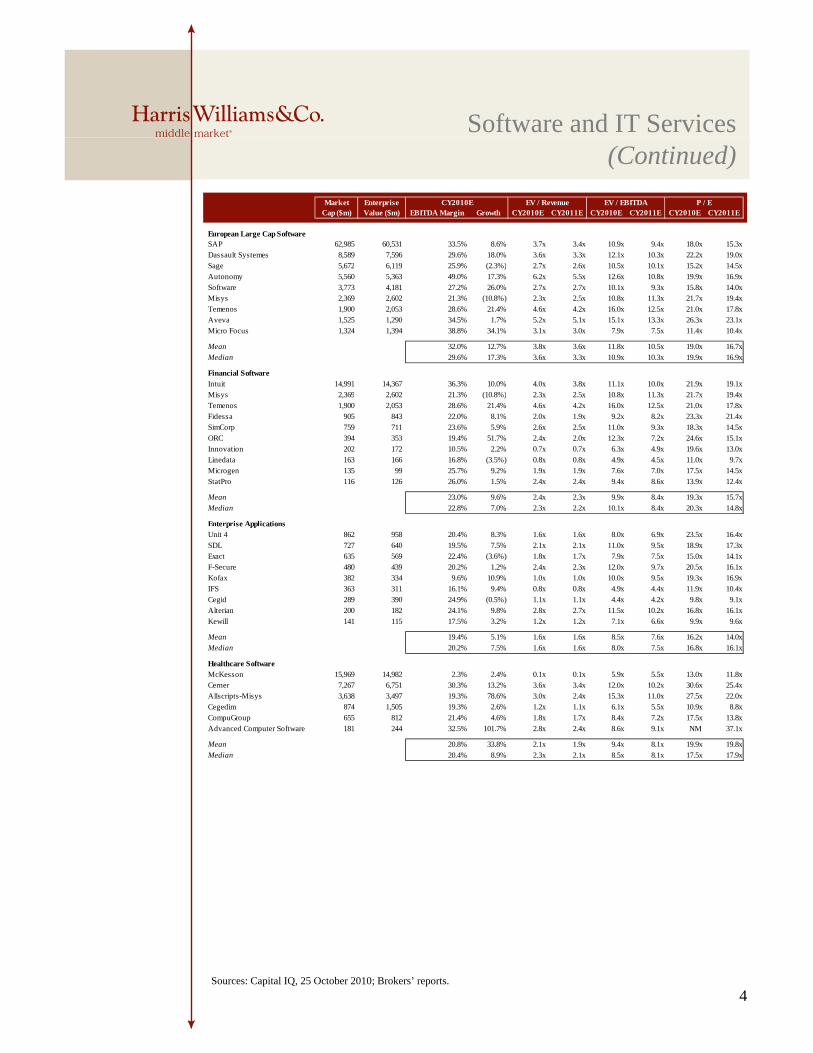
European Large Cap Software 32.0% 12.7% 3.8x 3.6x 11.8x 10.5x 19.0x 16.7x
Financial Software 23.0% 9.6% 2.4x 2.3x 9.9x 8.4x 19.3x 15.7x
Healthcare Software 20.8% 33.8% 2.1x 1.9x 9.4x 8.1x 19.9x 19.8x
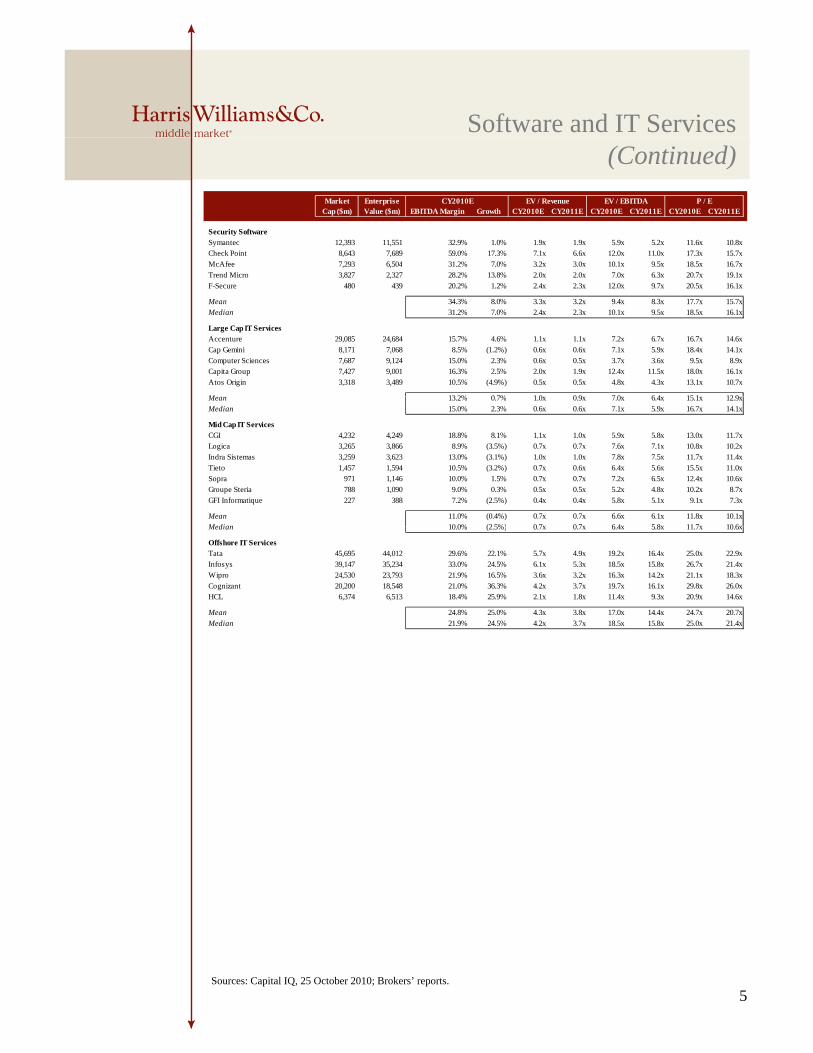
Large Cap IT Services 13.2% 0.7% 1.0x 0.9x 7.0x 6.4x 15.1x 12.9x
Mid Cap IT Services 11.0% (0.4%) 0.7x 0.7x 6.6x 6.1x 11.8x 10.1x
Offshore IT Services 24.8% 25.0% 4.3x 3.8x 17.0x 14.4x 24.7x 20.7x
Security Software 34.3% 8.0% 3.3x 3.2x 9.4x 8.3x 17.7x 15.7x
Communications
Summary
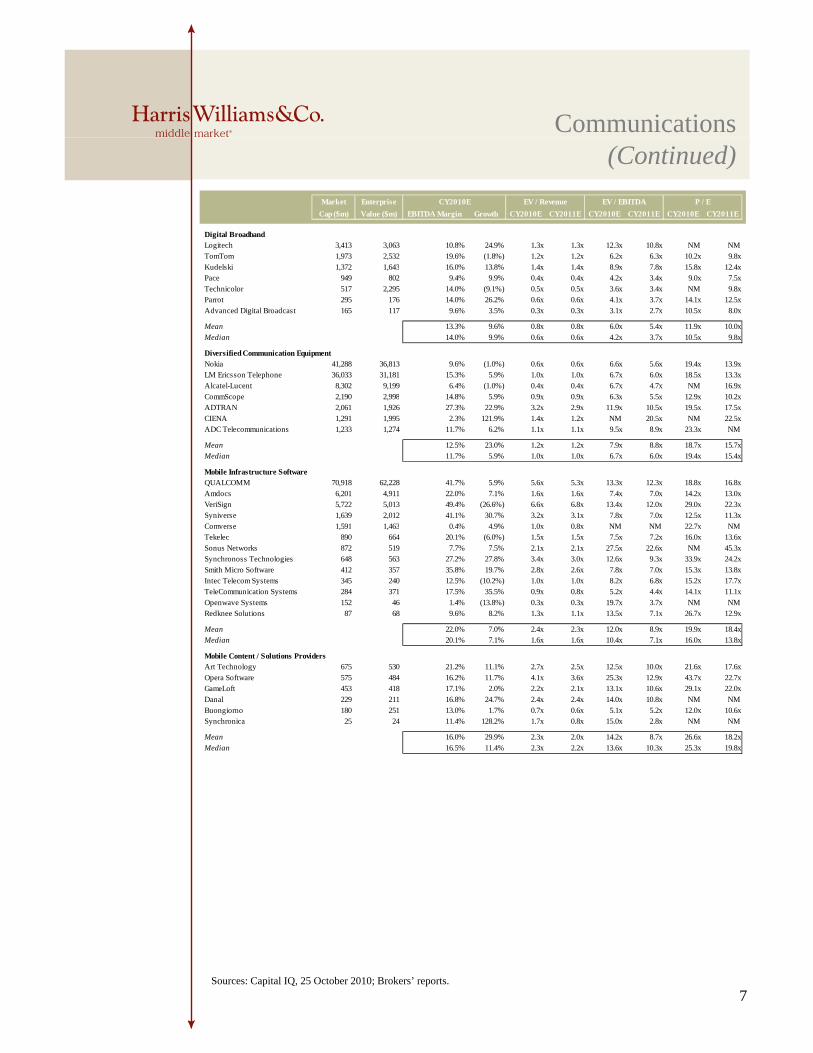
CommunicationsDigital Broadband 13.3% 9.6% 0.8x 0.8x 6.0x 5.4x 11.9x 10.0x
Diversified Communication Equipment 12.5% 23.0% 1.2x 1.2x 7.9x 8.8x 18.7x 15.7x
Mobile Content / Solutions Providers 16.0% 29.9% 2.3x 2.0x 14.2x 8.7x 26.6x 18.2x
Mobile Infrastructure Software 22.0% 7.0% 2.4x 2.3x 12.0x 8.9x 19.9x 18.4x
Internet and Digital Media
Chinese Internet Leaders 40.9% 34.1% 9.7x 7.9x 16.9x 15.8x 26.8x 24.3xOnline Classifieds 38.6% 19.2% 5.9x 5.4x 15.4x 12.2x 29.9x 25.1x
Content Providers / Communities 21.1% 11.2% 2.5x 2.4x 12.6x 9.8x 28.9x 24.7x
Ecommerce 15.8% 23.1% 3.5x 3.1x 21.4x 15.4x 33.7x 33.1x
Global Internet Leaders 33 6% 27 1% 7 1x 5 7x 14 7x 14 5x 23 7x 25 2xGlobal Internet Leaders 33.6% 27.1% 7.1x 5.7x 14.7x 14.5x 23.7x 25.2x
Interactive Entertainment 15.9% 26.5% 0.9x 1.0x 5.6x 6.3x 21.1x 19.0x
Intermediation and Comparison 27.5% 8.7% 2.2x 2.1x 8.4x 7.6x 19.5x 17.4xOnline Gambling 31.2% (5.3%) 3.2x 3.2x 8.9x 8.0x 13.2x 11.6x
Online Marketing 13.5% 12.6% 1.5x 1.4x 12.4x 8.4x 23.8x 19.2x
Online Travel 28.8% 20.6% 5.4x 4.9x 18.3x 14.4x 29.2x 25.9x
2
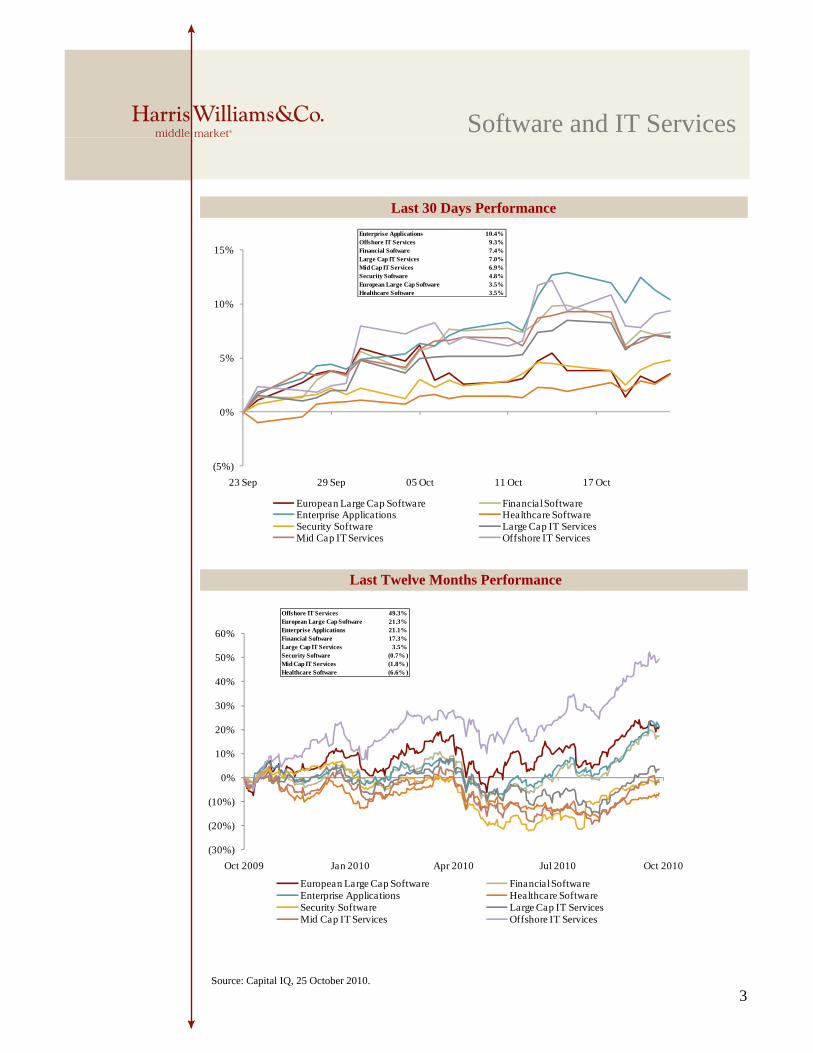
Software and IT Services
Last 30 Days Performance
Enterprise Applications 10.4%Offshore IT Services 9.3%Financial Software 7.4%Large Cap IT Services 7.0%Mid Cap IT Services 6 9%
15%
Mid Cap IT Services 6.9%Security Software 4.8%European Large Cap Software 3.5%Healthcare Software 3.5%
5%
10%
(5%)
0%
23 Sep 29 Sep 05 Oct 11 Oct 17 Oct
European Large Cap Software Financial SoftwareEnterprise Applications Healthcare SoftwareSecurity Software Large Cap IT Services
Last Twelve Months Performance
Security Software Large Cap IT ServicesMid Cap IT Services Offshore IT Services
50%
60%
Offshore IT Services 49.3%European Large Cap Software 21.3%Enterprise Applications 21.1%Financial Software 17.3%Large Cap IT Services 3.5%Security Software (0 7% )
0%
10%
20%
30%
40%
50% Security Software (0.7% )Mid Cap IT Services (1.8% )Healthcare Software (6.6% )
(30%)
(20%)
(10%)
Oct 2009 Jan 2010 Apr 2010 Jul 2010 Oct 2010
European Large Cap Software Financial SoftwareEnterprise Applications Healthcare SoftwareSecurity Software Large Cap IT Services
Source: Capital IQ, 25 October 2010.
3
Mid Cap IT Services Offshore IT Services
Software and IT Services(Continued)
Market Enterprise CY2010ECap ($m) Value ($m) EBITDA Margin Growth CY2010E CY2011E CY2010E CY2011E CY2010E CY2011E
European Large Cap SoftwareSAP 62,985 60,531 33.5% 8.6% 3.7x 3.4x 10.9x 9.4x 18.0x 15.3x
Dassault Systemes 8,589 7,596 29.6% 18.0% 3.6x 3.3x 12.1x 10.3x 22.2x 19.0x
Sage 5 672 6 119 25 9% (2 3%) 2 7x 2 6x 10 5x 10 1x 15 2x 14 5x
EV / Revenue EV / EBITDA P / E
Sage 5,672 6,119 25.9% (2.3%) 2.7x 2.6x 10.5x 10.1x 15.2x 14.5x
Autonomy 5,560 5,363 49.0% 17.3% 6.2x 5.5x 12.6x 10.8x 19.9x 16.9x
Software 3,773 4,181 27.2% 26.0% 2.7x 2.7x 10.1x 9.3x 15.8x 14.0xMisys 2,369 2,602 21.3% (10.8%) 2.3x 2.5x 10.8x 11.3x 21.7x 19.4x
Temenos 1,900 2,053 28.6% 21.4% 4.6x 4.2x 16.0x 12.5x 21.0x 17.8x
Aveva 1,525 1,290 34.5% 1.7% 5.2x 5.1x 15.1x 13.3x 26.3x 23.1x
Micro Focus 1,324 1,394 38.8% 34.1% 3.1x 3.0x 7.9x 7.5x 11.4x 10.4x
Mean 32.0% 12.7% 3.8x 3.6x 11.8x 10.5x 19.0x 16.7x
Median 29.6% 17.3% 3.6x 3.3x 10.9x 10.3x 19.9x 16.9x
Financial SoftwareIntuit 14,991 14,367 36.3% 10.0% 4.0x 3.8x 11.1x 10.0x 21.9x 19.1x
Misys 2,369 2,602 21.3% (10.8%) 2.3x 2.5x 10.8x 11.3x 21.7x 19.4xMisys 2,369 2,602 21.3% (10.8%) 2.3x 2.5x 10.8x 11.3x 21.7x 19.4x
Temenos 1,900 2,053 28.6% 21.4% 4.6x 4.2x 16.0x 12.5x 21.0x 17.8x
Fidessa 905 843 22.0% 8.1% 2.0x 1.9x 9.2x 8.2x 23.3x 21.4x
SimCorp 759 711 23.6% 5.9% 2.6x 2.5x 11.0x 9.3x 18.3x 14.5x
ORC 394 353 19.4% 51.7% 2.4x 2.0x 12.3x 7.2x 24.6x 15.1x
Innovation 202 172 10.5% 2.2% 0.7x 0.7x 6.3x 4.9x 19.6x 13.0x
Linedata 163 166 16.8% (3.5%) 0.8x 0.8x 4.9x 4.5x 11.0x 9.7x
Microgen 135 99 25.7% 9.2% 1.9x 1.9x 7.6x 7.0x 17.5x 14.5x
StatPro 116 126 26.0% 1.5% 2.4x 2.4x 9.4x 8.6x 13.9x 12.4x
Mean 23.0% 9.6% 2.4x 2.3x 9.9x 8.4x 19.3x 15.7x
Median 22.8% 7.0% 2.3x 2.2x 10.1x 8.4x 20.3x 14.8x
Enterprise Applicationste p se pp cat o sUnit 4 862 958 20.4% 8.3% 1.6x 1.6x 8.0x 6.9x 23.5x 16.4x
SDL 727 640 19.5% 7.5% 2.1x 2.1x 11.0x 9.5x 18.9x 17.3x
Exact 635 569 22.4% (3.6%) 1.8x 1.7x 7.9x 7.5x 15.0x 14.1x
F-Secure 480 439 20.2% 1.2% 2.4x 2.3x 12.0x 9.7x 20.5x 16.1x
Kofax 382 334 9.6% 10.9% 1.0x 1.0x 10.0x 9.5x 19.3x 16.9x
IFS 363 311 16.1% 9.4% 0.8x 0.8x 4.9x 4.4x 11.9x 10.4x
Cegid 289 390 24.9% (0.5%) 1.1x 1.1x 4.4x 4.2x 9.8x 9.1x
Alterian 200 182 24.1% 9.8% 2.8x 2.7x 11.5x 10.2x 16.8x 16.1x
Kewill 141 115 17.5% 3.2% 1.2x 1.2x 7.1x 6.6x 9.9x 9.6x
Mean 19.4% 5.1% 1.6x 1.6x 8.5x 7.6x 16.2x 14.0x
Median 20.2% 7.5% 1.6x 1.6x 8.0x 7.5x 16.8x 16.1x
Healthcare SoftwareMcKesson 15,969 14,982 2.3% 2.4% 0.1x 0.1x 5.9x 5.5x 13.0x 11.8xCerner 7,267 6,751 30.3% 13.2% 3.6x 3.4x 12.0x 10.2x 30.6x 25.4x
Allscripts-Misys 3,638 3,497 19.3% 78.6% 3.0x 2.4x 15.3x 11.0x 27.5x 22.0x
Cegedim 874 1,505 19.3% 2.6% 1.2x 1.1x 6.1x 5.5x 10.9x 8.8x
CompuGroup 655 812 21.4% 4.6% 1.8x 1.7x 8.4x 7.2x 17.5x 13.8x
Advanced Computer Software 181 244 32.5% 101.7% 2.8x 2.4x 8.6x 9.1x NM 37.1x
Mean 20.8% 33.8% 2.1x 1.9x 9.4x 8.1x 19.9x 19.8x
Median 20.4% 8.9% 2.3x 2.1x 8.5x 8.1x 17.5x 17.9x
4Sources: Capital IQ, 25 October 2010; Brokers’ reports.
Software and IT Services(Continued)
Market Enterprise CY2010ECap ($m) Value ($m) EBITDA Margin Growth CY2010E CY2011E CY2010E CY2011E CY2010E CY2011E
Security SoftwareSymantec 12,393 11,551 32.9% 1.0% 1.9x 1.9x 5.9x 5.2x 11.6x 10.8xCheck Point 8,643 7,689 59.0% 17.3% 7.1x 6.6x 12.0x 11.0x 17.3x 15.7x
McAfee 7,293 6,504 31.2% 7.0% 3.2x 3.0x 10.1x 9.5x 18.5x 16.7x
P / EEV / Revenue EV / EBITDA
, ,
Trend Micro 3,827 2,327 28.2% 13.8% 2.0x 2.0x 7.0x 6.3x 20.7x 19.1x
F-Secure 480 439 20.2% 1.2% 2.4x 2.3x 12.0x 9.7x 20.5x 16.1x
Mean 34.3% 8.0% 3.3x 3.2x 9.4x 8.3x 17.7x 15.7xMedian 31.2% 7.0% 2.4x 2.3x 10.1x 9.5x 18.5x 16.1x
Large Cap IT ServicesAccenture 29,085 24,684 15.7% 4.6% 1.1x 1.1x 7.2x 6.7x 16.7x 14.6x
Cap Gemini 8,171 7,068 8.5% (1.2%) 0.6x 0.6x 7.1x 5.9x 18.4x 14.1x
Computer Sciences 7,687 9,124 15.0% 2.3% 0.6x 0.5x 3.7x 3.6x 9.5x 8.9xCapita Group 7,427 9,001 16.3% 2.5% 2.0x 1.9x 12.4x 11.5x 18.0x 16.1x
Atos Origin 3,318 3,489 10.5% (4.9%) 0.5x 0.5x 4.8x 4.3x 13.1x 10.7x
M 13 2% 0 7% 1 0 0 9 7 0 6 4 15 1 12 9Mean 13.2% 0.7% 1.0x 0.9x 7.0x 6.4x 15.1x 12.9x
Median 15.0% 2.3% 0.6x 0.6x 7.1x 5.9x 16.7x 14.1x
Mid Cap IT ServicesCGI 4,232 4,249 18.8% 8.1% 1.1x 1.0x 5.9x 5.8x 13.0x 11.7x
Logica 3,265 3,866 8.9% (3.5%) 0.7x 0.7x 7.6x 7.1x 10.8x 10.2x
Indra Sistemas 3,259 3,623 13.0% (3.1%) 1.0x 1.0x 7.8x 7.5x 11.7x 11.4x
Tieto 1,457 1,594 10.5% (3.2%) 0.7x 0.6x 6.4x 5.6x 15.5x 11.0xSopra 971 1,146 10.0% 1.5% 0.7x 0.7x 7.2x 6.5x 12.4x 10.6x
Groupe Steria 788 1,090 9.0% 0.3% 0.5x 0.5x 5.2x 4.8x 10.2x 8.7x
GFI Informatique 227 388 7.2% (2.5%) 0.4x 0.4x 5.8x 5.1x 9.1x 7.3x
Mean 11.0% (0.4%) 0.7x 0.7x 6.6x 6.1x 11.8x 10.1x
Median 10 0% (2 5%) 0 7x 0 7x 6 4x 5 8x 11 7x 10 6xMedian 10.0% (2.5%) 0.7x 0.7x 6.4x 5.8x 11.7x 10.6x
Offshore IT ServicesTata 45,695 44,012 29.6% 22.1% 5.7x 4.9x 19.2x 16.4x 25.0x 22.9x
Infosys 39,147 35,234 33.0% 24.5% 6.1x 5.3x 18.5x 15.8x 26.7x 21.4x
Wipro 24,530 23,793 21.9% 16.5% 3.6x 3.2x 16.3x 14.2x 21.1x 18.3x
Cognizant 20,200 18,548 21.0% 36.3% 4.2x 3.7x 19.7x 16.1x 29.8x 26.0xHCL 6,374 6,513 18.4% 25.9% 2.1x 1.8x 11.4x 9.3x 20.9x 14.6x
Mean 24.8% 25.0% 4.3x 3.8x 17.0x 14.4x 24.7x 20.7x
Median 21.9% 24.5% 4.2x 3.7x 18.5x 15.8x 25.0x 21.4x
5Sources: Capital IQ, 25 October 2010; Brokers’ reports.
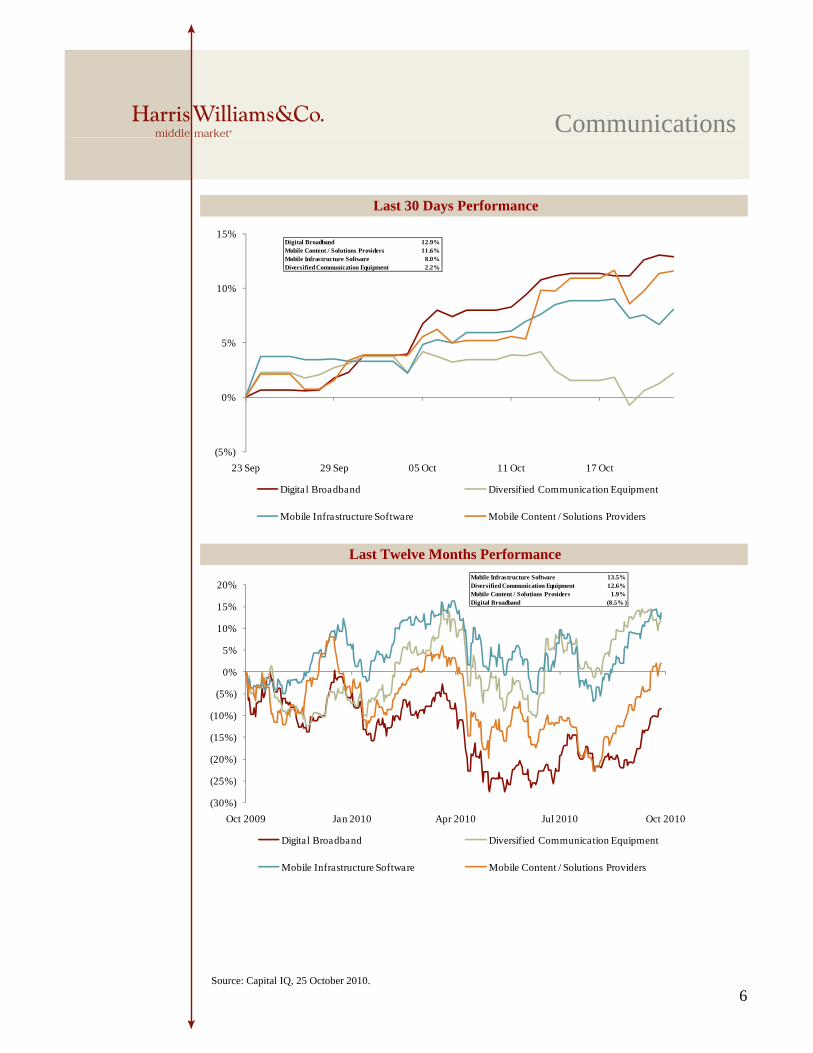
Communications
15%
Last 30 Days Performance
Digital Broadband 12.9%Mobile Content / Solutions Providers 11.6%Mobile Infrastructure Software 8.0%Diversified Communication Equipment 2 2%
0%
5%
10%
Diversified Communication Equipment 2.2%
(5%)
0%
23 Sep 29 Sep 05 Oct 11 Oct 17 Oct
Digital Broadband Diversified Communication Equipment
Mobile Infrastructure Software Mobile Content / Solutions Providers
5%
10%
15%
20%
Last Twelve Months Performance
Mobile Infrastructure Software 13.5%Diversified Communication Equipment 12.6%Mobile Content / Solutions Providers 1.9%Digital Broadband (8.5% )
(25%)
(20%)
(15%)
(10%)
(5%)
0%
(30%)
( )
Oct 2009 Jan 2010 Apr 2010 Jul 2010 Oct 2010
Digital Broadband Diversified Communication Equipment
Mobile Infrastructure Software Mobile Content / Solutions Providers
6Source: Capital IQ, 25 October 2010.
Communications(Continued)
Market Enterprise CY2010E
Cap ($m) Value ($m) EBITDA Margin Growth CY2010E CY2011E CY2010E CY2011E CY2010E CY2011E
Digital BroadbandLogitech 3,413 3,063 10.8% 24.9% 1.3x 1.3x 12.3x 10.8x NM NM
TomTom 1,973 2,532 19.6% (1.8%) 1.2x 1.2x 6.2x 6.3x 10.2x 9.8x
Kudelski 1 372 1 643 16 0% 13 8% 1 4x 1 4x 8 9x 7 8x 15 8x 12 4x
EV / Revenue EV / EBITDA P / E
Kudelski 1,372 1,643 16.0% 13.8% 1.4x 1.4x 8.9x 7.8x 15.8x 12.4xPace 949 802 9.4% 9.9% 0.4x 0.4x 4.2x 3.4x 9.0x 7.5x
Technicolor 517 2,295 14.0% (9.1%) 0.5x 0.5x 3.6x 3.4x NM 9.8xParrot 295 176 14.0% 26.2% 0.6x 0.6x 4.1x 3.7x 14.1x 12.5x
Advanced Digital Broadcast 165 117 9.6% 3.5% 0.3x 0.3x 3.1x 2.7x 10.5x 8.0x
Mean 13.3% 9.6% 0.8x 0.8x 6.0x 5.4x 11.9x 10.0x
Median 14.0% 9.9% 0.6x 0.6x 4.2x 3.7x 10.5x 9.8x
Diversified Communication EquipmentNokia 41,288 36,813 9.6% (1.0%) 0.6x 0.6x 6.6x 5.6x 19.4x 13.9xLM Ericsson Telephone 36,033 31,181 15.3% 5.9% 1.0x 1.0x 6.7x 6.0x 18.5x 13.3x
Alcatel-Lucent 8,302 9,199 6.4% (1.0%) 0.4x 0.4x 6.7x 4.7x NM 16.9x
CommScope 2 190 2 998 14 8% 5 9% 0 9x 0 9x 6 3x 5 5x 12 9x 10 2xCommScope 2,190 2,998 14.8% 5.9% 0.9x 0.9x 6.3x 5.5x 12.9x 10.2xADTRAN 2,061 1,926 27.3% 22.9% 3.2x 2.9x 11.9x 10.5x 19.5x 17.5x
CIENA 1,291 1,995 2.3% 121.9% 1.4x 1.2x NM 20.5x NM 22.5xADC Telecommunications 1,233 1,274 11.7% 6.2% 1.1x 1.1x 9.5x 8.9x 23.3x NM
Mean 12.5% 23.0% 1.2x 1.2x 7.9x 8.8x 18.7x 15.7xMedian 11.7% 5.9% 1.0x 1.0x 6.7x 6.0x 19.4x 15.4x
Mobile Infrastructure SoftwareQUALCOMM 70,918 62,228 41.7% 5.9% 5.6x 5.3x 13.3x 12.3x 18.8x 16.8x
Amdocs 6,201 4,911 22.0% 7.1% 1.6x 1.6x 7.4x 7.0x 14.2x 13.0xVeriSign 5,722 5,013 49.4% (26.6%) 6.6x 6.8x 13.4x 12.0x 29.0x 22.3x
Syniverse 1,639 2,012 41.1% 30.7% 3.2x 3.1x 7.8x 7.0x 12.5x 11.3x
Comverse 1 591 1 463 0 4% 4 9% 1 0x 0 8x NM NM 22 7x NMComverse 1,591 1,463 0.4% 4.9% 1.0x 0.8x NM NM 22.7x NMTekelec 890 664 20.1% (6.0%) 1.5x 1.5x 7.5x 7.2x 16.0x 13.6x
Sonus Networks 872 519 7.7% 7.5% 2.1x 2.1x 27.5x 22.6x NM 45.3xSynchronoss Technologies 648 563 27.2% 27.8% 3.4x 3.0x 12.6x 9.3x 33.9x 24.2x
Smith Micro Software 412 357 35.8% 19.7% 2.8x 2.6x 7.8x 7.0x 15.3x 13.8x
Intec Telecom Systems 345 240 12.5% (10.2%) 1.0x 1.0x 8.2x 6.8x 15.2x 17.7xTeleCommunication Systems 284 371 17.5% 35.5% 0.9x 0.8x 5.2x 4.4x 14.1x 11.1x
Openwave Systems 152 46 1.4% (13.8%) 0.3x 0.3x 19.7x 3.7x NM NMRedknee Solutions 87 68 9.6% 8.2% 1.3x 1.1x 13.5x 7.1x 26.7x 12.9x
Mean 22.0% 7.0% 2.4x 2.3x 12.0x 8.9x 19.9x 18.4xMedian 20.1% 7.1% 1.6x 1.6x 10.4x 7.1x 16.0x 13.8x
Mobile Content / Solutions ProvidersMobile Content / Solutions ProvidersArt Technology 675 530 21.2% 11.1% 2.7x 2.5x 12.5x 10.0x 21.6x 17.6x
Opera Software 575 484 16.2% 11.7% 4.1x 3.6x 25.3x 12.9x 43.7x 22.7xGameLoft 453 418 17.1% 2.0% 2.2x 2.1x 13.1x 10.6x 29.1x 22.0x
Danal 229 211 16.8% 24.7% 2.4x 2.4x 14.0x 10.8x NM NM
Buongiorno 180 251 13.0% 1.7% 0.7x 0.6x 5.1x 5.2x 12.0x 10.6xSynchronica 25 24 11.4% 128.2% 1.7x 0.8x 15.0x 2.8x NM NM
Mean 16.0% 29.9% 2.3x 2.0x 14.2x 8.7x 26.6x 18.2x
Median 16.5% 11.4% 2.3x 2.2x 13.6x 10.3x 25.3x 19.8x
7Sources: Capital IQ, 25 October 2010; Brokers’ reports.
Internet and Digital Media
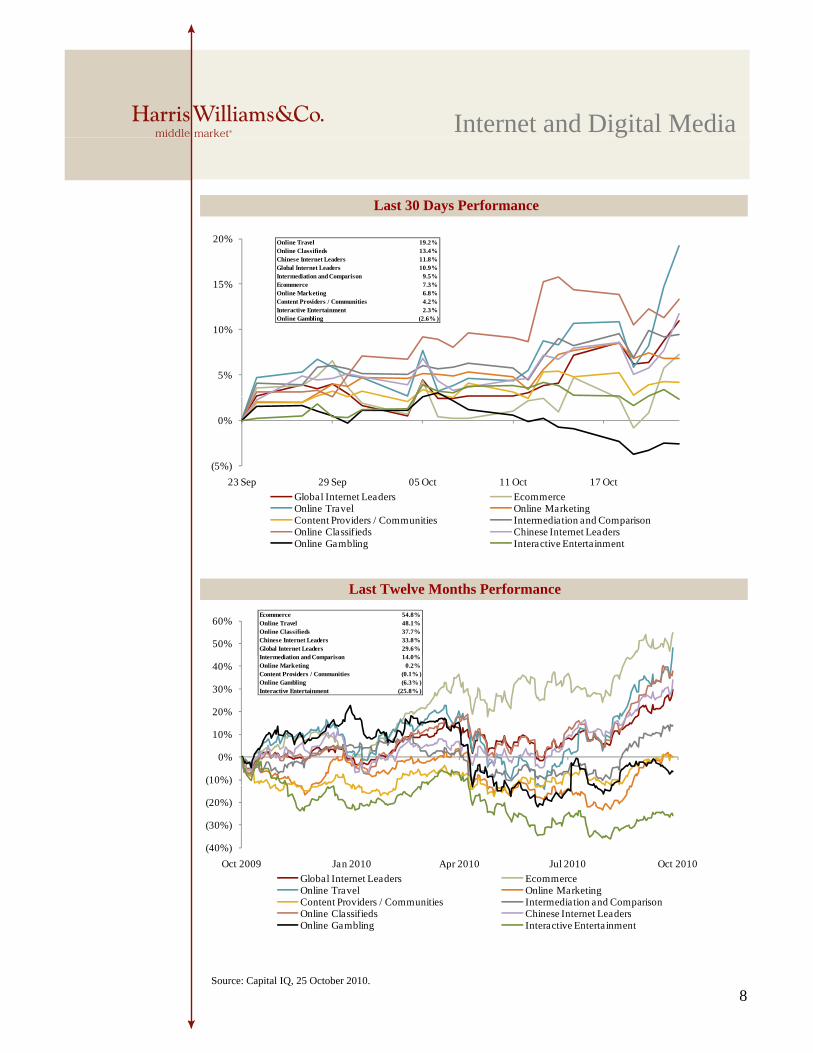
Last 30 Days Performance
g
20% Online Travel 19.2%Online Classifieds 13.4%Chinese Internet Leaders 11.8%Global Internet Leaders 10 9%
5%
10%
15%
Global Internet Leaders 10.9%Intermediation and Comparison 9.5%Ecommerce 7.3%Online Marketing 6.8%Content Providers / Communities 4.2%Interactive Entertainment 2.3%Online Gambling (2.6% )
(5%)
0%
23 Sep 29 Sep 05 Oct 11 Oct 17 Oct
Global Internet Leaders EcommerceOnline Travel Online MarketingContent Providers / Communities Intermediation and Comparison
Last Twelve Months Performance
Online Classifieds Chinese Internet LeadersOnline Gambling Interactive Entertainment
50%
60%Ecommerce 54.8%Online Travel 48.1%Online Classifieds 37.7%Chinese Internet Leaders 33.8%Global Internet Leaders 29.6%I t di ti d C i 14 0%
(10%)
0%
10%
20%
30%
40%Intermediation and Comparison 14.0%Online Marketing 0.2%Content Providers / Communities (0.1% )Online Gambling (6.3% )Interactive Entertainment (25.8% )
(40%)
(30%)
(20%)
Oct 2009 Jan 2010 Apr 2010 Jul 2010 Oct 2010
Global Internet Leaders EcommerceOnline Travel Online MarketingContent Providers / Communities Intermediation and ComparisonOnline Classifieds Chinese Internet Leaders
8Source: Capital IQ, 25 October 2010.
Online Classifieds Chinese Internet LeadersOnline Gambling Interactive Enterta inment
Internet and Digital Mediag(Continued)
Market Enterprise CY2010E
Cap ($m) Value ($m) EBITDA Margin Growth CY2010E CY2011E CY2010E CY2011E CY2010E CY2011E
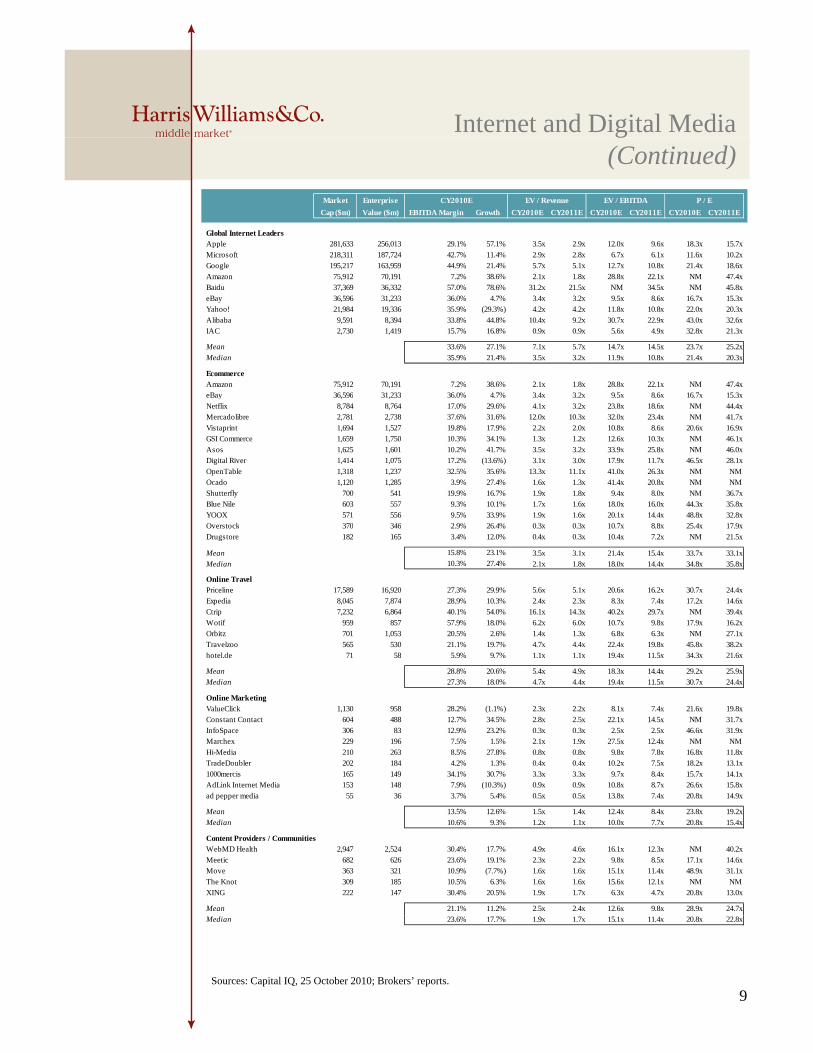
Global Internet LeadersApple 281,633 256,013 29.1% 57.1% 3.5x 2.9x 12.0x 9.6x 18.3x 15.7x
Microsoft 218,311 187,724 42.7% 11.4% 2.9x 2.8x 6.7x 6.1x 11.6x 10.2xGoogle 195 217 163 959 44 9% 21 4% 5 7x 5 1x 12 7x 10 8x 21 4x 18 6x
EV / Revenue EV / EBITDA P / E
Google 195,217 163,959 44.9% 21.4% 5.7x 5.1x 12.7x 10.8x 21.4x 18.6x
Amazon 75,912 70,191 7.2% 38.6% 2.1x 1.8x 28.8x 22.1x NM 47.4xBaidu 37,369 36,332 57.0% 78.6% 31.2x 21.5x NM 34.5x NM 45.8x
eBay 36,596 31,233 36.0% 4.7% 3.4x 3.2x 9.5x 8.6x 16.7x 15.3xYahoo! 21,984 19,336 35.9% (29.3%) 4.2x 4.2x 11.8x 10.8x 22.0x 20.3x
Alibaba 9,591 8,394 33.8% 44.8% 10.4x 9.2x 30.7x 22.9x 43.0x 32.6xIAC 2,730 1,419 15.7% 16.8% 0.9x 0.9x 5.6x 4.9x 32.8x 21.3x
Mean 33.6% 27.1% 7.1x 5.7x 14.7x 14.5x 23.7x 25.2x
Median 35.9% 21.4% 3.5x 3.2x 11.9x 10.8x 21.4x 20.3x
EcommerceAmazon 75,912 70,191 7.2% 38.6% 2.1x 1.8x 28.8x 22.1x NM 47.4xeBay 36 596 31 233 36 0% 4 7% 3 4x 3 2x 9 5x 8 6x 16 7x 15 3xeBay 36,596 31,233 36.0% 4.7% 3.4x 3.2x 9.5x 8.6x 16.7x 15.3x
Netflix 8,784 8,764 17.0% 29.6% 4.1x 3.2x 23.8x 18.6x NM 44.4xMercadolibre 2,781 2,738 37.6% 31.6% 12.0x 10.3x 32.0x 23.4x NM 41.7x
Vistaprint 1,694 1,527 19.8% 17.9% 2.2x 2.0x 10.8x 8.6x 20.6x 16.9xGSI Commerce 1,659 1,750 10.3% 34.1% 1.3x 1.2x 12.6x 10.3x NM 46.1x
Asos 1,625 1,601 10.2% 41.7% 3.5x 3.2x 33.9x 25.8x NM 46.0xDigital River 1,414 1,075 17.2% (13.6%) 3.1x 3.0x 17.9x 11.7x 46.5x 28.1x
OpenTable 1,318 1,237 32.5% 35.6% 13.3x 11.1x 41.0x 26.3x NM NMOcado 1,120 1,285 3.9% 27.4% 1.6x 1.3x 41.4x 20.8x NM NM
Shutterfly 700 541 19.9% 16.7% 1.9x 1.8x 9.4x 8.0x NM 36.7xBlue Nile 603 557 9.3% 10.1% 1.7x 1.6x 18.0x 16.0x 44.3x 35.8x
YOOX 571 556 9.5% 33.9% 1.9x 1.6x 20.1x 14.4x 48.8x 32.8xOverstock 370 346 2 9% 26 4% 0 3x 0 3x 10 7x 8 8x 25 4x 17 9xOverstock 370 346 2.9% 26.4% 0.3x 0.3x 10.7x 8.8x 25.4x 17.9x
Drugstore 182 165 3.4% 12.0% 0.4x 0.3x 10.4x 7.2x NM 21.5x
Mean 15.8% 23.1% 3.5x 3.1x 21.4x 15.4x 33.7x 33.1xMedian 10.3% 27.4% 2.1x 1.8x 18.0x 14.4x 34.8x 35.8x
Online TravelPriceline 17,589 16,920 27.3% 29.9% 5.6x 5.1x 20.6x 16.2x 30.7x 24.4x
Expedia 8,045 7,874 28.9% 10.3% 2.4x 2.3x 8.3x 7.4x 17.2x 14.6xCtrip 7,232 6,864 40.1% 54.0% 16.1x 14.3x 40.2x 29.7x NM 39.4x
Wotif 959 857 57.9% 18.0% 6.2x 6.0x 10.7x 9.8x 17.9x 16.2xOrbitz 701 1,053 20.5% 2.6% 1.4x 1.3x 6.8x 6.3x NM 27.1x
Travelzoo 565 530 21.1% 19.7% 4.7x 4.4x 22.4x 19.8x 45.8x 38.2xhotel de 71 58 5 9% 9 7% 1 1x 1 1x 19 4x 11 5x 34 3x 21 6xhotel.de 71 58 5.9% 9.7% 1.1x 1.1x 19.4x 11.5x 34.3x 21.6x
Mean 28.8% 20.6% 5.4x 4.9x 18.3x 14.4x 29.2x 25.9xMedian 27.3% 18.0% 4.7x 4.4x 19.4x 11.5x 30.7x 24.4x
Online MarketingValueClick 1,130 958 28.2% (1.1%) 2.3x 2.2x 8.1x 7.4x 21.6x 19.8xConstant Contact 604 488 12.7% 34.5% 2.8x 2.5x 22.1x 14.5x NM 31.7x
InfoSpace 306 83 12.9% 23.2% 0.3x 0.3x 2.5x 2.5x 46.6x 31.9xMarchex 229 196 7.5% 1.5% 2.1x 1.9x 27.5x 12.4x NM NM
Hi-Media 210 263 8.5% 27.8% 0.8x 0.8x 9.8x 7.8x 16.8x 11.8xTradeDoubler 202 184 4.2% 1.3% 0.4x 0.4x 10.2x 7.5x 18.2x 13.1x
1000mercis 165 149 34.1% 30.7% 3.3x 3.3x 9.7x 8.4x 15.7x 14.1xAdLink Internet Media 153 148 7 9% (10 3%) 0 9x 0 9x 10 8x 8 7x 26 6x 15 8xAdLink Internet Media 153 148 7.9% (10.3%) 0.9x 0.9x 10.8x 8.7x 26.6x 15.8x
ad pepper media 55 36 3.7% 5.4% 0.5x 0.5x 13.8x 7.4x 20.8x 14.9x
Mean 13.5% 12.6% 1.5x 1.4x 12.4x 8.4x 23.8x 19.2x
Median 10.6% 9.3% 1.2x 1.1x 10.0x 7.7x 20.8x 15.4x
Content Providers / CommunitiesWebMD Health 2,947 2,524 30.4% 17.7% 4.9x 4.6x 16.1x 12.3x NM 40.2x
Meetic 682 626 23.6% 19.1% 2.3x 2.2x 9.8x 8.5x 17.1x 14.6xMove 363 321 10.9% (7.7%) 1.6x 1.6x 15.1x 11.4x 48.9x 31.1x
The Knot 309 185 10.5% 6.3% 1.6x 1.6x 15.6x 12.1x NM NMXING 222 147 30.4% 20.5% 1.9x 1.7x 6.3x 4.7x 20.8x 13.0x
Mean 21.1% 11.2% 2.5x 2.4x 12.6x 9.8x 28.9x 24.7x
9Sources: Capital IQ, 25 October 2010; Brokers’ reports.
Median 23.6% 17.7% 1.9x 1.7x 15.1x 11.4x 20.8x 22.8x
Internet and Digital Mediag(Continued)
Market Enterprise CY2010ECap ($m) Value ($m) EBITDA Margin Growth CY2010E CY2011E CY2010E CY2011E CY2010E CY2011E
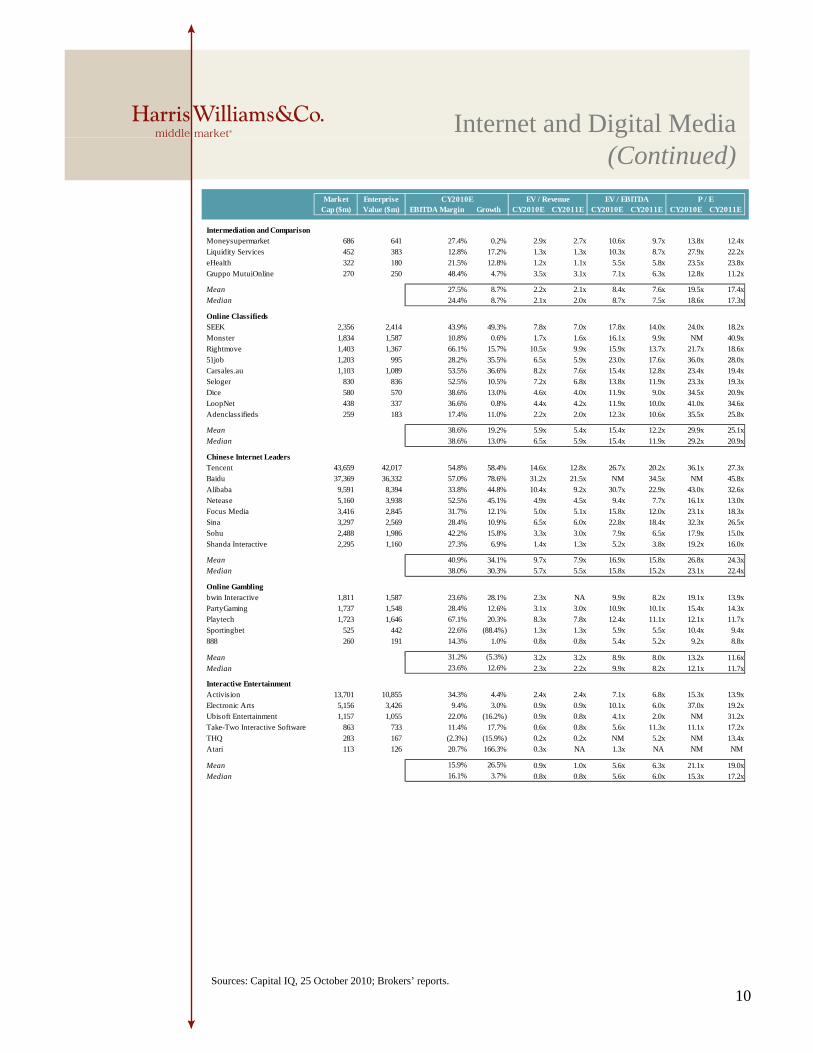
Intermediation and ComparisonMoneysupermarket 686 641 27.4% 0.2% 2.9x 2.7x 10.6x 9.7x 13.8x 12.4x
Liquidity Services 452 383 12.8% 17.2% 1.3x 1.3x 10.3x 8.7x 27.9x 22.2x
eHealth 322 180 21.5% 12.8% 1.2x 1.1x 5.5x 5.8x 23.5x 23.8x
EV / Revenue EV / EBITDA P / E
Gruppo MutuiOnline 270 250 48.4% 4.7% 3.5x 3.1x 7.1x 6.3x 12.8x 11.2x
Mean 27.5% 8.7% 2.2x 2.1x 8.4x 7.6x 19.5x 17.4x
Median 24.4% 8.7% 2.1x 2.0x 8.7x 7.5x 18.6x 17.3x
Online ClassifiedsSEEK 2,356 2,414 43.9% 49.3% 7.8x 7.0x 17.8x 14.0x 24.0x 18.2x
Monster 1,834 1,587 10.8% 0.6% 1.7x 1.6x 16.1x 9.9x NM 40.9x
Rightmove 1,403 1,367 66.1% 15.7% 10.5x 9.9x 15.9x 13.7x 21.7x 18.6x
51job 1,203 995 28.2% 35.5% 6.5x 5.9x 23.0x 17.6x 36.0x 28.0x
Carsales.au 1,103 1,089 53.5% 36.6% 8.2x 7.6x 15.4x 12.8x 23.4x 19.4xSeloger 830 836 52.5% 10.5% 7.2x 6.8x 13.8x 11.9x 23.3x 19.3x
Dice 580 570 38.6% 13.0% 4.6x 4.0x 11.9x 9.0x 34.5x 20.9x
LoopNet 438 337 36.6% 0.8% 4.4x 4.2x 11.9x 10.0x 41.0x 34.6x
Adenclassifieds 259 183 17.4% 11.0% 2.2x 2.0x 12.3x 10.6x 35.5x 25.8x
Mean 38.6% 19.2% 5.9x 5.4x 15.4x 12.2x 29.9x 25.1x
Median 38.6% 13.0% 6.5x 5.9x 15.4x 11.9x 29.2x 20.9x
Chinese Internet LeadersTencent 43,659 42,017 54.8% 58.4% 14.6x 12.8x 26.7x 20.2x 36.1x 27.3x
Baidu 37,369 36,332 57.0% 78.6% 31.2x 21.5x NM 34.5x NM 45.8x
Alibaba 9,591 8,394 33.8% 44.8% 10.4x 9.2x 30.7x 22.9x 43.0x 32.6x
Netease 5,160 3,938 52.5% 45.1% 4.9x 4.5x 9.4x 7.7x 16.1x 13.0x
Focus Media 3,416 2,845 31.7% 12.1% 5.0x 5.1x 15.8x 12.0x 23.1x 18.3xSina 3,297 2,569 28.4% 10.9% 6.5x 6.0x 22.8x 18.4x 32.3x 26.5x
Sohu 2,488 1,986 42.2% 15.8% 3.3x 3.0x 7.9x 6.5x 17.9x 15.0x
Shanda Interactive 2,295 1,160 27.3% 6.9% 1.4x 1.3x 5.2x 3.8x 19.2x 16.0x
Mean 40.9% 34.1% 9.7x 7.9x 16.9x 15.8x 26.8x 24.3xMedian 38.0% 30.3% 5.7x 5.5x 15.8x 15.2x 23.1x 22.4x
Online Gamblingbwin Interactive 1,811 1,587 23.6% 28.1% 2.3x NA 9.9x 8.2x 19.1x 13.9xPartyGaming 1,737 1,548 28.4% 12.6% 3.1x 3.0x 10.9x 10.1x 15.4x 14.3x
Playtech 1,723 1,646 67.1% 20.3% 8.3x 7.8x 12.4x 11.1x 12.1x 11.7x
Sportingbet 525 442 22.6% (88.4%) 1.3x 1.3x 5.9x 5.5x 10.4x 9.4x
888 260 191 14.3% 1.0% 0.8x 0.8x 5.4x 5.2x 9.2x 8.8x
M 31 2% (5 3%) 3 2 3 2 8 9 8 0 13 2 11 6Mean 31.2% (5.3%) 3.2x 3.2x 8.9x 8.0x 13.2x 11.6x
Median 23.6% 12.6% 2.3x 2.2x 9.9x 8.2x 12.1x 11.7x
Interactive EntertainmentActivision 13,701 10,855 34.3% 4.4% 2.4x 2.4x 7.1x 6.8x 15.3x 13.9xElectronic Arts 5,156 3,426 9.4% 3.0% 0.9x 0.9x 10.1x 6.0x 37.0x 19.2x
Ubisoft Entertainment 1,157 1,055 22.0% (16.2%) 0.9x 0.8x 4.1x 2.0x NM 31.2x
Take-Two Interactive Software 863 733 11.4% 17.7% 0.6x 0.8x 5.6x 11.3x 11.1x 17.2x
THQ 283 167 (2.3%) (15.9%) 0.2x 0.2x NM 5.2x NM 13.4xAtari 113 126 20.7% 166.3% 0.3x NA 1.3x NA NM NM
Mean 15.9% 26.5% 0.9x 1.0x 5.6x 6.3x 21.1x 19.0xMedian 16.1% 3.7% 0.8x 0.8x 5.6x 6.0x 15.3x 17.2x
10Sources: Capital IQ, 25 October 2010; Brokers’ reports.
TTDM Group Overviewpand Disclosures
Our Technology, Telecom & Digital Media (TTDM) Group is dedicated to providing superior merger & acquisition and capital markets advisory services to market leading companies. Our professionals’ extensive industry knowledge and transaction leadership experience spans the software, digital media, IT services and communications sectors. Our professionals in London, Boston and San Francisco have
1001 Haxall Point9th FloorRichmond, VA 23219USAPh +1 (804) 648 0072
Thierry MonjauzeManaging Director63 Brook StreetLondon W1K 4HSUnited Kingdom
Jeff BistrongManaging DirectorTwo International Place, 24th FloorBoston, MA 02110USA
services and communications sectors. Our professionals in London, Boston and San Francisco have global relationships with leading technology companies and financial investors. Thoughtful advice, deep experience and technology expertise, creativity and attention to detail from our senior technology bankers have resulted in a track record of consistently exceeding our clients' expectations.
Phone: +1 (804) 648-0072Fax: +1 (804) 648-0073
Two International Place24th FloorBoston, MA 02110USAPhone: +1 (617) 482-7501Fax: +1 (617) 482-7503
This report has been prepared by Harris Williams & Co. Ltd and approved by Sturgeon Ventures LLP in accordance with Conduct Of Business rules COBS 4 of the FSA Handbook. Harris Williams & Co. Ltd is an authorised representative of Sturgeon Ventures LLP which is Authorised and Regulated by the Financial Services Authority. This report is being made by Harris Williams & Co Ltd.
Investment banking services are provided by Harris Williams LLC, a registered broker-dealer and member of FINRA and SIPC and Harris Williams & Co Ltd Harris Williams & Co is a trade name under which Harris Williams LLC and Harris
United KingdomPhone: +44 20 7518 [email protected]
USAPhone: +1 (617) [email protected]
Fax: 1 (617) 482 7503
1900 East 9th Street20th FloorCleveland, OH 44114USAPhone: +1 (216) 689-2400Fax: +1 (216) 689-2401
SIPC, and Harris Williams & Co. Ltd. Harris Williams & Co. is a trade name under which Harris Williams LLC and Harris Williams & Co. Ltd conduct business in the U.S. and Europe, respectively.
Harris Williams & Co. (www.harriswilliams.com), a member of The PNC Financial Services Group, Inc. (NYSE:PNC), is the premier middle market advisor with a two-decade legacy of sell side excellence serving clients worldwide. The firm is focused exclusively on the middle market providing sell side and acquisition advisory, restructuring advisory, board advisory, private placements and capital markets advisory services.
THIS REPORT MAY CONTAIN REFERENCES TO REGISTERED TRADEMARKS, SERVICE MARKS AND COPYRIGHTS OWNED BY THIRD-PARTY INFORMATION PROVIDERS. NONE OF THE THIRD PARTY INFORMATION PROVIDERS IS ENDORSING THE OFFERING OF AND SHALL NOT IN ANY WAY BE DEEMED
63 Brook StLondon, W1K 4HSUnited KingdomPhone: +44 20 7518 8900Fax: +44 20 7526 2187
222 South Ninth Street INFORMATION PROVIDERS IS ENDORSING THE OFFERING OF, AND SHALL NOT IN ANY WAY BE DEEMED AN ISSUER OR UNDERWRITER OF, THE SECURITIES, FINANCIAL INSTRUMENTS OR OTHER NVESTMENTS DISCUSSED IN THIS REPORT AND SHALL NOT HAVE ANY LIABILITY OR RESPONSIBILITY FOR ANY STATEMENTS MADE IN THE REPORT OR FOR ANY FINANCIAL STATEMENTS, FINANCIAL PROJECTIONS OR OTHER FINANCIAL INFORMATION CONTAINED OR ATTACHED AS AN EXHIBIT TO THE REPORT. FOR MORE INFORMATION ABOUT THE MATERIALS PROVIDED BY SUCH THIRD PARTIES, PLEASE CONTACT US AT +44 20 7518 8900.
The information and views contained in this report were prepared by Harris Williams & Co. Ltd (“Harris Williams”). It is not a research report, as such term is defined by applicable law and regulations, and is provided for informational purposes only. It is not to be construed as an offer to buy or sell or a solicitation of an offer to buy or sell any financial instruments or
Suite 3350Minneapolis, MN 55402USAPhone: +1 (612) 359-2700Fax: +1 (612) 359-2701
1600 Market Street21st FloorPhil d l hi PA 19103
y ff y f ff y y fto participate in any particular trading strategy. The information contained herein is believed by Harris Williams to be reliable but Harris Williams makes no representation as to the accuracy or completeness of such information.
Harris Williams and/or its affiliates may be market makers or specialists in, act as advisers or lenders to, have positions in and effect transactions in securities of companies mentioned herein and also may provide, may have provided, or may seek to provide investment banking services for those companies. In addition, Harris Williams and/or its affiliates or their respectiveofficers, directors and employees may hold long or short positions in the securities, options thereon or other related financialproducts of companies discussed herein. Opinions, estimates and projections in this report constitute Harris Williams’ judgment and are subject to change without notice. The financial instruments discussed in this report may not be suitable for all investors and investors must make their own investment decisions using their own independent advisors as they believe
Philadelphia, PA 19103USAPhone: +1 (267) 675-5900Fax: +1 (267) 675-5901
575 Market Street31st FloorSan Francisco, CA 94105USA g p y
necessary and based upon their specific financial situations and investment objectives. Also, past performance is not necessarily indicative of future results. No part of this material may be copied or duplicated in any form or by any means, or redistributed, without Harris Williams’ prior written consent.
Copyright© 2010 Harris Williams & Co., all rights reserved.www.harriswilliams.com
USPhone: +1 (415) 288-4260Fax: +1 (415) 288-4269
Related Documents