A controversial plan by the Ethiopian government to expand the capital, Addis Ababa, into the sur- rounding Oromia region was abandoned in January 2016 after months of protests by the Oromo people. That, however, did not stop protests from continuing, as some Ethiopians expressed discontent with the government and the questionable detentions of activists. Government securi- ty forces responded harshly to demonstrations in the Oromia and Amhara regions—killing many demonstrators, wound- ing others, and arbitrarily arresting thousands more—draw- ing condemnation from human rights groups. In August the UN asked to send in observers to investigate the situation, but the Ethiopian government denied the request. Vital statistics Birth rate per 1,000 population (2015): 37.3 (world avg. 19.5). Death rate per 1,000 population (2015): 8.2 (world avg. 8.1). Life expectancy at birth (2015): male 59.1 years; female 63.9 years. Adult population (ages 15–49) living with HIV (2014): 1.1% (world avg. 0.8%). Demography Population (2016): 92,255,000. Density (2016): persons per sq mi 224.6, persons per sq km 86.7. Sex distribution (2015): male 50.24%; female 49.76%. Population projection: (2020) 101,420,000; (2030) 125,265,000. Major cities (2015 2 ): Addis Ababa 3,273,000; Adama (Nazret) 324,000; Gonder 323,900; Mekele 323,700; Hawassa 300,100. Urban-rural (2014): Ethiopia Official name: Federal Democratic Republic of Ethiopia. Form of government: federal republic with two legislative houses (House of the Federation [153]; House of Peoples’ Representatives [547]). Head of state: President Mulatu Teshome Wirtu. Head of government: Prime Minister Hailemariam Desalegn. Capital: Addis Ababa. Official language: none 1 . Official religion: none. Monetary unit: birr (Br); valuation (Sept. 1, 2016) 1 U.S.$ = Br 22.13; 1 £ = Br 29.43. Ethnic composition (2012): Age breakdown (2013): Religious affiliation (2012): Area and population area population 2015 2 Regional states Capitals sq mi sq km estimate Afar (Affar) Asayita (Asaita) 27,820 72,053 1,723,000 Amhara (Amara) Bahir Dar 59,733 154,709 20,401,000 Benishangul Gumuz Asosa (Asossa) 19,575 50,699 1,005,000 Gambella Gambella 11,499 29,783 409,000 Harari (Hareri) Harar (Harer) 129 334 232,000 Oromia (Oromiya) Addis Ababa 109,861 284,538 33,692,000 Somali (Sumale) Jijiga 107,820 3 279,252 3 5,453,000 Southern Nations, Nationalities and Peoples’ (SNNP) Hawassa (Awasa) 40,725 105,476 18,276,000 Tigray Mekele 32,711 84,722 5,056,000 Cities Addis Ababa — 203 527 3,273,000 Dire Dawa 4 — 602 1,559 440,000 TOTAL 410,678 1,063,652 90,078,000 5 © 2017 Encyclopædia Britannica, Inc. World Data ENCYCLOPÆDIA Britannica

Welcome message from author
This document is posted to help you gain knowledge. Please leave a comment to let me know what you think about it! Share it to your friends and learn new things together.
Transcript
Acontroversial plan by the Ethiopian government toexpand the capital, Addis Ababa, into the sur-rounding Oromia region was abandoned in January
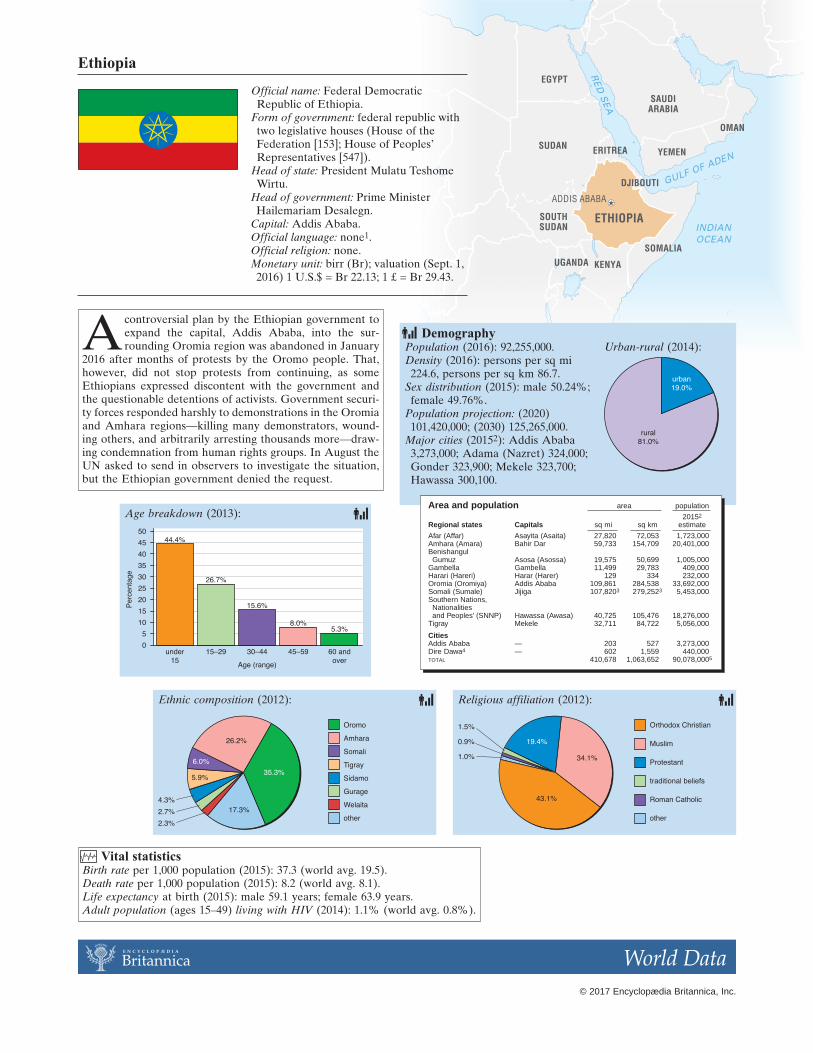
2016 after months of protests by the Oromo people. That,however, did not stop protests from continuing, as someEthiopians expressed discontent with the government andthe questionable detentions of activists. Government securi-ty forces responded harshly to demonstrations in the Oromiaand Amhara regions—killing many demonstrators, wound-ing others, and arbitrarily arresting thousands more—draw-ing condemnation from human rights groups. In August theUN asked to send in observers to investigate the situation,but the Ethiopian government denied the request.
Vital statisticsBirth rate per 1,000 population (2015): 37.3 (world avg. 19.5).Death rate per 1,000 population (2015): 8.2 (world avg. 8.1).Life expectancy at birth (2015): male 59.1 years; female 63.9 years.Adult population (ages 15–49) living with HIV (2014): 1.1% (world avg. 0.8%).
DemographyPopulation (2016): 92,255,000.Density (2016): persons per sq mi224.6, persons per sq km 86.7.
Sex distribution (2015): male 50.24%;female 49.76%.
Population projection: (2020)101,420,000; (2030) 125,265,000.
Major cities (20152): Addis Ababa3,273,000; Adama (Nazret) 324,000;Gonder 323,900; Mekele 323,700;Hawassa 300,100.
Urban-rural (2014):
Ethiopia
Official name: Federal DemocraticRepublic of Ethiopia.
Form of government: federal republic withtwo legislative houses (House of theFederation [153]; House of Peoples’Representatives [547]).
Head of state: President Mulatu TeshomeWirtu.
Head of government: Prime MinisterHailemariam Desalegn.
Capital: Addis Ababa.Official language: none1.Official religion: none.Monetary unit: birr (Br); valuation (Sept. 1,
2016) 1 U.S.$ = Br 22.13; 1 £ = Br 29.43.
Ethnic composition (2012):
Age breakdown (2013):
Religious affiliation (2012):
Area and population area population
20152
Regional states Capitals sq mi sq km estimate
Afar (Affar) Asayita (Asaita) 27,820 72,053 1,723,000Amhara (Amara) Bahir Dar 59,733 154,709 20,401,000BenishangulGumuz Asosa (Asossa) 19,575 50,699 1,005,000
Gambella Gambella 11,499 29,783 409,000Harari (Hareri) Harar (Harer) 129 334 232,000Oromia (Oromiya) Addis Ababa 109,861 284,538 33,692,000Somali (Sumale) Jijiga 107,8203 279,2523 5,453,000Southern Nations,Nationalitiesand Peoples’ (SNNP) Hawassa (Awasa) 40,725 105,476 18,276,000
Tigray Mekele 32,711 84,722 5,056,000
CitiesAddis Ababa — 203 527 3,273,000Dire Dawa4 — 602 1,559 440,000TOTAL 410,678 1,063,652 90,078,0005
© 2017 Encyclopædia Britannica, Inc.
World DataE N C Y C L O P Æ D I A
Britannica

National economyBudget (2014–15). Revenue: Br 199,639,100,000 (tax revenue 82.8%, of
which indirect taxes 52.7%, direct taxes 30.1%; grants6.5%; nontax revenue 10.7%). Expenditures: Br 230,521,-180,000 (capital expenditure 50.8%, of which economicdevelopment 33.1%; current expenditure 49.2%, ofwhich social services 22.4%).
Public debt (external, outstanding; 2014): U.S.$15,845,-673,000.
Gross national income (GNI; 2015): U.S.$58,863,000,000(U.S.$590 per capita); purchasing power parity GNI(U.S.$1,620 per capita).
Production (metric tons except as noted). Agriculture,forestry, fishing (2014): corn (maize) 7,234,955, sorghum4,339,134, wheat 4,231,589, sugarcane 2,748,990, sweet
potatoes 2,701,599, barley 1,953,385, yams 1,448,835, potatoes 921,832,millet 915,315, dry broad beans 838,944, dry beans 513,725, chickpeas458,682, cabbages and other brassicas 395,00012; leading producer ofbeeswax, honey, cut flowers, and khat; livestock (number of live ani-mals) 56,706,389 cattle, 29,332,382 sheep, 29,112,963 goats, 1,164,100camels, 5,250,00012 beehives; roundwood 109,683,244 cu m, of whichfuelwood 97%; fisheries production 50,205 (from aquaculture, negligi-ble). Mining and quarrying (2013): rock salt 470,000; gold 12,581 kg;tantalum 9,800 kg; niobium 3,500 kg. Manufacturing (value added inU.S.$’000,000; 2014): food products and beverages 541; bricks,cement, and ceramics 255; chemicals and chemical products 163;leather, leather products, and footwear 131. Energy production (con-sumption): electricity (kW-hr; 2012) 6,700,000,000 (4,644,000,000), bysource (2013): fossil fuels, negligible; renewable energy c. 100%, ofwhich hydroelectric c. 96.5%, wind energy c. 3.5%, geothermal, negli-gible; petroleum products (metric tons; 2011) n.a. (1,810,000).
Population economically active (2013): total 44,385,044; participationrates: age 10 and over, male 85.0%; female 74.6%; unemployed 4.5%,of which youth (ages 15–24) 6.8%.
Average household size (2004): 5.3.Land use as % of total land area (2009): in temporary crops 11.9%,left fallow 0.6%, in permanent crops 1.0%, in pasture 21.4%, forestarea 12.4%.
MilitaryTotal active duty personnel (November 2015): 138,000
(army 97.8%, air force 2.2%); mandate for the UNpeacekeeping force along the Ethiopian-Eritreanborder was terminated in July 2008. Military expen-diture as percentage of GDP (2015): 0.6%; per capi-ta expenditure U.S.$4.
Foreign trade11
Imports (2013): U.S.$10,955,400,000 (machinery andapparatus 22.2%, chemicals and chemical products12.2%, metals and articles thereof 11.9%, mineralproducts 11.6%, transport equipment 11.3%). Major import sources:
Exports (2013): U.S.$2,591,000,000 (coffee 23.4%,vegetables 20.8%, oil seeds 18.4%, live animalsand meat 10.0%, pearls and gemstones 6.4%). Major export destinations:
Transport and communicationsTransport. Railroads (2009–10): route length(2015) 423 mi, 681 km; passenger-km5,000,00013; metric ton-km cargo 600,00013.Roads (2015): total length 68,608 mi,110,414 km (paved 13%); passenger-km(2006–07) 9,968,000,000; metric ton-kmcargo, n.a. Vehicles (2007): passenger cars70,893; trucks and buses 166,095.
Education and healthLiteracy (2015): total population age 15 and over lit-erate 49.1%; males literate 57.2%; females literate41.1%.
Health (2010–11): physicians 1,427 (1 per 56,607 per-sons); hospital beds 23,311 (1 per 3,465 persons);infant mortality rate (2015) 53.4; undernourishedpopulation (2006–08) 32,600,000 (41% of total pop-ulation based on the consumption of a minimumdaily requirement of 1,750 calories).
1Amharic is the “working” language. 2July; official projections. 3Estimate. 4IncludesDire Dawa Town (population 277,000). 5Includes special enumeration areas having apopulation of 118,000. 6Provisional. 7Age 10 and up. 8Taxes on products less imputedbank service charges. 9Unemployed. 10Detail does not add to total given because ofstatistical discrepancy. 11Imports c.i.f.; exports f.o.b. 122013. 13Includes Djibouti partof Addis Ababa–Djibouti railroad. 14Subscribers.
Internet resources for further information:• Central Statistical Agency www.csa.gov.et• National Bank of Ethiopia www.nbe.gov.et
Structure of gross domestic product and labour force20136 20137
in value % of total labour % of labourBr ’000,000 value force force
Agriculture, forestry, fishing 358,085 42.0 30,817,068 69.4Mining and quarrying 10,307 1.2 179,681 0.4Manufacturing 30,381 3.6 1,902,194 4.3Construction 38,836 4.5 824,769 1.9Public utilities 7,539 0.9 227,311 0.5Transp. and commun. 41,077 4.8 412,798 0.9Trade, hotels 147,236 17.3 2,787,692 6.3Finance, real estate 82,241 9.6 135,947 0.3Pub. admin., defense 26,954 3.2 287,397 0.6Services 44,647 5.2 4,829,021 10.9Other 65,4378 7.78 1,981,1659 4.59
TOTAL 852,740 100.0 44,385,04410 100.0
Communications units unitsnumber per 1,000 number per 1,000
Medium date in ’000s persons Medium date in ’000s persons
TelephonesCellular 2015 42,31114 42814
Landline 2015 891 9.0
Internet users 2009 445 5.4Broadband 2015 65114 6.614
© 2017 Encyclopædia Britannica, Inc.
World DataE N C Y C L O P Æ D I A
Britannica
Related Documents