Estimating the global burden of tuberculosis WHO estimates of TB incidence, prevalence and mortality, by country, 1990–2007

Welcome message from author
This document is posted to help you gain knowledge. Please leave a comment to let me know what you think about it! Share it to your friends and learn new things together.
Transcript
Estimating the global burden of tuberculosis
WHO estimates of TB incidence,
prevalence and mortality,
by country, 1990–2007

• Why estimate the burden?
• A brief history of TB estimates
• Why revise them now?
• The burden (of estimates)
• Mechanics of calculations and lists of key assumptions
• What we don't do
• What should we do now?
This morning’s presentation…
Why estimate the burden?
• To give us an idea of the size of the problem
– priority setting, planning, funding
• To monitor progress, evaluate programmes and approaches
– (changes may or may not be due to TB
control)
• Everybody wants numbers
– even if they love to hate them.

Guidelines | 27 July 20064 |

Guidelines | 27 July 20065 |

Guidelines | 27 July 20066 |

Guidelines | 27 July 20067 |
Guidelines | 27 July 20068 |
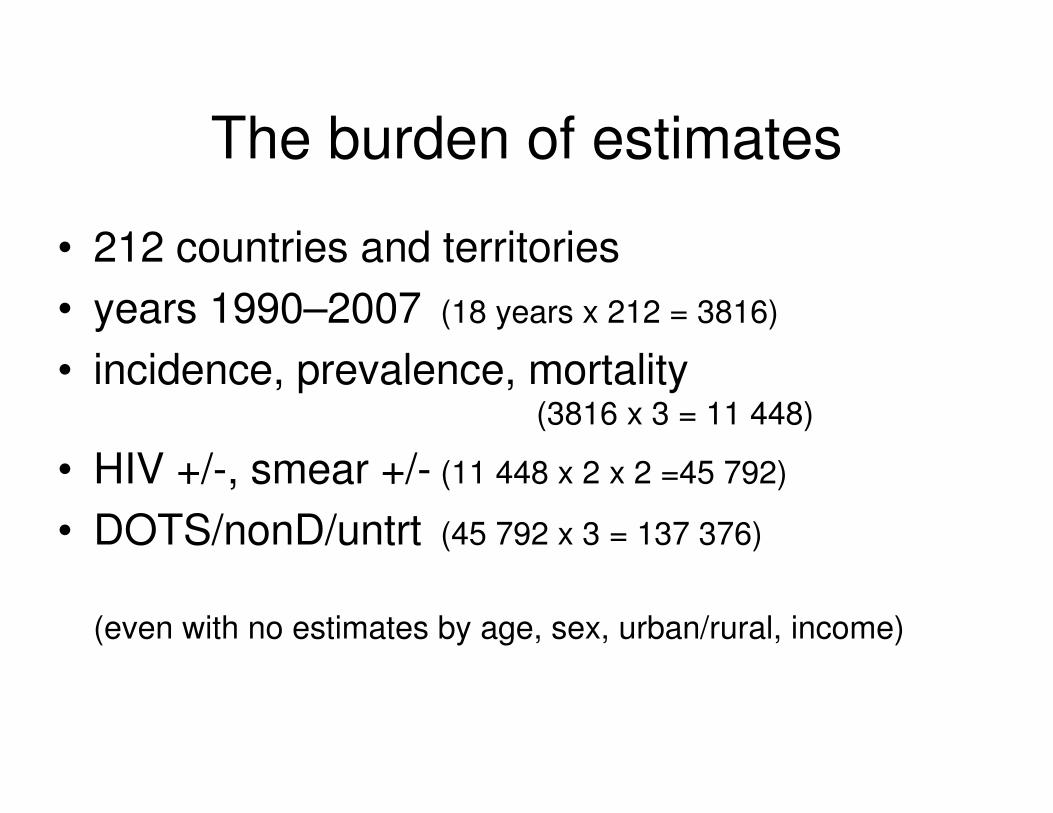
The burden of estimates
• 212 countries and territories
• years 1990–2007 (18 years x 212 = 3816)
• incidence, prevalence, mortality(3816 x 3 = 11 448)
• HIV +/-, smear +/- (11 448 x 2 x 2 =45 792)
• DOTS/nonD/untrt (45 792 x 3 = 137 376)
(even with no estimates by age, sex, urban/rural, income)
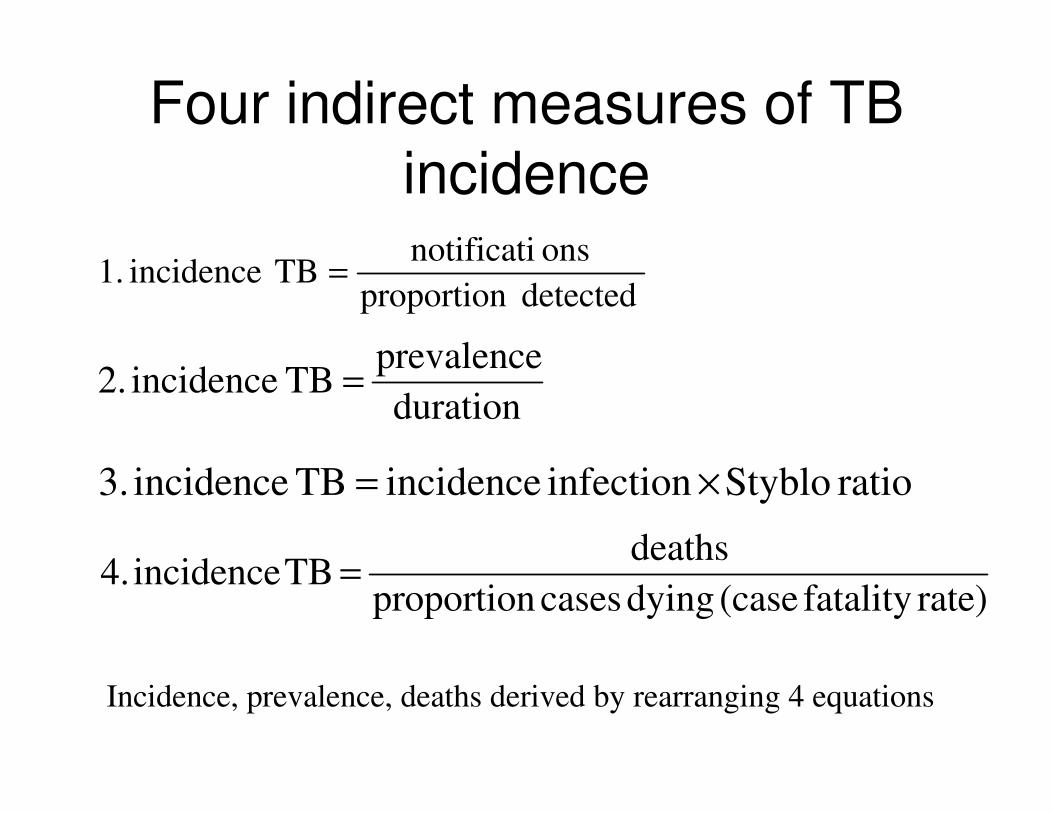
duration
prevalenceTB incidence 2. =
detected proportion
onsnotificatiTB incidence 1. =
ratio Styblo infection incidenceTB incidence 3. ×=
rate)fatality (case dying cases proportion
deaths TB incidence 4. =
Incidence, prevalence, deaths derived by rearranging 4 equations
Four indirect measures of TB
incidence
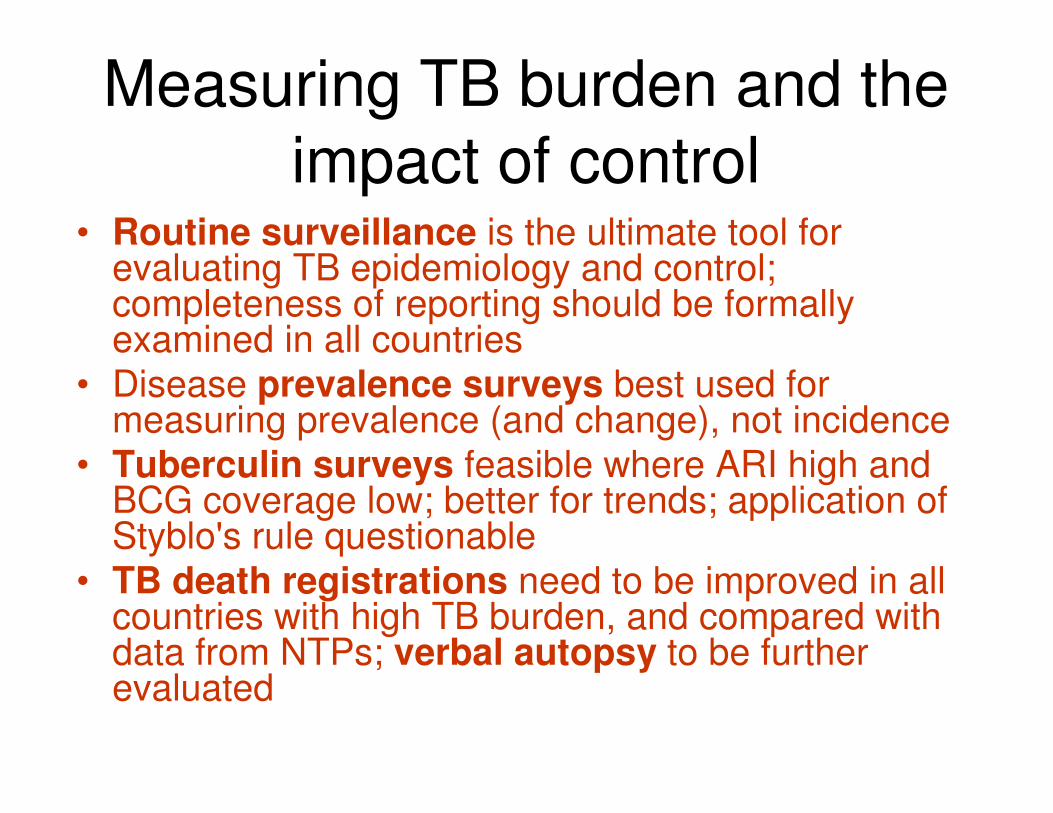
Measuring TB burden and the
impact of control• Routine surveillance is the ultimate tool for
evaluating TB epidemiology and control; completeness of reporting should be formally examined in all countries
• Disease prevalence surveys best used for measuring prevalence (and change), not incidence
• Tuberculin surveys feasible where ARI high and BCG coverage low; better for trends; application of Styblo's rule questionable
• TB death registrations need to be improved in all countries with high TB burden, and compared with data from NTPs; verbal autopsy to be further evaluated

1997
1996 Incidence
1998 Incidence
1999 Incidence
1995 Incidence
2007 Incidence
1990 Incidence
Prevalence
Prevalence
Prevalence
Prevalence
Prevalence
Prevalence
Prevalence
Mortality
Mortality
Mortality
Mortality
Mortality
Mortality
Mortality
Incidence1
23 3
2015
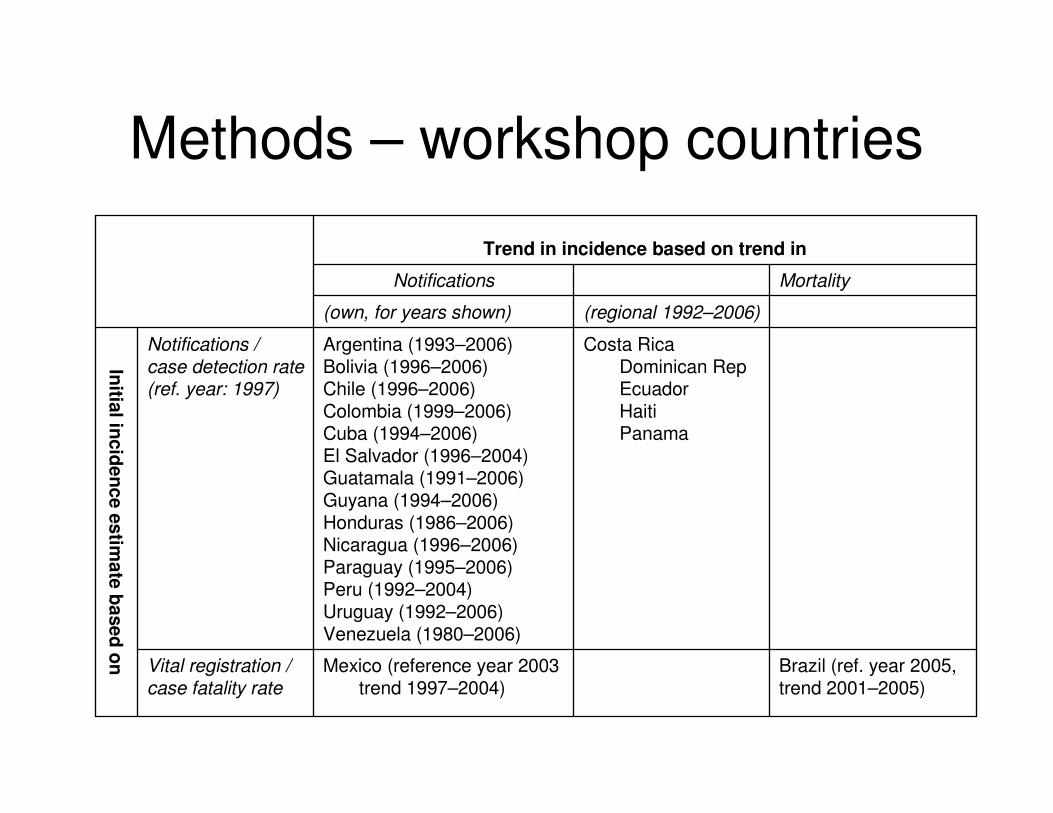
Methods – workshop countries
Brazil (ref. year 2005,trend 2001–2005)
Mexico (reference year 2003trend 1997–2004)
Vital registration / case fatality rate
Costa RicaDominican RepEcuadorHaitiPanama
Argentina (1993–2006)Bolivia (1996–2006)Chile (1996–2006)Colombia (1999–2006)Cuba (1994–2006)El Salvador (1996–2004)Guatamala (1991–2006)Guyana (1994–2006)Honduras (1986–2006)Nicaragua (1996–2006)Paraguay (1995–2006)Peru (1992–2004)Uruguay (1992–2006)Venezuela (1980–2006)
Notifications / case detection rate(ref. year: 1997)
Initia
l incid
en
ce e
stim
ate
based
on
(regional 1992–2006)(own, for years shown)
MortalityNotifications
Trend in incidence based on trend in
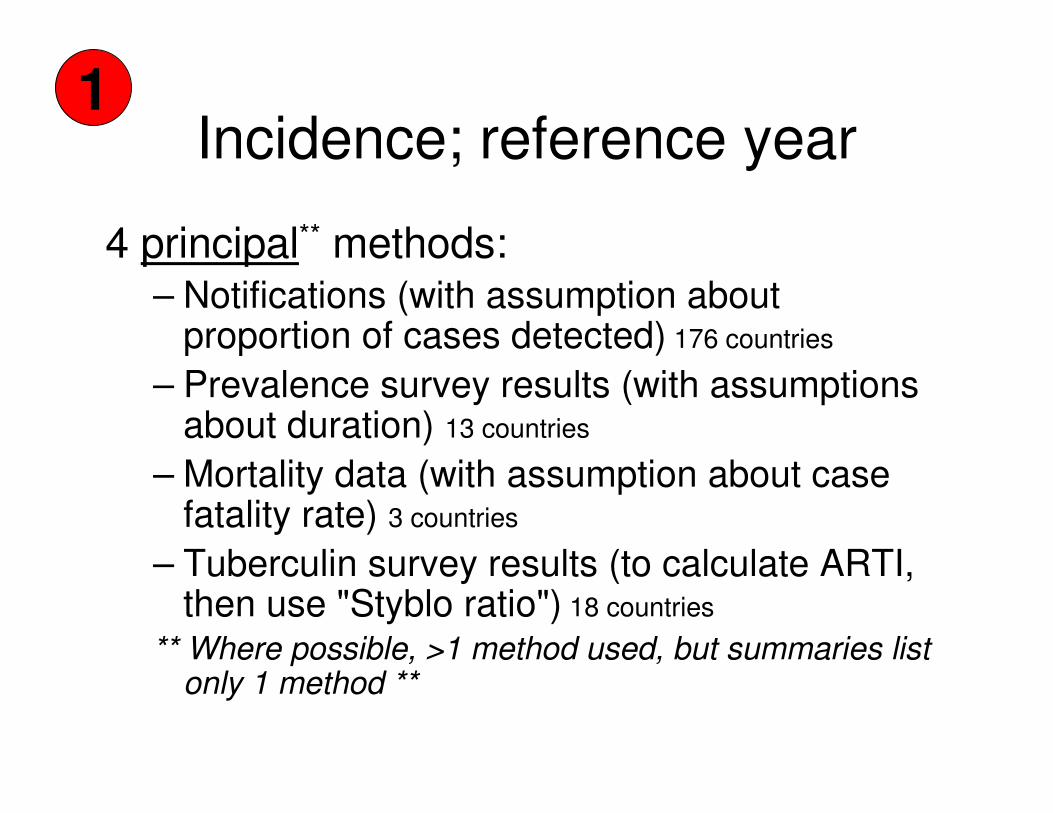
Incidence; reference year
4 principal** methods:– Notifications (with assumption about
proportion of cases detected) 176 countries
– Prevalence survey results (with assumptions about duration) 13 countries
– Mortality data (with assumption about case fatality rate) 3 countries
– Tuberculin survey results (to calculate ARTI, then use "Styblo ratio") 18 countries
** Where possible, >1 method used, but summaries list only 1 method **
1

Incidence from notifications
(176 countries)
If 50% of incident ss+ cases notified to WHO*
then Incidence = notified cases / 0.5
* Expert opinion based on coverage of health services, availability of TB services at primary health-care facilities, health-seeking behaviour
* Where it is thought that almost all cases are treated, but that only cases treated under DOTS are notified, operational research among TB patients can provide estimate of proportion notified (e.g. Afghanistan)
n.b Original estimates based on most recent notification data not average over several years.
1a

Incidence from notifications - assumptions• proportion of cases notified (CDR) is generally expert opinion
• need to decide whether to apply to notifications of smear-positive cases or all forms, from DOTS only or all sources (in most cases ss+ from all sources)
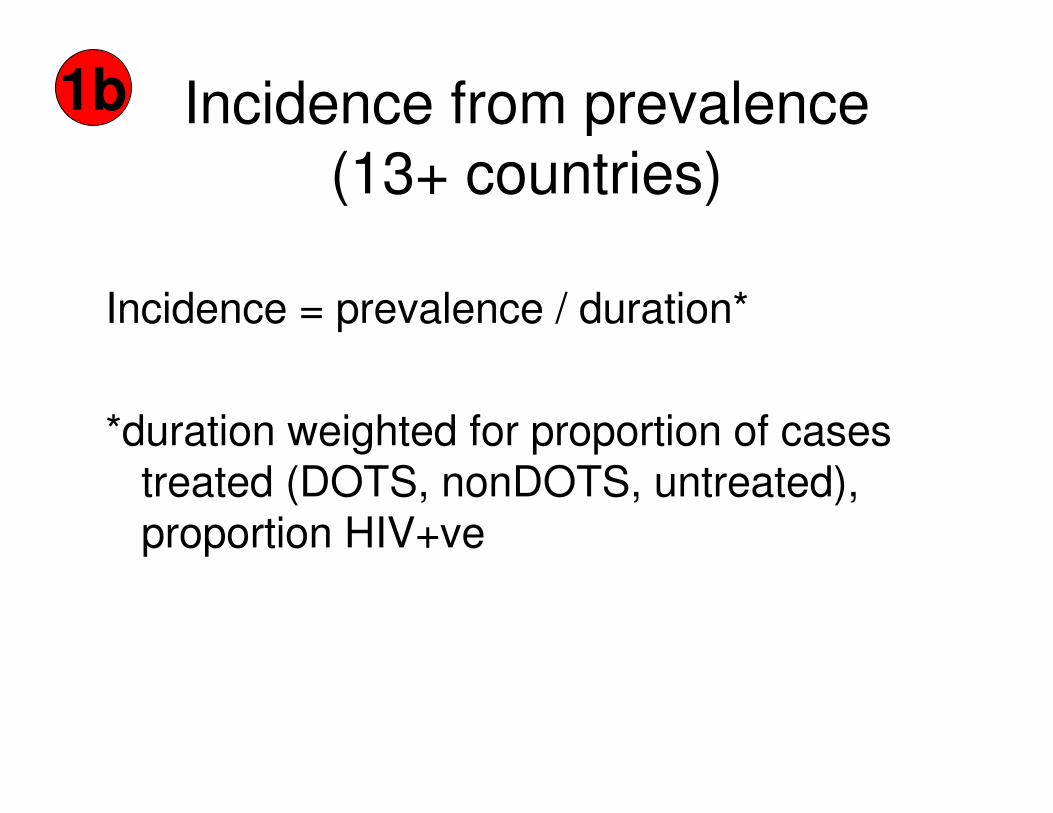
Incidence from prevalence
(13+ countries)
Incidence = prevalence / duration*
*duration weighted for proportion of cases treated (DOTS, nonDOTS, untreated), proportion HIV+ve
1b
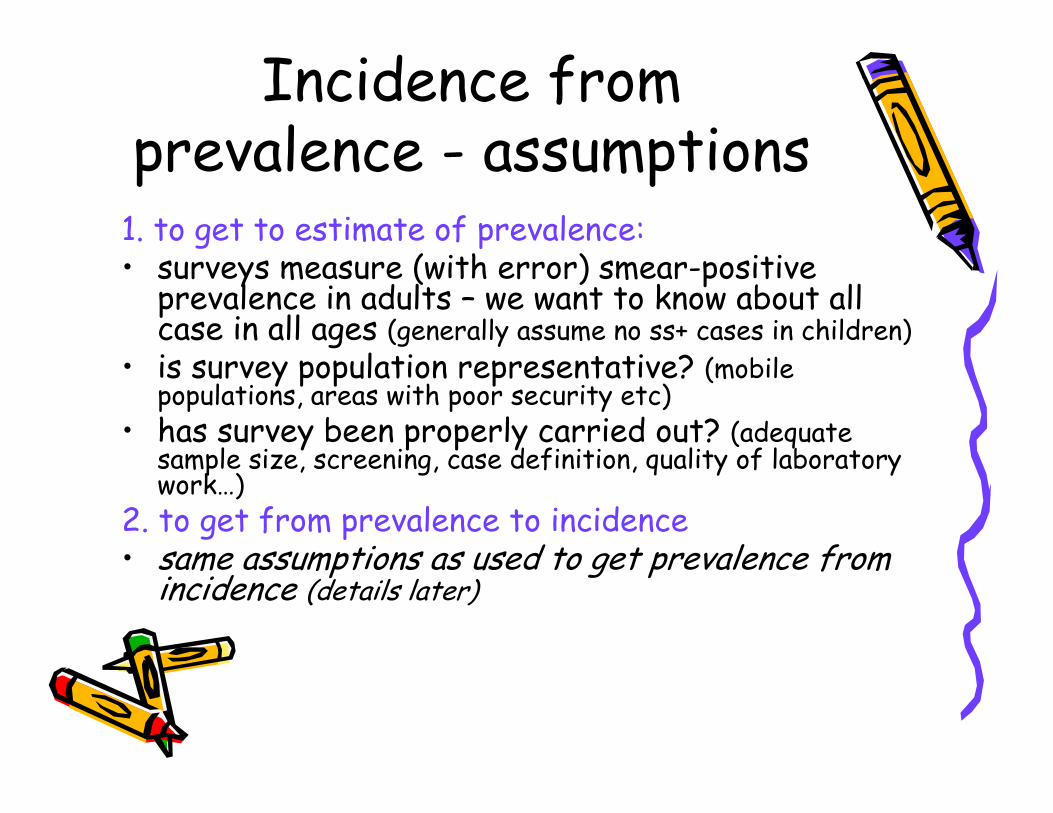
Incidence from prevalence - assumptions1. to get to estimate of prevalence:• surveys measure (with error) smear-positive prevalence in adults – we want to know about all case in all ages (generally assume no ss+ cases in children)
• is survey population representative? (mobile populations, areas with poor security etc)
• has survey been properly carried out? (adequate sample size, screening, case definition, quality of laboratory work…)
2. to get from prevalence to incidence• same assumptions as used to get prevalence from incidence (details later)
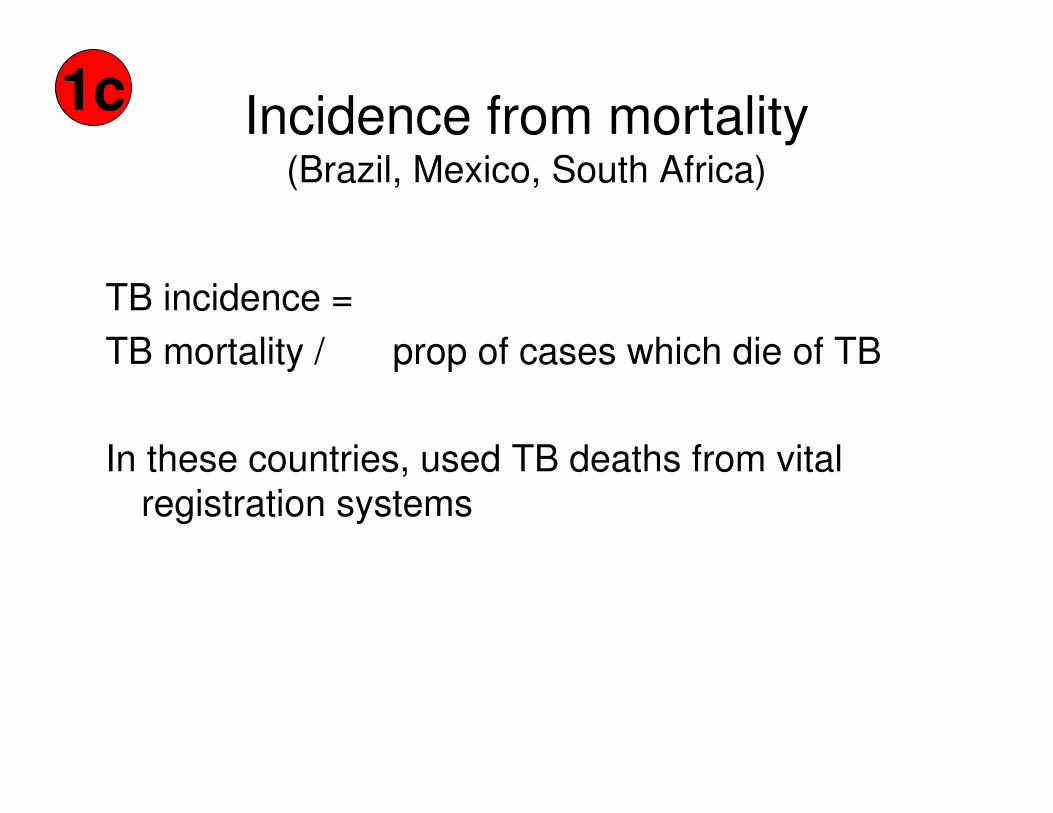
Incidence from mortality(Brazil, Mexico, South Africa)
TB incidence =
TB mortality / prop of cases which die of TB
In these countries, used TB deaths from vital
registration systems
1c
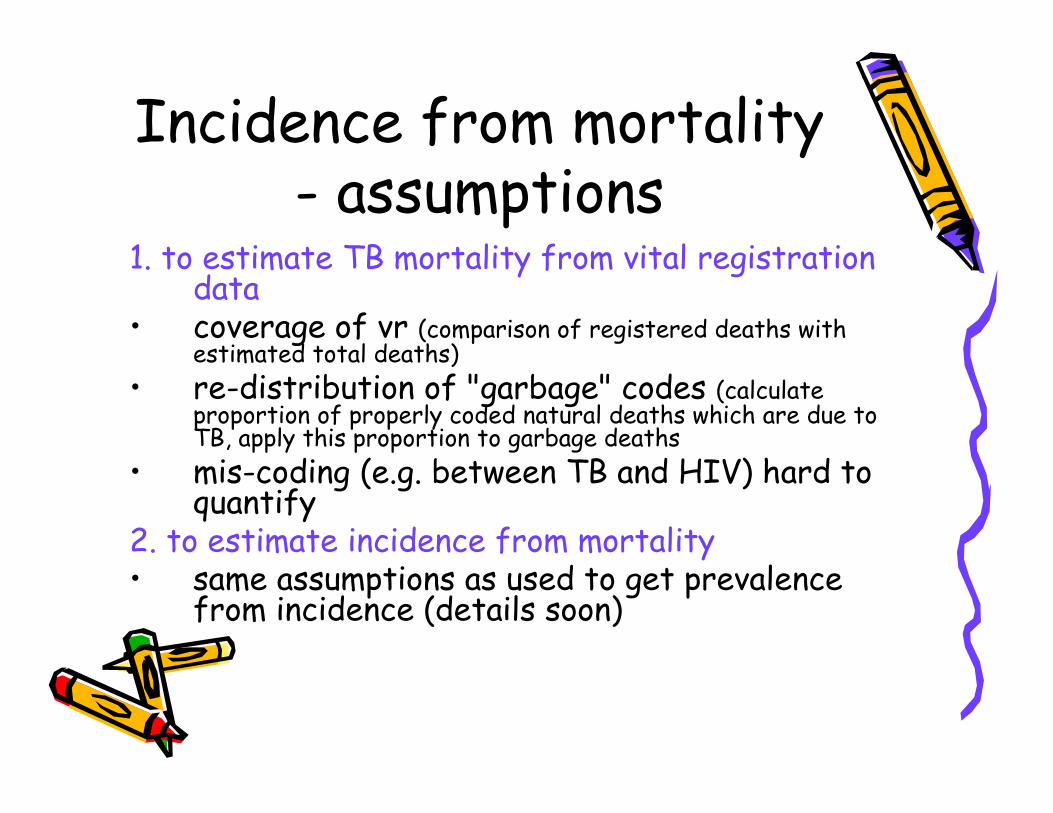
Incidence from mortality - assumptions
1. to estimate TB mortality from vital registration data
• coverage of vr (comparison of registered deaths with estimated total deaths)
• re-distribution of "garbage" codes (calculate proportion of properly coded natural deaths which are due to TB, apply this proportion to garbage deaths
• mis-coding (e.g. between TB and HIV) hard to quantify
2. to estimate incidence from mortality• same assumptions as used to get prevalence
from incidence (details soon)
Incidence from ARTI
(18+ countries)
• Based on observation of Styblo:
1% annual risk of infection with MTB corresponds to incidence of 50 smear-positive cases per 100 000 population
1d

Incidence from ARTI - assumptions1. to estimate ARTI from tuberculin survey• problems with “digit preference” when measuring
induration sizes, distinguishing MTB infection from reaction following BCG vaccination, environmental mycobacteria
• well behaved bimodal distributions rare• usually assume no effect of age on risk of infection• result is estimate for date of survey minus half the
age of the children (e.g. 2000 – 6/2= 1997)2. to estimate incidence from ARTI• original Styblo observation of fixed ratio of
incidence ss+ case to ARI based on few studies• relationship breaks down when HIV prevalence is
high or incidence is not stable (e.g. falling due to good TB control)
Incidence from comparison with
neighbouring countries
(5+ countries)
• Armenia, Azerbaijan, Afghanistan (in addition to notifications/CDR), Kyrgyzstan, Kazakhstan, Macao, Moldova, Timor-Leste
1e
Prevalence of HIV in incident TB cases
Note – HIV prevalence not used as input in estimating TB incidence
• Incidence rate ratio (odds ratio) – the ratio of the incidence of TB in HIV-positive people to the incidence of TB in HIV-negative people
• Direct data from HIV testing of TB patients (for 2006, 28 countries revised – 13 direct data, 2 surveys, 13 hybrid approach. For 2007 expect to be able to use direct data for more countries)

TB/HIV assumptions• How much testing needs to be done before we use direct data?
• What do we do for years pre-testing? Current approach – calculate IRR for 2006, apply to earlier years
• Is IRR the right indirect approach for countries without direct data?
• How does IRR vary between countries?Currently using 30 for high-income countries, 6 for others. Might be better to distinguish on basis of generalized vs. concentrated epidemic, or to use IRR calculated from neighbouring countries with direct data
• How does IRR vary over time? Currently no time dependance, but clearly stage of HIV epidemic is important
• How is IRR affected by ART?
Proportion of all cases which are smear positive• among HIV-negative cases: 45% (based on age distribution of ss+ cases and proportion of cases ss+ by age – see Murray et al 1993)
• among HIV-positive cases: 35% (from literature)
• Globally, 50% of cases notified under DOTS are smear positive, but varies between regions (high in Latin America, low in Africa and high-income countries)
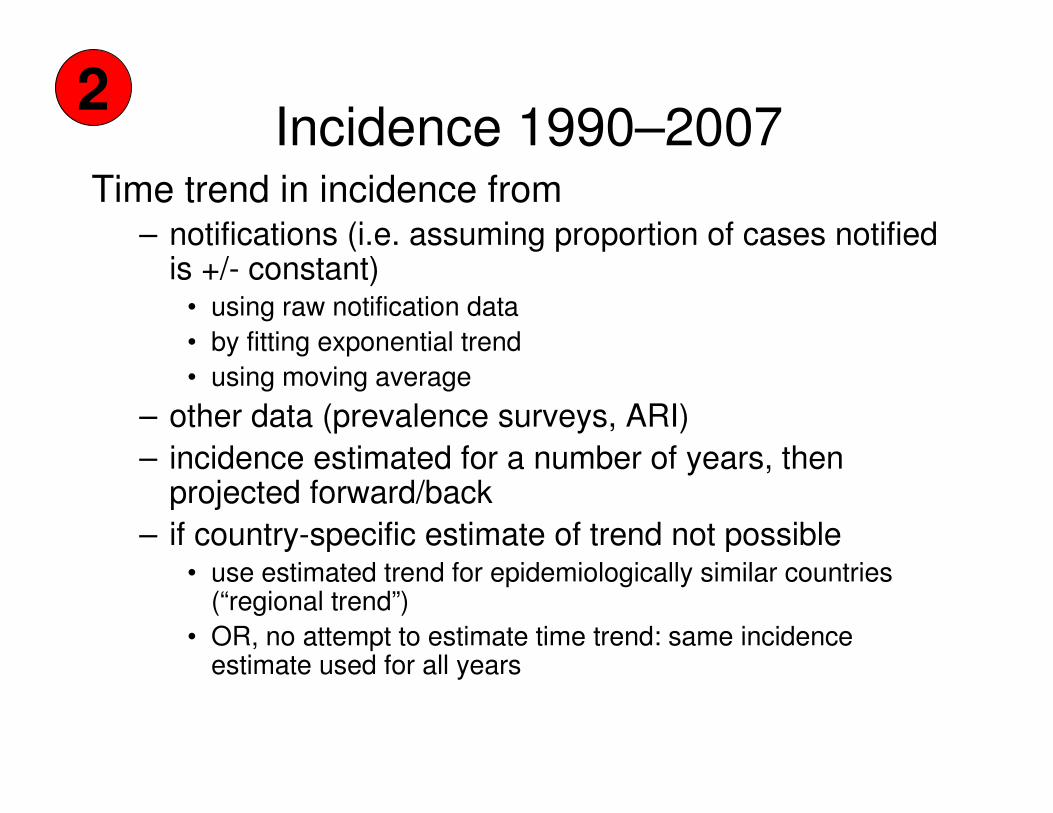
Incidence 1990–2007Time trend in incidence from
– notifications (i.e. assuming proportion of cases notified is +/- constant)
• using raw notification data
• by fitting exponential trend
• using moving average
– other data (prevalence surveys, ARI)
– incidence estimated for a number of years, then projected forward/back
– if country-specific estimate of trend not possible• use estimated trend for epidemiologically similar countries
(“regional trend”)
• OR, no attempt to estimate time trend: same incidence estimate used for all years
2
Year-to-year changes directly
from notification data
• currently only for Brunei Darresalum
• other candidates: high-income countries (including Middle-Eastern countries, Latin America c.f. working group on use of surveillance data)
2a
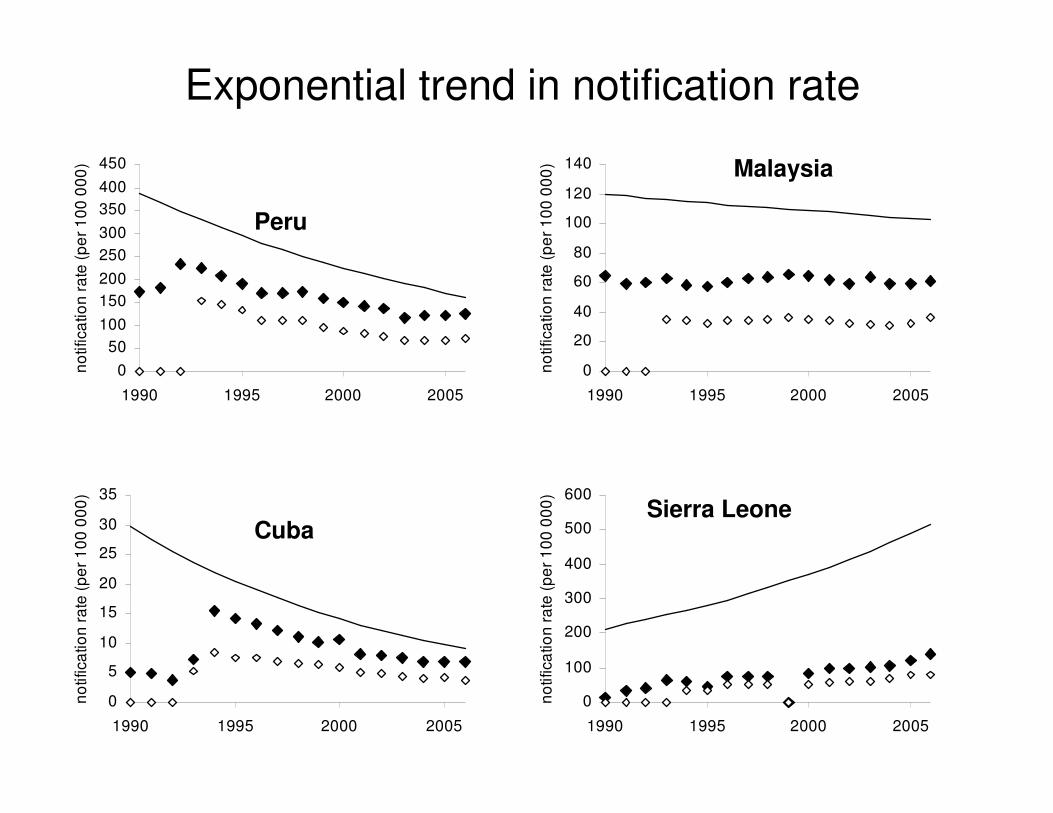
Exponential trend in notification
rate
• 44 countries using own data, 52 countries using regional trends – low-HIV Africa, Western Pacific, South-East Asia, Latin America
• Generally use total notification rate (DOTS and non-DOTS, all forms of disease)
2b
Exponential trend in notification rate
0
50
100
150
200
250
300
350
400
450
1990 1995 2000 2005
no
tifica
tio
n r
ate
(p
er
10
0 0
00
)
0
5
10
15
20
25
30
35
1990 1995 2000 2005
no
tifica
tio
n r
ate
(p
er
10
0 0
00
)
Peru
Cuba
0
20
40
60
80
100
120
140
1990 1995 2000 2005
no
tifica
tio
n r
ate
(p
er
10
0 0
00
) Malaysia
0
100
200
300
400
500
600
1990 1995 2000 2005
no
tifica
tio
n r
ate
(p
er
10
0 0
00
)
Sierra Leone

Moving average of notifications
• 53 countries using own notifications, 48 using regional notifications
• high HIV Africa, Central and Eastern Europe, Eastern Mediterranean, high-income coutries)
• Total notification rate (DOTS and non-DOTS, all forms of disease)
2c

0
5
10
15
20
25
30
35
40
45
50
1990 1995 2000 2005
no
tifica
tio
n r
ate
(p
er
10
0 0
00
)
0
2
4
6
8
10
12
14
16
18
20
1990 1995 2000 2005
no
tifica
tio
n r
ate
(p
er
10
0 0
00
)
Switzerland
Japan
0
100
200
300
400
500
600
700
800
1990 1995 2000 2005
no
tifica
tio
n r
ate
(p
er
10
0 0
00
)
Zimbabwe
0
20
40
60
80
100
120
1990 1995 2000 2005
no
tifica
tio
n r
ate
(p
er
10
0 0
00
) Russian Federation
Moving average of notification rate

Miscelaneous others
• South Africa– incidence estimated from vital registration data for years 1997 to
2005
– logistic curve fitted to estimated incidence
– curve used to generate estimates pre-1997 and post-2005
• India – trend set to zero to reflect opinion of NTP
• China – trend from successive prevalence surveys (overallduration assumed constant)
• Bangladesh – trend from ARI surveys
• Brazil – exponential trend in (corrected) number of TB deaths(overall cfr assumed constant)

Notifications as guide to incidence changes – assumptions I• For countries using own data – changes in notifications assumed to reflect changes in incidence, rather than in proportion of cases detected (quite likely to be a bit of both in many countries – need to start systematically assessing effort)
• For countries using "regional" trends – that the changes in incidence in other countries in
region have also occurred in the country in question
2d

Notifications as guide to incidence changes – assumptions II• For countries using raw notification data –year-to-year fluctations reflect incidence, due to small numbers, or to changes in immigration patterns
• For countries using exponential trend –proportional change in incidence is constant
• For countries using moving average –broad patterns observed in notification data
reflect incidence, but some “bumpiness” due to surveillance
2e
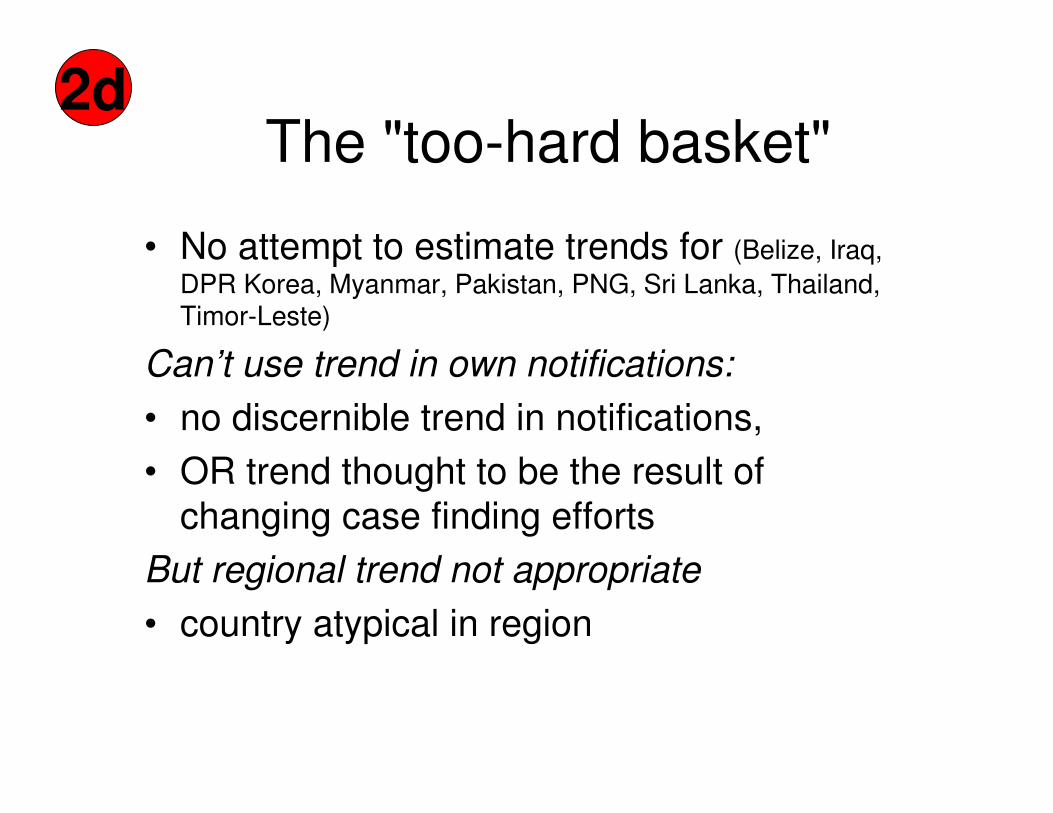
The "too-hard basket"
• No attempt to estimate trends for (Belize, Iraq,
DPR Korea, Myanmar, Pakistan, PNG, Sri Lanka, Thailand, Timor-Leste)
Can’t use trend in own notifications:
• no discernible trend in notifications,
• OR trend thought to be the result of
changing case finding efforts
But regional trend not appropriate
• country atypical in region
2d
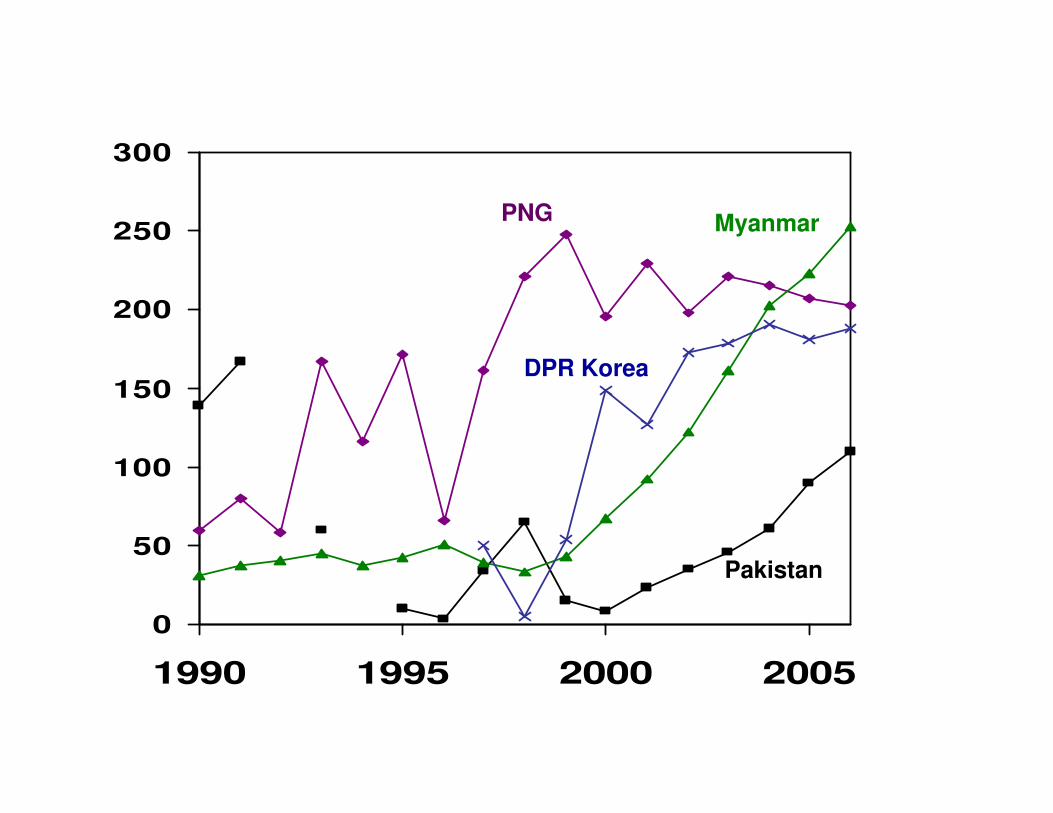
0
50
100
150
200
250
300
1990 1995 2000 2005
Pakistan
PNG Myanmar
DPR Korea
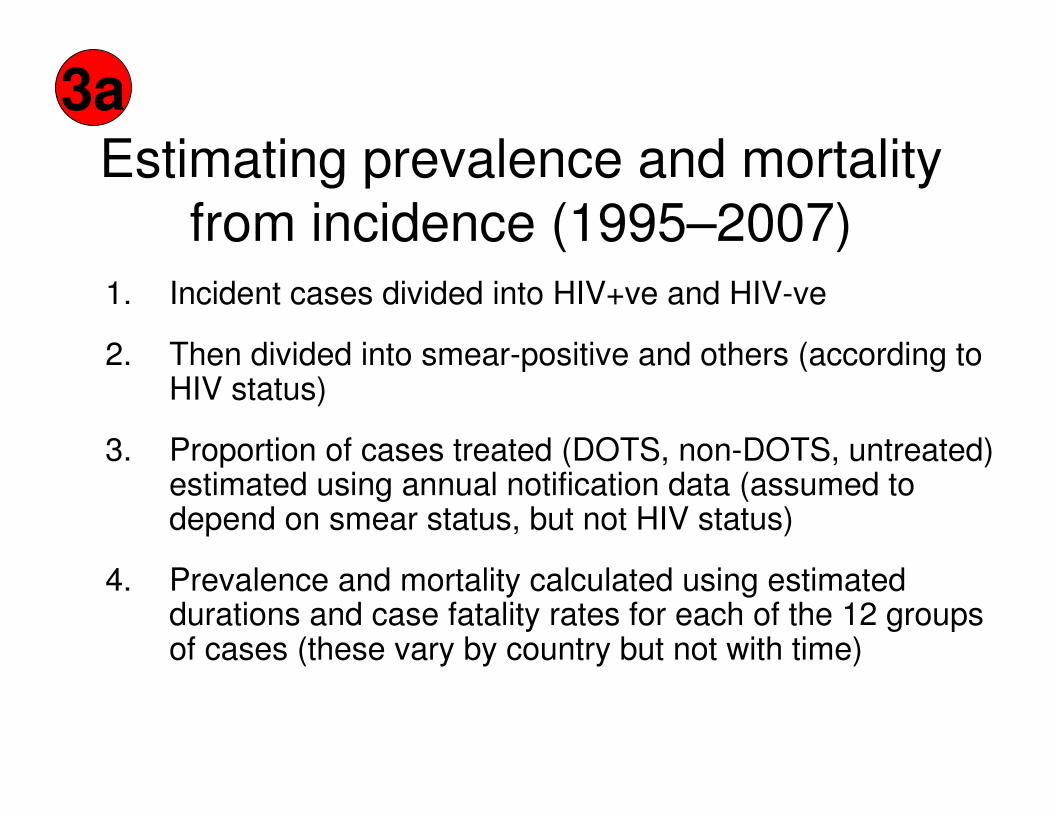
Estimating prevalence and mortality
from incidence (1995–2007)1. Incident cases divided into HIV+ve and HIV-ve
2. Then divided into smear-positive and others (according to HIV status)
3. Proportion of cases treated (DOTS, non-DOTS, untreated) estimated using annual notification data (assumed to depend on smear status, but not HIV status)
4. Prevalence and mortality calculated using estimated durations and case fatality rates for each of the 12 groups of cases (these vary by country but not with time)
3a

All incidentcases
HIV+ve HIV-ve
smear-positive(35%)
smear-negative(65%)
smear-positive(45%)
smear-negative(55%)
DOTS
nonDOTS
untreated
DOTS
nonDOTS
untreated
DOTS
nonDOTS
untreated
DOTS
nonDOTS
untreated
IRR or direct data
notificatio
ns
(DO
TS
/ nonD
OT
S,
ss+
/oth
er)
3a
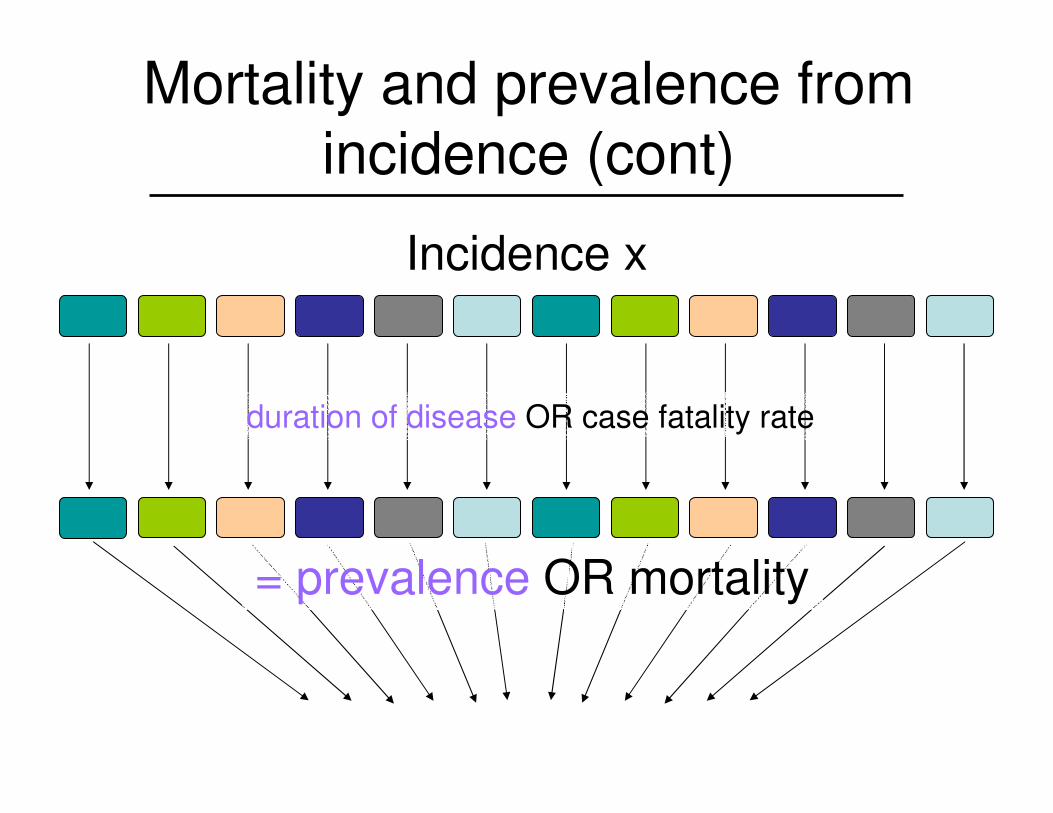
Mortality and prevalence from
incidence (cont)
Incidence x
duration of disease OR case fatality rate
= prevalence OR mortality
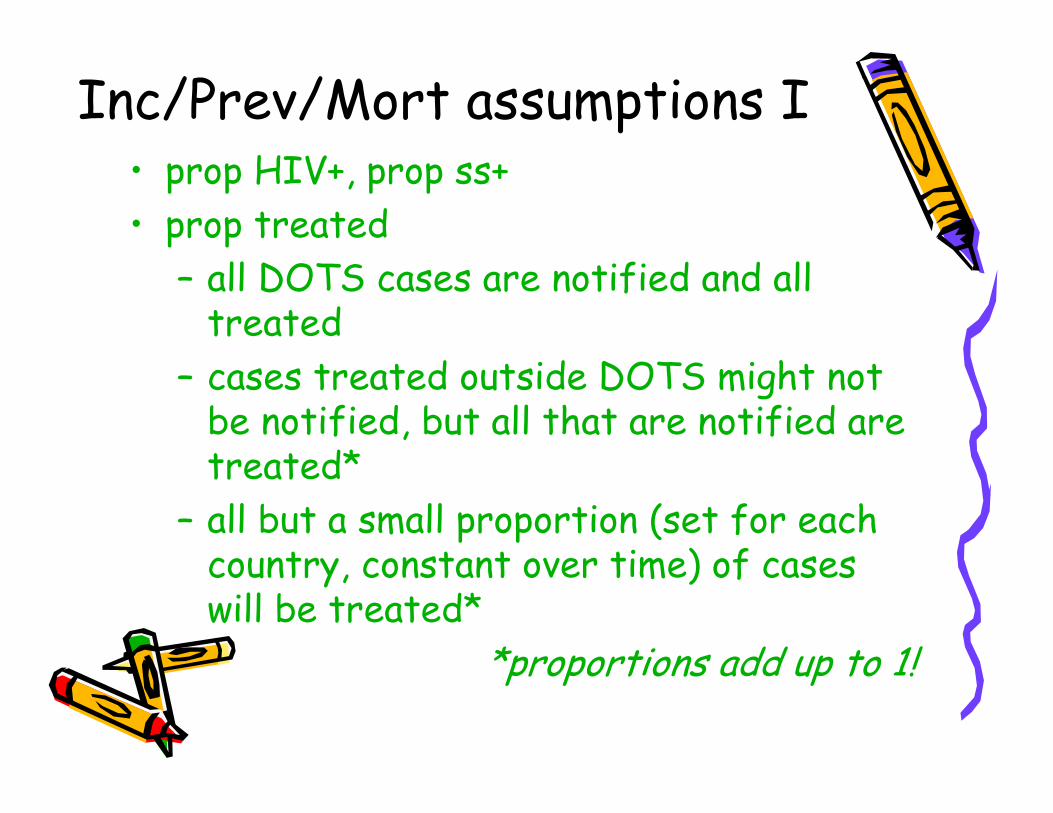
Inc/Prev/Mort assumptions I• prop HIV+, prop ss+
• prop treated
– all DOTS cases are notified and all treated
– cases treated outside DOTS might not be notified, but all that are notified are treated*
– all but a small proportion (set for each country, constant over time) of cases will be treated*
*proportions add up to 1!

Inc/Prev/Mort assumptions II• case fatality rates– HIV-ve: from follow-up studies of patients ("cohort" data include nonTB deaths, and don't include untreated cases)
– HIV+ve: assumptions made about proportion of deaths which are due to TB
– in high-income countries not distiction made between DOTS and nonDOTS
• durations– vary between countries but not over time– cases treated outside DOTS assumed to last longer
– in high-income countries not distiction made between DOTS and nonDOTS
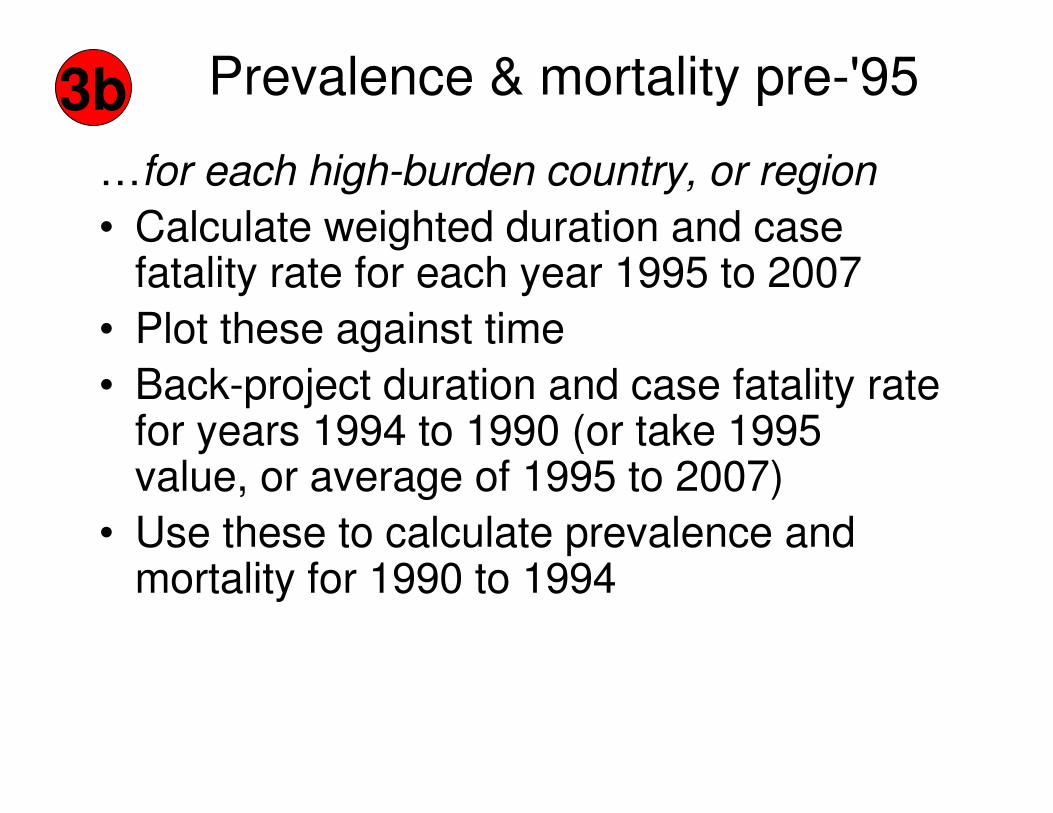
Prevalence & mortality pre-'95
…for each high-burden country, or region
• Calculate weighted duration and case fatality rate for each year 1995 to 2007
• Plot these against time
• Back-project duration and case fatality rate for years 1994 to 1990 (or take 1995 value, or average of 1995 to 2007)
• Use these to calculate prevalence and mortality for 1990 to 1994
3b

Pre-1995 assumptions• choice of years to use for back-projection depends on what is likely to have been happening pre-1995
• not currently done separately for non-high-burden countries
India
0.0
0.5
1.0
1.5
2.0
2.5
3.0
3.5
1994 1996 1998 2000 2002 2004 2006
du
rati
on
(years
)
0.0
0.5
1.0
1.5
2.0
2.5
3.0
3.5
4.0
1990 1992 1994 1996 1998 2000 2002 2004 2006
du
rati
on
(years
)
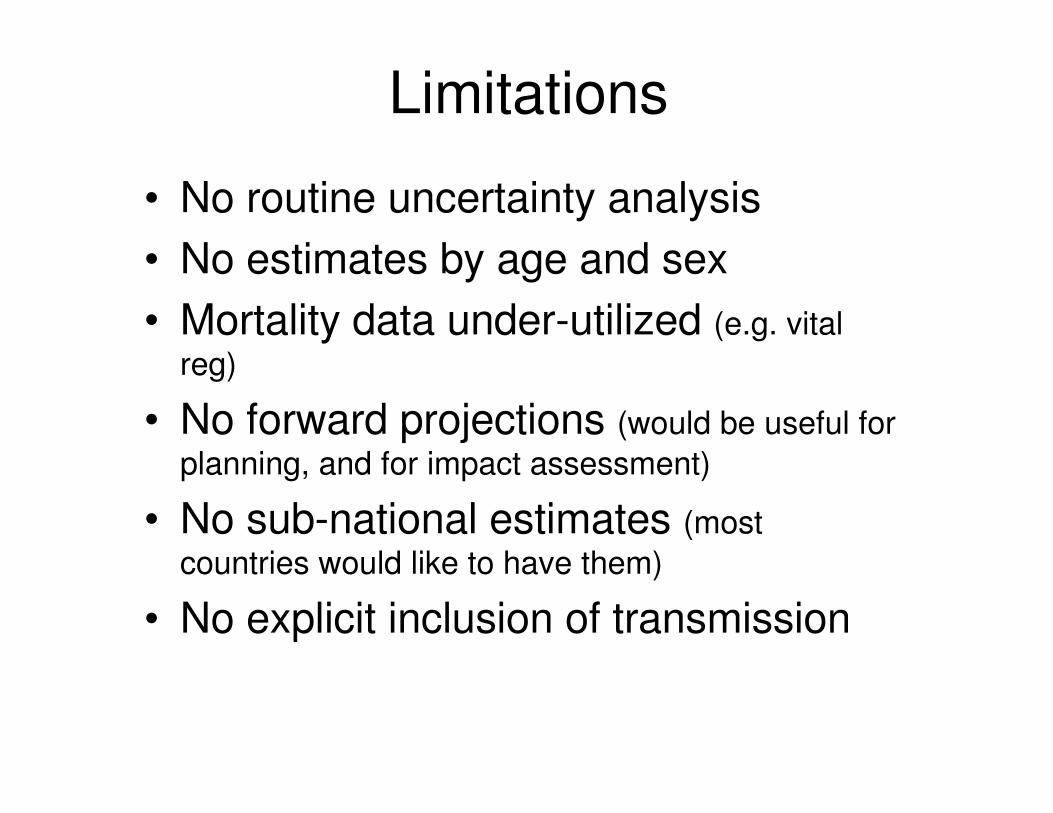
Limitations
• No routine uncertainty analysis
• No estimates by age and sex
• Mortality data under-utilized (e.g. vital
reg)
• No forward projections (would be useful for
planning, and for impact assessment)
• No sub-national estimates (most
countries would like to have them)
• No explicit inclusion of transmission
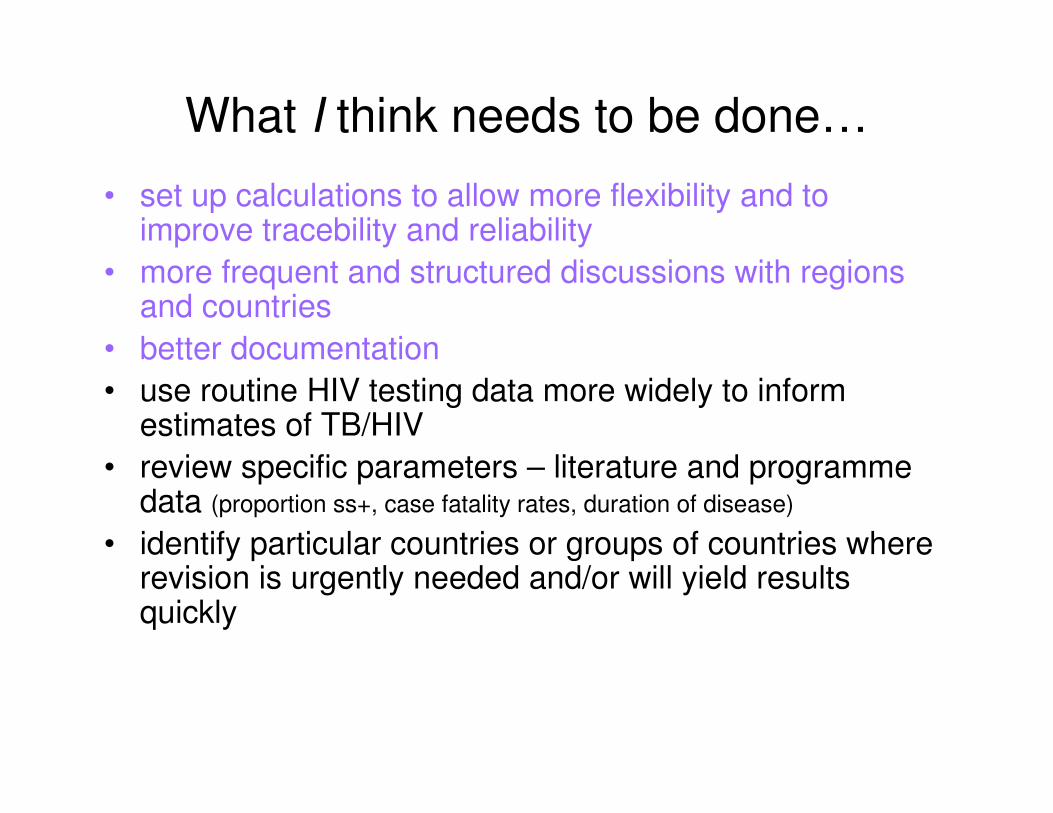
What I think needs to be done…
• set up calculations to allow more flexibility and to improve tracebility and reliability
• more frequent and structured discussions with regionsand countries
• better documentation
• use routine HIV testing data more widely to informestimates of TB/HIV
• review specific parameters – literature and programme data (proportion ss+, case fatality rates, duration of disease)
• identify particular countries or groups of countries whererevision is urgently needed and/or will yield resultsquickly
Related Documents