Presents: The Global Burden of Foodborne Disease- Results and perspectives of WHO’s Foodborne Disease Burden Epidemiology Reference Group (FERG)

Welcome message from author
This document is posted to help you gain knowledge. Please leave a comment to let me know what you think about it! Share it to your friends and learn new things together.
Transcript

Presents: The Global Burden of Foodborne Disease- Results and perspectives of WHO’s Foodborne Disease Burden Epidemiology Reference Group (FERG)

This webinar is sponsored by: Wageningen University, Marcel Zwietering, Leon Gorris, Arie Havelaar
and an anonymous MMRA PDG Member
Organized by: Microbial Modeling & Risk Analysis PDG
Supported By: Food Law, International Food Protection Issues, Viral & Parasitic
Foodborne Disease and the Water Safety & Quality PDG
All opinions and statements are those of the individual making the presentation
and not necessarily the opinion or view of IAFP

The Global Burden of Foodborne
Disease
Arie Havelaar on behalf of FERG
Overview
The Global Burden of Foodborne Disease 1
FERG: why, what, how?
Global overview of burden of foodborne disease
Regional differences
Policy implications
Further work
Conclusions
Why estimate the global burden of
foodborne disease?
The Global Burden of Foodborne Disease 2
Foodborne diseases (FBD) are highly visible: outbreaks,
contamination events but true burden invisible
FBD cause considerable morbidity and mortality
Full extent of FBD not documented
FBD not a risk factor in studies on global burden of
disease
FBD are complex: numerous hazards, numerous health
outcomes, effects on different time scales
Food is not the only transmission pathway of many food-
related hazards
Limited data availability

Objectives and structure
The Global Burden of Foodborne Disease 3
WHO Initiative to Estimate the Global Burden of Foodborne Diseases (2006) strengthen country capacity
to assess burden of FBD
increase number of countries that have studied burden of FBD
estimates of global burden of FBD, according to age, sex and region
increase awareness and commitment to implement food safety standards
encourage to use burden of FBD to set evidence-informed policies
Foodborne Disease Burden Epidemiology Reference Group (FERG) (2007) reviews of mortality,
morbidity and disability associated with FBD
model FBD burden where data are lacking
source attribution models to estimate proportion of disease that is foodborne
user-friendly tools for studies of burden of FBD at country level

FERG structure
The Global Burden of Foodborne Disease 4
Methodological choices
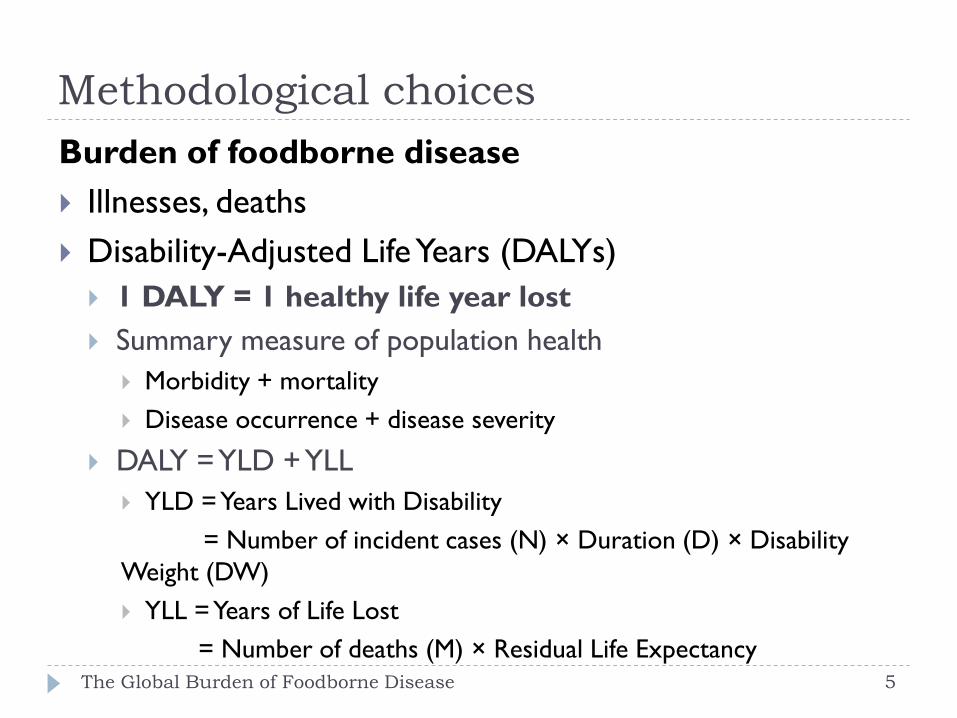
Burden of foodborne disease
Illnesses, deaths
Disability-Adjusted Life Years (DALYs)
1 DALY = 1 healthy life year lost
Summary measure of population health
Morbidity + mortality
Disease occurrence + disease severity
DALY = YLD + YLL
YLD = Years Lived with Disability
= Number of incident cases (N) × Duration (D) × Disability
Weight (DW)
YLL = Years of Life Lost
= Number of deaths (M) × Residual Life Expectancy The Global Burden of Foodborne Disease 5
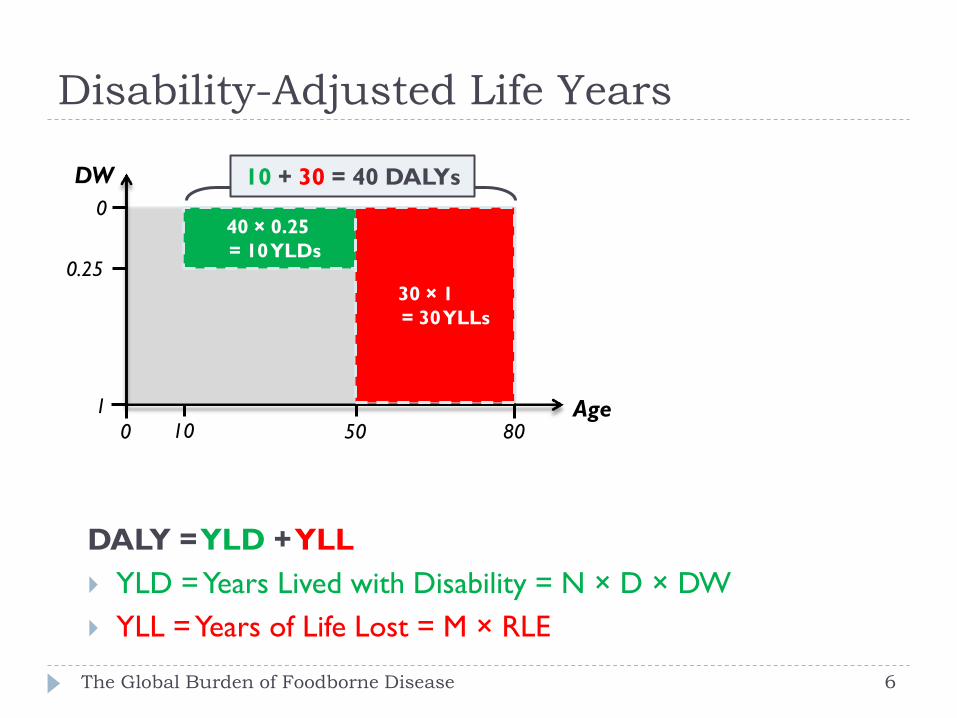
Disability-Adjusted Life Years
10 50 Age
DW
0
1
0
80
40 × 0.25
= 10 YLDs
30 × 1
= 30 YLLs
0.25
10 + 30 = 40 DALYs
DALY = YLD + YLL
YLD = Years Lived with Disability = N × D × DW
YLL = Years of Life Lost = M × RLE
The Global Burden of Foodborne Disease 6
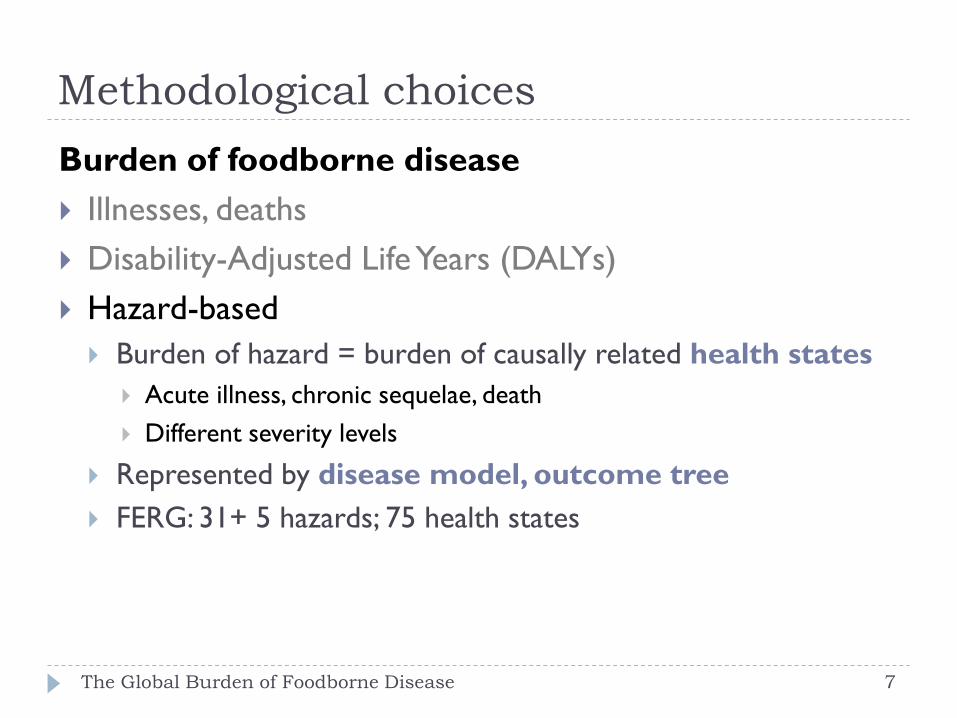
Methodological choices
Burden of foodborne disease
Illnesses, deaths
Disability-Adjusted Life Years (DALYs)
Hazard-based
Burden of hazard = burden of causally related health states
Acute illness, chronic sequelae, death
Different severity levels
Represented by disease model, outcome tree
FERG: 31+ 5 hazards; 75 health states
The Global Burden of Foodborne Disease 7
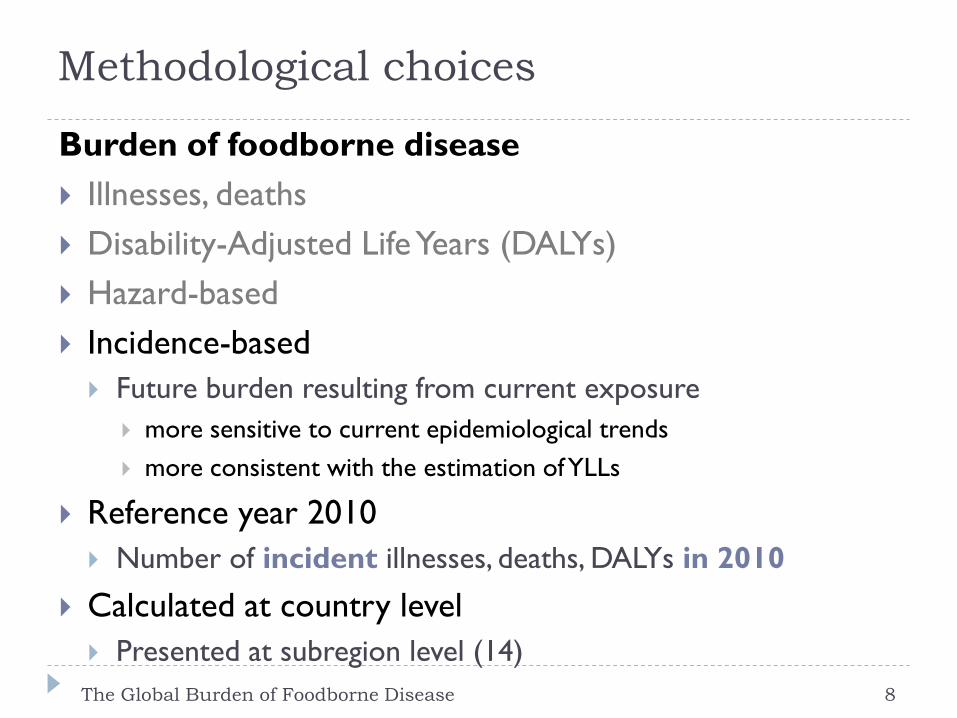
Methodological choices
Burden of foodborne disease
Illnesses, deaths
Disability-Adjusted Life Years (DALYs)
Hazard-based
Incidence-based
Future burden resulting from current exposure
more sensitive to current epidemiological trends
more consistent with the estimation of YLLs
Reference year 2010
Number of incident illnesses, deaths, DALYs in 2010
Calculated at country level
Presented at subregion level (14)
The Global Burden of Foodborne Disease 8

The Global Burden of Foodborne Disease
14 subregions
AMR A
AMR D AMR B
AFR E
AFR D EMR D
EMR B
EUR C
EUR B
EUR A
SEAR D
SEAR B
WPR B
WPR A
The sub regions are defined on the on the basis of child and adult mortality. Stratum A: very low child and adult mortality, Stratum
B: low child mortality and very low adult mortality, Stratum C: low child mortality and high adult mortality, Stratum D: high child
and adult mortality, and Stratum E: high child mortality and very high adult mortality (Ezzati et al., 2002). 9
FERG: methods
The Global Burden of Foodborne Disease 10
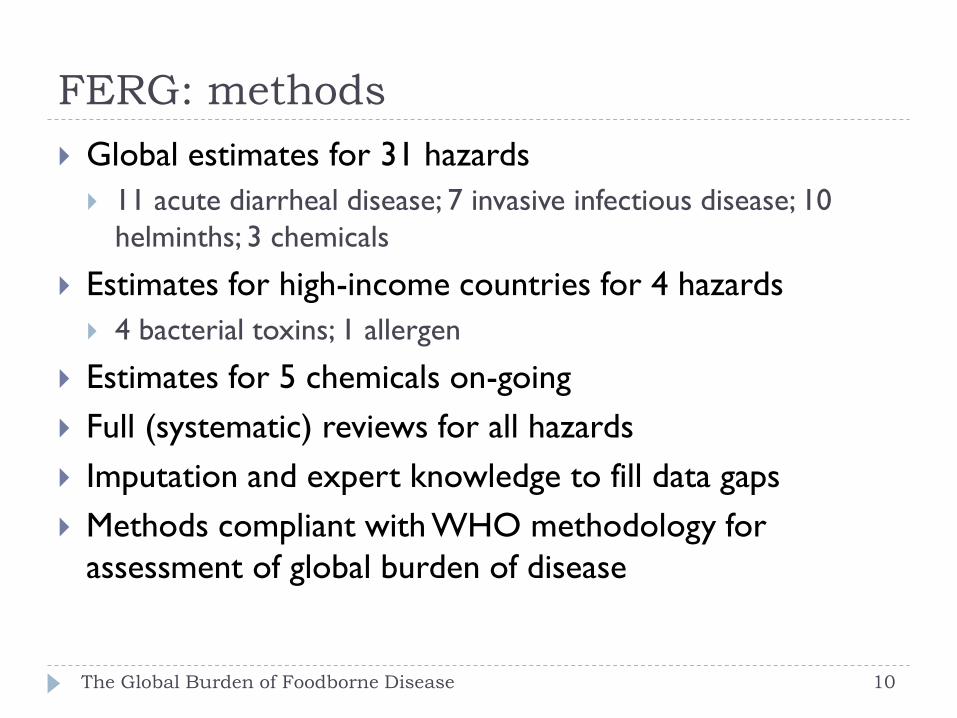
Global estimates for 31 hazards
11 acute diarrheal disease; 7 invasive infectious disease; 10
helminths; 3 chemicals
Estimates for high-income countries for 4 hazards
4 bacterial toxins; 1 allergen
Estimates for 5 chemicals on-going
Full (systematic) reviews for all hazards
Imputation and expert knowledge to fill data gaps
Methods compliant with WHO methodology for
assessment of global burden of disease
Methodological choices
The Global Burden of Foodborne Disease 11
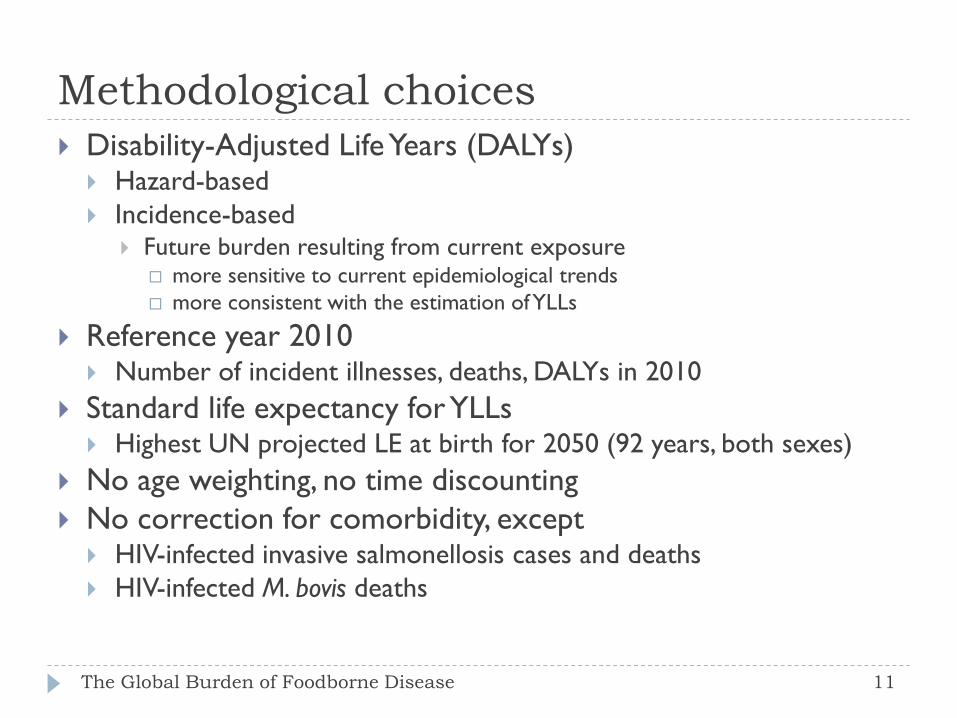
Disability-Adjusted Life Years (DALYs) Hazard-based
Incidence-based Future burden resulting from current exposure
more sensitive to current epidemiological trends
more consistent with the estimation of YLLs
Reference year 2010 Number of incident illnesses, deaths, DALYs in 2010
Standard life expectancy for YLLs Highest UN projected LE at birth for 2050 (92 years, both sexes)
No age weighting, no time discounting
No correction for comorbidity, except HIV-infected invasive salmonellosis cases and deaths
HIV-infected M. bovis deaths
Quantifying attributable disease burden
The Global Burden of Foodborne Disease 12
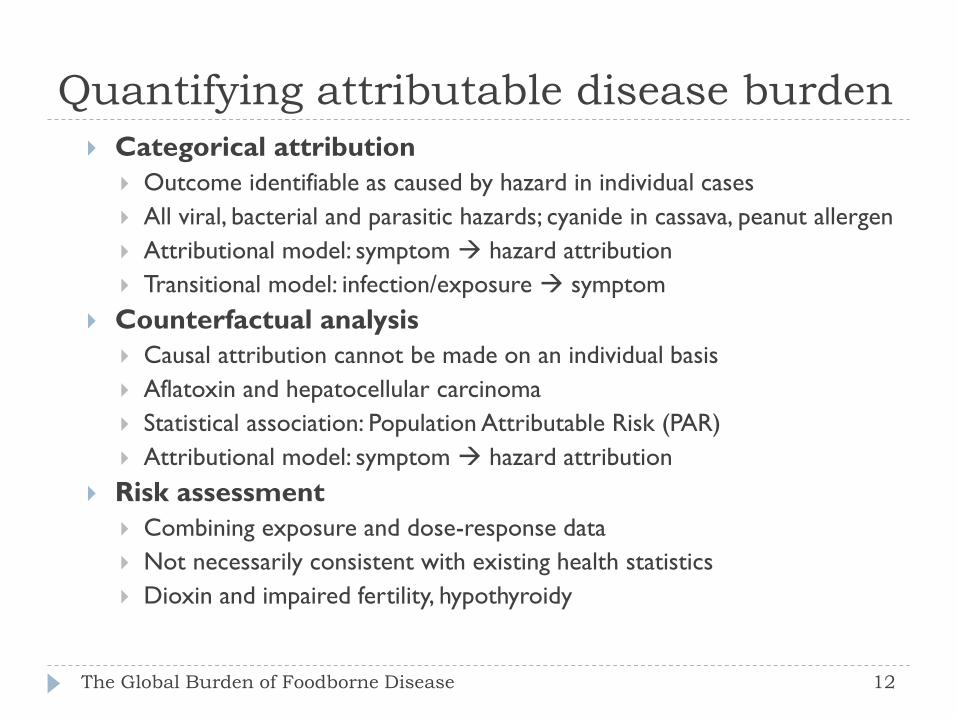
Categorical attribution
Outcome identifiable as caused by hazard in individual cases
All viral, bacterial and parasitic hazards; cyanide in cassava, peanut allergen
Attributional model: symptom hazard attribution
Transitional model: infection/exposure symptom
Counterfactual analysis
Causal attribution cannot be made on an individual basis
Aflatoxin and hepatocellular carcinoma
Statistical association: Population Attributable Risk (PAR)
Attributional model: symptom hazard attribution
Risk assessment
Combining exposure and dose-response data
Not necessarily consistent with existing health statistics
Dioxin and impaired fertility, hypothyroidy

Probabilistic burden assessment
The Global Burden of Foodborne Disease 13
Parameter + imputation + attribution uncertainty
10,000 Monte Carlo simulations
Uncertainty distribution instead of point estimate
Median, 95% uncertainty interval
Calculated at country level
Per hazard, outcome, age group (< or ≥ 5 years), sex
Presented at subregional level (14)
Diarrheal Diseases – CHERG Approach
The Global Burden of Foodborne Disease 14
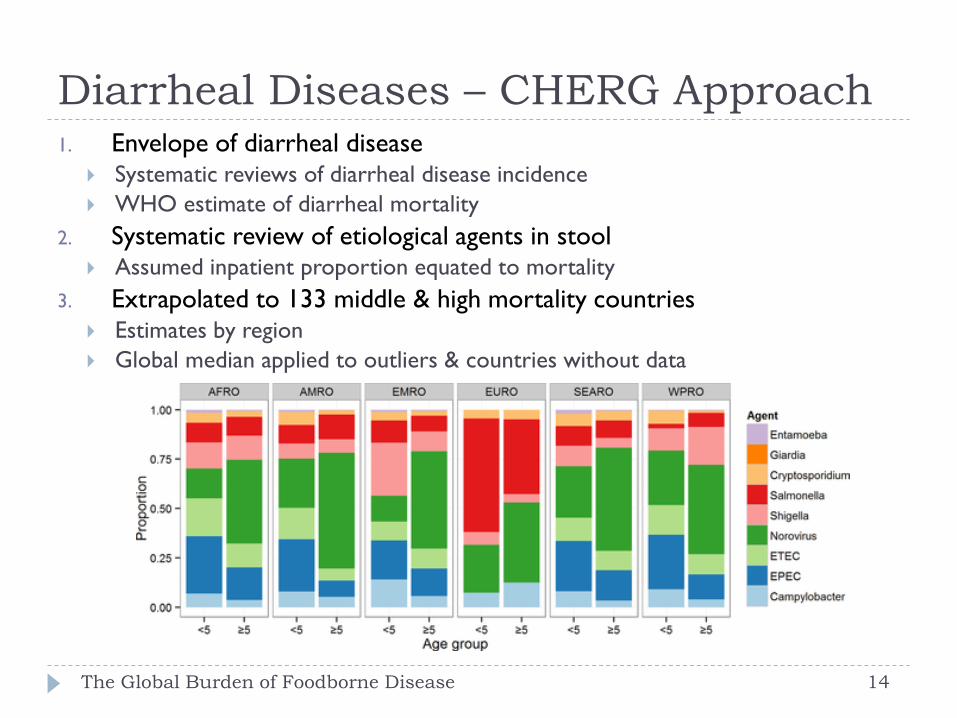
1. Envelope of diarrheal disease Systematic reviews of diarrheal disease incidence
WHO estimate of diarrheal mortality
2. Systematic review of etiological agents in stool Assumed inpatient proportion equated to mortality
3. Extrapolated to 133 middle & high mortality countries Estimates by region
Global median applied to outliers & countries without data

Diarrheal Diseases – National Approach
National etiology-specific estimates of foodborne incidence & mortality
Australia
Canada
France
New Zealand
The Netherlands
United Kingdom
United States of America
Median & UI from national studies applied to 61 low mortality countries
EUR A, B, C, AMR A, WPR A
The Global Burden of Foodborne Disease 15
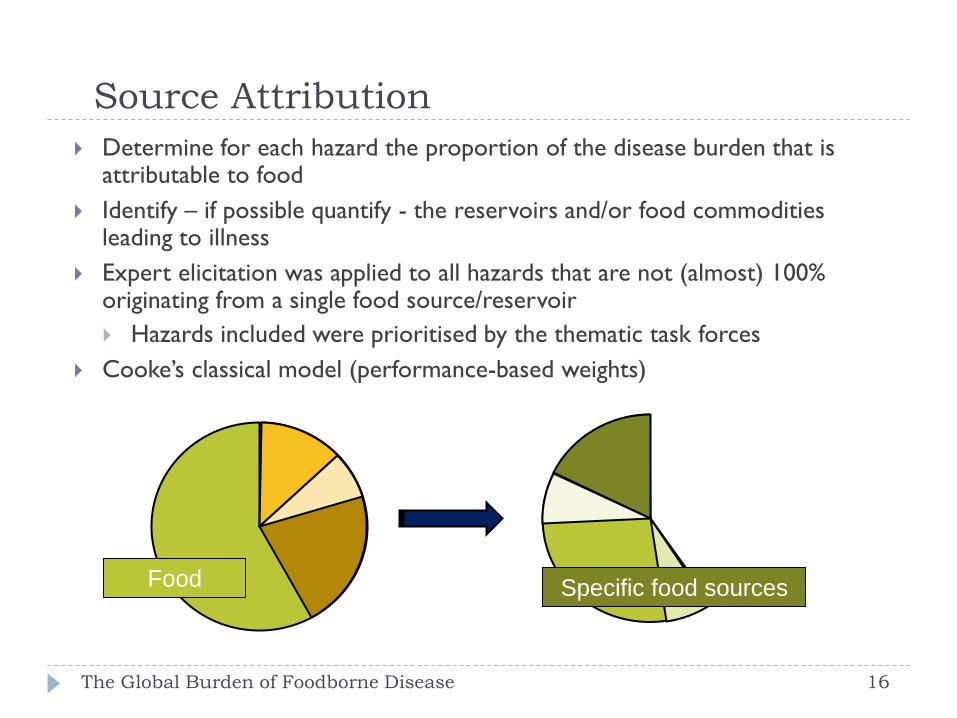
Source Attribution
Determine for each hazard the proportion of the disease burden that is attributable to food
Identify – if possible quantify - the reservoirs and/or food commodities leading to illness
Expert elicitation was applied to all hazards that are not (almost) 100% originating from a single food source/reservoir
Hazards included were prioritised by the thematic task forces
Cooke’s classical model (performance-based weights)
Food Specific food sources
The Global Burden of Foodborne Disease 16

Distribution of experts according to working
experience (>3 years) per subregion
The sub regions are defined on the on the basis of child and adult mortality. Stratum A: very low child and adult mortality, Stratum
B: low child mortality and very low adult mortality, Stratum C: low child mortality and high adult mortality, Stratum D: high child
and adult mortality, and Stratum E: high child mortality and very high adult mortality (Ezzati et al., 2002). 17

Disability weights
The Global Burden of Foodborne Disease 19
Severity of health states, relative reduction in health
0 = perfect health
1 = death
Adopted from WHO Global Health Estimates
Based on Global Burden of Disease (GBD) 2010, except:
Primary infertility: alternative value
Hypothyroidy: GBD 2013
Direct mapping or proxy health state(s)
Severity levels (mild, moderate, severe)
Included in disease model as distinct health states
Weighted average, based on epidemiological data

Global burden of foodborne disease, 2010
The Global Burden of Foodborne Disease 20
Hazard
group
Foodborne
illnesses
(millions)
Foodborne
deaths
(thousands)
Foodborne
DALYs
(millions)
All 600 420 33
Diarrheal 549 230 18
Invasive 36 117 8
Helminths 13 45 6
Chemicals 0.2 19 0.9
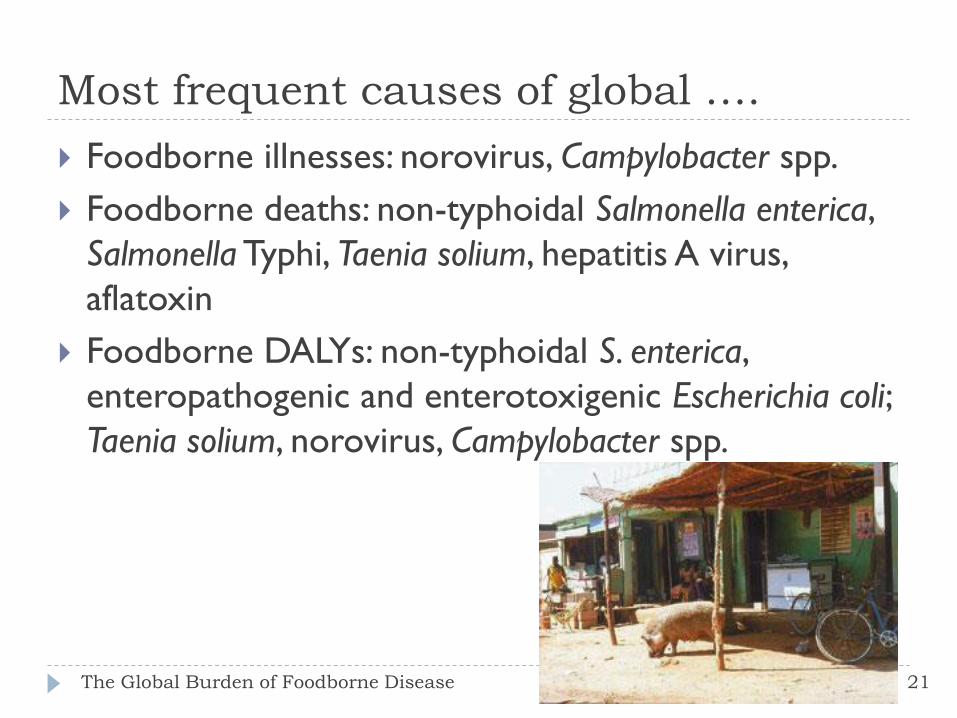
Most frequent causes of global ….
The Global Burden of Foodborne Disease 21 21
Foodborne illnesses: norovirus, Campylobacter spp.
Foodborne deaths: non-typhoidal Salmonella enterica,
Salmonella Typhi, Taenia solium, hepatitis A virus,
aflatoxin
Foodborne DALYs: non-typhoidal S. enterica,
enteropathogenic and enterotoxigenic Escherichia coli;
Taenia solium, norovirus, Campylobacter spp.
Global findings
The Global Burden of Foodborne Disease 22
Annually, 1 out of 10 people in the world suffer from
foodborne disease
Diarrheal diseases are the most common causes of illness
(550 million cases) and death (230,000 deaths)
Of these, non-typhoidal Salmonella enterica causes 60,000
deaths; this includes 22,000 deaths from invasive
salmonellosis in non-HIV patients
Diarrheal diseases cause more than half of global
foodborne DALYs

Ranking of foodborne hazards-global DALYs
The Global Burden of Foodborne Disease 23

Global burden at population and individual
level
The Global Burden of Foodborne Disease 24
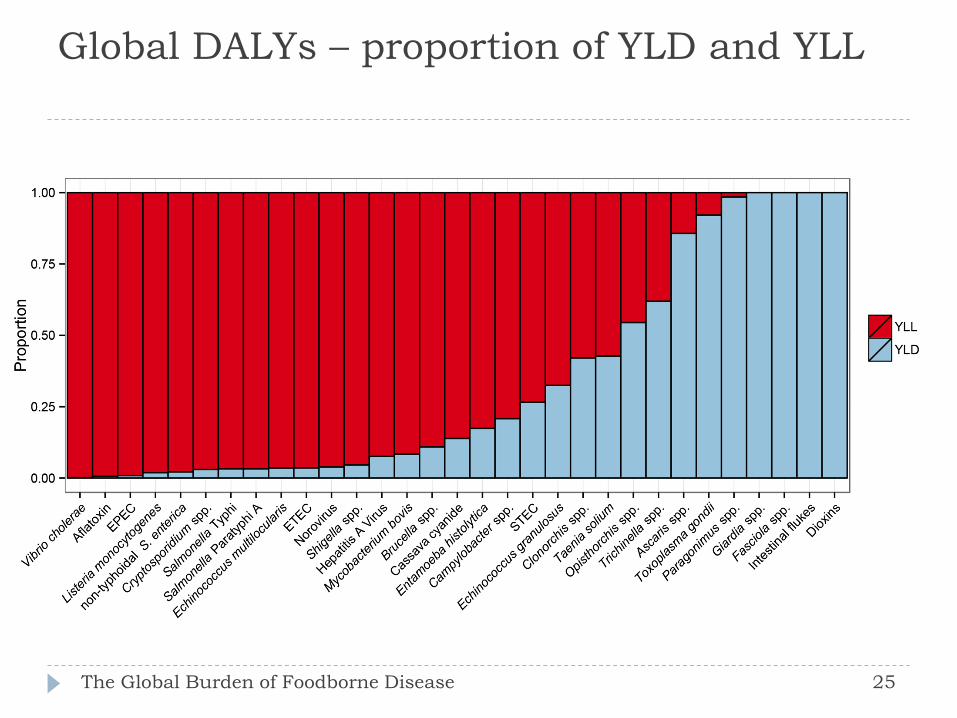
Global DALYs – proportion of YLD and YLL
The Global Burden of Foodborne Disease 25
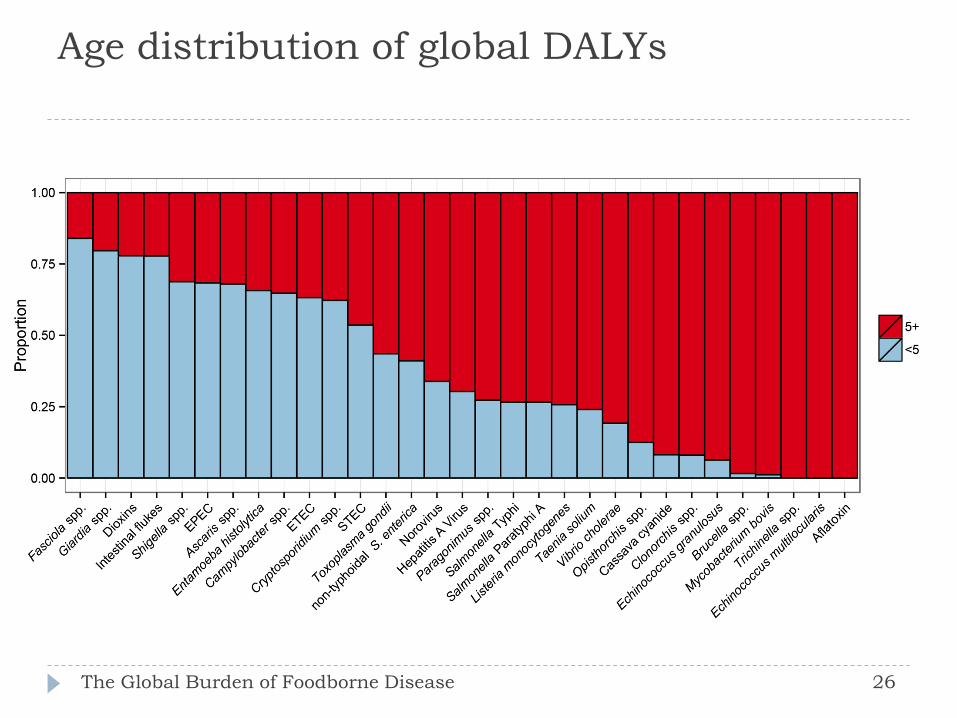
Age distribution of global DALYs
The Global Burden of Foodborne Disease 26
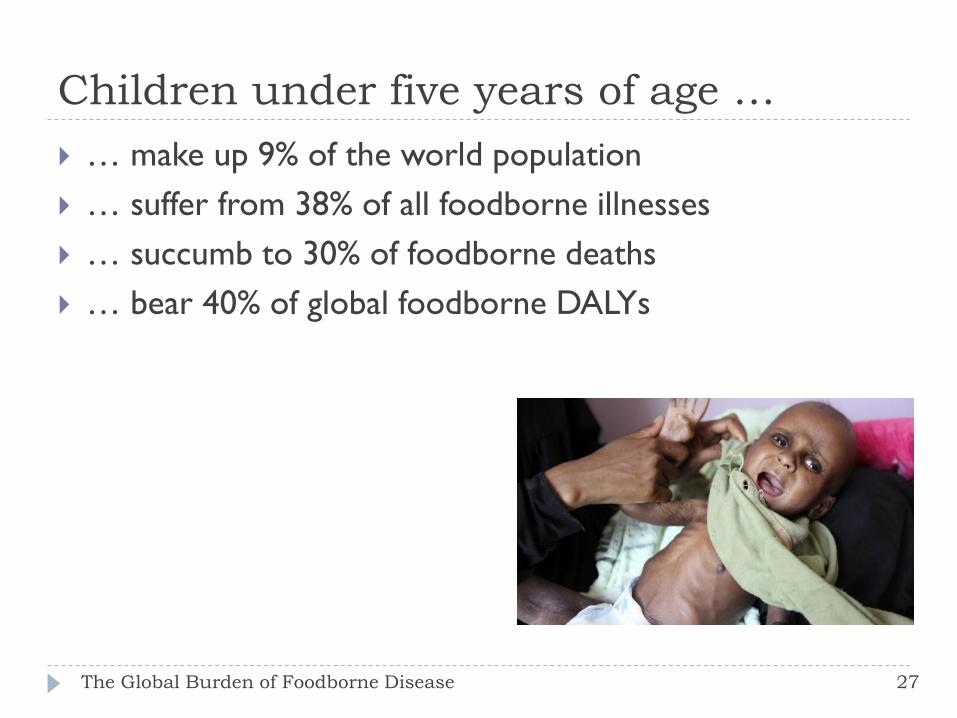
Children under five years of age …
The Global Burden of Foodborne Disease 27
… make up 9% of the world population
… suffer from 38% of all foodborne illnesses
… succumb to 30% of foodborne deaths
… bear 40% of global foodborne DALYs
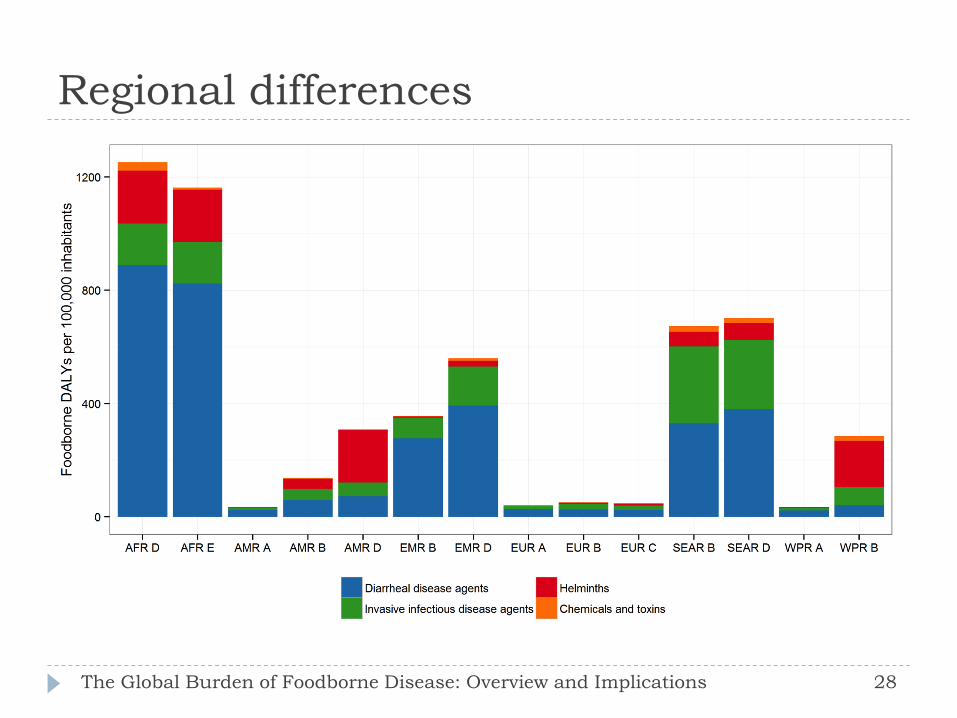
Regional differences
The Global Burden of Foodborne Disease: Overview and Implications 28

Regional differences
The Global Burden of Foodborne Disease 29
Africa and South-East Asia have the highest incidence of foodborne diseases and the highest death rates among all ages, including children under five
Lowest burden in North America, Europe and Australia, New Zealand and Japan
Marked differences in the contribution of different agents
Typhoid fever, foodborne cholera and diarrhea caused by pathogenic E. coli are much more common to low income countries
Fish-borne parasites are of concern in Southeast Asia
Diseases caused by non-typhoidal S. enterica, Campylobacter spp. and Toxoplasma gondii are a public health concern across the world
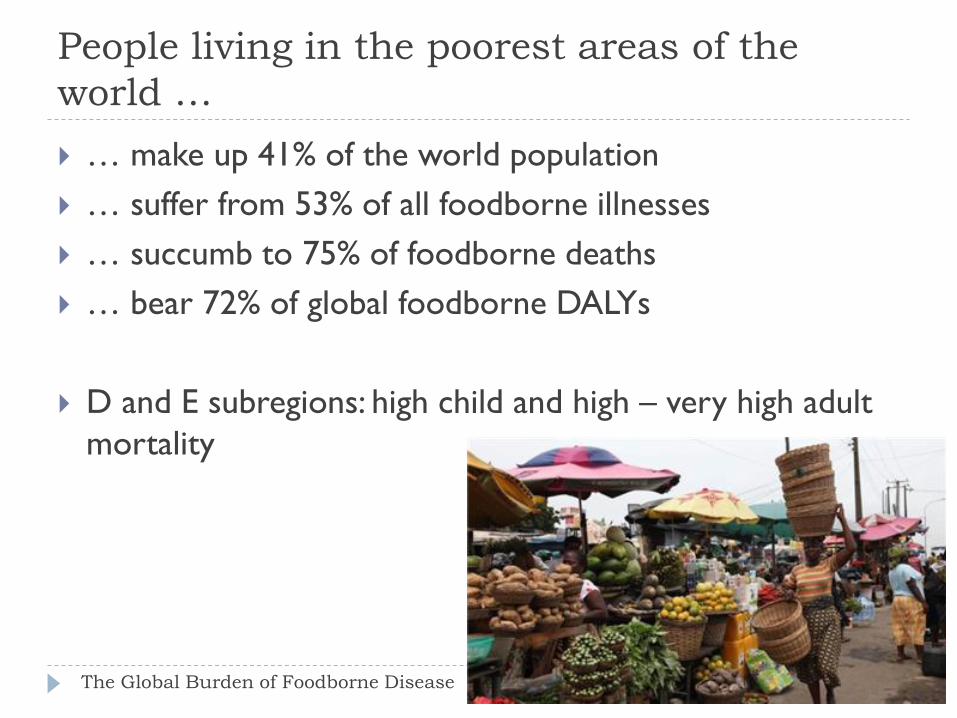
People living in the poorest areas of the
world …
The Global Burden of Foodborne Disease
… make up 41% of the world population
… suffer from 53% of all foodborne illnesses
… succumb to 75% of foodborne deaths
… bear 72% of global foodborne DALYs
D and E subregions: high child and high – very high adult
mortality

Interactive tool
The Global Burden of Foodborne Disease 31

Comparison with other estimates
The Global Burden of Foodborne Disease 32
FERG Foodborne diseases: 33 million DALYs
IHME Global Burden of Disease 2010 Dietary risk factors: 254 million DALYs
Unimproved water and sanitation: 211 million DALYs
HIV/AIDS: 82 million DALYs
Malaria: 82 million DALYs
Air pollution: 76 million DALYs
Tuberculosis 49 million DALYs
WHO Global Health Observatory 2012 HIV/AIDS 92 million DALYs
Malaria: 55 million DALYs
Tuberculosis: 44 million DALYs
Methodological differences!!
Limitations
The Global Burden of Foodborne Disease 33
Data availability and quality Particularly in low-income countries where burden is highest
Imputation and expert judgment
Presentation at regional level rather than country level
Large uncertainty intervals
Underestimation Limited number of hazards
Not all endpoints considered, e.g. malnutrition and stunting; irritable bowel syndrome; chronic (psychiatric) consequences of toxoplasmosis
Burden in HIV-positives preventable by food safety interventions
Model uncertainty, e.g. multiplicative or additive models for chemicals
Public health metrics do not quantify the full societal impact of foodborne diseases; economic burden
Indirect transmission of disease agents from food production systems – One Health
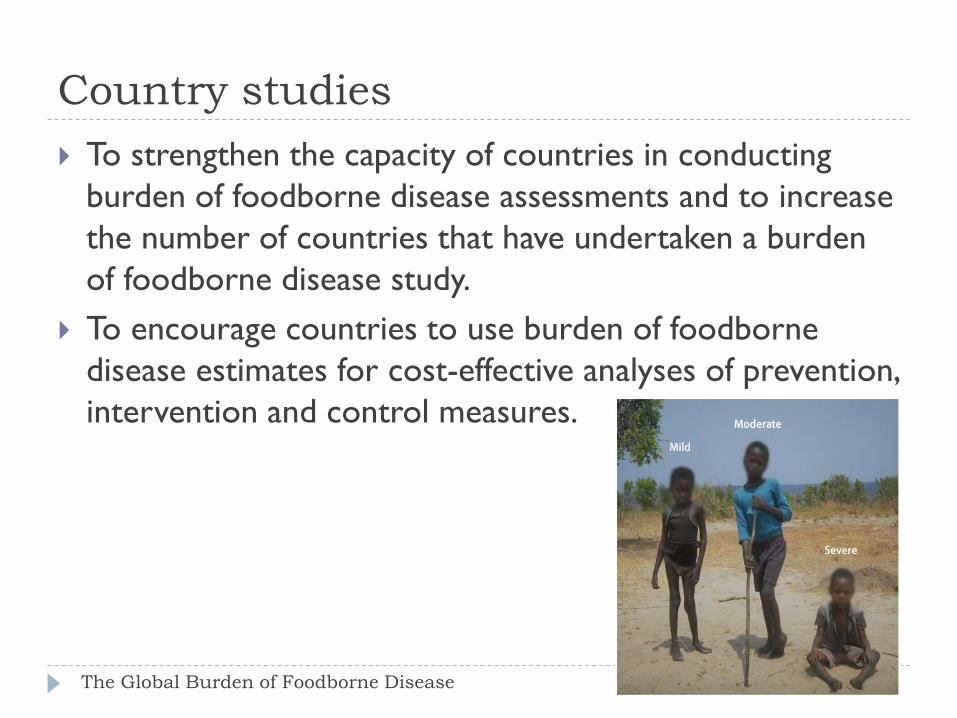
Country studies
To strengthen the capacity of countries in conducting
burden of foodborne disease assessments and to increase
the number of countries that have undertaken a burden
of foodborne disease study.
To encourage countries to use burden of foodborne
disease estimates for cost-effective analyses of prevention,
intervention and control measures.
The Global Burden of Foodborne Disease

Country Studies Tools and Resources
Reviews of existing burden of disease studies and
protocols
Manual on national burden of foodborne disease studies
Pilot studies in four countries (Albania, Japan, Thailand,
Uganda)
Hazard selection tool, including
Guidance on data collection
FERG Situation Analysis/Knowledge Translation/Risk
Communication Manual (SA/KT/RC Manual)
The Global Burden of Foodborne Disease 35
Implications for food safety policy
The Global Burden of Foodborne Disease 36
Difference in burden between regions suggests that FBD
are largely preventable by currently available methods
Linked to economic development and effective food
safety systems
From reactive, repressive systems to preventive, risk-
based and enabling systems
Effective surveillance networks at country, regional and
global levels
Pathogens that also cause problems in the developed
world will need novel control methods

Next steps: science
The Global Burden of Foodborne Disease 37
Country studies assessing burden of foodborne disease
Improved surveillance
Sentinel studies
Further investigation of the burden of chemicals in food
Additional outcomes (malnutrition, stunting, immune
suppression, functional bowel disorders, psychiatric outcomes)
Burden estimates for specific food commodities (e.g. meats,
produce)
Integration of FBD as risk factor in global burden of disease
studies (IHME, WHO)
Economic analysis (cost-of-illness, market impacts, cost-benefit
analyses)
Next steps: policy and implementation
The Global Burden of Foodborne Disease 38
Communication of results to all stakeholders
High-level expert + policy maker meeting to outline next steps (regional and national) needs
Food safety management in low- and middle-income countries: adoption of risk- and evidence based approaches
Intervention studies examining the benefits of safe food to prevent diarrheal disease in infants in low-income countries
Integrate food safety in One Health framework
Integrate promotion of food security, nutrition and food safety
Conclusions
The Global Burden of Foodborne Disease 39
WHO has launched the most comprehensive estimates of the
global burden of foodborne diseases to date
These address the lack of data to support food safety policy
making
Despite data gaps and other limitations, the results
demonstrate a considerable burden
A large share of the burden is borne by children under five
years of age and those living in low-income countries
Priority hazards differ between regions
Control methods do exist for many hazards, and are linked to
economic development and effective food safety systems
Hazards of global significance need novel control methods
More information
The Global Burden of Foodborne Disease
• WHO website http://www.who.int/foodsafety/areas_work/foodborne-diseases/ferg/en/
• PLOS collection http://collections.plos.org/ferg2015
• Interactive tool https://extranet.who.int/sree/Reports?op=vs&path=/WHO_HQ_Reports/G36/PROD/EXT/FoodborneDiseaseBurden
https://extranet.who.int/sree/Reports?op=vs&path=/WHO_HQ_Reports/G36/PROD/EXT/FoodborneDiseaseBurden
Acknowledgements
The Global Burden of Foodborne Disease
FERG Core Group
FERG members
Resource advisers
Attribution experts
WHO secretariat
IHME, Seattle, WA
ECDC, Solna, Sweden
Stakeholders
Funding: Netherlands, Japan, CDC, FDA, FSIS, individual
scientists, WHO member states supporting FERG experts

Questions?
45
The Global Burden of Foodborne Disease: Overview and Implications

Contact Information for Presenters
Arie H. Havelaar University of Florida Emerging Pathogens Institute [email protected]
Marcel H. Zwietering Wageningen University Laboratory of Food Microbiology [email protected]
Related Documents