Estimating Prevalence of Autism Spectrum Disorders (ASD) in the Irish Population: A r eview of d ata s ources and e pidemiological s tudies November 2018

Welcome message from author
This document is posted to help you gain knowledge. Please leave a comment to let me know what you think about it! Share it to your friends and learn new things together.
Transcript
Estimating Prevalence of Autism
Spectrum Disorders (ASD) in the Irish
Population: A r eview of d ata s ources
and e pidemiological s tudies
November 2018

Estimating Prevalence of Autism Spectrum Disorders (ASD) in the Irish Population
—— 2
This paper was compiled collaboratively by the R&D and Health Analytics Division and the
Chief Medical Officer’s Division of the Department of Health.
Estimating Prevalence of Autism Spectrum Disorders (ASD) in the Irish Population
—— 3
Contents
Executive Summary 4
1.0 Introduction 7
1.1 International classification of diseases 7
1.2 History of classification of ASD 8
1.3 Change in classification 9
1.4 Screening and diagnosis 11
1.5 Legislation 13
2.0 Review of data sources to estimate prevalence in Ireland 14
2.1 Irish data sources 14
2.2 Children in receipt of services 16
3.0 Epidemiological studies from Ireland 20
3.1 Prevalence of ASD in Ireland 20
3.2 Prevalence of autism in Northern Ireland 23
4.0 International databases 25
5.0 International studies of the prevalence of autism 30
6.0 Discussion 40
6.1 Possible reasons for a reported increase in prevalence of autism 40
6.2 Reported increase in prevalence rates in Ireland 40
6.3 Policy implications 41
Estimating Prevalence of Autism Spectrum Disorders (ASD) in the Irish Population
—— 4
Executive Summary Autism spectrum disorders (ASDs) are a group of life-long
neurodevelopmental conditions characterised by impairments in social
interaction and communication, as well as restricted, repetitive and
stereotyped patterns of behaviour. Although there have been many studies
on the epidemiology of ASDs internationally, uncertainty remains about the
true prevalence of ASD globally. This is largely attributed to differences in
measurement techniques which makes direct comparisons difficult.
In the last twenty years, the reported prevalence of ASDs has increased. The
most recent publication of the Centre for Disease Control (CDC) (April 2018)
reported the prevalence of ASDs in the US as 1.68% in the surveillance year
2014 but ASDs have been reported to be as high as 2.6% in South Korea and
as low as 0.39% in China.
Variations and changes in ASD prevalence rates reported may have several
explanations: changes or broadening of the diagnostic criteria, differences in
the methods used to study prevalence (sampling procedures, application of
statistical methods), as well as an increased awareness among parents,
professionals and the general public.
This paper examines available data and evidence relating to prevalence of
ASDs in children and adults in Ireland for burden of diseases analysis and
policy-making decisions.
Estimating Prevalence of Autism Spectrum Disorders (ASD) in the Irish Population
—— 5
Methods
As there is no specific autism register in Ireland, a number of administrative databases were
explored to determine if there was any useful data to inform incidence/ prevalence rates. In
addition, a literature search was conducted to identify any research or epidemiological
studies relating to autism prevalence that have been undertaken over the past 20 years in
Ireland. Prevalence rates of autism in other countries were sourced and analysed for
comparison purposes. These included analyses of data from registries and epidemiological
studies.
Key findings
• In autism epidemiology, point or period prevalence is more useful than incidence, as the
disorder starts long before it is diagnosed, and the gap between initiation and diagnosis
is influenced by many factors unrelated to risk. Therefore, this paper concentrates on
the prevalence literature.
• Given the complexity of the classification of autism and the subsequent changes made
to the DSM and ICD diagnostic categories over the last number of decades, estimating
prevalence of the condition is fraught with methodological difficulties.
• While significant progress has been made over the past two decades in the
development of screening and diagnostic instruments for autism spectrum disorders,
accurate tools for screening and diagnosis of ASD are limited by the lack of a true test
for ASD, which remains a behaviourally-defined disorder.
• The most reliable source of information would be a disease register where all
individuals diagnosed with the disorder (using standardised definition and diagnostic
instruments) would be recorded. While this does not exist in Ireland, this paper
highlights other data sources which can help with estimating a prevalence rate.
• The National Council for Special Education (NCSE) collects data on students with ASD
with resource teaching support or in special classes and special schools. Their analysis
indicates a prevalence rate of 1.55 per cent and this figure is currently used for planning
purposes. The Department of Education have recently changed their model whereby
professional and other medical assessment or diagnosis of ASD will no longer be
necessary for pupils to access educational teaching resources in schools. This is in line
with an international shift away from diagnosis-driven access to services.
• Within the health sector, it is important to note that plans are advanced to merge and
refine the existing disability information systems managed by the HRB into the NASS
(National Ability Supports System). This will capture diagnosis, including ASD, and will
be capable of recording more than one diagnosis to allow for co-morbidity. However,
the NASS is still voluntary (not epidemiological in its collection), so will only record
Estimating Prevalence of Autism Spectrum Disorders (ASD) in the Irish Population
—— 6
those who have or need the services referred to above, and thus cannot be used for
estimating prevalence rates.
• This paper highlights a number of national and epidemiological studies which sought to
measure the prevalence of ASD. These studies employ different methodologies,
diagnostic tools and age groups and as such are not directly comparable. The most
recent data on the prevalence of ASD in Ireland is reported in a study carried out by
Boilson and colleagues in Dublin City University (2016). This work is now part of an EU
wide study, Autism Spectrum Disorders in the EU (ASDEU), which is designed to
facilitate a common format for screening and diagnosing children with ASD across the
EU with the aim of developing a standardised strategy for future surveillance. Their
analysis reported a prevalence rate of 1% and when further analysis was conducted (to
weight for a low response rate) a figure of 1.5% resulted. This is in line with prevalence
estimates in other countries such as the UK, Finland, Norway, Denmark, Italy, Australia,
Canada and USA. It is also similar to the Department of Education figure of 1.5% which
is based on the numbers of children with a diagnosis of ASD who are availing of
additional teaching supports in schools.
• Virtually all studies demonstrate a significant difference in the estimated prevalence
rates of autism between the genders, with males four times more likely to be identified
with autism than females. There is also evidence to suggest that ASD prevalence rates,
and needs for services, are higher in disadvantaged areas.
• This review highlighted that there is no data available on prevalence of ASD in adults in
Ireland. Indeed, there is only one study conducted internationally in the adult
population. This community-based study carried out in 2011 in the UK found that ASD
affects approximately 1% of the adult English household population. There was no
evidence of a statistically significant reduction in prevalence of ASDs as a function of
age.
• Based on all the above, and notwithstanding the absence of a single source of data to
estimate ASD prevalence in Ireland, data compiled using a combination of methods
suggests that there is a robust case for adopting an estimated prevalence rate of 1-
1.5% for the purpose of planning policy and services.
• Repeating a prior study (such as the EU study led by DCU) using the same
methodology and conducted in the same geographical area at different points in time,
has potential to yield useful information on time trends provided that methods are kept
relatively constant.
Estimating Prevalence of Autism Spectrum Disorders (ASD) in the Irish Population
—— 7
1.0 Introduction Autism spectrum disorder (ASD) is a life-long developmental disability characterised by
social and communication impairments and by restricted interests and repetitive behaviours.1
An extremely wide range of individual differences is represented within this grouping, from
individuals who also have a severe learning disability to those with average and above
average intelligence. The Autism and Developmental Disabilities Monitoring (ADDM)
Network shows that among children identified with ASD who had IQ scores available, about
one third also have an intellectual disability.2 In Ireland it is estimated that this figure is about
50%.3
All share the triad of difficulties in reciprocal social interaction, communication, and a lack of
flexible thinking. ASDs impact on all areas of functioning and have significant implications
throughout the lives of those affected across the entire ability range. Children displaying
symptoms within all three areas of core autism symptomatology before 3 years of age are
usually diagnosed with childhood autism, and it is estimated that about 30% of all ASD
diagnoses relate to a diagnosis of childhood autism. The literature indicates a pattern of
lifelong disorder, whereby individuals with an autistic spectrum disorder continue to be
‘autistic’ throughout their lives.
1.1 International classification of diseases
Mental and behavioural disorders are classified by two major nosological systems, the
International Classification of Diseases - ICD (initiated in Paris in 1990),4 and the Diagnostic
and Statistical Manual of Mental Disorders - DSM (DSM-I was published in the USA in
1952).5 The ICD has since gone through ten revisions, with ICD-10 the latest to be published
(World Health Organization 1992). DSM has been revised more frequently, with successive
revisions in 1987, 1994, 2000, and more recently in May 2013 (American Psychiatric
Association 1987, 1994, 2000, 2013).
1 American Psychiatric Association. Diagnostic and statistical manual of mental disorders. 4th ed. Text revision. Washington, DC:
American Psychiatric Association; 2000. 2 Centers for Disease Control and Prevention (CDC). Prevalence of Autism Spectrum Disorders–Autism and
Developmental Disabilities Monitoring Network, United States, 2008. Morbidity and Mortal Weekly Report (MMWR) 2012; Vol. 61(3). 3 Personal communication with Prof. Louise Gallagher, Department of Psychiatry, Trinity College Dublin. 4 World Health Organization (1992) ICD-10: Classification of Mental and Behavioural Disorders. WHO. 5 American Psychiatric Association (1980) Diagnostic and Statistical Manual of Mental Disorders (3rd ed.) (DSM-III). APA.
Estimating Prevalence of Autism Spectrum Disorders (ASD) in the Irish Population
—— 8
It is important to note that there is a lot of convergence between the two international
systems of diagnosis, partly because of collaborative agreements between the two
organisations. It is possible to convert the diagnoses of one system into another. Both
classification systems take the modern view of autism: that ‘there is a spectrum of autistic
conditions and that they are disorders of development, not “psychoses”. Over time the
definitions of autism have changed as illustrated by the numerous diagnostic criteria that
were used in both epidemiological and clinical settings.
1.2 History of classification of ASD
In 1943, Kanner first documented a syndrome of "autistic disturbances" in 11 children who
shared previously unreported patterns of behaviour, including poor social interaction,
obsessiveness, stereotypic movement, and echolalia.6 Autism, the prototypic pervasive
developmental disorder (PDD), is characterized by an onset prior to three years of age and
by a triad of behavioural signs and symptoms, including:
(1) abnormal development in the use of language
(2) lack of reciprocal social interaction and responsiveness, and
(3) restricted, stereotypical, and ritualised patterns of interests and behaviour.7
Autism first manifests in childhood, with age of onset for a diagnosis being under the age of
3 years. This does not necessarily mean that a person is diagnosed before turning 3 years of
age, only that symptoms were present at that developmental stage.
For many years after autism was first described in the 1940s, its prevalence was considered
to be two to four cases per 10,000 children.8 During the 1950–60s, autism was widely
regarded as early presentation of childhood schizophrenia, an emotional disturbance rooted
in parent–child psychodynamics. Consequently, in DSM I (1952) autism was classified as
Schizophrenic reaction, childhood type.
This classification continued with the DSM II (1968), where autism appeared only under the
following category: 295.8 Schizophrenia, childhood type. This category was for cases in
which schizophrenic symptoms appear before puberty. The condition was considered to be
manifested by autistic, atypical and withdrawn behaviour; failure to develop identity separate
from the mother's; and general unevenness, gross immaturity and inadequacy of
development. It was acknowledged that these developmental defects may result in mental
retardation, which should also be diagnosed.
6 Kanner L. Autistic disturbances of affective contact. Nerv Child. 1943; 2:217–250. 7 Bailey A, Phillips W, Rutter M. Autism: towards an integration of clinical, genetic, neuropsychological, and neurobiological
perspectives. J Child Psychol Psychiatry. 1996; 37:89–126. 8 Wing L, Potter D. The epidemiology of autistic spectrum disorders: is the prevalence rising? Ment Retard Dev Disabil Res Rev.
2002;8: 151–161.
Estimating Prevalence of Autism Spectrum Disorders (ASD) in the Irish Population
—— 9
1.3 Change in classification
By the 1970s a change in classification occurred and autism was understood as biologic in
origin and no longer incompatible with mental retardation. Subsequently, the DSM-III and the
DSM-111R (1987) provided a more complex definition of autistic disorder that required
meeting 8 of 16 criteria among the three domains of social interaction, communication, and
restricted interest or activities, dropping the requirement for early onset in life and providing a
new category, “Pervasive Developmental Disorder, Not Otherwise Specified (PDD-NOS),”
for children meeting some but not all diagnostic criteria for autistic disorder.
Revisions in the DSM-III-R definition of autism meant that although sensitivity was now very
high, specificity still was quite low. In other words, a large number of children previously not
diagnosed now met the diagnostic criteria for autism. In 1994, the Diagnostic and Statistical
Manual of Mental Disorders, Fourth Edition (DSM-IV) introduced revised diagnostic criteria
and five subtypes of autism under the category of pervasive developmental disorders. These
included autistic disorder, Asperger disorder, pervasive developmental disorder–not
otherwise specified (PDD-NOS), childhood disintegrative disorder, and Rhett’s disorder.9 The
first three subtypes comprise autism spectrum disorder (ASD), whereas the latter two
conditions belong to the wider category of pervasive developmental disorders.
The fifth edition of DSM was published in 2013 and collapsed autism, Asperger syndrome
and pervasive developmental disorder-not otherwise specified into a single diagnosis of
Autism Spectrum Disorder (ASD).10 It is believed that individuals with ASD are best
represented as a single diagnostic category because they show similar types of symptoms
and are better differentiated by clinical specifiers (i.e., dimensions of severity) and
associated features (i.e., known genetic disorders, epilepsy, and intellectual disability). An
additional change to the DSM-5 includes synthesising the social and communication deficits
section into one domain.
Autistic Disorder
Autistic disorder (DSM-IV-TR) or childhood autism (ICD 10) has an onset before the age of
three and shows evidence of a cluster of features including abnormal functioning in social
interaction, communication, and imagination and thought as evidenced through restricted,
repetitive behaviour which cannot be solely explained on the basis of low cognitive
functioning. It is much more common in boys. Autistic disorder is also known as "Kanner's
Syndrome”.
9 American Psychiatric Association. Diagnostic and statistical manual of mental disorders. 4th ed. Washington, DC: American
Psychiatric Association; 1994. 10 American Psychiatric Association. Diagnostic and statistical manual of mental disorders. 5th ed. Arlington, VA: American Psychiatric Association; 2013.
Estimating Prevalence of Autism Spectrum Disorders (ASD) in the Irish Population
—— 10
Asperger’s Disorder (DSM-IV-TR) / Asperger’s Syndrome (ICD-10)
While this disorder has an ‘uncertain nosological validity’, it shows the same kind of
qualitative abnormalities of reciprocal social interaction as autistic disorder does with a
restricted, stereotyped, repetitive repertoire of interests and activities. In international
diagnostic terms, the main difference from autistic disorder has been that there is no
clinically significant delay or retardation in cognitive development or in language acquisition,
e.g. 'single words used by age two years' (DSM-IV-TR). More importantly, persons with
Asperger Syndrome (AS) have communication difficulties (regardless of structural language
skill). Children with Asperger Syndrome typically present for assessment relatively late in
development. Asperger Syndrome appears to have a later onset or at least tends to be
recognized at a later stage.
Atypical Autism or Pervasive Developmental Disorder-Not Otherwise Specified
(PDDNOS)
This diagnostic category is used when there is a severe and pervasive impairment in the
development of reciprocal social interaction associated with impairment in either verbal or
non-verbal communication skills or with the presence of stereotyped behaviour, interests and
activities, but not meeting the diagnostic criteria for specific pervasive developmental
disorders, e.g. autistic disorder or Asperger's Syndrome. PDD-NOS includes atypical autism,
i.e. presentations that are characterised by atypical symptomatology, or subthreshold
symptomatology, or late onset, or all of these.
Impact of changing diagnostic criteria on reported prevalence rate
It is understandable, given the complexity of the classification of autism and the subsequent
changes made to the DSM and ICD diagnostic categories over the last number of decades,
that estimating prevalence of the condition is fraught with methodological difficulties. This is
best illustrated in the work undertaken by Kielinen et al. (2000)11 who applied different
diagnostic criteria to the same group of children (n=39, 216). Whilst administering Kanner’s
original criteria the rate of autism was 2.3 per 10,000; this increased to 6.1 per 10,000 using
the ICD-10; the use of DSM-IV criteria further increased the rate to 7.6 per 10,000. These
findings illustrate a 3-fold variation in prevalence rates based solely upon varying diagnostic
criteria. Baird et al. in the UK in 2006 found a prevalence rate of 116.1 per 10,000, but when
the authors confined the definition of childhood autism to a narrower definition, this provided
a prevalence of 24.8 per 10,000 for the same population.12
11 M. Kielinen, Linna S.L., Moilanen, I. (2000) Autism in Northern Finland. Eur Child Adolesc Psychiatry. Sep;9(3):162-7. 12 Baird, et al. (2006) Prevalence of disorders of the autism spectrum in a population cohort of children in South Thames: the
Special Needs and Autism Project (SNAP). The Lancet. Jul 15;368 (9531):210-5.
Estimating Prevalence of Autism Spectrum Disorders (ASD) in the Irish Population
—— 11
This is further highlighted in a 2014 study: ‘Potential impact of DSM-5 criteria on autism
spectrum disorder (ASD) prevalence estimates.’13 The researchers found that estimates of
the number of children with ASD might be lower using the current Diagnostic and Statistical
Manual of Mental Disorders, Fifth Edition (DSM-5) criteria than using the previous Diagnostic
and Statistical Manual of Mental Disorders, Fourth Edition, Text Revision (DSM-IV-TR)
criteria.
1.4 Screening and diagnosis
In addition to changing classification systems, there are numerous screening and diagnostic
instruments used in the diagnosis of ASD. Significant progress has been made over the past
two decades in the development of screening and diagnostic instruments for autism
spectrum disorders (ASD).14 However accurate tools for screening and diagnosis of ASD are
limited by the lack of a true test for ASD, which remains a behaviourally-defined disorder.
Screening is the prospective identification of unrecognised disorder by the application of
specific tests or examinations. Surveillance refers to the on-going and systematic collection
of data relevant to the identification of a disorder over time by an integrated health system.
Several parameters of screening instruments are important in assessing their efficacy and
utility:
i. Sensitivity is the proportion of individuals with a disorder who have a positive screen
result,
ii. Specificity is the proportion of individuals with a disorder who have a negative screen
result,
iii. Positive predictive value (PPV) is the proportion of individuals with a positive screen
result who have the disorder.
Sensitivity is required to be high in order that the screen misses few cases of the disorder
(avoiding falsely reassuring parents and professionals). Specificity is required to be high in
order that few cases without the disorder are screen positive (avoiding falsely alarming
parents and costly referral for in-depth assessment). When the sensitivity and specificity of a
screen remain constant, the PPV is lower the rarer a disorder is within the population.15
Hence, PPV will be lower in the population than in referred samples. Glascoe (1996) has
estimated that acceptable sensitivity and specificity for developmental screening tests are
13 Matthew J. Maenner, et al. Potential Impact of DSM-5 Criteria on Autism Spectrum Disorder Prevalence Estimates. JAMA
Psychiatry. 2014;71(3):292-300. 14 See Charman, et al. (2013) Measurement Issues: Screening and diagnostic instruments for autism spectrum disorders – lessons from research and practice. Child Adolesc Ment Health. Feb 1; 18(1): 52–63. 15 Clarke and R. Harrington (1999). On diagnosing rare disorders rarely: appropriate use of screening instruments. J Child.
Psychol. Psychiatry. Feb: 40(2):287-90.
Estimating Prevalence of Autism Spectrum Disorders (ASD) in the Irish Population
—— 12
70% to 80%, reflecting the nature and complexity of measuring the continuous process of
child development.16
ASD is heterogeneous in the presentation and time course of core deficits. It would therefore
be important for a screening programme to administer ASD-specific screening tools
periodically at differing ages to detect children at risk who, for a number of reasons, may
have been missed on an earlier occasion. Searches identified 46 screening tools for ASD.
Most are designed for children, while only few measures are available for adults, especially
those with additional intellectual disabilities. Many instruments are under-researched,
although a small number such as the Modified Checklist for Autism in Toddlers and the
Social Communication Questionnaire have been widely examined in a variety of
populations.17
Diagnostic instruments
ASD screening instruments function to identify children in need of further monitoring or
diagnostic evaluation. At that point, standardised autism diagnostic instruments are often
employed to structure the information-gathering from both parents and identified children
within a diagnostic assessment. The existence of, and ongoing improvements to, such
measures are associated with more accurate diagnosis of ASD, including the ability to
reliably describe milder and younger cases, as well as increased comparability of research
findings based on better agreement as to “caseness” across research teams.
However, as with screening tools, diagnostic instruments are often limited by inadequate
power to correctly identify individuals with and without ASD. Further, the estimates of such
performance validity for each particular measure are necessarily limited by the absence of
an absolute test for ASD, and as such are influenced by clinical experience in diagnosing
ASD, training and experience in using the diagnostic measure, and evolution within the field
in terms of what is recognised and labelled “ASD.”
Therefore, ASD assessment and diagnosis relies on behavioural assessment. It is widely
accepted that diagnosis should be conducted using a multidisciplinary approach evaluating
cognitive functioning, speech and language ability and broader developmental concerns, as
well as behavioural evaluation.
Lack of a universally accepted screening instrument had led to recommendations in some
countries not to implement population screening. The 2012 HSE review concluded that it
would be inappropriate to be prescriptive about the assessment instrument used as new and
16 F.P. Glascoe (1996). Developmental Screening. In Wolraich, M., ed. Disorders of development and learning: A practical guide.
St Lois: MO: Mosby.
17 Sappok, et al. (2015). Screening tools for autism spectrum disorders. Advances in Autism, 1 (1):12-29.
Estimating Prevalence of Autism Spectrum Disorders (ASD) in the Irish Population
—— 13
more appropriate ones emerge.18 However, they advocated for use of a semi-structured
instrument in combination with the Autism Diagnostic Observation Schedule (ADOS) as that
which provides the best sensitivity and specificity in the diagnosis, and stability over time.
1.5 Legislation
The Education for Persons with Special Education Needs EPSEN Act (2004) provides for
supporting the rights of children to an educational assessment, an individual education plan,
and to an independent appeals process. It fits into a legislative framework which, inter alia,
includes the Education Act (1998), the Education (Welfare) Act (2000), the Equal Status Act
(2000) and the Disability Act (2005), under the overall umbrella of the Constitution, as well as
various international agreements and human rights provisions. The EPSEN Act has not yet
been implemented.
The purpose of the Disability Act is to promote the participation of people with disabilities in
society by supporting the provision of disability specific services and improving access to
mainstream public services. The Act establishes a right to an independent assessment of
individual needs and a related service statement. On 1st June 2007, Part 2 of the Disability
Act became law for children under the age of five years, giving them a right to an
independent assessment of need. The Disability Act (2005) places legal obligations on the
HSE regarding assessment of need and service statements for all individuals with a disability
and on the autism spectrum. The terms of the Act indicate that an assessment of need
should commence within three months.
18 See National Review of Autism Services: Past, Present and Future (HSE, 2012), pp. 19-20 and inclusion of a table
summarizing the main screening instruments, with their pros and cons.
Estimating Prevalence of Autism Spectrum Disorders (ASD) in the Irish Population
—— 14
2.0 Review of data sources to estimate
prevalence in Ireland There is currently no reliable method of estimating prevalence of Autism Spectrum Disorder
in Ireland. The most reliable source of information would be a disease register where all
individuals diagnosed with the disorder (using standardised definition and diagnostic
instruments) would be recorded. This does not exist in Ireland. However, there are other
data sources which might help with estimating a prevalence rate.
2.1 Irish data sources
The Irish census
The census of population has been the primary source of information on numbers of people
with disabilities in Ireland. In Census 2006 questions on disability were broadened to include
learning difficulties, intellectual disabilities, and psychological and emotional conditions; this
resulted in a rise in the prevalence rate for all developmental disorders from 2.1% of children
in 2002 to 3.2% in 2006. A follow-up nested study, entitled The National Disability Survey
(2008), and carried out with 16,000 people, reported that 11% of children aged 0-17 years
reported having a disability. Working estimates of prevalence for disabilities by category
based on the total population of 5-18s in the census of 2006 estimated the prevalence of
autism spectrum disorder at 4,730, a rate of 0.6%.
The 2016 census showed that 66,611 people or 1.4% of the population suffered from an
intellectual disability, 8,902 higher than in 2011, representing a 15.4% increase. As in
previous census data, the greatest incidence by far was amongst 10 to 14 year old males,
with 5,233 affected in this age group - more than double that of females (2,284). This
information while useful, does not provide data on ASD prevalence as no nested study has
been undertaken to date.
Health Research Board
The Health Research Board manages two national service-planning databases for people
with disabilities on behalf of the Department of Health.
• National Intellectual Disability Database (NIDD), established in 1995
• National Physical and Sensory Disability Database (NPSDD), established in 2002
Estimating Prevalence of Autism Spectrum Disorders (ASD) in the Irish Population
—— 15
The disability databases aim to provide comprehensive and accurate information for decision
making in relation to the planning of specialised health and personal social services for
people with intellectual, physical or sensory disabilities.
The National Intellectual Disability Database (NIDD) provides information on specialised
health services currently used or needed by people with intellectual disability. The database
informs the regional and national planning of these services by providing information on
trends in demographics, current service use and future service need.
The following information is provided:
• demographic profile of people with intellectual disability
• specialised health services received by people with intellectual disability
• waiting times for specialised health services.
The NIDD is not diagnosis-driven and therefore does not capture individuals with ASD.
Individuals with intellectual disability and secondary diagnosis of ASD can be recorded on
the NIDD, but ASD-specific data cannot be extracted.
The National Physical and Sensory Disability Database (NPSDD) provides information on
specialised health services utilised by people with physical/sensory disabilities. As not every
individual in Ireland who has a physical/sensory or speech and language disability is availing
of, or requiring a specialised health and personal social service, and as the registration on to
the database is voluntary, the NPSDD cannot provide any definitive epidemiological
statement on the number of people with a particular type of disability. Therefore, the
database may not cover a proportion of people living in Ireland who have a physical or
sensory disability.
As both databases are voluntary, have specific criteria for inclusion, and do not collect
diagnosis, it is clear that not all individuals with ASD will have their needs recorded on these
national databases, and therefore they cannot assist in estimating incidence/ prevalence of
ASD.
Plans are advanced to merge and refine the existing disability information systems into the
NASS (National Ability Supports System). This will continue to collect data on the HSE
funded specialist services for disability including day, respite, residential, multi-disciplinary,
supports for daily living such as PA (personal assistance) and home support. It will capture
diagnosis, including ASD. People can record more than one diagnosis to allow for
comorbidity. The NASS will also be able to capture where in education those of school age
are and are registered, which may make it possible to triangulate with National Council for
Estimating Prevalence of Autism Spectrum Disorders (ASD) in the Irish Population
—— 16
Special Education data at a later stage. However, the NASS is still voluntary (not
epidemiological in its collection), so will only record those who have or need the services
referred to above, and thus cannot be used for estimating prevalence rates.
2.2 Children in receipt of services
People with autism or autism spectrum disorders (ASD) may be served by public supports in
a range of areas – education supports, disability or mental health supports, social welfare
payments, free travel, housing or employment supports. Some of these programmes apply
across a range of disabilities, but in education there is a range of services and provision that
is specifically linked to a diagnosis of ASD.
National Council for Special Education (NCSE)
NCSE data on students with ASD with resource teaching support or in special classes and
special schools indicate a prevalence rate of about 1.55 per cent and this figure is currently
used for planning purposes. This calculation is based on school-aged children with ASD in
state-funded schools between 4-18 years. It should be understood that this is a school
population prevalence rate and is a best estimate based on administrative information
available. It is not perfect, because while it excludes 3-year-olds in early intervention classes
(170 children approximately), it doesn’t take into the account the number of 4-year-olds that
are not in school, or children aged 4 and older who are on the Home Tuition scheme and not
included in overall school population figures:
• Total school population: (883,903 – 170 children aged 3 years) = 883,733
• Students with ASD: (13,873-170) = 13,703 (13,703 / 883,733) x 100 = 1.55%
Using data from the Growing Up in Ireland (GUI) study, the Economic and Social Research
Institute (ESRI) analysed how the prevalence of special educational needs varies across
social class and income groups. They found that the percentage of pupils reported by
teachers to have special educational needs was significantly greater for those in schools
serving disadvantaged areas. This has been taken into consideration by the Department of
Education in a new model of additional teaching resources for schools (Dept. of Education
Circular No. 0013/2017).
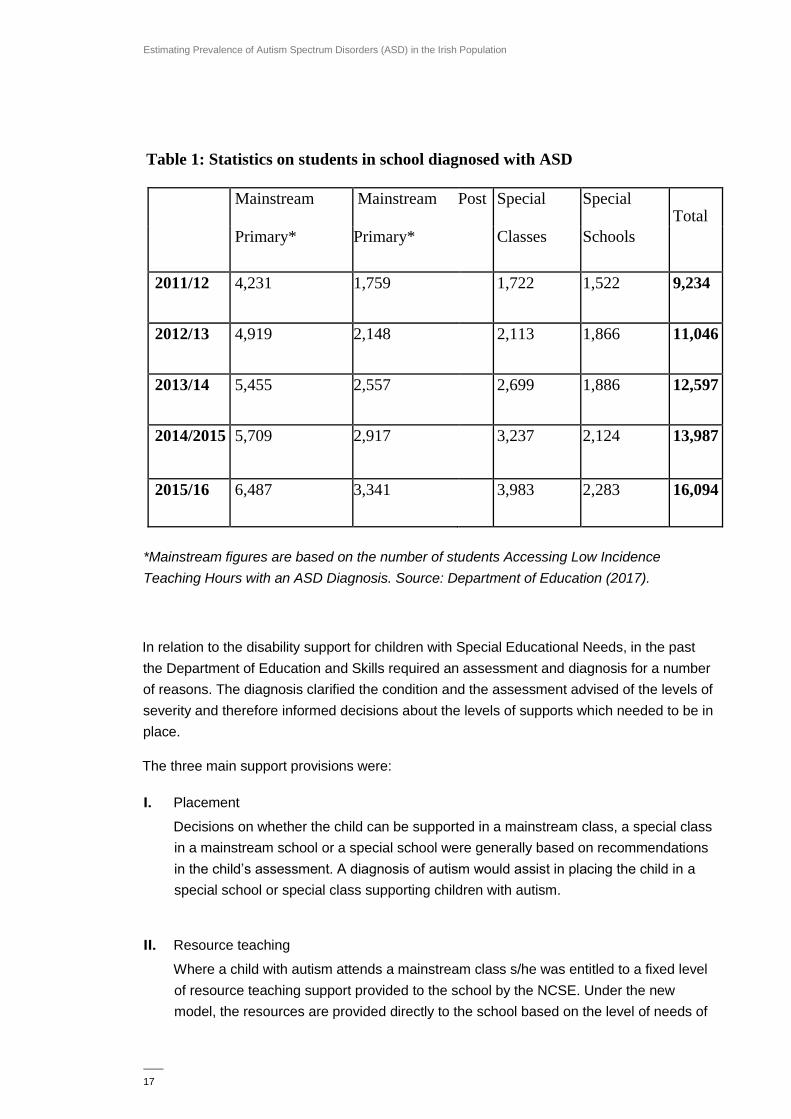
There has been a marked increase in the number of children accessing special education
services (Table 1).
Estimating Prevalence of Autism Spectrum Disorders (ASD) in the Irish Population
—— 17
Table 1: Statistics on students in school diagnosed with ASD
Mainstream Mainstream
Post Special Special Total
Primary*
Primary*
Classes
Schools
2011/12
4,231
1,759
1,722
1,522
9,234
2012/13
4,919
2,148
2,113
1,866
11,046
2013/14
5,455
2,557
2,699
1,886
12,597
2014/2015
5,709
2,917
3,237
2,124
13,987
2015/16
6,487
3,341
3,983
2,283
16,094
*Mainstream figures are based on the number of students Accessing Low Incidence
Teaching Hours with an ASD Diagnosis. Source: Department of Education (2017).
In relation to the disability support for children with Special Educational Needs, in the past
the Department of Education and Skills required an assessment and diagnosis for a number
of reasons. The diagnosis clarified the condition and the assessment advised of the levels of
severity and therefore informed decisions about the levels of supports which needed to be in
place.
The three main support provisions were:
I. Placement
Decisions on whether the child can be supported in a mainstream class, a special class
in a mainstream school or a special school were generally based on recommendations
in the child’s assessment. A diagnosis of autism would assist in placing the child in a
special school or special class supporting children with autism.
II. Resource teaching
Where a child with autism attends a mainstream class s/he was entitled to a fixed level
of resource teaching support provided to the school by the NCSE. Under the new
model, the resources are provided directly to the school based on the level of needs of
Estimating Prevalence of Autism Spectrum Disorders (ASD) in the Irish Population
—— 18
the school. Accordingly, there is no longer a need for a diagnosis to drive an individual
allocation to the school.
III. Special Needs Assistant (SNA) support
The SNA scheme is currently being reviewed to see whether children can be supported
differently or better. The model for allocating SNAs is also under review to see whether
the need for a diagnosis can be removed as was the case with the Resource teacher
scheme. Other supports including Home Tuition and Assistive technology are also
available to those with a diagnosis.
The Department of Education has introduced a revised model of allocation of additional
teaching supports to schools. This model includes the use of a school’s social context in the
development of a school’s educational profile, as the socioeconomic status of pupils is linked
to the incidence of certain types of special educational needs. The Department also noted
that international evidence clearly shows that there is a higher incidence of special
educational needs among boys and this is taken account of also in the new allocation model.
The profiled allocation for schools from September 2017 is based on
• the number of pupils with complex needs enrolled to the school;
• the learning support needs of pupils as evidenced by standardised test results; and
• the social context of the school including disadvantage and gender.
Professional and other medical assessment or diagnosis of a particular condition will no
longer be necessary for pupils to access educational teaching resources in schools, nor will
there be a requirement for schools to submit assessments annually in order to apply for
additional teaching resources. It is worth noting that, from the introduction of this model in
September 2017, the NCSE will no longer have access to information on the number of
students with ASD receiving additional teaching supports, i.e. the information on which its
prevalence rate of 1.5% is based. It should also be noted that the allocation of individual
Special Needs Assistants still requires that a child has been formally diagnosed.
Domiciliary Care Allowance
Domiciliary Care Allowance (DCA) is a monthly payment for a child aged under 16 with a
severe disability who requires ongoing care and attention substantially over and above the
care and attention usually required by a child of the same age. It is not means tested. The
allowance is administered by the Department of Social Protection. The guidelines state that
the payment is not based on the type of disability but on the resulting physical or mental
Estimating Prevalence of Autism Spectrum Disorders (ASD) in the Irish Population
—— 19
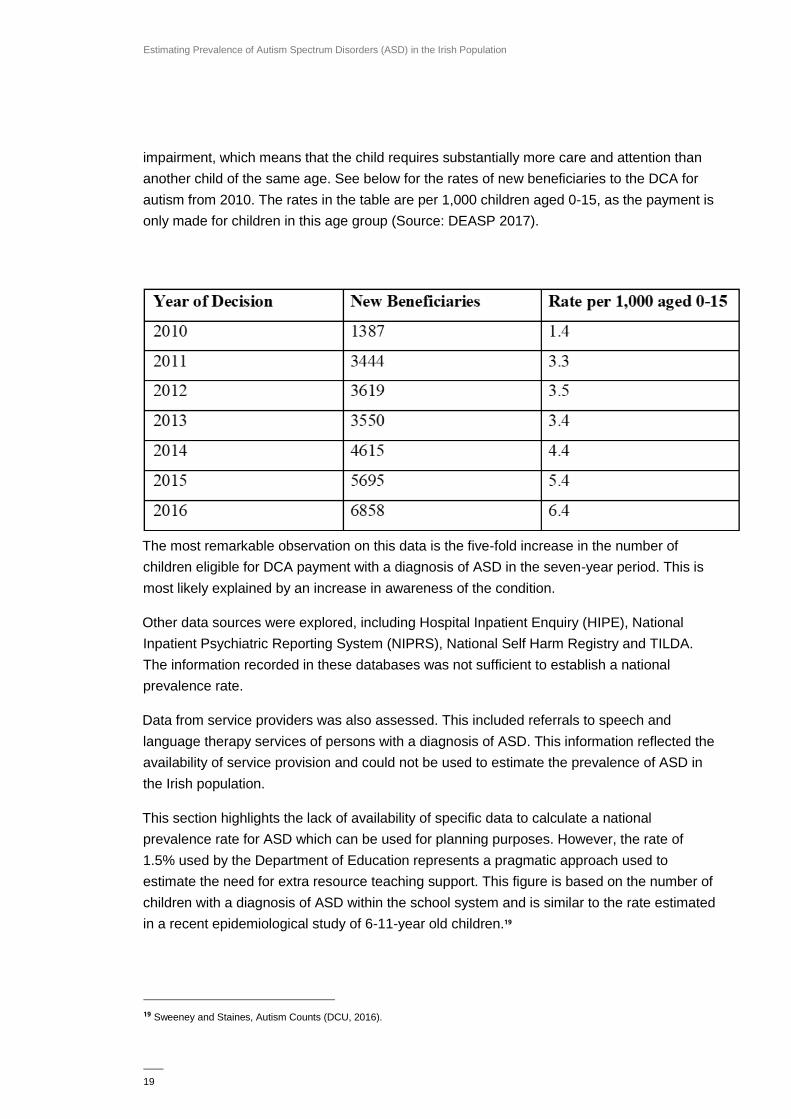
impairment, which means that the child requires substantially more care and attention than
another child of the same age. See below for the rates of new beneficiaries to the DCA for
autism from 2010. The rates in the table are per 1,000 children aged 0-15, as the payment is
only made for children in this age group (Source: DEASP 2017).
The most remarkable observation on this data is the five-fold increase in the number of
children eligible for DCA payment with a diagnosis of ASD in the seven-year period. This is
most likely explained by an increase in awareness of the condition.
Other data sources were explored, including Hospital Inpatient Enquiry (HIPE), National
Inpatient Psychiatric Reporting System (NIPRS), National Self Harm Registry and TILDA.
The information recorded in these databases was not sufficient to establish a national
prevalence rate.
Data from service providers was also assessed. This included referrals to speech and
language therapy services of persons with a diagnosis of ASD. This information reflected the
availability of service provision and could not be used to estimate the prevalence of ASD in
the Irish population.
This section highlights the lack of availability of specific data to calculate a national
prevalence rate for ASD which can be used for planning purposes. However, the rate of
1.5% used by the Department of Education represents a pragmatic approach used to
estimate the need for extra resource teaching support. This figure is based on the number of
children with a diagnosis of ASD within the school system and is similar to the rate estimated
in a recent epidemiological study of 6-11-year old children.19
19 Sweeney and Staines, Autism Counts (DCU, 2016).
Estimating Prevalence of Autism Spectrum Disorders (ASD) in the Irish Population
—— 20
3.0 Epidemiological studies from Ireland Several epidemiological studies have been identified in the literature which aim to measure
the prevalence of ASD in Ireland. These studies employ different methodologies, diagnostic
tools and age groups and as such are not directly comparable. The studies are summarised
below.
3.1 Prevalence of ASD in Ireland
Fitzgerald et al. (1997) examined diagnostic, prevalence, psychosocial and service issues in
relation to persons with autism in the Eastern Health Board (EHB) area in the period
19901992.20 All centres in the EHB area with children and adults up to 25 years with special
needs were identified and contacted regarding the study (n = 25). This study found 272 (4.9
per 10,000) persons in the age-range 6-25 who met diagnostic criteria for autistic disorder
using the Autistic Disorders Diagnostic Checklist.21 DSM-I11-R and ICD-10 criteria gave a
prevalence rate of 4-5 per 10,000. This rate is similar to rates from other countries in the
same time period.
This study was updated by Fitzgerald et. al in 2001. Estimates of the prevalence rates for
autism and ASD in Ireland, based on the number of persons availing of state, voluntary and
private services in the Eastern region were 7.7 per 10,000. This represents a clear increase
in the prevalence rate of 4.9/10,000 reported in 1992/1993 for the region. The prevalence
rate found in these studies is based on cohorts of children attending clinics. This means the
prevalence rate is based on children in receipt of services and does not take into
consideration unmet need. In addition, it is also likely that some mild cases may have been
missed and that staff may not have considered the possibility of autism in some persons with
severe intellectual disability or indeed with normal intelligence, and also that some preschool
children may not have come to anyone's attention with autism.
More recently, a study by Perry et al. (2007) assessed the feasibility of administering the
Checklist for Autism in Toddlers (CHAT) at the 18-month developmental check to estimate
the prevalence of diagnosed cases of autism.21 The CHAT was administered to 2117 infants.
The overall prevalence of clinically diagnosed autism following this screening exercise was
20 Fitzgerald, Michael, et al. (1997) Irish families under stress: Vol.6 Planning for the future of autistic persons: a prevalence and
psychosocial study in the Eastern Health Board area of Dublin. Eastern Health Board. 21 Wing, L. (1997) The autistic spectrum.
The Lancet. 350(9093):1761-1766. 21 Perry, I.J. et al. (2007) Screening for autistic spectrum disorder at the 18-month developmental assessment: a population-
based study. Irish Medical Journal, 100 (8):565-567
Estimating Prevalence of Autism Spectrum Disorders (ASD) in the Irish Population
—— 21
33.1 per 10,000 (95% CI: 13.3 to 68.0).
CHAT, developed by Simon Baron-Cohen and colleagues, assesses simple joint attention
and pretend play behaviours by parental report and health practitioner observation through
direct testing. In the UK, Baird et al. screened 16,235 infants at 18 months using the CHAT
instrument.22 Following the first administration of the instrument - 16,235 infants screened at
18 months - they reported a positive screening rate for autism (medium or high risk CHAT
score) of 251 per 10,000 (95% CI: 226−274), a somewhat higher rate than that observed in
the Irish study: 137.0 per 10,000 (95% CI: 91.9 to196.1). Similar to the Irish study (Perry et
al, 2007), a significant proportion of children who screened positive on first assessment did
not return for a further assessment. In the UK, children who scored medium or high risk after
two screenings (n=32) were given full clinical assessments at 42 months and 10 cases of
autism were diagnosed. Thus, the UK screening exercise yielded 12 cases of autism per
10,000 children screened on at least one occasion (95% CI: 2.9 to 11.3) as compared with
33.1 per 10,000 (95% CI: 13.3 to 68.0) in the study by Perry et al. As a result, the yield in
terms of previously undiagnosed cases in this 2007 study appears high relative to the earlier
UK study. However, comparisons between the two studies are constrained by the
differences in sampling strategies and dropout rates.
The most recent data on the prevalence of ASD in Ireland is reported in a study carried out
by Dublin City University (Boilson et al. 2016).23 This study used a protocol developed in
Europe called the European Autism Prevalence Protocol (EPAP). The main purpose of the
EPAP protocol, which was funded by DG Sante EU funding, was to facilitate a standardised
approach to estimating ASD rates across Europe. Subsequently further EU commission
funding permitted the establishment of the Autism Spectrum Disorders in Europe (ASDEU)
project (http://asdeu.eu/). This trans-European programme involving universities, charities
and expert institutions was established to increase understanding of autism.24 The Irish study
was the first to operationalise the screening phase of the protocol and validate the use of a
screening instrument - the Social Communication Questionnaire (SCQ) - as a primary
screener for ASDs among national school children.
In this research, a study booklet completed by the parents of eligible children aged 6-11
years was returned to the teacher for collection by the study team. There were (n=7,951)
primary school children screened males 54% (n =4,268) females 46% (n=3,683), special
education school children (n=189) males 66% (n=125) females 34% (n=64), in three regions:
22 Baird, et al. (2000) A screening instrument for autism at 18 months of age: a 6-year follow-up study. 23 Boilson, A.M., et al. (2016) Operationalisation of the European Protocol for Autism Prevalence (EPAP) for Autism Spectrum Disorder Prevalence Measurement in Ireland Journal of Autism and Developmental Disorders, 46(9), 3054-3067. 24 The European Autism Information Systems Project (Posada & Ramirez, 2008) highlighted the lack of systematic and reliable
data on the prevalence of autism spectrum disorders in Europe. The EAIS project designed a protocol for the study of ASD
prevalence at European level.
Estimating Prevalence of Autism Spectrum Disorders (ASD) in the Irish Population
—— 22
Galway, Waterford and Cork. Participation rates for parents of eligible children were 69%
(n=5,457) for national schools, 36% (n=69) for special education schools.
The distribution of SCQ total scores for the national school sample were strongly skewed
towards lower scores 4.65 ± 4.75, range 0-36. The majority of children (92%) scored in the
normal range (0 to11) (n=5002), 4% scored in the moderate range (12-14) (n=225) and 4%
scored in the high range (>15) score range (n=230). An optimal cut-off score (>13)
differentiated ASD from other diagnosis [sensitivity 0.90, specificity 0.81, positive predictive
value 0.43, and negative predictive value 0.98], [Test retest reliability mean interval: 15
months, Pearson’s r of 0.77, df = 499, p < 0.001].
The authors concluded that the feasibility of screening children for ASDs with the EPAP
protocol, using the SCQ in a non-clinical setting of Irish primary and special schools, was
demonstrated. The importance of this study is that the screening questionnaire, i.e. the
Social and Communication Questionnaire (SCQ), was validated for use in this population.
Furthermore, following this validation, the instrument was used to estimate the prevalence of
ASD in a national school population aged 6-11 years. Both National and Special Education
Schools were included in this study. Parents of almost 8,000 national school children in
mainstream and special education schools across Cork, Waterford and Galway cities were
administered the ASD screening questionnaire (SCQ) on behalf of their child. There was a
70% response rate. The total number of children identified with a diagnosis of Autism
Spectrum Disorder was 63, giving a prevalence rate of 1.0%. Within Special Education
schools in the study regions, 36 of the 69 children who participated were identified with an
autism diagnosis, giving an estimated 52% prevalence rate for this population.
According to the authors of this study, the findings should be regarded as a minimum
prevalence rate across the three study regions combined for the following reasons:
• while the overall response rates for National Schools were high, a significant number of
children identified and invited to attend multi-disciplinary assessment did not avail of the
assessment or were lost to follow-up
• response rates at the Special Education Schools were low at just 36% and therefore
cannot be regarded as representative of the Special Education school population.
When further analysis was conducted (to weight for this low response rate) a figure of 1.5%
resulted. The authors feel that this is a more accurate reflection of the prevalence rate in this
particular cohort. This is similar to the Department of Education figure of 1.5% which is
based on the numbers of children with a diagnosis of ASD who are availing of additional
teaching supports in schools.
Estimating Prevalence of Autism Spectrum Disorders (ASD) in the Irish Population
—— 23
3.2 Prevalence of autism in Northern Ireland
‘The Prevalence of Autism (including Asperger’s Syndrome) in School Age Children in
Northern Ireland 2018’ was published in May 2018 by the UK Department of Health.25
Statistics detailed within the publication were sourced from the Department of Education and
include the number of school aged children identified with autism (including Asperger’s) by
Health and Social Care Trust area, Urban/Rural, Multiple Deprivation Measure, gender,
school year and special educational needs assessment. The data shows a year-on-year
increase in estimated prevalence of autism in school aged children in Northern Ireland.
• The estimated prevalence of autism within the school aged population in Northern
Ireland has increased by 1.7 percentage points, from 1.2% in 2008/09 to 2.9% in
2017/18.
• There is a significant difference in the estimated prevalence rates of autism between
the genders, with males four times more likely to be identified with autism (4.5%) than
females (1.2%), in line with international findings.
• In general, prevalence across all school years was higher in 2017/18 compared with
2008/09. In 2017/18 the highest prevalence rate recorded was for those children aged
13 years and the lowest was for children aged 5 years. The results indicate that most
identification of autism in school occurs when children are aged between 5 and 8 years
old.
• The Northern Ireland urban population has a statistically significant higher prevalence
rate than the rural population.
• Using the Northern Ireland Multiple Deprivation Measure (MDM) ranking 13% of the
children identified with autism in 2017/18 were from the most deprived decile in
Northern Ireland. The rate of autism in this most deprived decile was 31% higher than
the Northern Ireland average.
There are several points worth noting about the above findings. Firstly, this report indicates
an estimated prevalence of autism of 2.9% in school aged children in Northern Ireland,
significantly higher than the 1.5% estimated in the ROI in the same age group. The
difference in prevalence rate reported between Northern Ireland and the Republic of Ireland
may be related to the introduction of the Autism Act (Northern Ireland) 2011. This was
accompanied by an increase in awareness of autism via campaigns and consciousness
raising events, and this may well have contributed to a rise in the number of assessments
carried out and positive diagnoses processing through the system.
25 The Prevalence of Autism (including Asperger Syndrome) in School Age Children in Northern Ireland 2018, Department of
Health (Information and Analysis Directorate), May 2018 (available at https://www.health-ni.gov.uk/topics/dhssps-statistics-andresearch).
Estimating Prevalence of Autism Spectrum Disorders (ASD) in the Irish Population
—— 24
Secondly, the report highlights the much higher rates in children from lower socio-economic
backgrounds. This, at first glance, might appear to be in contrast to results emanating from
USA monitoring studies, which found a higher prevalence of autism in White children
compared to Hispanic and other ethnic groups. However, this difference in the USA is
thought likely to be related to the availability of diagnostic services rather than a true
reflection of a higher incidence in White children. Socio-economic and gender differences in
rates have been taken into consideration in the Department of Education’s revised allocation
model for additional teaching supports in schools. This revised model will be evaluated after
two years when unmet need should be identified.26
26 Department of Education, Circular No. 0013/2017.
Estimating Prevalence of Autism Spectrum Disorders (ASD) in the Irish Population
—— 25
4.0 International databases There are several international databases which have been reporting prevalence estimates
over a period of time based on DSM and ICD criteria.
Autistic Developmental Disability Monitoring Network (ADDM)
One such database is the Autistic Developmental Disability Monitoring Network (ADDM) in
the USA. The Children’s Health Act (US) authorized CDC to create the ADDM Network in
2000. The ADDM Network is an active surveillance system that provides estimates of the
prevalence and characteristics of ASD among children aged 8 years whose parents or
guardians reside within 11 ADDM sites in the United States (selected counties or parts of
counties in Arkansas, Arizona, Colorado, Georgia, Maryland, Missouri, New Jersey, North
Carolina, South Carolina, Utah, and Wisconsin). The core surveillance activities in all ADDM
Network sites focus on children aged 8 years because it has been demonstrated that this is
the age of peak prevalence. While this database has limitations, e.g. only 11 States are
included in the surveillance network and the population study is not representative of the
total US population, it does nevertheless provide a comparable population-based ASD
prevalence estimate from different sites every 2 years and evaluates how these estimates
are changing over time.
Prevalence estimate from the ADDM
The most recent findings published in April 201827 estimate a prevalence rate of ASD in
8year olds of one in 59 (1.68%) for the surveillance year 2014. The findings from the ADDM
Network in 2016 (for surveillance year 2012) had previously estimated that the percentage of
children identified with autism spectrum disorder (ASD) was about 1 in 68 or 1.5%. This
increase in estimated prevalence between 2012 and 2014 is reflective of a general increase
across years since 2000, the first year of measurement. The estimated prevalence of ASDs
increased 23% during 2006 to 2008 and 78% during 2002 to 2008. However, the two most
recent surveys prior to the current findings had been suggestive of a plateauing prevalence
at around 1.5%.
Fombonne (2018)28, in an Editorial published after the CDC ADDM Network findings were
released, set out a number of factors to consider when seeking to interpret the results.
Firstly, he highlighted the fact that parents of children with autism have unusually high
27 Baio et al., (April 2018) Prevalence Spectrum Disorder among children aged 8 years- Autism and Developmental Disabilities
Monitoring Network, 11 sites, United States, 2014, Surveillance Summaries, 67 (6): 1-23
28 E Fombonne (June 2018), Editorial: The rising prevalence of autism, Journal of Child Psychology and Psychiatry, Vol 59, Issue
7.
Estimating Prevalence of Autism Spectrum Disorders (ASD) in the Irish Population
—— 26
participation in surveys, making it plausible that non-participants have less autism than
participants. In other words, he suggested that differential participation rates may have
biased upwards prevalence estimates. Secondly, Fombonne noted that the CDC
methodology excludes children without medical/education records, possibly resulting in
under-ascertainment of cases. Despite being a unique attempt to maintain a consistent
survey methodology across areas and over time, CDC results have consistently pointed to
under-ascertainment in some States (e.g. Alabama), in ethnic minority groups and in lower
socio-economic regions. Finally, Fombonne suggests that another limitation relates to the
fact that case status confirmation does not require a direct assessment of participants with
ASD. Record review is a procedure which can be employed to confirm diagnosis but in two
previous validation studies conducted, 65% of subjects met the diagnostic criteria when
directly assessed with standardised clinical tools in one study, whereas there was near full
agreement in the other validation study. Taken together, Fombonne concludes that the
upward trend in prevalence rates in the CDC Surveys are complex and difficult to interpret.
Furthermore, he points out that, even though not stated explicitly in the most recent report, a
preliminary estimate of 1.45% can be seen for estimation of prevalence of ASD determined
by DSM 5 behavioural criteria, an 18% reduction compared to that reported using DSM-IV
criteria in the same sub-sample.
iCARE – International
Data from six countries is collected by the International Collaboration for Autism Registry
Epidemiology (iCARE). Denmark is project lead in this partnership, which collects national
health registry data from Western Australia, Denmark, Finland, Norway, Sweden and Israel.
The data encompasses ‘Autism geographical and temporal heterogeneity, phenotype, family
and life course patterns, etiology, birth weight, birth order, and age of diagnosis’.29 The
nature of the data gathered in each country is outlined in Appendix A (Schendel, 2013).
Information sourced from Denmark, Finland and Sweden is from government-maintained
registries that record diagnoses from in- or out-patient clinics or hospital contact. Israel,
Norway and Western Australia retrieve diagnostic information from government-maintained
registries which record those receiving services or benefits. (The data from Israel and
Western Australia does not include non-Jewish and Aboriginal populations respectively.30)
• The Danish National Psychiatric Register (DPR) holds electronic records since 1970
and outpatient records since 1995. ASD diagnosis is based on ICD-10. Previous
prevalence estimates of ASD in Denmark were reported to be in the region of 1% but
the most recent findings which were published in November 2018 found an autism
29 Louise Gallagher, et al. (2014) Report of the Consultation for a National Registry and Biobank for Autism and
Neurodevelopmental Disorders. 30 D.E. Schendel (2013). The International Collaboration for Autism Registry Epidemiology (iCARE): Multinational Registry-Based
Investigations of Autism Risk Factors and Trends. J Autism Dev Disord. Nov; 43(11): 2650–2663.
Estimating Prevalence of Autism Spectrum Disorders (ASD) in the Irish Population
—— 27
prevalence of 1.65% in 10-year olds (for 2016)31. The study authors mined the DPR and
patient registries for every autism diagnosis in people born between 1980 to 2012, and
they followed these individuals through to 2016. Between 1980 and 2012 2,055,928
people were born in Denmark, 31,961 of whom received an autism diagnosis. In
addition to an overall increase in the estimated prevalence of autism to 1.65%, the
findings indicate that the prevalence of autism seems to increase with age as they
tracked people into adulthood. However, many global commentators have cautioned
about interpretation of the findings which are suggestive of an apparent surge of
diagnoses observed beyond childhood – 0.5 per cent of people born in Denmark from
1990-1991 received an autism diagnosis by 10 years of age. But, by the time
individuals are 26 years of age the prevalence rate increases to 1.3 per cent,
suggesting almost twice as many diagnoses are made between the ages of 10 and 26
as they are before age 10. Some international researchers have called for a clinical
evaluation to confirm adult diagnoses to assist in the interpretation of the findings.
• The Finnish data is from the Hospital Discharge Registry 1969-1993 and Care Register
for Health Care (1993+). Diagnoses are based on ICD-9 and ICD-10. Cumulative
prevalence of ASD has been reported as over 1% in Finland.3233
• Norway is conducting an Autism Birth Cohort (ABC) study, which is a sub-study of the
Norwegian Mother and Child Cohort (MoBa) study. This examines data on 114,500
children born between 1999 and 2009, with questionnaires conducted through
pregnancy and childhood, and recorded blood samples. The Medical Birth Registry of
Norway is the primary source for MoBa, but the Norwegian Patient Registry (which is
mandated by law, with no consent or opt-out) is the major source of ASD cases in the
ABC study. Diagnoses are per ICD-10. A 2012 study by the Norwegian Institute of
Public Health estimates the cumulative incidence of autism to be 0.7% for children aged
6-11 years.34 Since then, it has conducted a large record review study to determine the
quality of recorded diagnoses, finding that 85% of diagnosed children meet the
diagnostic criteria (DSM-IV) for autism spectrum disorders. Recent updates of the
registry data indicate that the cumulative incidence is higher than estimated in 2012,
with estimates between 1.0% and 1.2% from age 12 years and higher.34
• The National Patient Register (Sweden) includes all inpatient data since 1987 and all
outpatient data since 2001. Diagnosis is based on ICD-9 and ICD-10. A comparative
31 Schendel DE & Thorsteinsson E (2018) Cumulative incidence of autism into adulthood for birth cohorts in Denmark, 19802012,
JAMA 320: 1811-1813 32 Attladottir et al. (2015). The increasing prevalence of reported diagnoses of childhood psychiatric disorders: a
descriptive multinational comparison. Eur Child Adolesc Psychiatry. 24:173-183. 34 Surén, et al. ‘Autism Spectrum
Disorder, ADHD, Epilepsy, and Cerebral Palsy in Norwegian Children,’ Pediatrics. 2012. 33 .e152. 34 Information supplied by Pål Surén, Norwegian Institute of Public Health.
Estimating Prevalence of Autism Spectrum Disorders (ASD) in the Irish Population
—— 28
paper published in 2015 suggests that Sweden’s prevalence of ASD is 0.7% and of
childhood autism is 0.3%.35
• The Western Australia Register for ASD is established since 2013, and uses DSM-IV
and DSM-V. It collects simple demographic and diagnostic information, such as date of
birth, gender, primary language at home; diagnostic criteria used; diagnostic methods;
IQ (verbal and non-verbal) and/or developmental abilities; other cognitive assessments;
comorbidity; language assessments and adaptive behaviour. The 2015 comparative
paper suggests Western Australia has a prevalence rate of 0.5% for ASD and 0.4% for
childhood autism.36
ASD-EU
Autism Spectrum Disorders in Europe (ASDEU) is a three-year programme run by a
consortium of 20 groups from 14 countries (see Appendix B). ASDEU has received 2.1
million euros from the Directorate-General of Health and Consumers of the European
Commission (DG-SANCO) to increase understanding of and improve responses to autism. It
will study the prevalence of autism in 12 countries in the European Union; analyse the
economic and social costs of autism; review existing arrangements and develop proposals
for early detection programmes; train professionals; validate biomarkers for the disorder; and
improve understanding of diagnosis, comorbidity, and effective care and support for adults
and senior citizens with autism.
The lack of mechanisms to obtain consistent and reliable information about ASD trends at
the European level is an important obstacle for the development of better and more
equitable services. Hence, prevalence estimation across Europe and the development of a
standardized strategy to be used for future surveillance of the ASD figures is a key objective
of the ASD-EU programme.
Dublin City University is participating from Ireland and the results of the prevalence study
(estimated prevalence of 1-1.5%) have been discussed in an earlier section (see Boilson et
al (2016), p. 20).
Under the auspices of the ASDEU Study, the first population-based ASD prevalence study
conducted in Italy indicates a prevalence of ASD in children aged 7-9 years of one in 87
(0.86%).37
35 Attladottir et al. (2015) The increasing prevalence of reported diagnoses of childhood psychiatric
disorders: a descriptive multinational comparison. Eur Child Adolesc Psychiatry. 24:173-183. 36 Ibid. 37 Narzisi et al (2018) Prevalence of Autism Spectrum Disorder in a Large Italian Catchment Area- a School Based Population
Study within the ASDEU Project, Epidemiology and Psychiatric Sciences (First View Published Online on 6 September 2018)
Estimating Prevalence of Autism Spectrum Disorders (ASD) in the Irish Population
—— 29
ASD-UK
ASD-UK is a research database administered in Newcastle University since 2011. It
registers children aged 2-16 years at point of diagnosis (those with a diagnosis of autism,
atypical autism, autism spectrum disorder, pervasive developmental disorder, or Asperger
syndrome). The register is entirely voluntary, and a comparable adult database is in the
process of being established. The information held includes the child’s name and date of
birth, parents’/carers’ names and dates of birth, address and contact details, the type of ASD
diagnosis and other medical conditions, information about the child’s communication,
developmental skills and behaviour. The register also asks for information on the school the
child attends (if applicable) and on family members, such as siblings’ names and dates of
birth, and other family members with a diagnosis of ASD.
The ASD-UK website (http://www.asd-uk.com/research/) lists nine completed projects using
this data source but none relate to incidence or prevalence (most probably because of the
voluntary nature of the database).
Autism bio-collections
A bio-collection is a large set of biologically characterised samples, such as blood or tissue
collected from a group of individuals who typically have a specific medical condition.
Biocollections are useful as a dedicated resource to generate clinical and scientific data for
the analysis of medical conditions on a large scale, as well as to create functional disease
models to explore the biology of clinical conditions.38 Large-scale bio-collections and
associated comprehensive data that can aid the interrogation of the relationship between the
genotype and phenotype effects at the individual and group levels can address the issue of
heterogeneity. Bio-collections have been shown as valuable resources and have enabled
large-scale studies on ASD. The recent genetic studies have begun to reveal de novo
mutations on major cellular pathways. Examples of international autism bio-collections
include Autism Genetic Resource Exchange (AGRE), Simons Simplex Collection (SSC),
Danish Newborn Screening (NBS), Biobank Autism Inpatient Collection (AIC), and Autism
Tissue Programme (ATP)/ Autism BrainNet.
38 Lochmüller H, Schneiderat P. (2010) Biobanking in rare disorders. Adv Exp Med Biol. 686:105–13.
Estimating Prevalence of Autism Spectrum Disorders (ASD) in the Irish Population
—— 30
5.0 International studies of the prevalence of
autism
The first studies of the prevalence of autism were published in the 1960s and 1970s, when
autism was thought to be a very severe condition, usually accompanied by intellectual
disability. These studies reported the prevalence to be approximately four to five cases per
10,000 children.39 Appendix C includes a list of studies from around the world which have
been conducted across five decades (1966-2016) to estimate the prevalence of ASDs. It is
clear from the information that there has been a marked increase in the reported rates of
ASD since the early 1990s. Furthermore, this paper has provided details of survey findings
published in more recent times across the world, and their current estimates of prevalence.
This includes:
• The most recent findings of the CDC ADDM Network, published in April 2018,
estimate a prevalence rate of ASD of one in 59 of children aged 8 (1.68%) for the
surveillance year 2014. The findings from the ADDM Network in 2016 (for
surveillance year 2012) had previously estimated that the percentage of children
identified with autism spectrum disorder (ASD) was about 1 in 68 or 1.5%.
• Previous prevalence estimates of ASD in Denmark were reported to be in the region
of 1% but the most recent findings which were published in November 2018 found an
autism prevalence of 1.65% in 10-year olds (for 2016).
• Cumulative prevalence of ASD has been reported as over 1% in Finland
• Recent updates of the registry data in Norway indicate that the cumulative incidence
is estimated between 1.0% and 1.2% from age 12 years and higher.
• Sweden’s prevalence of ASD in 2015 was 0.7%.
• Under the auspices of the ASDEU Study, the first population-based ASD prevalence
study conducted in Italy indicates a prevalence of ASD in children aged 7-9 years of
one in 87 (0.86%).
• Data from the UK Millennium Cohort Study, which is a sample of more than 19,000
children, representative of the UK population show that I.7 % of parents reported that
children aged 6-8 had been identified as having an Autism Spectrum Disorder.
• The estimated prevalence of autism within the school aged population in Northern
Ireland is 2.9% in 2017/18.
39 Gillberg C, Wing L. (1999). Autism: not an extremely rare disorder. Acta Psychiatr Scand. 99:399–406.
Estimating Prevalence of Autism Spectrum Disorders (ASD) in the Irish Population
—— 31
In addition to those studies previously described, the National Autism Spectrum Disorder
Surveillance System (NASS) in Canada, which is a federally funded initiative set up to
estimate and monitor the number of individuals with ASD, have recently reported their
findings from 201540, focusing initially on those aged 5-17 years from six provinces and one
territory. They reported that the combined prevalence of ASD is 1 in 66. In order to compare
these results with the recently published CDC ADDM Network findings for 8 year olds in the
United States, the Canadian authors analysed their prevalence estimates at 8 years of age
and reported that this was slightly lower that the rate in the US, at 1 in 63.
In July 2018, Autism Spectrum Australia (ASPECT)41 revised its autism prevalence rates
upwards from 1 in 100 to an estimated 1 in 70 to reflect recent changes in diagnostic criteria
and new international research. They noted that the increase does not necessarily mean that
autism is on the rise, but that increased awareness and more accurate diagnosis is at least
partially important in explaining the rise.
To examine the hypothesis of a secular increase in the prevalence of autism, it is important
to note that prevalence estimates will be inflated when case definition is broadened and case
ascertainment is improved. Time trends in prevalence can, therefore, only be gauged in
investigations that hold these parameters under strict control over time. These
methodological requirements must be borne in mind while reviewing the evidence for a
secular increase in the prevalence of ASDs. The discussion in the following section is
adapted from an article by Fombonne and colleagues in 200942, where they reviewed and
discussed the various methodologies, surveys and prevalence figures reported.
Study descriptions
Studies have been conducted in many countries and over half of the results have been
published since 2000. Most study populations are urban based. The age range of the
population included in the studies range from birth to early adult life but most surveys have
included school-age samples with an overall median age of eight years. There is a large
variation in the size of the population surveyed. Studies with small sample sizes tended to
yield higher prevalence rates than studies with larger sample sizes.43
40 Ofner et al. (2018) Autism Spectrum Disorder among children and youth in Canada 2018- A report of the National Autism
Spectrum Disorder Surveillance System, Public Health Agency of Canada
41 Available at http://autismspectrum.org.au) 42 Fombonne E, Quirke S & Hagen A (2009) Prevalence and interpretation of recent trends in rates of pervasive developmental
disorders, McGill J Med, 12(2): 73
43 Fombonne, E. (2005) Epidemiology of autistic disorder and other pervasive developmental disorders. J Clin Psychiatry 66:3-8.
Estimating Prevalence of Autism Spectrum Disorders (ASD) in the Irish Population
—— 32
Study designs
Some studies have relied on existing administrative databases44 or on national registers45 for
case identification. Most investigations of ASD have relied on a two-stage or multistage
approach to identify cases in underlying populations. The first screening stage of these
studies often consisted of sending letters or brief screening scales requesting school and
health professionals to identify possible cases of autism. Each investigation varied in several
key aspects of this screening stage. First, the coverage of the population varied enormously
from one study to another. In addition, the surveyed areas varied in terms of service
development as a function of the specific educational or health care systems of each country
and of the year of investigation. Second, the type of information sent out to professionals
invited to identify children varied from simple letters including a few clinical descriptors of
autism-related symptoms or diagnostic checklists rephrased in nontechnical terms, to more
systematic screening based on questionnaires or rating scales of known reliability and
validity. Third, participation rates in the first screening stages were variable although refusal
rates tended to be very low.
Few studies provided an estimate of the reliability of the screening instrument. The sensitivity
of the screening methodology is also difficult to gauge in autism surveys, as the proportion of
false negatives was usually not estimated. Prevalence estimates must, therefore, be seen as
underestimates of “true” prevalence proportions.
Participation rates in second stage assessments were also generally high. The source of
information used to determine a case usually involved a combination of informants and data
sources, with a direct assessment of the person with autism in about half of the studies.
However, surveys of large populations46 did not include a direct diagnostic assessment of
subjects. Nevertheless, the methods developed by the Centre for Disease Controls for
recent large surveys, including the ADDM Network, rely on a multisource, multi-informant
screening of the population, abstraction of key developmental data, and review by panels of
expert clinicians who apply best-estimate procedures of known reliability and validity.
The assessments were conducted with various diagnostic instruments, ranging from a
classical clinical examination to the use of a variety of standardized measures that included,
in the most recent studies, gold standard diagnostic tools such as the Autism Diagnostic
Interview-Revised (ADI-R) or the Autism Diagnostic Observational Schedule (ADOS). The
44 Croen, L. A., et al. (2002) The changing prevalence of autism in California. J Autism Dev Disord 32:307-215; Gurney, J.G., et
al. (2003) Analysis of prevalence trends of autism spectrum disorder in Minnesota. Arch Pediatr Adolesc Med 157:622-627;
Fombonne E, et al. (2006) Pervasive developmental disorders in Montreal, Quebec, Canada: prevalence and links with
immunizations. Pediatrics 118: e139-e150. 45 Madsen, K. M., et al. (2002) A Population-based study of measles, mumps, and rubella vaccination and autism. N Engl J Med
347:1477-1482. 46 Autism and Developmental Disabilities Monitoring Network Surveillance Year 2000 Principal Investigators; Centre for Disease
Control and Prevention 2007 Prevalence of autism spectrum disorders – autism and developmental disabilities monitoring
networks, 6 sites, United States, 2000. MMWR Surveill Summ 56:1-11; Autism and Developmental Disabilities Monitoring
Network Surveillance Year 2002 Principal Investigators; Centre for Disease Control and Prevention 2007 Prevalence of autism
spectrum disorders – autism and developmental disabilities monitoring network, 14 sites, United States, 2002. MMWR Surveill
Summ 56:12-28.
Estimating Prevalence of Autism Spectrum Disorders (ASD) in the Irish Population
—— 33
precise diagnostic criteria retained to define a case varied according to the study and, to a
large extent, reflected historical changes in classification systems. Thus, Kanner's criteria,
Lotter's, and Rutter's definitions were used in surveys conducted before 1980, whereas
DSM-based definitions took over thereafter as well as ICD-10 since 1990. As described
earlier, Kielinen et al. (2000)47 have shown that a 2- to 3-fold variation in prevalence of
autism can result from applying different diagnostic criteria to the same survey data.
In a recent publication from China, where authors conducted a meta-analysis of the pooled
prevalence of ASD in the general population in China (with mean age from 1.6-8 years), the
pooled prevalence of ASD was 39.23 per 10,000, lower than reported by all other countries
to date48. However, it is mooted that this lower estimate might be explained, in part, by the
use of different screening tools. The most common screening tool used in China is the
CABS, but this is rarely, if ever, used in Western studies (where the ADOS or ADI-R are
widely used).
Referral statistics
Increasing numbers of children referred to specialist services or known to special education
registers have been taken as evidence for an increased incidence of autism spectrum
disorders. However, trends over time in referred samples are confounded by many factors
such as referral patterns, availability of services, heightened public awareness, decreasing
age at diagnosis, and changes over time in diagnostic concepts and practices, to name only
a few.
Strong evidence of “diagnostic switching” was produced in California49 and in all US states,50
indicating that a relatively high proportion of children previously diagnosed as having
intellectual disability are now identified as having an ASD diagnosis. Decreased age at
diagnosis has also been shown to contribute to the rising numbers of children diagnosed
with ASD.51 In the United Kingdom, Jick et al. (2003)52 have shown that the incidence of
specific developmental disorders (including language disorders) decreased by about the
same amount that the incidence of diagnoses of autism increased in boys born from 1990 to
1997. A more recent UK study53 has shown that up to 66% of adults previously diagnosed
with developmental language disorders would meet diagnostic criteria for a broad definition
47 Kielinen, M. et al. (2000) Autism in Northern Finland. Eur Child Adolesc Psychiatry 9:162-167. 48 Fei Wang et al (2018) The Prevalence of Autism Spectrum Disorders in China: a comprehensive meta-analysis. Int J Biol Sci, 14
(7): 717-725.
49 Eagle, R.S. (2004) Commentary: Further commentary on the debate regarding increase in autism in California. J Autism Dev
Disord 34:87-88. 50 Shattuck, P.T. (2006) Diagnostic substitution and changing autism prevalence. Pediatrics 117:1438-1439.
51 Wazana, A., et al. (2007) The autism epidemic: fact or artefact? J Am Acad Child Adolesc Psychiatry 46:721-730 52 Jick, H., et al. (2003) Epidemiology and possible causes of autism: changes in risk of autism in the UK for birth cohorts
19901998. Pharmacotherapy 23:1524-1530. 53 Bishop, D.V., et al. (2008) Autism and diagnostic substitution: evidence from a study of adults with a history of developmental
language disorder. Dev Med Child Neurol 50:341-345.
Estimating Prevalence of Autism Spectrum Disorders (ASD) in the Irish Population
—— 34
of ASD. Overall, evidence from these referral statistics is very weak and proper
epidemiologic studies are needed to assess secular changes in the incidence of a disorder.
Several analyses of special educational disability in the United States54 showed increased
numbers of ASD children in schools, but the increase was not specific to autism. These
analyses also showed a marked period effect that identified the early 1990s as the period
where the prevalence estimates started to go up in all ages and birth cohorts, coinciding
closely with the inclusion of ASDs in the federal Individual with Disabilities Educational Act
(IDEA) funding and reporting mechanism in the United States.
International collaboration
The iCARE partners published a comparative prevalence paper in 2015; this used a
population-based cohort including all live-born children in Denmark, Finland, Sweden and
Western Australia, from January 1, 1990 through December 31, 2007, and followed through
December 31, 2011.55 The main outcome measure was age-specific prevalence of
diagnoses reported to population-based registry systems in each country. The geographical
comparison was enhanced by harmonization of the study period and data prior to analysis
(including diagnostic codes used to define the conditions) and application of a uniform
statistical analytic approach across the multiple datasets. The authors observed that the
cumulative prevalence of ASD in the oldest cohorts was well over 1% in Finland and
Sweden, and over 1.5% in Denmark, with little evidence for a plateau in the prevalence
curves even in the oldest cohorts. The proportion of childhood autism observed in Denmark,
Sweden and Finland was comparable to what was previously reported (30%). Western
Australia displayed a higher proportion of childhood autism; over 80% of the ASD cases from
Australia were diagnosed with childhood autism. This pattern may relate to the availability of
funding for therapy services for younger children (less than 5 years) with ASD in Western
Australia.
A comparison of autism prevalence trends in Denmark and Western Australia was also
reported as part of this collaboration.56 This study compared prevalence statistics for two
distinct geographical regions, Denmark and Western Australia, both of which have had
population-based registers and consistent classification systems operating over the past
decade. Overall ASD prevalence rates were higher in Denmark (68.5 per 10,000 children)
compared with Western Australia (51.0 per 10,000 children), while the diagnosis of childhood
autism was more prevalent in Western Australia (39.3 per 10,000 children) compared with
Denmark (21.8 per 10,000 children). The authors concluded that these differences are
54 Gurney, J.G., et al. (2003) Analysis of prevalence trends of autism spectrum disorder in Minnesota. Arch Pediatr Adolesc Med
157:622-627; Shattuck, P.T. (2006) Diagnostic substitution and changing autism prevalence. Pediatrics 117:1438-1439. 55 Atladottir, et al. (2015) The increasing prevalence of reported diagnoses of childhood psychiatric disorders: a descriptive
multinational comparison. Eur Child Adolesc Psychiatry. 24: 173-183. 56 Parner et al. (2011) A comparison of autism prevalence trends in Denmark and Western Australia. Autism Dev. Disord. Dec.
41(12): 1601-8.
Estimating Prevalence of Autism Spectrum Disorders (ASD) in the Irish Population
—— 35
probably caused by local phenomena affecting case ascertainment but influence from
biological or geographical factors may exist.
Another study which uses pooled data from many studies attempts to develop global and
regional prevalence models and estimate the global burden of ASDs.57 A systematic review
was conducted for epidemiological data (prevalence, incidence, remission and mortality risk)
of autistic disorder and other ASDs. Data were pooled using a Bayesian meta-regression
approach while adjusting for between-study variance to derive prevalence models. The study
found that in 2010 there were an estimated 52 million cases of ASDs, equating to a
prevalence of 7.6 per 1000 or one in 132 persons. After accounting for methodological
variations, there was no clear evidence of a change in prevalence for autistic disorder or
other ASDs between 1990 and 2010. Worldwide, there was little regional variation in the
prevalence of ASDs. Globally, autistic disorders accounted for more than 58 DALYs
(disability-adjusted life years) per 100 000 population and other ASDs accounted for 53
DALYs per 100 000.
Comparison of cross-sectional epidemiologic studies
As discussed earlier, epidemiologic studies of ASD each possess unique design features
which could account almost entirely for between-studies variations in prevalence proportions.
The time trends in the prevalence of autism are, therefore, difficult to gauge from published
prevalence estimates. The significant correlation between prevalence of ASD and year of
publication could merely reflect increased efficiency over time in case identification methods
used in surveys as well as changes in diagnostic concepts and practices.58 In studies using
capture-recapture methods, it is apparent that up to one third of prevalent cases may be
missed by an ascertainment source, even in recently conducted studies.59
The most convincing evidence that method factors could account for most of the variability in
published prevalence estimates comes from a direct comparison of eight recent surveys
conducted in the United Kingdom and the United States.60 In each country, four surveys were
conducted around the same year and with similar age groups. As there is no reason to
expect huge between-area differences in prevalence, prevalence estimates should,
therefore, be comparable within each country. However, there was a 6-fold variation in
prevalence for UK surveys and a 14-fold variation in US figures. In each set of studies, high
57 A.J. Baxter, et al.(2015) The Epidemiology and Global Burden of Autism Spectrum Disorders. Psychological Medicine. Feb.
45(3): 601-613. 58 Kielinen, M. et al. (2000) Autism in Northern Finland. Eur Child Adolesc Psychiatry 9:162-167; Webb, E.V., et al. (1997) The
changing prevalence of autistic disorder in a Welsh health district. Dev Med Child Neurol. 39:150-152; Magnusson, P., et al.
(2001) Prevalence of autism in Iceland. J Autism Dev Disord 31:153-163; Shattuck, P.T. (2006) Diagnostic substitution and
changing autism prevalence. Pediatrics 117:1438-1439; Bishop, D.V., et al. (2008) Autism and diagnostic substitution: evidence
from a study of adults with a history of developmental language disorder. Dev Med Child Neurol 50:341-345. 59 Harrison, M.J., et al. (2006) Prevalence of autistics spectrum disorders in Lothian, Scotland: an estimate using the
“capturerecapture” technique. Arch Dis Child 91:16-19.
60 Fombonne, E. (2005) Epidemiology of autistic disorder and other pervasive developmental disorders. J Clin Psychiatry 66:3-8.
Estimating Prevalence of Autism Spectrum Disorders (ASD) in the Irish Population
—— 36
estimates derived from surveys where intensive population-based screening techniques
were used, whereas lower prevalence proportions were obtained from studies relying on
passive administrative methods for case finding. Because no passage of time was involved,
the magnitude of these gradients in prevalence can only be attributed to differences in case
identification methods across surveys.
Even more convincing evidence comes from the large survey by the CDC on 408,000 US
children aged 8 and born in 199461 where an average prevalence of 66/10,000 was reported
for 14 US states. However, there was more than a 3-fold variation in state-specific
prevalence proportions that ranged from a low 33/10,000 for Alabama to a high of
106/10,000 in New Jersey. These substantial differences reflected ascertainment variability
across sites in a study that was otherwise performed with the same methods and at the
same time, and in children born in the same year. Thus, no inference on trends in the
incidence of ASDs can be derived from a simple comparison of prevalence estimates over
time, since studies conducted at different periods are likely to differ even more with respect
to their methodology.
Repeat studies in defined geographical areas
Repeated studies, using the same methodology and conducted in the same geographical
area at different points in time, can potentially yield useful information on time trends
provided that methods are kept relatively constant. The Göteborg studies62 provided three
prevalence estimates, which increased over a short period of time. However, different age
groups were included in each survey. Other factors such as improved detection among the
intellectually disabled, cases born to immigrant parents, change in local services, and a
progressive broadening of the definition of autism over time were hypothesized by the
authors to account for the trend.63 Similarly, studies conducted in Japan at different points in
time in Toyota64 and Yokohama65 showed rises in prevalence that their authors interpreted as
reflecting the effect of both improved population screening of pre-schoolers and of a
broadening of diagnostic concepts and criteria.
61 Ibid. [Note, the latest figures from the CDC (2014) estimate that 14.7 per 1,000 8 year olds have been identified with ASD.] 62 Gillberg, C. (1984) Infantile autism and other childhood psychoses in a Swedish urban region. Epidemiological aspects. J Child Psychol Psychiatry 25:35-43; Gillberg, C., et al. (1991) Is autism more common now than ten years ago? Br J Psychiatry 158:403409. 63 Gillberg (1991). 64 Kawamura Y., et al. (2008) Reevaluating the incidence of pervasive developmental disorders: impact of elevated rates of detection through implementation of an integrated system of screening in Toyota, Japan. Psychiatry Clin Neurosci 62:152-159. 65 Honda, H., et al. (1996) Cumulative incidence and prevalence of childhood autism in children in Japan. Br J Psychiatry
169:228-235; Honda, H., et al. (2005) No effect of MMR withdrawal on the incidence of autism: a total population study. J Child
Psychol Psychiatry 46:572-579.
Estimating Prevalence of Autism Spectrum Disorders (ASD) in the Irish Population
—— 37
Successive birth cohorts
In large surveys encompassing a wide age range, increasing prevalence among most recent
birth cohorts could be interpreted as indicating a secular increase in the incidence of the
disorder, provided that alternative explanations can confidently be ruled out. This analysis
was used in two large French surveys.66 The surveys included birth cohorts from 1972 to
1985 (735,000 children, 389 of whom had autism) and, pooling the data of both surveys,
age-specific prevalence showed no upward trend.
Two separate surveys of children born 1992–1995 and 1996–1998 in Staffordshire in the
United Kingdom67 were performed with rigorously identical methods for case definition and
case identification. The prevalence for combined ASDs was comparable and not statistically
different in the two surveys,68 suggesting no upward trend in overall prevalence of ASDs
during the studies time interval.
Data from the UK Millennium Cohort Study, which is a sample of more than 19,000 children,
representative of the UK population show that I.7 % of parents reported that children aged
68 had been identified as having an Autism Spectrum Disorder.
Incidence studies
Incidence can be difficult to measure with rarer chronic diseases such as autism. In autism
epidemiology, point or period prevalence is more useful than incidence, as the disorder
starts long before it is diagnosed, and the gap between initiation and diagnosis is influenced
by many factors unrelated to risk. Subsequently, on reviewing the literature on the subject
we have concentrated on the prevalence literature.
However, the few incidence studies which have been conducted showed an upward trend in
incidence over short periods of time. In one of the largest study of 1,410 subjects, there was
a 10-fold increase in the rate of first recorded diagnoses of Pervasive Developmental
Disorders (DSM IV) in United Kingdom general practice medical records from 1988–1992 to
2000– 2001.69 The increase was more marked for PDDs other than autism, but the increase
in autism was also obvious. However, none of these studies’ investigations could determine
66 Fombonne E., et al. (1992) Prevalence of infantile autism in four French regions. Soc Psychiatry Psychiatr Epidemiol
27:203210; Fombonne, E., et al. (1997) Autism and associated medical disorders in a French epidemiological survey. J Am Acad
Child Adolesc Psychiatry 36:1561-1569. 67 Chakrabarti, S., et al. (2001) Pervasive developmental disorders in preschool children. JAMA 285:3093-3099. 68 Chakrabarti, S., et al. (2005) Pervasive developmental disorders in preschool children: confirmation of high prevalence. Am J
Psychiatry 162:1133-1141.
69 Smeeth, L., et al. (2004) MMR vaccination and pervasive developmental disorders: a case-control study. Lancet 364:963-969. 71 Powell, J.E., et al. (2000) Changes in the incidence of childhood autism and other autistic spectrum disorders in preschool children from two areas of the West Midlands, UK. Dev Med Child Neurol 42:624-628; Barbaresi, W.J., et al. (2005) The incidence of autism in Olmsted Country, Minnesota 1976-1997: results from a population-based study. Arch Pediatr Adolesc Med 159:3744;
Honda, H., et al. (2005); Wong, V.C., et al. (2008) Epidemiological study of autism spectrum disorder in China. J Child Neurol 23:67-72.
Estimating Prevalence of Autism Spectrum Disorders (ASD) in the Irish Population
—— 38
the impact of changes over time in diagnostic criteria, improved awareness and service
availability on the upward trend. The same conclusions apply to other incidence studies.71
In a population study using the UK General Practice Research Database (GPRD), Taylor et
al. (2013) estimated the annual autism prevalence rates for children aged 8 years in
20042010.70 Annual prevalence rates for each year were steady at approximately 3.8/1000
boys and 0.8/1000 girls. Annual incidence rates each year were also steady at about
1.2/1000 boys and 0.2/1000 girls. The authors concluded that following a reported fivefold
increase in the annual incidence rates of autism during the 1990s in the UK, the incidence
and prevalence rates in 8-year-old children reached a plateau in the early 2000s and
remained steady through 2010.
Current evidence does not strongly support the hypothesis of a secular increase in the
incidence of autism but power to detect time trends is seriously limited in existing datasets.
Although it is clear that prevalence estimates have gone up over time, this increase most
likely represents changes in the concepts, definitions, service availability, and awareness of
autistic-spectrum disorders in both the lay and professional public. To assess whether the
incidence has increased, method factors that account for an important proportion of the
variability in prevalence must be tightly controlled. The possibility that a true change in the
underlying incidence has contributed to higher prevalence figures remains, however, to be
adequately tested.
Prevalence of autism in adults
Although early ASD research focused primarily on children, there is increasing recognition
that ASD is a lifelong neurodevelopmental disorder. A community study carried out in 2011
by Brugha et al. found that autism spectrum disorder affects approximately 1% of the adult
English household population.71 There was no evidence of a statistically significant reduction
in prevalence of ASDs as a function of age. There are no similar studies in the literature to
compare the findings, but the authors conclude that the study demonstrates for the first time
in the general population that the rate of ASD is not significantly associated with age,
suggesting that the causes of autism are temporally constant. This supports the argument
that the reported increase in prevalence rate of autism internationally is more likely to be due
to increased recognition of ASD and subsequently an increase in the rate of diagnosis.
In addition, an interesting paper has recently been published by Hirvikoski and colleagues
(2016) from Sweden.72 This paper demonstrates increased mortality from almost all causes
in persons diagnosed with ASD compared to the general population. This leads the authors
70 Taylor, B. et al. (2013) Prevalence and incidence rates of autism in the UK: time trend from 2004-2010 in children aged 8 years.
BMJ Open. Oct 16;3(10). 71 Brugha, et al. (2011) Epidemiology of Autism Spectrum Disorders in Adults in the Community in England. ARCH GEN
PSYCHIATRY. 68(5), May.
72 Hirvikoski, et al. (2016) Premature mortality in autism spectrum disorder. Br J Psychiatry. Mar;208(3):232-8.

Estimating Prevalence of Autism Spectrum Disorders (ASD) in the Irish Population
—— 39
to conclude that persons with ASD may have increased biological vulnerability, as well as
insufficient awareness, diagnosis and treatment of comorbid diseases within the health care
system.
Estimating Prevalence of Autism Spectrum Disorders (ASD) in the Irish Population
—— 40
6.0 Discussion The previous sections have highlighted the challenges associated with estimating the
prevalence of ASD in a population. Studies conducted from many countries have
demonstrated the reported increase in prevalence of ASD diagnosis over the past two
decades.
However, direct comparisons between countries and studies is limited by the variations in
populations and age groups studied, in screening and diagnostic tools employed which have
not been validated, and the lack of follow-up in many studies which is necessary to increase
positive predictive value.
6.1 Possible reasons for a reported increase in
prevalence of autism
In many countries, a diagnosis of autism gives children greater access to specialised
services and special education services than do diagnoses of other conditions. This benefit
makes clinicians more likely to diagnose a child with autism, even those who are on the
borderline of the clinical criteria. In 1991, the U.S. Department of Education ruled that a
diagnosis of autism qualifies a child for special education services. The change may have
encouraged families to get a diagnosis of autism for their child. The number of children who
have both a diagnosis of autism and intellectual disability has also risen steadily over the
years.
As described earlier in the report, access to resource teaching and a special needs assistant
in the Irish education system required a diagnosis. It is possible that this has also been a
factor in the increase in the reported prevalence in the Irish context.
Policy changes may have also played a role. In 2006, the American Academy of Paediatrics
recommended screening all children for autism during routine paediatrician visits at 18 and
24 months of age. This move may have led to diagnoses for children who would otherwise
have slipped under the radar.
6.2 Reported increase in prevalence rates in Ireland
It is clear that policy changes and associated legislation have in part contributed to the
reported increase in prevalence of ASD globally. A similar trend has occurred in Ireland.
Estimating Prevalence of Autism Spectrum Disorders (ASD) in the Irish Population
—— 41
Fitzgerald, et al.’s 1990-92 study found a rate of 4.9 per 10,000 persons in age range 6-25
years. This had risen to 7.7 per 10,000 in 2001 in the same group.73 A study in 2007 by
Perry, et al., using a different age cohort and methodology, found a prevalence value of 33.1
per 10,000, and more recently a study by DCU found a rate of 1.0% in 6-11-year olds.74
In Ireland there have been several commissioned reports over the past number of years
which have examined the issue of ASD. This has resulted in greater parental and
professional awareness.75 As highlighted throughout this paper, changes in reported ASD
prevalence over time may have several explanations: broadening diagnostic criteria and
differences in the methods used to study prevalence, e.g. sampling procedures, application
of statistical methods.
Despite these challenges it is important to agree a national prevalence rate in order to plan
services (social, educational, health) for this group of individuals. The Department of
Education has used a prevalence rate of 1.5% based on the number of children with a
diagnosis of ASD who are currently accessing special education services. This is a
pragmatic approach, and it is similar to international rates quoted in the literature. In
additional the most recent epidemiological study conducted in Ireland to estimate the
prevalence of ASD (Boilson et al.) has reported a similar rate. As discussed earlier, this
study uses a screening instrument which has been validated in the population used and is
part of a European wide project. This may provide a valid method to monitor ASD prevalence
rates in Ireland in the future.
There is currently no reliable method of estimating prevalence of Autism Spectrum Disorder
in Ireland. In this paper, we have used a combination of methods to arrive at a figure which
may be used for assessing need and planning appropriate services. However, it is important
that an accurate method of determining prevalence of ASDs is agreed, and that the
prevalence rate is kept under review.
6.3 Policy implications
An extremely wide range of individual differences is represented within the Autistic Spectrum
Disorder categorization, from individuals who also have a severe learning disability to those
with average and above average intelligence. All share the triad of difficulties in reciprocal
social interaction, communication, and a lack of flexible thinking. ASDs impact on all areas of
73 Fitzgerald, Michael, et al. (1997) Irish families under stress: Vol.6 Planning for the future of autistic persons: a prevalence and
psychosocial study in the Eastern Health Board area of Dublin. Eastern Health Board. 74 Perry, I.J. et al. (2007) 'Screening for autistic spectrum disorder at the 18-month developmental assessment: a populationbased
study'. Irish Medical Journal, 100 (8):565-567 75 The Current State of Autism Services in Laois/Offaly (LOFFA, 2015); National Review of Autism Services: Past, Present and Way Forward (HSE, 2012); Review of Services for Persons with Autistic Spectrum Disorder (ERHA, 2002); Keenan, et al. Meeting the Needs of Families Living with Children with Autism Spectrum Disorder (2007).
Estimating Prevalence of Autism Spectrum Disorders (ASD) in the Irish Population
—— 42
functioning and have significant implications throughout the lives of those affected across the
entire ability range.
It is crucial to accurately identify children so that they can access evidence-based early
interventions. However, there are also significant economic and social costs if children are
allocated services based on a diagnosis without consideration of their severity level or
specific needs.
Unmet need of adults with ASD requires to be documented in Ireland.
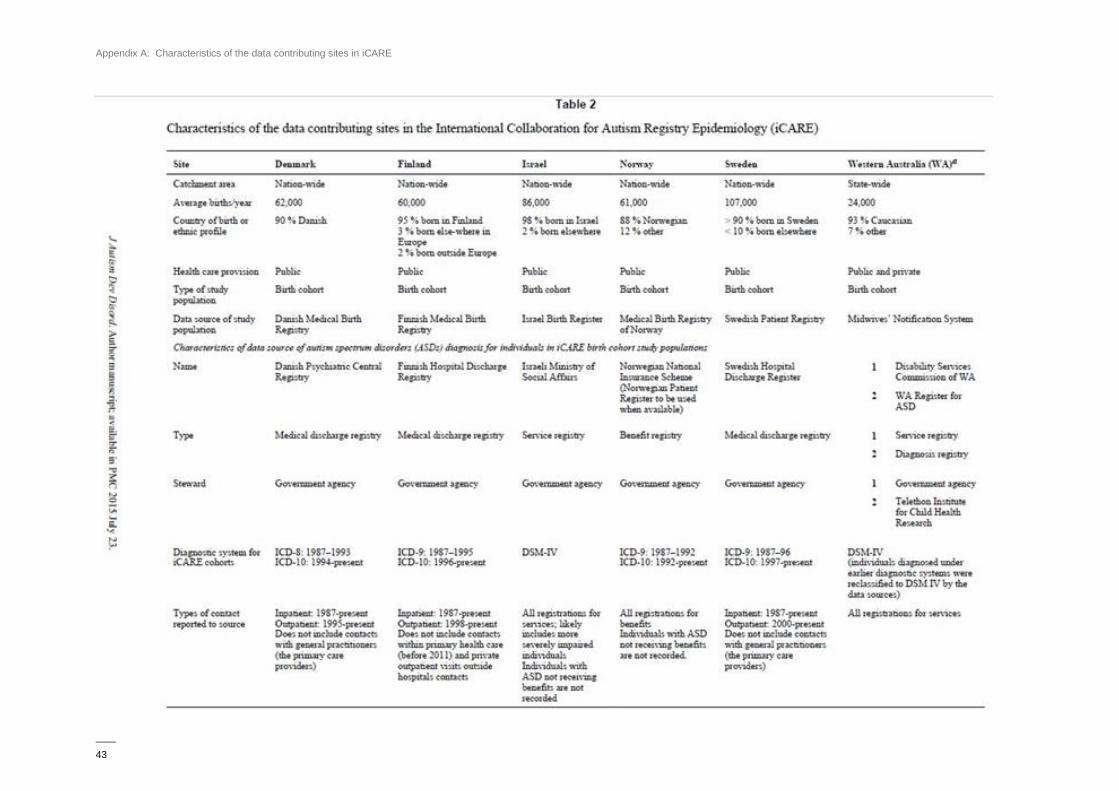
Appendix A: Characteristics of the data contributing sites in iCARE
—— 43

Appendix B: ASD-EU Consortium Associated Partners
—— 44
ASD-EU CONSORTIUM ASSOCIATED PARTNERS
Programme lead: Institute of Rare Diseases Research (IIER), Instituto
de Salud Carlos III (ISCIII), Spain
Medical University of Vienna, Austria Autism Europe, Belgium Ghent
University, Belgium
Bulgarian Association for Promotion of Education and Science,
Bulgaria
Aarhus University, Denmark
University of Oulu, Finland
University Toulouse 2 Jean Jaurès UT2J, France
The State Diagnostic and Counselling Centre, Iceland The IRCCS
Stella Maris Foundation, Italy
Instituto Nacional de Saúde Doutor Ricardo Jorge, Portugal University
of Warsaw, Poland
Dublin City University, Republic of Ireland
Victor Babes National Institute of Pathology, Romania
Fundación Canaria para el Avance de la Biomedicina y la
Biotecnología, Canary Islands, Spain
Fundación Española para la Cooperación Internacional, Salud y
Política Social, Spain
Universidad de Salamanca, Spain
London School of Economics and Political Science, United Kingdom
King’s College London, United Kingdom National Autistic Society,
United Kingdom
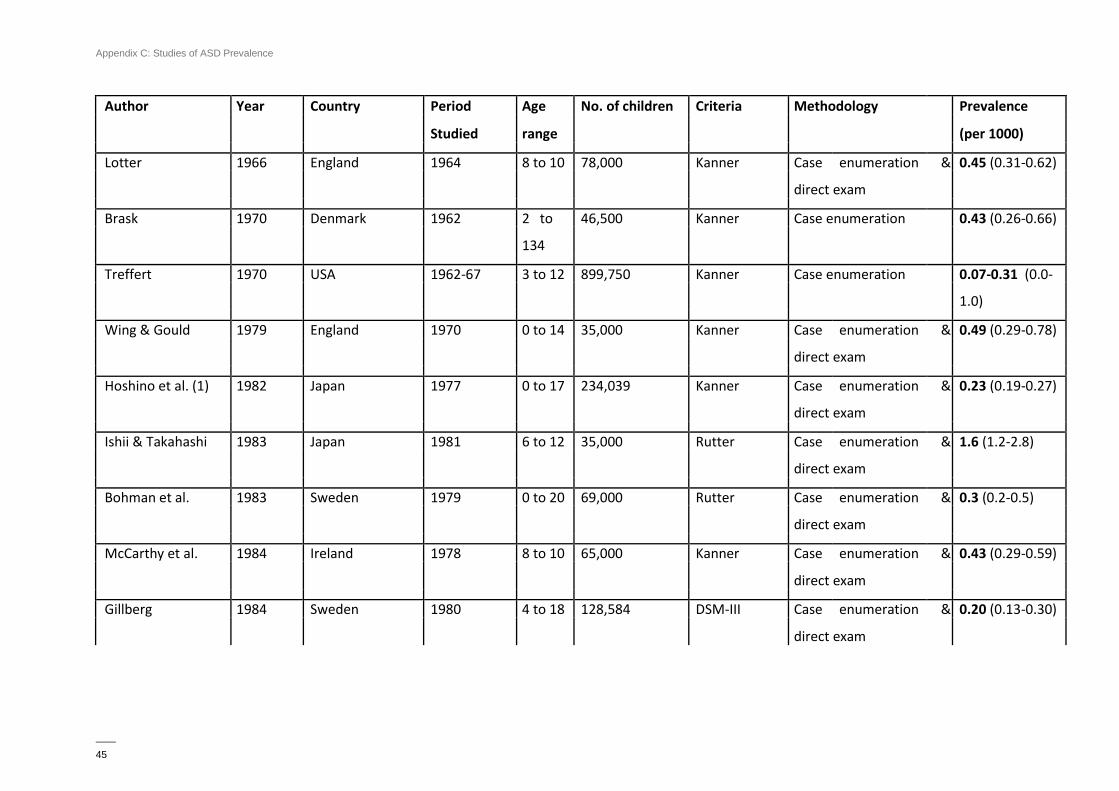
Appendix C: Studies of ASD Prevalence
—— 45
Author Year Country Period Age No. of children Criteria Methodology Prevalence
Studied range (per 1000)
Lotter 1966 England 1964 8 to 10 78,000 Kanner Case enumeration & 0.45 (0.31-0.62)
direct exam
Brask 1970 Denmark 1962 2 to 46,500 Kanner Case enumeration 0.43 (0.26-0.66)
134
Treffert 1970 USA 1962-67 3 to 12 899,750 Kanner Case enumeration 0.07-0.31 (0.0-
1.0)
Wing & Gould 1979 England 1970 0 to 14 35,000 Kanner Case enumeration & 0.49 (0.29-0.78)
direct exam
Hoshino et al. (1) 1982 Japan 1977 0 to 17 234,039 Kanner Case enumeration & 0.23 (0.19-0.27)
direct exam
Ishii & Takahashi 1983 Japan 1981 6 to 12 35,000 Rutter Case enumeration & 1.6 (1.2-2.8)
direct exam
Bohman et al. 1983 Sweden 1979 0 to 20 69,000 Rutter Case enumeration & 0.3 (0.2-0.5)
direct exam
McCarthy et al. 1984 Ireland 1978 8 to 10 65,000 Kanner Case enumeration & 0.43 (0.29-0.59)
direct exam
Gillberg 1984 Sweden 1980 4 to 18 128,584 DSM-III Case enumeration & 0.20 (0.13-0.30)
direct exam
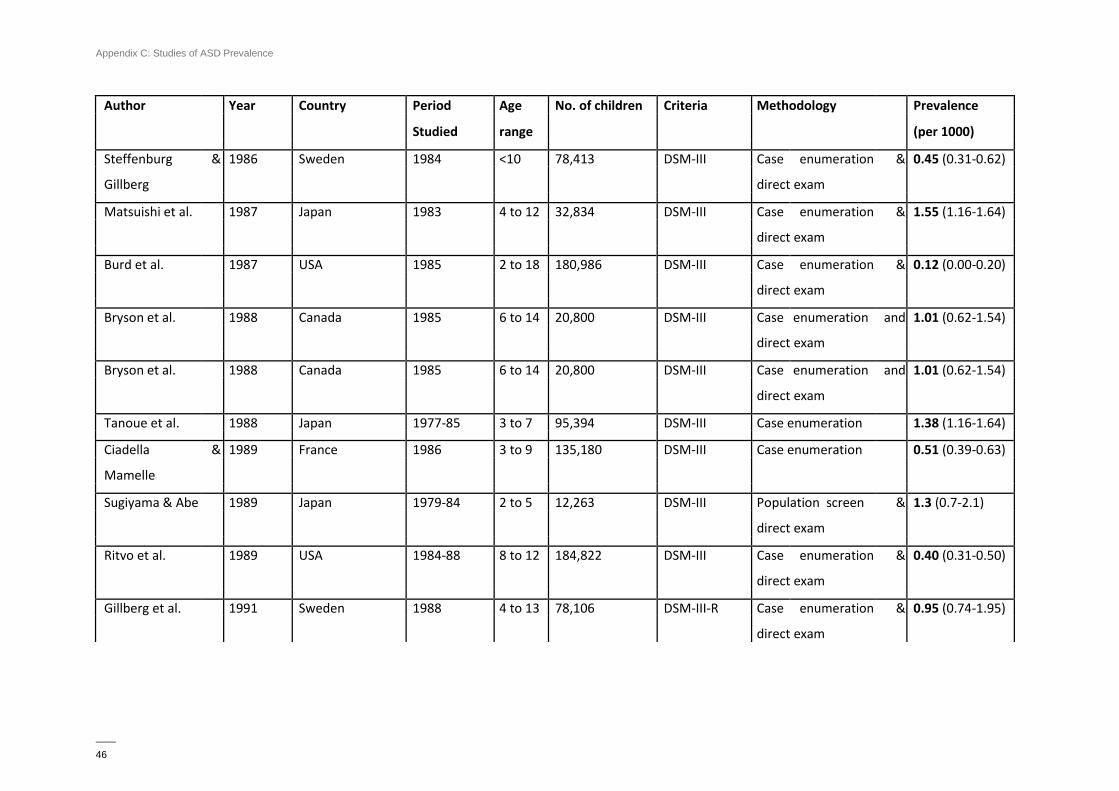
Appendix C: Studies of ASD Prevalence
—— 46
Author Year Country Period Age No. of children Criteria Methodology Prevalence
Studied range (per 1000)
Steffenburg & 1986 Sweden 1984 <10 78,413 DSM-III Case enumeration & 0.45 (0.31-0.62)
Gillberg direct exam
Matsuishi et al. 1987 Japan 1983 4 to 12 32,834 DSM-III Case enumeration & 1.55 (1.16-1.64)
direct exam
Burd et al. 1987 USA 1985 2 to 18 180,986 DSM-III Case enumeration & 0.12 (0.00-0.20)
direct exam
Bryson et al. 1988 Canada 1985 6 to 14 20,800 DSM-III Case enumeration and 1.01 (0.62-1.54)
direct exam
Bryson et al. 1988 Canada 1985 6 to 14 20,800 DSM-III Case enumeration and 1.01 (0.62-1.54)
direct exam
Tanoue et al. 1988 Japan 1977-85 3 to 7 95,394 DSM-III Case enumeration 1.38 (1.16-1.64)
Ciadella & 1989 France 1986 3 to 9 135,180 DSM-III Case enumeration 0.51 (0.39-0.63)
Mamelle
Sugiyama & Abe 1989 Japan 1979-84 2 to 5 12,263 DSM-III Population screen & 1.3 (0.7-2.1)
direct exam
Ritvo et al. 1989 USA 1984-88 8 to 12 184,822 DSM-III Case enumeration & 0.40 (0.31-0.50)
direct exam
Gillberg et al. 1991 Sweden 1988 4 to 13 78,106 DSM-III-R Case enumeration & 0.95 (0.74-1.95)
direct exam
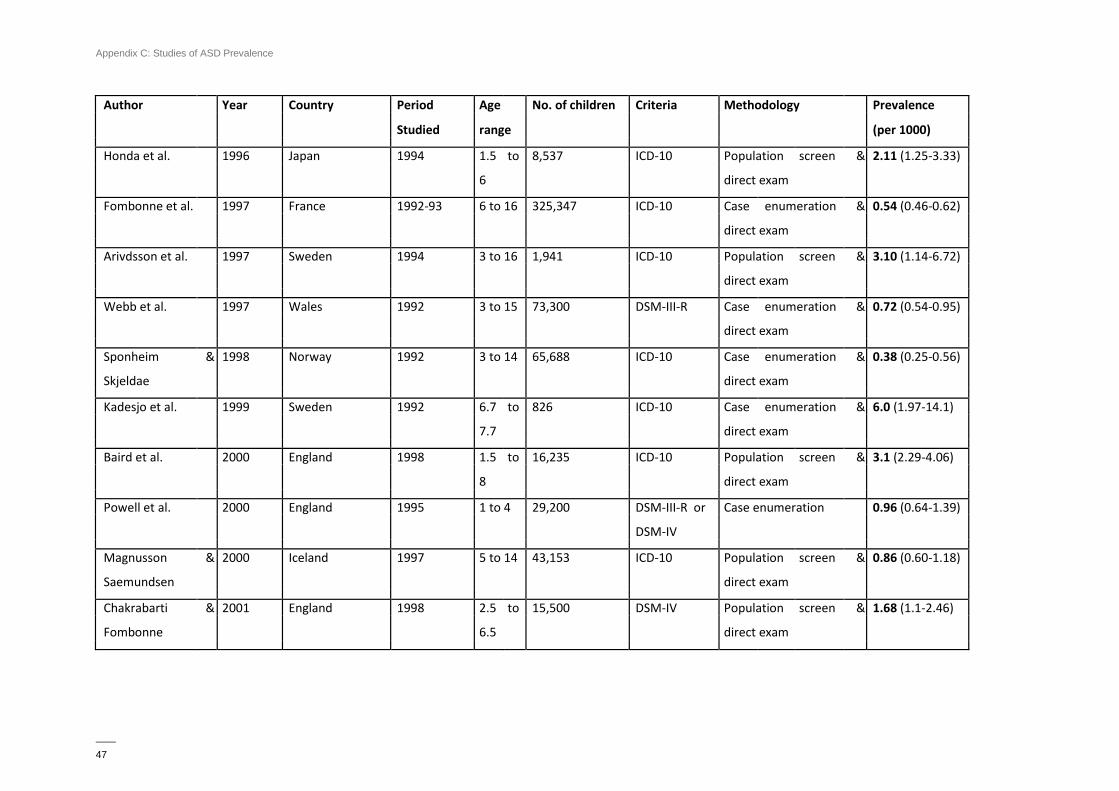
Appendix C: Studies of ASD Prevalence
—— 47
Author Year Country Period Age No. of children Criteria Methodology Prevalence
Studied range (per 1000)
Honda et al. 1996 Japan 1994 1.5 to 8,537 ICD-10 Population screen & 2.11 (1.25-3.33)
6 direct exam
Fombonne et al. 1997 France 1992-93 6 to 16 325,347 ICD-10 Case enumeration & 0.54 (0.46-0.62)
direct exam
Arivdsson et al. 1997 Sweden 1994 3 to 16 1,941 ICD-10 Population screen & 3.10 (1.14-6.72)
direct exam
Webb et al. 1997 Wales 1992 3 to 15 73,300 DSM-III-R Case enumeration & 0.72 (0.54-0.95)
direct exam
Sponheim & 1998 Norway 1992 3 to 14 65,688 ICD-10 Case enumeration & 0.38 (0.25-0.56)
Skjeldae direct exam
Kadesjo et al. 1999 Sweden 1992 6.7 to 826 ICD-10 Case enumeration & 6.0 (1.97-14.1)
7.7 direct exam
Baird et al. 2000 England 1998 1.5 to 16,235 ICD-10 Population screen & 3.1 (2.29-4.06)
8 direct exam
Powell et al. 2000 England 1995 1 to 4 29,200 DSM-III-R or Case enumeration 0.96 (0.64-1.39)
DSM-IV
Magnusson & 2000 Iceland 1997 5 to 14 43,153 ICD-10 Population screen & 0.86 (0.60-1.18)
Saemundsen direct exam
Chakrabarti & 2001 England 1998 2.5 to 15,500 DSM-IV Population screen & 1.68 (1.1-2.46)
Fombonne 6.5 direct exam
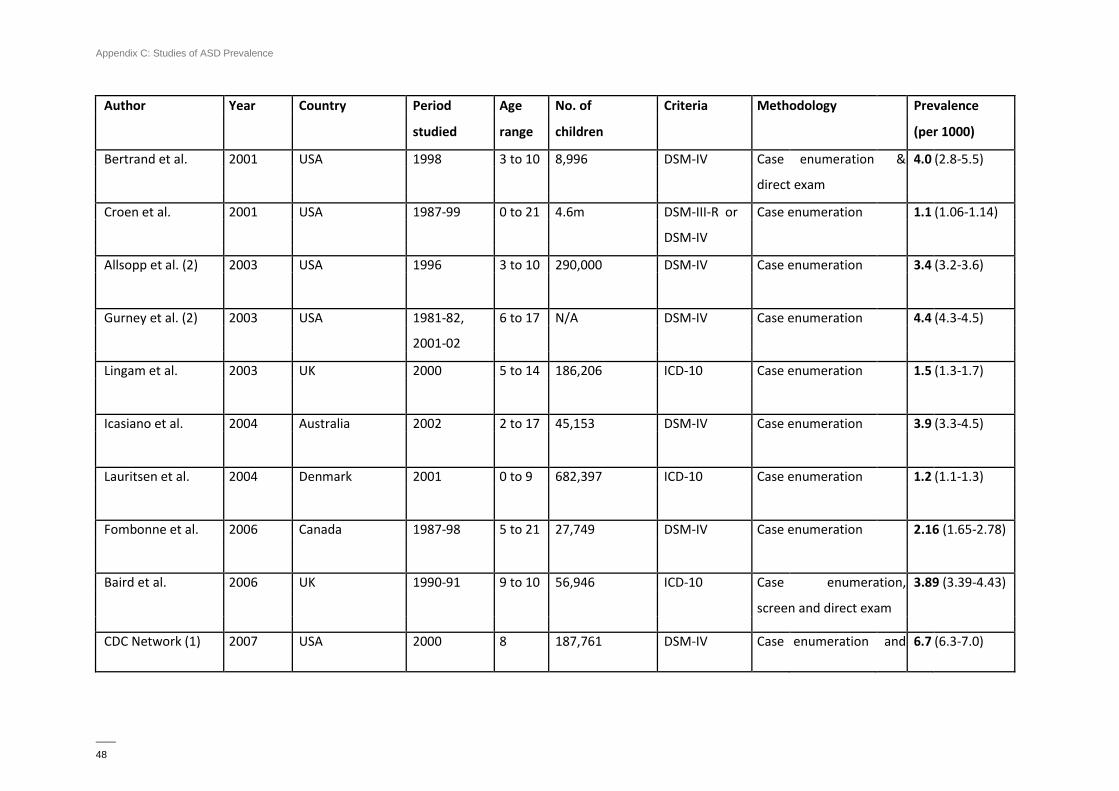
Appendix C: Studies of ASD Prevalence
—— 48
Author Year Country Period Age No. of Criteria Methodology Prevalence
studied range children (per 1000)
Bertrand et al. 2001 USA 1998 3 to 10 8,996 DSM-IV Case enumeration & 4.0 (2.8-5.5)
direct exam
Croen et al. 2001 USA 1987-99 0 to 21 4.6m DSM-III-R or Case enumeration 1.1 (1.06-1.14)
DSM-IV
Allsopp et al. (2) 2003 USA 1996 3 to 10 290,000 DSM-IV Case enumeration 3.4 (3.2-3.6)
Gurney et al. (2) 2003 USA 1981-82, 6 to 17 N/A DSM-IV Case enumeration 4.4 (4.3-4.5)
2001-02
Lingam et al. 2003 UK 2000 5 to 14 186,206 ICD-10 Case enumeration 1.5 (1.3-1.7)
Icasiano et al. 2004 Australia 2002 2 to 17 45,153 DSM-IV Case enumeration 3.9 (3.3-4.5)
Lauritsen et al. 2004 Denmark 2001 0 to 9 682,397 ICD-10 Case enumeration 1.2 (1.1-1.3)
Fombonne et al. 2006 Canada 1987-98 5 to 21 27,749 DSM-IV Case enumeration 2.16 (1.65-2.78)
Baird et al. 2006 UK 1990-91 9 to 10 56,946 ICD-10 Case enumeration, 3.89 (3.39-4.43)
screen and direct exam
CDC Network (1) 2007 USA 2000 8 187,761 DSM-IV Case enumeration and 6.7 (6.3-7.0)
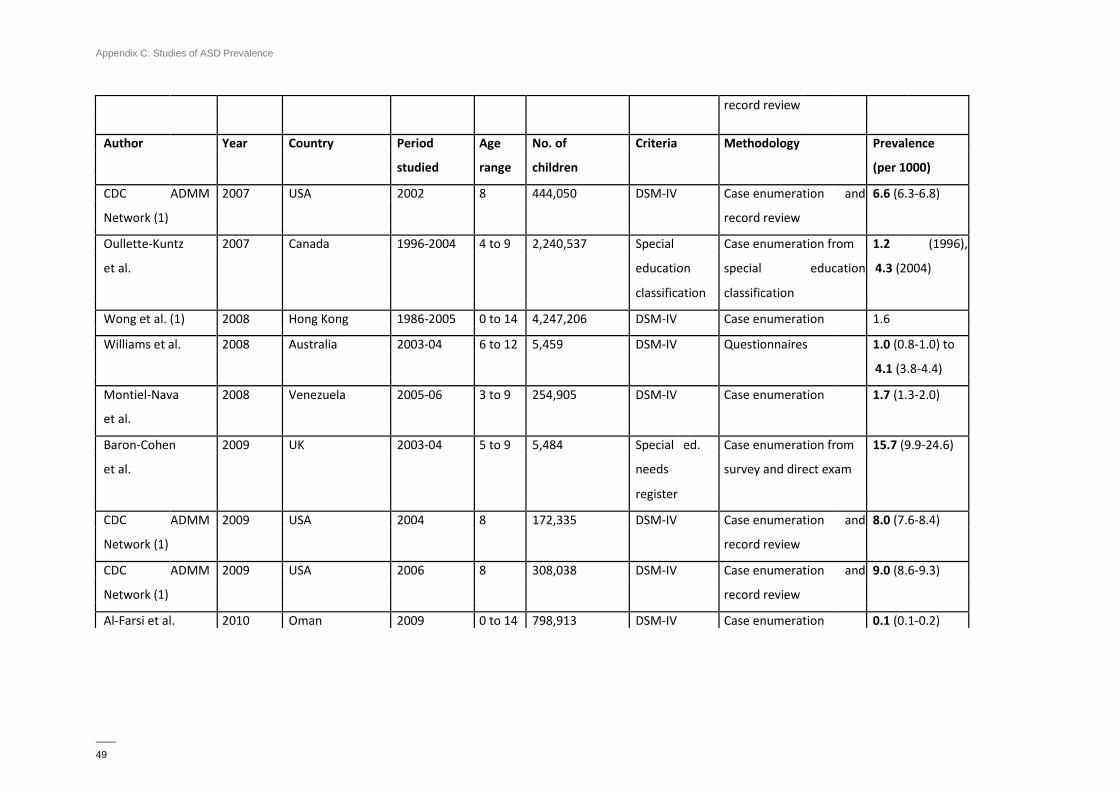
Appendix C: Studies of ASD Prevalence
—— 49
record review
Author Year Country Period Age No. of Criteria Methodology Prevalence
studied range children (per 1000)
CDC ADMM 2007 USA 2002 8 444,050 DSM-IV Case enumeration and 6.6 (6.3-6.8)
Network (1) record review
Oullette-Kuntz 2007 Canada 1996-2004 4 to 9 2,240,537 Special Case enumeration from 1.2 (1996),
et al. education special education 4.3 (2004)
classification classification
Wong et al. (1) 2008 Hong Kong 1986-2005 0 to 14 4,247,206 DSM-IV Case enumeration 1.6
Williams et al. 2008 Australia 2003-04 6 to 12 5,459 DSM-IV Questionnaires 1.0 (0.8-1.0) to
4.1 (3.8-4.4)
Montiel-Nava 2008 Venezuela 2005-06 3 to 9 254,905 DSM-IV Case enumeration 1.7 (1.3-2.0)
et al.
Baron-Cohen 2009 UK 2003-04 5 to 9 5,484 Special ed. Case enumeration from 15.7 (9.9-24.6)
et al. needs survey and direct exam
register
CDC ADMM 2009 USA 2004 8 172,335 DSM-IV Case enumeration and 8.0 (7.6-8.4)
Network (1) record review
CDC ADMM 2009 USA 2006 8 308,038 DSM-IV Case enumeration and 9.0 (8.6-9.3)
Network (1) record review
Al-Farsi et al. 2010 Oman 2009 0 to 14 798,913 DSM-IV Case enumeration 0.1 (0.1-0.2)
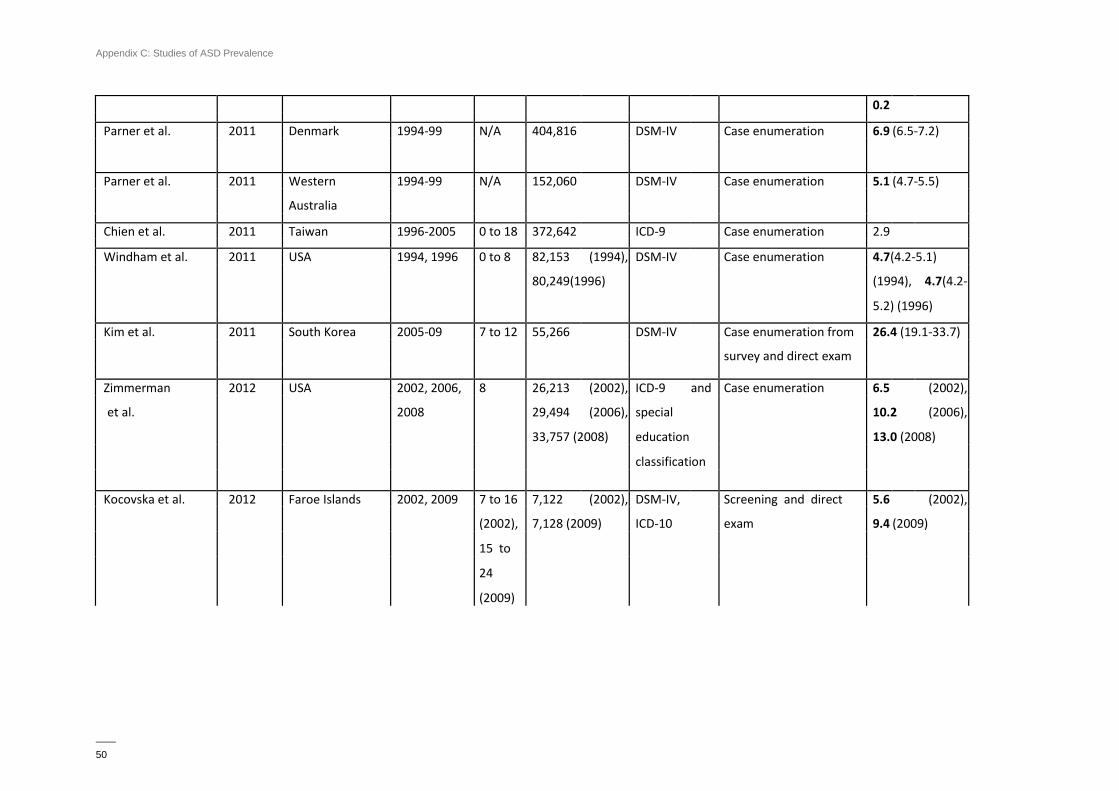
Appendix C: Studies of ASD Prevalence
—— 50
0.2
Parner et al. 2011 Denmark 1994-99 N/A 404,816 DSM-IV Case enumeration 6.9 (6.5-7.2)
Parner et al. 2011 Western 1994-99 N/A 152,060 DSM-IV Case enumeration 5.1 (4.7-5.5)
Australia
Chien et al. 2011 Taiwan 1996-2005 0 to 18 372,642 ICD-9 Case enumeration 2.9
Windham et al. 2011 USA 1994, 1996 0 to 8 82,153 (1994), DSM-IV Case enumeration 4.7(4.2-5.1)
80,249(1996) (1994), 4.7(4.2-
5.2) (1996)
Kim et al. 2011 South Korea 2005-09 7 to 12 55,266 DSM-IV Case enumeration from 26.4 (19.1-33.7)
survey and direct exam
Zimmerman 2012 USA 2002, 2006, 8 26,213 (2002), ICD-9 and Case enumeration 6.5 (2002),
et al. 2008 29,494 (2006), special 10.2 (2006),
33,757 (2008) education 13.0 (2008)
classification
Kocovska et al. 2012 Faroe Islands 2002, 2009 7 to 16 7,122 (2002), DSM-IV, Screening and direct 5.6 (2002),
(2002), 7,128 (2009) ICD-10 exam 9.4 (2009)
15 to
24
(2009)
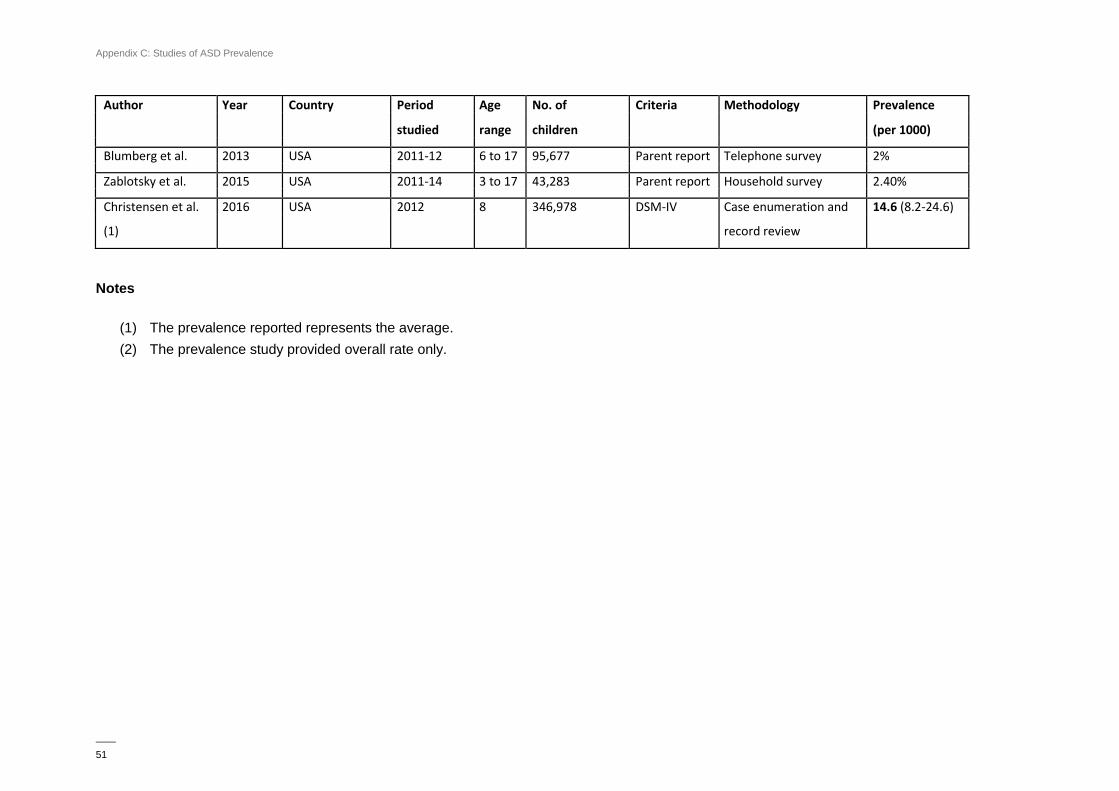
Appendix C: Studies of ASD Prevalence
—— 51
Notes
(1) The prevalence reported represents the average.
(2) The prevalence study provided overall rate only.
Author Year Country Period Age No. of Criteria Methodology Prevalence
studied range children (per 1000)
Blumberg et al. 2013 USA 2011-12 6 to 17 95,677 Parent report Telephone survey 2%
Zablotsky et al. 2015 USA 2011-14 3 to 17 43,283 Parent report Household survey 2.40%
Christensen et al. 2016 USA 2012 8 346,978 DSM-IV Case enumeration and 14.6 (8.2-24.6)
(1) record review
Related Documents