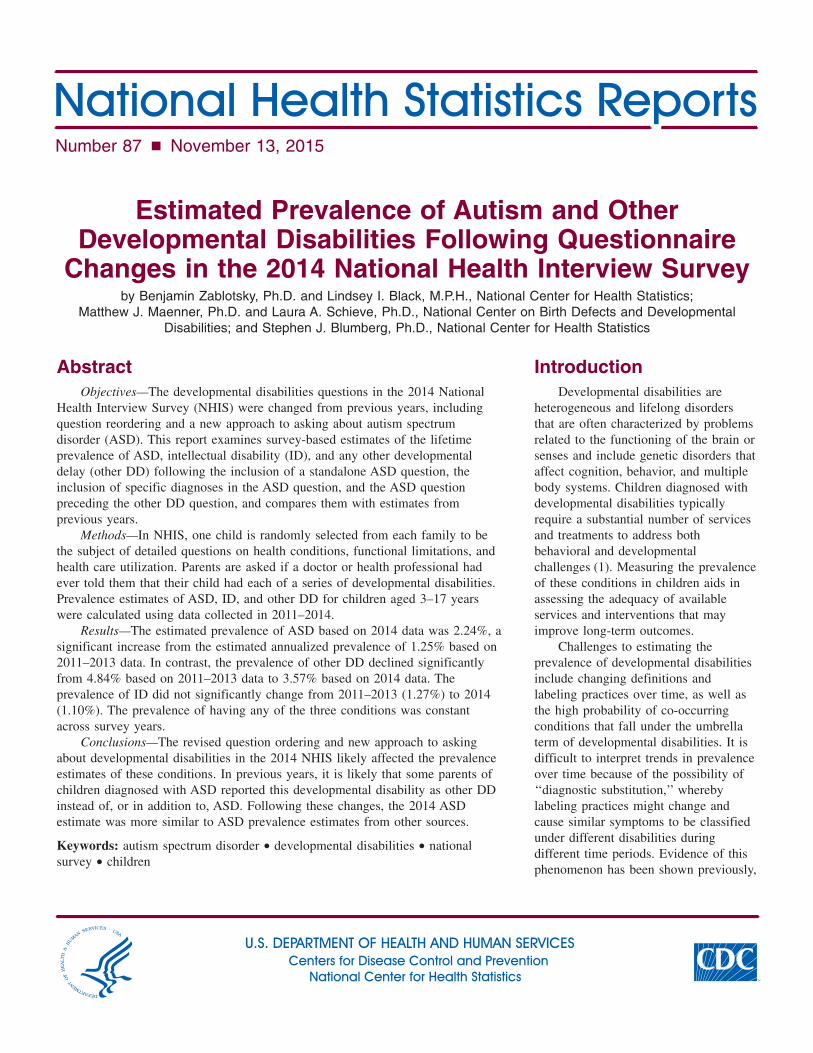
Number 87 n November 13, 2015 Estimated Prevalence of Autism and Other Developmental Disabilities Following Questionnaire Changes in the 2014 National Health Interview Survey by Benjamin Zablotsky, Ph.D. and Lindsey I. Black, M.P.H., National Center for Health Statistics; Matthew J. Maenner, Ph.D. and Laura A. Schieve, Ph.D., National Center on Birth Defects and Developmental Disabilities; and Stephen J. Blumberg, Ph.D., National Center for Health Statistics Abstract Objectives—The developmental disabilities questions in the 2014 National Health Interview Survey (NHIS) were changed from previous years, including question reordering and a new approach to asking about autism spectrum disorder (ASD). This report examines survey-based estimates of the lifetime prevalence of ASD, intellectual disability (ID), and any other developmental delay (other DD) following the inclusion of a standalone ASD question, the inclusion of specific diagnoses in the ASD question, and the ASD question preceding the other DD question, and compares them with estimates from previous years. Methods—In NHIS, one child is randomly selected from each family to be the subject of detailed questions on health conditions, functional limitations, and health care utilization. Parents are asked if a doctor or health professional had ever told them that their child had each of a series of developmental disabilities. Prevalence estimates of ASD, ID, and other DD for children aged 3–17 years were calculated using data collected in 2011–2014. Results—The estimated prevalence of ASD based on 2014 data was 2.24%, a significant increase from the estimated annualized prevalence of 1.25% based on 2011–2013 data. In contrast, the prevalence of other DD declined significantly from 4.84% based on 2011–2013 data to 3.57% based on 2014 data. The prevalence of ID did not significantly change from 2011–2013 (1.27%) to 2014 (1.10%). The prevalence of having any of the three conditions was constant across survey years. Conclusions—The revised question ordering and new approach to asking about developmental disabilities in the 2014 NHIS likely affected the prevalence estimates of these conditions. In previous years, it is likely that some parents of children diagnosed with ASD reported this developmental disability as other DD instead of, or in addition to, ASD. Following these changes, the 2014 ASD estimate was more similar to ASD prevalence estimates from other sources. Keywords: autism spectrum disorder • developmental disabilities • national survey • children Introduction Developmental disabilities are heterogeneous and lifelong disorders that are often characterized by problems related to the functioning of the brain or senses and include genetic disorders that affect cognition, behavior, and multiple body systems. Children diagnosed with developmental disabilities typically require a substantial number of services and treatments to address both behavioral and developmental challenges (1). Measuring the prevalence of these conditions in children aids in assessing the adequacy of available services and interventions that may improve long-term outcomes. Challenges to estimating the prevalence of developmental disabilities include changing definitions and labeling practices over time, as well as the high probability of co-occurring conditions that fall under the umbrella term of developmental disabilities. It is difficult to interpret trends in prevalence over time because of the possibility of ‘‘diagnostic substitution,’’ whereby labeling practices might change and cause similar symptoms to be classified under different disabilities during different time periods. Evidence of this phenomenon has been shown previously, U.S. DEPARTMENT OF HEALTH AND HUMAN SERVICES Centers for Disease Control and Prevention National Center for Health Statistics National Health Statistics Reports

Welcome message from author
This document is posted to help you gain knowledge. Please leave a comment to let me know what you think about it! Share it to your friends and learn new things together.
Transcript
Number 87 n November 13, 2015
National Health Statistics Reports
Estimated Prevalence of Autism and Other Developmental Disabilities Following Questionnaire
Changes in the 2014 National Health Interview Survey by Benjamin Zablotsky, Ph.D. and Lindsey I. Black, M.P.H., National Center for Health Statistics;
Matthew J. Maenner, Ph.D. and Laura A. Schieve, Ph.D., National Center on Birth Defects and Developmental Disabilities; and Stephen J. Blumberg, Ph.D., National Center for Health Statistics
Abstract Objectives—The developmental disabilities questions in the 2014 National
Health Interview Survey (NHIS) were changed from previous years, including question reordering and a new approach to asking about autism spectrum disorder (ASD). This report examines survey-based estimates of the lifetime prevalence of ASD, intellectual disability (ID), and any other developmental delay (other DD) following the inclusion of a standalone ASD question, the inclusion of specific diagnoses in the ASD question, and the ASD question preceding the other DD question, and compares them with estimates from previous years.
Methods—In NHIS, one child is randomly selected from each family to be the subject of detailed questions on health conditions, functional limitations, and health care utilization. Parents are asked if a doctor or health professional had ever told them that their child had each of a series of developmental disabilities. Prevalence estimates of ASD, ID, and other DD for children aged 3–17 years were calculated using data collected in 2011–2014.
Results—The estimated prevalence of ASD based on 2014 data was 2.24%, a significant increase from the estimated annualized prevalence of 1.25% based on 2011–2013 data. In contrast, the prevalence of other DD declined significantly from 4.84% based on 2011–2013 data to 3.57% based on 2014 data. The prevalence of ID did not significantly change from 2011–2013 (1.27%) to 2014 (1.10%). The prevalence of having any of the three conditions was constant across survey years.
Conclusions—The revised question ordering and new approach to asking about developmental disabilities in the 2014 NHIS likely affected the prevalence estimates of these conditions. In previous years, it is likely that some parents of children diagnosed with ASD reported this developmental disability as other DD instead of, or in addition to, ASD. Following these changes, the 2014 ASD estimate was more similar to ASD prevalence estimates from other sources.
Keywords: autism spectrum disorder • developmental disabilities • national survey • children
U.S. DEPARTMENT OF HEALTH AND HUMAN SECenters for Disease Control and Prevent
National Center for Health Statistics
Introduction Developmental disabilities are
heterogeneous and lifelong disorders that are often characterized by problems related to the functioning of the brain or senses and include genetic disorders that affect cognition, behavior, and multiple body systems. Children diagnosed with developmental disabilities typically require a substantial number of services and treatments to address both behavioral and developmental challenges (1). Measuring the prevalence of these conditions in children aids in assessing the adequacy of available services and interventions that may improve long-term outcomes.
Challenges to estimating the prevalence of developmental disabilities include changing definitions and labeling practices over time, as well as the high probability of co-occurring conditions that fall under the umbrella term of developmental disabilities. It is difficult to interpret trends in prevalence over time because of the possibility of ‘‘diagnostic substitution,’’ whereby labeling practices might change and cause similar symptoms to be classified under different disabilities during different time periods. Evidence of this phenomenon has been shown previously,
RVICES ion
Page 2 National Health Statistics Reports n Number 87 n November 13, 2015
particularly as it relates to children receiving special education services (2– 4). For this reason, it can be worthwhile to simultaneously consider the prevalence of the individual disorders that are considered developmental disabilities as well as the prevalence of any developmental disabilities as a whole (5).
Additional challenges stem from theavailable methods for estimating prevalence. Survey-based estimation relies on respondents understanding the questions asked, remembering that the diagnosis was given, recalling that diagnosis when asked, and accurately reporting that diagnosis within the survey context (6,7). Estimates based on administrative classifications (such as special education classifications, autism service eligibility, or medical billing codes) have other limitations. Certain segments of the population may have reduced access to the systems that generate the administrative counts, leading to undercounts and specious socioeconomic disparities in the prevalence of autism spectrum disorder (ASD) (8). In addition, the criteria for special education or other autism-related services differ from state to state, and their use is unevenly adopted within states (9,10). Because each source of information has different advantages andlimitations, multiple and complementary systems are needed to best understand observed changes in the prevalence of developmental disabilities.
Since 1997, the National Health Interview Survey (NHIS) has included questions to determine the prevalence of children ever diagnosed with the developmental disabilities of ASD, intellectual disability (ID), and any otherdevelopmental delay (other DD). In 2014, NHIS revised its approach to asking about ASD. The question wording was expanded to include more specific details on what constituted an ASD and to align with another national survey, the 2011–2012 National Survey of Children’s Health (NSCH). Additionally in 2014, the ASD question was included in the survey as a standalone question that was verbally asked before the question on other DD, and after the question on ID (Figure 1).
Before this, the ASD question was included in a checklist of 10 conditions provided to the parent; the parent was asked to read the list and select any of the 10 conditions that a doctor or health professional had ever said their child had. This checklist was provided after both the ID and other DD questions had been asked.
Order and contextual changes to a survey question can influence respondents’ interpretation of the questions and the responses they provide (7). This can result in changes to the data captured and the resulting estimates (11). The primary objective of this report is to evaluate whether the changes to the NHIS questions on developmental disabilities in 2014 affected the estimates of lifetime prevalence of developmental disabilities in the United States.
Methods
Data source
NHIS data for 2011–2014 were used for this analysis. NHIS is a nationally representative household survey conducted by the Centers for Disease Control and Prevention’s (CDC) National Center for Health Statistics. This cross-sectional survey collects data continuously throughout the year, and annual data files permit estimates for the civilian noninstitutionalized population. Interviews are conducted in person in respondents’ homes, with telephone follow-up if needed. Demographic and basic health information for all family members is collected from one or more adults in the family responding on behalf of the family. In addition, from each family, one adult (the sample adult) and one child (the sample child) are randomly selected to be the subject of more detailed health questions. Sample adults respond for themselves. For the sample child, a knowledgeable adult (usually the parent) responds on the child’s behalf. Further information and a detailed description of the NHIS sample design and questionnaire is available from: http://www.cdc.gov/nchs/nhis.htm.
Data from sample children used for analysis were restricted to children aged
3–17 years, because many developmental disabilities are not recognized by parents or diagnosed by doctors or health professionals before 3 years of age, particularly ASD (12). From 2011 through 2014, the annual number of interviews completed for sample children aged 3–17 years in NHIS was 10,554 in 2011; 10,954 in 2012; 10,684 in 2013; and 11,091 in 2014. Combined, interviews totaled 43,283 (2011–2014). The final sample child response rate ranged from 69.0% to 74.6% from 2011 through 2013, and was 66.6% in 2014.
Measures
Intellectual disability
Since 1997, a question on lifetime ID diagnoses has been included in the sample child component for children of all ages; it has always been the first question asked among a series of questions on developmental disabilities. The wording of the ID question was revised for 2011 to comply with Rosa’s Law (Pub. L. 111–256), and has remained consistent from 2011 through 2014. Parents were asked: ‘‘Did a doctor or health professional ever tell you that [child’s name] had an intellectual disability, also known as mental retardation?’’
Autism spectrum disorder
From 1997 through 2010, sample children with autism were identified as part of a 10-condition checklist. Respondents were asked to read the list, report whether a doctor or other health professional had ever told them that the child had any of the conditions, and if so, identify which conditions were diagnosed. The respondent was not specifically asked about each condition. From 2011 through 2013, autism continued to be identified as part of the same 10-condition checklist, but the previous wording used to name the condition (‘‘autism’’) was modified to ‘‘autism/autism spectrum disorder.’’ In 2014, the ASD survey item became a standalone question; respondents for sample children aged 2–17 years were directly asked the question. Futhermore,

National Health Statistics Reports n Number 87 n November 13, 2015 Page 3
2011–2013 2014
Intellectual disability Intellectual disability Did a doctor or health professional ever tell Did a doctor or health professional ever tell you that [child’s name] had an intellectual you that [child’s name] had an intellectual disability, also known as mental retardation? disability, also known as mental retardation?
Other developmental delay Autism spectrum disorder Has a doctor or health professional ever told Did a doctor or health professional ever tell you that [child’s name] had any other you that [child’s name] had autism, Asperger’s developmental delay? disorder, pervasive developmental disorder, or
autism spectrum disorder?
Autism spectrum disorder Looking at this list, has a doctor or health Other developmental delay professional ever told you that [child’s name] Has a doctor or health professional ever told had any of these conditions? you that [child’s name] had any other
developmental delay? Cerebral palsy Muscular dystrophy Cystic fibrosis Sickle cell anemia
Down syndrome
Autism/autism spectrum disorder Diabetes Arthritis Congenital heart disease Other heart condition
NOTE: In 2014, following the other developmental delay question, respondents were handed a notecard that contained the remaining nine conditions asked about in 2013. SOURCE: CDC/NCHS, National Health Interview Survey, 2011–2013 and 2014.
Figure 1. Developmental disability questions in the National Health Interview Survey, 2011–2013 and 2014
the question wording was again revised to specifically name the conditions included in the Diagnostic and Statistical Manual of Mental Disorders, Fourth Edition, Text Revision (DSM-IVTR) definition of ASDs (13), and to align the question with those found in other national surveys, namely the 2011–2012 NSCH. Parents were asked: ‘‘Did a doctor or health professional ever tell you that [child’s name] had autism, Asperger’s disorder, pervasive developmental disorder, or autism spectrum disorder?’’
Other developmental delay
Other DD was ascertained using the question, ‘‘Has a doctor or health
professional ever told you that [child’s name] had any other developmental delay?’’ and was asked of parents of children of all ages. Although this question wording has remained consistent from 1997 through 2014, its context changed in 2014. In 2014, the other DD question was asked after the new standalone question on autism. Before 2014, the other DD question was asked before the 10-condition checklist that included autism, and directly after the question on intellectual disability. Figure 1 details the ordering and wording of the developmental disabilities questions from 2011 through 2014. The ID question has always come before the other DD question.
Sociodemographic characteristics
To determine if the questionnaire changes captured different populations with different characteristics, the sociodemographic characteristics of the population of children diagnosed with developmental disabilities based on 2014 data were compared with the sociodemographic characteristics of the population of children diagnosed with developmental disabilities based on 2011–2013 data. Sociodemographic characteristics presented in this report include: age, sex, race and ethnicity, health insurance coverage type, family structure, poverty status, parent’s education, metropolitan statistical area (MSA) location of residence, and

Page 4 National Health Statistics Reports n Number 87 n November 13, 2015
Pre
vale
nce
1Indicates a statistically significant difference (p < 0.001) between 2011–2013 and 2014. SOURCE: CDC/NCHS, National Health Interview Survey, 2011–2013 and 2014.
1.27 1.10
4.84
3.57
1.25
2.24
5.26 5.30
5.75 5.76
2011–2013 2014
0
1
2
3
4
5
6
Any of the conditions
Autism spectrum disorder or other
developmental delay
Autism spectrum disorder1
Other developmental
delay1
Intellectual disability
Figure 2. Estimated lifetime prevalence of children aged 3–17 years with parent-reported developmental disability, by survey year: United States, 2011–2013 and 2014
geographic region. All sociodemographic characteristics were based on data collected from the family respondent. For more information on the definitions used for sociodemographic characteristics, see Technical Notes.
Clinical characteristics
Estimates of selected developmental conditions other than ASD, ID, and other DD were also examined. These include parent-reported lifetime diagnoses of attention-deficit/ hyperactivity disorder (ADHD) and learning disability (parents were asked if they had ever been told that their child had the condition); stuttering in the past 12 months; and seizures that occurred in the past 12 months. Additionally, estimates of current functional limitations were examined, including trouble with hearing or vision, walking, or remembering, and whether the child needed help with personal care or had any impairment noted due to a physical, mental, or emotional problem. Lastly, receipt of selected services was examined, including ever receiving special education or early intervention services or receiving home care from a health professional in the past 12 months. For more information on the clinical characteristics items, see Technical Notes.
Statistical analysis
For each of the conditions of interest—ASD, ID, and other DD—lifetime prevalence (henceforth referred to as prevalence) of any parent-reported diagnosis was calculated. All estimates were weighted to be representative of the U.S. noninstitutionalized population of children aged 3–17 years. Data weighting procedures are described in more detail elsewhere (14); the sample child weight was used for these analyses. Linear regression was used to assess the trend over time. Bivariate logistic regressions were used to assess changes between the 2011–2013 NHIS and the 2014 NHIS in the compositions of the estimated populations of children diagnosed with the conditions of interest. Comparisons of estimates are
based on two-tailed significance tests at the 0.05 level. Weighted point estimates and variances were calculated in SUDAAN (15) to account for the complex sample design.
Results
Prevalence of children ever diagnosed with developmental disabilities
The estimated ASD prevalence was 2.24% (1 in 45) in 2014, while averaging 1.25% (1 in 80) from 2011 through 2013—a significant increase (p < 0.001) (Figure 2). The estimated prevalence of other DD was 3.57% in 2014, while averaging 4.84% from 2011 through 2013—a significant decrease (p < 0.001). The estimated ID prevalence did not change significantly between 2011–2013 (1.27%) and 2014 (1.10%).
Despite changes to the prevalence of ASD and other DD, the overall prevalence of children with either ASD or other DD did not change between 2011–2013 (5.26%) and 2014 (5.30%). Similarly, the prevalence of children
with any of the three conditions (ID, ASD, or other DD) in 2011–2013 (5.75%) and 2014 (5.76%) did not differ significantly.
Characteristics of children with ASD
Although an increase was observed in the estimated prevalence of children diagnosed with ASD (based on parent report), the sociodemographic characteristics of the estimated populations of children ever diagnosed with ASD remained generally the same before and after the survey change (Tables 1 and 2). Children with ASD were mostly male (81.7% in 2011–2013, 75.0% in 2014) and non-Hispanic white (58.9% in 2011–2013, 59.9% in 2014), living in families in large MSAs (58.0% in 2011–2013, 54.7% in 2014), with two parents (65.9% in 2011–2013, 68.0% in 2014), and with at least one parent who had more than a high school level of education (76.0% in 2011–2013, 67.6% in 2014). None of these differences were statistically significant between years.
Estimates based on the 2014 data show that 22.9% of children ever

National Health Statistics Reports n Number 87 n November 13, 2015 Page 5
diagnosed with ASD were also said to have been diagnosed with other DD, a significant decrease from 66.7% based on 2011–2013 data (p < 0.001). However, for the estimated population of children ever diagnosed with ASD using the 2014 data, the likelihood of having been diagnosed with ADHD, ID, or a learning disability was not significantly different from the likelihood based on the 2011–2013 data.Children ever diagnosed with ASD using the 2014 data were also equally likely to have physical limitations and tobe receiving special education or early intervention services or home care whencompared with children with ASD using the 2011–2013 data.
Characteristics of children with other DD
The demographic characteristics of children ever diagnosed with other DD closely resembled those of children ever diagnosed with ASD (Tables 3 and 4). Children with other DD were mostly male, non-Hispanic white, and living in households with two parents, in large MSAs, with at least one parent who hadmore than a high school level of education. No differences were found in the sociodemographic and clinical characteristics of the populations ever diagnosed with other DD, whether thosepopulations were estimated based on 2014 data or 2011–2013 data.
Moreover, no differences in the sociodemographic and clinical characteristics of the populations ever diagnosed with either ASD or other DD were found, regardless of whether the population was estimated based on 2014data or 2011–2013 data (Tables 5 and 6). Likewise, sociodemographic and clinical characteristics did not differ between survey years when examining the populations ever diagnosed with any of the three conditions (Tables 7 and 8).
Discussion The 2014 NHIS included a change
to the wording of the ASD question, a change to the way the ASD question was asked, and a change in the placement of the ASD question within
the survey questionnaire. These changes had the potential to impact the estimated prevalence of ASD directly while also having a trickledown effect on the estimated prevalence of conditions that were asked about later in the questionnaire. Indeed, the significant increase in ASD prevalence and decrease in other DD prevalence seen from 2011–2013 to 2014 suggests that these changes did produce a measurement effect.
It cannot be ruled out that a true reduction of other DD diagnoses may have occurred in the population between survey years. However, true year-to-year changes of the magnitude observed are unusual, and require abrupt or dramatic changes in the risk factors acting on the population (16). It also cannot be concluded that the increase seen in the prevalence of ASD is completely explained by the three changes made to the survey. However, the virtually identical prevalence estimates of children ever diagnosed with any developmental disability in 2011–2013 and 2014 suggests that, before 2014, some parents of children diagnosed with ASD reported this developmental disability as other DD instead of, or in addition to, ASD.
It would be expected that some parents of children with ASD answered yes to their child ever having ‘‘any other developmental delay’’ in 2011– 2013, given that developmental delays in social interaction, language, and imaginative play are prototypical symptoms of ASD. It is less obvious why some of these parents did not report the child’s ASD when the condition was later presented as part of the list. It is possible that parents simply overlooked it, or they may have assumed that the survey interviewer would follow conversational norms and, therefore, would not ask redundant questions or expect redundant responses (17). The same principle can explain why the prevalence of other DD was lower in 2014. After reporting their child’s ASD, parents likely assume (correctly, it is worth noting) that the next question about other DD is asking about something other than ASD, and, therefore, should not be endorsed unless
another non-ASD (and non-ID) developmental delay was diagnosed.
This explanation suggests that ASD prevalence estimates based on the 2014 data are more sensitive in capturing the full population of children with ASD than estimates based on the 2011–2013 data. When the ASD question is asked directly and when it comes before the other DD question, it is likely to receive more attention and more thoughtful responses (18). Similar order effects for questionnaire items on psychological disability and social disability have been observed by other researchers (19). Nonetheless, it is not discernible from the data available whether the increase in sensitivity of ASD reporting was at the expense of decreased specificity.
The 2014 survey brought additional attention to the ASD question by including the names of specific diagnoses within the autism spectrum. The addition of Asperger’s disorder and pervasive developmental disorder (PDD) to the question in 2014 was intended to help cue recall of past diagnoses and clarify for parents what conditions were to be included as autism spectrum disorders. A similar change to the ASD question in NSCH between 2003 and 2007 led to higher prevalence estimates attributed partly to the wording change (20).
The change in the ordering of questions and the resulting lower prevalence of other DD in 2014 suggest that the other DD question is assessing a different concept in 2014 than in 2011–2013. Before 2014, it includes ASD-related delays; in 2014, it is less likely to include such delays. Analysts examining trends in developmental disabilities should therefore use caution when examining changes over time in ASD and other DD, but the combined estimate appears to be stable over time.
Limitations
Caution regarding the 2014 estimates is warranted because of several survey-related limitations. The reliance on parent reports could result in misreporting of children’s diagnoses and may also be subject to recall biases. For example, with the addition of PDD to

Page 6 National Health Statistics Reports n Number 87 n November 13, 2015
the ASD question in 2014, some parents may hear ‘‘developmental disorder’’ but not hear or understand the word ‘‘pervasive,’’ leading them to incorrectly report a non-ASD developmental delay as ASD. Parents’ reports were not substantiated through clinical evaluation or educational records. Because parents are asked to reflect only on the lifetime prevalence of developmental disabilities rather than current diagnoses, children who have lost their original diagnosis might be included in the reported prevalence. There are many reasons children who received a diagnosis in the past may no longer meet the criteria for a diagnosis, including, but not limited to, maturation, misdiagnosis, and effective treatment (21). Children may also have lost their original diagnosis due to changing diagnostic criteria (22). In addition, NHIS is a survey of the noninstitutionalized population and, therefore, children living in places other than the household (e.g., hospitals) would not be included in a reported prevalence. Finally, only 1 year of data post-survey change are available to be analyzed; additional years of data will help improve the precision of the estimates and allow a better assessment of trends for developmental disabilities.
Table A. Comparison of National Health IntervSurvey of Children’s Health
Characteristics Nationa
Year of most recent publication . . . . . . . Year of most recent data set . . . . . . . . . ASD prevalence estimate. . . . . . . . . . . 22Age of target population . . . . . . . . . . .
ASD ascertainment method . . . . . . . . . Parent-rabout a
Catchment area or target population . . . . In a nats
nonin
Survey sample size . . . . . . . . . . . . . . AConducted by . . . . . . . . . . . . . . . . . . Primary funder . . . . . . . . . . . . . . . . . Most recent previous data set . . . . . . . . 201
NOTES: ASD is autism spectrum disorder. NCHS is National CenControl and Prevention; and HRSA is Health Resources and Serv
Autism spectrum disorders surveillance
CDC has been tracking the prevalence of ASD for nearly 20 years. Besides NHIS, CDC has conducted NSCH and currently supports the Autism and Developmental Disabilities Monitoring (ADDM) Network. Table A provides a description of each system as well as the most recent prevalence estimate of children with ASD. The three systems use different sampling strategies, including different age groups, and they also use different methods to ascertain ASD. Although recent data from the most recent NHIS, NSCH, and ADDM Network reports contain converging prevalence estimates, the three systems are not directly comparable; instead, the findings from NHIS, NSCH, and ADDM Network each contribute unique information that, when combined, helps form a comprehensive picture of ASD among children in the United States.
NHIS represents the most in-depth health survey, with more than 12,000 sample-child interviews completed annually about health conditions, functional limitations, and health care access and utilization. In-person interviews and strong response rates make NHIS the principal source of information on the health of the noninstitutionalized population of the United States. As noted earlier, NHIS
iew Survey, Autism and Developmental Disabilit
l Health Interview Survey Autism and Developm
Disabilities Monitoring
2015 2014 2014 2010
.4 per 1,000 children 14.7 per 1,000 chil3–17 years 8-year-olds
eported survey responses lifetime autism spectrum disorder diagnosis
Expert clinicians review meducation records andsurveillance case def
ional in-person household urvey of the civilian stitutionalized population
In 14 communities acrUnited States (parts of ACO, FL, GA, MD, MO, N
SC, UT, and WIpproximately 13,000 Approximately 360
NCHS NCBDDD CDC CDC
3 (published in 2014) 2008 (published in 2
ter for Health Statistics; NCBDDD is National Center on Birth Defectices Administration.
has asked about lifetime diagnoses of autism in children since 1997 (23). Annual estimates since 1997 for children aged 3–17 years are presented in Figure 3. Although the sample size for NHIS is smaller than the other systems, the NHIS survey design allows for multiple years of data to be combined and analyzed together.
NSCH was conducted in 2003, 2007, and 2011–2012 as a national telephone survey that focused exclusively on children; approximately 95,000 interviews were conducted per cycle. With its large sample size, in-depth subanalyses—such as examining sociodemographic characteristics of children with autism—are possible with NSCH (24–26). Like NHIS, NSCH asked parents if their child had ever been diagnosed with ASD, but it also asked parents if the child currently had ASD. Parents provided extensive information about their child, including the presence of co-occurring conditions, ASD severity, as well as health care utilization and neighborhood and family characteristics. The NSCH sample was designed to be representative of children in the United States, but declining response rates over time raised concerns about increasing bias. Nonresponse bias cannot be ruled out, although careful analyses suggested that adjustments to the sample weights in 2011–2012 reduced the bias to be smaller than the
ies Monitoring Network, and National
ental Network National Survey of Children’s Health
2013 2011–2012
dren 20.0 per 1,000 children 6–17 years
edical and apply inition
Parent-reported survey responses about current autism spectrum
disorder diagnosis
oss the L, AZ, AR, J, NC, PA, )
In a national telephone survey of households with children
,000 Approximately 95,000 NCHS HRSA
012) 2007 (published in 2009)
s and Developmental Disabilities; CDC is Centers for Disease

National Health Statistics Reports n Number 87 n November 13, 2015 Page 7
Perc
ent
NOTES: Dashed lines indicate changes in the approach to asking about autism. During 1997–2010, children with autism were identified as part of a 10-condition checklist. During 2011–2013, autism continued to be identified as part of the same 10-condition checklist, but the previous wording used to name the condition (“autism”) was modified to “autism/autism spectrum disorder.” In 2014, the wording was expanded to include “autism, Asperger’s disorder, pervasive developmental disorder, and autism spectrum disorder”; the question was no longer part of a condition checklist; and the placement of the autism spectrum disorder question changed within the survey questionnaire. Differences observed in estimates before and after these changes may be partially or fully attributable to these changes. SOURCE: CDC/NCHS, National Health Interview Survey, 1997–2014.
0
0.5
1.0
1.5
2.0
2.5
2014201320122011 20102009200820072006200520042003200220012000199919981997
Year
Figure 3. Estimated lifetime prevalence of children aged 3–17 years with parent-reported diagnosis of autism spectrum disorder, by survey year: United States, 1997–2014
sampling error (24). Given ongoing concerns about bias in telephone surveys, NSCH has been redesigned by the federal Maternal and Child Health Bureau (its longtime sponsor) to be a mail- and Web-based survey, and it will be conducted by the U.S. Census Bureau starting in 2016.
The ADDM Network conducts ASD surveillance among 8-year-old children in multiple geographically defined areas of the United States in even-numbered years beginning in 2000 (12,27–31). In 2010, ADDM Network study areas covered 360,000 8-year-olds. Its surveillance protocol was developed from previous ASD surveillance studies that CDC conducted in metropolitan Atlanta, Georgia, in 1996, and Brick Township, New Jersey, in 1998 (32,33). Unlike NHIS and NSCH, ADDM Network is not a parent-based survey. Rather, ADDM Network determines ASD case status through the review of children’s medical and educational records. Trained clinicians determine whether the records contain documented
symptoms that are consistent with the DSM-IV-TR criteria for Autistic Disorder, Asperger’s Disorder, or Pervasive Developmental Disorder Not Otherwise Specified. This process allows the surveillance system to classify children who have ASD symptoms, even if they do not have a previous ASD diagnosis (approximately 20% of the ASD cases identified in 2010). The large, population-based surveillance areas allow for analyses of select risk factors and small subgroups. They also allow for comparisons of prevalence between different geographic regions.
Each system has captured similar prevalence increases since its inception. For example, ADDM Network estimates rose from 6.7 per 1,000 children aged 8 years in 2000 and 2002 to 14.7 per 1,000 children aged 8 years in 2010. NSCH estimates also rose from 5.5 per 1,000 children in 2003 to 20.0 per 1,000 children in 2011. Finally, NHIS estimates rose in the last decade, as shown in Figure 3. There has been
strong concordance between estimates from these three systems (including similar increases in prevalence following changes to the ASD case definition in NSCH and NHIS [20]) despite differences in their methods and samples. Parent-reported autism prevalence estimates from the 2003 NSCH were similar to the estimates from the 2003–2004 NHIS; both surveys asked about lifetime diagnosis of ‘‘autism,’’ and prevalence for children aged 4–17 years was 5.7 per 1,000 in NHIS and 5.5 per 1,000 in NSCH (25). Moreover, estimates from the 2007 NSCH (11.0 per 1,000 children aged 3–17 years using an expanded question about current ‘‘autism, Asperger’s disorder, pervasive developmental disorder, or other autism spectrum disorder’’) were comparable to the ADDM Network’s medical and educational records-based estimates from 2008 (11.3 per 1,000 children aged 8 years) (26,31).
Table A includes the most recent prevalence estimates from each of the

Page 8 National Health Statistics Reports n Number 87 n November 13, 2015
Table B. Estimated lifetime prevalence (and standard errors) of autism spectrum disorder among children aged 3–17 years, by sociodemographic characteristics: United States, 2014
Characteristic 2014
Age (years)
3–10 . . . . . . . . . . . . . . . . . . . . . . . . . 2.34 (0.26) 11–17 . . . . . . . . . . . . . . . . . . . . . . . . . 2.13 (0.24)
Sex
Male . . . . . . . . . . . . . . . . . . . . . . . . . . 3.29 (0.30) Female . . . . . . . . . . . . . . . . . . . . . . . . 1.15 (0.20)
Race and ethnicity
Non-Hispanic white . . . . . . . . . . . . . . . . . 2.55 (0.29) Non-Hispanic black . . . . . . . . . . . . . . . . . 2.21 (0.43) Non-Hispanic other . . . . . . . . . . . . . . . . . 2.49 (0.62) Hispanic. . . . . . . . . . . . . . . . . . . . . . . . 1.49 (0.26)
Health insurance coverage type
Private. . . . . . . . . . . . . . . . . . . . . . . . . 2.17 (0.25) Public . . . . . . . . . . . . . . . . . . . . . . . . . 2.36 (0.28) Other . . . . . . . . . . . . . . . . . . . . . . . . . *3.90 (1.67) Uninsured. . . . . . . . . . . . . . . . . . . . . . . *1.32 (0.61)
Family structure
Two parent . . . . . . . . . . . . . . . . . . . . . . 2.25 (0.24) Single parent. . . . . . . . . . . . . . . . . . . . . 2.21 (0.29) Other . . . . . . . . . . . . . . . . . . . . . . . . . *2.44 (0.85)
Poverty status
Less than 100% . . . . . . . . . . . . . . . . . . . 2.17 (0.35) 100%–199% . . . . . . . . . . . . . . . . . . . . . 2.45 (0.37) 200%–399% . . . . . . . . . . . . . . . . . . . . . 2.61 (0.44) 400% or more . . . . . . . . . . . . . . . . . . . . 1.86 (0.31)
Parent’s education
High school diploma or GED1 or less . . . . . . 2.28 (0.31) More than high school . . . . . . . . . . . . . . . 2.23 (0.23)
MSA2 status
Large MSA . . . . . . . . . . . . . . . . . . . . . . 2.30 (0.25) Small MSA . . . . . . . . . . . . . . . . . . . . . . 2.47 (0.34) Not in MSA. . . . . . . . . . . . . . . . . . . . . . 1.48 (0.35)
Geographic region
Northeast . . . . . . . . . . . . . . . . . . . . . . . 3.17 (0.56) Midwest . . . . . . . . . . . . . . . . . . . . . . . . 2.62 (0.40) South . . . . . . . . . . . . . . . . . . . . . . . . . 1.81 (0.26) West . . . . . . . . . . . . . . . . . . . . . . . . . . 2.00 (0.36)
* Estimate does not meet standards of reliability or precision (relative standard error is greater than 30% and less than or equal to 50%) and should be used with caution. 1General Educational Development high school equivalency diploma. 2Metropolitan statistical area.
SOURCE: CDC/NCHS, National Health Interview Survey, 2014.
three systems. It is important to remember that relative to the 2014 NHIS data, NSCH data are 2 years older (2011–2012) and ADDM Network data are 4 years older (2010). In this context, the 2014 NHIS estimate (22.4 per 1,000 children aged 3–17 years), which used a case definition of ASD that was virtually identical to that used in the 2011–2012 NSCH, seems more realistic than the 2011–2013 NHIS estimate (12.5 per 1,000 children aged 3–17 years), which was lower than the latest estimates from both NSCH and the ADDM Network. To the extent that converging estimates with other ASD tracking systems indicates validity, these comparisons suggest that ASD prevalence estimates based on the 2014 NHIS data are more likely to be valid than estimates based on the 2011–2013 NHIS data. Estimates of ASD prevalence from the 2014 NHIS are presented by sociodemographic characteristics in Table B.
Conclusions This report examines the prevalence
of developmental disabilities in NHIS from 2011 through 2014. The findings suggest that changes to the ordering and wording of the developmental disabilities questions within NHIS resulted in changes to the parent-reported prevalence of ASD and any other DD. Starting in 2016, NHIS will include questions on the current prevalence of ID, ASD, and other DD. This addition will follow the existing developmental disabilities questions, so as not to disrupt analyses of trends since 2014, and it will help to align NHIS estimates with other surveillance efforts, and minimize the potential for misdiagnosed cases to be captured within prevalence estimates.
References 1. Boulet SL, Boyle CA, Shieve LA.
Health care use and health and functional impact of developmental disabilities among US children, 1997–2005. Arch Pediatr Adolesc Med 163(1):19–26. 2009.
2. Coo H, Ouelette-Kuntz H, Lloyd JE, Kasmara L, Holden JJ, Lewis ME. Trends in autism prevalence: Diagnostic substitution revisited. J Autism Dev Disord 38(6):1036– 1046. 2008.
3. Polyak A, Kubina RM, Girirajan S. Comorbidity of intellectual disability confounds ascertainment of autism: Implications for genetic diagnosis.
Am J Med Genet B Neuropsychiatr Genet 168(7):600–8. 2015.
4. Shattuck PT. The contribution of diagnostic substitution to the growing administrative prevalence of autism in US special education. Pediatrics 117(4):1028–37. 2006.
5. Leonard H, Dixon G, Whitehouse AJO, Bourke J, Aiberti K, Nassar N, et al. Unpacking the complex nature

National Health Statistics Reports n Number 87 n November 13, 2015 Page 9
of the autism epidemic. Res Autism Spectr Disord 4(4):548–54. 2010.
6. Cannell C, Miller P, Oksenberg L. Research on interviewing techniques. In: Leinhardt S, editor. Sociological methodology. San Francisco, CA: Jossey-Bass, 389–437. 1981.
7. Tourangeau R, Rips LJ, Rasinski K. The psychology of survey response. Cambridge, UK: Cambridge University Press. 2000.
8. Durkin MS, Maenner MJ, Meaney FJ, Levy SE, DiGuiseppi C, Nicholas JS, et al. Socioeconomic inequality in the prevalence of autism spectrum disorder: Evidence from a U.S. cross-sectional study. PLoS One 5(7):e11551. 2010.
9. MacFarlane JR, Kanaya T. What does it mean to be autistic? Interstate variation in special education criteria for autism services. J Child Fam Stud 18(6):662–9. 2009.
10. Maenner MJ, Durkin MS. Trends in the prevalence of autism on the basis of special education data. Pediatrics 126(5):1018–25. 2010.
11. Van Handel MM, Branson BM. Monitoring HIV testing in the United States: Consequences of methodology changes to national surveys. PLoS One 10(4):e0125637. 2015.
12. Autism and Developmental Disabilities Monitoring Network Surveillance Year 2010 Principal Investigators, CDC. Prevalence of autism spectrum disorder among children aged 8 years—Autism and Developmental Disabilities Monitoring Network, 11 sites, United States, 2010. MMWR Surveill Summ 63(2):1–21. 2014.
13. American Psychiatric Association. Diagnostic and statistical manual of mental disorders, fourth edition, text revision. Washington, DC: 2000.
14. Parsons VL, Moriarity C, Jonas K, et al. Design and estimation for the National Health Interview Survey, 2006–2015. National Center for Health Statistics. Vital Health Stat 2(165). 2014.
15. RTI International. SUDAAN (Release 11.0.0) [computer software]. 2012.
16. Schieve LA, Rice C, Devine O, Maenner MJ, Lee LC, Fitzgerald R, et al. Have secular changes in perinatal risk factors contributed to the recent autism prevalence
increase? Development and application of a mathematical assessment model. Ann Epidemiol 21(12):930–45. 2011.
17. Strack F, Schwarz N, Wanke M. Semantic and pragmatic aspects of context effects in social and psychological research. Soc Cogn 9(1):111–25. 1991.
18. Barnett J, Nigg C, De Bourdeaudhuij I, Maglione C, Maddock J. The effect of item order on physical activity estimates using the IPAQ. Calif J Health Promot 5(1):23–9. 2007.
19. Kieffer JM, Hoogstraten J. Item-order effects in the Oral Health Impact Profile (OHIP). Eur J Oral Sci 116(3):245–9. 2008.
20. Schieve LA, Rice C, Yeargin-Allsopp M, Boyle CA, Kogan MD, Drews C, Devine O. Parent-reported prevalenceof autism spectrum disorders in US-born children: An assessment of changes within birth cohorts from the2003 to the 2007 National Survey of Children’s Health. Matern Child Health J 16(S1):S151–7. 2012.
21. Blumberg SJ, Zablotsky B, Avila RM, Colpe LJ, Pringle BA, Kogan MD. Diagnosis lost: Differences between children who had and who currently have an autism spectrum disorder diagnosis. Autism. 2015 [Forthcoming].
22. Maenner MJ, Rice CE, Arneson CL, Cunniff C, Schieve LA, Carpenter LA, et al. Potential impact of DSM–5 criteria on autism spectrum disorder prevalence estimates. JAMA Psychiatry 71(3):292–300. 2014.
23. Boyle CA, Boulet S, Schieve LA, Cohen RA, Blumberg SJ, YearginAllsopp M, et al. Trends in the prevalence of developmental disabilities in US children. Pediatrics 127(6):1034–42. 2011.
24. Blumberg SJ, Bramlett MD, Kogan MD, et al. Changes in prevalence of parent-reported autism spectrum disorder in school-aged U.S. children: 2007 to 2011–2012. National health statistics reports; no 65. Hyattsville, MD: National Center for Health Statistics. 2013.
25. CDC. Mental health in the United States: Parental report of diagnosed autism in children aged 4–17 years—United States, 2003–2004. MMWR Morb Mortal Wkly Rep 55(17):481–6. 2006.
26. Kogan MD, Blumberg SJ, Schieve LA, Boyle CA, Perrin JM, Ghandour RM, et al. Prevalence of parent-reported diagnosis of autism spectrum disorder among children in the US, 2007. Pediatrics 124(5):1395–403. 2009.
27. Autism and Developmental Disabilities Monitoring Network Surveillance Year 2000 Principal Investigators, CDC. Prevalence of autism spectrum disorders—Autism and Developmental Disabilities Monitoring Network, six sites, United States, 2000. MMWR Surveill Summ 56(1):1–11. 2007.
28. Autism and Developmental Disabilities Monitoring Network Surveillance Year 2002 Principal Investigators, CDC. Prevalence of autism spectrum disorders—Autism and Developmental Disabilities Monitoring Network, 14 sites, United States, 2002. MMWR Surveill Summ 56(1):12–28. 2007.
29. Autism and Developmental Disabilities Monitoring Network Surveillance Year 2004 Principal Investigators, CDC. Brief update: Prevalence of autism spectrum disorders (ASDs)—Autism and Developmental Disabilities Monitoring Network, United States, 2004. MMWR Surveill Summ 58(SS10):21–4. 2009.
30. Autism and Developmental Disabilities Monitoring Network Surveillance Year 2006 Principal Investigators, CDC. Prevalence of autism spectrum disorders—Autism and Developmental Disabilities Monitoring Network, United States, 2006. MMWR Surveill Summ 58(10):1–20. 2009.
31. Autism and Developmental Disabilities Monitoring Network Surveillance Year 2008 Principal Investigators, CDC. Prevalence of autism spectrum disorders—Autism and Developmental Disabilities Monitoring Network, 14 sites, United States, 2008. MMWR Surveill Summ 61(3):1–19. 2012.

Page 10 National Health Statistics Reports n Number 87 n November 13, 2015
32. Bertrand J, Mars A, Boyle C, Bove F, Yeargin-Allsopp M, Decoufle P. Prevalence of autism in a United States population: The Brick Township, New Jersey, investigation. Pediatrics 108(5):1155–61. 2001.
33. Yeargin-Allsopp M, Rice C, Karapurkar T, Doernberg N, Boyle C, Murphy C. Prevalence of autism in a US metropolitan area. JAMA 289(1):49–55. 2003.

National Health Statistics Reports n Number 87 n November 13, 2015 Page 11
Table 1. Percentages (and standard errors) of sociodemographic characteristics among children aged 3–17 years ever diagnosed with autism spectrum disorder, by survey year: United States, 2011–2013 and 2014
Characteristic 2011–20131 20141
Age (years) 3–10 . . . . . . . . . . . . . . . . . . . . . . . . . . . . . . 55.4 (2.9) 55.4 (4.0) 11–17 . . . . . . . . . . . . . . . . . . . . . . . . . . . . . . 44.6 (2.9) 44.6 (4.0)
Sex
Male . . . . . . . . . . . . . . . . . . . . . . . . . . . . . . . 81.7 (2.3) 75.0 (3.7) Female . . . . . . . . . . . . . . . . . . . . . . . . . . . . . 18.3 (2.3) 25.0 (3.7)
Race and ethnicity
Non-Hispanic white. . . . . . . . . . . . . . . . . . . . . . 58.9 (2.8) 59.9 (4.0) Non-Hispanic black. . . . . . . . . . . . . . . . . . . . . . 11.6 (1.8) 13.5 (2.5) Non-Hispanic other . . . . . . . . . . . . . . . . . . . . . . 9.2 (1.5) 10.6 (2.6) Hispanic . . . . . . . . . . . . . . . . . . . . . . . . . . . . 20.3 (2.2) 16.1 (2.7)
Health insurance coverage type
Private . . . . . . . . . . . . . . . . . . . . . . . . . . . . . 52.5 (2.9) 52.7 (4.1) Public . . . . . . . . . . . . . . . . . . . . . . . . . . . . . . 38.3 (2.9) 39.3 (3.9) Other . . . . . . . . . . . . . . . . . . . . . . . . . . . . . . 4.1 (1.0) *4.7 (1.9) Uninsured . . . . . . . . . . . . . . . . . . . . . . . . . . . 5.1 (1.2) *3.4 (1.5)
Family structure
Two parent . . . . . . . . . . . . . . . . . . . . . . . . . . . 65.9 (2.7) 68.0 (3.7) Single parent . . . . . . . . . . . . . . . . . . . . . . . . . 31.0 (2.7) 28.7 (3.6) Other . . . . . . . . . . . . . . . . . . . . . . . . . . . . . . 3.1 (0.9) *3.3 (1.1)
Poverty status
Less than 100%. . . . . . . . . . . . . . . . . . . . . . . . 20.2 (2.3) 21.5 (3.2) 100%–199% . . . . . . . . . . . . . . . . . . . . . . . . . . 23.1 (2.7) 25.1 (3.5) 200%–399% . . . . . . . . . . . . . . . . . . . . . . . . . . 32.3 (2.8) 32.1 (4.3) 400% or more . . . . . . . . . . . . . . . . . . . . . . . . . 24.5 (2.7) 21.4 (3.3)
Parent’s education
High school diploma or GED2 or less . . . . . . . . . . 24.0 (2.5) 32.4 (3.9) More than high school . . . . . . . . . . . . . . . . . . . . 76.0 (2.5) 67.6 (3.9)
MSA3 status
Large MSA. . . . . . . . . . . . . . . . . . . . . . . . . . . 58.0 (2.9) 54.7 (4.2) Small MSA . . . . . . . . . . . . . . . . . . . . . . . . . . . 30.2 (2.6) 36.1 (4.0) Not in MSA . . . . . . . . . . . . . . . . . . . . . . . . . . 11.8 (1.8) 9.2 (2.2)
Geographic region
Northeast . . . . . . . . . . . . . . . . . . . . . . . . . . . . 15.0 (2.1) 21.0 (3.4) Midwest. . . . . . . . . . . . . . . . . . . . . . . . . . . . . 22.6 (2.5) 26.2 (3.5) South . . . . . . . . . . . . . . . . . . . . . . . . . . . . . . 37.6 (2.9) 31.2 (3.7) West. . . . . . . . . . . . . . . . . . . . . . . . . . . . . . . 24.8 (2.4) 21.5 (3.4)
* Estimate does not meet standards of reliability or precision (relative standard error is greater than 30% and less than or equal to 50%) and should be used with caution. 1Sample sizes of children with autism spectrum disorder were 433 in 2011–2013 and 237 in 2014. 2General Educational Development high school equivalency diploma. 3Metropolitan statistical area.
SOURCE: CDC/NCHS, National Health Interview Survey, 2011–2013 and 2014.

Page 12 National Health Statistics Reports n Number 87 n November 13, 2015
Table 2. Percentages (and standard errors) of selected co-occurring conditions, functional limitations, and service utilization among children aged 3–17 years ever diagnosed with autism spectrum disorder, by survey year: United States, 2011–2013 and 2014
Characteristic 2011–20131 20141
Co-occurring conditions
Attention-deficit/hyperactivity disorder . . . . . . . . . . . . . . . 45.3 (3.0) 42.8 (4.1) Intellectual disability . . . . . . . . . . . . . . . . . . . . . . . . . . 23.2 (2.5) 16.7 (3.1) Learning disability . . . . . . . . . . . . . . . . . . . . . . . . . . . 63.2 (2.8) 62.6 (3.9) Other developmental delay. . . . . . . . . . . . . . . . . . . . . . 66.7 (2.8) †22.9 (3.6) Seizures, past 12 months . . . . . . . . . . . . . . . . . . . . . . *3.0 (0.9) *3.1 (1.2) Stuttered or stammered, past 12 months . . . . . . . . . . . . . 10.2 (1.8) 8.1 (2.1)
Limitations
Trouble seeing . . . . . . . . . . . . . . . . . . . . . . . . . . . . . 4.9 (1.1) *7.1 (2.2) Trouble hearing . . . . . . . . . . . . . . . . . . . . . . . . . . . . . 8.3 (1.5) *5.7 (1.8) Difficulty walking without equipment . . . . . . . . . . . . . . . . *2.4 (0.8) *0.9 (0.5) Difficulty remembering . . . . . . . . . . . . . . . . . . . . . . . . 12.7 (2.1) 7.4 (2.1) Needs help with personal care . . . . . . . . . . . . . . . . . . . 19.9 (2.4) 18.9 (3.2) Any impairment noted . . . . . . . . . . . . . . . . . . . . . . . . . 83.5 (2.1) 78.2 (3.2)
Services
Receives special education or early intervention services . . . 78.3 (2.4) 69.9 (3.8) Home care from health professional, past 12 months . . . . . 5.1 (1.1) *5.1 (1.9)
† p < 0.001. * Estimate does not meet standards of reliability or precision (relative standard error is greater than 30% and less than or equal to 50%) and should be used with caution. 1Sample sizes of children with autism spectrum disorder were 433 in 2011–2013 and 237 in 2014.
SOURCE: CDC/NCHS, National Health Interview Survey, 2011–2013 and 2014.

National Health Statistics Reports n Number 87 n November 13, 2015 Page 13
Table 3. Percentages (and standard errors) of sociodemographic characteristics among children aged 3–17 years ever diagnosed with other developmental delay, by survey year: United States, 2011–2013 and 2014
Characteristic 2011–20131 20141
Age (years)
3–10 . . . . . . . . . . . . . . . . . . . . . . . . . . . . . . 56.8 (1.8) 58.9 (3.3) 11–17 . . . . . . . . . . . . . . . . . . . . . . . . . . . . . . 43.2 (1.8) 41.1 (3.3)
Sex Male . . . . . . . . . . . . . . . . . . . . . . . . . . . . . . . 65.4 (1.7) 63.3 (3.2) Female . . . . . . . . . . . . . . . . . . . . . . . . . . . . . 34.6 (1.7) 36.7 (3.2)
Race and ethnicity
Non-Hispanic white. . . . . . . . . . . . . . . . . . . . . . 61.6 (1.7) 59.9 (3.3) Non-Hispanic black. . . . . . . . . . . . . . . . . . . . . . 13.7 (1.1) 12.4 (2.0) Non-Hispanic other . . . . . . . . . . . . . . . . . . . . . . 7.3 (0.8) 9.7 (1.9) Hispanic . . . . . . . . . . . . . . . . . . . . . . . . . . . . 17.4 (1.2) 18.0 (2.4)
Health insurance coverage type
Private . . . . . . . . . . . . . . . . . . . . . . . . . . . . . 48.0 (1.7) 46.4 (3.3) Public . . . . . . . . . . . . . . . . . . . . . . . . . . . . . . 43.5 (1.7) 44.5 (3.1) Other . . . . . . . . . . . . . . . . . . . . . . . . . . . . . . 3.8 (0.7) 5.7 (1.6) Uninsured . . . . . . . . . . . . . . . . . . . . . . . . . . . 4.6 (0.8) *3.4 (1.1)
Family structure
Two parent . . . . . . . . . . . . . . . . . . . . . . . . . . . 62.8 (1.6) 63.0 (3.0) Single parent . . . . . . . . . . . . . . . . . . . . . . . . . 34.0 (1.6) 32.9 (2.9) Other . . . . . . . . . . . . . . . . . . . . . . . . . . . . . . 3.2 (0.5) 4.1 (1.2)
Poverty status
Less than 100%. . . . . . . . . . . . . . . . . . . . . . . . 27.7 (1.6) 25.9 (3.0) 100%–199% . . . . . . . . . . . . . . . . . . . . . . . . . . 22.0 (1.5) 26.5 (3.0) 200%–399% . . . . . . . . . . . . . . . . . . . . . . . . . . 25.9 (1.4) 25.9 (3.1) 400% or more . . . . . . . . . . . . . . . . . . . . . . . . . 24.4 (1.5) 21.7 (2.9)
Parent’s education
High school diploma or GED2 or less . . . . . . . . . . 29.9 (1.5) 28.9 (3.1) More than high school . . . . . . . . . . . . . . . . . . . . 70.1 (1.5) 71.1 (3.1)
MSA3 status
Large MSA. . . . . . . . . . . . . . . . . . . . . . . . . . . 52.4 (1.9) 53.4 (3.5) Small MSA . . . . . . . . . . . . . . . . . . . . . . . . . . . 32.1 (1.7) 33.6 (3.3) Not in MSA . . . . . . . . . . . . . . . . . . . . . . . . . . 15.5 (1.4) 12.9 (2.5)
Geographic region
Northeast . . . . . . . . . . . . . . . . . . . . . . . . . . . . 19.2 (1.5) 18.1 (2.6) Midwest. . . . . . . . . . . . . . . . . . . . . . . . . . . . . 24.1 (1.5) 27.4 (3.3) South . . . . . . . . . . . . . . . . . . . . . . . . . . . . . . 37.0 (1.7) 36.6 (3.4) West. . . . . . . . . . . . . . . . . . . . . . . . . . . . . . . 19.7 (1.3) 17.9 (2.4)
* Estimate does not meet standards of reliability or precision (relative standard error is greater than 30% and less than or equal to 50%) and should be used with caution. 1Sample sizes of children with other developmental delay were 1,486 in 2011–2013 and 420 in 2014. 2General Educational Development high school equivalency diploma. 3Metropolitan statistical area.
SOURCE: CDC/NCHS, National Health Interview Survey, 2011–2013 and 2014.

Page 14 National Health Statistics Reports n Number 87 n November 13, 2015
Table 4. Percentages (and standard errors) of selected co-occurring conditions, functional limitations, and service utilization among children aged 3–17 years ever diagnosed with other developmental delay, by survey year: United States, 2011–2013 and 2014
Characteristic 2011–20131 20141
Co-occurring conditions
Attention-deficit/hyperactivity disorder . . . . . . . . . . . . . . . 30.5 (1.5) 27.4 (2.8) Intellectual disability . . . . . . . . . . . . . . . . . . . . . . . . . . 14.4 (1.1) 12.9 (2.2) Learning disability . . . . . . . . . . . . . . . . . . . . . . . . . . . 53.7 (1.6) 56.5 (3.4) Autism spectrum disorder . . . . . . . . . . . . . . . . . . . . . . 17.2 (1.1) 14.4 (2.3) Seizures, past 12 months . . . . . . . . . . . . . . . . . . . . . . 4.8 (0.7) 5.8 (1.5) Stuttered or stammered, past 12 months . . . . . . . . . . . . . 9.3 (1.0) 13.1 (2.4)
Limitations
Trouble seeing . . . . . . . . . . . . . . . . . . . . . . . . . . . . . 8.3 (1.0) 8.7 (1.8) Trouble hearing . . . . . . . . . . . . . . . . . . . . . . . . . . . . . 9.2 (1.1) 9.5 (2.0) Difficulty walking without equipment . . . . . . . . . . . . . . . . 3.6 (0.6) *4.2 (1.6) Difficulty remembering . . . . . . . . . . . . . . . . . . . . . . . . 5.5 (0.7) 5.6 (1.3) Needs help with personal care . . . . . . . . . . . . . . . . . . . 10.6 (1.0) 14.4 (2.4) Any impairment noted . . . . . . . . . . . . . . . . . . . . . . . . . 63.9 (1.6) 61.7 (3.4)
Services
Receives special education or early intervention services . . . 58.1 (1.7) 56.4 (3.5) Home care from health professional, past 12 months . . . . . 5.2 (0.7) *3.6 (1.2)
* Estimate does not meet standards of reliability or precision (relative standard error is greater than 30% and less than or equal to 50%) and should be used with caution. 1Sample sizes of children with other developmental delay were 1,486 in 2011–2013 and 420 in 2014.
SOURCE: CDC/NCHS, National Health Interview Survey, 2011–2013 and 2014.

National Health Statistics Reports n Number 87 n November 13, 2015 Page 15
Table 5. Percentages (and standard errors) of sociodemographic characteristics among children aged 3–17 years ever diagnosed with autism spectrum disorder or other developmental delay, by survey year: United States, 2011–2013 and 2014
Characteristic 2011–20131 20141
Age (years)
3–10 . . . . . . . . . . . . . . . . . . . . . . . . . . . . 56.0 (1.7) 57.9 (2.7) 11–17. . . . . . . . . . . . . . . . . . . . . . . . . . . . 44.0 (1.7) 42.1 (2.7)
Sex
Male . . . . . . . . . . . . . . . . . . . . . . . . . . . . 67.0 (1.6) 66.7 (2.6) Female. . . . . . . . . . . . . . . . . . . . . . . . . . . 33.0 (1.6) 33.3 (2.6)
Race and ethnicity
Non-Hispanic white . . . . . . . . . . . . . . . . . . . 61.4 (1.6) 59.8 (2.6) Non-Hispanic black . . . . . . . . . . . . . . . . . . . 13.8 (1.0) 13.1 (1.6) Non-Hispanic other . . . . . . . . . . . . . . . . . . . 7.4 (0.7) 10.3 (1.7) Hispanic . . . . . . . . . . . . . . . . . . . . . . . . . . 17.4 (1.1) 16.8 (1.9)
Health insurance coverage type
Private . . . . . . . . . . . . . . . . . . . . . . . . . . . 48.1 (1.7) 49.3 (2.7) Public. . . . . . . . . . . . . . . . . . . . . . . . . . . . 43.3 (1.6) 42.5 (2.6) Other . . . . . . . . . . . . . . . . . . . . . . . . . . . 3.8 (0.7) 4.7 (1.2) Uninsured . . . . . . . . . . . . . . . . . . . . . . . . . 4.8 (0.8) 3.5 (1.0)
Family structure
Two parent . . . . . . . . . . . . . . . . . . . . . . . . 63.0 (1.5) 64.7 (2.4) Single parent . . . . . . . . . . . . . . . . . . . . . . . 33.7 (1.5) 31.5 (2.3) Other . . . . . . . . . . . . . . . . . . . . . . . . . . . . 3.3 (0.5) 3.9 (0.9)
Poverty status
Less than 100% . . . . . . . . . . . . . . . . . . . . . 27.2 (1.5) 24.2 (2.3) 100%–199% . . . . . . . . . . . . . . . . . . . . . . . 22.6 (1.4) 25.0 (2.4) 200%–399% . . . . . . . . . . . . . . . . . . . . . . . 26.3 (1.4) 29.0 (2.8) 400% or more . . . . . . . . . . . . . . . . . . . . . . 24.0 (1.4) 21.8 (2.3)
Parent’s education
High school diploma or GED2 or less . . . . . . . . 29.8 (1.4) 29.8 (2.5) More than high school . . . . . . . . . . . . . . . . . 70.2 (1.4) 70.2 (2.5)
MSA3 status
Large MSA . . . . . . . . . . . . . . . . . . . . . . . . 52.7 (1.8) 53.5 (2.9) Small MSA . . . . . . . . . . . . . . . . . . . . . . . . 32.0 (1.7) 34.4 (2.7) Not in MSA . . . . . . . . . . . . . . . . . . . . . . . . 15.2 (1.4) 12.1 (2.0)
Geographic region
Northeast . . . . . . . . . . . . . . . . . . . . . . . . . 18.9 (1.4) 19.3 (2.2) Midwest . . . . . . . . . . . . . . . . . . . . . . . . . . 24.2 (1.4) 26.3 (2.6) South. . . . . . . . . . . . . . . . . . . . . . . . . . . . 36.7 (1.6) 35.0 (2.7) West . . . . . . . . . . . . . . . . . . . . . . . . . . . . 20.2 (1.3) 19.3 (2.0)
1Sample sizes of children with autism spectrum disorder or other developmental delay were 1,630 in 2011–2013 and 607 in 2014. 2General Educational Development high school equivalency diploma. 3Metropolitan statistical area.
SOURCE: CDC/NCHS, National Health Interview Survey, 2011–2013 and 2014.
Page 16 National Health Statistics Reports n Number 87 n November 13, 2015
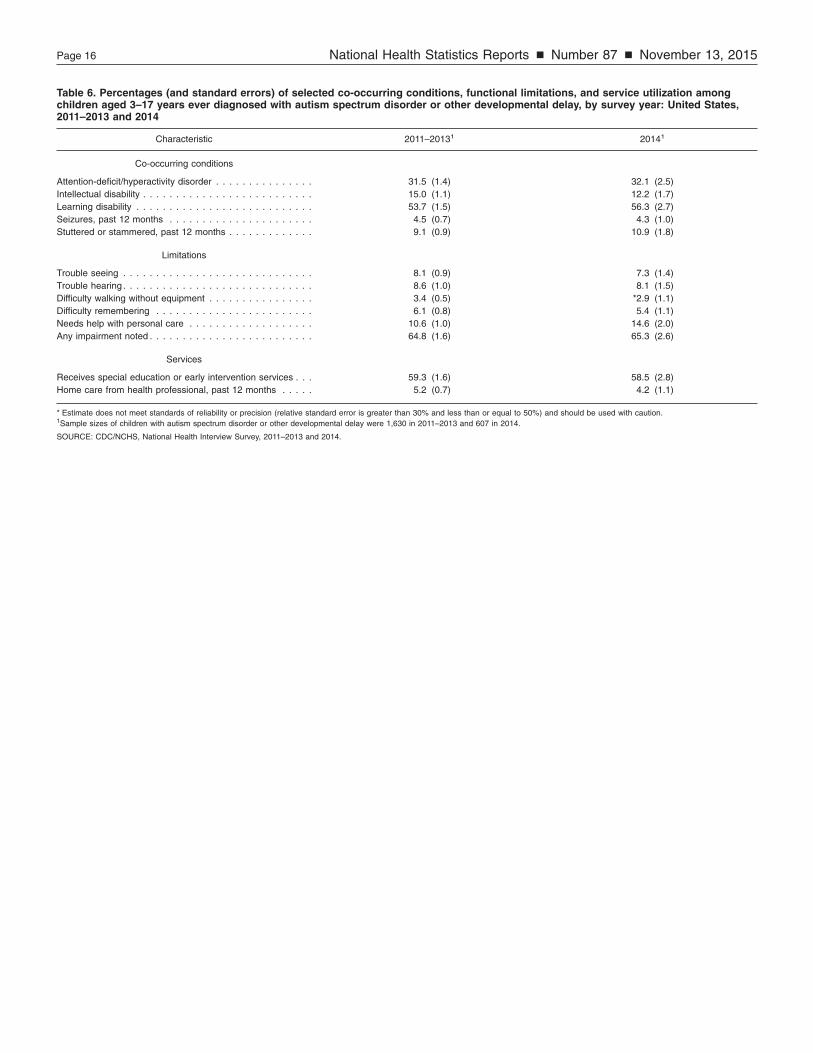
Table 6. Percentages (and standard errors) of selected co-occurring conditions, functional limitations, and service utilization among children aged 3–17 years ever diagnosed with autism spectrum disorder or other developmental delay, by survey year: United States, 2011–2013 and 2014
Characteristic 2011–20131 20141
Co-occurring conditions
Attention-deficit/hyperactivity disorder . . . . . . . . . . . . . . . 31.5 (1.4) 32.1 (2.5) Intellectual disability . . . . . . . . . . . . . . . . . . . . . . . . . . 15.0 (1.1) 12.2 (1.7) Learning disability . . . . . . . . . . . . . . . . . . . . . . . . . . . 53.7 (1.5) 56.3 (2.7) Seizures, past 12 months . . . . . . . . . . . . . . . . . . . . . . 4.5 (0.7) 4.3 (1.0) Stuttered or stammered, past 12 months . . . . . . . . . . . . . 9.1 (0.9) 10.9 (1.8)
Limitations
Trouble seeing . . . . . . . . . . . . . . . . . . . . . . . . . . . . . 8.1 (0.9) 7.3 (1.4) Trouble hearing . . . . . . . . . . . . . . . . . . . . . . . . . . . . . 8.6 (1.0) 8.1 (1.5) Difficulty walking without equipment . . . . . . . . . . . . . . . . 3.4 (0.5) *2.9 (1.1) Difficulty remembering . . . . . . . . . . . . . . . . . . . . . . . . 6.1 (0.8) 5.4 (1.1) Needs help with personal care . . . . . . . . . . . . . . . . . . . 10.6 (1.0) 14.6 (2.0) Any impairment noted . . . . . . . . . . . . . . . . . . . . . . . . . 64.8 (1.6) 65.3 (2.6)
Services
Receives special education or early intervention services . . . 59.3 (1.6) 58.5 (2.8) Home care from health professional, past 12 months . . . . . 5.2 (0.7) 4.2 (1.1)
* Estimate does not meet standards of reliability or precision (relative standard error is greater than 30% and less than or equal to 50%) and should be used with caution. 1Sample sizes of children with autism spectrum disorder or other developmental delay were 1,630 in 2011–2013 and 607 in 2014.
SOURCE: CDC/NCHS, National Health Interview Survey, 2011–2013 and 2014.

National Health Statistics Reports n Number 87 n November 13, 2015 Page 17
Table 7. Percentages (and standard errors) of sociodemographic characteristics among children aged 3–17 years ever diagnosed with intellectual disability, autism spectrum disorder, or any other developmental delay, by survey year: United States, 2011–2013 and 2014
Characteristic 2011–20131 20141
Age (years)
3–10 . . . . . . . . . . . . . . . . . . . . . . . . . . . . . . 54.0 (1.6) 55.9 (2.6) 11–17 . . . . . . . . . . . . . . . . . . . . . . . . . . . . . . 46.0 (1.6) 44.1 (2.6)
Sex
Male . . . . . . . . . . . . . . . . . . . . . . . . . . . . . . . 66.8 (1.5) 65.6 (2.4) Female . . . . . . . . . . . . . . . . . . . . . . . . . . . . . 33.2 (1.5) 34.4 (2.4)
Race and ethnicity
Non-Hispanic white. . . . . . . . . . . . . . . . . . . . . . 60.0 (1.5) 59.5 (2.5) Non-Hispanic black. . . . . . . . . . . . . . . . . . . . . . 14.5 (1.0) 13.3 (1.6) Non-Hispanic other . . . . . . . . . . . . . . . . . . . . . . 7.2 (0.7) 9.9 (1.5) Hispanic . . . . . . . . . . . . . . . . . . . . . . . . . . . . 18.2 (1.1) 17.3 (1.8)
Health insurance coverage type
Private . . . . . . . . . . . . . . . . . . . . . . . . . . . . . 46.7 (1.6) 49.0 (2.6) Public . . . . . . . . . . . . . . . . . . . . . . . . . . . . . . 44.8 (1.6) 43.3 (2.5) Other . . . . . . . . . . . . . . . . . . . . . . . . . . . . . . 3.9 (0.7) 4.3 (1.1) Uninsured . . . . . . . . . . . . . . . . . . . . . . . . . . . 4.6 (0.7) 3.4 (0.9)
Family structure
Two parent . . . . . . . . . . . . . . . . . . . . . . . . . . . 61.0 (1.5) 63.6 (2.3) Single parent . . . . . . . . . . . . . . . . . . . . . . . . . 35.4 (1.4) 32.3 (2.2) Other . . . . . . . . . . . . . . . . . . . . . . . . . . . . . . 3.6 (0.5) 4.0 (0.9)
Poverty status Less than 100%. . . . . . . . . . . . . . . . . . . . . . . . 27.1 (1.4) 24.9 (2.3) 100%–199% . . . . . . . . . . . . . . . . . . . . . . . . . . 23.3 (1.4) 24.6 (2.3) 200%–399% . . . . . . . . . . . . . . . . . . . . . . . . . . 26.8 (1.3) 28.6 (2.6) 400% or more . . . . . . . . . . . . . . . . . . . . . . . . . 22.8 (1.3) 22.0 (2.2)
Parent’s education
High school diploma or GED2 or less . . . . . . . . . . 31.3 (1.4) 30.4 (2.4) More than high school . . . . . . . . . . . . . . . . . . . . 68.7 (1.4) 69.6 (2.4)
MSA3 status
Large MSA. . . . . . . . . . . . . . . . . . . . . . . . . . . 52.7 (1.7) 53.9 (2.8) Small MSA . . . . . . . . . . . . . . . . . . . . . . . . . . . 31.6 (1.6) 34.3 (2.6) Not in MSA . . . . . . . . . . . . . . . . . . . . . . . . . . 15.7 (1.3) 11.9 (1.9)
Geographic region
Northeast . . . . . . . . . . . . . . . . . . . . . . . . . . . . 18.7 (1.4) 18.6 (2.0) Midwest. . . . . . . . . . . . . . . . . . . . . . . . . . . . . 23.8 (1.3) 25.4 (2.4) South . . . . . . . . . . . . . . . . . . . . . . . . . . . . . . 37.0 (1.5) 36.3 (2.6) West. . . . . . . . . . . . . . . . . . . . . . . . . . . . . . . 20.5 (1.2) 19.7 (2.1)
1Sample sizes of children with intellectual disability, autism spectrum disorder, or any other developmental delay were 1,789 in 2011–2013 and 660 in 2014. 2General Educational Development high school equivalency diploma. 3Metropolitan statistical area.
SOURCE: CDC/NCHS, National Health Interview Survey, 2011–2013 and 2014.

Page 18 National Health Statistics Reports n Number 87 n November 13, 2015
Table 8. Percentages (and standard errors) of selected co-occurring conditions, functional limitations, and service utilization among children aged 3–17 years ever diagnosed with intellectual disability, autism spectrum disorder, or any other developmental delay, by survey year: United States, 2011–2013 and 2014
Characteristic 2011–20131 20141
Co-occurring conditions
Attention-deficit/hyperactivity disorder . . . . . . . . . . . . . . . 32.9 (1.4) 32.7 (2.3) Learning disability . . . . . . . . . . . . . . . . . . . . . . . . . . . 55.9 (1.5) 58.3 (2.6) Seizures, past 12 months . . . . . . . . . . . . . . . . . . . . . . 4.6 (0.7) 4.4 (1.0) Stuttered or stammered, past 12 months . . . . . . . . . . . . . 9.4 (0.9) 11.0 (1.7)
Limitations
Trouble seeing . . . . . . . . . . . . . . . . . . . . . . . . . . . . . 8.3 (0.9) 8.2 (1.4) Trouble hearing . . . . . . . . . . . . . . . . . . . . . . . . . . . . . 8.7 (0.9) 8.2 (1.4) Difficulty walking without equipment . . . . . . . . . . . . . . . . 3.4 (0.5) *2.9 (1.0) Difficulty remembering . . . . . . . . . . . . . . . . . . . . . . . . 6.3 (0.7) 5.5 (1.1) Needs help with personal care . . . . . . . . . . . . . . . . . . . 11.2 (0.9) 13.9 (1.8) Any impairment noted . . . . . . . . . . . . . . . . . . . . . . . . . 65.3 (1.5) 66.4 (2.4)
Services
Receives special education or early intervention services . . . 59.7 (1.6) 59.5 (2.6) Home care from health professional, past 12 months . . . . . 4.9 (0.7) 3.8 (1.0)
* Estimate does not meet standards of reliability or precision (relative standard error is greater than 30% and less than or equal to 50%) and should be used with caution. 1Sample sizes of children with intellectual disability, autism spectrum disorder, or any other developmental delay were 1,789 in 2011–2013 and 660 in 2014.
SOURCE: CDC/NCHS, National Health Interview Survey, 2011–2013 and 2014.

National Health Statistics Reports n Number 87 n November 13, 2015 Page 19
Technical Notes
Definition of terms
Age—Categorized as 3–10 years or 11–17 years based on the child’s age at the time of the interview.
Race and ethnicity—Based on two separate and distinct questions that determine Hispanic or Latino origin and race. Persons of Hispanic or Latino origin may be of any race. Hispanic or Latino origin includes persons of Mexican, Puerto Rican, Cuban, Central and South American, or Spanish origin. Race is based on the family respondent’s description of his or her own racial background, as well as the racial background of other family members. Race and ethnicity was categorized as non-Hispanic white (single race), non-Hispanic black (single race), non-Hispanic other (including multiple races), and Hispanic (any race or races). Estimates for non-Hispanic persons of races other than white only, black only, and Asian only, or of multiple races, are not reported.
Health insurance coverage type— Includes private, public, other, or uninsured. Public health insurance includes children with Medicaid, Children’s Health Insurance Program, or other state-sponsored health plan. Other health insurance includes children with Medicare, military health coverage, or other government programs. Uninsured children includes those who were not reported to have been covered at the time of interview or those who were covered only by Indian Health Service or had only a single service plan (e.g., dental care only). Children with more than one type of health insurance were assigned to the first appropriate category in the following mutually exclusive hierarchy: private coverage, public coverage, other coverage, or uninsured.
Family structure—Based on the parent(s) living in the household with the child. Family structure was categorized as two parent, single parent, or other. Two-parent families can include biological, adoptive, step-, or foster parents. Legal guardians are not classified as parents. Other includes
children with neither a mother nor a father living in the household.
Poverty status—Based on the ratio of the family’s income in the previous calendar year to the appropriate poverty threshold (given the family’s size and number of children) defined by the U.S. Census Bureau for that year. Estimates are based on the reported income only and may differ from estimates produced with both reported and imputed income.
Parent’s education—Based on the highest grade completed by the child’s mother or father who was living in the household, regardless of that parent’s age. This does not take into account a parent’s education if they did not live in the same household as the child.
MSA status—Categorized as inside a large metropolitan statistical area (MSA), small MSA, or not in an MSA. Large MSA is defined as a county or group of contiguous counties with a population of 1 million or more, while small MSA is defined as a population of less than 1 million.
Geographic region—In the geographic classification of the U.S. population, states are grouped into the four regions used by the U.S. Census Bureau:
Region States included
Northeast Maine, Vermont, New Hampshire, Massachusetts, Connecticut, Rhode Island, New York, New Jersey, and Pennsylvania
Midwest Ohio, Illinois, Indiana, Michigan, Wisconsin, Minnesota, Iowa, Missouri, North Dakota, South Dakota, Kansas, and Nebraska
South Delaware, Maryland, District of Columbia, West Virginia, Virginia, Kentucky, Tennessee, North Carolina, South Carolina, Georgia, Florida, Alabama, Mississippi, Louisiana, Oklahoma, Arkansas, and Texas
West Washington, Oregon, California, Nevada, New Mexico, Arizona, Idaho, Utah, Colorado, Montana, Wyoming, Alaska, and Hawaii
Attention-deficit/hyperactivity disorder—Based on a positive response to the survey question, ‘‘Has a doctor or health professional ever told you that [child’s name] had attention-deficit/ hyperactivity disorder (ADHD) or attention deficit disorder (ADD)?’’
Learning disability—Based on a positive response to the survey question, ‘‘Has a representative from a school or a health professional ever told you that [child’s name] had a learning disability?’’
Seizures—Based on a positive response to the survey question, ‘‘During the past 12 months, has [child’s name] had any of the following conditions. . . seizures?’’
Stuttered or stammered—Based on a positive response to the survey question, ‘‘During the past 12 months, has [child’s name] had any of the following conditions. . . stuttering or stammering?’’
Trouble seeing—Based on a positive response to the survey question, ‘‘Does [child’s name] have any trouble seeing even when wearing glasses or contact lenses?’’
Trouble hearing—Respondents were asked to describe the child’s hearing without the use of hearing aids or other listening devices. Based on the survey question, ‘‘Which statement best describes [child’s name’s] hearing: excellent, good, a little trouble hearing, moderate trouble, a lot of trouble, or is [child’s name] deaf?’’ Responses of ‘‘a little trouble hearing,’’ ‘‘moderate trouble,’’ ‘‘a lot of trouble,’’ and ‘‘deaf’’ were labeled trouble hearing.
Difficulty walking—Based on a positive response for the sample child to the survey question, ‘‘Because of a health problem, does anyone in the family have difficulty walking without using any special equipment?’’
Difficulty remembering—Based on a positive response for the sample child to the survey question, ‘‘Is anyone in the family limited in any way because of difficulty remembering or because they experience periods of confusion?’’
Needs help with personal care—Based on a positive response for the sample child to the survey question, ‘‘Because of a physical, mental, or
Page 20 National Health Statistics Reports n Number 87 n November 13, 2015
emotional problem, does anyone in the family need the help of other persons with personal care needs, such as eating, bathing, dressing, or getting around inside this home?’’
Any impairment noted—Based on a positive response for the sample child to the survey question, ‘‘Are any family members limited in any way in any activities because of physical, mental, or emotional problems?’’
Receives special education or early intervention services—Based on a positive response for the sample child to the survey question, ‘‘Do any of these family members, [list of children’s names], receive special educational or
early intervention services?’’Home care—Based on a positive response to the survey question, ‘‘During the past 12 months, did [sample child] receive care at home from a nurse or other health care professional?’’

U.S. DEPARTMENT OF HEALTH & HUMAN SERVICES
Centers for Disease Control and Prevention National Center for Health Statistics 3311 Toledo Road, Room 5419 Hyattsville, MD 20782–2064
FIRST CLASS MAIL POSTAGE & FEES PAID
CDC/NCHS PERMIT NO. G-284
OFFICIAL BUSINESS PENALTY FOR PRIVATE USE, $300
For more NCHS NHSRs, visit: http://www.cdc.gov/nchs/products/nhsr.htm.
National Health Statistics Reports n Number 87 n November 13, 2015
Suggested citation
Zablotsky B, Black LI, Maenner MJ, et al. Estimated prevalence of autism and other developmental disabilities following questionnaire changes in the 2014 National Health Interview Survey. National health statistics reports; no 87. Hyattsville, MD: National Center for Health Statistics. 2015.
Copyright information
All material appearing in this report is in the public domain and may be reproduced or copied without permission; citation as to source, however, is appreciated.
National Center for Health Statistics
Charles J. Rothwell, M.S., M.B.A., Director Nathaniel Schenker, Ph.D., Deputy Director
Jennifer H. Madans, Ph.D., Associate Director for Science
Division of Health Interview Statistics Marcie L. Cynamon, Director
Stephen J. Blumberg, Ph.D., Associate Director for Science
For e-mail updates on NCHS publication releases, subscribe online at: http://www.cdc.gov/nchs/govdelivery.htm. For questions or general information about NCHS: Tel: 1–800–CDC–INFO (1–800–232–4636) • TTY: 1–888–232–6348
Internet: http://www.cdc.gov/nchs • Online request form: http://www.cdc.gov/info
DHHS Publication No. 2016–1250 • CS260062
Related Documents