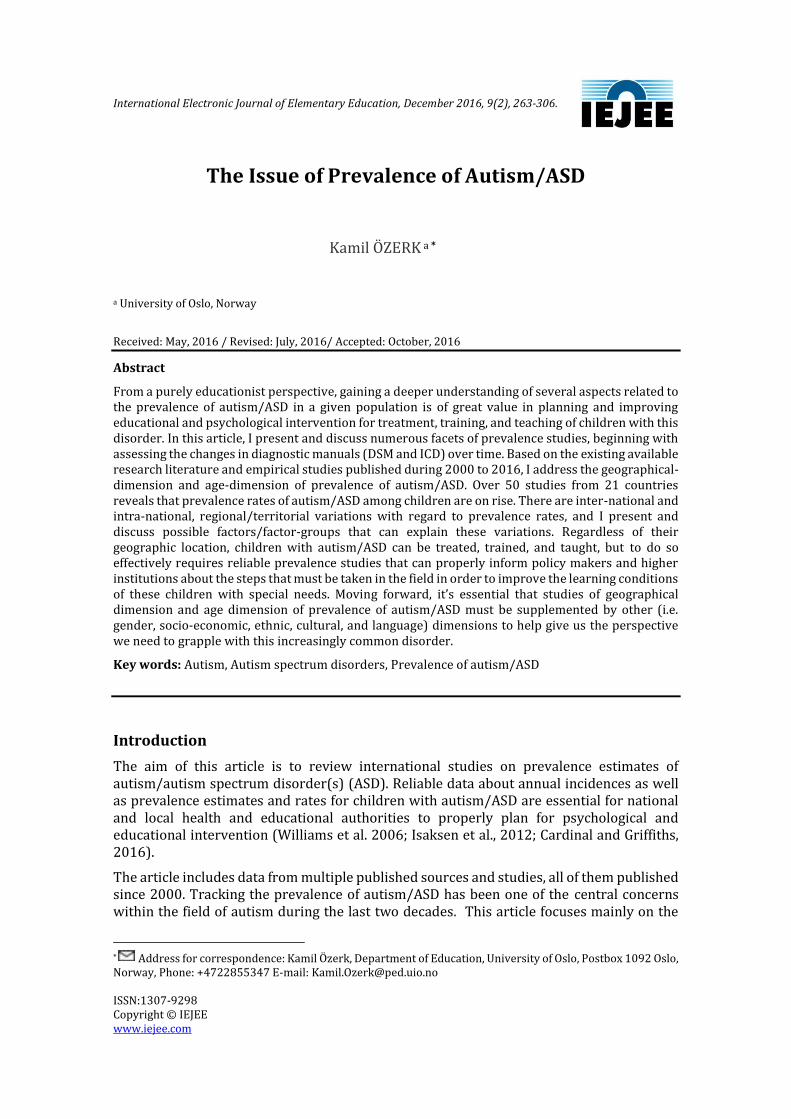
International Electronic Journal of Elementary Education, December 2016, 9(2), 263-306. ISSN:1307-9298 Copyright © IEJEE www.iejee.com The Issue of Prevalence of Autism/ASD Kamil ÖZERK a * a University of Oslo, Norway Received: May, 2016 / Revised: July, 2016/ Accepted: October, 2016 Abstract From a purely educationist perspective, gaining a deeper understanding of several aspects related to the prevalence of autism/ASD in a given population is of great value in planning and improving educational and psychological intervention for treatment, training, and teaching of children with this disorder. In this article, I present and discuss numerous facets of prevalence studies, beginning with assessing the changes in diagnostic manuals (DSM and ICD) over time. Based on the existing available research literature and empirical studies published during 2000 to 2016, I address the geographical- dimension and age-dimension of prevalence of autism/ASD. Over 50 studies from 21 countries reveals that prevalence rates of autism/ASD among children are on rise. There are inter-national and intra-national, regional/territorial variations with regard to prevalence rates, and I present and discuss possible factors/factor-groups that can explain these variations. Regardless of their geographic location, children with autism/ASD can be treated, trained, and taught, but to do so effectively requires reliable prevalence studies that can properly inform policy makers and higher institutions about the steps that must be taken in the field in order to improve the learning conditions of these children with special needs. Moving forward, it’s essential that studies of geographical dimension and age dimension of prevalence of autism/ASD must be supplemented by other (i.e. gender, socio-economic, ethnic, cultural, and language) dimensions to help give us the perspective we need to grapple with this increasingly common disorder. Key words: Autism, Autism spectrum disorders, Prevalence of autism/ASD Introduction The aim of this article is to review international studies on prevalence estimates of autism/autism spectrum disorder(s) (ASD). Reliable data about annual incidences as well as prevalence estimates and rates for children with autism/ASD are essential for national and local health and educational authorities to properly plan for psychological and educational intervention (Williams et al. 2006; Isaksen et al., 2012; Cardinal and Griffiths, 2016). The article includes data from multiple published sources and studies, all of them published since 2000. Tracking the prevalence of autism/ASD has been one of the central concerns within the field of autism during the last two decades. This article focuses mainly on the * Address for correspondence: Kamil Özerk, Department of Education, University of Oslo, Postbox 1092 Oslo, Norway, Phone: +4722855347 E-mail: [email protected]

Welcome message from author
This document is posted to help you gain knowledge. Please leave a comment to let me know what you think about it! Share it to your friends and learn new things together.
Transcript
International Electronic Journal of Elementary Education, December 2016, 9(2), 263-306.
ISSN:1307-9298 Copyright © IEJEE www.iejee.com
The Issue of Prevalence of Autism/ASD
Kamil ÖZERK a *
a University of Oslo, Norway
Received: May, 2016 / Revised: July, 2016/ Accepted: October, 2016
Abstract
From a purely educationist perspective, gaining a deeper understanding of several aspects related to the prevalence of autism/ASD in a given population is of great value in planning and improving educational and psychological intervention for treatment, training, and teaching of children with this disorder. In this article, I present and discuss numerous facets of prevalence studies, beginning with assessing the changes in diagnostic manuals (DSM and ICD) over time. Based on the existing available research literature and empirical studies published during 2000 to 2016, I address the geographical-dimension and age-dimension of prevalence of autism/ASD. Over 50 studies from 21 countries reveals that prevalence rates of autism/ASD among children are on rise. There are inter-national and intra-national, regional/territorial variations with regard to prevalence rates, and I present and discuss possible factors/factor-groups that can explain these variations. Regardless of their geographic location, children with autism/ASD can be treated, trained, and taught, but to do so effectively requires reliable prevalence studies that can properly inform policy makers and higher institutions about the steps that must be taken in the field in order to improve the learning conditions of these children with special needs. Moving forward, it’s essential that studies of geographical dimension and age dimension of prevalence of autism/ASD must be supplemented by other (i.e. gender, socio-economic, ethnic, cultural, and language) dimensions to help give us the perspective we need to grapple with this increasingly common disorder.
Key words: Autism, Autism spectrum disorders, Prevalence of autism/ASD
Introduction
The aim of this article is to review international studies on prevalence estimates of autism/autism spectrum disorder(s) (ASD). Reliable data about annual incidences as well as prevalence estimates and rates for children with autism/ASD are essential for national and local health and educational authorities to properly plan for psychological and educational intervention (Williams et al. 2006; Isaksen et al., 2012; Cardinal and Griffiths, 2016).
The article includes data from multiple published sources and studies, all of them published since 2000. Tracking the prevalence of autism/ASD has been one of the central concerns within the field of autism during the last two decades. This article focuses mainly on the
* Address for correspondence: Kamil Özerk, Department of Education, University of Oslo, Postbox 1092 Oslo, Norway, Phone: +4722855347 E-mail: [email protected]
International Electronic Journal of Elementary Education Vol.9, Issue 2, 263-306, December, 2016
264
geographical dimension and age dimension of prevalence of autism/ASD. Prior to these two main dimensions to be addressed, I will discuss one other important dimension: The criteria-dimension, which is crucial for understanding part of the recent tendencies in prevalence studies. This dimension concerns the changes in definitions and diagnosis criteria of autism/ASD over time. Due to the space limitations, other dimensions of prevalence of autism/ASD (i.e. gender dimension, socio-economical, and ethnic/linguistic minority) will not be addressed.
Prevalence of autism has to do with the question of ‘What is autism?’
In order to understand the issue of prevalence of autism/ASD, it’s necessary to clarify some of the important terms that will play a key role in this article. Autism, Autism Spectrum Disorder (ASD), Autism Spectrum Disorders (ASDs), ICD, ICD-10, DSM, DSM-IV and DSM5 incidence and prevalence are among the key terms to be addressed before we can properly address the issue of prevalence estimates and rates of ASD. As a foundation, I’ll start with defining ‘autism’ and ‘autism spectrum disorders’.
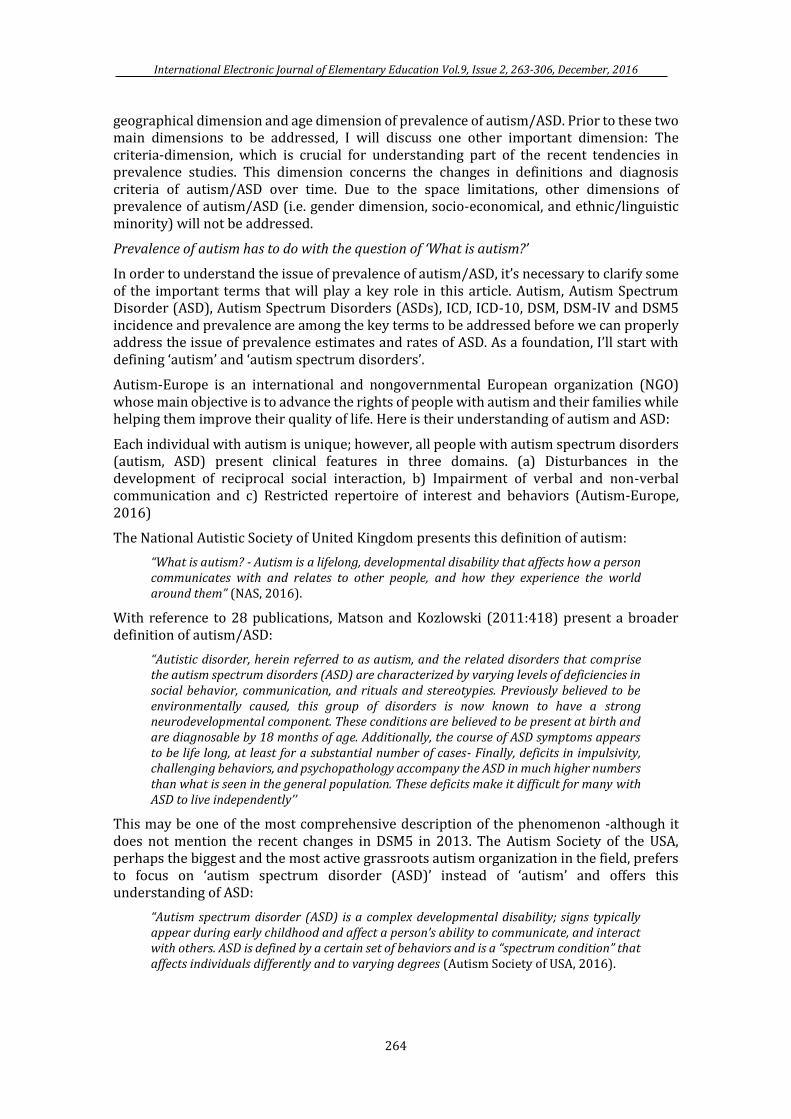
Autism-Europe is an international and nongovernmental European organization (NGO) whose main objective is to advance the rights of people with autism and their families while helping them improve their quality of life. Here is their understanding of autism and ASD:
Each individual with autism is unique; however, all people with autism spectrum disorders (autism, ASD) present clinical features in three domains. (a) Disturbances in the development of reciprocal social interaction, b) Impairment of verbal and non-verbal communication and c) Restricted repertoire of interest and behaviors (Autism-Europe, 2016)
The National Autistic Society of United Kingdom presents this definition of autism:
“What is autism? - Autism is a lifelong, developmental disability that affects how a person communicates with and relates to other people, and how they experience the world around them” (NAS, 2016).
With reference to 28 publications, Matson and Kozlowski (2011:418) present a broader definition of autism/ASD:
“Autistic disorder, herein referred to as autism, and the related disorders that comprise the autism spectrum disorders (ASD) are characterized by varying levels of deficiencies in social behavior, communication, and rituals and stereotypies. Previously believed to be environmentally caused, this group of disorders is now known to have a strong neurodevelopmental component. These conditions are believed to be present at birth and are diagnosable by 18 months of age. Additionally, the course of ASD symptoms appears to be life long, at least for a substantial number of cases- Finally, deficits in impulsivity, challenging behaviors, and psychopathology accompany the ASD in much higher numbers than what is seen in the general population. These deficits make it difficult for many with ASD to live independently’’
This may be one of the most comprehensive description of the phenomenon -although it does not mention the recent changes in DSM5 in 2013. The Autism Society of the USA, perhaps the biggest and the most active grassroots autism organization in the field, prefers to focus on ‘autism spectrum disorder (ASD)’ instead of ‘autism’ and offers this understanding of ASD:
“Autism spectrum disorder (ASD) is a complex developmental disability; signs typically appear during early childhood and affect a person’s ability to communicate, and interact with others. ASD is defined by a certain set of behaviors and is a “spectrum condition” that affects individuals differently and to varying degrees (Autism Society of USA, 2016).
The Issue of Prevalence of Autism/ Özerk
265
As can be seen in these various definitions, Autism-Europe includes both autism and ASD in its definition while The National Autistic Society of the UK focuses on ‘autism’ without mentioning 'Autism spectrum disorder (ASD)' although the definition may also apply for children with ASD. On the other hand, when we look at the definition given by the Autism Society of the USA, it defines Autism spectrum disorder’ (DSM5, 2013) and not ‘autism’. This is in line with the latest changes in DSM5, which I’ll discuss later in this article. Another important American organization is Autism Speaks, an autism science and advocacy organization. Autism Speaks has a similar approach to the concepts of autism and ‘autism spectrum disorder (ASD)’ as the Autism Society of the USA:
“Autism spectrum disorder (ASD) and autism are both general terms for a group of complex disorders of brain development. These disorders are characterized, in varying degrees, by difficulties in social interaction, verbal and nonverbal communication and repetitive behaviors.” (Autism Speaks, 2016).
Furthermore, they add this
“With the May 2013 publication of the DSM-5 diagnostic manual, all autism disorders were merged into one umbrella diagnosis of ASD. Previously, they were recognized as distinct subtypes, including autistic disorder, childhood disintegrative disorder, pervasive developmental disorder-not otherwise specified (PDD-NOS) and Asperger syndrome.” (Autism Speaks, 2016).
Two of the central researchers in the field of autism/ASD research - Dr. Catherine Lord and Dr. Somer L. Bishop:
“A diagnosis of ASD is based on descriptions and observations of behavior. […] there is much evidence that autism is a neurodevelopmental disorder with a very strong genetic component...” (Lord & Bishop, 2010: 3-4).
As it is seen here, autism/ASD is considered as a neurodevelopmental disorder. For the purpose of this review of prevalence estimates and rates, I prefer not to make any distinction between the terms ‘autism’ and ‘autism spectrum disorder (ASD)’ and will therefore refer both of these disorders together. When the term ASD is used alone, it refers to and includes ‘classic autism’, ‘child autism’ or ‘autistic disorder’, ‘Asperger’s syndrome’, and the diagnosis of ‘pervasive developmental disorder-not otherwise specified (PDD-NOS)’. This approach is in line with what I call the ‘spectrum-oriented approach to autism disorder’ taken by researchers at the U.S. Department of Health and Human Services, Centers for Disease Control and Prevention. They express their understanding of ASD in this way:
“Autism spectrum disorder (ASD) is a set of complex neurodevelopment disorders that include autistic disorder, Asperger disorder, and pervasive developmental disorder not otherwise specified (1). Children who have ASD display mild to severe impairments in social interaction and communication along with restricted, repetitive, and stereotyped patterns of behaviors, interests, and activities.” (Blumberg et al., 2013, 1).
Because ‘autism spectrum disorder’ (ASD) is a diagnostic category for a set of complex neurodevelopment disorders, it’s a medical term. ASD, meanwhile, is a name for identified neurodevelopment disorders, and thus a name for a diagnosis given by specialized physicians and/or psychiatrists based on the fulfillment of the criteria presented in two manuals that I’ll discuss in the following sections.
The two diagnostic and classification manuals: ICD and DSM
ICD and DSM are the manuals now being used to make a diagnosis of autism and ASD by specialized health professionals. ICD stands for International Classification of Diseases (ICD) and was published by the World Health Organization (WHO). The history of ICD goes
International Electronic Journal of Elementary Education Vol.9, Issue 2, 263-306, December, 2016
266
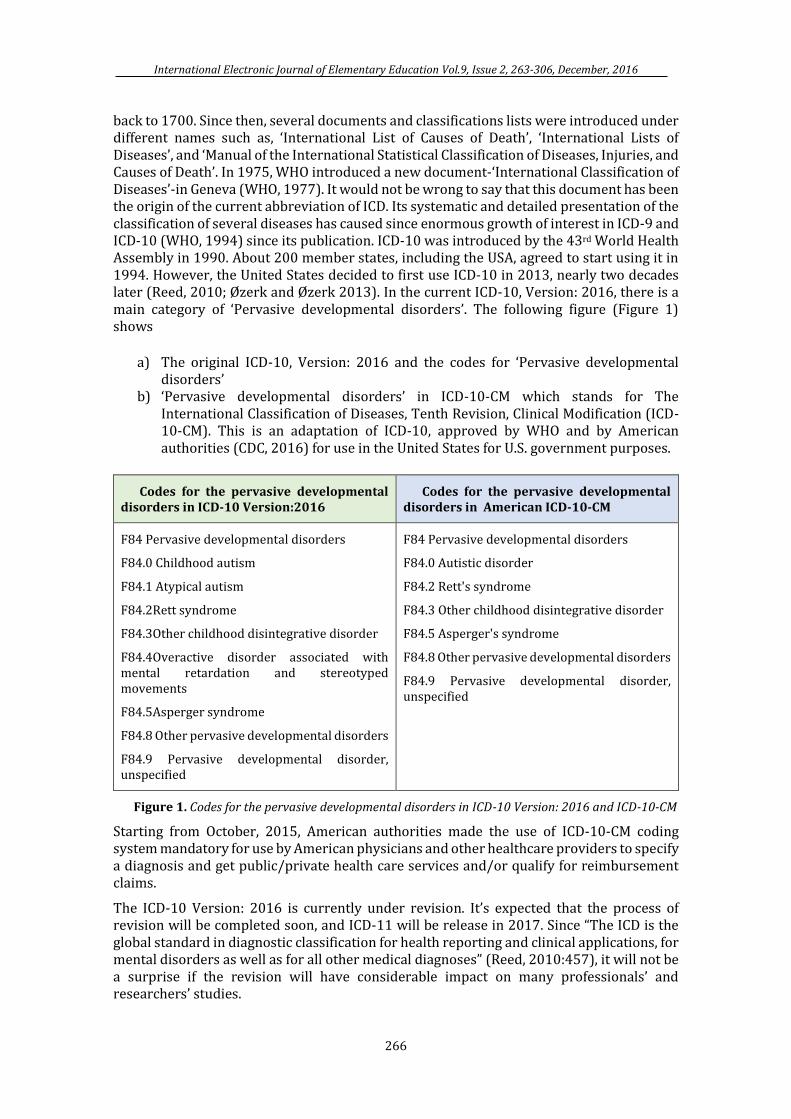
back to 1700. Since then, several documents and classifications lists were introduced under different names such as, ‘International List of Causes of Death’, ‘International Lists of Diseases’, and ‘Manual of the International Statistical Classification of Diseases, Injuries, and Causes of Death’. In 1975, WHO introduced a new document-‘International Classification of Diseases’-in Geneva (WHO, 1977). It would not be wrong to say that this document has been the origin of the current abbreviation of ICD. Its systematic and detailed presentation of the classification of several diseases has caused since enormous growth of interest in ICD-9 and ICD-10 (WHO, 1994) since its publication. ICD-10 was introduced by the 43rd World Health Assembly in 1990. About 200 member states, including the USA, agreed to start using it in 1994. However, the United States decided to first use ICD-10 in 2013, nearly two decades later (Reed, 2010; Øzerk and Øzerk 2013). In the current ICD-10, Version: 2016, there is a main category of ‘Pervasive developmental disorders’. The following figure (Figure 1) shows
a) The original ICD-10, Version: 2016 and the codes for ‘Pervasive developmental disorders’
b) ‘Pervasive developmental disorders’ in ICD-10-CM which stands for The International Classification of Diseases, Tenth Revision, Clinical Modification (ICD-10-CM). This is an adaptation of ICD-10, approved by WHO and by American authorities (CDC, 2016) for use in the United States for U.S. government purposes.
Codes for the pervasive developmental disorders in ICD-10 Version:2016
Codes for the pervasive developmental disorders in American ICD-10-CM
F84 Pervasive developmental disorders
F84.0 Childhood autism
F84.1 Atypical autism
F84.2Rett syndrome
F84.3Other childhood disintegrative disorder
F84.4Overactive disorder associated with mental retardation and stereotyped movements
F84.5Asperger syndrome
F84.8 Other pervasive developmental disorders
F84.9 Pervasive developmental disorder, unspecified
F84 Pervasive developmental disorders
F84.0 Autistic disorder
F84.2 Rett's syndrome
F84.3 Other childhood disintegrative disorder
F84.5 Asperger's syndrome
F84.8 Other pervasive developmental disorders
F84.9 Pervasive developmental disorder, unspecified
Figure 1. Codes for the pervasive developmental disorders in ICD-10 Version: 2016 and ICD-10-CM
Starting from October, 2015, American authorities made the use of ICD-10-CM coding system mandatory for use by American physicians and other healthcare providers to specify a diagnosis and get public/private health care services and/or qualify for reimbursement claims.
The ICD-10 Version: 2016 is currently under revision. It’s expected that the process of revision will be completed soon, and ICD-11 will be release in 2017. Since “The ICD is the global standard in diagnostic classification for health reporting and clinical applications, for mental disorders as well as for all other medical diagnoses” (Reed, 2010:457), it will not be a surprise if the revision will have considerable impact on many professionals’ and researchers’ studies.
The Issue of Prevalence of Autism/ Özerk
267
This brief look at the revision-history of ICD shows a clear pattern of regularly updating ICD. The revisions and updates have often been the result of new research findings, research reviews, and expert opinion. The revisions, as we’ll discuss later, once had some impact on diagnostic criteria, diagnostic practices, and prevalence statistics and prevalence estimates.
DSM: Diagnostic and Statistical Manual of Mental Disorders
Even though ICD is a global diagnostic manual and all the member states of WHO, including the United States, are obliged to use it (Reed, 2010), the American Psychiatric Association, USA, as mentioned earlier, developed and uses (along with ICD-10) another manual: Diagnostic and Statistical Manual of Mental Disorders (DSM), edited by the American Psychiatric Association (APA). The first DSM came out in 1952. The first revised version, DSM II appeared in 1968. Neither of these manuals included ‘autism’, but the third one, DSM-III which was edited in 1980, did under the term of ‘infantile autism’. It wasn't until 1987, when a revised version of DSM III came out (DSM III-R), that ‘infantile autism’ was replaced by ‘autism’. This version of DSM was followed by DSM-IV in 1994 and a text revised version, DSM-IV-TR, published in 2000. In DSM-IV-TR a new category of diseases was introduced under the name of ‘Pervasive Developmental Disorders’ and included the following sub-categories: ‘Asperger's Disorder’, ‘Autistic Disorder’, ‘Childhood Disintegrative Disorder', ‘Rett's Disorder’, and ‘Pervasive Developmental Disorder (Including Atypical Autism) Not Otherwise Specified’ or ‘PDD-NOS’.
In 2013, the current version of DSM was published under the name of DSM5. One of the biggest changes in DSM5 was that the separate diagnostic labels of Autistic Disorder, Asperger’s Disorder, and PDD-NOS were replaced by one umbrella term: ‘Autism Spectrum Disorder’ (ASD). At the same time, important distinctions were made based on severity in the two domains: Severity levels of difficulties with social communication on the one side and severity level of fixated or repetitive and restricted behaviors or interests on the other. The significant consequence of these changes is that a person who receives an ASD diagnosis at Level 1, Level 2, and Level 3 will be prescribed intervention measures like therapies, treatment, training, and teaching according to the severity level. These changes caused several concerns among researchers, professionals, and parents (Vivanti et.al., 2013a, 2013b; Mattila et.al., 2015). A relevant question for the purpose of this article is whether DSM5 has some impact on the prevalence of diagnoses of autism/ASD.
According to Compart (2012) the mentioned changes in DSM5 and the new criteria are more thorough and strict compared to the old criteria and thus there is uncertainty regarding how state and educational services and insurance companies will adopt these changes. As one can see, there are several stakeholders in the United States who can be affected by changes in diagnostic criteria. One may ask whether it was necessary to present in brief the historical development DSM and the current DSM5 since the U.S. is as much obliged to use ICD-10 as any other member state. The short answer is that the Diagnostic and Statistical Manual of Mental Disorders (DSM) has often been referred to as …‘the bible’ of psychiatric diagnostic texts” in the United States (Kupfer, Regier & Kuhl, 2008:2).
As noted above, the term ‘Autism spectrum disorder’ (ASD) was introduced in DSM5 for the first time in 2013, but among researchers, the terms ‘Pervasive developmental disorders’, ‘Autism spectrum disorder’, ‘Autism spectrum disorders’, and ‘autism’ were all being used as general terms for a group of complex disorders of neurological or brain development (Pierce, 2011, Pierce et al., 2011; Courchesne, 2011) for some time prior to the changes of 2013. The American Psychiatric Association explains the 2013 changes in DSM 5 by asserting that
“Autism spectrum disorder (ASD) incorporates four disorders from the previous manual: autistic disorder, Asperger’s disorder, childhood disintegrative disorder, and the catch-
International Electronic Journal of Elementary Education Vol.9, Issue 2, 263-306, December, 2016
268
all diagnosis of pervasive developmental disorder not otherwise specified. Researchers found that those four diagnoses were inconsistently applied across clinics and treatment centers and, rather than distinct disorders, actually represented symptoms and behaviors along a severity continuum. ASD reflects that continuum and is a more accurate and medically and scientifically useful approach. People diagnosed with one of the separate DSM-IV disorders should still meet the criteria for autism spectrum disorder or a different DSM-5 diagnosis”.
The changes of manuals and diagnosis categories and subcategories or subtypes of autism as well as the differences inherent between various versions of ICD-10 and different versions of DSM over the last several decades have had, as expected, clear impact on the prevalence statistics, estimates, and rates.
True prevalence estimates and rates
Prevalence studies rely on ‘incidence of autism/ASD’. Thus the term of incidence is one of the terms we must clarify here. The lexical definition of incidence is “…the rate at which something happens” (Cambridge Advanced Learner’s Dictionary & Thesaurus Cambridge University Press). Within the field of autism, it is being used to chart the number of new cases of autism or ASD that receive the diagnosis each year. Prevalence, on the other hand, refers to (according to the above-noted dictionary), “the fact of something existing or happening often”. It’s common for authorities in many countries working on autism/ASD to present prevalence statistics. One of the reasons for this may be the fact that an ‘autism/ASD’ diagnosis refers to a life-long neurodevelopmental condition (even though the severity level may vary) that makes a tremendous impact on families, insurance companies, public and private health care services, and educational institutions. The two most powerful agencies for prevalence statistics in the United States, the Centers for Disease Control and Prevention (CDC) and a network of sites that are funded by the CDC known as the ‘Autism and Developmental Disabilities Monitoring (ADDM) Network’, define prevalence as “…the number of people in a population that have a condition relative to all of the people in the population” (CDC, 2016) or the proportion of a population that has the characteristic at a given time period.
To be even clearer, the prevalence of autism/ASD equates to the number of children who were diagnosed autism/ASD at a given age or between two different ages in a given area/population. Prevalence is typically shown as a) x out of 10,000, or b) x out of 1,000, or c) a percent (e.g. 1%) or a proportion (e.g. 1 in 100). Prevalence estimates for a nation or a specific group of children (based on age or gender, for example) in a given country or geographic area are made on the bases of proportion of incidences found in a representative data. As the aim of this article is to add reliable information to the field, the issue of prevalence or prevalence estimates of autism/ASD will be presented in a way that highlights important details, limitations, and tendencies.
USA paves the way in the prevalence studies and debates
The United States of America is an enormous country consisting of 50 states with a total population of approximately 325 million. The country has a considerable number of research institutions and national autism associations, as well as federal agencies for health statistics. A number of different stakeholders with different agendas become involved when an autism or ASD diagnosis is given. School districts, health insurance companies, advocacy groups, and parents immediately become involved when a child receives a diagnosis of autism/ASD. Any changes in the diagnostic criteria used to make that diagnosis, therefore, have a serious impact on all the parties involved. At the core of this involvement is money. Adapted treatment, therapy, training and teaching of children with autism/ASD
The Issue of Prevalence of Autism/ Özerk
269
prerequisites requires competent staff who must be paid. And providing qualified help to children with autism/ASD is mandatory by law.
That law is known as the Individuals with Disabilities Education Act (IDEA) in the United States, enacted by Congress in 1975, ensuring that children with disabilities have the opportunity to receive a free appropriate public education, just like other children. However, children with autism/ASD need qualified help not only for their public education, but also during after school hours, on holidays, and at home. And as we know, there is no medical treatment or known cure for autism. Those with autism can be treated with therapy and taught using evidence-based educational and psychological methods and practices. Research has revealed that children have shown significant improvement as a result of early diagnosis and long term use of effective interventions (Lovaas, 1987; Pierce and Schreibman, 1994; Green, 1996 ; McGee et al., 1999; Charlop-Christy et al., 1999; Eikeseth et al., 2002; Remington et al., 2007; Remington et al., 2007; Koegel et.al., 2009; Odom et. al., 2010; Gotham et al., 2011; Rapin, 2011; Stahmer et.al, 2012; Øzerk and Øzerk, 2013; Eikeseth & Klintwall, 2014; NAC, 2015). Providing intensive and long-term treatment, therapy, training, and adapted teaching for these children has considerable economic consequences for the families, health care providers and the public educational system, however (Lavelle et. Al. 2014; Paul Leigh and Du., 2015). Any changes in the DSM inevitably spark a debate on children’s rights to appropriate special needs education and health care support, with the health insurance companies, parents, and public agencies all taking their own disparate views.
Changes in DSM over the years have also caused a debate about prevalence statistics in the U.S. as well. During the last decade, American prevalence statistics on autism paved the way for international attention and debate on the prevalence of autism. As mentioned earlier, prevalence of autism has implications for psychological and educational services (i.e. therapy, treatment, training, and teaching of children with autism/ASD) as well as economic consequences, but the American prevalence statistics have also brought about increased debate over research on the effect of recent changes in diagnosis criteria (Hansen et al., 2014; Smith et al., 2015; Cardinal and Griffiths, 2016). In the following sections, I will first present the main tendencies found in the prevalence estimates and rates of autism/ASD in the United States, and then present international tendencies in prevalence rates for autism/ASD based on available and reliable statewide and/or regional statistics from 21 countries based on more than 50 empirical studies.
“Autism is the fastest-growing developmental disability” in the last decade
Prevalence statistics in the United States are based on real representative data and estimates from the available representative data. The American CDC is the main and most reliable source for prevalence statistics in the USA. It receives federal funds and also provides funding for studies and programs to monitor and report data about diseases. Additionally, the Autism and Developmental Disabilities Monitoring (ADDM) Network is a group of programs funded by the CDC to estimate the number of children with autism spectrum disorder (ASD) living in different areas of the United States (CDC 2016). The ADDM consists of several network sites that collect data. The ADDM surveillance system has ascertained ASD among 8-year-old children through systematic review of clinical and educational records in accordance with the CDC’s surveillance program ‘Metropolitan Atlanta Developmental Disabilities Surveillance Program (MADDSP)’.
The ADDM Network sites collect data about the population of children with autism/ASD, compare the number of children who are diagnosed with autism/ASD in different areas and states of the US since 2000, and identify and present changes in the number of children with autism/ASD. The heading line of this section “Autism is the fastest-growing developmental
International Electronic Journal of Elementary Education Vol.9, Issue 2, 263-306, December, 2016
270
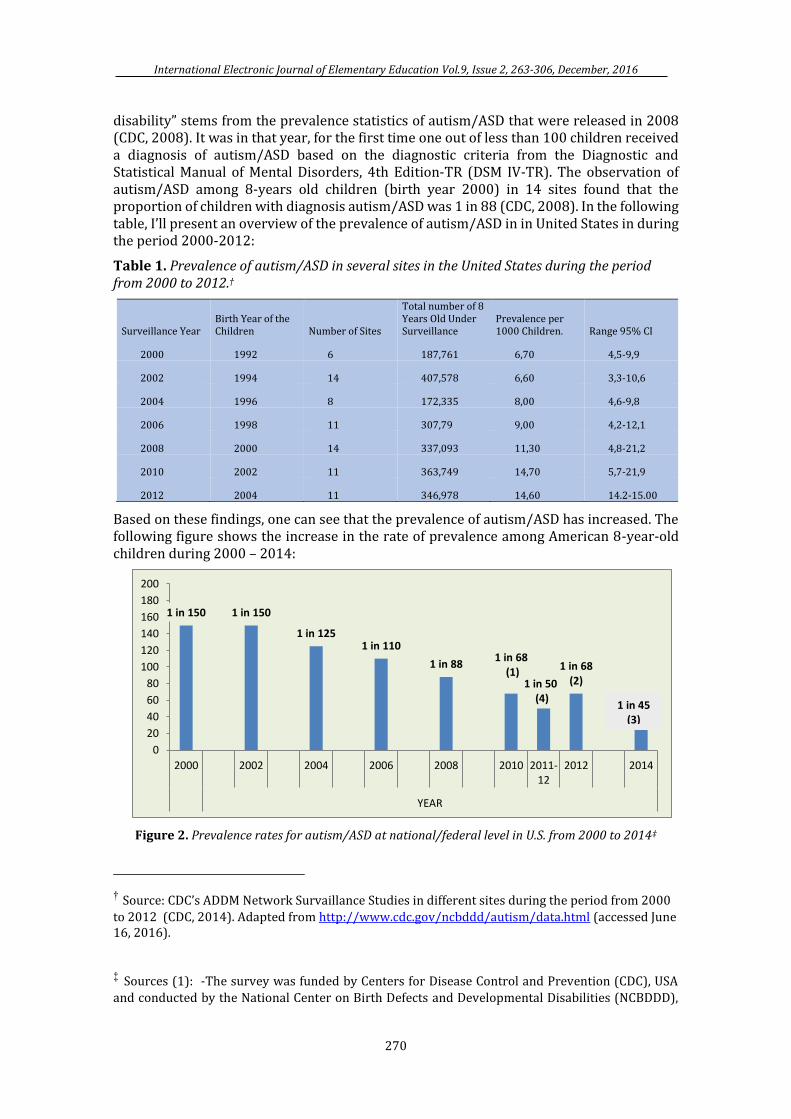
disability” stems from the prevalence statistics of autism/ASD that were released in 2008 (CDC, 2008). It was in that year, for the first time one out of less than 100 children received a diagnosis of autism/ASD based on the diagnostic criteria from the Diagnostic and Statistical Manual of Mental Disorders, 4th Edition-TR (DSM IV-TR). The observation of autism/ASD among 8-years old children (birth year 2000) in 14 sites found that the proportion of children with diagnosis autism/ASD was 1 in 88 (CDC, 2008). In the following table, I’ll present an overview of the prevalence of autism/ASD in in United States in during the period 2000-2012:
Table 1. Prevalence of autism/ASD in several sites in the United States during the period from 2000 to 2012.†
Surveillance Year Birth Year of the Children Number of Sites
Total number of 8 Years Old Under Surveillance
Prevalence per 1000 Children. Range 95% CI
2000 1992 6 187,761 6,70 4,5-9,9
2002 1994 14 407,578 6,60 3,3-10,6
2004 1996 8 172,335 8,00 4,6-9,8
2006 1998 11 307,79 9,00 4,2-12,1
2008 2000 14 337,093 11,30 4,8-21,2
2010 2002 11 363,749 14,70 5,7-21,9
2012 2004 11 346,978 14,60 14.2-15.00
Based on these findings, one can see that the prevalence of autism/ASD has increased. The following figure shows the increase in the rate of prevalence among American 8-year-old children during 2000 – 2014:
Figure 2. Prevalence rates for autism/ASD at national/federal level in U.S. from 2000 to 2014‡
† Source: CDC’s ADDM Network Survaillance Studies in different sites during the period from 2000
to 2012 (CDC, 2014). Adapted from http://www.cdc.gov/ncbddd/autism/data.html (accessed June 16, 2016).
‡ Sources (1): -The survey was funded by Centers for Disease Control and Prevention (CDC), USA
and conducted by the National Center on Birth Defects and Developmental Disabilities (NCBDDD),
1 in 150 1 in 150
1 in 1251 in 110
1 in 881 in 68
(1)1 in 68
(2)1 in 50(4)
0
20
40
60
80
100
120
140
160
180
200
2000 2002 2004 2006 2008 2010 2011-12
2012 2014
YEAR
1 in 45 (3)
The Issue of Prevalence of Autism/ Özerk
271
The figure shows that the prevalence estimates in the U.S. rose significantly from 2000 to 2014. While 1 in 150 children received a diagnosis of autism/ASD in 2000, this proportion rose to 1 in 45 by 2014. Although the surveillance studies had in some years different age groups (in 2010 and 2012 the study group was 8 years-old; the 2014 rate in the figure was based on surveillance of children 6-17 years-old), the tendency at the national level in the United States is quite clear: The estimated prevalence of autism/ASD among 8 years-old and 6-17 years-old has risen dramatically in recent years.
Prevalence of Autism/ASD at the state/regional level in the United States
It is very clear that for the period from 2000 to 2014, the prevalence of autism/ASD at the national/federal level has increased continuously. This rise in the prevalence rate for autism/ASD among 8 year-olds equates to about 120% from 2000 to 2012 and 23% from 2008 to 2012. If the prevalence estimate (1 in 68) for 8 year-olds in 2012 is representative for 6-17 year-olds in 2012, we can say that the rise is 23% from 2012 (1 in 68) to 2014 (1 in 45).
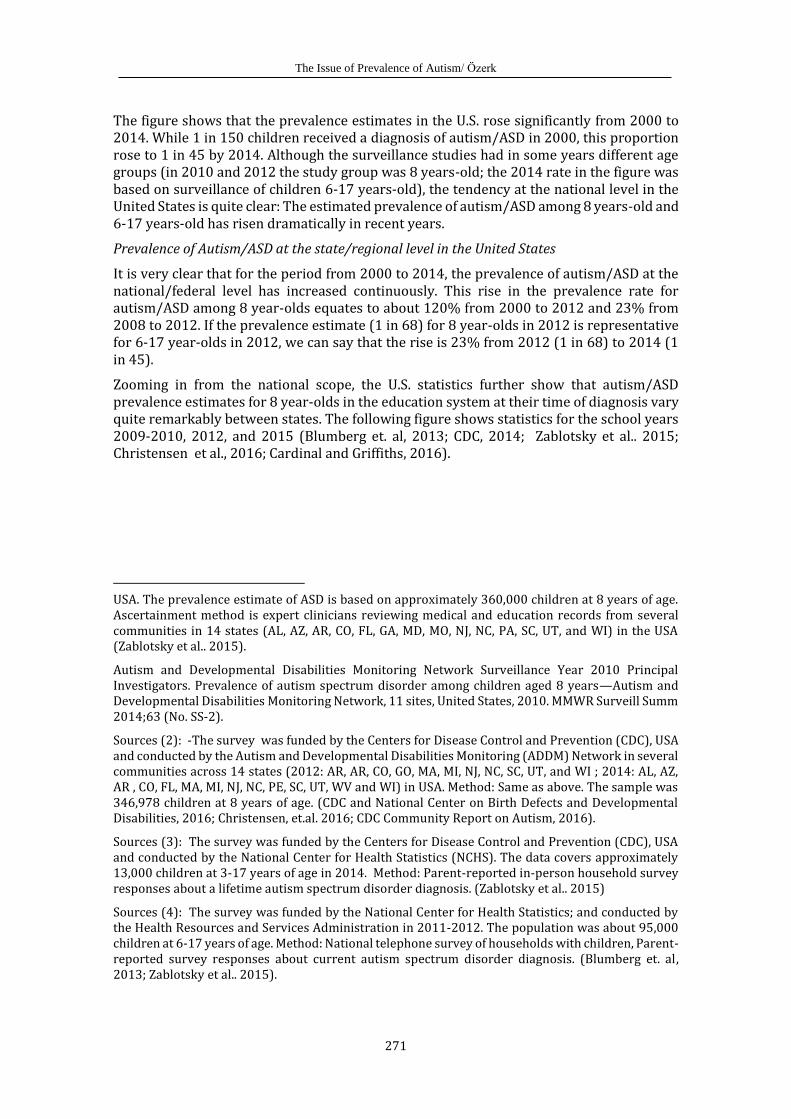
Zooming in from the national scope, the U.S. statistics further show that autism/ASD prevalence estimates for 8 year-olds in the education system at their time of diagnosis vary quite remarkably between states. The following figure shows statistics for the school years 2009-2010, 2012, and 2015 (Blumberg et. al, 2013; CDC, 2014; Zablotsky et al.. 2015; Christensen et al., 2016; Cardinal and Griffiths, 2016).
USA. The prevalence estimate of ASD is based on approximately 360,000 children at 8 years of age. Ascertainment method is expert clinicians reviewing medical and education records from several communities in 14 states (AL, AZ, AR, CO, FL, GA, MD, MO, NJ, NC, PA, SC, UT, and WI) in the USA (Zablotsky et al.. 2015).
Autism and Developmental Disabilities Monitoring Network Surveillance Year 2010 Principal Investigators. Prevalence of autism spectrum disorder among children aged 8 years—Autism and Developmental Disabilities Monitoring Network, 11 sites, United States, 2010. MMWR Surveill Summ 2014;63 (No. SS-2).
Sources (2): -The survey was funded by the Centers for Disease Control and Prevention (CDC), USA and conducted by the Autism and Developmental Disabilities Monitoring (ADDM) Network in several communities across 14 states (2012: AR, AR, CO, GO, MA, MI, NJ, NC, SC, UT, and WI ; 2014: AL, AZ, AR , CO, FL, MA, MI, NJ, NC, PE, SC, UT, WV and WI) in USA. Method: Same as above. The sample was 346,978 children at 8 years of age. (CDC and National Center on Birth Defects and Developmental Disabilities, 2016; Christensen, et.al. 2016; CDC Community Report on Autism, 2016).
Sources (3): The survey was funded by the Centers for Disease Control and Prevention (CDC), USA and conducted by the National Center for Health Statistics (NCHS). The data covers approximately 13,000 children at 3-17 years of age in 2014. Method: Parent-reported in-person household survey responses about a lifetime autism spectrum disorder diagnosis. (Zablotsky et al.. 2015)
Sources (4): The survey was funded by the National Center for Health Statistics; and conducted by the Health Resources and Services Administration in 2011-2012. The population was about 95,000 children at 6-17 years of age. Method: National telephone survey of households with children, Parent-reported survey responses about current autism spectrum disorder diagnosis. (Blumberg et. al, 2013; Zablotsky et al.. 2015).
International Electronic Journal of Elementary Education Vol.9, Issue 2, 263-306, December, 2016
272
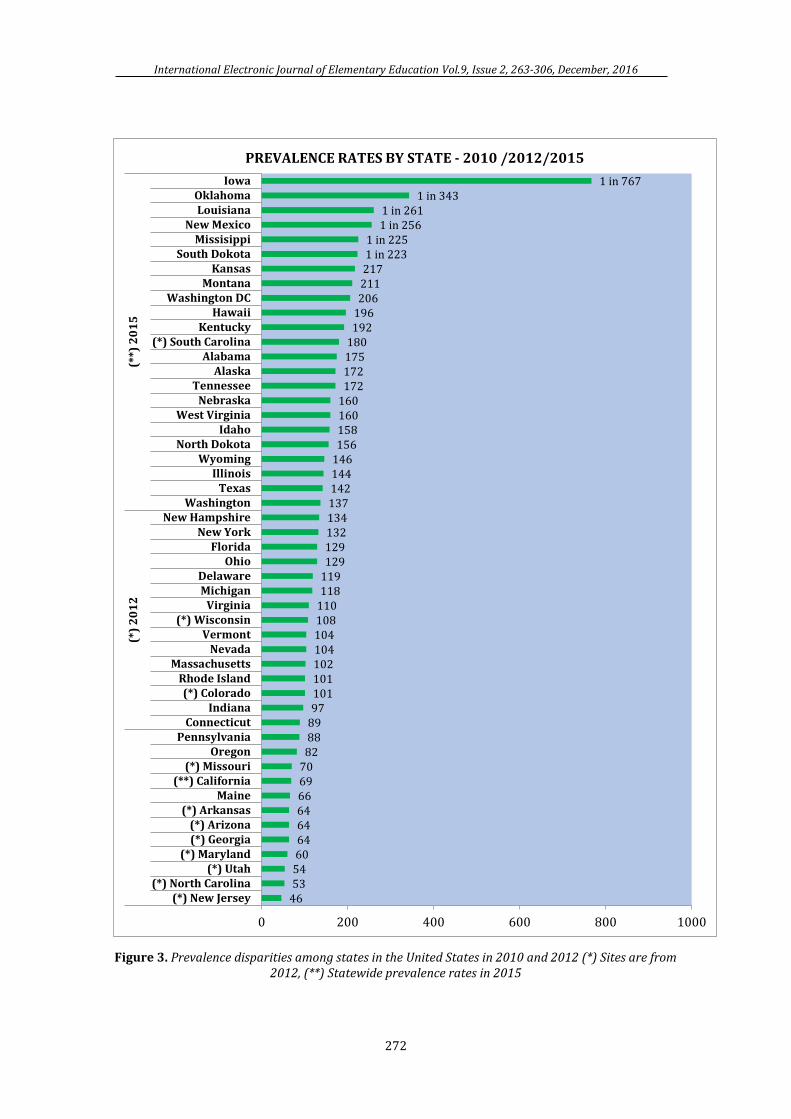
Figure 3. Prevalence disparities among states in the United States in 2010 and 2012 (*) Sites are from 2012, (**) Statewide prevalence rates in 2015
46535460646464666970828889971011011021041041081101181191291291321341371421441461561581601601721721751801921962062112171 in 2231 in 225
1 in 2561 in 261
1 in 3431 in 767
0 200 400 600 800 1000
(*) New Jersey(*) North Carolina
(*) Utah(*) Maryland
(*) Georgia(*) Arizona
(*) ArkansasMaine
(**) California(*) Missouri
OregonPennsylvania
ConnecticutIndiana
(*) ColoradoRhode Island
MassachusettsNevada
Vermont(*) Wisconsin
VirginiaMichiganDelaware
OhioFlorida
New YorkNew Hampshire
WashingtonTexas
IllinoisWyoming
North DokotaIdaho
West VirginiaNebraska
TennesseeAlaska
Alabama(*) South Carolina
KentuckyHawaii
Washington DCMontana
KansasSouth Dokota
MissisippiNew Mexico
LouisianaOklahoma
Iowa
(*)
20
12
(**)
20
15
PREVALENCE RATES BY STATE - 2010 /2012/2015
The Issue of Prevalence of Autism/ Özerk
273
As Figure 3 makes clear, there are huge differences in prevalence rates for autism/ASD between states in the United States. New Jersey has the highest rate and Iowa the lowest prevalence rate. Prevalence of autism/ASD is almost 17 times more common among children in New Jersey compared to Iowa. While the prevalence rate for autism/ASD is 1 in 46 for New Jersey, the rate is 1in 767 in Iowa for children age eight. Another striking result found here is that two neighboring states North Carolina and South Carolina have significantly different prevalence rates. The likelihood to have the diagnosis of autism/ASD as an 8 year-old child in North Carolina is almost three times higher than in South Carolina. These prevalence figures have triggered a huge debate about the causes of the increase as well as the geographic variations. Having presented and discussed national and statewide prevalence rates in the United States, we'll turn our attention in the following section to a recent study at the county level in the state of California, U.S.
County level prevalence rates: Orange County in California
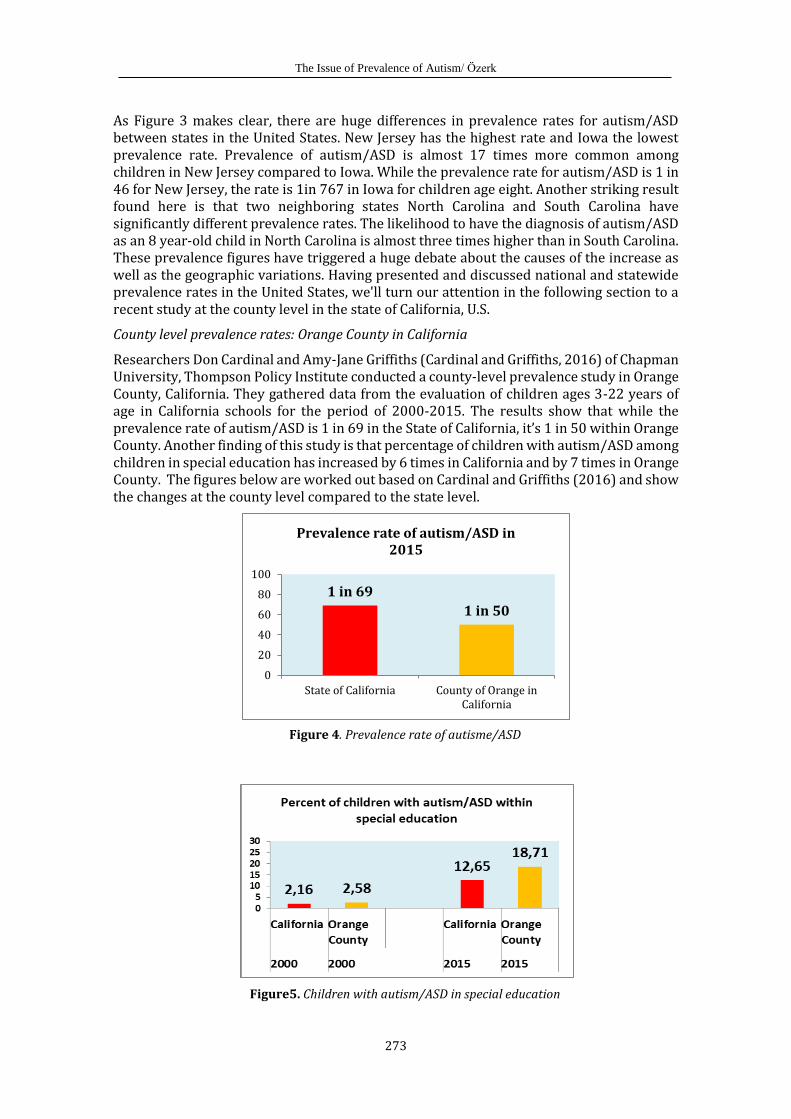
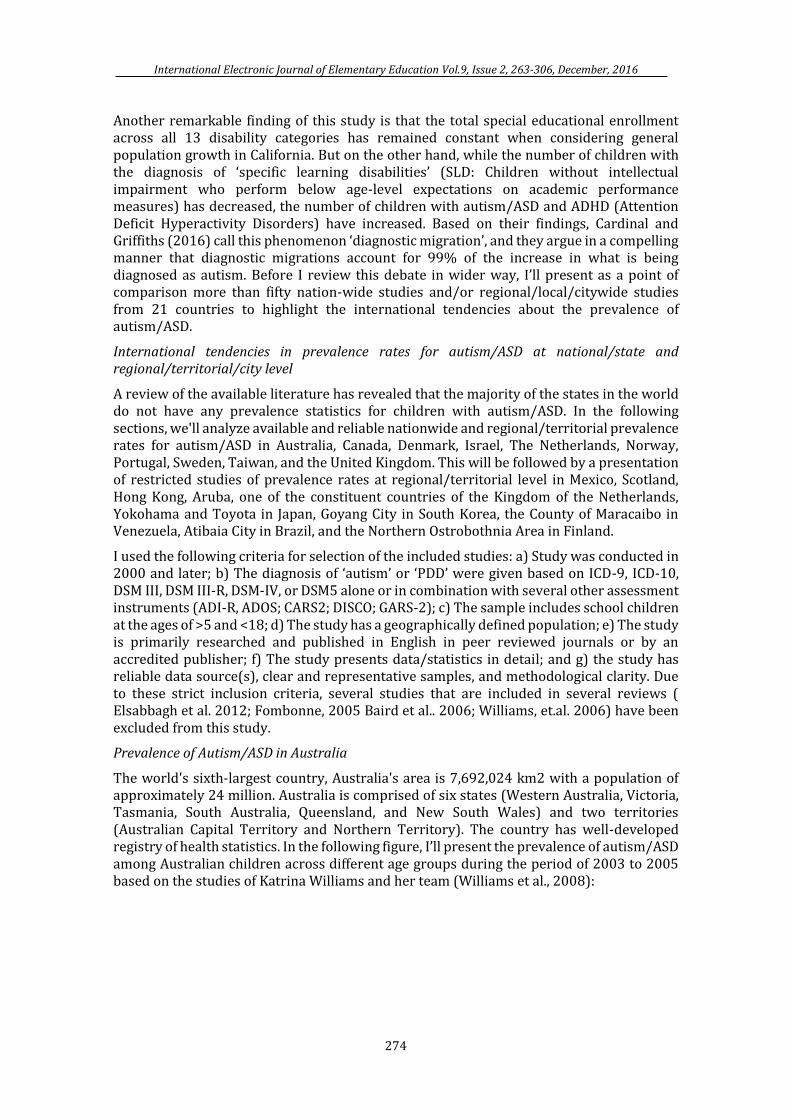
Researchers Don Cardinal and Amy-Jane Griffiths (Cardinal and Griffiths, 2016) of Chapman University, Thompson Policy Institute conducted a county-level prevalence study in Orange County, California. They gathered data from the evaluation of children ages 3-22 years of age in California schools for the period of 2000-2015. The results show that while the prevalence rate of autism/ASD is 1 in 69 in the State of California, it’s 1 in 50 within Orange County. Another finding of this study is that percentage of children with autism/ASD among children in special education has increased by 6 times in California and by 7 times in Orange County. The figures below are worked out based on Cardinal and Griffiths (2016) and show the changes at the county level compared to the state level.
Figure 4. Prevalence rate of autisme/ASD
Figure5. Children with autism/ASD in special education
1 in 69
1 in 50
0
20
40
60
80
100
State of California County of Orange inCalifornia
Prevalence rate of autism/ASD in 2015
International Electronic Journal of Elementary Education Vol.9, Issue 2, 263-306, December, 2016
274
Another remarkable finding of this study is that the total special educational enrollment across all 13 disability categories has remained constant when considering general population growth in California. But on the other hand, while the number of children with the diagnosis of ‘specific learning disabilities’ (SLD: Children without intellectual impairment who perform below age-level expectations on academic performance measures) has decreased, the number of children with autism/ASD and ADHD (Attention Deficit Hyperactivity Disorders) have increased. Based on their findings, Cardinal and Griffiths (2016) call this phenomenon ‘diagnostic migration’, and they argue in a compelling manner that diagnostic migrations account for 99% of the increase in what is being diagnosed as autism. Before I review this debate in wider way, I’ll present as a point of comparison more than fifty nation-wide studies and/or regional/local/citywide studies from 21 countries to highlight the international tendencies about the prevalence of autism/ASD.
International tendencies in prevalence rates for autism/ASD at national/state and regional/territorial/city level
A review of the available literature has revealed that the majority of the states in the world do not have any prevalence statistics for children with autism/ASD. In the following sections, we'll analyze available and reliable nationwide and regional/territorial prevalence rates for autism/ASD in Australia, Canada, Denmark, Israel, The Netherlands, Norway, Portugal, Sweden, Taiwan, and the United Kingdom. This will be followed by a presentation of restricted studies of prevalence rates at regional/territorial level in Mexico, Scotland, Hong Kong, Aruba, one of the constituent countries of the Kingdom of the Netherlands, Yokohama and Toyota in Japan, Goyang City in South Korea, the County of Maracaibo in Venezuela, Atibaia City in Brazil, and the Northern Ostrobothnia Area in Finland.
I used the following criteria for selection of the included studies: a) Study was conducted in 2000 and later; b) The diagnosis of ‘autism’ or ‘PDD’ were given based on ICD-9, ICD-10, DSM III, DSM III-R, DSM-IV, or DSM5 alone or in combination with several other assessment instruments (ADI-R, ADOS; CARS2; DISCO; GARS-2); c) The sample includes school children at the ages of >5 and <18; d) The study has a geographically defined population; e) The study is primarily researched and published in English in peer reviewed journals or by an accredited publisher; f) The study presents data/statistics in detail; and g) the study has reliable data source(s), clear and representative samples, and methodological clarity. Due to these strict inclusion criteria, several studies that are included in several reviews ( Elsabbagh et al. 2012; Fombonne, 2005 Baird et al.. 2006; Williams, et.al. 2006) have been excluded from this study.
Prevalence of Autism/ASD in Australia
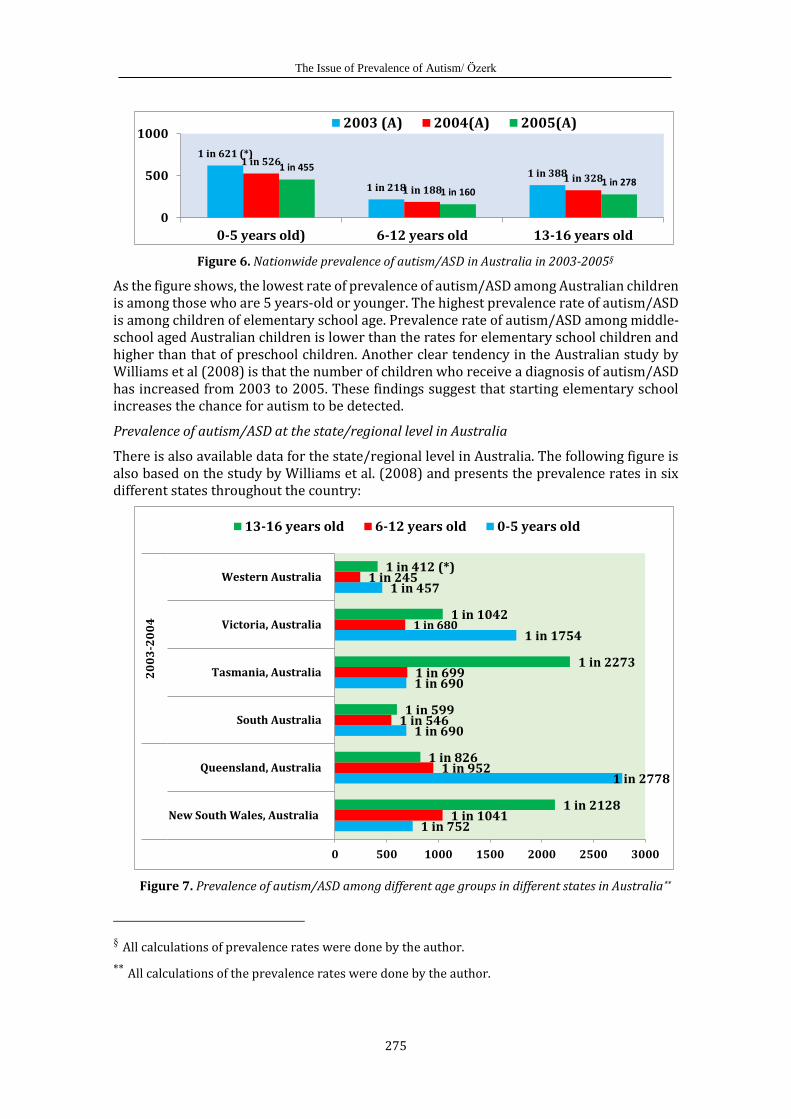
The world's sixth-largest country, Australia's area is 7,692,024 km2 with a population of approximately 24 million. Australia is comprised of six states (Western Australia, Victoria, Tasmania, South Australia, Queensland, and New South Wales) and two territories (Australian Capital Territory and Northern Territory). The country has well-developed registry of health statistics. In the following figure, I’ll present the prevalence of autism/ASD among Australian children across different age groups during the period of 2003 to 2005 based on the studies of Katrina Williams and her team (Williams et al., 2008):
The Issue of Prevalence of Autism/ Özerk
275
Figure 6. Nationwide prevalence of autism/ASD in Australia in 2003-2005§
As the figure shows, the lowest rate of prevalence of autism/ASD among Australian children is among those who are 5 years-old or younger. The highest prevalence rate of autism/ASD is among children of elementary school age. Prevalence rate of autism/ASD among middle-school aged Australian children is lower than the rates for elementary school children and higher than that of preschool children. Another clear tendency in the Australian study by Williams et al (2008) is that the number of children who receive a diagnosis of autism/ASD has increased from 2003 to 2005. These findings suggest that starting elementary school increases the chance for autism to be detected.
Prevalence of autism/ASD at the state/regional level in Australia
There is also available data for the state/regional level in Australia. The following figure is also based on the study by Williams et al. (2008) and presents the prevalence rates in six different states throughout the country:
Figure 7. Prevalence of autism/ASD among different age groups in different states in Australia**
§ All calculations of prevalence rates were done by the author.
** All calculations of the prevalence rates were done by the author.
1 in 621 (*)
1 in 218
1 in 3881 in 526
1 in 1881 in 328
1 in 455
1 in 1601 in 278
0
500
1000
0-5 years old) 6-12 years old 13-16 years old
2003 (A) 2004(A) 2005(A)
1 in 752
1 in 2778
1 in 690
1 in 690
1 in 1754
1 in 457
1 in 1041
1 in 952
1 in 546
1 in 699
1 in 680
1 in 245
1 in 2128
1 in 826
1 in 599
1 in 2273
1 in 1042
1 in 412 (*)
0 500 1000 1500 2000 2500 3000
New South Wales, Australia
Queensland, Australia
South Australia
Tasmania, Australia
Victoria, Australia
Western Australia
20
03
-20
04
13-16 years old 6-12 years old 0-5 years old
International Electronic Journal of Elementary Education Vol.9, Issue 2, 263-306, December, 2016
276
Huge differences can be seen in prevalence rates between two of the states and the other four. The highest prevalence rates are in Western Australia, with the next highest in South Australia. In Western Australia, 1 in 245 children in the age group 6-12 years-old have autism/ASD. The lowest prevalence rates for the same age group are in New South Wales. As one can see from the figure, it’s not easy to note a clear inter-state tendency for prevalence of autism/ASD in Australian states except that prevalence rates for of autism/ASD for 2003 and 2004 are lower compared to the state-level prevalence rates for autism/ASD in the U.S. (see figure 3).
Prevalence of Autism/ASD in Canada
Canada is the world's second-largest country, with a total area of 9,984,670 km2 and population of about 35 million. Canada is a federation composed of ten provinces (British Columbia, Manitoba, New Brunswick, Newfoundland and Labrador, Nova Scotia, Ontario, Prince Edward Island, Quebec, and Saskatchewan) and three territories (the Northwest Territories, Nunavut, and the Yukon ). Canada is one of the countries trying to establish national statistics for prevalence of autism/ASD. As part of this effort, in 2001, the Canadian authorities established a National Epidemiologic Database for the Study of Autism in Canada (NEDSAC).
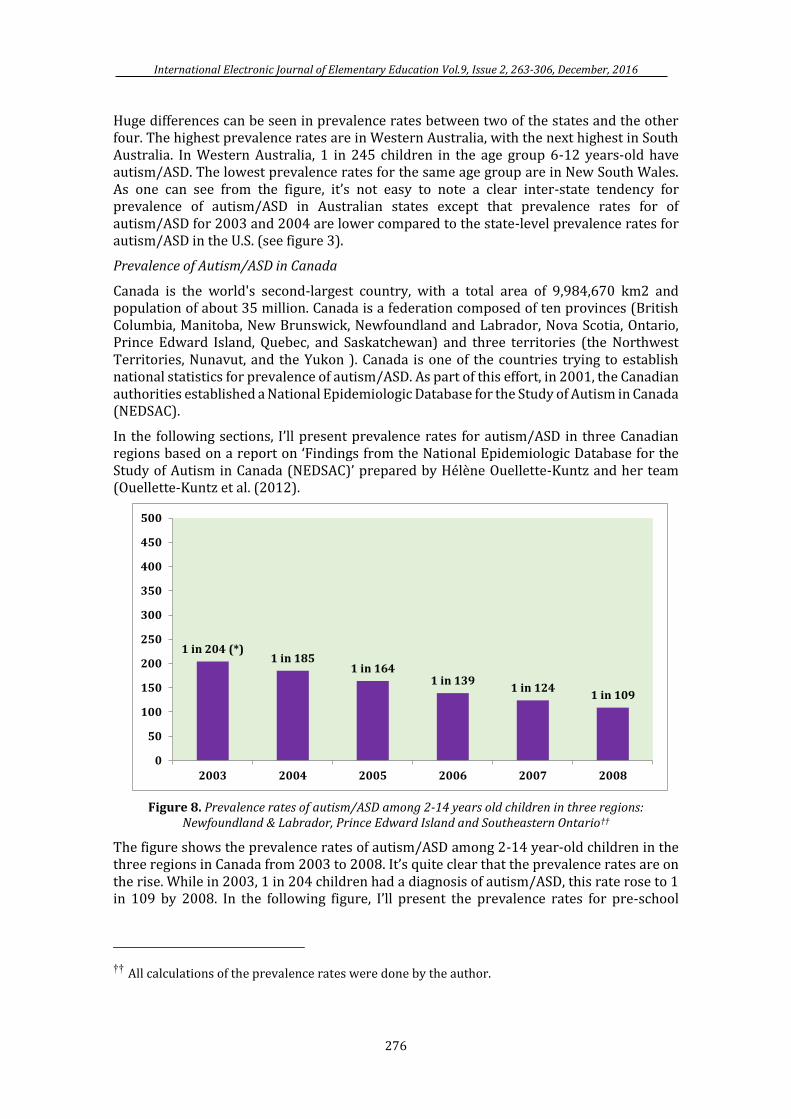
In the following sections, I’ll present prevalence rates for autism/ASD in three Canadian regions based on a report on ‘Findings from the National Epidemiologic Database for the Study of Autism in Canada (NEDSAC)’ prepared by Hélène Ouellette-Kuntz and her team (Ouellette-Kuntz et al. (2012).
Figure 8. Prevalence rates of autism/ASD among 2-14 years old children in three regions: Newfoundland & Labrador, Prince Edward Island and Southeastern Ontario††
The figure shows the prevalence rates of autism/ASD among 2-14 year-old children in the three regions in Canada from 2003 to 2008. It’s quite clear that the prevalence rates are on the rise. While in 2003, 1 in 204 children had a diagnosis of autism/ASD, this rate rose to 1 in 109 by 2008. In the following figure, I’ll present the prevalence rates for pre-school
†† All calculations of the prevalence rates were done by the author.
1 in 204 (*)1 in 185
1 in 1641 in 139
1 in 1241 in 109
0
50
100
150
200
250
300
350
400
450
500
2003 2004 2005 2006 2007 2008
The Issue of Prevalence of Autism/ Özerk
277
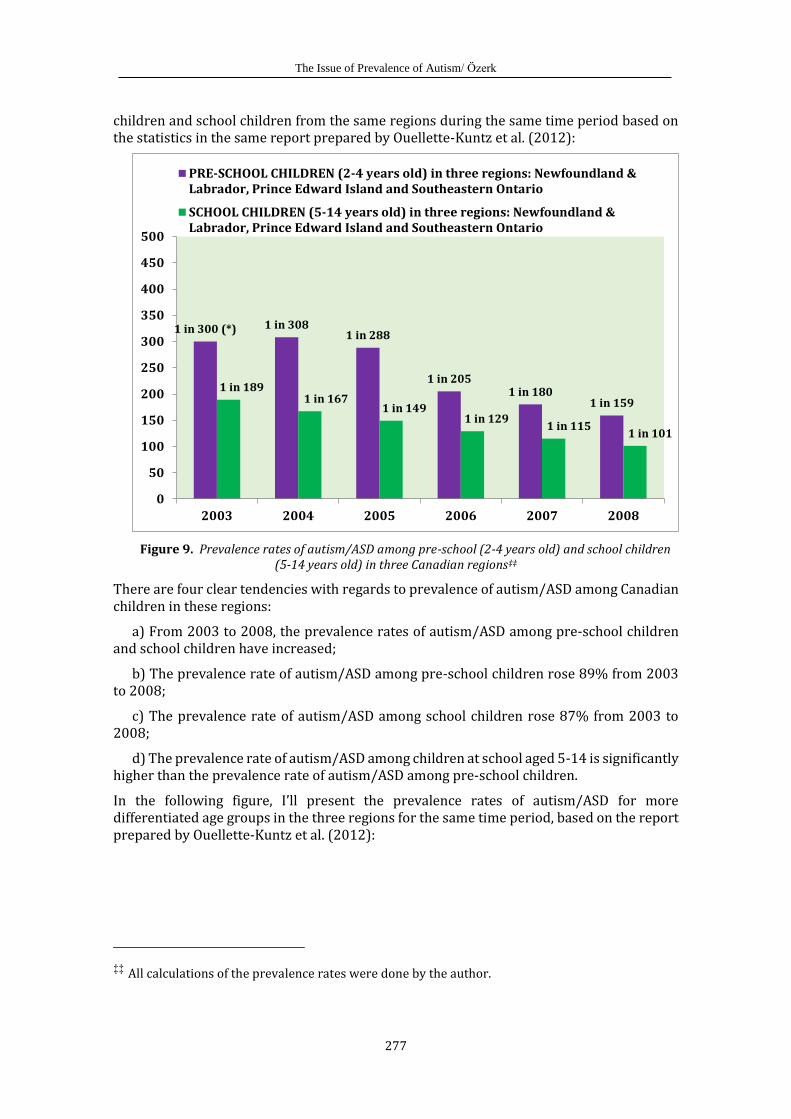
children and school children from the same regions during the same time period based on the statistics in the same report prepared by Ouellette-Kuntz et al. (2012):
Figure 9. Prevalence rates of autism/ASD among pre-school (2-4 years old) and school children (5-14 years old) in three Canadian regions‡‡
There are four clear tendencies with regards to prevalence of autism/ASD among Canadian children in these regions:
a) From 2003 to 2008, the prevalence rates of autism/ASD among pre-school children and school children have increased;
b) The prevalence rate of autism/ASD among pre-school children rose 89% from 2003 to 2008;
c) The prevalence rate of autism/ASD among school children rose 87% from 2003 to 2008;
d) The prevalence rate of autism/ASD among children at school aged 5-14 is significantly higher than the prevalence rate of autism/ASD among pre-school children.
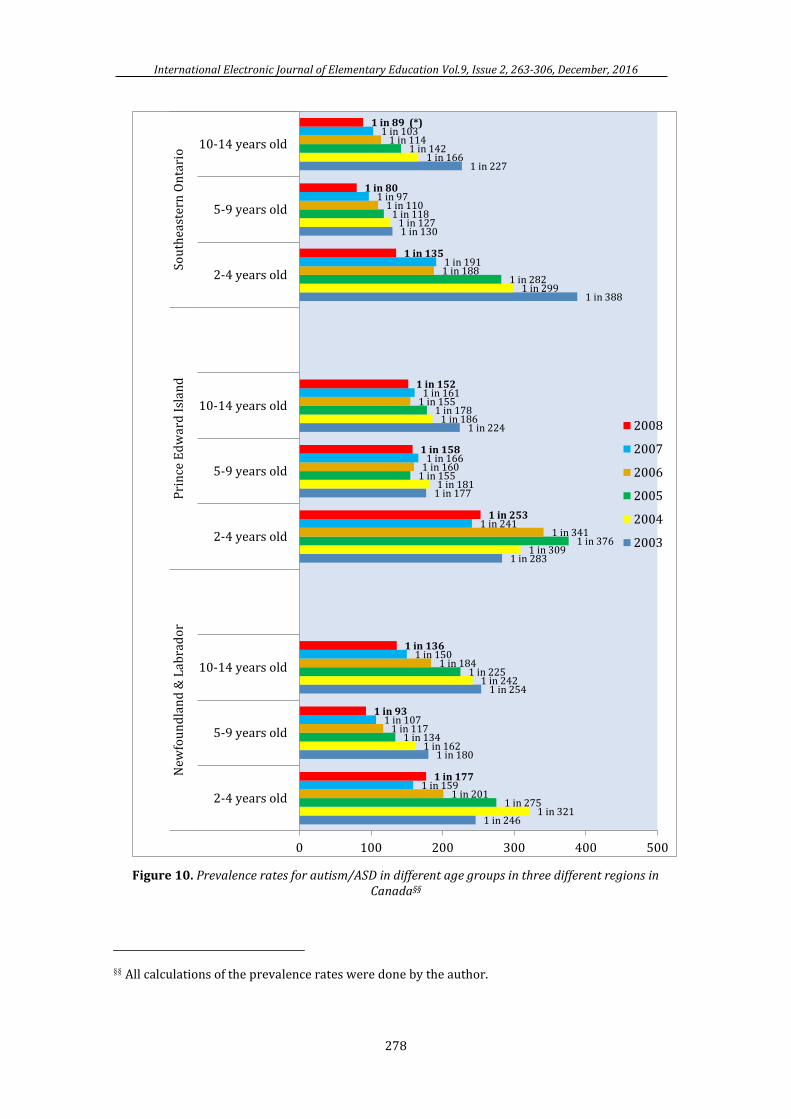
In the following figure, I’ll present the prevalence rates of autism/ASD for more differentiated age groups in the three regions for the same time period, based on the report prepared by Ouellette-Kuntz et al. (2012):
‡‡ All calculations of the prevalence rates were done by the author.
1 in 300 (*) 1 in 3081 in 288
1 in 2051 in 180
1 in 159
1 in 1891 in 167
1 in 1491 in 129
1 in 1151 in 101
0
50
100
150
200
250
300
350
400
450
500
2003 2004 2005 2006 2007 2008
PRE-SCHOOL CHILDREN (2-4 years old) in three regions: Newfoundland &Labrador, Prince Edward Island and Southeastern Ontario
SCHOOL CHILDREN (5-14 years old) in three regions: Newfoundland &Labrador, Prince Edward Island and Southeastern Ontario
International Electronic Journal of Elementary Education Vol.9, Issue 2, 263-306, December, 2016
278
Figure 10. Prevalence rates for autism/ASD in different age groups in three different regions in Canada§§
§§ All calculations of the prevalence rates were done by the author.
1 in 246
1 in 180
1 in 254
1 in 283
1 in 177
1 in 224
1 in 388
1 in 130
1 in 227
1 in 321
1 in 162
1 in 242
1 in 309
1 in 181
1 in 186
1 in 299
1 in 127
1 in 166
1 in 275
1 in 134
1 in 225
1 in 376
1 in 155
1 in 178
1 in 282
1 in 118
1 in 142
1 in 201
1 in 117
1 in 184
1 in 341
1 in 160
1 in 155
1 in 188
1 in 110
1 in 114
1 in 159
1 in 107
1 in 150
1 in 241
1 in 166
1 in 161
1 in 191
1 in 97
1 in 103
1 in 177
1 in 93
1 in 136
1 in 253
1 in 158
1 in 152
1 in 135
1 in 80
1 in 89 (*)
0 100 200 300 400 500
2-4 years old
5-9 years old
10-14 years old
2-4 years old
5-9 years old
10-14 years old
2-4 years old
5-9 years old
10-14 years old
New
fou
nd
lan
d &
Lab
rad
or
Pri
nce
Ed
war
d I
slan
dSo
uth
east
ern
On
tari
o
2008
2007
2006
2005
2004
2003
The Issue of Prevalence of Autism/ Özerk
279
Here, we see a clear increase in prevalence rates over the years in all the regions and for all age groups. Another key point, though perhaps not as clear, is that prevalence rates of autism/ASD among children at 5-9 years of age have mostly been higher than the other two age groups.
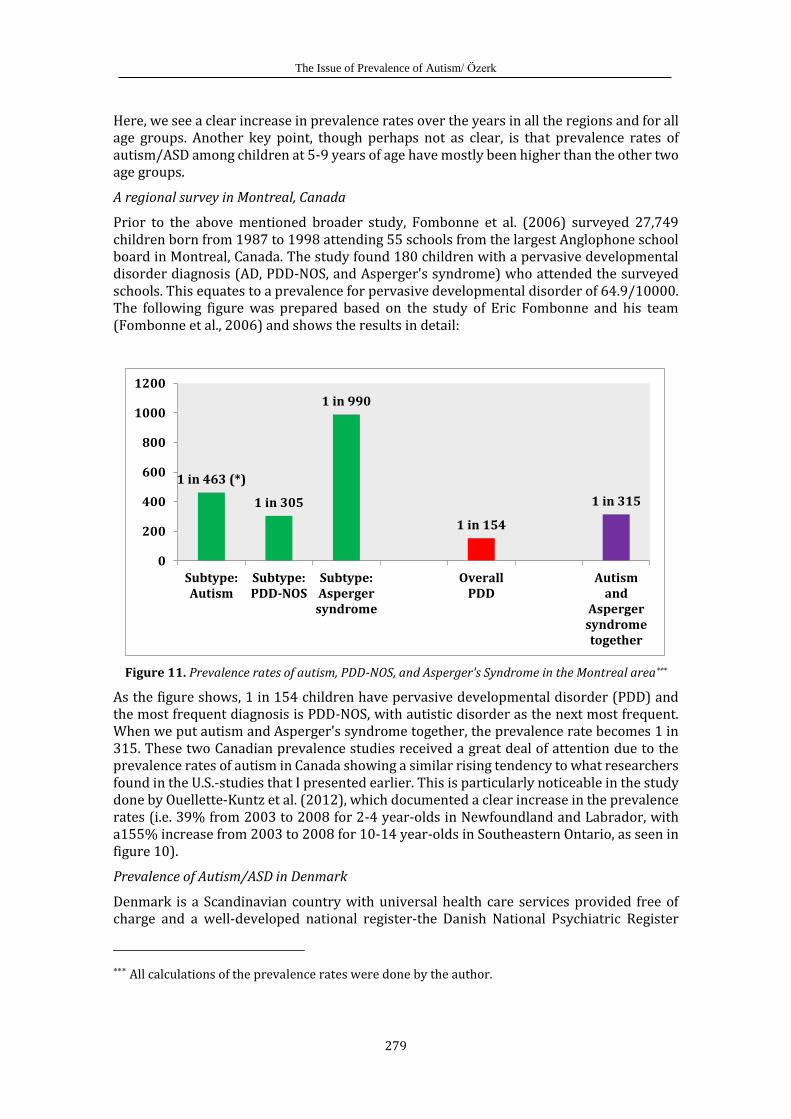
A regional survey in Montreal, Canada
Prior to the above mentioned broader study, Fombonne et al. (2006) surveyed 27,749 children born from 1987 to 1998 attending 55 schools from the largest Anglophone school board in Montreal, Canada. The study found 180 children with a pervasive developmental disorder diagnosis (AD, PDD-NOS, and Asperger's syndrome) who attended the surveyed schools. This equates to a prevalence for pervasive developmental disorder of 64.9/10000. The following figure was prepared based on the study of Eric Fombonne and his team (Fombonne et al., 2006) and shows the results in detail:
Figure 11. Prevalence rates of autism, PDD-NOS, and Asperger's Syndrome in the Montreal area***
As the figure shows, 1 in 154 children have pervasive developmental disorder (PDD) and the most frequent diagnosis is PDD-NOS, with autistic disorder as the next most frequent. When we put autism and Asperger's syndrome together, the prevalence rate becomes 1 in 315. These two Canadian prevalence studies received a great deal of attention due to the prevalence rates of autism in Canada showing a similar rising tendency to what researchers found in the U.S.-studies that I presented earlier. This is particularly noticeable in the study done by Ouellette-Kuntz et al. (2012), which documented a clear increase in the prevalence rates (i.e. 39% from 2003 to 2008 for 2-4 year-olds in Newfoundland and Labrador, with a155% increase from 2003 to 2008 for 10-14 year-olds in Southeastern Ontario, as seen in figure 10).
Prevalence of Autism/ASD in Denmark
Denmark is a Scandinavian country with universal health care services provided free of charge and a well-developed national register-the Danish National Psychiatric Register
*** All calculations of the prevalence rates were done by the author.
1 in 463 (*)
1 in 305
1 in 990
1 in 154
1 in 315
0
200
400
600
800
1000
1200
Subtype:Autism
Subtype:PDD-NOS
Subtype:Aspergersyndrome
OverallPDD
Autismand
Aspergersyndrometogether
International Electronic Journal of Elementary Education Vol.9, Issue 2, 263-306, December, 2016
280
(DNPR). Children in Denmark who are suspected of having a diagnosis of autism/ASD are referred by general practitioners or school psychologists to child psychiatric specialist services where they undergo assessment by a multidisciplinary team and are assigned a final diagnosis by a child psychiatrist. All cases of ASDs are registered in the DNPR by psychiatrists once a formal diagnosis is established (Hansen et al. 2015). One of the nationwide studies of autism prevalence trends over time in Denmark was carried out by Parner et al. (2008) in 2006. They studied all children born in Denmark from January 1, 1994, to December 31, 1999. The cohort was identified in the Danish Medical Birth Registry and consisted of 407,458 children. This child population was grouped in 2-year birth cohorts:
Group 1: Children born between January 1, 1994, and December 31, 1995; Group 2: Children born between January 1, 1996, and December 31, 1997; Group 3: Children born between January 1, 1998, and December 31, 1999.
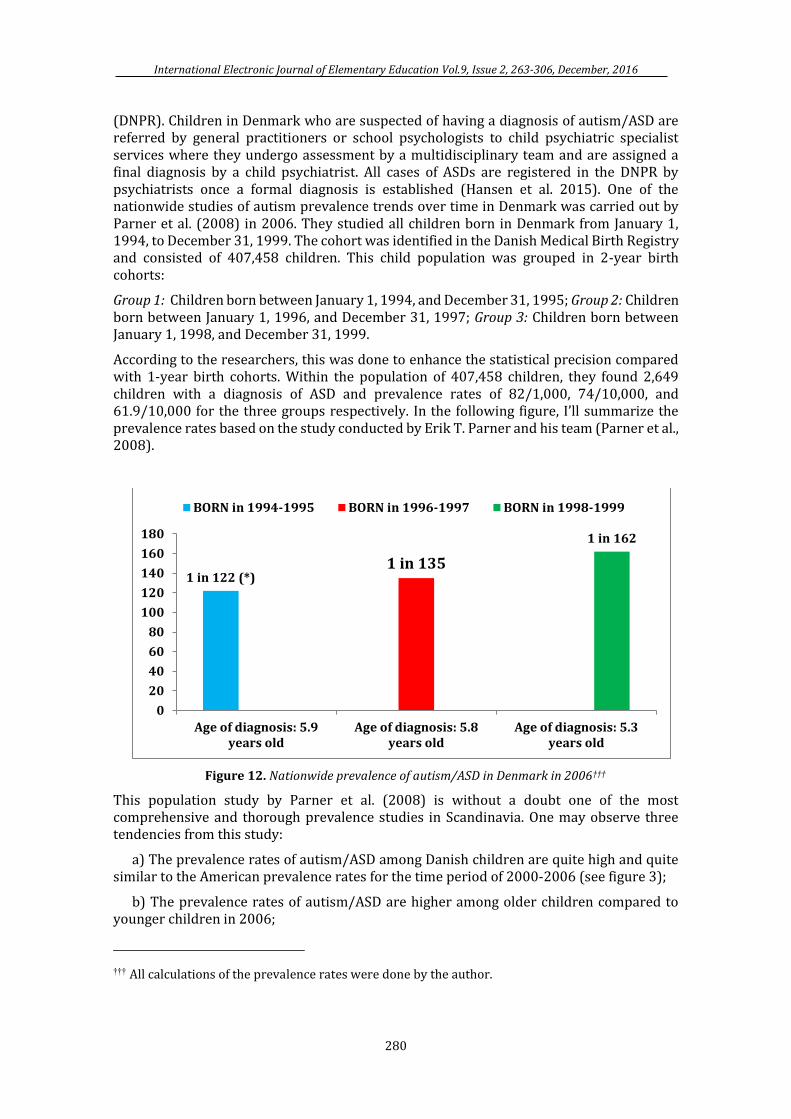
According to the researchers, this was done to enhance the statistical precision compared with 1-year birth cohorts. Within the population of 407,458 children, they found 2,649 children with a diagnosis of ASD and prevalence rates of 82/1,000, 74/10,000, and 61.9/10,000 for the three groups respectively. In the following figure, I’ll summarize the prevalence rates based on the study conducted by Erik T. Parner and his team (Parner et al., 2008).
Figure 12. Nationwide prevalence of autism/ASD in Denmark in 2006†††
This population study by Parner et al. (2008) is without a doubt one of the most comprehensive and thorough prevalence studies in Scandinavia. One may observe three tendencies from this study:
a) The prevalence rates of autism/ASD among Danish children are quite high and quite similar to the American prevalence rates for the time period of 2000-2006 (see figure 3);
b) The prevalence rates of autism/ASD are higher among older children compared to younger children in 2006;
††† All calculations of the prevalence rates were done by the author.
1 in 122 (*)1 in 135
1 in 162
0
20
40
60
80
100
120
140
160
180
Age of diagnosis: 5.9years old
Age of diagnosis: 5.8years old
Age of diagnosis: 5.3years old
BORN in 1994-1995 BORN in 1996-1997 BORN in 1998-1999
The Issue of Prevalence of Autism/ Özerk
281
c) The prevalence rates of autism/ASD are higher among those children with later diagnosis than earlier diagnosis.
Compulsory education in Denmark starts at the age of 6. Most likely those children who were diagnosed at average 5.9 or 5.8 years of age were identified in primary classes in the Danish schools system. One may therefore claim that starting school makes children with ASD more detectable than enrollment in kindergarten or being mostly at home until 6 years of age.
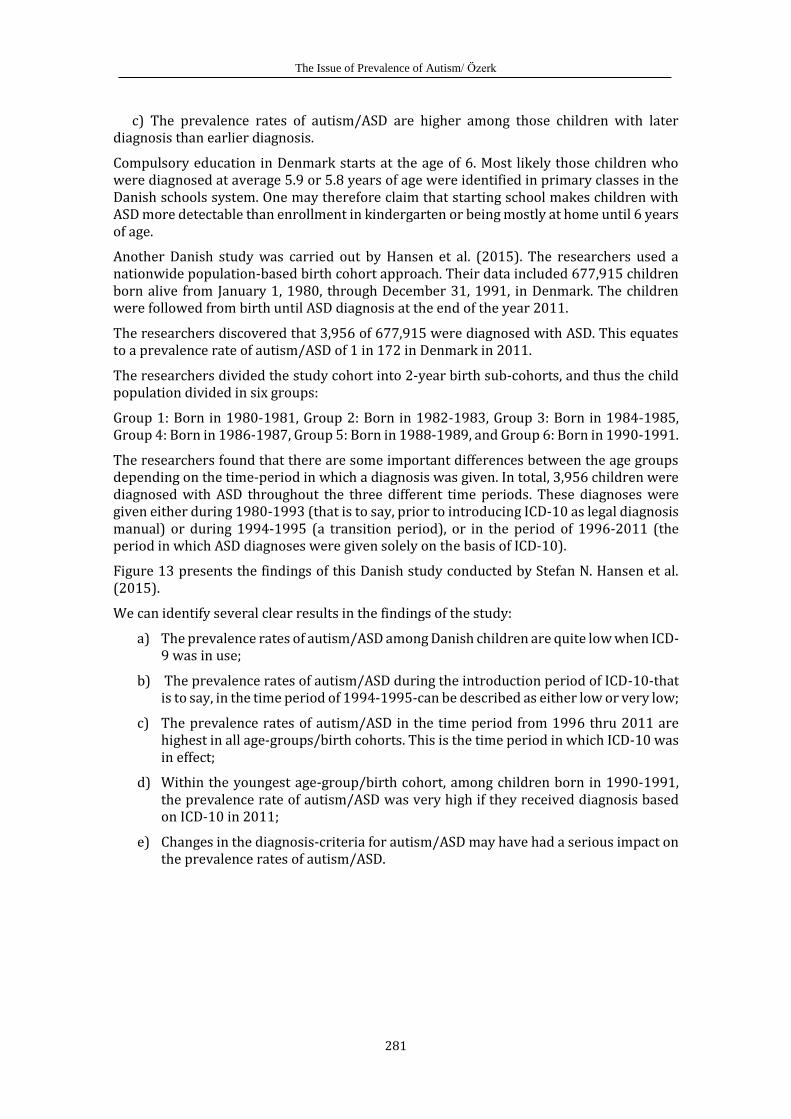
Another Danish study was carried out by Hansen et al. (2015). The researchers used a nationwide population-based birth cohort approach. Their data included 677,915 children born alive from January 1, 1980, through December 31, 1991, in Denmark. The children were followed from birth until ASD diagnosis at the end of the year 2011.
The researchers discovered that 3,956 of 677,915 were diagnosed with ASD. This equates to a prevalence rate of autism/ASD of 1 in 172 in Denmark in 2011.
The researchers divided the study cohort into 2-year birth sub-cohorts, and thus the child population divided in six groups:
Group 1: Born in 1980-1981, Group 2: Born in 1982-1983, Group 3: Born in 1984-1985, Group 4: Born in 1986-1987, Group 5: Born in 1988-1989, and Group 6: Born in 1990-1991.
The researchers found that there are some important differences between the age groups depending on the time-period in which a diagnosis was given. In total, 3,956 children were diagnosed with ASD throughout the three different time periods. These diagnoses were given either during 1980-1993 (that is to say, prior to introducing ICD-10 as legal diagnosis manual) or during 1994-1995 (a transition period), or in the period of 1996-2011 (the period in which ASD diagnoses were given solely on the basis of ICD-10).
Figure 13 presents the findings of this Danish study conducted by Stefan N. Hansen et al. (2015).
We can identify several clear results in the findings of the study:
a) The prevalence rates of autism/ASD among Danish children are quite low when ICD-9 was in use;
b) The prevalence rates of autism/ASD during the introduction period of ICD-10-that is to say, in the time period of 1994-1995-can be described as either low or very low;
c) The prevalence rates of autism/ASD in the time period from 1996 thru 2011 are highest in all age-groups/birth cohorts. This is the time period in which ICD-10 was in effect;
d) Within the youngest age-group/birth cohort, among children born in 1990-1991, the prevalence rate of autism/ASD was very high if they received diagnosis based on ICD-10 in 2011;
e) Changes in the diagnosis-criteria for autism/ASD may have had a serious impact on the prevalence rates of autism/ASD.
International Electronic Journal of Elementary Education Vol.9, Issue 2, 263-306, December, 2016
282
Figure 13. Prevalence rates of autism/ASD among Danish children in three different time periods‡‡‡
Prevalence of Autism/ASD in Israel
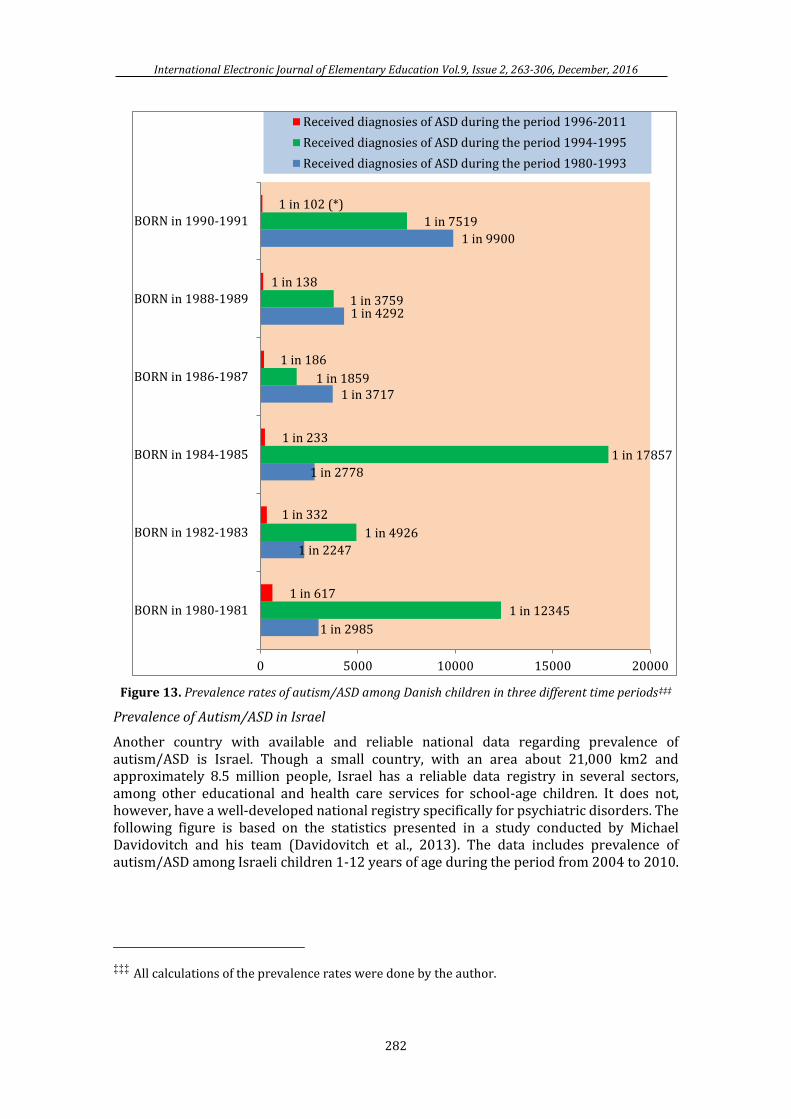
Another country with available and reliable national data regarding prevalence of autism/ASD is Israel. Though a small country, with an area about 21,000 km2 and approximately 8.5 million people, Israel has a reliable data registry in several sectors, among other educational and health care services for school-age children. It does not, however, have a well-developed national registry specifically for psychiatric disorders. The following figure is based on the statistics presented in a study conducted by Michael Davidovitch and his team (Davidovitch et al., 2013). The data includes prevalence of autism/ASD among Israeli children 1-12 years of age during the period from 2004 to 2010.
‡‡‡ All calculations of the prevalence rates were done by the author.
1 in 2985
1 in 2247
1 in 2778
1 in 3717
1 in 4292
1 in 9900
1 in 12345
1 in 4926
1 in 17857
1 in 1859
1 in 3759
1 in 7519
1 in 617
1 in 332
1 in 233
1 in 186
1 in 138
1 in 102 (*)
0 5000 10000 15000 20000
BORN in 1980-1981
BORN in 1982-1983
BORN in 1984-1985
BORN in 1986-1987
BORN in 1988-1989
BORN in 1990-1991
Received diagnosies of ASD during the period 1996-2011
Received diagnosies of ASD during the period 1994-1995
Received diagnosies of ASD during the period 1980-1993
The Issue of Prevalence of Autism/ Özerk
283
Figure 14. Nationwide prevalence rates of autism/ASD in Israel from 2004 to 2010
The nationwide prevalence rate of autism/ASD among 1-12 years old Israeli children shows a dramatic increase during the seven years studied, from 2004 to 2010. This equates to a remarkable 682% increase in the prevalence rate of autism/ASD among Israeli children from 2004 to 2010. The most notable increase occurred during the first two years of the study (2004 to 2005), in which the rate more than doubled. The rate doubled again from 2005 to 2007, and nearly doubled once more between 2007 and 2010.
Prevalence of Autism/ASD in the Netherlands
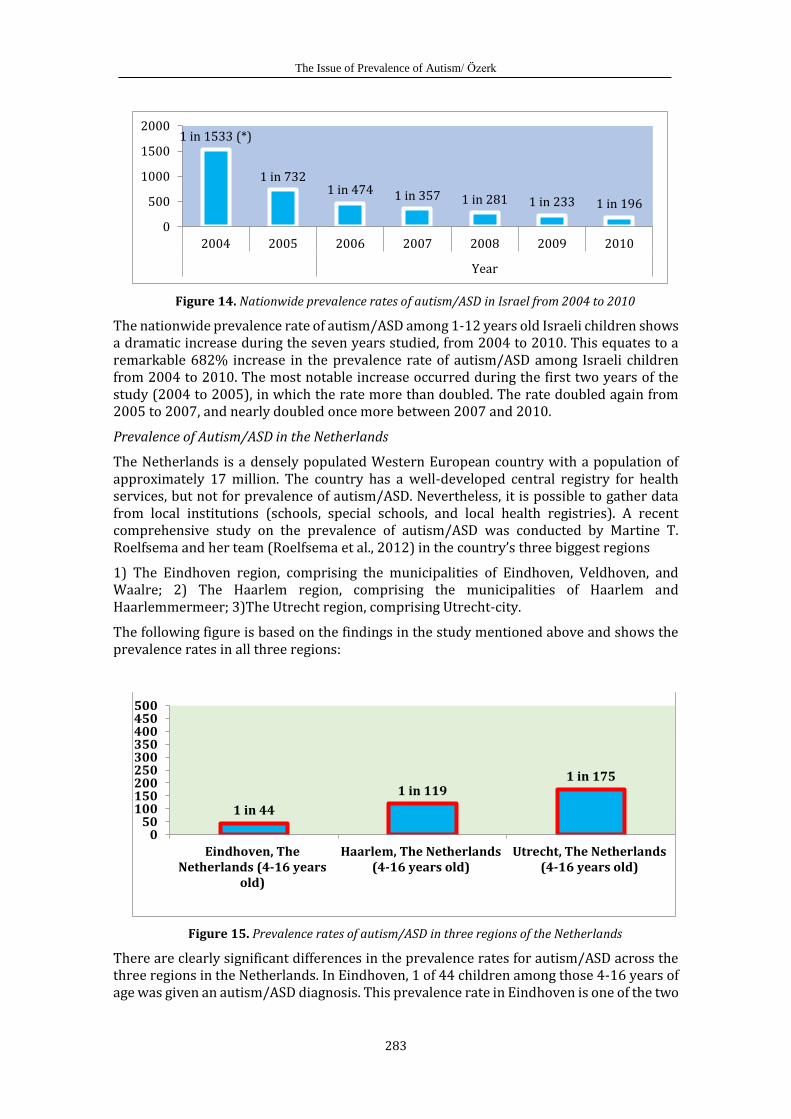
The Netherlands is a densely populated Western European country with a population of approximately 17 million. The country has a well-developed central registry for health services, but not for prevalence of autism/ASD. Nevertheless, it is possible to gather data from local institutions (schools, special schools, and local health registries). A recent comprehensive study on the prevalence of autism/ASD was conducted by Martine T. Roelfsema and her team (Roelfsema et al., 2012) in the country’s three biggest regions
1) The Eindhoven region, comprising the municipalities of Eindhoven, Veldhoven, and Waalre; 2) The Haarlem region, comprising the municipalities of Haarlem and Haarlemmermeer; 3)The Utrecht region, comprising Utrecht-city.
The following figure is based on the findings in the study mentioned above and shows the prevalence rates in all three regions:
Figure 15. Prevalence rates of autism/ASD in three regions of the Netherlands
There are clearly significant differences in the prevalence rates for autism/ASD across the three regions in the Netherlands. In Eindhoven, 1 of 44 children among those 4-16 years of age was given an autism/ASD diagnosis. This prevalence rate in Eindhoven is one of the two
1 in 1533 (*)
1 in 7321 in 474 1 in 357 1 in 281 1 in 233 1 in 196
0
500
1000
1500
2000
2004 2005 2006 2007 2008 2009 2010
Year
1 in 44
1 in 1191 in 175
050
100150200250300350400450500
Eindhoven, TheNetherlands (4-16 years
old)
Haarlem, The Netherlands(4-16 years old)
Utrecht, The Netherlands(4-16 years old)
International Electronic Journal of Elementary Education Vol.9, Issue 2, 263-306, December, 2016
284
highest rates in all the literature regarding prevalence of autism/ASD (the other highest rate is found in Seoul, South Korea). Researchers (Roelfsema et al., 2012) have discussed and hypothesized about the causes of this high prevalence rate in Eindhoven based on a ‘hyper-systemizing theory’ proposed by Baron-Cohen (2006, 2008) which I’ll return to later.
Prevalence Rates of Autism/ASD in Norway
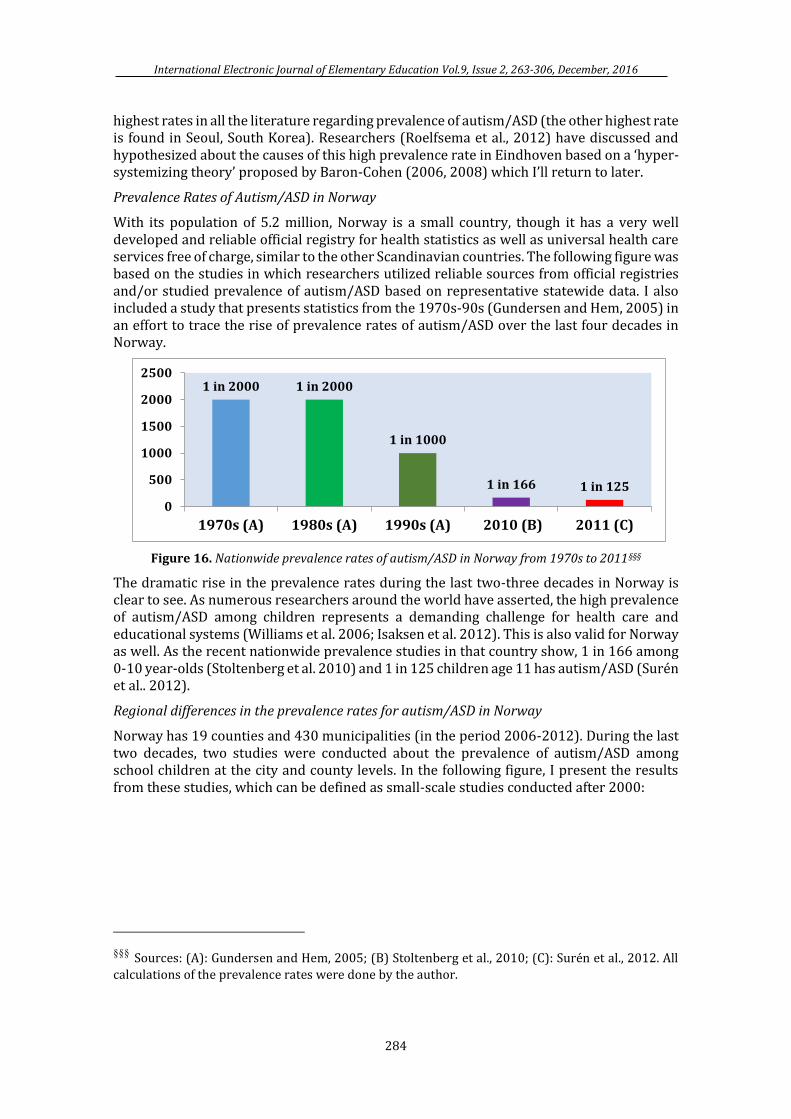
With its population of 5.2 million, Norway is a small country, though it has a very well developed and reliable official registry for health statistics as well as universal health care services free of charge, similar to the other Scandinavian countries. The following figure was based on the studies in which researchers utilized reliable sources from official registries and/or studied prevalence of autism/ASD based on representative statewide data. I also included a study that presents statistics from the 1970s-90s (Gundersen and Hem, 2005) in an effort to trace the rise of prevalence rates of autism/ASD over the last four decades in Norway.
Figure 16. Nationwide prevalence rates of autism/ASD in Norway from 1970s to 2011§§§
The dramatic rise in the prevalence rates during the last two-three decades in Norway is clear to see. As numerous researchers around the world have asserted, the high prevalence of autism/ASD among children represents a demanding challenge for health care and educational systems (Williams et al. 2006; Isaksen et al. 2012). This is also valid for Norway as well. As the recent nationwide prevalence studies in that country show, 1 in 166 among 0-10 year-olds (Stoltenberg et al. 2010) and 1 in 125 children age 11 has autism/ASD (Surén et al.. 2012).
Regional differences in the prevalence rates for autism/ASD in Norway
Norway has 19 counties and 430 municipalities (in the period 2006-2012). During the last two decades, two studies were conducted about the prevalence of autism/ASD among school children at the city and county levels. In the following figure, I present the results from these studies, which can be defined as small-scale studies conducted after 2000:
§§§ Sources: (A): Gundersen and Hem, 2005; (B) Stoltenberg et al., 2010; (C): Surén et al., 2012. All
calculations of the prevalence rates were done by the author.
1 in 2000 1 in 2000
1 in 1000
1 in 166 1 in 125
0
500
1000
1500
2000
2500
1970s (A) 1980s (A) 1990s (A) 2010 (B) 2011 (C)
The Issue of Prevalence of Autism/ Özerk
285
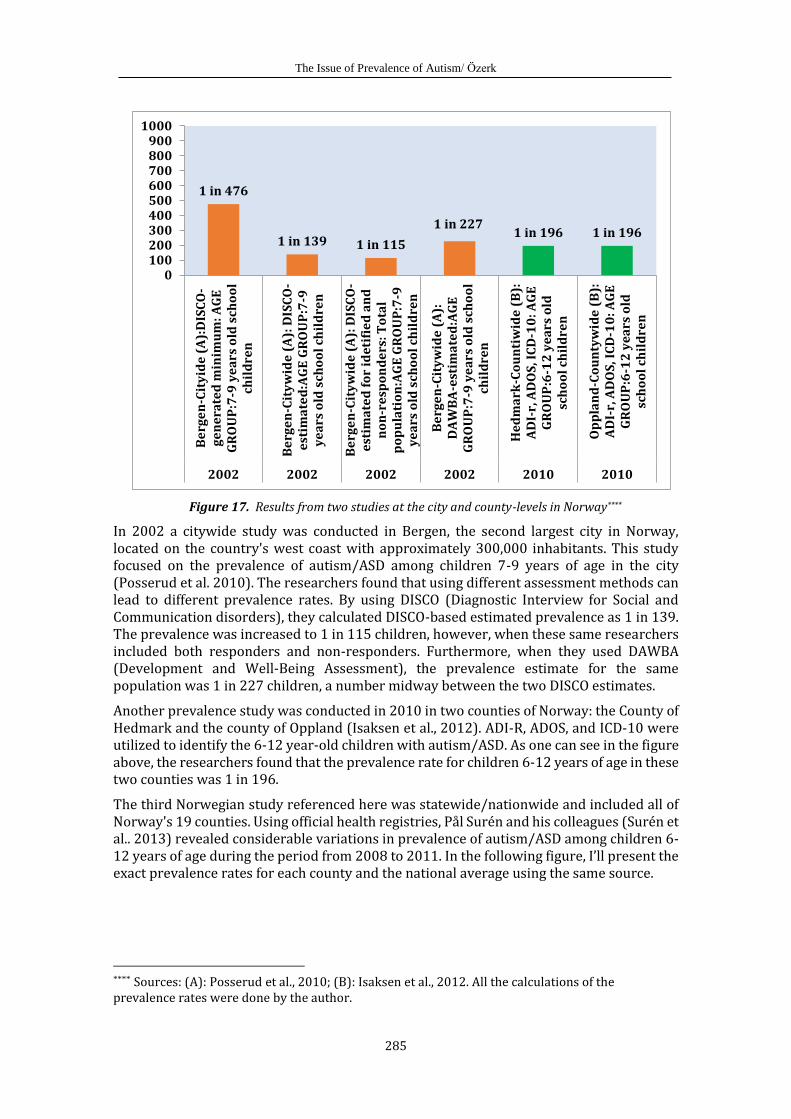
Figure 17. Results from two studies at the city and county-levels in Norway****
In 2002 a citywide study was conducted in Bergen, the second largest city in Norway, located on the country's west coast with approximately 300,000 inhabitants. This study focused on the prevalence of autism/ASD among children 7-9 years of age in the city (Posserud et al. 2010). The researchers found that using different assessment methods can lead to different prevalence rates. By using DISCO (Diagnostic Interview for Social and Communication disorders), they calculated DISCO-based estimated prevalence as 1 in 139. The prevalence was increased to 1 in 115 children, however, when these same researchers included both responders and non-responders. Furthermore, when they used DAWBA (Development and Well-Being Assessment), the prevalence estimate for the same population was 1 in 227 children, a number midway between the two DISCO estimates.
Another prevalence study was conducted in 2010 in two counties of Norway: the County of Hedmark and the county of Oppland (Isaksen et al., 2012). ADI-R, ADOS, and ICD-10 were utilized to identify the 6-12 year-old children with autism/ASD. As one can see in the figure above, the researchers found that the prevalence rate for children 6-12 years of age in these two counties was 1 in 196.
The third Norwegian study referenced here was statewide/nationwide and included all of Norway's 19 counties. Using official health registries, Pål Surén and his colleagues (Surén et al.. 2013) revealed considerable variations in prevalence of autism/ASD among children 6-12 years of age during the period from 2008 to 2011. In the following figure, I’ll present the exact prevalence rates for each county and the national average using the same source.
**** Sources: (A): Posserud et al., 2010; (B): Isaksen et al., 2012. All the calculations of the prevalence rates were done by the author.
1 in 476
1 in 139 1 in 115
1 in 2271 in 196 1 in 196
0100200300400500600700800900
1000
Be
rge
n-C
ity
ide
(A
):D
ISC
O-
ge
ne
rate
d m
inim
um
: A
GE
GR
OU
P:7
-9 y
ea
rs o
ld s
cho
ol
chil
dre
n
Be
rge
n-C
ity
wid
e (
A):
DIS
CO
-e
stim
ate
d:A
GE
GR
OU
P:7
-9y
ea
rs o
ld s
cho
ol
chil
dre
n
Be
rge
n-C
ity
wid
e (
A):
DIS
CO
-e
stim
ate
d f
or
ide
tifi
ed
an
dn
on
-re
spo
nd
ers
: T
ota
lp
op
ula
tio
n:A
GE
GR
OU
P:7
-9y
ea
rs o
ld s
cho
ol
chil
dre
n
Be
rge
n-C
ity
wid
e (
A):
DA
WB
A-e
stim
ate
d:A
GE
GR
OU
P:7
-9 y
ea
rs o
ld s
cho
ol
chil
dre
n
He
dm
ark
-Co
un
tiw
ide
(B
):A
DI-
r, A
DO
S, I
CD
-10
: A
GE
GR
OU
P:6
-12
ye
ars
old
sch
oo
l ch
ild
ren
Op
pla
nd
-Co
un
tyw
ide
(B
):A
DI-
r, A
DO
S, I
CD
-10
: A
GE
GR
OU
P:6
-12
ye
ars
old
sch
oo
l ch
ild
ren
2002 2002 2002 2002 2010 2010
International Electronic Journal of Elementary Education Vol.9, Issue 2, 263-306, December, 2016
286
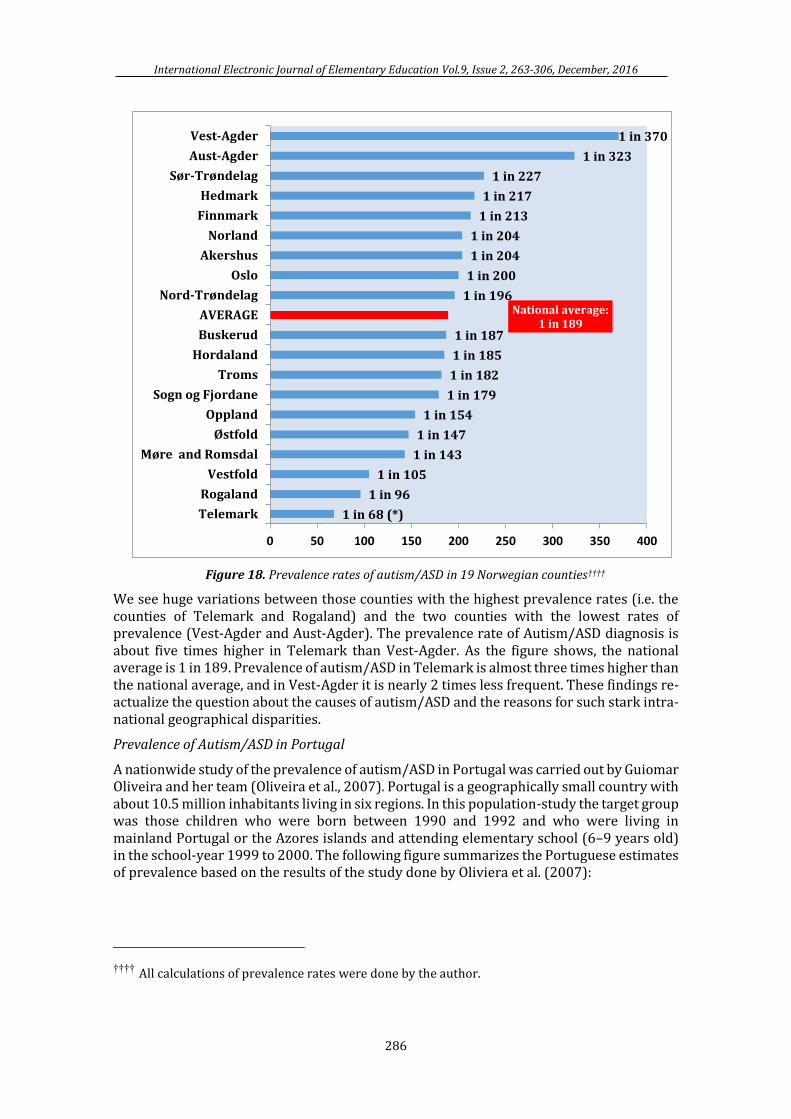
Figure 18. Prevalence rates of autism/ASD in 19 Norwegian counties††††
We see huge variations between those counties with the highest prevalence rates (i.e. the counties of Telemark and Rogaland) and the two counties with the lowest rates of prevalence (Vest-Agder and Aust-Agder). The prevalence rate of Autism/ASD diagnosis is about five times higher in Telemark than Vest-Agder. As the figure shows, the national average is 1 in 189. Prevalence of autism/ASD in Telemark is almost three times higher than the national average, and in Vest-Agder it is nearly 2 times less frequent. These findings re-actualize the question about the causes of autism/ASD and the reasons for such stark intra-national geographical disparities.
Prevalence of Autism/ASD in Portugal
A nationwide study of the prevalence of autism/ASD in Portugal was carried out by Guiomar Oliveira and her team (Oliveira et al., 2007). Portugal is a geographically small country with about 10.5 million inhabitants living in six regions. In this population-study the target group was those children who were born between 1990 and 1992 and who were living in mainland Portugal or the Azores islands and attending elementary school (6–9 years old) in the school-year 1999 to 2000. The following figure summarizes the Portuguese estimates of prevalence based on the results of the study done by Oliviera et al. (2007):
†††† All calculations of prevalence rates were done by the author.
1 in 68 (*)
1 in 96
1 in 105
1 in 143
1 in 147
1 in 154
1 in 179
1 in 182
1 in 185
1 in 187
National average: 1 in 189
1 in 196
1 in 200
1 in 204
1 in 204
1 in 213
1 in 217
1 in 227
1 in 323
1 in 370
0 50 100 150 200 250 300 350 400
Telemark
Rogaland
Vestfold
Møre and Romsdal
Østfold
Oppland
Sogn og Fjordane
Troms
Hordaland
Buskerud
AVERAGE
Nord-Trøndelag
Oslo
Akershus
Norland
Finnmark
Hedmark
Sør-Trøndelag
Aust-Agder
Vest-Agder
The Issue of Prevalence of Autism/ Özerk
287
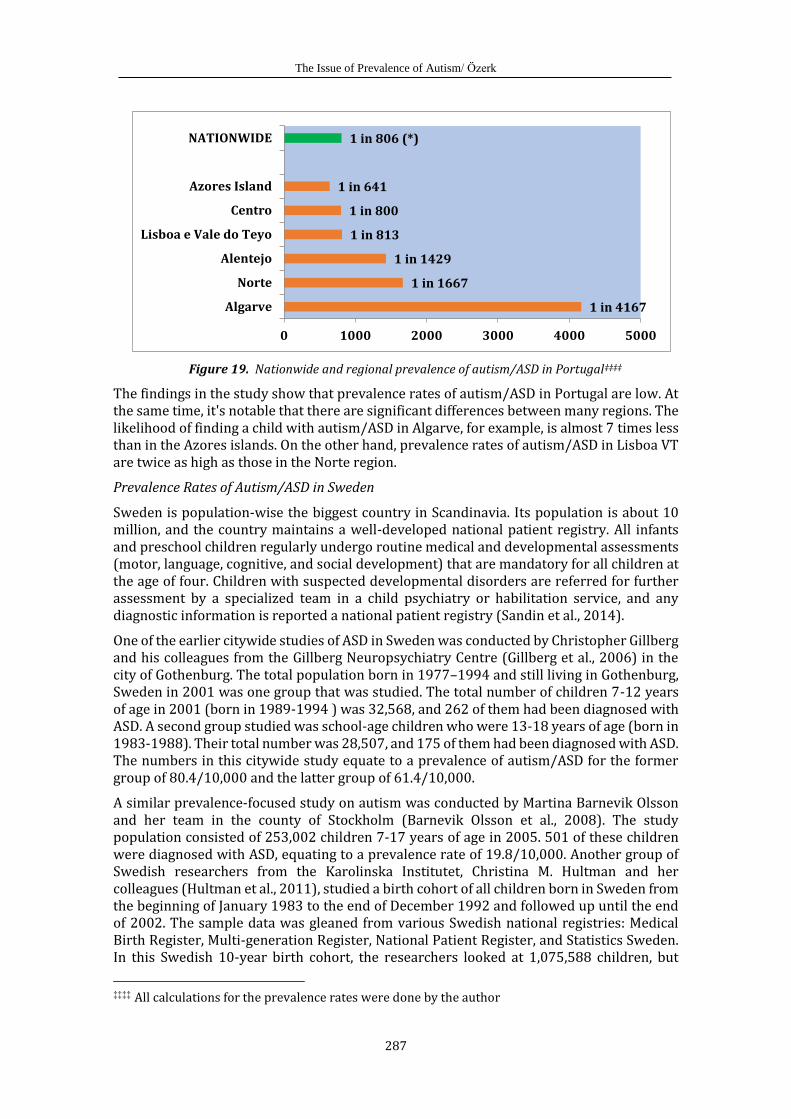
Figure 19. Nationwide and regional prevalence of autism/ASD in Portugal‡‡‡‡
The findings in the study show that prevalence rates of autism/ASD in Portugal are low. At the same time, it's notable that there are significant differences between many regions. The likelihood of finding a child with autism/ASD in Algarve, for example, is almost 7 times less than in the Azores islands. On the other hand, prevalence rates of autism/ASD in Lisboa VT are twice as high as those in the Norte region.
Prevalence Rates of Autism/ASD in Sweden
Sweden is population-wise the biggest country in Scandinavia. Its population is about 10 million, and the country maintains a well-developed national patient registry. All infants and preschool children regularly undergo routine medical and developmental assessments (motor, language, cognitive, and social development) that are mandatory for all children at the age of four. Children with suspected developmental disorders are referred for further assessment by a specialized team in a child psychiatry or habilitation service, and any diagnostic information is reported a national patient registry (Sandin et al., 2014).
One of the earlier citywide studies of ASD in Sweden was conducted by Christopher Gillberg and his colleagues from the Gillberg Neuropsychiatry Centre (Gillberg et al., 2006) in the city of Gothenburg. The total population born in 1977–1994 and still living in Gothenburg, Sweden in 2001 was one group that was studied. The total number of children 7-12 years of age in 2001 (born in 1989-1994 ) was 32,568, and 262 of them had been diagnosed with ASD. A second group studied was school-age children who were 13-18 years of age (born in 1983-1988). Their total number was 28,507, and 175 of them had been diagnosed with ASD. The numbers in this citywide study equate to a prevalence of autism/ASD for the former group of 80.4/10,000 and the latter group of 61.4/10,000.
A similar prevalence-focused study on autism was conducted by Martina Barnevik Olsson and her team in the county of Stockholm (Barnevik Olsson et al., 2008). The study population consisted of 253,002 children 7-17 years of age in 2005. 501 of these children were diagnosed with ASD, equating to a prevalence rate of 19.8/10,000. Another group of Swedish researchers from the Karolinska Institutet, Christina M. Hultman and her colleagues (Hultman et al., 2011), studied a birth cohort of all children born in Sweden from the beginning of January 1983 to the end of December 1992 and followed up until the end of 2002. The sample data was gleaned from various Swedish national registries: Medical Birth Register, Multi-generation Register, National Patient Register, and Statistics Sweden. In this Swedish 10-year birth cohort, the researchers looked at 1,075,588 children, but
‡‡‡‡ All calculations for the prevalence rates were done by the author
1 in 4167
1 in 1667
1 in 1429
1 in 813
1 in 800
1 in 641
1 in 806 (*)
0 1000 2000 3000 4000 5000
Algarve
Norte
Alentejo
Lisboa e Vale do Teyo
Centro
Azores Island
NATIONWIDE
International Electronic Journal of Elementary Education Vol.9, Issue 2, 263-306, December, 2016
288
14,025 cohort members were excluded due to the fact that they had a psychiatric diagnosis other than autism. Moreover, the original sample was reduced further to 1,034,627 due to missing data on one or more covariates or other reasons. The researchers used the narrow diagnosis of infantile/childhood autism (ICD-9 diagnostic codes 299A or ICD-10 diagnostic codes F84.0–F84.1) and did not include other forms of autism spectrum disorders (i.e. Asperger’s syndrome or PDD-unspecified). Since no specific code of autism was available before ICD-9 was introduced in 1987, the study was restricted to include subjects diagnosed from 1987. The study resulted in finding only 860 children with the diagnosis of childhood autism. This means that the prevalence of childhood autism (not ASD) in the study group was 8.3/10,000.
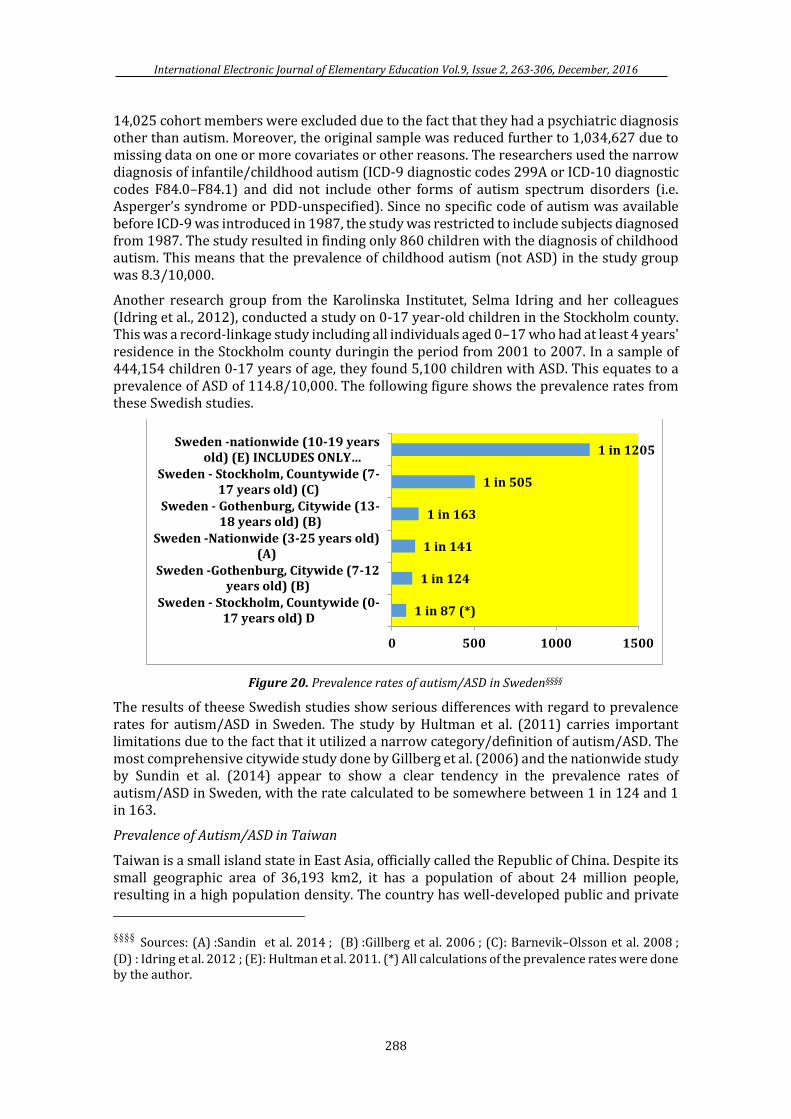
Another research group from the Karolinska Institutet, Selma Idring and her colleagues (Idring et al., 2012), conducted a study on 0-17 year-old children in the Stockholm county. This was a record-linkage study including all individuals aged 0–17 who had at least 4 years' residence in the Stockholm county duringin the period from 2001 to 2007. In a sample of 444,154 children 0-17 years of age, they found 5,100 children with ASD. This equates to a prevalence of ASD of 114.8/10,000. The following figure shows the prevalence rates from these Swedish studies.
Figure 20. Prevalence rates of autism/ASD in Sweden§§§§
The results of theese Swedish studies show serious differences with regard to prevalence rates for autism/ASD in Sweden. The study by Hultman et al. (2011) carries important limitations due to the fact that it utilized a narrow category/definition of autism/ASD. The most comprehensive citywide study done by Gillberg et al. (2006) and the nationwide study by Sundin et al. (2014) appear to show a clear tendency in the prevalence rates of autism/ASD in Sweden, with the rate calculated to be somewhere between 1 in 124 and 1 in 163.
Prevalence of Autism/ASD in Taiwan
Taiwan is a small island state in East Asia, officially called the Republic of China. Despite its small geographic area of 36,193 km2, it has a population of about 24 million people, resulting in a high population density. The country has well-developed public and private
§§§§ Sources: (A) :Sandin et al. 2014 ; (B) :Gillberg et al. 2006 ; (C): Barnevik–Olsson et al. 2008 ;
(D) : Idring et al. 2012 ; (E): Hultman et al. 2011. (*) All calculations of the prevalence rates were done by the author.
1 in 87 (*)
1 in 124
1 in 141
1 in 163
1 in 505
1 in 1205
0 500 1000 1500
Sweden - Stockholm, Countywide (0-17 years old) D
Sweden -Gothenburg, Citywide (7-12years old) (B)
Sweden -Nationwide (3-25 years old)(A)
Sweden - Gothenburg, Citywide (13-18 years old) (B)
Sweden - Stockholm, Countywide (7-17 years old) (C)
Sweden -nationwide (10-19 yearsold) (E) INCLUDES ONLY…
The Issue of Prevalence of Autism/ Özerk
289
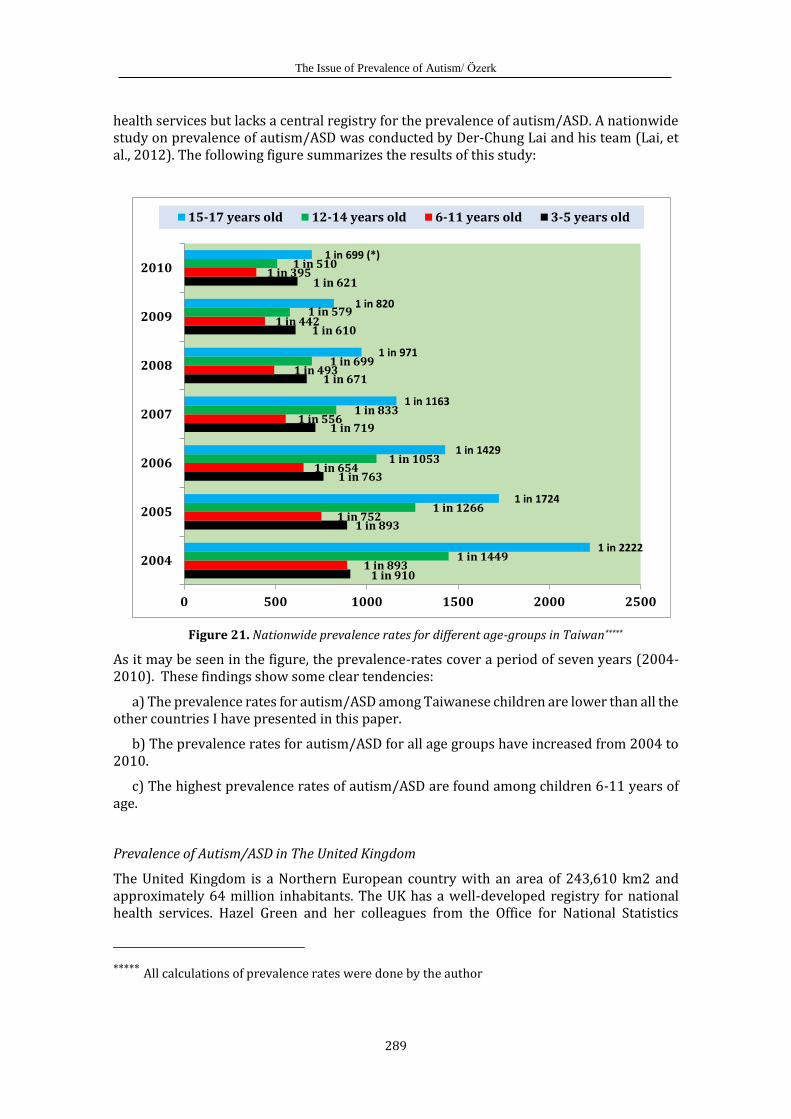
health services but lacks a central registry for the prevalence of autism/ASD. A nationwide study on prevalence of autism/ASD was conducted by Der-Chung Lai and his team (Lai, et al., 2012). The following figure summarizes the results of this study:
Figure 21. Nationwide prevalence rates for different age-groups in Taiwan*****
As it may be seen in the figure, the prevalence-rates cover a period of seven years (2004-2010). These findings show some clear tendencies:
a) The prevalence rates for autism/ASD among Taiwanese children are lower than all the other countries I have presented in this paper.
b) The prevalence rates for autism/ASD for all age groups have increased from 2004 to 2010.
c) The highest prevalence rates of autism/ASD are found among children 6-11 years of age.
Prevalence of Autism/ASD in The United Kingdom
The United Kingdom is a Northern European country with an area of 243,610 km2 and approximately 64 million inhabitants. The UK has a well-developed registry for national health services. Hazel Green and her colleagues from the Office for National Statistics
***** All calculations of prevalence rates were done by the author
1 in 910
1 in 893
1 in 763
1 in 719
1 in 671
1 in 610
1 in 621
1 in 893
1 in 752
1 in 654
1 in 556
1 in 493
1 in 442
1 in 395
1 in 1449
1 in 1266
1 in 1053
1 in 833
1 in 699
1 in 579
1 in 510
1 in 2222
1 in 1724
1 in 1429
1 in 1163
1 in 971
1 in 820
1 in 699 (*)
0 500 1000 1500 2000 2500
2004
2005
2006
2007
2008
2009
2010
15-17 years old 12-14 years old 6-11 years old 3-5 years old
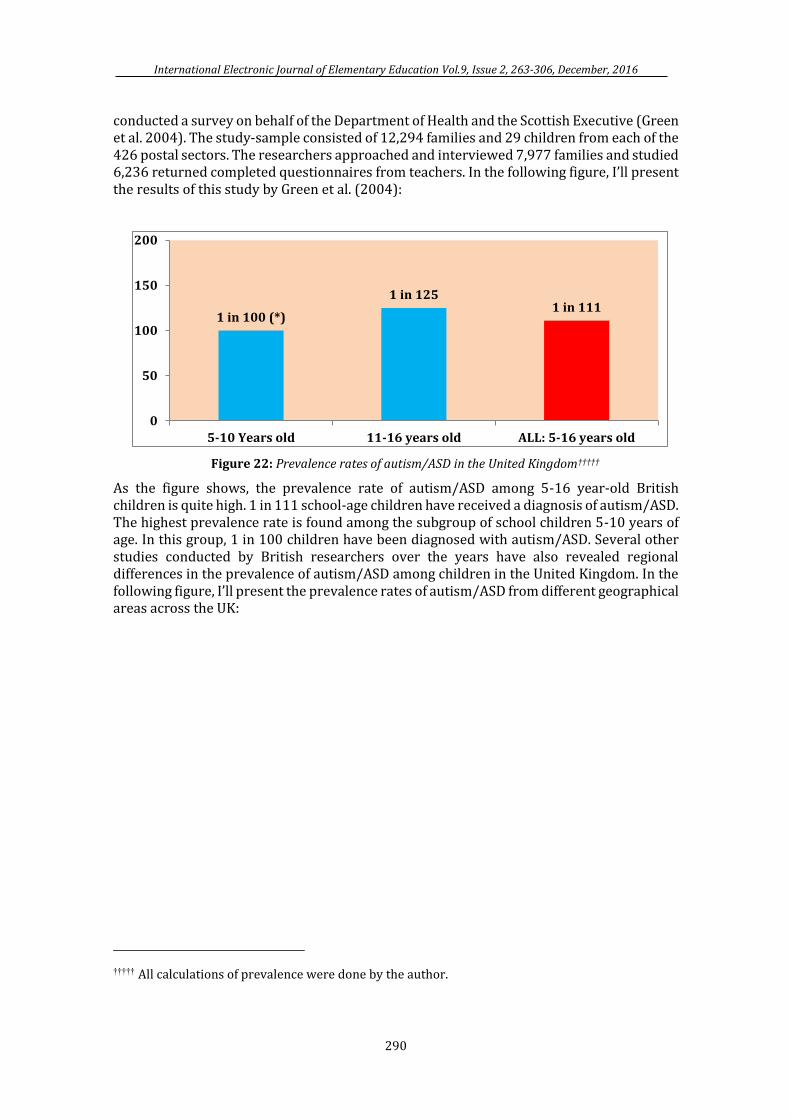
International Electronic Journal of Elementary Education Vol.9, Issue 2, 263-306, December, 2016
290
conducted a survey on behalf of the Department of Health and the Scottish Executive (Green et al. 2004). The study-sample consisted of 12,294 families and 29 children from each of the 426 postal sectors. The researchers approached and interviewed 7,977 families and studied 6,236 returned completed questionnaires from teachers. In the following figure, I’ll present the results of this study by Green et al. (2004):
Figure 22: Prevalence rates of autism/ASD in the United Kingdom†††††
As the figure shows, the prevalence rate of autism/ASD among 5-16 year-old British children is quite high. 1 in 111 school-age children have received a diagnosis of autism/ASD. The highest prevalence rate is found among the subgroup of school children 5-10 years of age. In this group, 1 in 100 children have been diagnosed with autism/ASD. Several other studies conducted by British researchers over the years have also revealed regional differences in the prevalence of autism/ASD among children in the United Kingdom. In the following figure, I’ll present the prevalence rates of autism/ASD from different geographical areas across the UK:
††††† All calculations of prevalence were done by the author.
1 in 100 (*)
1 in 1251 in 111
0
50
100
150
200
5-10 Years old 11-16 years old ALL: 5-16 years old
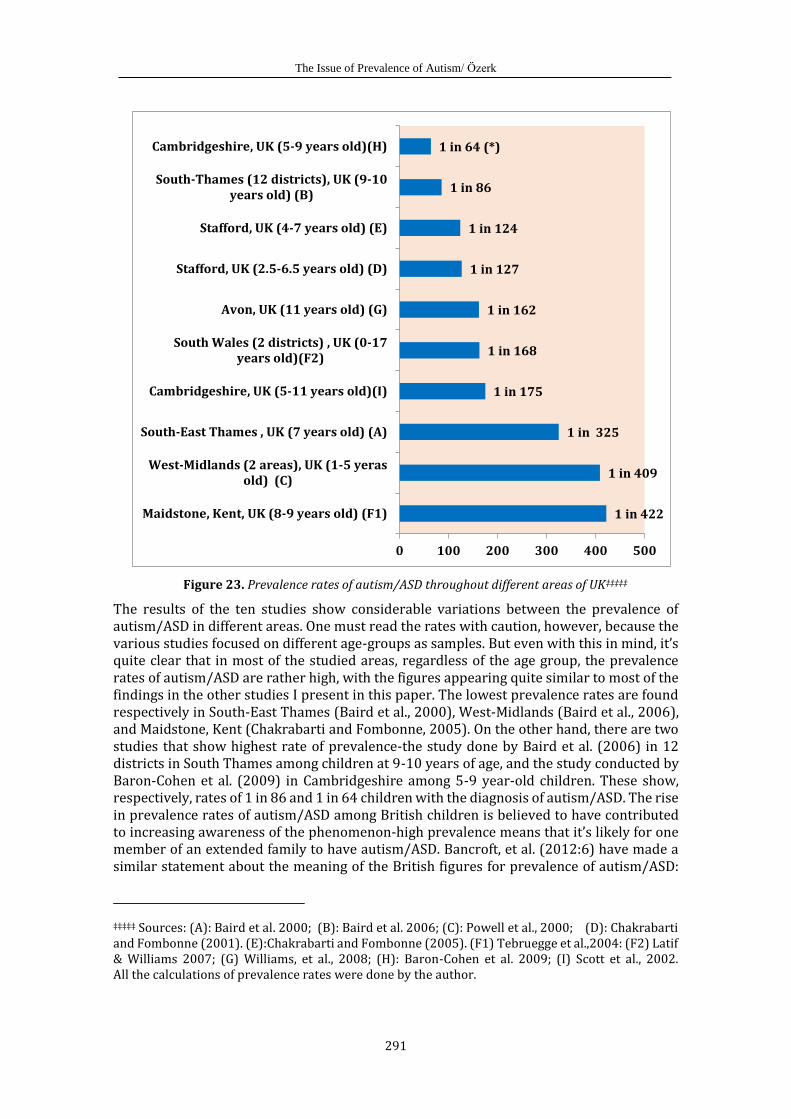
The Issue of Prevalence of Autism/ Özerk
291
Figure 23. Prevalence rates of autism/ASD throughout different areas of UK‡‡‡‡‡
The results of the ten studies show considerable variations between the prevalence of autism/ASD in different areas. One must read the rates with caution, however, because the various studies focused on different age-groups as samples. But even with this in mind, it’s quite clear that in most of the studied areas, regardless of the age group, the prevalence rates of autism/ASD are rather high, with the figures appearing quite similar to most of the findings in the other studies I present in this paper. The lowest prevalence rates are found respectively in South-East Thames (Baird et al., 2000), West-Midlands (Baird et al., 2006), and Maidstone, Kent (Chakrabarti and Fombonne, 2005). On the other hand, there are two studies that show highest rate of prevalence-the study done by Baird et al. (2006) in 12 districts in South Thames among children at 9-10 years of age, and the study conducted by Baron-Cohen et al. (2009) in Cambridgeshire among 5-9 year-old children. These show, respectively, rates of 1 in 86 and 1 in 64 children with the diagnosis of autism/ASD. The rise in prevalence rates of autism/ASD among British children is believed to have contributed to increasing awareness of the phenomenon-high prevalence means that it’s likely for one member of an extended family to have autism/ASD. Bancroft, et al. (2012:6) have made a similar statement about the meaning of the British figures for prevalence of autism/ASD:
‡‡‡‡‡ Sources: (A): Baird et al. 2000; (B): Baird et al. 2006; (C): Powell et al., 2000; (D): Chakrabarti and Fombonne (2001). (E):Chakrabarti and Fombonne (2005). (F1) Tebruegge et al.,2004: (F2) Latif & Williams 2007; (G) Williams, et al., 2008; (H): Baron-Cohen et al. 2009; (I) Scott et al., 2002. All the calculations of prevalence rates were done by the author.
1 in 422
1 in 409
1 in 325
1 in 175
1 in 168
1 in 162
1 in 127
1 in 124
1 in 86
1 in 64 (*)
0 100 200 300 400 500
Maidstone, Kent, UK (8-9 years old) (F1)
West-Midlands (2 areas), UK (1-5 yerasold) (C)
South-East Thames , UK (7 years old) (A)
Cambridgeshire, UK (5-11 years old)(I)
South Wales (2 districts) , UK (0-17years old)(F2)
Avon, UK (11 years old) (G)
Stafford, UK (2.5-6.5 years old) (D)
Stafford, UK (4-7 years old) (E)
South-Thames (12 districts), UK (9-10years old) (B)
Cambridgeshire, UK (5-9 years old)(H)
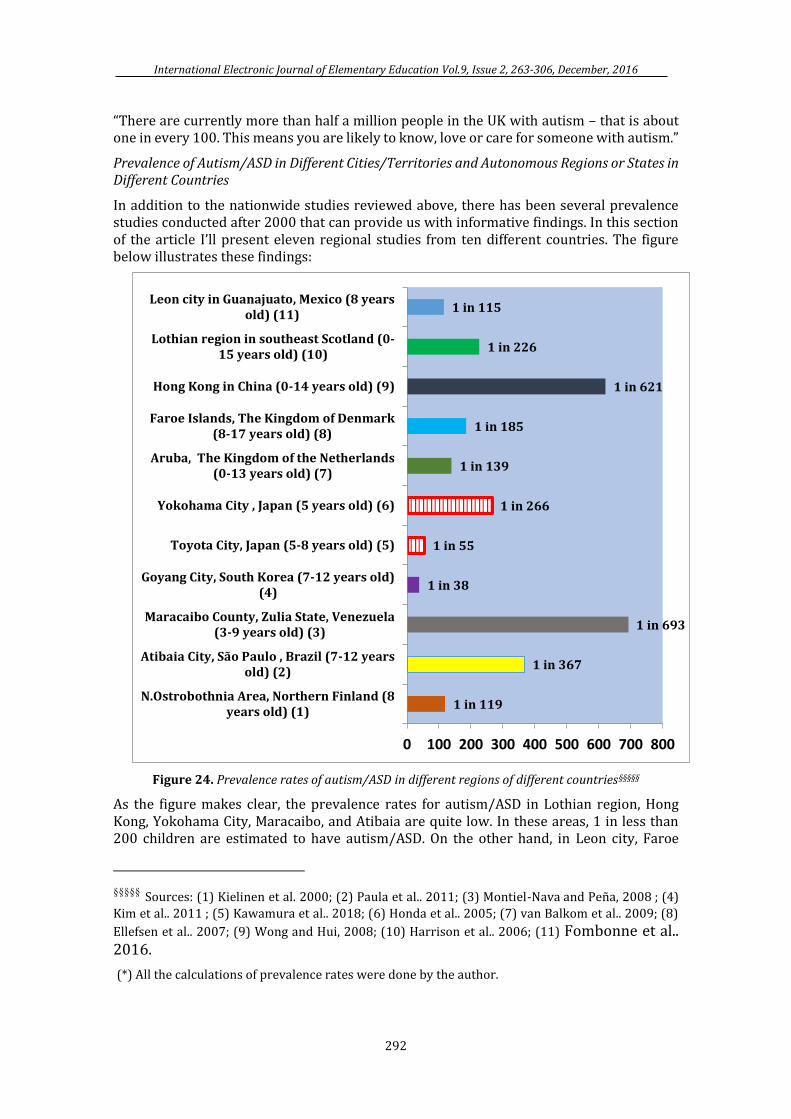
International Electronic Journal of Elementary Education Vol.9, Issue 2, 263-306, December, 2016
292
“There are currently more than half a million people in the UK with autism – that is about one in every 100. This means you are likely to know, love or care for someone with autism.”
Prevalence of Autism/ASD in Different Cities/Territories and Autonomous Regions or States in Different Countries
In addition to the nationwide studies reviewed above, there has been several prevalence studies conducted after 2000 that can provide us with informative findings. In this section of the article I’ll present eleven regional studies from ten different countries. The figure below illustrates these findings:
Figure 24. Prevalence rates of autism/ASD in different regions of different countries§§§§§
As the figure makes clear, the prevalence rates for autism/ASD in Lothian region, Hong Kong, Yokohama City, Maracaibo, and Atibaia are quite low. In these areas, 1 in less than 200 children are estimated to have autism/ASD. On the other hand, in Leon city, Faroe
§§§§§ Sources: (1) Kielinen et al. 2000; (2) Paula et al.. 2011; (3) Montiel-Nava and Peña, 2008 ; (4)
Kim et al.. 2011 ; (5) Kawamura et al.. 2018; (6) Honda et al.. 2005; (7) van Balkom et al.. 2009; (8)
Ellefsen et al.. 2007; (9) Wong and Hui, 2008; (10) Harrison et al.. 2006; (11) Fombonne et al.. 2016.
(*) All the calculations of prevalence rates were done by the author.
1 in 119
1 in 367
1 in 693
1 in 38
1 in 55
1 in 266
1 in 139
1 in 185
1 in 621
1 in 226
1 in 115
0 100 200 300 400 500 600 700 800
N.Ostrobothnia Area, Northern Finland (8years old) (1)
Atibaia City, São Paulo , Brazil (7-12 yearsold) (2)
Maracaibo County, Zulia State, Venezuela(3-9 years old) (3)
Goyang City, South Korea (7-12 years old)(4)
Toyota City, Japan (5-8 years old) (5)
Yokohama City , Japan (5 years old) (6)
Aruba, The Kingdom of the Netherlands(0-13 years old) (7)
Faroe Islands, The Kingdom of Denmark(8-17 years old) (8)
Hong Kong in China (0-14 years old) (9)
Lothian region in southeast Scotland (0-15 years old) (10)
Leon city in Guanajuato, Mexico (8 yearsold) (11)
The Issue of Prevalence of Autism/ Özerk
293
Islands, Aruba, City of Toyota, Goyang City, and North Ostrobothnia, the prevalence rates of autism/ASD are 1 in 200 or higher. One can see that, on average, these rates are very much in line with the trend in many of the nationwide studies that I have presented in earlier sections of this paper. There are, however, three striking facts we can observe in the above figure:
a) There is a significant difference in the prevalence rates of the two Japanese cities. Toyota's prevalence of autism/ASD is nearly five times higher than Yokohame. This fact elicits an important question about whether the age of the samples has some impact on the rates. The Toyota study focused on 5-8 year-olds, while the Yokohama study included only 5-year-old children in its sample.
b) Another striking result here is the Finnish-study, showing 1 in 119 children at 8 years of age having autism/ASD. Finland, Sweden, and Norway are three neighboring countries. As presented above, two comprehensive and thorough Swedish studies-one citywide (Gillberg et al., 2006) and one nationwide (Sandin et al. 2014)-found respectively that 1 in 124 and 1 in 141 Swedish children had a diagnosis of autism/ASD. One could assess the Swedish prevalence rates and the Finnish prevalence rates as being quite close. We can also assert the same for the Danish prevalence rates: Between 1 in 101 and 1 in 132 children at 6 years of age received a diagnosis of ASD based on ICD-10. On the other hand, we see some differences between these Nordic countries and Norway with regard to prevalence rates. In Norway, the national average has been calculated to be 1 in 189, and in the three Northern counties of Norway (Norland, Troms, and Finnmark), which are quite close to Sweden and Finland, the prevalence rates are 1 in 204, 1 in 182, and 1 in 213 respectively (see figure 18).
c) The third striking finding in the above figure is the South Korean study in Goyang City, recording the highest ever rate of prevalence of autism/ASD in the reviewed literature in this article. The second highest rate of prevalence is in the Dutch region of Eindhoven, where 1 in 44 children at 4-16 years of age have been diagnosed with autism/ASD (see figure 15)
Discussion with particular focus on the causes of differences and the rise in the prevalence of autism/ASD
I have presented nationwide, citywide, and regional studies of prevalence of autism/ASD from eleven countries and citywide or regional/territorial studies from ten countries. A clear trend among these studies is that prevalence of autism/ASD has increased over the last two decades-although the increase is not so apparent in some countries or regions. The relevant policy documents, research literature, and empirical studies that this paper has been primarily based on were published during the time period of 2000-2016, but many samples in these studies received their diagnosis in the 1990s. This is important to note because from 1990 to 2016, there have been some important changes in the diagnostic manuals ICD and DSM. The following figure shows the changes/revisions:
Timeline for Changes / Revisions of Diagnostic Manuals ICD and DSM: 1990-2016
1990-1993 ICD-9 1994 - 2016 ICD 10
1990–1993 DSM III
1994-1999 DSM IV 2000-2012 DSM-IV-TR 2013 – DSM5
Figure 25. Changes/revisions of diagnostic manuals: 1990-2016
International Electronic Journal of Elementary Education Vol.9, Issue 2, 263-306, December, 2016
294
2000 was the year in which The Autism and Developmental Disabilities Monitoring (ADDM) Network, a group of programs funded by the U.S. federal agency Centers for Disease Control and Prevention (CDC), started to collect data about the population of children with autism/ASD. During the period from 2000-2005, prevalence estimates began to show both that autism/ASD was on the rise and that there were geographical variations in the prevalence estimates and rates. This history is from the American side.
On the European side, in the first half of the 2000s, the European Commission for Health and Consumer Protection Directorate-General also stated to give more attention to the prevalence statistics and studies. In a report, the following conclusions on autism/ASD were mentioned: the European Union lacks good data to test hypotheses on secular changes in the incidence of autism. They concluded that studies of prevalence in the EU and the U.S. had important methodological limitations and thus could be used to derive absolute conclusions on the increase of prevalence. Therefore they underline the necessity of more developed monitoring systems than those currently in place to address the issue of changes in the prevalence of ASD. With this background, the EU funded a research project conducted by Manuel Posada and his colleagues from the Research Institute for Rare Diseases, Madrid, to design a strategy for the development of a system to more accurately measure the prevalence of autism/ASD (Posada et. al., 2007). A year after this study, in 2008, new prevalence statistics of autism/ASD in the U.S. were released by the CDC (CDC, 2008) showing that 1 out of 88 children at the age of 8 received a diagnosis of autism/ASD based on the diagnostic criteria in DSM IV-TR. Since the year 2000 and particularly since 2008, all prevalence studies have shown that diagnoses of autism/ASD are on the rise. This has led to serious debate over causes of this rise, the factors accounting for it, and the visible disparities between the various studies, countries, and regions with regard to prevalence rates.
Nationwide and regional prevalence statistics also revealed notable intra-national differences—or, in other words, inter-regional differences in all the presented 21 countries. Particularly of note are huge disparities between several states in the U.S., between several counties in Norway, between several regions/territories in Australia, between cities/counties in Sweden and in the Netherlands, and between the three regions in Canada. At the same time, this study also revealed that differences between the prevalence rates of autism/ASD in children across different age groups are significant. And it’s clear from this research literature that Portugal seems to be the country with the lowest prevalence rates compared to other countries, but there's no explanation as to why. Yet, the biggest question is how one can explain the overall rise in prevalence rates coupled with the geographic and age-related variations.
Factors accounting for the increase of and variations in prevalence rates
a) One of the most articulated comments on the rise of and disparities in prevalence rates is that many studies used unclear and/or different methods in surveys and/or that they had limited, not representative samples (Williams et al., 2006; Elsabbagh et al., 2012; Posada et al., 2017).
b) The other related factors are the diagnostic substitution, changing, and expanding of diagnostic criteria in DSM III-R in 1987 and DSM IV-TR in 1994. Due to the changes in these manuals, children with developmental language disorder or pragmatic language impairments could get diagnosed as having autism/ASD (Baird et.al., 2006; Bishop et al., 2008). Furthermore, modifications in ICD 10 in the 1990s or later could have impacted the prevalence rates as well (Howlin, 2008). Other researchers have claimed that the increased prevalence might be due to over-diagnosis of autism/ASD, at least in some areas, because DSM-IV, DSM-IV-TR, and ICD-10 leave room for subjective judgment (Roelfsema et al.,
The Issue of Prevalence of Autism/ Özerk
295
2012). The Danish study by Hansen et al. (2015) shows that the prevalence rates of autism/ASD there have increased after the introduction of ICD-10 (see figure 13 and 24). The researchers found that in the youngest age-group/birth cohort( i.e. among the children born in 1990-1991), the prevalence rate of autism/ASD was very high if they received their diagnosis based on ICD-10 in 2011 compared to children of the same age who received their diagnosis earlier than that. In a recent study conducted at the county-level and state-level in California, Cardinal and Griffiths (2016) found that during the last 15 years, from 2000 to 2015, the number and proportion of children with ‘specific learning disabilities’ among children in special education has decreased while the number of children diagnosed with of autism/ASD increased. The researchers claim that 99% of this increase in autism is due to ‘diagnostic migration’. This argument suggests that, due to the changes in diagnostic manuals and diagnostic practices and most likely also changes in provisions and economic support systems in the U.S. during the last 15 years, a situation arose where children who would be defined as ‘specific learning disability’ in earlier years were instead being assigned the diagnosis of autism/ASD.
c) Increased competency, better instruments, and improved recognition and detection have also been mentioned as some of the contributing factors for the rise in prevalence (Wing and Potter 2002). This argument is connected to another possible explanation: Increased awareness among educational and clinical professionals may result in better ascertainment (Baird et.al., 2006; Williams et al., 2006; Howlin, 2008). The increased awareness among the public and parents (Baron-Cohen et al. 2009; Elsabbagh et. al., 2012) may also have an impact on the rise of prevalence rates among children.
d) Geographic location and availability of professional services are specifically mentioned as explanatory factors for the variations in the prevalence rates between different cities and regions within the same country. Variations in screening/diagnostic instruments used (Posserud et. al., 2010) may also cause variations of prevalence estimates, as was shown in a Norwegian citywide study (see figure 17). Prevalence statistics may be influenced if the study sample is from an urban area with easy access to specialized services or, conversely, if the study sample is from a rural area with few or lack of specialized professionals and/or weak medical infrastructure (Williams et al., 2006). Variations in the regional prevalence rates in Portugal stand as a good example supporting this argument (see figure 19). On the other hand, the huge differences between some Norwegian counties (as I presented in Figure 18), weaken this argument, since Norway has a socialized health care system which provides equal access to specialized services regardless area of residence.
e) Availability of suitable funding, better services, and accessible special schools: In many countries, health care services and/or specialized services are not fully socialized. Having a child with autism/ASD in one of these countries equates to a need for more money-necessary to provide access to adopted treatment, training, and teaching services. When such services are not covered by public support, the parents need this funding. If there are different rules and funding opportunities in different areas throughout a country (i.e. the U.S. and U.K.), families often relocate into areas with easier access to the service providers and special schools they need (Scott et al. 2002; Williams, et.al., 2006; Baron-Cohen et al., 2009). This type of social mechanism can result in greater concentrations of families with children with autism/ASD in some areas of a country than others, causing geographical variations in prevalence rates.
f) The concentration of children with autism/ASD in certain areas of a given country also can be a consequence of parents with autism/ASD having located in certain areas. Since autism/autism spectrum disorders (ASD) are considered to be among the most heritable of all neurodevelopmental disorders (Linctenstein et. al., 2010; Robinson et al., 2011), it is
International Electronic Journal of Elementary Education Vol.9, Issue 2, 263-306, December, 2016
296
reasonable to expect relative higher prevalence rate among children in the areas where there exists a high concentration of fathers or mothers with same disorders. As figure 15 shows, the prevalence rate is 1 in 44 in the Dutch region of Eindhoven in the Netherlands. In their discussion of the causes of this very high prevalence rate, Roelfsema and her colleagues (Roelfsema et al., 2012) try to explain this using a ‘hyper-systemizing theory’ developed by Simon Baron-Cohen (2006, 2008). The argument here is that many adults with autism/ASD have an unusually strong drive to systemize. Areas/regions with high-tech industries value and attract talented systemizers. They define the Eindhoven region as the hub for IT and technology in the Netherlands. Therefore, it’s not surprising that autism/ASD would be more common among children in this area (1 in 44) since the likelihood is very high that adult individuals who are talented systemizers are attracted to working and raising a family there. This hyper-systemizing theory is quite new in the field, but not the ‘popular one’-the so called “The Geek Syndrome”, which originates from Silicon Valley in the U.S. Steve Silberman (2011) mentions the following as one of the simple explanations for the situation in that high-tech area: autism is really increasing because of assortative mating: geeks like other geeks, so they get together and have children! Other high-tech regions with quite high prevalence rates include Stockholm county in Sweden, where the prevalence rate is 1 in 87 (see figure 20) according to the study by Idring et al. (2012), the British areas Cambridgeshire (Baron-Cohen et al., 2009) and South-Thames (Baird et al, 2006) where the prevalence rates of autism/ASD among school-age children are respectively 1 in 64 and 1 in 86 (see figure 23). Furthermore Toyota city in Japan as well as Goyang City, South Korea have very high prevalence rates-1 in 55 and 1 in 38, respectively. At state/county/region levels, there are 23 states in the U.S. (see figure 3), two regions in Canada (see figure 10), one area in Finland and one in Mexico (see figure 24) and three counties in Norway (see figure 18) where the prevalence rates for autism/ASD are higher than 1 in 120. More total and more thorough research is needed to explain these high prevalence rates in some areas compared to others and also test Baron-Cohen’s ‘‘hyper-systemizing theory’ to see whether it can survive closer scrutiny
g) Starting at school increases detection and thus prevalence rates for elementary school age groups. There is quite a clear tendency in many of the figures in which I present the prevalence rates of autism/ASD for differentiated age-groups: The prevalence rates for school children (5/6-11/12) is higher than those for younger or older groups. This is valid for Australia (see Figure 6) and for Canada (see figure 9). In the Norwegian population studies (Surén et al., 2011; 2013), the prevalence rate is 1 in 125 for 11 year-olds, but 1 in 189 on average for 6-12 year-olds (see figures 16 and 18). Only one Swedish city-wide study includes separate school-age categories (Gilberg et al., 2016): the prevalence rate in that study is 1 in 124 for elementary school children and 1 in 163 for junior and senior secondary school children in Gothenburg, Sweden. In the British regional studies of 5-9 year-olds (Baron-Cohen et al., 2009), 9–10 year-olds (Baird et. al., 2006), and 4-7 year-olds (Chakrabarti and Fombonne, 2005), the prevalence rates are higher than other regional studies in which the samples were 7 years-old (Baird et al., 2000), 1-5 years-old (Powell et al., 2000), and 8-9 years-old (Tebruegge et al., 2004) as is shown in figure 23. In the country-wide British study (Green et al., 2004), the prevalence rate is 1 in 100 for 5-10 years old and 1 in 125 for the older group, 11-16 years old (see figure 22). In Taiwanese study (Lai, et. al.,2012), the tendency is clear: In all the annual statistics for prevalence between the year 2004 and 2010, the 6-11 year-olds (elementary school age group) have the highest prevalence rates compared to all other younger or older groups (see figure 21). In the Danish study by Parner et al. (2008), the prevalence rates of autism/ASD among 5.9 year-olds or 5.8 year-olds (most likely school starters in the Danish school system) are higher than those who are 5.3 years old and who are most likely still kindergarten children (see figure 12).
The Issue of Prevalence of Autism/ Özerk
297
h) Inter-national and intra-national cultural differences, where the diagnosis of autism/ASD is considered a stigma, can explain in some cases the discrepancies in prevalence rates.
i) Socioeconomic background or/and ethnic minority and/or linguistic minority backgrounds can also play a significant role in prevalence rates found in many countries or areas. Several researchers have addressed this factor by showing that these groups are under-represented, under-diagnosed, and thus under-supported by professional services (Begeer et al., 2009; Özerk and Özerk, 2015; Blumberg et. al, 2013; Zablotsky et al. 2015; Christiansen et al., 2016). I feel it necessary to mention this factor group although I did not address this aspect of prevalence in this article.
In conclusion, this analysis of the review of changes in diagnostic manuals over time, the review of research literature, and the presentation and elaboration of more than 50 empirical studies from 21 countries, demonstrates that the prevalence rates of autism/ASD have increased in all countries over time. I discussed nine possible causes of those increases, each supported to certain degrees by the findings. It’s quite obvious that changes in diagnostic manuals, diagnostic substitutions, or ‘diagnostic migration’ have had and still have a serious impact on global prevalence rates. The key limitation of this study, and also of the international scientific literature, is that many countries are not a part of or not involved in the prevalence studies and ongoing academic conversation. Among the 30 most populated countries in the world, only four of them (the United States, Japan, the United Kingdom, and South Korea) have considerable prevalence studies. China, Brazil, and Mexico are three of these most populated countries in the world, yet have few or sporadic studies on autism. The other 23 most populated countries (India, Indonesia, Pakistan, Nigeria, Bangladesh, Russia, the Philippines, Ethiopia, Vietnam, Egypt, Germany, Iran, DR Congo, Thailand, Turkey, France, Italy, Tanzania, South Africa, Myanmar, Colombia, Kenya, and Spain) are not participants in studies at all or visible in the scientific knowledge production and conversation. They may also simply lack any means of oversight of prevalence rates of autism/ASD within their national borders. From an educationist perspective, this is a problem-not only for these countries, but also for the field of autism/ASD-research. Cross cultural and international studies are needed to enrich our knowledge about this ‘disorder’ that, according to the studies presented here, is on the rise (or its prevalence rate is on the rise) and may now be the fastest growing diagnosis among children in those respective countries.
As mentioned earlier, this study reveals that there are some small and sometimes huge inter-national and intra-national variations in the prevalence rates in all countries. The cause of these discrepancies can be one or the combination of many of the factors mentioned above. Whatever one's beliefs about the cause, it is clear that future research on prevalence must include and address additional dimensions of prevalence apart from geographic and age dimensions. The field needs more total and more thorough prevalence studies based on clear, representative, and inclusive samples using solid research methodologies covering a wider range of areas than the current studies, where the dominance of American, British, Canadian, and Scandinavian studies is apparent. Future research must also address the gender, cultural, social-class, ethnic minority, and linguistic-minority dimensions of prevalence of autism/ASD more than is the case today.
We know that children with autism/ASD can be treated, trained, and taught. But it takes reliable and informative data about prevalence rates and prevalence tendencies among children in different age groups, with different gender, socio-economic, ethnic, cultural, and language backgrounds in the population to make this happen successfully. This work is essential if we are to be truly effective in planning and improving educational and psychological intervention for treatment, training, and teaching of children with
International Electronic Journal of Elementary Education Vol.9, Issue 2, 263-306, December, 2016
298
autism/ASD. Policy makers and higher educational institutions will respond to reliable prevalence studies, informing them on the need for programs and courses that will improve the skills of those professionals who will one day care for someone with autism/ASD. Though these prevalence studies will inevitably rely on data from the past, we must carefully structure them in a way that will give us direction into the future, affording us the scope and depth necessary to properly understand what is happening to our children.
• • •
References
ADI-R: Autism Diagnostic Interview-Revised created by Michael Rutter, MD FRS, Ann LeCouteur, MBBS and Catherine Lord, PhD in 1994
ADOS: Autism Diagnostic Observation Schedule created by Catherine Lord, Ph.D., Michael Rutter, M.D., FRS, Pamela C. DiLavore, Ph.D., and Susan Risi, Ph.D in 1989.
American Psychiatric Association. (1980). Diagnostic and statistical manual of mental disorders (3rd ed.). Washington, DC: APA Press.
American Psychiatric Association. (1987). Diagnostic and statistical manual of mental disorders (3rd ed., text rev.). Washington, DC: APA Press.
American Psychiatric Association. (1994). Diagnostic and statistical manual of mental disorders (4th ed.). Washington, DC: APA Press.
American Psychiatric Association. (2000). Diagnostic and statistical manual of mental disorders (4th ed., text rev.). Washington, DC: APA Press.
American Psychiatric Association. (2013). Diagnostic and statistical manual of mental disorders (5th ed.). Washington, DC: APA Press.
Autism-Europe, 2016: http://www.autismeurope.org . Accessed 03.03.2016 )
Autism Society of USA (2016): http://www.autism-society.org/what-is/. Accessed 03.03.2016.
Autism Speaks (2006): https://www.autismspeaks.org/what-autism. Accessed 03.03.2016
Baird, G., Charman, T., Baron-Cohen, S., Cox, A. Swettenham, J., Wheelwright, S. & Drew, A. (2000). A Screening Instrument for Autism at 18 Months of Age: A 6-Year Follow-up Study. Journal of the American Academy of Child and Adolescent Psychiatry, 39(6), 694–702.
Baird, G., Simonoff, E., Pickles, A., Chandler, S., Loucas, T., Meldrum, D. & Charman, T. (2006). Prevalence of disorders of the autism spectrum in a population cohort of children in South Thames: the special needs and autism project (SNAP). Lancet, 368, 210–215.
Bancroft, K., Batten, A., Lambert, S. & Madders, T. (2012). The way we are: autism in 2012. London. The National Autistic Society.
Barnevik Olsson, M., Gillberg, C. & Fernell, E. (2008). Prevalence of autism in children born to Somali parents living in Sweden: a brief report. Developmental Medicine & Child Neurology, 50, 598–601.
Baron-Cohen, S. (2006). The hyper-systemizing, assortative mating theory of autism. Progress in Neuro-Psychopharmacology and Biological Psychiatry, 30, 865–872.
Baron-Cohen, S. (2008). Autism, hypersystemizing, and truth. Quarterly Journal of Experimental Psychology, 61, 64-75.
The Issue of Prevalence of Autism/ Özerk
299
Baron-Cohen, S., Scott, F. J., Allison, C., Williams, J., Bolton, P., Matthews, F. E. & Brayne, C. (2009). Prevalence of autism-spectrum conditions: UK school-based population study. The British Journal of Psychiatry. 194, pp 500–509. DOI:10.1192/bjp.bp.108.059345.
Bearss, K., Johnson, C., Smith, T., Lecavalier, L., Swiezy, N., Aman, M., McAdam, D.B., Butter, E., Stillitano, C., Minshawi, N., Sukhodolsky, D.G., Mruzek, D.W., Turner, K., Neal, T., Hallett, V., Mulick, J.A., Green, B., Handen, B., Deng, Y., Dziura, J. & Scahill, L. (2015).Effect of parent training vs parent education on behavioral problems in children with autism spectrum disorder: a randomized clinical trial. The Journal of the American Medical Association, 313(15), 1524-1533. doi:10.1001/jama.2015.3150.
Begeer, S., Bouk, S.E., Boussaid, W., Terwogt, M.M., & Koot, H.M. (2009). Underdiagnosis and Referral Bias of Autism in Ethnic Minorities. Journal of Autism and Developmental Disorders, 39, 42-148.
Bishop, D.V.M., Whitehouse, A. J. O., Watt, H. J. & Line, E. A. (2008). Autism and diagnostic substitution: evidence from a study of adults with a history of developmental language disorder. Developmental Medicine & Child Neurology, 50, 341-345
Blumberg, S. J., Bramlett, M.D., Kogan, M.D., Schieve, L.A., Jones, J.R. & Lu, M.C. (2013). Changes in prevalence of parent-reported autism spectrum disorder in school-aged U.S. children: 2007 to 2011–2012. National Health Statistics Reports no 65, March 20, 2013. Hyattsville, MD: National Center for Health Statistics (NCHS).
CARS2: Childhood Autism Rating Scale, Second Edition created by Eric Schopler, Mary E. Van Bourgondien, Ph.D.Glenna Janette Wellman.& Steven R. Love in 2010.
CDC (2008). Prevalence of autism. http://www.cdc.gov/ncbddd/autism/data.html (Accessed December, 10, 2008).
CDC (2014). Autism and Developmental Disabilities Monitoring Network Surveillance Year 2010 Principal Investigators. Prevalence of autism spectrum disorder among children aged 8 years—Autism and Developmental Disabilities Monitoring Network, 11 sites, United States, 2010. MMWR Surveillance Summaries 2014; 63(No. SS-2). Atlanta, GA: Centers for Disease Control and Prevention.
CDC (2016). Centers for Disease Control and Prevention. Autism Spectrum Disorder (ASD). Data and Statistics. http://www.cdc.gov/ncbddd/autism/data.html (Accessed June 16th, 2016).
CDC (2016a). International Classification of Diseases, Tenth Revision, Clinical Modification (ICD 10-CM) http://www.cdc.gov/nchs/icd/icd10cm.htm. Accessed 510.03, 2016).
CDC (2016b). Morbidity and Mortality Weekly Report – Surveillance Summaries Vol. 65-No 2 (April 1, 2016) Atlanta, Georgia: Centers for Disease Control and Prevention.
Cambridge Advanced Learner’s Dictionary & Thesaurus © Cambridge University Press.
Cardinal, D. & Griffiths, A-J. (2016). Summary of findings. Report presentet at the Inagural Disability Summit. Orange: Chapman University, Thompson Policy Institute.
Chakrabarti, S. & Fombonne, E. (2001). Pervasive developmental disorders in preschool children. The Journal of the American Medical Association, 28(24), 3093–3099.
Chakrabarti, S. & Fombonne, E. (2005). Pervasive developmental disorders in preschool children: confirmation of high prevalence. American Journal of Psychiatry, 162, 1133–1141.
Charlop-Christy, M. H., LeBlanc, L. A. & Carpenter, H. M. (1999). Naturalistic teaching strategies (NATS) to teach speech to children with autism: Historical perspective, development, and current practice. The California School Psychologist, 4, 30-46.
Christensen, D.L, Baio, J., Braun, KV., Bilder, D., Charles, J., Constantino, J. N. Daniels, J., Durkin, M.S., Fitzgerald, R.T., Kurzius-Spencer, M. Lee, L-C., Pettygrove, S., Robinson, C., Schulz, E., Wells, C., Wingate, M.S., Zahorodny, W. & Yeargin-Allsopp, M. (2016). Prevalence and Characteristics of Autism Spectrum Disorder Among Children Aged 8 Years — Autism and Developmental Disabilities Monitoring Network, 11 Sites, United States, 2012. Morbidity and Mortality Weekly
International Electronic Journal of Elementary Education Vol.9, Issue 2, 263-306, December, 2016
300
Report Surveillance Summaries 2016; 65 (No. SS-3)(No. SS-3) pp 1–23. DOI: http://dx.doi.org/10.15585/mmwr.ss6503a1.
Compart, P. J. (2012). Diagnosis Matters. Paper presented at The ARI-Conference Fall-2012. Autism Research Institute. San Diego, California.
Constantino, J. N., Zhang, Y., Frazier, T., Abbacchi, A. M &, Law, P. (2010). Sibling recurrence and the genetic epidemiology of autism. American Journal of Psychiatry, 167(11), 1349–1356
Courchesne, E., Campbell, K., Solso, S. (2011). Brain growth across the life span in autism: Age-specific changes in anatomical pathology. Brain Research, 1380, 138-145,
Davidovitch, M., Hemo, B., Manning-Courtney, P. & Fombonne, E. (2013). Prevalence and Incidence of Autism Spectrum Disorder in an Israeli Population. Journal of Autism and Developmental Disordorders, 43, 785–793. DOI 10.1007/s10803-012-1611-z.
DAWBA: The Development and Well-Being Assessment developed by Robert Goodman, Tamsin Ford, Hilary Richards, Rebecca Gatward and Howard Meltze in 2000.
DISCO: Diagnostic Interview for Social and Communication Disorders – tenth version developed by Leekam, S., Libby, S., Wing, L., Gould, J., & Taylor, C. (2002) and The Swedish version of DISCO-10 by Nygren, G., Hagberg, B., Billstedt, E., Skoglund, A., Gillberg, C. and Johannson, M. (2009).
Eikeseth, S. (1999). Intensive School-based Behavioral Treatment for Four to Seven Year Old Children with Autism: “A One Year Follow-up”. Paper presented at PEACH 'Putting Research into Practice' conference, London, June 18 1999.
Eikeseth, S., Smith, T., Jahr, E., & Eldevik, S. (2002). Intensive behavioral treatment at school for 4- to 7-year-old children with autism: A 1-year comparison controlled study. Behaviour modification: Special Issue: Autism, 26(2), 49–68.
Eikeseth, S. & Klintwall, L. (2014). Educational Interventions for Young Children with Autism Spectrum Disorders. In V. P. Patel and V. R. M. Colin (eds.). Comprehensive Guide to Autism. Section XV. pp 2101-2123. Springer Publishing Company.
Ellefsen, A., Kampmann, H., Billstedt, E., Gillberg, I. C. & Gillberg, C. (2007). Autism in the Faroe Islands. An Epidemiological Study. Journal of Autism and Developmental Disorders, 37(3), 437–444. DOI 10.1007/s10803-006-0178-y 123
Elsabbagh, M., Divan, G., Koh, Y.-J., Kim, Y. S., Kauchali, S., Marcín, C., Montial-Nava, C. , Patel, V. Paula, C. S., Wang, C. Yasamy, M. T. & Fombonne, E. (2012). Global Prevalence of Autism and Other Pervasive Developmental Disorders. Autism Research, 5(3), 160–179. http://doi.org/10.1002/aur.239.
European Commission (2005). Some elements about the prevalence of Autism Spectrum Disorders (ASD) in the European Union. Luxembourg: European Commission Health & Consumer Protection Directorate-General. Directorate C - Public Health and Risk Assessment C2 - Health information. Luxembourg,
Fombonne, E. (2005). Epidemological studies of pervasive developmental disorders. I F. Volkmar, R. Raol, A. Klin & D. Cohen (eds.). Handbook of Autism and pervasive developmental disorders. Hoboken, N.J. Wiley.
Fombonne, E., Zakarian, R., Bennett, A., Meng, L. & McLean-Heywood, D. (2006). Pervasive developmental disorders in Montreal, Quebec, Canada: prevalence and links with immunizations. Pediatrics, 118, 139–150.
Fombonne, E., Quirke, S., & Hagen, A. (2011). Epidemiology of pervasive developmental disorders. In D. G. Amaral, G. Dawson, & D. H. Geschwind (Eds.). Autism spectrum disorders. New York: Oxford University Press.CrossRef.
Fombonne, E. , Marcin, C., Manero, A. C., Bruno, R., Diaz, C., Villalobos, M., Ramsay, K. & Nealy, B. (2016). Prevalence of Autism Spectrum Disorders in Guanajuato, Mexico: The Leon survey. Journal of Autism and Developmental Disorders. 46(5), 1669–1685.
The Issue of Prevalence of Autism/ Özerk
301
GARS-2: Gilliam Autism Rating Scale–Second Edition (Gillian, 2006). It’s the revised version of Gilliam Autism Rating Scale developed by James E. Gillian in 1995.
Gillberg, C., Cederlund, M., Lamberg, K. & Zeijlon, L. (2006). Brief Report: “The Autism Epidemic”. The Registered Prevalence of Autism in a Swedish Urban Area. Journal of Autism and Developmental Disorders, 36(3), 429-435.
Gotham, K., Bishop, S. I. & Lord, C. (2011). Diagnosis of Autism Spectrum Disorders. In D.G. Amaral, G. Dowson & D.H. Geschwind (eds.). Autism Spectrum Disorders. New York: Oxford University Press.
Green, H., McGinnity, A., Meltzer, H., Ford, T. & Goodman, R. (2004). Mental health of children and young people in Great Britain. Gosport: Palgrave Macmillan/National Statistics.
Gundersen, T. og Hem K-G (2005). Brukerundersøkelse blant personer med diagnose innen autismespekteret. Erfaringer med Autismenettverket- 09-15 STF78 A054504.
Hansen, S. N., Schendel, D. E. & Parner, E. T. (2015). Explaining the Increase in the Prevalence of Autism Spectrum Disorders The Proportion Attributable to Changes in Reporting Practices. Journal of American Medical Association Pediatrics. 169(1), 56-62. DOI:10.1001/jamapediatrics.2014.1893.
Harris, S. L. (1995). Educational Strategies in Autism. In Schopler E. & Mesibov, G. B. (eds.). Learning and Cognition in Autism. NY: Plenum Press.
Harrison, M. J., O’Hare, A. E., Campbell, H., Adamson, A. & McNeillage, J. (2006). Prevalence of autistic spectrum disorders in Lothian, Scotland: an estimate using the “capture–recapture” technique. Archives of Disease in Childhood, 91(1), 16–19. http://doi.org/10.1136/adc.2004.049601.
Honda, H., Shimizu, Y. & Rutter, M. (2005). No effect of MMR withdrawal on the incidence of autism: a total population study. Journal of Child Psychology and Psychiatry 46, 572–579.
Howlin, P. (2008). Autism and diagnostic substitution. Developmental Medicine & Child Neurology. 50(5), 325–325.
Hultman, C. M., Sandin, S., Levine, S. Z., Lichtenstein, P. & Reichenberg, A. (2011). Advancing paternal age and risk of autism: new evidence from a population-based study and a meta-analysis of epidemiological studies. Molecular Psychiatry 16, pp 1203–1212. DOI:10.1038/mp.2010.121.
Idring, S., Rai, D., Dal, H., Dalman, C., Sturm, H., Zander, E., Lee, B. K., Serlachius, E. & Magnusson, C. (2012). Autism Spectrum Disorders in the Stockholm Youth Cohort: Design, Prevalence and Validity. PLoS ONE 7(7). e41280. DOI:10.1371/journal.pone.0041280.
Isaksen, J., Diseth, T.H., Schjølberg, S. & Skjeldal, O.H. (2012). Observed prevalence of autism spectrum disorders in two Norwegian counties. European Journal of Paediatric Neurology. 16 (6), 592-598.
Kawamura, Y., Takahashi, O. & Ishii, T. (2008). Reevaluating the incidence of pervasive developmental disorders: impact of elevated rates of detection through implementation of an integrated system of screening in Toyota, Japan. Psychiatry and Clinical Neuroscience, 62, 152–159.
Kielinen, M., Linna, S. L., & Moilanen, I. (2000). Autism in Northern Finland. European Child and Adolescent Psychiatry, 9, 162–167.
Kim, Y.S., Leventhal, B.L., Koh, Y.J., Fombonne, E., Laska, E., L., Cheon, K-A., Kim, S-J., Lee, H-K., Song, D-H & Grinker, R. R. (2011). Prevalence of Autism Spectrum Disorders in a Total Population Sample, 168(9), 904-912.
King, B. H. (2015). Promising Forecast for Autism Spectrum Disorders. The Journal of the American Medical Association, 313(15), 1518-1519.
Koegel, R.L., Vernon, T.W., & Koegel, L.K. (2009). Improving social initiations in young children with autism using reinforcers with embedded social interactions. Journal of Autism and Developmental Disorders, 39(9), 1240-1251.
International Electronic Journal of Elementary Education Vol.9, Issue 2, 263-306, December, 2016
302
Kupfer, D. J., Regier, D. A. & Kuhl, E. A. (2008). On the road to DSM-V and ICD-11. European Archives of Psychiatry and Clinical Neuroscience Volume 258, Supplement 5 (2008), 2-6.
Lai, D-C., Tseng, Y-C , Hou, Y-M. & Guo, H-R. (2012). Gender and geographic differences in the prevalence of autism spectrum disorders in children: Analysis of data from the national disability registry of Taiwan. Research in Developmental Disabilities 33, 909–915.
Latif, A.H. & Williams, W.R. (2007). Diagnostic trends in autistic spectrum disorders in the South Wales valleys. Autism. 11(6), 479-87.
Lavelle, T.A., Weinstein, M.C., Newhouse, J. P., Munir, K., Kuhlthau, K. A. & Prosser, L. A. (2014). Economic Burden of Childhood Autism Spectrum Disorders. Pediatrics. 133(3), 520-529; DOI: 10.1542/peds.2013-0763
Lichtenstein P, Carlström E, Råstam M, Gillberg C. & Anckarsäter, H. (2010). The genetics of autism spectrum disorders and related neuropsychiatric disorders in childhood. American Journal of Psychiatr, 167(11), 1357–1363
Lord, C. & Bishop, S.L. (2010). Autism Spectrum Disorders. Diagnosis, Prevalence, and Services for Children and Families. Social Policy Report, 24(2), 1-26.
Lovaas, O.I. (1987). Behavioral treatment and normal educational and intellectual functioning in young autistic children. Journal of Consulting and Clinical Psychology, 55(1), 3-9.
Matson, J. L. & Kozlowski, A. M., (2011). The increasing prevalence of autism spectrum disorders. Research in Autism Spectrum Disorders, 5, 418-424.
Mattila, M-L., Kielinen, M., Linna, S-L., Jussila, K., Ebeling, H., Bloigu, R., Joseph, R. M. & Moilanen, I. (2011). Autism Spectrum Disorders According to DSM-IV-TR and Comparison With DSM-5 Draft Criteria: An Epidemiological Study. Journal of the American academy of child & adolescent psychiatry, 50(6), 583-592.
McGee, G. G., Morrier, M. J. & Daly, T. (1999). An incidental teaching approach to early intervention for toddlers with autism. Journal of the Association for Persons with Severe Handicaps, 24, 2133-2146.
Montiel-Nava, C. & Peña, J. (2008). Epidemiological findings of pervasive developmental disorders in a Venezuelan Study. Autism 12, 191–202
NAC (National Autism Center) (2015). Findings and conclusions: National standards project, phase 2. Randolph, MA: NAC
National Autistic Society (2006). http://www.autism.org.uk/about/what-is.aspx. Accessed 03.03.2016).
Odom, S., Boyd, B., Hall, L., & Hume, K. (2010). Evaluation of comprehensive treatment models for individuals with autism spectrum disorders. Journal of Autism and Developmental Disorders, 40, (4), 425-436. DOI:10.1007/s10803-009-0825-1
Oliveira, G., Ataide, A., Marques, C. Migual, T. S., Coutinho, A. M., Mota-Vieira, L., Gonçalves, E., Lopes, N. M., Rodrigues, V., da Mota, H. C.& Vicente, A. M. (2007). Epidemiology of autism spectrum disorder in Portugal: prevalence, clinical characterization, and medical conditions. Developmental Medicine & Child Neurology 49, 726–733.
Ouellette-Kuntz, H., Coo, H. & Gorski, D. (2012). Findings from the National Epidemiologic Database for the Study of Autism in Canada (NEDSAC). Changes in the Prevalence of Autism Spectrum Disorders in Newfoundland and Labrador, Prince Edward Island, and Southeastern Ontario. Kingston, Ontario: NEDSAC, Queen’s University.
Özerk, M. & Özerk, K. (2013). Autism og pedagogikk (Autism and Pedagogy). Oslo: Cappelen Damm Akademisk.
Özerk, M. & Özerk, K. (2015). A Bilingual Child Learns Social Communication Skills through Video Modeling-A Single Case Study in a Norwegian School Setting. International Electronic Journal of Elementary Education, 8(1), 551-566.
The Issue of Prevalence of Autism/ Özerk
303
Parner, E.T., Schendel, D. E. & Thorsen, P. (2008). Autism Prevalence Trends over Time in Denmark: Changes in Prevalence and Age at Diagnosis. Archives of Pediatrics and Adolescent Medicine Vol. 162(12), 1150-1156.
Paul Leigh, J. & Du, J. (2015). Brief Report: Forecasting the Economic Burden of Autism in 2015 and 2025 in the United States. Journal of Autism and Developmental Disorders, 45(12), 4135–4139.
Paula, C.S., Ribeiro, S., Fombonne, E. & Mercadante., M.T. (2011). Brief report: Prevalence of pervasive developmental disorder in Brazil: a pilot study. Journal of Autism and Developmental Disorders. 41, 1738–1741.
Pierce, K. & Schreibman, L. (1994). Teaching daily living skills to children with autism in unsupervised settings through pictorial self-management. Journal of Applied Behavior Analysis, 27, 471-481.
Pierce, K., Conant, D., Hazin, R., Desmond, J., & Stoner, R. (2011). A preference for geometric patterns early in life as a risk factor for autism. Archives of General Psychiatry. 68(1), 101-109.
Pierce, K. (2011). Early functional brain development in autism and the promise of sleep fMRI. Brain Research, 1380, 162-74
Rapin, I. (2011). Autism Turns 65: A Neurologist’s Bird’s Eye View. In D.G. Amaral, G. Dowson & D.H. Geschwind (eds.). Autism Spectrum Disorders. New York: Oxford. University Press.
Robinson, E.B., Koenen, K.C., McCormick, M.C., Munir, K., Hallett, V., Happé, F., Plomin, R. & Ronald, A. (2011). Evidence That Autistic Traits Show the Same Etiology in the General Population and at the Quantitative Extremes (5%, 2.5%, and 1%). Archives of General Psychiatry, 68(11), 1113-1121.
Posada, M. Primo,P. G., Ferrar, M.J. & Martín-Arribas, M. C. (2007 ). European Autism Information System (EAIS). Report on the ‘Autism Spectrum Disorders Prevalence Data and Accessibility to Services’ Questionnaire (QEAIS). Research Institute for Rare Diseases, Instituto de Salud Carlos III, Madrid 20 March 2007.
Posserud, M., Lundervold, A. J., Lie, S. A. & Gillberg, C. (2010). The prevalence of autism spectrum disorders: impact of diagnostic instrument and non-response bias. Social Psychiatry and Psychiatric Epidemiology. 45 (3), 319–327.
Powell, J., Edwards, A., Edwards, M., Pandit, B., Sungum-Paliwal, S., & Whitehouse, W. (2000). Changes in the incidence of childhood autism and other autistic spectrum disorders in preschool children from two areas of the West Midlands, UK. Developmental Medicine and Child Neurology, 42, 624–628.
Reed, G. M. (2010). Toward ICD-11: Improving the Clinical Utility of WHO’s International Classification of Mental Disorders. Professional Psychology: Research and Practice. 41(6), 457–464
Remington, B., Hastings, R. P., Kovshoff, H., Espinosa, F., Jahr, W., Brown, T., Alsford, P., Lemaic, M., & Ward, N. (2007). A field effectiveness study of early intensive behavioral intervention: Outcomes for children with autism and their parents after two years. American Journal of Mental Retardation 112, 418-438.
Roelfsema, M.T., Hoekstra, R.A., Allison, C., Wheelwright, S., Brayne, C., Matthews, F.E. and Baron Cohen, S. (2012). Are autism spectrum conditions more prevalent in an information-technology region? A school-based study of three regions in the Netherlands. Journal of Autism and Developmental Disorders, 42(5), 734-739.
Sandin,S., Lichtenstein, P., Kuja-Halkola, R., Larsson, H., Hultman, C. M. & Reichenberg, A. (2014). The Familial Risk of Autism. The Journal of the American Medical Association (JAMA), 311(17), 770-1777. DOI:10.1001/jama.2014.4144.
Scott, F., Baron - Cohen, S., Bolton & Brayne, C. (2002). Brief report Prevalence of autism spectrum conditions in children aged 5–11 years in Cambridgeshire, UK. Autism, 6(3), 231–237.
International Electronic Journal of Elementary Education Vol.9, Issue 2, 263-306, December, 2016
304
Smith, I. C., Reichow, B. & Volkmar, F.R. J. (2015).The Effects of DSM-5 Criteria on Number of Individuals Diagnosed with Autism Spectrum Disorder: A Systematic Review. Journal of Autism and Developmental Disorders. 45(8), 2541–2552.
Stahmer, A. C., Suhrheinrich, J., Reed, S., & Schreibman, L. (2012). What works for you? Using teacher feedback to inform adaptations of an evidence-based practice for classroom use. Autism Research and Treatment. Article ID 70986.
Stoltenberg, C., Schjølberg, S., Bresnahan, M., Hornig, M., Hirtz, D., Dahl, C.,Lie, K.K. Reichborn-Kjennerud, T., Schreuder, P., Alsaker, E., Øyen, A-S., Magnus, P., Surén, P., Susser, E. & Lipkin, W.I. & the ABC Study Group (2010). The Autism Birth Cohort: a paradigm for gene–environment–timing research. Molecular Psychiatry 15, 676–680.
Surén, P., Bakken, I.J., Aase, H,, Chin, R., Gunnes. N., Lie, K.K.., Magnus. P., Reichborn- Kjennerud, T., Schjølberg, S., Øyen, A-S. & Stoltenberg, C. (2012). Autism spectrum disorder, ADHD, epilepsy, and cerebral palsy in Norwegian children. Pediatrics 130: 152 – 158.
Surén, P., Bakken, I.J., Lie, K.K., Schjølberg, S., Aase, H., Reichborn-Kjennerud, T., Magnus, P., Øyen, A-S., Kveim Svendsen, B., Aaberg, K.M., Andersen, L.G. & Stoltenberg, C. (2013). Differences across counties in the registered prevalence of autism, ADHD, epilepsy and cerebral palsy in Norway. Tidsskrift for Norrsk Legeforening 133, 1929 – 1934.
Tebruegge, M., Nandini, V., & Ritchie, J. (2004). Does routine child health surveillance contribute to the early detection of children with pervasive developmental disorders? – An epidemiological study in Kent, U.K. BMC Pediatrics, 4, 4. http://doi.org/10.1186/1471-2431-4-4
van Balkom, I. D. C., Bresnahan, M., Vogtländer, M.F., van Hoeken, D., Minderaa, R.B., Susser, E. & Hoek, H.W. (2009). Prevalence of treated autism spectrum disorders in Aruba. Journal of Neurodevelopmental Disorders. 1(3), 197–204.
Vivanti, G., Tennison, O., Vivanti, D. P. (2013a). Diagnostic criteria for autism under the DSM-5. http://www.autismeurope.org/fr/a-propos-de-l-autisme/les-criteres-de-diagnostic 3/diagnostic-criteria-for-autism-under-the-dsm-5-2.html (accessed 14.09.2016)
Vivanti, G., Hudry, K., Trembath, D., Barbaro, J., Richdale, A., Dissanayake, C. (2013b). Towards the DSM 5 Criteria for Autism: Clinical, Cultural and Research Implications. Australian Psychologist, 48, 258-261.
Volkmar, F. R, Reichow, B. (2013). Autism in DSM-5: Progress and challenges. Molecular Autism, 4(13), 1-6.
Williams, J. G., Higgins,J.P.T. & Brayne, C.E.G. (2006). Systematic review of prevalence studies of autism spectrum disorders. Archives of Disease in Childhood. 91(1), 8–15. Published online 2005 Apr 29. DOI: 10.1136/adc.2004.062083
Williams, E., Thomas, K., Sidebotham, H. & Emond, A. (2008). Prevalence and characteristics of autistic spectrum disorders in the ALSPAC cohort. Developmental Medicine and Child Neurology. 50(9), 672–677.
Williams, K., MacDermott,S., Ridley, G., Glasson, E. J. & Wray, J. A. (2008). The prevalence of autism in Australia. Can it be established from existing data? Journal of Paediatrics and Child Health 44, 504–510.
Wing, L., & Potter, D. (2002). The epidemiology of autistic spectrum disorders: is the prevalence rising? Mental Retardation and Developmental Disabilities Research Reviews, 8, 151–161.
Wong, V.C.N. & Hui, S.L.H. (2008). Epidemiological Study of Autism Spectrum Disorder in China. Journal of Child Neurology. 23(1), 67-72.
WHO (1977). Manual of the international statistical classification of diseases, injuries, and causes of death, Volume 1. Geneva: World Health Organization.
WHO (1994). International Statistical Classification of Diseases and Related Health Problems10th Revision (ICD-10). Geneva, World Health Organization.

The Issue of Prevalence of Autism/ Özerk
305
Zablotsky, B., Black,L. I., Maenner, M.J., Schieve, L.A, Blumberg, S. J. (2015). Estimated Prevalence of Autism and Other Developmental Disabilities Following Questionnaire Changes in the 2014 National Health Interview Survey. National Health Statistics Reports nr 87, 13th of November, 2015. Hyattsville, MD: U.S. Department of Health and Human Services Centers for Disease Control and Prevention (CDC), National Center for Health Statistics (NCHS).

International Electronic Journal of Elementary Education Vol.9, Issue 2, 263-306, December, 2016
306
www.iejee.com
This page is intentionally left blank
Related Documents