EPTD Discussion Paper No. 127 Environment and Production Technology Division International Food Policy Research Institute 2033 K Street, N.W. Washington, D.C. 20006 U.S.A. December 2004 Copyright © 2004: International Food Policy Research Institute EPTD Discussion Papers contain preliminary material and research results, and are circulated prior to a full peer review in order to stimulate discussion and critical comment. It is expected that most Discussion Papers will eventually be published in some other form, and that their content may also be revised. WATER ALLOCATION POLICIES FOR THE DONG NAI RIVER BASIN IN VIETNAM: AN INTEGRATED PERSPECTIVE Claudia Ringler and Nguyen Vu Huy

Welcome message from author
This document is posted to help you gain knowledge. Please leave a comment to let me know what you think about it! Share it to your friends and learn new things together.
Transcript

EPTD Discussion Paper No. 127
Environment and Production Technology Division
International Food Policy Research Institute 2033 K Street, N.W.
Washington, D.C. 20006 U.S.A.
December 2004
Copyright © 2004: International Food Policy Research Institute
EPTD Discussion Papers contain preliminary material and research results, and are circulated prior to a full peer review in order to stimulate discussion and critical comment. It is expected that most Discussion Papers will eventually be published in some other form, and that their content may also be revised.
WATER ALLOCATION POLICIES FOR THE DONG NAI RIVER BASIN IN VIETNAM: AN INTEGRATED PERSPECTIVE
Claudia Ringler and Nguyen Vu Huy

ACKNOWLEDGMENTS This paper is a product of the ADB RETA project No. 5866 “Irrigation Investment, Fiscal Policy, and Water Resource Allocation in Indonesia and Vietnam” It combines work by the International Food Policy Research (IFPRI) Institute, Washington, D.C., the Sub-Institute for Water Resources Planning (SIWRP), HCMC, and the Sub-National Institute for Agricultural Planning and Projections (Sub-NIAPP), HCMC, Vietnam. Helpful comments have been received by Consuelo Varela Ortega.

ABSTRACT
Recent water sector reforms, increased scarcity and vulnerability of existing water
resources, combined with declining public funding available for large-scale infrastructure
investment in the sector have led to an increased awareness by the Government of
Vietnam for the need to analyze water resource allocation and use in an integrated
fashion, at the basin scale, and from an economic efficiency perspective. This paper
presents the development, application, and results from an integrated economic-
hydrologic river basin model for the Dong Nai River Basin in southern Vietnam that
attempts to address these issues. The model framework takes into account the sectoral
structure of water users (agriculture, industry, hydropower, households, and the
environment), the location of water-using regions, and the institutions for water allocation
in the basin. Water benefit functions are developed for the major water uses subject to
physical, system control, and policy constraints. Based on this modeling framework,
policies that can affect water allocation and use at the basin level, including both basin-
specific and general macroeconomic policies, are analyzed.
Keywords: River basin model, water allocation policy, integrated assessment, Vietnam, Dong Nai basin

TABLE OF CONTENTS
1. Introduction – Background on the Dong Nai River Basin 1
2. Modeling Framework 5
3. Model Data and Validation 13
4. Baseline (BAS) and Optimization (OPT) Results 21
5. Alternative Scenarios 26
6. Conclusions 46
References 52

Water Allocation Policies for the Dong Nai River Basin in Vietnam: An Integrated Perspective
Claudia Ringler1 and Nguyen Vu Huy2
1. INTRODUCTION – BACKGROUND ON THE DONG NAI RIVER BASIN
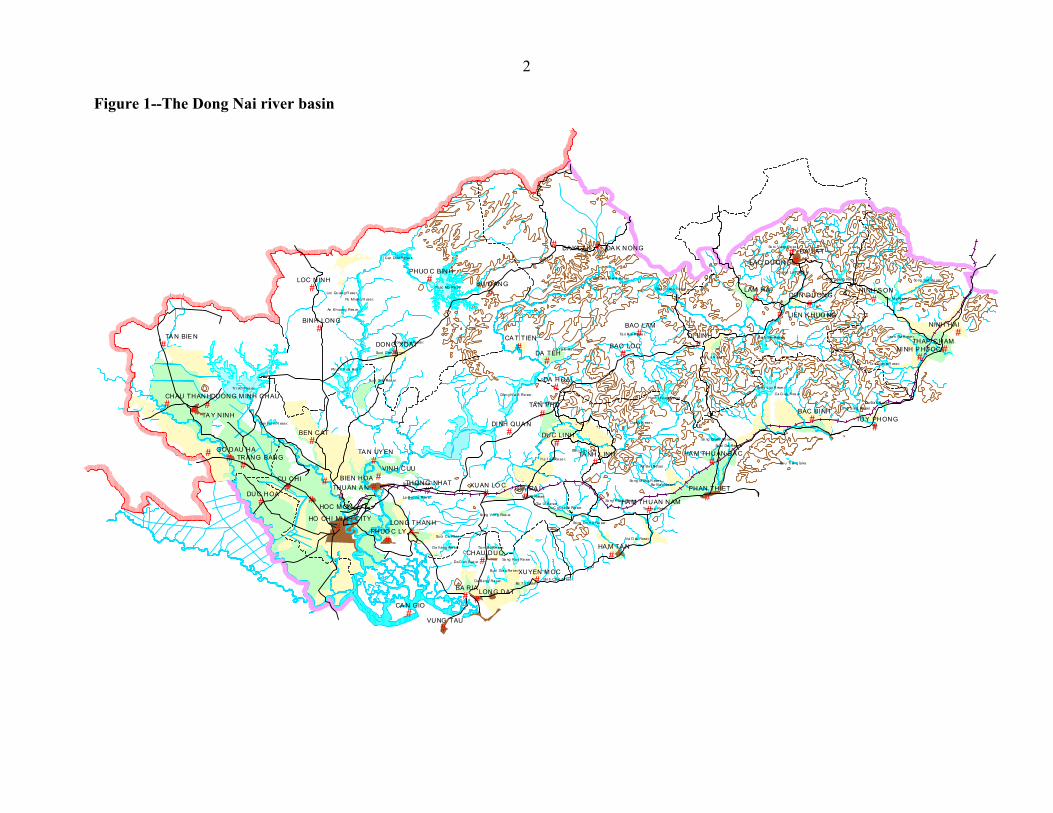
The Dong Nai River Basin (DNRB) is the largest national river basin and the economic
center of the country in southern Vietnam. The basin includes lowland areas that are subject to
annual flooding in the wet season and salinity intrusion in the dry season as well as mountainous
highland areas of up to 1,600 m. In addition, for administrative and planning purposes, a series of
several smaller coastal basins3 are combined with the Dong Nai basin adding to a total surface
area of 48,471 km2 within Vietnam, or about 15 percent of the country’s land surface area (see
also Figure 1).
1 International Food Policy Research Institute, Washington, D.C. 2 Sub-Institute for Water Resources Planning, HCMC, Vietnam. 3 In the following, references to the Dong Nai basin include the surrounding coastal area, unless specified otherwise.
2
Figure 1--The Dong Nai river basin
#
#
#
#
#
#
#
#
##
#
#
#
#
#
#
##
##
##
#
#
##
# # #
# ##
#
#
#
##
#
#
#
###
#
##
##
#
#
##
#
##
#
#
# #
#
Tr i An Res er.
Th ac Mo Re ser .
Ph uo c H oa Res er .
Don g N ai 8 Re ser .
So ng L uy R ese r.
Can Do n Re se r.
Dai N inh Res er .
Ham T hu an Re ser .
Pu M ien g R ese r.
Don g N ai 4 Re ser .
Don g N ai 3 Re ser .
Da D en Res er .
Don g Xo ai R ese r.
Ta n M y R ese r.
Da Va ng Re ser .
So ng Din h 3 Re ser .
Ca G iay Res er .
So ng Ra y Re ser .
La Buo ng Res er .
Don Du ong Re ser .
Da T e 'h Re ser .
Da M i R ese r.
So ng Q uao Re ser .
Su oi Vang Re se r.
Da T o n Re se r.
Ta n G ian g R ese r.
So ng Sat Re ser .
Ka L a R ese r.
Can No m R ese r.
Ka Be t Re ser .
Su oi Ca Rese r.
Ba Ba u Re se r.
Bie n La c La ke
Su oi Cam Re se r.
Lon g Song Re ser .
So ng Pha n Res er.
Tr a T a n Re se r.
Gia Ui Re ser .
Tu yen La m Res er .
Su oi Gia i Res er .
Da Ba ng Re ser .
Ta m Bo Re se r.
Ba T o Rese r.
Lan h Ra R ese r.
Du C on g Ho i Re ser .
Ta n R ai Re se r.
Su oi Gia u Re se r.
So ng M on g R ese r.
Nui L e Rese r.
So ng M ay Rese r.
Da Ba c R ese r.
Bin h Cha u R ese r.
Su oi Da Rese r.
Pr o Res er .An Kh uon g Res er.
Nui D at Rese r.
Ba u Tr an g la ke
Loc Qu an g R ese r.
Ta n la p Rese r.
So ng Von g Res er.
BA RIA
DA TEH
CU CHI
DA LA T
LAM HA
HA M TA N
DI LINHBAO LAM
BAO LOC
DA HOAI
TA N PHU
GIA RA I
BU DANG
BEN CAT
DUC HOA
CA N GIO
HOC M ON
DA K'L AK
BIEN HOA
LONG DAT
DUC LI NH
XUAN LO C
CA T TIEN
LOC NINH
TA N BIE N
TA Y NINH
PHUO C LY
TA N UY EN
VINH CUU
THUAN A N
BAC BINH
NI NH HAI
NI NH S ON
VUNG TAU
DA K NONG
CHAU DUC
XUYEN M OC
DI NH QUA N
TA NH L INH
BINH LONG
DONG XOA I
GO DAU HA
TUY PHONG
THAP CHAM
LAC DUONG
DON DUONG
PHUO C BINH
CHAU THANH
TRANG BANG
LONG THANH
THONG NHATPHAN THIET
NI NH P HUOC
LIEN K HUO NG
HA M THUAN NAM
HA M THUAN BA C
DUONG M INH CHAU
HO CHI MI NH CITY
3
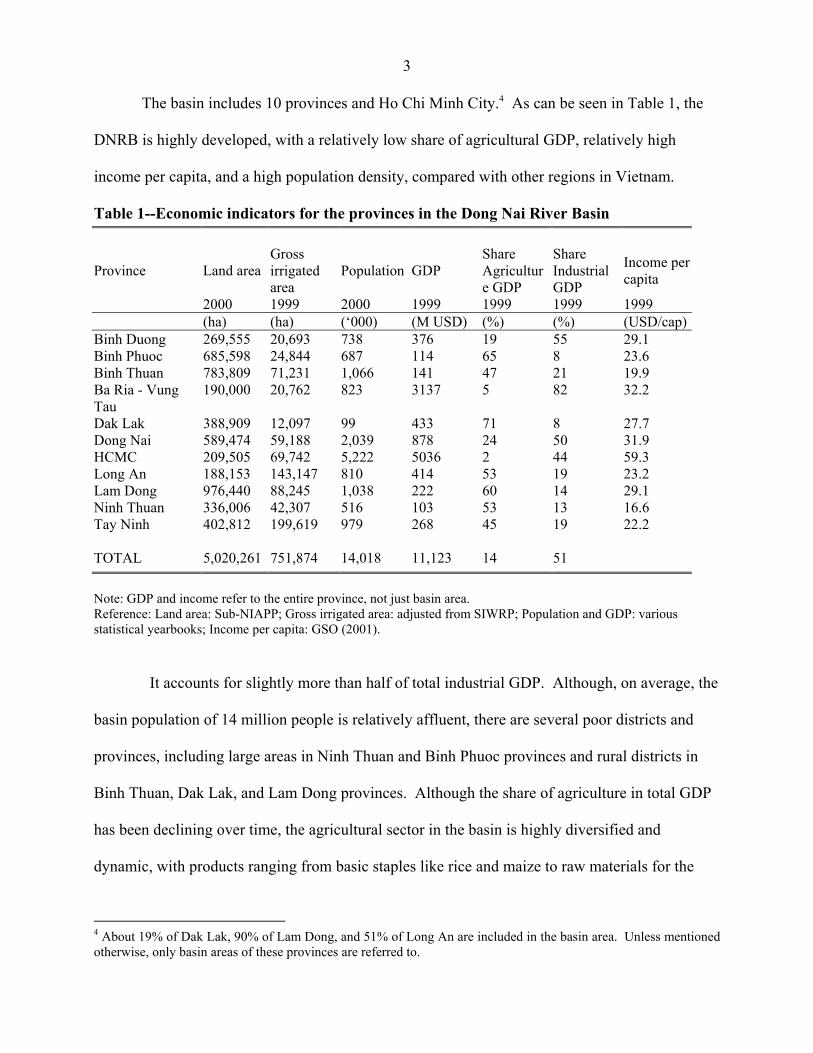
The basin includes 10 provinces and Ho Chi Minh City.4 As can be seen in Table 1, the
DNRB is highly developed, with a relatively low share of agricultural GDP, relatively high
income per capita, and a high population density, compared with other regions in Vietnam.
Table 1--Economic indicators for the provinces in the Dong Nai River Basin
Province Land area Gross irrigated area
Population GDP Share Agriculture GDP
Share Industrial GDP
Income per capita
2000 1999 2000 1999 1999 1999 1999 (ha) (ha) (‘000) (M USD) (%) (%) (USD/cap)Binh Duong 269,555 20,693 738 376 19 55 29.1 Binh Phuoc 685,598 24,844 687 114 65 8 23.6 Binh Thuan 783,809 71,231 1,066 141 47 21 19.9 Ba Ria - Vung Tau
190,000 20,762 823 3137 5 82 32.2
Dak Lak 388,909 12,097 99 433 71 8 27.7 Dong Nai 589,474 59,188 2,039 878 24 50 31.9 HCMC 209,505 69,742 5,222 5036 2 44 59.3 Long An 188,153 143,147 810 414 53 19 23.2 Lam Dong 976,440 88,245 1,038 222 60 14 29.1 Ninh Thuan 336,006 42,307 516 103 53 13 16.6 Tay Ninh 402,812 199,619 979 268 45 19 22.2 TOTAL 5,020,261 751,874 14,018 11,123 14 51
Note: GDP and income refer to the entire province, not just basin area. Reference: Land area: Sub-NIAPP; Gross irrigated area: adjusted from SIWRP; Population and GDP: various statistical yearbooks; Income per capita: GSO (2001).
It accounts for slightly more than half of total industrial GDP. Although, on average, the
basin population of 14 million people is relatively affluent, there are several poor districts and
provinces, including large areas in Ninh Thuan and Binh Phuoc provinces and rural districts in
Binh Thuan, Dak Lak, and Lam Dong provinces. Although the share of agriculture in total GDP
has been declining over time, the agricultural sector in the basin is highly diversified and
dynamic, with products ranging from basic staples like rice and maize to raw materials for the
4 About 19% of Dak Lak, 90% of Lam Dong, and 51% of Long An are included in the basin area. Unless mentioned otherwise, only basin areas of these provinces are referred to.

4
local industry, including cotton, rubber, and sugarcane, to high-valued crops, like coffee, fruit,
grapes, pepper, tea, and vegetables.
Total discharge is estimated at 47.065 BCM (billion cubic meters), including about 6-7
BCM of Mekong flows. Rainfall averages 2,000 mm, but can be as low as 700 mm in some
coastal areas. The DNRB has 5 major rivers: the Dong Nai mainstream, the Be, the Sai Gon, and
the La Nga as major tributaries, and the Vam Co Dong system that joins the Dong Nai just before
the outlet into the Sea. There is one major interbasin transfer to the Cai Basin in the coastal area
(within the Dong Nai basin planning unit) of around 20 m3/sec and a second transfer is under
construction (Figures 1, 2).
The DNRB ranks second in hydropower potential in the country and in 2000, total
installed hydropower capacity reached 1,182 MW with average annual power production of 4,881
GWh. Total investment cost of existing hydropower projects is estimated at USD 1,105 million
(including Ham Thuan- Da Mi, Thac Mo, and Tri An reservoirs). In addition, the basin includes
Dau Tieng, the largest irrigation reservoir in Vietnam. Several additional reservoirs are currently
under construction.
On the institutional side, several reforms in the water sector have recently impacted upon
or will impact on the basin in the near future. In January 1999, a new Water Resources Law went
into force. According to the Law, the Ministry of Agriculture and Rural Development (MARD)5
is in charge of overall management of the country’s water resources, but the Government may
delegate authority for specific water uses to other ministries; water allocation is carried out from a
river basin perspective adhering to the principles of fairness and reasonability; priority in use is
5 In November of 2002, following the establishment of the new Ministry of Natural Resources and Environment (MONRE), MONRE was assigned responsibility for state management of water resources as well as other natural resources and environment, whereas public water services delivery is to be carried out by MARD and other ministries with water-related responsibilities.

5
accorded to drinking water in both quality and quantity (Article 20); and both water use and
wastewater discharge are to be licensed by provincial government authorities (People’s
Committees) under the guidance of MARD. In April of 2001, MARD established a basin
Planning Management Council for the DNRB. Detailed operation rules are not yet finalized, but
it is assumed that in a first phase, the Council will focus on river basin planning.
The following sections introduce the modeling framework; describe model data and
validation; and present a baseline and an optimization scenario. Based on this modeling
framework the consequences of changes in crop prices and irrigation efficiency, increased trade
liberalization, and the establishment of water use rights and alternative trading regimes on the
basin economy are analyzed.
2. MODELING FRAMEWORK
In order to support coordination of management in the Dong Nai River Basin, and to
assist the recently established Dong Nai River Basin Planning Management Council a better
understanding of water supply, demand, and its value in various uses is needed. Moreover, an
understanding of the role of alternative policy instruments in alleviating likely future water
shortages in the basin is necessary to allocate scarce resources across irrigation, hydropower
development, and urban water supply demands. The complexities involved in water allocation
and use in the Dong Nai River Basin—and any river basin in the world—require a holistic
approach to the planning and management of its water resources to achieve an optimal utilization
that is at the same time sustainable, efficient, and equitable (McKinney et al. 1999, Rogers and
Fiering 1986).

6
The two principal approaches to river basin modeling are simulation—to simulate water
resources behavior based on a set of rules governing water allocation and infrastructure operation;
and optimization—to optimize allocation based on an objective function and accompanying
constraints. Although simulation and optimization models have differing objectives, they are in
fact complementary tools to address problems related to the competition over scarce water
resources and the design and assessment of alternative systems of water allocation.
The model developed for the DNRB draws on previous economic-hydrologic modeling
carried out at IFPRI, in particular, for the Maipo River Basin in Chile (Rosegrant et al. 2000). It
belongs to the class of integrated economic-hydrologic river basin models and includes
hydrologic, economic, and institutional components. The model focus is on the economic
component. The river basin model is developed as a node-link network, which is an abstracted
representation of the spatial relationships between the physical entities in the river basin. Nodes
represent river reaches, reservoirs, and demand sites, and links represent the connections between
these entities (Figure 2).
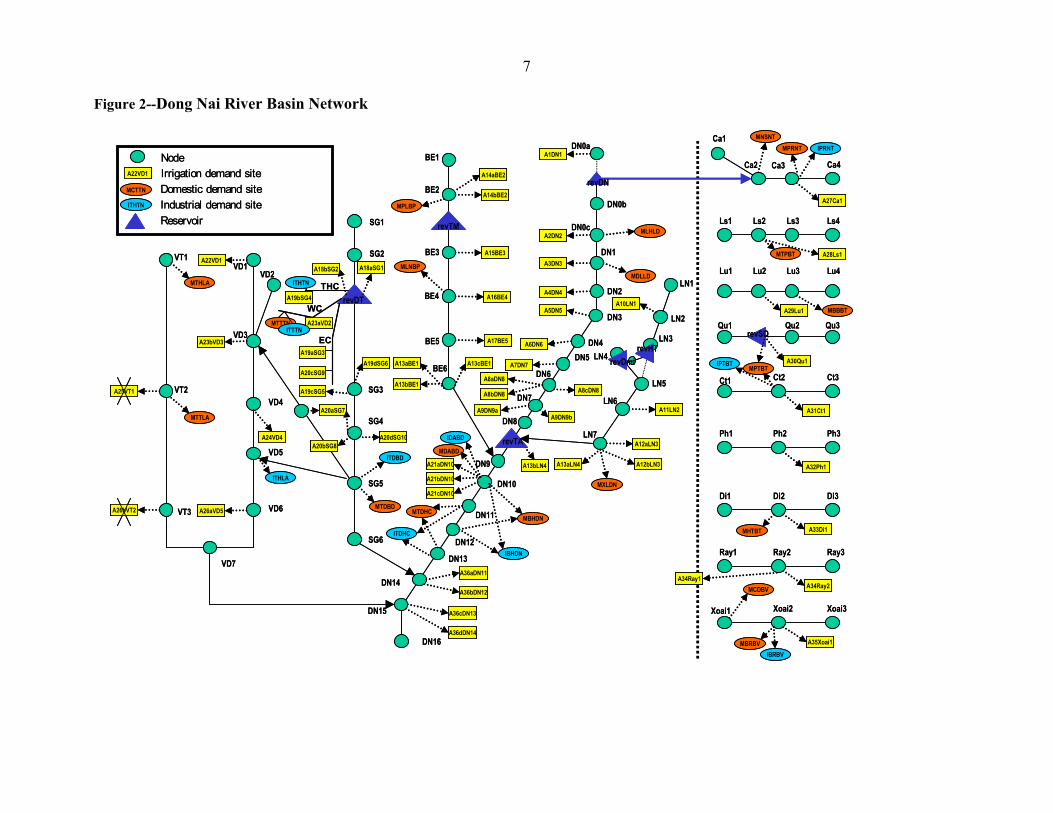
7
Figure 2--Dong Nai River Basin Network
DN0a
DN0b
DN0c
DN1
DN2
DN3
DN4DN5
DN6
DN7
LN1
LN2
LN3
LN4
LN5
LN6
LN7
Ca1
Ca2 Ca3 Ca4
Ls2 Ls3 Ls4Ls1
Lu2 Lu3 Lu4Lu1
Qu2 Qu3Qu1
DN8
DN10
DN11
DN12
DN13
DN14
DN16
DN15
BE1
BE2
BE3
BE4
BE5
BE6
SG1
SG2
SG3
SG4
SG5
SG6
VD1
VD3
VD4
VD5
VD6
VT1
VD2
VT2
VT3
VD7
Ct2 Ct3Ct1
Xoai2 Xoai3Xoai1
Ph2 Ph3Ph1
Di2 Di3Di1
Ray2 Ray3Ray1
A8aDN8
A1DN1
A2DN2
A3DN3
A4DN4
A5DN5
A6DN6
A7DN7
A9DN9a
A10LN1
A11LN2
A12aLN3
A13aLN4
A13bBE1
A17BE5
A16BE4
A14bBE2
A15BE3
A19cSG5
A20aSG7
A15BE3A22VD1
A23bVD3
A24VD4
A26aVD5
A25VT1
A26bVT2
A23aVD2
A18bSG2
A20cSG9
A18aSG1
A19bSG4
A27Ca1
A28Ls1
A29Lu1
A30Qu1
A31Ct1
A32Ph1
A33Di1
A34Ray2
A35Xoai1
A36bDN12
MLHLD
MBHDNMTDBD
MTDHC
MPLBP
MLNBP
MBBBT
MHTBT
MBRBV
MTPBT
revTM
revDT
revSQ
MPTBT
DN9A21aDN10
MTTTN
IBHDN
ITDHC
IBRBV
ITHTN
NodeA22VD1 Irrigation demand site
Domestic demand siteIndustrial demand siteReservoir
MCTTN
ITHTN
revDNA14aBE2
A13cBE1A13aBE1
A12bLN3
A36aDN11
A36dDN14
A36cDN13
A8bDN8 A8cDN8
A21bDN10
A21cDN10
A19dSG6
A20bSG8A20dSG10
A13bLN4
A19aSG3
MXLDN
MNSNT
ITDBD
MCDBVA34Ray1
revHTrevDmi
THC
WC
ECITTTN
revTArevTA
MTHLA
MTTLA
ITHLA
A9DN9b
IDABD
MDABD
MDLLD
MPRNT IPRNT
IPTBT
8
Inflows to these nodes include water flows from the headwaters of the river basin, as well
as local rainfall drainage. Flow balances are calculated for each node at each time period, and
flow transport is calculated based on the spatial linkages in the river basin network.
For modeling purposes, provinces are considered the major modeling units in the river
basin model. Agricultural demand sites are delineated according to 37 sub-catchments and
administrative boundaries, resulting in 60 irrigation demand sites.6 For domestic demand sites,
adjacent districts have been summed up, yielding 48 domestic demand sites. For industrial water
use, 12 demand sites are delineated for the provinces with major industrial water use: Ba Ria-
Vung Tau, Binh Duong, HCMC, Dong Nai, as well as several provinces with lower industrial
development: Binh Thuan, Long An, Ninh Thuan, and Tay Ninh. The model also incorporates
the major existing reservoirs for hydropower production, irrigation, and flood control.
Thematically, the modeling framework includes three components: (1) hydrologic
components, including the water balance in reservoirs, river reaches, and crop fields; (2)
economic components, including the calculation of benefits from water uses by sector, demand
site, and country; and (3) institutional rules and economic incentives that impact upon the
hydrologic and economic components. Water supply is determined through the hydrologic water
balance in the river system; while water demand is determined endogenously within the model
based on functional relationships between water and productive uses in irrigated agriculture,
domestic and industrial uses, and hydropower. Water supply and demand are balanced based on
the objective of maximizing economic benefits to water use. Environmental requirements to
control saltwater intrusion are included as flow constraints. The time horizon of the model is one
6 Two irrigation demand sites on the West Vam Co River have not been included as they are outside the Dong Nai basin planning unit.

9
year with 12 periods (months). The following section describes the hydrologic and economic
components in more detail.
HYDROLOGIC COMPONENT
Hydrologic relations and processes are based on the flow network. They include: (1) flow
transport and balance from river outlets/reservoirs to crop fields, and domestic and industrial
demand sites; (2) return flows from irrigated areas and urban-industrial areas; (3) reservoir
releases; (4) instream water uses; and (5) groundwater.
The basic flow balance at a node in the basin network is calculated as:
flow_downstream = flow_upstream + local_drainage +
return_flows - withdrawals – (evaporation) losses (1)
The rainfall-runoff process is not included in the model. It is assumed that runoff starts
from rivers and reservoirs. Effective rainfall for crop production is calculated outside of the
model, and included into the model as a constant parameter. As groundwater data was scarce, the
exploitation capacity of shallow groundwater was included, and withdrawal estimates as
available, but groundwater was not modeled separately.
ECONOMIC COMPONENT
The objective of the model is to maximize the annual net profits from water uses in
irrigation, households and industries, and hydropower generation. The objective function is
formulated as:
(2)
where:
VI pwin
in ∑∑∑ ∑ +++= pwa m
ma VPVMVAObjMax

10
VA net profit from irrigated agriculture VM net benefit from municipal water use VI net profit from industrial production VP net profit from power production a, m in, pw indexes for irrigation, domestic, industrial demand sites and power station
Crop Yield Function
In order to establish a relationship between inputs other than water and crop yield, a
quadratic production function is chosen (see Eq. 3) due to its properties of decreasing marginal
returns to additional inputs and substitutability of inputs.
The quadratic function is expressed as follows:
[ ]
⎥⎥⎥⎥⎥
⎦
⎤
⎢⎢⎢⎢⎢
⎣
⎡
⎥⎥⎥⎥
⎦
⎤
⎢⎢⎢⎢
⎣
⎡
+
⎥⎥⎥⎥⎥⎥⎥
⎦
⎤
⎢⎢⎢⎢⎢⎢⎢
⎣
⎡
=
inmnnn
m
m
m
n
i
nca
xxxx
xxxx
x
xxx
yst3
2
1
321
3333231
2232221
1131211
321
3
2
1
321, ],,,,[
γγγγγγγγγγγγγγγγ
αααα (3)
where γα and are the input coefficients, and x are inputs by crop c. Water inputs in this
equation are fixed at the yield-maximizing level. In order to establish a relationship between crop
yield and water stress, the crop yield-water stress relationship described in Doorenbos and
Kassam (1979) and Doorenbos and Pruitt (1977) is used.
)/1(*)1(* MA ETMETkyysty −−=
(4) where: y actual yield (water-stressed) (mt/ha) yst non-water stressed yield (mt/ha), from the quadratic production function ETA seasonal actual evapotranspiration (mm) ETM seasonal potential evapotranspiration (mm)

11
cca
ccccccacaa
pwWpecfcmclcpcyAVA
*)(**
,
,,
−
+++−=
( )( ) ( ){ }
mwdm
mmpoppdruralurban
m
Pmwd
mwdmwdIeVMCS
*
11
11011
,,,
−
−⋅−⋅
==−−
⎟⎠⎞⎜
⎝⎛⎟
⎠⎞⎜
⎝⎛
∑ εεε
βε
ψ
ε
The net profit function for irrigated agriculture is formulated as:
(5)
where: A area harvested (ha) W irrigation water applied (m3) y actual yield from FAO relationship, (mt/ha) pc crop price at farm gate (USD/mt) lc labor cost (family and hired) (MD/ha) mc machinery/animal cost (USD/ha) fc fertilizer cost (USD/ha) pec pesticide cost (USD/ha) pw water fee (USD/m3) Domestic Net Benefit Function
The net benefit function for domestic water uses (VM) is derived from an inverse demand
function for water. In a first step, a double-log function is estimated.
( ) ( ) ( )mwdPImwd lnlnln ⋅−⋅+= εβψ (6)
where: mwd per capita water demand (m3/cap) Ψ constant I income (US$/cap/month) Pmwd price paid for water (US$/m3) ε price elasticity of demand β income elasticity of demand
The inverse of the demand function is then integrated over the space of mwd0
7 - W to
estimate the consumer surplus:
7 There are no clear guidelines for choosing mwd0. Here it is defined as a share of actual per capita consumption. Thus, consumer surplus here can only be accrued for consumption levels above average demand. It is not considered crucial in this modeling framework, as allocation is driven based on marginal benefits.
12
( ) ( )iwdPiwd lnln ⋅−= θµ
(7) where:
CS Consumer Surplus (US$ million) mwd0 per capita normal water demand (m3/cap) Pmwd price for water, includes urban and rural water and surface and groundwater e EXP urban, pd rural, pop indexes for urban/rural parameters, for time period (pd) and population (pop)
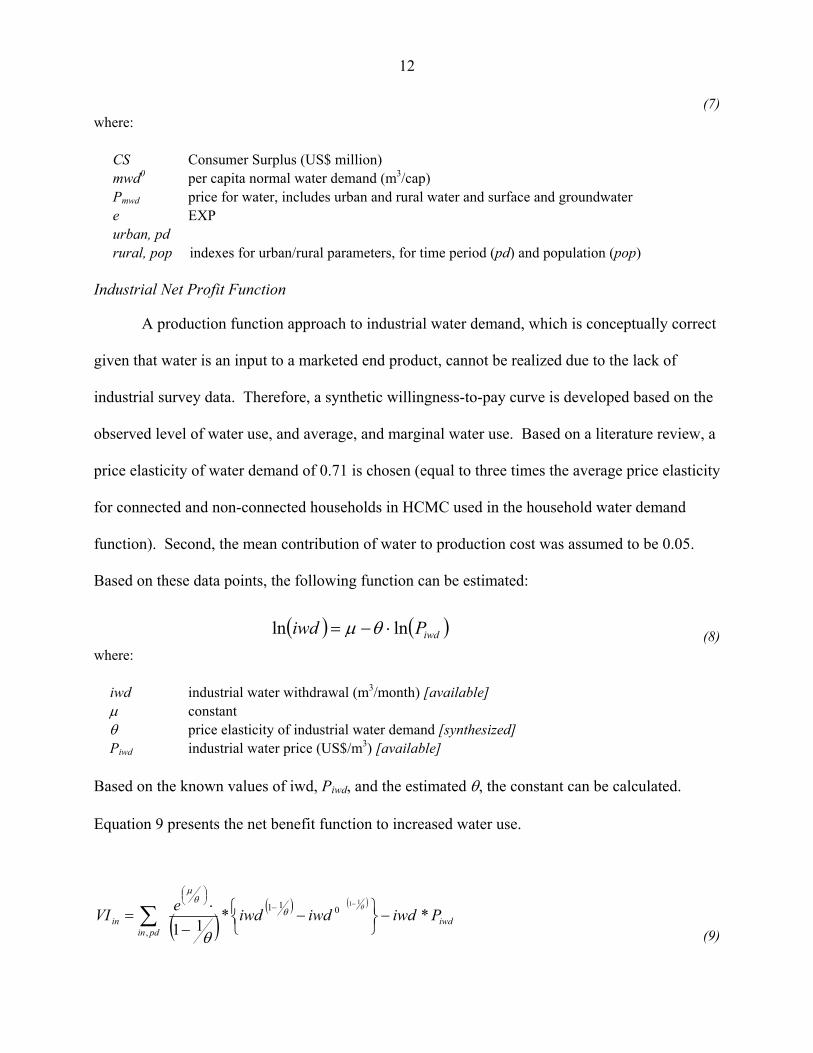
Industrial Net Profit Function
A production function approach to industrial water demand, which is conceptually correct
given that water is an input to a marketed end product, cannot be realized due to the lack of
industrial survey data. Therefore, a synthetic willingness-to-pay curve is developed based on the
observed level of water use, and average, and marginal water use. Based on a literature review, a
price elasticity of water demand of 0.71 is chosen (equal to three times the average price elasticity
for connected and non-connected households in HCMC used in the household water demand
function). Second, the mean contribution of water to production cost was assumed to be 0.05.
Based on these data points, the following function can be estimated:
(8)
where: iwd industrial water withdrawal (m3/month) [available] µ constant θ price elasticity of industrial water demand [synthesized] Piwd industrial water price (US$/m3) [available]
Based on the known values of iwd, Piwd, and the estimated θ, the constant can be calculated.
Equation 9 presents the net benefit function to increased water use.
(9) ( )( ) ( )
iwdpdin
in PiwdiwdiwdeVI **11
11011
,−
⎭⎬⎫
⎩⎨⎧ −
−⋅
=−−
⎟⎠⎞⎜
⎝⎛
∑ θθθ
µ
θ

13
)( pwpwpwpw pcppPowVP −⋅=
where:
iwd industrial water withdrawals (m3/month) iwd0 industrial withdrawals at normal demand (m3/month) e EXP
Hydropower Net Profit Function
To estimate power production, in a first step, power production efficiency is calculated
based on daily release and power production data. Profit from power production (VP) is
calculated as a linear function, multiplying power production (pow) with the difference between
power selling price (pp) and power production cost (pc) for each hydropower station.
(10)
3. MODEL DATA AND VALIDATION
The model is calibrated to 1999/2000 data. In the following, data sources for the model
are briefly described and a run with fixed water allocation (BAS) is compared with selected
observed data.
Hydrologic Data
Source flow was determined by the hydrology division of SIWRP (Sub-Institute for Water
Resources Planning, Ho Chi Minh City) based on a rainfall-runoff model called RRMOD for
1978-1998 for a total of 37 river nodes/reaches. Together with the withdrawal nodes, a total of
82 nodes are included in the model. Total estimated basin discharge amounts to 47.1 BCM. As
these data are ex-post depletion, estimated actual depletion, just under 4 BCM, is added to these
observed natural flows. From the model runs, total discharge in the baseline simulation (BAS)
14
05000
1000015000200002500030000350004000045000
Dai Ninh
Dong Nai
1Dong N
ai 2
Dong Nai
3Dong N
ai 4
Dong Nai
5Dong N
ai 6
Dong Nai
8
@ Tri A
n (w/ L
a Nga)
Confl. w/B
eHoa A
n
Confl. w/Sai
Gon
Confl. w/VCD
flow
(MC
M)
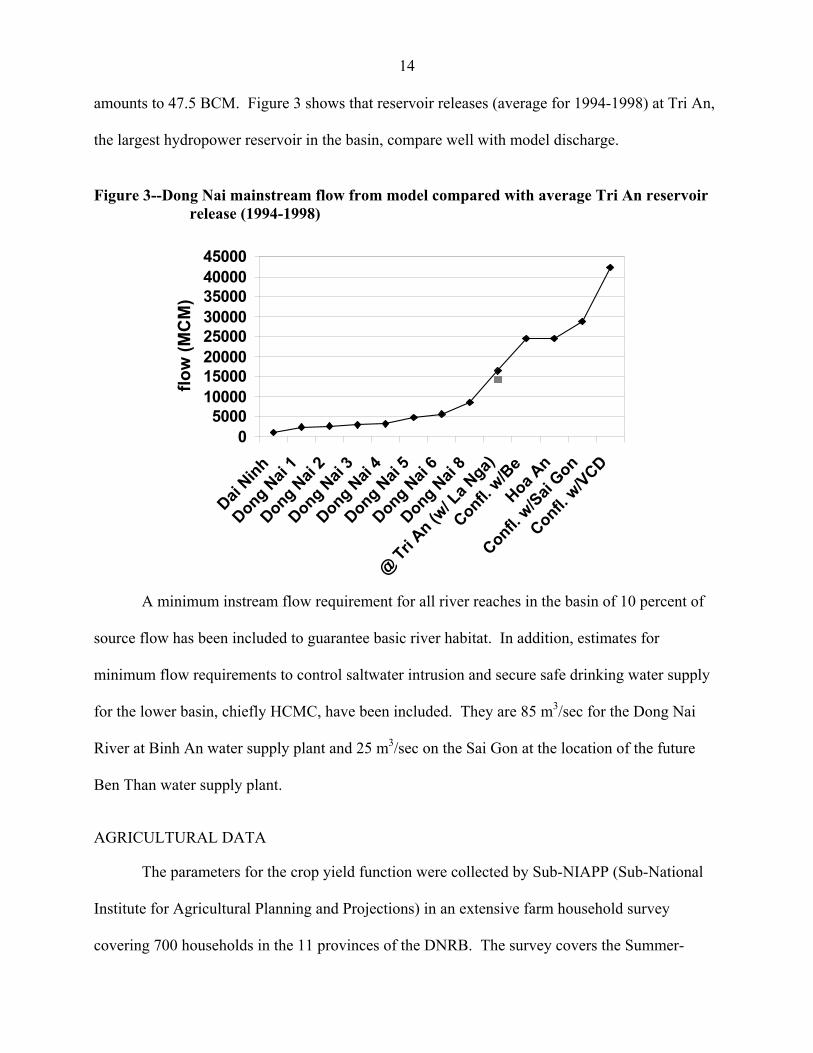
amounts to 47.5 BCM. Figure 3 shows that reservoir releases (average for 1994-1998) at Tri An,
the largest hydropower reservoir in the basin, compare well with model discharge.
Figure 3--Dong Nai mainstream flow from model compared with average Tri An reservoir
release (1994-1998)
A minimum instream flow requirement for all river reaches in the basin of 10 percent of
source flow has been included to guarantee basic river habitat. In addition, estimates for
minimum flow requirements to control saltwater intrusion and secure safe drinking water supply
for the lower basin, chiefly HCMC, have been included. They are 85 m3/sec for the Dong Nai
River at Binh An water supply plant and 25 m3/sec on the Sai Gon at the location of the future
Ben Than water supply plant.
AGRICULTURAL DATA
The parameters for the crop yield function were collected by Sub-NIAPP (Sub-National
Institute for Agricultural Planning and Projections) in an extensive farm household survey
covering 700 households in the 11 provinces of the DNRB. The survey covers the Summer-
15
Autumn season of 1999 to the Winter-Spring season of 2000 (SubNIAPP 2001). Based on the
survey data crop yield functions were estimated for the major irrigated annual (bean, maize,
peanut, rice, sugarcane, tobacco, vegetables) and perennial crops (coffee, fruit tree, other tree,
pepper) in the basin. Annual crops are separated by season (Winter-Spring, Summer-Autumn,
and Rainy Season). Moreover, paddy and vegetable crops are further subdivided by region
(coastal area, mountainous area, and lowland area). The input variables incorporated are in
USD/ha: labor, machinery, fertilizer, pesticides, and water. Family labor is valued at the
prevailing wage rate stipulated by the farm households. Water includes both estimated irrigation
water applied and effective rainfall (calculated based on daily rainfall observations prevailing
over the survey period). Mean values of major input variables by crop, which are used in the
model, are shown in Table 2.

16
Table 2--Yield function parameters, area-weighted mean values by crop
Price Yield Labor Machinery Fert N Fert P Fert K Pesti-cide Irr-Water ER
(USD/mt) (mt/ha) (MD/ha) (USD/ha) (kg/ha) (kg/ha) (kg/ha) (USD/ha) (mm) (mm) beanDX 484 1 44 46 32 47 20 14 255 28 coffee 641 3 331 10 314 227 96 74 1352 879 frtree 310 8 308 6 227 147 61 71 1182 728 maizeDX 132 6 68 47 82 89 29 24 403 78 maizeHT 101 6 82 43 61 61 25 18 352 292 otree 366 33 841 5 963 1025 413 871 1401 403 peanDX 315 3 99 41 77 101 46 60 363 77 peanHT 329 1 84 40 48 63 22 28 372 293 pepper 3392 3 540 20 325 325 138 159 960 597 riceDXc 107 5 93 36 117 68 22 27 830 82 riceDXm 120 5 80 44 100 58 21 20 768 146 riceDXu 111 4 62 34 91 71 26 31 782 181 riceHTc 111 5 92 35 108 66 24 32 895 397 riceHTm 113 4 73 46 100 67 18 24 746 573 riceHTu 104 4 63 33 100 64 28 37 853 430 riceMUAc 112 4 82 33 97 57 17 28 808 412 riceMUAm 113 4 81 53 126 53 24 14 773 525 riceMUAu 108 4 58 27 96 56 16 28 737 436 sugarc 16 50 140 19 172 131 53 31 1541 608 tobDX 1299 3 411 32 273 200 94 45 402 105 vegiDXc 182 19 308 26 241 204 69 100 309 50 vegiDXm 83 27 243 42 211 228 61 87 250 107 vegiDXu 134 12 160 46 220 155 21 57 295 114 vegiHTc 199 19 335 19 272 214 69 106 333 113 vegiHTm 144 22 251 36 232 320 62 188 269 190 vegiHTu 122 11 129 52 185 144 20 54 356 253 vegiMUAc 171 24 385 14 266 194 56 107 257 179 vegiMUAu 119 14 169 33 222 170 27 56 328 223
Note: DX = Winter-Spring season; HT = Summer-Autumn season; MUA = Rainy season. *Note: Due to a lack of observations for beanHT and beanMUA, the respective values from vegiHTu and vegiMUAu were taken.
Irrigation service fees (ISF) in Vietnam for public systems are decided at the province
level following government guidelines. ISF are area-based and can vary by crop, season, and
type of irrigation water supply (gravity or pump irrigation). Currently, ISF only partially reflect
the scarcity value of water; fees are typically higher for pump irrigation, but also typically lower
for rice, which consumes relatively more water. Survey results indicate average basin ISF of
17
USD 19/ha, USD 12/ha and USD 5/ha for dry-season, summer-autumn season, and rainy season
paddy, compared to USD 92/ha for perennial coffee plants that are pump-irrigated. ISF per ha
were converted to volumetric values for modeling purposes.
There are no consistent databases for irrigated area and irrigation sources in Vietnam.
Sub-NIAPP estimates gross irrigated area for 1999/2000 of 819,136 ha, whereas SIWRP
estimates an area of 781,349 ha. Irrigated areas for upland crops are not separated in statistics on
irrigation. For this analysis, they were distributed according to statistical yearbooks on total area
and survey results. It was assumed that only perennial crops are irrigated with groundwater.
Estimated yield function and production costs are applied to the gross irrigated area for 1999 of
759,480 ha.
DOMESTIC WATER USE DATA
Domestic water delivery data was collected from the various water supply companies in
the basin. Water loss rates in the basin range from 19 percent for Ba Ria-Vung Tau (BRVT)
province to 49 percent in Trang Bang, Tay Ninh province. Water tariffs from public supply
companies were included as available. About half of the companies apply progressive block
tariffs. Average rates vary from VND 1,600/m3 (USD 0.11/m3) for Long An province to VND
2,529/m3 (USD 0.18/m3) in Da Lat City, Lam Dong province. For individual pumping and most
rural domestic water uses, a supply cost of USD 0.1/m3 was assumed. Public water supply
companies serve only about 60 percent of the population of major cities, and people with
household connections consume, on average, substantially more than non-connected households.
For those districts and areas without public supply, a minimum supply standard of 40-50
l/cap/day was assumed. This results in total domestic water supply of about 920,500 m3/day and
per capita supply of 64 l/day.

18
The parameters for the domestic benefit function were estimated separately for connected
and non-connected households based on the 1995 household water demand behavior survey
carried out by GKW/SAFEGE (GKW/SAFEGE 1996). The survey was carried out in the 12
inner and four peripheral districts of HCMC. The price and income elasticities estimated were
then applied to other districts in the basin, following adjustments for rural-urban shares (to which
non-connected and connected parameters were applied, respectively), rural-urban incomes, and
rural-urban consumption shares.
INDUSTRIAL WATER USE DATA
Industrial water use estimates for the Dong Nai basin have ranged from 130-2,500 MCM
(million cubic meters) per year (Ngoc Anh 2000 and Boggs 1995, respectively). For this study,
industrial water use was collected from the industrial zones of the four major industrial provinces
in the basin (BRVT, Binh Duong, HCMC, and Dong Nai). However, water supply data for these
zones was sparse. Moreover, substantial industrial production takes places outside of designated
industrial zones. Industrial water supply data was also collected from municipal water supply
companies in the various provinces in the basin. As these data were still not sufficient, industrial
water use was estimated based on the water use coefficients for industrial products presented in
Boggs (1995, see Boggs’ Table 6).
In 1999, total net industrial water demand was estimated at 287 MCM, 44 percent of
which was delivered from surface water sources, the remainder from private or industrial zone
managed wells. The water tariff that public water companies charge to industries varies little
among provinces and is usually a flat rate. Among the provinces with available data, the rate is

19
lowest in Long An at VND 2,600/m3 (USD 0.19/m3) and highest in Binh Thuan at VND 4,500/m3
(USD 0.32/m3).
HYDROPOWER DATA
Power production parameters in the model include efficiency estimates computed from
historic daily reservoir release data, operation rules, dead and maximum storage, maximum
turbine flow, and area-storage and elevation-storage relationships. Figure 4 presents the
operation curve for Tri An, together with historic storage values and model outcomes. The graph
shows that reservoir operation curves in place are not adhered to religiously in the basin. Figure
5, which compares power production from model results and historic data for Da Nhim reservoir,
shows that the model replicates current production levels well. Hydropower production costs,
supplied by PECC2, for the major stations, range from USD 0.012/kWh for Thac Mo to USD
0.033/kWh for Ham Thuan and Da Mi stations; and electricity selling prices range from USD
0.038/kWh for Tri An to USD 0.07/kWh for Da Nhim station. For analysis purposes, it is
assumed that hydropower profits accrue to those provinces where the reservoir is located.

20
Figure 4--Operation curve, baseline and historic storage, Tri An Reservoir Figure 5--Hydropower production, Da Nhim Station, historic data and baseline result
0
500
1000
1500
2000
2500
3000
Jan Feb Mar Apr May Jun Jul Aug Sep Oct Nov Dec
months
Oper curve Model 1996 1998 st
orag
e (M
CM
)
0
500
1000
1500
2000
2500
3000
Jan Feb Mar Apr May Jun Jul Aug Sep Oct Nov Dec
months
Oper curve Model 1996 1998
stor
age
(MC
M)

21
The model has been coded in the GAMS modeling language, a high-level modeling system for
mathematical programming problems. It consists of 50,317 single equations (rows) and 117,691
single variables (columns) with 185,034 non-zero coefficients. The CONOPT3 solver for highly
nonlinear problems has been used to solve the model.
4. BASELINE (BAS) AND OPTIMIZATION (OPT) RESULTS
BAS attempts to recreate the water allocation and use situation prevailing in 1999/2000.
This can usually not be achieved through full optimization, because optimized allocation is based
on a partial incorporation of the reality into the modeling framework, and because the logic of the
modeling approach assumes economic efficiency as the main driving force for water allocation
across time and space, with perfect in- and foresight into the scarcity value of water in its various
uses. For BAS, water allocations to various sectors are fixed. In the irrigation sector, crop yield
and crop production inputs, including labor, fertilizer, and water are fixed at average levels, for
example. Moreover, irrigated crop area allocation levels are fixed. Power is produced within
operating rules.
Full optimization (OPT) presumes an omniscient decision-maker, which can be
represented, for example, through the Dong Nai River Basin Organization. However, transaction
costs for full optimization of basin resources in the real world would be tremendous. For OPT,
irrigated area ranges from 0.2-1.5 of observed irrigated area, and crop inputs other than water are
within a range from 0.8-1.2 of average input levels. Domestic demand is within a range of 0.7-
1.15 of observed demand, and industrial demand within a range of 0.5-1.5 of actual demand.
Reservoir releases operate within operation rules.
22
Under BAS, total off-stream water withdrawals from surface sources are estimated at
6,157 MCM, 12 percent of total runoff. Minimum flow requirements for drinking water on the
Dong Nai and Sai Gon Rivers account for a further 3,469 MCM. Surface withdrawal shares are
89 percent for irrigation, 5 percent for domestic uses, and 5 percent for industrial water uses. In
addition, total groundwater abstractions amount to 705 MCM or 6.9 percent of total shallow
groundwater capacity. About 292 MCM are pumped for irrigation, 163 MCM for domestic uses,
and 251 MCM for industrial uses. Total power production amounts to 5,287 GWh. Under the
OPT scenario, water can be allocated more freely across sectors, following optimization
objectives, within the bounds specified above, and the physical and system control constraints
and minimum instream and downstream flow requirements. Under this scenario, surface water
withdrawals increase to 6,353 MCM; and groundwater pumping increases by 4 percent.
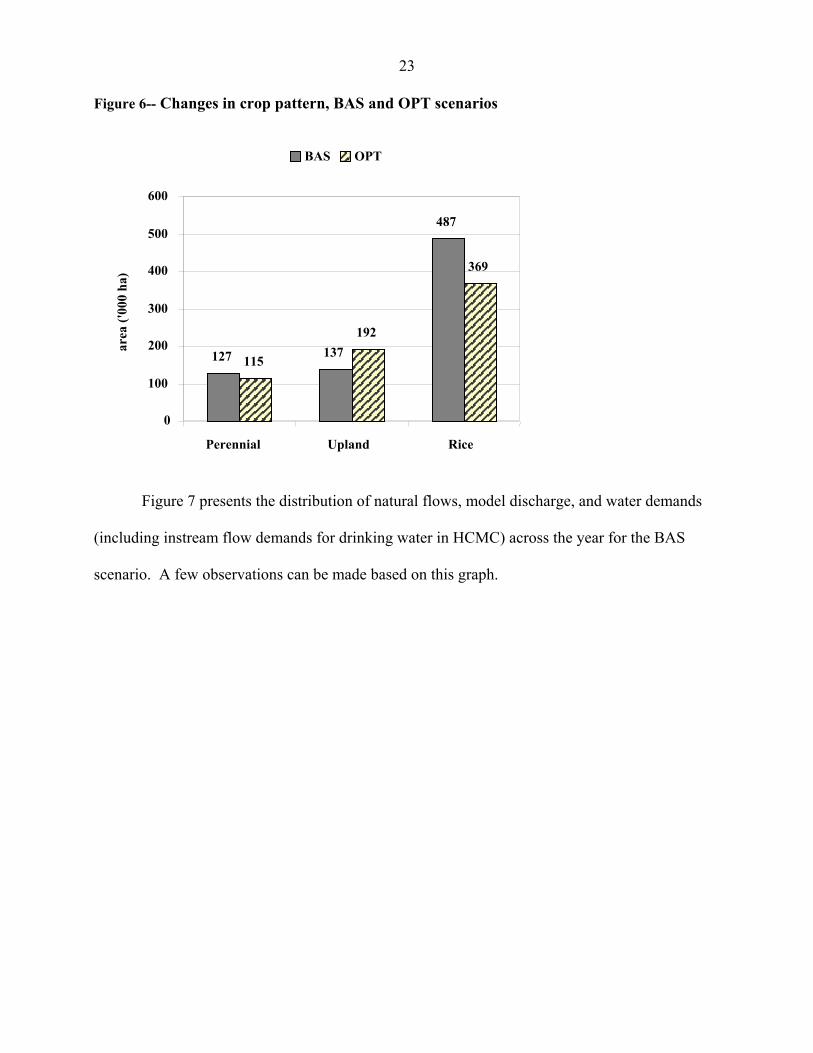
Compared to BAS, gross irrigated area under OPT drops by 75,000 ha. The decline is largest for
rice crops, but coffee area declines as well. Area under upland crops, on the other hand, increases
by 55,000 ha (see also Figure 6). Increases are particularly large for peanut in the dry season and
vegetables in the rainy season.
23
Figure 6-- Changes in crop pattern, BAS and OPT scenarios
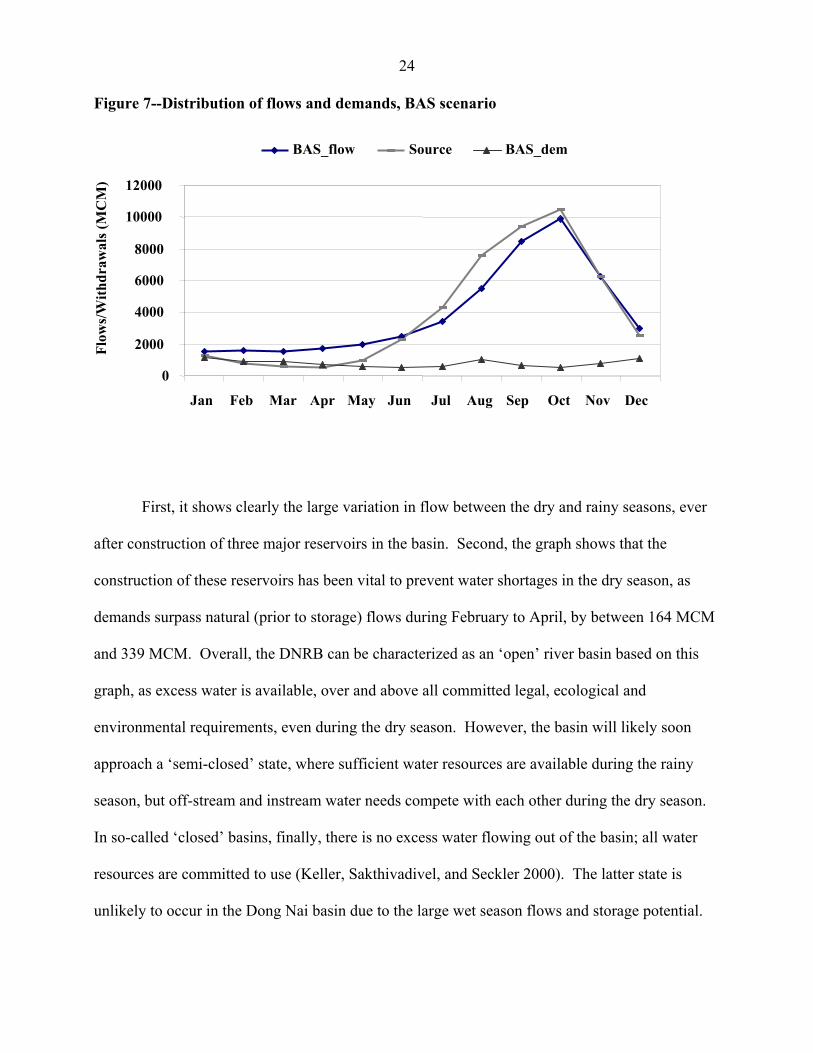
Figure 7 presents the distribution of natural flows, model discharge, and water demands
(including instream flow demands for drinking water in HCMC) across the year for the BAS
scenario. A few observations can be made based on this graph.
127 137
487
115
192
369
0
100
200
300
400
500
600
Perennial Upland Rice
BAS OPT
area
('00
0 ha
)
24
Figure 7--Distribution of flows and demands, BAS scenario
First, it shows clearly the large variation in flow between the dry and rainy seasons, ever
after construction of three major reservoirs in the basin. Second, the graph shows that the
construction of these reservoirs has been vital to prevent water shortages in the dry season, as
demands surpass natural (prior to storage) flows during February to April, by between 164 MCM
and 339 MCM. Overall, the DNRB can be characterized as an ‘open’ river basin based on this
graph, as excess water is available, over and above all committed legal, ecological and
environmental requirements, even during the dry season. However, the basin will likely soon
approach a ‘semi-closed’ state, where sufficient water resources are available during the rainy
season, but off-stream and instream water needs compete with each other during the dry season.
In so-called ‘closed’ basins, finally, there is no excess water flowing out of the basin; all water
resources are committed to use (Keller, Sakthivadivel, and Seckler 2000). The latter state is
unlikely to occur in the Dong Nai basin due to the large wet season flows and storage potential.
0
2000
4000
6000
8000
10000
12000
Jan Feb Mar Apr May Jun Jul Aug Sep Oct Nov Dec
BAS_flow Source BAS_dem
Flow
s/W
ithdr
awal
s (M
CM
)
25
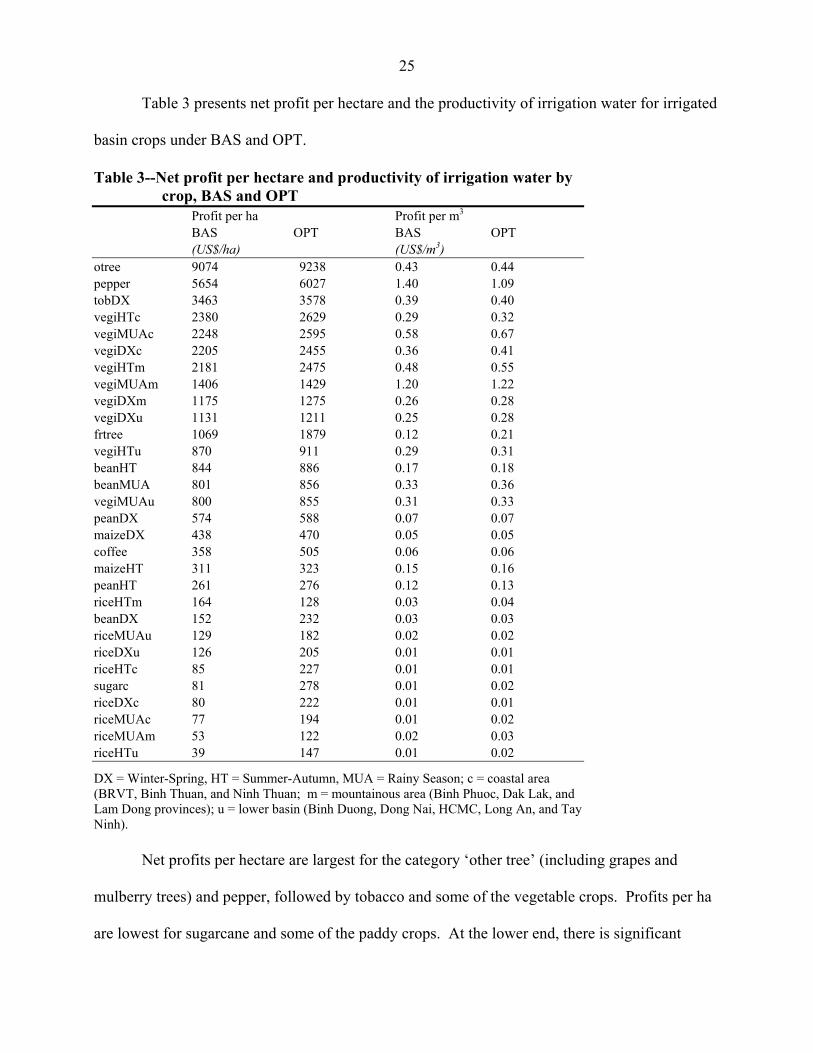
Table 3 presents net profit per hectare and the productivity of irrigation water for irrigated
basin crops under BAS and OPT.
Table 3--Net profit per hectare and productivity of irrigation water by crop, BAS and OPT
Profit per ha Profit per m3 BAS OPT BAS OPT (US$/ha) (US$/m3) otree 9074 9238 0.43 0.44 pepper 5654 6027 1.40 1.09 tobDX 3463 3578 0.39 0.40 vegiHTc 2380 2629 0.29 0.32 vegiMUAc 2248 2595 0.58 0.67 vegiDXc 2205 2455 0.36 0.41 vegiHTm 2181 2475 0.48 0.55 vegiMUAm 1406 1429 1.20 1.22 vegiDXm 1175 1275 0.26 0.28 vegiDXu 1131 1211 0.25 0.28 frtree 1069 1879 0.12 0.21 vegiHTu 870 911 0.29 0.31 beanHT 844 886 0.17 0.18 beanMUA 801 856 0.33 0.36 vegiMUAu 800 855 0.31 0.33 peanDX 574 588 0.07 0.07 maizeDX 438 470 0.05 0.05 coffee 358 505 0.06 0.06 maizeHT 311 323 0.15 0.16 peanHT 261 276 0.12 0.13 riceHTm 164 128 0.03 0.04 beanDX 152 232 0.03 0.03 riceMUAu 129 182 0.02 0.02 riceDXu 126 205 0.01 0.01 riceHTc 85 227 0.01 0.01 sugarc 81 278 0.01 0.02 riceDXc 80 222 0.01 0.01 riceMUAc 77 194 0.01 0.02 riceMUAm 53 122 0.02 0.03 riceHTu 39 147 0.01 0.02
DX = Winter-Spring, HT = Summer-Autumn, MUA = Rainy Season; c = coastal area (BRVT, Binh Thuan, and Ninh Thuan; m = mountainous area (Binh Phuoc, Dak Lak, and Lam Dong provinces); u = lower basin (Binh Duong, Dong Nai, HCMC, Long An, and Tay Ninh).
Net profits per hectare are largest for the category ‘other tree’ (including grapes and
mulberry trees) and pepper, followed by tobacco and some of the vegetable crops. Profits per ha
are lowest for sugarcane and some of the paddy crops. At the lower end, there is significant

26
variation between the BAS and OPT scenarios, as the flexible adjustment of inputs other than
water under OPT helps avoid some of the low crop profits in the BAS scenario.
The productivity of irrigation water, defined as USD/m3, depends on both the profitability
of the crop and its need for irrigation water, which again is determined by growing season,
growing length, and climatic factors. Baseline results indicate that water productivity is high for
vegetables planted in the highland areas and the summer-autumn season. This is because these
crops consume very little irrigation water. Among the non-vegetable crops, pepper, ‘other tree’
and tobacco stand out as crops with relatively high profit per unit of water consumed.
Unsurprisingly, water productivity is lowest for sugarcane and various paddy crops.
5. ALTERNATIVE SCENARIOS
SENSITIVITY ANALYSIS
Sensitivity analyses are carried out to test the robustness of baseline results. Parameters
tested include changes in the climatic situation—inflows and effectively usable rainfall—changes
in the efficiency with which water resources are being used at the field and at the level of primary
and secondary canals. The final sensitivity analysis refers to changes in selected agricultural
commodity prices. Results are presented in Table 4.

27
Table 4--Sensitivity analysis, various parameters (comparison with opt, percentage values)
Parameter Levels/ Values
Irrigation Profit
Domestic Benefit
Industrial Profit
HP Profit
Total Profit
Total Ag Withdrawals
Irrigation Pumping
Total Dom. Withdraw-als
Domestic Pumping
Total Ind. Withdrawals
Industrial Pumping
0.6 90.2 100.0 100.0 71.9 94.4 100.0 66.3 100.0 100.0 100.0 100.0 Low flow (%) 0.5 87.7 100.0 100.0 62.8 92.8 99.5 64.5 100.0 100.0 100.0 100.0
0.5 87.5 100.0 100.0 100.1 96.6 100.0 69.0 100.0 100.0 100.0 100.0 Field-application Efficiency/a 0.9 110.5 100.0 100.0 99.9 102.8 100.0 104.6 100.0 100.0 100.0 100.0
0.60 105.4 100.0 100.0 99.9 101.5 100.0 71.2 100.0 100.0 100.0 100.0 0.75 112.4 100.0 100.0 99.8 103.3 99.5 63.9 100.0 100.0 100.0 100.0
Conveyance and Distribution Efficiency/b 0.375 92.2 100.0 100.0 100.1 97.9 100.0 106.7 100.0 100.0 100.0 100.0
1998 130.5 100.0 100.0 99.9 108.3 100.0 106.0 100.0 100.0 100.0 100.0 Coffee/Pepper Price Changes 2001 82.4 100.0 100.0 100.8 95.3 97.3 23.8 100.0 100.0 100.0 100.0 Note: Runs are based on OPT. Notes: /a Base efficiency is 0.7; b/ Base efficiency for combined conveyance and distribution efficiency is 0.5.

28
Hydrologic Year
During a dry-year case, represented by 60 percent and 50 percent of average inflows and
effective rainfall, respectively, farm incomes from irrigated agriculture drop to 90 percent and 88
percent of OPT levels, respectively. Profits from hydropower production decline similarly, to 72
percent and 63 percent, respectively, as less flows are available to keep the turbines operating.
Under both dry-case scenarios, groundwater pumping for irrigation drops significantly, to 66
percent and 65 percent of OPT levels, respectively, due to the increase in domestic and industrial
pumping—which dominate over irrigation pumping—to compensate for reduced surface water
availability. Domestic and industrial water use benefits are not affected due to their high
marginal return to water usage.
Irrigation Efficiency
One important means to reduce water losses is the improvement of on-farm field
efficiency. In the baseline scenario, field application efficiency is estimated at 0.7, that is, 70
percent of the water applied at the field level is used beneficially by plants. If the field
application efficiency level were increased to 0.9 (and thus overall efficiency to 45 percent), for
example, through investments in irrigation technology in the entire basin, then irrigation profits
would increase to 111 percent of OPT levels (an increase of USD 42 million), and hydropower
profits would decline by a very small amount (a reduction of USD 0.1 million). Increased on-
farm efficiency would make low-profit crops relatively more feasible, and both irrigated area and
groundwater pumping would increase. The annual cost of increased on-farm efficiency, not
incorporated here, should not surpass the estimated increase in net benefits from irrigation
estimated for this alternative.
29
When field application efficiency is reduced to 0.5, however, that is only half of the water
arriving at the field can be used effectively for crop evapotranspiration (and thus overall
efficiency is reduced to 25 percent down from 35 percent), then irrigation profits drop to 88
percent of OPT levels. The relatively more expensive groundwater pumping would decline to 69
percent of OPT levels. This decline would be compensated by increased surface water
withdrawals.
The Government of Vietnam is currently undertaking a large investment project to line
irrigation canals to reduce water losses. The total investment plan over the 1999-2005 period
amounts to USD 758 million for all of Vietnam. The investment funds have several sources.
Most of the funds will be allocated from MARD and based on Decision No. 66. However, a
substantial share will also be sourced from ISF and the land tax, and the reminder from the
farmers themselves. At USD 52 million, the canal lining investments planned and ongoing in the
Dong Nai Basin are relatively small compared to the overall investment schedule (7 percent of
the total), but are still substantial. Irrigation management companies hope to increase conveyance
and distribution efficiency following canal lining from 0.7 to 0.9 (IMC Ninh Thuan and IMC Cu
Chi, personal communication); these estimates (including the original levels) appear somewhat
optimistic. In the baseline, conveyance and distribution efficiency combined are estimated at 0.5.
If the ongoing canal lining would increase the conveyance and distribution efficiency
across the basin to a level of 0.75 (translating into an overall efficiency level of 0.53), then profits
from irrigation would increase to 112 percent of OPT levels (or an increase by USD 50 million),
at the same time that irrigation withdrawals would decline. Groundwater pumping for irrigation
purposes would decline dramatically, to 64 percent of OPT levels—a reduction by 95 MCM—as
cheaper surface water would become more abundant, whereas surface withdrawals would
increase by 65 MCM. Increased irrigation surface withdrawals, in turn, would lead to a slight

30
reduction in profits from hydropower production (USD 0.3 million annually). Thus, at this
increase in efficiency, the canal lining investment appears to be a viable option, compared to
costs incurred.
If the ongoing canal lining activities would increase the combined conveyance and
distribution efficiency levels to a value of 0.6 only (translating into an overall efficiency level of
0.42), then the additional respective annual profits would be only USD 22 million. In this case,
total irrigation withdrawals would not decline, with a reduction of irrigation pumping of 76 MCM
completely offset by an increase in surface withdrawals (Table 4). Thus, no water savings would
be achieved at the basin level.
If, on the other hand, maintenance on primary and secondary canals is deferred—as is
currently happening in many Vietnamese irrigation systems—the combined conveyance and
distribution efficiency might decline to a level of 0.38 based on an increase in canal losses of 25
percent (and translating into an overall efficiency level of 26 percent). In this case, irrigation
profits would drop to 92 percent of OPT levels (a drop by USD 31 million). The resulting
decline in surface irrigation water withdrawals (18 MCM) would be compensated by an increase
in groundwater pumping to 107 percent of OPT levels and total basin profits would decline to 98
percent of OPT values (decline by USD 31 million). Thus, even if the canal-lining project would
not be implemented, it is clear that deferring maintenance on public irrigation systems will cause
long-term costs to the irrigation sector in the Dong Nai Basin and Vietnam.
Finally, the outcomes for irrigation profits are larger for changes in on-farm field
efficiency as they apply to both surface and groundwater irrigation sources.
Commodity Price Changes
Several major agricultural commodities experienced sharp declines in Vietnam and
elsewhere over the past few years. Although the rice price in Vietnam has dropped significantly

31
in the Mekong Delta over this period, prices in the DNRB remained stable due to the relatively
lower quantity and higher quality of rice produced. To evaluate the impact of recent price
changes on farmer incomes, alternative simulations are carried out for the 1998 and 2001 coffee
and pepper prices, which are major cash crops affected by the price decline. Converted to US
dollars, the prices implemented in the model are for coffee: USD 1,033/mt, USD 641/mt, and
USD 372/mt, for 1998, survey year (1999/2000), and 2001, respectively—a drop by a factor of
2.7 over three years—and for pepper: USD 4,590/mt, USD 3,392/mt, and USD 1,149/mt, a drop
by a factor of 4 over the period. The results of the alternative simulations are shown in Figure 8.
If the 1998 coffee and pepper prices would prevail, irrigation profits would increase to
131 percent over OPT values, and total basin profits to 108 percent. For the case of 2001 coffee
and pepper prices, profits from irrigated agriculture drop to 82 percent of OPT values, and total
profits decline to 95 percent of OPT values. In the latter case, total irrigation withdrawals decline
slightly. Moreover, agricultural pumping, which is a major water source for pepper and coffee
crops, drops sharply, to 24 percent of OPT levels, while profits from hydropower production
slightly increase (see Figure 8).

32
527
662 690
156
404
576
677
156
333
561639
157
0
100
200
300
400
500
600
700
800
irr profit withdrw area hydropower
1998survey2001
Figure 8--Sensitivity analysis – Impacts of changes in coffee and pepper prices
POLICY ANALYSIS—WATER USE RIGHTS (WRI), BROKERAGE MECHANISM (BRK), AND MARKET CLEARING (MC) SCENARIOS
The Vietnam Water Law of 1999 calls for a permit system that applies to both surface and
groundwater. Use rights for groundwater are granted for a period of 15 years and for surface
water for a period of 20 years. The permit system only applies to large-scale users. Small
quantities—chiefly for household uses and small-scale uses in agriculture, forestry, aquaculture,
and other home enterprises—are not included in the permit system. In times of water shortages,
domestic uses get priority over irrigation, industrial, hydropower, and environmental uses. At the
absence of the implementation of these regulations, allocation is currently controlled implicitly
through the investment decision-making process. Public agencies and companies, through public
investments in new water-using facilities, determine de facto the basic allocation of surface water
among users. Such uses include irrigation schemes, hydropower stations, ports, and municipal

33
water supply systems. Moreover, in the absence of enforced water use rights, the construction of
new infrastructure implicitly reallocates water among the various sectors, without compensating
potential historic users of this water.
Experience in several developed and developing countries has shown that as economies
develop, and more infrastructure is being built, water is typically reallocated from the agriculture
sector to the rapidly growing urban and industrial sectors (Rosegrant and Ringler 1998). This
process can threaten the livelihoods of irrigating farmers and associated rural economies. The
establishment of water use rights (WRI), as envisioned in the Vietnam Water Law, and as
recently detailed in decisions passed by the Government, could empower water users in all
sectors, as it establishes both rights and responsibilities to specified water use. If water shifts to
other, typically urban and industrial sectors, irrigators and other users would need to be
compensated. However, this requires that representatives of irrigating farmers, like Water User
Associations, farmer cooperatives, or Irrigation and Drainage Management companies are
allocated use rights, as farmers are exempted/excluded in the current legislation. Moreover,
establishing water rights can serve as an incentive to invest in productive water uses, as there is
some security to be able to use the water for a prolonged period. Furthermore, water use rights
provide incentives for all sectors to invest in water-saving technologies, as water outside of the
existing water use right would have to be obtained at a certain cost, and—in well-developed
water use right systems—water can be traded, that is, purchased and sold, among sectors.
The establishment of water use rights together with the possibility to sell unused use
rights to an agency or to purchase additional use rights, if the water can be used productively, can
help poorer farmers to obtain additional income. The implications of this type of system—which
34
can be implemented in the form of a brokerage mechanism (BRK)—on water allocation, use, and
farmer incomes, and overall basin profits will be examined in the following.
In practice, there have been both positive and somewhat less successful experiences
regarding the implementation of brokerage mechanisms (also called clearinghouses or
charge/subsidy systems). These systems have so far typically been employed to control air and
water pollution. Wang and Chen (1999) present a positive outcome of the application of a
charge/subsidy system in China to control industrial pollution. In particular, this system provided
the Chinese industries with incentives to decrease pollution levels. Another case study in France
has shown that too much bureaucracy can undermine the effectiveness of charge/subsidy systems
(Glachant 1999).
If (water) economies are more advanced, a Market Clearing (MC) mechanism can be
introduced that ensures that the volume of water being sold by all users equals the volume being
purchased by other users within the same sector or across sectors across specified time periods,
here months. The implementation of market clearing mechanisms requires more sophisticated
communication and information systems compared to the introduction of a water brokerage
system.
The establishment of water use rights is a highly complex task and requires the
determination of many aspects to ensure its workability. For example, in the case of Vietnam, the
allocation of water use rights to groups of farmers (Water User Associations) or Irrigation and
Drainage Management Companies (IMCs) requires the determination of initial allocation rules.
Possibilities for initial allocation include:
- designed capacity of extraction works - actual capacity of extraction works - historical water use pattern

35
- estimated water needs (WRCS 2000).
Each type of initial rights allocation will have significant consequences for the equity,
efficiency, and viability and sustainability of the water rights system. The water use right
scenarios implemented here envision a system where water users are registered in some form
with a basin agency or authority or similar; and that the registered use confers both rights to use
the amount registered as well as the responsibility to use this water in an efficient manner.
Moreover, an alternative scenario envisions the future purchase and sale of these water use rights,
to allow water to move into higher-valued uses without compromising the incomes of irrigating
farmers.
For WRI, water rights are established for all demand sites reflecting historic usage under
BAS. For the BRK scenario, in addition to the water use rights, a brokerage mechanism is
implemented. All off-stream sectors can sell water up to their water use right allotment to a
brokerage agency or clearinghouse (which could be the river basin agency), which compensates
the users at a fixed water price, and then can relocate the resource to other sectors that might want
to purchase sources in addition to their own water rights. Sales and purchases are implemented
on a monthly basis. Thus, a demand site can buy in the dry season and sell during the wet season,
for example. If the water sold to the agency is not allocated to other off-stream sectors, it
enhances instream flows. The water price at which the agency buys and sells—the agency water
price—is fixed exogenously and is the same for all sectors (under full water market conditions,
the water price at which various water users at different locations in the system are willing to sell
or buy water can be revealed through the shadow price). Two alternative agency prices are set at
USD 0.02/m3 and at USD 0.06/m3. A third set of scenarios includes a market clearing
mechanism (MC) in addition to the brokerage mechanism. That is, water use rights that are sold

36
or bought to an agency need to be equal in volume. Thus, the agency costs are limited to
transaction costs. Costs for the establishment and management (transaction costs) of a brokerage
and market mechanism are difficult to estimate. For the purpose here it is assumed that the
brokerage incurs transaction costs of USD 0.01/m3 purchased/sold and the market clearing
mechanism faces costs of USD 0.03/m3 traded among sectors. Net water trade equals zero. As
the model optimizes over the entire basin, a provision is included for the BRK and MC scenarios
that no individual demand site can be worse off than under the WRI case. The alternative
scenarios are implemented based on the OPT scenario, that is, they include variation in area,
yield, and crop inputs, and are based on the BAS for initial water use right allocation.
Table 5 presents selected results for the water use right scenarios with the alternatives of
brokerage mechanism (BRK) and brokerage plus market clearing (MC).

37
Table 5--Selected results from water trading analysis, WRI, BRK and MC scenarios
WRI BRK 0.02 BRK 0.06 MC 0.02 MC 0.06
Agency-fixed trading price (USD/m3) 0.02 0.06 0.02 0.06Irrigation Profit (M USD) 401 486 387 435 434Domestic Benefit (M USD) 687 1,057 1,057 1,057 1,057Industrial Benefit (M USD) 155 162 160 161 161Hydropower Profit (M USD) 155 153 154 154 154Total Profit (M USD) 1,397 1,858 1,757 1,806 1,805Total water withdrawals (MCM) 6,309 9,670 3,923 6,326 6,334Irrigation withdrawals (MCM) 5,615 8,719 3,054 5,411 5,430Irrigated area (in '000 ha) 678 904 497 685 693
Government income/(cost) (M USD) 33.8 -74.6 0.0 0.0
Farmer sells (buys) (M USD) -27.4 89.1 5.7 16.5Dom. Sector sells (buys) (M USD) -4.3 -12.4 -4.2 -12.6Industry sells (buys) (M USD) -2.1 -2.1 -1.5 -3.9
Quantity of water traded (MCM) 1,690 1,485 284 275Average farm income per ha (USD/ha) 591 538 779 635 627Average irrigation water per ha (m3/ha) 8,279 9,646 6,147 7,898 7,836
Note: See also Figure 9.
When a brokerage mechanism (BRK) system is introduced, water withdrawals increase
significantly compared to the fixed rights system, even though water users have to pay for
additional water. The agency-fixed sale/purchase price is crucial for the determination of the
agency net income or loss. In the case of a price of USD 0.02/m3 all sectors are net buyers and a
total of 1,690 MCM are purchased under BRK, for example. Thus, the agency has a net income
USD 34 million from water sales for the river basin as a whole. At the same time, gross irrigation
withdrawals increase to 8.7 BCM. All sectors with established water use rights gain from the
clearinghouse mechanism. However, the benefits to instream uses, like hydropower, and
environmental uses, decline as they do not have water use rights accorded based on the Water
Law and reflected in the river basin model. Moreover, although total profits in the irrigation
sector increase, these profits are spread over a much wider irrigation area, and more water-

38
-100-80-60-40-20
020406080
100
BR
K0.02
BR
K0.06
MC
0.02
MC
0.06Trad
e (M
USD
)
Irr sell/(buy) Dom sell/(buy) Ind sell/(buy) Gov Inc/(cost/env)
intensive crops are brought into production. As a result, profits decline on a per hectare basis,
compared to the system with fixed water rights (from USD 591/ha to USD 538/ha).
If the water price in the BRK system is set at a higher level, here USD 0.06/m3, it is more
profitable for many irrigation systems to sell part of their water use right to the water agency
instead of continuing to use the full share of allocated use rights. All in all, the water agency
purchases 1.2 BCM worth of water at a net cost of USD 74.6 million. This is due to the fact that
the volume of water sold by farmers at this higher water price is far larger than the volume of
additional water demanded by the domestic and industrial sectors (see also Table 5 and Figure 9).
Figure 9--Water use right scenarios: water sales/purchases and agency income/cost (environment)
Due to the large sales of water from irrigated agriculture, the volume of gross agricultural
water withdrawals declines to 3.1 BCM and irrigated area drops to 0.497 million hectares. As a
result, profits from irrigated agriculture alone under the higher water price of USD 0.06/m3 are
lower compared to the irrigation profits at the agency set price of USD 0.02/m3. However, the
39
important result is that under the higher water price, profit from irrigated agriculture on a per
hectare basis is significantly higher compared to the WRI scenario and compared to the BRK
scenario at the lower agency-set price (USD 779/ha, versus USD 591/ha and USD 538/ha). At
the price offered for the water use right, irrigating farmers make a substantial share of their use
rights available to other off-stream users (or the environment), while investing their remaining
water resources into those crops that are more profitable per cubic meter of water (“crop per
drop”). Thus, water moves to higher-valued uses, without income losses to the irrigation sector.
Gross water trade reaches a level of 1.485 BCM.
If in addition to the brokerage mechanism, a market clearing mechanism is introduced,
that is, net sales of water use rights across all sectors need to equal net purchases of water use
rights across all sectors. In that case, the brokerage agency does not incur gains and losses apart
from transaction costs. As a balance has to be reached between the water use rights available
intended for sale and the demand for additional water use rights, the volume of purchases and
sales drops compared to the BRK scenarios. Whereas the quantity of water traded was 1,690
MCM under BRK 0.02 (that is at the agency set price of USD 0.02/m3) and 1,485 MCM under
BRK 0.06 the corresponding volumes under the market clearing mechanism drop to 284 MCM
under MC 0.02 and 275 MCM under MC 0.06, respectively. Moreover, under all MC scenarios,
on average, irrigated areas, which have generally lower profits “per drop” of water compared to
usage in industry and households, are net sellers of waters, whereas the latter are net buyers of the
resource (Figure 9). At the higher agency price, the trade in water use rights under MC increases
substantially in monetary but not volume terms, with irrigation demand site incomes from water
sales increasing from USD 5.7 million to USD 16.5 million. Although net farm income per ha
does not reach the BRK levels—where the agency supports water sales from irrigated areas even
40
60708090
100110120130140
WRI BRK 0.02
BRK0.06
MC 0.02 MC 0.06
Profit/ha Withdrawal/ha
if no one purchases this water—net profits per hectare irrigated are still larger compared to the
WRI case.
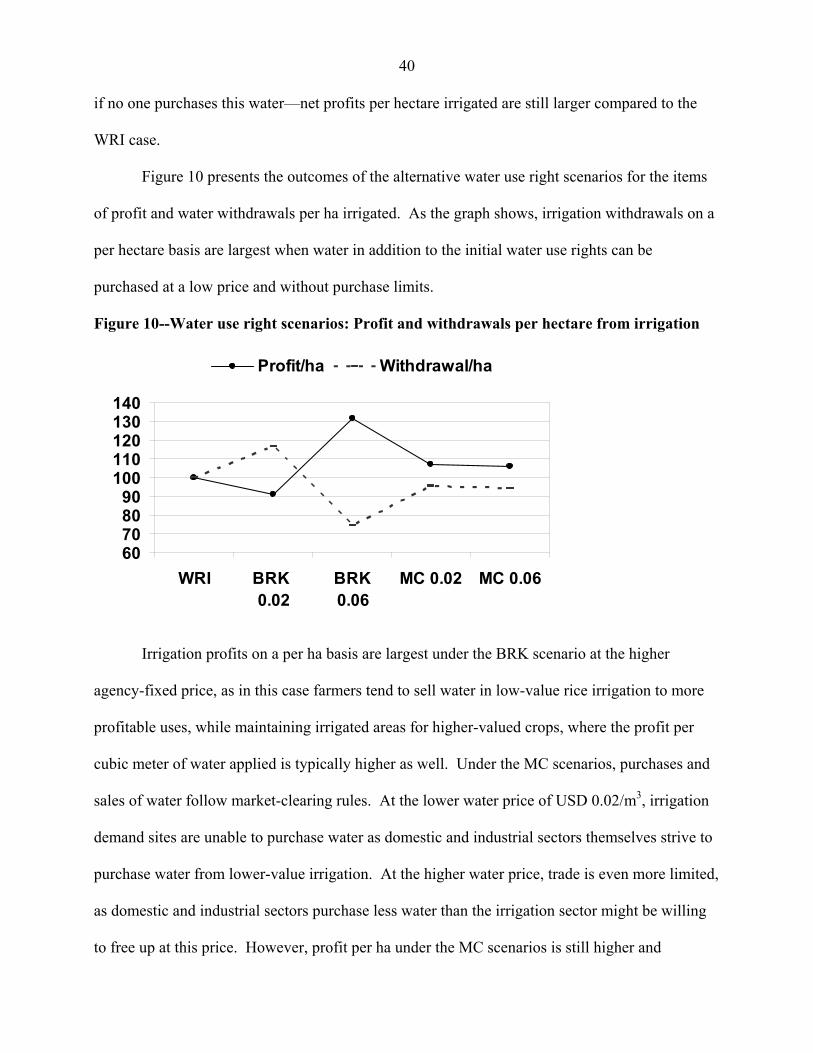
Figure 10 presents the outcomes of the alternative water use right scenarios for the items
of profit and water withdrawals per ha irrigated. As the graph shows, irrigation withdrawals on a
per hectare basis are largest when water in addition to the initial water use rights can be
purchased at a low price and without purchase limits.
Figure 10--Water use right scenarios: Profit and withdrawals per hectare from irrigation
Irrigation profits on a per ha basis are largest under the BRK scenario at the higher
agency-fixed price, as in this case farmers tend to sell water in low-value rice irrigation to more
profitable uses, while maintaining irrigated areas for higher-valued crops, where the profit per
cubic meter of water applied is typically higher as well. Under the MC scenarios, purchases and
sales of water follow market-clearing rules. At the lower water price of USD 0.02/m3, irrigation
demand sites are unable to purchase water as domestic and industrial sectors themselves strive to
purchase water from lower-value irrigation. At the higher water price, trade is even more limited,
as domestic and industrial sectors purchase less water than the irrigation sector might be willing
to free up at this price. However, profit per ha under the MC scenarios is still higher and

41
-200
0
200
400
600
800
1,000
1,200
1,400
WRI BRK 0.02 BRK 0.06 MC 0.02 MC 0.06
M U
SD
Water trade: Inc / Cost
Irrigation Profit (M USD)
Other profits/benefits
irrigation withdrawals per ha are still lower compared to the WRI scenario; thus the combined
objective of improved farmer incomes and water savings can be achieved under both alternative
scenarios, the brokerage mechanism and market clearing.
Figure 11 presents the income of farmers from irrigation activities and from sale of water
use rights.
Figure 11-- Water use right scenarios: Total irrigation and other profits
At the lower water price, USD 0.02/m3, irrigation demand sites are net purchasers of
water under the BRK scenario, spending a total of USD 27.4 million on additional water use
rights, 5.6 percent of total irrigation profits, 20 percent of total surface irrigation withdrawals, and
19 percent of total irrigation withdrawals. Under the higher water price, irrigating farmers are net
sellers of water, obtaining a total of 23 percent of total irrigation profits from water sales, and
selling 33 percent of total irrigation withdrawals (or 3 percent of total basin discharge). Under
the MC scenario, where irrigation sites are net sellers at both specified water prices, incomes
from water sales are USD 5.7 million (1.3 percent of total irrigation profits) and USD 16.5

42
million (3.8 percent of total irrigation profits) under the water prices of USD 0.02/m3 and USD
0.06/m3, respectively. Under market-clearing conditions, water sales out of agriculture reach 5
percent of total surface withdrawals under both alternative agency-set water prices.
As the Dong Nai basin economy develops and water becomes scarcer, the agency price
could be increased to reflect the increasing value of water in the basin, thus prompting additional
water sales and investments in water-saving technologies in irrigated agriculture as well as in the
purchasing water-use sectors.
OPEN ECONOMY, INTERNATIONAL LINKAGES– TRDLIB
During the last decade or so, Vietnam has become a major or even the largest player in
some international agricultural commodity markets, including pepper, coffee, and rice.
Moreover, Vietnam has recently joined ASEAN and considers participation in the WTO.
Increased participation in international agricultural commodity markets and increased openness to
trade has led to the removal of most distortionary export taxes and import quotas that have been
in place in the past, but it has also exposed local producers to the price fluctuations prevalent in
some of these international markets, particularly rice.
The Open Economy and International Linkages Scenario, TRDLIB, assumes a
continuation of these trends culminating in the full removal of primary economic distortions
(taxes, subsidies) that affect agricultural production (and hence agricultural water use). The Dong
Nai basin economy, centered on irrigated crop production, is linked to global conditions via
internationally established prices of inputs (fertilizers, energy, for example) and outputs
(agricultural commodities). Farmers face producer prices set in international markets and
mediated by costs of inland transportation, storage and marketing margins. The scenario does not
take into account secondary effects of increased trade liberalization, like a reduction in the

43
marketing margins, which will likely occur as the powers accorded to few traders are gradually
relaxed during the increased opening to international markets and the larger introduction of
competitiveness in markets. Moreover, the large remaining industrial protection levels (for
example in the sugarcane industry) are not examined under this scenario.
As a study by Barker et al. (2002) shows, overall subsidy and taxation levels in the
agriculture sector have declined substantially over the last two decades. In 1999/2000, estimated
average net protection rates reached –7 percent for rice, -7.5 percent for coffee, -13 percent for
pepper, + 7.5 percent for tobacco, +112 percent for sugarcane (1998-1999 average, industrial
protection), and +16.5 for urea. The case of urea is particularly significant. Urea protection rates
vary across time, but have been significant and geared at protecting the local fertilizer industry.
Based on the IFPRI-SubNIAPP farm household survey, farmers paid between USD 381-1500 per
metric ton of nitrogen equivalent fertilizer.8 As the CIF border price of urea was USD 105 per
metric ton in 1999, and the estimated wholesale price about USD 157 per metric ton in
1999/2000, farmers, on average, were taxed heavily for fertilizer inputs. Distortions are lower for
other fertilizers, like potash and potassium, because they are mostly imported. If remaining trade
barriers would be removed, domestic prices received by farmers would increase for rice, coffee,
pepper, and decline for tobacco. Urea fertilizer costs to farmers would decline significantly
(Barker et al., 2002). The case of sugarcane is different. Here it is the industry that is heavily
protected.9
8 The average elemental nitrogen cost of rice farmers ranged from USD 382-616 per metric ton. Urea has a concentration of about 45 percent of elemental nitrogen. Thus, farmers paid about USD 171-684 per metric ton of urea. 9 A study by CIE (2001) showed that liberalization of sugar imports would increase the real income of Vietnam by some USD 82 million each year, and sugarcane production would decline. As the profit per ha for sugarcane is already quite low, no further changes were made to the sugarcane price received by farmers resulting from the removal of the protection for the sugarcane industry.
44
The objectives of the TRDLIB scenario are to analyze the outcomes for cropping patterns,
water allocation, and farm incomes of the removal of primary remaining distortions in
agricultural input and output markets. In order to implement the trade liberalization scenario, the
protection/taxation levels were removed for the irrigated crops in the basin model, that is, rice
prices were increased by 7 percent, coffee prices by 7.5 percent, and pepper prices by 13 percent;
and tobacco prices were reduced by 7.5 percent, and urea prices by 16.5 percent. This scenario
was analyzed based on the 2010 projected Business-As-Usual (BAU) scenario with flexible area
allocation.
The removal of remaining taxes on fertilizer (urea), rice, coffee, and pepper will lead to
direct annual farm income increases of USD 89 million. As a result, total annual profits increase
from USD 4,676 million under BAU to USD 4,765 million under the alternative TRDLIB
scenario (2010 projections). Lam Dong province experiences the largest yearly benefits, at USD
25 million, followed by Binh Phuoc, at USD 13 million, and Binh Thuan, at USD 10 million.
Figure 12 shows the changes in profitability per hectare for the three major crop types. Profit per
ha increases most for rice crops, by 22 percent (from USD 182/ha to USD 223/ha), followed by
perennial crops, by 13 percent (from USD 1,465/ha to USD 1,658/ha), and upland crops by 0.4
percent (from USD 1,048/ha to USD 1,053/ha).

45
1,465
1,048
182
1,658
1,053
223
0
500
1,000
1,500
2,000
Perennial Upland Rice
Prof
it (U
SD/h
a)
BAU TRDLIB
Figure 12--Profit per hectare by crop type, TRDLIB and BAU scenarios
The large increase in profitability of rice crops is due to the combination of larger
received output prices and reduced fertilizer input costs. This applies similarly to the large
increase in profitability observed for perennial crops. Here the share of fertilizer in total
production cost is the reason for the large increase in profitability. Nitrogen equivalent fertilizer,
for example, averages 343 kg/ha and year for perennial crops as compared to 119 kg/ha for paddy
and 125 kg/ha for upland crops. However, urea plays an important part for all crop types, and the
removal of urea protection is equivalent to a direct net transfer of income to irrigating farmers.
Total irrigated area increases slightly between these two scenarios, from 1.546 million ha
under BAU in 2010, with flexible area allocation to 1.548 million ha under TRDLIB, and
TRDLIB helps move some of the unprofitable rice area back into the positive profit margin area.
Moreover, under the TRDLIB scenario, the N-fertilizer application increases from an average of
168 kg/ha for irrigated crops in the basin in BAU to 179 kg/ha, and the P-fertilizer application
increases from 126 kg/ha to 129 kg/ha; whereas K-fertilizers barely change.
46
6. CONCLUSIONS
The paper introduced an economic-hydrologic river basin model and its application to the
Dong Nai River Basin in southern Vietnam. The model describes the water supply situation
along the river system and the water demands by the various water-using sectors. Water benefit
functions are developed for productive water uses and minimum instream flows are included as
constraints. Water supply and demand are then balanced based on the economic objective of
maximizing net benefits to water use. This structure allows for intersectoral and multi-province
analyses of water allocation and use with the objective to determine tradeoffs and
complementarities in water usage and strategies for the efficient allocation of water resources.
This type of model can help the provinces in the newly formed Dong Nai Planning
Management Council to structure the complex reality of the Dong Nai water resources system.
The model can be used both as a planning tool, focusing on the investment side, and even more
so as a tool to develop strategies for basin management. The model can support policymakers in
their decision-making processes from an economic efficiency perspective. Water allocation
mechanisms need to be efficient, equitable, and environmentally sustainable. The model
developed for the DNRB inherently ensures efficient water allocation in the basin as water is
allocated according to its scarcity value to the highest valued uses and, once those are satisfied, to
other uses, so long as the overall economic profit from water use across the basin increases.
Finally, the model allows to analyze the impact of policies on outcomes for water and farm
incomes at various levels: from changes in farmer behavior and decisions at the local/crop area
level, to basin-level changes in water allocation mechanisms, up to national-level changes in
macroeconomic input and output price policies.

47
Sensitivity analyses for changes in the overall irrigation efficiency have shown that water
savings could be large. However, the appropriate means to achieve these savings—either through
structural/infrastructure measures, as chosen by the government, or through nonstructural
measures, like improvement in management, or the implementation of a brokerage mechanism
(see below)—warrant further analysis and discussion. Only high levels of actual efficiency
increase—for example, an increase in the combined conveyance and distribution efficiency to
0.75—would actually lead to sufficient increased benefits through water savings to make the
USD 52 million investment currently implemented a viable one. However, other benefits,
including cost savings due to reduced O&M from canal lining also would need to be considered.
On the other hand, cessation of joint farmer canal cleaning can be a stumbling block for irrigation
management transfer and farmer management of irrigation systems, and thus might not be
conducive to the ongoing, albeit slow, process of decentralization in Vietnam’s irrigation sector.
The simulation of alternative output prices received for pepper and coffee has
demonstrated their large impact on the total basin economy over the last few years. The
reduction in coffee and pepper prices between 1998 and 2001 alone, has led to a decline in net
farm incomes by USD 194 million in the DNRB (accompanied by a large drop in groundwater
pumping of 218 MCM). The drop in coffee and pepper prices is particularly worrisome, as these
perennial crops are long-term investment decisions that cannot be changed in the matter of a
season or even a year. The multi-year reduction in coffee prices in Vietnam, in fact, has led to
the destruction of several thousand hectares of coffee plants—albeit mostly older and less
productive ones—and has led to the substitution of some area planted to the robusta variety with
the more highly priced arabica variety. However, coffee prices have since recovered to closer to
1998 levels, returning the crop back to profitability. The decline in pepper prices was not large
enough to wipe out area. Stabilizing and increasing farmgate prices through improved quality

48
and other measures must be a key goal for Vietnam’s agricultural policy, particularly for
perennial crops, which cannot quickly adjust to the large price swings experienced in the basin in
recent years.
Results from the water use rights scenarios have shown that appropriate incentives can
shift irrigated area allocation towards water savings while farmer incomes are maintained and
urban and industrial water use shares increase. Although not shown explicitly on the basis of
alternative scenarios, the establishment of water use rights alone does provide security for all
types of water users, as they guarantee a long-term right to access to a specific volume of water,
which can lead to investments for improved water use in all sectors, and supports longer-term
cropping decisions towards more high-value (and more risky) cropping patterns. In particular, by
making the limits to water use explicit, water use rights create incentives for the implementation
of water-saving technologies to meet future demand. The results from the alternative
clearinghouse mechanism (BRK) scenarios have shown that farmers and other water users do
respond positively to changes in the incentive structure for water allocation and use. For
example, water sales from irrigated areas occur more often, when rice constitutes a large share of
the irrigated area in the specific demand site due to the lower value of water in rice irrigation
compared to other cropping systems. Moreover, in the case of the brokerage system, special
attention has to be paid to the setting of the agency-fixed water price, at which users can sell part
of their water use right or obtain access to additional water. At relatively higher water purchase
and sales prices, for example, at the USD 0.06/m3 applied here, irrigators tend to sell a part of
their water use right at the same time as profits from irrigated agriculture on a per hectare basis
increase significantly, as water in low-value uses is sold first—here average profits per ha
increased to USD 779/ha, and farmers earned an additional USD 89 million from water sales, but
total profits from irrigated farming alone in the basin declined to USD 387 million. The water
49
sold by irrigation sites translates into real water savings at the basin level that can enhance
instream flows or can be used to meet urban-industrial demands. If, on the other hand, the water
purchase/sales price is relatively low, for example, at the USD 0.02/m3 used here, then irrigation
sites will tend to purchase additional water—here for USD 27 million—resulting in lower
average profits per ha, here USD 538/ha, while total irrigation profits are higher, here at USD 486
million. In this case, instream flows decline, but irrigated area and farm employment increase.
Thus, the brokerage systems can help achieve water savings in irrigated agriculture without
hurting the net income situation in rural areas; in fact, farmer incomes are enhanced if appropriate
incentives are provided.
The brokerage mechanism has been examined here as it is relatively easier to implement
in a developing-country context, once water use rights are established, as it requires no market
clearing mechanism. However, as the results here have shown as well, depending on the
clearinghouse-set water price (and on the water scarcity or abundance situation), large volumes of
additional water might be purchased, resulting in net incomes to the agency, but net losses to the
environment and possibly to hydropower production, or large volumes of water use rights are
sold to the agency, in which case the environment and hydropower benefit, at a net monetary cost
to the agency. The introduction of a market clearing mechanism avoids these possibly extreme—
albeit within physical, technical, system, and economic boundaries—sale and purchasing events
by placing a limit on water use right sales, as bids to sell water are balanced with existing
demands for additional water.
Results for the series of MC scenarios have shown that although the volume of water sold
and purchased is significantly reduced compared to the BRK scenarios—with maximum water
volumes traded of 284 MCM under MC compared to 1,690 MCM under BRK—net gains across
water-using sectors are as large or even larger compared to the BRK system. However, the

50
implementation of an MC scenario in practice requires a complex information and management
system, with large ensuing transaction costs, which would need to be estimated in detail prior to
establishing such a system.
The analyses have also shown that irrigation sites will only sell part of their water use
rights, that is, the introduction of water trading does not necessarily lead to the cession of
agricultural activities. According to the model simulations, if water can be sold to or purchased
from a clearinghouse, irrigators spend 5.6 percent of their farm incomes on purchasing additional
water (to obtain 20 percent of their surface withdrawals) at the lower agency water price. At the
higher price, irrigators obtain 23 percent of their total irrigation profits from water sales, and sell
33 percent of withdrawals (or 3 percent of total basin discharge). If market clearing is
introduced, 1.3 percent and 3.8 percent of the average farm income is obtained from water sales
at the lower and higher water-trading price, respectively, and 5 percent of irrigation water is
transferred out of agriculture.
Finally, the application of both water-trading instruments are very flexible and can adapt
to the changing scarcity value of water in the basin. When water is abundant, for example, a low
water price for sales and purchases can be set and most water will be used within its respective
intended use. As the basin economy develops and water becomes scarcer, the agency price could
be increased to reflect the higher value of water in the basin, thus prompting additional water
sales and investments in water-saving technologies in irrigated agriculture as well as other water-
use sectors.
Moreover, the analysis of changes in macroeconomic policies—here the full removal of
primary economic distortions (taxes, subsidies) that affect irrigated agricultural production (and
hence agricultural water use)—compared to the current situation has shown that the prevailing
pattern of price distortions has significant impacts on water usage at the basin (and national)

51
levels. The removal of remaining agricultural protection and subsidies would lead to direct annual
farm income increases of USD 89 million in the Dong Nai River Basin (for the future 2010
estimate). Thus, distorted input and output price policies also distort incentives for efficient land
water allocation in irrigation and other water-using sectors. Efficient allocation of land and water
resources at the basin level would be enhanced if policymakers remove remaining distortions at
the macro level in Vietnam, and other Asian river basins.

52
REFERENCES
Barker, R., C. Ringler, N.M. Tien, and M. Rosegrant. 2002. Macro policies and investment
priorities for irrigated agriculture in Vietnam. Report prepared for the ADB RETA 5866. Mimeo.
Boggs, D. 1995. Municipal and industrial water supply and disposal. Accommodating growth. In Vietnam water resources sector review. Selected working papers. World Bank: Washington, D.C.
Doorenbos, J. and A.H. Kassam. 1979. Yield response to water. FAO Irrigation and Drainage Paper No. 33. Rome: FAO.
Doorenbos, J. and W.O. Pruitt. 1977. Guidelines for predicting crop water requirements. FAO Irrigation and Drainage Paper No. 24 (rev.). Rome: FAO.
GKW/SAFEGE (Gesellschaft für Kläranlagen und Wasserversorgung Mannheim / Société Anonyme Française d'Etudes et de Gestion). 1996. Ho Chi Minh City water supply master plan. TA No. 2000-VIE. Final Report. Volume III: Annexes
Glachant, M. 1999. Water agencies in France: A case of conflict between common and state institutions. CERNA. Ecole des Mines de Paris, France. <accessed at http://www.isnie.org/ISNIE99/Papers/glachant.pdf>
Keller, A.A., R. Sakthivadivel, and D. Seckler. 2000. Water scarcity and the role of water storage in development. Research Report 39. Colombo, Sri Lanka: International Water Management Institute.
McKinney, D.C., X. Cai, M.W. Rosegrant, C. Ringler, and C.A. Scott. 1999. Integrated basin-scale water resources management modeling: Review and future directions, IWMI SWIM Paper No. 6. Colombo, Sri Lanka: IWMI.
Ngoc Anh, N. 2000. Quan Ly Tong hop Tai Nguyen Nuoc Luu Vuc Song Dong Nai (General management of water resources in Dong Nai River Basin). Hanoi: Master’s Thesis, University of Water Resources.
Rogers, P.P. and M.B. Fiering. 1986. Use of systems analysis in water management. Water Resources Research 22(9): 146S-158S.
Rosegrant M.W. and C. Ringler. 1998. Impact on food security and rural development of transferring water out of agriculture. Water Policy, 1(6): 567-586.
Rosegrant, M.W., C. Ringler, D.C. McKinney, X. Cai, A. Keller, and G. Donoso. 2000. Integrated economic-hydrologic water modeling at the basin scale: The Maipo river basin. Agricultural Economics (24)1: 33-46.

53
Wang, Hua and Chen, Ming. 1999. How the Chinese system of charges and subsidies affects pollution control efforts by China’s top industrial polluters. Working Paper 2198. World Bank.
WRCS. 2000. Progress report on management study on licensing of surface water extractions. Red River Basin Water Resources Management Project .ADB TA 2871-VIE. Mimeo.

LIST OF EPTD DISCUSSION PAPERS
01 Sustainable Agricultural Development Strategies in Fragile Lands, by Sara J. Scherr and Peter B.R. Hazell, June 1994.
02 Confronting the Environmental Consequences of the Green Revolution in Asia, by Prabhu L. Pingali and Mark W. Rosegrant, August 1994.
03 Infrastructure and Technology Constraints to Agricultural Development in the Humid and Subhumid Tropics of Africa, by Dunstan S.C. Spencer, August 1994.
04 Water Markets in Pakistan: Participation and Productivity, by Ruth Meinzen-Dick and Martha Sullins, September 1994.
05 The Impact of Technical Change in Agriculture on Human Fertility: District-level Evidence From India, by Stephen A. Vosti, Julie Witcover, and Michael Lipton, October 1994.
06 Reforming Water Allocation Policy Through Markets in Tradable Water Rights: Lessons from Chile, Mexico, and California, by Mark W. Rosegrant and Renato Gazri S, October 1994.
07 Total Factor Productivity and Sources of Long-Term Growth in Indian Agriculture, by Mark W. Rosegrant and Robert E. Evenson, April 1995.
08 Farm-Nonfarm Growth Linkages in Zambia, by Peter B.R. Hazell and Behjat Hoijati, April 1995.
09 Livestock and Deforestation in Central America in the 1980s and 1990s: A Policy Perspective, by David Kaimowitz (Interamerican Institute for Cooperation on Agriculture. June 1995.
10 Effects of the Structural Adjustment Program on Agricultural Production and Resource Use in Egypt, by Peter B.R. Hazell, Nicostrato Perez, Gamal Siam, and Ibrahim Soliman, August 1995.
11 Local Organizations for Natural Resource Management: Lessons from Theoretical and Empirical Literature, by Lise Nordvig Rasmussen and Ruth Meinzen-Dick, August 1995.
12 Quality-Equivalent and Cost-Adjusted Measurement of International Competitiveness in Japanese Rice Markets, by Shoichi Ito, Mark W. Rosegrant, and Mercedita C. Agcaoili-Sombilla, August 1995.
13 Role of Inputs, Institutions, and Technical Innovations in Stimulating Growth in Chinese Agriculture, by Shenggen Fan and Philip G. Pardey, September 1995.
14 Investments in African Agricultural Research, by Philip G. Pardey, Johannes Roseboom, and Nienke Beintema, October 1995.
15 Role of Terms of Trade in Indian Agricultural Growth: A National and State Level Analysis, by Peter B.R. Hazell, V.N. Misra, and Behjat Hoijati, December 1995.
16 Policies and Markets for Non-Timber Tree Products, by Peter A. Dewees and Sara J. Scherr, March 1996.
17 Determinants of Farmers’ Indigenous Soil and Water Conservation Investments in India’s Semi-Arid Tropics, by John Pender and John Kerr, August 1996.
18 Summary of a Productive Partnership: The Benefits from U.S. Participation in the CGIAR, by Philip G. Pardey, Julian M. Alston, Jason E. Christian, and Shenggen Fan, October 1996.
19 Crop Genetic Resource Policy: Towards a Research Agenda, by Brian D. Wright, October 1996.
20 Sustainable Development of Rainfed Agriculture in India, by John M. Kerr, November 1996.
21 Impact of Market and Population Pressure on Production, Incomes and Natural Resources in the Dryland Savannas of West Africa: Bioeconomic Modeling at the Village Level, by Bruno Barbier, November 1996.
22 Why Do Projections on China’s Future Food Supply and Demand Differ? by Shenggen Fan and Mercedita Agcaoili-Sombilla, March 1997.
23 Agroecological Aspects of Evaluating Agricultural R&D, by Stanley Wood and Philip G. Pardey, March 1997.
24 Population Pressure, Land Tenure, and Tree Resource Management in Uganda, by Frank Place and Keijiro Otsuka, March 1997.

25 Should India Invest More in Less-favored Areas? by Shenggen Fan and Peter Hazell, April 1997.
26 Population Pressure and the Microeconomy of Land Management in Hills and Mountains of Developing Countries, by Scott R. Templeton and Sara J. Scherr, April 1997.
27 Population Land Tenure and Natural Resource Management: The Case of Customary Land Area in Malawi, by Frank Place and Keijiro Otsuka, April 1997.
28 Water Resources Development in Africa: A Review and Synthesis of Issues, Potentials, and Strategies for the Future, by Mark W. Rosegrant and Nicostrato D. Perez, September 1997.
29 Financing Agricultural R&D in Rich Countries: What’s Happening and Why? by Julian M. Alston, Philip G. Pardey, and Vincent H. Smith, September 1997.
30 How Fast Have China’s Agricultural Production and Productivity Really Been Growing? by Shenggen Fan, September 1997.
31 Does Land Tenure Insecurity Discourage Tree Planting? Evolution of Customary Land Tenure and Agroforestry Management in Sumatra, by Keijiro Otsuka, S. Suyanto, and Thomas P. Tomich, December 1997.
32 Natural Resource Management in the Hillsides of Honduras: Bioeconomic Modeling at the Micro-Watershed Level, by Bruno Barbier and Gilles Bergeron, January 1998.
33 Government Spending, Growth, and Poverty: An Analysis of Interlinkages in Rural India, by Shenggen Fan, Peter Hazell, and Sukhadeo Thorat, March 1998. Revised December 1998.
34 Coalitions and the Organization of Multiple-Stakeholder Action: A Case Study of Agricultural Research and Extension in Rajasthan, India, by Ruth Alsop, April 1998.
35 Dynamics in the Creation and Depreciation of Knowledge and the Returns to Research, by Julian Alston, Barbara Craig, and Philip Pardey, July, 1998.
36 Educating Agricultural Researchers: A Review of the Role of African Universities, by Nienke M. Beintema, Philip G. Pardey, and Johannes Roseboom, August 1998.

37 The Changing Organizational Basis of African Agricultural Research, by Johannes Roseboom, Philip G. Pardey, and Nienke M. Beintema, November 1998.
38 Research Returns Redux: A Meta-Analysis of the Returns to Agricultural R&D, by Julian M. Alston, Michele C. Marra, Philip G. Pardey, and T.J. Wyatt, November 1998.
39 Technological Change, Technical and Allocative Efficiency in Chinese Agriculture: The Case of Rice Production in Jiangsu, by Shenggen Fan, January 1999.
40 The Substance of Interaction: Design and Policy Implications of NGO-Government Projects in India, by Ruth Alsop with Ved Arya, January 1999.
41 Strategies for Sustainable Agricultural Development in the East African Highlands, by John Pender, Frank Place, and Simeon Ehui, April 1999.
42 Cost Aspects of African Agricultural Research, by Philip G. Pardey, Johannes Roseboom, Nienke M. Beintema, and Connie Chan-Kang, April 1999.
43 Are Returns to Public Investment Lower in Less-favored Rural Areas? An Empirical Analysis of India, by Shenggen Fan and Peter Hazell, May 1999.
44 Spatial Aspects of the Design and Targeting of Agricultural Development Strategies, by Stanley Wood, Kate Sebastian, Freddy Nachtergaele, Daniel Nielsen, and Aiguo Dai, May 1999.
45 Pathways of Development in the Hillsides of Honduras: Causes and Implications for Agricultural Production, Poverty, and Sustainable Resource Use, by John Pender, Sara J. Scherr, and Guadalupe Durón, May 1999.
46 Determinants of Land Use Change: Evidence from a Community Study in Honduras, by Gilles Bergeron and John Pender, July 1999.
47 Impact on Food Security and Rural Development of Reallocating Water from Agriculture, by Mark W. Rosegrant and Claudia Ringler, August 1999.
48 Rural Population Growth, Agricultural Change and Natural Resource Management in Developing Countries: A Review of Hypotheses and Some Evidence from Honduras, by John Pender, August 1999.

49 Organizational Development and Natural Resource Management: Evidence from Central Honduras, by John Pender and Sara J. Scherr, November 1999.
50 Estimating Crop-Specific Production Technologies in Chinese Agriculture: A Generalized Maximum Entropy Approach, by Xiaobo Zhang and Shenggen Fan, September 1999.
51 Dynamic Implications of Patenting for Crop Genetic Resources, by Bonwoo Koo and Brian D. Wright, October 1999.
52 Costing the Ex Situ Conservation of Genetic Resources: Maize and Wheat at CIMMYT, by Philip G. Pardey, Bonwoo Koo, Brian D. Wright, M. Eric van Dusen, Bent Skovmand, and Suketoshi Taba, October 1999.
53 Past and Future Sources of Growth for China, by Shenggen Fan, Xiaobo Zhang, and Sherman Robinson, October 1999.
54 The Timing of Evaluation of Genebank Accessions and the Effects of Biotechnology, by Bonwoo Koo and Brian D. Wright, October 1999.
55 New Approaches to Crop Yield Insurance in Developing Countries, by Jerry Skees, Peter Hazell, and Mario Miranda, November 1999.
56 Impact of Agricultural Research on Poverty Alleviation: Conceptual Framework with Illustrations from the Literature, by John Kerr and Shashi Kolavalli, December 1999.
57 Could Futures Markets Help Growers Better Manage Coffee Price Risks in Costa Rica? by Peter Hazell, January 2000.
58 Industrialization, Urbanization, and Land Use in China, by Xiaobo Zhang, Tim Mount, and Richard Boisvert, January 2000.
59 Water Rights and Multiple Water Uses: Framework and Application to Kirindi Oya Irrigation System, Sri Lanka, by Ruth Meinzen-Dick and Margaretha Bakker, March 2000.
60 Community natural Resource Management: The Case of Woodlots in Northern Ethiopia, by Berhanu Gebremedhin, John Pender and Girmay Tesfaye, April 2000.

61 What Affects Organization and Collective Action for Managing Resources? Evidence from Canal Irrigation Systems in India, by Ruth Meinzen-Dick, K.V. Raju, and Ashok Gulati, June 2000.
62 The Effects of the U.S. Plant Variety Protection Act on Wheat Genetic Improvement, by Julian M. Alston and Raymond J. Venner, May 2000.
63 Integrated Economic-Hydrologic Water Modeling at the Basin Scale: The Maipo River Basin, by M. W. Rosegrant, C. Ringler, DC McKinney, X. Cai, A. Keller, and G. Donoso, May 2000.
64 Irrigation and Water Resources in Latin America and he Caribbean: Challenges and Strategies, by Claudia Ringler, Mark W. Rosegrant, and Michael S. Paisner, June 2000.
65 The Role of Trees for Sustainable Management of Less-favored Lands: The Case of Eucalyptus in Ethiopia, by Pamela Jagger & John Pender, June 2000.
66 Growth and Poverty in Rural China: The Role of Public Investments, by Shenggen Fan, Linxiu Zhang, and Xiaobo Zhang, June 2000.
67 Small-Scale Farms in the Western Brazilian Amazon: Can They Benefit from Carbon Trade? by Chantal Carpentier, Steve Vosti, and Julie Witcover, September 2000.
68 An Evaluation of Dryland Watershed Development Projects in India, by John Kerr, Ganesh Pangare, Vasudha Lokur Pangare, and P.J. George, October 2000.
69 Consumption Effects of Genetic Modification: What If Consumers Are Right? by Konstantinos Giannakas and Murray Fulton, November 2000.
70 South-North Trade, Intellectual Property Jurisdictions, and Freedom to Operate in Agricultural Research on Staple Crops, by Eran Binenbaum, Carol Nottenburg, Philip G. Pardey, Brian D. Wright, and Patricia Zambrano, December 2000.
71 Public Investment and Regional Inequality in Rural China, by Xiaobo Zhang and Shenggen Fan, December 2000.
72 Does Efficient Water Management Matter? Physical and Economic Efficiency of Water Use in the River Basin, by Ximing Cai, Claudia Ringler, and Mark W. Rosegrant, March 2001.
73 Monitoring Systems for Managing Natural Resources: Economics, Indicators and Environmental Externalities in a Costa Rican Watershed, by Peter Hazell, Ujjayant Chakravorty, John Dixon, and Rafael Celis, March 2001.
74 Does Quanxi Matter to NonFarm Employment? by Xiaobo Zhang and Guo Li, June 2001.
75 The Effect of Environmental Variability on Livestock and Land-Use Management: The Borana Plateau, Southern Ethiopia, by Nancy McCarthy, Abdul Kamara, and Michael Kirk, June 2001.
76 Market Imperfections and Land Productivity in the Ethiopian Highlands, by Stein Holden, Bekele Shiferaw, and John Pender, August 2001.
77 Strategies for Sustainable Agricultural Development in the Ethiopian Highlands, by John Pender, Berhanu Gebremedhin, Samuel Benin, and Simeon Ehui, August 2001.
78 Managing Droughts in the Low-Rainfall Areas of the Middle East and North Africa: Policy Issues, by Peter Hazell, Peter Oram, Nabil Chaherli, September 2001.
79 Accessing Other People’s Technology: Do Non-Profit Agencies Need It? How To Obtain It, by Carol Nottenburg, Philip G. Pardey, and Brian D. Wright, September 2001.
80 The Economics of Intellectual Property Rights Under Imperfect Enforcement: Developing Countries, Biotechnology, and the TRIPS Agreement, by Konstantinos Giannakas, September 2001.
81 Land Lease Markets and Agricultural Efficiency: Theory and Evidence from Ethiopia, by John Pender and Marcel Fafchamps, October 2001.
82 The Demand for Crop Genetic Resources: International Use of the U.S. National Plant Germplasm System, by M. Smale, K. Day-Rubenstein, A. Zohrabian, and T. Hodgkin, October 2001.
83 How Agricultural Research Affects Urban Poverty in Developing Countries: The Case of China, by Shenggen Fan, Cheng Fang, and Xiaobo Zhang, October 2001.
84 How Productive is Infrastructure? New Approach and Evidence From Rural India, by Xiaobo Zhang and Shenggen Fan, October 2001.
85 Development Pathways and Land Management in Uganda: Causes and Implications, by John Pender, Pamela Jagger, Ephraim Nkonya, and Dick Sserunkuuma, December 2001.
86 Sustainability Analysis for Irrigation Water Management: Concepts, Methodology, and Application to the Aral Sea Region, by Ximing Cai, Daene C. McKinney, and Mark W. Rosegrant, December 2001.
87 The Payoffs to Agricultural Biotechnology: An Assessment of the Evidence, by Michele C. Marra, Philip G. Pardey, and Julian M. Alston, January 2002.
88 Economics of Patenting a Research Tool, by Bonwoo Koo and Brian D. Wright, January 2002.
89 Assessing the Impact of Agricultural Research On Poverty Using the Sustainable Livelihoods Framework, by Michelle Adato and Ruth Meinzen-Dick, March 2002.
90 The Role of Rainfed Agriculture in the Future of Global Food Production, by Mark Rosegrant, Ximing Cai, Sarah Cline, and Naoko Nakagawa, March 2002.
91 Why TVEs Have Contributed to Interregional Imbalances in China, by Junichi Ito, March 2002.
92 Strategies for Stimulating Poverty Alleviating Growth in the Rural Nonfarm Economy in Developing Countries, by Steven Haggblade, Peter Hazell, and Thomas Reardon, July 2002.
93 Local Governance and Public Goods Provisions in Rural China, by Xiaobo Zhang, Shenggen Fan, Linxiu Zhang, and Jikun Huang, July 2002.
94 Agricultural Research and Urban Poverty in India, by Shenggen Fan, September 2002.
95 Assessing and Attributing the Benefits from Varietal Improvement Research: Evidence from Embrapa, Brazil, by Philip G. Pardey, Julian M. Alston, Connie Chan-Kang, Eduardo C. Magalhães, and Stephen A. Vosti, August 2002.
96 India’s Plant Variety and Farmers’ Rights Legislation: Potential Impact on Stakeholders Access to Genetic Resources, by Anitha Ramanna, January 2003.
97 Maize in Eastern and Southern Africa: Seeds of Success in Retrospect, by Melinda Smale and Thom Jayne, January 2003.

98 Alternative Growth Scenarios for Ugandan Coffee to 2020, by Liangzhi You and Simon Bolwig, February 2003.
99 Public Spending in Developing Countries: Trends, Determination, and Impact, by Shenggen Fan and Neetha Rao, March 2003.
100 The Economics of Generating and Maintaining Plant Variety Rights in China, by Bonwoo Koo, Philip G. Pardey, Keming Qian, and Yi Zhang, February 2003.
101 Impacts of Programs and Organizations on the Adoption of Sustainable Land Management Technologies in Uganda, Pamela Jagger and John Pender, March 2003.
102 Productivity and Land Enhancing Technologies in Northern Ethiopia: Health, Public Investments, and Sequential Adoption, Lire Ersado, Gregory Amacher, and Jeffrey Alwang, April 2003.
103 Animal Health and the Role of Communities: An Example of Trypanasomosis Control Options in Uganda, by Nancy McCarthy, John McDermott, and Paul Coleman, May 2003.
104 Determinantes de Estrategias Comunitarias de Subsistencia y el uso de Prácticas Conservacionistas de Producción Agrícola en las Zonas de Ladera en Honduras, Hans G.P. Jansen, Angel Rodríguez, Amy Damon, y John Pender, Juno 2003.
105 Determinants of Cereal Diversity in Communities and on Household Farms of the Northern Ethiopian Highlands, by Samuel Benin, Berhanu Gebremedhin, Melinda Smale, John Pender, and Simeon Ehui, June 2003.
106 Demand for Rainfall-Based Index Insurance: A Case Study from Morocco, by Nancy McCarthy, July 2003.
107 Woodlot Devolution in Northern Ethiopia: Opportunities for Empowerment, Smallholder Income Diversification, and Sustainable Land Management, by Pamela Jagger, John Pender, and Berhanu Gebremedhin, September 2003.
108 Conservation Farming in Zambia, by Steven Haggblade, October 2003.
109 National and International Agricultural Research and Rural Poverty: The Case of Rice Research in India and China, by Shenggen Fan, Connie Chan-Kang, Keming Qian, and K. Krishnaiah, September 2003.
110 Rice Research, Technological Progress, and Impacts on the Poor: The Bangladesh Case (Summary Report), by Mahabub Hossain, David Lewis, Manik L. Bose, and Alamgir Chowdhury, October 2003.
111 Impacts of Agricultural Research on Poverty: Findings of an Integrated Economic and Social Analysis, by Ruth Meinzen-Dick, Michelle Adato, Lawrence Haddad, and Peter Hazell, October 2003.
112 An Integrated Economic and Social Analysis to Assess the Impact of Vegetable and Fishpond Technologies on Poverty in Rural Bangladesh, by Kelly Hallman, David Lewis, and Suraiya Begum, October 2003.
113 Public-Private Partnerships in Agricultural Research: An Analysis of Challenges Facing Industry and the Consultative Group on International Agricultural Research, by David J. Spielman and Klaus von Grebmer, January 2004.
114 The Emergence and Spreading of an Improved Traditional Soil and Water Conservation Practice in Burkina Faso, by Daniel Kaboré and Chris Reij, February 2004.
115 Improved Fallows in Kenya: History, Farmer Practice, and Impacts, by Frank Place, Steve Franzel, Qureish Noordin, Bashir Jama, February 2004.
116 To Reach The Poor – Results From The ISNAR-IFPRI Next Harvest Study On Genetically Modified Crops, Public Research, and Policy Implications, by Atanas Atanassov, Ahmed Bahieldin, Johan Brink, Moises Burachik, Joel I. Cohen, Vibha Dhawan, Reynaldo V. Ebora, José Falck-Zepeda, Luis Herrera-Estrella, John Komen, Fee Chon Low, Emeka Omaliko, Benjamin Odhiambo, Hector Quemada, Yufa Peng, Maria Jose Sampaio, Idah Sithole-Niang, Ana Sittenfeld, Melinda Smale, Sutrisno, Ruud Valyasevi, Yusuf Zafar, and Patricia Zambrano, March 2004
117 Agri-Environmental Policies In A Transitional Economy: The Value of Agricultural Biodiversity in Hungarian Home Gardens, by Ekin Birol, Melinda Smale, And Ágnes Gyovai, April 2004.
118 New Challenges in the Cassava Transformation in Nigeria and Ghana, by Felix Nweke, June 2004.
119 International Exchange of Genetic Resources, the Role of Information and Implications for Ownership: The Case of the U.S. National Plant Germplasm System, by Kelly Day Rubenstein and Melinda Smale, June 2004.
120 Are Horticultural Exports a Replicable Success Story? Evidence from Kenya and Côte d’Ivoire, by Nicholas Minot and Margaret Ngigi, August 2004.
121 Spatial Analysis of Sustainable Livelihood Enterprises of Uganda Cotton Production, by Liangzhi You and Jordan Chamberlin, September 2004
122 Linkages between Poverty and Land Management in Rural Uganda: Evidence from the Uganda National Household Survey, 1999/00, by John Pender, Sarah Ssewanyana, Kato Edward, and Ephraim Nkonya, September 2004.
123 Dairy Development in Ethiopia, by Mohamed A.M. Ahmed, Simeon Ehui, and Yemesrach Assefa, October 2004.
124 Spatial Patterns of Crop Yields in Latin America and the Caribbean, by Stanley Wood, Liangzhi You, and Xiaobo Zhang, October 2004.
125 Variety Demand within the Framework of an Agricultural Household Model with Attributes: The Case of Bananas in Uganda, by Svetlana Edmeades, Melinda Smale, Mitch Renkow and Dan Phaneuf, November 2004.
126 Assessing the Spatial Distribution of Crop Production Using a Cross-Entropy Method, Liangzhi You and Stanley Wood, November 2004.
Related Documents