EPRI. Proceedings: Fourth International Conference on Cold Fusion Volume 2: Calorimetry and Materials Papers, TR-104188-V2. 1994. Lahaina, Maui, Hawaii: Electric Power Research Institute. This book is available here: http://my.epri.com/portal/server.pt?Abstract_id=TR-104188-V2 Product ID: TR-104188-V2 Sector Name: Nuclear Date Published: 7/30/1994 Document Type: Technical Report File size: 18.53 MB File Type: Adobe PDF (.pdf) Full list price: No Charge This Product is publicly available The LENR-CANR.org version of the book (this file) is 20 MB, and it is in “text under image” or “searchable” Acrobat format.

Welcome message from author
This document is posted to help you gain knowledge. Please leave a comment to let me know what you think about it! Share it to your friends and learn new things together.
Transcript

EPRI. Proceedings: Fourth International Conference on Cold Fusion Volume 2: Calorimetry andMaterials Papers, TR-104188-V2. 1994. Lahaina, Maui, Hawaii: Electric Power Research Institute.
This book is available here:
http://my.epri.com/portal/server.pt?Abstract_id=TR-104188-V2
Product ID: TR-104188-V2 Sector Name: Nuclear
Date Published: 7/30/1994 Document Type: Technical Report
File size: 18.53 MB File Type: Adobe PDF (.pdf)
Full list price: No Charge
This Product is publicly available
The LENR-CANR.org version of the book (this file) is 20 MB, and it is in “text under image” or“searchable” Acrobat format.
EPRIElectric PowerResearch Institute
Keywords:DeuteriumPalladiumCold fusionElectrolysisHeatHeavy water
EPRI TR-104188-V1Project 3170ProceedingsJuly 1994
Proceedings: Fourth InternationalConference on Cold FusionVolume 2: Calorimetry and MaterialsPapers
Prepared byElectric Power Research institutePalo Alto, California

Proceedings: Fourth International Conference on Cold Fusion Volume 2: Calorimetry and Materials Papers
TR-104188-V2
Proceedings, July 1994
December 6-9, 1993 Lahaina, Maui, Hawaii
Conference Co-chairmen T.O. Passell Electric Power Research Institute
M.C.H. McKubre SRI International
Prepared by ELECTRIC POWER RESEARCH INSTITUTE 3412 Hillview Avenue Palo Alto, Califomia 94304
Sponsored by Electric Power Research Institute Palo Alto, Califomia
T.O. Passell Nuclear Power Group
and
Office of Naval Research Arlington, Virginia
R. Nowak

DISCLAIMER OF WARRANTIES AND LIMITATION OF LIABILITIES
THIS REPORT WAS PREPARED BY THE ORGANIZATION(S) NAMED BELOW AS AN ACCOUNT OF WORK SPONSORED OR COSPONSORED BY THE ELECTRIC POWER RESEARCH INSTITUTE, INC. (EPRI). NEITHER EPRI, ANY MEMBER OF EPRI, ANY COSPONSOR, THE ORGANIZATION(S) NAMED BELOW, NOR ANY PERSON ACTING ON BEHALF OF ANY OF THEM:
(A)MAKES ANY WARRANTY OR REPRESENTATION WHATSOEVER, EXPRESS OR IMPLIED, (I) WITH RESPECT TO THE USE OF ANY INFORMATION, APPARATUS, METHOD, PROCESS, OR SIMILAR ITEM DISCLOSED IN THIS REPORT, INCLUDING MERCHANTABILITY AND FITNESS FOR A PARTICULAR PURPOSE, OR (II) THAT SUCH USE DOES NOT INFRINGE ON OR INTERFERE WITH PRIVATELY OWNED RIGHTS, INCLUDING ANY PARTY'S INTELLECTUAL PROPERTY, OR (III) THAT THIS REPORT IS SUITABLE TO ANY PARTICULAR USERS CIRCUMSTANCE; OR
(B)ASSUMES RESPONSIBILITY FOR ANY DAMAGES OR OTHER LIABILITY WHATSOEVER (INCLUDING ANY CONSEQUENTIAL DAMAGES, EVEN IF EPRI OR ANY EPRI REPRESENTATIVE HAS BEEN ADVISED OF THE POSSIBILITY OF SUCH DAMAGES) RESULTING FROM YOUR SELECTION OR USE OF THIS REPORT OR ANY INFORMATION, APPARATUS, METHOD, PROCESS, OR SIMLAR ITEM DISCLOSED IN THIS REPORT.
ORGANVATION(S) THAT PREPARED THIS REPORT: ELECTRIC POWER RESEARCH INSTITUTE PALO ALTO, CAUFORNIA
Electric Power Research Institute and EPRI are registered service marks of Electric Power Research Institute, Inc.
Copyright 0 1994 Electric Power Research Institute, Inc. All rights reserved.
ORDERING INFORMATION
Requests for copies of this report should be directed to the EPRI Distribution Center, 207 Coggins Drive, P.O. Box 23205, Pleasant Hill, CA 94523, (510) 934-4212. There is no charge for reports requested by EPRI member utilities.

FOREWORD
These four volumes include the full text or, in five cases, just the visual materials of papers presented at the Fourth International Conference on Cold Fusion. This meeting was the latest in a series of conferences devoted to a new area of scientific endeavor, variously called, "Deuterated Metals Research", "Anomalous Nuclear Phenomena in Solids", and "Research on New Hydrogen Energy". The first three conferences were held in Salt Lake City, Utah, (U.S.A)., Como, (Italy), and Nagoya, (Japan), in March, 1990, June, 1991, and October 1992, respectively. The authors and participants in this fourth conference should be thanked for four days of stimulating presentations and discussions. A conscious effort was made to maintain a high standard of scientific content and avoid exaggerated claims propagated by various public media. It is gratifying that this effort was largely successful without the need for extraordinary measures.
A number of new experimental approaches were evident compared with the Nagoya meeting. Use of ceramic proton conductors at high temperature was one such. Another was the use of ultrasonic cavitation in heavy water to load palladium and titanium foils with deuterium. Many theoretical papers were given, with some progress evident toward explaining some of these puzzling experimental observations. However, the wide range of theoretical models and speculations shows that the field remains in an exploratory phase, at least for the majority of theorists.
The use or concurrent sessions for the first time caused some attendees to miss hearing significant papers. It is hoped that this compendium of papers will serve to redress that shortcoming. Proceedings, including only those papers passing a rigorous peer review, will appear later as a publication of the American Nuclear Society's Fusion Technology Journal, thanks to the initiative of Editor George Miley.
242 persons from 12 countries registered and attended the conference. The hotel facility and the weather were such as to allow concentration on the technical meetings without serious distraction. Attendees included 124 from the United States, 62 from Japan, 19 from Italy, 11 from Russia, 10 from France, 5 from Canada, 4 from China, 2 from Switzerland, 2 from Germany, and 1 each from Spain. India, and England. A large number of interested persons from the former Soviet Union and eastern Europe were unable to attend but sent several papers that are included in these volumes.

Some 156 abstracts were originally submitted of which 125 papers appear in these proceedings. Since some of the enclosed material is in an unfinished state, the authors would appreciate being contacted by those who desire to reference the work reported here. The papers are divided so that Volume 1 contains all the papers received from authors who participated in the four plenary sessions, Volume 2 includes contributed papers on calorimetry and materials, Volume 3 has contributions on nuclear particle detection and measurement, and Volume 4 contains the papers contributed on theory and special topics. The papers are ordered in the same order of abstracts in the two volumes distributed at the meeting, with a few minor exceptions.
Thanks are due to the International Advisory and the Organizing Committees for their supportive efforts in arranging a successful meeting on such a controversial, yet potentially significant and hence absorbing, topic. Persons particularly active in arranging the agenda were M.C.H. McKubre, S. Crouch-Baker, D. Rolison, T. Clavtor, H. Ikegami, and P. Hagelstein. I also wish to thank the following persons who ably served as session chairmen or co-chairmen during the meeting: M. Srinivasan, S. Smedley, P. Hagelstein, F. Tanzella, A. Miller, D. Rolison, S. Crouch-Baker, M. McKubre, K. Kunimatsu, E. Storms, F. Will, T. Claytor, F. Scaramuzzi, H. Ikegami, J. Bockris, G. Miley, B. Liaw, A. Takahashi, J. Cobble and M. Rabinowitz.
Supporting the logistical and physical arrangements were EPRI and the Office of Naval Research (ONR), represented by L. Nelson and R. Nowak respectively. Cosponsoring the meeting in addition to EPRI and ONR, was Comitato Nationale per la Ricerca e per io Sviluppo dell'Energia Nucleare e Belle Energie Alternative (ENEA), represented by Franco Scaramuzzi. My sincere gratitude goes out to these persons and organizations. Many other organizations implicitly supported the meeting by funding the travel of a number of attendees. Notable among these were ENECO with 21, NEDO with 26, and IMRA with 10 attendees respectively.
The search for a definitive signature of some nuclear reaction correlated with the production of excess heat in the palladium-deuterium system was advanced by the presentations of D. Cozzi, G. Gigli, and M. Miles and their respective coworkers who reported measuring He 4 in the vapor phase of both closed and open electrochemical cells. However, the concentrations observed were at levels well below the atmospheric concentration of He 4 (5.2 ppmv) and hence are not robustly above criticism as possible atmospheric air contamination. On the other hand, the tritium results of F. Will and coworkers appear robust, with great care taken to establish reliable backgrounds and checking for contamination. .1 also found the tritium results of T. Clavtor and coworkers convincing.

M. Fleischmann, S. Pons, and coworkers provided two papers elaborating the excess heat phenemena: one of the more intriguing results was the excess heat observed well after complete cessation of current flow due to evaporative loss of electrolyte in "boil-off" experiments of the kind first described at the Nagoya meeting.
Several papers using gas loading of palladium claimed evidence of nuclear reaction products. Y. Iwamura and coworkers appear to have replicated the experiment reported by E. Yamaguchi and his NTT coworkers at Nagoya, but emphasizing neutrons and a mass 5 peak in the mass spectrum tentatively assigned to the TD molecule.
The paper chosen by M. Fleischmann in the final panel session as the most outstanding of the conference was by D. Cravens, who on a very modest budget, had discovered many of the better methods for loading palladium with deuterium to high levels and getting the excess heat phenomenon.
Insight into the loading of hydrogen and deuterium into metals was provided by four excellent papers by R. Huggins, R. Oriani, K. Kunimatsu and coworkers, and F. Cellani and coworkers, respectively.
Particularly insightful papers on the theoretical side were presented by R. Bush, S. Chubb, P. Hagelstein, G. Hale, S. Ichimaru, Y. Kim, X. Li, G. Preparata, M. Rabinowitz, A. Takahashi, and J. Vigier .
A thoughtful paper by J. Schwinger was read by E. MaHove at a special evening session. Also, E. Storms gave an excellent summation of the meeting in the final panel session.
I apologize in advance for failing to mention here results from many other equally excellent and significant papers given at the conference.
I agree with and echo H. Ikegami's remarks in the preface of the Nagoya meeting proceedings, It is my belief that cold fusion will become one of the most important subjects in science, one for which we have been working so patiently, with dedication and with courage, for future generations, for those who will live in the twenty-first century. In order to achieve our goal, our ultimate goal, we must continue and extend our interdisciplinary and international collaboration".
The International Advisory and Organizing Committees met late in the sessions to set the location of the next two meetings. For the next meeting April 9 - 13, 1995) Monaco (near \ice, France) \vas chosen, and in 1996,
Beijing, China.
Besides Linda Nelson of EPRI who ably handled the logistics before and at the Conference, S. Creamer of SRI International and E. Lanum of EPRI deserve our thanks for dealing with on-site issues that arise at every large gathering such as this.
I acknowledge with thanks the support of my colleagues at EPRI in planning and organizing this meeting, namely N. Ferris, L. Fielder, K. Werfelman, S. Ennis, B. Klein, R. Claeys, T. Schneider, F. Will, J. Byron, A. Rubio, R. Shaw, R. Jones, J. Taylor, K. Yeager, and R. Balzhiser.
Thomas 0. Passe11, Editor Electric Power Research Institute June 1994

International Advisory Committee
J.0'M. Bockris (USA) H. Ikegami (Japan) X.Z. Li (China) G. Preparata (Italy) F. Scaramuzzi (Italy) A. Takahashi (Japan) M. Fleischmann (U.K.) K. Kunimatsu (Japan) S. Pons (France) C. Sanchez (Spain) M. Srinivasan (India) D. Thompson (U.K.)


VOLUME 2
CALORIMETRY AND MATERIALS PAPERS
TABLE OF CONTENTS
J. O'M. Bockris, R. Sundaresan, D. Letts, and Z. Minevski, "Triggering of Heat and Sub-Surface Changes in Pd-D Systems" 1-1
H. Miyamaru, Y. Chimi, T. Inokuchi, and A. Takahashi, "Search for Nuclear Products of Cold Fusion" 2-1
M. Okamoto, Y. Yoshinaga, M. Aida, and T. Kusunoki, "Excess Heat Generation, Voltage Deviation, and Neutron Emission in D2O-LiOD Systems" 3-1
E. Storms, "Some Characteristics of Heat Production Using the "Cold Fusion" Effect" 4-1
K. Ota, H. Yoshitake, 0. Yamazaki, M. Kuratsuka, K. Yamaki, K. Ando, Y. Iida, and N. Kamiya, "Heat Measurement of Water Electrolysis Using Pd Cathode and the Electrochemistry" 5-1
M. Miles and B. Bush, "Heat and Helium Measurements in Deuterated Palladium" 6-1
P. Handel, "Subtraction of a New Thermo-Electromechanical Effect from the Excess Heat, and the Emerging Avenues to Cold Fusion" 7-1
S. Pons and M. Fleischmann, "Heat After Death" 8 - 1
G. Miley, "Comments About Nuclear Reaction Products" 9-1
M. Melich and W. Hansen, "Back to the Future: The Fleischmann-Pons Effect in 1994" 10-1
W. Hansen and M. Melich, "Pd/D Calorimetry - The Key to the F/P Effect and a Challenge to Science" 11-1
J. Waisman and N. Kertamus, "Excess Heat: The Macro Principles" 12-1
R. Bush and R. Eagleton, "Calorimetric Studies for Several Light Water Electrolytic Cells With Nickel Fibrex Cathodes and Electrolytes with Alkali Salts of Potassium, Rubidium, and Cesium" 13-1

T. Mizuno, M. Enyo, T. Akimoto, and K. Azumi, "Anomalous Heat Evolution from SrCeO3-Type Proton Conductors During Absorption/Desorption of Deuterium in Alternating Electric Field" _ 14-1
H. Ramamurthy, M. Srinivasan, V. Mukherjee, and P. Adibabu, "Further Studies on Excess Heat Generation in Ni-H20 Electrolytic Cells" 15-1
M. Swartz, "A Method to Improve Algorithms Used to Detect Steady State Excess Enthalpy" 16-1
Q. Zhang, Q. Gou, Z. Zhu, J. Lou, F. Liu, J. S., B. Miao, A. Ye, and S. Cheng, The Excess Heat Experiments on Cold Fusion in a Titanium Lattice" 17-1
D. Cravens, "Factors Affecting the Success Rate of Heat Generation in CF Cells" 18-1
M. Swartz, "Some Lessons from Optical Examination of the PFC Phase-II Calorimetric Curves" 19-1
H. Ransford III, and S. Pike, "Apparatus for Safely Extending Cold Fusion • Investigations to High Temperature, Pressure, and Input Power Regimes" 20-1
S. Barrowes, and H. Bergeson, "Linear, High-Precision, Redundant Calorimeter" 21-1
M. Hugo, ''A Home Cold Fusion Experiment" 22-1
T.Aoki, Y. Kurata, H. Ebihara, N. Yoshikawa, "Study of Concentrations of Helium and Tritium in Electrolytic Cells with Excess Heat Generations" 23-1
Y. Bazhutov, Y. Chertov, A. Krivoshein, Y. Skuratnik, and N. Khokhlov, "Excess Heat Observation During Electrolysis of CsCO3 Solution in Light Water" 24-1
J. Dash, G. Noble, and D Diman, "Surface Morphology and Microcomposition of Palladium Cathodes After Electrolysis in Acidified Light and Heavy Water: Correlation with Excess Heat . 25-1
R. Huggins, "Materials Aspects of the Electrochemical Insertion of Hydrogen and Deuterium into Mixed Conductors" 26-1
H. Okamoto and S. Nezu, "Measurements of Hydrogen Loading Ratio of Pd Anodes Polarized in LiH-LiC1-KC1 Molten Salt Systems" 27-1
S. Miyamoto, K. Sueki, K. Kobayashi, M. Fujii, M. Chiba, H. Nakahara, T. Shirakawa, T. Kobayashi, M. Yanokura, and M. Aratani, "Movement of Li During Electrolysis of 0.1M-LiOD/D20 Solution" 28-1

L.Bertalot, F. DeMarco, A. DeNinno, R. Felici, A. LaBarbera, F. Scaramuzzi, and V. Violante, "Deuterium Charging in Palladium by the Electrolysis of Heavy Water: Measurement of the Lattice Parameter" 29-1
B. Liaw and Y. Ding, "Charging Hydrogen into Ni in Hydride-Containing Molten Salts" 30-1
S. Nezu and T. Sano, "Measurements of Hydrogen Loading Ratio of Pd Electrodes Cathodically Polarized in Aqueous Solutions" 31-1
E. Criddle, "Evidence of Agglomerization and Syneresis in Regular and Excess Heat Cells in Water" 32-1
M. Swartz, "Isotopic Fuel Loading Coupled to Reactions at an Electrode" 33-1


TRIGGERING OF HEAT AND SUB-SURFACE CHANGES IN
Pd-D SYSTEMS
J.0 1 M.Bockris, R.Sundaresan, D.Letts and Z.Minevski
Department of Chemistry, Texas A&M University College Station, Texas, 77843
16 December, 1993

TRIGGERING OF HEAT AND SUB-SURFACE CHANGES IN
Pd-D SYSTEMS
J. O'M. Bockris, R. Sundaresan, Z. Minevski, & D. Letts
Deparment of Chemistry, Texas A&M University, College Station, Texas 77843
INTRODUCTION
More than four years after the first reports of chemically stimulated nuclear reactions, the triggering of heat evolution and the production of associated nuclear debris is still a highly uncertain matter. This is so both as to the duration of the switch-on time and, indeed, whether a given electrode will commence to show nuclear activity within 500 hours of the beginning of electrolysis.'
In the present study, 3 methods of triggering anomalous heat are described;the changes in the sub-surface of palladium during the evolution of D, or H z are described as a function of potential. temperature and time.
Finally, these results are brought up against the present theories of heat production in metals.
1. EXPERIMENTAL 1.1. Electrochemical Stimulation
Hodko and Bockris (1) presented a pulsing study in the 1991 Meeting in Como. In that study, emptying and filling the electrode with D (D/Pd from 0.3 to o.83) gave rise to the initiation of heat bursts. The present study examines the efficacy of the Takahashi conditions.
Electrolysis Cell : The cell was made of plexiglass of 5 mm thickness. It had outer dimensions of 120 mm x 75 mm x 100 mm. It was provided with a lid of the same material with provisions for introducing the electrodes. cooling coil , etc.. The cell housed a glass cooling coil with six spirals through which chilled water maintained at 20±0.01°C in an external cooling system (Hulce, Model A81 ) was circulated at a constant rate of —5 liters per minute to cool the electrolyte. This arrangement ensured an efficient exchange of heat between the electrolyte (source of heat) and the chilled water coils(sink). Thermal equilibrium was reached within 30 or 40 minutes.
Electrodes : A 1 mm thick. 25 mm square plate of palladium metal served as the cathode. This material was received as a gift from Tanaka Kikinzoku Kogyo, Japan, and was similar to the Pd used by Takahashi (2). The material was 99.97% pure Pd. It was used as such without pretreatment, supported by two small polyethylene blocks on either side, and surrounded by an anode of 0.5 mm thick platinum wire (Johnson Matthey, Puratronic Grade) which was wound round the blocks ( 6 turns with —5 mm pitch ) keeping the anode-cathode distance at —10 mm at both sides. The platinum contact wire to the cathode and the platinum anode lead wire were both covered with Teflon tape to ensure electrical isolation. The electrolyte was 0.29 M LiOD, obtained by dissolving lithium metal ( Johnson Matthew, USA. 99.9% pure ) in ID,0 (ISOTEC. Inc., USA, 99.9 atom percent pure ) in an atmosphere of argon. Fig.l. depicts the assembly.
Power Supply : A constant current assembly was used.
An arbitrary time at which the examination of an electrode is often terminated
1-2

Electrolysis Conditions : The cell was filled with 650 ml of electrolyte. The level was kept at 1 cm below the top of the cell. A thermometer was placed near the cooling coil and a thermistor (matched earlier with the thermometer ) in between the electrode. assembly and the cooling coil. A thermistor thermometer ( Omega, USA ), with both analog and digital readout was used to record the temperature of the electrolyte during the experiment. The electrolyte level was maintained to within 1 cm of the initial level by replenishing periodically with D 20. A 1 ml sample was withdrawn every 2 or 3 days to check for tritium. The temperature in the laboratory remained at 20*1°C, except for a period of about 10 days when there was a breakdown in the temperature control and measurements were not taken.
The experimental procedure involved a 'preloading phase' employing a saw-tooth current mode. The current was cycled linearly from 0.25 A to 4.2 A (0.02 - 0.336 A.cm -2) in a 20 minute period. This was continued for 9 days. After this,'the measurement phase' was carried out in the Low- High EL-H] current mode, in which the current was kept constant at 0.25 A and 4.2 A alternately for 6 hour periods. The current cycling modes are shown in Fig.2. The experiment was carried out over a 61-day duration.
Calibration procedure for excess heat calculation: Calibration by Joule heating was adopted. The experiment was,therefore, started with an initial test operation. Currents of 1A, 3A and 5A were passed through the cell for 40 minutes each and the electrolyte temperature and cell voltages noted. Assuming that there was no excess heat generation at this stage of the experiment, the temperature rise, AT, during this period was taken as a measure of the calorimeter calibration. A temperature increase (AT) of 4.70 °C was recorded for 50W Joule heating. The "zero power" line, corresponding to 20 ° C, was taken as constant in view of the steady room temperature. A value of 0.094°C was thus obtained for AT per watt input power over the experimental range.
Determination of the D/Pd ratio: The degree of loading of deuterium into palladium was monitored 'in situ' by means of four probe resistivity measurements. Four platinum leads were spot-welded to the cathode at appropriate locations and the resistance was continuously recorded by means of a digital micro-ohmmeter(Model DMO-350, Tacrad Inc., Canada) and stored into a IBM-286 compatible computer. The ratio of the initial resistance, R 0 , before the electrolysis to the resistance,R, at any time during the experiment was plotted against time. To calculate the value of D/Pd from this plot, use was made of a previously constructed calibration graph of RJR, vs. D/Pd[in which the D/Pd determination had been made on the basis of coulometric measurements].
Measurement of the potential of the cathode : A luggin capillary contact tube was placed within 1 mm of the cathode and the cathode potential was measured with respect to a saturated calomel electrode(S.C.E.).
Measurement of tritium : During the experiment. the tritium activity in the electrolyte was being monitored every two or three days. A 0.5 ml sample was withdrawn, mixed with 6.5 ml of Optiphase, "HiSafe-3" scintillation cocktail and the activity of this solution was counted for 10 minutes. A Wallac 1410 Liquid Scintillation Counter was made use of for this purpose.
1.2. Radio-Frequency Stimulation Electrolysis cell: A Johnson Matthew palladium foil cathode of 99.9 % purity and dimensions 11.9
x 12.5 x 1 mm was held between two teflon holders and was surrounded by 7 turns of 20 gauge platinum wire anode (Fig.3.). This electrode assembly was contained in a 10 cm tall cylindrical glass cell of 25.4 mm internal diameter. 15 ml of 0.3 M LiOD in D 2 0 was taken in the cell for electrolysis.
The temperature was measured by means of a thermistor. The RF power was applied to the cell by means of a 20 gauge copper wire that was wound around the cell in 15 turns in a typical NMR configuration.
RF Generator: A Rohde & Schwarz generator, with a frequency range 100-1000 MHz was used in conjunction with a RF amplifier(ENI. Model 603L). The RF power(6 - 100 mW).mentioned in the experiment. is the maximum power delivered assuming 100 % coupling efficiency. The efficiency of the RF-coupling to the cell was not measured.
Measurement of heatine due to application of RF power: Prior to the stimulation experiment.
1-3

different RF power ranging from 100 mW to 1 W were applied to the cell containing 15 ml electrolyte . The rise in temperature was 5.2 ° C per Watt.
Before the RF power was coupled to the cell, the palladium cathode was charged with deuterium by carrying out the electrolysis at 0.25 A for 139 hours. The D/Pd ratio was expected to have reached > 0.8 by this procedure. At this stage, maintaining the charging current unchanged, the RF power of 6 to 30 mW was applied to the cell at 365.608 MHz.
1.3. Magnetic Stimulation The magnetic field was applied by means of two different permanent magnets:
Magnet 1: A horse shoe magnet of 200 Gauss was placed around the cell (Fig. 4.). Magnet 2: Two 1" diameter disc magnets of Neodymium were placed in attractive mode on opposite sides of the cell; the field strength was measured at the Los Alamos National Laboratory as 800 Gauss in an empty cell (Fig.5.).
This experiment was carried out at 3.5 ° C in a small refrigerator. The connecting leads were run through small holes drilled on the sides of the refrigerator which were then sealed with epoxy. The lower temperature was chosen to facilitate deuterium loading .
The cathode was 99.9 % pure Englehardt palladium which had been cold rolled. Its dimensions were 12.5 x 12.5 x 0.28 mm. It was charged with deuterium at a current of 80 mA [cell voltage was 2.64 V] in 15 ml of 0.3 M LiOD/D 20 for 48 hours before applying the magnetic stimulation. It is probable that this treatment corresponded to a D/Pd ratio of > 0.8.
1.4. Materials Science A standard three electrode electrochemical system was used in this study with Palladium as the
working electrode and Platinum as the counter electrode. Working electrodes were in the form of a foil, 50 gm x 10 mm x 5 mm, purchased from Johnson Matthey as 99.975 % pure Palladium. They were used as cathodes in the electrolysis of 0.1 M KOH or 0.1 M KOD medium with saturated calomel electrode as a reference electrode. Experiments were performed by varying the time of electrolysis and overpotential at room temperature. The potential range studied was from the reversible potential to overpotential of rl = - 1.0 V. The applied potentials were maintained for different periods of time, varying from 0.5 hour to 6 weeks.
Each experiment was carried out with a fresh electrode. Following electrolysis at certain conditions, the electrode was washed with purified water and etched in 30 % 1:1 HNO 3 + HCI mixture(3). A preliminary investigation had been carried out prior to the experiments to observe the effect of duration of etching on the depth of the surface exposed. Measurements were carried out for durations ranging from 1 to 5 minutes. After etching, the solution was analyzed by ICP and by knowing the area of etched surface it was calculated that one etching procedure corresponds to the depth of 800 A per minute. An etching time of 2.5 minutes, corresponding to 2,000 A was chosen for our investigations.The etched surfaces were then subjected to examination by means of Differential Polarization Interference Contrast Microscopy (DPICM) and Scanning Electron Microscopy (SEM).
DPICM was chosen because it is a technique capable of imaging minute surface structures in differentiating color. At magnifications of 100 and 600 that have been used in this study, it affords greater observability of patterns having dimensions of the order of c. 0.5 mm with a resolution of 2 and 0.4 1.1M. SEM was chosen due to its capability to image the surface in three dimensions (depth of field is large and there is shadow relief effect of the secondary electrons). At magnifications of 1000 and 50,000, the resolution of 0.2 and 0.004 gm affords observations of crystal grains.
The microscopy was repeated after re-etching the surface 5 successive times, up to a depth of 1
1-4
2. RESULTS
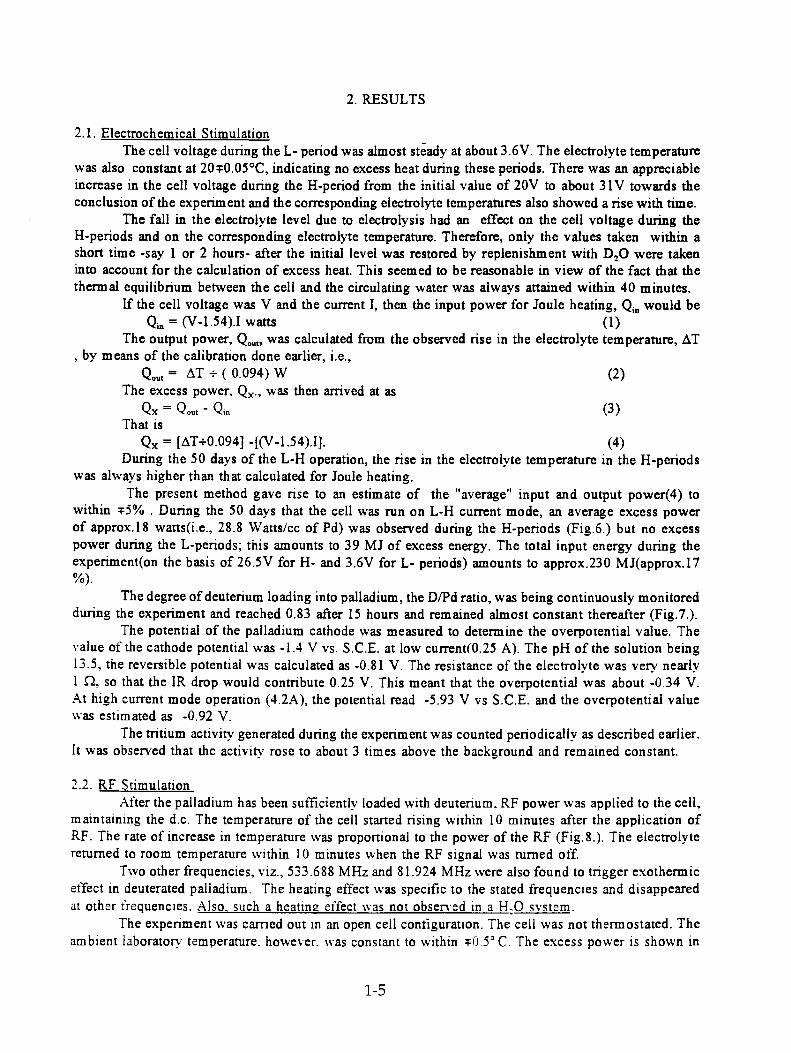
2.1. Electrochemical Stimulation The cell voltage during the L- period was almost steady at about 3.6V. The electrolyte temperature
was also constant at 20*0.05°C, indicating no excess heat during these periods. There was an appreciable increase in the cell voltage during the H-period from the initial value of 20V to about 31V towards the conclusion of the experiment and the corresponding electrolyte temperatures also showed a rise with time.
The fall in the electrolyte level due to electrolysis had an effect on the cell voltage during the H-periods and on the corresponding electrolyte temperature. Therefore, only the values taken within a short time -say 1 or 2 hours- after the initial level was restored by replenishment with D 20 were taken into account for the calculation of excess heat. This seemed to be reasonable in view of the fact that the thermal equilibrium between the cell and the circulating water was always attained within 40 minutes.
If the cell voltage was V and the current I, then the input power for Joule heating, Q in would be Q in = (V-1.54),I watts (1)
The output power, Q n„t, was calculated from the observed rise in the electrolyte temperature, AT , by means of the calibration done earlier, i.e.,
Qout ( 0.094) W (2) The excess power, Q x ., was then arrived at as
Qx = Qout - Qin (3 ) That is
Qx = [0T÷0.094] -[(V-1.54).1]. (4) During the 50 days of the L-H operation, the rise in the electrolyte temperature in the H-periods
was always higher than that calculated for Joule heating. The present method gave rise to an estimate of the "average" input and output power(4) to
within *5% . During the 50 days that the cell was run on L-H current mode, an average excess power of approx.18 watts(i.e., 28.8 Watts/cc of Pd) was observed during the H-periods (Fig.6.) but no excess power during the L-periods; this amounts to 39 MJ of excess energy. The total input energy during the experiment(on the basis of 26.5V for H- and 3.6V for L- periods) amounts to approx.230 MJ(approx.17 %).
The degree of deuterium loading into palladium, the D/Pd ratio, was being continuously monitored during the experiment and reached 0.83 after 15 hours and remained almost constant thereafter (Fig.7.).
The potential of the palladium cathode was measured to determine the overpotential value. The value of the cathode potential was -1.4 V vs. S.C.E. at low current(0.25 A). The pH of the solution being 13.5, the reversible potential was calculated as -0.81 V. The resistance of the electrolyte was very nearly 1 n, so that the IR drop would contribute 0.25 V. This meant that the overpotential was about -0.34 V. At high current mode operation (4.2A), the potential read -5.93 V vs S.C.E. and the overpotential value was estimated as -0.92 V.
The tritium activity generated during the experiment was counted periodically as described earlier. It was observed that the activity rose to about 3 times above the background and remained constant.
2.2. RF Stimulation After the palladium has been sufficiently loaded with deuterium. RF power was applied to the cell,
maintaining the d.c. The temperature of the cell started rising within 10 minutes after the application of RF. The rate of increase in temperature was proportional to the power of the RF (Fig.8.). The electrolyte returned to room temperature within 10 minutes when the RF signal was turned off.
Two other frequencies, viz., 533.688 MHz and 81.924 MHz were also found to trigger exothermic effect in deuterated palladium. The heating effect was specific to the stated frequencies and disappeared at other frequencies. Also, such a heating effect was not observed in a H,0 system.
The experiment was carried out in an open cell configuration. The cell was not thermostated. The ambient laboratory temperature. however. was constant to within 0 . 5 ° C. The excess power is shown in
1-5
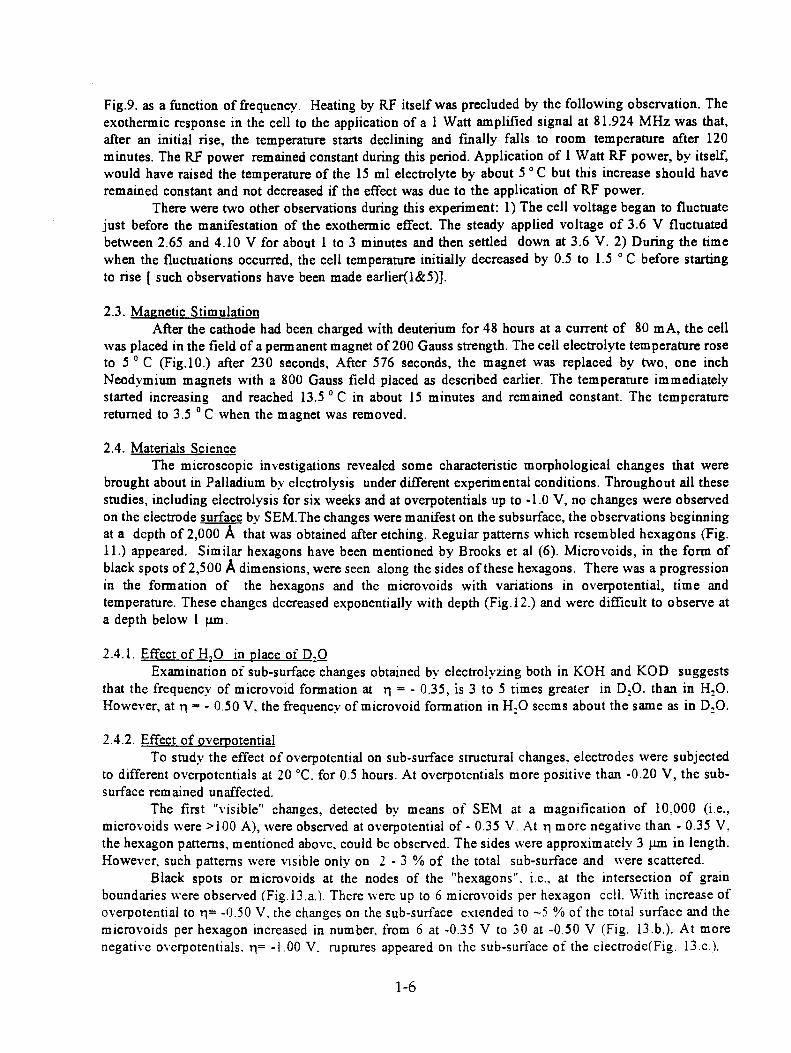
Fig.9. as a function of frequency. Heating by RF itself was precluded by the following observation. The exothermic response in the cell to the application of a 1 Watt amplified signal at 81.924 MHz was that, after an initial rise, the temperature starts declining and filially falls to room temperature after 120 minutes. The RF power remained constant during this period. Application of 1 Watt RF power, by itself, would have raised the temperature of the 15 ml electrolyte by about 5 C but this increase should have remained constant and not decreased if the effect was due to the application of RF power.
There were two other observations during this experiment: 1) The cell voltage began to fluctuate just before the manifestation of the exothermic effect. The steady applied voltage of 3.6 V fluctuated between 2.65 and 4.10 V for about 1 to 3 minutes and then settled down at 3.6 V. 2) During the time when the fluctuations occurred, the cell temperature initially decreased by 0.5 to 1.5 ° C before starting to rise [ such observations have been made earlier(1&5)].
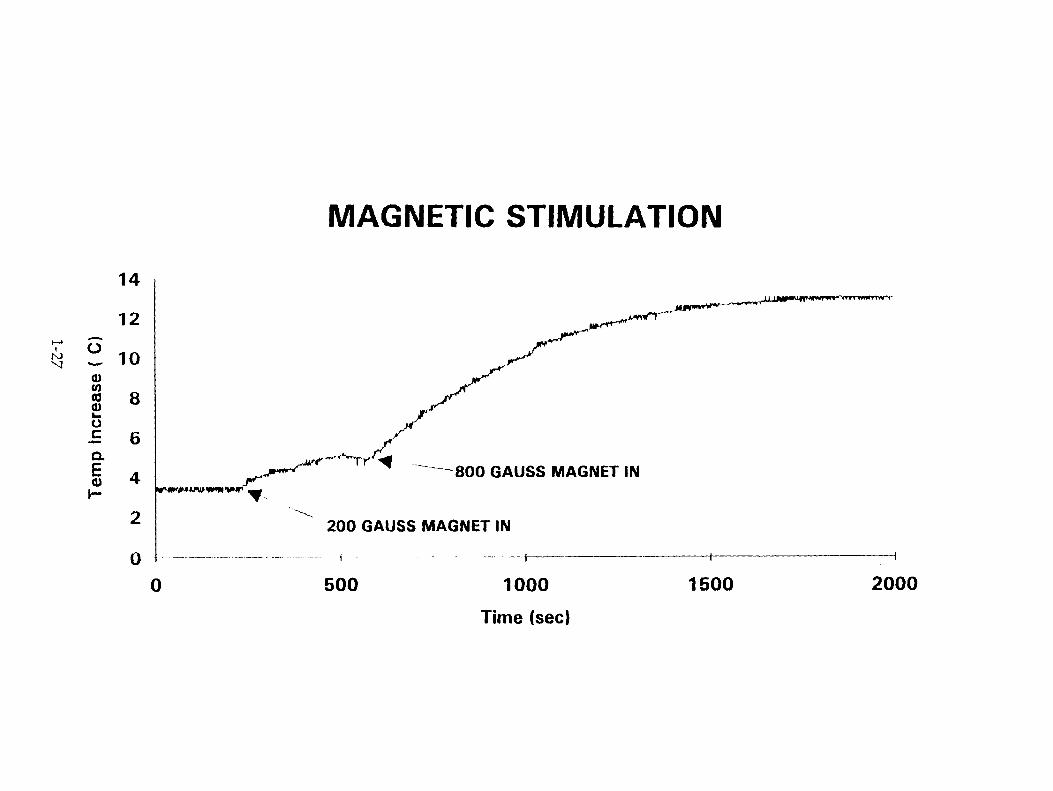
2.3. Magnetic Stimulation After the cathode had been charged with deuterium for 48 hours at a current of 80 mA, the cell
was placed in the field of a permanent magnet of 200 Gauss strength. The cell electrolyte temperature rose to 5 ° C (Fig.10.) after 230 seconds, After 576 seconds, the magnet was replaced by two, one inch Neodymium magnets with a 800 Gauss field placed as described earlier. The temperature immediately started increasing and reached 13.5 ° C in about 15 minutes and remained constant. The temperature returned to 3.5 ° C when the magnet was removed.
2.4. Materials Science The microscopic investigations revealed some characteristic morphological changes that were
brought about in Palladium by electrolysis under different experimental conditions. Throughout all these studies, including electrolysis for six weeks and at overpotentials up to -1.0 V, no changes were observed on the electrode surface by SEM.The changes were manifest on the subsurface, the observations beginning at a depth of 2,000 A that was obtained after etching. Regular patterns which resembled hexagons (Fig. 11.) appeared. Similar hexagons have been mentioned by Brooks et al (6). Microvoids, in the form of black spots of 2,500 A dimensions, were seen along the sides of these hexagons. There was a progression in the formation of the hexagons and the microvoids with variations in overpotential, time and temperature. These changes decreased exponentially with depth (Fig.12.) and were difficult to observe at a depth below 1 p.m.
2.4.1. Effect of H 20 in place of D 20 Examination of sub-surface changes obtained by electrolyzing both in KOH and KOD suggests
that the frequency of microvoid formation at I" = - 0.35, is 3 to 5 times greater in D 20. than in 11 20. However, at ri = - 0.50 V, the frequency of microvoid formation in 11,0 seems about the same as in D,O.
2.4.2. Effect of overpotential To study the effect of overpotential on sub-surface structural changes, electrodes were subjected
to different overpotentials at 20 °C. for 0.5 hours. At overpotentials more positive than -0.20 V, the sub-surface remained unaffected.
The first "visible" changes, detected by means of SEM at a magnification of 10,000 (i.e., microvoids were >100 A), were observed at overpotential of - 0.35 V. At r1 more negative than - 0.35 V, the hexagon patterns. mentioned above, could be observed. The sides were approximately 3 p.m in length. However. such patterns were visible only on 2 - 3 % of the total sub-surface and were scattered.
Black spots or microvoids at the nodes of the "hexagons". i.e., at the intersection of grain boundaries were observed (Fig.13.a.). There were up to 6 microvoids per hexagon cell. With increase of overpotential to rl= -0.50 V. the changes on the sub-surface extended to —5 % of the total surface and the microvoids per hexagon increased in number. from 6 at -0.35 V to 30 at -0.50 V (Fig. 13.b.). At more negative overpotentials. ri= -1.00 V. ruptures appeared on the sub-surface of the eiectrode(Fig. 13.c.).
1-6

Intensive and extensive ruptures appeared on the sub-surface. The intensive ruptures were — 20 p.m in size and covered approximately 7 % of the surface. Extensive ruptures were 5-10 .im in size and were distributed over — 20 % of the sub-surface. These ruptures were grouped into patches, each having the dimensions of —0.5 mm.
2.4.3. Effect of time The effects observed on the palladium electrode upon electrolysis for various periods of time are
shown in Figs. 14.a-d.. To evaluate the effect of time over the range of 0.5 hour to six weeks, an ri of -0.35 V was maintained at a constant temperature of 20 °C.
For the shortest period studied, t = 0.5 hours (Fig. 14.a.), hexagons were scattered over 2 to 3 % of the total surface. As the time was prolonged to 3 hours, the hexagons increased and tended to group together to form "islands", Fig.14.b. Each island contained between 20 and 50 unit hexagons and the hexagons spread to 10 % of the electrode area at 3 hours (Fig. 14.b.) and 20 % at 10 hours(Fig. 14.c.). Here, islands, each having between 200 and 300 hexagon units that were separated by about 20 to 25 p.m were formed and tended to "cluster" into groups.. These clusters had dimensions of the order of 500 gm and were seen about 1 mm apart . Fig. 14.d.. shows the situation after 100 hours of electrolysis.
When the Palladium electrodes were subjected to electrolysis for 6 weeks (1000 hours) the whole sub-surface was "damaged" and the hexagonal units can no longer be seen.
2.4.4. Effect of temperature Experiments were conducted at -0.35 V for 0.5 hour at 20 and 50°C ( Fig. 15.a. and b. ). Island
formation at 50 ° C resembled the behavior at n = - 1.0 V at 0.5 hours.
3. DISCUSSION
3.1.Electrochemical Stimulation The electrochemical stimulation experiment, performed in a manner similar to that of Takahashi,
shows an unmistakable generation of excess energy. As Takahashi has observed, excess heat is manifest within two days after High-Low current pulsing mode is started.There are, however, some observations that differ from those reported by Takahashi:
1. The cell voltage during the L-periods remained constant at 3.6V. The temperature of the electrolyte during these periods was close to 20 C in this experiment, suggesting no excess energy.The current during the L-periods was 0.25 A which meant that the current density was 0.02 A.cm'. Earlier observations(7 to 10) have indicated that this current density is too low to manifest excess heat. Takahashi(2), however. reports "significant temperature increases even for L-periods".
2. There was an excess energy of approx.18W during the H-periods throughout this experiment. This is lower than what is quoted by Takahashi. It is to be mentioned here that though Takahashi first reported a relative excess of —70%(2), this value was much lower(—.30%) when he repeated the experiment(4).
3. Though there was a constant excess energy during the H-periods, there was no "surface boiling" that was reported in (2); again. this effect was absent in the subsequent experiment(4).
4. The degree of loading of deuterium into the cathode was continuously monitored and its value was 0.83. Takahashi did not measure but assumed it to be —0.9. The overpotential was -0.92 V.
3.2. Pulsina and its Mechanism It has been pointed out by Gittus and Bockris (11) that the solubility of H in Pd is greater than
that of D and that. because of the relation between C, and local stress. the solubility is particularly high at dislocations. It follows that reactions which may be the origin of the heat prouction phenomenon will be likely to occur at high concentration points near dislocations within
1-7
ovR = Co e
(5)
Now, there is always some H in the solution and in an unannealed electrode; thus, H may block dislocation positions from being occupied by D. Hence, pulsing, during which the D/Pd is varied up and down, may be seen as dissolving some of the H from its blocking positions on the dislocations - it will be filled increasingly with D (Fig.16.).
This suggests that deep anodic pulsing to bring D/Pd towards zero followed by rapid cathodic pulsing to bring it up again, as shown in Fig.17 [cf.(1)], is the most likely switch-on mechanism. 3.2. Radio-Frequency Stimulation
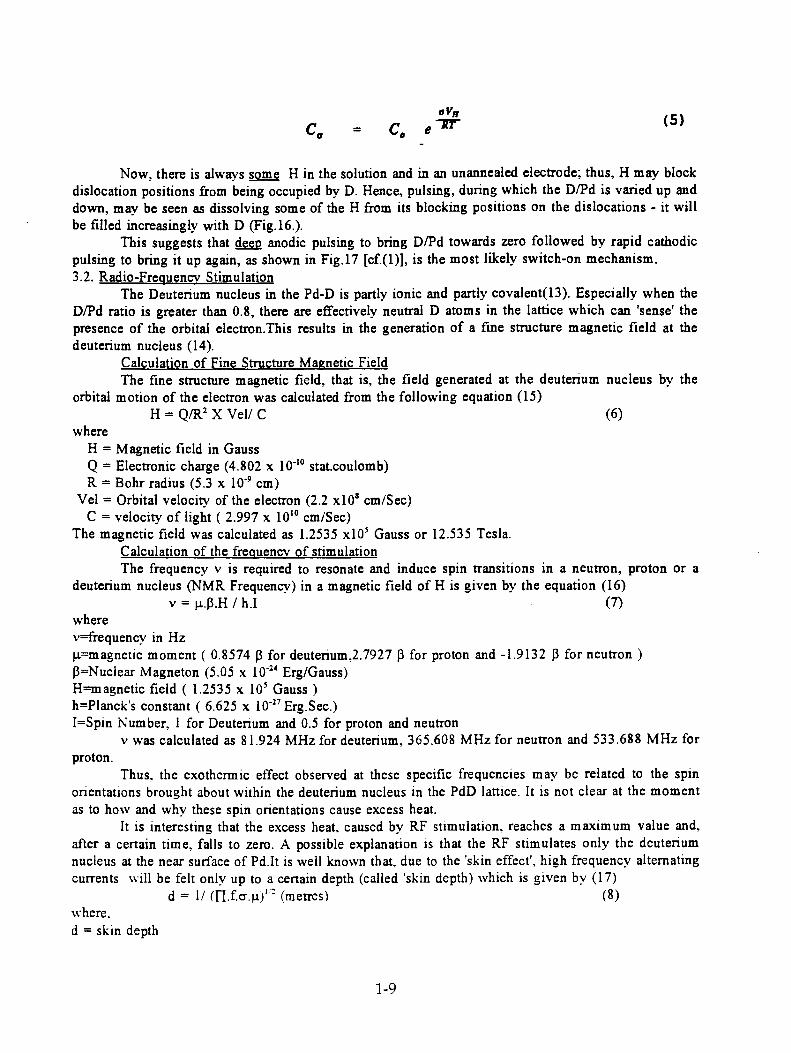
The Deuterium nucleus m the Pd-D is partly ionic and partly covalent(13). Especially when the D/Pd ratio is greater than 0.8, there are effectively neutral D atoms in the lattice which can 'sense' the presence of the orbital electron.This results in the generation of a fine structure magnetic field at the deuterium nucleus (14).
Calculation of Fine Structure Magnetic Field The fine structure magnetic field, that is, the field generated at the deuterium nucleus by the
orbital motion of the electron was calculated from the following equation (15) H = Q/R2 X Vel/ C (6)
where H = Magnetic field in Gauss Q = Electronic charge (4.802 x 10 4° stat.coulomb) R = Bohr radius (5.3 x 10 -9 cm)
Vel = Orbital velocity of the electron (2.2 x10 8 cm/Sec) C = velocity of light ( 2.997 x 10 10 cm/Sec)
The magnetic field was calculated as 1.2535 x10 5 Gauss or 12.535 Tesla. Calculation of the frequency of stimulation The frequency v is required to resonate and induce spin transitions in a neutron, proton or a
deuterium nucleus (NMR Frequency) in a magnetic field of H is given by the equation (16) v = p. 3.H / h.I (7)
where v=frequency in Hz 1.1.=magnetic moment ( 0.8574 13 for deuterium.2.7927 3 for proton and -1.9132 13 for neutron ) r3=Nuclear Magneton (5.05 x 10' 24 Erg/Gauss) H=magnetic field ( 1.2535 x 10 5 Gauss ) h=Planck's constant ( 6.625 x 10 -27 Erg.Sec.) I=Spin Number, 1 for Deuterium and 0.5 for proton and neutron
v was calculated as 81.924 MHz for deuterium, 365.608 MHz for neutron and 533.688 MHz for proton.
Thus, the exothermic effect observed at these specific frequencies may be related to the spin orientations brought about within the deuterium nucleus in the PdD lattice. It is not clear at the moment as to how and why these spin orientations cause excess heat.
It is interesting that the excess heat, caused by RF stimulation, reaches a maximum value and, after a certain time, falls to zero. A possible explanation is that the RF stimulates only the deuterium nucleus at the near surface of Pd.It is well known that. due to the 'skin effect', high frequency alternating currents will be felt only up to a certain depth (called 'skin depth) which is given by (17)
d = 1/ (17.f.a.p.) 12 (metres) (8) where. d = skin depth
1-9

= electrical conductivity of the material(mho/metre) = permeability of the material(Henry/metre)
f = frequency of the a.c.(Hz) For the frequencies that have been applied m this stimulation experiment,it can be shown that the
depth to which the RF would have been effective is only — 0.007mm (71.1.m). Summary of Observations 1) RF energy at three specific frequencies triggers exothermic effect in deuterated palladium
without the presence of an external magnetic field. 2) A similar effect is manifest in the presence of a magnetic field of 200 Gauss or greater. 3) The triggering is effective even at electrolysis current densities below 100 mA/cm 2 . 4) Sufficient deuterium charging of the palladium(D/Pd probably greater than 0.8) is a necessary
prerequisite to the triggering effect.
3.3. Materials Science 3.3.1. Initiation of subsurface damage with respect to overpotential and pressure
It is well known that a pressure theory exists for the treatment of the switch-on potential for cracking(18). The D evolved on the electrode surface is assumed to be in equilibrium with D 2 in voids. In so far as the pressure (— fugacity) in the voids exceeds the spreading pressure, the crack will spread and damage will be detectable.
In this study, damage was found to begin at an overpotential of -0.35 V(Fig.18.). In addition, the Tafel line measurements show a sharp increase in slope in this region which may be assumed to correspond to the saturation of the electrode surface and a change of mechanism to one in which the coupled discharge-chemical combination
M + D20 + e R.D.S. M—D + OD -
M—D + M—D 2M + D2 ( 1 0 )
(9)
changes to fast discharge slow chemical combination
M + D20 + e M—D + OD -
R .D. S. M—D + M—D 2M +
In the latter case. the fugacity of D, is given by
fD2 = e (13)
The condition for the beginning of damage can then be shown to be
e 1
, 16 iY, i > k - - - j 3 /
and
D2
(14)
1-10
RT ( 16 TY ) 1 (15) latt 2F
In 3 1
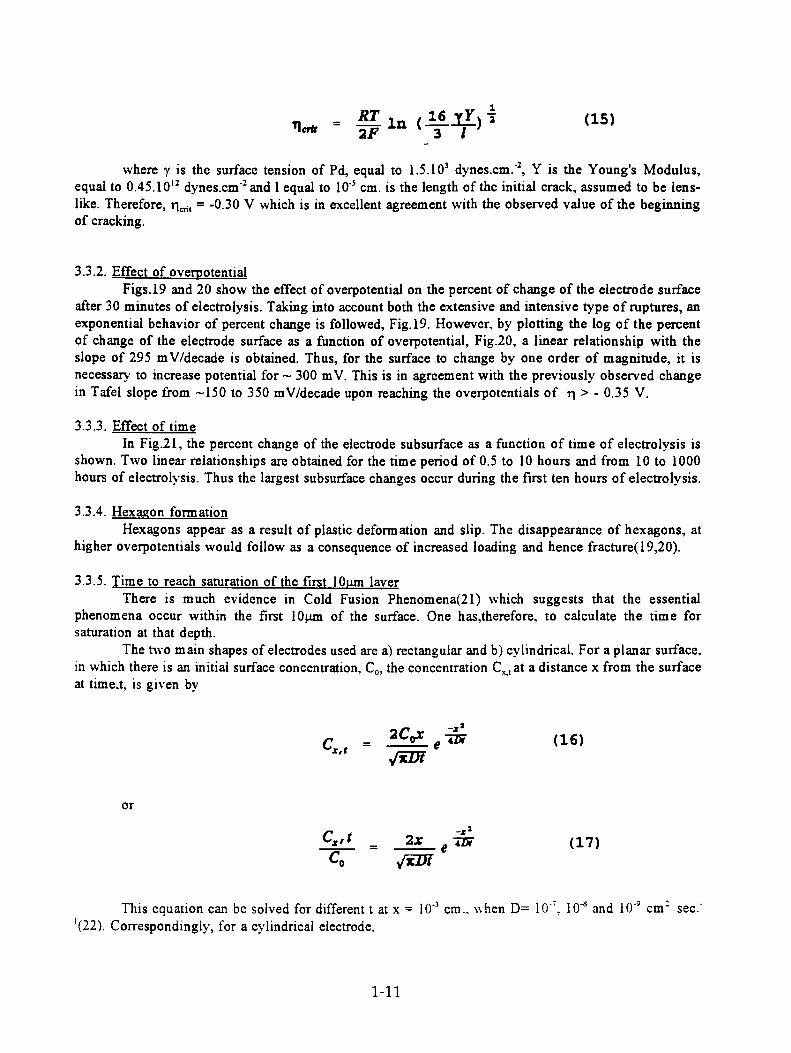
where y is the surface tension of Pd, equal to 1.5.10 3 dynes.cm."2, Y is the Young's Modulus, equal to 0.45.10 12 dynes.c&and 1 equal to 104 cm. is the length of the initial crack, assumed to be lens-like. Therefore, i cnt = -0.30 V which is in excellent agreement with the observed value of the beginning of cracking.
3.3.2. Effect of overpotential Figs.19 and 20 show the effect of overpotential on the percent of change of the electrode surface
after 30 minutes of electrolysis. Taking into account both the extensive and intensive type of ruptures, an exponential behavior of percent change is followed, Fig.19. However, by plotting the log of the percent of change of the electrode surface as a function of overpotential, Fig.20, a linear relationship with the slope of 295 mV/decade is obtained. Thus, for the surface to change by one order of magnitude, it is necessary to increase potential for — 300 mV. This is in agreement with the previously observed change in Tafel slope from —150 to 350 mV/decade upon reaching the overpotentials of 1 > - 0.35 V.
3.3.3. Effect of time In Fig.21, the percent change of the electrode subsurface as a function of time of electrolysis is
shown. Two linear relationships are obtained for the time period of 0.5 to 10 hours and from 10 to 1000 hours of electrolysis. Thus the largest subsurface changes occur during the first ten hours of electrolysis.
3.3.4. Hexagon formation Hexagons appear as a result of plastic deformation and slip. The disappearance of hexagons, at
higher overpotentials would follow as a consequence of increased loading and hence fracture(19,20).
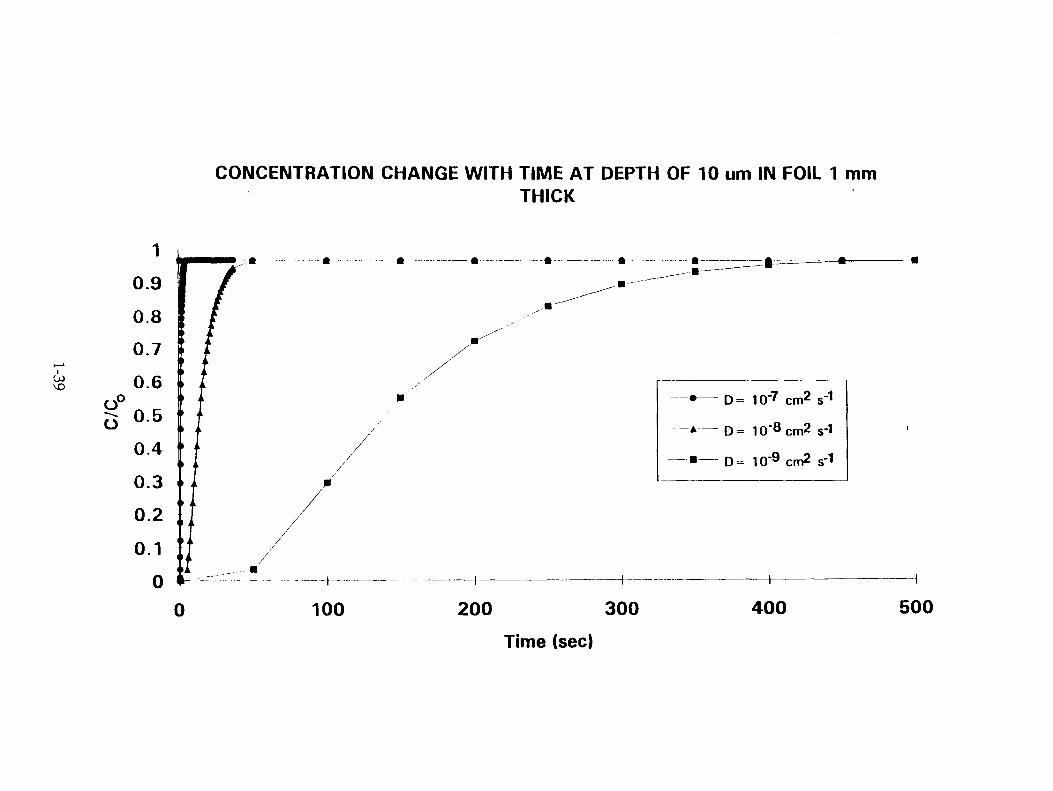
3.3.5. Time to reach saturation of the first 10itm laver There is much evidence in Cold Fusion Phenomena(21) which suggests that the essential
phenomena occur within the first 10p.m of the surface. One has,therefore, to calculate the time for saturation at that depth.
The t-wo main shapes of electrodes used are a) rectangular and b) cylindrical. For a planar surface, in which there is an initial surface concentration, C o, the concentration C c., at a distance x from the surface at time.t, is given by
This equation can be solved for different t at x = 10 -3 cm., when D= 10 -7 . 10 -8 and 10 -9 cm' sec: '(22). Correspondingly, for a cylindrical electrode,
1-11

J (2.4048—r ) _ (2.4048) a u • R2 =C — 2C0
2.4048 J1 (2 . 40 -48) (18)
where J 0 and J, are the roots of Bessel's differential equation. The concentration profiles for different times of electrolysis, calculated for both the types of electrodes, are shown in Fig.22a. and b. In fact, the switch on times are generally longer than these times shown here.
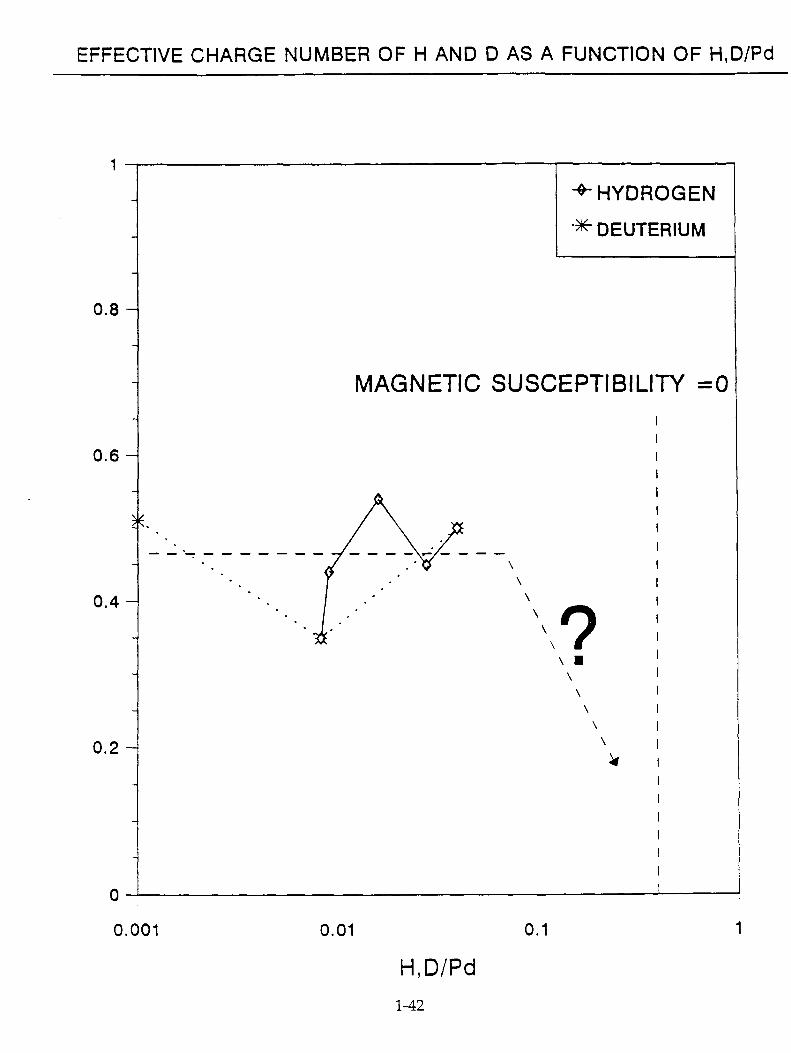
3.3.6.Electronic state of dissolved hydrogen Pure palladium is paramagnetic. A number of experimental studies(23) indicate that upon
absorption of hydrogen there is decrease in paramagnetism. Also, results of different authors (23) agree for the value of H/Pd 0.65, at which the solids become diamagnetic. Thus, after D/Pd ratio of 0.65, electrons are not filling the d-band of the host metal and magnetic susceptibility is zero. Due to this, electrons are now more localized in regard to protons. After reaching the D/Pd ratio of 0.80, all octahedral places in the lattice are occupied and those in tetrahedral positions are now available (Fig.23.). As a consequence, hydrogen is much less mobile and it can be speculated that a covalent bond between Pd and H is starting to form.
Wipf(24) has compiled some experimental data on effective charge number of hydrogen isotopes in polycrystalline Pd ( Table 1). 3.3.7. Charge on Deuterium
There are two methods of determining the charge on D. One can measure the diffusion coefficient and then (e.g., with tritium marking) obtain the mobility. The Nernst-Einstein Equation enables one to obtain the charge, Z. Alternatively, one may determine Z from the magnetic susceptibility.
There is a linear decrease of magnetic susceptibility to D/Pd = 0.65 after which the d holes are filled and the susceptibility tends to zero.
The value of Z is clearly near to 0.5 (Fig.24.) ( at low values of D/Pd and decreases as D/Pd increases. At D/Pd = 0.8, the likely value of Z from magnetic susceptibility measurements is decreasing to zero.
3.4. Theories of Cold Fusion 3.4.1. Difficulties In Cold Fusion seen by classical nuclear physicists
The difficulties are 1) penetrating the coulomb barrier, 2) the fact that nuclear and chemical processes take place at radically different frequencies (e.g., IP sec' and 10 22 sec') [referred to as "asymptotic freedom" by Preparata (25)] and 3) the Leggett-Baym(26) point, according to which the deuterium ions in the palladium lattice are further apart than they are in deuterium molecule and therefore, as the authors saw it, must remain stably apart.
As to barrier penetration, it is invalid to apply a simple Gamow formula to calculate the tunneling probability in metals as is done in the dilute plasma. Thus. in the metal the approach to collision is through an electron gas which screens the charges from each other and thus reduces the barrier. A Gamow calculation is inapplicable.
The insulation of the nucleus from chemical forces seems incompatible with the fact that Mossbauer frequencies depend upon the chemical surrounds of the nucleus.
The Leggett-Baym point is a difficulty. Even in the tetrahedral positions, the D-D distances are 1.77 A -- too large.
However. if the Gittus- Bockris hypothesis is pursued. i.e., the activity is at dislocations, the solubility is greatly enhanced and D/Pd in those areas must be >> 1. If it is >3. the tetrahedral holes are filled when the D/Pd at the dislocations exceeds 3. the only possibilities are interstitial positions when the D-D distances are are smaller.
1-12
3.4.2. Anomalous phenomena which act as criteria for the correctness of models The essential phenomena of cold fusion- small rate of production of neutrons, large rate of
production of tritium, heat more than between 10 and 109 (occasionally 1,000) watts per cc of Pd- are well known.
However, a successful theory must be consistent with the following: 1. The sporadicity of observation of the effects, 2. Switch-on is dependent upon impurities in the solution, or the metal, 3. Switch-on does not occur for times of the order of 100 hours of electrolysis.
3.4.3. Types of Theories 1. The fusion of D + D in the bulk of a metal lattice [Preparata(25);
Takahashi(27)]. 2. The fusion of D + D at promontories on the surface of the electrode
[Bockris(28); Kim(29)]. 3. Production of tritium and heat with a mechanism which involves "virtual"
neutrons [Hegelstein(30)]. 4. Transmutational reactions [Kucherov(31)].
3.4.3.1 Fusion in the bulk 3.4.3.1.a. Preparata Model (25)
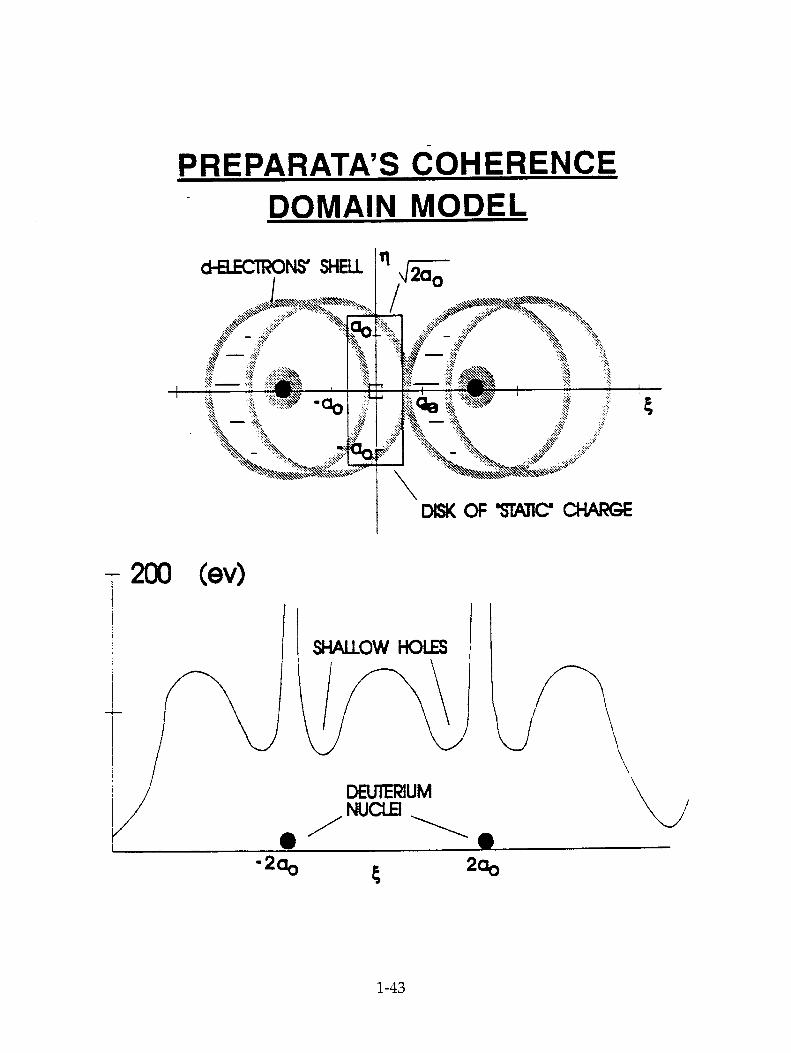
The most comprehensive attempt to give a credible theory of this is due to Preparata(25) with an application of his ideas of super radiance (particles behave in a coherent fashion within the lattice).
This theory does take notice of the electronic structure of transition metals. The model of a metal tacitly assumed by most workers is that of a series of individual (non-bonded) cations interspersed by essentially free electrons. But transition metals are bonded (32) and share electron orbits in a three dimensional manner. Preparata produces a diagram(Fig.25.) in which he utilizes the properties of the d electron level in palladium to make a rudimentary theory of such screening, and deduces therefrom a reduction in the equivalent barrier height(Jones Fusion). At this point, to increase the rate of fusion to attain the observed heat, Preparata introduces his hypothesis that there are groups of electrons (400 A) and groups of deuterons (1,000 A) which move coherently.
Such a model would give rise to extreme heating in the hot spot regions of the coherent groups and therefore destroy their structure which, in this model, is the origin of the enhanced fusion. For this reason. Preparata brings in "electron cooling,". He shows that the excess heat is "taken away" by the coherent electron groups.
Preparata's theory has the virtue of leaning upon the real electronic structure of palladium. However, after having got to the Jones limit quite rationally, it needs faith, i.e.. that the coherent groups which he assumes, must be assumed to exist. Further, it gives no interpretation of the facts brought out above as those most characteristic of cold fusion experiments, their sporadicity; their dependence upon specific surface structures and the abnormally long time they take to switch on (longer than that to reach D/Pd = 0.83 near the surface).
3.4.3.2. Surface Promontory Models The first of these was proposed in 1990 by Bockris et al.(28) on the basis that observations made
of successful electrodes showed that their surfaces possessed a dendritic structure. On this basis, a model was suggested which depended upon the high field developed at tips of
low radius of curvature [Bockris and Gonzales-Martin(33)]. Thus, the evolution of deuterium preferentially occurs at these tips and and they become
associated sporadically with bubble formation. When these bubbles attain a certain size.the high field at the tip of the dendrites then emits electrons into the deuterium in the gas containing the bubble and ionizes some of the D,. + e + D) (Fig.26.).
1-13
A zeroeth approximation theory was given by Packham, et al(34), still assuming a D+---D+ relation and a Gamow barrier. But since that time, it has been realized that the dendrite tips have ADSORBED D, which may have a zero or even a negative charge. This. model does not have a Coulomb barrier.
The theory at first seemed to be a hot fusion theory, hence consistent only with n/T=1. However,in the cluster impact work(35), there is the same high reaction rate for the tritium-proton channel and a low rate for the conventional He' + neutron level, as is observed in cold fusion. It is found here that the pre-exponential factor of the Gamow equation is 10" times larger for the low energies involved here rather than for the high ones in classical nuclear physics.
This suggestion of a preferred channel for tritium solves the principal difficulty suffered by the original dendrite theory of Bockris et al (28).
The dendrite theory has advantages over competing theories because it explains the factors which are anomalous in other models. Thus, it depends upon the surface conditions, because only some surfaces will grow dendrites. The dendrites may not consist only of palladium, they may be of other materials grown from the solution. Furthermore, the growth of dendrites would depend upon the impurities in solution, in a characteristic way as developed by Popov(36). Briefly, the rate of growth would depend exponentially upon the impurities in the solution. Irreproducibility obtains an interpretation, as do long switch-on times.
Thus, the dendrite theory not only explains the anomalous n/T ratios formation but it also gives a quanitative interpretation of the surface sensitivity, the dependence upon impurities, and the long time for delay. Such features are not possessed by any other theory.
3.4.3.3. Theory involving Neutron Transfer This theory is due to P. L. Hegelstein(30) and has a principal point as its foundation: the
Coulomb barrier is difficult to overcome without some special mechanism such as the high field arising at points of minimal curvature, so that it is clear that a mechanism which avoids it is welcome.
In Hegelstein's view, this can be achieved by assuming that neutrons from deuterons transfer to "acceptor" nuclei such as another deuteron, 6 Li, 10B or to Pd itself, entering their nuclei to produce various products including tritium (cf. Kucherov's model).
On the other hand, Hegelstein, by avoiding the coulomb barrier, involves a difficulty, namely, the distance the neutrons would have to travel to achieve the reaction which he suggests. Thus, only "virtual" neutrons are available to him and it is easy to calculate the life time of such a particle (Fig.27.).
Hagelstein's model is of great interest because it would appear to give a step towards the production of various new nuclei as observed by Kucherov. The major problem is to lengthen the life time of "virtual" neutrons by, say, 10 5 times.
3.4.3.4 Transmutational Theories Karabut, Kucherov and Savvatimova(31) have suggested a theory based upon experiments that
they have carried out in glow discharge experiments in the presence of deuterium. They observe characteristics which are similar to those which are observed in aqueous solution. excess heat, weak neutron generation. tritium and He' production, together with characteristic X-rays and weak gamma radiation.
The novel feature of their work is that they analyze their cathodes chemically, finding, of course, helium and tritium similar to the findings earlier published by Bockris et al. However. they utilize an X-ray microprobe. high resolution dipole mass spectrometry and secondary high mass spectrometry and find a host of new elements in the palladium as a result of the electrolysis. Thus, they found not only 6Li, but also several other metals from groups one and two and then also Ca. Cr, Ni, Ge,etc. These elements occur in the upper 1 micron layer of the cathode. in consistency with the concept of the surface reaction as the origin of fusion. The content of the transmuted elements is up to 0.1 atomic %.
Karabut et al. observed that the presence of germanium is wholly unexpected. The maximum concentration is 0.1 atomic %.
1-14

The possible reactions suggested by Karabut et al. are given in Fig.28. Very approximate calculations which have been made by Karabut et al. seem to suggest that the
right order of magnitude of heat can be obtained on the basis of these suggested reactions.
4. ACKNOWLEDGMENTS
Financial support from ENECO ( formerly FEAT ) is acknowledged. Z.M. thanks the Welch Foundation for partial support for this work. R.S. thanks the Bhabha Atomic Research Centre, Bombay ( India ) for leave of absence.
1-15

5. REFERENCES 1) J. O'M. Bockris, D. Hodko and Z. Minevski, ICCF-2, June 29 - July 4, 1991, Como, Italy, p. 337. 2) A.Takahashi, et al., Int.J.Appl.Electromagn.Materials, 106,1(1992). 3) D.R. Rolison and P.P. Trzaskoma, J.Electroanal.Chem., 287 (1990) 375. 4) A.Takahashi, et al., ICCF-3, October 21-25, 1992, Nagoya, Japan, p. 79. 5) M.Fleischmann, S.Pons and M.Hawkins, J.Electroanal.Chem., 261,301(1989). 6) C.R. Brooks and A. Choudhury, Metallurgical Failure Analysis, McGraw-Hill, Inc., 1993, p.182. 7) S.Pons and M.Fleischmann, Proc. 1st Annual Conference on Cold Fusion, March 28-31, 1990, Salt
Lake City,Utah(USA), p.1. 8) M.C.H.McKubre, et al, "Frontiers of Cold Fusion" (Proc. 3rd International Conference on Cold
Fusion, Oct.21-25, 1992, Nagoya, Japan), Universal Academy Press, Japan, p.5. 9) E Storms, Ibid., p.21. 10) K Kunimatsu, et al, Ibid., p.31 11) J.Gittus and J.0'M.Bockris, Nature, 339 (1989) 105. 12) J.O'M.Bockris and P.K.Subramanyan, Acta Metall., 19 (1971) 1205. 13) J.Knaak and W.Eichenauer, Z.Naturforsch.,239(1968)1783. 14) A.W.Overhauser; Physical Review, 92(1953)411. 15) K.R.Atkins ; "Physics", 2nd Edition, John Wiley, New York,1970,p.303 16) CRC Handbook of Chemistry and Physics, 66th Edition, 1985-1986, CRC Press, Boca Raton
(Florida),1985,Table E-75. 17) D.W.Dearholt and W.R.McSpadden; "Electromagnetic Wave Propagation", McGraw-Hill, 1973,
p.174 18) J.0'M.Bockris and A.K.N.Reddy,Modern Electrochemistrv,Plenum, New York, 1970. 19) C.R.Brooks and A.Chaudhury, "Metallurgical Failure Analysis", McGraw-Hill,
1993, p.182. 20) H.Bohm in "An Atlas of Metal Damage", L.Engel and H.Clingele
(Ed), Carl Harmer Verlag, Munich, Germany,1981. 21) C.C.Chien, D.Hodko, Z.Minevski and J.0'M.Bockris, J. Electroanal. Chem.,338 (1992) 189. 22) S.Majorowski and Baranowski, J.Phys.Chem.Solids, 43(1982)1119 23) F.A.Lewis, " The Palladium System ", Academic Press, London (1967), p.147. 24) H.Wipf,"Hydrogen in Metals", Vol.II,G.Alefeld and J.Volkl (Ed.), Springer-Verlag,Berlin,
(1978).13.273. 25) G.Preparata. Fusion Technology, 20(1991)82. 26) A.J.Leggett and G.Baym, Nature. 340(1989)45. 27) A.Takahashi, et al. Preprint of the paper submitted to the Russian Conference on Cold Fusion.
Abrau-Durso. Russia. Sept.1993. 28) G.H.Lin. R.C.Kainthla. N.J.C.Packham and J.0'M.Bockris. J.Electroanal.Chem., 280(1990)207 29) Y.E.Kim. Fusion Technology, 19(1991)558. 30) P.Hagelstein. ibid.. 23(1993)353; also a preprint of the papaer to be communicated to Fusion
Technology. 31) A.B.Karabut. Y.R.Kucherov and I.B.Savvatimova, "Frontiers of Cold Fusion "[Proc. 3rd
International Conference on Cold Fusion, Oct.21-25, 1992. Nagoya, Japan], Universal Academy Press. Tokyo. 1993. p.165.
32) L.Pauling and E.B.Wilson. Introduction to Quantum Mechanics. Chap.12, McGraw-Hill, 1935. 33) A.Gonzales-Martin. R.C.Bhardwaj and J.0'M.Bockris. J.Applied Electrochemistry, 23(1993)531. 34) N.J.C.Packham. K.L.Wolf, J.C.Wass, R.C.Kainthla and J.0'M.Bockris. J.Electroanal.Chem..
270(1989)451. 35) R.J.Beuhler. G.Friedlander and L.Friedman. Phvs.Rev.Lett.. 63(1989)1292. 36) K.I. Popov and M.D. Maksimovic. in J. O'M. Bockris et al. (eds). Modem Aspects of
Electrochemistry. Volume 19. p. 193. Plenum Press. N.Y. (1989)
1-16

Table 1.
HYDROGEN ISOTOPE
H/Pd or
D/Pd
T (K) EFF.CHARGE NUMBER,
Z*
EXPER. TECHNIQUE
H High (a-phase) 290-350 positive, +1 for H/Pd-0.6
Drift velocity
H s2.8x10-2 455-513 +0.4 to +0.55 H2 flux meas.
H s1.6x10-2 520-620 +0.54 H2 flux meats.
D 1.0x10² 520-620 +0.51 to +0.59 H2 flux meas.
H D s4.0x10' 420-1070 Between +0.3
and +0.7 H2 flux meas.
H s8.2x10-3 970 +0.44 Diff. potent.
H, D s8.2x10-3 970 +0.35 Diff. potent.
1-17
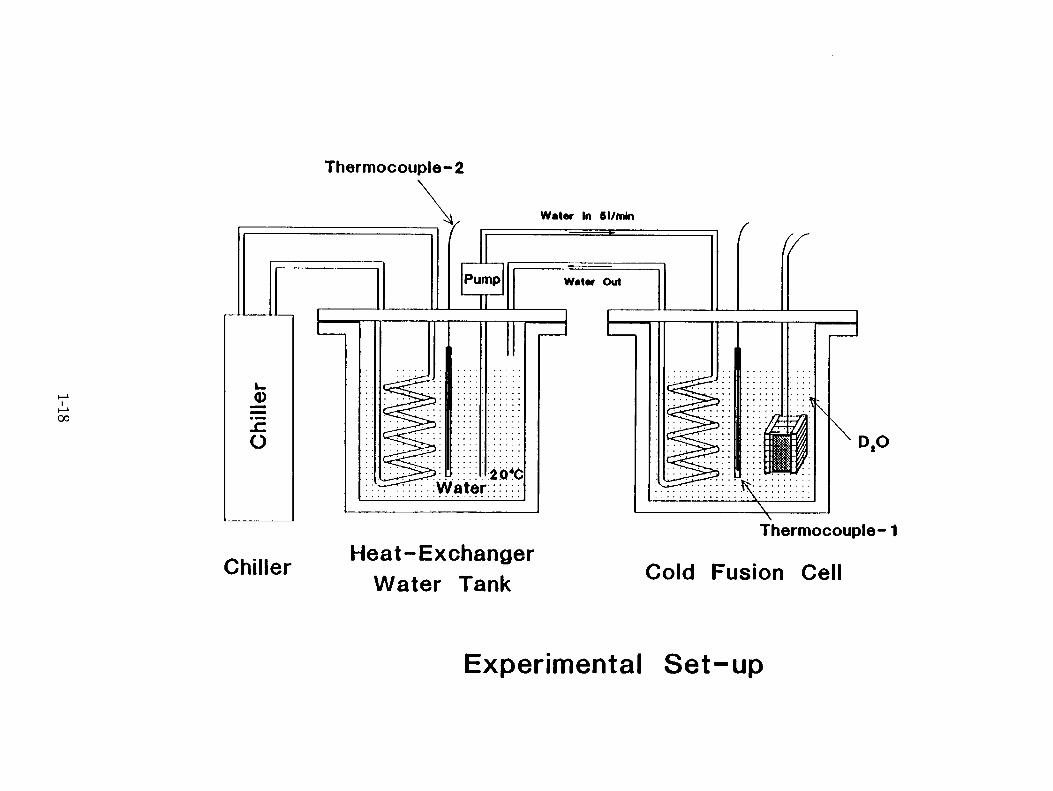
Experimental Set-up
1-18

Fig. 2a Saw—tooth—current Mode Operation ; Pre—loading
Fig. 2b L—H Current Mode Operation ; Heat Measurement
Current Operation Modes. 1-19

CELL ASSEMBLY FOR RF STIMULATION
1-20

CELL ASSEMBLY FOR MAGNETIC SI1MULA11ON LLN THE FIELD OF 200 GAUSS HORSE-SHOE MAGNET)
1-21

THERMISTOR
2 4" D2
CELL ASSEMBLY FOR MAGNETIC STIMULATION (SYMMETRIC 800 GAUSS MAGNETIC FILD)
WORKING COUNTER ELECTRODE (P1) ELECTRODE (Pd)
ELECTROLYTE LEVEL (0.3 M LIQD)
1.)
TEFLON HOLDER FOR ELECTROLYSIS CELL AND MAGNETS
PERMANENT DISC MAGNETS

Excess Power As A Functior Of Time
1-23

D/Pd MEASUREMENTS
1-24

RF STIMULATION AT 365.608 MHz

EXCESS POWER AS A FUNCTION OF FREQUENCY
MAGNETIC STIMULATION

XAGONS AND MICROVOIDS
1-28

SURFACE COVERAGE WITH HEXAGONS AS A FUNCTION OF DEPTH
1-29

1
1 1.- 1 r► ID 1 P,

FFFFCT OF TIMF

-0.35 V 0.) hr:;
"C


CONDITIONS FOR CRACKING
MECHANISM 1. COUPLED DISCHARGE CHEMICAL DESORPTION
_ nF OVERPOTENTIAL < -0.35 V — 1U
1 '5 e ." RT
MECHANISM 2. FAST DISCHARGE SLOW CHEMICAL COMBINATION
2nF OVERPOTENTIAL > -0.35 V frv—
Lri" e RT
1-35

SURFACE COVERAGE WITH HEXAGONS AS A FUNCTION OF
OVERPOENTIAL
1-36

SURFACE COVERAGE WITH HEXAGONS AS A FUNCTION OF
OVERPOTENTIAL
1-37

SURFACE COVERAGE WITH HEXAGONS AS A FUNCTION OF
TIME
1-38
CONCENTRATION CHANGE WITH TIME AT DEPTH OF 10 urn IN FOIL 1 mm THICK

1-40
CONCENTRATION CHANGE WITH TIME AT DEPTH OF 10 um IN CYLINDER 1 mm RADIUS

PALLADIUM DEUTERIDE LATTICE
OCTAHEDRAL
D/Pd < 0.80
Pd - Pd =4.08 A D1 - D2 =2.88 A D2 - D3 =2.88 A
TETRAHEDRAL
D/Pd > 0.80
Pd - Pd =4.08 A D3 - D4 =1.77 A D4 - D5 =2.51 A
— PALLADIUM a -- DEUTERIUM IN OCTAHEDRAL SITES
-- DEUTERIUM IN TETRAHEDRAL SITES 1-41
EFFECTIVE CHARGE NUMBER OF H AND D AS A FUNCTION OF H,D/Pd
1-42
PREPARATA'S COHERENCE DOMAIN MODEL
1-43

THE DENDRITE ENHANCED TUNNELING MODEL
FIELD 107 V/cm DISCHARGE CURRENTS OF -105 A
DENDRITE

HAGELSTEIN'S "VIRTUAL" NEUTRON MODEL

KUCHEROV'S REACTION SCHEMES
1-46

SEARCH FOR NUCLEAR PRODUCTS OF COLD FUSION
Hiroyuki Miyamaru, Yasuhiro Chimi, Toshihiro Inokuchi and Akito Takahashi
Department of Nuclear Engineering, Faculty of Engineering Osaka University, Yamadaoka 2-1, Suita, Osaka 565 Japan
Abstract
Neutron and helium measurement system with a closed type electrolysis was constructed in order to accomplish simultaneous detections of nuclear products for cold fusion. On-line neutron measurement was performed and loading Deuterium/ Palladium ratio was monitored during electrolysis. Electrolysis gas was analyzed by a high resolution mass spectrometer after electrolysis. Some electrolyses with several Pd electrodes were carried out as preliminary experiments. Loading ratios observed were less than 0.85. Neither significant helium generation nor neutron emission was observed.
Introduction In the recent studies, excess heat generation has been reported in many laboratories 1 ). Especially, correlation between D/Pd ratio and excess heat has been well investigated 2). 3),4). Numerous attempts have been made to clarify origin of the excess heat. Nevertheless, the clarification has not been accomplished yet. With regard to nuclear products, a few groups have claimed tritium and helium 4 ( 4 He) production in the electrolysis 5) or some vacuum experiments 0), 7). However, there have been no reports which claimed large amount of neutron emission or helium 3 production corresponding to the excess heat. This fact indicates that conventional D-D reactions are not able to explain the excess heat completely. In this sense, if the excess heat is nuclear origin, unusual nuclear reactions with other nuclear products should be considered so as to explain low neutron emission. If unusual nuclear reactions occur, simultaneous detections of supposed nuclear products are required to clarify mechanism of the reactions. Therefore, a closed-type electrolysis cell was designed and constructed in order to measure neutrons and deuterium loading
2-1

ratio on-line, and moreover, to analyze helium after electrolysis. Using this closed system, electrolysis gas was able to be stored over a long electrolysis period. Helium analysis with high sensitivity was expected even if the excess heat was slight or intermittent. Some electrolysis experiments were performed as preliminary experiments.
Equipment Figure 1 (a) shows a simplified scheme of the measurement system. The closed cell was placed into the polyethylene blocks with 40 cm thickness to decrease neutron background. A fast neutron detector (NE213 with 15 inch diameter) was used in this study. A pulse shape discrimination (PSD) technique was employed to eliminate gamma-ray signals of background. A flow-chart of the PSD is indicated in Fig. 1 (b). Time dependence of neutron counts and energy spectrum were acquired all the time. Background neutron level was approximately 4 neutrons / min. All the data acquisition and their processing calculations were performed using a personal computer system.
After each experiment, electrolysis gas was installed from the cell to a vacuum chamber of a quadrupole mass spectrometer (HIRESOM-2SM ; ULVAC). The chamber is all made of stainless steel and it is always evacuated at10- 8 Torr. Resolution and sensitivity of the spectrometer were experimentally studied to determine the detection limit of helium. The spectrometer was adjusted to obtain enough resolution to separate two closed mass peaks ( 4 He-; M=4.003 and D2- ;M=4.028). The detection limit of the spectrometer was approximately 10 14
He atoms (10-11 Torr). This amount corresponds to 100 J excess heat in the cell as far as the occurrence of conventional D-D fusion reactions is assumed.
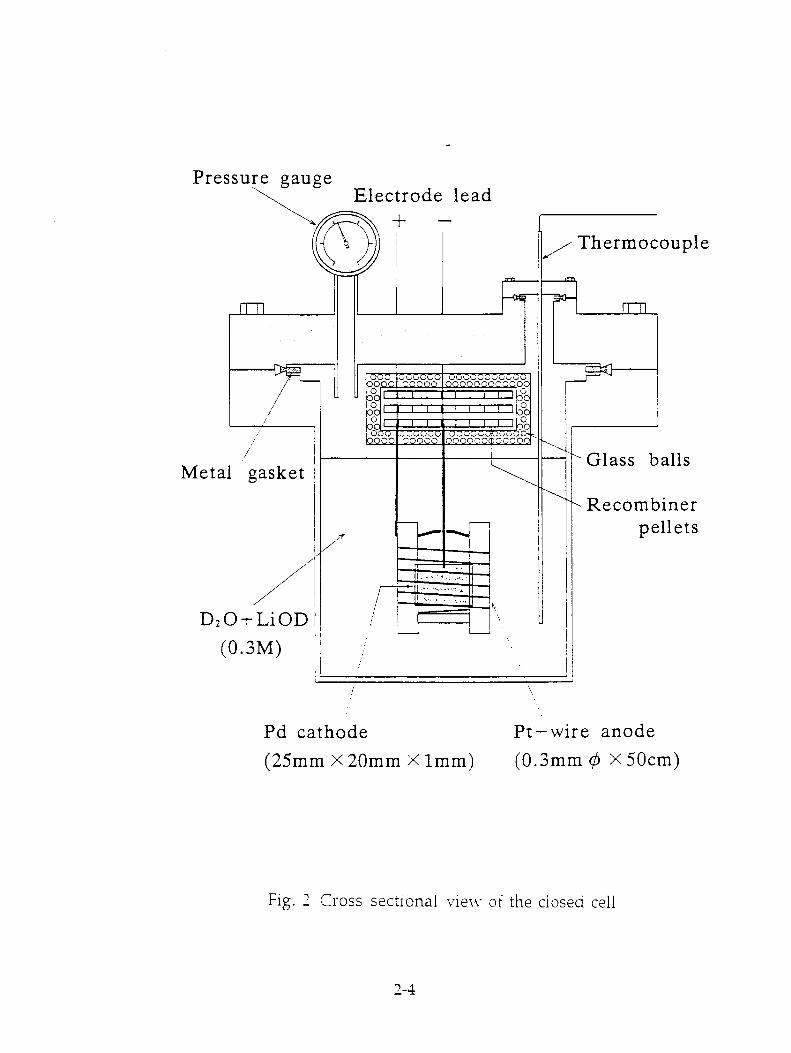
Figure 2 shows a cross-sectional view of the closed cell. The cell body was made of stainless steel and all joints were sealed by metal gaskets to minimize the diffusing-out of electrolysis gas. The inside of the cell was coated by PTFE to avoid alkaline corrosion. A palladium cathode plate was supported by a PTFE sample holder at the center of the cell. A platinum-wire anode was surrounding
spirally the cathode. A stainless-sealed thermocouple was installed to monitor cell temperature. Recombiner pellets were placed within a mesh-platinum cage attached to the cell lid in the upper space. A semiconductor pressure sensor was
employed to monitor cell pressure. Cell temperature, ambient temperature, cell pressure, cell current and voltage Nvere automatically recorded by a computer and a pen-recorder.
2-2

Fig. I (a) Simplified scheme of the measurement system (b) Pulse shape discrimination flow-chart
2-3
Pressure gauge Electrode lead
r oo-o 0o0o6o oo o oo
Thermocouple
Metal gasket
D2O+LiOD (0.3M)
Glass balls
Recombiner pellets
Pd cathode (25mm X 20mm X 1mm)
Pt—wire anode (0.3mm c X 50cm)
Fig. 2 Cross sectional view of the closed cell
-4

Experimental Four cold-worked palladium samples were studied. Characteristics of each sample are indicated in Table 1. The size of a palladium plate (99.9% purity) was 2.5cm wide, 2.0cm long and lmm thick. All palladium samples were supplied by Tanaka Kikinzoku Co., Ltd. Neither chemical nor annealing treatments were performed before electrolysis. Electrolyte solution was 600cc D 20 with 0.3M LiOD. Electrolysis current was operated with various pulse modes. The current density was changed from 32 to 640 mA/cm 2 .
Table 1.
List of the Experimental Conditions
Exp. No. Sample Vickers hardness
Electrolysis time (days)
Current density (mA/cm 2 )
1 Pd 150 30 40-370 2 Pd 150 11 40-260 3 Pd 300 11 40-220 4 Pd 150 28 32-640
Loading Ratio An experimental method to estimate loading ratio is as follows. When deuterium is absorbed in a palladium metal, oxygen gas in proportion to absorbed amount of deuterium is accumulated in the cell due to lack of deuterium for recombination. Therefore, the cell pressure is increased until the saturation of deuterium absorption. Amount of oxygen gas is calculated from the increase of the cell pressure to estimate loading ratio. An error range of the loading ratio was approximately 0.025 in this study.
Figure 3 shows time dependence of loading ratio after starting an electrolysis of Exp. 4. Applied electrolysis current during first 5 days was 160mA/ cm2 . The loading ratio increased rapidly for the first one hour, in contract to the gradual increase for the following 100 hours. Finally it saturated around 0.84. This was a typical feature of deuterium absorption in this study. For other Pd samples, loading ratios were saturated around 0.85. When a high current density was applied, the high loading ratio was maintained for a long period. After 120 hours electrolysis, a pulse electrolysis Nvith low and high current mode was applied expecting high loading ratio to be attained. Each low (32 mA/cm 2 ) and
2-5

Fig. 3 Variation of loading ratio with time (I)
Fig. Variation of loading ratio \vith time (II)
2-6

high (320 mA / cm 2 ) mode was repeated every 5 hours. However, the loading ratio gradually declined as shown in Fig. 4. Finally, the loading ratio decreased to 0.73. In case of the hard palladium sample (Exp. 3), almost the same tendency was observed. Although various pulse patterns were attempted to achieve high loading ratio, any of Pd samples could not exceed the ratio of 0.85. It is considered that the reason for the decrease is due to microscopic cracks occurred during the process of frequent cycle of absorption and desorption. In this sense, it is necessary to clarify metallurgical characteristics of individual palladium which can realize high loading ratio.
He detection Table 2 indicates the results of helium analysis about 4 samples. Helium 3 (M=3.02) and 4 He were investigated. There were no significant signals observed beyond the detection limit. These results indicate that the amount of helium generation during electrolyses was less than 10 14 atoms.
Table 2.
Summary of He Analysis
Exp. No. loading ratio He analysis (max-min)
1 0.84-0.65 No peak 2 0.84-0.78 No peak 3 0.83-0.77 No peak 4 0.84-0.73 No peak
Neutron detection Neutron measurement was carried out only for the hard Pd sample ( Exp. 3). Figure 5 shows time dependence of neutron counts. Slight fluctuations are observed. However, these fluctuations might be occasionally caused not only fluctuation of background neutrons but also by the instability of used PSD modules and high voltage power supply. Especially, some electronics modules are much sensitive to the change of ambient temperature. Timing signals of a scintillator sometimes have slight drifts even if room temperature is controlled by an air-conditioner. This influence causes fluctuation of neutron counts. As
a consequence, it is considered that the observed fluctuations exceeding averaged background did not show meaningful increase of neutron counts. Recoil proton
2-7

Fig. 5 Time dependence of neutron counts
Fig. o Recoil proton energy spectra of the NE213 detector
2-8

energy spectra are indicated in Fig. 6. A neutron energy is roughly estimated by comparison of foreground and background. Any neutron emission, which has inherent energy (e.g. 2.45MeV ), was not confirmed in the comparison of two energy spectra.
Conclusion An experimental system of closed-type electrolysis was developed for the measurement of neutron and helium by supposed cold fusion effect. The feasibility of the system was confirmed. Although palladium samples with two different types in hardness were preliminary studied, the loading ratio could not reach over 0.85. No significant nuclear products have been detected. In this study, some critical conditions (e.g., high loading ratio, surface or bulk conditions of Pd metal) might not be satisfied to generate excess heat. We will have to make further efforts to search the key to meet excess heat production first and then to catch "supposed" nuclear products.
References
1) Proceedings of the 3rd International Conference on Cold Fusion, Nagoya Japan (October 1992), "Frontiers of Cold Fusion", Universal Academy Press (1993)
2) M. C. H. McKubre et al., "Excess Power Observations in Electrochemical Studies of the D/Pd System; the Influence of Loading", Ref. 1, p.5 (1993)
3) K. Kunimatsu et al., "Deuterium Loading Ratio and Excess Heat Generation during Electrolysis of Heavy Water by a Palladium Cathode in a Closed Cell Using a Partially Immersed Fuel Cell Anode'', Ref.1, p.31 (1993)
4) T. Mizuno, T. Akimoto and K. Azumi, "Cold Fusion Reaction Products and Behavior of Deuterium Absorption in Pd Electrode", Ref. 1, p.373 (1993)
5) M. H. Miles and B. F. Bush, "Search for Anomalous Effects Involving Excess Power and Helium during D20 Electrolysis Using Palladium Cathodes", Ref.1, p.189 (1993)
6) E. Yamaguchi and T. Nishioka, "Direct Evidence for Nuclear Fusion Reactions in Deuterated Palladium'', Ref.1, p.179 (1993)
7) T. N. Clavtor, D. G. Tuggle and 5. F. Taylor - Evolution of Tritium from
2-9

Deuterided Palladium Subject to High Electrical Currents", Ref.1, p.217 (1993)
8) A. Takahashi, T. Iida, T. Takeuchi and A. Mega, "Excess Heat and Nuclear Products by D20/Pd Electrolysis and Multibody Fusion", J. Appl. Electromag. Mat., 3, p.221 (1992)
2-10

Excess Heat Generation, Voltage Deviation, and Neutron Emission in D 2O-LiOD Systems
M. Okamoto, Y. Yoshinaga, M. Aida, T. Kusunoki`
Research Laboratry for Nuclear Reactors Tokyo Institute of Technology
Ookayama, Meguro-city, Tokyo 152 Japan
Present address:Japan Atomic Power Co.Ltd. Tsuruga-city, Japan *
Abstract To elucidate the conditions in which the nuclear phenomena take place, the
correlations between the events attributed to the nuclear phenomena should be
clarified in the experimental system. The neutron count rates, cell temperatures
and the cell voltages have been measured simultaneously in every 10 sec, and the data were stored in a computor system to find and discuss the correlations between the three parameters.
Introduction As has been discussed, the correlations between the effects which have been
predicted to occur simultaneously in the solid state nuclear phenomena and also to clarify the conditions to generate the excess heat from the solids.
In the present study, a simple excess heat monitoring system has been
equipped to the electrolysis cell along with a neutron energy spectrometer(NE213 liquid scintillation detector) to find the correlation between the excess heat
generation, the neutron emission and the increase rate of the cell-voltage. The
voltage between the two electrodes, the cell temperatures from the three
thermocouples and the emission rate of the neutron have been measured in
every 10 sec. and the data of them have been stored in a computor system throughout the operations.
To discuss the correlations, four foreground runs with the heavy water and one background run with the light water have been carried out resulting a very
interesting correlation between the cell-voltage change and the excess heat generation occurred in the D 2O-Li0D-Pd systems.
Experiment
The assembly for the neutorn detection and the method of the evaluation of
the excess neutron and its energy spectrum were same as described in a previous
paper(1). The electrolysis cell used is illustrated in Fig.1. The cell is made of
3-1
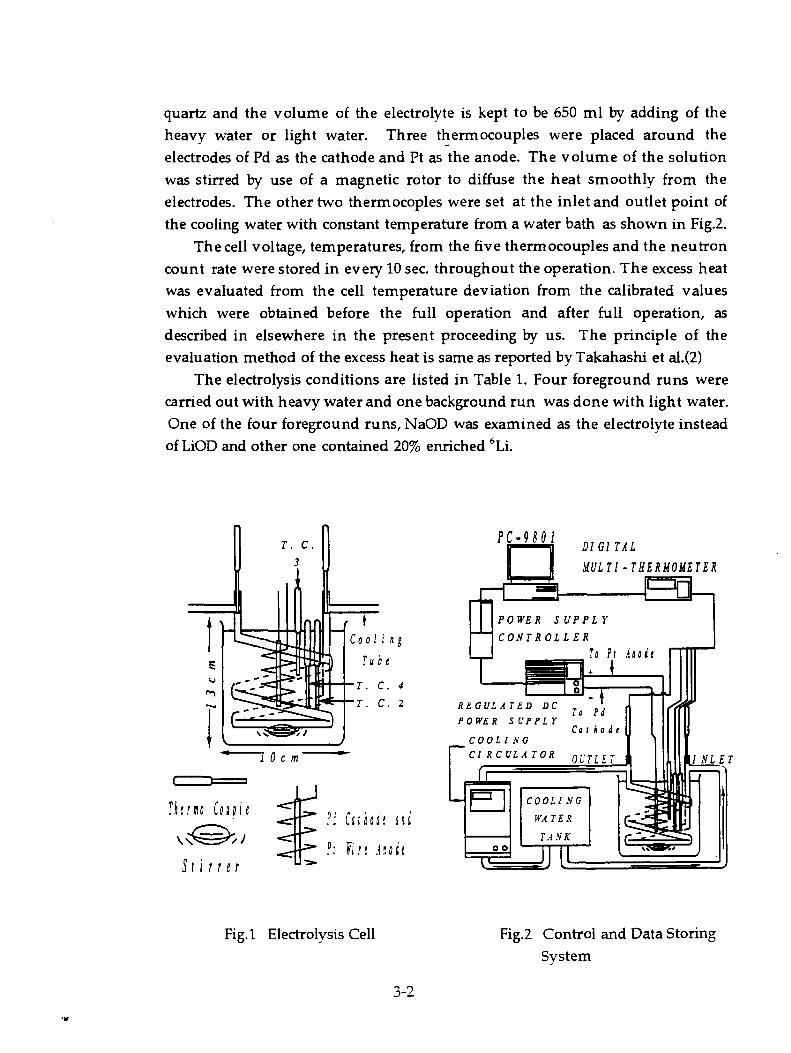
quartz and the volume of the electrolyte is kept to be 650 ml by adding of the heavy water or light water. Three thermocouples were placed around the electrodes of Pd as the cathode and Pt as the anode. The volume of the solution was stirred by use of a magnetic rotor to diffuse the heat smoothly from the electrodes. The other two thermocoples were set at the inlet and outlet point of the cooling water with constant temperature from a water bath as shown in Fig.2.
The cell voltage, temperatures, from the five thermocouples and the neutron count rate were stored in every 10 sec. throughout the operation. The excess heat was evaluated from the cell temperature deviation from the calibrated values which were obtained before the full operation and after full operation, as described in elsewhere in the present proceeding by us. The principle of the evaluation method of the excess heat is same as reported by Takahashi et a1.(2)
The electrolysis conditions are listed in Table 1. Four foreground runs were carried out with heavy water and one background run was done with light water. One of the four foreground runs, NaOD was examined as the electrolyte instead of LiOD and other one contained 20% enriched 6Li.
Fig.1 Electrolysis Cell Fig.2 Control and Data Storing System
3-2

1.50
0
7 8
Run No.
Cathode size(mm)
Electrolyte Preloading days cycle
Electrolysis Time(h)
Low/High Current
1 0.5x10.0 x25.0 NaOD(0.5M) 5 12
hours /cycle
158 19/355 2
1.0x10.0 x25.0
LiOD(0.6M) 9 745 18/333
mA/cm2
3 20% bLiOD(0.5M) — 7 264 4 - LiOD(0.5M) - 10 307 5 LiOH(0.5M) — — 192
Table 1 Electrolysis conditions
Results and Discussion Neutron Emission
A typical example of the result of the neutron energy spectrum is shown in
Fig.3. As was reported, the intensity of the neutron emission is very weak but
appreciable excess neutrons were detected as shown in Fig.3. Similar neutron energy spectrum were obtained in every foreground run includidng Run 1 with
NaOD but no excess neutron in the background run (Run 5) with the light water.
Fig.3 Neutron Energy Spectrum
Excess Heat Generation One of the typical example of the cell temperature with no excess heat(Run 2)
is shown in Fig.4 as a function of the input power. The solid line with open
circles is the calibration curve. The solid circles represent the averaged cell temperatures measured by the three thermocouples. Because of no deviation
between the cell temperatures and the calibration curve, it can be concluded that
we have no excess heat. In Fig.5, the cell temperatures measured by the three thermocouples in Run 3
are illustrated for each thermocouples along with the calibration curve. The
3-3

Excess Heat Generation Each Thermocouple
upper diviations from the calibration curve indicate the appreciable excess heat generation in this run(Run 3). The magnitudes of the deviations increase with decrease of the distances from the Pd cathode. This facts indicate that the source of the excess heat is the Pd cathode.
The average cell temperatures are illustrated in Fig.6 as a function of the input power. Using this upper deviation from the calibration curve, the excess heat is evaluated as shown in Fig.7. The excess power increases proportionally with increase of input power upto about 36W, and at this point the excess power is 7W, ca. 20% of energy gain.
Fig.4 Cell Temperature with no Fig.5 Cell Temperature for
Fig.6 Average Cell Temperature Fig.7 The Correlation of Excess Power to Input Power
3-4

The correlation between the excess heat generation and the cell voltage The cell voltage is defined here as follows;
Cell Voltage = V(Pd-Pt)„.„d-1.5VD20 As shown in Fig.8, the excess power generation became clear beyond their error at the electolysis time of 120 hours. This point is also very interesting, because from this point the rate of the cell voltage increases exponentially while before this point, the rate increases as linear, as shown in Fig.9. In Fig.9, the cell voltage observed in the electrolysis with no nuclear effects is also plotted as a control run. The increase rates of the first half of the curves are similar and increases linearly. In the latter half, the rate of the Run No.3 with the neutron emission and the excess heat generation is evidently larger than that of Run No.4 with no nuclear effects.
This fact indicates that the abnormal increase rate of the cell voltage have a significant correlation to the excess heat generation.
Fig.8 Excess Power Growth Feature Fig.9 Increase Rate of Cell Voltage
Fig.10 Correlation between Excess Heat Generation and Neutron Emission
3-5

The correlation between the excess heat generation and the neutorn emission We have investigated the above correlation, but there has been found no
clear correlation between the excess neutron emission and the excess heat generation. In Fig.10 , the excess neutrons are illustrated with the excess heat as a function of the operation time to show a weak corrleation between them.
Conclusion The correlations between the excess neutron emission, the excess heat, and
the cell voltage increase rate have been investigated by use of D20-LiOD(Na0D)-Pd electrolysis systems. In the four foreground runs, the weak excess neutron emissions were observed and one of them gave the appreciable excess heat generation.
Based on the discussion on the correlations between the above three points, it is concluded that the cell voltage at the start point of the electrolysis and the increase rate of the cell voltage have strong correlation with the excess heat generation, while the excess neutron emission has no clear correlation with the excess heat generation.
References (1)Mutsuhiro Nakada, Takehiro Kusunoki and Makoto Okamoto. Energy of the Neutrons Emitted in Heavy Water Electrolysis. Fronties of Cold Fusion, Tokyo : Universal Academy Press, 1992, pp.173-178. [book] (2)Akito Takahashi, Akiyama Mega, Takayuki Takeuchi, Hiroyuki Miyamaru and Toshiyuki Iida. Anomalous Excess Heat by D,O/Pd Cell under L-H Mode Electrolysis, ibid pp.79-91. [book]
3-6

SOME CHARACTERISTICS OF HEAT PRODUCTION USING THE "COLD FUSION" EFFECT
Edmund Storms Los Alamos National Laboratory (retired)
MS-C358, Los Alamos. M 87545
Abstract
Additional evidence is presented to show that heat production resulting from the Pons-Fleis-chmann Effect has a positive temperature coefficient, has a critical onset current density, and originates at the palladium cathode.
• Introduction The Pons-Fleischmann effect is proposed to produce energy by initiating a fusion reaction be-tween two deuterium atoms within an electrolytic cell. While an understanding of this phenome-non is still lacking, the reality of anomalous heat production has been established by many stud-ies.
Work done during this program demonstrates that the effect can be reproduced when the proper palladium and protocols are used. During the first part of the study[1], the methods of Taka-hashi[2] were used with success. The present study reproduced the effect using the addition of aluminum to the electrolyte as first suggested by McKubre et al.[3]. These studies also revealed several of the reasons why negative results were obtained in the past.
This work further defines conditions that influence excess heat production. The effects of cur-rent density and cell temperature are explored. The location within the cell from which excess heat production originates is also determined.
Experimental The study uses a closed, stirred, pyrex-glass, isoperibolic-type calorimeter as described previous-ly[t]. Calibrations were done using the electrolytic method before excess energy was observed and an internal heater after excess heat production started. Generally, calibration was done be-fore and after excess heat production. No significant changes were observed in the calibration constant during the study. The total uncertainty in the measured heat value was about ±.4%. Be-cause random variations of ±-0.2 watt were observed, excess heat was not claimed unless the ex-cess exceeded 0.5 watt. Details of the calorimeter design and the calibration methods are de-scribed in reference 1.
A palladium cathode obtained from Tanaka Metals Company, Japan, (Batch #4) was used fter being washed with acetone. This was charged with deuterium in 0.4M LiOD at 20 mA/cm until the D/Pd ratio became constant at 0.84 after 9 hours. The charging behavior was similar to that produced by Batch #1 which produced significant excess heat.[1] Electrolysis was continued with variations in cell current, cell temperature, and periodic calibrations without the production of excess energy. After 575 hrs, excess heat was observed following the addition of 28 ppm of aluminum to a new electrolytic solution. Once excess power was observed, the magnitude of the excess increased each time the cell current was raised to 2.5 A as shown in Fig 1. Eventually, excess power became stable and the study was commenced.
4-1
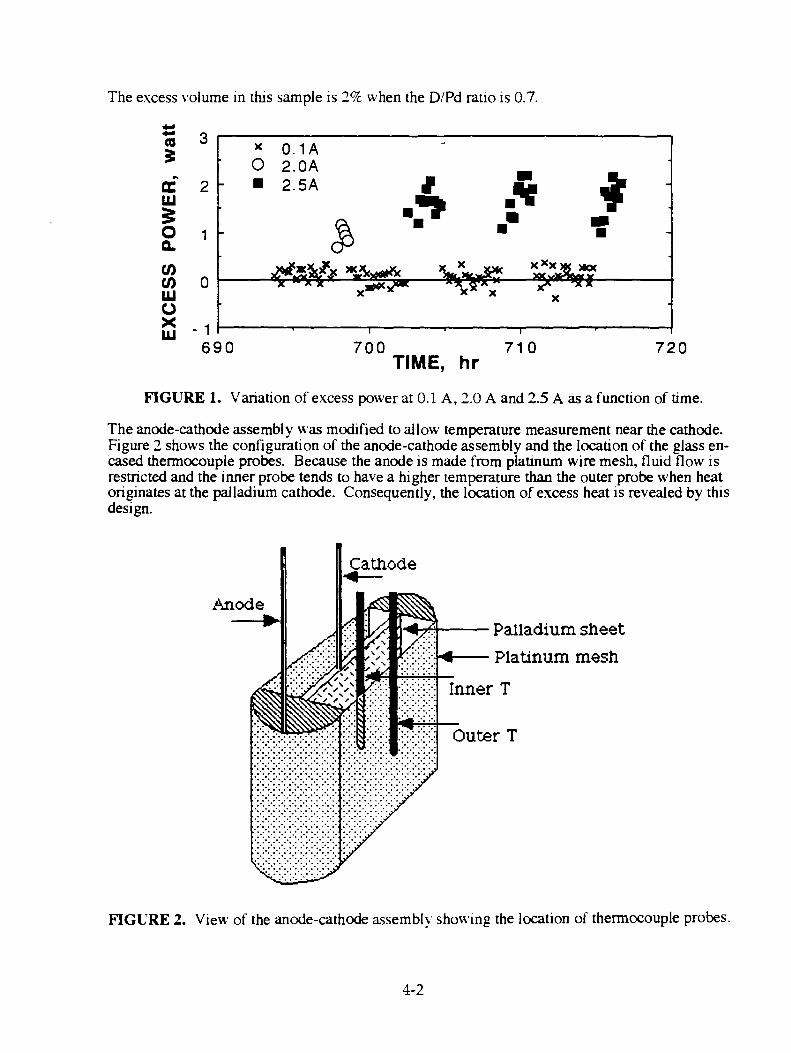
The excess volume in this sample is 2% when the D/Pd ratio is 0.7.
FIGURE 1. Variation of excess power at 0.1 A, 2.0 A and 2.5 A as a function of time.
The anode-cathode assembly was modified to allow temperature measurement near the cathode. Figure 2 shows the configuration of the anode-cathode assembly and the location of the glass en-cased thermocouple probes. Because the anode is made from platinum wire mesh, fluid flow is restricted and the inner probe tends to have a higher temperature than the outer probe when heat originates at the palladium cathode. Consequently, the location of excess heat is revealed by this design.
FIGURE 2. View of the anode-cathode assembly showing the location of thermocouple probes.
4-2

Results
Relationship Between Cell Current and Excess Power The effect of cell current is determined by changing the cell current from 0.1 A to 3 A in steps and back down to 0.1 A. This cycle is repeated twice during each data set. Steady-state is reached after 15 min and the current is maintained constant for an additional 15 min. Data are taken each minute during this second interval and averaged to give the plotted value.
Figure 3 compares several examples of how the current density affects excess power density. Most of the plotted points showing the behavior observed during other studies are averaged val-ues extracted from published graphs containing many Roints. Several studies show a clear onset to the production of excess energy near 0.1 A/cm'. Pons and Fleischmann were the first to mention the effect and Kainthla et al.[4] were the first to show data. While these studies all give current onset values between 0.05 and 0.1 A, a variety of values have been observed in this study. In earlier workill, the onset was above 035 A/cm 2. This variation in onset value may partly account for the early lack of reproducibility if the onset happened to be larger than the ap-plied current
• There is a wide variation in the slope of the lines. These differences in slope are believed caused by variations in the area producing the excess energy. The slope reported by McKubre et al. [3] is affected by a very nonuniform current density typical of their apparatus. The slope throu igh the data reported by Kunimatsu et al.[5] is uncertain because the data are repokted as W/cm and insufficient information is provided to allow an accurate conversion to W/cm`. Although not shown in the figure, a variation in slope over an extended time can be seen in the low-high val-ues reported by Takahashi et al.[6]. McKubre et al. [3], Kunimatsu et al.[5], Hasegawa et al.[7], and Mizuno et al.[81 show that this relationship is caused by an increased D/Pd ratio that results when the current density is increased. Apparently, the D/Pd ratio for a fixed current and/or the affected area are not constant during extended electrolysis nor between studies.
There is no indication in any of the studies for the fine structure reported by Bush[9] and required by his theory.
FIGURE 3. Relationship between excess power density and current density.
4-3

Source of Excess Energy Three potential sources of energy can be suggested to exist in the cell. These are (1) the energy being applied to the cell as current, (2) the energy that results from any chemical reactions within the cell, and (3) the energy that is called excess. Some people believe that sources (2) and (3) are identical. Nevertheless, it is instructive to find the physical source of excess energy within the cell.
Figure 4 shows the temperature difference between thermocouples located outside and inside the anode structure. The solid line results when the applied power is increased in the absence of ex-cess power. Up to 40 watts of applied power is used to determine this line. Clearly, normal elec-trolytic power has very little effect on this temperature difference. On the other hand, production of excess power causes a marked increase in the temperature near the cathode compared to that outside the anode. A+0.25° offset error is present in the calibration of the two thermocouples and should be ignored. This result indicates that the excess power originates at or near the cath-ode. Changes in this relationship over a period of time indicates that the location of power pro-duction on the cathode gradually changes.
Two thermocouples located outside the anode-cathode structure in a region that is actively stirred are used to determine the calibration constant. Therefore, the warming trend within the anode-cathode structure does not affect the calibration of the calorimeter.
FIGURE 4. Temperature difference between thermocouples located near the anode and near the cathode as a function of power. The line results from applied power in the absence of excess power and the points result from only excess power.
Effect of temperature on excess power production The effect of temperature on excess power production is determined as follows. The cell temper-
4-4

ature is increased at fixed electrolysis current (1.8A) by applying power to the internal heater. This additional power is subtracted from the total power when calculating excess power. While this method avoids changes in the calibration constant, it has a very limited temperature range. Consequently, the calculated temperature coefficient-must be viewed as an approximation. Clear-ly, this measurement needs to be made over a wider temperature range and for various current densities.
Figure 5 shows the relationship between cell temperature and excess power. Excess power is chosen over percent excess power for the following reasons. When temperature is increased, the cell resistance is reduced, thereby reducing the applied power. Consequently percent excess power increases more rapidly than does excess power alone. Because the cell resistance depends on the geometry of the cell and variable characteristics of the electrolyte, this ratio is not a funda-mental property of the phenomenon.
FIGURE 5. Relationship between excess power and cell temperature.
When plotted as log excess vs 1/T (Figure 6), the energy of the chemical reaction affecting ex-cess heat production is determined to be about 15 kcal/mol.
FIGURE 6. Relationship between log excess heat and 1/T.
4-5

Conclusions Reproductivity of the Pons-Fleischmann Effect is no longer an issue. If proper palladium and protocols are used, a high probability of successful excess energy production can now be expect-ed using the electrolytic technique.
The amount of excess power production depends on the D/Pd ratio above a critical value and the area of the palladium having the necessary ratio. The region having the necessary deuterium concentration changes with time during electrolysis. Those factors that affect the deuterium con-centration are different between different studies and change with time during a study. This vari-ability,' adds to the difficulty in achieving stable heat production.
The D/Pd ratio is sensitive to chemical conditions that exist on the surface of the palladium. These chemical conditions produce a temperature coefficient for the heat producing reaction that imply a barrier energy of =15 kcal/mole. The large magnitude of this value suggests that deuteri-um diffusion in palladium is not the rate limiting step. Because this reaction plays a major role in achieving the necessary deuterium concentration, a more detailed study is essential.
Acknowledgement The author is grateful to ENECO (FEAT) for making the presentation of this work possible and the Los Alamos National Laboratory for providing the equipment.
References [1] E. Storms, "Measurement of Excess Heat from a Pons-Fleischmann Type Electrolytic
Cell", Proceedings of the Third International Conference on Cold Fusion, October 21-25 , 1992, Nagoya Japan, Frontiers of Cold Fusion, (H. Ikegami, ed), Universal Academy Press, Inc., Tokyo, Japan. p. 21.
[2] A. Takahashi, "Nuclear Products by D 20/Pd Electrolysis and Multibody Fusion", Proc. Int. Sym. Nonlinear Phenomena in Electromagnetic Fields, ISEM-Nagoya, Jan. 27-29, 1992.
[3] M. C. H. McKubre, S. Crouch-Baker, A. M. Riley, S. I. Smedley and F. L. Tanzella, "Ex-cess Power Observations in Electrochemical Studies of the D/Pd System; The Influence of Loading", Proceedings of the Third International Conference on Cold Fusion, October 21-25 , 1992, Nagoya Japan, Frontiers of Cold Fusion, (H. Ikegami, ed), Universal Acad-emy Press, Inc., Tokyo, Japan. p. 5.
[4] R. C. Kainthla et al. "Sporadic Observation of the Fleischrnann-Pons Effect", Electro-chim. Acta. 34, 1315 (1989).
[5] K. Kunimatsu, N. Hasegawa, A. Kubota, N. Imai, M. Ishikawa, H. Akita and Y. Tsuchi-da, "Deuterium Loading Ratio and Excess Heat Generation during Electrolysis of Heavy Water by a Palladium Cathode in a Closed Cell Using a Partially Immersed Fuel Cell Anode", Proceedings of the Third International Conference on Cold Fusion, October 21- 25 , 1992, Nagoya Japan, Frontiers of Cold Fusion, (H. Ikegami, ed), Universal Academy Press, Inc., Tokyo, Japan. p. 31.
[6] A. Takahashi, A. Mega, T. Takeuchi, H. Miyamaru and T. Iida, "Anomalous Excess Heat by D 20/Pd Cell under L-H Mode Electrolysis", Proceedings of the Third International Conference on Cold Fusion, October 21-25 , 1992, Nagoya Japan, Frontiers of Cold Fu-sion, (H. Ikegami, ed), Universal Academy Press, Inc., Tokyo, Japan, p. 79.
[7] N. Hasegawwa, K. Kunimatsu, T. Ohi, and T. Terasawa, "Observation of Excess Heat during Electmlysisd of 1M LiOD in a Fuel Cell Type Closed Cell", Proceedings of the
4-6

Third International Conference on Cold Fusion, October 21-25 , 1992, Nagoya Japan, Frontiers of Cold Fusion, (H. Ikegami, ed), Universal Academy Press, Inc., Tokyo, Japan. p. 377.
[8] T. Mizuno, T. Akimoto, and K. Azumi, "Cold Fusion Reaction Products and Behavior of Deuterium Absorption in Pd Electrode", Proceedings of the Third International Confer- ence on Cold Fusion, October 21-25 , 1992, Nagoya Japan, Frontiers of Cold Fusion, (H. Ikegami, ed), Universal Academy Press, Inc., Tokyo, Japan. p. 373.
[9] R. Bush, "Cold Fusion: The Transmission Resonance Model Fits Data on Excess Heat, Predicts Optimal Trigger Points, and Suggests Nuclear Reaction Scenarios", Fusion Tech. 19, 313 (1991).
4-7

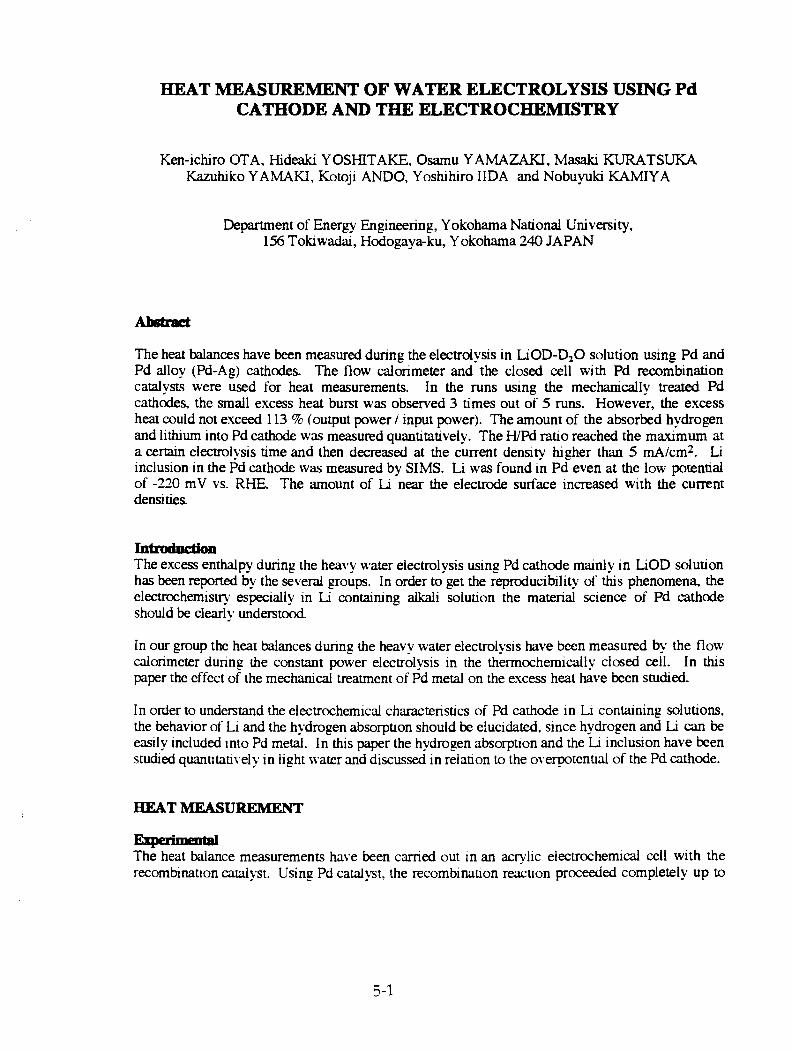
HEAT MEASUREMENT OF WATER ELECTROLYSIS USING Pd CATHODE AND THE ELECTROCHEMISTRY
Ken-ichiro OTA, Hideaki YOSHITAKE, Osamu YAMAZAKI, Masaki KURATSUKA Kazuhiko YAMAKI, Kotoji ANDO, Yoshihiro IIDA and Nobuyuki KAMIYA
Department of Energy Engineering, Yokohama National University, 156 Tokiwarlai, Hodogaya-ku, Yokohama 240 JAPAN
Abstract
The heat balances have been measured during the electrolysis in LiOD-D 20 solution using Pd and Pd alloy (Pd-Ag) cathodes. The flow calorimeter and the closed cell with Pd recombination catalysts were used for heat measurements. In the runs using the mechanically treated Pd cathodes, the small excess heat burst was observed 3 times out of 5 runs. However, the excess heat could not exceed 113 % (output power / input power). The amount of the absorbed hydrogen and lithium into Pd cathode was measured quantitatively. The H/Pd ratio reached the maximum at a certain electrolysis time and then decreased at the current density higher than 5 mA/cm 2 . Li inclusion in the Pd cathode was measured by SIMS. Li was found in Pd even at the low potential of -220 mV vs. RHE. The amount of Li near the electrode surface increased with the current densities.
Introdnedon The excess enthalpy during the heavy water electrolysis using Pd cathode mainly in LiOD solution has been reported by the several groups. In order to get the reproducibility of this phenomena, the electrochemistry especially in Li containing alkali solution the material science of Pd cathode should be clearly understood.
In our group the heat balances during the heavy water electrolysis have been measured by the flow calorimeter during the constant power electrolysis in the thermochemically closed cell. In this paper the effect of the mechanical treatment of Pd metal on the excess heat have been studied.
In order to understand the electrochemical characteristics of Pd cathode in Li containing solutions, the behavior of Li and the hydrogen absorption should be elucidated, since hydrogen and Li can be easily included into Pd metal. In this paper the hydrogen absorption and the Li inclusion have been studied quantitatively in light water and discussed in relation to the overpotential of the Pd cathode.
HEAT MEASUREMENT
Experimental The heat balance measurements have been carried out in an acrylic electrochemical cell with the recombination catalyst. Using Pd catalyst, the recombination reaction proceeded completely up to
5-1
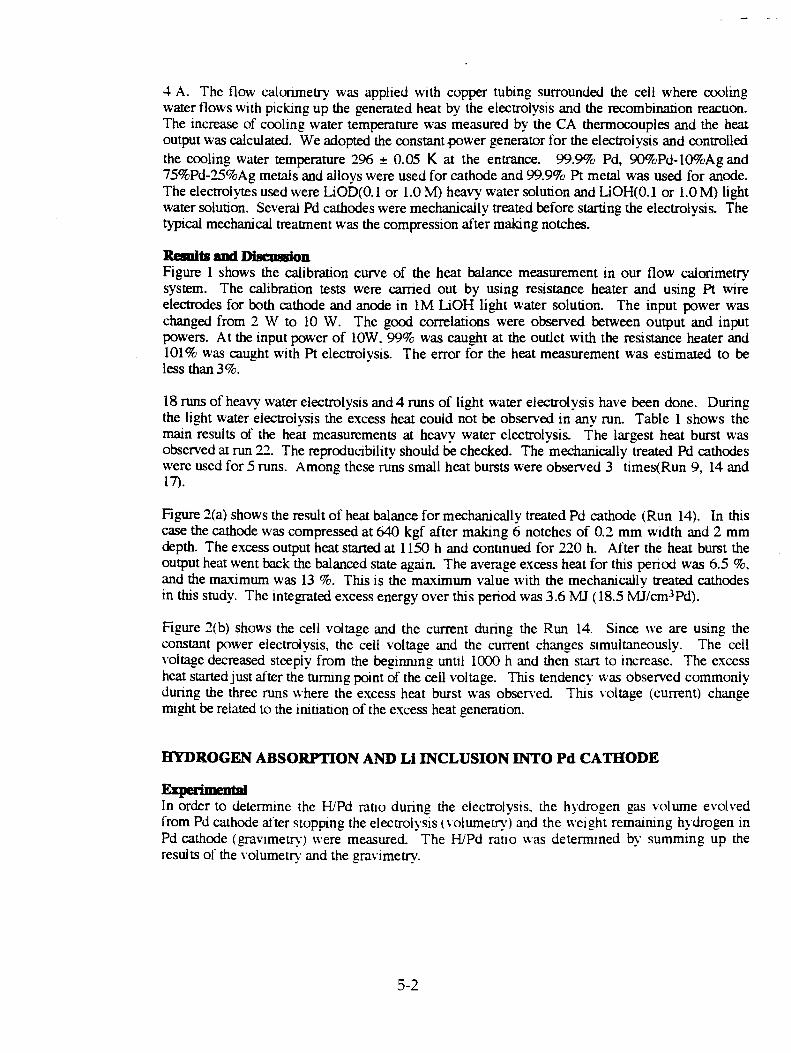
4 A. The flow calorimetry was applied with copper tubing surrounded the cell where cooling water flows with picking up the generated heat by the electrolysis and the recombination reaction. The increase of cooling water temperature was measured by the CA thermocouples and the heat output was calculated. We adopted the constant power generator for the electrolysis and controlled the cooling water temperature 296 ± 0.05 K at the entrance. 99.9% Pd, 90%Pd-10%Ag and 75%Pd-25%Ag metals and alloys were used for cathode and 99.9% Pt metal was used for anode. The electrolytes used were LiOD(0.1 or 1.0 M) heavy water solution and LiOH(0.1 or 1.0 M) light water solution. Several Pd cathodes were mechanically treated before starting the electrolysis. The typical mechanical treatment was the compression after making notches.
Results and Discussion Figure 1 shows the calibration curve of the heat balance measurement in our flow c,alorimetry system. The calibration tests were carried out by using resistance heater and using Pt wire electrodes for both cathode and anode in 1M LiOH light water solution. The input power was changed from 2 W to 10 W. The good correlations were observed between output and input powers. At the input power of IOW, 99% was caught at the outlet with the resistance heater and 101% was caught with Pt electrolysis. The error for the heat measurement was estimated to be less than 3%.
18 runs of heavy water electrolysis and 4 runs of light water electrolysis have been done. During the light water electrolysis the excess heat could not be observed in any run. Table 1 shows the main results of the heat measurements at heavy water electrolysis. The largest heat burst was observed at run 22. The reproducibility should be checked. The mechanically treated Pd cathodes were used for 5 runs. Among these runs small heat bursts were observed 3 times(Run 9, 14 and 17).
Figure 2(a) shows the result of heat balance for mechanically treated Pd cathode (Run 14). In this case the cathode was compressed at 640 kgf after making 6 notches of 0.2 mm width and 2 mm depth. The excess output heat started at 1150 h and continued for 220 h. After the heat burst the output heat went back the balanced state again. The average excess heat for this period was 6.5 %, and the maximum was 13 %. This is the maximum value with the mechanically treated cathodes in this study. The integrated excess energy over this period was 3.6 M1 (18.5 MJ/cm 3 Pd).
Figure 2(b) shows the cell voltage and the current during the Run 14. Since we are using the constant power electrolysis, the cell voltage and the current changes simultaneously. The cell voltage decreased steeply from the beginning until 1000 h and then start to increase. The excess heat started just after the turning point of the cell voltage. This tendency was observed commonly during the three runs where the excess heat burst was observed. This voltage (current) change might be related to the initiation of the excess heat generation.
HYDROGEN ABSORPTION AND Li INCLUSION INTO Pd CATHODE
Experimental In order to determine the H/Pd ratio during the electrolysis. the hydrogen gas volume evolved from Pd cathode after stopping the electrolysis volumetry) and the weight remaining hydrogen in Pd cathode (gravimetrv) were measured. The H/Pd ratio was determined by summing up the results of the volumetry and the gravimetrv.
5-2

99.9 % Pd foils (0.1 mm x 10 mm x 10 mm) were used for specimens and these were annealed at 1273 K for 12 h before use. Pt wire was used for anode. The electrolysis was carried out in the acrylic cell at the constant current densities of 0.5, 5, 50 and 500 mA/cm 2 . The temperature of electrolytes was kept at 298 ± 1 K.
For SIMS analysis, Pd cathode was removed from the cell, washed with Milli - Q water and transferred into vacuum immediately after the electrolysis and stored in N2 until the analysis. CAMECA 4f was used for SIMS analysis with 02+ ion as the primary ion. 0.8 % Pd - Li alloy was used for the reference material of 6Li+, 7Li+ / 1°6Pd+ signal intensity.
Results and Discussion Fig. 3 shows the relationship between the electrolysis time and the amount of absorbed hydrogen into Pd cathodes in LiOH (0.2 M). The H(gravimetry) is 0.71 after 30 h and is independent of the current density. On the other hand, the H(volumetry) changes with the current density. The higher value of H(volumetry) was obtained at higher current densities. The H/Pd ratio, especially H(volumetry), increases at the initial period, got the maximum and then decreased at the current density higher than 5 mA/cm 2. On the other hand, H/Pd reached 0.82 at 50 mA/cm 2 in H2SO4 (0.1 M) and it kept constant for about 500 h. The decrease of H/Pd might be caused by the Li in the solution or in the Pd cathode. In the case of 0.5 mA/cm 2 , however, no notable decrease was observed until 500 h. Finally, the H/Pd ratio got to 0.81 at 0.5 mA/cm 2 .
The maximum value of H/Pd at 500, 50 and 5 mA/cm 2 were 0.88, 0.85 and 0.82, respectively. The overpotentials of Pd cathode were 220, 370, 520 and 670 mV vs. RHE at 0.5, 5, 50 and 500 mA/cm2 , respectively. However, the obtained H/Pd ratio could not be explained by the simple the Nernstian equation, using the equilibrium gaseous hydrogen pressure 1 and the overpotential,.
Fig. 4 shows the depth profiles of Li in Pd cathode after electrolysis measured by SIMS. Since the surface was washed with water, the surface Li easily dissolved to water and was removed. In Fig. 4 the data near the Pd surface was eliminated. The surface concentration of Li can be obtained by the extrapolation of the line to the surface. The calculated surface concentration of Li and the diffusion coefficient of Li in Pd were summarized in Table 2. The surface concentration and the absorbed amount of Li becomes lager at the higher current densities. It is worthy of noting that Li was detected at the lowest current density, 0.5 mA/cm 2 . In this condition, the electrode potential was about -220 mV vs. RHE. It is not comparable to the empirical potential of UPD at -1.11 V 2 and even lower than the potential obtained by Enyo by the discontinuity of Tafel line (400mV) 3 .
This absorption of Li may affect the absorption or desorption reaction of hydrogen in Pd and probably relates with the decrease of the absorbed hydrogen.
Reference 1. H. Frieske. and W. Wicke. Physk. Chem.. 77, p.50 (1973)
2. D. M. Kolb. Advances in Electrochemistry and Electrochemical Engineering (H. Gerischer and
C. W. Tobias Eds.), Vol. 11, John Wiley & Sons, New York. 1978. pp.125 -271
3. M. Enyo, and P. C. Biswas. J. Electroanal. Chem., 335, p.309 (1992)
5-3

Table 1 Results of heat balance measurement
Run Electrolyte Pd sample Size
dia. x length (mm)
Treatment C.D. (mA/cm2)
Win (W)
Heat balance (%max)
1 0.1M LiOD 2 x 20 500 8.6 97 2 0.1M LiOD 2 x 20 600 —400 8.6 98 3 0.1M LiOD 2 x 20 420 8.6 103 5 1M LiOD 2 x 20 1260-770 10 102 6 1M LiOD 5 x 20 630--460 10 100 9 1M LiOD 5 x 20 DA 600-300 10 109 11 1M LiOD Ag 25% 2 x 20 A. 1400-530 10 99 12 1M LiOD 5 x 20 _ A 1000-500 10 103 13 1M LiOD Ag 10% 2 x 20 A 1500 — 900 10 99 14 1M LiOD Ag 10% 3 x 10 —A 890-r250 10 113 15 1M LiOD Ag 10% 2 x 20 A 990 ,--l30 5 100 16 1M LiOD Ag 10% 5 x 10 _A 570-490 5 101 17 1M LiOD Ag 10% 5 x 10 _, ,n, 490 —160 5 109 21 1M LiOD 4 x 15 270 —120 2 103 22 1M LiOD 4 x 15 ■ 260 —180 2 174
0: Mechanical treatment, Quench (1023 K), El: Anneal (673 K)
Table 2 Surface concentration and diffusion coefficient of Li in Pd (298 K).
C.D. / mAcm-2 Co / atom % D / cm2 s-1
500 7.2 5.8x 10⁻¹⁸
5 2.3 6.4x 10 -18
0.5 1.1 1.5 x 10' 17
5-4
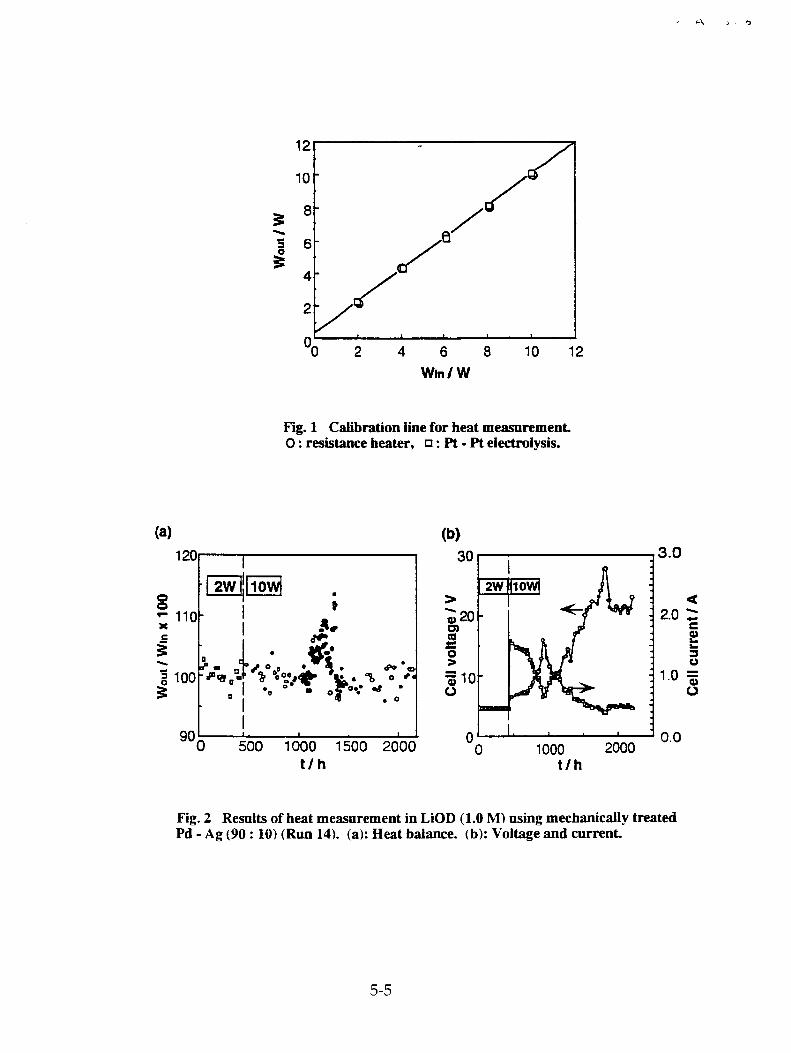
Fig. 1 Calibration line for heat measurement.. 0 : resistance heater, 0 : Pt - Pt electrolysis.
Fig. 2 Results of heat measurement in LiOD (1.0 M) using mechanically treated Pd - Ag (90 : 10) (Run 14). (a): Heat balance. (b): Voltage and current.
5-5
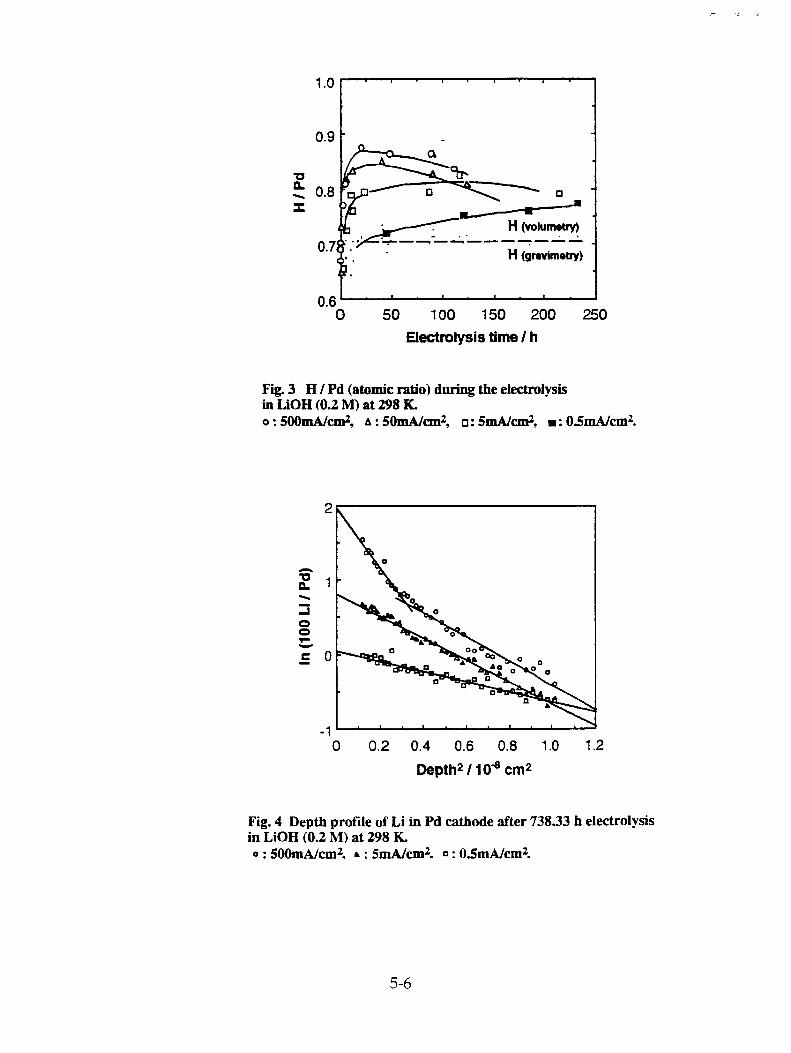
50 100 1 50 200 250 Electrolysis time / h
Fig. 3 H / Pd (atomic ratio) during the electrolysis in LiOH (0.2 M) at 298 K.
500mA/cm2, A : 50mA/cm2, o : 5mA/cm2, ■ : 0.5mA/cm2.
Fig. 4 Depth profile of Li in Pd cathode after 738.33 h electrolysis in LiOH (0.2 M) at 298 K. 0 : 500mA/cm2, • : SmA/cm2. 0 : 0..5mA/cm2.
5-6

HEAT AND HELIUM MEASUREMENTS IN DEUTERATED PALLADIUM
M. H. Miles B. F. Bush*
Chemistry Division, Research Department Naval Air Warfare Center Weapons Division
China Lake, CA 93555-6001 USA
Abstract
Metal flasks were used to collect electrolysis gas samples in Pd/D20 + LiOD and Pd/H20 + LiOH experiments in order to minimize effects due to helium diffusion through glass. For five control experiments yielding no excess power, the mean value for the background helium concentrations in our system was 4.4 ±0.6 ppb or 5.1 ±0.7 x 10 13 4He/500 mL. For five experiments producing excess power, the measured helium concentration was higher than the background level in each case. Three different laboratories have been used for measurements of the helium concentrations in various electrolysis gas samples from our experiments during the past three years. The chance probability of obtaining these heat-helium results for a total of 27 measurements due to random errors is extremely small. Furthermore, the helium measurements from all three laboratories yield helium production rates of 1011-1012 4Heis •w.
Introduction
Our previous results present a correlation between the measured excess power and helium production in D10-LiOD electrolysis cells using palladium cathodesl. The measured rate of 4He production (10 11-1012 4He/s •W) is the correct magnitude for typical deuteron fusion reactions that yield helium as a product. Because helium is present in the atmosphere (5.22 ppm), it is difficult to convince everyone that the 4He measured in the electrolysis gas is a product of a fusion reaction within the cell. It is indeed a very challenging experimental problem to clearly establish the production of 4He from Pd/D20 electrolysis cells. This situation is compounded by difficulties in obtaining large excess power effects in these experiments.
Table I presents the theoretical relationship between the excess power and helium production assuming 2D + 2 D -4 4He + 23.8 MeV as the major fusion reaction with the energy being deposited within the calorimeter. At low levels of excess power, the uncertainties in measurements of the helium and the excess power are rather large. When the excess power exceeds 0.2 W, however, it could be possible to correlate the rate of 4He production with proposed fusion reactions. It should be noted that for any given excess power, the helium concentration in the electrolysis gas stream will be inversely proportional to the current. For example, an experiment producing 0.500 W of excess power when
* Current address: SRI International, Menlo Park, CA 94025 USA
6-1

I = 250 mA would theoretically yield 112 ppb of 4He in the electrolysis gas stream.
Experimental
The electrolysis cells initially contained 16 cm 3 of 0.1 M LiOD + D20 (99.9%, Cambridge Isotope Laboratories) or 0.1 M LiOH + H20. The design of the electrolysis cells and calorimeters were similar to previous reports -4. The major difference was that electrolysis gas samples were collected in stainless steel metal flasks rather than the 500 mL Pyrex glass flasks used in previous experiments 1-3. Four identical metal flasks (numbered 1-4) and four similar calorimetric cells (A, B, C, D) were used in this study. The helium concentrations in the metal flasks were measured by a Department of the Interior (DOI) laboratory (Helium Field Operations, Amarillo, Texas). The standard deviation (a) for the measurement of the helium concentration was generally about ±1 part per billion (ppb).
Most of the palladium rod cathodes investigated in this study were obtained from Johnson Matthey. The Pd-Ag alloy cathode (4 mm x 1.6 cm) was loaned to us by Dr. Shinji Nezu of IMRA Japan. The palladium sheet cathode (1.0 mm x 3.2 mm x 1.6 cm) was cut from a sample loaned to us by Tanaka Metals (Japan). Two palladium rod cathodes (1 mm x 1.5 an and 2 mm x 1.2 cm) were produced by Johnson Matthey (UK) using the "original recipe" and were loaned to us by Dr. Haven E. Bergeson of the University of Utah.
Results
Helium measurements in D20 and H20 control experiments are presented in Table II. Stainless steel metal flasks were used to collect the electrolysis gas samples in order to minimize atmospheric contamination due to helium diffusion through glass2 . The helium concentrations in Table II support a detection limit of approximately 10 13 4He/500 mL in these experiments as reported previously2 . The measured helium concentrations in these control experiments yield a mean value of 4.4 ±0.6 ppb or 5.1 ±0.7 x 10 13 4He/500 mL.
For experiments producing excess power, five helium measurements using these same metal flasks have been completed. These experiments are shown in Table III and yield a mean value of 1.4 ±0.7 x 10 11 4He/s•W after correcting for background levels of helium measured in control studies (Table II). This value is the correct magnitude for typical deuteron fusion reactions that yield 4He as a product2. It is interesting to note from Table Di that the two palladium rods produced by Johnson Matthey using the "original recipe" yielded excess power. The palladium sheet from Tanaka Metals also produced excess power. The excess power density is greater than 1 W/cm3 Pd for each of these three cathodes. However, the excess power levels measured during the collection of the gas samples in these new experiments were only 0.1 W or less, hence experimental errors are rather large (Table I). Further experiments using metal flasks are needed that involve equal numbers of control cells and cells producing
6-2

large excess power effects. This should provide additional statistical evidence regarding helium production in Pd/D20 electrolysis cells.
Table II shows that no measurable differences occur in background levels of 4He over a time period exceeding four months. Nearly identical 4He concentrations are obtained for the electrolysis cell C gas sample collected on 24 February 1993 and then again in a different experiment on 7 July 1993. Furthermore, Table II, illustrates that the particular metal flask used produces no significant difference in the 4He result. The lowest 4He concentration (3.4 ±1.1 ppb) was obtained using metal flask #4. However, the highest 4He concentration (9.7 ±1.1 ppb) was obtained using this same metal flask in an experiment producing excess power (Table III).
Discussion
The likely source of the measured helium concentration in the control experiments (Table II) is the diffusion of atmospheric helium through the glass in the system and through the thick-walled rubber tubing that connects the electrochemical cell, collection flask, and oil bubbler 3. The contribution of atmospheric helium that diffuses through the glass in a system can be calculated by the equation
q = 10/d (1)
as discussed previouslyL2 . For Pyrex glass with surface area of 300 cm 2 and thickness (d) of 1.8 mm, Equation 1 yields 2 x 10 11 4He/500 mL when I = 500 mA (500 mL of D2 + 02 gas is generated in 4870 seconds at 23°C and 700 torr). This amount of 4He is more than two orders of magnitude smaller than the measured helium levels in the control experiments (Table II). Thus diffusion of atmospheric helium through the thick-walled rubber tubing is the major source of helium in our control experiments. This conclusion is supported by measured diffusion rates of helium through rubber tubing 5.
The background helium concentration of 4.4 ±0.6 ppb or 5.1 ±0.7 x 10 13 4He/500 mL determined in this study (Table 11) is a very important result for several reasons. First, it clearly establishes a minimum helium detection limit for our previous studies 1-3 of about 5 x 10 13 4He/500 mL. This places our helium production rate for that set of experiments at 1011_1012 4He /s •W as reported previously2'6 . Furthermore, this background level of helium in our system explains why the effect of atmospheric helium diffusing into our glass flasks during storage and shipment was not observable in experiments involving the analysis of our electrolysis gas samples at the University of Texas 1-3. The experimental rate of atmospheric helium diffusion into our Pyrex glass flasks when filled with H2 or D2 + 02 is 1.96 ±0.34 x 10 12 atoms/day as measured by Rockwell Internationale. Based on this result, it would require 26 days before the atmospheric diffusion of helium into our glass flasks would equal the minimum helium detection limit for those studies 1-3 .
6-3

The excellent reproducibility of our background helium levels (5.1 ±0.7 x 10 13 4He/500 mL, Table II) establishes the significance of three previous heat and helium measurements where our electrolysis gas samples were analyzed by Rockwell International2,6 . The reported 4He measurements per 500 mL were 1.34 x 10¹⁴, 1.05 x 10 14, and 0.97 x 10 14 atoms with a standard deviation of ±0.01 x 10 14
atoms (±0.1 ppb) for experiments with excess power of 100 mW, 50 mW, and 20 mW, respectively 6. This is the most precise helium measurements reported for any of our gas samples. These results were obtained by extrapolating back to zero flask storage time to eliminate the effect of atmospheric helium diffusing into the Pyrex glass flasks (see Fig. 2 of Ref. 2). The experiment with the largest excess power yielded the largest amount of helium. This highest value of 1.34 x 10¹⁴ 4He/500 mL gives a 12 a effect above background based on the standard deviation for the background helium (Table II). Furthermore, the difference between the highest and lowest concentrations of 4He in the Rockwell measurements is a 37 a effect based upon their reported standard deviation. These three experiments involving measurements by Rockwell International give a mean value of 3.0 ±1.7 x 10 11 4He/s•W6. The two best experiments, however, were in excellent agreement and yielded 2 x 10 11 4He/seW for both measurements6. Simple calculations using the differences between 4He concentrations and excess watts yields 1 x 10 11 4He/s•W for the Rockwell meeasurements6.
In summary, our first set of heat and helium measurements (1990-1991) using Pyrex glass flasks resulted in eight experiments that yielded excess power and measurable helium 1-3 . Six control experiments gave no excess power and no detectable helium1-3 . The probability that this first set of results could be obtained by random errors is Pi = (1/2) 14 = 1/16,384. One experiment was omitted from this set due to a very low D20 level that exposed the palladium cathode to D2 and 02 gases 12.
Our second set of heat and helium measurements (1991-1992) using Pyrex glass flasks involved three experiments that gave excess power and excess helium production.2,6 Extrapolations to zero time eliminated the effect of atmospheric helium diffusion into the glass flasks. The probability of obtaining this second set of results by random errors is P2 = (1/2)3 = 1/8.
Our third set of heat and helium measurements (1993) involved metal collection flasks to minimize diffusion effects due to atmospheric helium. Five control experiments yielded no excess power and established a background helium level of 4.4±0.6 ppb for our system (Table II). Five additional experiments yielded excess power and excess helium production. The probability that this third set of results could be produced by random errors is P3 = (1/2) 10 = 1/1,024.
Finally, the probability that all three sets of experimental results could be due to random errors is given by
1 1 1 p = pie p2e p3= (_)14.(_)3,(_yo = 2 / 2 134,217,730
(2)
6-4

Much better odds exist for winning the California State Lottery. No experiments were omitted from these three studies other than the one experiment in the first set. Three different laboratories were used for the measurements of helium in the electrolysis gas samples. All three sets of experiments gave helium production rates of 1011 -1012 4Heis•W. The more accurate helium measurements place this value closer to 10 11 4He/seW.
Acknowledgments
We thank Tanaka Metals for the loan of the palladium sheet samples, Dr. Shinji Nezu for the loan of Pd-Ag rod, and Dr. Haven E. Bergeson for the loan of two palladium rods. We thank David L. Miles for the computer analysis and display of the experimental data. We also thank Mary Garasu and the Joint Training Partnership Act Summer Youth Training Program for her experimental and computer assistance.
References
1. M. H. Miles, R. A. Hollins, B. F. Bush, J. J. Lagowski, and R. E. Miles, "Correlation of Excess Power and Helium Production During D20 and H20 Electrolysis Using Palladium Cathodes," J. Electroanal. Chem., Vol. 346, pp. 99-117 (1993).
2. M. H. Miles and B. F. Bush in Frontiers of Cold Fusion, H. Ikegami, Editor, Tokyo, Japan: Universal Academy Press, 1993, pp. 271-278.
3. B. F. Bush, J. J. Lagowski, M. H. Miles, and G. S. Ostrom, "Helium Production During the Electrolysis of D20 in Cold Fusion Experiments," J. Electroanal. Chem., Vol. 304, pp. 271-278 (1991).
4. M. H. Miles, K. H. Park, and D. E. Stilwell, "Electrochemical Calorimetric Evidence for Cold Fusion in the Palladium-Deuterium System," I. Electroanal. Chem., Vol. 296, pp. 241-254 (1990).
5. T. Davidson, U.S. Department of the Interior, Bureau of Mines, Helium Field Operations, Amarillo, Texas, personal communication.
6. M. H. Miles, B. F. Bush, and J. J. Lagowski, "Anomalous Effects Involving Excess Power, Radiation, and Helium Production During D20 Electrolysis Using Palladium Cathodes," Fusion Technology (accepted for publication).
6-5

Table I. Theoretical Relationship Between Excess Power and Helium Production. Magnitude of Experimental Errors.
Px (W)
4Hea (ppb)
4He (atoms/500 mL)
4He Errorb (%)
Calorimetric< Error (%)
0.050 5.6 6.38 x 10 13 18 a
a a
•cr C•1
1-4
0.100 11.2 1.28 x 10 14 8.9 0.200 22.4 2.55 x 10¹⁴ 4.5 0.500 56.0 6.38 x 10 14 1.8 1.000 112.0 1.28 x 10¹⁵ 0.9
a For I = 500 mA assuming 2D + 2D -4 4He + 23.8 MeV is the fusion reaction.
b ±1 ppb. ±0.020 W.
Table II. Helium Measurements in Control Experiments Using Metal Flasks. No excess power was measured.
Electrode Flask/cell
(date) 4Hea - (ppb)
4He (atoms /500 mL)
Pd Rodb 1 /C 4.8 ±1.1 5.5 x 10¹³ (4 mm x 1.6 cm) (2/24/93)
PdAg Rodb 2/D 4.6 ±1.1 5.2 x 10 13 (4 mm x 1.6 cm) (2/24/93)
Pd Rodb 3/C 4.9 ±1.1 5.6 x 10¹³ (4 mm x 1.6 cm) (2/24/93)
PdAg Rodb 4/D 3.4 ±1.1 3.9 x 10¹³ (4 mm x 1.6 cm) (2/28/93)
Pd Rodc 3/C 4.5 ±1.5 5.1 x 10¹³ (1 mm x 1.5 cm) (7/7/93)
(Mean) (4.4 ±0.6) (5.1 ±0.7x 10 13) a Helium analysis by U.S. Bureau of Mines, Amarillo, Texas. b D20 + LiOD (I = 500 mA). H20 + LiOH (I = 500 mA).
6-6

Table III. Helium Measurements Using Metal Flasks. Experiments Producing Excess Power.
Electrode Flask /cell
(date) 4Hea (ppb)
Px (W) 4He/s•Wb
Pd Sheets 3/A 9.0 ±1.1 0.055 1.6 x 10¹¹ (1.0 ram x 3.2 mm x 1.6 an)
(5/21/93)
Pd Rodc 4/B 9.7 ±1.1 0.040 2.5 x 10¹¹ (1 mm x 2.0 cm) (5/21/93)
Pd RodC 1/C 7.4 ±1.1 0.040 1.4 x 10 11 (1 mm x 1.5 cm) (5/30/93)
Pd RodC 2/D 6.7 ±1.1 0.060 7.0 x 10¹⁰ (2 mm x 1.2 cm) (5/30/93)
Pd Rodd 1/A 5.4 ±1.5 0.030 7.5 x 10 10 (4 mm x 2.3 cm) (7/7/93)
a Helium analysis by U.S. Bureau of Mines, Amarillo, Texas. b Corrected for background helium level of 5.1 x 10 13 4He/500 mL. C D20 + LiOD (I = 400 mA). d D20 + LiOD (I = 500 mA).
6-7


SUBTRACTION OF A NEW THERMO-ELECTROCHEMICAL EFFECT FROM THE EXCESS HEAT, AND THE EMERGING AVENUES TO COLD FUSION
Peter H. Handel Dept. of Physics and Astronomy, Univ. of Missouri, St. Louis, MO 63121
Abstract A new thermo-electrochemical effect similar to the thermoelectric effects
known from solid state physics is introduced into the analysis of the enthalpy balance in electrochemistry. On this basis a new source of excess heat is defined, estimated and compared with the experiment. Most of the observed excess heat has the same current dependence as this new effect. The earlier irreproducibility of cold fusion excess heat in different laboratories is also interpreted on this basis. An optimistic outlook is presented for cold fusion nevertheless.
I. Introduction
Accelerated by the experimental observation of excess heat in heavy-water electrolytic cells by Pons and Fleischmannl, cold fusion research has polarized the scientific community more than any other subject. Although the scientists involved in electrolytic cold fusion studies were bona fide investigators of a mind boggling puzzle which defied all attempts of scientific explanation, they were often ridiculed by members of the scientific community, who had no explanation for the excess heat phenomenon either 2 . In spite of the lack of public support, these scientists continued the research of the excess heat phenomena with great personal sacrifices, trying to improve the reproducibility and the magnitude of the observed excess heat, while searching also for nuclear byproducts such as neutrons, tritium, He3, and y rays. This search remained relatively unsuccessful, with nuclear byproducts observed at rates close to the background, a factor of 10 8 below the level consistent with the observed excess heat. This prompted many well-known scientists to explore the possibility of non-radiative transitions of a pair of deuterons into tritium or He4 with no nuclear byproducts, except for protons from the tritium channel3. These theoretical studies did not reveal any processes leading to large enough reaction rates, although a source of possible irreproducibility of the excess heat was found 4 .
The present paper examines the known energy balance of electrolysis, showing that a major heat (more precisely enthalpy) source term has been ignored in all known studies of this subject. In Sec. II we introduce and define the thermo-electrochemical effect which generates the new heat source term. This way, electrolytic cold fusion research is put on a more rigorous scientific basis, allowing for the first time a consistent definition of the excess heat, and eliminating a major source of uncontrollable irreproducibility in the calorimetry of electrolytic cells or molten salt cells. The results are compared with the experimental evidence in Sec. III. The paper also examines the main paths of achieving cold fusion and the prospects of cold fusion research in Sec. IV.
7-1
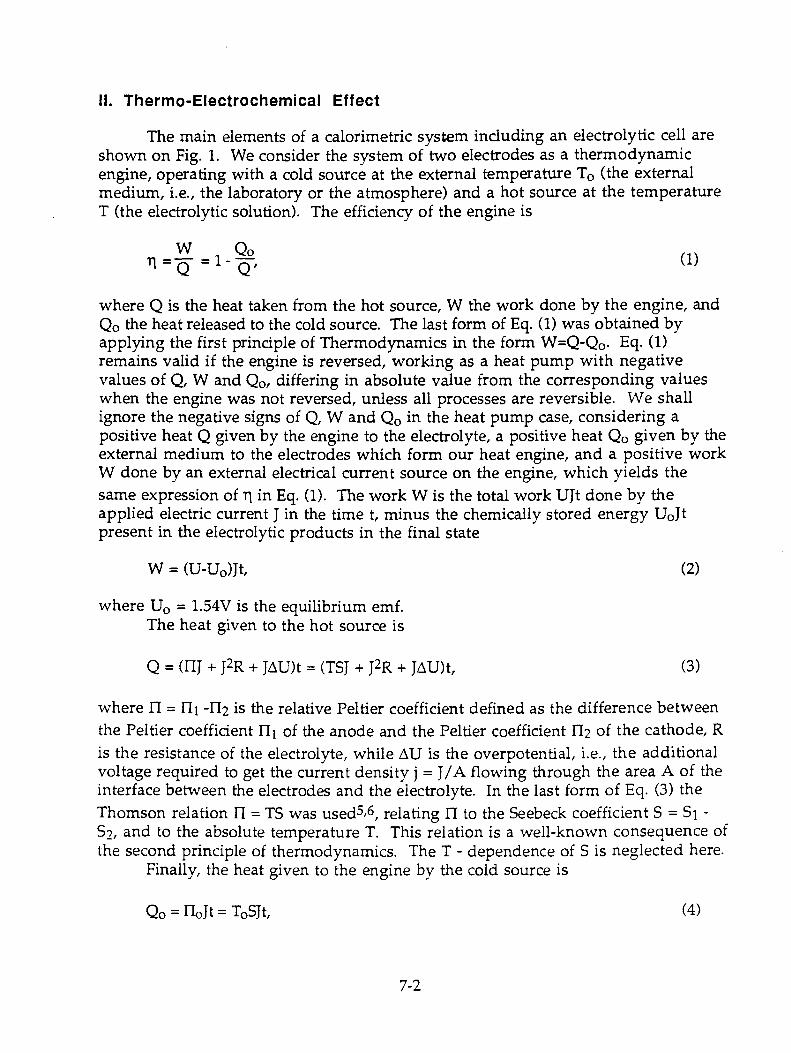
11. Thermo-Electrochemical Effect
The main elements of a calorimetric system including an electrolytic cell are shown on Fig. 1. We consider the system of two electrodes as a thermodynamic engine, operating with a cold source at the external temperature To (the external medium, i.e., the laboratory or the atmosphere) and a hot source at the temperature T (the electrolytic solution). The efficiency of the engine is
W i C20 1.1 = --cr = i - Q , (1)
where Q is the heat taken from the hot source, W the work done by the engine, and Q0 the heat released to the cold source. The last form of Eq. (1) was obtained by applying the first principle of Thermodynamics in the form W=Q-Q 0 . Eq. (1) remains valid if the engine is reversed, working as a heat pump with negative values of Q, W and Q0, differing in absolute value from the corresponding values when the engine was not reversed, unless all processes are reversible. We shall ignore the negative signs of Q, W and Q 0 in the heat pump case, considering a positive heat Q given by the engine to the electrolyte, a positive heat Q0 given by the external medium to the electrodes which form our heat engine, and a positive work W done by an external electrical current source on the engine, which yields the same expression of il in Eq. (1). The work W is the total work UJt done by the applied electric current J in the time t, minus the chemically stored energy U oJt present in the electrolytic products in the final state
W = (U-U0)jt, (2)
where U0 = 1.54V is the equilibrium emf. The heat given to the hot source is
Q = (IIJ + J2R + JAU)t = (TSJ + J 2R + JAU)t, (3)
where II = 1-11 -II2 is the relative Peltier coefficient defined as the difference between the Peltier coefficient Hi of the anode and the Peltier coefficient II2 of the cathode, R is the resistance of the electrolyte, while AU is the overpotential, i.e., the additional voltage required to get the current density j = J/A flowing through the area A of the interface between the electrodes and the electrolyte. In the last form of Eq. (3) the Thomson relation II = TS was used5 '6 , relating II to the Seebeck coefficient S = Si -S2, and to the absolute temperature T. This relation is a well-known consequence of the second principle of thermodynamics. The T - dependence of S is neglected here.
Finally, the heat given to the engine by the cold source is
Qo = noJt = ToSJt, (4)
7-2

where 110 is the relative Peltier coefficient of the two electrodes at the ambient temperature To .
Substituting Eqs. (2)-(4) into Eq. (1), we obtain, after simplifying with Jt
W/Q = (T-T0)S+JR+AU U-U0
TS+JR+AU =
TS+JR+AU
In the reversible limit defined by j-40 we assume that AU—+0 and obtain from Eq. (5)
rl=1 - T0/T, (6)
in agreement with the second principle of thermodynamics. In Eq. (6) we assumed the overpotential AU=U-Uo -JR-(r-To)(Si-S2) to vanish
in the reversible limit of small current densities j. The connection between AU and j is given by the Tafel law in the implicit form given by Erdey-Gruz and Volmer 8
j= Atexp[-cce.AU/kT] - exp[(1-cc)eAU/kT1) (7)
where A is a factor independent of j and AU, 0<a<1 is a fraction distributing the overpotential over the two electrodes, and k is Boltzmann's constant. The last approximation, valid only in the limit of very small j and AU values, shows that AU can be made arbitrarily small by increasing the area of the electrodes and by reducing the total current J, which also reduces the ohmic voltage drop (reversible limit). Thus, AU vanishes indeed in the (reversible) low j limit.
The efficiency r allows us to calculate the excess heat fraction
which is the perceived excess heat of thermo-electrochemical origin, obtained per unit of applied work W. This quantity is a more convenient indicator of the obtained thermo-electrochemical excess heat than n. The arrow indicates the reversible limit in Eq. (8). It is remarkable that in the reversible limit the excess heat Traction becomes infinite for T=T o . We conclude that in a flow-through calorimetric experiment with T close to T o an infinite amount of thermo-electrochemical excess heat can be obtained from each Joule of expended energy. Some examples of expected excess heat values are presented in Table 1 below. Table 1 also gives the excess heat fraction E' obtained by considering the chemically stored energy as a part of W, which is in fact incorrect, but which is necessary in the case of closed cells where the gasses produced in the electrolytic process recombine catalytically in the system. Indeed, in this case the recombination heat becomes indistinguishable from the other heat or enthalpy contributions. One obtains in this case
(5)
7-3

T S ToS E,_ 0 _ U [uo-FAU+(T-To)S+JR]
(9)
The presence of the large term U0 in the denominator of this expression causes it to be very small in a misleading way, and keeps it from going to infinity in the reversible limit. The excess heat fractions are calculated in Table I for three examples of cells at j = 100 mA/cm 2 .
Table 1
Cell Electrodes T TQ S1 S2 S 11 AU+JR e% E'%
OK OK p.V/K p.V/K 11.V /K mV mV
I. 1)Pt ; 2)Pd 301 299 -5.14 -10.7 5.56 1.67 56 2.96 0.1
II. 1)Fe; 2)Ni 301 299 15 -19.4 34.4 10.3 30 34.3 0.7
III.1)Pt; 2)Ni 301 299 -5.14 -19.4 13.9 4.28 16 26.7 0.28
Table 1.: Thermo-electrochemical excess heat for Pt/Pd, Fe/Ni and Pt/Ni cells.
The values of the thermopower S in this table have been taken from Landolt-Bornstein 9 and are for metals of high purity. Impurities usually present in the electrodes can cause S to differ by as much as two orders of magnitude.
III. Comparison with the Experimental Evidence
The excess heat percentages in Table 1 are referred to the total energy input W into the cell from the time when the current has been first applied to the cell. On the other hand, the observed heat release from electrolytic cells is very non-uniform in time and reflects the presence of other terms in the heat balance equation, such as the heat of solvatation (which changes sign in hydrogen-absorbing materials at high concentrations of hydrogen or deuterium, the process becoming endothermic), exo-thermic release of deuterium (often initiated when the temperature is changed), or even partial catalytic oxidation with water formation in open cells. Thermo-electro-chemical excess heat can be stored and used to provide for solvatation heat at high
7-4

deuterium concentrations, remaining entirely unnoticed, while the heat emission connected with a sudden deuterium release, or release during several hours or days, can be mistaken for genuine excess heat, and considered too large to be explained by Eqs. (8) - (9). Therefore, only an energy balance extended over the entire period of operation of the electrolytic cell, with all terms included for the duration of the entire experiment, can be used as a basis for identifying true excess heat.
The main earmark of the thermo-electrochemical excess heat M on) concept introduced in this paper is its proportionality with the total electric charge (It) which has passed through the electrolytic cell, or the proportionality of the excess power produced (III) with the average current I. This characteristic proportionality was present from the beginnings, as we see in Table 2, and can be expressed with the help of an effective Peltier coefficient II eff• In Table 2 below we list the current densities j, the measuredl excess heat percent 8, the corresponding cell voltages U implied by the listed current and excess heat valuesl, and the effective Peltier coefficient 1eff=ToSeff=(U-U0)8/100 obtained from Eq. (8) above.
Table 2
Current Density Excess Heats Cell voltage Eff. Peltier Coefficient
nefr---ToSeff
mA/cm2 % V mV
8 23 3.22 390
6 4 1 9 3.65 390
512 5.5 8.9 400
Table 2.: Measuredl values of the excess heat percent and cell voltage for various current densities, indicate the presence of a constant effective II.
The observed values of II and S are more than 200 times larger than the values calculated in Table 2 assuming constant excess heat power all the time. They are of the order of values measured in semiconductors, rather than in metals. This is primarily because excess heat appears over a shorter period, only intermittently, while the action of the thermo-electrochemical effect is always present. If the excess heat was noticed only for a fraction f of the total time during which the constant current was flowing through the cell, we should compare II and S with tTI eff and fSeff respectively. In Table 2, we may have f=0.5 %.
The proportionality of excess power with the constant current applied to the cell is evident in most if not all excess heat measurements to date. A particularly clear example is on page 15 of the last Conference Proceedings -10 in this series, which allows to define II = 150 mV/K. More research is needed to separate true fusion heat.
It is important to note that the thermo-electrochemical excess heat introduced
7-5

here can be automatically compensated by enclosing the connection of the electrodes with identical (e.g., copper) wires in the calorimeter together with the electrolytic cell itself, as indicated by the dotted adiabatic surface B. We have to consider the use of configuration B as the likely cause of the negative results, and the use of both A and B by different investigators as the likely cause of the well-known irreproducibil-ity of cold fusion results.
The above discussion should not be interpreted as a claim that excess heat from cold nuclear fusion does not exist. The present paper only introduces a new mechanism of excess heat, which was never considered before in electrochemistry and in cold fusion research, and suggests a careful reexamination of all previous measurements and a careful planning of all future experiments on this basis.
IV. The Main Paths to Cold Fusion
The main difficulty in cold fusion is expressed by the extreme smallness of the fusion cross sections at low energies, and even at energies in the KeV range. This causes more losses of energy than can be recovered from the fusion reactions. As long as we are unable to recover this large lost energy, the only way to improve the energy balance is to increase the fusion cross sections.
The fusion cross sections are small because of the large Coulomb barrier. This barrier can be reduced with the help of negatively charged mesons, such as mesons, binding together a pair of hydrogen isotope nuclei. After catalyzing a fusion, the muon continues to catalyze other fusions with large probability. Experiments at the Los Alamos Meson Physics laboratory have demonstrated yields of 150 fusions per muon, with energy liberation close to 3 GeV per muon. There are indications that 300 fusions per muon are possible. The present estimate of the average accelerator beam energy needed to produce a muon is about 5 Gev, although the theoretical limit is below 2 GeV.
Various forms of muon-catalyzed fusion reactors are presently envisioned. Although pure fusion is not energetically solvent today, fusion-fission hybrids combined with a spallation breeder would require only 100 fusions per muon and would yield net energy gain today even if the energy expenditure per muon stays as high as 5 GeV. Modern concepts try to avoid the need to produce intermediate pi-meson and muon beams. Synergetic systems of this kind use the deuterium-tritium mixture both as the target for muon production and as the fuel for the subsequent muon-catalyzed fusion process.
Many-body effects can also be used to enhance the ridiculously low natural fusion rates. As was shown previously, the very large effective masses of electrons in some rare-earth combinations are similar to the mass of the muon, although this similarity neglects the anisotropy and is limited to the less important long wave-length region. Nevertheless, it leads to a large increase of the hydrogen binding en-ergy in metals with increased electronic effective masses4 . This shows that the large effective masses have a considerable effect in bringing the hydrogen nuclei closer.
We conclude that cold fusion research is not less likely to lead to a solution of our energy problems than magnetically confined hot fusion, or inertial fusion.
7-6

V. References
1. M. Fleischmann, S. Pons, and M. Hawkins, J. Electroanal. Chem. 261, 301-308 (1989); Erratum 263, 187 (1989). This experiment uses the calorimeter wall of type A in Fig. 1.
2. See, e.g., F. Close, Too Hot to Handle, W.H. Allen Publ. Co., London 1990. 3. J. Schwinger, "Nuclear Energy in an Atomic Lattice", Proc. 1St Ann.Conf.
on Cold Fusion, NCFI Press (390 Wakara Way, Salt Lake City, UT), 1990, p. 130; also Z. Physik D15, 221 (1989).
4. P.H. Handel: "Reformulation of the Cold Fusion Problem: Heterogeneous Nucleation - A likely Cause of the Irreproducibility and Intermittency of Cold Fusion Observations". I. Annual Conf. on Cold Fusion, Salt Lake City, Utah, March 28-31, 1990.
5. J. Tauc, Photo and Thermoelectric Effects, Pergamon, Oxford 1962. 6. K.W. Boer, Survey of Semiconductor Physics, Van Nostrand 1990, pp. 754-
758. 7. P.H. Handel, Phys. Rev. B11,1595-1599 (1975). 8. T. Erdey-Gruz and M. Volmer, Z. Phys. Chem. 150, 203 (1930). 9. Landolt-Bornstein: Tables of Physical Data, Sixth edition, Springer Verlag. 10. H. Ikegami (Editor): Frontiers of Cold Fusion. Tokyo, Japan, Universal
Academy Press, 1993.
7-7

Fig. 1. Thermo-electrochemical effect in a Pt/Pd cell: The work input
UJ=fExHda and the heat transport ru from the environment into the
electrolytic cell. U is the applied voltage, J the current, and II=1 -11-112 a
Peltier coefficient. Excess heat is observed if no enclosure is used, or if
enclosure A is used. No excess heat is observed when enclosure B is used,
encompassing both the hot and cold source.
7-8
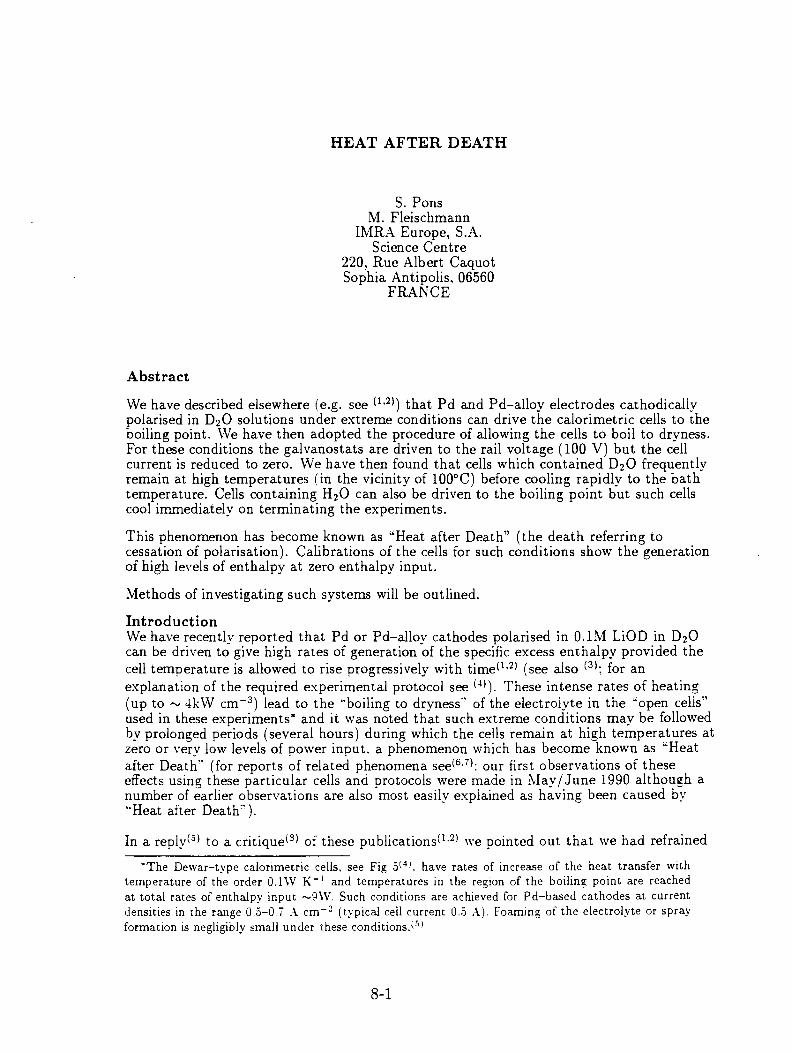
HEAT AFTER DEATH
S. Pons M. Fleischmann
IMRA Europe, S.A. Science Centre
220, Rue Albert Caquot Sophia Antipolis, 06560
FRANCE
Abstract
We have described elsewhere (e.g. see ( 1 . 2) ) that Pd and Pd-alloy electrodes cathodicallv polarised in D 2 0 solutions under extreme conditions can drive the calorimetric cells to the boiling point. We have then adopted the procedure of allowing the cells to boil to dryness. For these conditions the galvanostats are driven to the rail voltage (100 V) but the cell current is reduced to zero. We have then found that cells which contained D 2 0 frequently remain at high temperatures (in the vicinity of 100°C) before cooling rapidly to the bath temperature. Cells containing H 2 0 can also be driven to the boiling point but such cells cool immediately on terminating the experiments.
This phenomenon has become known as "Heat after Death" (the death referring to cessation of polarisation). Calibrations of the cells for such conditions show the generation of high levels of enthalpy at zero enthalpy input.
Methods of investigating such systems will be outlined.
Introduction We have recently reported that Pd or Pd-alloy cathodes polarised in 0.1M LiOD in D 2 0 can be driven to give high rates of generation of the specific excess enthalpy provided the cell temperature is allowed to rise progressively with time(L 2) (see also (3); for an explanation of the required experimental protocol see ( 4) ). These intense rates of heating (up to ti 4kW cm -3 ) lead to the "boiling to dryness" of the electrolyte in the "open cells" used in these experiments* and it was noted that such extreme conditions may be followed by prolonged periods (several hours) during which the cells remain at high temperatures at zero or very low levels of power input, a phenomenon which has become known as "Heat after Death" (for reports of related phenomena see (6 . 7) : our first observations of these effects using these particular cells and protocols were made in May/June 1990 although a number of earlier observations are also most easily explained as having been caused by "Heat after Death").
In a reply (5) to a critique ( s ) of these publications(" ) we pointed out that we had refrained
The Dewar-type calorimetric cells, see Fig 5( 4 ), have rates of increase of the heat transfer with temperature of the order 0.1W K -1 and temperatures in the region of the boiling point are reached at total rates of enthalpy input —PW. Such conditions are achieved for Pd-based cathodes at current densities in the range 0.5-0.7 A cm -2 (typical cell current 0.5 A). Foaming of the electrolyte or spray formation is negligibly small under these conditions.(' )
8-1

from interpreting the "Cooling Curves" which-characterise these episodes of "Heat after Death" because we believed that the calorimeters used are not well suited for making exact evaluations under such conditions. In the present paper we outline a number of possible approaches to the analysis of these "Cooling Curves." The results obtained show that our initial assessment of the performance of the calorimeters was too pessimistic: in the absence of excess enthalpy generation thermal balances can be made at the 2-3% level in gas filled cells and these errors can decrease to —0.5% in the presence of excess enthalpy generation.
Experimental The experimental methods and protocols used were closely similar to those which we have described in earlier publications( 1,2,3,9,10) see also(4)). The single compartment Dewar-type electrochemical cells were maintained in water thermostats (up to 4 cells in each thermostat). The temperature of the thermostats was set equal to that of the room housing the experiments; the temperature of the room was controlled to ±0.5°C using two separate control systems. The thermostats were cooled at a controlled rate using subsidiary cooling systems and heated using Techne Te-8A stirrer/temperature control units. We have found that it is possible to control the temperature of each thermostat to within ±0.003°C locally and ±0.01°C overall by adopting this particular strategy (16 thermostats housed in the single thermostatted room). This level of control is essential in order to achieve accurate analyses of the behaviour of the calorimeters (see further below).
The protocols for carrying out the experiments were also similar to those which we have described previously. The electrodes were first charged galvanostatically at low to intermediate current densities for prolonged periods of time; the current density was then raised and this raising of the current density caused a progressive increase of the temperature of the caloriometers up to the region of the boiling point of the electrolyte. Calibrations of the cells were carried out at stated intervals (every 2 days) throughout these two stages by applying constant currents to resistor chains (high stability metal film resistors maintained in heat transfer oil in glass tubes); the voltages developed across the resistor chains were monitored continuously. The heat transfer coefficients for the cells were derived using the methods of analysis described in a further paper presented at this Conference. (4)
The cells were refilled every two days to make up for losses of D 2 0 due to electrolysis (and due to evaporation at the higher temperatures). The records of the additions show that the Faradaic efficiencies for the electrolyses are close to 100%. As we have noted previously this fact alone is sufficient to show that the reduction of oxygen at the cathodes is negligibly small (deuterium generated at the cathodes cannot be reoxidised at the oxide coated Pt-anodes; for further evidence for negligible reduction of oxygen at the cathodes see(4 )). It is important to note that the rate of excess enthalpy generation is zero or positive over the whole period of operation for cells operated using these particular protocols: there is therefore no mechanism for storing energy which could be released when polarisation is interrupted.
Cell and bath temperatures were measured using high stability thermistors ( Thermometrics Ultrastable Thermistors. kS2 ±0.02% stability per year) which were calibrated against National Bureau of Standards calibrated thermometers. The thermistor assembly is shown in Fig 5 of ( 4) . Cell temperatures were recorded every 300 s: circuits were maintained open for 290 s then closed and readings were taken during the last 1 s using Keithley 199 DMM Scanner Multiscanner Units interfaced to a Compaq 386s/20 computer.
8-2

The only major change to the calorimeters compared to the instruments described in our earlier publications was the addition of a Pt-wire helical resistor to -empty" cells. This was driven galvanostatically with power inputs in the range 0.1 to 9 W. It was found that the cell temperatures reached constant plateau values at long times (constant to within ±0.005°C); with this range of power inputs the range of the plateau temperatures straddled the operating range of the calorimeters, 20°C< 0cell <100°C. Heat transfer coefficients were determined from the plateau values of the temperature using the simple relation
RObath AO)4 — °Ltd
(all symbols are defined in the glossary of symbols).
Following the interruption of the galvanostatic polarisation of the resistive heater, the cooling curves for such empty cells were determined and compared to the cooling curves for cells showing "Heat after Death" (see below).
Modelling of the Calorimeters For the simplest conditions of zero energy input during the determination of the Cooling Curves. the general Black Box Model, Fig 6(4) . simplifies to that shown in Fig 1. We note that zero energy input implies zero input to the calibration heaters as well as zero electrolysis current. The latter condition applies with high precision to cells which have boiled dry (see further below) as well as to full cells where electrolysis is interrupted. In turn both conditions imply that there is no input due to make-up with D 2 0 and no output due to the gas streams. However. it is possible to envisage conditions where evaporation has to be taken into account for cells which are still filled with electrolyte; we will not discuss such cases at this stage.
It follows therefore that we need only consider the time-dependent change of the enthalpy content of the calorimeter and heat transfer to the water bath. The latter is dominated by radiation across the lower, unsilvered portions of the Dewar-type cells. Fig 5( 4 ) (see also (1-".1° ) ). In the absence of any excess enthalpy generation we obtain the simple differential equation
which can be integrated to give the closed form expression
where
AO (1)
8-3
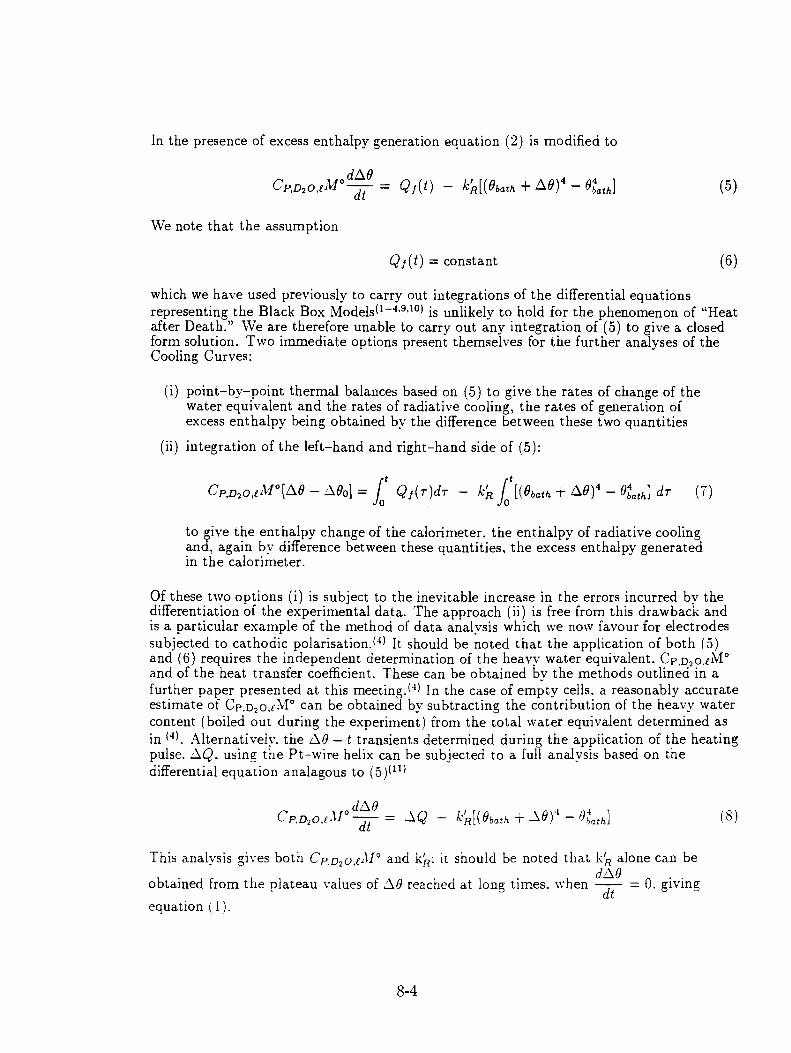
In the presence of excess enthalpy generation equation (2) is modified to
We note that the assumption
Q At) = constant (6)
which we have used previously to carry out integrations of the differential equations representing the Black Box Models( 1-4 '9•°) is unlikely to hold for the phenomenon of "Heat after Death." We are therefore unable to carry out any integration of (5) to give a closed form solution. Two immediate options present themselves for the further analyses of the Cooling Curves:
(i) point-by-point thermal balances based on (5) to give the rates of change of the water equivalent and the rates of radiative cooling, the rates of generation of excess enthalpy being obtained by the difference between these two quantities
(ii) integration of the left-hand and right-hand side of (5):
Cp,D2 0,eM ° [A0 - Aeol = Qt(r)dr - k 0 R a Ob th 0O) 4 - qathl dr (7)
to give the enthalpy change of the calorimeter, the enthalpy of radiative cooling and, again by difference between these quantities, the excess enthalpy generated in the calorimeter.
Of these two options (i) is subject to the inevitable increase in the errors incurred by the differentiation of the experimental data. The approach (ii) is free from this drawback and is a particular example of the method of data analysis which we now favour for electrodes subjected to cathodic polarisation. (4) It should be noted that the application of both (5) and (6) requires the independent determination of the heavy water equivalent. Cp,D 2 o.tM°
and of the heat transfer coefficient. These can be obtained by the methods outlined in a further paper presented at this meeting. (4 In the case of empty cells, a reasonably accurate estimate of Cp.D2o,iM° can be obtained by subtracting the contribution of the heavy water content (boiled out during the experiment) from the total water equivalent determined as in ( 4 ). Alternatively, the AO - t transients determined during the application of the heating pulse. Q. using the Pt-wire helix can be subjected to a full analysis based on the differential equation analagous to (5)(11)
This analysis gives both Cp.D 2 0,/111° and kiR : it should be noted that k'R alone can be
obtained from the plateau values of AO reached at long times. when —dA0
= 0, giving dt
equation (1).
8-4
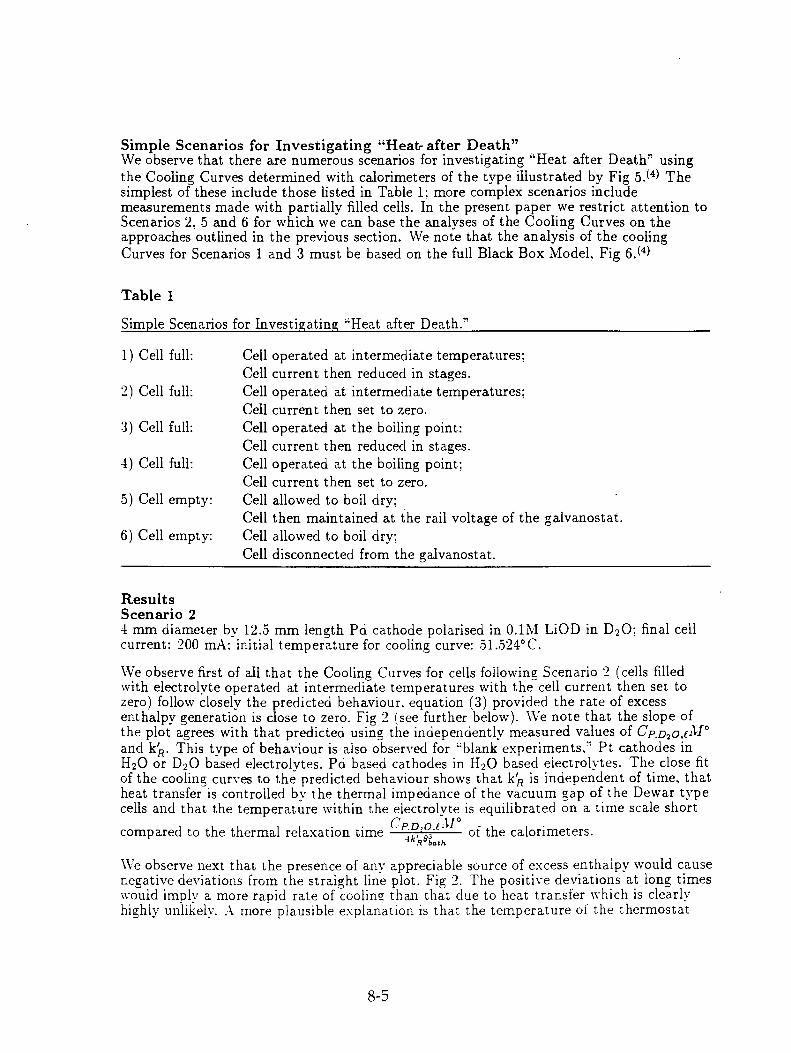
Simple Scenarios for Investigating "Heat- after Death" We observe that there are numerous scenarios for investigating "Heat after Death" using the Cooling Curves determined with calorimeters of the type illustrated by Fig 5. 0) The simplest of these include those listed in Table 1; more complex scenarios include measurements made with partially filled cells. In the present paper we restrict attention to Scenarios 2. 5 and 6 for which we can base the analyses of the Cooling Curves on the approaches outlined in the previous section. We note that the analysis of the cooling Curves for Scenarios 1 and 3 must be based on the full Black Box Model, Fig 6. 0 )
Table 1
Simple Scenarios for Investigating "Heat after Death."
1) Cell full:
2) Cell full:
3) Cell full:
4) Cell full:
5) Cell empty:
6) Cell empty:
Cell operated at intermediate temperatures; Cell current then reduced in stages. Cell operated at intermediate temperatures; Cell current then set to zero. Cell operated at the boiling point: Cell current then reduced in stages. Cell operated at the boiling point; Cell current then set to zero. Cell allowed to boil dry; Cell then maintained at the rail voltage of the galvanostat. Cell allowed to boil dry; Cell disconnected from the galvanostat.
Results Scenario 2 4 mm diameter by 12.5 mm length Pd cathode polarised in 0.1M LiOD in D 2 0; final cell current: 200 mA: initial temperature for cooling curve: 51.524°C.
We observe first of all that the Cooling Curves for cells following Scenario 2 (cells filled with electrolyte operated at intermediate temperatures with the cell current then set to zero) follow closely the predicted behaviour. equation (3) provided the rate of excess enthalpy generation is close to zero. Fig 2 (see further below). We note that the slope of the plot agrees with that predicted using the independently measured values of Cp,D2 0,eill ° and leR . This type of behaviour is also observed for "blank experiments." Pt cathodes in H 20 or D 2 0 based electrolytes. Pd based cathodes in H 2 0 based electrolytes. The close fit of the cooling curves to the predicted behaviour shows that k'R is independent of time, that heat transfer is controlled by the thermal impedance of the vacuum gap of the Dewar type cells and that the temperature within the electrolyte is equilibrated on a time scale short
Cp.k
D20 e-11° compared to the thermal relaxation time 4 of the calorimeters.
Anth
We observe next that the presence of any appreciable source of excess enthalpy would cause negative deviations from the straight line plot. Fig 2. The positive deviations at long times would imply a more rapid rate of cooling than that due to heat transfer which is clearly highly unlikely. A more plausible explanation is that the temperature of the thermostat
8-5

has been overestimated. That this is in fact likely is shown by the additional plots calculated assuming an error in the temperature readings (±0.005°C). (It should be noted that the maximum variation in temperature throughout the whole space of the thermostat is ±0.01°C; the temperature locally is constant to within ±0.003°C.) These additional plots show that the effects of such errors are negligible provided the interpretation is restricted to values of the ordinate less than 6 and/or times shorter than 45,000 s.
The fact that the excess enthalpy generation is small for this particular experiment following the cessation of the cathodic polarisation is shown by the calculation of the total enthalpy changes according to equation (6), Fig 3. In the results reported in this paper the integrations of the radiative cooling term have been carried out using the trapezium rule except for the blank experiment for Scenarios 5 and 6 where Simpson's rule has been used (see further below). The integral excess enthalpy reaches a value 302 J which is negligibly small compared to the integral of the radiative heat output, 14,191 J (i.e. 2%). It is not clear at the present time whether values of the excess enthalpy of this order of magnitude determined from the cooling curves can be regarded as significant (see further below). In any event we see that the putative rate of excess enthalpy generation (calculated by the point-by-point balance based on equation (5)) drops to very low values within 6 hours following the cessation of polarisation. Fig 4: the thermal balance can be made to better than 0.3 mW at long times. It is of interest that the cell voltage drops rapidly to zero following the cessation of polarisation.
Scenario 4 1 mm diameter by 12.5 mm length Pd cathode polarised in 0.1M LiOD in D 2 0; final cell current: 250 mA: initial temperature for the Cooling Curve: 99.605°C.
We examine next the cooling curve for a cell which had been driven into the region of the boiling point but where the polarisation was interrupted before the cell had been allowed to boil dry. Fig 5 gives a plot of the data according to equation (3) and it can be seen that the negative deviations from the predicted line now indicated marked enthalpy generation following the cessation of polarisation. Indeed, there is a period during which the enthalpy generation increases with time as shown by the decrease of the ordinate (although the absolute level of enthalpy generation in this time region is low, see Fig 7 below). The presence of excess enthalpy generation is confirmed by the evaluation of the data according to equaiton (7), Fig 6, and according to equation (5), Fig 7. Fig 6 shows that the integral of the excess enthalpy now reaches 3240 J which is certainly significant compared to the value 302 J for the experiment illustrated in Fig 3. Indeed the value 3240 J equates to 2.9 MJ (Mole Pd) - ' which is far beyond the realm of possibility for any chemical process in the system. We also note that for this particular experiment the enthalpy generation initially increases to a very marked peak (0.8 NV is about 8 W cm -3 for this particular electrode). The further increase in the rate of enthalpy generation at long times accounts for the decrease of the ordinate of the plot according to equation (3), Fig .5.
Scenarios 5 and 6 2 mm diameter by 12.5 mm length Pd cathode polarised in 0.1M LiOD in D 2 0: final cell current 500 mA: starting point for Cooling Curve shown on Fig 5.
We turn next to the discussion of one particular phenomenon of "Heat after Death" which was contained in our preceding publications.o. 21 Fig 8 gives the temperature-time data including the period of intense boiling. We note here that the cooling curve was determined initially according to Scenario 5 followed by Scenario 6. For the interpretation of this cooling curve it is important to observe that the cell current fell from the set value
8-6

of 500 mA to an indicated value of 0 as the cell boiled dry.t The indication of zero current by the instrumentation of the galvanostat sets an upper bound of 0.5 mA on the measured current and an upper bound of 50 mW on the rate of energy input during the cooling according to Scenario 5 since the rail voltage of the galvanostat used was 100 V (see further below).
In interpreting the behaviour of cells following Scenarios 5 and 6, we must first of all consider the behaviour of appropriate "blank cells." The reason is that the water equivalent of the gas spaces. --0.1 J K- ', is low compared to that of the solid components of the cells, ^-, 60 J K- '. In consequence, thermal equilibrium may not be maintained at the interface between the gas and the inner wall of the Dewar cell and a significant thermal impedance may appear at this wall in addition to that of the vacuum gap. By contrast the water equivalent of the electrolyte in the filled cells is ,, 410 J K- ' so that thermal equilibrium is readily maintained at the inner wall of the Dewar.
That an additional thermal impedance appears at the inner wall for gas-filled cells is shown by the calibration of these cells using the Pt-wire resistors. The heat transfer coefficients for such gas-filled cells are es-0.6 W K -4 , values which are ,-0.8 of the values of the cells filled with electrolyte (the latter values are close to those calculated from the Stefan-Boltzmann coefficient and the radiant surface areas). The simplest way of allowing for this additional thermal impedance is to assume that the rate of heat transfer from the gas space to the inner wall is linearly dependent on the temperature difference, LIAO, between those two spaces. If we balance this heat transfer rate, kAAO, by the radiation across the vacuum gap, then
kAAO = - kR' [(Obath 0O)4 - Otath] ( 9 )
At a first level of approximation, we can linearise the right-hand-side of (9) giving
kooe 41c/ReLth(-10 - AAO) (10)
and
4k/Fgat A.A0 h (11)
4k 1ROL t h k
4e and the effective heat transfer coefficient becomes . We conclude that
41c/ROLRe?,ath
th k although k > -Ik'Rqath (roughly k = 16k/Rqath ) the magnitude of k is not sufficient to maintain thermal equilibrium at the inner wall of the Dewar.
It is therefore necessary to examine the effect of this additional thermal impedance on the
tNevertheless we assumed(':'- ) that the cell current was maintained at the set value up to the time at which it reached zero. It follows that we overestimated the enthalpy input during the period of intense boiling and that. in consequence. our estimates of the rates of excess enthalpy generation were lower bounds.
8-7
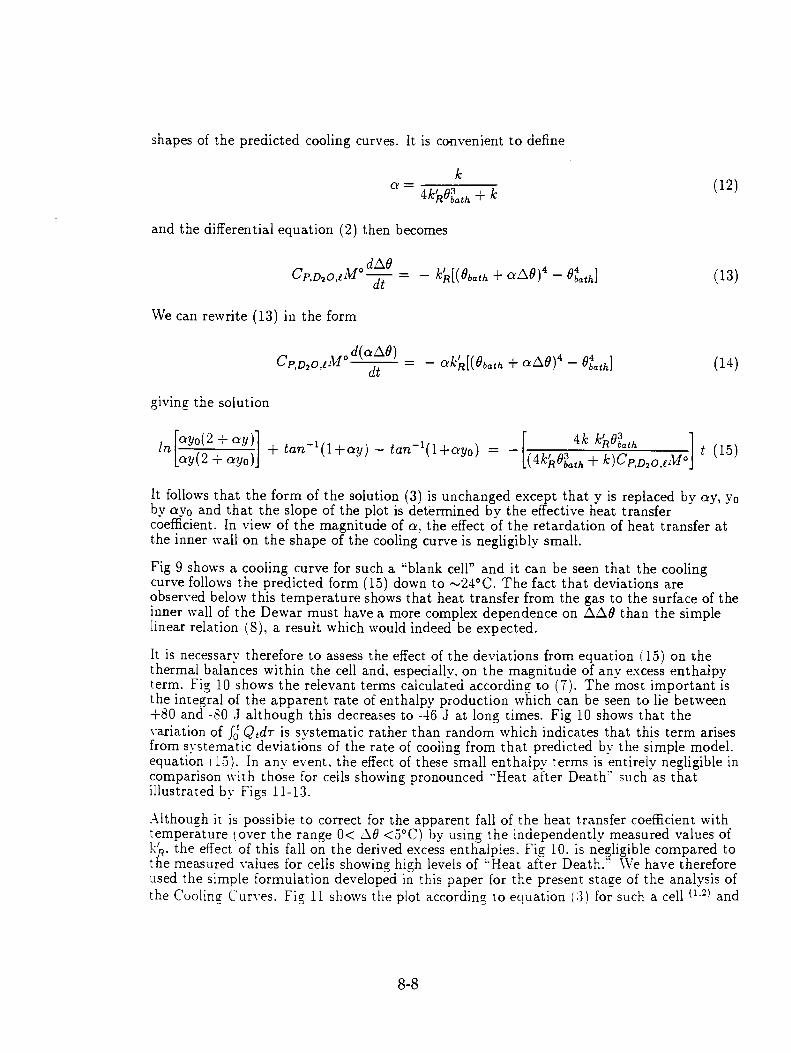
shapes of the predicted cooling curves. It is convenient to define
It follows that the form of the solution (3) is unchanged except that y is replaced by ay, yo by ay0 and that the slope of the plot is determined by the effective heat transfer coefficient. In view of the magnitude of a, the effect of the retardation of heat transfer at the inner wall on the shape of the cooling curve is negligibly small.
Fig 9 shows a cooling curve for such a "blank cell" and it can be seen that the cooling curve follows the predicted form (15) down to '24°C. The fact that deviations are observed below this temperature shows that heat transfer from the gas to the surface of the inner wall of the Dewar must have a more complex dependence on A.A0 than the simple linear relation (8), a result which would indeed be expected.
It is necessary therefore to assess the effect of the deviations from equation (15) on the thermal balances within the cell and. especially, on the magnitude of any excess enthalpy term. Fig 10 shows the relevant terms calculated according to (7). The most important is the integral of the apparent rate of enthalpy production which can be seen to lie between +80 and -80 J although this decreases to -46 J at long times. Fig 10 shows that the variation of fc; Q tdr is systematic rather than random which indicates that this term arises from systematic deviations of the rate of cooling from that predicted by the simple model. equation (15). In any event. the effect of these small enthalpy terms is entirely negligible in comparison with those for cells showing pronounced "Heat after Death - such as that illustrated by Figs 11-13.
Although it is possible to correct for the apparent fall of the heat transfer coefficient with temperature (over the range 0< AO <5°C) by using the independently measured values of kiR . the effect of this fall on the derived excess enthalpies. Fig 10. is negligible compared to the measured values for cells showing high levels of "Heat after Death. - We have therefore used the simple formulation developed in this paper for the present stage of the analysis of the Cooling Curves. Fig 11 shows the plot according to equation (3) for such a cell ( 1 . 2) and
8-8

the marked difference to the behaviour of the -"blank cell," Fig 9, will be immediately apparent. The cell remains at high temperature for ^ ,3 hours and the AO— t plot then indicates a period of cooling roughly in line with that predicted by equation (3). However, this phase of cooling is arrested because a new, lower, level of excess enthalpy generation is reached and the ordinate then again decreases because there is a reheating of the cell contents as for the example discussed above (see Fig 14 below). This lower level of excess enthalpy generation is maintained for a further —6 hours during which the rate of excess enthalpy generation shows several "spikes," Fig 14. There is then a further period of cooling in line with the predictions of equation (3); we can analyse this region separately by setting the origin at 6,0 = 22.408°C, t = 33,337 s, Fig 12. As the curvature of the plot at long times far exceeds that for "blank cells" (e.g. see Fig 7) it is likely that the cell again reaches a new, even lower, level of excess enthalpy generation.
We can again derive the change in the enthalpy content of the calorimeter and the total excess enthalpy by carrying out the integrations as in equation (7). Fig 13 shows that the total excess enthalpy exceeds the total change in enthalpy content of the calorimeter by a factor of nearly 20. An alternative way of displaying this information is to evaluate rates of cooling and the rates of generation of excess enthalpy as in Fig 14. The information derived from this plot has been referred to above.
Discussion The Cooling Curves which we have observed for cells containing Pd or Pd-alloy cathodes and operated using Scenarios 2, 5 and 6 fall roughly between the limits of the two relevant cases which we have discussed here. At one extreme we have zero or very low levels of enthalpy generation, at the other prolonged and low to high levels of this enthalpy generation: each particular example shows its own particular pattern of behaviour e.g. see Figs 5-7.
Contrary to the view which we have expressed previously, the calorimeters and methodology which we have developed for the investigation of polarised cells also appears to be adequate for deriving a near quantitative interpretation of the Cooling Curves. The systems showing high, sustained, levels of the rates of excess enthalpy generation are naturally of greatest interest because they point the way towards developing systems showing enthalpy generation at low or zero rates of energy input. We note here once again that the excess enthalpy generated in examples such as that illustrated in Fig 13 viz 128.5 kJ (which equates to 3.27 MJ cm -3 or 29 MJ (mole Pd) - ') exceeds by a factor of 10 2
- 103 that of any conceivable chemical process. Thus the combustion of all the deuterium stored in the lattice would only generate 148.6 kJ(mole Pd) - ' assuming that the D/Pd ratio had reached 1. Furthermore. for that particular example, the cell showed excess enthalpy generation throughout the period of polarisation( 1,2) so that there was no conceivable mechanism for developing a storage mechanism for chemical or physical energy.
We note finally that cells which show pronounced - Heat after Death- also maintain high cell voltages e.g. see Fig 12. As the Pt counter electrode will rapidly adopt a potential in the vicinity of that of the deuterium electrode. this negative potential must be established at the Pd electrode in contact with the residual solid electrolyte deposited during the phase of -boiling to dryness. - It is possible that this highly negative potential is due to the generation of a high surface potential ( " 21 which serves to confine the deuterons in the lattice.
8-9

Glossary of Symbols Used
Cp,D2o,t is the heat capacity of liquid D2 0. [JK-1 moll (VI? )
is the effective heat transfer coefficient due to radiation. [WK-4] is the symbol for the liquid phase.
M° is the heavy water equivalent of the calorimeter at a chosen time origin. [mols]
Q f is the rate of generation of excess enthalpy. [W] Q f (t) is the time dependent rate of generation of
excess enthalpy. [W] t is the time. [s] v is the symbol for the vapour phase.
AQ is the rate of heat dissipation of calibration heater. [W] is the difference in cell and bath temperature. [K]
Obath is the bath temperature. [K] is a time. [s]
8-10
References
1. Martin Fleischmann and Stanley Pons in: Frontiers of Cold Fusion: Proceedings of the Third International Conference on Cold Fusion, Nagoya, Japan (21-25 October 1992), ed. H. Ikegami, Frontiers Science Series No. 4 (FSS-4) p.47.
2. Martin Fleischmann and Stanley Pons, -Calorimetry of the Pd-D 2 0 system: from simplicity via complications to simplicity." Physics Letters A 176 (1993) 118.
3. Stanley Pons and Martin Fleischmann in T. Bressani, E. Del Guidice and G. Preparata (Eds), The Science of Cold Fusion: Proceedings of the II Annual Conference on Cold Fusion, Como. Italy, (29 June-4 July 1991), Vol. 33 of the Conference Proceedings, The Italian Physical Society, Bologna. (1992) 349, ISBN 887794-045-X.
4. M. Fleischmann. S. Pons. T. Roulette and Monique Le Roux, "Calorimetry of the Pd-D 2 0 System: the Search for Simplicity and Accuracy." Paper C1.1. presented at the 4th International Conference on Cold Fusion, Maui. Hawaii (December 6-9 1993).
5. M. Fleischmann and S. Pons, "Reply to the Critique by Douglas O.R. Morrison entitled "Comments on Claims of Excess Enthalpy by Fleischmann and Pons using Simple Cells made to Boil" to be published in Physics Letters A.
6. M.C.H. McKubre, B. Bush. S. Crouch-Baker. A. Hauser, N. Jevtic. T. Passell, S. Smedley, F. Tanzella, M. Williams and S. Wing. "Calorimetry Studies of the D/Pd System." Paper No. C1.5, presented at the 4th International Conference on Cold Fusion, Maui, Hawaii (December 6-9 1993).
7. M.E. Mellich and W.N. Hansen. "Pd/D Calorimetry-The Key to the F/P Effect and a Challenge to Science, - Paper No. C3.3 presented at the 4th International Conference on Cold Fusion. Maui, Hawaii (December 6-9 1993).
S. Douglas R.O. Morrison. "Comments on Claims of Excess Enthalpy by Fleischmann and Pons using Simple Cells made to Boil." to be published in Physics Letters A.
9. M. Fleischmann. S. Pons. M.W. Anderson. L.J. Li and M. Hawkins. -Calorimetry of the palladium-deuterium-heavy water system." J. Electroanal. Chem.. 287 (1990) 293.
10. M. Fleischmann and S. Pons. -Some Comments on the paper Analysis of Experiments on Calorimetry of LiOD/D , 0 Electrochemical Cells. R.H. Wilson et al.. J. Electroanal. Chem.. 332 (1992) 1." J. Electroanal. Chem.. 332 (1992) 33.
11. To be published.
12. G. Preparata "Cold Fusion '93: Some Theoretical Ideas. - paper No. T1.2 presented at the 4th International Conference on Cold Fusion. Maui. Hawaii (December 6-9 1993).
8-11
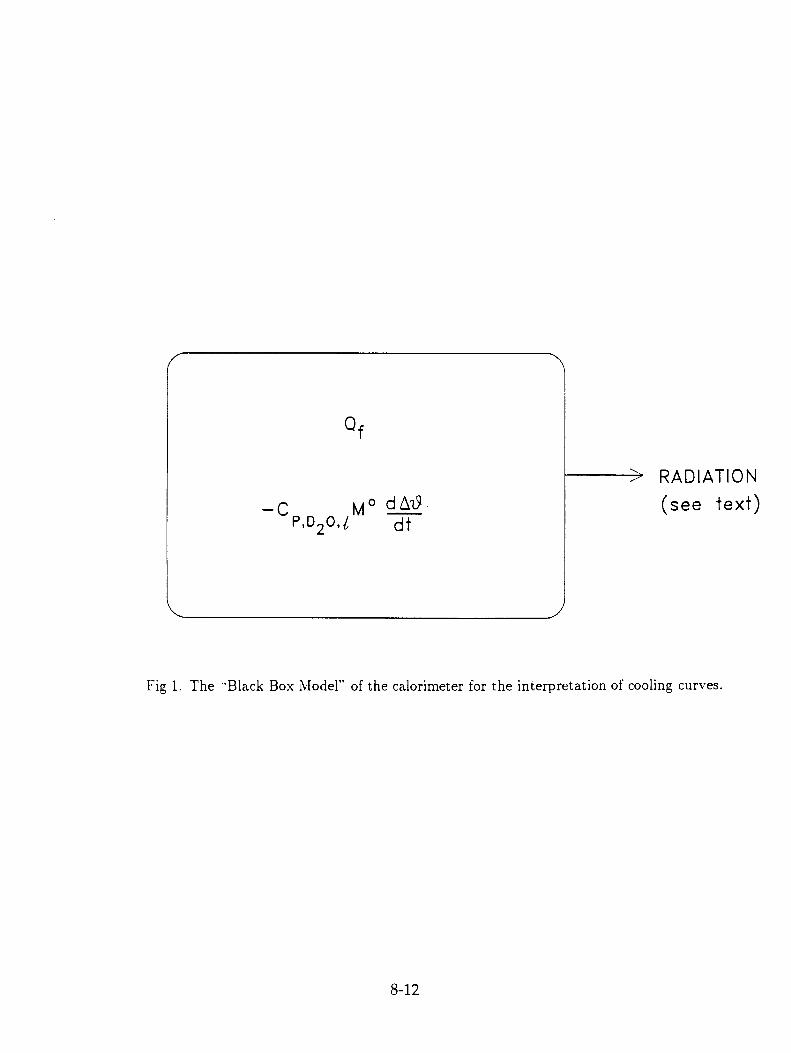
Fig 1. The - Black Box Model" of the calorimeter for the interpretation of cooling curves.
8-12
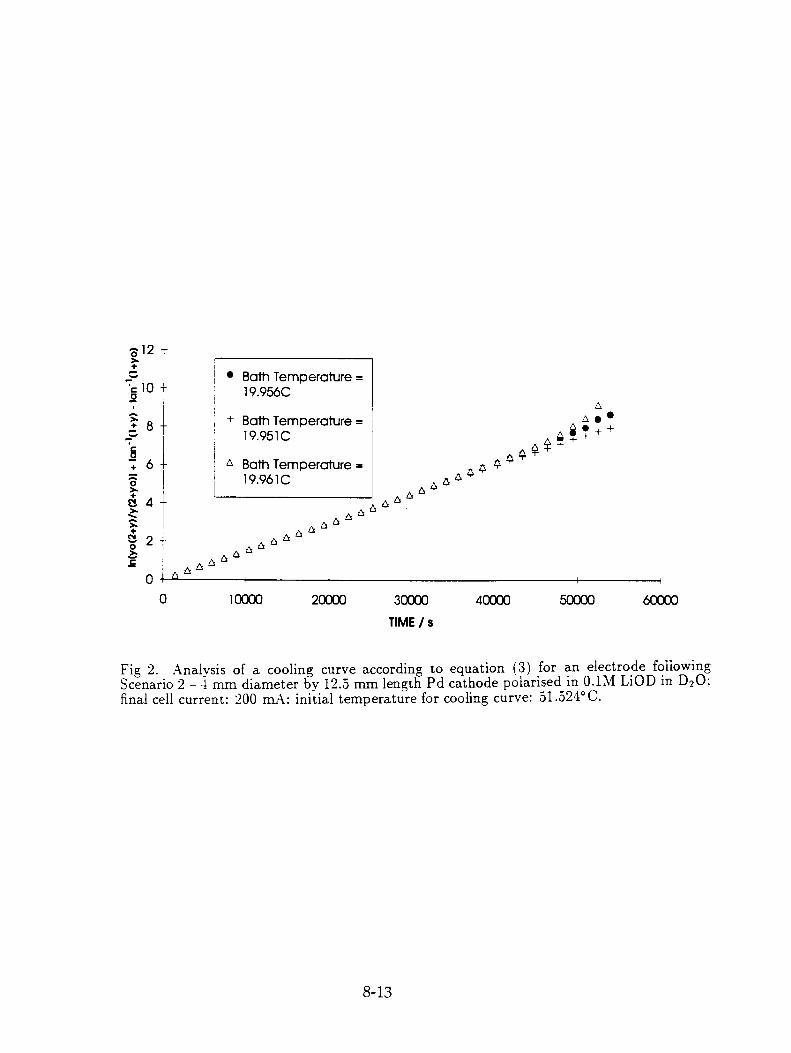
Fig 2. Analysis of a cooling curve according to equation (3) for an electrode following Scenario 2 — 4 mm diameter by 12.5 mm length Pd cathode polarised in 0.1M LiOD in D 2 0; final cell current: 200 mA: initial temperature for cooling curve: 51.524°C.
8-13

Fig 3. The integral radiative heat output and the integral of the rate of excess enthalpy generation for the example of Fig 2.
8-14

Fig 4. The rate of excess enthalpy generation and the cell potential for the example of Fig 2.
8-15

Fig 5. Analysis of a cooling curve according to equation (3) for an electrode following Scenario 4 - 1 mm diameter by 12.5 mm length Pd cathode polarised in 0.1M LiOD in D 2 0; final cell current: 250 mA; initial temperature for the cooling curve: 99.605°C.
8-16

Fig 6. The integral radiative heat output and the integral of the rate of excess enthalpy generation for the example of Fig 5.
8-17

Fig 7. The rate of excess enthalpy generation for the example of Fig 5.
8-18

Fig 8. The temperature-time curve for a cell beinz driven to boiling showing also the initial part of the cooling curve - 2 mm length Pd cathode polarised in 0.1M LiOD in D 2 0; final cell current: 500 mA.
8-19

0 2000 4000 6000 8000 10000 12000
TIME / s
Fig 9. Analysis of the cooling curve for a - blank cell" covering the case of Scenarios 5 and 6.
8-20
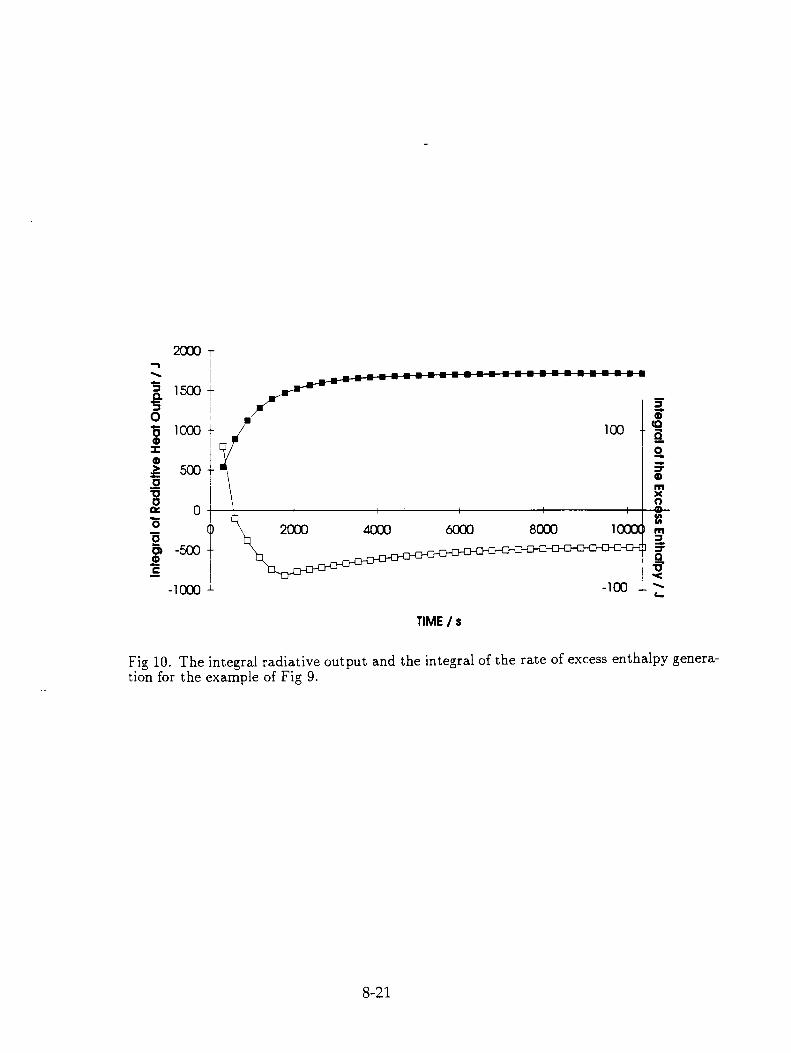
Inte
g ral
of R
adia
tive
Hea
t Out
put /
J
TIME / s
Fig 10. The integral radiative output and the integral of the rate of excess enthalpy genera-tion for the example of Fig 9.
8-21

Fig 11. Analysis of the cooling curve according to equation (3) for the example of Fig 8.
8-22

Fig 12. Analysis of the cooling curve according to equation (3) for the example of Fig 8 and at times greater than 33,337 s. The figure also shows the variation of the cell potential with time.
8-23

Fig 13. The integral radiative heat output and the change of enthalpy content of the calorimeter for the example of Fig 8.
8-24

Fig 14. The rate of cooling and the rate of excess enthalpy generation for the example of Fig 8 and at times greater than 12,829 s.
8-25

Comments About Nuclear Reaction Products
By George H. Miley
FUSION STUDIES LABORATORY 100 NEL, 103 South Goodwin Avenue
Urbana, IL 61801-2984
Telephone: 217-333-3772 Facsimile: 217-333-2906
e-Mail: miley@ uiucvmd.bimet
18 October 1993
Prepared for Dr. Nate Hoffman, Rockwell International, under contract with EPRI
Note: This report represents work-in-progress. Copies should not be distributed without permission of the Author.

Comments About Nuclear Reaction Products
Introduction
If a nuclear reaction occurs, it should be possible_to experimentally detect reaction products and thus identify the reaction itself. This has been discussed in earlier reviews, (1) and there have been numerous attempts to detect various products, ranging from neutrons, tritium, helium and gamma rays to sundry isotopes of palladium. While some results have been reported, problems of background interference and low levels of product concentrations, coupled with difficulty in reproducibility, have prevented general agreement on the identification of the products, i.e. on the reaction(s), involved. This problem is further complicated by the numerous reactions that might be considered and by the absence of a definitive identification of the nuclear products or consensus on a reaction theory. To illustrate the many possibilities involved, we will briefly survey reaction products that might occur through two-body reactions and conclude with some comments about multi-body reactions that have been proposed.
Two-Body Reaction Products
We first consider the "conventional" reactions shown in Table 1 (largely taken from Ref. 2). These involve deuterium (d) by itself or with other elements that might be in the deuterium, either as impurities or as constituents of the electrolyte. Reactions involving protons (p) are included, since experiments with light-water cells have been reported (e.g. see Ref. 3 and references therein), and also because the proton is one of the products from deuterium break-up that could continue to react. The reactions shown all have positive Q-values, i.e. could occur easily if the Coulombic barrier is overcome. They would also result in heat production.

TABLE 1. Some Two-Body Reactions, Excluding Reactions with Pd
Reactants Product 1 Product 2 Product 3 Q Value (MeV)
p + d 'He Y 5.4
d + d t 03 12 = 12.3 yr) P - 4.03
'He n 3.27
p + 6 Li 'Be (et vz = 53.3 days) Y 5.61
'He e 4.02
p+ 7Li 'Be (/t in = 0.07 fs) y 17.25
a a 17.35
d + 6Li 'Be (2at,,, = 0.07 fs) y 22.28
a a 22.37
'He (a,nF = 0.6) 'I-le . 0.84
'He a n 1.80
71..i p 5.03
'Be (et,,, = 53/3 days) n 3.38
'Li (a,pr = 1/5) t (13e 12 =12.3 Yr)
0.60
d + 'Li 9Be y 5.61
'Be (2a,,, = 0.07 fs) li 15.03
'He (a,nr = 0.6) a 15.16
a a n 15.12
p + 12/C '3N (€ 1/2 = 9.96 min) Y 1.94
d +12C 14N
Y 10.27
p + 160 ' 7F (e,,.2 = 64.5 s) y 0.6
d + 160 18F (e v, = 110 min) y 7.53
Nomenclature ,
d = deuteron n = neutron p = proton t = triton t In = half-life a = alpha 13 = negative beta decay e = positive beta decay including electron conversion F = level width for particle-unstable nuclides ( kV)
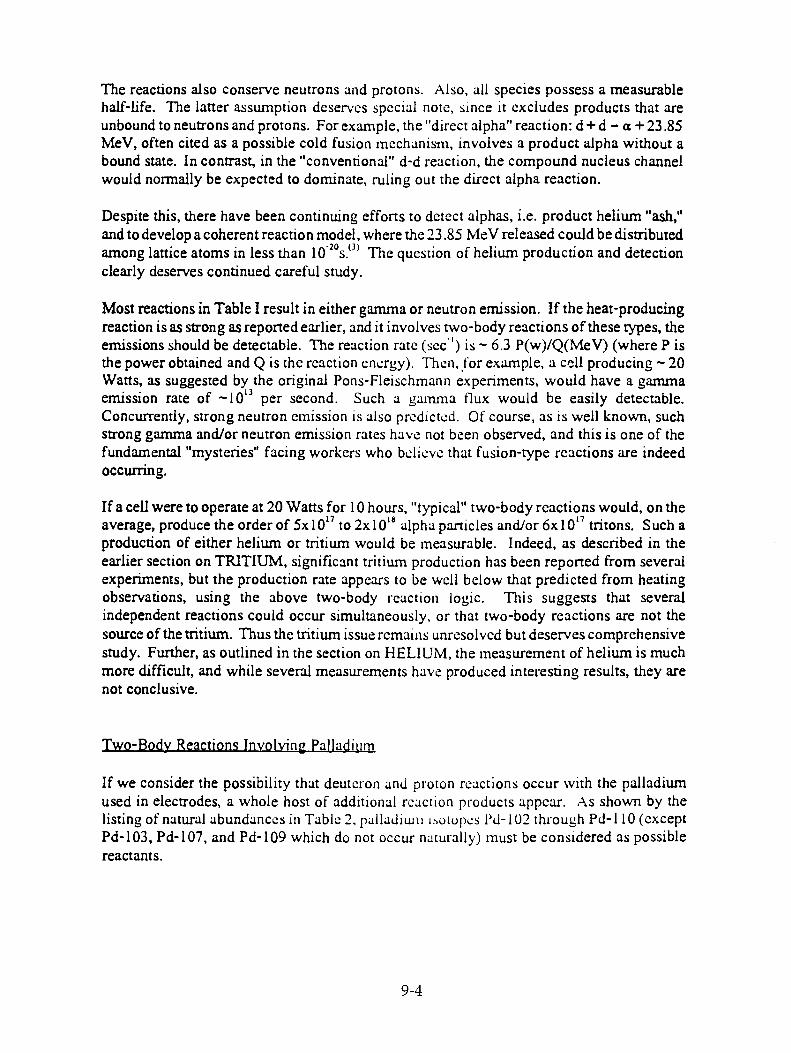
The reactions also conserve neutrons and protons. Also, all species possess a measurable half-life. The latter assumption deserves special note, since it excludes products that are unbound to neutrons and protons. For example, the "direct alpha" reaction: d + d a + 23.85 MeV, often cited as a possible cold fusion mechanism, involves a product alpha without a bound state. In contrast, in the "conventional" d-d reaction, the compound nucleus channel would normally be expected to dominate, ruling out the direct alpha reaction.
Despite this, there have been continuing efforts to detect alphas, i.e. product helium "ash," and to develop a coherent reaction model, where the 23.85 MeV released could be distributed among lattice atoms in less than 10 -2°s.(3) The question of helium production and detection clearly deserves continued careful study.
Most reactions in Table I result in either gamma or neutron emission. If the heat-producing reaction is as strong as reported earlier, and it involves two-body reactions of these types, the emissions should be detectable. The reaction rate (sec -I ) is — 6.3 P(w)/Q(MeV) (where P is the power obtained and Q is the reaction energy). Then, for example, a cell producing — 20 Watts, as suggested by the original Pons-Fleischmann experiments, would have a gamma emission rate of —10" per second. Such a gamma flux would be easily detectable. Concurrently, strong neutron emission is also predicted. Of course, as is well known, such strong gamma and/or neutron emission rates have not been observed, and this is one of the fundamental "mysteries" facing workers who believe that fusion-type reactions are indeed occurring.
If a cell were to operate at 20 Watts for 10 hours, "typical" two-body reactions would, on the average, produce the order of 5x 10" to 2x10" alpha particles and/or 6x10" tritons. Such a production of either helium or tritium would be measurable. Indeed, as described in the earlier section on TRITIUM, significant tritium production has been reported from several experiments, but the production rate appears to be well below that predicted from heating observations, using the above two-body reaction logic. This suggests that several independent reactions could occur simultaneously, or that two-body reactions are not the source of the tritium. Thus the tritium issue remains unresolved but deserves comprehensive study. Further, as outlined in the section on HELIUM, the measurement of helium is much more difficult, and while several measurements have produced interesting results, they are not conclusive.
Two-Body Reactions Involving Palladium
If we consider the possibility that deuteron and proton reactions occur with the palladium used in electrodes, a whole host of additional reaction products appear. As shown by the listing of natural abundances in Table 2, palladium isotopes Pd-l02 through Pd-110 (except Pd-103, Pd-107, and Pd-109 which do not occur naturally) must be considered as possible reactants.

TABLE 2. Natural Abundances and Neutron Cross Sections for Pd (from Ref. 1) -
Isotope Pd-102 Pd-104 Ed-105 Pd-106 Pd-lOg pd-11
a/o (atomic %) 1.0 11.0 1 2.2 27.3 26.7 11.8
(a) 5.0 ? 10.0 0.013 0.20 0.02 ay (barns)
(b) -- 10.0 90.0 0.28 12.00 0.21 (a) metastable state formation
(b) direct-ground-state formation
Some possible reactions with positive Q Values are listed in Table 3 (taken from Refs. 1, 2, 5, and 6). The deuteron-induced reactions shown can roughly be divided into three categories:
(1) reactions producing all stable products via a "fission"-like breakup; (2) neuron "swapping" (i.e. Oppenheimer-Phillips type--See Ref. 7)
reactions, producing a proton and either a stable or an unstable radioactive product; and
(3) "direct" transmutation-type reactions, giving a radioactive product plus a neutron.
Likewise, the proton-induced reactions shown in Table 3 can be grouped into two categories: (1) "fission" reactions giving all stable products; and (2) "direct" transmutation-type reactions giving a radioactive product plus a gamma
or an alpha.
Some experiments have attempted to detect such products using a mass spectrometric analysis of palladium electrodes taken from operating cells. Results have been inconclusive, but this still appears to be a potentially fruitful avenue for study.
From a theoretical point of view, the Oppenheimer-Phillips "neutron swapping" reaction has received the most attention as a possible key to the "puzzle."`"' Thus, in the sense of possibly providing a simple answer to the enigma, the "neutron-swapping" reaction is to the Pd-reaction what the "direct alpha" channel is to the d-d reaction.

TABLE 3. Two-Body Reactions involving
REACTIONS WITH
DEUTERONS j PRODUCTS
Q I VALUE,
MeV
Pd- 102 + d f - V-51 + Cr-53 34
_p + 1'd-103 • -5.38
- p + a + Ru-99 _
3.4
- n + Ag-103 1 -2.01
Pd- 104+d f - a + Rh-102• -8.1
- C-I3 + Nb-93 8.0
- p + Pd-105 -4.9
- 13-11 + Mo-95 3.0
- n + Ag-105* 1 -2.8
-p+a +Rh-101 2.1
-n+a +Rh-101* i
-0.6
- B-I 0 + Mu-90 : 0.5
Pd- 105 + d - Ca-4N + Cu-59 33
- Ne-20 +1(b-h7 17
- a 1- R11-103 10.8
- p + N-106 7.8
- 13-11 + Mu-96 5.1
- n + Ag-106• -3.5 1 - n + a + R11-102• -0.9
- p + Be-S + Mo-9S 0.7
- B-I0 + N40-97 0.2
Pd- 106 + d 1
- a + 1(11-104• -7.7
- p 4- 1'd-107• l -4.3
i , - 13-11 + Mo-97 11 -
- n + a + 1(11-10.3 0.7
Pd- 108 + d - a + Rh-106* -7.6
- n + A g- 109 4.3
- p + Pd-I09• -3.9
- B-11 + Nlo-99 1 -) _.-
-• n + a +1(11-103• -1.0
Pd-110 + d - a + Ith-ION• -7.4
- n + Av-1 1 1 • -4.9
- p + l'4.1-111• -3.5
- ti + a + 1th - 1 u7` -1.2
• Radioactive product
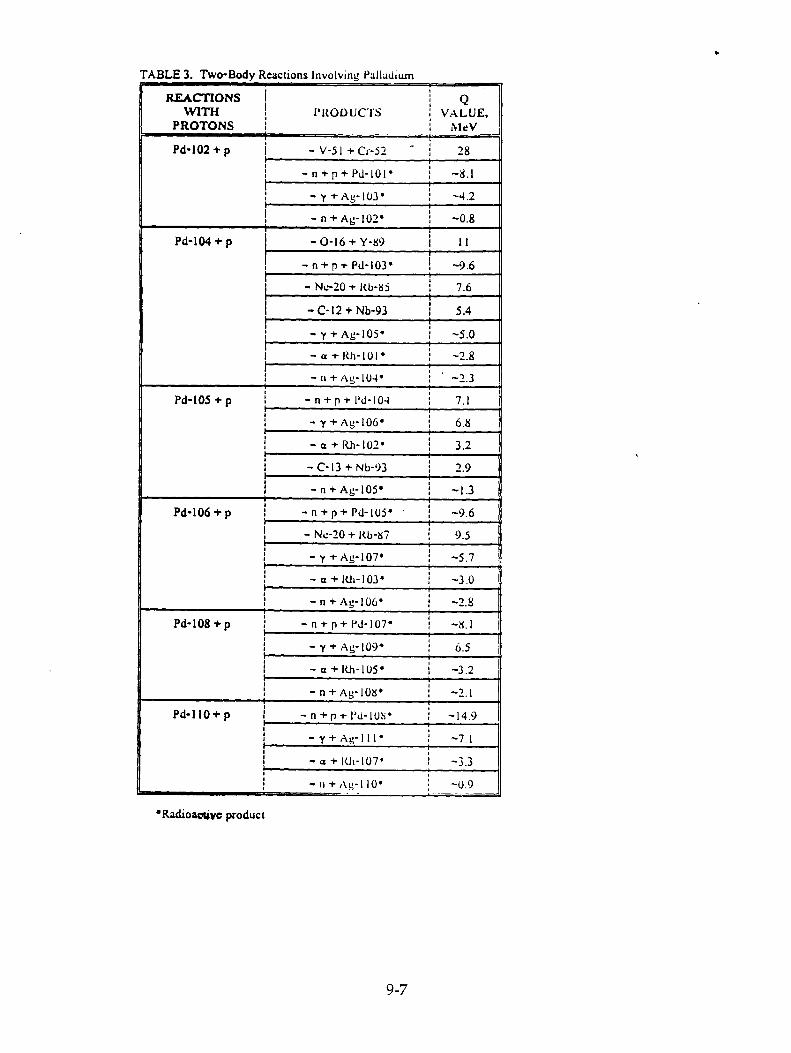
TABLE 3. Two-Body Reactions Involving Palladium
REACTIONS WITH
PROTONS PROD ucrs
Q VALUE,
MeV
Pd-102 + p I - V-5I + C1-52 - 28
- n + p + PLI-101• -8.1
- y + Ag-103• -4.2
- n + Ag-102• -0.8
Pd-104 + p
1 I
i - 0 - 16 + Y -89 -1 i 11
-n+p+Pd-103• -9.6
- Ne-20 + Rb-85 7.6
- C- 12 + Nb -93 1 5.4
- y + Ag-I05• -5.0
- a +16-101• -2.8
- n "I' A g - I 0 4 • . -2.3
Pd-105 + p - n 1- p + 1 4 c1-10-1 7.1
- y + Ag-106• 6.8
- a + Rh-102* 3.2
- C-13 + Nb-93 2.9
- n + Ag - 105* - 1.3
Pd-106 + p ti - n + p + Pd-105* -9.6
- Ne-20 + Rb-87 9.5
- y + Ag-107• -5.7
- a + It11-103• -3.0
- n + Ag-106• -2.8
Pd- 108 + p - n + p + Pd - 107• -8.1
- y + Ag-109• 6.5
- a + lth-105• -3.2
- n + Ag-108• -2.1
Pd- 110+p - n + p + l't1-108• I -14.9
- y + A g-Ill• -7.1
- a + Ith-107• -3.3
- n + Ag-110• -0.9
'Radioactive product
The Oppenheimer-Phillips reaction corresponds, in effect, to a deuteron disintegration under the influence of the nuclear potential of palladium. The abnormally low binding energy of the proton and neutron in deuterium makes such a breakup plausible. In the this reaction, as the deuterium's wave function comes into palladium's Coulombic field, the deuterium nucleus becomes polarized, so that the neutron component penetrates the field first. Consequently, the neutron is captured while the proton component, which has not yet penetrated far into the field, is "split off." This reaction produces a net energy of -4.8 MeV, depending on the Pd isotope involved, which could, in principle, explain heating as well as the failure to detect copious neutron emission. The Oppenheimer-Phillips reaction has been studied both experimentally and theoretically in connection with high-energy physics, where deuterons can easily penetrate the Coulombic barrier of the target. The key question of how the "cold" deuteron could penetrate the Coulombic barrier of a high-Z element like palladium to allow such a reaction remains open. This question not only applies to the Oppenheimer-Phillips reaction, but also to all reactions being considered to explain cold fusion. The point is, should penetration occur, there is good reason to expect a neutron-swapping reaction. Any explanation, if there is one, must involve the unique feature of having the reaction occur in a solid lattice.
Radioactive Pd Products
The detection of the stable products listed in Table 3 should be relatively straightforward if the experiment is run long enough to build up a reasonable product concentration. The situation with the reactions in Table 3 that produce radioactive palladium isotopes is more complex, however. In addition to direct reactions, such isotopes could be produced by secondary reactions, e.g., by neutron-induced reactions, where the neutron comes from a primary reaction which might not even involve palladium itself. (See, for example, Refs 1 and 9.)
To illustrate the latter possibility, average neutron cross sections are listed in Table 2 for low-energy neutrons. The first line in that listing corresponds to the metastable state formation, and the second line to direct-ground-state formation. For illustration, note that neutron capture is favored in Pd-105. Thus, if neutron reactions are significant, we could expect the Pd-105 abundance (22.2 a/o in natural Pd) to be lowered relative to the other isotopes, while that of Pd 106 (27.3 a/o) would be increased.
A full understanding of the build-up of decay products due to either direct or "indirect" neutron transmutation requires a computer study of the various decay chains that become involved. This has not been reported to date, so here we can only offer some general observations. For example, based on the half-lives of the Pd radioactive isotopes (Table 4), the long-lived isotope Pd-107 might be expected to build up in an electrode composed of natural Pd. The effect could even be enhanced for diagnostic purposes by use of an isotopically enriched sample of Pd-106. This would not be so crucial, however, should the Oppeneimer-Phillips reaction occur, since Pd-106 transmutation would be relatively strong. (However, subsequent Pd-107 transmutations would quickly saturate its build-up).
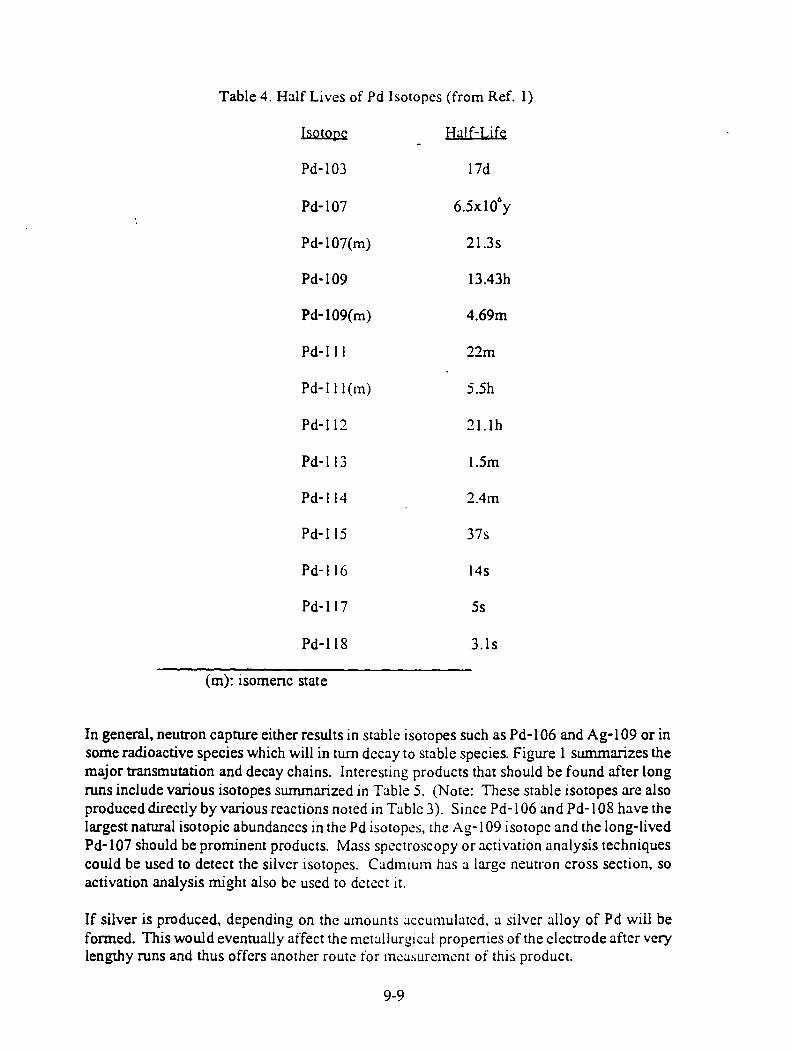
Table 4. Half Lives of Pd Isotopes (from Ref. 1)
Isotope Half-Life
Pd-103 17d
Pd-107 6.5x10⁶y
Pd-107(m) 21.3s
Pd-109 13.43h
Pd-109(m) 4.69m
Pd-111 22m
Pd-111(m) 5.5h
Pd-112 21.1h
Pd-113 1.5m
Pd-1 14 2.4m
Pd-115 37s
Pd-116 14s
Pd-117 5s
Pd-118 3.1s
(m): isomeric state
In general, neutron capture either results in stable isotopes such as Pd-106 and Ag-109 or in some radioactive species which will in turn decay to stable species. Figure 1 summarizes the major transmutation and decay chains. Interesting products that should be found after long runs include various isotopes summarized in Table 5. (Note: These stable isotopes are also produced directly by various reactions noted in Table 3). Since Pd-106 and Pd-108 have the largest natural isotopic abundances in the Pd isotopes, the Ag- 109 isotope and the long-lived Pd-107 should be prominent products. Mass spectroscopy or activation analysis techniques could be used to detect the silver isotopes. Cadmium has a large neutron cross section, so activation analysis might also be used to detect it.
If silver is produced, depending on the amounts accumulated, a silver alloy of Pd will be formed. This would eventually affect the metallurgical properties of the electrode after very lengthy runs and thus offers another route for measurement of this product.
9-9
A number of "non-traditional" reaction mechanisms have been considered theoretically. Some involve mechanisms such a neutron chains, nuclear mass resonances, and neutron or deuteron tunneling. While these reaction mechanisms are quite unique, the reaction products are generally similar to those already listed for two-body reactions. Thus to distinguish these reactions, care must be taken to focus on unique products, especially high-energy particles or photon emissions, and on the relative abundance of the stable products. The interested reader is referred to references for more detail since this topic is too complex to cover in the brief space available here.
Multi-Body Reactions
Various investigators have suggested multi-body reactions may be favored over two-bol reactions in a lattice. An example is the NATTOH model, proposed by T. Matsumoto! ) ) He assumes that deuterons are compressed in the metal electrode to such a high effective pressure that three or more can "condense" to form a cluster. With cluster formation, many-bodied fusion reactions of the type illustrated in Figure 2 are possible. Again, details of this model and other three-body reaction possibilities are beyond the scope of the present discussion, so the reader is referred to the literature. However, from the view of detection of reaction products, this possibility clearly increases the complexity of the analysis. Thus, the reactions cited in Fig. 6 result in new products not predicted for two-body reactions. Again, as in the case of "non-traditional" reactions, the experimenter appears best advised to focus on unique products that would provide a "tell-tale" signal.
Other Reaction Sequences
A variety of other reaction mechanisms have been considered involving strange particles, chains, etc. The situation can rapidly become even more complex, should a reaction sequence or chain be considered. For example, R. Bush recently proposed" ) a chain where an entire "cold nucleosynthetic series" of isotopes of Sr, Zr, Y, Nb, Mo, Ru, Tc, Rh, Pd, Ag, Cd, In and Sn would occur in an electrolytic cell employing a nickel cathode and a light-water based rubidium carbonate electrolyte. His hypothesis is based on an extension of Oppenheimer-Phillips (neutron-swapping) reactions to describe "lattice-assisted" neutron and proton transfer reactions. In order to verify this hypothetical model, or any of the other various mechanisms which have been proposed, it is desirable to identify and focus on the measurement of unique reaction products that might serve as a "telltale" signal. In the cold nucleosynthesis case, investigators have been concentrating on detection of calcium that might build up via addition of a proton to Rb. They are also employing a mass spectromet-ric search for Rb/Sr in the nickel cathode.
Conclusion
A conclusive detection of reaction products must remain as a primary objective for experimentalists. Not only would such conclusive identification prove that nuclear reactions do in fact occur, but it would provide a sound basis for identifying mechanisms and focusing theoretical studies. Unfortunately, as seen from this brief, and admittedly incomplete, survey, the problem is very complex. Not only are there numerous reaction products that must be considered, but the detection of the small quantities of products and low-intensity radiation typical of these experiments pose an ambitious experimental challenge. Hopefully this appendix helps, though, by providing a brief overview of the many possibilities to be considered at this stage in research on possible nuclear reactions induced in solid lattices.

APPENDIX c: NUCLEAR REACTIONS D WITH Pd ISOTOPES
1. G.H. MILEY, M.H. RAGHEB, and H. HO RA, "COMMENTS A BOUT DIAGNOSTICS FOR NUCLEAR REACTION PRODUCTS FROM COLD FUSION," NSF/EPRI WORKSHOP, WASHINGTON, DC, 16-18 OCT 1989.
2. D. MUELLER AND L.R. GRISHAM, "NUCLEAR REACTION PRODUCTS THAT WOULD APPEAR IF SUBSTANTIAL COLD FUSION OCCURRED," FUSION TECHNOLOGY, 16, 379, 1989.
3. R.T. BUSH, "A LIGHT WATER EXCESS HEAT REACTION SUGGESTS THE 'COLD FUSION' MAY BE 'ALKALI-HYDROGEN FUSION'," FUSION TECHNOLOGY, 22, 301, 1992.
4. P.L. HAGELSTEIN, "A (SLIGHTLY REVIS ED) SIMPLE MODEL FOR COHERENT DD FUSION IN THE PRESENCE OF A LATTICE," ABSTRACTS, WORKSHOP ON COLD FUSION PHENOMENA, SANTA FE, NM, 23-25 MAY, 1989.
5. T. PASSELL, EPRI, PALO ALTO, CA, PRIVATE COMMUNICATION OF TABLE OF Pd REACTIONS GIVING STABLE PRODUCTS.
6. E.G. BATYRBEKOV, NUCLEAR PHYSICS INSTITUTE OF THE REPUBLIC OF KAZAKHSTAN, PRIVATE COMMUNICATION, Pd REACTIONS WITH RADIOAC-TIVE PRODUCTS.
7. H.A. BETHE, "THE OPPENHEIMER-PHILLIPS PROCESS, PHYSICAL REVIEW, 53, 39, 1938.
8. M. RAGHEB AND G.H. MILEY, "ON THE POSSIBILITY OF DEUTERON DISINTEGRATION IN ELECTROCHEMICALLY COMPRESSED D+ IN A PALLADI-UM CATHODE," FUSION TECHNOLOGY, 16, 243, 1989.
9. J.C. JACKSON, "COLD FUSION RESULTS STILL UNEXPLAINED," SCIENTIFIC CORRESPONDENCE, NATURE, 339, 345, 1989.
10. T. MATSUMOTO, "'NATTOH' MODEL FOR COLD FUSION," FUSION TECHNOL-OGY, 16, 532, 1989.
11.R. BUSH, "CAN COLD FUSION BE EXPLAINED BY ORBITAL COLLAPSE DUE TO CONDENSED MATTER MODIFICATIONS OF THE ZERO-POINT FIELD?," PRIVATE COMMUNICATION.

Back to the Future The Fleischmann-Pons Effect in 1994
Michael E. Melich Department of Physics
Naval Postgraduate School Monterey, CA 93943-5000
Wilford N. Hansen Department of Physics Utah State University
Logan, UT 84322-4415
Abstract
From its initial public announcement on 23 March 1989, the Fleischmann-Pons Effect (FPE) has been attributed to:
• nuclear fusion • nuclear fission • exotic chemistry • some previously unidentified law of nature • instrumental error.
Highly public as well as private efforts were made in 1989 to decide if an FPE existed and if so, what caused it. This paper reevaluates some of the factual bases for the scientific and management judgements of 1989 with the advantage of what has been learned after four years of worldwide experimentation and analysis. We conclude that there is an FPE and its signature is heat. Data existed in 1989 that could have lead to this conclusion. The source of the excess heat is still not understood. Scientific progress was not made through this debate, which was largely uninformed by appropriate experimentation, and patent considerations may have played a determining role in the scientific progress associated with the FPE.
10-1
Introduction
The extraordinary nature of the scientific claim made by Fleischmann and Pons 1 (FP) immediately set off a flurry of both scientific as well as managerial activity. Starting with the University of Utah press conference on 23 March 1989 through the end of 1989, scientists and their sponsoring governmental and private employers struggled to decide the validity of the claims. By November 1989 the overwhelming official and popular judgement in most of the world was that there was no validity to the FP claims. Despite this, the "cold fusion" saga lives on and a non- scientific cottage industry continues to churn out "explanations" for the "facts" of the "cold fusion" saga. Strikingly absent from most of these explanations is any examination of the raw experimental data collected before December 1989, which presumably were the primary source of "fact" for determining the validity of the FPE.
The focus of our analytical efforts has been and continues to be the soundness of the 1989 conclusions concerning FPE validity. At the Second International Conference on Cold Fusion at Como, Italy one of us (WNH) reported his analysis for the State of Utah of some early Fleischmann and Pons experimental data. Some of our reconstruction and analysis of Harwell Laboratory's 2 isoperibolic calorimetry was reported in the Proceedings of the Third International Conference on Cold Fusion at Nagoya, Japan3• We have gained access to other sets of raw data from the 1989-90 period and have also benefited from retrospective analysis efforts undertaken and published in the past years4- 6 .
Inevitably in "scientific archeological" expeditions such as ours, a perspective evolves which was not available either to those who did the experiments or to those who immediately tried to draw implications from the results. This paper addresses, with benefit of hindsight, what might have been in 1989 had we known then what we know now. Or, as our title suggests, how might 1989 have turned out if we had had the benefit of these "future" four years of understanding?
FP Effect Validity - What is meant?
There are two sets of criteria that have been in play from the beginning -the scientific criteria and those associated with patents. It was
10-2

commonly assumed, particularly since the FPE was presented in a public press conference, that the most important criteria were those of science, yet a careful examination of what was made available in 1989 suggests that patent criteria were primary. Although there is a relationship between the two they are not the same and have quite different requirements. (see Figure 1) Broadly speaking the scientific community has no secrets while the technological and commercial communities depend on secrecy or controlled access to information to derive competitive advantage.• The United States Constitution created a monopolistic property right for inventors and the price to inventors was "public disclosure" of their
Figure 1. Criteria for validity. I—LeZ■ionobvious?
invention. Thus, an inventor has no incentive to publicly describe his invention until such time as a patent is issued, further, the procedures for getting a patent in the United States assume secrecy from the time of application until issuance.
To receive a patent an inventor must have produced something that is "New" and "Useful". Two hundred years of court cases and legislation have tried to grapple with what these words mean. "Newness" has been so difficult to define that an additional criteria "Nonobviousness" found its
10-3

way into the law in 1952. Today an invention is "New" if there is no prior invention which conflicts with the "new invention"; and, if it wasn't obvious to a "Person having ordinary skill in the art" - Mr. Phosita, in the legal jargon. The "Usefulness" criteria is the juncture of the scientific and patent criteria. An invention can be Useful only if it can operate to perform its intended task, thus, an invention that violates the laws of nature can't operate -- hence it can't be useful.
The scientific validity criteria in Figure 1 serve different needs in science. If a phenomena is "well described" then scientists can use each other's experiences without always having to repeat them, i.e., a good "theory" compactly represents and extends limited experience. Absent good "theory" the scientist must go back to the laboratory to find out what was "really meant". If he can't perform your experiment, i.e., repeat it, then he can't have confidence that he knows what your claimed phenomena are.
To the extent there was any official application of "scientific" criteria to the FPE it started with the commissioning on 24 April 1989 by the Secretary of Energy, James D. Watkins, of a special assessment by the Energy Research Advisory Board (ERAB)7. The ERAB assessment team was to be formed and an interim report provided by 31 July 1989 with a final report by 15 November 1989. A fuller, non-bureaucratic discussion of the workings and reasoning of the ERAB team and the meaning of their report is given in Huizenga8.
Cold Fusion Patentability Assessment of the U.S. Patent and Trademark Office
In his Annual Report for Fiscal Year 1992 the Commissioner of Patents and Trademarks reported:
Emerging Technology - Cold Fusion Although cold fusion has been the subject of much skepticism in the
scientific community, it continues to be an active area of research in the United States and other countries. Since the concept of cold fusion has come into recent prominence, over 200 applications mentioning it have been filed at the USPTO. The USPTO has not issued a patent for any application claiming cold fusion or claiming a process relying on cold fusion. These applications have been routinely rejected under 35 U.S.C. 101 and/or 35 U.S.C. 112.
The basic position of the USPTO in making its rejections seems to be: (1) the inventions can't be useful because the scientific community,
10-4

particularly as summarized by the ERAB assessment team, has established that there is no "cold fusion", (35 U.S.C. 101);
(2) because there is no FPE, it is -impossible in any specification to describe the claimed invention in a manner which is enabling to one who is skilled in the art. That is, no inventor is capable of writing an enabling description. (35 U.S.C. 112).
The USPTO may also be rejecting applications using a third argument: (3) Any claims by the inventors for new apparatus and methods are
already to be found in the prior electrochemical art. Thus, all the claims of the inventors are "obvious" being a mere repetition of prior invention of electrochemists or other Mr. Phosita. As with (1) and (2) above this logic depends upon the non-existence of an FPE. If there is an FPE it would be a surprising result and thus this foundation for rejection would not stand.(35 U.S.0 102(exact duplication) or 35 U.S.C. 103(obvious extension)).
Reprise of Some Experimental Evidence of 1989 for the FPE
The following table lists papers based on data collected in 1989. They are used to illustrate various features of the evidence produced but not necessarily available in 1989. Each set of work is briefly discussed in the labelled paragraphs that follow.
Experiment-Reported Exp. Start Finished Excess ± (Power )
FPI - 10 Apr 89 1 NA I March 89 KJ - MJ N A
Lewis, et alio - 17 Aug 89 early Apr 89 I early May 89 zero ±6 % Pinput
Williams, et al.2 -23 Nov 89 mid-Mar 89 late July 89 Izero various
• 16 FPH calorimeters 17-26 Apr 89 29 May 89 inconclusive ±5-10% of Pinput
• 1 Isothermal calorimeter 17 Apr 89 25 July 89 zero < 1 % Pinput
AM000 12 -19 March 1990 Apr 89 18 Dec 89 50KJ < 1% Pinput
• Trial cell 0 1 Apr 89 1June 89 KJ NA
• Trial cell 1 June 89 Aug 89 1KJ N A
• Closed, flow cell 2 24 Oct 89 18 Dec 89 >50KJ ±0.001 W
10-5
Fleischmann and Pons(FP). First, the FPE was described in a "preliminary note"l that is a remarkably dense 7 pages and extraordinary for its claims. It was written in one afternoon and to expedite publication the authors never saw the final galley proofs. It provided very few details about the design of the electrochemical cells or other information to educate experimenters in the subtlety of the experiment. In particular, the duration of an experimental cycle and other crucial information was not published in the scientific literature until FP's papers was submitted 21 December 1989. Note that FP had completed a patent application, which remains publicly unavailable to this day, prior to submission of their "preliminary note"l - which had been received by the Journal of Electroanalytical Chemistry on 13 March 1989 and in revised form 22 March 1989, all prior to the press conference.
Lewis, et al, CalTech. Lewis, et all° attempted replication of the FP experiment but lacked detailed information about FP's experimental design. The California Institute of Technology Summer 1989 alumni magazine Engineering & Science 11 contains the most detailed published description of the design of the calorimeters and procedures used by Lewis, et a16. It is not possible using the published record to do an accurate comparative analysis of these attempted replications of the FP experiments. It appears that the Lewis group never had an experimental cycle longer than 18 days. Further, the quality and maturity of their calorimeters, their experimental design, and the analysis of their results make their published work of historical but not scientific interest in establishing or rejecting the FPE. It is also worth noting that Lewis, et al were highly visiblel 1 in the popular press and were subjected to and major participants in the pressures of the intense public relations firestorm that had started on 23 March 1989.
Williams, et a1 2 , Harwell. By reputation in the scientific community Williams, et a12 at Harwell in England conducted the most careful and complete replication trials of the FPE heat experiments. Their "replication" of the FP experiments using their sixteen Fleischmann-Pons-Hawkins(FPH) calorimeters represented a very good first effort to explore the parameters of electrode size, effects of light and heavy water, different electrolytes, and extended measurement cycle times. The FPH cells were operated for over 40 days throughout which period the experimental team was under great pressure to complete the experiments,
10-6
produce conclusions and ultimately provide a written report. This pressure produced an immature understanding of the error characteristics of their FPH cells. A second calorimeter, the isothermal or so-called plutonium calorimeter, was also set up to measure heat produced in an electrolytic cell of design radically different than those of FP. Although much has been made of the measurement accuracy of this isothermal calorimeter, there was only one such instrument in existence and the detailed behavior of the installed electrochemical cell was never researched. For example, the cell potentials in this cell seem unaccountably low for the operating current densities used, particularly when compared to the geometry and electrolyte of their FPH cells. As with Lewis, et al., the Harwell group operated under extreme public scrutiny and had little opportunity to revisit and reanalyze and mature their instruments or procedures.
Amoco 12 , Non-public report of internal 1989 work. In March 1993 the Research Department of the Amoco Production Company provided us with a copy of their internal report of work on the FPE they performed in 1989. Unlike most other research groups trying to do science under the glare of publicity, the Amoco team was able in 1989 to complete three iterations of experimentation, learning in each iteration how to improve and mature their experimental instruments and designs. The result of their 24 Oct-18 Dec 1989 experiment showed that an FPE experiment in a closed, flow calorimeter produced unaccountably large steady levels of heat, as well as bursts of heat, at magnitudes 100 to 1000 times greater than instrumental error. The cumulative net gain in energy was in excess of 50KJ. Further, the tritium level in the electrolyte at experiment start was 2.5 ± 1.0 pcurie/mL, while at the end of the experiment this had increased to 7.4 ± 1.1 pcurie/mL; these results were achieved in a closed calorimeter. A complete material accounting was carried out for the water, palladium and lithium and essentially no materials were consumed during the experiment. They note that had the experiment been terminated in less than one month they would have failed to see the FPE. We are urging Amoco to submit this work for publication in a scientific journal.
Summary and Observations
With the cooperation of Fleischmann & Pons, Harwell, Amoco and the State of Utah's National Cold Fusion Institute, we have obtained raw
10-7

experimental data from FPE experiments performed in 1989. A dispassionate and more leisurely analysis of that data shows that additional, useful information can be extracted from these early data sets. Results of our analyses will be published elsewhere. The 1989 conclusions and assertions about instrumental accuracy, presence or absence of anomalous levels of heat, and the failed appreciation of the subtle nature of these experiments can be seen in hindsight.
As observed by the Amoco researchers, patience was crucial to the success of their experiments. In retrospect, the CalTech and Harwell teams failed to produce "persons having ordinary skill in the art". They did not have the "teachings" of the FPE contained in the Utah patent applications, nor did they spend the time to understand the subtleties of the FPE experiments.
Attaining the level of skill to become a Mr. Phosita for the FPE in 1989 now seems beyond the reach of a group conducting crash experimentation in the full glare of public scrutiny. The pressure to perform produced:
- experimental cycles that were too short -- CalTech; - experimental cycles too lacking in guidance about the experiment
being replicated -- all experimenters, since the FP preliminary notes was hurriedly produced and short on information for a new field;
- experiments too visible to produce mature, considered scientific judgement -- ERAB panel which had an impossible set of deadlines and no established FPE facts, and the CalTech and Harwell teams which operated at full tilt for a short period without adequate contemplation time.
The 1989 attempts by the ERAB and other public review groups to discern the "facts" of the FPE demonstrates how weak a process advisory panels can be when faced with masses of "preliminary notes", strict reporting deadlines, anecdotal evidence from laboratory visits where experiments are not actually in progress, and where debate is more informed by passion than laboratory experience.
Based upon our evaluation of the 1989 experimental data sets made available to us, we conclude:
• There is a Fleischmann-Pons Effect. • The experimental signature of the FPE is heat.
Further, we observe that: • Refinements of the 1989 FPE experiments are producing
10-8

experimental protocols and instruments that meet the most stringent demands of science and possibly those of the patent system.
• Today, there is no "explanation" for the FPE, but from a patent perspective - it simply doesn't matter, so long as the inventions perform as claimed.
References
1 a. M. Fleischmann, S: Pons and M. Hawkins, J. Electroanal. Chem. 261 (1989) 301 1 b. M. Fleischmann, S. Pons and M. Hawkins, J. Electroanal. Chem. 263 (1989) 187 2. D.E. Williams, D.J.S. Findlay, D.H. Craston, M.R. Sent:), M. Bailey, S. Croft, B.W. Hooten, C.P. Jones, A.R.J. Kucernak, J.A. Mason and R.I. Taylor, Nature, 342 (1989) 375 3. M. E. Melich and W.N. Hansen in H. Ikegami(Ed), Frontiers of Cold Fusion: Proceedings of the Third International Conference on Cold Fusion, October 21-25, 1992, Nagoya, Japan, Frontiers Science Series No. 4(FSS-4), Universal Academic Press, Tokyo 1993, ISBN 4-946443-12-6 4. R.H. Wilson, J.W. Bray, P.G. Kosky, H.B. Vakil and F.G. Will, J. Electroanal. Chem., 332 (1992) 1 5. M. Fleischmann and S. Pons, J. Electroanal. Chem., 332 (1992) 33 6. M.H. Miles and B.F. Bush in H. Ikegami(Ed), Frontiers of Cold Fusion: Proceedings of the Third International Conference on Cold Fusion, October 21-25, 1992, Nagoya, Japan, Frontiers Science Series No. 4(FSS-4), Universal Academic Press, Tokyo 1993, ISBN 4-946443-12-6 7. U.S. Department of Energy, Energy Research Advisory Board, DOE/S-0071, Cold Fusion Research, November 1989 8. John R. Huizenga, Cold Fusion:The Scientific Fiasco of the Century, U. Rochester Press, Rochester, NY 1992, ISBN 1-87822-07-1 9. M. Fleischmann, S. Pons, M.W. Anderson, L.J. Li and M. Hawkins, J. Electroanal. Chem., 287 (1990) 293 10. N.S. Lewis, C.A. Barnes, M.J. Heben, A. Kumar, S.R. Lunt, G.E. McManis, G.M. Miskelly, R.M. Penner, M.J. Sailor, P.G. Santangelo, G.A. Shreve, B.J. Tufts, M.G. Youngquist, R.W. Kavanagh, S.E. Kellogg, R.B. Vogeiaar, T.R. Wang, R. Kondrat & R. New, Nature, 340(1989) 525 11. "Quest for Fusion" in Engineering & Science(ISSN 0013 -7812), Summer 1989, Vol LII, No. 4, Alumni Association, California Institute of Technology 12. Amoco Production Company, Research Department, Theodore V.
10-9

Lautzenhiser, Daniel W. Phelps, Report T-90-E-02, 90081 ART0082, 19 March 1990, Cold Fusion: Report on a Recent Amoco Experiment .

Pd/D CALORIMETRY — THE KEY TO THE F/P EFFECT AND A CHALLENGE TO SCIENCE
Wilford N. Hansen Department of Physics Utah State University
Logan, Utah 84322-4415
Michael E. Melich Department of Physics
Naval Postgraduate School Monterey, California 93943-5000
Abstract
The main issue before this conference can be stated as a simple question:
Question #1: Can large amounts of heat be generated at a significant rate by Pd/D interaction as announced by Fleischmann and Pons?
By now there have been many experimental results claiming to answer "yes" and which force us to take that possibility very seriously. As used here the "large amounts" are much larger than can possibly be explained by chemistry or metallurgy as known today. Up to now the only practical way of answering this question is by Pd/D calorimetry. That being so, a second question naturally follows.
Question #2: Are there any Pd/D calorimetric data sets extant which are competent to clearly answer Question 1?
It is shown why Pd/D calorimetry holds the answer, and why the answer to both questions is probably "yes."
11 -1

Introduction
By now electrochemical Pd/D calorimetry has greatly advanced, both experimentally and in method of analysis. In fact, key data sets from the past, if carefully documented, can be re-analyzed with much enhanced insight. This is very important, especially for the experiments which have come to determine national and international policy.
The main issue before this conference can be stated as a simple question:
Question #1: Can large amounts of heat be generated at a significant rate by Pd/D interaction as announced by Fleischmann and Pons?
By now there have been many experimental results claiming to answer "yes" and which force us to take that possibility very seriously. As used here the "large amounts" are much larger than can possibly be explained by chemistry or metallurgy as known today. Up to now the only practical way of answering this question is by Pd/D calorimetry. That being so, a second question naturally follows.
Question #2: Are there any Pd/D calorimetric data sets extant which are competent to clearly answer Question 1?
There are indeed experiments which taken at face value do answer Question 1, with a resounding "yes." However, because of the extreme significance of such an answer and the apparent difficulty in nailing down all the parameters necessary to make the experiments repeatable, it may be reasonable to expect scientists to be highly skeptical and require unusually high standards of proof. Also, nature seems to have dealt us a case more profound and evasive than imagined at first. But this should not be blamed on F/P or other researchers. The challenge to science is to solve the case, with hard work and rational dialogue. We shouldn't allow such a smoke screen to be thrown up that the answers can't be recognized even when they am found. We also must be careful that our motives are purely scientific.
To make our position clear at this point we offer two examples from a long list. Mike McKubrel et. al, using closed cell electrochemical calorimetry both simple and accurate, found and confirmed several times large amounts of excess heat. In their examples the largest total excess heat was 450 eV/atom normalized to the Pd lattice or to the D in the lattice at a loading taken as —1.
In a completely independent set of experiments, Edmund Storms 2 found excess heat produced to about 400 eV/Pd atom, in a different closed electrochemical calorimeter design. Before going to other details, stop and focus on the implications of these numbers. Those implications are profound and unavoidable! They must be faced by anyone interested in knowing the answer to Question #1. Consider that the typical heat of formation of chemical compounds, say H20, is 1 eV/atom. For an exceptionally stable compound like Al203 it is about 3 eV/atom. The maximum enthalpy you could store in a Pd lattice by work hardening or any other distortion is about 0.2 eV/atom, the heat of melting. Thus the excess heat that has been produced is hundreds of times that conceivable from chemistry or metallurgy as we know it.
This enormous excess heat production is the Fleischmann/Pons Effect, FPE. The signature of the FPE is excess heat. and up to now the only practical way of answering Question #1 is by Pd/D calorimetry. That makes the subject interesting indeed.
There are other examples of experiments which answer Question #1 with a clear The two data sets that have been most used in deciding if the Fleischmann/Pons Effect. FPE, really exists are the sets of F/P 3 themselves and those of Harwel1 10 . The F/P data sets are the very basis
11-2
of the FPE in the first place. The Harwell data have been and are (correctly or not) used to argue that there is no FPE. In the hope of clarifying the situation by giving an independent careful evaluation of both calorimetric investigations we have re-analyzed F/P and Harwell data. We have been given a few sets of F/P raw data and all of the Harwell calorimetric data. While the results will be published in much greater detail elsewhere, we make some points regarding the work here. Having the advantage of later and improved analysis techniques, we hoped to discover more detailed information and to improve the accuracy with which the results could be given. Perhaps at higher accuracy we might even find excess heat where it hadn't been realized before or simply agree or disagree with previous analyses, where they existed. In any case, both data sets would be looked at from an independent and different point of view.
Below we report some of our findings using our own analysis of these key calorimetric investigations. We also discuss the implications of these findings.
Some Analytical Details and Implications
General Comments
We submit as self-evident that in these matters experimental observation must always have the last word. And indeed it will. Since nothing involving human reasoning is absolute, it is a matter of individual opinion as to when "yes" is proven by observation. Proving the answer to be "no" is a much more difficult subject. An observation that simply fails to answer "yes" (call it "negative") does not answer "no." It simply gives no answer at all. Failing to catch a fish from a favorite trout stream on a particular outing says essentially nothing about the total absence of fish in the stream. All active researchers doing calorimetry have negative results, and that will probably continue until details are worked out. It is absurd to suggest that Question 1 be answered by taking a tally of the number of positive and negative results. Yet simple negative results have been taken as convincing evidence that the F/P effect does not exist. And current patent and funding policies are driven by a few negative results. Therefore it is extremely important that calorimetric results be examined closely.
We reexamined some of the F/P raw data taken by them and loaned to us 11 . We have also examined the performance of duplicates of the F/P silvered cells. We had these cells made to the original specs by the same company that made them for F/P. The purpose of this endeavor was to independently evaluate the F/P data and cells by our own analytic techniques. The importance of clarifying the validity of the F/P results would be hard to overstate.
We also obtained the raw data of the Harwell electrochemical experiments, as well as the notebooks. These data were examined to increase, if possible, the information obtained from their analysis 12 . We present some of our findings below. This work is not yet completely finished.
Hopefully we have also advanced the state-of-the-art in this type of calorimetry. For example, we show that the F/P silvered cells can be accurate as high as 90 C or so. We examine the question of blackbody radiation in the cell system. We examine the matter of temperature uniformity within the F/P cells, which was such a debated point early on, and actually measure the fraction of the heat flux that actually goes out the top of typical F/P cells. We also use new statistical procedures in attempts to maximize the information extraction from the data. Some of these data have been taken by us using our own F/P type cells.
Numerical examples of F/P and Harwell results
In keeping with the purpose of this short paper to discuss the validity of F/P type calorimetry in an overall sense, two examples of real data sets will be examined, i.e. an example of F/P silvered cell
11-3

raw data and raw data from a Harwell run. The data are original and used by permission from F/P and Harwell. The emphasis here in this paper is not to investigate excess heat claims, but to demonstrate our analysis of real data. Both the consistency of the data set and the appropriateness of our method of analysis are being tested.
First consider an F/P data set that is run in the usual way but with a Pt cathode giving no excess heat. There are no heat pulses at all for calibration, yet we shall see that our methods still analyze the data very well. The temperature and voltage of the cell are shown in Fig. 1. In the first part of the analysis we took the excess heat as small (the exact value doesn't matter for now) and the cell mass as 5.3 moles water equivalent. We then calculated Kc assuming Kr = 5.5 E-10. Since the model fails at water refills and when the temperature gets too high, a few computed Kc values will be bad at these times. The bad points are obvious. These outlier points are removed. A linear regression analysis is then run with the cleaned up data set to determine excess heat, heat conduction constant and moles of water equivalent heat capacity (Qf, Kc, and M) simultaneously over the whole data set. Kr is fixed at 5.5 E-10. Each quantity is obtained as a single number which is an average. The Qf is indeed found to be zero within less than 20 milliwatts, and Kc and M are physically reasonable. In fact, we calculated Qf, Ke and M for fifty different regions, obtained from time zero to fifty different times 100 minutes apart from 10,000 minutes to the very end of the data set. IQflnain was near zero and IQflmax was 3.8 E-02 watt. The mean Qf was -1.2 E-02 watt. These numbers indicate the systematic error because we already know the real answer is zero. Relating the accuracy to the 5 watt input to this cell, the mean deviation from zero is -0.24% of the power. We do not take this value as the final calculated Qf, however, because we wish to see excess power as a function of time. Kc is then recalculated at every point with Qf and M held fixed. The result is plotted in Fig. 2. This is the real Kc of the cell as a function of time at all points where Qf is essentially zero, which is everywhere for this cell. The sawtooth variation is due to the daily change in electrolyte level. But the daily average of Kc is nearly constant. Kc x AT is about 9% of the heat transfer due to both radiation and conduction. In Fig. 3 is shown the calculated excess heat assuming a fixed average Kc. We call it oneKcQ to avoid confusion with Qf. The sawtooth variation here is not real, but shows up this way because of the Kc variation. Now the oneKcQ sawtooth variation could be modeled and thereby nearly eliminated, but it isn't worth the effort. The standard deviation, std, for the Qf data set is only 20 milliwatts including the sawtooth variations, and systematic uncertainties that can't be eliminated are about that same amount. Note that the average total input power for this run is roughly 4-5 watts. Also, as we shall see with the next set of data, when there is a deviation such as a heat pulse, it stands out superimposed on the sawtooth shape and is easily seen. So we see that we can analyze the data to better than 0.5-1% of input power and can see odd pulses to even higher sensitivity, depending on where they show up.
By a similar procedure, but somewhat different, we have analyzed the Harwell data. Here the cell has a Pd cathode in D20 + LiOD, and it is designed to produce heat to test for the F/P effect. There are also many heater pulses and electrolytic current pulses. In Fig. 4 where we show our determination of oneKcQ + H (H is the power of an imposed heater pulse), the actual heater pulses are included on the baseline for reference. Note that H is included as an unknown in the analysis so as to see how well we do. Since the heat pulse calibrations were made with a full cell, the zero baseline should go through the oneKcQ curve at a time when the cell is full. Positive deviation along the typical slope until refill is due entirely to change in Kc due to lowering electrolyte level. It appears that the data are unreliable from about 7000 to about 18000 minutes. In the Harwell notebooks a "faulty power supply" is mentioned at this time. Thus the reason for the big dip near the beginning is due to cell malfunction. Even here, however, heater pulses are seen and accurately analyzed, implying that short heat bursts would also be seen. At later times the data are reasonable. Accuracies of about 20 milliwatts (here that is 2%) can be expected in the best regions but this degrades to 60 milliwatts or even 100 milliwatts in other regions (see pulse 8 for example). Total heat power is about 1 watt here, so that ± 20 milliwatts corresponds to ± 2%.
11-4

Results of studies of some key calorimetric problems
First consider the problem of temperature uniformity within the F/P silvered cells. Actually our studies were within our own copies of the silvered cells, made into our own calorimeters. At an electrolysis current of 0.4 amps temperature differences were measured at various pairs of locations with vertical and horizontal separations with a difference thermocouple. In summary, differences of two or three hundredths of a degree were typical. During a heater pulse of 0.3 watt, a bias of up to 0.1 degree was found across the cell from heater to thermometer. Further, a 0.1 degree error was found to change the calculated excess heat, Qf, by 0.016 watt when a 0.3 watt heat pulse was involved at a 3 watt heat transfer output power or an error of about 1/2%. Actually the maximum observed error would be more like 1/4% because the effective cell temperature was probably close to the mean of the two extremes, making the error itself only about 0.05 degree. These temperature differences, while larger than the reported 0.01 degree, are not a serious problem in our F/P type silvered cells.
There are two types of heat transfer out of the cells besides that due to mass flow. Most of the heat transfer is by radiation. Recall that radiation power is Kr x (T4cell - "1"4 bath) and heat conduction power is Kc x (Tceii-Troom )• For one of our typical cells, we have measured Kr at 6.0 E-10 with Kc = 0.0055. Given our measured values for Kr, Kc, Tceii, Tbath, and Troom , we compute that 6.9% of the heat is out the top. That means the heat conduction through the top of the cell is about 6.9% of the total heat transfer. Most of that conduction is due to the glass with silver coating plus the wires. In our case we use a plastic foam stopper instead of the Kel-F stopper used by F/P, and the wires are at a practical minimum in thermal and electrical conductivity, and the Kc out the top was measured by fitting an environment controlling hood over the top part of the cell and controlling its temperature separately.
Another important point that needs to be cleared up is the often heard suggestion that several cells in a water bath may be "talking" to each other radiatively because they are transparent. It has also been suggested that hot spots on the cathode might be seen by an infrared thermogram. We have examined these possibilities quantitatively. We have calculated blackbody curves up to 600 K. We have also measured the transmittance of laboratory pyrex, light water, and heavy water. The results show clearly that the cell electrolyte, pyrex walls, and water bath are all opaque to the calculated thermal radiation. Details are given elsewhere ]. 1 . Of course if there are hot spots so hot that they have appreciable radiation in the near infrared or the visible they could be seen. But this would require a temperature considerably higher than 600 K.
Time constant effects are important in calorimetry. The radiative heat transfer has the advantage that only the glass walls are involved so long as the contents are "well stirred." Experience shows that the typical time constant from this point of view is only a few minutes at most. This gives a great advantage to this type of calorimetry because it is so responsive. By the way, the water bath must also be well stirred to prevent temperature gradients at the cell surface. Conduction out the top of the cell is another matter. It can have a long time constant. However, since Kc is only ca. 7% of the Kr + Kc transfer, a larger error in the process can be tolerated. In fact, if a simple temperature controlled hood is used on the upper half of the silvered top and the hood kept close to the cell temp, say within 3 degrees for a 30 degree (Tcell - Tbath), the effect of conduction out the top is reduced by another order of magnitude to 0.7% which is essentially negligible.
A final effect which we discuss here is that of atmospheric pressure for these open cells. The cells are versatile in that they can be used at widely varying temperatures, even approaching 90 C. At the higher temperature evaporation is an important factor, and depends on atmospheric pressure and equilibrium mixing. We have found that our modeling equations work well to 90 C, as shown in the F/P cell data given below, but the atmospheric pressure need have only modest accuracy at low temperatures (say <50 C) but must be known to about 5% at 75 C.
11-5

Conclusions
After a great deal of experience working with F/P data, modeling the calorimeters, and physically using electrochemical calorimeters like the F/P silvered cells, we have found that they are easily capable of 1% accuracy when care is taken and all experimental details are available for the analysis. They can be used to 90 C. Temperature uniformity is adequate, and intercell radiation is not a problem. The cells are rather inexpensive and versatile. All this is a variance with the common wisdom of 1989. Our analysis methods take no shortcuts but can be run in minutes on a workstation once programmed.
We have applied these analysis techniques to the Harwell FPH electrolytic calorimetry cells. The Harwell FPH cells are not as accurate as the F/P type cells, but over considerable time segments of their operation their accuracy can be reliably characterized. The accuracy bounds that we have estimated are about 2-3% of input power, which is a tighter estimate than derived using Harwell's analysis techniques. We have also determined that the detection of heat pulses above a certain size can be accomplished with the Harwell FPH cells. There are instances, as we reported at ICCF3 in Nagoya in October 1992, where such excess heat pulses are seen. Analysis is continuing of these cells to determine the total excess energy represented by these observed heat pulses.
The excess heat found in the Harwell FPH cells, as we currently understand it, is not definitive with respect to the Fleischmann/Pons Effect, FPE. On the other hand, the Harwell results in no way disprove the FPE. With the luxury of hindsight we now see that Harwell would not have been expected to produce significant excess heat in almost all of their cells because of low current densities, low levels of D loading into the Pd, and other choices in their experimental design. Scientists have no business using the Harwell data as a "no" answer to Question 1!
11-6

References
1. M. C. H. McKubre, S. Crouch-Baker, A. M. Riley ; S. I. Smedley, and F. L. Tanzella in H. Ikegami (Ed.), Frontiers of Cold Fusion. Tokyo, Japan: Universal Academy Press, Inc., 1993, pp. 5-19.
2. Edmund Storms in H. Ikegami (Ed.), Frontiers of Cold Fusion. Tokyo, Japan: Universal Academy Press, Inc., 1993, pp. 21-30.
3. M. Fleischmann, S. Pons, and M. Hawkins. "Electrochemically Induced Nuclear Fusion of Deuterium." J. Electroanal. Chem. Vol. 261, p. 301 (1989); M. Fleischmann, S. Pons, M. W. Anderson, L. J. Li, and M. Hawkins. "Calorimetry of the Palladium-Deuterium-Heavy Water System." J. Electroanal. Chem. Vol. 287, p. 293 (1990); S. Pons and M. Fleischmann. "Calorimetric Measurements of the Palladium/Deuterium System: Fact and Fiction." Fusion Tech. Vol. 17, p. 669 (1990).
4. M. Schreiber, T. M. Giir, G. Lucier, J. A. Ferrante, J. Chao, and R. A. Huggins. "Recent Measurements of Excess Energy Production in Electrochemical Cells Containing Heavy Water and Palladium." Proceedings of the First Annual Conference on Cold Fusion 44, Salt Lake City, UT, (March 1990).
5. M. C. H. McKubre, R. Rocha-Filho, S. T. Smedley, F. L. Tanzella, S. Crouch-Baker, T. 0. Passell, and J. Santucci. "Isothermal Flow Calorimetric Investigations of the D/Pd System." Proceedings of the Second Annual Conference on Cold Fusion, Como, Italy, (June - July 1991).
6. R. A. Oriani, J. C. Nelson, S. Lee, and J. H. Broadhurst. "Calorimetric Measurements of Excess Power Output During the Cathodic Charging of Druterium into Palladium." Fusion Tech. Vol. 18, p. 652 (1990).
7. M. H. Miles, K. H. Park, and D. E. Stilwell. "Electrochemical Calorimetric Evidence for Cold Fusion in the Palladium-Deuterium System." J. Electroanal. Chem. Vol. 296, p. 241 (1990); M. H. Miles, B. F. Bush, G. S. Ostrom, and J. J. Logowski. "Heat and Helium Productions in Cold Fusion Experiments." Proceedings of the Second Annual Conference on Cold Fusion 363, Como, Italy (June July (1991).
8. E. Storms. "Review of Experimental Observations About the Cold Fusion Effect." Fusion Tech. Vol. 20, p. 433 (1991).
9. A. B. Karabut, Ya.R. Kucherov, and I. B. Savvatimova. "Nuclear Product Ratio for Glow Discharge in Deuterium." Physics Letters A. Vol. 170, p. 265 (1992).
10. D. E. Williams, D. J. S. Findlay, D. H. Craston, M. R. Send, M. Bailey, S. Croft, B. W. Hooton, C. P. Jones, A. R. J. Kucernak, J. A. Mason, and R. I. Taylor. "Upper Bounds on 'Cold Fusion' in Electrolytic Cells." Nature. Vol. 342, p. 375 (1989).
11. Wilford N. Hansen. "An Independent Analysis of Some Fleischmann/Pons Electrochemical Calorimetric Data." submitted for publication.
12. Wilford N. Hansen and Michael E. Melich. "An Independent Analysis of Harwell Electrochemical Calorimetric Data." to be submitted for publication.
11-7

1- )-
C
Fig. 1. Raw temperature and potential of F/1 3 Cell. Clirrpnt vac a ennct ant 0.8 wain.

Fig. 2. Kc of FA' Cell. cur ;0 n ponctqnt 5 ; F-10 1
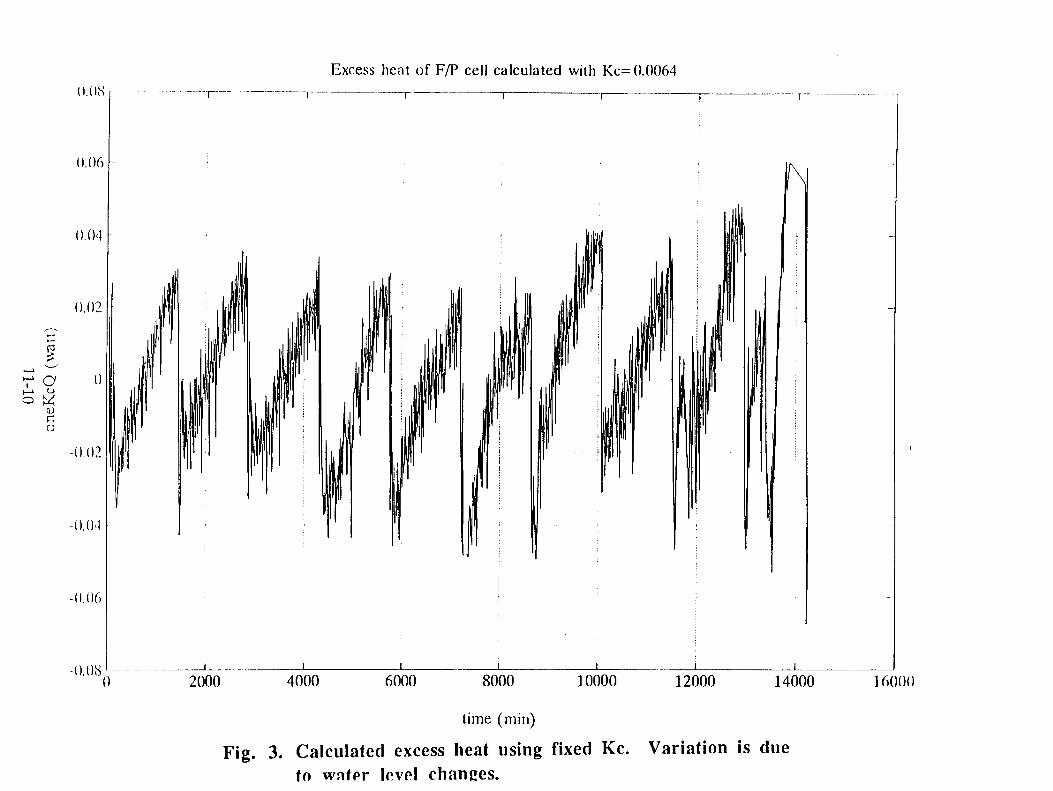
Fig. 3. Calculated excess heat using fixed Kc. Variation is due to water level changes.
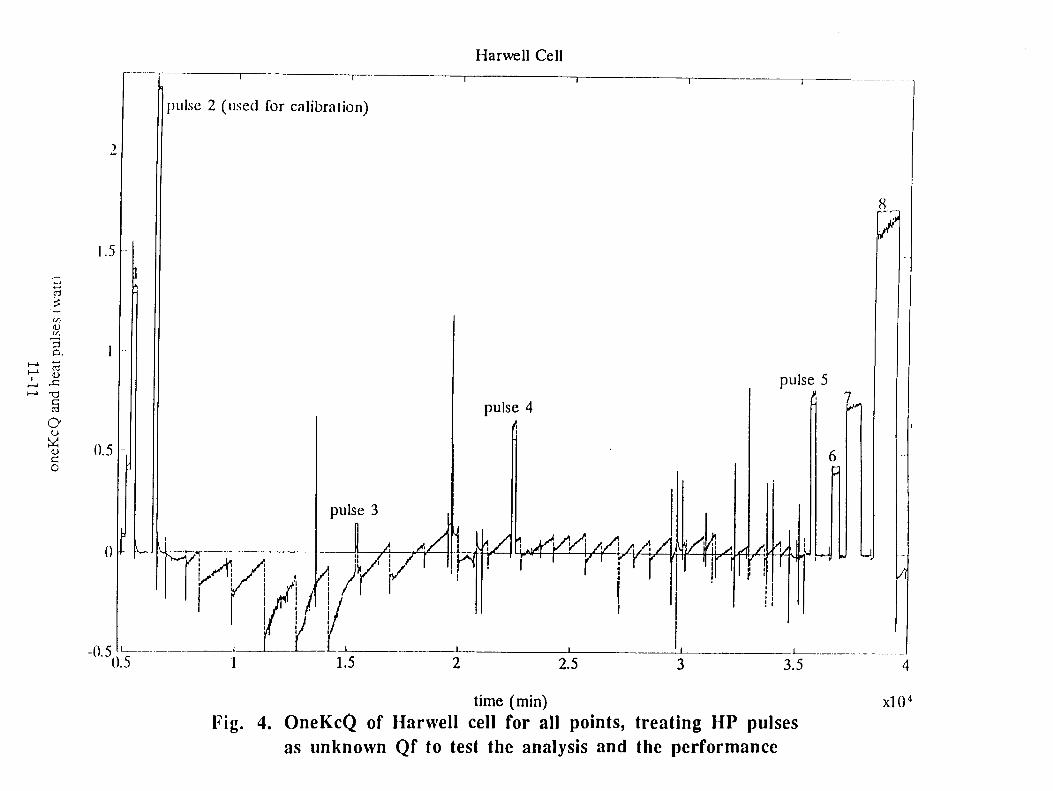
Fig. 4. OneKcQ of Harwell cell for all points, treating HP pulses as unknown Qf to test the analysis and the performance

FIGURE CAPTIONS
Fig. 1. Raw temperature and potential of F/P Cell. Current was a constant 0.8 amp.
Fig. 2. Kc of F/P Cell. (Kr is a constant 5.5 E-10.)
Fig. 3. Calculated excess heat using fixed Kc. Variation is due to water level changes.
Fig. 4. OneKcQ of Harwell cell for all points, treating HP pulses as unknown Qf to test the analysis and the performance of the calorimeter under widely variant conditions.
11-12

EXCESS HEAT; THE MACRO-PRINCIPLES.
J. L. Waisman*, Consultant, 25 Redwood Tree Lane, Irvine, California, 92715-2226, U.S.A.
N. J. Kertamus, Senior Research Scientist, Southern California Edison Co., 2244 Walnut Grove Avenue, Rosemead, California, 91770, U.S.A.
Abstract and Conclusions.
This paper presents Macro-Principles which permit prediction of the Excess-Power-density developed in Pd-D crystal lattices. The principles are stated in terms of three state properties which can be measured and controlled, and other conventional thermodynamic and heat transfer properties. The 3 state properties of the lattice are composition, temperature and deuterium chemical potential.
The principles are independent of the details of the heat producing collision events. They consider (a) that the events occur in the course of collisions of a given deuterium entity with another entity in the lattice, (b) that the collisions occur as a consequence of the jumping of the hydrogen isotope from one interstitial position to another, and (c) that the jumps and collisions are triggered by the state of internal energy in the lattice.
We present previously published experimental evidence that the effect of temperature on excess heat production has the predicted trend. Simulations of the excess heat, produced by varying the 3 state properties and two heat transfer properties, are also consistent with experimental results.
The simulations also explain the very large excess power density obtained during forced-to-boiling tests.
The principles are believed to offer a plausible explanation of heat bursts, and runaway temperature accompanying excess heat produced during electrolysis.
The principles predict achievable conditions which will produce excess power at commercially competitive densities. These predictions should permit a leap into practical applications.
12-1

EXCESS HEAT. MACRO-PRINCIPLES.
Contents
Background. 1. First Macro-Principle. The Excess-Heat (X-Heat) Production
Equation. 2. Second Macro-Principle. Producing Desired State Properties.
Limits of Nature. 3. X-Heat Production Curves. 4. Third Macro-Principle. Effect of Heat Transfer on the Lattice
Temperature. 5. Some "Old" Data. Baseline and Non-Baseline. 6. Experiment vs. Prediction, Low X-Power-Densities. 7. A Fleeting Glimpse of Commercial X-Power-Densities. 8. Appendix. Identification of Thermodynamic Force. References.
Background
This paper presents and substantiates macro-principles which can be used for quantitatively predicting excess heat in palladium-deuterium systems. The principles are termed "macro-principles" since they depend only on macro-properties which can be measured and controlled.
The principles are consistent with thermodynamics, metallurgy, diffusion technology, and heat-transfer technologies. They do not depend on a detailed understanding of the micro-events which produce the heat.
The principles show that the excess heat (which we shall call X-Heat) depends on the crystal lattice state properties: its composition, the lattice temperature, and the deuterium chemical potential. Investigators are urged to measure at least two of them; the third is dependent on the other two.
Other Metals and Other Deuterium Sources.
The specific corroborating data are for palladium-deuterium electrolytic systems. But the reader will note that other metal-hydrogen systems have internal energy characteristics similar to those of Pd/H. And other metal systems are not limited to the low temperature hydrogen-rich phases to which the Pd/H system is restricted.
The reader will also note that the principles presented deal with the interaction of hydrogen entities with the lattice after
12-2
the entities have entered the lattice. The external source of the hydrogen entities is not significant. It may just as easily have been deuterium gas, or implantation by other sources as by electrolysis.
I-Heat-Power-Density Target for Competitive Commercial Costs.
An economic analysis not included in this paper has been conducted. It shows that for the Pd/D system, an X-power-density in the range of kilowatts/cm."3 is required for energy costs competitive with natural gas.
Postulates.
The principles follow naturally from the following postulates:
a. excess power is produced in the palladium-deuterium system, b. that the excess power density may be far higher than can be explained by known chemical, or metallurgical reactions;
that the heat producing events: c. occur in a metal lattice which contains many deuterium entities in its interstices. d. occur when a deuterium entity collides with or closely approaches another entity which may also be deuterium. e. are triggered in the course of the jumping of these particles at energy levels characteristic of the lattice when it has the system's given state properties;
and that: f. the same heat producing events will always occur in a system of a given composition, given quality and having given state properties.
Baseline Work.
The experimental work which has been performed by workers in the field of "cold-fusion" includes a large variety of test equipment, materials, material preparation, times, pressures, temperatures and analysis techniques. To permit focussed thinking we choose a "baseline" set of conditions to develop the theory. Later we will extend the pattern to other than baseline conditions.
Our selected baseline (1) is for X-Heat produced: -in the course of electrolysis controlled to constant current density, -using a palladium cathode and a deuterium solute in a Fleischmann and Pons type cell, or an equivalent closed cell, -using a long time soaking after the nominal "filling time" for diffusion.
12-3

List of Macro-Principles:
Three principles are presented.
1. The X-Heat Production Equation.
2. Producing Desired State Properties; Limits of Nature.
3. Effect of Heat Transfer on the Lattice Temperature.
The first principle is proposed for use with X-Heat and rests on two independent bases: the logic of its derivation, and its consistency with experiment. The next two principles are adapted from well-developed technologies. The combined use of all three is essential for predicting X-Heat
Much additional investigation of the macro-principles is in order. We hope that other investigators will independently evaluate and improve upon them.
1. First Macro-Principle. The X-Heat Production Equation.'
The Thermodynamic Force.
The lattice consists of particles making up the lattice itself, say palladium, and small particles in the interstices, say hydrogen. Both types of particles are vibrating, with an energy distribution and an average energy, characteristic of the temperature. In addition, the hydrogen particles in the interstices jump from one interstice to another at an average frequency also characteristic of the temperature. In hydrogen-palladium at room temperature, the average jump frequency is in the range of billions per second.
In accordance with postulate d, a collision or close approach of a given particle of hydrogen to another particle may occur during a jump. (We shall use the term collision to apply also to a close approach.) A collision may result in changes of the electron structure of the two particles (a chemical reaction), or changes in the nuclei (a nuclear reaction).
The characteristics of the jumps also determine the rate of hydrogen mass movement, or diffusion, through the lattice (2). Therefore at the beginning of each hydrogen jump, when the hydrogen
r . The symbol [-] is used for exponentiation. Example: cm. - 3 is cubic centimeters.
12-4

is not yet close to a colliding particle, the jump characteristics are independent of which of the three options will occur; the diffusion, a chemical reaction, or a nuclear reaction. In the following development we consider - these three options as two groups: the movement of mass (diffusion), and the collision reactions (chemical or nuclear).
The following thought process is usually successful in developing rate equations. One thinks of the rate of the reaction as a "flux". One then selects a characteristic of the process as a "theromodynamic-force" (or thermo-force) which causes the flux. This may not be a newtonian force. A measure of the "free energy" (or equivalently, the entropy) of the system is selected. The thermo-force at time t, is proportional to the difference between the measure of the free energy at that time, and the free energy when the system reaction is complete.
In the appendix, we relate our choice of a thermo-force with the formalism of the "Thermodynamics of Ongoing Processes".
We select the hydrogen chemical potential, as the (scalar) "thermo-force" for a collision reaction. It is the same thermo-force which assists the jumps in diffusion (see appendix), except that it is not biased in any direction. This type of "force" is commonly used by thermodynamicists. For example:
Callen (3) summarizes the use of chemical potential, "... we shall see that the chemical potential provides the generalized force not only for the flow of matter from point to point but also for its changes of phase and for chemical reactions. The chemical potential thus plays a dominant role in theoretical chemistry."
Lewis and Randall (4) make a similar statement.
The choice also follows directly from the definition of chemical potential. The chemical potential of a particle is the amount of free energy change in the lattice which occurs when the particle is moved from infinity into the lattice. This change requires the application of a thermo-force. If the driving thermo-force were removed, the hydrogen would tend to escape. The driving thermo-force is the chemical potential. Within the lattice the chemical potential of the hydrogen represents the interaction between the particle and the remainder of the lattice system. It can be thought of as a repulsive newtonian force, which assists each jump.
The Equation.
In general, J = L X (1-1) where, for a reaction, the flux J is the change in mass per unit time per initial mole of a reacting substance. X is the thermo-force (4 in this case) and L is a rate factor which may be
12-5
temperature dependent, and whose dimensions are to be determined for each phenomenon. We now make several substitutions in equation (1-1).
Assume that a given number of jumps produces a specific number of heat-producing events. Then the total rate of X-Heat production per mole of reacting substance is proportional to J.
We define jp as the total (X-Heat) energy produced by the system per second, and M as the mass of Deuterium in the active part of the system. ("active" will be discussed shortly) Then Jp/M is proportional to the J in equation (1-1).
The rate factor "L" in equation 1-1 must be proportional to the average rate of jumping, or the frequency, f.
Equation (1-1) now becomes Jp = K1 M f u (1-2)
where K1 is a proportionality constant.
We make two additional substitutions for convenience. We replace M by (Cd) (Vpd), where Cd is the deuterium concentration in gm./cm. 3 , and Vpd is the system active Pd volume in cm. 3 . We then replace the Cd by K2 (D/Pd), where D/Pd is the atom ratio of deuterium to palladium.
Shewmon (2) shows that for diffusion, the jump frequency is proportional to the diffusivity, D, which has dimensions of cm. - /sec. (Note that we underline the D for diffusivity to distinguish it from D, for a deuterium entity.)
We substitute (K3 D) for the f. The temperature coefficient of D will be discussed subsequently.
Equation (1-2) now becomes: Jp/V = K (D/Pd) (D) g (1-3)
where K is a dimensional constant having dimensions of moles/cm. - 5, a product of Kl, K2, and K3. The "V" is an abbreviation of Vpd, the active volume.
Equation (1-3) will be called the X-heat Production Equation.
A Bridgman-type dimensional analysis of equation 1-3 (5), indicates consistency with dimensional rules. This consistency shows that in addition to both sides of the equation having the same dimensions,
(a.) The equation will not change form as units are changed, and (b.) The dimensions of the dimensional constant K, are traceable to substitution of identities or the stated relation between f and D.
12-6

For convenience in calculating the diffusivity, D, we present a well-known relationship between D and temperature. The numbers are based on tests for alpha hydrogen-palladium over a range of temperatures.(6) Data for the beta phase are sparse. One investigator reports beta D values which are the same as the alpha; another reports beta D an order of magnitude larger than the alpha D.
D = D, exp (-Q/RT) (1-4) where the D and the D, are in cm. 2 /sec, Q is the activation energy in calories per mole, R is the gas constant in calories per mole per degree K, and T is the absolute temperature. D, = 0.0095, Q = 6500, and R = 1.98.
The exponential part of equation (1-4) is identical to the exponential portion of the Arrhenius equation for chemical reaction rates, and the exponential portion of the Boltzmann distribution of energy vs temperature.(7)
• The equation (1-4) component of the X-heat production equation
(1-3) produces a very strong temperature effect. It is augmented by the appearance of the temperature as a linear effect in the chemical potential. (4 = R T 1,„a, where a is the activity.)
We used the term "active volume" in defining the "V" in equation (1-2). We use the term to mainain generality. The active volume is the region of the host where significant X-heat is generated. Its location in the host must be established for each population of similar experiments. The present authors' analysis of the Fleischmann and Pons experiments will be presented. It clearly establishes an active volume throughout the bulk. Other experiments may represent near-surface active locations, or other non-uniform X-heat sources. But it is believed that the laws of X-heat production and heat transfer will still apply. And, of course, proof of the validity of the principles depends on consistency with past valid experiments, and its success in extrapolating to new conditions.
2. Second Macro-Principle. Producing Desired State Properties; Limits of Nature. (Equivalence of Electrolytic and Gas Loading.)
Identifying C, P, and T Properties.
Equation (1-3) determines X-heat density as a function of 3 variables, C, P, and T. C is the composition (the D/Pd), T is the lattice (or host) temperature in Kelvin (included in the D and u),
12-7

and P is the chemical potential, 4, in joules/mole, as previously defined in section 1.
Expressions for Chemical Potential. - Equivalence of Electrolytic and Gas Loading.
The chemical potential of H in a Pd host, g, can be expressed as g-ge = R T Lna. (Darken & Gurry, 26, p. 211), where a is the H's activity. The p o is the chemical potential in the standard state, generally 1 atmosphere. (The go is frequently omitted as we have done earlier in this paper; but it is always implied.)
Hydrogen enters the solid solution via the immediate surroundings of the host. In the immediate surroundings, the chemical potential is determined by the characteristics of the fluid, and in the case of an electrolyte, by its electrode potential.
For electrolytic loading the hydrogen chemical potential is g-go = (F E) (2-1)
where F is a Faraday, 96,500 coulombs per gram mole, and E is the electrode potential compared to a standard hydrogen electrode in its standard state.
For gas pressure loading the chemical potential of hydrogen in the H2 gas is
g-g, = {(1/2) R T Lh P/Po}, (2-2) where P is the hydrogen gas partial pressure in atmospheres, and the standard state pressure, Po, is 1 atmosphere. This equivalence of electrolytic and gas loading has been shown, (Lewis, 6, p. 34) by a number of workers. It is important. Apparently any system state in the lattice can be attained by either kind of loading. And for a given state of the lattice, there is no reason to think that any diffusion or reaction will be any different, whether the lattice is electrolytically or gas loaded.
The "Surroundings" Impose State Properties.
At the start of loading, the interior of the host has no hydrogen and its hydrogen activity is therefore zero. The surroundings are at a high activity as determined by the electrode potential or gas pressure. The H is forced to diffuse into the lattice until its interior chemical potential is the same as it is in the surroundings. As the surroundings are varied, such as by changes in the electrode potential, the interior will follow after a lag. This is one important function of the surroundings; pumping in the hydrogen and establishing its activity.
12-8

"Surroundings" have Strong Effect on the Lattice Temperature.
The other major X-heat related function of the surroundings is to adjust the rate at which X-heat is removed from the host. This is not a passive effect; nor is it trivial. The heat transfer properties of the surroundings vary over a wide range. This will have a very major effect on the rate of X-heat production. This will be discussed subsequently.
Phase and CPT Diagrams. CPT-Space. Limits and Dependencies.
The values of C, P and T cannot be arbitrarily determined. The concentration cannot exceed a maximum value determined by the temperature and chemical potential. And the 3 variables are not independent. When two are known, the third is fixed.
FIGURE 2-1.
12-9

Figure 2-1 shows a phase diagram for Pd-H as a function of the concentration, pressure and temperature.(8) It is useful to consider the diagram's 3-dimensional space as "CPT-Space". The curved surface (to be called the "surface of the solid zone") is the surface in CPT-space where the solid and gas can co-exist at equilibrium. Surfaces are also shown where the alpha and beta phases co-exist. Although the position of the boundary surfaces represent equilibrium, similar boundary surfaces exist for a changing system. These changing-system surfaces are at somewhat different locations than shown, corresponding to a time lag for the phase changes. The "solid zone" in CPT space (the space under the curved surface) represents the range available for X-heat production.
A pressure scale is shown on figure 2-1, representing the "force" for gas loading. For electrolytic loading this scale is replaced by the cathode electrode potential, with the equivalence previously shown in equations 2-1 and 2-2.
Fir.' 10P s
p(n) isotherms of Pd(H) with bulk palladium at different temperatures. including the critical region
12-10

Figure 2-2 is a "CPT Isothermal" diagram.(9) Each of the family of lines shown correspond to horizontal planes in Figure 2-1. It is apparent that if two of the CPT variables are known, the third can be determined from thid diagram. The ordinate of this diagram is Log P. The ordinate may also be chemical potential or electrode potential.
These figures are for the Pd/H system. The corresponding figures for the Pd/D system will be similar. But the state properties will be somewhat different. Lewis (6) has data useful to correct these diagrams for deuterium.
Calculating K in equation 1-3.
If the X-heat is measured during a test, and the rate of change is small enough so that C, P, and T are approximately steady, and if two or all of the CPT variables are measured, K can be calculated. If only two are measured; the third is determined from a figure 2-2 type diagram.
3. X-Heat Production Curves
If one were able to load a host to a given D/Pd, maintain the concentration constant, and then increase the host's temperature, how would the X-heat change with temperature? The Production Equation (1-3) answer to this question is shown in Figure 3-1 for D/Pd's of 0.4, 0.8 and 1.0. Recall for a given D/Pd, that Figure 2-2 shows that the chemical potential, Az, must change as the temperature changes. This change is incorporated into each curve of Figure 3-1. The temperature effect is very large; it is probably the largest controllable variable in producing X-heat.
However, in electrolysis, one does not directly control the D/Pd. The family of lines in Figure 3-1 is still an important guideline for the relationship, but one will move from line to line as the D/Pd changes.
There are two kinds of limits which dictate how much of the production curves can actually be used. First, the CPT must lie within the solid-zone in CPT-space, as shown in the previous section. Second, for electrolysis, the temperature must be below boiling.
For the higher D/Pd's in Figure 3-1 (0.8 and 1.0) 100 C cannot be exceeded for both the above reasons. The dashed lines in this figure indicate this.
12-11

FIGURE 3-1. X-HEAT PRODUCTION CURVES. K = 6,620.
CLOSEUP
12-12
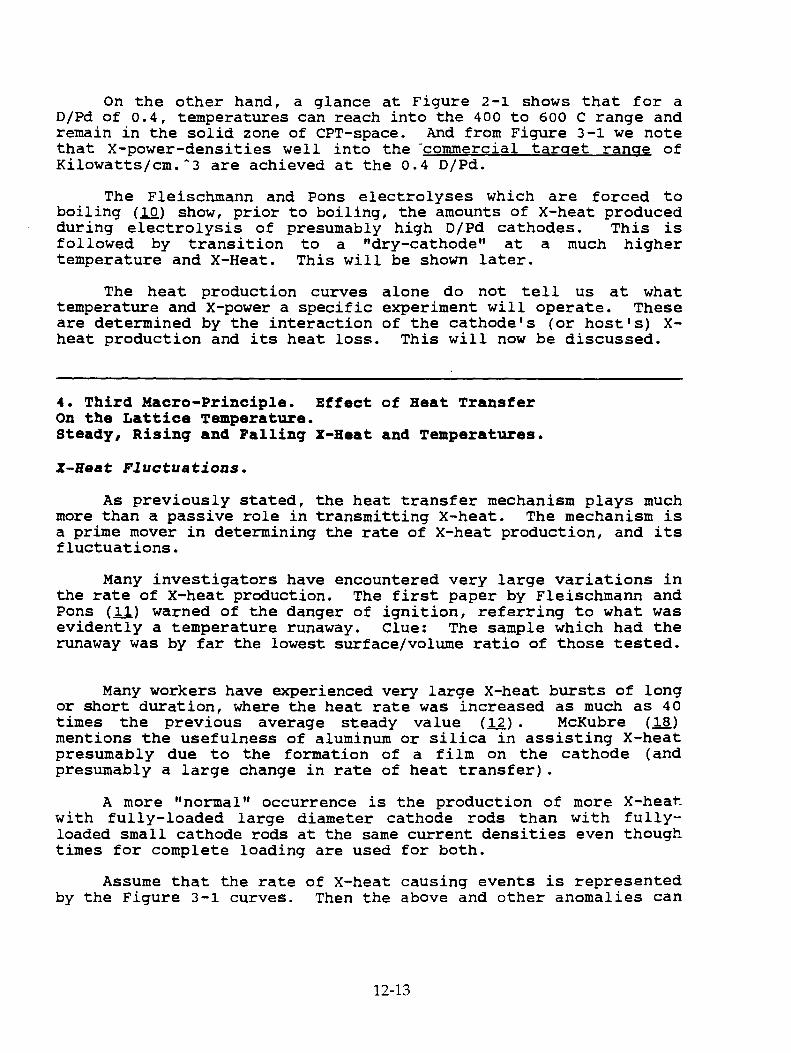
On the other hand, a glance at Figure 2-1 shows that for a D/Pd of 0.4, temperatures can reach into the 400 to 600 C range and remain in the solid zone of CPT-space. And from Figure 3-1 we note that X-power-densities well into the -commercial target range of Kilowatts/cm. - 3 are achieved at the 0.4 D/Pd.
The Fleischmann and Pons electrolyses which are forced to boiling (10) show, prior to boiling, the amounts of X-heat produced during electrolysis of presumably high D/Pd cathodes. This is followed by transition to a "dry-cathode" at a much higher temperature and X-Heat. This will be shown later.
The heat production curves alone do not tell us at what temperature and X-power a specific experiment will operate. These are determined by the interaction of the cathode's (or host's) X-heat production and its heat loss. This will now be discussed.
4. Third Macro-Principle. Effect of Heat Transfer On the Lattice Temperature. Steady, Rising and Palling X-Heat and Temperatures.
X-Heat Fluctuations.
As previously stated, the heat transfer mechanism plays much more than a passive role in transmitting X-heat. The mechanism is a prime mover in determining the rate of X-heat production, and its fluctuations.
Many investigators have encountered very large variations in the rate of X-heat production. The first paper by Fleischmann and Pons (11) warned of the danger of ignition, referring to what was evidently a temperature runaway. Clue: The sample which had the runaway was by far the lowest surface/volume ratio of those tested.
Many workers have experienced very large X-heat bursts of long or short duration, where the heat rate was increased as much as 40 times the previous average steady value (12). McKubre ag) mentions the usefulness of aluminum or silica in assisting X-heat presumably due to the formation of a film on the cathode (and presumably a large change in rate of heat transfer).
A more "normal" occurrence is the production of more X-heat with fully-loaded large diameter cathode rods than with fully-loaded small cathode rods at the same current densities even though times for complete loading are used for both.
Assume that the rate of X-heat causing events is represented by the Figure 3-1 curves. Then the above and other anomalies can
12-13

be explained by well known characteristics of the heat transfer from the cathode and from the electrolytic cell.
A Clue in the Shape of the I-heat Production Curves.
Consider any of the curves in Figure 3-1. If the cathode producing X-heat were perfectly thermally insulated and therefore transmitted no heat, all the X-heat would be used to increase the cathode temperature. Each higher temperature would produce more heat, which would produce a higher temperature, etc. The effect accelerates with increasing temperature because of the rapidly increasing slope of the curve. This is an unstable positive feedback which produces a runaway temperature. Of course this is an extreme case. But even the normal range of heat transfer characteristics produces large X-heat effects because of the exponential shape of the production curve.
The Heat Transfer Laws.
The electrolytic cells in use for producing X-heat have three zones of interest to us, each at a uniform temperature: a reference reservoir or bath, the electrolyte or "cell", and the cathode. During X-heat production, the cathode has the highest temperature, the "cell" next, and the bath the lowest.
A sharp temperature change occurs across the two relatively thin layers separating these zones. Experience has shown that the rate of heat transfer between two of the adjacent zones is a function of the difference in temperature between zones, of the area of the separating layer, and of an experimentally determined characteristic called the "heat transfer coefficient".
First consider the heat transfer rate from the cell to the bath. Two common equations are:
Pout= A Kc (Tcell-Tbath) (4-1) Pout= A Kr (Tce11 4 - Tbath4 ) (4-2).
Pout is heat transfer out, watts, and "A Kc" or "A Kr" are the "cell constant." A is the surface area of the cell periphery, Kc and Kr are the heat transfer coefficients, and T is the absolute temperature. Equation 4-1 is generally termed "Newton's Law of Cooling" and applies when the principal heat transfer is by convection. Equation 4-2 is used when the principal transfer is by radiation. Calorimeters using conduction transfer have also been used. Such calorimeters require a corresponding equation with the temperature gradient as the temperature function.
In all cases, the experimental calibration produces a graph of Pout vs. the temperature function.
A wide range of cell designs and materials are in use producing a wide range of cell constants. For example, the scatter
12-14

in cell temperature of 5 investigators using a bath temperature of 30 C, and an output power of 2 watts, was from 33 to 60 C. This is a large difference. This is one of several reasons for wide scatter of the X-heat produced by different investigators at the same current density.
Next, consider the heat transfer from the cathode to the cell. The Newton's law of cooling type equation is:
J = A h (Tcathode-Tcell) (4-3), or J/Vc = (A/Vc) h (Tcathode-Tcell) (4-4).
J is the total rate of heat flow from the cathode, A is the surface area of the cathode, h is the heat transfer coefficient, and Vc is the active volume of the cathode.
The cathode temperature is not generally measured or reported, and the corresonding h therefore can not be calculated. This measurement is sorely missed in the use of equation 1-3 for X-Power density, and for the calculation of the'"h". The "h" is a very sensitive indicator of important effects. But even when h is not known, we can still arrive at important conclusions by calculating effects of a range of "h" corresponding to a likely range of values. Measuring cathode temperatures is not easy; but the data are worth a struggle.
Figure 4-1 is a plot of equation 4-4. The ordinate is the X-Power density transported from the cathode, as a function of the cathode temperature. We select equation 4-4 rather than 4-3 to match the scales of the heat production curves, Figure 3-1. Although a single line is shown, it represents a family, for which both the Tcell and the slope will vary over a wide range. The slope changes as the cathode surface-area/volume ratio and the "h" change.
Stability and Heat Flow. Combining X-heat-Production-Curves and Heat Transfer Line.
We now have sufficient information to determine the cathode temperature and X-power production at a steady state. We determine these quantities by comparing the rate of X-heat production for a range of temperatures, Figure 3-1, with the rate of heat transfer of the same temperature range, Figure 4-1.
This is illustrated in figure 4-2. At any temperature, T, we know both the rates of X-heat production and transport. The difference between the two rates corresponds to the rate at which the cathode temperature changes. At point "S", this difference is zero and the temperature is stable.
At a temperature below S, more X-heat is being produced than transported, and the cathode temperature is rising. Similarly, at temperatures above "S", the temperature is falling.
12-15
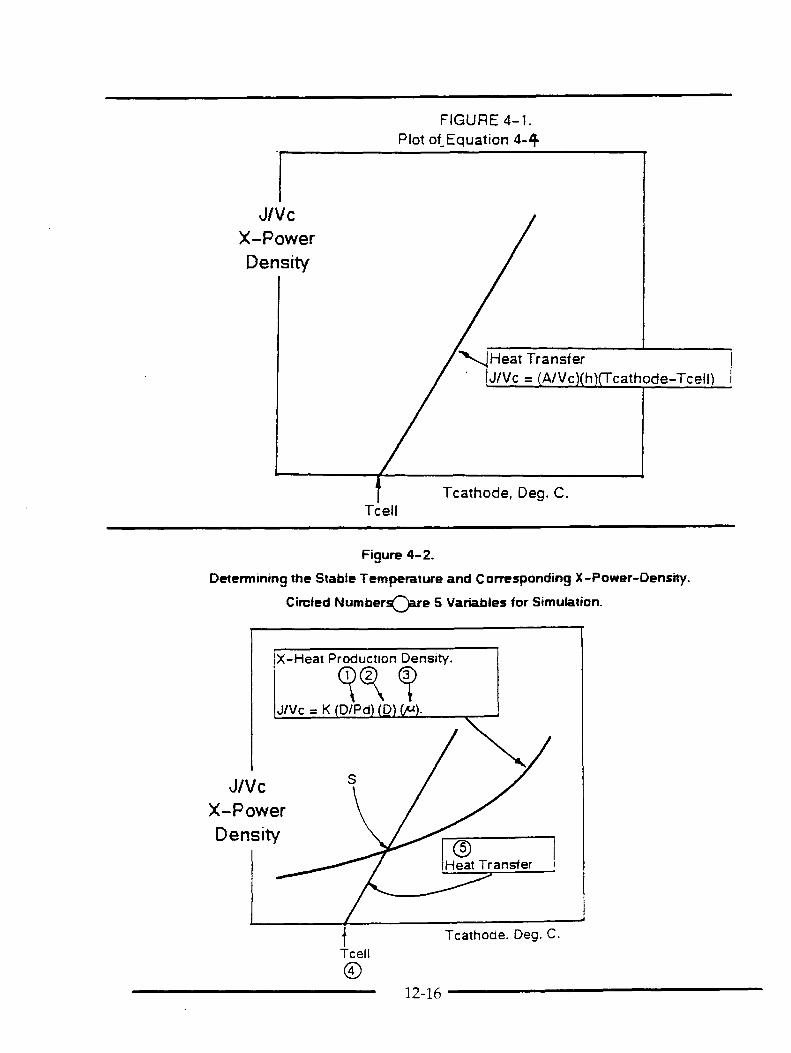
12-16
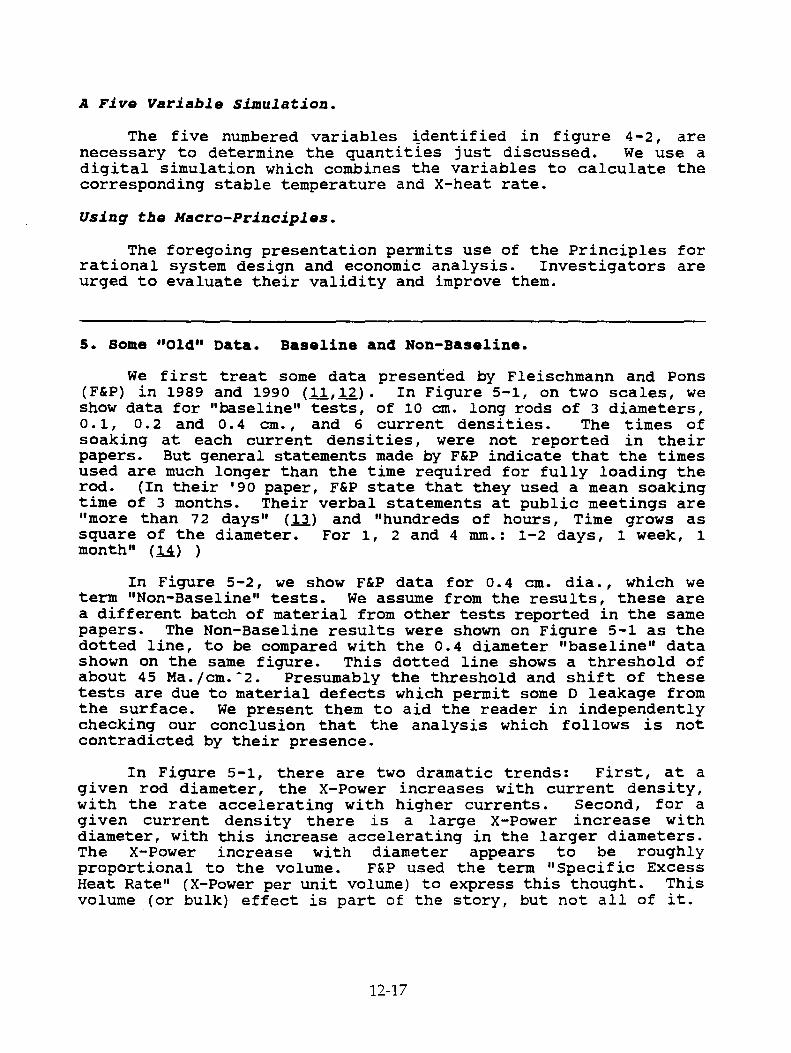
A Five Variable Simulation.
The five numbered variables identified in figure 4-2, are necessary to determine the quantities just discussed. We use a digital simulation which combines the variables to calculate the corresponding stable temperature and X-heat rate.
Using the Macro-Principles.
The foregoing presentation permits use of the Principles for rational system design and economic analysis. Investigators are urged to evaluate their validity and improve them.
5. Some "Old" Data. Baseline and Non-Baseline.
We first treat some data presented by Fleischmann and Pons (F&P) in 1989 and 1990 (11,12). In Figure 5-1, on two scales, we show data for "baseline" tests, of 10 cm. long rods of 3 diameters, 0.1, 0.2 and 0.4 cm., and 6 current densities. The times of soaking at each current densities, were not reported in their papers. But general statements made by F&P indicate that the times used are much longer than the time required for fully loading the rod. (In their '90 paper, F&P state that they used a mean soaking time of 3 months. Their verbal statements at public meetings are "more than 72 days" (13) and "hundreds of hours, Time grows as square of the diameter. For 1, 2 and 4 mm.: 1-2 days, 1 week, 1 month" (14) )
In Figure 5-2, we show F&P data for 0.4 cm. dia., which we term "Non-Baseline" tests. We assume from the results, these are a different batch of material from other tests reported in the same papers. The Non-Baseline results were shown on Figure 5-1 as the dotted line, to be compared with the 0.4 diameter "baseline" data shown on the same figure. This dotted line shows a threshold of about 45 Ma./cm. - 2. Presumably the threshold and shift of these tests are due to material defects which permit some D leakage from the surface. We present them to aid the reader in independently checking our conclusion that the analysis which follows is not contradicted by their presence.
In Figure 5-1, there are two dramatic trends: First, at a given rod diameter, the X-Power increases with current density, with the rate accelerating with higher currents. Second, for a given current density there is a large X-Power increase with diameter, with this increase accelerating in the larger diameters. The X-Power increase with diameter appears to be roughly proportional to the volume. F&P used the term "Specific Excess Heat Rate" (X-Power per unit volume) to express this thought. This volume (or bulk) effect is part of the story, but not all of it.
12-17

FIGURE 5-1. F&P, EXPERIMENTAL X-HEAT
12-18
FIGURE 5-2.
NON-BASELINE, 0.4 cm. Dia.
12-19

In Figure 5-3 we plot the "relative" X-Power-density versus diameter. The term "relative" refers to the ratio of each X-Power-density to the X-Power-density of the 0.1 cm. diameter rods at the same current density. It is -apparent that although all experimental points indicate an increase in X-Heat at least proportional to the volume, all diameters larger than 0.1 cm. increase their relative X-Power-density by a greater amount. The increase is larger with larger diameters and higher current densities. (Note that in Figure 5-3 the "R" in the graph refers to a reversal in the expected order of the data at that diameter.)
We shall now show that these effects are predicted by the Production Equation and other Macro-Principles presented earlier.
6. Experiment vs. Prediction, Low X-Power-Densities.
Diameter and Temperature Effects.
We now answer the question: As larger diameter cathodes are used, at a given current density, why does the X-Power-density increase more than the volume increases?
Consider "baseline" experiments loaded at constant current density, and having the required long time soaks. The D/Pd depends on the electrode-potential, which in turn depends on the cathode current density. This dependence is consistent with recently published papers which have measured D/Pd in situ. (15,16) The result of this dependence is that different cathode diameters tested at the same current density would have the same D/Pd. Therefore the X-Power-density might be presumed to be proportional to the volume.
But it is not. The X-Power-density exceeds the volume proportionality (Figure 5-3). The reason is as follows:
We know that any body at a different temperature than its surroundings, will transfer heat at a rate which depends on its surface/volume ratio as well as the heat transfer coefficient (h) and the temperature difference. The greater the rod diameter, the smaller the surface/volume ratio and the less the heat transferred from it. Therefore, if all diameters had a given D/Pd, and initially the same X-Power-density, the large diameter cathodes will develop a higher temperature.
But the higher temperature develops a higher X-Power-density (Figure 3-1), which in turn causes higher temperature, and so on. A steady state will be reached for each cathode size and shape when the heat production and heat loss rates are equal and opposite. This has been described in section 4. We can demonstrate it by
12-20
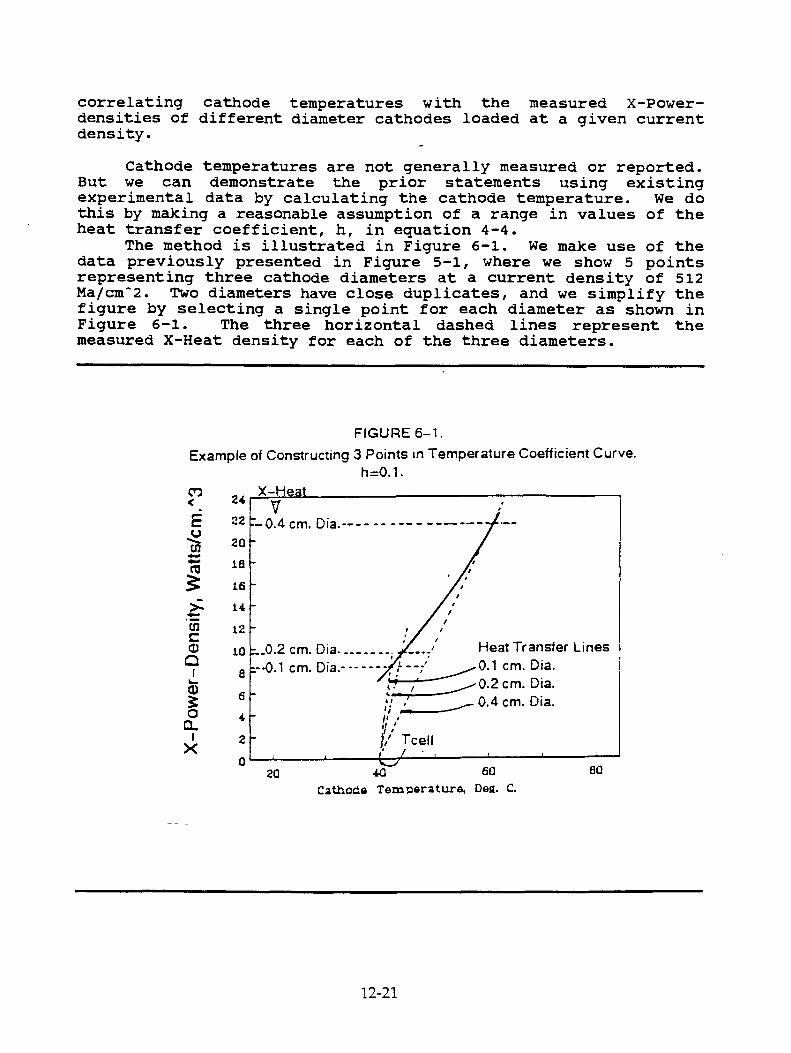
correlating cathode temperatures with the measured X-Power-densities of different diameter cathodes loaded at a given current density.
Cathode temperatures are not generally measured or reported. But we can demonstrate the prior statements using existing experimental data by calculating the cathode temperature. We do this by making a reasonable assumption of a range in values of the heat transfer coefficient, h, in equation 4-4.
The method is illustrated in Figure 6-1. We make use of the data previously presented in Figure 5-1, where we show 5 points representing three cathode diameters at a current density of 512 Ma/cm - 2. Two diameters have close duplicates, and we simplify the figure by selecting a single point for each diameter as shown in Figure 6-1. The three horizontal dashed lines represent the measured X-Heat density for each of the three diameters.
12-21

The fan of dashed lines originating at Tcell on the horizontal scale are the heat loss lines described by equation 4-4. (Tcell is the temperature of the cell, or electrolyte.) The dashed line for each diameter has a different slope, corresponding to its surface area to volume ratio. It is also reasonable that all diameters loaded at a given current density will have the same "h".
Each intersection of the two dashed lines for a given diameter represents equal and opposite heat production and heat loss; each therefore represents a steady state temperature.
The solid curve connecting the three intersections is the variation of X-Heat density with cathode temperature.
Since the h has not been measured, we must check a range of h's to determine a range of shapes. Three curves for h's from 0.05 to 1.0 (watts/(cm. - 2 Deg C) are presented in Figure 6-2 as the three solid lines. (A range of h's for water with forced convection is quoted as 0.01 to 2.0 in Thomas (17). The range used in Figure 6-2 covers the center of Thomas' range.)
We emphasize that these are experimental data with different h's merely changing the upward curvature. A calculated X-Heat production curve is shown as a dashed line for comparison. This curve is one of a family similar to those shown in figure 3-1. The similar shape of the solid lines and and the dashed line demonstrates the reality of the temperature effect and its similarity to the predicted effect.
In section 4 and Figure 4-2 we described the "5-variable simulation" used to predict the steady state X-Heat produced by a given combination of state properties and heat transfer properties of a cathode. We have used the simulation to produce the curves shown in Figure 6-3 for the relative X-Heat of a range of diameters and three D/Pd ratios. (Note that "L" in this figure is the cathode length.) Compare Figure 6-3 with experimental data, Figure 5-3. If the range of current densities shown in Figure 5-3 is mentally replaced by the range of D/Pd's in Figure 6-3 the curves are very similar. This scale replacement is valid. D/Pd is known to increase with increasing current densities in such experiments, although the relationship may not be linear.
The above data are believed to be credible evidence that the increased X-Heat with increasing diameter is due to decreases in the heat transfer rates of larger diameters.
We note some simplification for the simulation represented by Figure 6-1. The same Tcell was used for all three diameters. Actually, Tcell will increase with cathode diameter. One can visualize the effect. The curves for increasing diameters will

FIGURE 6-2. EXPERIMENTAL X-HEAT FOR THREE ASSUMED h'S. SHAPE COMPARISON WITH PRODUCTION EQUATION.
D/Pd = 0.95; K = 6619.
FIGURE 6-3. SIMULATION, RELATIVE X-HEAT VS. DIAMETER. CATHODE LENGTH, 10 CM., h = 0.65, K = 6620.

rise somewhat more slowly than shown. But the general shape will not change radically.
Other Experimental Verification. Lbw X-Heat Density.
We have also used the 5-variable simulation to predict the X-Heat of a range of D/Pd's for 3 diameters. The predictions are shown in Figure 6-4. (K=6619 moles/cm. - 5, h=0.4 watts/(cm. - 2 Deg. C)) Compare this figure with the experimental data, Figure 5-1. Again, mentally replace the Figure 6-4, D/Pd scale, with the current density scale of Figure 5-1.
The experiment vs. simulation comparisons of this section are demonstrations of the high probability of validity of the Macro-Principles.
The use of the state properties principle, section 2, in the above comparisons is not obvious. Although not explicitly mentioned in the preceding arguments, the section 2 Principles were used in determining the chemical potential for the simulations. The "upswing" of X-Power in figures 6-3 and 6-4, are due in large part to the increase of chemical potential with increasing D/Pd. This "upswing" has been shown in Figure 2-2 for D/Pd's in the beta range.
FIGURE 6-4. SIMULATION. X-HEAT VS. BETA RANGE D/Pd.
THREE DIAMETERS

7. A Fleeting Glimpse of Commercial X-Power-Densities.
The "forced to boiling" Fleischmann and Pons tests.
These results (18) are important in two ways. A high value of X-Power-density was obtained for a short time; and they were obtained after boiling dry. This gives us an insight into methods other than electrolysis for producing high density X-Heat.
Palladium samples 2 mm. diameter by 12.5 mm. long were electrolyzed in 0.1 M LiOD at two constant current settings, the second current larger than the first. During a number of days at the higher currents, the input power and cell temperatures gradually increased. After a number of days, these increases accelerated until boiling occurred. The boiling evaporated the electrolyte in approximately 20 minutes, the cells remained hot until 3 hours after completion of the boiling-to-dry, and local temperatures in the cell exceeded 300 C. Time lapse video recordings were made of the boiling. The last half of the boiling which took 10 minutes, was analyzed to determine the enthalpy required to vaporize the liquid.
The input enthalpy was 22,500 joules and the total output was 109,200 joules, an excess enthalpy of 86,700 joules and a ratio of 4.8. The average enthalpy output rate less the average input rate was 144.5 watts, or 3,700 watts/cm 3 . This is identified as excess heat, which we call X-Heat.
We paraphrase F&P: High rates of excess heat are being produced at the boiling temperature. This is the sequence: At the second current plateau, the temperature and excess heat rate are rising. The positive feedback (from the higher temperatures causing higher X-Heat rate) accelerates the rate of both until boiling is attained. The high temperature at boiling causes the high X-Heat rate. Higher heat rates may be possible with more prolonged or higher temperature boiling.
Comments by authors of this paper.
The reason for the increasing temperature and X-Heat at the second current plateau and prior to the acceleration to boiling, is not obvious, and apparently is not exclusively associated with the presence of X-Heat. We deduce this from previous F&P work published by Hansen (19) in connection with his review of the F&P calorimetry.
Hansen shows the timeline for temperature, power input and X-Heat rate for a number of tests. Two of these were identified blankcell 8 and heatcell 1. Both had a current plateau of 800 Ma
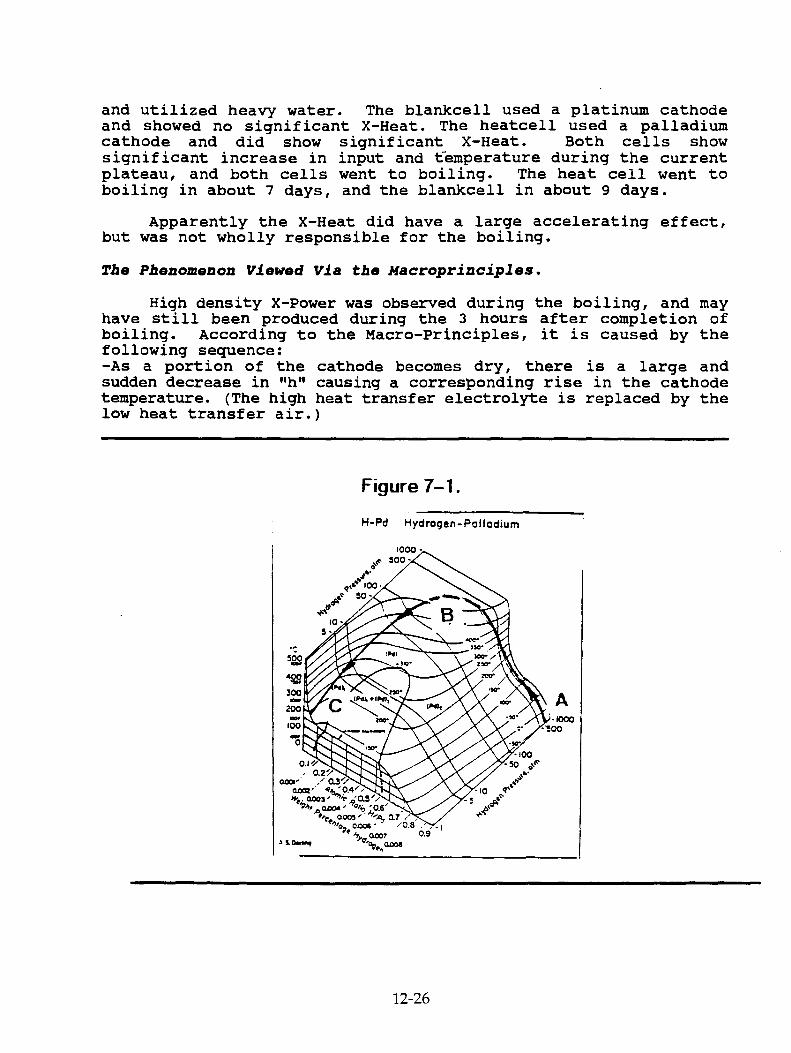
and utilized heavy water. The blankcell used a platinum cathode and showed no significant X-Heat. The heatcell used a palladium cathode and did show significant X-Heat. Both cells show significant increase in input and temperature during the current plateau, and both cells went to boiling. The heat cell went to boiling in about 7 days, and the blankcell in about 9 days.
Apparently the X-Heat did have a large accelerating effect, but was not wholly responsible for the boiling.
The Phenomenon Viewed Via the Macroprinciples.
High density X-Power was observed during the boiling, and may have still been produced during the 3 hours after completion of boiling. According to the Macro-Principles, it is caused by the following sequence: -As a portion of the cathode becomes dry, there is a large and sudden decrease in "h" causing a corresponding rise in the cathode temperature. (The high heat transfer electrolyte is replaced by the low heat transfer air.)
Figure 7-1.
12-26

-For a time this temperature increase predominates and causes a greatly amplified X-Power during the early part of the sequence. -Simultaneously the discharge of D2 begins at the cathode surface. With a time lag, outward diffusion occurs from the interior. -The discharge begins slowly, accelerates, and finally slows down to a tiny rate as the concentration approaches zero. This effect, with the X-Heat rate diminishing as D diminishes finally predominates.
Illustrations.
Figure 7-1 shows a line, ABC, following the above sequence, superimposed over the phase diagram. Point A represents the state properties at the start of the boiling sequence.
The corresponding sequence of X-Power changes can be visualized from figure 3-1. Assume that at the start, D/Pd is 0.8, and the temperature is 100 C, giving an X-Heat rate of 160 watts/cm - 3. When a given location is dry and the above sequence starts, the temperature and X-Power increase quickly, while we go to curves of lower D/Pd slowly. A typical case might be that when the average D/Pd has decreased to 0.4, the temperature would be above 250 C, and the X-Power-density would already have exceeded 1,000 Watts/cm - 3.
The results of a simulation of the sequence is summarized in Figure 7-2. In the upper part of this figure, we show the time line of the cell and cathode temperatures. Of course, the cathode X-Heat makes the cathode hotter than the cell. Boiling occurs in about 20 minutes. During this time the heat transfer coefficient, h, is assumed to have decreased from 0.1 to 0.037, with a corresponding temperature of about 600 C.
In the lower part of the figure, we show the X-Power-density corresponding to 600 C is 7,260 watts/cm - 3. (This is beyond the temperature covered by Figure 3-1.) The dashed line in the lower part of Figure 7-2, shows a probable path for the experimental sequence. We probably would not quite have achieved a temperature of 600 C, nor an X-power of 7,260 watts/cm. - 3. The F&P latest measurement, from the average heat of evaporation, was 3,700 watts/cm - 3.
It is notable that the high X-Heat rates were achieved in the "dry" portion of the sequence. This is a strong signal that the X-Heat does not require the simultaneous presence of electrolysis.
12-27

FIGURE 7-2. A FLEETING GLIMPSE OF COMMERCIAL X-HEAT DENSITIES.
Looking at F&P's Boiling-to-Dry, Via the Macroprinciples.
12-28

Our commercial problem is to achieve the combination of state properties designated as "B" in Figure 7-1, and to maintain these conditions at a steady state.
8. Appendix Identification of Thermodynamic-Force.
As a thinking pattern, we use the formalism of the branch of thermodynamics which deals with ongoing processes, generally referred to as "thermodynamics of irreversible processes" (T.I.P.). This enables us to transfer our thinking of equilibrium state properties and equilibrium thermodynamic functions to the local properties and local functions of the ongoing processes of interest. This science deals with "fluxes", symbol J, which may be flow rates of net mass, heat, or electrons; or chemical reactions. We'll use the chemical reaction as a surrogate for the "collision" group. And although the science can deal with simultaneous interactions of several fluxes, we will use it for a single flux. This implies no interaction of our hydrogen collision reaction with any other flow or reaction. We use this as a first approximation with subsequent complications to be added as experimental data dictates.
The entity which causes the flux is called a thermodynamic-force, (or thermo-force) designated in T.I.P. as "X". The term is somewhat misleading in that the forces are not necessarily forces in the newtonian sense, which cause a mass to accelerate (Z2, p. 5). They are quantities which cause flows or reactions. They may be gradients of chemical potential, or electric potential, or temperature for fluxes of mass, electric current or heat, respectively. (The chemical potential of a species in solution is its partial molal free energy, gi = aci / aNi , where G is the System Gibbs free energy per mole of species i added, and N is the number of moles of "i" in the system. The chemical potential is always measured compared to the potential in a standard state. This state is always implied but not stated.)
The thermo-forces will not have the dimensions of newtonian forces, MLt-2 . Their dimensions are determined by the equation defining the process.
In the formalism of T.I.P., if a flux and thermo-force are properly selected (20, p7),
J = L X (8-1).
The L is a rate function for the specific process; i.e. it will be a function of diffusivity for diffusion, the electrical conductivity for electric current flow, etc.
In general, the fluxes and thermo-forces are vectors for use
12-29
with flows, but we assume the fluxes and thermo-forces are in the same given direction, and use them as scalars. For a chemical reaction they are also scalars. The "proper selection" for given flows or reactions, consists of matching each flux and thermo-force so that the sum of their products is equal to the rate of change of system entropy. A further description of the matching can be found in the previous reference.
For diffusion in a system all of which is at the same temperature, a set of matching flux and thermo-force is as follows. The flux is the mass passing through a unit area per second, and the thermo-force is the gradient in chemical potential. (21) This relationship is much more general than Fick's law, and has been found to be correct even for many practical situations where a solute is moving "uphill" in a solute concentration gradient. (22) In such cases, the effect of other gradients, such as solvent composition or temperature is stronger than the solute concentration gradient. 2
The correct diffusion equation is derived starting with an equation (8-1) format. We visualize that in the absence of a chemical potential gradient, the jumps would occur in all directions with equal probability. However, during diffusion, there is a strong bias in the direction of the gradient. We can transfer this thinking to the collision reactions using a chemical reaction as a surrogate for both chemical and nuclear reactions.
We now express matched fluxes and thermo-forces for chemical reactions. The flux for equation 8-1 is the change in mass per unit time per mol of reacting substance. The corresponding thermo-force is the difference between the sum of the chemical potentials of the number of cools of reactants and the same sum for the products. In identifying the thermo-forces for X-Heat triggering, we have two problems; we're not sure of the products, and at the start of the reaction the products have a meaningless chemical potential of minus infinity. (The chemical potential is (R T L,a), where a is the activity, zero at 0 concentrations.) This is a common problem for activities close to zero.(22)
Our selection of the thermo-force is therefore based on the logic in section 1 of this paper. When we will be dealing with an X-Heat reaction in advanced stages, the products may have to be considered, and the production equation modified.
2 . In the narrative, section 1, we use the diffusivity, D, from Fick's law as a surrogate for frequency. This is not generally correct when one uses the more general diffusion equation with the chemical potential gradient as the driving force. However, the error is small for temperatures of 300 C or lower.
12-30

References.
1. S. Pons and M. Fleischmann, "Calorimetric Measurements of the Palladium/Deuterium System: Fact and Fiction", Fusion Tech. 17 (1990).
2. Paul G. Shewmon, "Diffusion in Solids", McGraw-Hill Book Company, New York, 1963, p.42.
3. Herbert B. Callen, "Thermodynamics and and Introduction to Thermostatics", John Wiley and Sons, New York, 1985, p. 55. p. 148.
4. Gilbert Newton Lewis and Merle Randall, revised by Kenneth S. Ptizer and Leo Brewer, "Thermodynamics" second edition 1961, McGraw-Hill Book Co., New York, 1961, p. 148.
5. P. W. Bridgman, "Dimensional Analysis", Yale University Press, 1931.
6. F. A. Lewis, "The Palladium Hydrogen System", Academic Press, 1967.
7. Linus Pauling, "General Chemistry", W. H. Freeman and Company, 1953, p. 409.
8. American Society for Metals, ASM Handbook, 1973, V. 8, p. 309, "Metallography and Phase Diagrams".
9. Alefeld et al, "H in metals II, Springer, 1978".
10. Fleischmann and Pons, Martin Fleischmann and Stanley Pons, "Calorimetry of the Pd-D20 system: from simplicity via complications to simplicity", Physics Letters A176 (1993) 118-129.
11. M. Fleischmann, S. Pons and M. Hawkins, "Electrochemically Induced Nuclear Fusion of Deuterium", J. Electroanal. Chem. 261 (1989) 301. See erratum, 263 (1989) 187.
12. S. Pons and M. Fleischmann, "Calorimetric Measurements of the Palladium/Deuterium System: Fact and Fiction", Fusion Tech. 17 (1990) 659.
13. Eugene F. Mallove, "Fire From Ice", John Wiley and Sons, Inc, 1991, p. 153.
14. Frank Close, "Too Hot to Handle", Princeton University Press, 1991, p. 258.
12-31

15. M.C.H. McKubre et al, "Excess Power Observations in Electrochemical Studies of the D/Pd System; the Influence of Loading", in the Proceedings of the Third International Conference on Cold Fusion, Frontiers - of Cold Fusion, October 21-25, 1992, Nagoya, Japan, Universal Academy Press, Inc., Tokyo, Japan.
16. K. Kunimatsu et al, "Deuterium Loading Ratio and Excess Heat Generation during Electrolysis of Heavy Water by a Palladium Cathode in a Closed Cell Using a Partially Immersed Fuel Cell Anode", Proceedings of the Third International Conference on Cold Fusion, Frontiers of Cold Fusion, October 21-25, 1992, Nagoya, Japan, Universal Academy Press, Inc., Tokyo, Japan.
17. Lindon C. Thomas, "Heat Transfer", Prentice Hall, 1992, p. 18.
18. Martin Fleischmann and Stanley Pons, "Calorimetry of the Pd-D20 system: from simplicity via complication to simplicity", Physics Letters A 176 (1993) 118-129.
19. Wilford N. Hansen, "REPORT TO THE UTAH STATE FUSION/ENERGY COUNCIL ON THE ANALYSIS OF SELECTED PONS FLEISCHMANN CALORIMETRIC DATA", The Science of Cold Fusion, Proceedings of the II Annual Conference on Cold Fusion, Como, Italy, 29 June - 4 July, 1991.
20. S. R. De Groot, "Thermodynamics of Irreversible Processes", North Holland Publishing Company, Amsterdam, 1963.
21. J. L. Waisman, George Sines, and L. B. Robinson, "Diffusion of Hydrogen in Titanium Alloys Due to Composition, Temperature, and Stress Gradients", Metallurgical Transactions, Volume 4, January 1973, pp. 291-302.
22. J. L. Waisman, R. Toosky, and George Sines, "Uphill Diffusion and Progressive Embrittlement: Hydrogen in Titanium", Metallurgical Transactions A, Volume 8A, August 1977, pp. 1249-1256.
23. Lawrence S. Darken and Robert W. Gurry, "Physical Chemistry of Metals", McGraw-Hill Book Co., N.Y., 1953, p. 261, 432.
12-32

"Calorimetric Studies For Several Light Water Electrolytic Cells With Nickel Fibrex Cathodes and Electrolytes With Alkali Salts
of Potassium, Rubidium, and Cesium"
R. Bush and R. Eagleton
Physics Department, California State Polytechnic University* and
Future Energy Applied Technology, Inc. (FEAT)**
Abstract
Results will be reported for calorimetric studies with light water cells with alkali salts of K, Rb, andCs employing nickel fibrex (fine nickel mesh) electrodes. Highlights: (1) An experiment showing that the light water excess heat effect is not the result of contamination by D20. (2) A sequence of six "transmission resonances" in a cell with two cc of D20 added to 43cc of 0.57 M RbOH. (3)Heat bursts showing time-scale invariance for a Rb and two Cs cells. (4) Cu is shown to be a promoter, or co-factor,of the light water excess heat effect.
Introduction
Evidence is presented supporting the existence of a light water excess heat effect for electrolytic cells employing electrolytes of some alkali atom salts of K, Rb, and Cs, with palladium anodes, and nickel mesh cathodes. [Bush6 earlier presented the first evidence for a light water excess heat effect with rubidium. The work presented here is apparently the first published work on a light water excess heat effect with cesium.]
An experiment employing two otherwise identical potassium cells run in series, one with regular water (nanopure water) and the other with dedeuterated water, strongly supports the hypothesis that the light water excess heat effect is not due to contaminative deuterium.
Light water experiments with nickel electrodes are proving more reliable, robust, and reproducible than those with heavy water and palladium cathodes. (However,
13-1 ISC44/CalonStudMauiPpr2 / W94
for ultimate practical power production, it is still not clear whether heavy- or light water will offer the principal advantage.) In addition, cell "gymnastics" can be performed during an experiment such as checking the calibration running anodically (electrodes reversed) or by turning off the cell and observing the decay of the excess power to zero, or by a combination of these alternated with regaining the original excess power level. In these instances the baseline value is reached for our calorimeter in about 30 minutes, and the original excess power level may be restored in approximately 30 minutes after that. Needless to write, any of these activities would be sufficient to terminate an experiment involving a heavy water electrolyte with a palladium cathode. It is shown that there is an apparent advantage of the hydroxides over the carbonates with repect to checking the calibration anodically.
Six consecutive "transmission resonances" fit by the TRM ("Transmission Resonance Model") have been located and plotted for the case of an RbOH light water cell containing about a four percent D20 replacement by volume. No such resonances have been located for a light water based electrolyte alone, and Bush argues that such resonances depend upon the presence of the deuterium solely, except for the fact that the relevant lattice spacing would be either that of the nickel lattice or that of the Rb interstitial lattice at the surface of the nickel. At any rate, if this hypothesis is correct, it seems possible to have a reliable heavy water experiment, at least as far as these transmission resonances in an excess power-versus-current density plot are concerned, by piggy-backing it onto a matrix provided by the highly reliable light water experimental environment. Also, the fact that these resonances apparently do not appear in the absence of deuterium indicates that these fine structure modifications in the form of "hill and valley" curves with a cusp are a real effect and not artifacts associated with heat bursts, deuterium loss at higher current densities,limitations upon calorimetry accuracy, etc.
Heat bursts for the light water case have been found for the only three cases where they have been sought so far, for three different light water cells, one employing rubidium, and two employing cesium. The heat bursts show up at essentially all time scales examined and have a roughly similar appearance. This evidence for scale invariance in time for this phenomonon, coupled with the apparent appropriateness of a fractal nature of the heat bursts, adds to the evidence of the transmission resonances in supporting a chaos theory nature for the light water
13-2 ISC44 iCaloriStuciMauiPpr2 / W94

excess heat effect. In turn this suggests that small initial differences at the outset between two otherwise identical cells could lead to quite different behavior for the two cells after several weeks. Bush8 had previously pointed to the time-scale invariance of the transmission resonances, as well as their fractal appearance ("cusps"), as evidence for a "chaotic" behavior for heavy water cells.
Finally, evidence is presented for copper as an "accelerant," or "promoter", of the light water excess heat effect. Two otherwise identical rubidium cells were run in series with the exception that one had a nickel mesh cathode to which ten percent copper had been added. The cell whose cathode had copper added showed at least double the excess heat of the cell without. Copper added in the form of copper nitrate to the electrolyte of the other cell, which initially lacked copper in its cathode gave evidence of improving its excess power yield.
Apparatus
The cell and calorimeter construction employed for the investigation of electrolytically induced anomalous excess heat effects in light water is similar to that of Fleishmann - Ponsl with the following principal modifications: (a) Teflon coating of all nonelectrode materials to reduce electrolyte contamination, (b) a magnetic stirrer to provide more uniform electrolyte mixing, (c) platinum black recombiner to allow for closed cell operation. Fig. 1 shows a cell schematic. Unlike the double wall pyrex cells used in prior work which we have reported, the present cells consisted of single wall teflon vessels having a thickness of 0.05 cm. These vessels were immersed directly in a circulating temperature-regulated water bath. The temperature of this bath was regulated to maintain a constant electrolyte temperature as the cell currents were varied. The temperature, current, and voltage data for each cell were monitored and logged using a Macintosh 'Ix computer equipped with National Instruments LabView software. Three type K thermocouples were employed with each cell: two to monitor electrolyte temperature and one to monitor the bath temperature. The two thermocouples within the cell were threaded into opposite ends of a small diameter u-shaped teflon sleeve, which was filled with mineral oil to improve thermal contact of cell with the thermocouples. Thermocouple voltages were amplified and converted to degree celcius values by use of AD595AQ/9217 integrated circuit chips. This permitted steady state temperature measurements having a standard deviation of about 0.05
13-3 ISC44 /C al onS tu ciMa uiP pr2 / W94

°C. Corrections for thermocouple offsets were made within the software. The cell's currents and voltages were logged from Fluke 45 dual display multimeters. The cathodes were open cylinders fabricated from either a nickel wire fiber matte (National Standard) or nickel wire (AESAR / Johnson Matthey). These cathodes are described in greater detail below. The anodes consist of platinum wire (18 cm long, 0.1 cm diam.) positioned axially within the cathodes. Cell calibration was achieved by running the cells anodically. The electrolytes were 0.57M solutions of K2CO3 in nanopure water with the exception of cell 64 which was made with dedeuterated water (Aldrich Chem. Co.) that had a deterium content 10-2 times lower than that of ordinary water.
Additional cathode details for each of the seven cells reported herein are specified here in Table I :
Table I: Details of Cell Electrolytes
Configurations, Electrodes, and
Cell # Cathodes Electrolyte Cell Type
56 Ni Fibrex 0.57M RbOH in C 45cc H20+2cc D20
63 Ni Fibrex 0.57M K2CO 3 in D 62cc H20
64 Ni Fibrex 0.57M K2CO 3 in D 62cc dedeuterated H 2 0
69 Ni Fibrex 0.57M Rb2CO3 in D 65cc H20
70 Ni Fibrex 0.57M Cs2CO3, in D 65cc H20
71 Ni Fibrex 0.57M Rb2CO3 in D +10%Cu 65cc H20
72 Ni Fibrex 0.57M Cs2CO3 in D +10%Cu 65cc H20
1.3-4 ISC44 / Cal onS tu ciMa utPp r2 / W94
An Experiment with Dedeuterated Light Water Demonstrates that the Light Water Excess Heat Effect Does Not Arise as a Result of Contamination by Heavy Water
Some critics of the light water excess heat effect have contended that the effect is real, but that it is associated with the known contamination of light water by heavy water, i.e. about one out of every 5,000 molecules in H20 is actually D20. Bush 6
originally conducted mixing experiments in which measured small amounts of D20 were added to the light water electrolyte to check the influence upon the light water excess heat effect. Bush6 noted that such relatively small amounts of heavy water added to the bulk of the electrolyte nevertheless raised the deuterium concentration over that provided by contamination by many orders of magnitude without producing a large increase in the excess power level. To support the contamination hypothesis one would then be forced to suppose that the light water excess heat effect essentially saturated at the absurdly low fraction of heavy water to light water provided by the natural contamination level. An experiment to rule this out was performed by comparing the excess power performance of two otherwise identical cells , cell 63 and cell 64, run in series for which the light water for the potassium carbonate (0.57 M) electrolyte was, respectively, regular water (nanopure water) and dedeuterated water (Aldrich). The latter has only one percent of the D20 as regular water; i.e., only one out of every 500,000 molecules is D20. Fig. 2 shows that, within the limits of error the maximum excess powers were essentially the same, about 1.1W, and that excess powers at lower currents were essentially comparable. [ In Fig. 2, data points for cell 63 ( ordinary, nanopure water) are solid rectangles with the error bars left off, while those for cell 64 (dedeuterated water) are open rectangles with the error bars attached.] This provides strong evidence for a genuine light water excess heat effect in which, as indicated by Bush 6 in his CAF hypothesis ("Cold Alkali Fusion"), protons undoubtedly play a key role in the light water reaction, just as deuterons do in the heavy water excess heat reaction.
A Possible Solution to the Mills-Bush Calcium Controversy for Potassium Cells
Calcium concentrations in the electrolytes for cell 63 (nanopure water) and cell 64 (dedeuterated water) were also compared at various stages and found to be comparable and consistent with the excess heats determined to that point. This
13-5 ISC44 /CaloriStudMauiPpr2 / W94

would be consistent with Bush's CAFE and LANT 12 hypotheses ("Lattice Assisted Nuclear Transmutation") according to which the excess heat and calcium result from a lattice-assisted addition of a proton to a potassium nucleus. However, after attaining a maximum of about 1.3 ppm of calcium in the electrolyte, the calcium level fell to approximately 1ppm and remained there. Bush hypothesizes that a state of dynamic equilibrium was reached for which the rate of calcium being driven back into the cathode matched the rate of calcium leaving the cathode in association with calcium production. This phenomenon apppears to bear directly upon ther controversy between Mills and Bush concerning the claimed calcium production (Bush) and claimed non-production (Mills) as Bush has previously reported in reference 14. A private source has indicated that Mills detestability for calcium in solution has a lower level threshold of about lOppm, which is an order of magnitude higher than the approximate maximum dynamical equilibrium value of about 1ppm determined by Bush for the electrolytes of both potasium carbonate cells 63 and 64. If this is correct, then, Mills would probably never see any calcium in the electrolytes of his potassium cells: Calcium concentrations in the electrolyte would reach maximum levels much less than the 10 ppm threshold of detection, and then the calcium would build up within the cathode. Moreover, some of this, according to Bush's LANT12 hypothesis might be transmuted to other nuclides by virtue of single proton capture reactions.
Carbonates vs. Hydroxides: Cell "Gymnastics"
Typically, researchers are finding that light water cells with nickel cathodes, as compared to heavy water cells with palladium cathodes, are easier to bring on line with the light water excess heat effect being more robust and reproducible. Figures 3, 4. and 5 exemplify a sort of cell "gymnastics" that can be performed with the light water excess heat effect, but would terminate the experiment were it to involve the heavy water excess heat effect. Fig. 3 shows the decay of excess power in a light water cell with 0.57 M RbOH in the electrolyte. Fig. 4 shows an "on-off-on" excess power sequence for the same cell in which the excess power with the current on is about 0.7 W. When the cell current is turned off an upward spike is seen as an artifact of this nonequilibrium condition followed by a decay of the excess power to the baseline of 0 W. A downward spike (again an artifact associated with nonequilibrium) marks the point in time at which the cell is turned on again, and it is seen to rise to the same excess power level of about 0,7 W. This is followed by
13-6 ISC44 / C al oriS tudM a uiP p r2 / W94

another such sequence, and these cell "gymnastics" can be repeated over and over again without losing the excess heat effect. Fig _5 for cell 56 adds the additional "acrobatic" of an anodic calibration check in which the cell is run backwards (cathode becomes the anode and vice-versa), to the beginning and end of such an "on-off-on" sequence. Such cell "gymnastics" for a heavy water cell experiment would result in a severe loss of deuterons within the cathode which would terminate the experiment. A distinct advantage for the light water studies, then, over the heavy water studies is that the calibration for the former can be checked "on the fly" by running anodically.
With regard to checking the calibration anodically, however, there may be a major advantage in working with alkali atom hydroxides as compared to alkali atom carbonates. Thus, in the case of rubidium carbonate, we have noticed a tendency for the calibration to gradually drift upward from the original line of calibration, which leads to a larger and larger correction (reduction) to the excess power based upon the original calibration curve. Thus, all of the excess power results in this paper involving carbonates have been corrected by anywhere from zero percent to about 60 percent to take this into account. Why this effect is larger in the carbonate case than in the hydroxide case might be more obvious to us were we electrochemists instead of physicists. Based upon this, Srinivasan24 has also suggested that alkali atom hydroxides may prove generally preferable to carbonates in future light water work.
"Transmission Resonances" in the Excess Power-vs-Current Curves for a RbOH Light Water Cell with 2 ml of D20 Added
A light water cell (Cell 56) with a 0.57 M RbOH electrolyte and a nickel mesh cathode was employed to search for "transmission resonances" predicted by Bush's TRM8 ("Transmission Resonance Model") for which previous experimental evidence has been obtained by us15 . According to the TRM 8 these transmission resonances provide a fine-structure modification of the otherwise linear behavior exhibited in a graph of excess power versus curent density. The model predicts that these will take the form of a "hill-and-valley" pattern with the valley terminating in a "cusp". However, a special feature of the investigation was that a 2 ml replacement of electrolyte by 2m1 of D20 was made several days prior to the resonance search. Thus, the six transmission resonance patterns that were
13-7 ISC44/CaloriStucthilauiPpr2 /W94

subsequently found, and exhibited in Figures 6, 7, 8, 9, 10, and 11 corresponding, respectively, to integral orders n= 12, 11, 10, 9, 8, and 7 and fit by the TRM, could, apriori, have been a manifestation either of the light water alone, the heavy water alone, or of the mixture. Bush has subsequently argued that these transmission resonances are produced by "resonant" D's, i.e. those satisfying the transmission resonance condition, colliding with D's in an interstitial lattice near the surface of the nickel, and, more than likely provided by Rb. Thus, the patterns are, in this sense, due to a mixture of the heavy and light water components. He reasons that the impedance matching provided by the equal masses of the colliding D's maximizes the effect for the D-on-D case, while minimizing it for the D-on-Rb, p-on-Rb, or even D-on-p cases due to the mass mismatch for the latter three cases. Thus, according to Bush, a maximum energy exchange occurs for the D-on-D case for resonant incoming D's that can, via collisional energy exchanges, strongly enhance lattice vibrations. (Bush has employed this latter aspect to make a connection between the TRM and his new model, the ECFM 25,26,27 , since the enhancement of lattice vibrations reduces the "Casimir separation" associated with this latter model. The ECFM2526, 27("Electron Catalyzed Fusion Model") provides an excellent fit to the experimental excess power-vs-loading data of McKubre et al? (SRI/EPRI) and to the independent excess power-vs-loading data of Kunimatsu et al. 18 (IMRA). So far as we know, Bush's theoretical model is the only one to fit such actual data.)
The Table of Fig. 13 shows the integral order (n= 12, 11, 10, 9, 8, 7) and corresponding current values found, respectively, for the cusp locations (local minima of the excess power-vs-current curve) for the six different resonance patterns located for cell 56. Fig. 12 exhibits the resonance patterns of integral orders 9, 10, 11, and 12 on the same graph. Figures 14, 15, and 16 show the fit of the Bush's TRM to the resonances for integral orders n= 12, 9, and 7, respectively. A resonance pattern was located first employing a preliminary search and a rough value of about 10 mA for Io based upon past experience. It was then found, based upon Bush's theoretical formulae 8
in Fig. 13, that a least squares fit of the TRM to the data points of the resonance pattern could be provided for n=12 and a value of Io = 10.97 mA for the adjustable parameter representing the equilibrium current. This same value of Io was then employed to predict the current values for resonances corresponding to other integral orders with n less than 12. The cusp locations for the corresponding resonances were subsequently located to within about ten percent of the predicted
13-8 ISC44/CalonStudMataPpr2 /W94

values. The Table of Fig. 13 shows the corresponding Io values giving the best fit of the TRM to the data points of each resonance. Note that they all fall in the range from Io = 10.82 mA ( for n=7) to Io = 11.88 mA (n=11). The fact that these best values varied by an average of only 3.5 percent from the average seems to provide strong support for the TRM. Moreover, the fact that such patterns have not even remotely turned up in the absence of D20 added to the electrolyte supports Bush's hypothesis that observable resonances are associated with D-on-D reactions only, and are not produced spuriously as the result of either heat bursts, the inconstancy of deuterium occupation, calorimetric error, or a combination of these. Otherwise, there is little doubt that such resonances would have been observed previously in the many light water cases that were studied prior to the D20 replacement of electrolyte for cell 56.
It should be remarked that a number of the error bars in the resonances shown are underestimated. Since the calorimeter constant for cell 56 was 2.4 W per C, and the lowest meaningful value of the temperature difference between the cell and the bath in this experiment was 0.05 C, the error bars should minimally be + 0.12 W. However, it should also be noted that an advantage of the cell (cell 56) employed to search for these resonances was that it was of the double- pyrex wall type C (Table I) with flowing water, which is shown schematically in reference 20. This type of cell has the advantage over the type D (single pyrex wall and no flowing water) used for the other studies in this paper of producing a better integration of the heat over the entire cell. With these two factors in mind we note that, even though individual resonances in this sequence are not compelling , the overall pattern of the resonances, each of which appears to have an identifiable cusp (relative minimum), with their high correlatability to the TRM predictions make this series of considerable interest and worthy of further consideration and study. We note, however, that they are not easy to find, since each resonance requires a fine mesh of about fifteen data points to establish the shape with the cusp. (Each of the data points referred to is, in reality, the average of ten to fifteen excess power readings taken at about one minute intervals.)
Finally, because of the relatively large reproducibility of the light water excess heat effect (essentially 100%) and the relatively short "loading time", it appears that there is a real advantage to studying the transmission resonances for the D-on-D reaction
13-9 15C44 / CalonStudMauiPpr2 / W94
by making a heavy water replacement (about 4%) to the light water electrolyte once excess heat has been observed for the latter.
Excess Heat Bursts Observed With Light Water Cells
Figures 17 through 25 provide probably the first closed cell evidence for heat bursts obtained with a light water-nickel system. The computerized data acquisition system was set to record excess powers and the coresponding cell temperatures at one minute intervals for about 24 hours. Fig. 17 (rubidium carbonate, cell 69) exhibits this burst type behavior: Successive points on the graph were obtained by averaging the excess power data points over a six minute interval. Likewise, figures 18 and 19 exhibit a similar burst type behavior when the averaging is done for increments of about twenty seven minutes and fifty minutes, respectively. Figures 20, 21, and 22, and figures 23, 24, and 25 portray a similar burst type behavior for two cesium carbonate cells, cell 70 and cell 72, respectively. The fact that the patterns appear very much the same regardless of time scale, i.e. they exhibit time-scale invariance, and have a fractal appearance argues for a chaos theory description for the light water excess heat effect. This chaos theory nature had earlier arisen in connection with the heavy water-palladium system with reference to Bush's 6 TRM ("Transmission Resonance Model"): In addition to a fractal nature suggested by the fact that the "hill-and-valley" patterns of the the "transmission resonances", which formed a nonlinear fine structure imposed upon the otherwise linear behavior of the excess power-versus-current density curves, displayed valleys terminating in sharp "cusps," these patterns for the heavy water-palladium system also exhibited a time-scale invarinace. Bush 8 and independently, Srinivasan 17, based upon Bush's work, have pointed to a major possible consequence of this chaos theory nature in connection with the well-known "butterfly effect": Thus, small differences in initial conditions of otherwise identical cells could lead to major differences in behavior with time such as when the cells first exhibit excess power etc. Thus, the heat burst evidence presented here gives strong additional evidence for a similarity of the light water-nickel system to the heavy water-palladium system.
Negative Temperature Coefficient for the Light Water Excess Heat Effect
An increase in cell temperature has typically been found by observers to decrease the excess power of that light water cell. The reason for this is not clear. However,
13-10 ISC44 / Cal onS tudMa taPp r2 W94

presumably an increased temperature may favor some surface process such as bubble formation which might interfere with the exothermic process. A possibility according to Bush would be that the bubble pattern limits the flux of protons onto the alkali lattice which he proposes forms on the nickel and hypothesizes to be important for the interaction between an alkali atom and a proton leading to the excess heat producing reaction. We have determined the temperature coefficient for the excess power for the light water case of a rubidium cell (cell 71) and a cesium cell (cell 72) by employing calibrations at 32C, 39C, and 46C for both cells. For the temperature range 32C to 46C the average values for the temperature coefficient (W/C) were as follows:
Cesium (cell 72): -0.046 W/C + 0.010 W/C Rubidium (cell 71): -0.053 W/C + 0.010 W/C
Thus, although the value for rubidium is somewhat larger in absolute value, the errors of + 0.010W/C place the two averages differing by 0.013W/C at less than one standard deviation (0.02W/C) apart. According to these values, a ten degree rise in temperature in this temperature range, assuming all other cell input parameters to be fixed, would result in about a one half watt decrease in excess power for either cell.
Evidence for Copper as a Promoter of the Light Water Excess Heat Effect With Nickel Cathodes
Silver has previously been reported as a possible promoter of the excess heat effect for the heavy water-palladum system by Fleischmann and Pons 16 . There may also be
a relation to our successful work9 with heavy water and a cathode consisting of a thin film (five microns) of palladium electroplated onto a silver substrate reported at the Como Conference. So, Bush points out that, since the relation of copper to nickel in terms of electron shell structure is analogous to that of silver to palladium, copper might be a "promoter" of the light water excess heat effect with nickel. That copper is , indeed, such a promoter was first established at Cal Poly (Pomona) before the Maui Conference by following Bush's approach of running two identical rubidium carbonate cells in series with the exception that one cell had a Cu addition to the nickel mesh cathode, while the other included Cu only as a relatively minor contaminant. A parallel experiment was conducted with two light water based
13-11 ISC44/CaloriStuciMauiPpr2 /W94
cesium carbonate cells. (It is believed that this work, plus that reported on heat bursts earlier for the same two cesium cells, constitutes the first reported work with cesium cells.) For the two rubidium cells run in series, cell 71 had a nickel mesh cathode with 10% copper powder added by National Standard during manufacture while cell 69 had the ordinary nickel mesh cathode with only a small amount of Cu contaminant (roughly one thousandth the Cu of cell 71). The dramatically different results, approximately two-to-one in favor of cell 71 in terms of excess power are demonstrated in Fig.26 in a graph of excess power versus time. (The evidence for an improvement of the excess power effect in cell 69 when copper nitrate-dissolved-in-rubidium carbonate electrolyte replacements were made at days 31, 36, and 52 is, however, not particularly strong. Thus, the peak for cell 69 between about 40 days and 50 days might be almost totally ascribable to a decrease in the setting of the cell temperature from 39 C to 32 C at the rise and a reverse change in the setting at the fall of the excess power. ) Note that the total excess heat represented by the area under the excesss power curve for cell 71 is approximately 4 MJ, which is far too much to be explicable by calorimetric error since the cell is closed and the error bars are about 0.1 W, and well beyond the realm of explicability of ordinary chemistry. Bush originally proposed in his CAFE and LANT 12 hypotheses that a basic heat producing reaction in this context is a lattice-assisted reaction in which a rubidium nucleus adds a proton to become a nucleus of strontium. Strong initial evidence for such a scenario has been previously presented by Bush6 . This evidence was updated in one of our Nagoya Proceedings papers 10, and additional corroborating evidence is presented in our companion experimental paper 20 in the Maui Proceedings. Further evidence atttained for a nuclear nature of the heavy and light water excess heat effects was presented by us in our other paper 11 in the Nagoya Proceedings.
The results for the corresponding cesium carbonate cells, cell 72 (Cu added to the cathode before electrolysis as in the case of rubidium cell 71) and cell 70 (No Cu added before electrolysis as in the case of rubidium cell 69) can be compared in Fig. 27, where it is seen that the Cu-pretreated cell 72 (10 percent addition of Cu to the cathode) is yielding about 75% more excess heat than did cell 70, which lacked the addition of Cu to the cathode prior to electrolysis. An attempt was again made to further check the effect of Cu as a potential promoter by adding copper nitrate (Cu2NO3) to the electrolyte of the cell without the Cu in the cathode, cell 70. The case for the efficacy of the copper nitrate addition here appears much stronger than for the case of its addition to the rubidium cell, cell 69: Copper nitrate was added to
13-12 ISC44 /CalonStudMauiPpr2 / W94

the electrolyte of cell 70 via an essentially equal volume replacement of electrolyte at days 33 and 57, and it may be that these additions are correlatable to the rises in excess power for the curve of cell 70 at around 39 days and 57 days, respectably. Also apparently attesting to the efficacy of the addition of copper nitrate to the electrolyte of cell 70 is the fact that, at the end of the two curves, around the seventieth day, the excess powers are essentially the same, but with that of cell 70, which initially lacked Cu, now slightly higher. Note that the total excess heat ascribable to cell 72 over the period of operation portrayed by the curve is approximately 7 MJ, which, as in the rubidium case, is far too large to ascribe to the error bars (approx. 0.1 W) or ordinary chemistry. Bush originally proposed in his CAFE and LANT12 hypotheses, that a prime candidate for an excess heat reaction in the cesium cell case would be the lattice assisted addition of a proton to a cesium nucleus to yield a barium nucleus. A search will now be conducted for otherwise unexplained barium in the postrun electrolyte and cathode material as compared to the prerun materials.
This difference in excess heat behavior with and without Cu for two otherwise identical rubidium (cesium) cells run in series also provides additional strong evidence that there is a light water excess heat effect. Bush's hypothesis that Cu is a promoter has been given strong corroboration by BARC 13: Shortly after the Cal Poly talk19 at Maui announcing the initial direct evidence for Cu as a promoter in the light water case, Srinivasan22 wired his colleagues at BARC. According to Srinivasan22, the latter then added a Cu foil to an operating potassium carbonate light water cell and observed the excess power to increase from ten percent to about fifty percent. In addition to this corroboration we would like to point out that BARC played a key role in connection with Bush's original Cu hypothesis: Some time ago we received a fax from a theorist claiming that Cu was an essential ingredient in his light water model, and asking to what extent Cu was present in our cathodes as a contaminant. This made little impression at the time since the Cu contamination was adjudged to be too small to be significant in this respect. Unfortunately, the fax was misplaced so that we were then unaware, as now, of the author's name or affiliation, and he made no further attempt to communicate Then, following the Nagoya Conference we found our light water excess powers inexplicably becoming lower. An initial attempt to pinpoint the cause of this was unsuccessful. However, it was in this atmosphere that a fax arrived from Bockris 21 of Texas A&M with a copy of a fax to Bockris from Srinivasan of BARC. The fax indicated that the BARC light water excess power levels had gone essentially to zero when their copper
13-13 ISC44 / CalonStudMatuPpr2 / W94
constantan thermocuples were sheathed against the electrolyte by employing stainless steel. This sparked Bush's hypothesis and he immediately pushed to test the idea of Cu as an "accelerant" or "co-factor" (In this paper we have adopted the term "promoter" later introduced in this context by Srinivasan 23 .) A small positive effect was seen by adding copper nitrate to the electrolyte of a potassium carbonate light water cell. Much better results were obtained in a comparison of the two rubidium (cesium) carbonate cells, cells 69 (70) and 71 (72), mentioned in the preceding paragraphs. Initial positive evidence was mentioned by Bush19 in our talk at the Maui Conference. It is clear then that the BARC experience relayed by Bockris21 to Bush played an extremely important role in Bush's hypothesis and the subsequent Cal Poly verification of this hypothesis. And while this hypothesis has been verified at this stage only for potassium (Cal Poly, BARC) , rubidium (Cal Poly), and cesium (Cal Poly) Cu will, according to Bush's hypothesis involving the analogy to the silver-palladium case, prove to be a promoter in all cases of cold fusion employing a nickel cathode and emphasized in the CAF 6 and LANT12 hypotheses.
Bush points out that the absence of a promotor such as Cu or the presence of an inhibitor such as stainlesss steel, with this lattter case first being announced by Srinivasan at al.23 in these Proceedings, could, conceivably, account for the controversy between Mills and Bush concerning the production of excess heat by sodium-nickel light water cells. Thus, Mills3 maintained from the beginning, in connection with his discovery of the potassium-nickel light water excess heat effect that, if sodium is employed instead of potassium in the electrolyte, the excess heat effect disappears. Moreover, according to Mills and Fare114, their "novel chemistry," improving upon quantum mechanics, explains that sodium should not work. This apparent nonviability of sodium was then corroborated by Noninski 5 working at Mills' laboratory. Bush6, on the other hand, used cells constructed by Eagleton to show that sodium works as well, or perhaps even somewhat better, than potassium in yielding an excess heat effect in a light water cell with a nickel (mesh) cathode. Bush's work6 encouraged that of Srinivasan 13 (BARC) and, subsequently that of Notoya7 (Catalysis Research Center, University of Hokkaido), both of whom found independently that sodium yields the excess heat effect in a light water cell with nickel cathode. According to Bush, if the cell tried with sodium by Mill and that tried by Noninski were somehow deficient in a promoter such as Cu or subjected to an inhibitor such as stainless steel, null results would have been obtained. Moreover, since these null results were in line with the prediction of the "novel
13-14 ISC44/Calon5 tuciMauiPpr2 I W94

chemistry" of Mills and Farell4 a single test might have appeared adequate in corroborating the Mills-Farrell theoretical prediction. Since our knowledge of promoters, cofactors ,and inhibitors, is still in nascent form, it is not unreasonable to hypothesize that some unsuccessful attempts to corroborate the light water excess heat effect might be explained in this manner.
Conclusions The evidence presented strengthens the point of view that the light water excess heat effect is a genuine phenomenon worthy of additional study. The similarities shown to the heavy water excess heat effect , when added to the nuclear evidence6,10,11,20
, support the hpothesis6,12 that these two excess heat effects are simply oppposite sides of the same nuclear coin.
Acknowledgments
T. Passell (EPRI) is thanked for his encouragement and interest in the Cal Poly project. ENECO, formerly FEAT, is thanked for its financial support and encouragement. Bunny Gilbert of the Cal Poly (Pomona) Instructional Support Center is especially appreciated for her help in preparing the manuscript. Roger Bush, son of the first named author, is thanked for the software that made possible our computerized data acquisition system. M. Srinivasan (BARC) is appreciated for helpful discussions on light water cell calorimetry and for his interest in, and encouragement of, the research program at Cal Poly (Pomona).
References
1. M. Fleischmann and S. Pons, "Electrochemically Induced Nuclear Fusion of Deuterium," J. Electroanal. Chem., 261, 301 (1989) 2. M. C. H. McKubre, S. Crouch-Baker, A. M. Riley, S.I. Smedley, and F.L. Tanzella, "Excess Power Observations in Electrochemical Studies of the D/Pd System; the Influence of Loading", Proc. 3-ICCF, 5 (1993). 3. R. Mills and K. Kneizys, "Excess Heat Production by the Electrolysis of an Aqueous Potassium Carbonate Electrolyte and the Implications for Cold Fusion", Fusion Technol., a (1991). 4. R. Mills and J. Farrell, The Grand Unified Theory, Science Press, 1989. 5. V. Noninski, "Observation of Excess Energy During the Electrolysis of a Light Water Solution of K2CO3", Fusion Technol. 6. R. Bush, "A Light Water Excess Heat Reaction Suggests that 'Cold Fusion' May Be 'Alkali-Hydrogen Fusion' ", Fusion Technol., 22 301 (1992). 7. R. Notova and M. Envo, "Excess heat Production in Electrolysis of Potassium Carbonate Solution with Nickel Electrodes", Proc. of the Third Intl. Conf. on Cold Fusion", 421, (1993).
13-15 1SC44 /CalonStudMauiPpr2 / W94
8. R. Bush, "Cold 'Fusion': The Transmision Resonance Model Fits Data on Excess Heat, Predicts Optimal Trigger Points, and Suggests Nuclear Reaction Scenarios," Fusion Technol., 19, 313 (1991). 9. R. Bush and R. Eagleton, "A Calorimetric Study of the Excess Heat Effect in Thin Films of Palladium, talk given by Bush, Second Annual Conference on Cold Fusion, 10. R.T. Bush and R.D. Eagleton, "The Transmission Resonance Model for Cold Fusion in Light Water: I. Correlation of Isotopic and Elemental Evidence with Excess Power", Proc. 3-ICCF, 409,(1993). 11. R.T. Bush and R.D. Eagleton, "Experimental Studies Supporting the Transmission Resonance Model for Cold Fusion in Light Water: II. Correlation of X-Ray Emission with Excess Power", Proc. 3-ICCF, 409 (1993). 12. R. Bush, "Towards a Nuclear Physics of Condensed Matter", accepted for Fusion Technol., under revision, est. issue: March'94. 13. M. Srinivasan, A. Shyam, T. Sankaranarayanan, M. Bajpai, H. Ramamurthy, U. Mukherjee, M. Krishnan, M.Nayar, and Y. Naik, "Tritium and Excess Heat Generation during Electrolysis of Aqueous Solutions of Alkali Salts with Nickel Cathode", Proc. 3-ICCF, 123 (1993). 14. R. Bush, "Will the Light Water excess Heat Effect Lead to a Unification with Cold Fusion?", Twenty First Century Science and Technology, Fall 1993, p. 75. 15. R. Eagleton and R. Bush, "Calorimetric Evidence Supporting the Transmisssion Resonance Model for Cold Fusion", Fusion Technol., /2., 239 (1991). 16. M. Fleischmann and S. Pons, Discussion remarks at the Como Conference 17. M. Srinivasan, "Nuclear Fusion in an Atomic Lattice", Current Science, April 21, 1991. 18. K. Kunimatsu, N. Hasegawa, A. Kubota, N. Imai, M. Ishikawa, H. Akita, and Y. Tsuchida, "Deuterium Loading Ratio and Excess Heat Generation during Electrolysis of Heavy Water by a Palladium Cathode in a Closed Cell Using a Partially Immersed Fuel Cell Anode", Proc. 3-ICCF, 31 (1993) 19. R. Bush and R. Eagleton, "Calorimetric Studies For Several Light Water Electrolytic Cells With Potassium Carbonate and Sodium Carbonate Electrolytes and Nickel Cathodes," Talk delivered at the Maui Conference, ICCF-4 (1993). 20. R. Bush and R. Eagleton, "Strontium Production in Two Electrolytic cells with Light Water Based Rubidium Carbonate Electrolytes and Nickel Mesh Cathodes," Talk delivered at the Maui Conference, ICCF-4 (1993) (Submitted to the proceedings.) 21. J. Bockris, Chemistry, Texas A&M, Private communication, 1993. 22. M. Srinivasan, B.A.R.C., Private communication, Dec. 1993. 23. M. Srinivasan, P. Adi Babu. M. Bajpai, D. Gupta, U. Mukherjee, H. Ramamurthy, T. Sankarnarainan, A. Sinha, and A. Shyam. "Excess Heat and Tritium Measurements in Ni-H20 Electrolytic Cells, Submitted to Proc ICCF- 4. 24. M. Srinivasan, BARC, Private communication, February 1994.
13-16 ISC44 /CalonStudiviauiPpr2 / W94

1.2
1.0 -I
• •
• ■ ■
■
■ 0.2 "I • • • •• 0.0
0.8 1.0 0.0 0.2 0.4 0.6 Current (A)
• a I
25.R. Bush, "An Electron-Catalyzed Fusion Model (ECFM) Suggests a Unification of Heavy- and Light Water Cold Fusion Phenomena, Manuscript submitted for publication to Fusion Technology. 26.R. Bush, "A Unifying Model for Cold Fusion," Talk delivered at Maui Conference, ICCF-4, 1993. 27.R. Bush, "A Unifying Model for Cold Fusion", Submitted to the Proceedings of the ICCF-4.
*3801 West Temple Avenue, Pomona, CA 91768. **University of Utah Research Park, 391-B Chipeta Way, Salt Lake City, Utah 84108.
FIGURE 1:
PRINCIPAL FEATURES
• CLOSED CELL OPERATION • MECHANICAL STIRRED
ELECTROLYTE RECOMBINER BAFFLE & HEAT SINK TEFLON CELL PLATINUM ANODE NICKEL FIBREX CATHODE NANOPURE H20 BASE
ELECTROLYTE CELL IMMERSED IN BATH CONSTANT CURRENT AND
TEMPERATURE OPERATION
FIGURE 2:
Data: Cells 63 and 64
13-17 ISC44/CaloriStudMauiPpr2 / W94
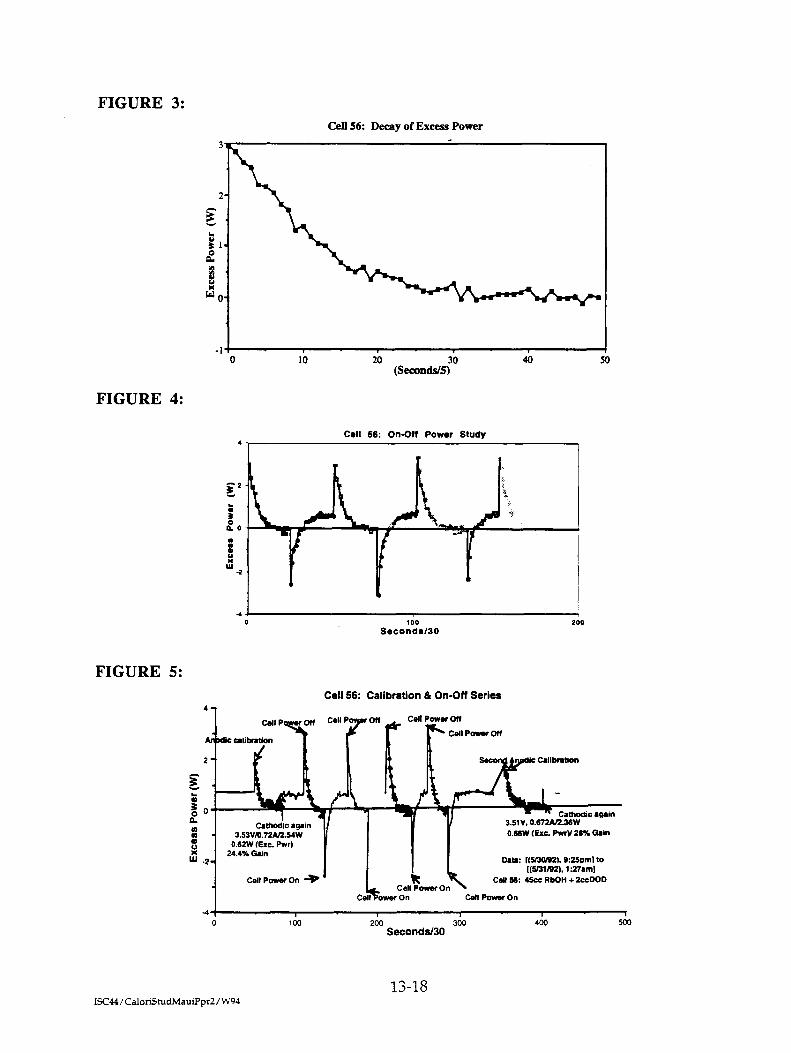
4-1
Anbac calibration
Cell P Cell P7r Off Call Power Off
F.."' Cell Power Off
is Calibration
Cathodic again 3.53Y/0.72A2.54W
0.62W (Exc. Pwr) 24.4% Gain
Cell Power On -4). Cell Power OIN
Celt ower On Call Power On
Data: f(5/30192). 9:25oml to ((5/31/92), 1:27am)
Cell 56: 45cc RbOH ♦ 2ccOOD
Cathodic again 3.5111, 0.672A/236W 0.66W (Exc. PwrY 26% Gain
04,
100 200 300 Seconds/30
400 50C
13-18
FIGURE 3: Cell 56: Decay of Excess Power
FIGURE 4:
FIGURE 5: Cell 56: Calibration & On-Off Series
ISC44 / CaloriStudMauiPpr2 / W94

FIGURE 8: FIGURE 9:
FIGURE 10: FIGURE 11:
FIGURE 6: FIGURE 7:
13-19 ISC44 / Calo n5 niciMautPp r2 / W94
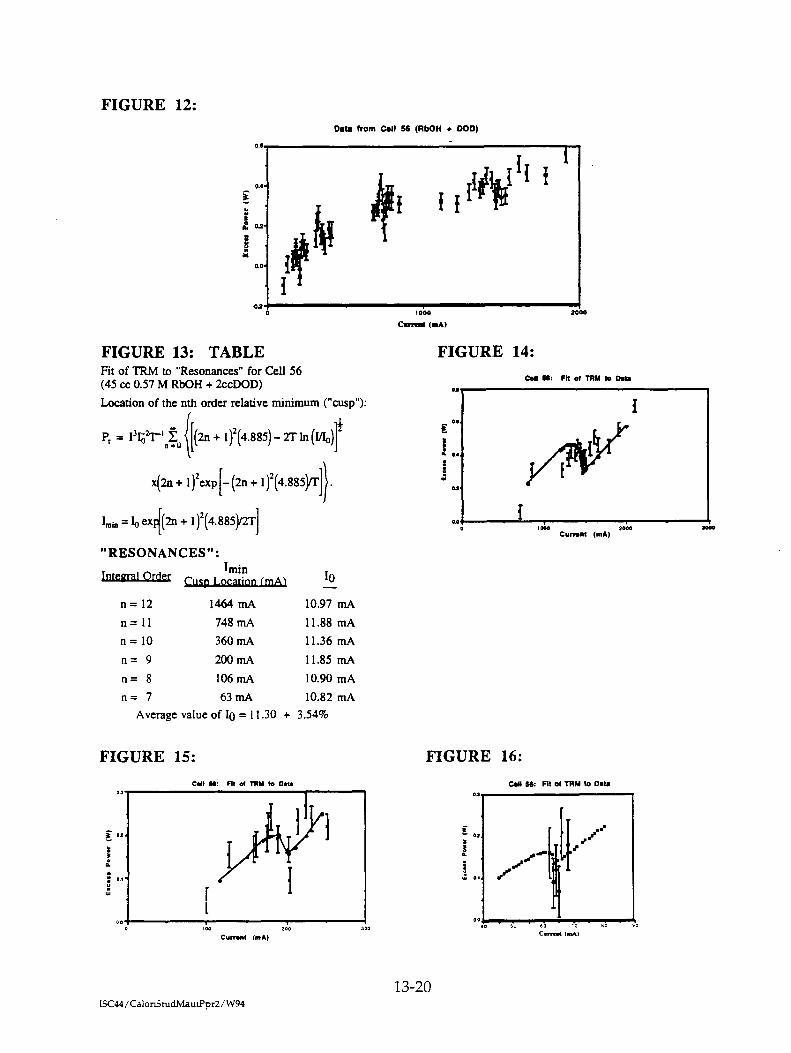
FIGURE 13: TABLE FIGURE 14:
FIGURE 12:
FIGURE 15: FIGURE 16:
13-20 ISC44/CalonStudMamPpr2 /W94

FIGURE 17: FIGURE 18: FIGURE 19:
Excess Perm vs. TM* for Coll NI
Exce•• Poe., we. ilm• for Cell SO Excess Power vs. Tess
tor Cell 89
ow
,odo Minutes
, G-Go ■ GOG 1.10 iao
Minutes
FIGURE 20: FIGURE 21:
• *"
Of.
FIGURE 22:
Excess Power vs. 71ms for Call 70
Excess Power vs. Tim• for Cell 70
Excess Power vs. 71mo for Coll 70
g 173
1.72
111
S 170
3 7
; "
: •
Iw ZOOD 3000 1000
Minutes woo
Minutes
•
Minutes
FIGURE 23: FIGURE 24: FIGURE 25:
Excess Power vs. Time for Cell 72
Excess Power vs. Time for Cell 72
Excess Power vs. Time for Coll 72
30t0 .040 Mln utes Minutes
ISC44/RB-RE Ppr2d/W94

FIGURE 26:
FIGURE 27:
13-22 ISC44IRB-RE Ppr2e/W94
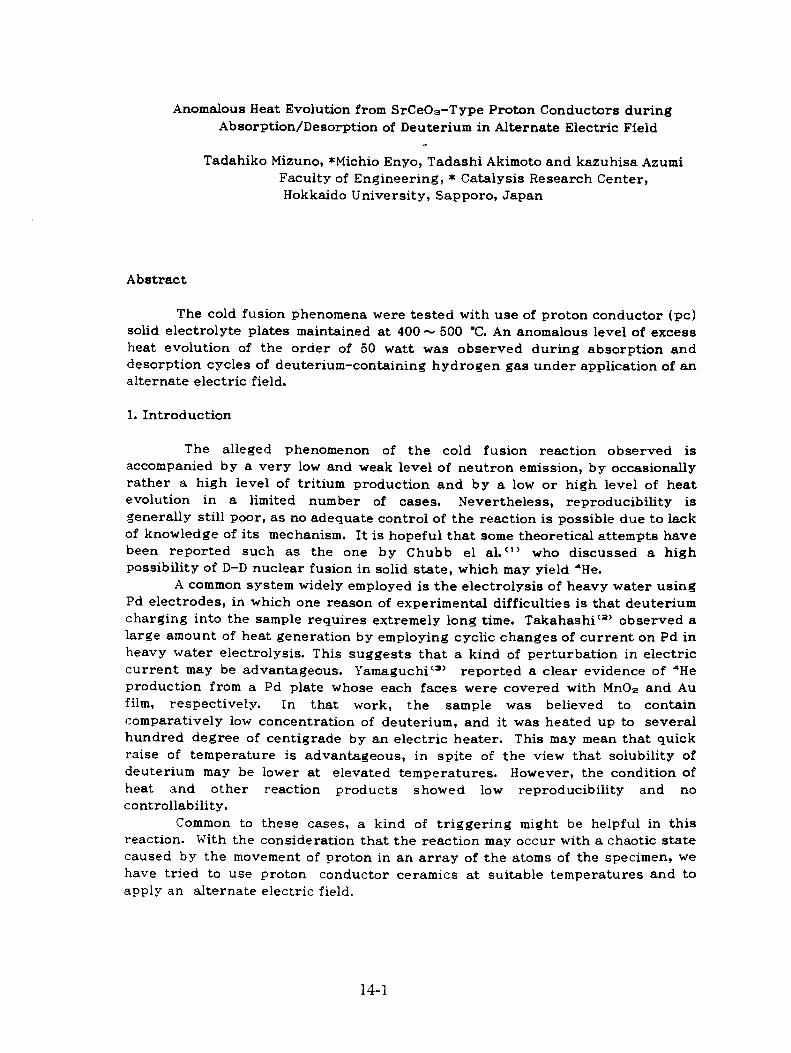
Anomalous Heat Evolution from SrCeO 3-Type Proton Conductors during Absorption/Desorption of Deuterium in Alternate Electric Field
Tadahiko Mizuno, *Michio Enyo, Tadashi Akimoto and kazuhisa Azumi Faculty of Engineering, * Catalysis Research Center, Hokkaido University, Sapporo, Japan
Abstract
The cold fusion phenomena were tested with use of proton conductor (pc) solid electrolyte plates maintained at 400 -- 500 °C. An anomalous level of excess heat evolution of the order of 50 watt was observed during absorption and desorption cycles of deuterium-containing hydrogen gas under application of an alternate electric field.
1. Introduction
The alleged phenomenon of the cold fusion reaction observed is accompanied by a very low and weak level of neutron emission, by occasionally rather a high level of tritium production and by a low or high level of heat evolution in a limited number of cases. Nevertheless, reproducibility is generally still poor, as no adequate control of the reaction is possible due to lack of knowledge of its mechanism. It is hopeful that some theoretical attempts have been reported such as the one by Chubb el al."' who discussed a high possibility of D-D nuclear fusion in solid state, which may yield 'He.
A common system widely employed is the electrolysis of heavy water using Pd electrodes, in which one reason of experimental difficulties is that deuterium charging into the sample requires extremely long time. Takahashi' ) observed a large amount of heat generation by employing cyclic changes of current on Pd in heavy water electrolysis. This suggests that a kind of perturbation in electric current may be advantageous. Yamaguchi ( ' reported a clear evidence of 'He production from a Pd plate whose each faces were covered with Mn0 3 and Au film, respectively. In that work, the sample was believed to contain comparatively low concentration of deuterium, and it was heated up to several hundred degree of centigrade by an electric heater. This may mean that quick raise of temperature is advantageous, in spite of the view that solubility of deuterium may be lower at elevated temperatures. However, the condition of heat and other reaction products showed low reproducibility and no controllability.
Common to these cases, a kind of triggering might be helpful in this reaction. With the consideration that the reaction may occur with a chaotic state caused by the movement of proton in an array of the atoms of the specimen, we have tried to use proton conductor ceramics at suitable temperatures and to apply an alternate electric field.
14-1
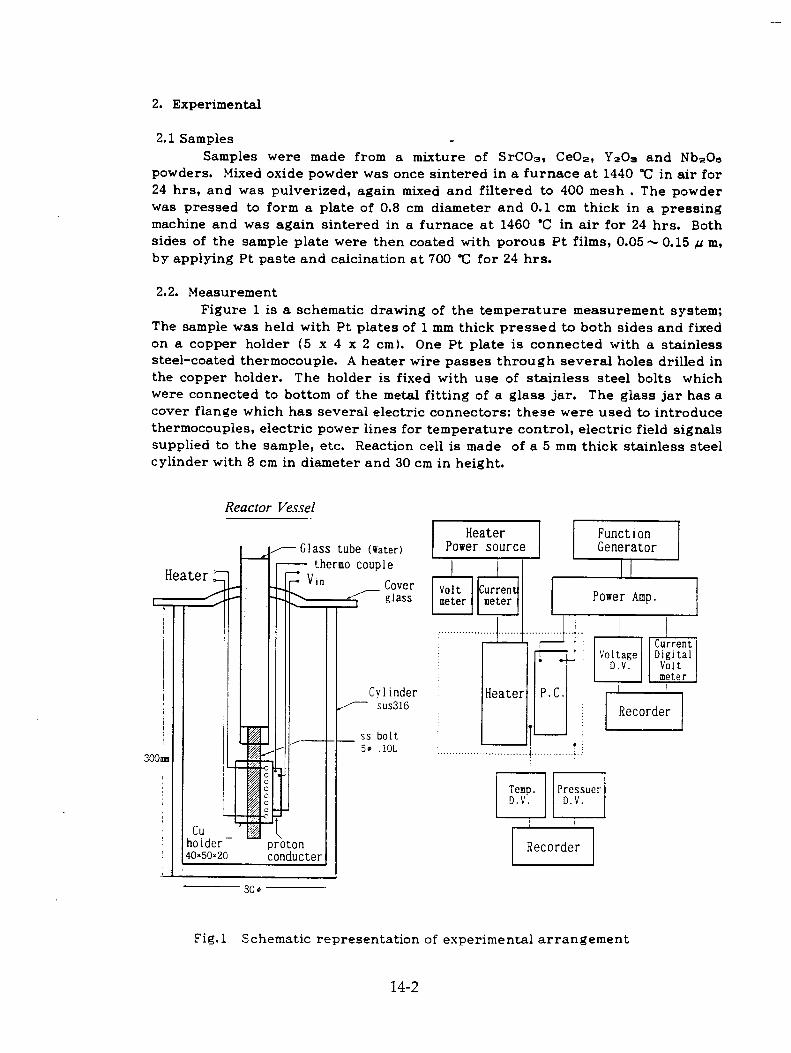
2. Experimental
2.1 Samples - Samples were made from a mixture of SrCO3, CeO2, Y203 and Nb20e5
powders. Mixed oxide powder was once sintered in a furnace at 1440 °C in air for 24 hrs, and was pulverized, again mixed and filtered to 400 mesh . The powder was pressed to form a plate of 0.8 cm diameter and 0.1 cm thick in a pressing machine and was again sintered in a furnace at 1460 °C in air for 24 hrs. Both sides of the sample plate were then coated with porous Pt films, 0.05 -- 0.15 µ m, by applying Pt paste and calcination at 700 °C for 24 hrs.
2.2. Measurement Figure 1 is a schematic drawing of the temperature measurement system;
The sample was held with Pt plates of 1 mm thick pressed to both sides and fixed on a copper holder (5 x 4 x 2 cm). One Pt plate is connected with a stainless steel-coated thermocouple. A heater wire passes through several holes drilled in the copper holder. The holder is fixed with use of stainless steel bolts which were connected to bottom of the metal fitting of a glass jar. The glass jar has a cover flange which has several electric connectors: these were used to introduce thermocouples, electric power lines for temperature control, electric field signals supplied to the sample, etc. Reaction cell is made of a 5 mm thick stainless steel cylinder with 8 cm in diameter and 30 cm in height.
Reactor Vessel
Glass tube (water) thermo couple in Cover
glass Volt meter
Heater Power source
Current) meter I
Heater
Temp. D. V.
Recorder
P.C.
Pressuer D.V.
Power Amp.
Function Generator
Voltage D.V.
Recorder
Current Digital Volt meter
Fig.1 Schematic representation of experimental arrangement
14-2

The sample temperature is kept constant by means of a stabilized power supply. The electric field is supplied from a function generator via. a power amplifier. The input power is recorded continuously by means of a pen recorder and two digital voltmeters for current and voltage. Temperature is also recorded by a digital voltmeter at 0.1 °C of precision. The pressure of the system is measured by a pressure-to-voltage transducer. The temperature vs. input heater power relationship was calibrated for various gas mixtures.
3. Experimental Results
Figure 2 shows temperature changes of the proton conductor sample, SrCeo.0Yo. oeNbo. 0202. 97 and Al2Sio. 504 dummy sample, which are placed in the atmosphere of deuterium gas. The samples were heated by the heater, and the temperature rose up to a constant level of e.g. 380 °C within one hr. The deuterium gas was then introduced into the reaction vessel: temperature once fell down to 360 °C, but it again started to rise, attaining 410 °C after 5 hrs and this temperature was maintained at least for 20 hrs at which the experiment was terminated. In the other cases of hydrogen gas with the same type of sample (dotted curve) or dummy sample in deuterium (broken curve), the temperature fell down to about 270 °C within one hr and stayed there afterwards. This type of temperature fall should well be accounted for as due to increase of heat loss caused by thermal conduction of the hydrogen. A small difference recognized between deuterium and hydrogen is caused by a small difference in their thermal conductivity.
Fig.2 Temperature changes of proton conductor and dummy sample in various atmosphere under constant heater input
14-3

The heat generation from the proton conductor in the experiment of deuterium gas was estimated to be approximately 50 watt over 20 hrs, or -- 3.6 MJ in total. The input power given to the- sample was 18 V, 40 Az A, or 7.2 x 10' watt. Accordingly, the output-to-input power ratio was estimated to be as large as 7 x 10 4 .
All the sample electrolytes were analysed by X-ray emission spectroscopy for the detection of composition change. But no change was observed before and after the heat evolution: no change was detected between the samples with and without heat evolution. However, structural change was observed between the heat evolved and no heat evolved samples by X-ray analysis; several extra peaks were observed on the heat evolved samples around the intrinsic peaks of perovskite structure in the diffraction pattern. These peaks are not originated from the dissociated additional metal oxide nor from expansion of crystal lattice due to hydrogen absorption.
4. Discussion
Deuterium concentration in pc can be derived as follows; proton conductivity a H is given by the relation
crH=F v H [1.11 / V where F is Faraday, v H is proton mobility, V is molar volume of proton
conductor and [111 is proton concentration. Proton mobility v H showed obey the Arrhenius equation as,
V D a 2qw 1/ 14 = E KT
where V D is moving rate of proton, E is electric field, a is average jump distance, q is electric charge, W is jump frequency of ion, k is Boltzmann constant and T is temperature. The activation energy of proton mobility is 0.6-- 0.5 eV as obtained experimentally. The electric field frequency (f) across the proton conductor is approximately estimated from the following equation
f = L 2/ v " TV where L is thickness of proton conductor and V is electric field. For example, f is 0.03 Hz, at T is 400 °C. If one assumes that the anomalous heat generation may be caused by the following D-D reaction taking place in the electrolyte,
D + D = 4 21-le + 23.8 MeV then, a typical case of ion current 40 u A at 400 °C for 18 V of electric field corresponds to the deuterium flow rate in the sample of 2.5 x 10' 4 D 4 s - 1 . If further the whole number of deuterium ions contribute to the D-D fusion, then the energy produced should be 6 x 10 2 ' eV • mol• s'. As 50 watt is equal to 3.12 x 10 21 eV • mol• s , we may conclude that several 10 % of D 4 has contributed to the fusion reaction.
References 1, T.A.Chubb and S.R.Chubb; Fusion Technology, 20(1991)93. 2, A.Takahashi, A.Mega, T.Takeuchi, H.Miyamaru and T.Iida; Proceedings of the
Third Int. Conf. on Cold Fusion, Nagoya,(1992)79. 3, E.Yamaguchi and T.Nishioka; Proceedings of the Third Int. Conf. on
Cold Fusion, Nagoya, (1992) 179.
14-4

15-1


I or 15-5
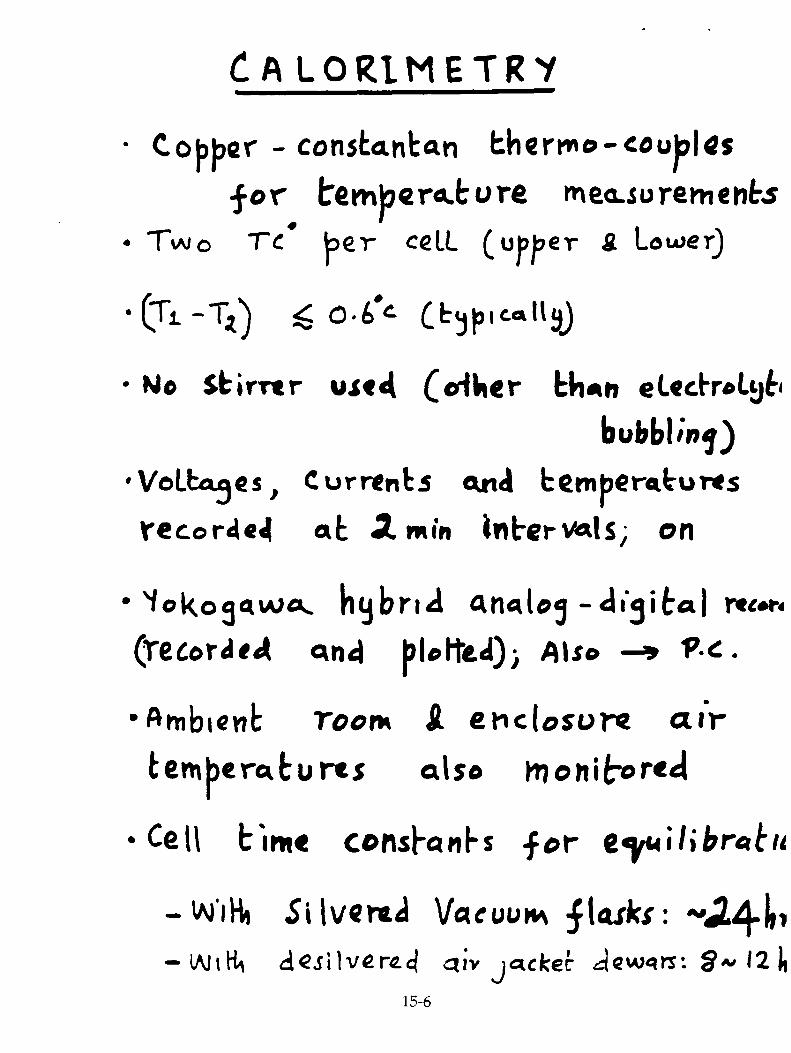
15-6


SUMMARY O F RE 5 - U .LTS
NIAGo•IA CONFERE NCE VROCEED/NCTS)
133
Table I. Experiments Where DT was Measured for Various Input Power Levels.
Sri Expt. Date No. Alkali Sol— Max. Max. Mit.= No. No. Comp— of Type vent Input Excess cdszniait
leted days Power Power inilact. Pi(w) (%) (Bq/ml)
PISD GROUP (CYL. & PLANAR GEOMETRY; SOLID & POROUS Ni)
I X-8/12. May,1 44d K2CO3 H20 2.0w 40% NIL 2 X-14t Jun,3 16d Li2CO3 Lua 3.5w 30% 1ZZ 3 X-15t May,21 10d K2CO3 ;5%D20 1.6w 130% 3311
4 XA —1: Oct,20 30d K2CO3 H20 1.2w NIL 5 XA-2: Oct,20 30d K2CO3 H20 1.0w um NIL 6 XA-3: Oct,20 30d K 2C0 3 H20 1.3w 23% NIL 7 XA-4: Oct,20 30d Li2CO3 H20 1.ow 70% NIL 8 XA-5: Oct,20 30d Na2CO3 H20 0.8w 35% NIL
HALL 5 GROUP (CYLINDRICAL GEOMETRY : POROUS Ni)
9 Al Jun,29 21d K2CO3 25%D20 36% NIL 10 A2 Jun.29 21d K2CO 3 25%D 20 28% NIL 11 A3 Jun,29 21d K2CO3 25%D20 0.23w 28% NIL 12 A4 Jun,29 21d K2CO3 IUD 24% 46 13 AS Jun,29 21d Li2CO3 1 70% 14.54
14 B1 Aug.25 28d -Li2CO3 H20 40% NIL 15 B2 Aug,25 28d -Li2CO3 H20 58% NIL 16 B3 Aug,25 28d •Li2CO3 . 07tD,0 0.3w 46% 312. 17 B4 Aug,25 28d Li2CO3 50%D,Q 49% cp B5 Aug,25 28d •Li2CO3 az0 53% L9.i.
• Cylindrical Geometry, Solid Nickel Cathode t Cylindrical Geometry, Porous Nickel Cathode 2 Planar Geometry, Porous Nickel Cathode • Enriched lithium (54%)
5t...1,cCQ S 5 rate = 16 calls $


C-
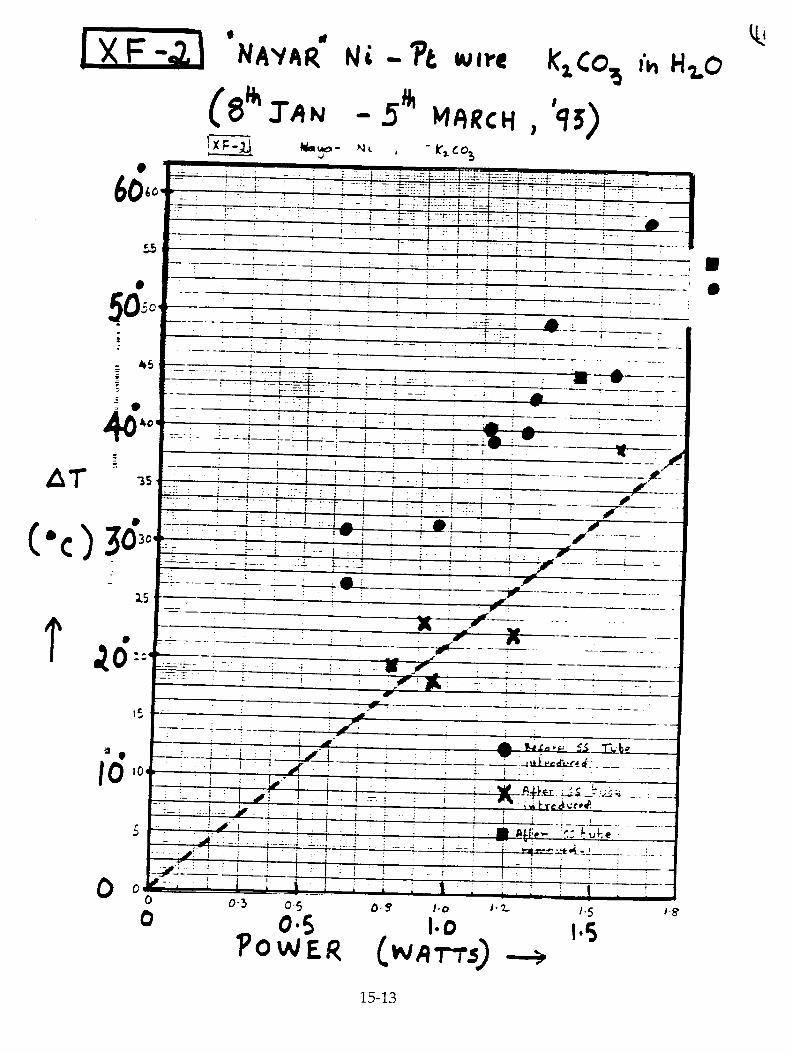
15-13
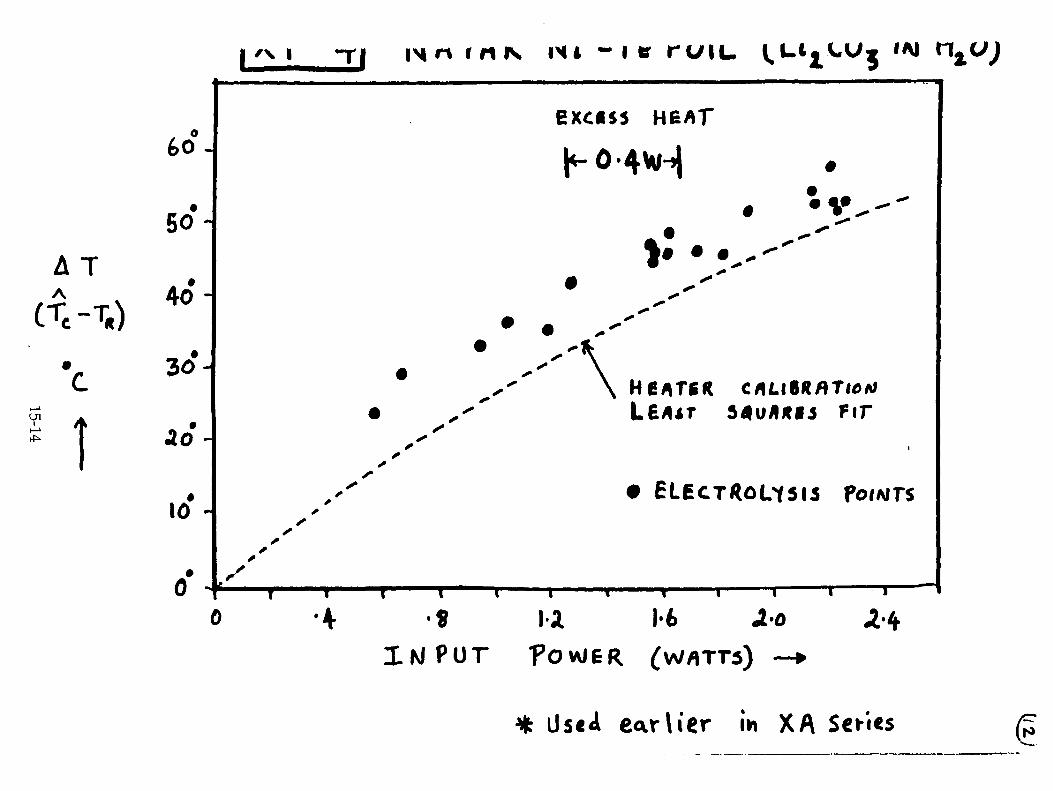
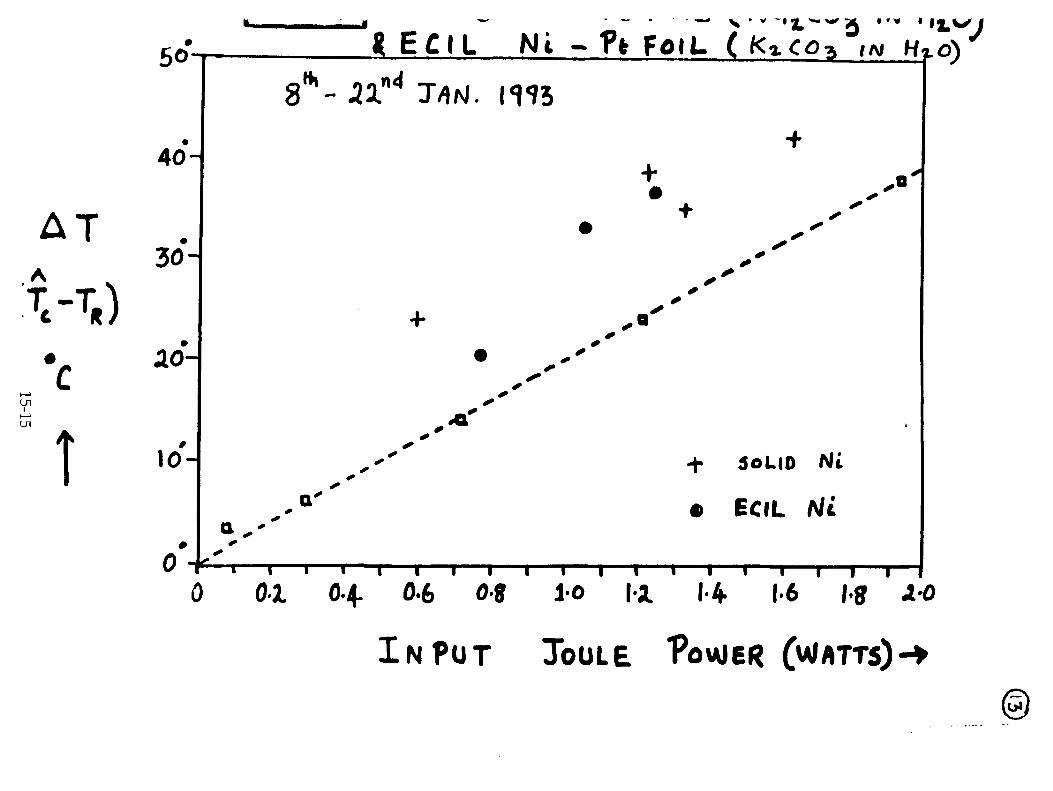


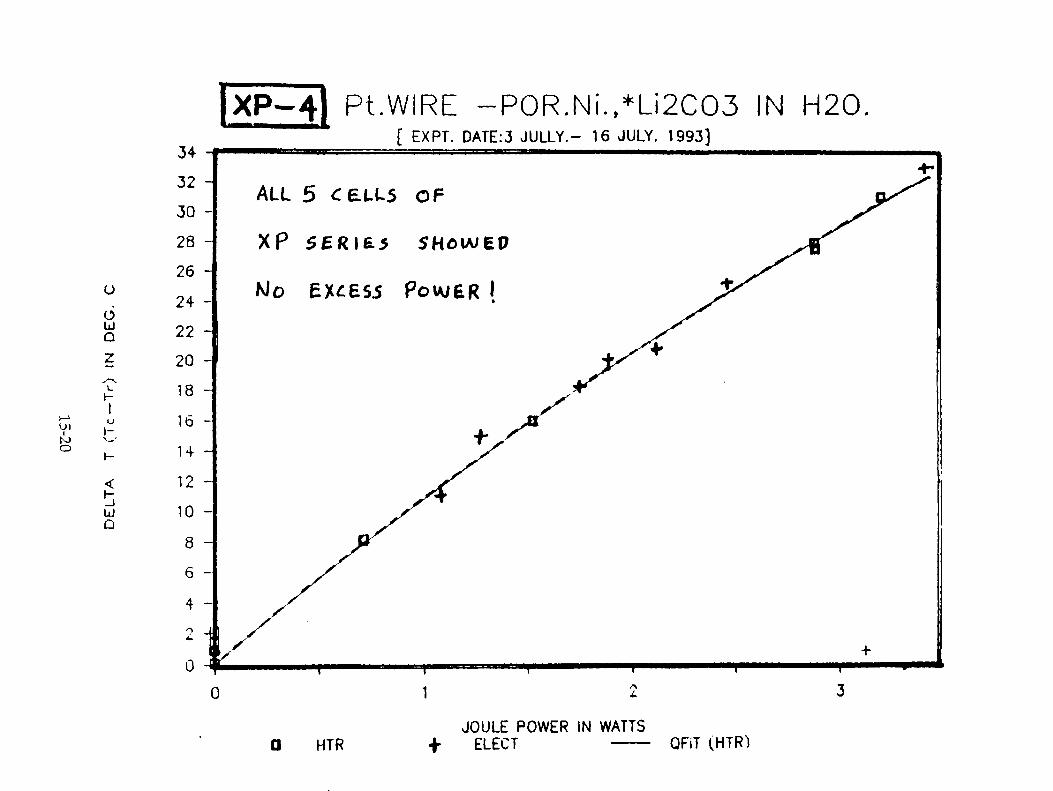
Ut 1(3
C)
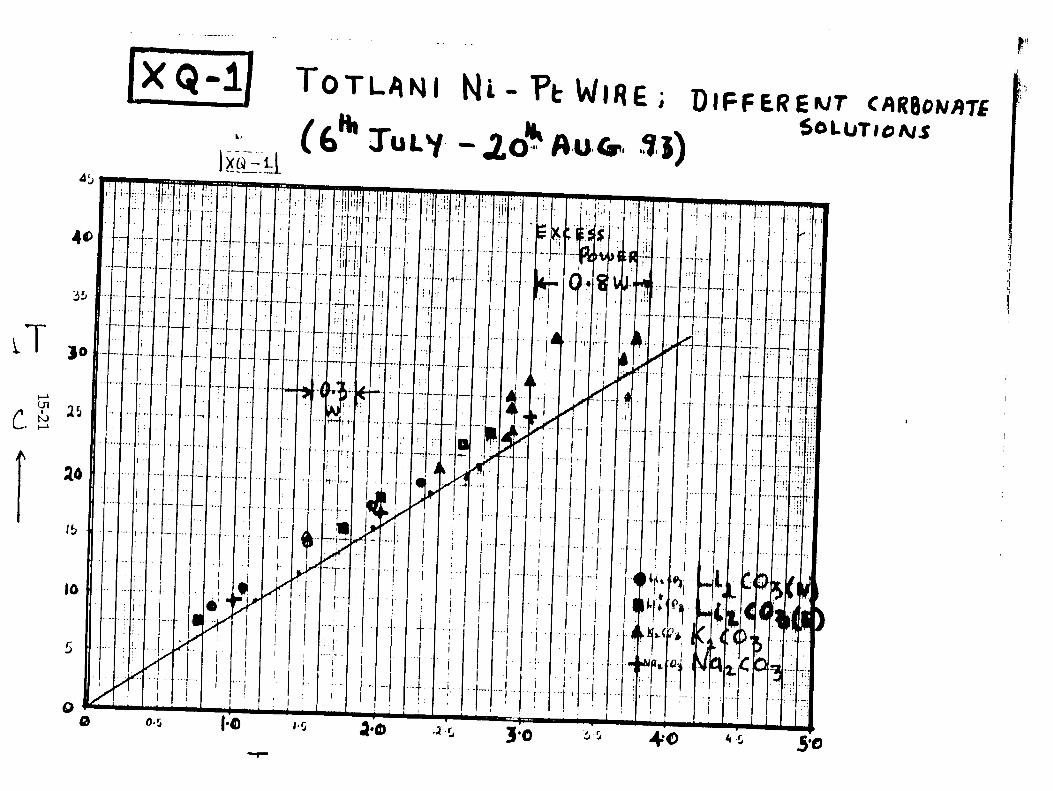

....,
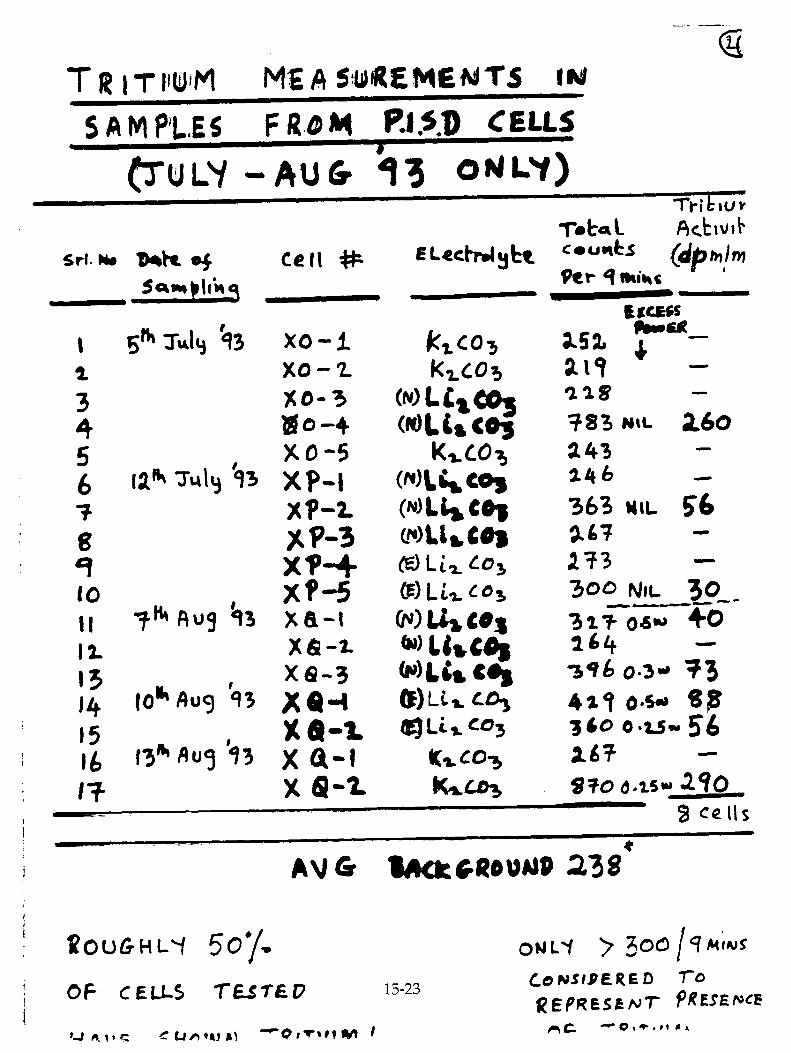

CONCLUSIONS

DEC 03 '9317:50 9•7 P01707
FURTHER STUDIES ON EXCESS HEAT GENERATION IN H 2O-Ni ELECTROLYSIS CELLS
• H. RAXAMURTHY, H. SRINIVASAN, @ U.K. HURHERJEE AND P. ADIBABO
Process Instrumentation systems Division @Neutron Physics Division
Bhabha Atomic Research Centre Trombay, Bombay 400085
INDIA
ABSTRACT
This paper presents the results of the further calorimetric studies carried out at our centre since the Nagoya Conference, on exess heat generation during the electrolysis of alkali carborate solutions in H20 using Nickel cathode and Platinum anode, con-firming the findings of Randell Mills and his collaborators - first reported in 1991. The corresponding measurements on Triti-um production are described in a companion paper. The electro-lytic solution was either K2 CO 3 , Li 2 CO 3 or Na 2 CO 3 . Different types of Nickel were studied and the cells were open type and fabricated out of double walled glass dewars (commercial thermos flasks).. As many as 13 series of experiements were conducted, each with 5 cells. Excluding few cells in which either S.S. sheathed thermocouples were used or 80 ohm shunts were used, 28 cells were studied. Of these, 14 have shown excess heat. In the present experiments the absolute magnitude of excess power was in the range of 0.2 to 0.7 W.
INTRODUCTION
Having come to know the startling results on excess heat generation with simple light water - Nickel electrolysis cell, reported by different groups from different parts of the globe, we initiated the attempts to verify the same at our Centre in Trombay in January 1992. In pursuit of it, we started with a crude cell to proceed with and made constant improvements to both cell structure and instrumentation to measure and monitor various currents and temperatures of the cells.
DEL e= '93 17:51 977 P02/07
A bank of 5 cells and an identical dummy cell were run at a time. The difference in average temperature at steady state between operating cell and an identical non-operational dummy cell was taken as a measure of the heat generation in the cells: The cells were calibrated using resistance heaters. Different types of Nickel were tried. The electrolysis solution wa either 0.57M K2CO3 , 0.1M Li2CO3 (natural or enriched in Li 6) or 0.57 M Na2CO3.
DESCRIPTION OP CELLS :
All the cells were of the open type with either rubber or Teflon lids having three holes, two holes for insertion of ther-mocouples - one at bottom most and another at top just dipping into the electrolyte; another hole is for escaping of electrolyt-ic gases and for make up to maintain constant level of electrolyt in cell.
In all 8 series of experiments (labelled XB to XF, XH,XJ, XX & XM) cells were fabricated out of double walled vacuum glass dewars (commercial thermos flasks). In other series of experi-ments (labelled TG, XN to XQ) cells are double walled vacuum broken, m-sealing, glass dewars. Only in PG series 250 ml gradu-ated cylinders in Pet Jar was used as cell.
In electrode assembly, cathodes (Ni) were made in planer geometry (2 cm x 6 cm in size, 0.3 mm thick). The Platinum anode which encampa5sed the Ni cathode (solid or porous) was made of 0.15 mm or 0.2 mm dia. Pt wire wound over a Teflon frame either in U 'form or sandwich design. Sandwich design incorporates placing of Ni. cathode in planer geometry between two perforated 1 mm thick Teflon sheets and encompassed with Pt. wire in front of all perforated holes. 14 cells out of 28 cells studied have shown excess heat in both '11' frame as well as sandwich design. Also, both solid Ni. and porous Ni inclusive of fibrous Ni. mate-rial similar to that used by R.T.BUSH has indicated excess heat. The lead wires to the electrodes were covered with Teflon sleev-ing upto the top of cell lid so that no portions above the solution level is exposed bare to the electrolytic gases. This is to minimise recombination effects giving rise to errors in calorimetry.
The electrolytic solution was either 0.59 M k2CO 3 , 0.1 M .L.i 2CU3 (natural or enriched in Li6 ) or 0.59 M Na 2 CO3 . While most experiments were carried out with H20 solutions, some runs used a mixture of H2 0 and 25 4 D20. The volumes of the electrolytic
solution were 98 ml, 200 ml respectively for the 110 ml and 300 ml flasks.
15-27
term '93 17:52 977Pli3ee7
To speed up data accumulation these experiments have used banks of five electrolytic cells (flasks) connected in series. A sixth cell served as dummy or reference cell, for the DT (differ-ential temperature between electrolytic cells and the reference cell) measurements. Highly stabilised constant voltage power supply units (0 to 30 V DC adjustable) with negligible ripple were employed to drive the cells. All cells had a built-in resistor or resistance wire of Manganin encased in Teflon sleeves or tape besides the Ni-Pt electrode assembly, for calibration purposes.
INSTRUMENTATION AND CALORIMETRY
As described in our Nagoya paper, cells voltage, current and temperature data were recorded continuously on a Yokogawa hybrid analog - digital multichannel paper chart recorder. In addition, the data was also simultaneously recorded on a personal computer for possible off-line or on-line data processing- The basic experimental set up and calorimetric technique were essentially similar to that described in our Nagoya paper. In these series of experiments, each cell had two thermocouples (TC's) for tempera-ture measurements, one located in the upper region and the other closer to the bottom of the cell. No stirrer was deployed. The temperature difference between the upper and lower thermocouples was less than 0.6°C at steady state in most of the runs both during calibration as well as electrolysis. The difference in average temperature at steady state between the operating cell and that of an identical non-operational dummy was taken as a measure of the heat generation in the cells. In experiments, XB, XD and XE series of experiments thermocouples of ANSI type T, S.S. sheathed mineral insulated wire used. In rest of the series ANSI type T thermocouple PVC insulated or S.S. sheathed ANST type thermocouple encased in a glass tube were used for temperature measurement.
k ELECTROLYSIS EXPERIMENTS AND EXCESS HEAT RESULTS
All the electrolytic cells were of the open type and de-ployed double glass dewars (commercial thermos flasks). In the more recent experiments, the outer plastic container of the flasks was replaced by a 1000 ml glass beaker and the double walled dewars silver coatings were dissolved using dilute HNO 3 wash (after breaking the vacuum ), in order to obtain transparent see through cells. With this, the calibration constant which was earlier in the 20 to 35 °C/Hr region diminished to values in the range of 7 to 10°C/Hr. correspondigly the time duration to reach
steady state also decreased from about 24 hours to about 10 hours.
15-28
DEC 03 '93 17:53 977 M04V07
The cells were calibrated using resistance heaters. A bank of 5 cells and one dummy were run at a time. The cathodes were mostly made of Nickel. Different types of Nickel were studied. The Pt. wire anode was usually in the form of a coil wound around the flat Nickel plate cathode (planer geometry) mounted in a Teflon frame (U shape). A few runs were however also made with the Pt. anode in the form of a foil mounted parallel to the cath-ode although majority of the runs used ''U' frame design for holding the cathode. Several experiments were also run with a sandwich type design wherein the Ni cathode was sandwiched be-tween a pair of perforated Teflon sheets around which Pt. wire was coiled as anode. The electrolytic solution was either 0.59 M K2CO3 , 0.1 M Li 2CO3 (natural or enriched in Lib) or 0-59M Na2Co3 .
In all, 13 series (labelled XB to X4 series) of experiments were conducted, each with 5 cells during the 10 months period from November 1992 to August 1993. The steady state temperatures of the cells were recorded for various input Joule powers upto a maximum of 3 W. In XB, XD and XE series (Nov - Dec. 1992) runs, immediately after the Nagoya meeting, surprisingly none of the cells gave any excess heat. The only change effected in these experiments was the deployment of sturdy s.S. sheathed mineral insulated Copper-Csonstantan thermocouples instead of PVC sheathed and insulated Copper-Const.intan for TC's to avoid fre-quent prOblems arising from the corrosion of the exposed hot junction by the electrolyte. In XF series (7th Jan.- 5th March 1993) we therefore went back to use of PVC sheathed TC's. This resulted in all the 5 cells showing excess heat once again. In a couple of cells which were showing excess heat, when a S.S. tube was dipped into the solution, the excess heat vanished after a lapse of time (1 day) and was restored when it was removed. The exact mechanism by which the excess heat phenomenon is suppressed by the presence of the stainless steel in the solution is not yet clear. In all subsequent series of experiments, the S.S sheathed TC's were therefore further encased in a glass tube to avoid contact between S.S. and electrolyte.
There was a second two month frustrating phase (6th Mar. to 9th May, 1993) when the data points were very erratic. The calibration curve was periodically shifting. This was eventually traced to introduction of very low value (80 ohm) shunts for measuring currents in place of the earlier 1 ohm Manganin coils. This resulted in erroneous current measurements arising from contact resistance, also contributing at times to the current measuring circuit_ Once this problem was resolved and rectified, all but one of the subsequent series once again showed excess heat in atleast a few of the five cells.
15-29
DEC 03 ' 93 17:54 977 P05V07
Excess heat has been observed both with 'U' frame and sand-wich design. As for electrolyte K 2 CO3 , Li2 CO3 , Li b enriched, Li2CO3 and in a few cases even Na2c0.3 solution has given excess heat. Also both solid Ni and porous Ni inclusive of fibrous Ni material similar to that used by R.T.Bush has indicated excess heat.
• Excluding the experiments in which either s.s sheathed TC's
ware used or 80 ohm sheaths were used 28 cells were studied. Out iheeie 14 have shown excess heat. vile of the main observations
arising from the post Nagoya series of experiments is that the excess - over - dummy - cell - temperature - points fall on a line which is more or less parallel to the calibration curve, indicating that the margin of excess power is approximately constant for a given cell, independent of input current or joules power, supporting the observation of Randell Mills, the origina-tor of the concept of generating excess heat using electrolytic cells. In the present experiments the absolute magnitude of excess power was in the region of 0.2 to 0.7 W. This means, that for Ni - H20 cells, it is inappropriate to express excess heat as a percentage of input Joule power. We now realise that it is futile to raise the range of power levels of operation of the cells to a maximum of 10 or 15 W. with a view to increasing the amount of nuclear transmutation products such as Ca from K, if any is produced. It appears that with a typical Ni-cathode surface area of about 20 cm margin (both sides) the maximum excess heat margin obtainable in our cells is less than 1 W. Efforts have been initiated to see if pulsed operation as recom-mended by Randell Mills will improve the overall energy gain.

DEC 03 '93 17:55 977 P06/07
Table - Experiments where DT was measured for various input
power levels_
S.No Expt. Duration Alkali Solvent Max. input Max Energy No type power power
Pf (W) 1 over (W)
PLANAR GEOMETRY, 13-FRAME & SANDWITCH DESIGN, SOLID
1 XB Oct. 29 to K2CO3 H20 - Nov 11, 92 Li2VO3
Na2CO3
& POROUS Ni
-
2 XC NOV 21-25, 1992
K2CO3 -do- 2.6 0.2
3 XD Nov. 11 to K2CO3 -do- Dec. 14, 92 Li2CO3
Na2CO3
4 XE Dec. 15 92- -do- -do- 1.5 0.2 Jan 11,93
5 XF Jan 8 to -do- -do- 2.7 0.7 Mar. 5, 93
6 PG March 10-21, K2CO3 -do- 12.0 0.5 1993 Na2CO3 (PG 4)
7 TG March 22 - -do- -do- 13.0 1.0 Apl 2,1993 (TG 4)
8 XH Apl. 2-12, -do- -do- 2.5 0.1
1993 (XH 2)
9 XJ Ap1.12-20, 1993
K2CO3 Li2 CO3
-do- 2.8 (HJ 4)
0.25
10 XX Apl. 21 -. -do- -do- 3.6 1.1 Hay 9, 93 (XX 2)
11 XM May 5-21, -do- -do- 2.4 0.2
1993 (XM 4)
12 XN May 21 - -do- -do- 9.5 4.0 to 1993 (XN 4)
15-31


A METHOD TO IMPROVE ALGORITHMSUSED TO DETECT STEADY STATE
EXCESS ENTHALPY
MITCHELL R. SWARTZJET Technology Weston, MA USA 02193
Dr. Mitchell Swartz does not wish to have his papers uploaded to LENR-CANR.org. A copy of thispaper can be found in the original EPRI proceedings, Vol. 2, p. 264:
http://my.epri.com/portal/server.pt?Abstract_id=TR-104188-V2
16-1

THE EXCESS HEAT EXPERIMENTS ON COLD FUSION IN TITANIUM LATTICE
Q. F. Zhang Q. Q. Gou Z. H. Zhu J. M. lou F. S. liu J. X. S. B. Y. Miao A. P. Ye S. M. Cheng
(The Institute of Atomic and Molecular Science at High Temperature and High Pressure, Chengdu University of Science and Technology, chengdu 610065, China)
ABSTRACT
This paper reports two groups of experiments in cold fusion of titanium lattice. A kinds of solution contanining the D 20 and a little H 2 0 is used in the first group of experiments and we could not observe any ascent of temperature in the Ti-rod after more than ten days, and then we found that the capability of Ti-rod absorbing H atoms is stronger than the capa-bility of Ti-rod absorbing D atoms. In the second group of experiments, the electrolyse solution is pure D 20 and the "excess heat" phenomena occurs after six days. The ascent of temperature in the middle of Ti-rod reached at 0.5C and the part of but-tom of D20 reached at 1. 5C. After then, we found that the x—ray diffraction spectrum of Ti-rod causes change and some spectrums lines of Ti-rod are unknowm. On the other hand , the surface fo Ti-rod becomes much more brittle after "excess heat"
Experimental Instrument A Ti-rod of diameter 2. Omm was used as cathode and a P 1 -Sheet was used around it (Fig. 1). A dividing net was set between the cathode and the anode in order to set out the D2 and 0 2 seperatly, , two thermocouples were put in the holes in the buttom of the cathode to defect the tempera-ture of the Ti-rod. And two other thermocouple was set in the parallel position to defect the temperature of the D 20. The electrolyte is pure D 20 with 0. 1N of NaOD or the compound of D 20 and H 20 with 0. 1N of NaOD.
El ectrol ysis Experiments 1. Experiment with Electrolyte include H 2 0 and D 2 0 The electrolyte was
1
17-1

1—D20 out 2—P, sheet 3—O 2 out 4 — Cold bath 5—Ti rod 6—thermocouples 7-dividing net 8—D20
Fig. 1 Experimental Instrument
composed of H20(10 1%), D20(90%) and NaOD (0. 1N). The Cur-reut density is 250mA/cm 2 . We added 1 ml of D20 into the electrolyte every 2 hours within the experiment. The temperature of Ti-rod and D20 was steady within 10 days. Af ter the experiment, we divided the Ti-rod above and in the D 20 in-to 4 pieces to make SIMS analysis. We found that the Ti-rod above the D20 had absorbed a great deal of H, but the peak D was not found (Figure 2A). On the other hand, both H and D were found in Ti-lattice in the D 20, and the amount of the D absorbed in the Ti-lattice became larger and larger with the increase of deepness of erosiving(Figure 2B).
2. Experiment in Electrolyzer with pure D 20 In the secoud group of experiments, the electrolyse solution is pure D20 with NaOD (0. 1N) and the extraordinery ascent of temperiture of Ti-rod occurs after some days of electrolysis. For example we used the Ti-rod of diameter of 12. Omm to make the electrolysis experiment with the current density of 250mA/cm 2 and the extraordinery ascent of temperature of Ti-rod is about 24C after 4 daysr- 23 . Therefore, when we used the Ti-rod of diameter of 2. Omm with the current density of 300mA/cm: , the extraordinery ascent of temperature of 1. 5 t (but-

7. ■ od above 0,0 4'
1) 3•
✓ t . 2 — envy
napftlidor ■•■■ •• ••■■•
LoOd000plo=4■Vol■
Figure. 2A SIMS spectrum of T, — rod above Dt0
Figure. 2B SIMS spectrum of Ti—rod in D20
RAP4ilia
Figure 3. The extraordinery ascent of temperature of Ti—rod(middle)
Figure. 4 The extraordinery ascent of temperature of Ti —rod (buttom)
3
17-3

tom)and 0. 5°C (middle) occured after 6 days. So the larger the diame-ter of Ti-rod is, the higher the extraordinery ascent of temperature of Ti-rod (Figure 3,4). Otherwise , we can say: The temperature remains the same before the extraordinery ascent of temperiture of Ti-rod oc-curs after 4 to 6 days and the temperature of D 20 goes up very slowly as extraordinery ascent of temperatur of Ti-rod occurs.
The Surface Detection and Analysis of Ti -rod 1.The SIMS detection
As Fig 2A, 2B showed: during the process of electrolysis, the space above the surface of D20 was filled with H and much more D, The Ti-rod absorbed many H atoms but no . D atoms. On the other hand, the Ti-rod under the surface of D 20 absorbed both H and D atoms. Obvi-ously the atoms of H and D were forced into the Ti lattices under the action of the electric field in the electrolyzer. The Ti-rod above D20 had no action of the electric field, only having absorbability on its sur-face. These two kinds of action were completly different. So the mechanism of the entrance of D atoms into the Ti lattices by the elec-tric field will discussed further study and it is good reason why the repi-titon rate of the "exess heat" phenomenon is increased.
2.Sweep Electron Microscope Experiments (SEM). The pictures in Fig 5, 6,7,8 are the results of surface metal phase anal-ysis of Ti-rod by SEM.
- It is clear that the Ti lattice become more brittle because of the absorb- ing of D. That is why the surface seems muddy and thinning-down.
3.Hardness Detection As table 1 shows that the hardness of Ti surfacechangedafter the "ex-cess heat" experiment. Table 1. (HRC)
No: 1 2 3 4 5 6
HRC (before ) 43 47 40 35 45 46
HRC (after) 50 49 49 49 48 49
The average HRC of the six point change from 42. 7 to 49. 0 after ex-traordinery ascent of temperature of Ti-rod. This result is correspond-ing to that of the micro detection. Therefore, We may say that the surface hardness of Ti lattice is increased after the extraordinery ascent
4
17-4

Figure.5 surface of Ti-rod. (before excess heat) Figure. 6 surface of TI-rod. (after excees heat)
- ....1071 • . 0' .5 • A. d 4.72C29 30um
Figure. 7 cut trace of Ti-rod. (before excess heat) Figure. 8 cut trace of Ti-rod. (after excess heat)
of temperature of Ti-rod. 4. X-Ray diffraction detection
The result of the x-ray diffraction detections of the Ti-rod before and after the extraordinery ascent of Ti rod were showed in figure 9 ,10. We are sure that the structure of the surpace of Ti-rod was changed af-ter the extraordinery as cent. When we check the distance between the
5
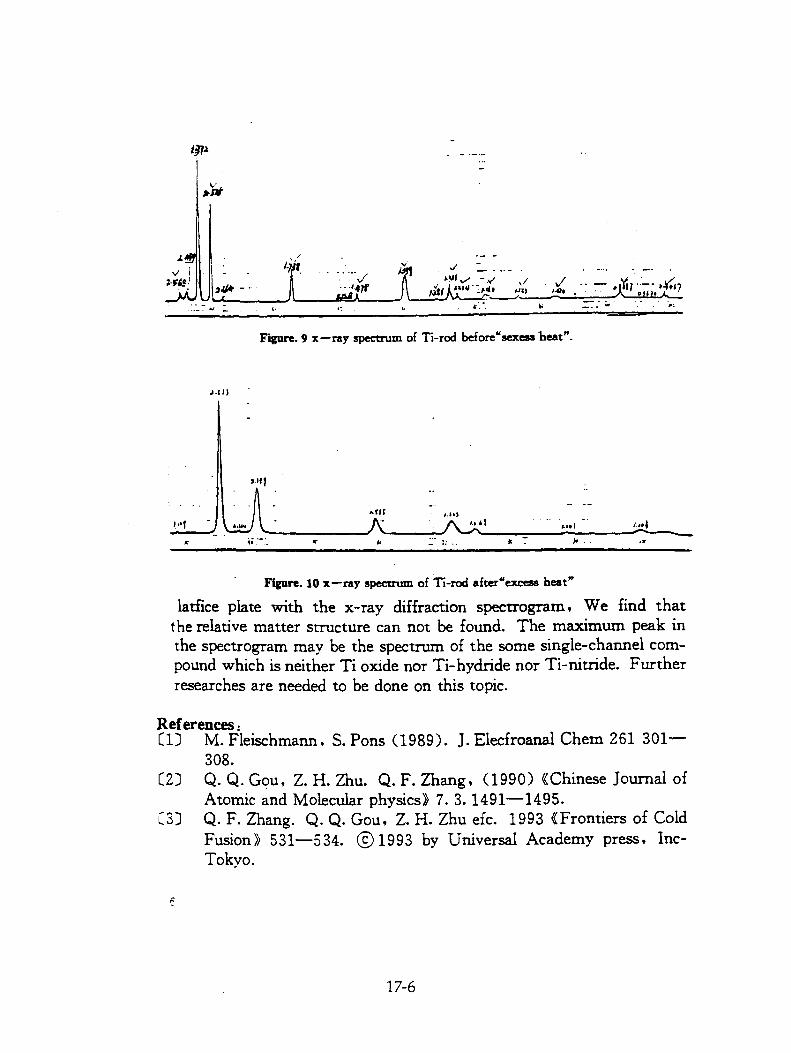
Figure. 9 x—ray spectrum of Ti-rod before"sexess heat".
latfice plate with the x-ray diffraction spectrogram, We find that the relative matter structure can not be found. The maximum peak in the spectrogram may be the spectrum of the some single-channel com-pound which is neither Ti oxide nor Ti-hydride nor Ti-nitride. Further researches are needed to be done on this topic.
References: C1) M. Fleischmann, S. Pons (1989). J. Elecfroanal Chem 261 301—
308. C2J Q. Q. Gou, Z. H. Zhu. Q. F. Zhang, (1990) (Chinese Journal of
Atomic and Molecular physics) 7. 3. 1491-1495. C3D Q. F. Zhang. Q. Q. Gou, Z. H. Zhu efc. 1993 (Frontiers of Cold
Fusion)) 531-534. CI 1993 by Universal Academy press, Inc-Tokyo.
17-6
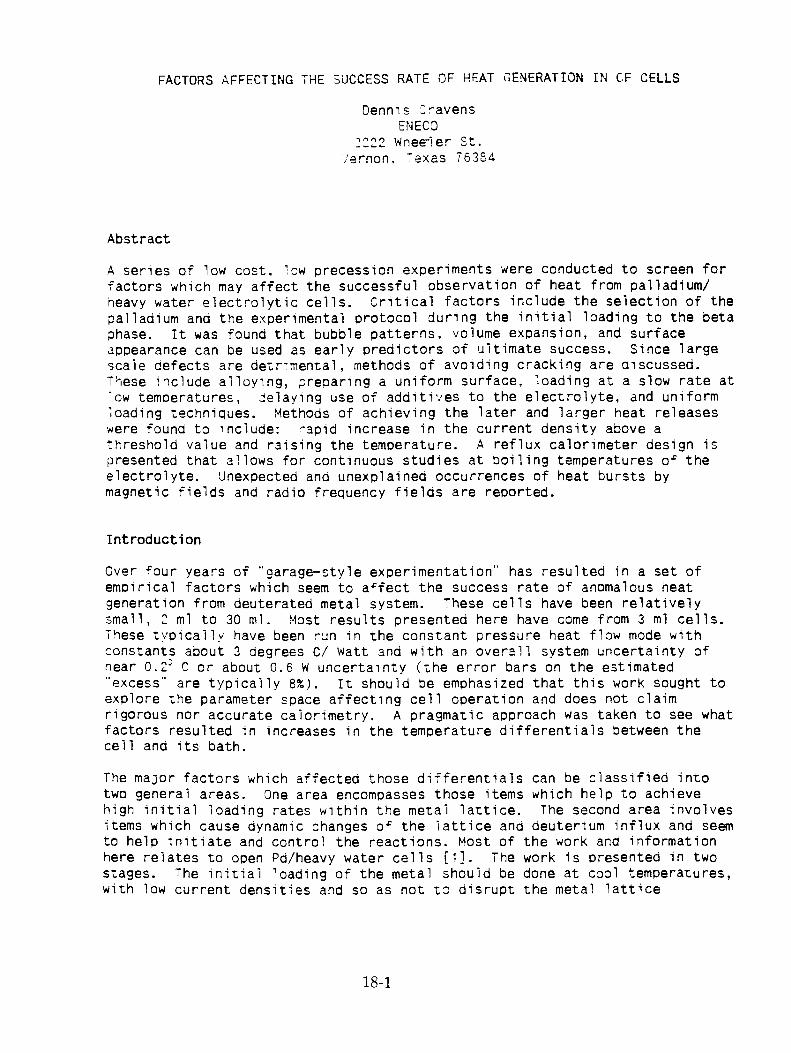
FACTORS AFFECTING THE SUCCESS RATE OF HEAT GENERATION IN CF CELLS
Dennis Cravens ENECO
22 Wheeler St. /ernon. Texas 76354
Abstract
A series of low cost, low precession experiments were conducted to screen for factors which may affect the successful observation of heat from palladium/ heavy water electrolytic cells. Critical factors include the selection of the palladium and the experimental protocol during the initial loading to the beta phase. It was found that bubble patterns, volume expansion, and surface appearance can be used as early predictors of ultimate success. Since large scale defects are detr7mental, methods of avoiding cracking are discussed. These include alloying, preparing a uniform surface, loading at a slow rate at 'ow temperatures, Delaying use of additives to the electrolyte. and uniform loading techniques. Methods of achieving the later and larger heat releases were found to include: -apid increase in the current density above a threshold value and raising the temperature. A reflux calorimeter design is presented that allows for continuous studies at boiling temperatures of the electrolyte. Unexpected and unexplained occurrences of heat bursts by magnetic fields and radio frequency fields are reported.
Introduction
Over four years of "garage—style experimentation" has resulted in a set of empirical factors which seem to affect the success rate of anomalous heat generation from deuterated metal system. These cells have been relatively small, 2 ml to 30 ml. Most results presented here have come from 3 ml cells. These typically have been run in the constant pressure heat flow mode with constants about 3 degrees C/ Watt and with an overall system uncertainty of near 0.2' C or about 0.6 W uncertainty (the error bars on the estimated "excess" are typically 8%). It should be emphasized that this work sought to explore the parameter space affecting cell operation and does not claim rigorous nor accurate calorimetry. A pragmatic approach was taken to see what factors resulted in increases in the temperature differentials between the cell and its bath.
The major factors which affected those differentials can be classified into two general areas. One area encompasses those items which help to achieve high initial loading rates within the metal lattice. The second area involves items which cause dynamic changes of the lattice and deuterium influx and seem to help initiate and control the reactions. Most of the work and information here relates to open Pd/heavy water cells [1]. The work is presented in two stages. The initial loading of the metal should be done at cool temperatures, with low current densities and so as not to disrupt the metal lattice

structure. The second stage should be cone at higher temperatures and with high current density, and with a some aynamic condition imposed on the lattice.
Part 1 — Factors affecting the initial loading ratios
It appears that high loaaina ratios of deuterium are helpful [2,3], 7f not required, for the achievement of the anomalous heating events. Althougn the dynamic conditions discussed in Part 2 may cause local regions of high deuterium ratios, by and large the greatest factor in achieving the heat is to conduct the initial loading of the metal host lattice so as not to cause damage which would prevent a large deuterium ratios in the ultimate heat generation stages. The following steps should be taken to achieve a large initial loading: a) select host lattice materials, b) prevent cracking of the host lattice, c) load the cathode in a uniform manner, and d) avoid contamination.
Selecting host lattice materials
The metal host selected to contain the deuterium is important for the observation of anomalous heat effects. Remember that the goal is to load D (D= deuterium isotope of hydrogen) into the host at a rate faster than the D can escape. This means that conditions which increase the egress of the should be limited and conditions which increase its entrance should be enhanced. we will see that the proper loading techniques ana the limitation of cracking are important factors in reproducing the effects.
Reasonable care should be taken in selecting the Pd which will be used for the metal host lattice so that it can hold a high atomic ratio of D to Pd. High purity (>99.5%) Pd is recommended. I use Pd from Aldrich or investment grade Pd from Engalhard. It is especially important that it have low levels of Pt impurities. The Pd should be visually inspected to assure it is free from obvious cracks, voids or Lutter lines. A quick dip in formic acid or an electrolyte to wet the surface sometimes helps in visualizing the structure of the material.
It was empirically determined that the bubble patterns on the electrodes are often predictors of excess heat. A "good" sample will initially take up hydrogen (i.e. the deuterium isotope) very readily at low current density. A "bad" sample often exhibits bubbles very early in the initial loading stages. It is often disconcerting to see marked differences from samples cut from adjacent regions of the same wire or rod. Since the initial 'oading should be done slowly over an extenaed t7me, lt 7s recommended that several samples be initially loaded at the same time. :f a number of similar samples are loaded simultaneously and in series, their relative hydrogen uctake can be discerned by their bubble patterns. The "best" samples of such an array will be the last to show bubbles at their surface. :t is thought that t'nis signals higher loading ratios (i.e. it can take in more hydrogen) and its surface conditions allow less recombination. A "goon" sample should load to 0.6 (or even 0.8 4ith the Rh alloy) before it forms hydrogen recombination bubbles at its surface. This delay in bubble formation is perhaps the single best way to predict a sample's future success.
18-2
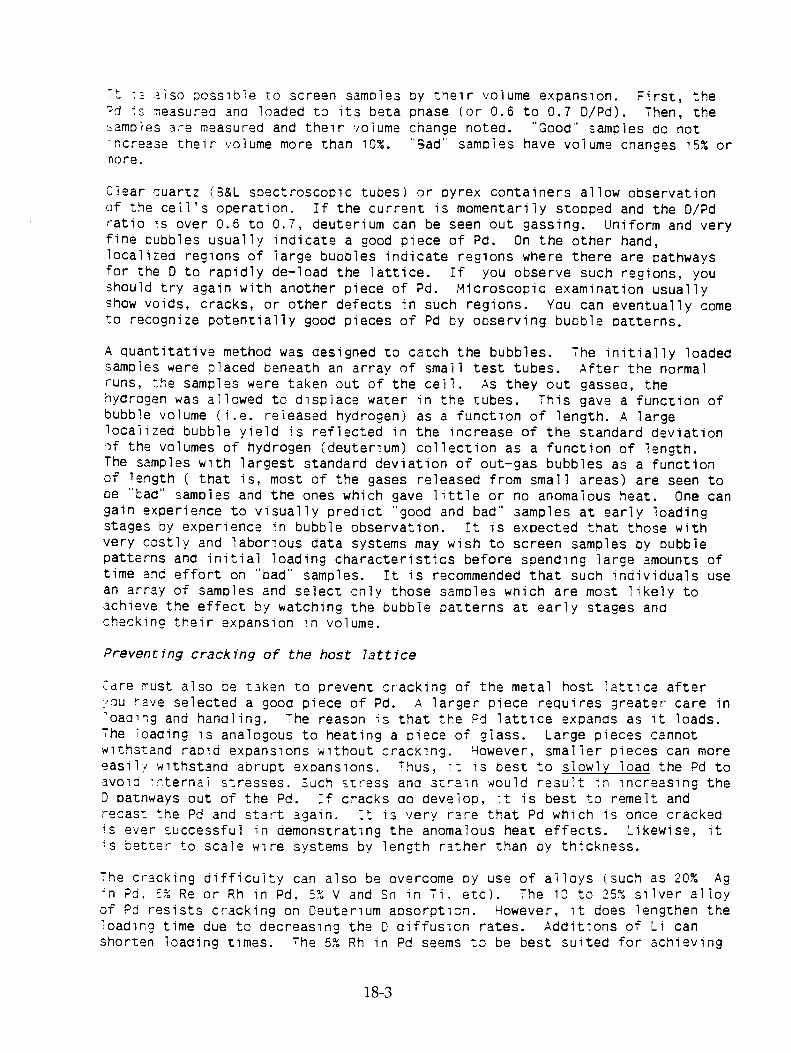
7t 73 also possible to screen samples oy their volume expansion. First, the =d ts measured and loaded to its beta phase (or 0.6 to 0.7 D/Pd). Then, the :,amoles are measured and their volume change noted. "Good" samples do not - ncrease their volume more than 10%. ";ad" samples have volume changes 15% or more.
Clear quartz (B&L spectroscopic tubes) or pyrex containers allow observation of the cell's operation. If the current is momentarily stopped and the D/Pd ratio is over 0.6 to 0.7, deuterium can be seen out gassing. Uniform and very fine bubbles usually indicate a good piece of Pd. On the other hand, localized regions of large bubbles indicate regions where there are pathways for the D to rapidly de—load the lattice. If you observe such regions, you should try again with another piece of Pd. Microscopic examination usually show voids, cracks, or other defects in such regions. You can eventually come to recognize potentially good pieces of Pd by observing bubble patterns.
A quantitative method was designed to catch the bubbles. The initially loaded samples were placed beneath an array of small test tubes. After the normal runs, the samples were taken out of the cell. As they out gassed, the hydrogen was allowed to displace water in the tubes. This gave a function of bubble volume (i.e. released hydrogen) as a function of length. A large localized bubble yield is reflected in the increase of the standard deviation of the volumes of hydrogen (deuterium) collection as a function of length. The samples with largest standard deviation of out—gas bubbles as a function of length ( that is, most of the gases released from small areas) are seen to be "Lad" samples and the ones which gave little or no anomalous heat. One can gain experience to visually predict "good and bad" samples at early loading stages by experience in bubble observation. It is expected that those with very costly and laborious data systems may wish to screen samples by bubble patterns and initial loading characteristics before spending large amounts of time and effort on "bad" samples. It is recommended that such individuals use an array of samples and select only those samples which are most likely to achieve the effect by watching the bubble patterns at early stages and checking their expansion in volume.
Preventing cracking of the host lattice
Care must also be taken to prevent cracking of the metal host lattice after :You have selected a good piece of Pd. A larger piece requires greater care in 'oadihg and handling. The reason is that the Pd lattice expands as it loads. The loading is analogous to heating a piece of glass. Large pieces cannot withstand rapid expansions without cracking. However, smaller pieces can more easily withstand abrupt expansions. Thus, -: is best to slowly load the Pd to avoid 7nternal stresses. Such stress and strain would result in increasing the D pathways out of the Pd. If cracks do develop, it is best to remelt and recast the Pd and start again. It is very rare that Pd which is once cracked is ever successful in demonstrating the anomalous heat effects. Likewise, it is better to scale wire systems by length rather than by thickness.
The cracking difficulty can also be overcome by use of alloys (such as 20% Ag 'n Pd. E% Re or Rh in Pd, 5% V and Sn in Ti. etc). The 10 to 25% silver alloy of Pd resists cracking on Deuterium aosorption. However, it does lengthen the loading time due to decreasing the D diffusion rates. Additions of Li can shorten loading times. The 5% Rh in Pd seems to be best suited for achieving
18-3
anomalous neat effects. However, such alloys are extremely difficult to form and are auite costly. As a result, very little exper7mentation was done on sucn alloys. Another tactic to plate Pd on Ag or another suostrate such as Ni or Cu [4]. The advantages are two-fald. -Tirst, the plating can be preformed so as tc partially form Pd D. This avoids cracking that results from expansions during rapid loadina. Second, it proviaes better thermal conductivity. [note - It is recommended that the plating oe done in an ammoniated solution and the film should be at least 5 to 2C microns thick.]
It is also often beneficial to anneal the sample to relieve internal stress and strains. However, remember that as the sample is annealing, impurities such as Pt, Cd, etc can migrate to the surface. :f you anneal, be sure to grind and polish the surface to remove such impurities after annealing. Otherwise, the sample will not "take up" hydrogen. (Pt catalyzes hydrogen recombination). Instead, the hydrogen will simply recombine at the surface and you will notice bubbles early in the loading process. In other words, you must always follow any annealing with polishing and surface preparation.
Loading the cathode in a uniform manner
The shape and surface texture of the cathode is also important. The cathode should be shapea to avoid snaro or jagged corners. Such points do not allow proper loading to be obtained. The idea is to remember to minimize E-field gradients across the surface of the host lattice. Such variations would lead to unequal loading. The D would then tend to diffuse through the Pd and then escape from the lattice from areas with the least surface E-field directed to accelerate the D+ flux into the lattice. This means your loading ratio will be limited, in part, by that portion of the surface area of the Pd which has the minimum over-potential (more exactly, the smallest absolute value of a negative potential).
Although rough surfaces may hasten early loading, they seem to decrease the ultimate loading obtained. This is one of the major causes of confusion at understanding variations in success of different samples. Such rough samples contain aeep grooves or valleys which are normally the regions with the least surface potential. : polish the Pd to avoid sucn difficulties. This is done by first polishing on a buffer wheel. The purpose is to round any burrs, rough areas or sharp corners. The Pd is then polished by a series of finer aluminum oxide powders and finally with cerium oxide (optical grade) on a cotton cloth.
4 very revealing observation was made on a sample that was polished only cn :one side. The other =ode was rough (from a hacksaw. The experiment resulted - n a distinct warping of the sample with tne a greater iblumetrio expansion on the rough side (approximately 159 greater expansion over the smooth side was estimated from the thickness and curvature). Storms 1E] has established such Targe volume expansions are counter productive for the observation of the heat effects. A series of experiments were conducted with several different surface preparations cn thin strip samples. Figure 1 depicts the results of those few experiments.
Rough surfaces on the anoae should also be avoided. Burrs and points seem to be sites cf oxidation and corrosion (this has been seen with nickel anodes). I sometimes use an entire 'spiral loop" as an anode with both ends outside of
18-4

the cell. If you have a free end, you may wish to place it in glue (silicon rubber. epoxy,...) to prevent corrosion from the point when it is run for extended times. The best results seem to come with Pt anodes but if you use Ni it should be oxidized first ( flame heating or with hydrogen peroxide solution).
It is important that the initial loading of the Pd be done slowly and carefully. The object is to use a low current density ( 30 to 60 mA/ cm = ) so that there will not be uneaual expansion and the development of large internal stresses. IMPORTANT - Do not be tempted to raise the current above 100 mA/cm -until the ratio within the lattice is at least above 0.6 to 0.7 range. If you use pulsing techniques, do not raise the peak current levels above the 100 to 200 mA/cm = levels until the Pd is loaded to at least 0.65. You can calculate the amp seconds needed to load the lattice to 0.7 or better. I prefer to load until mucn longer or about 150 Amp*hours have passed for each cubic centimeter of Pd (with at least one dimension <1mm). Be patient. It is better to spend too much time in the initial loading stage than too little. Any sudden application of large currents before it reaches the beta phase is likely to crack the host lattice. This could lead to rendering the Pd useless until it is recast. Some early work was unable to observe anomalous heat because of using obviously inappropriate samples or too rapid early loading and then using the cracked and stressed Pd over and over again. Be cautious of experimentation which has used the same piece of Pd over and over.
A series of experiments where conducted to see the effect of various initial loading rates on the % excess power produced (all compared when running at 50 C and 500 mA/cm - ). Notice (Figure 2) the cathodes which were slowly loaded out preformed those which where initially at a high current density. It should be noted that rapidly loaded wires often had a greater volume expansion.
It would seem that one role of the additives is to increase the over-potential and the internal fugacity within the lattice and select certain electrochemical pathways. Thus, do not add the poisons [2] or other additives (Al, thiourea. Si, B, Mo...) until you are above 0.6 to 0.7 D/Pd. Adding such materials too quickly could cause a creeping or spreading of any preexisting cracks or voids since the gasses build up within such voids. -,owever. if you slowly load the lattice before the additions, the expansion of the lattice on absorbing the 0 may help to seal such voids. Thus, :he goal is to first load slowly to allow the lattice to heal any voids (refer to Figure Materials which can increase the internal fugacity should be added only after most internal cracks and voids are self corrected.
The shape of the anode can also affect :he results. The anode should have the proper geometry to load the metal host to a unifcrm manner. Figure 4 shows the results of changing the number of turns of a spiral wound] Pt anode. The idea is tc have enough turns to supply a uniform field at the metal lattice. This is similar to trying to increase the internal pressure of a balloon. A few points of pressure do not suffice. It takes uniform pressure from all sides. :_lkewise, since D has a high diffusion rate, large internal D ratios should be attempted by using a uniform potential across the entire surface of the metal host lattice. :therwise your ratios will be limited by that portion of the electrode with the smallest (absolute) potential.
18-5

Avoiding some kinds of contamination
Impurities can be harmful to the heat aeneration. I clean the anode and the electrolyte by running it in a separate -system with a aummy electrode. This removes any reactive species and most impurities from the platinum and plates them onto to a dummy cathode. :t also removes some impurities that may be in the electrolyte. The dummy electrode is then removed and with it any such impurities. :f Ni is used as an anode, it should be first oxidized to render its surface passive.
Some experimenters have placed their electrical connections to the anode inside their cells. This can cause materials from the electrical lead to enter the cell and be plated onto the cathode. The fcam and spray within the cell, aver an extended period of time, will wet the connections and contaminate the cathode. It is advisable to keep the anode connections well out of the electrolyte and preferably out of the cell.
On the other hand, the connections to the cathode should be well below the surface of the electrolyte. Remember that the highest loading ratio achieved by your cathode is limited, in part, on the portion of the surface of the cathode which has the least inward deuterium flux. Thus, the metal host lattice should be well under the surface of the electrolyte and the anode should be positioned to extend above and below a cylindrical cathode. The idea is to have all surfaces on the cathode at approximately the same potential with respect to the incoming deuterium ions. I use platinum, silver or nickel for the connection to the Pd. If you use silver Jr another more active material, be careful not to turn off the currant or reverse current for extended periods unless it is electrically and chemically insulated. This can, in some cases, cause oxidation of the connections and the transmission of ions from the connections into the electrolyte.
Heavy water is hygroscopic and will uptake normal water from the atmosphere. When working with large open water baths, you should take steps to avoid the cell taking in normal water via the atmosphere. One approach is to connect a tube tc the cell and run it to a U tube with heavy water or oil. Another approach is to keep an over-pressure of deuterium in the region above the cell. This limits water uptake and also keeps the electrolytic pathways favoring those which lead to deuterium. You can bubble deuterium in at the bottom of the cell. This complicates the calorimetry but is not too bad if you reach the point cf seeing high levels of anomalous heat. :t also lengthens the time of usefulness of some additives such as thiourea. It should also be mentioned, that a small amount of water (about 1%) seems to level out heat bursts but that high levels (in excess of 10%) seem to prevent the reactions. Such mixtures (,10% H. 0) can be used as controls.
Part 2 - factors creating dynamic conditions
Only after the initial loading stages should the system be suojected to large dynamic conditions. Subjecting the system to dynamic or non-equilibrium conditions (after the initial 7oadina) can cause regions of larger :',euterium ratios than the global average over the cathode [6]. Such dynamic conditions often initiate or alter the heat generation from within the metal lattice. The act of changing the temperature ( - arge rate of heat gain as a function of
18-6

time), going to a higher current density, imposing RF signals on the cell, imposing a magnetic field in the region of the cathode, or altering the geometry of the cathode often cause the initiation of greater heat flux 'bursts or sustained bursts) from the cathode.
Changes in temperature
The greatest anomalous neat yields were from cells operating at temperatures above 75 degrees C and when used in conjunction with large current densities. The heat effects often seem to be triggered by loading slowly at 20 to 30 degrees and then running in a heated bath at 60 or more degrees.
The anomalous heat yields seem to be more noticeable at higher temperatures (see Figure 5). Due to the large possible errors, the trend line in the figure (as well as others in this article) should only be used to indicate an increasing function and not necessarily a linear one. The greatest sustained heat yields to date by the author have been from cells running at near 100 C [7]. These were outfitted with a reflux column so that prolonged boiling could be sustained. The device is diagramed in figure 6. It should be loticed the condensation is returned off-axis to prevent returning cold and non-conductive water directly to the region of the electrode. After calibration, the cell is run with a constant inlet temperature (about 40 C). The flow rate is adjusted manually so that the bottom of the reflux condenser stays at a nearly constant temperature (60 to 80 C). The idea is not to quench the reaction by returning overly cool water, or water devoid of electrolyte, to the region of the metal host lattice. The off-axis return and the elevated temperature at the return portion of the reflux column are subtle but important features.
The calorimeter is made up of: A) the electrolytic cell contained within a dewer =task, B) a central reflux column containing crushed aluminum oxide for a vapor condensation surface and recombines material (not shown is a tygon tubing connected to top and turning downward to prevent rapid escape of hydrogen and convection currents), C) an outer water jacket to provide cooling to the reflux column, D) a series of insulat7on, E) inlet from a constant temperature bath fitted with copper strip packing to prevent laminar flow in the region of temperature sensors, and F) an condensate return directed away from the active metal host. The temperature differential between the inlet and outlet was held relatively constant. The upper inlet temperature was held constant by the bath temperature. The lower outlet temperature was held approximately constant by adjusting the flow rate.
Increases in current density
Although it is best to load at a low current density (30-60 mA/cm 2 ), the anomalous heat effects are not seen until the current density is raised [8] (usually at least 200 mA/cm = and normally near 500 mA/cm'). Recall that a low initial loading rate is required to prevent cracking of the lattice and ultimately the escape of the deuterium from the lattice. Deuterium ratios above 0.8 can usually be reached only when there is a large influx of deuterium from high current densities. There does not seem to be a universal threshold for the current density for all cathodes. Instead, it appears that there is a range somewhere near 200 to 700 mA/cm = for most "good cathodes". The best cathodes have a tendency to have a lower threshold than do the
18-7

marginal cathodes. It would seem that the good cathodes leak less (perhaps due to fewer cracks for deuterium to leak out) and can reach higher ratios at lower current densities. It also seems that the initial slow loading is best at lower temperatures and low current densities. wowever, the heat production should be done at an elevated temperature and at a higher current densities.
One can make the analogy to filling a bucket having a hole. If the bucket has only a small hole, it can be filled with a small inflow. If the bucket has a large hole or several small holes, it can only be filled with a very large flow. Using higher current densities works, in part, by increasing the inflow above the out flow of the deuterium. Holding the current low during the initial stages works by decreasing the number of "holes" from which the deuterium will leak when one goes to the high current densities after the initial loading.
A few rapid pulses of current may also set up localized regions of high deuterium ratios within the cathode. The use of dynamic currents that are more rapid than the deuterium diffusion times can lead to high deuterium ratios in some regions of the cathode [9]. Changing the electrolysis current can set up dynamic variations and non-equilibrium ratios of the deuterium within the cathode. One way to do this is pulse the electrolytic current [10]. The goal is to set up a conditions that would cause a crowding of the deuterium within local regions of the cathode. The pulsing is usually done while keeping a D.C. bias on the current. In other words, the pulses should add on top of a D.C. bias. The bias is selected (for example 60 mA/cm') so that the cathode is not in a reverse bias condition. This prevents any de-loading that could occur if it was rendered anodic. For those new to CF cells, it is recommended that they first slowly loaded (30 mA/cm- surface are for 150 Amp*hours per cc of Pd), then slowly ramp to 60 mA/cm- (over 2 hours), and finally start pulsing between the 60 mA/cm = and 500 mA/cm- levels. The pulses should have a fast rise time and a period between a few seconds to a few hours long. I use a period of 30 min and a 50% duty cycle.
It is also possible to pulse the current through 0 volts and reverse the current. If this protocol is used, it is important that the Pd never be de-loaded past the beta phase and into the alpha phase. This method may be a somewhat better than the above one. (However, the D.C. bias method is recommended until experience is gained at knowing your loading ratios.) The mechanism is currently unclear. However, cycling of the cathode often seems beneficial. Higher current densities can be reached by decreasing the anode to cathode separation and adding electrolytic agents, such as lithium sulfate, to increase the conductivity.
Imposing a magnetic field on the metal lattice
It should be emphasized that this section (magnetic effects) is only preliminary. It deals with inexplicable, but tantalizing, observations. They are mentioned here only in hopes that others may find them interesting. Again, the reader is cautioned that due to the complexity of the calorimetry, the effect due to magnetic fields may be spurious and certainly needs more work before instrumental errors are ruled out. Basically it appears that a magnetic field seems to alter the heat flux from cells. Due to the complexities of calculating the magnetic field in the region of a paramagnetic material (and surface dendrites), it is hard to characterize. When a cell is
18-8
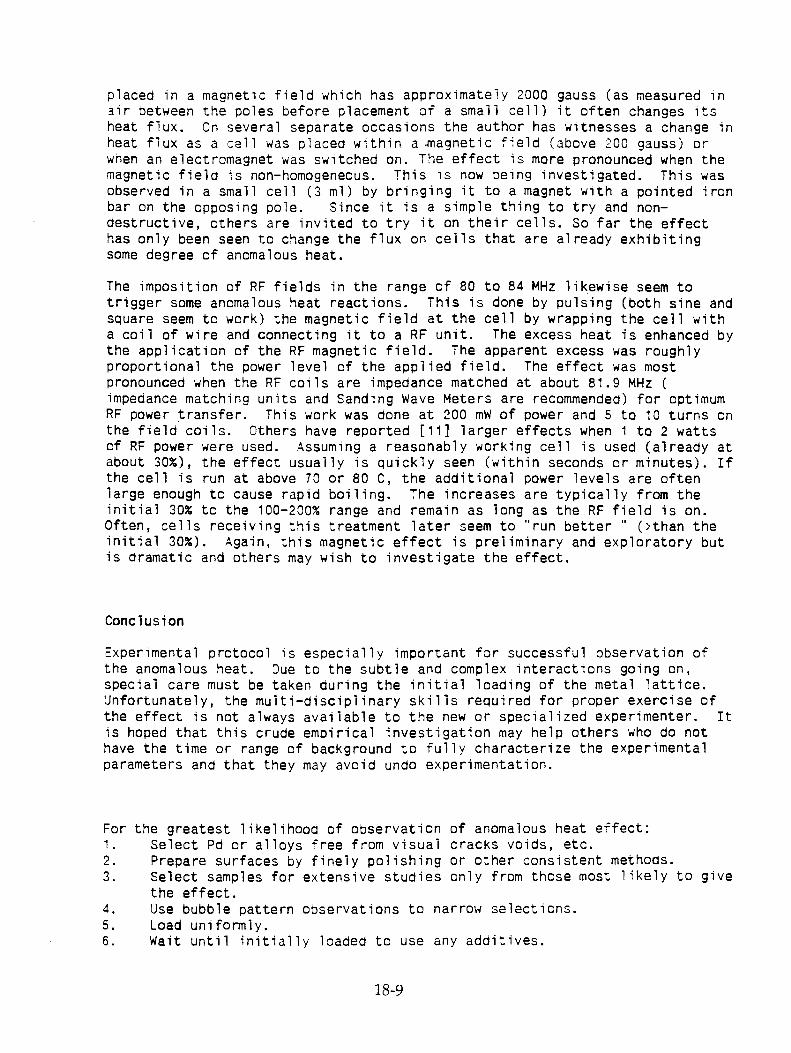
placed in a magnetic field which has approximately 2000 gauss (as measured in air between the poles before placement of a small cell) it often changes its heat flux. On several separate occasions the author has witnesses a change in heat flux as a cell was placed within a4nagnetic field (above 200 gauss) or when an electromagnet was switched on. The effect is more pronounced when the magnetic field is non-homogeneous. This is now being investigated. This was observed in a small cell (3 ml) by bringing it to a magnet with a pointed iron bar on the opposing pole. Since it is a simple thing to try and non- destructive, others are invited to try it on their cells. So far the effect has only been seen to change the flux on cells that are already exhibiting some degree of anomalous heat.
The imposition of RF fields in the range of 80 to 84 MHz likewise seem to trigger some anomalous heat reactions. This is done by pulsing (both sine and square seem to work) the magnetic field at the cell by wrapping the cell with a coil of wire and connecting it to a RF unit. The excess heat is enhanced by the application of the RF magnetic field. The apparent excess was roughly proportional the power level of the applied field. The effect was most pronounced when the RF coils are impedance matched at about 81.9 MHz ( impedance matching units and Sanding Wave Meters are recommended) for optimum RF power transfer. This work was done at 200 mW of power and 5 to 10 turns on the field coils. Others have reported [11] larger effects when 1 to 2 watts of RF power were used. Assuming a reasonably working cell is used (already at about 30%), the effect usually is quickly seen (within seconds or minutes). If the cell is run at above 70 or 80 C, the additional power levels are often large enough to cause rapid boiling. The increases are typically from the initial 30% to the 100-200% range and remain as long as the RF field is on. Often, cells receiving this treatment later seem to "run better " (>than the initial 30%). Again, this magnetic effect is preliminary and exploratory but is dramatic and others may wish to investigate the effect.
Conclusion
Experimental protocol is especially important for successful observation of the anomalous heat. Due to the subtle and complex interactions going on, special care must be taken during the initial loading of the metal lattice. Unfortunately, the multi-disciplinary skills required for proper exercise of the effect is not always available to the new or specialized experimenter. It is hoped that this crude empirical investigation may help others who do not have the time or range of background to fully characterize the experimental parameters and that they may avoid undo experimentation.
For the greatest likelihood of observation of anomalous heat effect: 1. Select Pd or alloys free from visual cracks voids, etc. 2. Prepare surfaces by finely polishing or other consistent methods. 3. Select samples for extensive studies only from those most likely to give
the effect. 4. Use bubble pattern observations to narrow selections. 5. Load uniformly. 6. Wait until initially loaded to use any additives.
18-9

7. Quickly raise current, but only after the initial loading. 8. Work at elevated temperatures for greater efficiencies. =low calorimetry used on reflux condensers is especially recommended for those seeking extended studies on boiling systems. In brief: load cool and slow then run hot and fast.
References
1 M. Fleischmann, S. Pons, and M. Hawkins, J. Electroanal. Chem., 261,(1989),p301.
2 M.C.H. McKubre, S. Crouch-Baker, A.M. Riley, S.I. Smedley and F.L. Tanzella, "Excess Power Observations in Electrochemical Studies of the D/Pd System: the Influence of Loading", Proceedings of ICCF3 (1993),p5, Nagoya Japan.
3 M.C.H. McKubre, at al., The Proceedings of the First Annual Conference on Cold Fusion, March 28-31, 1990, Salt Lake City, USA, p20.
4 G.H. Miley, et al., "Multilayer Thin Film Electrodes for Cold Fusion" Proceeding of the ICCF3 (1993), p 659, Nagoya, Japan.
5 E. Storms, Fusion Technol, 20 (1991),p433.
6 A. Samgin, V. Tsidikovski, and A. Baraboshkin, Proceedings ICCF3 (1993) p39 abstract.
7 S. Pons and M. Fleischmann "Frontiers of Cold Fusion", Proceedings of ICCF3 (1993) p47, Nagoya, Japan.
8 M. Fleischmann, S. Pons, M.W. Anderson, L.J. Li, and M. Hawkins, J. Electroanal. Chem., 287 (1990), p293.
9 R. A. Huggins, "Some Materials Aspects of the Electrocnemicai Insertion of Hydrogen and Deuterium into Metals", to be published in these proceedings, ICCF4, Maui, Hawaii (1993).
10 A. Takahashi, A. Mega, T. Takeuchi, H. Miyamaru and T. Iida; Proceedings of ICCF3 (1993), p79, Nagoya, Japan.
11 J. O'M. Bockris, R. Sundaresan, D. Letts and Z.S. Minevski; "Triggering and structural changes in Cold Fusion Electrodes", to be published in these proceedings, ICCF4, Maui, Hawaii (1993).

Surface - conditions Figure 1 - use a smooth surface
% excess power
rough one side polished one end polished polished
Surface condition
(series 83-86)
Initial Loading Figure 2 - Use a slow initial loading
% excess power
30 60 120 240 480
Current density mA/ sq.cm. run at 600 mA/ 811.0111.
18-11
40 ,,,.:VMA\N..,,.,{.1:.:\A1V. 1 #,§AVEM41 k,g11P411 v .1 One, '.. ‘,,..1;k \ impiO4,\k„. \
ml...‘pl,ii ,. 1 .,.4.,.,,,,:,,, \ ,\‘‘.,4014. ogiAw
\\Tii
gg::;\,,k,,,\B tvi4%
NotgT.F \ 0.44:$,.: i; ,.,:t6::: ..,1....„
wA' ,..:.,4.#;; fore initial load After initial load
(cell series 63-56 adding Al)
25
1 turn 3 turns 5 turns 7 turns 9 turns
Number of turns on anode (Pt wire)
Time of Additives Figure 3 - use additives after loading
% excess Power
Anode Configuration Figure 4 - Use uniform anode spacing
% excess power
(cells 46 -52)

251-
20!--
15i-
101-
51-
0'— 25 32 46 50 60 70
Temperature of bath (degrees C) 113
,-C - A
80
Temperature Figure 5 - Run at - elevated temperatures % excess power
18-13

Power vs. Gurrent Density Figure 7 - run at high currents
% excess power 40;
0 ' 60 120 240 300 424 525 634
Current density mA/ sq.cm. 705

SOME LESSONS FROMOPTICAL EXAMINATION OF THE PFC
Phase-II CALORIMETRIC CURVES
MITCHELL R. SWARTZJET Technology Weston, MA USA 02193
Dr. Mitchell Swartz does not wish to have his papers uploaded to LENR-CANR.org. A copy of thispaper can be found in the original EPRI proceedings, Vol. 2, p. 290:
http://my.epri.com/portal/server.pt?Abstract_id=TR-104188-V2
19-1

APPARATUS FOR SAFELY EXTENDING COLD FUSION INVESTIGATIONS TO HIGH TEMPERATURE, PRESSURE AND INPUT POWER REGIMES
H.E. "Chip" Ransford, III and S.J. Pike
Nova Resources Group, Inc. 1553 Platte St. #301 Denver, Colorado 80202 (303) 433-5582
To assure continued and expanding funding in an increasingly cost-conscious, results-oriented world economy, "cold fusion" needs solid proof of commercial feasibility. Excess heat calculations are of little use in convincing nonscientific skeptics. Heat alone, at low temperatures, does not have the "medium of exchange" value of electrical power. Proof of commercial viability has three critical dimensions which must meet certain minimums:
■ The temperature must reach 175 to 200°C — high enough to allow reasonably efficient (in the range of 15-20%) conversion to mechanical/electrical power.
■ The system power levels must reach at least 5 to 10 kw of thermal output to demonstrate conversion to self power plus provide useful electrical energy for other functions.
■ The system must operate continuously for weeks to months with short lag times to start up or shut down.
To date, world wide, most cold fusion investigations have been attempts to confirm and expand understanding of the Fleischmann-Pons Effect (FPE) at its basic levels. This research to corroborate FPE - with notable exceptions - has three common characteristics:
■ Most FPE experiments have been conducted at or near ambient conditions of temperature and pressure, many in open cells.
■ The experiments have been small in scale with minimal standardization of design.
■ These experiments produced small thermal outputs and low excess energy ratios.
Despite the many technical (and other) obstacles in this field, the research now has clearly revealed these empirical facts:
■ Nuclear reactions can indeed occur in electrolytic systems;
■ The energy released in these reactions occurs primarily as heat;
20-1

■ The major byproduct in palladium-deuterium systems is ordinary helium; [1]
■ Excess energy ratios exceeding 10:1 are possible;
■ The energy density can exceed three kilowatts per cubic centimeter;
■ The reaction rate increases nonlinearly with increasing temperature. [2]
These results hint at the potential power yields from cold fusion. They also show that safety precautions developed for electrochemical research can no longer be considered sufficient for FPE studies. The various accidents and events arising from open cells have led Fleischmann, Pons and others to issue warnings emphasizing the danger of closed systems. [3]
However, if cold fusion is to ever reach its potential, closing and pressurizing the reseach cells is neccessary. This calls for a much greater ability to contain and control cold fusion events. Safety must be the highest priority in the laboratory and thus, in the design and construction of experimental equipment. Good design must allow for radioactive products, high pressures at high temporatures, coolant circulation and the ability to easily maintain experimental protocols.
CONTAINMENT. Cold fusion experiments often produce minor amounts of neutrons and tritium.[3,4] As these reactions are scaled up, this amount will increase, presumably propor-tionally.
Neutrons can be absorbed by the appropriate shielding. Tritium, on the other hand, is a lasting hazard that must be handled, stored and disposed of in carefully regulated ways. This would argue for a thermodynamically closed cell configuration so that any tritium generated would be catalytically recombined with oxygen and returned to the electrolyte. Tritiated water is actually more biologically dangerous than the gas, but easier to contain. All used electrolyte should be treated as low-level radiologically hazardous waste until tested.
HEAT AND PRESSURE EVENTS. A pressurized cell is also necessary if the system is to operate at temperatures greater than 100°C. Closing and pressurizing the cell adds safety risk to laboratory and personnel. In a fixed volume, steam will reach pressures that exceed 200 atmo-spheres as the temperature rises over 375°C. This temperature could quickly be reached in a cell operating at a lower temperature, given the high power density possible and the positive temperature coefficient findings.
The result is the very real possibility of thermal runaway reactions. These appear to have occurred - even in open cells. In closed cells the results are much more drastic -a steam explosion. To avoid this happening, any closed FPE cell must be designed to withstand sudden surges to the critical (maximum) pressure of its electrolyte. At
20-2
minimum, an oversized relief valve must be installed.
Also in closed cell systems, the failure of the catalyst to recombine the gases gen-erated by electrolysis leads to extremely high piessures, higher than the maximum possible from steam but developed over a longer time. This type of overpressure event is best sensed and avoided, however the pressure could be controlled with a safety relief valve. The ignition of the unrecombined hydrogen and oxygen is a possible failure mode — particularly in the electrically active, thermally hot envir-onment of a cold fusion reaction cell. This ignition results in an abrupt release of chemical energy with a pressure pulse rising to 10 times the starting pressure, capable of generating a significant shock wave. The strength requirements of the vessel must be based on the worst case.
COOLING. The closed, high temperature FPE power cell requires a large cooling capacity. [5] A 3kw/cc energy density provides sufficient energy to vaporize that cc of paladium in two minutes. Since cooling occurs most efficiently across thin walls, this conflicts with the need for a thick, strong cell walls.
A prudent cooling system design would provide a modified pool boiling arrange-ment so that the flow rate of coolant past the heat exchange surface of the cathode is convectively driven by the heat flux emanating from the cathode. This should prevent or control thermal runaway reactions. A pressurized reservoir of coolant, gravity-fed to the cell, would allow time for an orderly shutdown in the event of a cooling pump failure.
The above shows a requirement for a relatively large volume of cooling fluid. In general, the more and the milder the coolant, the better. The electrolyte is a poor choice due to its highly corrosive composition, high pressure, potential for tritium contamination and high cost. Therefore, a second fluid is needed in a self-contained, pressurized system separate from the electrolyte. It must circulate through coolant passages in the high pressure chamber, close to the cathode.
There are only a few ways to accomplish this, topologically speaking. One would be with a central hollow palladium cathode lined with silver to prevent hydrogen diffusion. With this design solutimn, the onset of film boiling in the coolant would limit the maximum heat transfer rate. This limits the thickness of the palladium on the coolant tube and thus limits the over-all power density possible with this configuration.
The ETC To avoid these limits, while at the same time maintaining the simple rotationally symmetric electrical field configuration of the original FP experiment, a topological inversion lies at the heart the ETC. An externally silvered palladium ring cathode surrounds a central anode. The outer, silver surface of this cathode ring, which is axially tapered, is in contact with a similarly tapered silver shell for electrical and
20-3
thermal conductive energy transfer. In this way, the heat exchange surface can increase in area outward from the source of heat.
The Electrolytic Thermal Cell' (ETC) reflects the goal of assured safe operation at temperatures to 350°C, pressures to 3,500 psi (250 atm) and electrolysis input powers up to 1 kw. It has a continuous cooling capacity of 20 kw with a peak capacity of 100 kjoules/second for 30 seconds. Layering of progressively redundant safety systems assures graceful failure modes to extreme conditions.
The core of the ETC is a high pressure chamber of stainless steel, 13cm outside dia-meter by 4.5cm bore. At its top, it incorporates high-capacity, fail-safe pressure relief plus instrumentation feed-throughs. It holds a structurally-embedded cast-silver thermal dissipator in its lower section. The finned dissipator is immersed in and tightly coupled to the calorimeter (boiler) section, which has an integrated, pres-surized coolant (working fluid) reservoir. The cooling fins are thick enough at their roots to allow temperature and vibration sensors to be embedded nearly in contact with the cathode. Surrounding and bracing the fins is a heavy stainless ring which carries three internal electrical heating elements. The heaters can bring the reaction chamber to operating temperature or can calibrate the calorimeter up to 20kw.
A coolant such as water, liquid nitrogen or a fluorocarbon like trifluoroethanol (CF3CH2OH-1-120) is thermosiphoned from the reservoir past the thermal dissipator, where boiling occurs. The resulting vapor carries entrained, hot droplets that are centrifugally removed and returned to the boiler. After a secondary demisting stage, the saturated hot vapor exits the ETC to pass through flow measurement or energy conversion devices and into condensing coils. Recondensed coolant, approximately 2 litres/ minute at maximum power, is pumped back into the boiler reservoir, when called for by level sensors. The boiler working pressure can be as high as 750 psi (50 atm). Controlling this pressure at the boiler outlet sets the operating temperature of the cathode.
Containment vessels thermally isolate the experiment while protecting the exper-imenter and laboratory from overpressure events. The 55cm diameter outer con-tainment vessel encloses the entire calorimeter, electrolysis chamber and inner con-tainment vessel. The inner containment vessel, 30cm diameter, encloses only the upper portion of the high-pressure chamber. It is designed to receive the blow-off from the high-pressure relief and has 40 times the volume of the electrolytic cell.
Normally at a rough vacuum, both containment vessels automatically vent and reseal when their pressures rise past a threshold. Both are double walled, high-vacuum insulated, heavy gauge cold-formed stainless steel - as are the calorimeter (boiler/-reservoir) walls. Gaskets, spacers, washers, bolts and nuts are also stainless. The total heat loss rate is estimated at a maximum of 150 watts at 250°C.
The annular space between the inner components and the outer vessel, evacuated during operation, can also hold a 5cm thick shell of neutron moderation materials,
20-4
with absorptive additives. The insulating walls of the outer containment vessel can be filled with a proportional counting gas and strung with beaded wires to allow neutron detection by silver activation over a hemisphere approximately centered on the cell.
Access to the electrolysis chamber is made through 10cm diameter ports at the top of the outer and inner containment vessels. These ports also hold feedthroughs for instrumentation. Electrolysis power is supplied through a fail-safe connector within the bottommost port. Contact in the high current connector (100 Amp continuous, 2,000 Amp surge) is mechanically established by a collapsing stainless bellows only when rough vacuum is attained within the ETC evacuation region. If overpressure or leakage causes loss of vacuum above a threshold level, a pilot valve causes the safety switch bellows to extend, shutting down the main electrolysis current. An auxiliary contact is closed as the main opens, allowing a trickle charge to hold the hydrogen in the cathode or a reverse charge to flush it out.
The anode conductor, a 0.5cm diameter silver rod, 25cm long, insulated with teflon and ceramic, centered inside a one centimeter diameter silver tube brings cur-rent to the cell. Heat which would be lost via and within the coaxial power conductor is largely absorbed by the incoming coolant flow and thus kept inside the calorimeter. This coaxial design also permits sub-microsecond pulse rise times of the input power.
The power conductor is a part of the removable electrochemical cartridge. The rod does double duty by transmitting rotary motion to the high-pressure cell. Threads convert this to non-rotating vertical movement of the tapered platinum mesh anode. The electrodes can be brought into contact in order to center the anode and also to make reference measurements. The spacing between the anode and cathode can be adjusted with a servomotor driving the external shaft. The gear reduction and threads combine to move the anode a calculated 0.55 micron per degree of actuator shaft rotation. It is thought that minimizing the electrode spacing via a feedback system could have beneficial effects on performance.
All active electrochemical components (i.e. electrolyte, cathode, anode, reference electrode and recombiners) are contained in sealed silver-shelled cartridges which have an internal volume of 125cc and use 10 to 12cc of electrolyte. The electro-chemical cartridges can be inserted or removed via the top access ports of the ETC containment vessels. The interchangeable cartridges reduce experiment turnaround and cell maintenance time. Low current precharging of multiple cartridges outside the ETC can be readily accomplished. The cartridges remain sealed during exchange to prevent pre- and post-experiment material contamination and/or loss of electro-lyte. A simple aluminum or plastic form is provided to mold a silicone rubber seal around the cathode ring after it is placed in the silver shell of the cartridge being assembled. This operation can be performed bv NRG if desired. Custom cathodes can be supplied as well, with ring dimensions, alloys and metallurgical treatments to specifications. NRG will also provide complete post-experiment analysis services and cartridge shipping containers.
20-5

In order to certify that the Electrolytic Thermal Cell is safe within its operational ratings, manufacturing will be done in batches. All materials in each batch will be traceable. Each unit will receive thorough inspections and certain non-destructive testing. Samples selected from the manufacturing run will be subjected to a battery of tests, including the testing to destruction of a few units. Very much depends on attention to details. We must be confident before units are shipped to other research-ers, and before we begin our own high-power experiments.
The ETC is designed for versatility. For example, following preloading of the cathode through electrolysis, the cell may be evacuated and high voltage glow dis-charge experiments initiated. The ETC is made entirely of magnetically transparent materials which facilitates experiments involving external fields. It should be noted that the ETC is not only a calorimeter, but it is also a pressurized power reactor. Development of compatible Rankine cycle conversion equipment progresses.
[1]. M.H. Miles and B.F Bush in ICCF4 Proceedings (1994) (based on abstract). [2]. E. Storms in ICCF4 Proceedings (1994) (based on abstract). [3]. M. Fleischmann, S. Pons and M. Hawkins. J.Electroanal Chem.,261 (1989)301. [4]. For more references see review by E. Storms, Fusion Technol., 20 (1991)433. [5]. J. Waisman and N. Kertamus in ICCF4 Proceedings (1994) (based on abstract).
20-6
LINEAR, HIGH PRECISION, REDUNDANT CALORIMETER
Steven C. Barrowes Haven E. Bergeson Physics Department University of Utah
Salt Lake City, Utah 84112
Abstract
Criticisms of the calorimetry have often provided the basis for challenges to reports of observations of excess heat in metal hydride and metal deuteride systems. This report describes calorimeters which are immune to most such challenges. In this paper, the design objectives are elucidated, the design features of the calorimeter are modeled, the calibration results are shown, and data from the operation of control cells are given.
Introduction
Claims of excess heat from "cold fusion," i.e. heat beyond the limits obtainable by chemical or mechanical processes, have frequently been challenged because of purported calorimetry problems. Open cell calorimetry has been challenged with special severity: some systems have changing calorimetric "constants"; others left open questions about whether all of these gases were removed as assumed, i.e. with no recombination. In addition, due to a significant amount of the heat being transferred by radiation and convection, the calibration curves are often far from linear, requiring extensive modeling and analysis to interpret the results of live runs.
To solve these problems, we are running closed electrolytic cells (using an internal recombiner) inside calorimeters having the following characteristics: (1) high precision from 200 mW to 20 W of power; (2) linear output for ease of interpretation; (3) redundancy in the heat measurement; (4) long term stability; (5) independence of the heat source position within a cell; (6) a reasonably short time constant, allowing the structure of heat bursts to be seen.
The basic design includes inner and outer shells of Al or Cu, connected by a large number of thermoelectric modules (TEMs) wired in series. Utilizing the Peltier effect, these modules produce an output voltage proportional to a temperature difference across their faces; the temperature difference is, in turn, proportional to the heat flow through the modules. Arranged so that nearly all of the heat flows through TEMs with output terminals wired in series, the calorimeter gives a response very nearly proportional to the net heat flow through the calorimeter. (In the ideal case, none of the heat would flow by radiation or convection, causing the response to be as linear as the TEMs or Peltier elements themselves.)
21-1
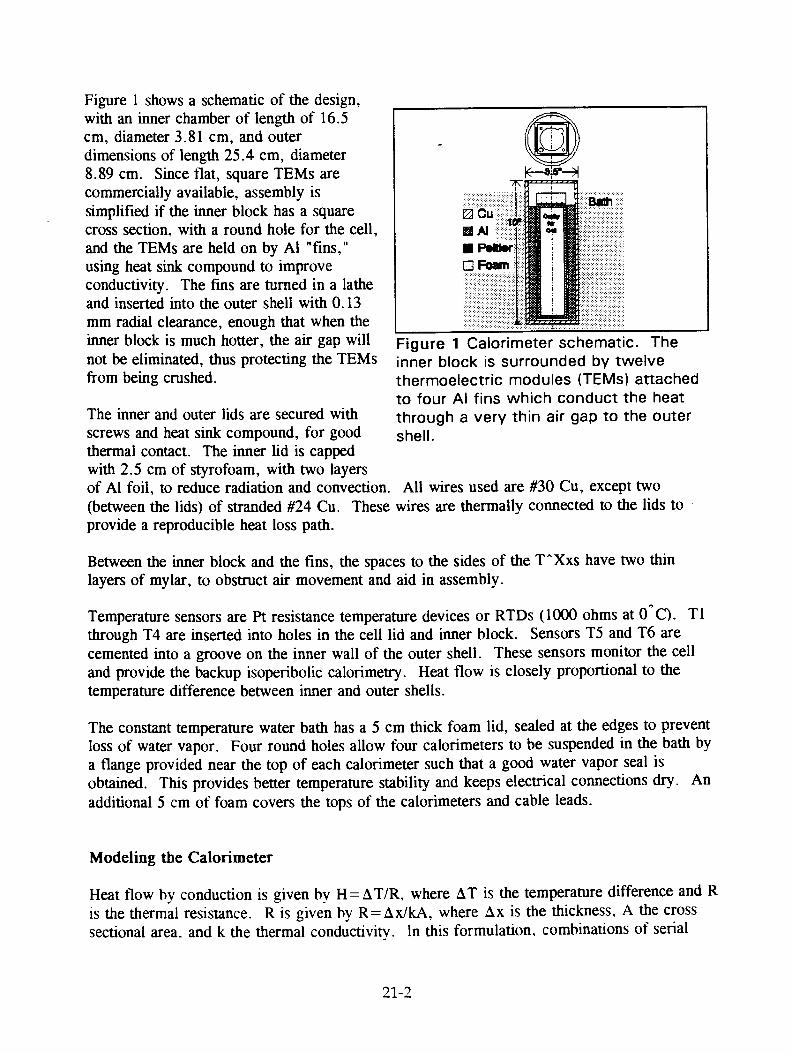
Figure 1 Calorimeter schematic. The inner block is surrounded by twelve thermoelectric modules (TEMs) attached to four Al fins which conduct the heat through a very thin air gap to the outer shell.
Figure 1 shows a schematic of the design, with an inner chamber of length of 16.5 cm, diameter 3.81 cm, and outer dimensions of length 25.4 cm, diameter 8.89 cm. Since flat, square TEMs are commercially available, assembly is simplified if the inner block has a square cross section, with a round hole for the cell, and the TEMs are held on by Al "fins," using heat sink compound to improve conductivity. The fins are turned in a lathe and inserted into the outer shell with 0.13 mm radial clearance, enough that when the inner block is much hotter, the air gap will not be eliminated, thus protecting the TEMs from being crushed.
The inner and outer lids are secured with screws and heat sink compound, for good thermal contact. The inner lid is capped with 2.5 cm of styrofoam, with two layers of Al foil, to reduce radiation and convection. All wires used are #30 Cu, except two (between the lids) of stranded #24 Cu. These wires are thermally connected to the lids to provide a reproducible heat loss path.
Between the inner block and the fins, the spaces to the sides of the T'Axs have two thin layers of mylar, to obstruct air movement and aid in assembly.
Temperature sensors are Pt resistance temperature devices or RTDs (1000 ohms at 0 C). T1 through T4 are inserted into holes in the cell lid and inner block. Sensors T5 and T6 are cemented into a groove on the inner wall of the outer shell. These sensors monitor the cell and provide the backup isoperibolic calorimetry. Heat flow is closely proportional to the temperature difference between inner and outer shells.
The constant temperature water bath has a 5 cm thick foam lid, sealed at the edges to prevent loss of water vapor. Four round holes allow four calorimeters to be suspended in the bath by a flange provided near the top of each calorimeter such that a good water vapor seal is obtained. This provides better temperature stability and keeps electrical connections dry. An additional 5 cm of foam covers the tops of the calorimeters and cable leads.
Modeling the Calorimeter
Heat flow by conduction is given by H=AT/R, where AT is the temperature difference and R is the thermal resistance. R is given by R= x/kA, where x is the thickness, A the cross sectional area. and k the thermal conductivity. In this formulation, combinations of serial
21-2

Figure 2 Thermal resistance network. Heat from the cell (or, alternatively, from the inner block) travels primarily through the TEM path, then through the fins and air gap to the outer shell which is at bath temperature.
and parallel heat paths may be treated like combinations of electrical resistors in series and parallel.
Where radiation and/or convection contribute a small part, these can also be formulated as parallel thermal resistances. Radiative heat flow is H=aaA(T 24 - T1 4) = 4aaAT3 AT, giving R=1/4aaAV, where a = 5.672 x 10' W/m2K4 , and a = 0.1 for aluminum. Convective losses can be treated with R=1/AbAT 4 , where b=2.49 W/m 21C5I4 for the top of the warm lid, b=1.77 W/m2K514 for a wall surface, and b=1.31 W/m2K514 for a bottom surface.
Using these expressions, the thermal resistances of the various areas can be calculated, using AT=6 C (approximately true for 20 watts), and T=63 ° C=336K.
The thermal resistance across the inner Al block to the TEMs is a negligible R 0.003 K/W, using Ax = 1.5 cm, A = 250 cm2 , and k = 205 W/mK. Across the outer Cu block the resistance is smaller still. Thus each block is at a uniform temperature, T 1 (inner block) or T2 (bath).
The main heat path is expected to be through the TEMs. A measured value for one module (Melcor type CP-1.4-127-045L-2) is 2.78 1C/W. The heat sink compound has k=0.215 W/mK, A=16 cm 2 , Ax=2.5 x 10' cm (including both layers), giving R = 0.073 K/W. The total resistance for a TEM plus the compound, divided by 12, gives the resistance through the TEM path as RTEM 0.238 K/W.
The areas at the sides of the TEMs gives a parallel resistance Rs , as indicated in Fig. 2. With A ---- 156 cm 2 , Ax = 0.33 cm, and k = 0.03 W/mK, this air conduction gives R = 8.6 K/W. Convection is broken into three parts by the two layers of mylar. If each has 0T/3 temperature difference and two walls, the convective resistance is 217 K/W. Radiative resistance (assuming mylar is transparent to IR) is 74.5 K/W. Another side path is through the screws. These are stainless steel with a nylon washer to prevent metal-to-metal contact (and two Belville washers, which provide spring action to prevent crushing of the TEMs). The resistance through the 32 screws and washers is estimated to be 5.1 K/W. Combining these four resistances gives Rs =3.05 1C/W.
Using circuit theory, one sees that of the heat passing through the fins and air to the outer shell, 7.3% passes around the sides of the TEMs.
21-3

The resistance through the fins (using Ax = 0.8 cm, A = 361 cm 2 ) is 0.001 IC/W, and conduction through the air gap (Ax = 0.013 cm, A = 370 cm2 ) is 0.140 K/W.
Heat paths directly from inner to outer shells include: wire leads, lid losses, base losses and corner losses. These four in parallel constitute RD. Three of these include radiation and convection losses. Resistance through the wires (two #24, five #30, all 10 cm long) is 391 K/W. The equivalent resistance of the lid, base, and corners is 29.6 IC/W, giving RD = 25.8 K/W.
Combining all resistances, the total equivalent resistance is R ea, = 0.36 IC/W. Of the total heat flow, 91% flows through the TEMs. Radiative paths carry 0.51% of the heat and convective paths 0.46%, such that only 0.97% is non-conductive. Non-linearities should thus be less than 1 %, especially at less than 20 W power. At 20 W, AT should be AT = RH = 7.2" C, near the 6K assumed for the calculations.
The time constant is given by T = (E mc)R, where E me is the sum of mass times heat capacity, assuming the thermal mass is all in the inner block. The thermal capacity of the cell plus the inner block is 995 J/K, which with the total resistance R ea, = 0.36 K/W gives a reasonably short time constant of T ="-- 6.0 minutes.
According to the above calculations, does this calorimeter meet all the criteria in the introduction?
The precision will depend on measurement electronics and on the effect of variations in room temperature. Certainly the output should be acceptably close to linear.
The backup system uses RTDs calibrated by the supplier to +0.1 ° C, but capable of in-situ calibration to +0.01 C or better. If 20 W gives AT = 7.2 K, an error of +0.01 C is equivalent to about ±30 mW. This will be compared with actual performance, but should provide acceptable redundancy for thermal power measurements. In addition the inner and outer temperatures have at least two RTDs each, guarding against failure of a single component.
The components used are expected to have long-term stability, as would any closed cell operating normally. Position of the heat source in the calorimeter should not change the output significantly. This will be tested with two separate calibrations. Finally, the time constant is short compared with many of the heat bursts reported by others.
Calibration
The behavior of the calorimeter can be modelled accurately with the equation
(1) P = rn, Co + m2 Co (T - Te) + b, +b2 (T-TL )
where m,, m2 , b 1 , and h2 are calibration constants, C o is the output voltage of the calorimeter, T is the bath temperature, T, is an arbitrary fixed bath temperature (60 ° C in this work), and
21-4

Tr, is the laboratory temperature. The first term, m, C O , which represents the linear output of the TEMs dominates, while the other terms represent small corrections. The second term represents a possible tiny temperature dependence of the TEMs plus other unknown effects. The last two terms represent small amounts of heat flow from the bath to the laboratory through the TEMs; the entire bath-calorimeter system is well insulated with the result that these terms are small, but they are dependent on the position of the calorimeter within the bath.
The calorimeters were calibrated with resistance heaters placed in two different positions: the first is in a metal cell placed in the cell cavity; the second is in a hole in the inner calorimeter block. The power input varied between 49 mW and 20 W, while bath temperatures varied between 40° C and 75 ° C. Measurements were begun 90 minutes after each power and bath temperature setting. Every five minutes, the average value of 10,000 measurements of C o
was recorded for each calorimeter.
The parameters in equation (1) were fit to the data taken with a heater inside a metal cell. The results are:
Parameter Calorimeter #1 Calorimeter #1 Calorimeter #1 Calorimeter #1 m, 14.237 14.434 14.323 14.638 M2 -0.00363 -0.00581 -0.00927 -0.0125 b, b2
0.0239 -0.00026
0.0139 -0.00013
-0.0007 0.00019
-0.0103 0.00046
When these parameters (taken with heaters in metal cells) were used to calculate the heat flow from resisters in the inner calorimeter block, the calculations differed with the measured power input by a standard deviation of only 1.6 mW averaged over the four cells. With such a difference between the calibration heater position and the heater position of these measurements, the agreement suggests both a high degree of precision of the heat measurement and of position independence for the heat source. (In actual use, the heat source will always be positioned inside a metal cell.) The graph at right shows calibration and comparison data over an extended power input range for one calorimeter. The graphs on the next two pages show similar data for a more restricted power input range for all four calorimeters; the restricted range makes it easier to distinguish the data from the two heat source positions.
21-5

21-6

21-7
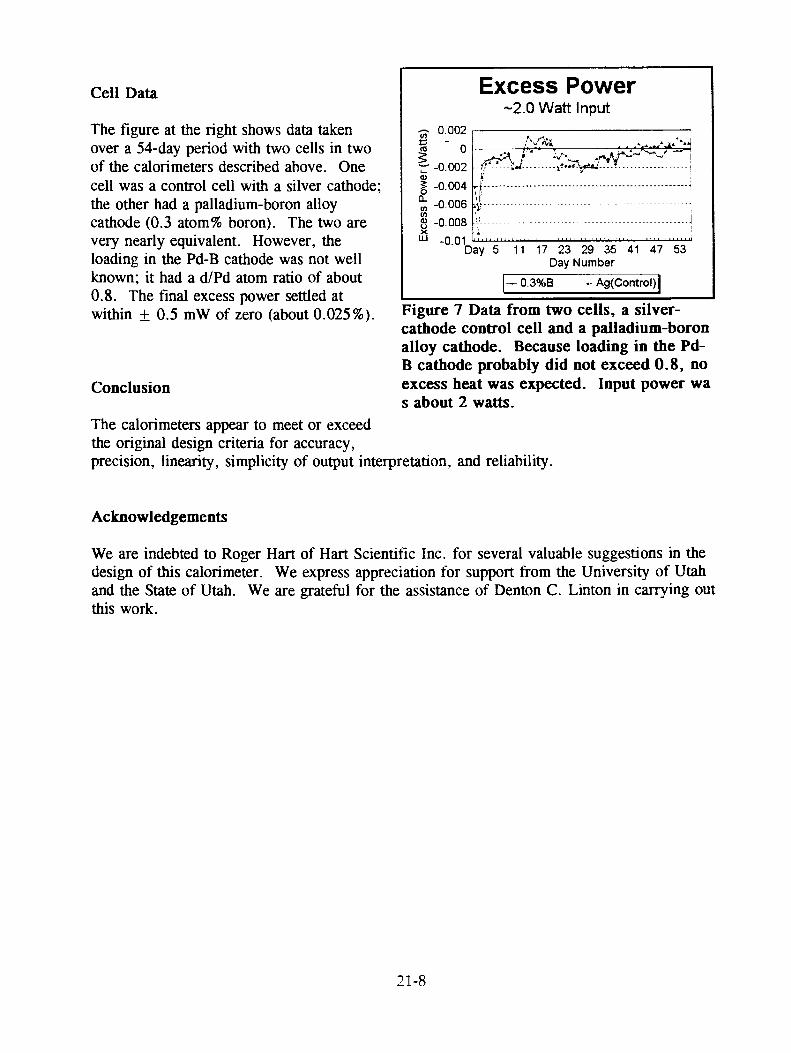
Cell Data
The figure at the right shows data taken over a 54-day period with two cells in two of the calorimeters described above. One cell was a control cell with a silver cathode; the other had a palladium-boron alloy cathode (0.3 atom% boron). The two are very nearly equivalent. However, the loading in the Pd-B cathode was not well known; it had a d/Pd atom ratio of about 0.8. The final excess power settled at within ± 0.5 mW of zero (about 0.025%).
Conclusion
Figure 7 Data from two cells, a silver-cathode control cell and a palladium-boron alloy cathode. Because loading in the Pd-B cathode probably did not exceed 0.8, no excess heat was expected. Input power wa s about 2 watts.
The calorimeters appear to meet or exceed the original design criteria for accuracy, precision, linearity, simplicity of output interpretation, and reliability.
Acknowledgements
We are indebted to Roger Hart of Hart Scientific Inc. for several valuable suggestions in the design of this calorimeter. We express appreciation for support from the University of Utah and the State of Utah. We are grateful for the assistance of Denton C. Linton in carrying out this work.
21-8

A HOME COLD FUSION EXPERIMENT Mark Hugo, 5395 Shady Hills Circle, Excelsior, MN 55331
Work on the Pons and Fleischmann effect has been in progress at the Hugo Home Fusion lab for slightly over 3 years. Work has progressed from simple experiments using converted infant feeding bottles as the basis for early cells, and Radio Shack thermometry for delta-T calorimetry, to the current set up illustrated in the photos.
Currently the Hugo home lab uses a 16 channel A/D data gathering board attached to a 386 PC with Lab Tech Notebook (TM) for data processing. A Milton/Roy Metronics Chemical metering pump is used to provide constant flow to the calorimetry device. This equipment works in conjunction with an old German made constant temperature bath, a Coleman "Koolatron" device to sub-cool the circulating water prior to going into the constant temperature bath, which precedes the copper coils in the calorimeter. A standard Honeywell process temperature controller controls the temperature in the constant temperature bath to +/-.5 degrees C.
The cold fusion cell show in the illustration was fabricated by the U. of Minnesota glassware department (for about $250). The catalysts used in the cell and attached outside the cell (but with in the boundary of the calorimeter) are a Los Alamos type Pt surfaced graphite cloth and a HydroCat (TM) commercial battery recombination catalyst.
The CF Cell is placed in a commercially available "drink cooler" which has 20 feet of 1/8 inch dia. copper tubing wound inside of it. The copper tubing enters the calorimeter volume though 5" thick additional foam insulation at the top of the cooler. The input and output from the "calorimeter" are directed through a "Droege Device" which is a hyper sensitive and stable differential temperature device based on the Peltier effect.
The cell design incorporates a uniaue "dual sided" charging situation where a 1 cm. :ona, .3mm thick. 3mm dia Pd cylinder has a 1 cm raaius Pt anoae on the outside and a
mm cia Pt anode on the inside. This allows independent charaing on either side of the Pd caznoae. Approximately 1 M LiOD was used as tne electrolyte.
The standard protocol for cnaraina is to charge 1 day with 80 mA/CmA2 forward cnaraina (i.e. Pd cathodic), on one side and 30-50mINCm^2 anoaic on the other side of the Pd. After this initial "flushing' of the Pd sample. a standard 40-80mA/Cm ^2 is used on bcth sides of the Pd. Cathodic. This is maintained fcr 2 days or more. From this point a steeped ramping to 500mA/Cm^2 can be performed and typically excess heat is =served within a day after coming up to high current density.

This report presents processed data from two runs. The data was averaged and tabulated with a spread-sheet program. The summary tables contain 10 mega-byte of processed data. Two runs out of several were chosen. One run was interesting because after a short attempt to deload the cathode with reverse current, the Pd cylinder "shattered". This gave an opportunity to obtain an "automatic" calibration run at the end of the excess heat run. (This work done in June '93).
The other run, completed shortly before the 4th Annual Cold Fusion Conf., demonstrated that apparently the excess heat effect can be maintained (once initiated) even when reverse charging is used on one side of a two sided specimen. The reverse charging on the one side of the Pd cylinder was kept at a constant current density below that of the cathodic side and some enhancement of the effect was noted.
The original title of the Poster session given at the Maui Conf. was, "Is it real, or is it the CF Hex?" (A take off on the "is it real or is it Memorex (TM)" advertisement. Since that title was turned in the author has resolved what was the primary cause of his concern as to the reality of the "excess heat" effect. As can be seen from the June run's data, there is evidence that the baseline output from the calorimetry is 36mV per watt. (With a plus or minus 4% error band). By the time the November run was made some changes had been made to the system, and the new calibration number was 38mV per watt. This number was obtained two ways, first by light water electrolysis between Pt/Pd and by electrolysis between two Pt electrodes With heavy water.
There was a difficulty, however, in that a calibration resistor placed in the calorimeter, touching the cooling coils yielded 50mV per watt. This gave the author great doubts about the validity of the "excess heat" results. However, after discussions with other members of the "home Cold Fusion" community, the author was enjoined to try a more accurate model of the CF cell heat source. This was accomplished by putting the calibration resistor in a glass jar (with an open top, not quite exactly like the CF cell) in the middle of the calorimeter, as the CF cell was run. The resistance calibration was stabilized and run over the long Thanksgiving weekend of '93. The result was 39mV/Watt over the range of interest. This calibration test leads the author to believe that the both the June and November results were real, along with several other runs not reported.
One last item of significance. The Pd cylinders used by the author were obtained from a Milton Roy high purity hydrogen generator. As such is supposed to be a 10% Beta Phase Ag/Pd alloy. It also has a proprietary surface treatment to enhance hydrogen transport into and through the cylinder(s).
22-2
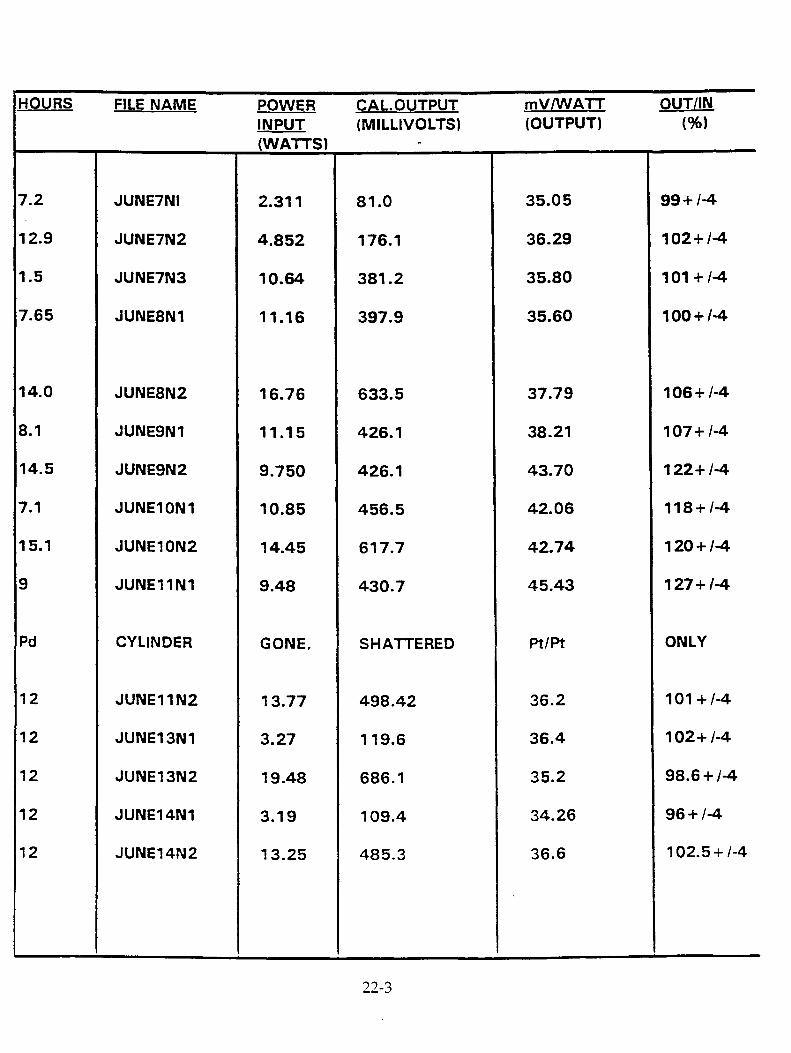
HOURS FILE NAME POWER INPUT (WATTS)
CAL.OUTPUT (MILLIVOLTS)
-
mV/WATT (OUTPUT)
OUT IN (%)
7.2 JUNE7NI 2.311 81.0 35.05 99 +1-4
12.9 JUNE7N2 4.852 176.1 36.29 102+l-4
1.5 JUNE7N3 10.64 381.2 35.80 101 + 1-4
7.65 JUNE8N1 11.16 397.9 35.60 100 + /-4
14.0 JUNE8N2 16.76 633.5 37.79 106 + /-4
8.1 JUNE9N1 11.15 426.1 38.21 107+/-4
14.5 JUNE9N2 9.750 426.1 43.70 122+ /-4
7.1 JUNE1ON1 10.85 456.5 42.06 118 + /-4
15.1 JUNE1ON2 14.45 617.7 42.74 120 + /-4
9 JUNE11N1 9.48 430.7 45.43 127 + /-4
Pd CYLINDER GONE, SHATTERED Pt/Pt ONLY
12 JUNE11N2 13.77 498.42 36.2 101 + /-4
12 JUNE13N1 3.27 119.6 36.4 102+ /-4
12 JUNE13N2 19.48 686.1 35.2 98.6 + /-4
12 JUNE14N1 3.19 109.4 34.26 96+1-4
12 JUNE14N2 13.25 485.3 36.6 102.5 + /-4

11.0
11.0
11.0
10.9
10.2
11.2
532
510
526
546
512
512
512
OF THE PD CYLINDER
8.97
17.58
18.68
14.0
14.6
13
14.7
14.75
420
617
756
660
668
580
700
663
HOURS FILE NAME POWER CAL.OUTPUT mV/WATT OUT/IN INPUT (MILLIVOLTS) (OUTPUT) (%) (WATTS)
12
12
12
12
10
12
2
6
6
6
6
12
12
12
12
NOV20N1
NOV22N2
NOV23N1
NOV23N2
NOV24N1
NOV24N3
NOV24N3
NEG ON INSIDE
NOV25N1
NOV25N2
NOV25N3
NOV25N4
NOV26N1
NOV26N2
NOV27N1
NOV27N2
48.1
46.4
47.8
49.6
47
46.5
45.7
46.8
49.0
48.3
47.1
45.6
44.6
47.5
45.0
127+ /-4
123+ /-4
126+/-4
129+ /-4
126+/-4
123+ /-4
121+1-4
123+ /-4
126+/-4
125+/-4
126+ /-4
124+ /-4
118+ /-4
126+ /-4
119+/-4

AUDIO FREQUENCY DRIUFP/A1131' AND MONI WRING SCOPE FOR 1111:1 111ASONIC
ATTEMPT
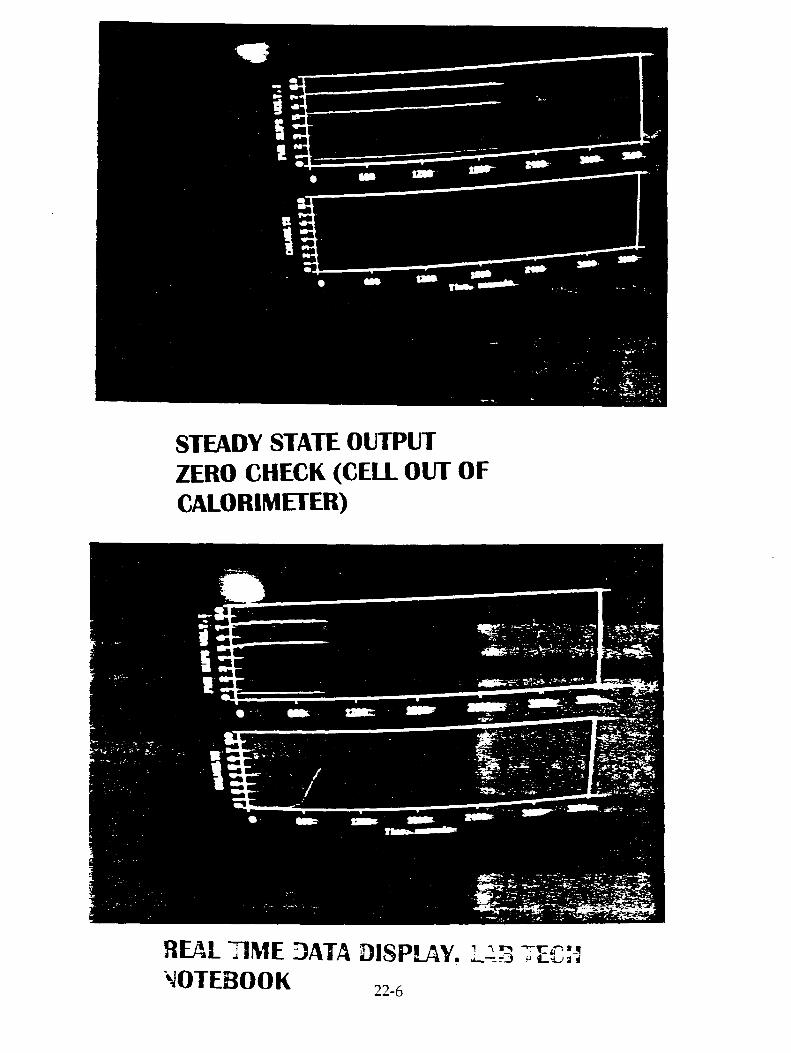
STEADY STATE OUTPUT ZERO CHECK (CELL OUT OF CALORIMETER)

61111111111,1111111111111VIIIIMMONIVII --_-1111111111111 ■1111/111111/111,111111/1/11/11111/1111 .='- :.,-_,111111111111/111111111111.111111111/411111111RIM
• aseriromanwsossisiur--
2ND POWER SUPPLY AND A/D MULTIPIEUNG 30A:10


;.4n, am= • ,
E NSF
MI TON ROY
LIQUID METRONICS CHEMICAL METERING PUMP (CONSTANT FLOW)
PA Mk I

CLOSE UPS OF E.LECTE't:P>F_
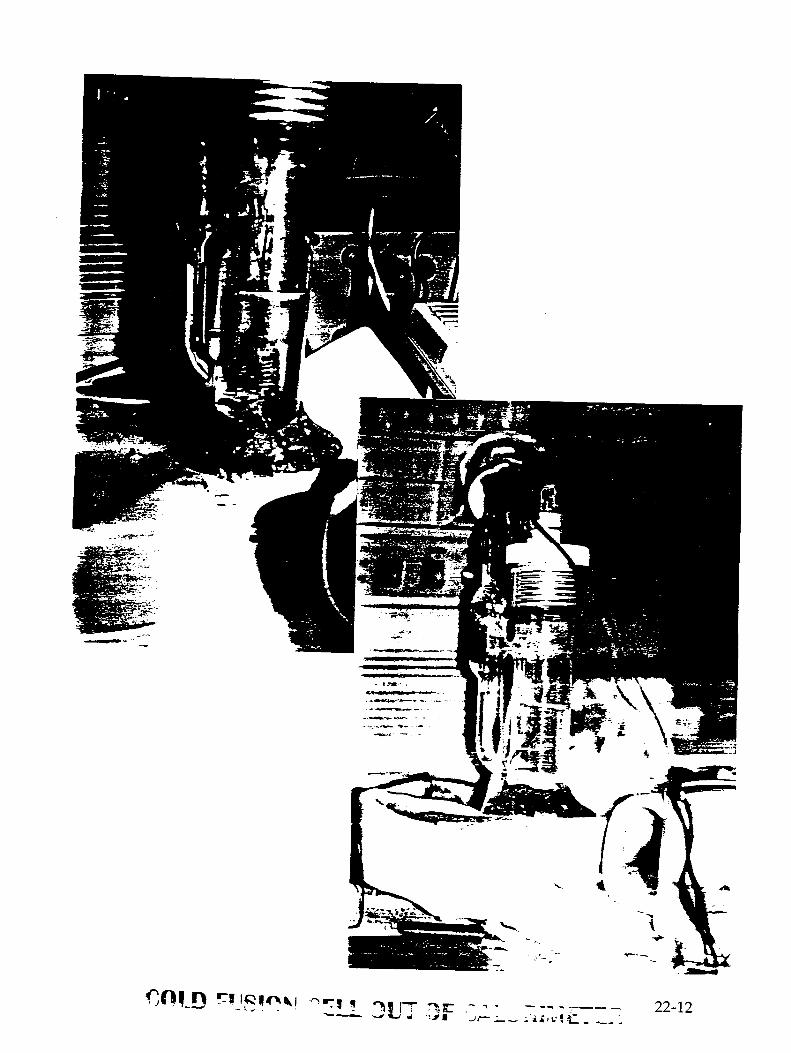
S
Ot_D

386 DATA GATHERING PC AND ONE OF TWO DC POWER SUPPUES
INSIDE .13F FLOW CALORIMETER (Conner ir z/ on aro CI Ili A 1-1 C t 22-13


Study of Concentrations of Helium and Tritium in
Electrolytic Cells with Excess Heat Generations
T.Aoki, Y.Kurata, H.Ebihara,
Isotope Center, University of Tsukuba, Tsukuba-shi,
Ibaraki 305, Japan.
N.Yoshikawa.
Institute of Nuclear Study, University of Tokyo,
Tanashi-shi, Tokyo 188, Japan
ABSTRACT
Concentrations of helium and tritium in gas and liquid
phases in calorimetric cells with excess heat generations were
measured. Values of factor F(nuclear ash) defined as ratio of
amount of heat released by particular nuclear reactions to the
excess heat, were calculated to be F(He in gas phase)=-_-(4±16)x10 -3
and F(T in liquid phase) (8±6)x10 -", and upper limit of F(T in
gas phase) 5 1x10⁶ . These extremely small values suggested
either that (1)the nuclear reactions might occur in deep inside
of the Pd cathode, or (2)the major amount of the detected excess
heat could not match with the heat expected from the nuclear
reactions if the reactions occurred on the surface of Pd
cathodes.
1. INTRODUCTION
It is well known that excess heat generations are found in
many calorimetries of Pd/D 20 systems". Searches for nuclear
reaction products (proton, neutron, gamma-ray,Tritium, Helium,
etc.) have been started by many groups' -" considering in minds
that the amounts of the excess heat can not be explained by the
chemical reactions but by the nuclear reactions. However,
origins of the excess heat generations are still in dispute. It
is interesting to keep searching for the nuclear products of
helium and tritium in gas and liquid phases of the calorimetric
23-1
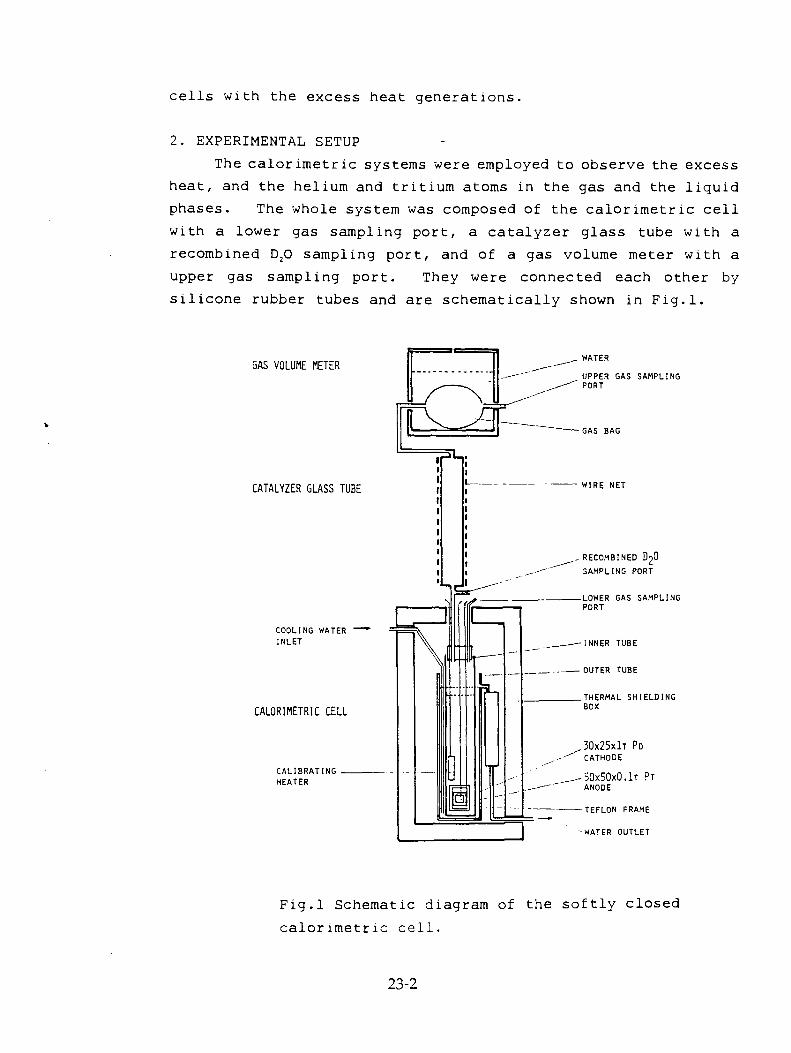
GAS VOLUME METER WATER
UPPER GAS SAMPLING PORT
GAS BAG
CATALYZER GLASS TUBE WIRE NET
-RECOMBINED D20 SAMPLING PORT
LOWER GAS SAMPLING PORT
COOLING WATER INLET __---INNER TUBE
-- ----OUTER TUBE
THERMAL SHIELDING
CALORIMETRIC CELL BOX
CALIBRATING HEATER
30x25x1T PD -CATHODE
50X50X0.17 PT ANODE
TEFLON FRAME
WATER OUTLET
cells with the excess heat generations.
2. EXPERIMENTAL SETUP
The calorimetric systems were employed to observe the excess
heat, and the helium and tritium atoms in the gas and the liquid
phases. The whole system was composed of the calorimetric cell
with a lower gas sampling port, a catalyzer glass tube with a
recombined D20 sampling port, and of a gas volume meter with a
upper gas sampling port. They were connected each other by
silicone rubber tubes and are schematically shown in Fig.l.
Fig.1 Schematic diagram of the softly closed
calorimetric cell.
23-2

The calorimetric cell itself was composed of an inner tube,
an outer tube and a thermal shielding box. A cathode of 30x25x1t
Pd sheet (Tanaka Kikinzoku Corp.) was sandwiched between two
50x50x0.1t Pt anodes. Both the cathode and the anodes were
supported by a 10 mm teflon frame. A calibrating heater, the
lower gas sampling port, a gas guiding tube and electrolytic
solution were put in the inner tube together with the cathode and
anodes. Electrolytes were 0.1M LiOD heavy water solution or 0.1M
LiOH light water solution. The inner tube was shielded by a
plastic stopper with a gas guiding tube. The inner tube was
settled in the outer tube. Running water was introduced to the
outer tube at constant flow rate so as to cool down the inner
tube. Two thermocouples were put at an inlet and an outlet of
the coolant for the calorimetry, which was monitored by a
personal computer. The outer tube was hold in a thermal
shielding box with heat insulating materials. The catalyzer
glass tube contained platinum black powders and was wrapped in
a wire net for safety. The gas volume meter was a plastic water
container in which a gas bag was immersed. The gas volume was
determined by measuring the water level.
3. CALORIMETRY
Calorimetry was made by observing differences between
temperatures of coolant at the inlet and the outlet. Rise of the
coolant temperature due to Joule power generations in the inner
tube was calibrated by the heater. A typical calibration curve
is shown in Fig.2 with an estimated error of less than ±0.5 W.
Excess heat was was calculated by subtracting net input Joule
power, (Eci11-Ediss)xI, from observed amount of heat determined by
the calibration curve, where E.. 0 was measured cell potential,
was dissociation potential (1.48 V and 1.54 V for the light water
and the heavy water, respectively) and I was the cell current.
Two experiments for Pd/H 2O systems (Run 3AA7, 3BA8) and four
experiments for Pd/D 20 systems (Run 3AA3, 3BA4, 3CA5, 3DA6) were
tried using four same type of the calorimetric systems. The
excess heat generations were found not for the two H 20 systems
but for all the four D 20 systems. A small amount of the excess
23-3

Fig.2 Typical heat calibration for calorimetry.
Fig.3 Excess heat generations vs. current density.
23-4
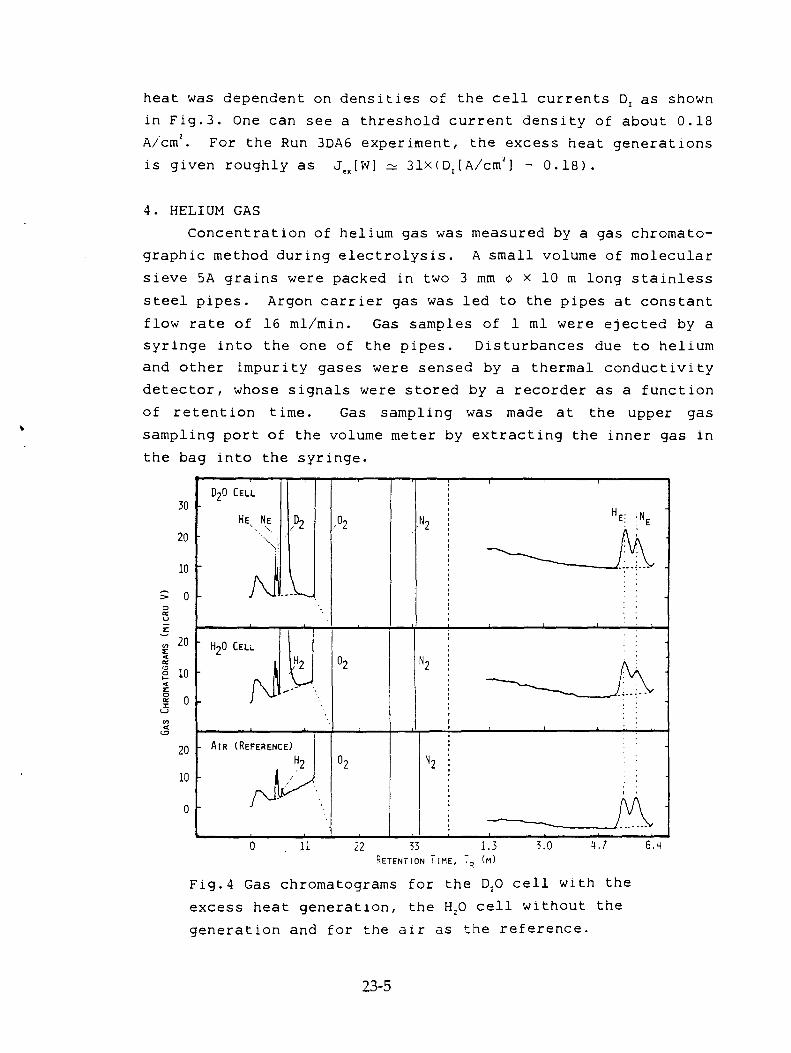
heat was dependent on densities of the cell currents ID, as shown
in Fig.3. One can see a threshold current density of about 0.18
A/cm 2 . For the Run 3DA6 experiment, the excess heat generations
is given roughly as Je.[W] ti 31x(D x [A/cm 2 ] - 0.18).
4. HELIUM GAS
Concentration of helium gas was measured by a gas chromato-
graphic method during electrolysis. A small volume of molecular
sieve 5A grains were packed in two 3 mm m x 10 m long stainless
steel pipes. Argon carrier gas was led to the pipes at constant
flow rate of 16 ml/min. Gas samples of 1 ml were ejected by a
syringe into the one of the pipes. Disturbances due to helium
and other impurity gases were sensed by a thermal conductivity
detector, whose signals were stored by a recorder as a function
of retention time. Gas sampling was made at the upper gas
sampling port of the volume meter by extracting the inner gas in
the bag into the syringe.
Fig.4 Gas chromatograms for the D 20 cell with the
excess heat generation, the H 20 cell without the
generation and for the air as the reference.
23-5

Measurements were done for the one D 20 cell with the excess
heat generation of (4.8 ± 0.5) W and for the two H 20 cells
without the generation. Fig.4- shows typical gas chromatograms
for the D 20 cells and the H 20 cells, and a chromatogram of air in
the experimental room, which played a role of concentration
references ( He 5.24x10 -% Ne 1.81x10 -3 , 0 2 20.9, N 2 78.0 volume 95).
Taking the measured helium gas concentrations and the gas volume
determined by the volume meter into account, production rates (He
atoms/sec) were calculated as (4.5 ± 1.5)x1e for the D 20 cell
and (4.1 ± 1.5)x10" and (3.9 ± 1.5)xle for the two H 20 cells.
Therefore, assuming the excess heat generation had relation with
the helium production, the net helium production rate for the
(4.8 ± 0.5) W excess heat was (0.5 ± 2.1)x10" He atoms/sec.
5. TRITIUM WATER
Samples of 1 ml recombined heavy water were collected at the
sampling port of the calorimetric D 20 cell with the constant
excess heat generation of (3.4 ± 0.5) W for every 16 days.
Concentrations of the tritium in the samples were measured by
liquid scintillation counting method. A net increase of (1.0 ±
0.7) dpm/ml in disintegration rates over the 16 days was found
after collecting long term drifting of the scintillation counter.
This value led to (5.6 ± 3.9)x10 9 T atoms in 600 ml electrolyte.
Therefore, tritium production rate under the condition of (3.4
± 0.5) W excess heat generation was (4.0 ± 2.8)x10 3 T atoms/sec.
6. TRITIUM GAS
A proportional gas chamber was developed to measure energy
spectrum of beta-rays emitted from the tritium atoms. The chamber
consisted of an anode with five 20 um sense wires and six 100 4m
potential wires, and of two cathodes of 100 um mesh. The
effective area was 50 mm x 140 mm and the thickness was 10 mm.
The chamber was shielded by lead blocks and surrounded b .;
aluminum and lucite plates. Pulse signals from the sense wires
were amplified and were accumulated by a pulse height analyzer
(hereafter PHA). The signals due to cosmic rays were rejected
by anti-coincidence plastic scintillation counters which covered
the surface of the chamber. Energy calibration spectrum was
23-6

measured using 5.9 keV X-rays from 55Fe source, and is shown in
Fig.5 with a background spectrum.
The tritium concentration in gas phase of the Run 3CA5 D 20
cell with the excess heat generation was measured. The gaseous
sample(20 ml) was taken from the lower gas sampling port of the
cell. It was put into the chamber, after the counter gas (AT +
10 % CH 4 ) flow was stopped. Successive 600 sec spectrum measure-
ments were tried 5 or 6 times, after readjustments for small gain
downward shift were made by increasing the bias with the help of
the "Fe X-ray, and these spectra were finally summed up.
Fig.5 Spectra of background (a) and X-ray of "Fe(b).
The energy spectra were integrated in the range from 0.2 keV to
12 keV to obtain averaged counting rates. Taking detection
efficiency of 0.5 into account, the disintegration rate was (0.90
± 0.06) dps/20 ml.
For comparison with this concentration, similar measurements
were done for the H20 cell without the excess heat generation,
and for pure D 2 gas, pure H 2 gas and the air. However, quite same
values as for the 1:)20 cell were obtained for these references.
Therefore, subtracting the values of the references, the
expected net disintegration rate of the D 20 cell was calculated
to be (0.00 ± 0.08) dps/20 ml, where the excess heat generation
23-7

was (3.5 ± 0.5) W and the cell current was 7.5 A (D 1= 0.5 A/cm 2 ).
7. NEUTRON AND GAMMA-RAY -
Measurements were made for fast and slow neutrons and gamma-
rays by using a 5 cm 0 x 5 cm long liquid scintillation neutron
detector, a 'He gas neutron detector and a 5 cm o x 5 cm long
NaI(Tl) gamma-ray detector, respectively, along with the PHA
system. The detection experiments were done for the D 20 cell
with the excess heat generation of (4.8 ± 0.5) W and also for the
same cell without the generation at the current density less than
0.15 A/cm2 . Since detection counting rates for the both
experiments agreed within statistical errors, net increases in
the counting rates of the fast and slow neutrons and also of the
gamma-rays were not observed during the excess heat generation.
8. DISCUSSION
It may be interesting to introduce factor, F(nuclear ash)
to discuss about the relations between the quantities of the
nuclear ashes and the excess heat. It was defined as ratio of
the amount of heat released by the nuclear reactions relevant to
the detected ashes to the amount of the excess heat.
Values of the F factors for the present experiments were
given as follows,
F(He in gas phase ) (4 ± 16)x10 - '
F(T in liquid phase)= (8 ± 6)x10 -1° ,
and upper limit of F(T in gas phase ) S 1x10 6 .
In these calculations, the postulated nuclear reactions were
taken as
D + D = 'He + 23.8 MeV,
and D + D = 'T + H + 4.03 MeV.
Comparing with the factors, it seemed the factor for helium
was larger than that for the tritium productions. However, there
still remained a possibility that the increased helium
concentration was made not by the nuclear reaction but by some
kind of helium pumping processes, because the productions were
also observed in the same order for the H 20 cells without the
excess heat generations. Such processes were assumed to be a
thermal transpiration process and a helium leakage process.
23-8
Anyhow, The extremely small values of the factors could not
explain the amounts of excess heat.
However, it was worthy - to note that, if the nuclear
reactions were to be made inside of the Pd cathode, residual
helium and tritium atoms in the cathode could hardly escape out
of the cathode to the gas and the liquid phases so that the
meaningful amounts of helium and tritium in these phases were not
detected, as shown in the present experiment. Therefore, it
should be concluded the small F values suggested either that (1)
the nuclear reactions might have to occur in the deep inside of
the Pd cathodes, or that (2) the major amount of the detected
excess heat could not match with the amount of the heat expected
from the nuclear reactions, if the reactions occurred on the Pd
cathode surfaces.
9. REFERENCES
1) M. Fleischmann, S. Pons and M. Hawkins, J.Electroanal.
Chem., 261(1989)p301.
2) A. Takahashi, A. Mega, T. Takeuchi, H.Miyamaru and T. Iida,
Proceedings of the 3rd International Conference on Cold
fusion, Nagoya, Japan, 1992, p79.
3) D. B. Buehler, L. D. Hansen, S. E. Jones and L. B. Rees,
ibid., p245.
4) E. Yamaguchi and T. Nishioka, ibid., p179.
23-9


Excess heat observation during electrolysis of Cs2CO3 solution in light water.
Yu.N.Bazhutov, Yu.P.Chertov.
Scientific research center of Physical-technical
problems, Moscow.
A.A.Krivoshein.
The Instituteof atomic energetics, Obninsk,
Moscow region.
Ya.B.Skuratnik, N.I.Khokhlov.
Karpov Institute of Physical Chemistry, Moscow.
Russia.
Abstract.
There were carried out series of experiments with initiation of cold fusion reaction by 0.74
M Cs2CO3 in H20 electrolysis with Ni - cathode and Pt - anode. The electrolysis were
conducted with constant currens (100, 200, 300, 400, 500, 920 mA). The heat
calibration was carried out with using joule heat source for each electrode current:.Duration
of these series of experiments was about 30 days. The excess heat was steadily
observed at all currents (except 100 and 200 mA). It was estimated as (20 - 30)%. There
was not found the tritium in electrolyte probes.
Introduction.
In last time the intresting results were obtained by different authors during electrolysis
of light water of alkali salts with nickel cathodes [1,2]. In present work we carried out
two experiments of such type.
Method.
It is shown in figure 1 a schematic diagram of the used cell. A solution of 0.74M Cs2CO3 in
light water was used. The volume of electrolytic solution was 300m1. Pt-plate was used
as anode in both cases. For heat calibration we prepared a special heater, which
consist of thin nichrome wire placed in glass tube (diameter 5mm) filled by oil. The heater
'.vas introduced in the used cell between cathode and anode. Power of heater could
24-1

2
be varied from 0 to 10 watt. It is permissed to carry out a calibration of cell during
electrochemical process. It is very important because it gives posibility to devide accurratly the output heat on joule-heat, connected with electrolysis current and
excess heat connected with "cold fusion".
Fig. 1 Schematic diagram of cell.
24-2

3
Basis of the experiment.
Realy input electrical energy(PIn) was spended for heating of cell, content (Pj) and for
decompose water (Pd):
Pin = Pj Pd (1)
Pin and Pd are known. Hence
Pj = Pin - Pd (2)
"Cold fussion" ( exess heat) (Pex) take place if heat generating in experiment (Pexp)
exceed Pj.
Pex = Pexp - Pj (3)
It is easy to show that
Pj = (U - 1.48)*I (4)
where: U - voltage on cell, in Volts. I - electrolysis current, in Amperes.
Pexp was determined as value proportionate to difference of temperatures
(dT = T1 - T2 , look at figure 1)
Pexp = K *iff ( 5 )
Coefficient of proportionality K in (5) was determined with using decribed above heater.
Heating cell constant (and hence dT) dependent from mixing of electrolyte. That is a
reason why we determined K for every value of I.
K = (dTh - dT)/Ph (6)
where: dTh - difference of temperatures when heater is switch on;
dT - difference of temperatures when heater is switch out;
Ph - power of heater. Part of excess heat 0 is determined
as
Q (%) = [(Pout - Pin)/Pin] *100% ( 7 )
It is convenient to determine Q as
Q(%)=[(dT - dTk))/dTk] *100% (8)
where: dTexp - difference of temperatures in experiment normalized relatively Pj on 1 watt;
dT - difference of temperatures from heater normalized relatively Pj on 1 watt.
Results.
Accuracy of temperature determination was 3%. In the fist experiment Ni - cathode
(22.5 * 13.6 * 4.5 mm ) was polarized by current 920 mA. The time of coming heat
balance was 6 - 8 hours. The experiment was carried out 26 days. All the time we observed
constant heat excess generation on rate 20 - 30%. By reverse current we did not
observe excess of heat . Output heat was equal Pj.
In the second experiment Ni - cathode in the form of a plate (diamiter - 20 mm.
24-3
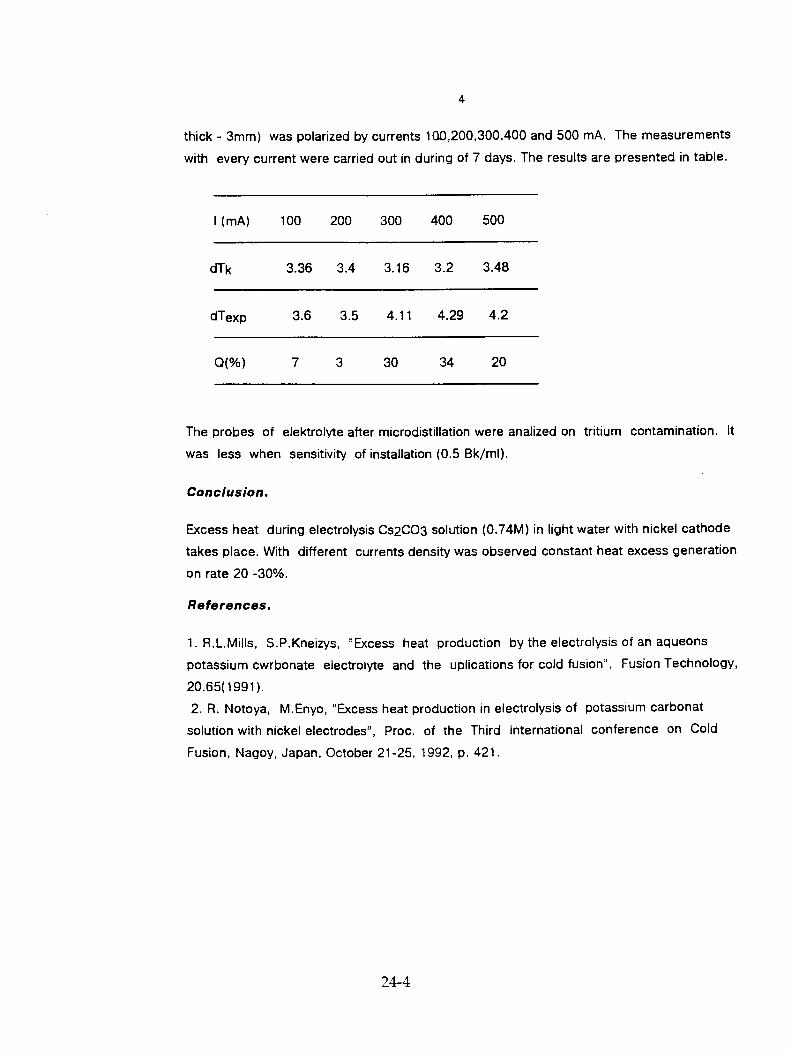
4
thick - 3mm) was polarized by currents 100,200,300,400 and 500 mA. The measurements
with every current were carried out in during of 7 days. The results are presented in table.
I (mA) 100 200 300 400 500
dTk 3.36 3.4 3.16 3.2 3.48
dTexp 3.6 3.5 4.11 4.29 4.2
Q(%) 7 3 30 34 20
The probes of elektrolyte after microdistillation were analized on tritium contamination. It
was less when sensitivity of installation (0.5 Bk/ml).
Conclusion.
Excess heat during electrolysis Cs2CO3 solution (0.74M) in light water with nickel cathode
takes place. With different currents density was observed constant heat excess generation
on rate 20 -30%.
References.
1. R.L.Mills, S.P.Kneizys, "Excess heat production by the electrolysis of an aqueons
potassium cwrbonate electrolyte and the uplications for cold fusion", Fusion Technology,
20.65(1991).
2. R. Notoya, M.Enyo, "Excess heat production in electrolysis of potassium carbonat
solution with nickel electrodes", Proc. of the Third International conference on Cold
Fusion, Nagoy, Japan, October 21-25, 1992, p. 421.
24-4

SURFACE MORPHOLOGY AND MICROCOMPOSITION OF PALLADIUM CATHODES AFTER ELECTROLYSIS IN ACIDIFIED
LIGHT AND HEAVY WATER: CORRELATION WITH EXCESS HEAT
J. Dash and G. Noble Department of Physics
Portland State 'University P. 0. Box 751
Portland, Oregon 97207-0751
D. Diman Carleton College
Northfield, Minnesota 55077
Abstract
Experiments were performed using Pt anodes and Pd cathodes. The electrolyte contained H20 and H2SO4 in one cell and D 20 and H2SO4 in a similar cell connected in series. Excess heat, localized melting, and localized concentrations of Au or Ag were observed. It is concluded that nuclear fusion is the most probable explanation for the excess heat. localized melting, and localized concentrations of unexpected elements.
Experimental Methods and Results
We recently reported on the electrolysis of D 20 acidified with H2SO 4, using a Pd cathode made from a single crystal cold rolled into a foil'. Rimmed craters occurred on the surface of this cathode after electrolysis for 12 minutes. suggesting that localized melting had occurred. We also recently reported on comparative heat measurements during electrolysis from two cells in series. one containing H,0 and H„SO 4 . the other containing D20 and H,SO 4, and both containing cold-rolled. 0.35 mm thick polycrystalline Pd cathodes -. The anodes were Pt foil 0.03 mm thick. A recombination catalyst was used in both. Excess heat was observed from the D„O cell for the first 300 hours of operation. after which excess heat was observed from the light water cell for the final 100 hours of - operation. Subsequent to our published report'. we have begun to study the surface topography and composition of the Pd cathodes from both cells. The electrodes were cleaned ultrasonically in deionized water before this study.
25-1

A low magnification scanning electron microscope (SEM) photograph of these electrodes is shown in Fig. 1. The appearance of both electrodes is similar. After about 400 hours of electrolysis, the original rectangular cross sections have become oval, and the original rectangular longitudinal shapes have become tapered and bent concave toward the anodes. The concave side of each electrode is depicted in Fig. 1. The original smooth, shiny surfaces changed to dull, corrugated topography. Dark spots are present on the lower ends of both cathodes, where the shape changes were greatest. These dark spots most probably were caused by localized differences in topography, but localized differences in chemical composition also were observed by using an energy dispersive spectrometer (EDS) attached to the SEM. EDS gives surface analysis to a depth of about one um.
Fig. 1. Heavy water (left) and light water (right) Pd cathodes, concave side, after electrolysis for about 400 hours.
For example, Fig. 2 is a higher magnification photograph of a small portion of the bottom of the light water Pd cathode on the concave side. The composition of a smooth area such as A is given by the spectrum in Fig. 3. This relatively smooth. flat area with little contrast appears to have no heavy elements other than Pd. On the other hand, region B. which appears darker and rougher with more contrast. gave the spectrum in Fig. 4. This spectrum shows an appreciable amount of Pt and Au in addition to Pd. Similar spectra were obtained from regions C and D. It is likely that Pt is piated from
25-2

Fig. 2. Enlargement of lower right corner of H 20 cathode in Fig. 1.
the electrolyte where it occurs due to slow dissolution of the Pt anode. Au, however, is not expected to arise from a pure Pt anode. Nor is it expected to occur inhomogeneously as an impurity in Pd because Au and Pd are completely miscible in the solid state 3.
11.3 >1 134 cts!
' 1.1 6.180 keV FS= 21( ch 319= MEM1:LWC PHOTO 673,SPOT 2
k 1.1 6.240 kell FS= 2K ch 322= MEM1:LWC PHOTO 675, SPOT2
11.4 > 74 cts
Fig. 3. EDS spectrum from region A of the H,0 cathode shown in Fig. 2.
Fig. 4. EDS spectrum from region B of the H 20 cathode shown in Fig. 2.
25-3
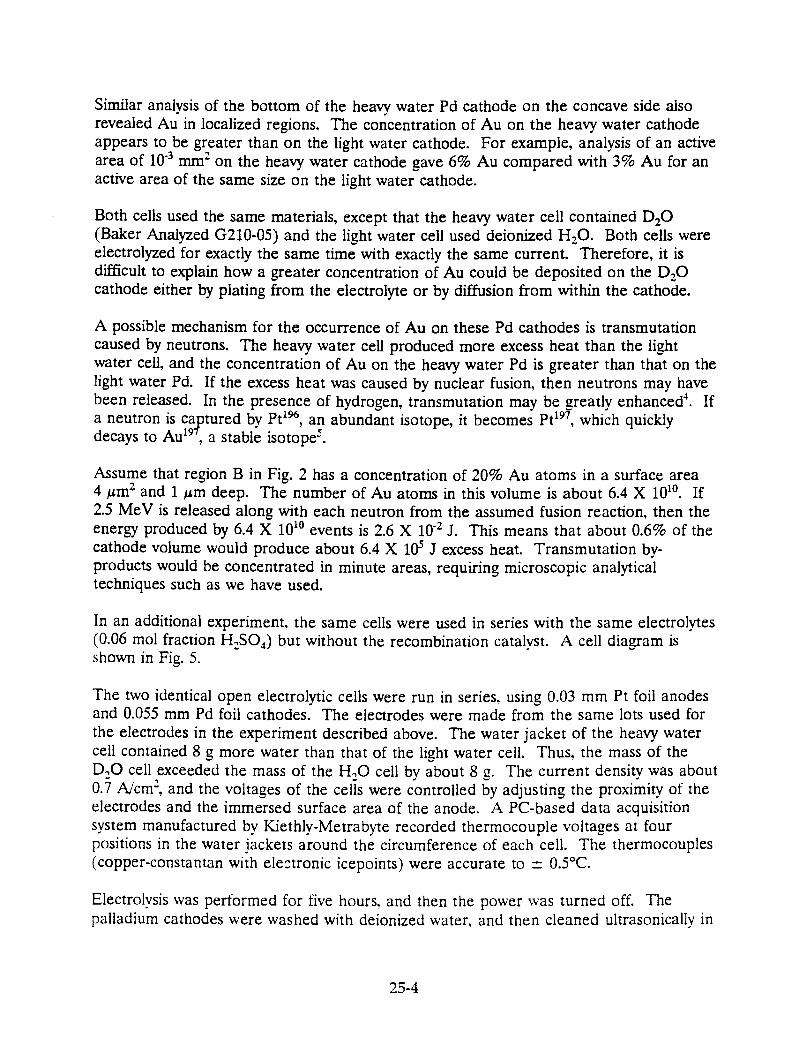
Similar analysis of the bottom of the heavy water Pd cathode on the concave side also revealed Au in localized regions. The concentration of Au on the heavy water cathode appears to be greater than on the light water cathode. For example, analysis of an active area of 10-3 mm2 on the heavy water cathode gave 6% Au compared with 3% Au for an active area of the same size on the light water cathode.
Both cells used the same materials, except that the heavy water cell contained D 20 (Baker Analyzed G210-05) and the light water cell used deionized H20. Both cells were electrolyzed for exactly the same time with exactly the same current. Therefore, it is difficult to explain how a greater concentration of Au could be deposited on the D 20 cathode either by plating from the electrolyte or by diffusion from within the cathode.
A possible mechanism for the occurrence of Au on these Pd cathodes is transmutation caused by neutrons. The heavy water cell produced more excess heat than the light water cell, and the concentration of Au on the heavy water Pd is greater than that on the light water Pd. If the excess heat was caused by nuclear fusion, then neutrons may have been released. In the presence of hydrogen, transmutation may be greatly enhanced'. If a neutron is captured by Pt 196, an abundant isotope, it becomes Pt 197 , which quickly decays to Au191, a stable isotopes .
Assume that region B in Fig. 2 has a concentration of 20% Au atoms in a surface area 4 Am2 and 1µm deep. The number of Au atoms in this volume is about 6.4 X 10 10. If 2.5 MeV is released along with each neutron from the assumed fusion reaction, then the energy produced by 6.4 X 10 10 events is 2.6 X 10⁻² J. This means that about 0.6% of the cathode volume would produce about 6.4 X 10⁵ J excess heat. Transmutation by-products would be concentrated in minute areas, requiring microscopic analytical techniques such as we have used.
In an additional experiment, the same cells were used in series with the same electrolytes (0.06 mol fraction H2SO4) but without the recombination catalyst. A cell diagram is shown in Fig. 5.
The two identical open electrolytic cells were run in series, using 0.03 mm Pt foil anodes and 0.055 mm Pd foil cathodes. The electrodes were made from the same lots used for the electrodes in the experiment described above. The water jacket of the heavy water cell contained 8 g more water than that of the light water cell. Thus, the mass of the D20 cell exceeded the mass of the H,0 cell by about 8 g. The current density was about 0.7 A/cm2, and the voltages of the cells were controlled by adjusting the proximity of the electrodes and the immersed surface area of the anode. A PC-based data acquisition system manufactured by Kiethly-Metrabyte recorded thermocouple voltages at four positions in the water jackets around the circumference of each cell. The thermocouples (copper-constantan with electronic icepoints) were accurate to ± 0.5°C.
Electrolysis was performed for five hours, and then the power was turned off. The palladium cathodes were washed with deionized water, and then cleaned ultrasonically in
25-4

tubes for thermocouples
Polyethylene rings
Electrolyte
Water jacket
Electrodes
acetone prior to being examined and photographed with a light microscope, and with a scanning electron microscope.
A program was written which averaged the four water jacket temperatures in each cell. The average in the H cell was then subtracted from the average in the D cell for every data point. Then, the average, maximum, and minimum of this difference was recorded for every ten minutes of data. The power value for each cell was also averaged and the minimum and maximum recorded over the ten minute periods.
The power input to the heavy water (D) cell was maintained at least 0.1 watt less than to the light water (H) cell. Although the mass of the D cell exceeded that of the H cell, the temperature of the D cell was the same or higher than that of the H cell throughout the experiment, as shown by the graphs in Fig. 6. The graphs show the difference in power input and the difference in temperature between the H and D cells during an experiment. One can clearly see a positive value for the average D-H temperature, and a negative value for the difference (D-H) in power input. This indicates that the D cell was producing more heat per unit power in, than the H cell.
Fig. 5. Schematic diagram showing components of open cells and circuit used for electrolysis of light and heavy water cells in series.
An obvious change in surface morphology occurred during electrolysis, as shown in Fig. 7. The edges of the foil became rounded and spherical globules formed on the surface on the concave side, suggesting that localized melting and chemical reaction with sulfate in the electrolyte occurred during electrolysis. Using an energy dispersive spectrometer attached to a scanning electron microscope. chemical composition was determined in regions which had topography suggestive of localized melting. A spectrum (Fig. 9A) of the entire region in Fig. 8 has a strong peak at 2.84 KeV, indicating that its composition
25-5

Fig. 6.A. Difference in power input to the heavy water (D) cell and light water (H) cell during electrolysis for five hours. The negative values indicate that more power was input to the H cell throughout the experiment.
Difference in Water Jacket Temperature vs. Time (D cell less H cell) 6/30/93
Fig. 6.B. Difference in water jacket temperature of the D cell and H cell. The positive values indicate that the D cell power output exceeded the H cell power output throughout the experiment.
25-6

is overwhelmingly Pd, but a peak for Pt is also present. The intensities of the Pt and Pd peaks suggest that the average surface composition of the entire area of Fig. 7 is about 85% Pd and 15% Pt. As mentioned above; Pt from the anode codeposits with H and D at the Pd cathode in this system.
Spectra from the four numbered asperities in Fig. 8 are shown in Fig. 9B, 9C, 9D, and 9E for spots 1, 2, 3, and 4, respectively. In all of these the predominant peak is at 2.98 KeV, which corresponds to Ag. The inflections at about 2.84 KeV indicate that Pd is still present, especially in spectrum D from spot 3. Pt peaks also occur in all of these spectra, and peaks for S occur in spectra B and C from spots 1 and 2, respectively. The occurrence of S at spots 1 and 2 but not at spots 3 and 4 or in the overall area of Fig. 8 may be due to inhomogeneous interaction with sulfate from the electrolyte. Localized heating may have been more intense at points 1 and 2, causing inhomogeneous chemical interaction.
Fig. 7.A. Pd cathode before electrolysis. Fig. 7.B. Pd cathode after electrolysis. The lines on the surface and the edge Changes were probably caused by cracks were caused by cold rolling. localized melting and reaction with sulfate
in the electrolyte.
The possibility of electroplating silver from this cell is minimal. The anode was high purity Pt, and electrolyte was made from analytical reagents, and the container was glass. The possibility of Ag occurring as an inhomogeneous impurity in the Pd cathode also is minimal because the Ag-Pd system exhibits complete miscibility in all phases 6 .
A possible mechanism for the occurrence of Ag in such areas is transmutation caused by neutrons. For example, if the excess heat observed for the heavy water cell was caused by nuclear fusion. then neutrons may have been released. If a neutron is captured by Pd 108. it becomes Pd 1°9, which rapidly decays to A 109. a stable isotope'.
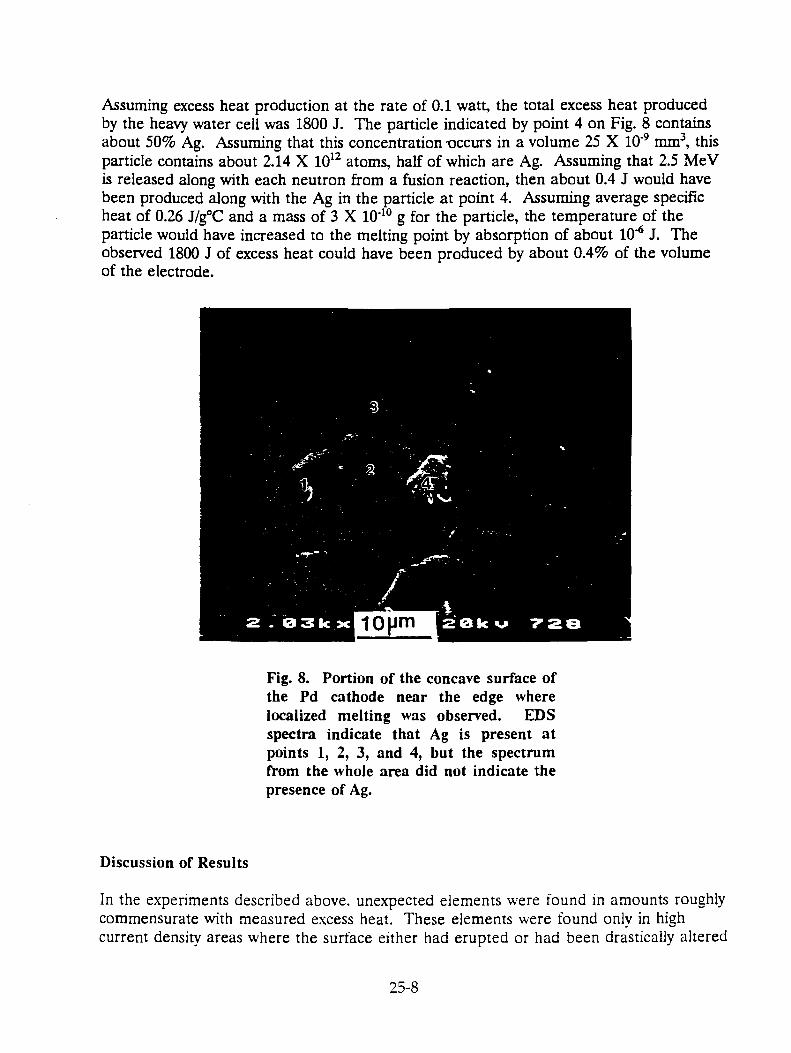
Assuming excess heat production at the rate of 0.1 watt, the total excess heat produced by the heavy water cell was 1800 J. The particle indicated by point 4 on Fig. 8 contains about 50% Ag. Assuming that this concentration occurs in a volume 25 X 10 -9 mm3, this particle contains about 2.14 X 10 12 atoms, half of which are Ag. Assuming that 2.5 MeV is released along with each neutron from a fusion reaction, then about 0.4 J would have been produced along with the Ag in the particle at point 4. Assuming average specific heat of 0.26 J/g°C and a mass of 3 X 10 40 g for the particle, the temperature of the particle would have increased to the melting point by absorption of about 10 -6 J. The observed 1800 J of excess heat could have been produced by about 0.4% of the volume of the electrode.
Fig. 8. Portion of the concave surface of the Pd cathode near the edge where localized melting was observed. EDS spectra indicate that Ag is present at points 1, 2, 3, and 4, but the spectrum from the whole area did not indicate the presence of Ag.
Discussion of Results
In the experiments described above. unexpected elements were found in amounts roughly commensurate with measured excess heat. These elements were found only in high current density areas where the surface either had erupted or had been drastically altered
25-8
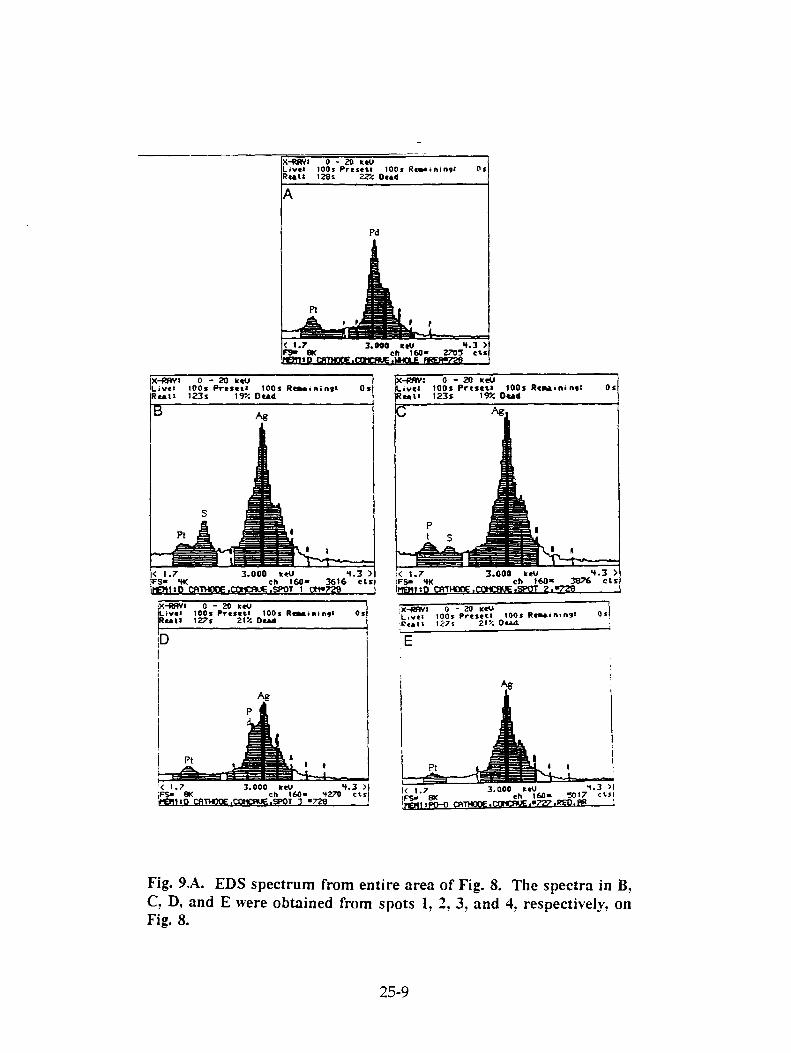
Fig. 9.A. EDS spectrum from entire area of Fig. 8. The spectra in B, C, D, and E were obtained from spots 1, 2, 3, and 4, respectively, on Fig. 8.
25-9

from the original cold-rolled condition. Gold was found on palladium cathodes from both light water and heavy water cells which had been electrolyzed in series for about 400 hours. More gold was found on the heavy water cathode than on the light water cathode. This seems to correlate roughly with the excess heat measurements; i.e., more excess heat was observed for the heavy water cell than for the light water cell. Gold was observed only on the highest current density portions of each cathode, and on a highly convoluted surface. The initial thickness of the palladium electrodes on which gold was observed after electrolysis was 0.35 mm.
In the second experiment, the same cells were used with platinum anodes from the same lot used for the first experiment. The palladium cathodes also were made from the same lot of palladium used in the first experiment, but the thickness was 0.055 mm. Excess heat was observed over the span of the five-hour experiment; i.e., the output of heat from the heavy water cell exceeded that produced by the light water cell. Evidence of surface melting and chemical reaction of sulfate from the electrolyte with the palladium cathode was observed on the concave side of the heavy water cathode near the edges but not on the convex side of the cathode, which faced away from the anode. Silver was detected at surface eruptions near the edges where melting occurred, but not elsewhere. Gold was not observed on this electrode. The evidence for surface melting which was found on the thin palladium cathode was not apparent on the thicker palladium cathode which had gold deposits but not silver. It seems likely that the thinner palladium cathode reached a higher temperature during electrolysis, so that kinetics may have been more rapid on the thinner palladium.
The occurrence of gold and silver in these experiments seems unlikely to have been caused by impurities being deposited in the localized, high concentrations which were observed. On the other hand, these elements could have been produced by transmutation if slow neutrons were present. It is estimated that the average energy of a neutron is reduced by 50% in each collision with a proton 4 . Consider a group of 1 MeV electrons. After about 14 collisions with protons. half of these will have energies less than 1 eV 4 . Neutrons to be used for transmutation are commonly slowed down in paraffin4. In our system, protons are present in the electrolyte and in the palladium.
In summary, we have observed excess heat from electrolysis of palladium in both light and heavy water, both of which contained H 2SO4. Unexpected elements were detected. These may have been produced by transmutation caused by neutrons from fusion reactions which occurred in only a small fraction of the palladium cathodes.
It is essential that these experiments are repeated, using the highest purity materials available, in order to determine if the results reported here are reproducible.
25-10
References
1. D. S. Silver. J. Dash, and P. S. Keefe. "Surface Topography of a Palladium Cathode After Electrolysis in Heavy Water." Fusion Technology. Vol. 24, p. 423 (1993).
2. J. Dash, P. S. Keefe, E. Nicholas, and D. S. Silver, "Comparison of Light and Heavy Water Electrolysis with Palladium Cathodes," Proceedings AESF 80th Annual Conference, Orlando, Florida, (June 1993).
3. H. Okomoto and T. B. Massalslci. Binary Alloy Phase Diagrams, Vol. 1. Metals Park, Ohio: ASM, 1986, pp. 294-295.
4. F. K. Richtmyer, E. H. Kennard, and T. Lauritsen. Introduction to Modern Physics. New York: McGraw-Hill, 1955, pp. 527-531.
5. Handbook of Chemistry and Physics. 41st ed. Cleveland: Chemical Rubber Publishing Co, 1959/60, pp. 492-493.
6. I. Karakaya and W. T. Thompson. Binary Alloy Phase Diagrams, Vol. 1. (T. B. MassalsIci, ed.-in-chief.) Metals Park, Ohio: ASM, 1986, pp. 55-56.
7. Handbook of Chemistry and Physics. 41st ed. Cleveland: Chemical Rubber Publishing Co., 1959/60, pp. 470-471.
Acknowledgements
We are very grateful to L. Brodie for stimulating discussions. This is Environmental Sciences and Resources Publication No. 294.
25-11


MATERIALS ASPECTS OF THE ELECTROCHEMICAL INSERTION OF HYDROGEN AND DEUTERIUM INTO MIXED CONDUCTORS
Robert A. Huggins* Department of Materials Science & Engineering
Stanford University Stanford, CA 94305
* Current Address: Center for Solar Energy and Hydrogen Research
Helmholtzstr. 8, 89081 Ulm, Germany
Abstract
A number of features of the presence of interstitial species in metals and alloys relevant to "solid state fusion" experiments are discussed. These include experimental evidence for very high virtual pressures under certain conditions, and the influence of promotors and surface blockers. Dislocation generation and motion can result from the large stresses accompanying composition gradients and phase transformations. Because of preferential segregation of interstitial species to dislocations, transport along dislocations can be much faster than through the bulk crystal, and dislocation motion can cause unusually rapid interstitial solute transport and both entry and emission from surfaces. Mechanical effects related to the presence of hydrogen often are sporadic and can have long delay times. It is possible that some of the same microstructural features and phenomena that are responsible for delayed mechanical behavior play an important role in the "solid state fusion" observations. Two dislocation mechanisms are presented that can produce transient local hyperloading.
Introduction
It is the purpose of this paper to discuss several of the materials aspects of the solution of hydrogen isotopes in metals and alloys. It will be seen that there are several features that are directly relevant to the efforts that are currently being undertaken to investigate "solid state fusion" phenomena. It will also be evident that some of the experimental observations that appear to be so vexing, and have raised serious doubts and questions, such as the sporadic nature and ''materials dependence" of some of the observed effects, are not at all surprising in light of what is Known about other features of the insertion of hydrogen isotopes and other interstitial species into metals.
26-1

An important feature of the behavior of such systems is the interplay between interfacial phenomena and bulk thermodynamic conditions. As a result, it is possible to obtain species distributions and related phenomena inside solids that are equivalent to those that would be present- if there were a very high external pressure of one of the components.
Composition gradients and phase transformations with accompanying large changes in specific volume can generate very large internal stresses, leading to dislocation generation and motion. In addition, segregation to dislocations is commonly observed, with the possibility of greatly enhanced local concentrations.
There is good evidence for the enhanced transport of hydrogen isotopes by dislocation motion, and experiments have shown a definite correlation between gas evolution and plastic deformation that causes dislocation emission from the surface.
Changes in internal microstructure relating to some of these phenomena have often been observed to exhibit a time dependence, leading to sporadic behavior and delay times that are difficult to predict, similar to some of the "solid state fusion" observations.
General Comments
The relatively easy absorption of large amounts of hydrogen into metals was first reported by Graham over a hundred years ago [1]. The first examples that he studied were palladium and palladium-silver alloys. He also showed that hydrogen could be introduced into such materials by electrochemical charging [2,3].
Since that time there has been a large amount of work on various aspects of hydrogen in metals, leading to a rich scientific literature. This has led to the acquisition of much fundamental knowledge about thermodynamic, kinetic and structural aspects of interstitial solid solutions, as well as the development of a number of important experimental techniques. Hydrogen and its isotopes move rapidly in palladium, and this metal has served as the primary example for the study of these matters. Large concentrations of hydrogen isotopes can be readily absorbed under experimental conditions that are relatively easy to achieve, and experiments can be performed in both air and aqueous environments without the formation of a blocking surface oxide.
There is a considerable amount of practical interest in the use of hydrogen-permeable metallic membranes, primarily palladium-silver alloys, for the separation of gases. A good measure of research effort has also gone into the exploration of the use of hydrogen absorption in metals and alloys for the storage
26-2

of hydrogen, and more recently, for the use of such materials as rechargeable electrodes in battery systems.
In addition to these essentially positive applications, hydrogen can have very significant, and generally deleterious, effects upon the behavior of metals in technological applications. One of the most important involves the influence of hydrogen on various mechanical properties. Hydrogen embrittlement and hydrogen-related stress corrosion cracking are very important practical problems with some metals and alloys.
We shall see that consideration of some of the knowledge generated in these other areas may be instructive in providing insight, and perhaps even understanding, concerning some of the recent observations in the "solid state fusion" arena.
The Imposition Of Very High Activities Of Solute Species InsideSolids
One of the features of the electrolytic experiments that seems the most foreign to many who are not conversant with the relevant thermodynamic and kinetic principles is the concept that a solid that is obviously sitting in an environment with a total pressure of one atmosphere can behave as though it were under an extremely high applied pressure of one of its constituents.
Equilibrium Between a Bulk Solid and Its Surface
Many years ago Wagner and his co-workers pointed out that if a solid surface acting as a heterogeneous catalyst is exposed to a reacting gas mixture for a sufficiently long time under steady state conditions at elevated temperatures, thermodynamic equilibrium becomes established between the species in the surface region, i.e., adsorbed reactants, intermediates, and products, and atomic and electronic species in the bulk underlying solid.
They showed that if species transport across the interface and in the bulk solid to and from the surface is sufficiently fast, one can obtain information about the thermodynamic state of the surface species during the catalysis reaction by observation of some suitable physical property relating to the corresponding species in the bulk solid. Furthermore, this information, in conjunction with the macroscopic system and rate parameters, can be used to evaluate the activities of surface species, and to identify the rate-determining step in a typical sequential catalytic reaction.
This approach was used as a diagnostic tool to understand the mechanism of the heterogeneous reaction in a number of simple cases at elevated temperatures,
26-3

where surface-bulk equilibrium could be readily established. Early examples by the Wagner group included studies of oxygen transfer reactions, such as
CO2 + H2 = CO + H20 and
2N20 = 2N2 +02
on the surface of oxide catalysts [4], and gaseous hydrogenation and dehydrogenation reactions, such as the hydrogenation of ethylene [5] and the decomposition of formic acid [6] on metals.
Use of Back-Side Solid State Electrochemical Cell as Sensor of Interfacial Parameters
In addition, Wagner showed that, under appropriate conditions, a properly designed solid state electrochemical cell on the back side of the catalyst material could also be used as a sensor to give information about interfacial conditions. Demonstrations included the use of an indirect silver ion-conducting solid electrolyte cell for the evaluation of the sulfur activity on the surface of Ag2S when used as a catalyst for reactions such as
H2 + 1 /2S2 = H/S [7,8] and
COS = CO +H/S [9].
Again, an important criterion is rapid transport of atomic and electronic species in the solid, so that equilibrium can be attained between the bulk solid and its surface on one side, i.e., the front side, upon which the heterogeneous reaction takes place, and also on the back side between the solid and the adjacent electrolyte.
High Solute Activies Resulting From Heterogeneous Catalysis
A slightly different twist was given to the general proposition that the interior of a solid comes into equilibrium with its own surface in connection with observations that phenomena can occur within solids that seem to be very far from equilibrium, if certain reactions are taking place upon their surfaces.
At about the same time as the work of Wagner mentioned above, Temkin and Pvzhev introduced the concept of "virtual pressure' into the catalyst community in connection with their work on the rate expression for ammonia synthesis upon a heterogeneous catalyst [10,11]. This concept has subsequently been further pursued by others as well [12-14].
26-4

This concept arose in connection with the experimental observation that iron nitride Fe4N has been found to form near the surface of iron during the catalytic synthesis of ammonia from hydrogen and nitrogen at 400 °C. On the other hand, it is known that at that temperature Fe4N can be formed by the direct reaction of iron and nitrogen if the nitrogen pressure is higher than about 108 Pa, or about 103 atm. Nevertheless, if the nitrogen is replaced by NH3, Fe4N readily forms at about 1 atm pressure. This means that so far as species in the iron are concerned, NH3 at 1 atm on the surface of iron in the presence of hydrogen behaves as though it has a virtual nitrogen pressure of 10 atm.
This type of behavior is interpreted in terms of the mechanism of the relevant heterogeneous reaction that is taking place on the surface of the iron. In a sequential reaction in which a number of elementary mechanistic steps operate in series, under steady state conditions the actual rates of all the steps must be the same. However, the different steps will normally have different virtual maximum rates, a concept introduced by Wagner in 1970 [15], and thus different impedances, so that the overall driving force for the reaction that is taking place at the interface is unevenly distributed between them. The concentrations of reactants, intermediates, and products on the surface must therefore adjust themselves in order to arrive at the same rates for all steps. The species that are involved in the step with the greatest impedance, i.e. the lowest virtual maximum rate, will therefore have the greatest concentration at the surface.
In the case of the very large virtual pressure of nitrogen when the ammonia decomposition reaction is taking place at 1 atm total pressure on the surface of iron, it is obvious that the concentrations of nitrogen-containing species at the interface must have the same magnitudes as they would be if nitrogen gas at a pressure of 10 atm were to be in contact with the solid.
Interfacial Reactions and Species Distributions During Electrolysis of Aqueous Electrolytes
An analogous situation exists in the case of reactions taking place at the liquid-solid, electrolyte-electrode interface in an electrochemical cell, although the terminology that is used to describe it may be somewhat different. Discussions of this matter may be found in a number of places [16-18].
In electrochemical reactions, the driving force is electrical, and under steady state conditions, the species populations at the surface have to adjust themselves so that the different elementary steps involved in the overall process have the same rates. If there is sufficiently rapid equilibration between the surface of the solid and its nearby interior, this interfacial population distribution thus will determine the virtual pressure, or activity, of the relevant species in the subsurface region of the solid.
26-5

Under conditions of steady state electrolysis of water at high currents, the electrical potential at the surface of the cathode, for example, must be significantly displaced from its equilibrium value. This can lead to very large values of virtual pressure, or activity, of hydrogen in the solid electrode just below the surface. With time, as diffusion of atomic species takes place, the thermodynamic conditions imposed in this surface region will gradually equilibrate throughout the bulk solid. The rate at which this takes place will be determined by the chemical diffusion kinetics of the mobile species, e.g. hydrogen isotopes, within the solid. This can occur by their transport through the bulk crystals, or along dislocations and grain boundaries, which act as rapid pathways.
The Use Of Permeation Experiments To Evaluate The Interfacial Composition
One of the techniques that has been used to study the transport properties of hydrogen isotopes in metals involves the measurement of the rate at which such species are transported through thin membranes under either pressure gradients or electrochemical driving forces. There are a number of variants on this general method, and they have been discussed in several reviews in this field [17-19].
Since in metals and alloys diffusion of species is driven only by concentration gradients, this method can be used to evaluate the concentration of hydrogen isotopes in the vicinity of the electrolyte-electrode surface in electrochemical cells. It can be used in cases in which that concentration corresponds to hydrogen pressures greater than one atmosphere [20], and recent work has involved experiments in which electrolysis is taking place at the hydrogen entry interface [21].
Stresses Resulting From The Insertion Of Interstitial Species
Because they have a positive partial molar volume, the presence of interstitial species such as the hydrogen isotopes causes expansion of the metal lattice. The partial molar volume of hydrogen in the a phase of all fcc metals is approximately the same, about 1.65 cm 3 per gm atom of H [22].
The presence of interstitial hydrogen deforms the host lattice and creates a long range elastic strain field. The interaction between the strain fields of two such incerstitials is such that they are attracted to each other. Rather detailed discussions of this are available in the literature [23,24].
As the concentration of interstitial hydrogen species inc.eases, so does the elastic strain energy. Above a certain critical value, palladium has a lower Gibbs free energy if it separates into two phases, forming a miscibility gap in the phase
26-6

diagram. When the total concentration is above the solubility limit in the terminal solid solution a phase, additional hydrogen is accommodated in regions of much higher concentration, called the b phase, even though the basic structure of the palladium host is the same. The jump in partial molar volume change accompanying the a-0 phase transformation is 1.57 cm 3 per gm atom of H, and in the b phase it is 1.30 cm 3 per gm atom of H [19].
These values give rise to very significant changes in volume, and if this volume change does not take place simultaneously at all points within the solid, very large stresses can be generated. This leads to mechanical distortion by plastic flow, a large increase in the hardness, and often the nucleation and propagation of cracks.
The Non-Uniform Distribution Of Interstitial Species
It is well known that hydrogen isotopes occupy interstitial sites, primarily those with octahedral coordination, in face centered cubic metals, such as palladium. This has been found to be the case in both the a and b phases [25,26). Because such interstitial solute species cause localized expansion of the crystal lattice, they are attracted to microstructural features where there is local lattice dilation. The preferential location of interstitials is along the dilation side of edge dislocations, and the segregation of hydrogen and nitrogen to the dilated regions around the edge components of dislocations in iron alloys is well established [27,28]. This has also been demonstrated for hydrogen in niobium [29].
Flanagan et al. [30] compared the hydrogen solubility of cold-rolled (12 - 80%) and well annealed samples of palladium in the a phase. They found that the presence of dislocations resulted in a substantial enhancement of the apparent solubility of both hydrogen and deuterium, with the magnitude of the enhancement ratio is dependent upon the amount of plastic strain, reaching values of about 1.33 at high strains. Very heavily deformed palladium chips gave an even greater enhancement ratio of 1.63 [31]. The enhancement ratio was about the same for hydrogen and deuterium, and was found to be independent of the hydrogen isotope content in the a phase. The general form of this behavior is the same as the dependence of the hardness upon plastic strain [32].
This solubility enhancement is due to a higher local concentration in the stress fields of the dislocations. That is, there is a solute "atmosphere" around dislocations. Contrary to the behavior of bcc metals, there is no experimental evidence for the presence of hydrogen isotopes in the core region of dislocations in palladium [31].
The effect of the local hydrostatic stress sh upon the chemical potential mH of dissolved hydrogen can be written as
26-7

DmH = - Sh / VH
where VH is the partial molar volume of the interstitial hydrogen. The experimentally determined value of VH for hydrogen in all fcc metals and alloys is 1.65 ± 0.05 cm3 /g atom H at 298 K [22]. Since the solubility enhancement is about the same for hydrogen and deuterium, it was suggested [31] that one can assume that the values of VH and VD are about the same.
By comparison of the solubility enhancement and an estimate of the influence of the degree of deformation upon the dislocation density, Flanagan and Lynch [31] were able to show that above a dislocation density of about 10 10 /cm2 the enhancement of the solubility by the presence of dislocations should be experimentally observable. To achieve this critical value of dislocation density in a previously annealed sample of palladium one would need to impose more than 5% deformation at room temperature. This explains why the data on the solubility of nominally "annealed" samples measured in various laboratories is so reproducible, despite the wide difference in actual treatments, whereas there is a lot of scatter in the data reported for deformed samples.
Direct evidence that hydrogen isotopes are preferentially located in dislocation atmospheres, internal interfaces, and grain boundaries was presented in 1974 by Lacombe's group by the use of tritium autoradiography [33] in samples into which a small amount of tritium was deliberately added.
Autoradiography has also been presented recently as evidence of the presence of tritium in samples that have been involved in electrolysis experiments related to "solid state fusion" [34,35]. The images that were obtained in these cases also indicated a very non-uniform distribution of tritium within the solid. It was assumed that there was not any tritium present in the materials prior to the electrolysis experiment, so that the autoradiographic results give an indication that tritium must have been formed during the electrolysis process.
Sicking [36,37] also used tritium as a radiochemical tracer in a study of the influence of plastic deformation on the apparent diffusion of hydrogen isotopes, as will be described later.
Microstructure! Changes Related To Hydrogen Insertion
Very significant microstructural changes accompany the insertion and deletion of hydrogen isotopes in metals, as a result of the changes in specific volume that occur.
Because of the great practical importance of the deleterious influence of the insertion of hydrogen into iron and its alloys, much of the work in this area has involved these and other bcc materials. It is now well established that hydrogen
26-8

charging (and discharging) of these materials causes the generation of large, and non-uniform, dislocation densities [38,39]. A similar phenomenon is well known in connection with the diffusion of dopants into semiconductors. The spatial inhomogeniety of these phenomena - leads to non-uniformity in both time and position in the accompanying lattice parameter changes and solute compositional distribution. Deformation bands and dislocation pile-ups at grain boundaries, as well as the spontaneous initiation of internal fractures have been found by electron microscopy [39].
In the case of metals such as palladium, in which a phase transformation takes place, with the accompanying large discontinuous volume changes (about 9%), these effects are especially striking. Phase transformations in Nb, Ta and V, in which the products are crystallographically incoherent, were discussed by Schober and Wenzl [40]. Under various conditions, the a—f3 phase transformation in palladium can be either incoherent, partially coherent, or fully coherent.
Electron microscopy studies [41,42] have shown that the t3—a transformation in palladium is discontinuous, and resulted in the generation of a high dislocation density in the a phase. The a phase nucleates in partly coherent form at the intersection of dislocations with the surface, and grows by the formation of large lenticular "dendrites" along the elastically soft <100> directions in the b matrix.
As these precipitates continue to grow, the local coherency strain field disappears and further dislocations are generated. It has been found [32] that further transformation involves both the growth of the dendritic a regions already nucleated and the nucleation of new a grains. As in the case of martensite reactions, growth of an individual "dendrite" plate is limited by both crystallographic constraints and intersections with other microstructural features. As a result, as the overall transformation proceeds the size of new a grains becomes ever smaller, as they must grow between previously formed ones.
Erratic phase transformation behavior on charging and discharging was found in the electron microscopy work when palladium from one source was used [41]. This was not the case with palladium from a different source was used. Likewise, some coherent precipitates were found in one case, but not in the other. It was concluded [42] that this was related to a difference in the presence of minor impurities in the palladium.
Variability in the time dependence of the start of the P—a transformation at room temperature was found in both cases. This was attributed to the probable presence of surface films when the samples were exposed to air [42].
26-9
Evidence for the generation of dislocations during cyclic a—(3 phase transformations was the observation [43] that the hydrogen solubility was enhanced by going through the phase change. This is similar to the observation of the influence of plastic deformation on this parameter [30], as discussed earlier. Additional evidence for the generation of large dislocation concentrations as a result of the a—I3 phase transformation was the observation of significant changes in mechanical properties, such as large increases in hardness [32].
The Influence Of Species Upon The Surface - Promotors
It has been known for a long time that the presence of even very small amounts of certain elements has a very marked effect in enhancing the entry of hydrogen isotopes into metals [44,45]. This occurs both in the case of absorption from the gas phase and upon electrochemical charging. Species that seem to be most effective in causing hydrogen to enter metals, apparently at considerably higher activities than those characteristic of the external environment include those containing P, As, Sb, Bi, S, Se, Te, cyanide, and I, as well as several organic species. Discussions of this can be found in several reviews [17,46,47]. Figure 1 shows the effect of the presence of small amounts of several promoters, as well as the applied current density upon the permeation rate of hydrogen through steel [48]. Since the permeation rate is proportional to the concentration gradient, these data indicate the influence of these parameters upon the local concentration of hydrogen just under the entry surface.
The mechanism whereby this promoter effect influences absorption phenomena has been quite controversial, and the experimental results obtained by different investigators have been conflicting. One of the current hypotheses involves the observation that some of the most effective promoters are known to form hydrides [45], and experiments showing the influence of pH upon the promoter effect has been used to support the concept of the importance of the hydride-forming tendency of the most effective promoters [49].
The hydrides of a number of these materials are extremely toxic, and some (e.g. HIS) can be readily detected at very small concentrations. Since there are no reports of the observation of the escape of such hydride species into the gas, and very small concentrations of the hydride formers in the electrolyte seem to act for a long time, rather than becoming consumed, it seems reasonable to assume that the formation of free molecular hydrides of the promoters is not a realistic expectation.
As pointed out earlier in this parer, when highly mobile species such as hydrogen isotopes are present, we can assume that the interior of a solid comes into equilibrium with its outer surface under steady state conditions. Therefore,
26-10
one should think of the action of promoters in terms of how they might control or modify the hydrogen-related interfacial species distribution.
Thermodynamic data indicate that the hydrides of the active promoter species are actually not very stable with respect to their formation from molecular hydrogen. On the other hand, the Gibbs free energy change that would be involved if they were to form from atomic hydrogen is generally quite large and negative. A promoter species such as As might bond to adsorbed hydrogen atoms on the surface, thereby influencing the interfacial species distribution that is "seen" by the bulk solid. Such a simple model would be consistent with the molecular structures of some of the promoter hydrides.
It should be pointed out, however, that there are currently no data available on the influence of promoters under the extreme electrolytic conditions imposed in many of the "solid state fusion" experiments.
Evidence For the Electrolytic Production of High Hydrogen Activities in Other Face Centered Cubic Metals When a Promoter is Present
The work on the influence of promoters has primarily involved either materials such as palladium that absorb large amounts of hydrogen isotopes, or iron base alloys, where the influence of hydrogen at high activities can be very deleterious. However, the same phenomena can be found in other materials, such as fcc copper, which is generally thought to not be sensitive to hydrogen, and in which the equilibrium solubility at ambient temperatures is negligible.
Experiments on the cathodic charging of annealed copper foils at 10 mA/cm 2 in an acid solution have been performed recently [SOL When the electrolyte contained As203, known as a promoter in the cases of both iron alloys and palladium, they found that the ductility was drastically reduced, blisters and voids were formed both inside grains and in grain boundaries, and a high dislocation density, with dense tangles was observed by transmission electron microscopy. In the absence of the promoter, there was no microscopic evidence of significant hydrogen absorption into the copper.
The Inhibiting Effect Of Some Surface Species
Whereas the discussion above centered upon the action of certain species to promote or enhance the absorption of hydrogen isotopes into metals, there are also a lot of examples in which either experimental conditions or specific species have just the opposite effect.
It is well known that the presence of oxygen results in the presence of blocking lavers on the surface of metals that tend to form hydrides. This is a major
26-11
problem limiting the cycle life of the otherwise very attractive magnesium hydrides.
The Influence Of Prior Plastic Deformation Upon Diffusion Of Hydrogen Isotopes
Compilations of data relating to the diffusion of hydrogen isotopes in palladium can be found in several places [51]. Whereas most experiments have been performed on annealed materials, it has been found that prior plastic deformation that results in the formation of large dislocation densities causes the observed macroscopic diffusion coefficient of hydrogen isotopes in palladium to be substantially reduced [19]. Similar recent results were reported by Hasegawa and Nakajima [52].
This is primarily due to the fact that previously generated dislocations act as traps. Data showing this effect in the case of the diffusion coefficient of tritium in palladium are shown in Figure 2. Recent measurements dearly showing the effect of prior plastic deformation upon the diffusion coefficient of hydrogen in palladium were presented by Falanga et al. [53].
This effect of dislocation trapping upon the transport of hydrogen and other interstitials is well known in other metals. For example, the large effect of quenched-in dislocations upon the apparent diffusion kinetics of hydrogen in niobium, as well as the influence of concurrently generated dislocations upon the permeation flux in Ti-Mo alloys, Ta and Nb was recently reported [39].
Sicking and co-workers developed an electrolytically driven permeation method to study the effect of prior cold work in which tritium was used as a sensitive tracer [36]. This technique was utilized to study the influence of prior deformation upon the diffusion of tritium in palladium, and the influence of the amount of deformation upon the trap concentration [37]. They found that the dislocation trap binding energy for tritium in palladium is about -18 kJ/mole (-187 meV/atom), and that the local vibrational modes for tritium in the trap positions are distinctly softer than they are in the normal octahedral interstitial positions in the crystal structure.
Their results, as well as the conclusions of Kirchheim [54-56], indicate that there is a considerable amount of lattice distortion near the dislocations, leading to the possibility of the accumulation of a very high local concentration in the dislocation atmospheres, as mentioned above.
The Transport Of Hydrogen Isotopes By Dislocation Motion

It was proposed by Bastien and Azou as early as 1951 that hydrogen may be transported in metals by being carried along by moving dislocations, and that this mechanism could produce more rapid hydrogen transport than that which is possible by conventional point defect diffusion in the crystal lattice in response to concentration gradients [57]. This concept has since been confirmed by a number of other authors [58-60].
The importance of the motion of hydrogen along with dislocations [61] to the serious problem of the hydrogen embrittlement of metals [60], [62-64] has received a lot of attention [16]. As a result, work at a number of laboratories has emphasized the importance of the coupling between dislocation motion and the transport of hydrogen [65].
A model for the ductile, as distinct from brittle, fracture of metals in a hydrogen atmosphere that is based upon hydrogen transport by dislocations has also been presented [66].
While much of the early attention was given to hydrogen transport via moving dislocations in bcc iron-based alloys, the same phenomenon was observed for fcc nickel as well [67]. It has been shown that serrated yielding, characteristic of dislocations with solute atmospheres, occurs in hydrogen-charged nickel [68,69], and also in an aluminum alloy [65].
It has been suggested that the enhancement of the release of hydrogen isotopes from a number of metals that were previously charged is caused by the egression of mobile dislocations from the surface [58,67]. This question was investigated by Donovan using tritium as a sensitive radioactive tracer [65]. His experiments included both bcc and fcc metals, and the results were comparable in all cases.
He demonstrated that the rate of gas evolution could be greatly enhanced relative to that due to normal crystalline point defect diffusion when plastic deformation is taking place. Observations at different values of strain clearly showed that the enhanced tritium evolution was not due to higher diffusivity in the presence of elastic strain, but definitely involved dislocation motion. The rate of evolution varied as the plastic strain increased, obviously being dependent upon the changes in dislocation behavior connected with strain hardening. Eventually fracture, which also involves dislocation generation and motion, caused an additional large sudden increase in the rate of gas evolution. These features are dearly seen in the data presented in Figure 3, which shows the rate of tritium release as a function of strain for an austenitic stainless steel [65]. The rate of tritium release was found to be a function of strain rate, increasing at higher rates. However, the volume of tritium released per unit strain decreased as the strain rate increased.
The tritium emission was found to be complicated in the case of an austenitic (fcc) stainless steel that undergoes a strain-related transformation zo form a phase

with a much lower hydrogen isotope solubility. The differences in solubility of the initial and product crystal structures caused additional tritium to be expelled as a result of the phase transformation.
In the case of an aluminum alloy that showed dynamic strain aging and repeated yielding tritium release was discontinuous, and there was a clear relation between jumps in the tritium release rate and the periodic plastic yielding. This is shown in Figure 4. The general model for this type of mechanical behavior (called the Portevin-LeChatelier effect) involves the sudden generation of a high density of mobile dislocations when yielding occurs.
The amount of tritium released during plastic deformation and fracture should be related to several factors. These include the rate at which dislocations encounter the external surface, the amount of tritium associated with the Cottrell atmosphere of an average dislocation, and the ability of this tritium atmosphere to move with the dislocations.
Under equilibrium conditions, the excess concentration of tritium associated with the atmosphere of a dislocation Cd can be written as [70,71]:
Cd = C1 exp(-Gb/RT)
where C1 is the nearby lattice concentration, and Gb is the binding energy of the tritium to the dislocation "trap". R and T are the gas constant and the absolute temperature. The binding energy is negative, so the amount of local concentration enhancement is greater at lower temperatures. As an example, the value of Gb has been found to be -1.9 kcal/mol in the case of nickel.
Upon the application of a local shear stress large enough that it would normally cause dislocation motion, three things can happen if the dislocation has a solute atmosphere. Either the solute pins the dislocation in place, preventing its motion, the solute atmosphere moves along with the dislocation, or the dislocation breaks away from its atmosphere, leaving the excess solute behind in the lattice. What happens will depend upon the mobility of the solute, the dislocation velocity, and the magnitude of the solute-dislocation binding energy.
The velocity of a solute v s moving in the elastic force field of a dislocation is [70]
vs = DF/kT
where D is the diffusivity of the solute. F is the force due to the local gradient in hydrostatic strain, and k is the Boltzmann constant. For the case of an edge dislocation,
F = 0.56 Gb / b

where b is the Burgers vector of the dislocation.
Therefore, there will be a critical dislocation velocity v* above which a dislocation will break away from its solute atmosphere, given by
v* = D (0.56 Gb)/(b k T)
For any given macroscopic strain rate, there will be a range of dislocation velocities, depending upon the local stress distribution. As the strain rate increases, there will be more dislocations that break away from their atmospheres, and thus do not carry along any substantial excess solute concentration.
The rate at which solute will be carried to the surface by dislocations will be proportional to the product of the mobile dislocation density near the surface, the average excess solute concentration associated with the dislocation atmospheres, and the average dislocation velocity normal to the surface.
The plastic strain rate is related to the mobile dislocation density r, and the average dislocation velocity v by
de/dt = f b rm v
where f is a geometric factor and b is again the Burgers vector.
Unfortunately, without experimental evidence, it is not easy to separate the effect of a change in the mobile dislocation density from a change in the average dislocation velocity, as they both have the same effect upon the strain rate.
As plastic strain takes place, dislocations are generated, and various interaction processes take place. This results in the following relation between the density of mobile dislocations and the amount of plastic strain e p [72]:
rm = (r0 + M ep) exp (H ep/s)
where ro is the initial mobile dislocation density, M a multiplication coefficient, H the strain hardening coefficient, and s the applied stress.
This relationship leads to a maximum in the mobile dislocation density at relatively small values of strain, decreasing again at larger strains, as illustrated in Figure 5 [72]. This is the same kind of strain dependence that was found for tritium emission during plastic strain, as shown in Figure 3.
The strain rate dependence of the tritium emission rate was evaluated by Donovan in the case of iron, nickel and stainless steel at room temperature, and from this information he was able to extract the volume of tritium emitted per
unit strain [65]. He found that this quantity decreased with increased strain rate. This is in accordance with expectations, for at higher strain rates a greater number of dislocations will have velocities greater than the critical value v*, and will thus break away from their atmospheres-and not drag solute species along.
The Sporadic Nature Of Mechanical Effects Related To Hydrogen Absorption In Metals
It has been known for a long time that the presence of hydrogen introduced during processing, as well as from the environment, can have an important, and generally deleterious, effect upon the mechanical properties of steels. A summary of much of the early work in this area was presented by Troiano [73].
One of the important characteristics of these phenomena is their sporadic and unpredictable nature. Delayed failure is commonly observed with hydrogen embrittlement and the related observations of stress-corrosion cracking. The term "static fatigue" has often been used to describe these hydrogen-related, time-dependent mechanical effects. Important early contributions to the study of the delayed failure phenomenon were made by Bastien and his co-workers [74], and a useful discussion of the state of knowledge in this area was presented in the review by Oriani [16].
One of the primary early goals of the work on these problems has been the establishment of methods with which one could obtain reproducible test results. This is quite similar to the current status of the "solid state fusion" area.
Especially important was the determination of the initiation time for the generation of cracks with the critical characteristics such that they would propagate. Highly variable incubation times of months, sometimes years, were often observed. An example of typical data is illustrated in Figure 6, in which the time to failure of a group of samples of AISI 4340 steel is shown for three different strength levels [75]. The tremendous scatter along the time scale is clearly evident.
Gradually, it became recognized that hydrogen entry causes time - dependent microstructural changes, and that the critical parameters involve not just the intensity of the applied stress and the environmental variables, but also the influence of the solute content and microstructural parameters upon the yield stress necessary for dislocation motion, as well as other aspects of the microstructure. An illustration of the importance of prior thermo-mechanical treatment that produces changes in microstructure upon the time delay prior to failure [76] is shown in Figure 7. The large influence of the chemical environment upon the relation between the stress intensity and the hydrogen-related crack velocity [77] is shown in Figure 8.

A thorough discussion of the various metallurgical parameters that are involved in the time delay and other features related to the influence of dissolved hydrogen upon the mechanical behavior of steels was presented by Kerns, et al. [45].
A Possible Explanation For The "Burst' Character Of Tritium Emission
A common observation in "solid state fusion" experiments is that tritium emission appears to occur as "bursts" in both gas loading [34] and electrochemical [78-81] experiments. Since the analytical methods generally used for the detection of tritium in the electrochemical experiments are not continuous, but involve periodic sampling, it has not been possible to determine the actual time scale of the reported appearance of tritium.
It is most probable that the tritium that was observed in these experiments was generated inside the palladium [82], but only was detected outside as a result of one or more emission events related to sporadic dislocation motion, as discussed above.
Dislocation Mechanisms That Can Produce Transient Local Hyperioading
It has now been well established that one of the conditions that is necessary in order to observe the generation of excess thermal power and energy in the electrolytic experiments with palladium cathodes is that the sample must have a high average deuterium concentration, i.e. high loading. Another feature that is also apparently useful is that the system be rather abruptly perturbed. Methods by which this is sometimes accomplished include a rapid temperature change, or a jump in the electrolytic current. It is to be expected that these methods also lead to appreciable dislocation motion.
There are two simple ways in which the motion of dislocations can produce transient local "hyperloading" of solute in the palladium. These are illustrated schematically in Figure 9. In one case, breakaway of a dislocation from its solute atmosphere leaves behind a volume of normal crystal that suddenly has a local solute concentration that is higher than the average loading. If the average loading is already near saturation, this produces a local region in the normal crystal structure that is "hyperioaded". The extra solute atoms will, of course, gradually diffuse away with time to relieve this local supersaturation.
Local hyperloading can also occur if two dislocations dragging solute atmospheres that are moving on intersecting slip planes meet. When this occurs, there is also suddenly a local region in the solid that is hyperloaded, with a solute concentration that is essentially the sum of the two atmospheres.
Concluding Comments
Although the electrochemical "solid state fusion" experiments in which deuterium is inserted into palladium may appear to be very simple and unsophisticated, what actually takes place involves the complex interplay of a number of microscopic phenomena.
The details of the local composition and the imposed dynamic phenomena at interfaces can have great importance, because of the influence of the interfacial mechanism during electrolysis, and the presence of promoters or inhibiters can greatly affect the activity of solute species resident in the solid. Under some conditions this solute concentration may be comparable to that which would be present at very large external gas pressures.
The distribution of interstitial species such as hydrogen isotopes in polycrystalline metals is very non-uniform. The strain field around dislocations causes a significant local enhancement of their concentration. Large stresses can be generated as a result of composition gradients and phase changes, leading to plastic deformation, which involves the dynamics of dislocation generation and motion. Because of the preferred association of hydrogen isotopes with dislocations, this results not only in substantial changes in the microstructure but also in significant transport and rearrangement of the solute content within the solid.
It is well known that the presence of hydrogen isotopes produces large and time -dependent effects upon the dislocation-related mechanical properties of metals, and workers in that area have long been plagued with some of the same problems of sporadic behavior and apparent irreproducibility that are characteristic of many of the "solid state fusion" experiments at the present time.
Dislocation mechanisms can produce local regions of transient hyperloading, and may be related to the "burst" character of some of the phenomena that are often observed in "solid state fusion" experiments.

REFERENCES
1. T. Graham, Phil. Trans. Roy. Soc. (London) 156, 415 (1866).
2. T. Graham, Proc. Roy. Soc. (London) 16, 422 (1868).
3. T. Graham, Phil. Mag. 36, 63 (1868).
4. C. Wagner, K. Hauffe, Z. Elektrochem. 44, 172 (1938).
5. C. Wagner, K. Hauffe, Z. Elektrochem. 45, 409 (1939).
6. H. J. Schoennagel, C. Wagner, Ber. Bunsenges. phys. chem. 69, 699 (1965).
7. H. Kobayashi, C. Wagner, J. Chem. Phys. 26, 1609 (1957).
8. H. Sdunalzried, C. Wagner, Trans. AIME 227, 539 (1963).
9. E. Bechtold, Ber. Bunsenges. phys. chem. 69, 328 (1965).
10. M. I. Temkin, V. Pyzhev, Zhur. Fiz. Xhim. 13, 851 (1939).
11. M. I. Temkin, V. Pyzhev, Acta Physicochimica 12, 327 (1940).
12. C. Kemball, Disc. Faraday Soc. 41, 190 (1966).
13. S. Ichikawa, Chem. Eng. Sci. 44, 2754 (1989).
14. M. Boudart, Catalysis Letters 3, 111 (1989).
15. C. Wagner, Adv. in Catalysis 21, 323 (1970).
16. R. A. Oriani, in Annual Review of Materials Science R. A. Huggins, Ed. (1978), pp. 327.
17. P. K. Subramanyan, in Comprehensive Treatise of Electrochemistry (Plenum, 1981), pp. 411.
IS. R. N. Iver, H. W. Pickering, in Annual Review of Materials Science, R. A. Huggins, Ed. (1990), pp. 299.
19. E. Wicke, H. Brodowski, in Topics in Applied Physics, Vol 29 G. Alefeld, J. Volk', Eds. (Springer, 1978), pp. 73.
20. G. Holleck, E. Wicke, Z. Physik. Chem. N.F. 56, 155 (1967).
2649
21. P. C. Searson, to be published
22. a). B. Baranowski, S. Majchrzak, T. B. Flanagan, J. Phys. F: Metal Phys. 1, 258 (1971), b). Y. Fukai, Z. Phys. Chem. N. F. 163, 165 (1989).
23. H. Wagner, in Hydrogen in Metals G. Alefeld, J. VOlkl, Eds. (Springer, 1978), pp. 5.
24. H. Peisl, in Topics in Applied Physics, Vol 28 (Springer, 1978), pp. 53.
25. J. E. Worsham, M. G. Wilkinson, C. G. Shull, J. Phys. Chem. Solids 3, 303 (1957).
26. K. Skold, G. Nelin, J. Phys. Chem. Solids 28, 2369 (1967).
27. H. A. Wriedt, L. S. Darken, Trans. Met. Soc. AIME 233, 111 (1965).
28. H. Podgurski, R. A. Oriani, F. N. Davis, Trans. Met. Soc. AIME 245, 1603 (1969).
29. Y. Sasaki, T. Matsumoto, Japan J. Appl. Phys. 11, 617 (1972).
30. T. B. Flanagan, J. F. Lynch, J. D. Clewley, B. v. Turkovich, J. Less Common Metals 49, 13 (1976).
31. T. B. Flanagan, J. F. Lynch, J. Less Common Metals 49, 25 (1976).
32. J. A. Ferrante, G. Lucier, M. Schreiber, T. M. Gil'', R. A. Huggins, unpublished research.
33. J. P. Laurent, G. Lapasset, M. Aucouturier, P. Lacombe, in Hydrogen in Metals I. M. Bernstein, A. W. Thompson, Eds. (ASM, 1974), pp. 559.
34. P. K. Ivengar, M. Srinivasan, in First Annual Conference on Cold Fusion Salt Lake City, UT, 1990),
33. M. C. H. McKubre, et al., in First Annual Conference on Cold Fusion Salt Lake City, 1990),
36. G. Sicking, H. Buchold, Z. Naturforsch. 26a, 1973 (1971).
37. C. Sicking, M. Glugla, B. Huber, Ber. Bunsenges. Phys. Chem. 87, 413 (1933).
33. . D. Kapusta, T. T. Kam and K. E. Heusier, Z. phys. Chem. N. F. 123, 219 (1980).
39. M. E. Arrnacanqui, R. A. Oriani, Mat. Sci. Eng. 91, 143 (1987).
26-20

40. T. Schober, H. Wenzi, in Hydrogen in Metals II G. Alefeld, J. Volk', Eds. (Springer, 1978), pp. 11.
41. H. C. Jamieson, G. C. Weatherly, F. D. Manchester, I. Less Common Metals 50, 85 (1976).
42. E. T. C. Ho, H. A. Goldberg, G. C. Weatherly, F. D. Manchester, in Proceedings of Second International Congress on Hydrogen in Metals Paris, (1977), pp. 2B3.
43. J. F. Lynch, J. D. Clewley, T. B. Flanagan, Phil. Mag. 23, 1415 (1973).
44. W. Baukloh, G. Zimmermann, Arch. Eisenhiittenwesen 9, 459 (1936).
45. M. Smialowski, Z. Szklarska-Smialowska, Bull. Acad. pol. Sci. CL, III 2, 73 (1954).
46. G. E. Kerns, M. T. Wang, R. W. Staehle, in International Conference on Hydrogen Embrittlement and Stress Corrosion Cracking of Iron Base Alloys Unieux, France, 1973),
47. R. D. McCright, R. W. Staehle, in International Conference on Hydrogen Embrittlement and Stress Corrosion Cracking in Iron Base Alloys Unieux, France, 1973).
48. T. P. Radhakrishnan and L. L. Schreir, Electrochimica Acta 11, 1007 (1966).
49. J. F. Newman, L. L. Shreir, Corrosion Sci. 9, 631 (1969).
50. S. Nakahara, Y. Okinaka, J. Electrochem. Soc. 136, 1892 (1989).
51. J. Wild, G. Alefeld, in Hydrogen in Metals I G. Alefeld, J. Volkl, Eds. (Springer-Verlag, 1978), pp. 321.
52. H. Hasegawa and K. Nakajima, J. Phys. F 9, 1035 (1979).
53. A. Falanga, M. Schreiber, R. A. Huggins, presented at World Hydrogen Energy Conference #8, Honolulu (1990), to be published
54. R. Kirchheim, Scripta Metall. 14, 905 (1980).
55. R. Kirchheim, Acta Metall. 29, 835 (1981).
56. R. Kirchheim, Acta Metall. 29, 845 (1981).
26-21

57. P. Bastien, P. Azou, C. R. Acad. Sci. Paris 232, 1845 (1951).
58. R. C. Frank, in Internal Stresses and Fatigue in Metals G. M. Rassweiler, W. L. Grube, Eds. (Elsevier, 1959), pp. 411. -
59. R. Broudeur, J. P. Fidelle, H. Auchere, in Int. Cong. Hydrogen in Metals (Editions Science et Industrie, Paris, 1972), pp. 106.
60. M. R. Louthan Jr., et al., Mater. Sci. Eng. 10, 357 (1972).
61. P. G. Bastien, in Physical Metallurgy of Stress Corrosion fracture T. N. Rhodin, Eds. (Intersdence, 1959), pp. 311.
62. B. A. Graville, R. G. Baker, F. Watkinson, Brit. Welding Jour. 14, 337 (1967).
63. A. W. Thompson, Met. Trans. 5, 1855 (1974).
64. A. W. Thompson, Met. Trans. A 6A, 1431 (1975).
65. J. A. Donovan, Met. Trans. A 7A, 1677 (1976).
66. J. K. Tien, et al., Met. Trans. A 7A, 821 (1976).
67. B. A. Wilcox, G. C. Smith, Acta Met. 13, 331 (1965).
68. T. Boniszewski, G. C. Smith, Acta Met 11, 165 (1963).
69. J. S. Blakemore, Met. Trans. 1, 145 (1970).
70. A. H. Cottrell, Dislocations and Plastic Flow in Crystals (Clarendon Press, Oxford, 1953).
71. N. F. Fiore, C. L. Bauer, Pros. Mater. Sci. 13, 87 (1967).
72. J. J. Gilman, Micromechanics of Flow in Solids (McGraw-Hill, 1969).
73. A. R. Troiano, Trans. ASM 5, (1960).
74. P. Bastien and P. Azou, in Proceedings of First World Metallurgical Congress, (ASM, Cleveland1951), p. 535.
75. P. C. Hughes, I. R. Lamborn and B. B. Liebert, J. Iron and Steel Institute 203, 156 (1965).
76. R. T. Ault and e. al., Trans. ASM 60, 79 (1967).
26-22

77. P. McIntyre and A. H. Priest, . British Steel Corp. Corporate Laboratories Report MG/31/72, 1972).
78. J. 0. Bockris and e. al., in Proceedings- of First Annual Conference on Cold Fusion, Salt Lake City, 1990), p. 137.
79. E. Storms and C. Talcott, in Proceedings of First Annual Conference on Cold Fusion, Salt Lake City,1990), p. 149.
80. E. Storms, C. Talcott, M. A. David, in NSF/EPRI Workshop on Anomalous Effects in Deuterated Materials Washington, DC, 1989),
81. M. Fleischmann, to be published in Proceedings of the NSF/EPRI Workshop on Anomalous Effects in Deuterated Metals Washington, DC, 1989).
82. F. G. Will, K. Cedzynska and D.C. Linton, J. Electroanal. Chem. 360, 161 (1993)

FIGURE CAPTIONS
Figure 1. Effect of Several Poison Additions, as well as the Cathodic Current Density, on the Permeation Rate of Hydrogen Through Low Strength Steel [48].
Figure 2. Influence of the Degree of Prior Plastic Deformation V Upon the Chemical Diffusion Coefficient of Tritium in Palladium [19].
Figure 3. Rate of Tritium Release and Plastic Strain in a Type 304 Stainless Steel [63].
Figure 4. Correlation of the Rate of Tritium Release With Yielding in a 3086 Aluminum Alloy [65].
Figure 5. Influence of the Degree of Plastic Strain Upon the Mobile Dislocation Density [72].
Figure 6. Data Showing the Tremendous Scatter in the Time at Which Delayed Failure Occurred in Different Samples of AISI 4340 Steel Under Applied Stress. The
Deleterious Influence of Increased Strength Level is Also Clearly Evident [75].
Figure 7. The Influence of Prior Thermo-Mechanical Treatment Upon the Time Delay Prior to Failure of D6AC Steel in Distilled Water Environment [76].
Figure 8. Data Showing the Large Influence of the Chemical Environment Upon the Relation Between the Stress Intensity and the Hydrogen - Related Crack Velocity
of 835M30 Steel [77].
Figure 9. Dislocation Breakaway Mechanism That Could Produce Transient Local Hyperloading
Figure 10. Dislocation Intersection Mechanism That Could Produce Transient Local Hyperloading
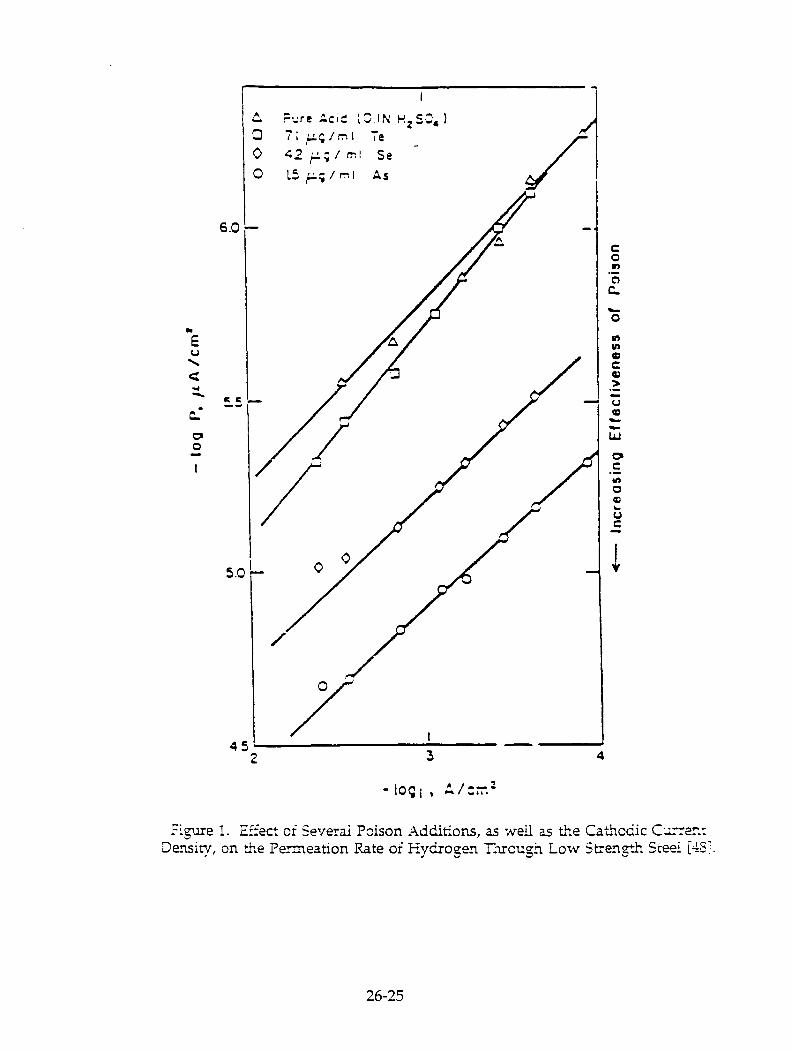
E
6.0H
C C
5.0
45 ,. 2
C. ,re Acid H 2 ,504 ) CZ 7; p.vrni Te 0 4 2 J.: / fr.! Se 0 l5 LLcirril As
3
Incr
ea
sin
g E
ffe
cti
ven
ess
of
0 1,
Figure 1. Effect of Several Poison Additions, as well as the Cathodic Current Density, on the Permeation Rate of Hydrogen Through Low "Stench Steel [48.L
26-25

Figure 2. Influence of the Degree of Prior Plastic Deformation V Upon the Chemical Diffusion Coefficient of Tritium in Palladium [19I.

Figure 3. Rate of Tritium Release and Plastic Stain in a Type 304 Stainless Steel [65i.

Figure 4. Correlation of the Rate of Tritium Release With Yielding in a 5086 Aluminum Alloy (651.

Figure 3. Influence of the Degree of Plastic Strain Upon the Mobile Dislocation Density [72].

Figure 6. Data Showing the Tremendous Scatter in the Time at Which Delayed Failure Occurred in Different Samples of AISI 4340 Steel Under Applied Stress. The
Deleterious Influence of Increased Strength Level is Also Clearly Evident [75].

Figure 7. The Influence of Prior Thermo-Mechanical Treatment Upon the Time Delay Prior to Failure of D6AC Steel in Distilled Water Environment (76).

Fizure 8. Data Showing the Large Influence of the Chemical Environment L -pon the Relation Between the Stress Intensity and the Hydrogen - Related Crack Velocity
of 835M30 Steel [77].
26-32

Figure 9. Dislocation Breakaway Mechanism That Could Produce Transient Local Hyperloading
26-33
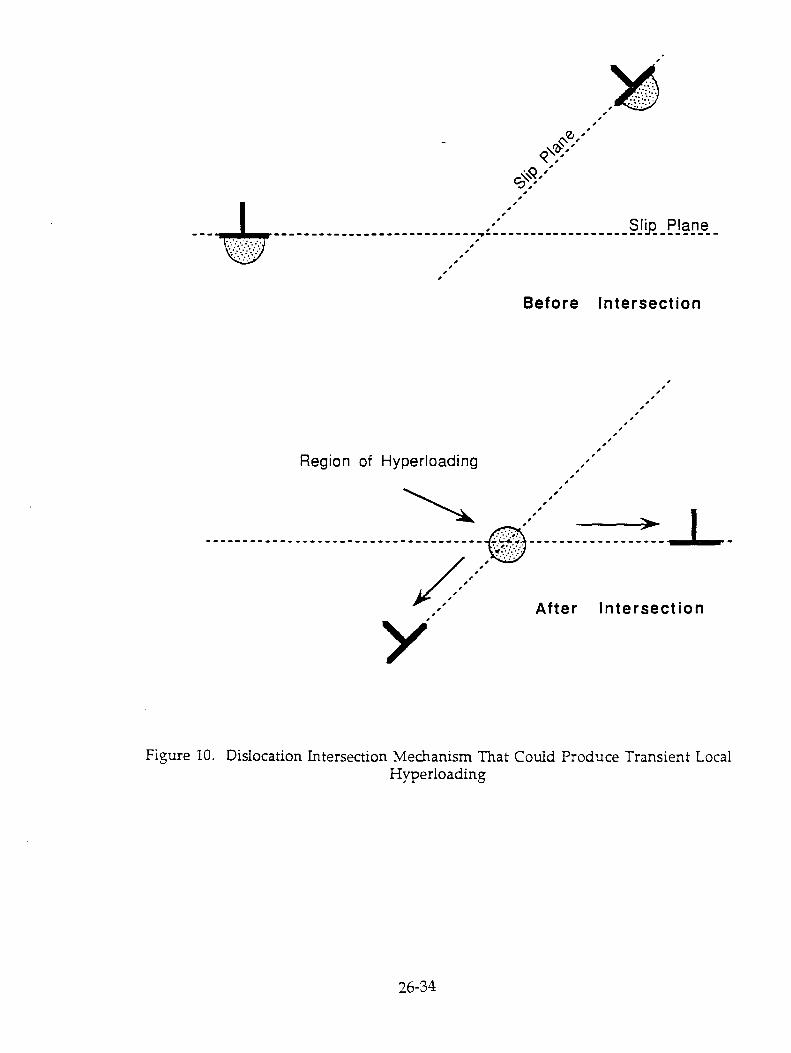
Figure 10. Dislocation Intersection Mechanism That Could Produce Transient Local Hyperloading
26-34

Measurements of Hydrogen Loading Ratio of Pd Anodes Polarized in LiH-LiCI-KCI Molten Salt Systems
H. Okamoto and S. Nezu
IMRA MATERIAL R&D CO., LTD. 5-50 HACHIKEN-CHO
KARIYA, AICHI 448 JAPAN
Abstract
Hydrogen loading ratios of Pd anodes polarized in LiH-KCI-LiC1 molten salt systems were measured at 430 °C using a volumetric method. The values determined at the current density of 300 mA/cm2 are 0.057 and 0.030 for H/Pd and D/Pd, respectively. The electrochemical behavior of the Pd anodes in molten salt systems is presented.
Introduction
Cold fusion reaction in a molten salt system has been reported by Liaw et al. 1 . For heavy water electrolysis, correlation between excess heat and deuterium loading of Pd has been pointed out by several research groups 2, 3 . It has been reported that attaining high deuterium loading of Pd is essentially important to give rise to cold fusion reaction. It is known that the loading ratio (D/Pd) to be attained by electrolysis is higher than that attained by the gas loading method in which a Pd specimen is kept in contact with a deuterium gas, when compared at the same deuterium pressure. The deuterium loading ratios of 0.8 to 1 have often been reported for heavy water electrolysis. On the other hand, relatively few reports have been made for the behavior of Pd electrodes and for deuterium loading of Pd in molten salt systems.
The PTC diagram for a Pd-H system 4 shows that Pd absorbs hydrogen by H/Pd-0.02 at a hydrogen partial pressure of 1 atm at 400 °C, where molten salt electrolysis is to be carried out. It should be noted that the loading ratio at this temperature are much smaller than that at a room temperature (=0.7). Thus, if the attainment of higher loading ratio is one of the criteria for giving rise to cold fusion reaction, a loading ratio to be attained by molten salt electrolysis might be very high. This stimulated our current investigation to measure hydrogen loading ratio of Pd anodes polarized in LiH-LiCI-KCI molten salt systems. In this paper, hydrogen loading ratios (H/Pd, D/Pd) in molten salt systems are presented. Voltammetric data obtained with the Pd anodes in the molten salts are analyzed to understand the electrochemical reactions.
27-1

n 0
1
Experimental
An eutectic molten salt of LiCI-KCI (59 : 41 mole %, Wako Chemical) was used for an electrolyte. The LiCI-KCI mixture of the eutectic composition was dried under a vacuum at 200 °C, and then melted at 430 °C in an aluminum crucible placed in a separable flask. Then a suitable amount of LiD (Aldrich) or LiH (Wako Chemical) was added to the mixture. The electrolysis was carried out in an argon dry box with minimum oxygen and moisture content. A typical molten salt experimental setup is schematically shown in Fig. 1. Both Pd and Ni rods (1.5 - 2 mm in diameter, 3 - 10 mm in length, IMRA Material) are used as the anodes in separate experiments. An Al wire was used as the cathode. A Ni wire was used as the quasi reference electrode, whose potential was calibrated against a Li/Li+ equilibrium potential by measuring the potential difference between the Ni wire and another Ni wire on which Li was deposited electrochemically. The potential of the reference electrode was calibrated every time the experimental conditions were changed.
Voltammmetry was conducted using a HA501 potentiostat (Hokuto Denko) with a 11B104 function generator. The measurements of hydrogen overvoltage were carried out using the current interrupt method.
The hydrogen loading ratios were determined by measuring the amount of the evolved gas during galvanostatic electrolysis using a mass flow meter (KOFLOC, Model-3710) or a gas burette (Fig. 1). The amount of the hydrogen absorbed into Pd was calculated by taking the difference between the amount of the evolved gas and the one from the quantity of electricity. The mass flow meter was mainly used to observe the gas evolution behavior and to estimate the loading ratio roughly. More accurate measurements were made using the gas burette.
a : Pd anode, b : Al cathode c : LiCl-KC1 molten salt d : Aluminum crucible e : Aluminum protection tube f : Separable flask g : Heating mantle h : Dry box, i : Gas burette j : Silicon oil k : Water jacket 1 : Levelling bulb m : Thermocouple n Thermocontroller o : Galvanostat
Fig. 1. Hydrogen absorption measurement system for molten salt systems.
27-2

Results and Discussion
Prior to the measurements of the loading ratio we studied the electrochemical behavior of Pd anodes in a molten salt. Fig. 2 shows two cyclic voltammograms obtained with a Pd and a Ni electrode in a LiC1-KC1 molten salt at 430 °C. The waves obtained for the Ni electrode correspond to the reduction and oxidation of Li. It should be noted for the Pd electrode that ambiguous cathodic waves appear at potentials positive with respect to the potential for Li deposition onto the Ni electrode. The electrochemical reactions corresponding to these waves have been found to be the formation of Pd-Li alloys with various compositions 5 .
When LiH was added to the LiCI-KCI molten salt, the rest potential of the Pd electrode changed f om +2400 to +580 mV(vs. Li/Li+). This potential, 580 mV corresponds to the starting potential for the Pd-Li alloy formation as described above. This means that the Pd electrode is chemically reduced to form Pd-Li alloys by the addition of LiH. Thus this rest potential should originates from the equilibrium potentials of the following reactions.
x Pd + a Li+ + b PdxLiy Hz + (a y) Li+ + + (z y) e- H- T._> 1/2 H2 + e -
Figure 3 shows cyclic voltammograms obtained by scanning anodically from the rest potentials for a Pd ane Ni electrode. For the Ni electrode, it is seen that one wave which corresponds to the oxidation of hydride ions appears. For the Pd electrode, on the other hand, overlapping with several waves can be seen. The electrochemical reactions corresponding to the waves should be as follows:
PdxLiyHz PdxLiy_a Hz + a Li+ + a Pd + x PdHx + x
1/2 H2 + e-
Fig. 2. Cyclic voltammograms obtained with a Pd and a Ni electrode in a LiCI-KC1 molten salt at 430°C. (a) WE : Ni (S = 0.31cm 2), (b) WE : Pd (S = 0.13cm 2 ). Scan rate : 100 mV/sec.
27-3

Fig. 3. Cyclic voltammograms obtained with a Pd and a Ni electrode in a LiH-LiCI-KC1 molten salt at 430°C. (a) WE : Ni (S = 0.31cm2); (b) WE : Pd (S = 0.13cm 2). Scan rate : 100 mV/sec; LiH : 4.03 mole %.
Figure 4 shows typical mass flow meter responses to switching on and off constant current electrolysis for a Pd and a Ni anode. For the Ni anode, the gas evolution began and stopped immediately on switching on and off the electrolysis, respectively. For the Pd anode, on the other hand, delays in the response were observed on switching on and off, as shown in Fig. 4, indicating the hydrogen absorption and desorption. The hydrogen absorption was saturated in 15 minute with a Pd rod 2 mm thick and 10 mm long at the current of 500 mA. From the steady state gas flow rate, it was confirmed that the current efficiency was —100 %. The estimated loading ratio with this technique were 0.07 (H/Pd) and 0.06 (D/Pd).
Fig. 4. Typical responses of the mass flow meter for a Pd and a Ni electrode upon switching on and off the electrolysis. LiH : 12.2 mole %; current : 500 mA.
27-4
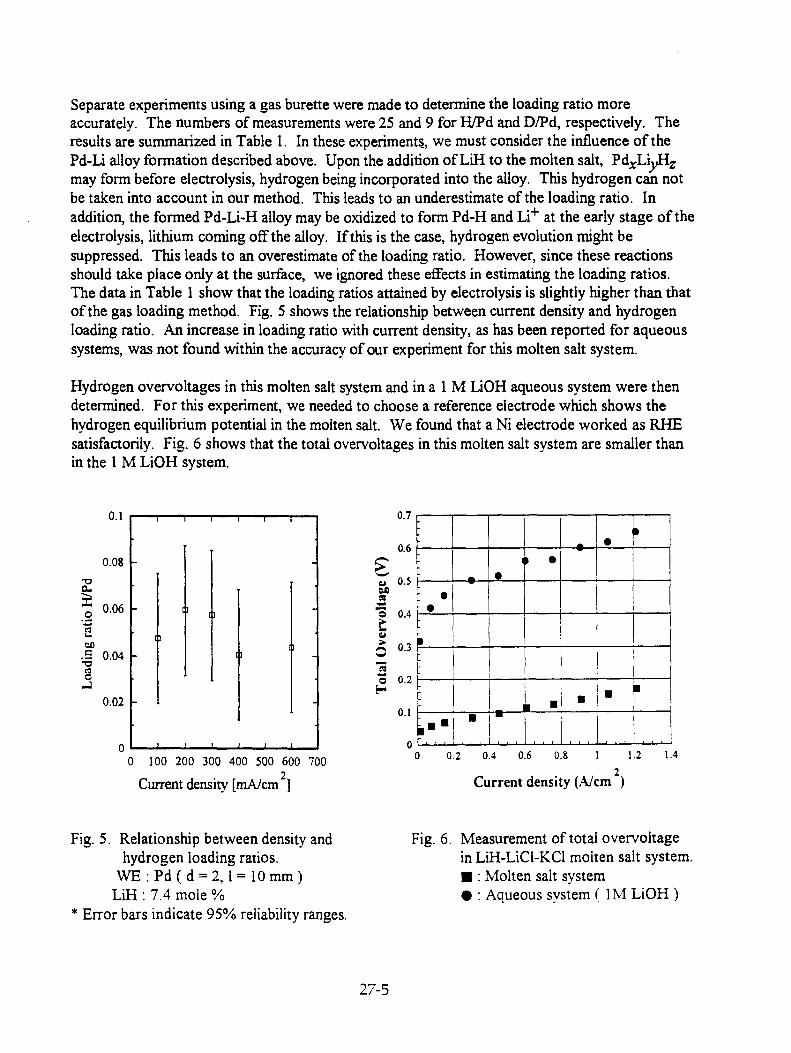
Separate experiments using a gas burette were made to determine the loading ratio more accurately. The numbers of measurements were 25 and 9 for H/Pd and D/Pd, respectively. The results are summarized in Table 1. In these experiments, we must consider the influence of the Pd-Li alloy formation described above. Upon the addition of LiH to the molten salt, Pd xLiyHz
may form before electrolysis, hydrogen being incorporated into the alloy. This hydrogen can not be taken into account in our method. This leads to an underestimate of the loading ratio. In addition, the formed Pd-Li-H alloy may be oxidized to form Pd-H and Li + at the early stage of the electrolysis, lithium coming off the alloy. If this is the case, hydrogen evolution might be suppressed. This leads to an overestimate of the loading ratio. However, since these reactions should take place only at the surface, we ignored these effects in estimating the loading ratios. The data in Table 1 show that the loading ratios attained by electrolysis is slightly higher than that of the gas loading method. Fig. 5 shows the relationship between current density and hydrogen loading ratio. An increase in loading ratio with current density, as has been reported for aqueous systems, was not found within the accuracy of our experiment for this molten salt system.
Hydrogen overvoltages in this molten salt system and in a 1 M LiOH aqueous system were then determined. For this experiment, we needed to choose a reference electrode which shows the hydrogen equilibrium potential in the molten salt. We found that a Ni electrode worked as RHE satisfactorily. Fig. 6 shows that the total overvoltages in this molten salt system are smaller than in the 1 M LiOH system.
Fig. 5. Relationship between density and hydrogen loading ratios.
WE : Pd ( d = 2, I= 10 mm ) LiH : 7.4 mole %
* Error bars indicate 95% reliability ranges.
Fig. 6. Measurement of total overvoltage in LiH-LiCl-KC1 molten salt system. ■ : Molten salt system • : Aqueous system ( 1M LiOH )

Table 1. Hydrogen loading ratios of Pd in a molten salt and a aqueous system.
Molten salt system Aqueous system Hs gas system
Method Gas burette Mass flow meter Gas burette Gas loading
Electrolyte LiH LiD LiH LiD LiOH LiOD
Loading ratio H(D)/Pd
* 0.057
** 0.030 0.07 0.06 0.84 0.76 < 0.02
* Mean value in 25 measurements. ** Mean value in 9 measurements.
References
1.B. Y .Liaw et al., J. Electroanal. Chem., 319, 161 (1991). 2. M. C. H. McKubre et al., Proceedings of the Third International Conference on Cold Fusion,
Universal Academy Press, Inc.,p5 (1992). 3. K. Kunimatsu et al., Proceedings of the Third International Conference on Cold Fusion,
Universal Academy Press, Inc.,p31 (1992). 4. P. L. Levine and K. E. Weale, J. Chem. Soc. Faraday Trans, 56, 357 (1960). 5. T. Nohira, K.Amezawa and Y.Ito, Proceedings of the 60th meeting of the Electrochemical
Society of Japan, 259 (1993).
27-6

Movement of Li during electrolysis of 0.1 M-LiOD/D 20
solution.
Shinya MIYAMOTO, Keisuke SUEKI, Kanako KOBAYASHI, Masatoshi FUJII, Masami CHIBA, and Hiromichi NAKAHARA. Faculty of Science, Tokyo Metropolitan University Minami-osawa 1-1, Hachioji, Tokyo, 192-03, Japan
Toshiaki SHIRAKAWA Department of Social Information Proceeding,Otsuma Women's University Karakida 2-7-1, Tama, Tokyo, 206, Japan
Takayuki KOBAYASHI School of Hygienic Science, Kitasato University Kitasato 1-15-1, Sagamihara, Kanagawa, 228, Japan
Minoru YANOKURA and Michi ARATANI Institute of Physical and chemical research (RIKEN) Hirosawa 2-1, Wako,Saitama, 351-01, Japan
Abstract Depth profile and concentration of Li, D, and H were measured for the Pd cathode after
electrolysis of 0.1M-LiOD/D 20 solution. All of Pd cathodes had Li in the range of 1X10 -3 to 1X10- ' in terms of Li/Pd ratio. D was found depleted and/or replaced by H after electrolysis
when Pd cathode was left in the air. Excess heat was also measured during the electrolysis, and no excess heat was observed
within the uncertainty of 6.8%.
Introduction Since M.Fleischmann & S.PonsW and S.Jones et a1. (2) reported the cold fusion phenomena
which they claimed to proceed through next reactions, many scientists tried to verify the phenomena.
d + d 'He ( 0.82MeV ) + n ( 2.45MeV ) <1> d + d 31-1 ( 1.01MeV ) + p ( 3.02MeV ) <2> d + d °He + y + 23.4MeV <3>
But because of difficulty of reproducing the subtle experimental conditions, the truth of cold fusion has not been ascertained yet. In the previous work (3), we searched for protons that were expected from reaction <2>, but only the upper limit of 1.35X10 24 was obtained for the fusion rate of d-d pairs per second.
We also reported in reference (3) that Li in the electrolyte was deposited into the Pd cathode during the electrolysis of 0.1M-LiOD/D 20 solution.
This work investigates the depth profile and concentrations of Li, D, and H inside the Pd cathode by Elastic Recoil Detection Analysis (ERDA) (4) , and effects of various electrolysis conditions on the Li deposition. Measurements of excess heat during electrolysis was also performed.
28-1

Figure 1 The cell for the electrolysis.
Experiments 1. The electrolysis cell.
A new cell was designed and built for the electrolysis. As shown in Figure 1, this is made of teflon, and open to the air only through a Si oil bubbler. It was placed inside a dewer vessel for thermal insulation from the environment and cooled by the forced flow of water through a copper pipe. The dewer vessel was placed inside a vinyl house for keeping it from the air flow in the room. The difference of the water temperature between the inlet and outlet was monitored by thermocouples. The heat property of the cell and the cooling system was examined by placing a 2W heater at the position of electrodes and found that 90% of the input heat was taken away by the cooling system while the electrolyte (40m1) temperature reached to a constant of 30°C which was in excess of 24°C above the ambient temperature.
The 0.5%-Pd alumina pellets ( NE Chemcat Co. Lot No.: 256-18130) were fixed above the electrolyte solution inside the cell as a recombination catalyst of D2 and 02 gas into D20. The 10X10X3mm Pd plate used for cathode and the 1mm4) Pt wire used for anode were Ichimura Metals Co., respectively. The enrichment (0.1M-LiOD/D 20 solution) was 99.96 atom% D Company).
supplied by Tanaka Kikinzoku Co. and of D20 and LiOD used as electrolyte (ISOTEC INC., A Matheson, USA
Table I The conditions of electrolysis.
MRUN Time (h) Electrolyte Mode * Cathode voltage(V)
Currents(A) Charge(C)
01 140.3 LiOD P -0.8 - -1.31 0.037 - 0.625 2.47X10 5
03 214.4 LiOD P -0.8 - -1.25 0.030 - 0.002 1.64X10 4
04 182.8 LiOD P < -2.15 1.100 - 0.400 4.03X10 5
05 261.9 LiOD P -2.65 - -3.32 1.130 - 0.146 1.87X10 5
07 287.2 LiOD G -2.62 - -3.37 0.40 4.14X10 5
08 549.2 LiOD G n.m. ** 0.40 7.91X10 5
09 957.7 LiOD G -3.03 - -4.37 .
0.40 1.38X10°
* P and G mean potentiostat and galvanostat, respectively. ** n.m. ; not measured.
28-2

2. Conditions of electrolysis and measurements. The conditions of electrolysis are shown in Table I. Two kinds of electrolysis modes were
employed ; constant cathode potential with respect to a reference electrode of a Pt wire (Potentiostat) and constant currents (Galvanostat). In the constant potential mode, electrolysis of D20 initially began at the cathode voltage of -0.85V but it was observed to become less negative at the end of electrolysis, probably due to the change in the electrochemical property of the surface of the reference electrode. In MRUNO3 - 05, a reverse vial was applied before electrolysis for a few seconds for cleaning the Pd surface. In MRUN07, D2 gas was charged to the Pd cathode before electrolysis
All the handling of a cell was conducted in the glove box filled with N2 gas. The current, input voltage, reference voltage, and the temperature of the electrolyte and the
ambient or cooling water, and difference of the inlet and outlet of cooling water were monitored.
3.Depth profile of Li, D, and H For studying the depth profile
of Li, D and H in the Pd cathode, ERDA was performed in a scattering chamber installed at the Al beam course of the RIKEN's heavy ion Liner ACcelerator (RILAC). The experimental set-up is shown in Figure 2 . 51 MeV or 60 MeV Ar' beams from RILAC were used. The Pd plate was placed at the center of the chamber at the angle of 30° with respect to the beam and forward-recoiled Li, D, and H ions were detected by
L a solid-state detector at 37°. In r mute getup JOT CICLJA order to stop the scattered Ar beam, a thin Al foil was inserted in front of the detector. The detection system was calibrated by use of pure LiH compound and by Rutherford Front Scattering ( RFS ) of Ar by Pd. In order to explore the effect on the amounts of D and H in Pd of preservation conditions during the time after electrolysis and before ERDA analysis, D : gas loaded Pd plates were left standing for two days under various conditions, in air, N2 gas, Ar gas, Table II Input heat and output heat. D20 and H20, and ERDA analysis were performed. For loading D2 gas a Pd plate was placed in about twenty atm D. gas for one day.
Results and Discussion 1.Excess heat measurements
Excess heat measurements were performed in MRUN01, 05, 07 and 09 and the results of total input heat and output heat are given in Table II.
MRUN Input (MJ) Output (MJ)
01 1.090 1.082±0.073
05 1.659 1.654±0.112
07 2.921 2.921±0.196
09 10.25 10.37±0.705
28-3
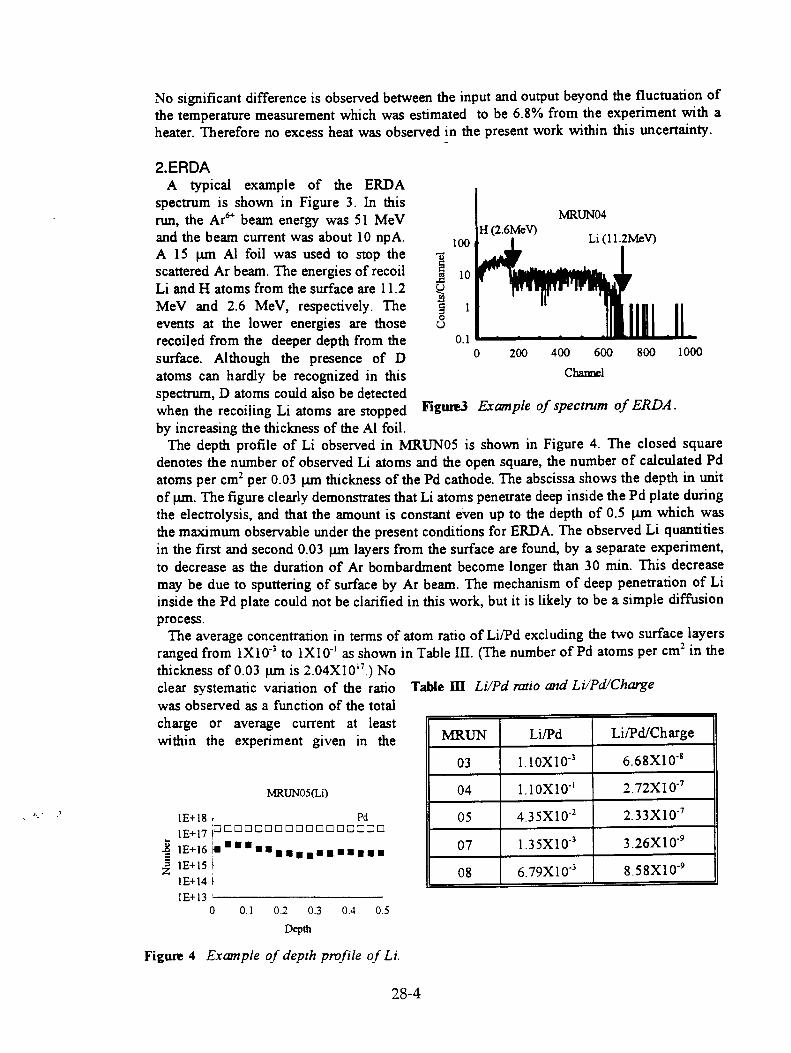
No significant difference is observed between the input and output beyond the fluctuation of the temperature measurement which was estimated to be 6.8% from the experiment with a heater. Therefore no excess heat was observed in the present work within this uncertainty.
2.ERDA A typical example of the ERDA
spectrum is shown in Figure 3. In this run, the Ar6+ beam energy was 51 MeV and the beam current was about 10 npA. 100 A 15 pm Al foil was used to stop the scattered Ar beam. The energies of recoil Li and H atoms from the surface are 11.2 MeV and 2.6 MeV, respectively. The events at the lower energies are those
MRUNO4 H (2.6MeV)
recoiled from the deeper depth from the 0.1 surface. Although the presence of D 0
atoms can hardly be recognized in this spectrum, D atoms could also be detected when the recoiling Li atoms are stopped Figure3 Example of spectrum of ERDA.
by increasing the thickness of the Al foil. The depth profile of Li observed in MRUNO5 is shown in Figure 4. The closed square
denotes the number of observed Li atoms and the open square, the number of calculated Pd atoms per cm2 per 0.03 pm thickness of the Pd cathode. The abscissa shows the depth in unit of pm. The figure clearly demonstrates that Li atoms penetrate deep inside the Pd plate during the electrolysis, and that the amount is constant even up to the depth of 0.5 p.m which was the maximum observable under the present conditions for ERDA. The observed Li quantities in the first and second 0.03 pm layers from the surface are found, by a separate experiment, to decrease as the duration of Ar bombardment become longer than 30 min. This decrease may be due to sputtering of surface by Ar beam. The mechanism of deep penetration of Li inside the Pd plate could not be clarified in this work, but it is likely to be a simple diffusion process.
The average concentration in terms of atom ratio of Li/Pd excluding the two surface layers ranged from 1X10 -3 to 1X10' as shown in Table III. (The number of Pd atoms per cm 2 in the thickness of 0.03 prn is 2.04X10".) No clear systematic variation of the ratio Table III Li/Pd ratio and Li/Pd/Charge
was observed as a function of the total
200 400 600 800 1000
Channel
charge or average current at least within the experiment given in the
MRUN05(Li)
1E+18 r Pd 1E+17 121000013171000OCIC:2.:20
1E+16 t• ••• ••••• • ••••••• 2 1E+15
1E+14 f 1E+13
0 0.1 0.2 0.3 0.4 0.5 Depth
Figure 4 Example of depth profile of Li.
MRUN Li/Pd Li/Pd/Charge
03 1.10X10⁻³ 6.68X10⁻⁸
04 1.10X10 -1 2.72X1 0-7
05 4.35X10⁻² 2.33X10 -7
07 1.35X10⁻³ 3.26X10⁻⁹
08 6.79X10⁻³ 8.58X10⁻⁹
28-4
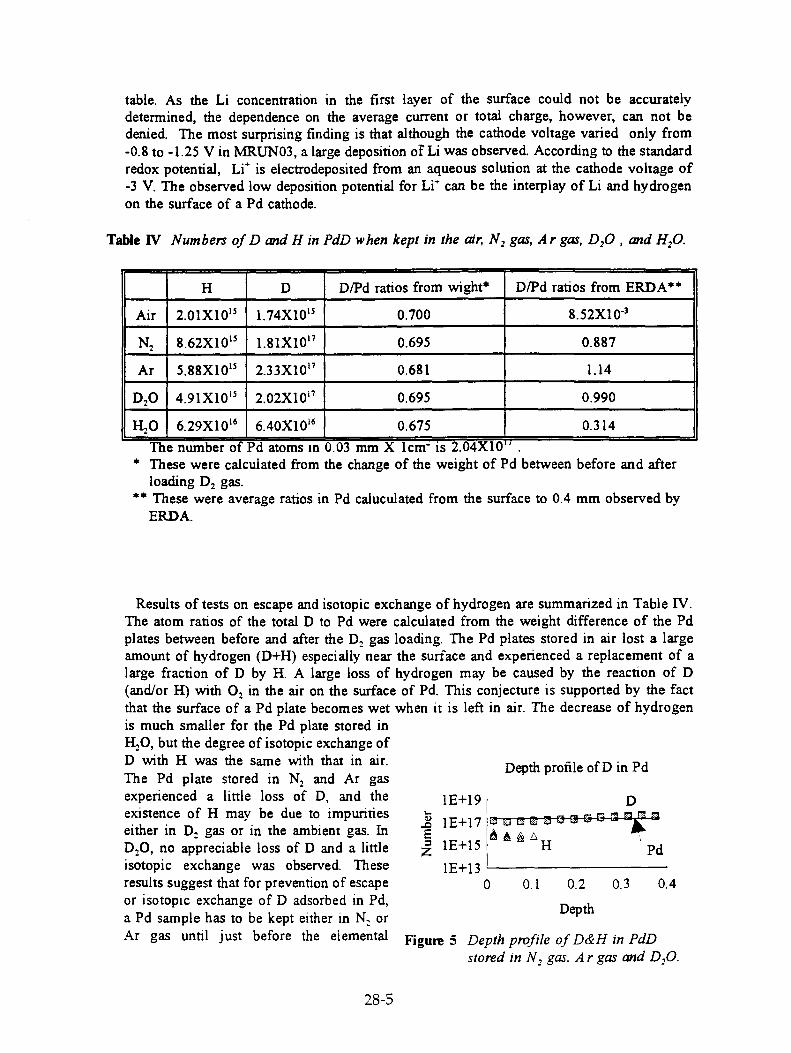
table. As the Li concentration in the first layer of the surface could not be accurately determined, the dependence on the average current or total charge, however, can not be denied. The most surprising finding is that although the cathode voltage varied only from -0.8 to -1.25 V in MRUNO3, a large deposition of Li was observed. According to the standard redox potential, Li' is electrodeposited from an aqueous solution at the cathode voltage of -3 V. The observed low deposition potential for Li' can be the interplay of Li and hydrogen on the surface of a Pd cathode.
Table N Numbers of D and H in PdD when kept in the air, N2 gas, Ar gas, D 20 , and H20.
H D D/Pd ratios from wight* D/Pd ratios from ERDA**
Air 2.01X10" 1.74X10" 0.700 8.52X10 -3
N2 8.62X10" 1.81X10" 0.695 0.887
Ar 5.88X10" 2.33X10" 0.681 1.14
D20 4.91X10" 2.02X10" 0.695 0.990
H20 6.29X10' 6 6.40X10 0.675 0.314
The number of Pd atoms in 0.03 mm X lcm` is 2.04X10" . * These were calculated from the change of the weight of Pd between before and after
loading D2 gas. ** These were average ratios in Pd caluculated from the surface to 0.4 mm observed by
ERDA.
Results of tests on escape and isotopic exchange of hydrogen are summarized in Table N. The atom ratios of the total D to Pd were calculated from the weight difference of the Pd plates between before and after the D, gas loading. The Pd plates stored in air lost a large amount of hydrogen (D+H) especially near the surface and experienced a replacement of a large fraction of D by H. A large loss of hydrogen may be caused by the reaction of D (and/or H) with 0 2 in the air on the surface of Pd. This conjecture is supported by the fact that the surface of a Pd plate becomes wet when it is left in air. The decrease of hydrogen is much smaller for the Pd plate stored in H20, but the degree of isotopic exchange of D with H was the same with that in air. Depth profile of D in Pd The Pd plate stored in N2 and Ar gas experienced a little loss of D, and the 1E+19 existence of H may be due to impurities either in D2 gas or in the ambient gas. In .2 1E+17urcrart:rtr-fr-154:44""Vi2
6 H D20, no appreciable loss of D and a little 1E+15 Pd
isotopic exchange was observed. These 1E+13 results suggest that for prevention of escape 0 0.1 0.2 0.3 0.4 or isotopic exchange of D adsorbed in Pd,
Depth a Pd sample has to be kept either in N2 or Ar gas until just before the elemental Figure 5 Depth profile of D&H in PdD
stored in N, gas, A r gas and D 20.
28-5
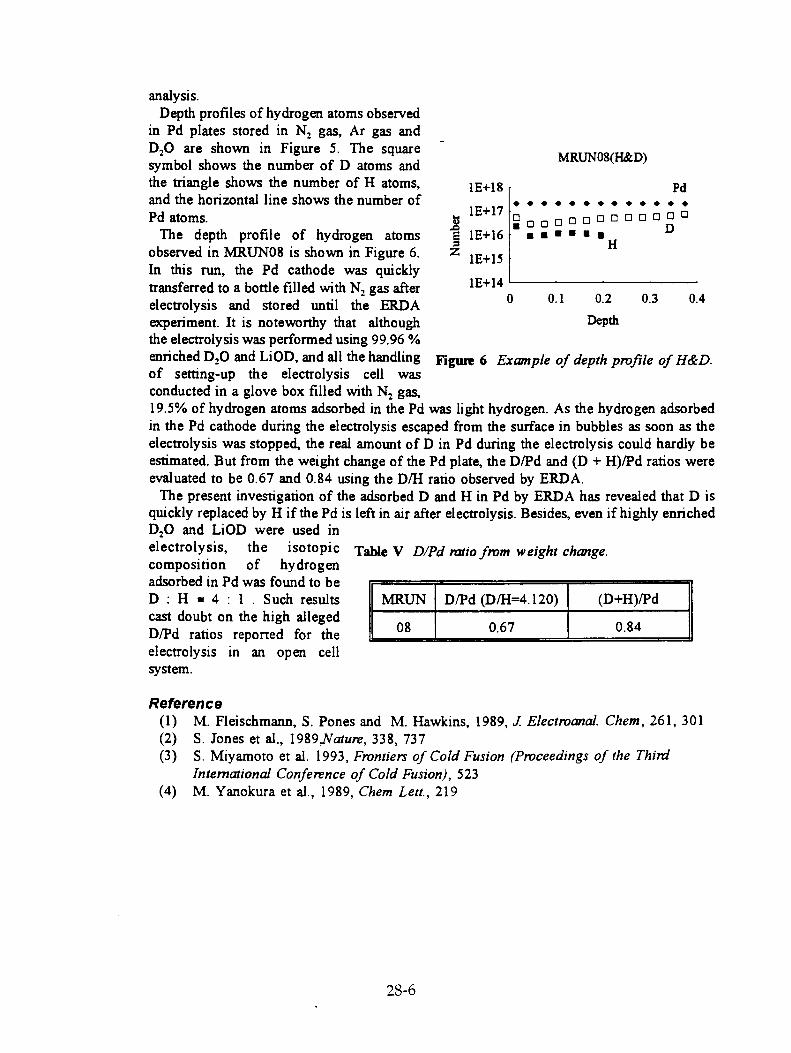
analysis. Depth profiles of hydrogen atoms observed
in Pd plates stored in N2 gas, Ar gas and D20 are shown in Figure 5. The square symbol shows the number of D atoms and the triangle shows the number of H atoms, and the horizontal line shows the number of Pd atoms.
The depth profile of hydrogen atoms observed in MRUNO8 is shown in Figure 6. In this run, the Pd cathode was quickly transferred to a bottle filled with N2 gas after electrolysis and stored until the ERDA experiment. It is noteworthy that although the electrolysis was performed using 99.96 % enriched D20 and LiOD, and all the handling Figure 6 Example of depth profile of H&D. of setting-up the electrolysis cell was conducted in a glove box filled with N2 gas, 19.5% of hydrogen atoms adsorbed in the Pd was light hydrogen. As the hydrogen adsorbed in the Pd cathode during the electrolysis escaped from the surface in bubbles as soon as the electrolysis was stopped, the real amount of D in Pd during the electrolysis could hardly be estimated. But from the weight change of the Pd plate, the D/Pd and (D + H)/Pd ratios were evaluated to be 0.67 and 0.84 using the D/H ratio observed by ERDA.
The present investigation of the adsorbed D and H in Pd by ERDA has revealed that D is quickly replaced by H if the Pd is left in air after electrolysis. Besides, even if highly enriched D20 and LiOD were used in electrolysis, the isotopic Table V D/Pd ratio from weight change. composition of hydrogen adsorbed in Pd was found to be D : H • 4 : 1 . Such results cast doubt on the high alleged D/Pd ratios reported for the electrolysis in an open cell system.
Reference (1) M. Fleischmann, S. Pones and M. Hawkins, 1989, J. Electroanal. Chem, 261, 301 (2) S. Jones et al., 1989,Nature, 338, 737 (3) S. Miyamoto et al. 1993, Frontiers of Cold Fusion (Proceedings of the Third
International Conference of Cold Fusion), 523 (4) M. Yanokura et al., 1989, Chem Lett., 219
MRUN D/Pd (D/H=4.120) (D+H)/Pd
08 0.67 0.84

Deuterium charging in Palladium by the electrolysis of heavy water: measurement of_ the lattice parameter
L.Bertalot(1), F.DeMarco(t), A.DeNinno(t), R.Felici, A.LaBarberaM, F.Scaramuzzi($) and V.Violante(*)
Istituto Struttura della Materia del C.N.R., Via E.Ferrni 38, 1-00044 Frascati, Italy
We report on X-ray diffraction measurements performed during the charging of a palladium anode by the electrolysis of a LiOD-heavy water solution to determine the lattice parameter. In this way we are able to study the dynamics of the process and to determine the D/Pd final ratio of the sample. Up to now we have studied three samples, which have shown very different behaviors. The estimated deuterium concentration was then checked by degassing the anode in a known volume.
Introduction
It is widely accepted that the production of excess heat during the electrolysis of a heavy water solution onto a Palladium anode is strictly related to the concentration of Deuterium inside the metal ( 1 ). It is then crucial to determine the status of charging during the electrolysis (or the gas loading procedure).
Many physical parameters depend on the concentration of Deuterium in the D/Pd binary system. For instance, the resistivity increases almost linearly with respect to the concentration in a wide range before reaching a maximum at a ratio of about 0.8 (2) • The measurement of this parameter has been used to monitor the status of charging of the sample ( 1 ). Unfortunately the resistivity is not a "good" parameter since the value measured after degassing a palladium foil or wire is different from the initial value measured before the charging procedure (3 ). Thus the resistivity measurement can only show the variation of the D/Pd ratio and indicate if the actual value is bigger or smaller than 0.8 but they cannot give an exact value of this ratio.
When we insert Hydrogen or Deuterium atoms in a metal lattice we distort the periodic structure of the guest metal. The increment of the unit cell volume depends only on the H/Metal ratio and is the same for many materials (4) . This is true for Palladium also and the dependence of the lattice parameter in the a and 13 phases on the concentration of Hydrogen or Deuterium has been largely studied (4) . It has been shown from
29-1
measurements at 77 K, that the relation between the lattice parameter of the p phase and the H or D concentration is linear ( 5 ), and, by assuming the thermal expansion of the system to be the same of pure Palladium, the following relation is obtained for the Deuterium case:
C = -23.502 + 5.9904 • a (1)
where "C" is the concentration of D in atomic ratio, and "a" is the lattice parameter in A units. The lattice parameter is generally measured by using the diffraction of an opportune wave by the lattice periodical structure. Either X-rays or neutrons or electrons can be employed for this purpose, but they all present technical problems when we want to perform an in situ measurement during the electrolysis. In this paper we will show that energy dispersive X-ray diffraction allows to overcome many technical problems and we present some results obtained in situ during the charging of a palladium electrode.
Theory
In a diffraction experiment we record the intensity diffused by a sample as a function of the scattering vector q. In general the measured intensities depend on the magnitude and on the orientation of q with respect to the sample. For an ideal polycrystalline material we average along all the possible orientations of the grains and the diffused intensities depend only on the magnitude of q defined by:
= q = ( 47r )sin(*) (2)
where "X" is the incident radiation wavelength and "19" is the angle of scattering. In the case of a simple cubic structure as for Palladium, the diffraction pattern shows peaks whose positions are defined by:
= (27c)vh2+ k 2 +12 (3) a
where "a" is the lattice parameter and h,k and 1 are the miller indexes. The width of the peaks is instead related to the domain dimensions. By measuring the values of q where
29-2

the intensities are maximized (the peak positions) we can determine the lattice parameter and then the concentration of Deuterium inside. the Palladium using rel. (1).
From eq. (2) it is evident that we can measure the intensity either by varying the scattering angle t3 at fixed incident energy, or as a function of the incident wavelength but keeping the scattering angle fixed. (We should remind that for a photon E [KeV] = 12.4 / A. [A].) The first method is the most widely employed. The incident radiation is in general the Ka emission line of an opportune material. The diffused radiation is measured as a function of the diffraction angle by a scintillation counter. The other method, which we have employed in the present measurements, uses a white beam produced by Bremmstrahlung of electrons and the diffused radiation is recorded by an energy dispersive solid state detector. In our case the anode material of the tube is Chromium and the useful energy range goes from about 15 KeV up to 55 KeV. The energy dispersive method has then two major advantages: a) the incident energies are quite high, so that the X-rays can cross, without suffering a
strong attenuation, the cell walls and the electrolyte; b) the incident and outcoming beams are fixed with respect to the sample container,
making the design of the cell very simple. Moreover from rel. 3 the Bragg peaks occur at different photon energies; then, since
the penetration of a photon inside a material depends on its energy, different peaks correspond also to different sample depths.
Results
A first experiment was performed on a Palladium cathode 1 mm thick 12 mm in diameter (6) (sample A). The sample was annealed at 970 °C for some hours in an Argon atmosphere to remove the Oxygen from the surface. We used the same cell geometry of other experiments described elsewhere ( 7 ) and here we only remind that electrolysis is performed in one side only of the cathode while the other is free in a gas ambient where we can measure the outgoing gas flux. We started this experiment keeping a low constant current (20 mA) for about 7 days until we observed a detectable gas flux coming out from the sample. X-ray diffraction patterns were collected every day and they showed that after 7 days the sample was all in the p phase. In fig. 1 we report the diffraction patterns of the palladium before starting the electrolysis (dashed line) and after 5 days of electrolysis (solid line). Data have always been collected during the electrolysis. In this figure we can clearly observe:
29-3

a) the fluorescence lines of palladium, which are used to check that all the electronic apparatus works correctly and that does not shift during the experiment (this could introduce systematic errors in the lattice parameter measurements);
b) the diffraction peaks characteristic of a face centered cubic structure. From their positions we can determine the lattice parameter using rel. 3 and, then, the Deuterium concentration.
In the solid line the diffraction peaks have splitted in two separated peaks corresponding to the a and 13 phases of the D/Pd system.
Fig. 1) Diffraction peaks of a Palladium cathode. The dashed line is obtained before starting the electrolysis, while the continuos line is measured after 5 days of charging at 20 mA. We can clearly observe that the diffraction peaks have splitted in two corresponding to the a and 13 phases of the D/Pd binary system.
Then we applied a pulsed current with a square wave form and the following characteristics: minimum current 20 mA, maximum current 200 mA and periods varying between 4400 s and to 6000 s.
In fig 2 we report the dependence of the lattice parameter of the 13 phase as a function of the electrolysis time for the whole experiment. From the plot it is evident that the sample keeps increasing D-concentration for about two weeks up to a maximum ratio of about 0.76±0.02.
We have then raised the temperature of the cell to 50 °C to determine if this could influence the loading of the sample. After about a week we cooled the sample at room temperature and measured again the lattice parameter. We did not observe any change in
29-4

the D/Pd ratio. We could not perform the measurements at the high temperature since the
position of the reflecting surface was higher due to thermal expansion of the sample
holder, this changes the angle of scattering and makes the data not comparable with the
room temperature ones. After about three weeks of electrolysis the sample was removed
from the cell and degassed in a known volume. The final D/Pd ratio so measured was of
0.77 ±0.05.
Fig.2) Dependence of the lattice parameter of the f3 phase and of the D/Pd ratio as a function of the electrolysis time
Two more samples (B and C) were then studied. They were 12 mm in diameter and
0.5 mm thick ( 8 ). The annealing was performed at 970 °C for several hours under vacuum
conditions. For the B sample we applied a constant current electrolysis to determine the
effect of the current density in the maximum reachable charging. We started by applying a
current of 50 mA and, in this case, after 1 day of electrolysis, only one series of peaks
could be observed, differently from what we had seen for sample A. Assuming that these
peaks were due to the 13 phase, the corresponding D/Pd ratio was 0.47 ± 0.02, well
below the (3 m i n concentration; after 2 days we reached a plateau at a concentration of
about 0.54 ± 0.02. Increasing the current to 200 mA led to a concentration of 0.57 ± 0.02
after two more days and going up to 1 A we reached the maximum loading of 0.65 ± 0.02
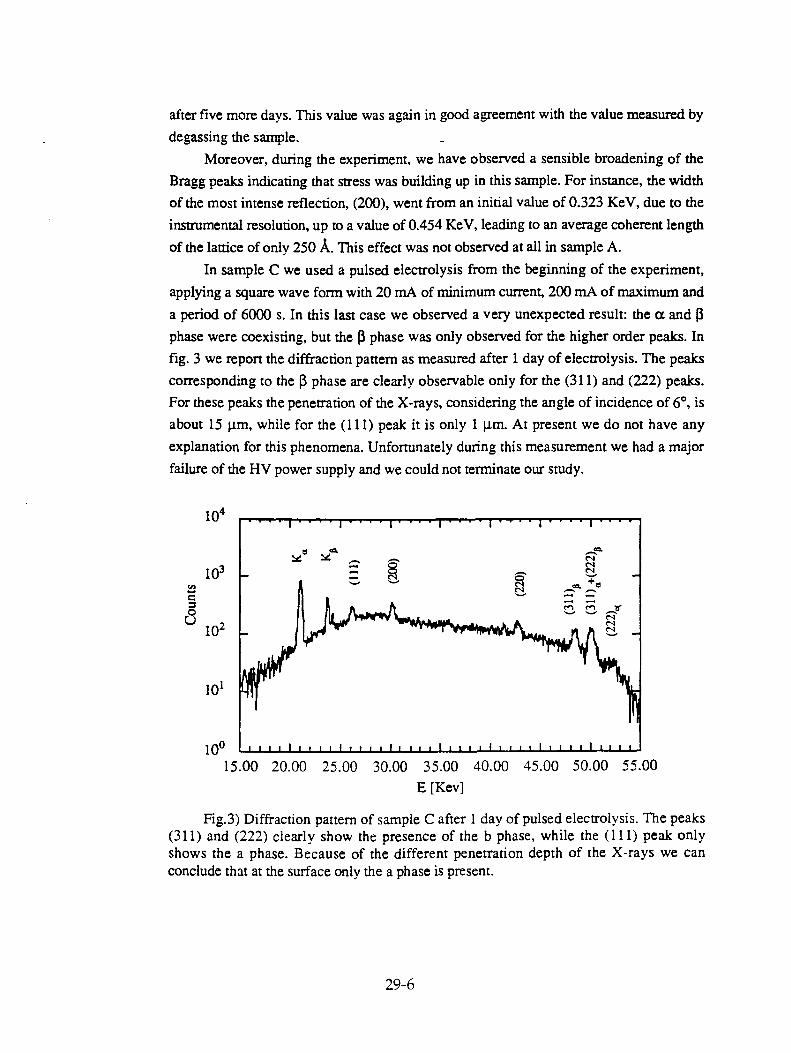
after five more days. This value was again in good agreement with the value measured by degassing the sample. _
Moreover, during the experiment, we have observed a sensible broadening of the Bragg peaks indicating that stress was building up in this sample. For instance, the width of the most intense reflection, (200), went from an initial value of 0.323 KeV, due to the instrumental resolution, up to a value of 0.454 KeV, leading to an average coherent length of the lattice of only 250 A. This effect was not observed at all in sample A.
In sample C we used a pulsed electrolysis from the beginning of the experiment, applying a square wave form with 20 mA of minimum current, 200 mA of maximum and a period of 6000 s. In this last case we observed a very unexpected result: the a and $3 phase were coexisting, but the $3 phase was only observed for the higher order peaks. In fig. 3 we report the diffraction pattern as measured after 1 day of electrolysis. The peaks corresponding to the 13 phase are clearly observable only for the (311) and (222) peaks. For these peaks the penetration of the X-rays, considering the angle of incidence of 6°, is about 15 p.m, while for the (111) peak it is only 1 1..tm. At present we do not have any explanation for this phenomena. Unfortunately during this measurement we had a major failure of the HV power supply and we could not terminate our study.
Fig.3) Diffraction pattern of sample C after 1 day of pulsed electrolysis. The peaks (311) and (222) clearly show the presence of the b phase, while the (111) peak only shows the a phase. Because of the different penetration depth of the X-rays we can conclude that at the surface only the a phase is present.
29-6
In conclusion we have shown that the energy dispersive X-ray diffraction can be usefully employed to study the charging of Palladium with Deuterium. We were able to determine in situ the concentration of Deuterium inside a Palladium cathode and study some dynamics of the process. The obtained final concentration of Deuterium was in good agreement with the values measured by degassing the sample in a known volume. However the different behaviors shown by different samples have still to be understood.
References (t) - CRE ENEA, Via E.Fermi 27, 1-0044 Frascati, Italy (1) - M.C.H.McKubre et al., proceedings of ICCF-3, Nagoya, pag. 5, (1993) (2) - R.W.Pisniewski and A.Rostocki, Phys. Rev. B, 3,251, (1971) (3) - F.Antonangeli et al., Private Communications (4) - H.Peisl, "Lattice Strain due to Hydrogen in Metals" in "Hydrogen in Metals",
Vol. 1, ed. Alefeld and Volkl, Springer Verlag, New York (1978) (5) - J.E.Schirber and B.Morosin, Phys.Rev.B, 12 , 117 (1975) (6) - produced by TANAKA Kikinzoku International K.K., Tokio, Japan (7) - L. Bertalot et al., Frontiers on Cold Fusion, Proceedings of ICCF-3, Universal
Academy Press. Inc., Tokyo, Japan, 365 (1993) (8) - produced by Johnson-Matthey Public Limited Comp., Hatton Garden, London,
United Kigdom
29-7


CHARGING HYDROGEN INTO Ni IN HYDRIDE-CONTAINING MOLTEN SALTS
Bor Yann Liaw and Yi Ding Hawaii Natural Energy Institute, School of Ocean and Earth Science and
Technology, University of Hawaii at Manoa Honolulu, HI 96822
Abstract
Elevated-temperature calorimetric measurements were performed using a cell: Al 6061 alloy I LiH(saturated), LiCl-KC1 eutectic I Ni with a charging current of about 600 mA. An anomalous positive temperature excursion was observed, which was difficult to explain based on our understanding of the electrochemical reactions occurring in the cell and the associated enthalpies. The potential between the working and counter electrodes fell in two peculiar ranges: in the initial stage, 0.7-1.2 V, and in a later stage, 2.3-2.6 V — a range of great interest — due to its similarity to the condition of an excess heat event that we reported in the Pd-D system in which significant excess heat was measured.
Introduction
Excess power and heat accompanied with nuclear products have been measured in many recent experiments (1-12) using a variety of techniques to enhance deuterium or hydrogen absorption into metal matrices. Originally proposed by Fleischmann and Pons (13) was the electrolysis of heavy water with Pd cathode and Pt anode, in which reproducible "boiled-off" episodes and significant amount of excess heat of the order of over 200 eV per Pd atom were recently demonstrated (14). They have attributed this phenomenon to some unknown nuclear processes yet to be identified. Mills and his co-workers (15) independently reported excess heat using light water electrolysis with Ni cathode and Pt anode in potassium carbonate solutions. Mills and his co-workers (16,17) further proposed a theory attributing the excess heat to be originated from sub-ground-state energy levels of hydrogen. Similar excess heat results using light-water electrolysis have been reported by several other laboratories, including Bush (1) who proposed an "alkali-hydrogen fusion" model to claim his team's finding of enriched nuclear transformation. The origin of both excess heat phenomena are still an open question.
These reports, although difficult to explain, draw our interest to verify excess heat generation in Ni anode using hydride-based melt. This paper reports an instance in which apparent excess power was measured. Two previous experiments using a similar cell configuration but at different charging currents, 350 and 400 mA, also
30-1

exhibited anomalous temperature excursions at different magnitudes. The origin of this excess power was not clear, nor was the detail of reactions involved in the electrolysis. This preliminary experiment was not intended to detect any nuclear products, nor will any nuclear aspects be discussed. From thermodynamic point of view, it is very difficult to explain the thermal behavior exhibited by the cell.
Experimental Aspects
The cell configuration was similar to what we previously reported. Figure 1 shows the schematic of this particular experimental setup. Ni electrode was made of a Ni thin-wall tubing obtained from Small Parts, Inc., Florida. The Al alloy electrode was a typical commercial 6061 tubing with a wall thickness of 1/8". Two thermocouples were used: Orie is an E-type (chromel-constantan couple) and the other is a K-type (chromel-alumel couple) probe, both made by Omega Engineering, Inc. Each probe was protected with a thin-wall ungrounded 304 stainless steel sheath and connected to an ice-point junction compensator to obtain correct temperature readings. Although the E-type probe is more sensitive to small temperature change than the K-type, both probes behaved consistently during the experiment. The K-type probe was placed inside the cathode holder, which was made of brass, about half an inch above the melt surface. The E-type probe was placed in the melt approximately half way between the cathode and the anode. A relatively constant temperature difference of about 10°C between the two probes was found throughout the experiment, almost independent of any electrolysis process.
The charging process was conducted under a galvanostatic mode with a constant current of 600 mA. We used a PARC 173 galvanostat for the electrolysis. Cell potential and temperature readings were collected by a data acquisition board and controlled by a Macintosh program written in LabVIEW. The board has a 16-bit resolution, which allows up to ±10 V input and a gain of 100 to give the temperature reading a precision of about 0.035°C. We also intermittently monitored the cell current and the voltage and current of the furnace dc power supply through external digital multimeters to assure a constant cell current and furnace power input during the electrolysis. The dc furnace input power has been controlled at 24.1±0.1 W throughout the experiment, therefore the possible drift in the cell temperature was about ±1°C. The calorimeter was calibrated at the end of the run by varying the furnace power in a step fashion and recording the steady temperature variation at intervals of at least 6 hours. A linear calibration curve from each temperature probe was shown in Figure 2 with a cell constant of about 10.3°C W -1 .
Results and Discussions
Figure 3 displays the temperature variations measured by the two probes and the cell potential excursion during the run. There are several interesting features from this result:
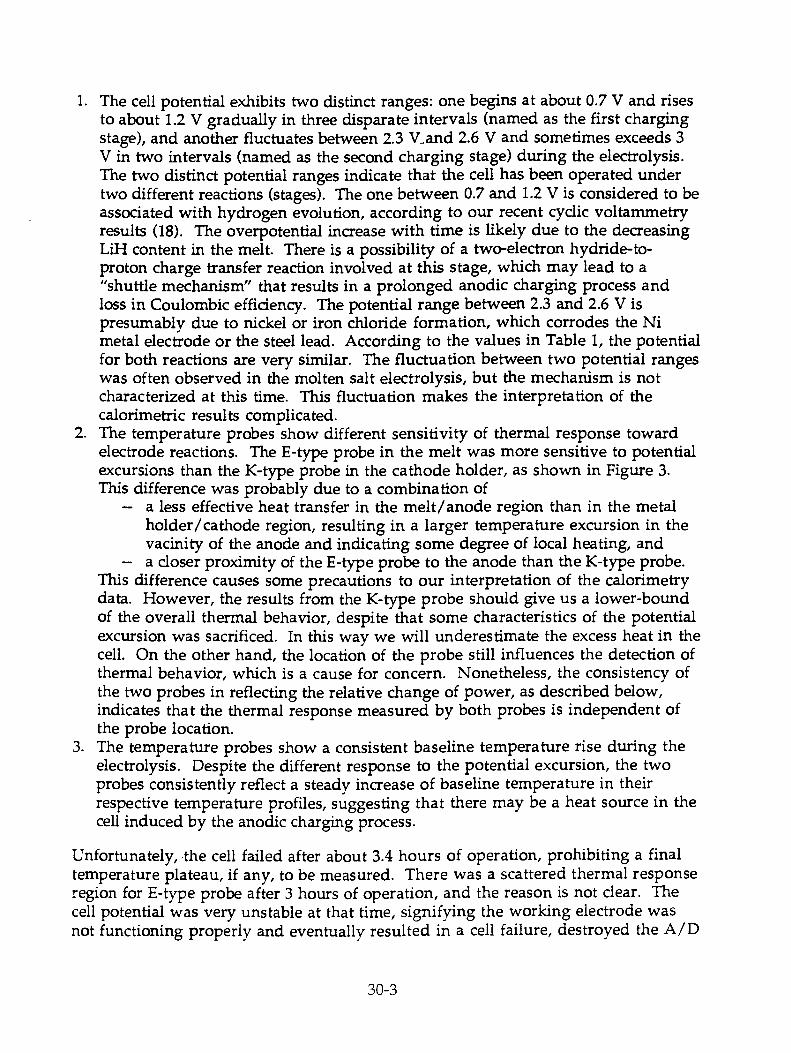
1. The cell potential exhibits two distinct ranges: one begins at about 0.7 V and rises to about 1.2 V gradually in three disparate intervals (named as the first charging stage), and another fluctuates between 2.3 V_and 2.6 V and sometimes exceeds 3 V in two intervals (named as the second charging stage) during the electrolysis. The two distinct potential ranges indicate that the cell has been operated under two different reactions (stages). The one between 0.7 and 1.2 V is considered to be associated with hydrogen evolution, according to our recent cyclic voltammetry results (18). The overpotential increase with time is likely due to the decreasing LiH content in the melt. There is a possibility of a two-electron hydride-to-proton charge transfer reaction involved at this stage, which may lead to a "shuttle mechanism" that results in a prolonged anodic charging process and loss in Coulombic efficiency. The potential range between 2.3 and 2.6 V is presumably due to nickel or iron chloride formation, which corrodes the Ni metal electrode or the steel lead. According to the values in Table 1, the potential for both reactions are very similar. The fluctuation between two potential ranges was often observed in the molten salt electrolysis, but the mechanism is not characterized at this time. This fluctuation makes the interpretation of the calorimetric results complicated.
2. The temperature probes show different sensitivity of thermal response toward electrode reactions. The E-type probe in the melt was more sensitive to potential excursions than the K-type probe in the cathode holder, as shown in Figure 3. This difference was probably due to a combination of
— a less effective heat transfer in the melt/anode region than in the metal holder/cathode region, resulting in a larger temperature excursion in the vacinity of the anode and indicating some degree of local heating, and
— a closer proximity of the E-type probe to the anode than the K-type probe. This difference causes some precautions to our interpretation of the calorimetry data. However, the results from the K-type probe should give us a lower-bound of the overall thermal behavior, despite that some characteristics of the potential excursion was sacrificed. In this way we will underestimate the excess heat in the cell. On the other hand, the location of the probe still influences the detection of thermal behavior, which is a cause for concern. Nonetheless, the consistency of the two probes in reflecting the relative change of power, as described below, indicates that the thermal response measured by both probes is independent of the probe location.
3. The temperature probes show a consistent baseline temperature rise during the electrolysis. Despite the different response to the potential excursion, the two probes consistently reflect a steady increase of baseline temperature in their respective temperature profiles, suggesting that there may be a heat source in the cell induced by the anodic charging process.
Unfortunately, the cell failed after about 3.4 hours of operation, prohibiting a final temperature plateau, if any, to be measured. There was a scattered thermal response region for E-type probe after 3 hours of operation, and the reason is not clear. The cell potential was very unstable at that time, signifying the working electrode was not functioning properly and eventually resulted in a cell failure, destroyed the A/D
30-3

board and the E-type probe. The working electrode lead was found broken when the cell was disassembled.
Figure 4 shows the input and output power profiles of the experiment. The input electrochemical power is the product of the current and cell potential. The output power measured from both probes are interpreted from the post-calibration curves shown in Figure 2. The two output curves are similar except for the regions of high potential excursion. Excess power was observed in both probes after about 1.7 hours of operation. However, because the input power decreased from 1.5 W to 0.5 W at that time, the interpretation of excess power was obscured between 1.7 and 2.4 hours. After 2.4 hours, the excess power over the large 1.5 W input power was apparent. At 2.9 hours the excess power was about 0.5 W over the 1.5 W input, or about 33%. It should be noted that the scattering of the thermal response in the curves shows the overall noise level of the temperature and power measurements, which is significantly lower than the magnitudes of the temperature rise and excess power measured in the experiment; therefore, random errors can not explain the excess power result.
In summary, the K-type probe in the cathode holder gave a more conservative and less potential-dependent measurement of the cell thermal behavior during the anodic charging process. A consistent yet "unknown" heat source caused a temperature rise in the cell and resulted in excess power measured of the order of 0.5 W over the input power of 1.5 W. This phenomenon cannot be explained by random error in the measurement nor any storage mechanism.
A more detailed heat balance and estimation of the anomalous thermal behavior of the cell can be obtained by examining the electrochemical reactions involved in the electrolysis. The enthalpy of these reactions can be used for comparison with the calorimetry data. The possible reactions under consideration are listed in Table 1. During the initial electrolysis the half-cell reactions are:
Dissociation of LiH in the electrolyte:
LiH = Li+ + Fr [1]
13-LiAl formation at the cathode:
Li+ + Al + e =13-LiAl [2]
Hydrogen evolution at the anode:
Fr = 1 /2 H2 + e, [3]
and the total cell reaction is:
LiH + Al = 3-LiAl + 1 /2 H2. AH4 = 9.92 kcal mol-1 [4]
30-4

The enthalpy of the total reaction [4] is endothermic. Accordingly, there should be a power decrease of 0.26 W at 600 mA from this reaction. The initial power input of this reaction was about 0.42 W (0.6 A x 0.7 V) and gradually increased to 0.72 W (0.6 A x 1.2 V). The difference between the input power and the power consumption from the endothermic reaction enthalpy will be treated as total IR loss that turned into waste heat, which should be about 0.16 W initially and increase to 0.46 W eventually. This waste heat should raise the cell temperature only by 1.6°C to 4.6°C, respectively, in contrast to the measured baseline temperature rise of about 20°C at 3.2 hours. The cell temperature rise was about an order of magnitude larger than what we expected from this reaction.
Another possibility of heat release could come from the two-electron charge-transfer hydride-to-proton reaction and speculated "shuttle mechanism" possibly involved at the end of the first charging stage according to:
LiC1 + LiH + 2 Al = 2 13-LiAl + HC1. LiHio = 78.10 kcal mo1-1 (10)
The substantial positive enthalpy will reduce the input power by 1.02 W, which will adversely decrease the cell temperature by 3-6°C. Even if the reaction also occurred at the second stage with a high input power of 1.56 W (0.6 A x 2.6 V), the IR-loss heat rate is still only about 0.54 W or contributes to only 5.4°C increase. The measured excess power value is much larger than what we expected from this effect.
We further consider the heat balance in the second charging stage in which metal chloride formations, such as [11] and [12] in Table 1, occur. The enthalpies for NiC12 and FeC12 formations are 97.97 and 89.61 kcal mo1 -1 , respectively. These reactions will subtract the input power by 1.27 and 1.17 W, respectively. With the associated input power of 1.56 W (0.6 A x 2.6 V), we found the IR-loss heat rate only accounts for 0.29-0.39 W or 2.9-3.9°C in cell temperature rise, still considerably less than what was measured. Besides, the excess power seems to occur from the beginning of the electrolysis, in which the chloride reaction should not involve.
More recently, we have conducted some electrolysis experiments using steel leads as the anode. The results, which will be discussed elsewhere, showed no excess power even though the cell potential reached above 2.2 V, a distinct range of interest for the second charging stage and as a contrast to the Ni-based experiments. We can treat the steel-based system as blank or control experiments. The result indicates that the excess power seems to be associated with the presence of Ni. In the future, we need to distinguish the Ni-based system that produces excess power from the one that doesn't. We should also characterize the parameters that cause the difference.
It should be cautioned, however, that although the excess power and temperature excursions were significantly greater than the values expected from the enthalpy of reactions and the IR-loss heat, the magnitude of the excess power (-0.5 W) is still small compared to the dc power to the external furnace (24.1±0.1 W).
30-5
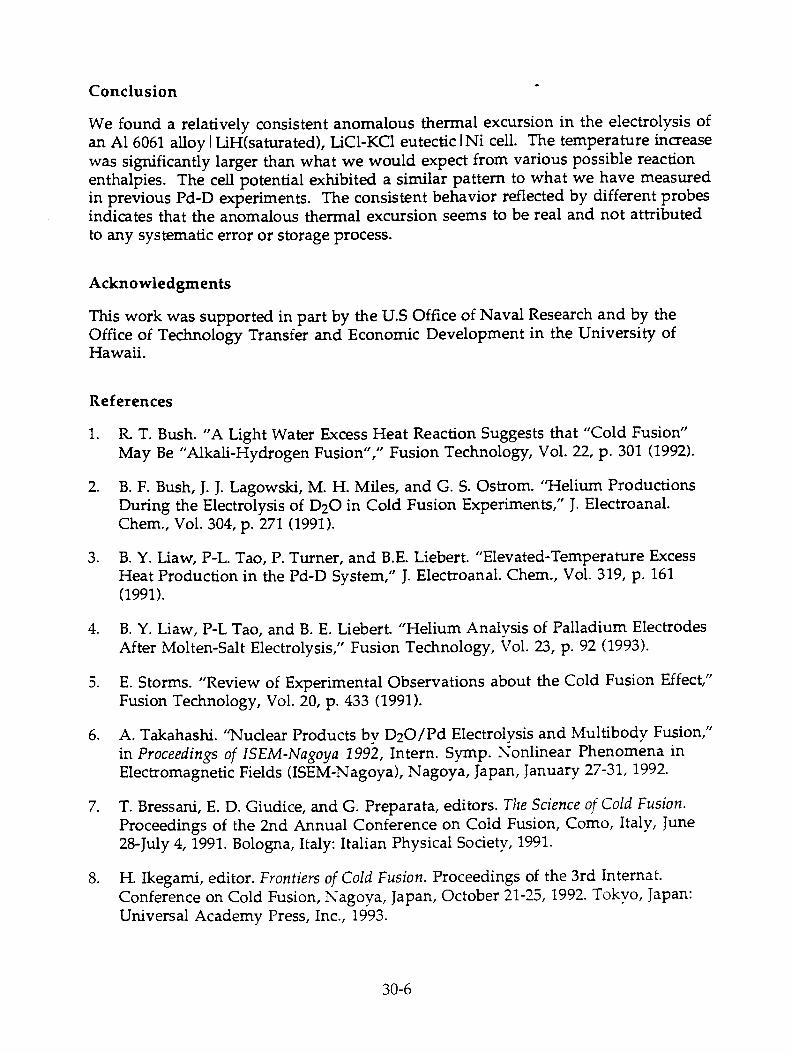
Conclusion -
We found a relatively consistent anomalous thermal excursion in the electrolysis of an Al 6061 alloy 1 LiH(saturated), LiCl-KC1 eutectic 1 Ni cell. The temperature increase was significantly larger than what we would expect from various possible reaction enthalpies. The cell potential exhibited a similar pattern to what we have measured in previous Pd-D experiments. The consistent behavior reflected by different probes indicates that the anomalous thermal excursion seems to be real and not attributed to any systematic error or storage process.
Acknowledgments
This work was supported in part by the U.S Office of Naval Research and by the Office of Technology Transfer and Economic Development in the University of Hawaii.
References
1. R. T. Bush. "A Light Water Excess Heat Reaction Suggests that "Cold Fusion" May Be "Alkali-Hydrogen Fusion"," Fusion Technology, Vol. 22, p. 301 (1992).
2. B. F. Bush, J. J. Lagowski, M. H. Miles, and G. S. Ostrom. "Helium Productions During the Electrolysis of D20 in Cold Fusion Experiments," J. Electroanal. Chem., Vol. 304, p. 271 (1991).
3. B. Y. Liaw, P-L. Tao, P. Turner, and B.E. Liebert. "Elevated-Temperature Excess Heat Production in the Pd-D System," J. Electroanal. Chem., Vol. 319, p. 161 (1991).
4. B. Y. Liaw, P-L Tao, and B. E. Liebert. "Helium Analysis of Palladium Electrodes After Molten-Salt Electrolysis," Fusion Technology, Vol. 23, p. 92 (1993).
5. E. Storms. "Review of Experimental Observations about the Cold Fusion Effect," Fusion Technology, Vol. 20, p. 433 (1991).
6. A. Takahashi. "Nuclear Products by D20/Pd Electrolysis and Multibody Fusion," in Proceedings of ISEM-Nagoya 1992, Intern. Symp. Nonlinear Phenomena in Electromagnetic Fields (ISEM-Nagoya), Nagoya, Japan, January 27-31, 1992.
7. T. Bressani, E. D. Giudice, and G. Preparata, editors. The Science of Cold Fusion. Proceedings of the 2nd Annual Conference on Cold Fusion, Como, Italy, June 28-July 4, 1991. Bologna, Italy: Italian Physical Society, 1991.
8. H. Ikegami, editor. Frontiers of Cold Fusion. Proceedings of the 3rd Internat. Conference on Cold Fusion, Nagoya, Japan, October 21-25, 1992. Tokyo, Japan: Universal Academy Press, Inc., 1993.
30-6

9. A. Takahashi, T. Lida, T. Takeuchi, and A. Mega. "Excess Heat and Nuclear Products by D20/Pd Electrolysis and Multibody Fusion," Internat. J. Appl. Electromag. in Materials, Vol. 3, p. 221 (1992).
10. S. Szpak, P. A. Mosier-Boss, and J. J. Smith. "On the Behavior of Pd Deposited in the Presence of Evolving Deuterium," J. Electroanal. Chem., Vol. 302, p. 255 (1991).
11. E. Yamaguchi and T. Nishioka. "Direct Evidence for Nuclear Fusion Reactions in Deuterated Palladium," in Frontiers of Cold Fusion, H. Ikegami, ed., the 3rd International Conference on Cold Fusion, Nagoya, Japan, October 21-25, 1992, Tokyo, Japan: Universal Academy Press, Inc., 1993, pp. 179.
12. M. H. Miles, R. A. Hollins, B. F. Bush, J. J. Lagowski, and R. E. Miles. "Correlation of Excess Power and Helium Production During D20 and H20 Electrolysis Using Palladium Cathodes," J. Elctroanal. Chem., Vol. 346, p. 99 (1993).
13. M. Fleischmann, S. Pons, and M. Hawkins. "Electrochemically Induced Nuclear Fusion of Deuterium," J. Electroanal. Chem., Vol. 261, p. 301; err. Vol. 263, p. 187 (1989).
14. M. Fieischmann, and S. Pons. "Calorimetry of the Pd-D20 System: from Simplicity via Complications to Simplicity," Phys. Lett. A, Vol. 176, p. 1 (1993).
15. R. L. Mills and S. P. Kneizys. "Excess Heat Production by the Electrolysis of an Aqueous Potassium Carbonate Electrolyte and the Implications for Cold Fusion," Fusion Technology, Vol. 20, p. 65 (1991).
16. R. L. Mills and J. J. Farrell. The Grand Unified Theory, Ephrata, PA: Science Press, 1990.
17. R. L. Mills. Unification of Spacetime, the Forces, Matter, and Energy, Ephrata, PA: Science Press, 1992.
18. Y. Ding and B. Y. Liaw. "Electrochemical Characterization of Ni in Hydride-Containing Molten Salts," presented in the 9th International Conference on Solid State Ionics, the He gue, Netherlands, September 12-17, 1993.
30-7
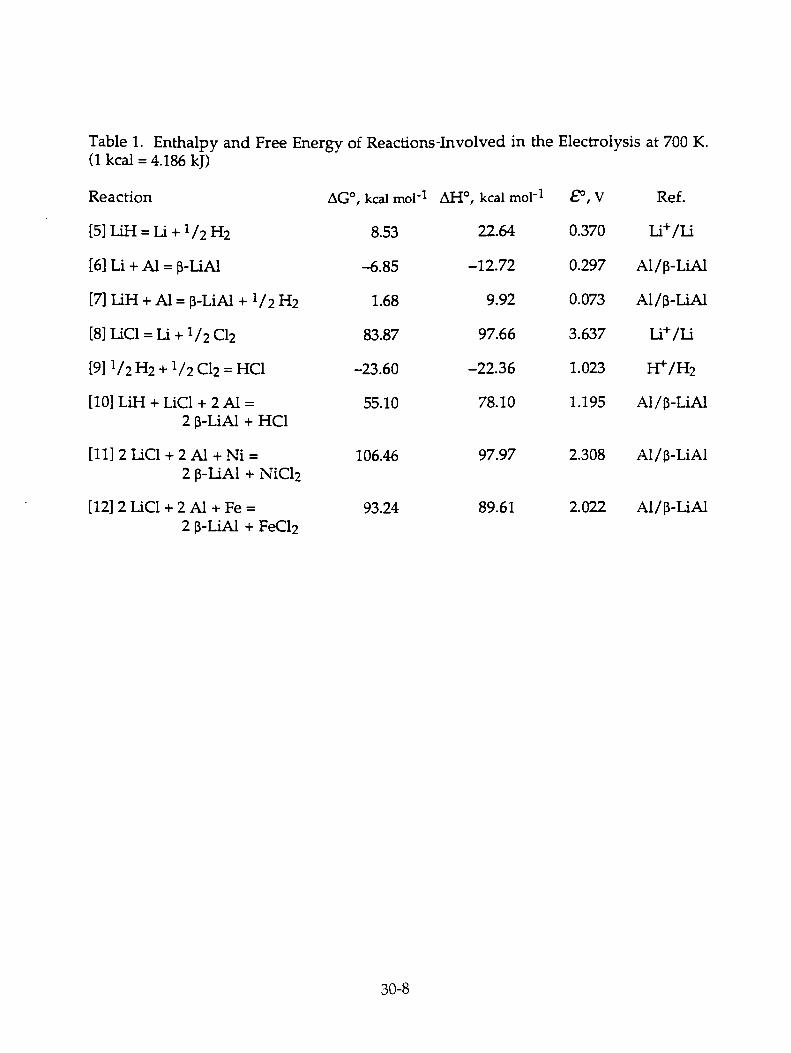
Table 1. Enthalpy and Free Energy of Reactions-Involved in the Electrolysis at 700 K. (1 kcal = 4.186 kJ)
Reaction AG°, kcal mo1 -1 A1-1° , kcal mo1 -1 E°, V Ref.
[5]LiH = Li + 1 /2 H2 8.53 22.64 0.370 Li+/Li
[6]Li + Al = 13-LiAl -6.85 -12.72 0.297 Al/p-LiAl
[7]LiH + Al =13-LiAl + 1 / 2 H2 1.68 9.92 0.073 Al /3-LiAi
[8]LiC1 = Li + 1 /2 C12 83.87 97.66 3.637 Li+ /Li
[9] 1/2H2 + 1 /2 C12 = HC1 -23.60 -22.36 1.023 H+/H2
[10]LiH + LiC1 + 2 Al = 55.10 78.10 1.195 Al/ i-LiAl 2 f3-LiAl + HC1
[11]2 LiC1 + 2 Al + Ni = 106.46 97.97 2.308 Al /5-LiAl 2 p-LiAl + NiC12
[12]2 LiC1 + 2 Al + Fe = 93.24 89.61 2.022 Al /13-LiAl 2 f3-LiAl + FeCl2
30-8

Figure 1. Schematic of the molten salt cell.
Figure 2. Post calibration curves of the experiment with a cell constant of 10.3°C W -1 .
30-9

Figure 3. Temperature profiles and cell voltage during the electrolysis.
Figure 4. Input and output power profiles during the electrolysis.
30-10
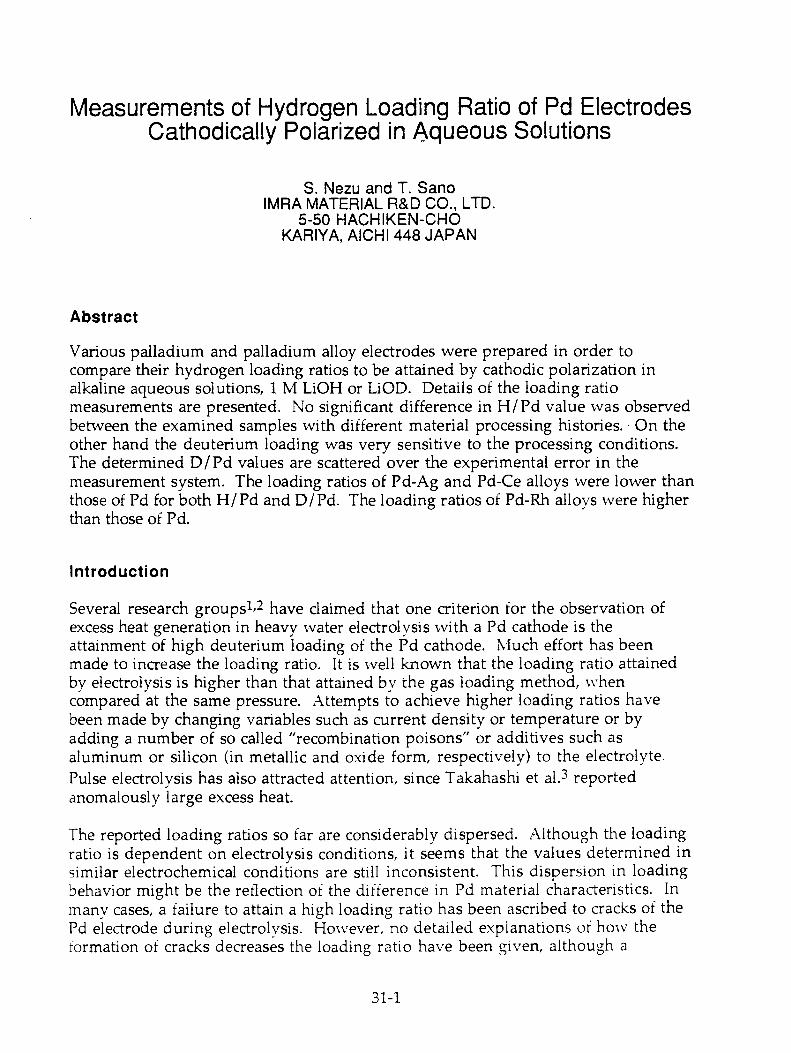
Measurements of Hydrogen Loading Ratio of Pd Electrodes Cathodically Polarized in Aqueous Solutions
S. Nezu and T. Sano IMRA MATERIAL R&D CO., LTD.
5-50 HACHIKEN-CHO KARIYA, AICHI 448 JAPAN
Abstract
Various palladium and palladium alloy electrodes were prepared in order to compare their hydrogen loading ratios to be attained by cathodic polarization in alkaline aqueous solutions, 1 M LiOH or LiOD. Details of the loading ratio measurements are presented. No significant difference in H/Pd value was observed between the examined samples with different material processing histories. On the other hand the deuterium loading was very sensitive to the processing conditions. The determined D/Pd values are scattered over the experimental error in the measurement system. The loading ratios of Pd-Ag and Pd-Ce alloys were lower than those of Pd for both H/Pd and D/Pd. The loading ratios of Pd-Rh alloys were higher than those of Pd.
Introduction
Several research groups 1,2 have claimed that one criterion for the observation of excess heat generation in heavy water electrolysis with a Pd cathode is the attainment of high deuterium loading of the Pd cathode. NIuch effort has been made to increase the loading ratio. It is %yell known that the loading ratio attained by electrolysis is higher than that attained by the gas loading method, when compared at the same pressure. Attempts to achieve higher loading ratios have been made by changing variables such as current density or temperature or by adding a number of so called "recombination poisons" or additives such as aluminum or silicon (in metallic and oxide form, respectively) to the electrolyte. Pulse electrolysis has also attracted attention, since Takahashi et al. 3 reported anomalously large excess heat.
The reported loading ratios so far are considerably dispersed. Although the loading ratio is dependent on electrolysis conditions, it seems that the values determined in similar electrochemical conditions are still inconsistent. This dispersion in loading behavior might be the reflection of the difference in Pd material characteristics. In many cases, a failure to attain a high loading ratio has been ascribed to cracks of the Pd electrode during electrolysis. However, no detailed explanations of how the formation of cracks decreases the loading ratio have been given, although a
31-1
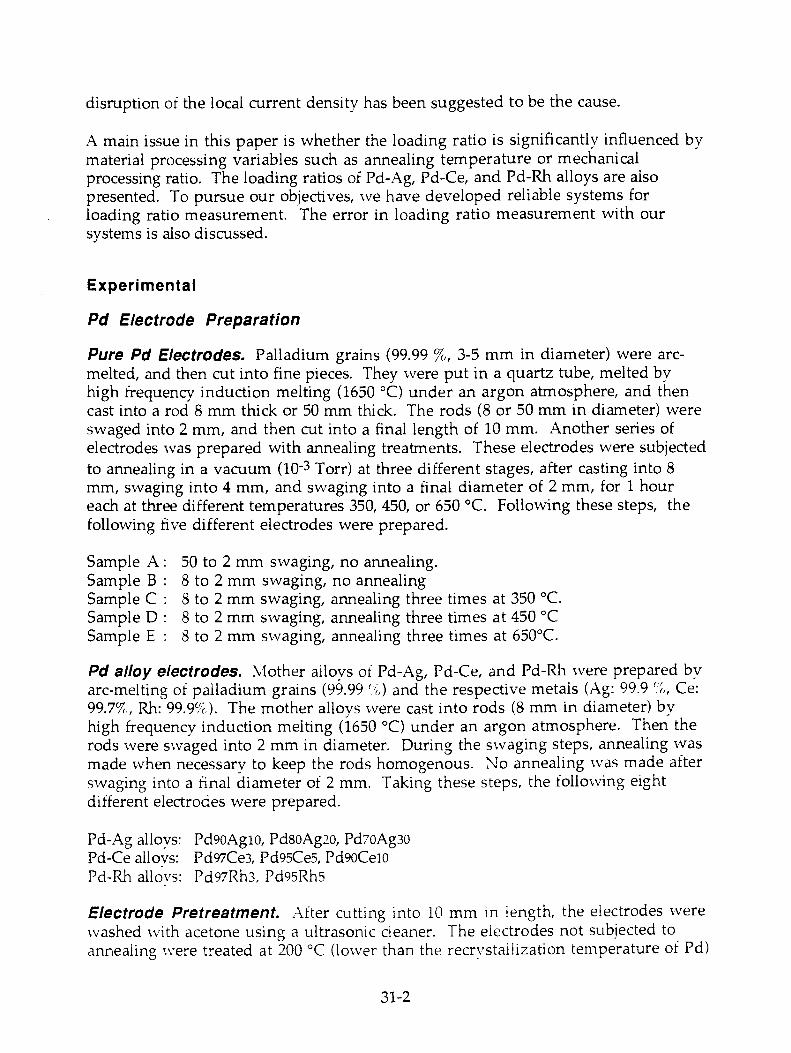
disruption of the local current density has been suggested to be the cause.
A main issue in this paper is whether the loading ratio is significantly influenced by material processing variables such as annealing temperature or mechanical processing ratio. The loading ratios of Pd-Ag, Pd-Ce, and Pd-Rh alloys are also presented. To pursue our objectives, we have developed reliable systems for loading ratio measurement. The error in loading ratio measurement with our systems is also discussed.
Experimental
Pd Electrode Preparation
Pure Pd Electrodes. Palladium grains (99.99 To, 3-5 mm in diameter) were arc-melted, and then cut into fine pieces. They were put in a quartz tube, melted by high frequency induction melting (1650 °C) under an argon atmosphere, and then cast into a rod 8 mm thick or 50 mm thick. The rods (8 or 50 mm in diameter) were swaged into 2 mm, and then cut into a final length of 10 mm. Another series of electrodes was prepared with annealing treatments. These electrodes were subjected to annealing in a vacuum (10 -3 Torr) at three different stages, after casting into 8 mm, swaging into 4 mm, and swaging into a final diameter of 2 mm, for 1 hour each at three different temperatures 350, 450, or 650 °C. Following these steps, the following rive different electrodes were prepared.
Sample A : Sample B : Sample C : Sample D : Sample E :
50 to 2 mm swaging, no annealing. 8 to 2 mm swaging, no annealing 8 to 2 mm swaging, annealing three times at 350 °C. 8 to 2 mm swaging, annealing three times at 450 °C 8 to 2 mm swaging, annealing three times at 650°C.
Pd alloy electrodes. Mother alloys of Pd-Ag, Pd-Ce, and Pd-Rh were prepared by arc-melting of palladium grains (99.99 (;,) and the respective metals (Ag: 99.9 `:;„ Ce: 99.77,, Rh: 99.9`,17(,). The mother alloys were cast into rods (8 mm in diameter) by high frequency induction melting (1650 °C) under an argon atmosphere. Then the rods were swaged into 2 mm in diameter. During the swaging steps, annealing was made when necessary to keep the rods homogenous. No annealing was made after swaging into a final diameter of 2 mm. Taking these steps, the following eight different electrodes were prepared.
Pd-Ag alloys: Pd9oAglo, Pd80Ag2o, Pd7oAg30 Pd-Ce alloys: Pd97Ce3, Pd95Ce5, Pd9oCew Pd-Rh alloys: Pd97Rh3, Pd95Rh5
Electrode Pretreatment. After cutting into 10 mm in length, the electrodes were washed with acetone using a ultrasonic cleaner. The electrodes not subjected to annealing were treated at 200 °C (lower than the recrvstallization temperature of Pd)
31-2

for 3 hours under an vacuum for a degassing purpose. After drying in the air, the electrodes were weighed. Then lead wires (Teflon coated Ag wire) were attached by using spot welding. The connection spots were sealed by resin sealants.
Loading Ratio Measurements
Gas Burette Method. Figure 1 schematically shows the loading ratio measurement system using gas burettes. In this system, both of the evolved gases, 02 and H2, were collected together in the burettes for the measurement of the gas volume. In Principle, the difference between the amount of the collected gas and the one calculated from the quantity of electricity for water electrolysis corresponds to the hydrogen absorbed into the Pd electrode, assuming that the recombination of the evolved gases does not occur and the current efficiency is 100 %. 200 ml of D20 (ISOTEC inc., 99.9 %) containing 1 M LiOD (by dissolving Li metal) or H20 (ion exchanged, resistivity > 15 M•cm) containing 1 M LiOH (by dissolving analytical grade Li0H•H20) was used as the electrolyte. The Pt helical anode was placed symmetrically, surrounding the cathode. The cell body was made of acrylic, and had double side walls so that water (25 °C) for cell temperature control could flow between the walls. The funnel placed reversely in the electrolyte solution was used to introduce the evolved gases into the gas burettes (a capacity of 300 ml each). The two burettes were used alternately to collect more than 300 ml of gas by switching the valves. The gas pressure in the burettes was made equal to atmosphere pressure by adjusting the height of the levelling bottle containing water. The gas temperature was maintained at 25 °C by circulating water through the jackets of the burettes. The gas volume measured on the burettes was corrected for the water vapor pressure in the burettes, and then converted into moles of hydrogen atoms to calculate the loading ratio. Electrolysis was carried out galvanostatically at 300 mA/ cm 2 throughout this study using a HA-151 galvanostat (Hokuto Denko). Although the electrolysis was carried out galvanostatically, the current was recorded every 5 seconds for better accuracy, and integrated into the quantity of electricity.
Prior to the measurements of the loading ratio, the following two examinations were carried out to estimate the accuracy of this method. Firstly, the current efficiency for the electrolysis was checked by measuring the rate of gas evolution using a Pt cathode (2 mm in diameter, 10 mm in length). During several hours after starting the galvanostatic electrolysis at 300 mA/cm 2, the gas recovery efficiencies (the ratio of an actual collected gas amount to the theoretical amount from the quantity of electricity) determined for the period of 1 hour were less than 99.5 %. They increased with time. After 12 hours continuous electrolysis, however, those determined for the period of 8 hours (typical time required for measurements in this study) were in the range 99.9 to 100.1 in 20 separate measurements. The lower efficiencies of gas recovery at the beginning of the electrolysis were due to the dissolution of gas into the electrolyte, as fresh electrolyte solutions always gave lower efficiencies. Secondly, the degree of the dissolution of the collected gas into the water in the burettes was checked. This was found to be negligible in the time-scale for this method. Considering these facts, we assumed that the current efficiency with respect to water electrolysis was 100 even if a Pd cathode was used
31-3
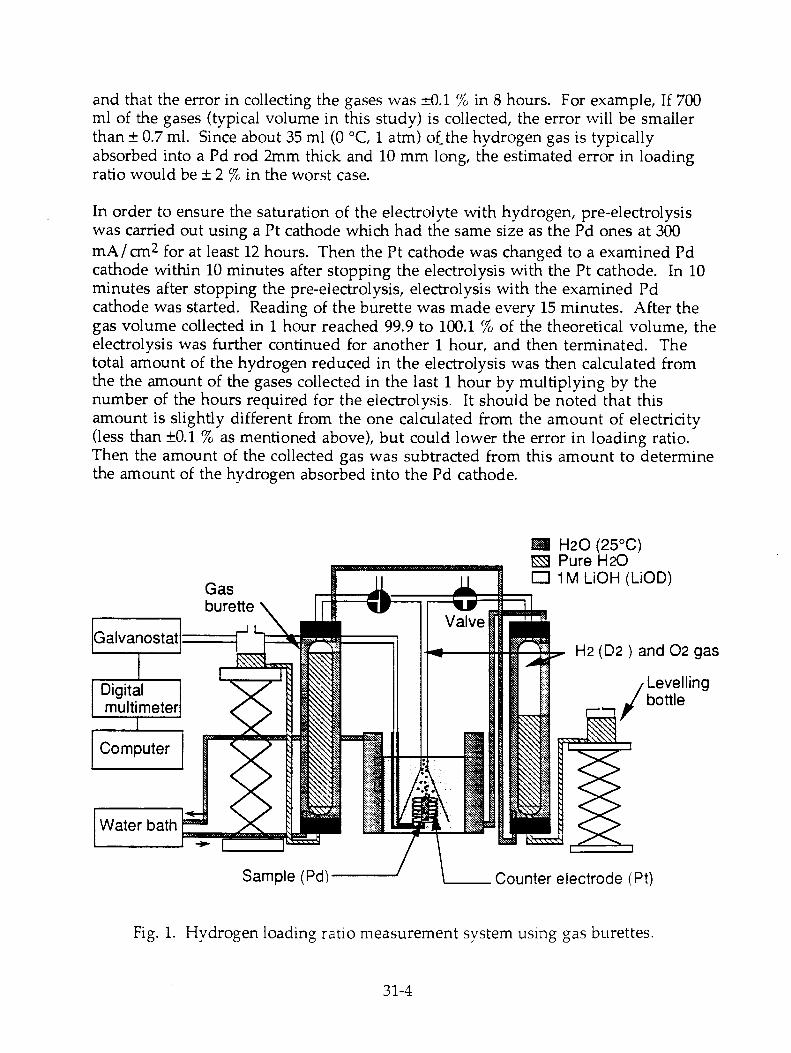
and that the error in collecting the gases was ±0.1 % in 8 hours. For example, If 700 ml of the gases (typical volume in this study) is collected, the error will be smaller than ± 0.7 ml. Since about 35 ml (0 °C, 1 atm) of the hydrogen gas is typically absorbed into a Pd rod 2mm thick and 10 mm long, the estimated error in loading ratio would be ± 2 % in the worst case.
In order to ensure the saturation of the electrolyte with hydrogen, pre-electrolysis was carried out using a Pt cathode which had the same size as the Pd ones at 300 mA/ cm2 for at least 12 hours. Then the Pt cathode was changed to a examined Pd cathode within 10 minutes after stopping the electrolysis with the Pt cathode. In 10 minutes after stopping the pre-electrolysis, electrolysis with the examined Pd cathode was started. Reading of the burette was made every 15 minutes. After the gas volume collected in 1 hour reached 99.9 to 100.1 % of the theoretical volume, the electrolysis was further continued for another 1 hour, and then terminated. The total amount of the hydrogen reduced in the electrolysis was then calculated from the the amount of the gases collected in the last 1 hour by multiplying by the number of the hours required for the electrolysis. It should be noted that this amount is slightly different from the one calculated from the amount of electricity (less than ±0.1 % as mentioned above), but could lower the error in loading ratio. Then the amount of the collected gas was subtracted from this amount to determine the amount of the hydrogen absorbed into the Pd cathode.
Fig. 1. Hydrogen loading ratio measurement system using gas burettes.
31-4

Mass Flow Meter Method. Although we mainly used the measurement system described above in this study, the loading ratios of the Pd-Rh alloys were measured using the system shown in Fig. 2. This system features the use of a mass flow meter and automatic operation. The principle of the measurement is the same as that of the system using gas burettes except that the flow rate is recorded to be integrated into the gas volume. Several improvements were made on the system reported in our previous paper4 . In our previous system, the cathode compartment was separated from the anode one with a glass separator to introduce only the evolved hydrogen gas into the mass flow meter, and the electrolyte in the anode compartment was open to the air. Since with this configuration there is a pressure drop inherent in the mass flow meter (less than 9 mmH2O), a flow of the gas is suppressed at the beginning of electrolysis until the pressure difference between the anode and the cathode compartment reaches the pressure drop. This results in the loss in gas collection. Typically this loss volume varied in the range 3 ml to 6 ml with our cell design and was difficult to control. Thus a blank run with a Pt cathode was necessary before each of Pd electrodes was examined. The other problem in our previous system was that the current distribution was not uniform because of the existence of the separator. The new design shown in Fig. 2 solved these problems. In this system, both the evolved hydrogen and oxygen gases are together introduced into the mass flow meter. The loss volume due to the pressure drop was decreased by minimizing the space above the electrolyte. The helical Pt anode was placed symmetrically, surrounding the Pd cathode. The mass flow meter was calibrated for the mixture of a hydrogen and a oxygen gas.
Stainless pipe Valve Dehydrant (CaCl2)
Electrolyte (1M LiOH or LiOD)
Counter electrode (Pt)
Mass flow meter
Digital multimeter
Computer
Fig. 2. Hydrogen loading ratio measurement system using a mass flow meter.
31-5

Results and Discussion
Table 1 lists the results of the measurements. For the pure Pd electrodes, 2 separate measurements for each of the various samples were carried out except for 13 separate measurements of H/Pd for sample A. For sample A, the mean loading ratio (H/ Pd) in the 13 measurements was 0.846 with the maximum of 0.866 and the minimum of 0.828. Fig. 3 shows typical output of the mass flow meter. In the Figure, the hatched area corresponds to the absorbed hydrogen. It should be noted that the output rises very quickly to one third of the final value at the start of the electrolysis. This is due to the evolution of the oxygen gas, demonstrating the very quick response of the mass flow meter with the pressure drop minimized by the improved cell design. Fig. 4 shows the change of the loading ratios (D/Pd, D/Pd+Rh) with time for a Pd and a Pd95Rh5 electrode.
As shown in Table 1, significant difference in H/Pd was not observed between the examined pure Pd electrodes with different processing conditions. The slight difference should be considered as experimental error inherent in this method, as explained in the experimental section. The observed scattering in loading ratio in 13 measurements for sample A is consistent with the estimated error, ± 2 %. For the heavy water system, on the other hand, we observed significant difference in D/Pd. Even if the samples were taken from the same batch, those loading ratios were scattered over the experimental error. The results show that the electrode with higher processing ratio and without annealing gives the highest loading ratio and annealing at 650 °C significantly decreases the loading ratio.
In our preliminary experiment, we have found further lower loading ratios of 0.2 to 0.3 (D/Pd) for the samples annealed at 1000 °C for 24 hours. The loading ratio for the light water system was not changed significantly. This is quite interesting finding. Although we had evaluated our Pd electrodes using light water, this reminded us to use heavy water. It is noted that these lower loading ratios were determined at the time when the gas recovery efficiencies reached in the range 99.9 to 100.1 c;,. Since this range is the limit of our measurement, there is a possibility that slow loading (less than 0.1 %) was still continued at that time. Therefore, the lower loading ratios may have resulted from unsaturation. We first suspected the effect of the oxide on the surface of the Pd electrodes. However, the EPMA for oxygen did not show any significant difference in the oxygen content between the annealed and the unannealed samples. A study to explain this interesting result is in progress.
A visible crack on a Pd electrode subjected to electrolysis was observed once in a series of sample B. The loading ratio (H/Pd) was 0.802. Although this lower value may be ascribed to the cracking, further accumulation of data is needed to conclude the relationship between cracking and loading ratio.
The loading ratio of Pd-Ag and Pd-Ce alloys decreased with increasing Ag or Ce content for both H/Pd and D/ Pd. On the other hand, the loading ratios of the Pd-Rh alloys were higher than those of pure Pd. As shown in Fig. 4, the loading rate of the Pd-Rh alloy was smaller than that of pure Pd.
31-6

Table 1. Hydrogen loading ratios observed for various Pd and Pd alloy electrodes at the current density of 300 mA/cm 2 .
Sample Processing Anneal H/Pd D/Pd ratio (%)* temp.(°C)
1st run 2nd run mean 1st run 2nd run mean
Pdioo (A) 99.8 no anneal 0.834 0.843 0.846** 0.817 0.819 0.818 Pdioo (B) 93.8 no anneal 0.835 0.839 0.837 0.823 0.757 0.775 Pdioo (C) 93.8 350 0.802 0.865 0.834 0.798 0.731 0.765 Pdioo (D) 93.8 450 0.831 0.854 0.843 0.803 0.782 0.793 Pdioo (E) 93.8 650 0.836 0.850 0.843 0.734 0.704 0.719 Pd9oAglo 93.8 -' 0.628**** 0.628 Pd8oAg2o 93.8 - 0.469 0.477 Pd7oAg3o 93.8 - 0.333 0.315 Pd97Ce3 93.8 - 0.660 0.629 Pd95Ce5 93.8 - 0.582 0.526 Pd9oCeio 93.8 - 0.311 0.340 Pd97Rh3 93.8 - 0.927 Pd95Rh5 93.8 - 0.839
* Defined as (1 -final cross section area / initial area) x 100, without considering the effect of annealing.
** Mean value in 13 experiments. * For the alloys, refer to the experimental section. '** For the alloys, D(or H)/(Pd+Ag, Ce, Rh) values are given.
Fig. 3. Typical output of the mass flow meter.
31-7

Fig. 4. Loading ratio vs. time plot for Pd100 and Pd95Rh5.
References
1. M.C.H. McKubre et al., Proceedings of the Third International Conference on Cold Fusion, University Academy Press, Inc., P. 5 (1992).
2. K. Kunimatsu et al., Proceedings of the Third International Conference on Cold Fusion, University Academy Press, Inc., P. 31 (1992).
3. A. Takahashi et al.,Proceedings of the Third International Conference on Cold Fusion, University Academy Press, Inc., P. 79 (1992).
4. T. Sano et al., Proceedings of the Third International Conference on Cold Fusion, University Academy Press, Inc., P. 569 (1992).
31-8

EVIDENCE OF AGGLOMERATION AND SYNERESIS IN REGULAR AND EXCESS HEAT CELLS IN WATER
Ernest E. Criddle Electrochemical Science & Technology Centre
University of Ottawa 33 Mann Avenue
Ottawa, Ontario, KIN 6N5 Canada
Abstract
Agglomeration and syneresis of colloids in electrochemical cells affect cell voltages when the agglomerate adheres to electrodes. Electrode gassing can dislodge agglomerates which move under thermophoretic forces to the cooler cell wall; once adhered to the wall they can change the thermal conductivity of that wall which changes the cell constant. Agglomerates on the electrodes and the cell wall may undergo syneresis which consists of shrinking and restructuring. This may be triggered by a change of cell current and produces either a more resistive layer on the electrodes or a little sediment in the cell. Such changes in resistance can alter resistive heating but do not lead to excess heat. Excess heat is reported here as a function of a nickel cathode: soft nickel failed to produce excess heat while three samples of treated nickel were more productive. A parallel is drawn between these results on nickel and results reported by others for the palladium heavy water system.
Background Dilute colloids of silica, trace metals and likely some bacteria exist as charged particles of various shapes and sizes in solution. Control of such species is mandatory in the microcircuit, pharmaceutical and electroplating industries. In an electrochemical cell, charged silica particles migrate and may coat an electrode with a monolayer but will not agglomerate further unless metal ions are present. Then, agglomerates form on an electrode like a house of cards, except the agglomerates are held by the charges rather than gravity. Agglomeration by electrophoresis has been described by others' , 2 . When the current changes, the agglomerate may undergo a dramatic crystalline change called syneresis. This may be a catastrophic change as if someone shook the table under the house of cards. The resultant layer may be much less porous and even quite resistive to ion transport; or it may detach from the electrode and drift away.
The following series of experiments is presented as a preliminary demonstration of agglomeration and syneresis which affect electrode voltages and cell constants; and of excess heating in ordinary water which appears to be a function of the cathode metal. These two distinct entities are presented as they unfolded from experimental results.
32-1
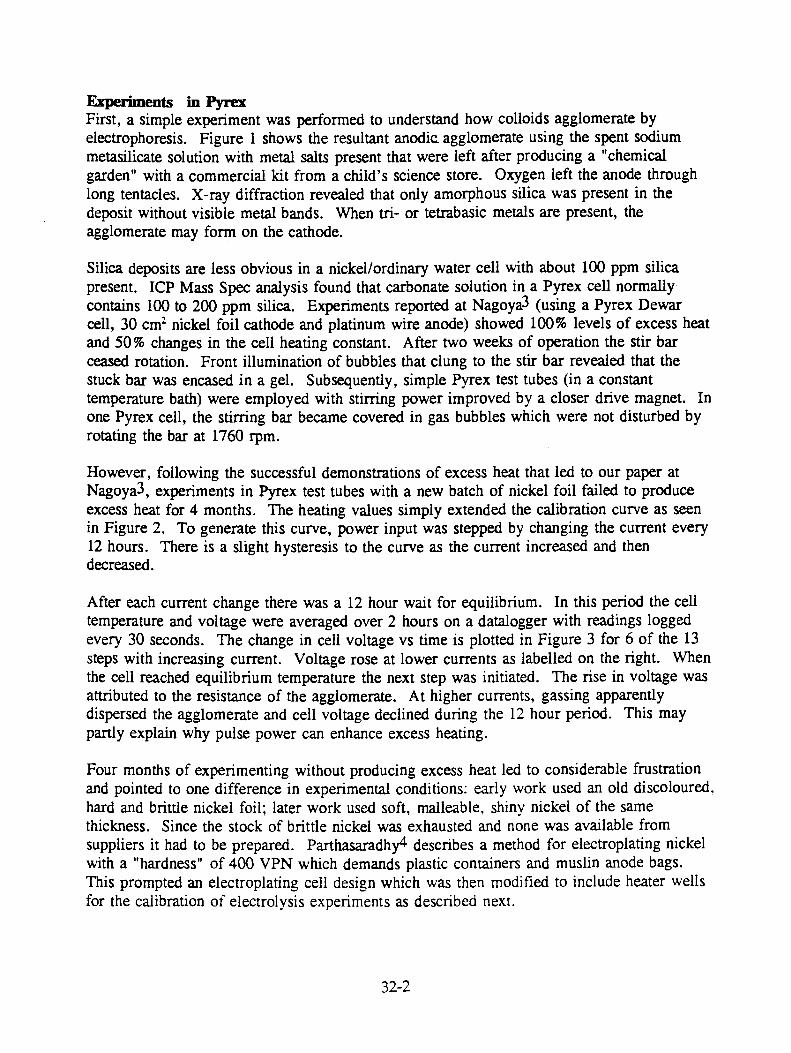
Experiments in Pyrex First, a simple experiment was performed to understand how colloids agglomerate by electrophoresis. Figure 1 shows the resultant anodic. agglomerate using the spent sodium metasilicate solution with metal salts present that were left after producing a "chemical garden" with a commercial kit from a child's science store. Oxygen left the anode through long tentacles. X-ray diffraction revealed that only amorphous silica was present in the deposit without visible metal bands. When tri- or tetrabasic metals are present, the agglomerate may form on the cathode.
Silica deposits are less obvious in a nickel/ordinary water cell with about 100 ppm silica present. ICP Mass Spec analysis found that carbonate solution in a Pyrex cell normally contains 100 to 200 ppm silica. Experiments reported at Nagoya 3 (using a Pyrex Dewar cell, 30 cm' nickel foil cathode and platinum wire anode) showed 100% levels of excess heat and 50% changes in the cell heating constant. After two weeks of operation the stir bar ceased rotation. Front illumination of bubbles that clung to the stir bar revealed that the stuck bar was encased in a gel. Subsequently, simple Pyrex test tubes (in a constant temperature bath) were employed with stirring power improved by a closer drive magnet. In one Pyrex cell, the stirring bar became covered in gas bubbles which were not disturbed by rotating the bar at 1760 rpm.
However, following the successful demonstrations of excess heat that led to our paper at Nagoya3, experiments in Pyrex test tubes with a new batch of nickel foil failed to produce excess heat for 4 months. The heating values simply extended the calibration curve as seen in Figure 2. To generate this curve, power input was stepped by changing the current every 12 hours. There is a slight hysteresis to the curve as the current increased and then decreased.
After each current change there was a 12 hour wait for equilibrium. In this period the cell temperature and voltage were averaged over 2 hours on a datalogger with readings logged every 30 seconds. The change in cell voltage vs time is plotted in Figure 3 for 6 of the 13 steps with increasing current. Voltage rose at lower currents as labelled on the right. When the cell reached equilibrium temperature the next step was initiated. The rise in voltage was attributed to the resistance of the agglomerate. At higher currents, gassing apparently dispersed the agglomerate and cell voltage declined during the 12 hour period. This may partly explain why pulse power can enhance excess heating.
Four months of experimenting without producing excess heat led to considerable frustration and pointed to one difference in experimental conditions: early work used an old discoloured. hard and brittle nickel foil; later work used soft, malleable, shiny nickel of the same thickness. Since the stock of brittle nickel was exhausted and none was available from suppliers it had to be prepared. Parthasaradhy 4 describes a method for electroplating nickel with a "hardness" of 400 VPN which demands plastic containers and muslin anode bags. This prompted an electroplating cell design which was then modified to include heater wells for the calibration of electrolysis experiments as described next.
32-2

Experiments in Plastic The Plexiglass tube with base as seen in Figure 4 uses two nickel anodes to provide a uniform current density at the cathode. Anode bags- were easily slipped on and off; these were made of close woven cotton/polyester. The heater wells were made of Teflon tubes. Cell temperature was observed with an Omega self-adhesive thermocouple on the exterior of the cell wall.
Figure 5 shows plots of cell voltage and heating vs time for this Plexiglass cell with an electroplated "hard" nickel cathode (36.4cm 2), Ni anodes (total 55 cm 2) and 0.57M K2CO3 . At the outset, the cell voltage was high. Anode bags introduced at the 8 hour mark were . used to extract colloidal impurities which formed a gas bubble filled gel on the bag. When the bags were removed at the 25 hour mark the voltage dropped (presumably due to the loss of the resistive gel layer on the bags) and heating per watt increased slowly. Then the current was decreased to 45mA at 72 hours which further reduced cell voltage and increased heating to 10.5°C/W. Calibration heating in this cell produced 6.5°C/W. At 45mA the voltage rose slowly for 150 hours but was quite low (2 volts) and stable as described previously by Mills and Kneizys5 and Noninski6 .
The higher heat per watt in this cell was found to be characteristic of several "hard" nickel cathodes and was quite different from the soft nickel of Figure 2. By exchanging cathodes, it was found that excess heat could be switched on and off in this experiment. Classical heating was observed with soft nickel, while "hard" nickel produced up to 12°C/W (ie. about 100% excess heat). An old electrode of brittle nickel used for earlier work3 was rejuvenated in 0.57M K2CO3/3 % H202 according to a recipe of Mills? and it then achieved previous performance levels again close to 12°C/W.
Figure 6 shows calibration and electrochemical heating levels for the Plexiglass cell using a soft nickel cathode which had been oxidized in air at 500°C for an hour to blacken it like our original aged nickel. Calibration values with and without bags forms a continuous curve. Cell heating with anode bags in place in this instance was at the calibration level. When the bags were removed, cell heating produced considerable excess heat. However, these results must be considered preliminary until the roles of agglomerates and of metals are more fully appreciated.
These divergent results on Ni/K 2CO3 reflect similar experiences on Pd/LiOD. Palladium rod produced excess heat 8 from about 400 hours to 800 hours into a run which may reflect the time for it to be hardened by deuterium intrusion and perhaps before it cracked with embrittlement. Annealed palladium foils and rods subjected to ramped power often failed to produce excess power until the power ramps were repeated 9 , again suggesting a required time to harden. Alternatively, a palladium ball deformed by hammer blows into a fat dime shape 10 produced excess heat within 15 hours. Another palladium foil that was cold worked 11 yielded excess heat after 30 current ramps (10 hours) although a replication experiment using palladium from the same batch was less successful; oddly, no mention was made of cold working the replication foil. The parallel successes for hardened or cold worked cathodes in light and heavy waters may be more than coincidence.
32-3

Conclusions It is concluded that colloidal impurities affect excess heat cells that use ordinary water by raising the cell voltage and increasing resistive heating. Removal of these colloids can decrease cell voltage and improve the fraction of input power that is exhibited as excess cell heating. It is also concluded that "hardened" nickel samples prepared in three different ways all produced excess heat while soft nickel did not. This situation appears to parallel the experiences of heat production from palladium in heavy water.
Acknowledgements The financial contribution of Energy, Mines and Resources Canada is greatly appreciated.
References 1. R. K. Iler. "The Chemistry of Silica: Solubility, Polymerization, Colloid and Surface
Properties and Biochemistry." New York, Wiley 1979, pp. 83-94, 172-177, 312-404.
2. C. J. Brinker and G. W. Scherer. Sol-Gel Science. San Diego: Academic Press, 1990, pp. 99-107.
3. E. E. Criddle, "Implications of Isoperibolic Electrode Calorimetry for Cold Fusion: The Silica Effect," ICCF3 proceedings: Frontiers of Cold Fusion. Universal Academy Press-Tokyo 1993, pp. 417-420.
4. N. V. Parthasaradhy. Practical Electroplating Handbook, New Jersey: Prentice Hall, 1989, pp. 183-186.
5. R. L. Mills and S. P. Kneizys, "Excess Heat Production by the Electrolysis of an Aqueous Carbonate Electrolyte and the Implications for Cold Fusion." Fusion Technology, Vol. 20. No.1, pp. 65-81 (1991).
6. V. C. Noninski, "Excess Heat During the Electrolysis of a Light Water Solution of K2CO3 with a Nickel Cathode", Fusion Technology, Vol. 21, No.2, Part 1, pp. 163-167 (1992).
7. R. L. Mills, W. R. Good and R. Shaubach. "Dihidrino Molecule Identification." Fusion Technology. Vol. 25, No. 1 (1994).
8. S. Pons and M. Fleischmann. "Calorimetry of the Palladium - Deuterium System." Proc. First Annual Conference on Cold Fusion, Salt Lake City UT (March 1990) pp. 1-19.
9. M. McKubre, S. Crouch-Baker, S. Smedley and F. Tanzella. "An Overview of Calorimetric Studies on the D/Pd System, at SRI." Proc. Russian Conference on Cold Fusion, Abrau Durso (September 1993).
32-4

10. M. Schreiber, T. M. Gur, G. Lucier, J. A. Ferrante, J. Chao and R. M. Huggins. "Recent Measurements of Excess Energy Production in Electrochemical Cells Containing Heavy Water and Palladium." Proc. First Annual Conference on Cold Fusion, Salt Lake City UT (March 1990) pp. 44-56.
11. A. Takahashi, A. Mega, T. Takeuchi, H. Miyamaru and T. Iida. "Anomalous Excess Heat by D20/Pd Cell Under L-H Mode Electrolysis." Frontiers of Cold Fusion. Universal Academy Press - Tokyo (1993) pp. 79-91.
Figure 1. An electrochemical garden Figure 2. Heat vs input power for soft Ni monster grown on Ni wire anode. cathode coincides with calibration heat.
32-5
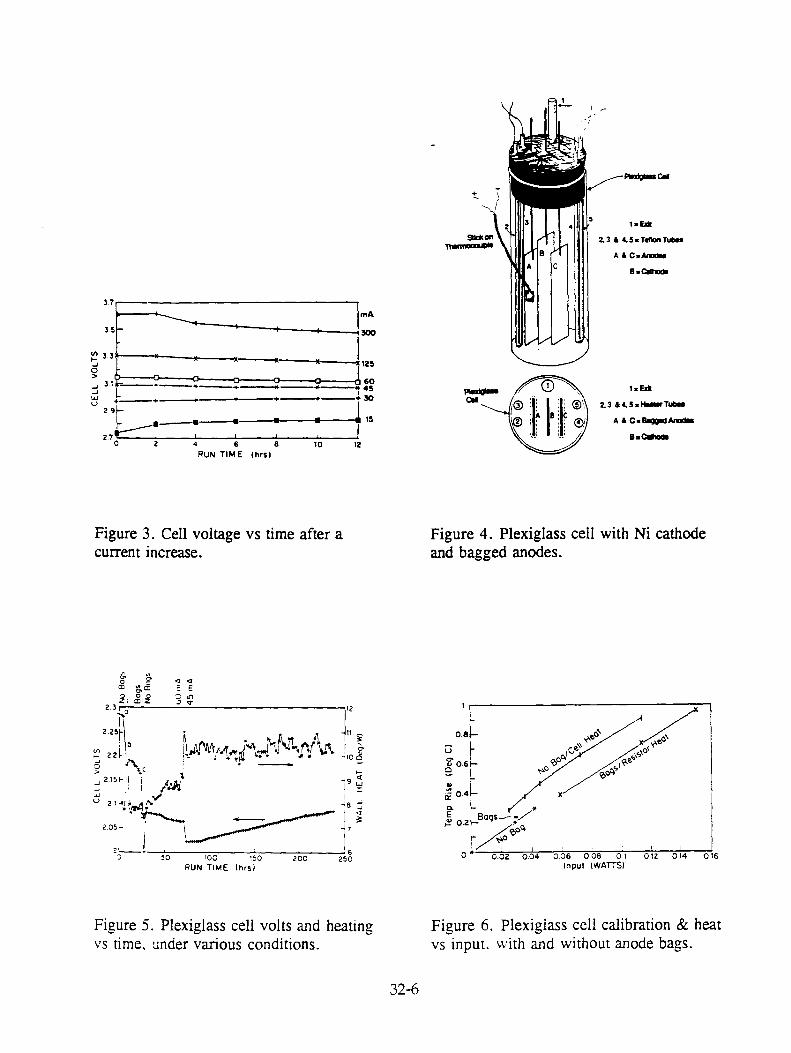
Figure 3. Cell voltage vs time after a Figure 4. Plexiglass cell with Ni cathode current increase. and bagged anodes.
Figure 5. Plexiglass cell volts and heating Figure 6. Plexiglass cell calibration & heat vs time, under various conditions. vs input. with and without anode bags.
32-6

ISOTOPIC FUEL LOADINGCOUPLED TO REACTIONS
AT AN ELECTRODE
MITCHELL R. SWARTZJET Technology Weston, MA USA 02193
Dr. Mitchell Swartz does not wish to have his papers uploaded to LENR-CANR.org. A copy of thispaper can be found in the original EPRI proceedings, Vol. 2, p. 436:
http://my.epri.com/portal/server.pt?Abstract_id=TR-104188-V2
33-1


About EPRI
EPRI creates science and technology solutions for the
global energy and energy services industry. U.S.
electric utilities established the Electric Power
Research Institute in 1973 as a nonprofit research
consortium for the benefit of utility members, their
customers, and society. Now known simply as EPRI,
the company provides a wide range of innovative
products and services to more than 1000 energy-
related organizations in 40 countries. EPRI's
multidisciplinary team of scientists and engineers
draws on a worldwide network of technical and
business expertise to help solve today's toughest
energy and environmental problems.
EPRI. Electrify the World
WARNING: This Document may contain information classified under U.S. Export Control regulations as restricted from export outside the United States. You are under an obligation to ensure that you have a legal right to obtain access to any such restricted information and to ensure that you obtain an export license prior to any re-export of any such restricted information. Special restrictions may apply to access by anyone that is not a United States citizen or a Permanent United States resident. For further information regarding your obligations, please see the information contained below in the section titled "Export Control Restrictions."
Export Control Restrictions Access to and use of EPRI Intellectual Property is granted with the specific understanding and requirement that responsibility for ensuring full compliance with all applicable U.S. and foreign export laws and regulations is being undertaken by you and your company. This includes an obligation to ensure that any individual receiving access hereunder who is not a U.S. citizen or permanent U.S. resident is permitted access under applicable U.S. and foreign export laws and regulations. In the event you are uncertain whether you or your company may lawfully obtain access to this EPRI Intellectual Property, you acknowledge that it is your obligation to consult with your company's legal counsel to determine whether this access is lawful. Although EPRI may make available on a case by case basis an informal assessment of the applicable U.S. export classification for specific EPRI Intellectual Property, you and your company acknowledge that this assessment is solely for informational purposes and not for reliance purposes. You and your company acknowledge that it is still the obligation of you and your company to make your own assessment of the applicable U.S. export classification and ensure compliance accordingly. You and your company understand and acknowledge your obligations to make a prompt report to EPRI and the appropriate authorities regarding any access to or use of EPRI Intellectual Property hereunder that may be in violation of applicable U.S. or foreign export laws or regulations.
© 2004 Electric Power Research Institute (EPRI), Inc. All rights reserved. Electric Power Research Institute and EPRI are registered service marks of the Electric Power Research Institute, Inc. EPRI. ELECTRIFY THE WORLD is a service mark of the Electric Power Research Institute, Inc.
EPRI • 3412 Hillview Avenue, Palo Alto, California 94304 • PO Box 10412, Palo Alto, California 94303 • USA 800.313.3774 • 650.855.2121 • askepri;i4epri.com • www.epri.com
Related Documents


![Proceedings of the U.S. NRC/EPRI/ANL Heated Crevice .... Diercks* * Argonne National Laboratory ... and the Electric Power Research Institute, ... Chemistry Tina Gaudreau [EPRI]](https://static.cupdf.com/doc/110x72/5b1b46377f8b9a37258e787e/proceedings-of-the-us-nrceprianl-heated-crevice-diercks-argonne-national.jpg)