Epidemiologic Methods Septem ber28 U nderstanding M easurem ent: A spects ofR eproducibility & Validity O ctober3 Study D esign O ctober10 M easures ofD isease O ccurrence I O ctober17 M easures ofD isease O ccurrence II O ctober24 M easures ofD isease A ssociation I O ctober31 M easures ofD isease A ssociation II O ctober31 M easures ofA ttributable R isk N ovem ber7 B ias in E pidem iologic Studies: Selection B ias N ovem ber14 B ias in E pidem iologic Studies: M easurem entBias N ovem ber14 C onfounding and Interaction I: G eneralPrinciples N ovem ber21 C onfounding and Interaction II: A ssessing Interaction N ovem ber28 C onfounding and Interaction II: Stratified A nalysis D ecem ber5 C onceptualA pproach to M ultivariable A nalysis I D ecem ber7 C onceptualA pproach to M ultivariable A nalysis II D ecem ber12 C onceptualA pproach to M ultivariable A nalysis III

Epidemiologic Methods. Definitions of Epidemiology The study of the distribution and determinants (causes) of disease –e.g. cardiovascular epidemiology.
Dec 27, 2015
Welcome message from author
This document is posted to help you gain knowledge. Please leave a comment to let me know what you think about it! Share it to your friends and learn new things together.
Transcript
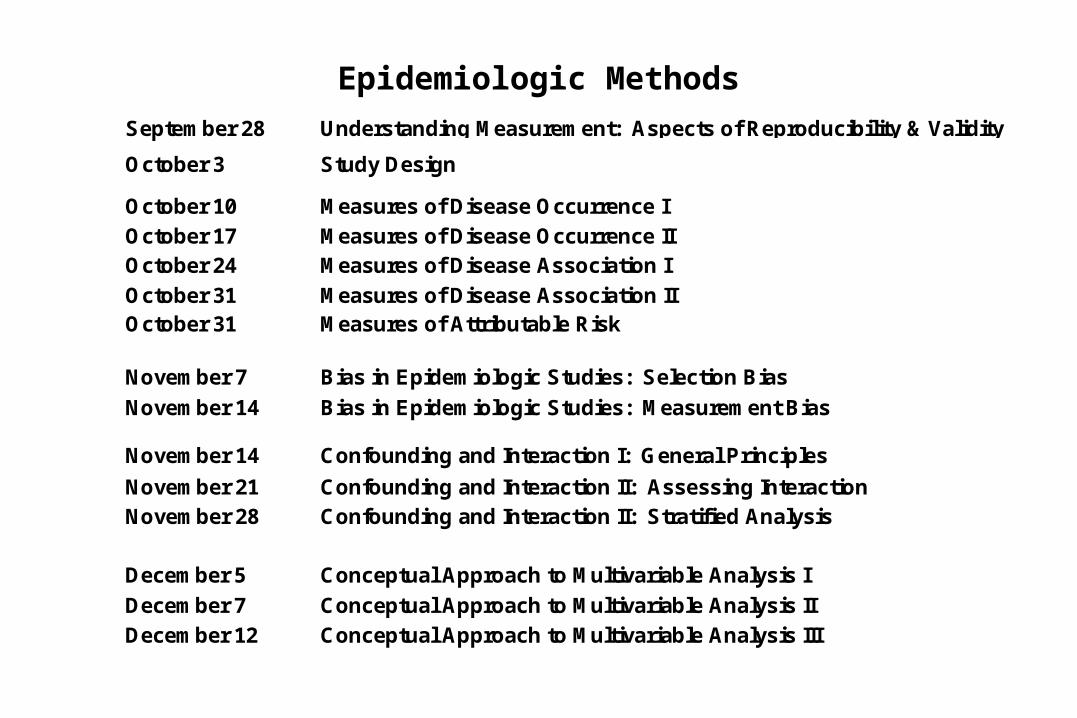
Epidemiologic MethodsSeptember 28 Understanding Measurement: Aspects of Reproducibility & Validity
October 3 Study Design
October 10 Measures of Disease Occurrence I
October 17 Measures of Disease Occurrence IIOctober 24 Measures of Disease Association I
October 31 Measures of Disease Association IIOctober 31 Measures of Attributable Risk
November 7 Bias in Epidemiologic Studies: Selection Bias
November 14 Bias in Epidemiologic Studies: Measurement Bias
November 14 Confounding and Interaction I: General Principles
November 21 Confounding and Interaction II: Assessing InteractionNovember 28 Confounding and Interaction II: Stratified Analysis
December 5 Conceptual Approach to Multivariable Analysis I
December 7 Conceptual Approach to Multivariable Analysis II
December 12 Conceptual Approach to Multivariable Analysis III

Definitions of Epidemiology
• The study of the distribution and determinants (causes) of disease– e.g. cardiovascular epidemiology
• The method used to conduct human subject research– the methodologic foundation of any research
where individual humans or groups of humans are the unit of observation
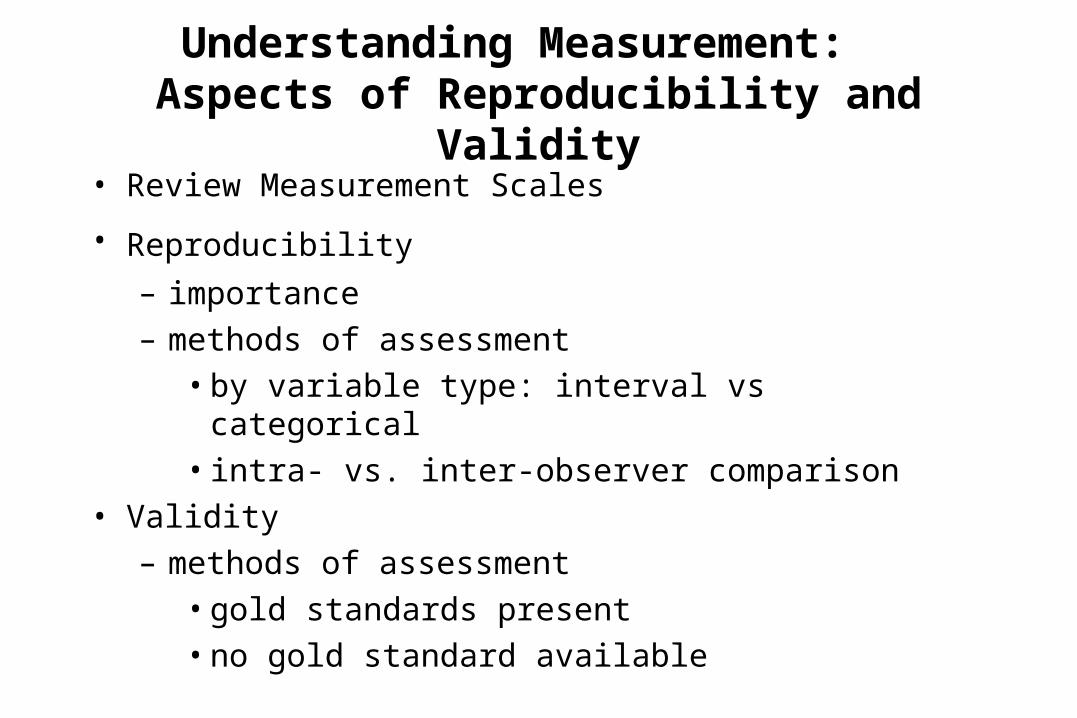
Understanding Measurement: Aspects of Reproducibility and Validity
• Review Measurement Scales
• Reproducibility
– importance– methods of assessment
• by variable type: interval vs categorical• intra- vs. inter-observer comparison
• Validity– methods of assessment
• gold standards present• no gold standard available
Clinical Research
Sample
MeasureAnalyze
Infer

A study can only be as good as the data . . .
-Martin Bland

Measurement Scales
Scale Example
Interval continuousdiscrete
weightWBC count
Categoricalordinalnominaldichotomous
tumor stageracedeath

Reproducibility vs Validity
• Reproducibility– the degree to which a measurement provides the
same result each time it is performed on a given subject or specimen
• Validity– from the Latin validus - strong– the degree to which a measurement truly
measures (represents) what it purports to measure (represent)

Reproducibility vs Validity
• Reproducibility– aka: reliability, repeatability, precision, variability,
dependability, consistency, stability
• Validity– aka: accuracy

Relationship Between Reproducibility and Validity
Good Reproducibility
Poor Validity
Poor Reproducibility
Good Validity

Relationship Between Reproducibility and Validity
Good Reproducibility
Good Validity
Poor Reproducibility
Poor Validity

Why Care About Reproducibility?
Impact on Validity• Mathematically, the upper limit of a measurement’s
validity is a function of its reproducibility
• Consider a study to measure height in the community:
– if we measure height twice on a given person and get two different values, then one of the two values must be wrong (invalid)
– if study measures everyone only once, errors, despite being random, may not balance out
– final inferences are likely to be wrong (invalid)
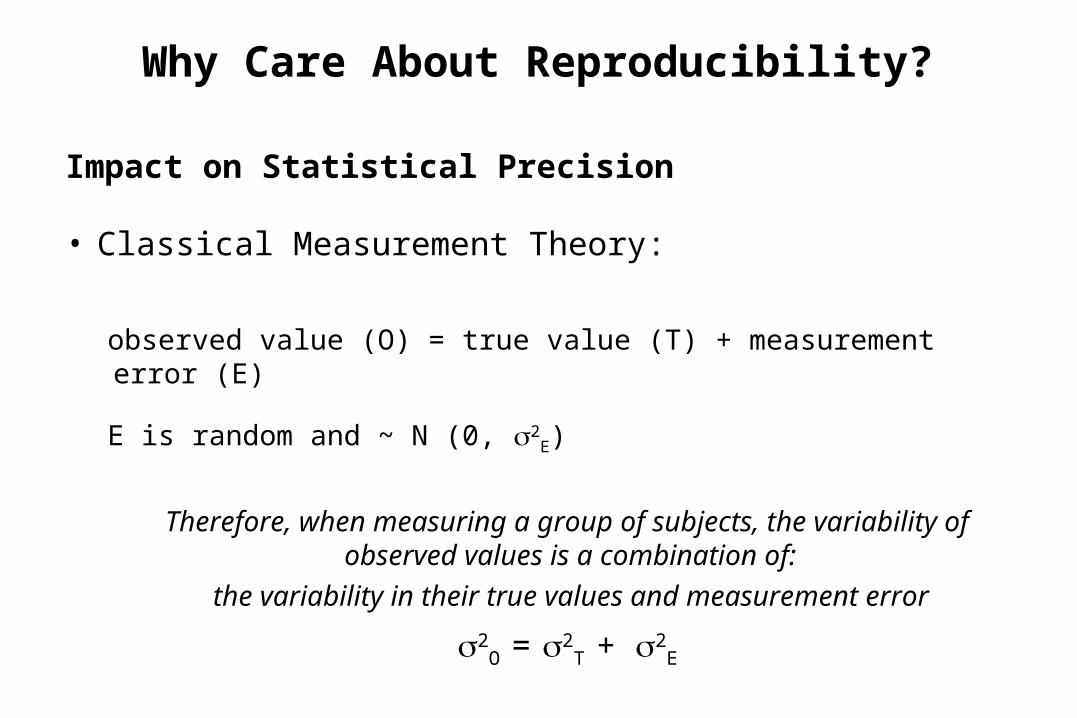
Why Care About Reproducibility?
Impact on Statistical Precision
• Classical Measurement Theory:
observed value (O) = true value (T) + measurement error (E)
E is random and ~ N (0, 2E)
Therefore, when measuring a group of subjects, the variability of observed values is a combination of:
the variability in their true values and measurement error
2O = 2
T + 2E

Why Care About Reproducibility?
2O = 2
T + 2E
• More measurement error means more variability in observed measurements
• More variability of observed measurements has profound influences on statistical precision/power:– Descriptive study: less precise estimates of given traits– RCT’s: power to detect a treatment difference is reduced– Observational studies: power to detect an influence of a
particular exposure upon a given outcome is reduced.

Conceptual Definition of Reproducibility
• Reproducibility
• Varies from 0 (poor) to 1 (optimal)
• As 2E approaches 0 (no error), reproducibility
approaches 1
2
E
2
T
2
T
2
O
2
T

Phillips and Smith, J Clin Epi 1993

Sources of Measurement Variability
• Observer
• within-observer (intrarater)
• between-observer (interrater)
• Instrument
• within-instrument
• between-instrument
• Subject
• within-subject

Sources of Measurement Variability
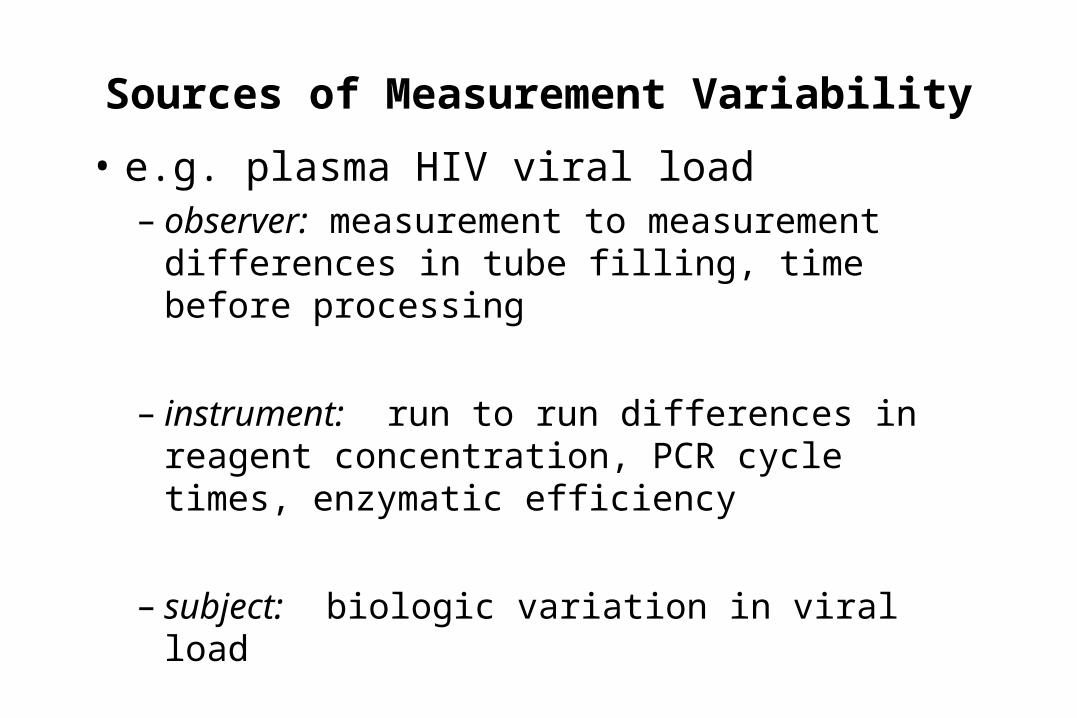
• e.g. plasma HIV viral load– observer: measurement to measurement
differences in tube filling, time before processing
– instrument: run to run differences in reagent concentration, PCR cycle times, enzymatic efficiency
– subject: biologic variation in viral load

Assessing Reproducibility
Depends on measurement scale
• Interval Scale– within-subject standard deviation– coefficient of variation
• Categorical Scale
– Cohen’s Kappa
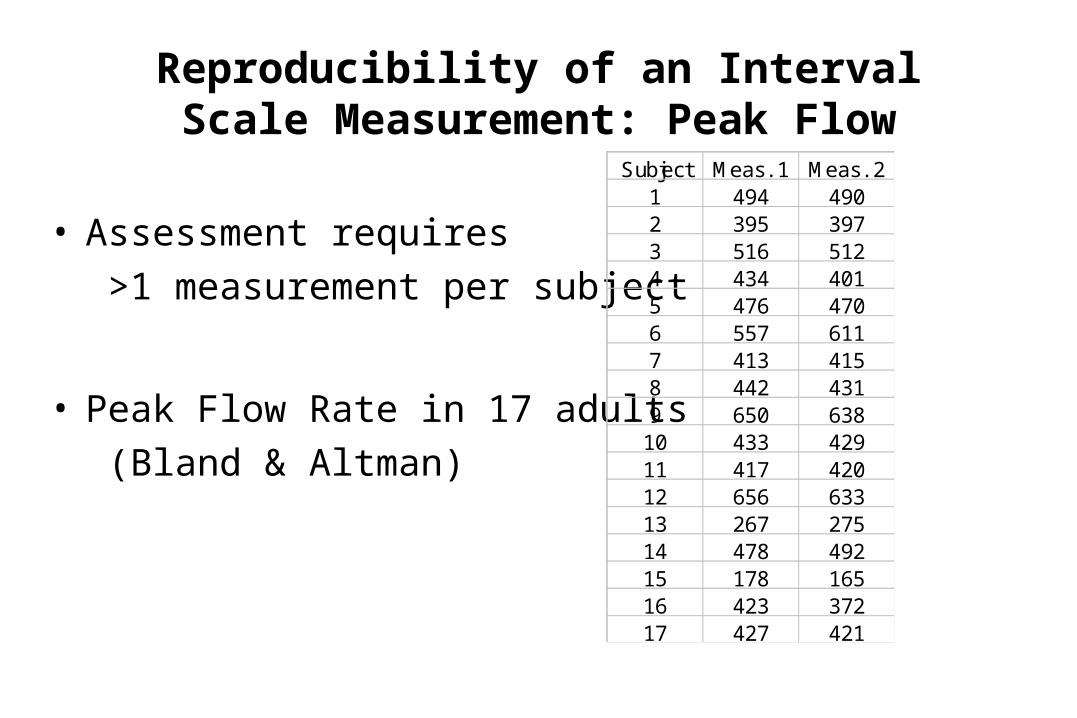
Reproducibility of an Interval Scale Measurement: Peak Flow
• Assessment requires
>1 measurement per subject
• Peak Flow Rate in 17 adults
(Bland & Altman)
Subject Meas. 1 Meas. 21 494 4902 395 3973 516 5124 434 4015 476 4706 557 6117 413 4158 442 4319 650 638
10 433 42911 417 42012 656 63313 267 27514 478 49215 178 16516 423 37217 427 421

Assessment by Simple CorrelationM
eas.
2
Meas. 1200 400 600 800
200
400
600
800
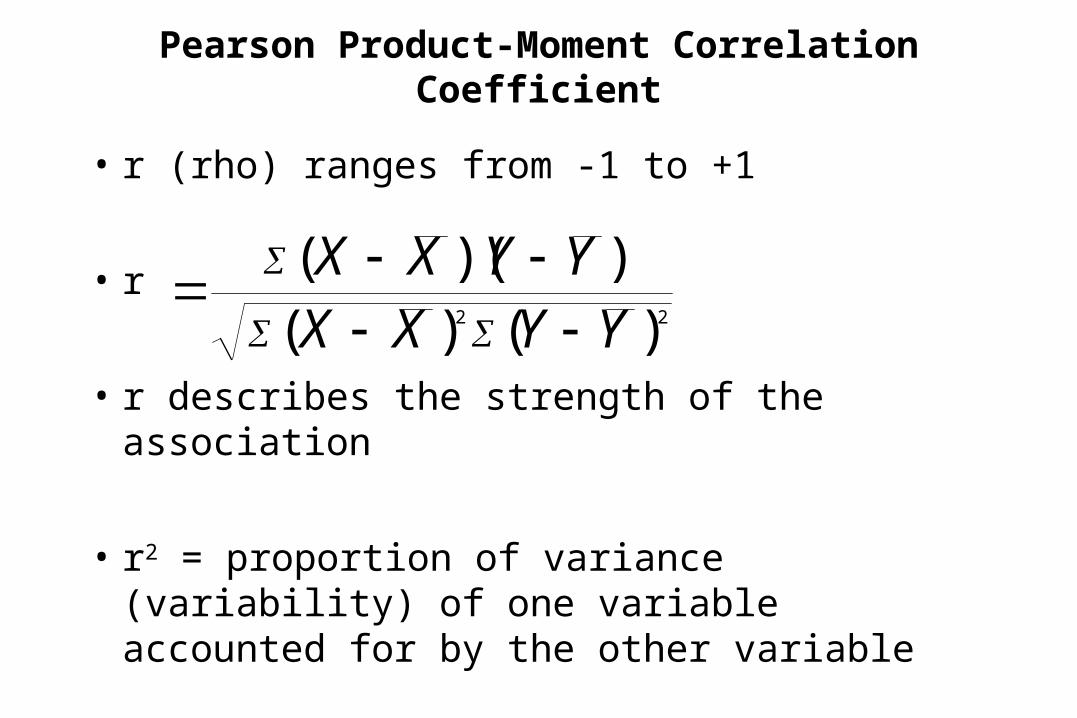
Pearson Product-Moment Correlation Coefficient
• r (rho) ranges from -1 to +1
• r
• r describes the strength of the association
• r2 = proportion of variance (variability) of one variable accounted for by the other variable
22 )()())((YYXXYYXX
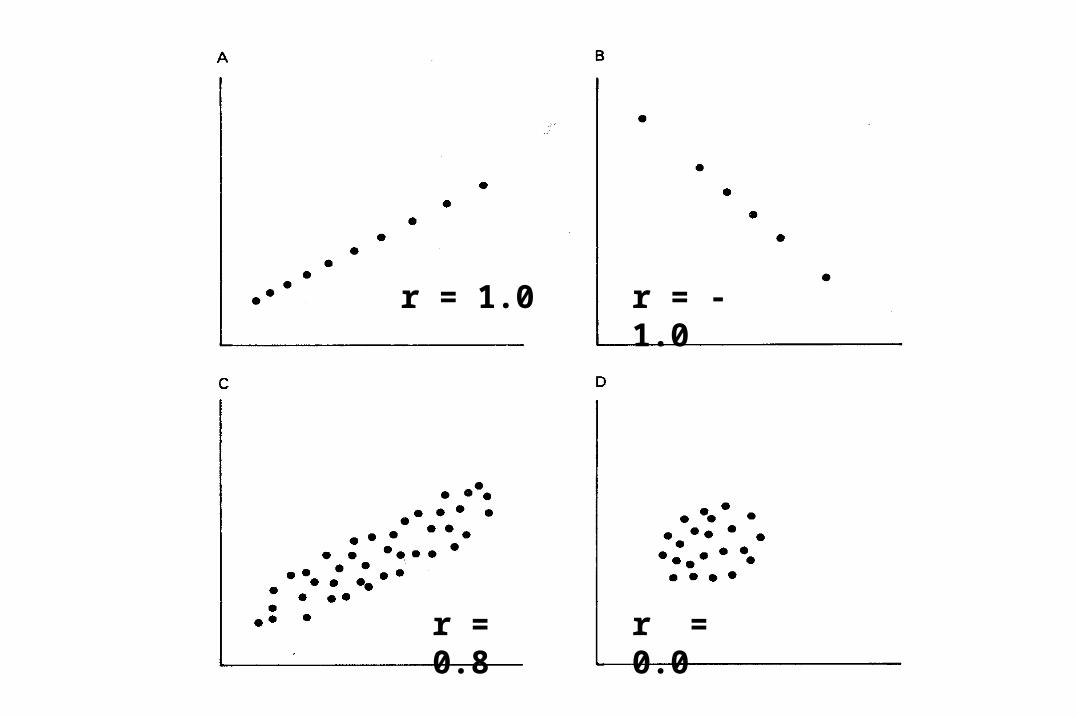
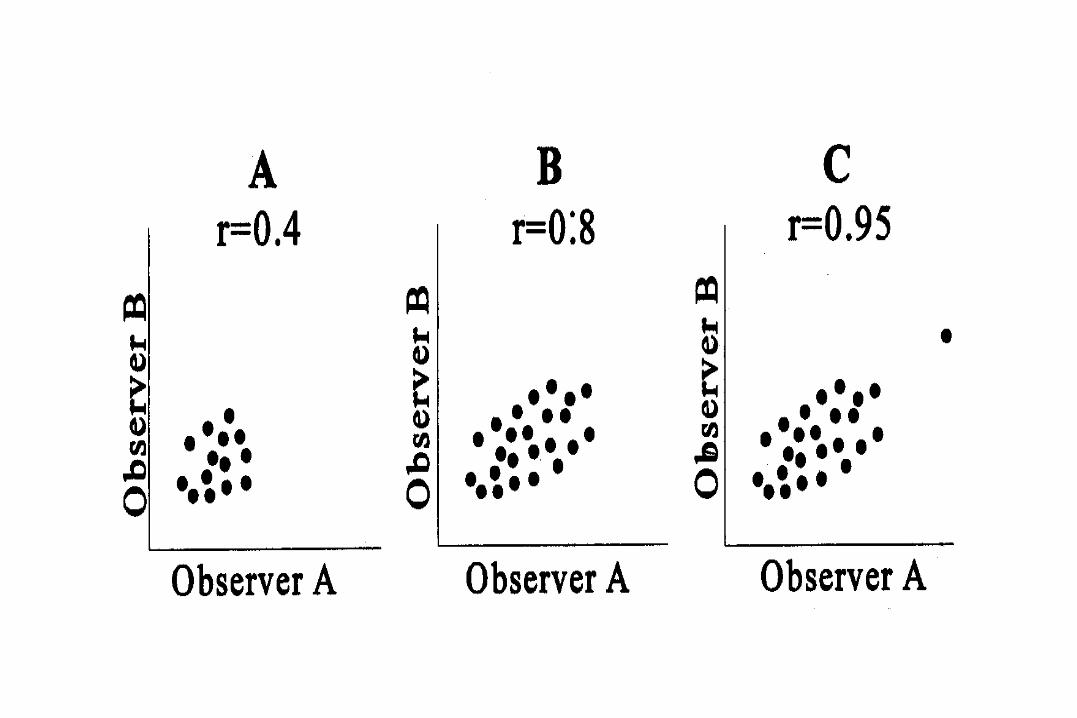
r = -1.0
r = 0.8 r = 0.0
r = 1.0
r = 1.0 r = -1.0
r = 0.8 r = 0.0
Correlation Coefficient for Peak Flow Data
r ( meas.1, meas. 2) = 0.98

Limitations of Simple Correlation for Assessment of Reproducibility
• Depends upon range of data– e.g. Peak Flow
• r (full range of data) = 0.98• r (peak flow <450) = 0.97• r (peak flow >450) = 0.94

Limitations of Simple Correlation for Assessment of Reproducibility
• Depends upon ordering of data
• Measures linear association only
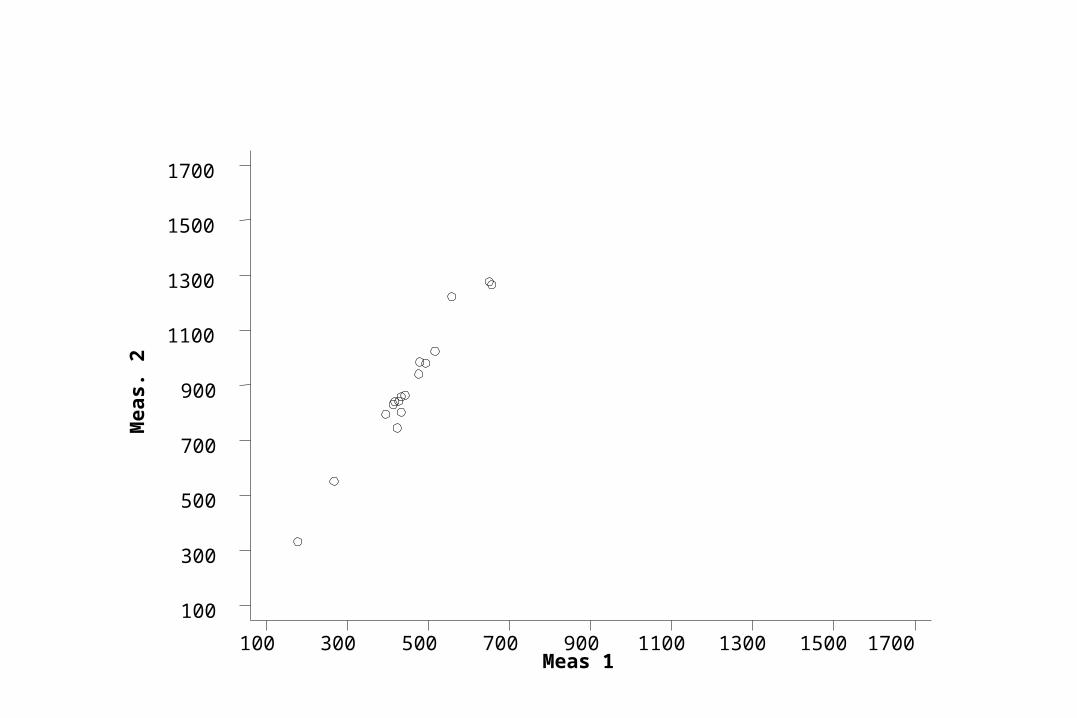
Meas.
2
Meas 1100 300 500 700 900 1100 1300 1500 1700
100
300
500
700
900
1100
1300
1500
1700

Limitations of Simple Correlation for Assessment of Reproducibility
• Gives no meaningful parameter for the issue

Within-Subject Standard Deviation
• Mean within-subject standard deviation (sw)
= 15.3 l/min
subject meas1 meas2 mean s1 494 490 492 2.832 395 397 396 1.413 516 512 514 2.83. . . . .. . . . .. . . . .
15 178 165 172 9.1916 423 372 398 36.0617 427 421 424 4.24
17)24.4...83.2( 222
n
si i

Computationally easier with ANOVA table:
• Mean within-subject standard deviation (sw) :
Analysis of Variance Source SS df MS F Prob > F-----------------------------------------------------------------------Between groups 441598.529 16 27599.9081 117.80 0.0000 Within groups 3983.00 17 234.294118----------------------------------------------------------------------- Total 445581.529 33 13502.4706
squares of sum group- withins2
i
234 squaremean group- within17s2
i
l/min 15.3 squaremean group-within
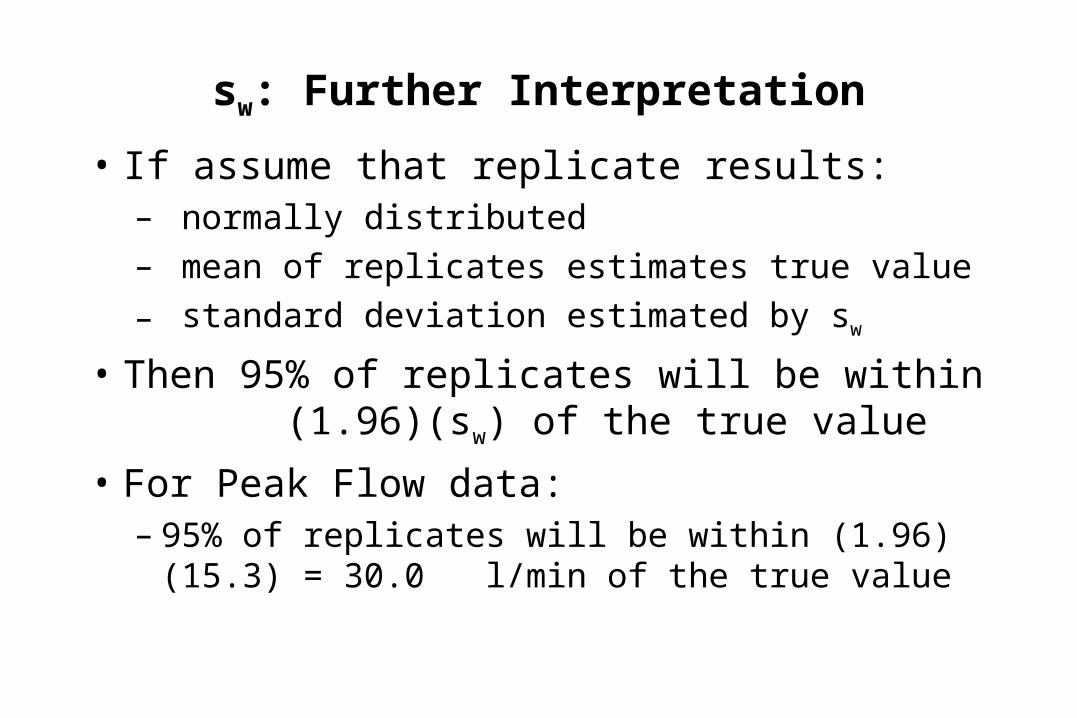
sw: Further Interpretation
• If assume that replicate results:– normally distributed – mean of replicates estimates true value
– standard deviation estimated by sw
• Then 95% of replicates will be within (1.96)(sw) of the true value
• For Peak Flow data: – 95% of replicates will be within (1.96)(15.3) =
30.0 l/min of the true value

sw: Further Interpretation
• Difference between any 2 replicates for same person = diff = meas1 - meas2
• Because var(diff) = var(meas1) + var(meas2), therefore,
s2diff = sw
2 + sw2 = 2sw
2
sdiff
• If assume the distribution of the differences between pairs is N(0, 2
diff), therefore, – The difference between 2 measurements for the same subject is
expected to be less than (1.96)(sdiff) = (1.96)(1.41)sw = 2.77sw for 95% of all pairs of measurements
w
2
w
2
diffs2s2s

sw: Further Interpretation
• For Peak Flow data:
• The difference between 2 measurements for the same subject is expected to be less than 2.77sw
=(2.77)(15.3) = 42.4 l/min for 95% of all pairs
• Bland-Altman refer to this as the “repeatability” of the measurement

Interpreting sw
• Appropriate only if there is one sw
• if sw does not vary with the true underlying value
Wit
hin
-Su
bje
ct
Std
Devia
tion
Subject Mean Peak Flow
100 300 500 7000
10
20
30
40 Kendall’s correlation coefficient = 0.17, p = 0.36

Another Interval Scale Example
• Salivary cotinine in children (Bland-Altman)
• n = 20 participants measured twicesubject trial 1 trial 2
1 0.1 0.12 0.2 0.13 0.2 0.3. . .. . .. . .
18 4.9 1.419 4.9 3.920 7.0 4.0

Simple Correlation of Two Trialstr
ial
1
trial 20 2 4 6
0
2
4
6
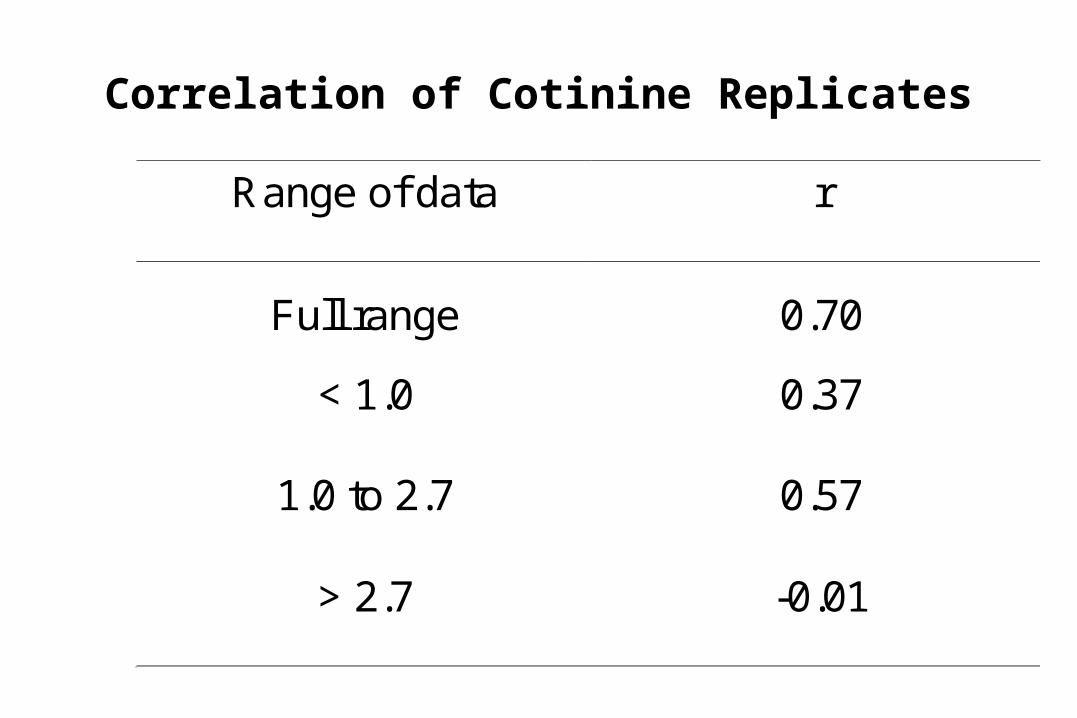
Correlation of Cotinine Replicates
Range of data r
Full range 0.70
< 1.0 0.37
1.0 to 2.7 0.57
> 2.7 -0.01
>2.0
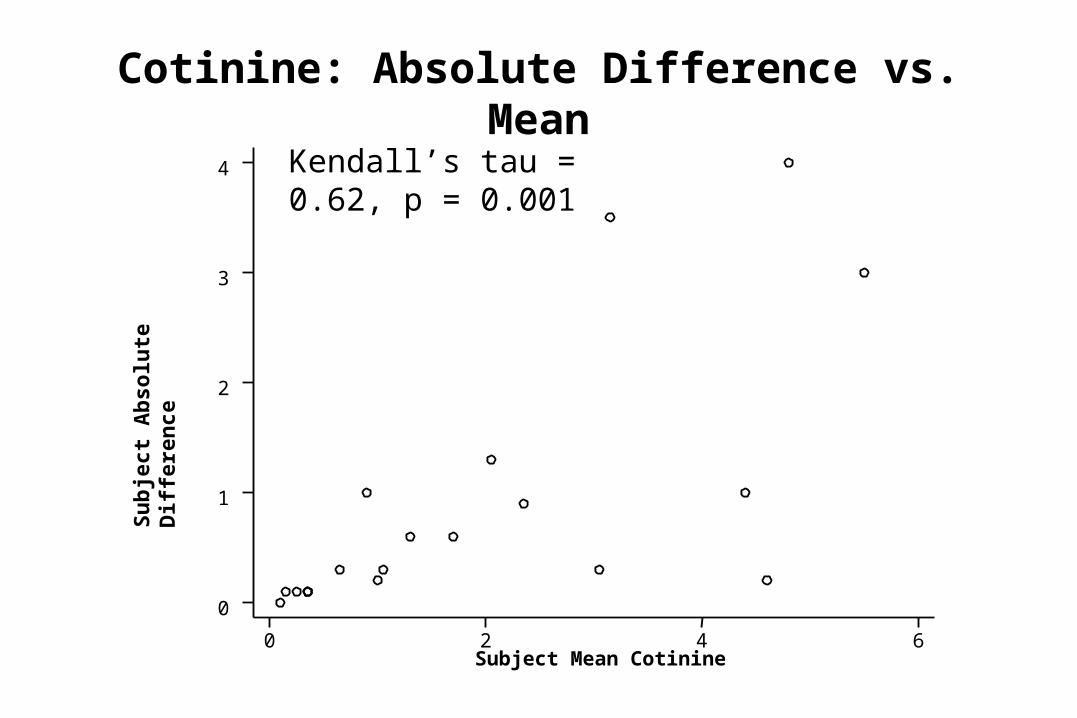
Cotinine: Absolute Difference vs. MeanS
ub
ject
Ab
solu
te D
iffe
ren
ce
Subject Mean Cotinine0 2 4 6
0
1
2
3
4 Kendall’s tau = 0.62, p = 0.001

Logarithmic Transformation
subject trial1 trial2 log trial 1 log trial 21 0.1 0.1 -1 -12 0.2 0.1 -0.69897 -13 0.2 0.3 -0.69897 -0.52288. . . . .. . . . .. . . . .
18 4.9 1.4 0.690196 0.14612819 4.9 3.9 0.690196 0.59106520 7 4 0.845098 0.60206
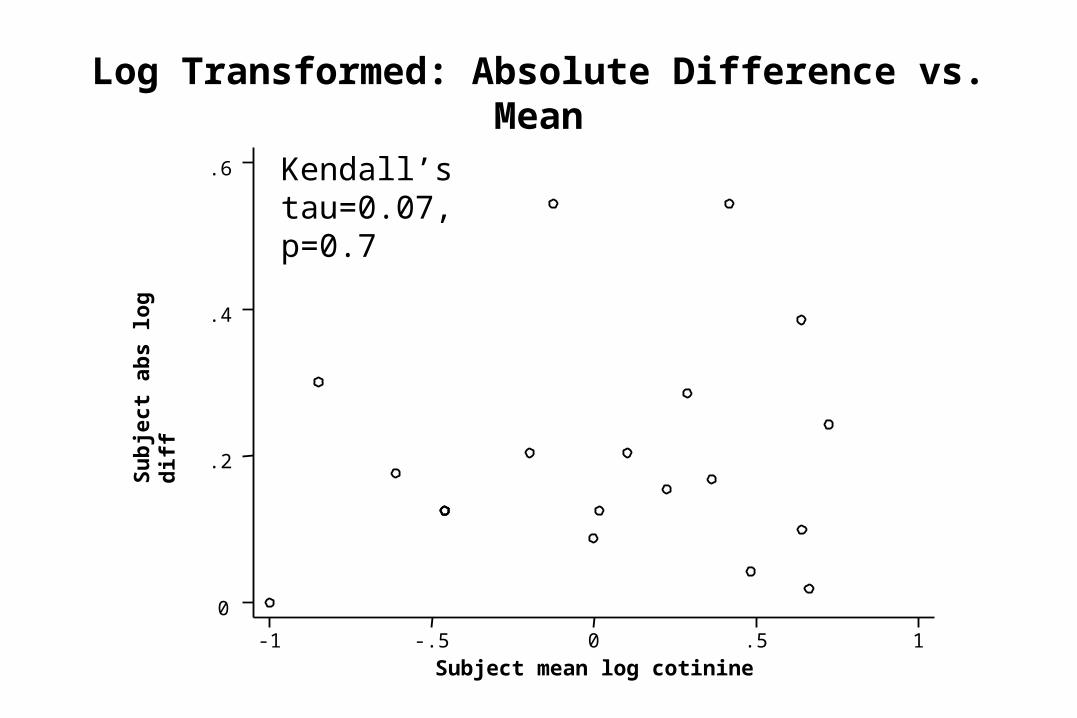
Log Transformed: Absolute Difference vs. MeanS
ub
ject
ab
s lo
g d
iff
Subject mean log cotinine-1 -.5 0 .5 1
0
.2
.4
.6 Kendall’s tau=0.07, p=0.7

sw for log-transformed cotinine data
• sw
• back-transforming to original units:
• antilog(sw) = antilog(0.175) = 1.49
175.00305.0
Analysis of Variance Source SS df MS F Prob > F------------------------------------------------------------------------Between groups 10.4912641 19 .552171793 18.10 0.0000 Within groups .610149715 20 .030507486------------------------------------------------------------------------ Total 11.1014138 39 .284651636
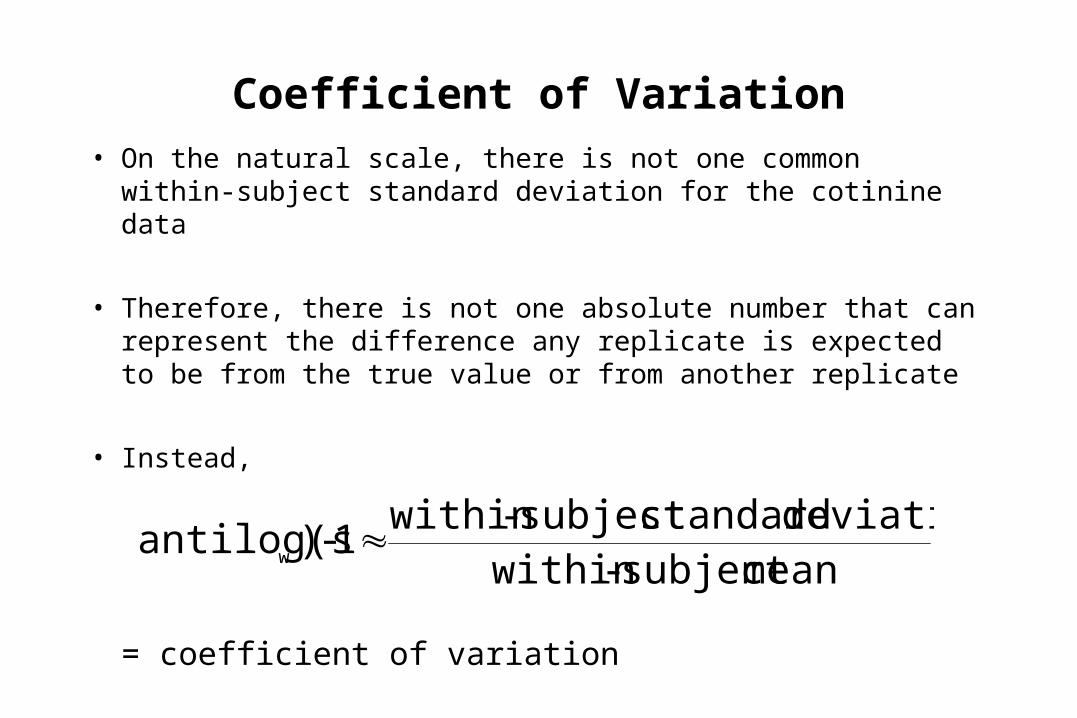
Coefficient of Variation
• On the natural scale, there is not one common within-subject standard deviation for the cotinine data
• Therefore, there is not one absolute number that can represent the difference any replicate is expected to be from the true value or from another replicate
• Instead,
= coefficient of variation
meansubject -withindeviation standardsubject -within
1- )antilog(sw

Cotinine Data
• Coefficient of variation = 1.49 -1 = 0.49
• At any level of cotinine, the within-subject standard deviation of repeated measures is 49% of the level

Coefficient of Variation for Peak Flow Data
• By definition, when the within-subject standard deviation is not proportional to the mean value, as in the Peak Flow data, then there is not a constant ratio between the within-subject standard deviation and the mean.
• Therefore, there is not one common coefficient of variation
• Estimating the coefficient of variation by taking the common within-subject standard deviation and dividing by the overall mean of the subjects is not very meaningful

Intraclass Correlation Coefficient, rI
• rI
• Averages correlation across all possible ordering of replicates• Varies from 0 (poor) to 1 (optimal)
• As 2E approaches 0 (no error), rI approaches 1
• Advantages: not dependent upon ordering of replicates; does not mistake linear association for agreement; allows >2 replicates
• Disadvantages: still dependent upon range of data in sample, still does not give a meaningful parameter on the actual scale of measurement in question
22
2
2
2
ET
T
O
T

Intraclass Correlation Coefficient, rI
• rI
• where:– m = no. of replicates per person
– SSb = sum of squares between subjects
– SSt = total sum of squares
• rI(peak flow) = 0.98
• rI(cotinine) = 0.69
t
tb
SSmSSmSS
)1(

Reproducibility of a Categorical Measurement: Chest X-Rays
• On 2 different occasions, a radiologist is given the same 100 CXR’s from a group of high-risk smokers to evaluate for masses
• How should reproducibility in reading be assessed?

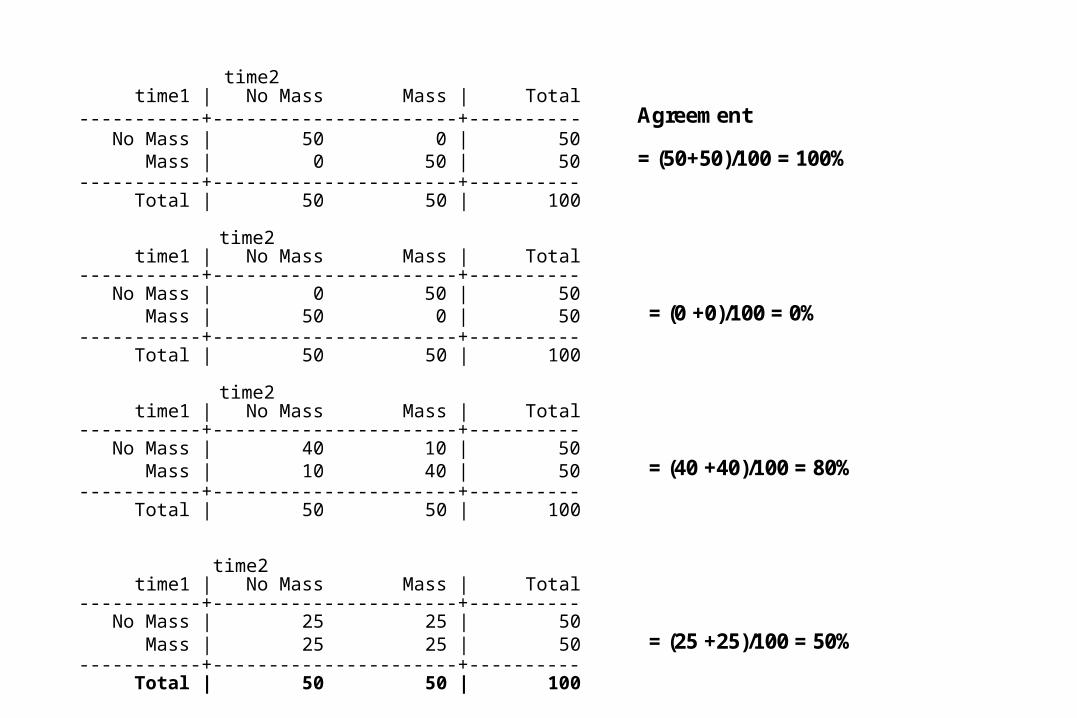
time2 time1 | No Mass Mass | Total-----------+----------------------+---------- Agreement No Mass | 50 0 | 50 Mass | 0 50 | 50 = (50+50)/100 = 100%-----------+----------------------+---------- Total | 50 50 | 100
time2 time1 | No Mass Mass | Total-----------+----------------------+---------- No Mass | 0 50 | 50 Mass | 50 0 | 50 = (0 +0)/100 = 0%-----------+----------------------+---------- Total | 50 50 | 100
time2 time1 | No Mass Mass | Total-----------+----------------------+---------- No Mass | 40 10 | 50 Mass | 10 40 | 50 = (40 +40)/100 = 80%-----------+----------------------+---------- Total | 50 50 | 100
time2 time1 | No Mass Mass | Total-----------+----------------------+---------- No Mass | 25 25 | 50 Mass | 25 25 | 50 = (25 +25)/100 = 50%-----------+----------------------+---------- Total | 50 50 | 100
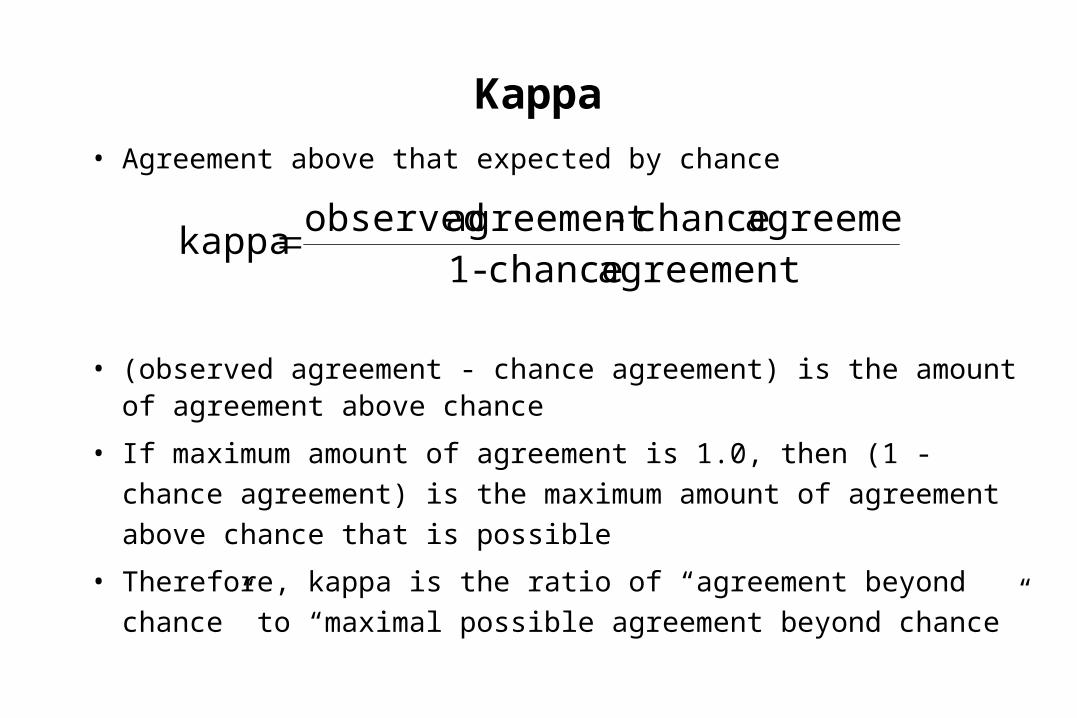
Kappa
• Agreement above that expected by chance
• (observed agreement - chance agreement) is the amount of agreement above chance
• If maximum amount of agreement is 1.0, then (1 - chance
agreement) is the maximum amount of agreement above
chance that is possible
• Therefore, kappa is the ratio of “agreement beyond chance” to
“maximal possible agreement beyond chance”
agreement chance -1agreement chance -agreement observed
kappa

Determining agreement expected by chanceObserved
time2 time1 | No Mass Mass | Total-----------+----------------------+---------- No Mass | 42 3 | 45 Observed Mass | 18 37 | 55 agreement = 79%-----------+----------------------+---------- Total | 60 40 | 100
Fix marginstime2
time1 | No Mass Mass | Total-----------+----------------------+---------- No Mass | | 45 Mass | | 55-----------+----------------------+---------- Total | 60 40 | 100
Fill in expected values for cells under assumption of independencetime2
time1 | No Mass Mass | Total-----------+----------------------+---------- Agreement No Mass | 27 18 | 45 expected by Mass | 33 22 | 55 chance = 49%-----------+----------------------+---------- Total | 60 40 | 100
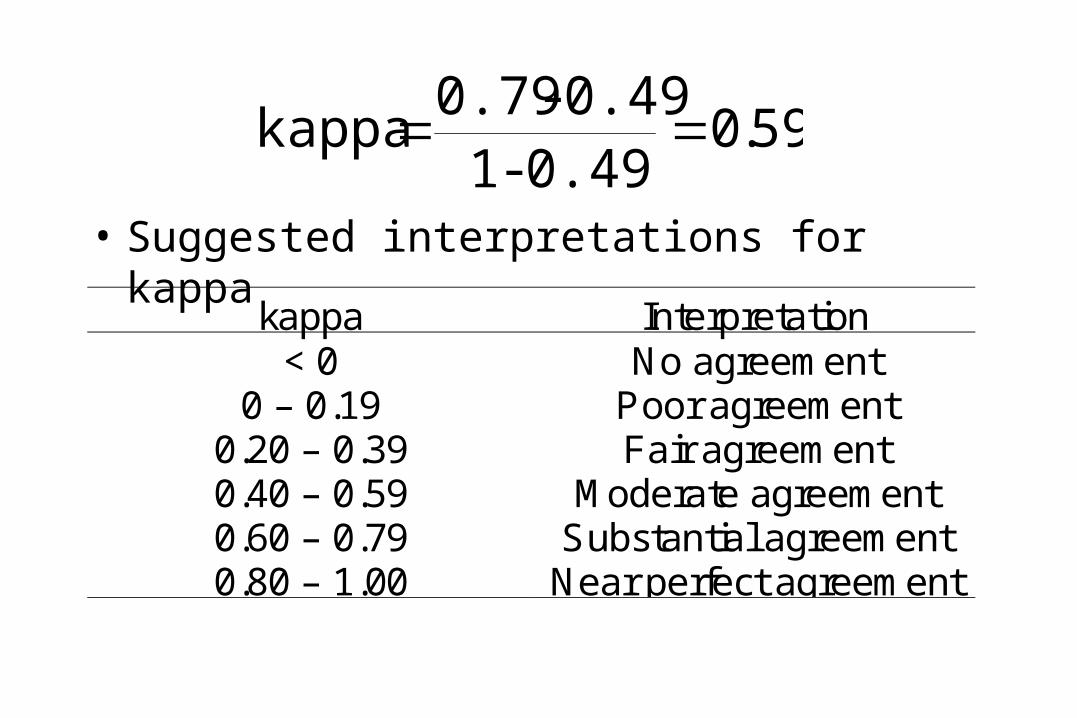
• Suggested interpretations for kappa
59.00.49 -1
0.49 - 0.79 kappa
kappa Interpretation< 0 No agreement
0 – 0.19 Poor agreement0.20 – 0.39 Fair agreement0.40 – 0.59 Moderate agreement0.60 – 0.79 Substantial agreement0.80 – 1.00 Near perfect agreement
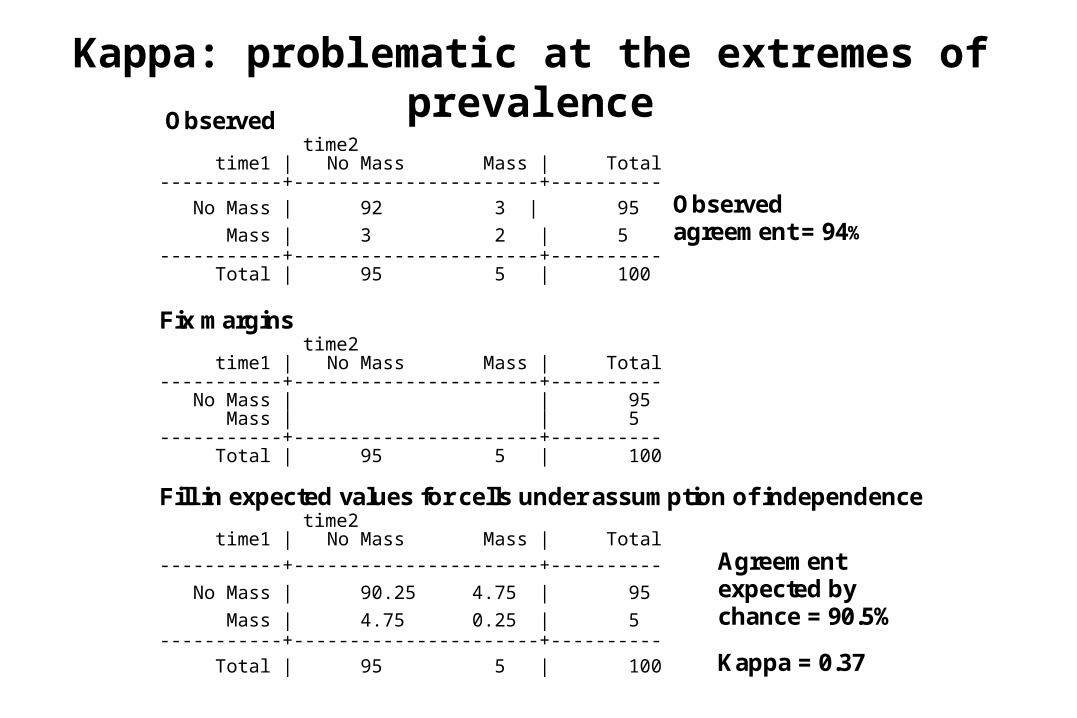
Kappa: problematic at the extremes of prevalenceObserved
time2 time1 | No Mass Mass | Total-----------+----------------------+---------- No Mass | 92 3 | 95 Observed Mass | 3 2 | 5 agreement = 94%-----------+----------------------+---------- Total | 95 5 | 100
Fix marginstime2
time1 | No Mass Mass | Total-----------+----------------------+---------- No Mass | | 95 Mass | | 5-----------+----------------------+---------- Total | 95 5 | 100
Fill in expected values for cells under assumption of independencetime2
time1 | No Mass Mass | Total-----------+----------------------+---------- Agreement No Mass | 90.25 4.75 | 95 expected by Mass | 4.75 0.25 | 5 chance = 90.5%-----------+----------------------+---------- Total | 95 5 | 100 Kappa = 0.37
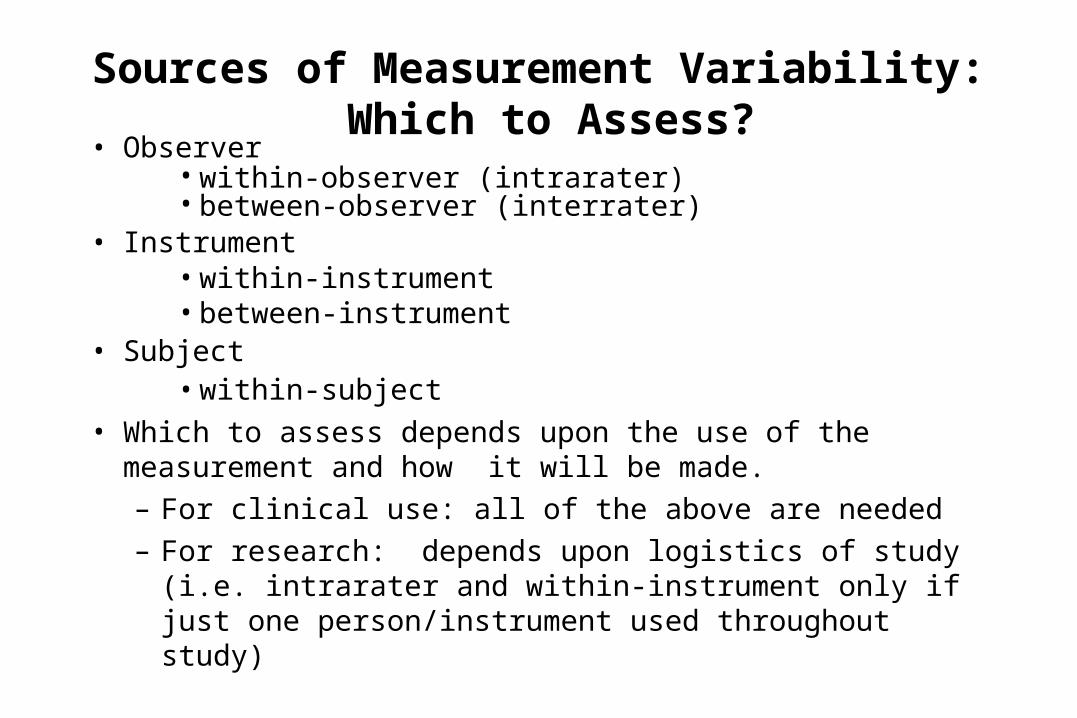
Sources of Measurement Variability: Which to Assess?
• Observer • within-observer (intrarater)• between-observer (interrater)
• Instrument • within-instrument• between-instrument
• Subject• within-subject
• Which to assess depends upon the use of the measurement and how it will be made. – For clinical use: all of the above are needed– For research: depends upon logistics of study (i.e.
intrarater and within-instrument only if just one person/instrument used throughout study)
Improving Reproducibility
• See Hulley text
• Make more than one measurement!– But know where the source of your variation
exists!

Assessing Validity - With Gold Standards
• A new and simpler device to measure peak flow becomes available (Bland-Altman)
subject gold std new1 494 5122 395 4303 516 520. . .. . .. . .
15 178 25916 423 35017 427 451

Plot of Difference vs. Gold StandardD
iffe
ren
ce
Gold standard
0 200 400 600 800 1000
-200
-100
0
100
200
Fre
qu
en
cy
diff-100 -50 0 50 100
0
2
4
6
8

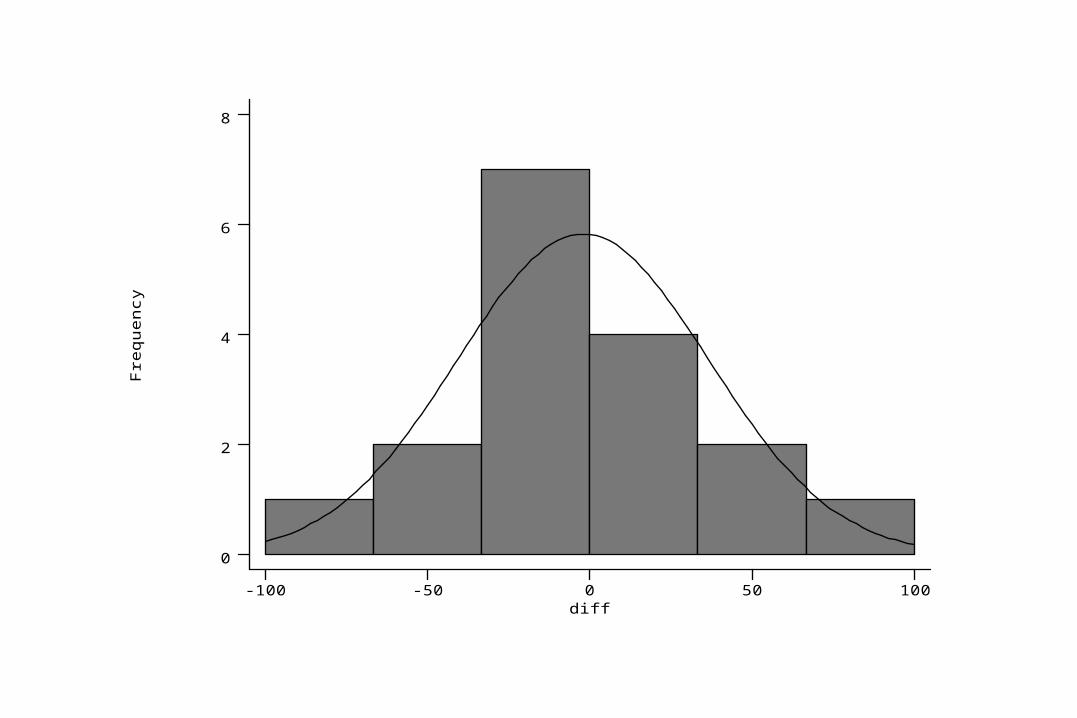
• The mean difference describes any systematic difference between the gold standard and the new device:
• The standard deviation of the differences:
• 95% of differences will lie between -2.3 + (1.96)(38.8), or from -78 to 74 l/min.
• These are the 95% limits of agreement
i
i nd
nd 3.2)]427451(..)494512[(
11
8.381
)( 2
n
dds i i
d

Assessing Validity of Categorical Measures
• Dichotomous
• More than 2 levels– Collapse or– Kappa
Gold StandardPresent Absent
New Present a bMeasurement Absent c d
Sensitivity = a/(a+c)Specificity = d/(b+d)

Assessing Validity - Without Gold Standards
• When gold standards are not present, measures can be assessed for validity in 3 ways:
– Content validity• Face• Sampling
– Construct validity– Empirical validity (aka criterion)
• Concurrent• Predictive

Conclusions• Measurement reproducibility plays a key role in determining validity
and statistical precision in all different study designs– When assessing reproducibility,
• avoid correlation coefficients • use within-subject standard deviation if constant • or coefficient of variation if within-subject sd is proportional to
the magnitude of measurement
• Acceptable reproducibility depends upon desired use
• For validity, plot difference vs mean and determine “limits of agreement” or determine sensitivity/specificity
– Be aware of how your measurements have been validated!
Related Documents