Epidemiologic evaluation of diagnostic tests Mr.sci. Sabina Šerić-Haračić TCDC/TCCT consultant – Aquatic epidemiology [email protected]

Epidemiologic evaluation of diagnostic tests Mr.sci. Sabina Šerić-Haračić TCDC/TCCT consultant – Aquatic epidemiology [email protected].
Jan 14, 2016
Welcome message from author
This document is posted to help you gain knowledge. Please leave a comment to let me know what you think about it! Share it to your friends and learn new things together.
Transcript

Epidemiologic evaluation of diagnostic tests
Mr.sci. Sabina Šerić-Haračić
TCDC/TCCT consultant – Aquatic [email protected]

Where to sample What to sample How to properly package/ship samples How many samples Where to ship Who is paying
Diagnostic consideration in field
Is sampled material appropriate for test used Have samples been shipped properly Condition of samples upon arrival Having and knowing to use recommended
test/s Where to send results Who is paying
Diagnostic consideration in lab

Having relevant and detailed sampling, shipping, testing procedures
Level of compliance to prescribed procedures Do we have all necessary information Is number of samples tested enough to safely
conclude presence/absence of disease Are test/s used precise enough to confirm/rule
out disease How much this costs
Diagnostic consideration in decision making

Diseased Healthy
Test positive
Test negative
Test sensitivity and specificityAre test/s used precise enough to confirm/rule out disease
100 100
105
95
95 10
5 90
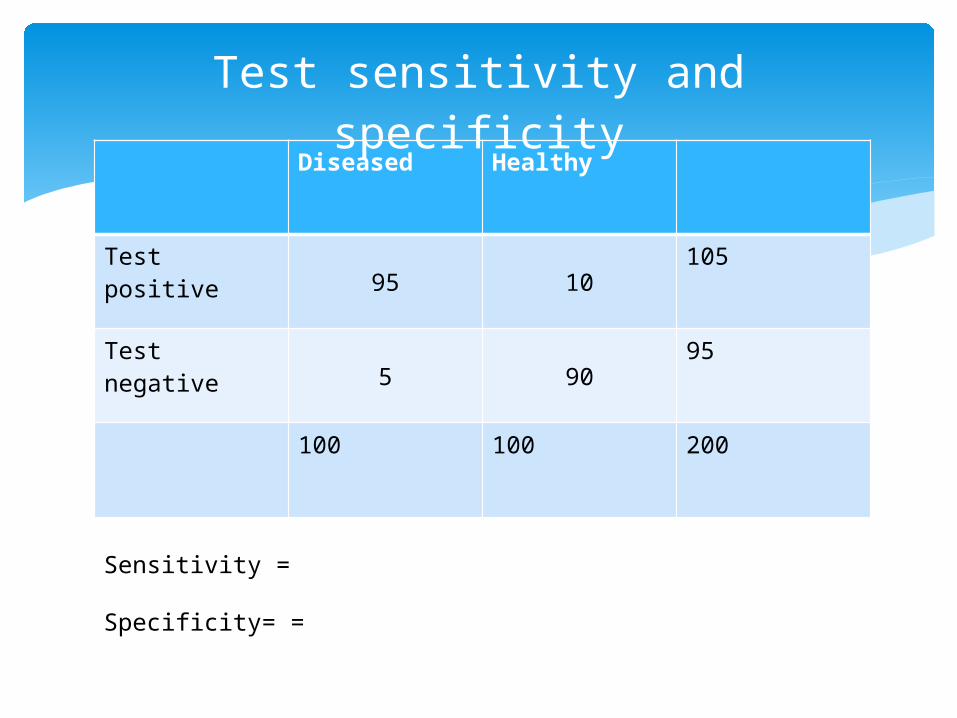
Diseased Healthy
Test positive95 10
105
Test negative5 90
95
100 100 200
Test sensitivity and specificity
Sensitivity =
Specificity= =
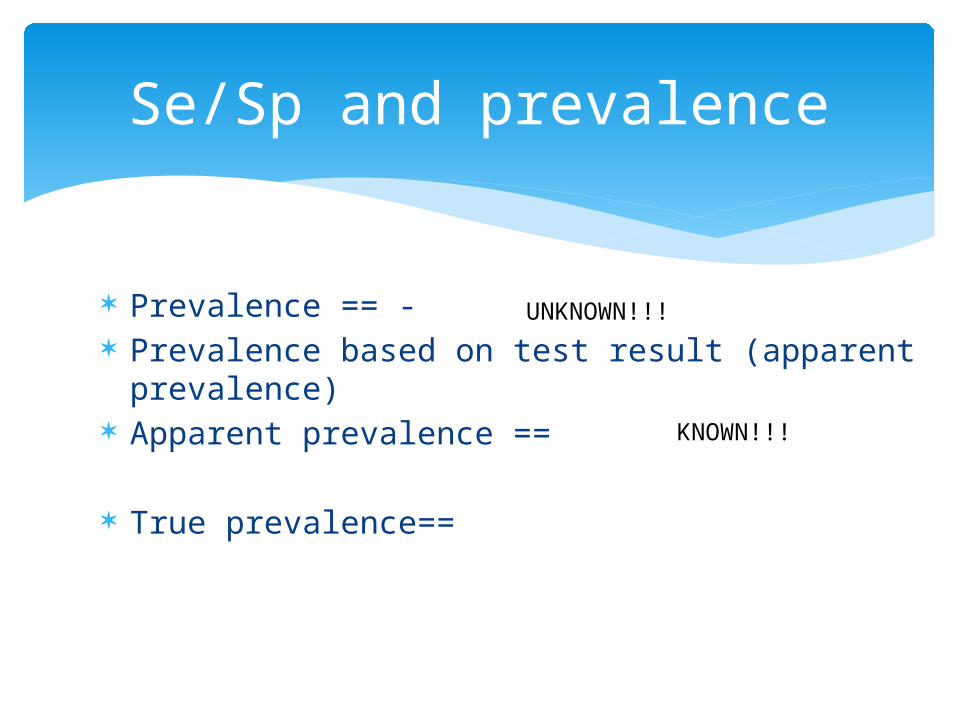
Prevalence == - Prevalence based on test result (apparent
prevalence) Apparent prevalence ==
True prevalence==
Se/Sp and prevalence
UNKNOWN!!!
KNOWN!!!

Positive tests results came for 92% of diseased animals 3% healthy animals
What is test Sensitivity and Specificity for Prevalence = 7,3% Prevalence =15%
Assignment
Diseased Healthy
Test positive
Test negative

Prevalence = 0 SP=90% Out of 100 healthy animals we will have 5
positive results (false positive) Repeat testing Use another test Use better test Demonstrating disease freedom requires
Sp=100%
SE/SP and disease freedom

Fair coin -50% cahnce of heads/tails Assume unfair coin – 90% of heads 10%of
tails Number of trows – 20 Chance to have all heads from 20 trows if
chance head in each trow is 90%
Test results on herd level(farm/pond/pooled samples...)

Result of a test from at least 2 animals or from pooling of 2 samples
Interpretation of the herd status is more important than interpretation of each individual's test results
Herd Sensitivity is the probability that an infected herd has a positive herd test result
Herd Specificity is the probability that an non-infected herd has a negative herd test result
Test results on herd level(farm/pond/pooled samples...)

Factors affecting Herd Sensitivity (HSe) and Herd Specificity (HSp)
Individual Se and Sp Within herd prevalence of disease Number of animals tested in the group Number of reactor animals per group that
will designate a positive or negative herd
Test results on herd level(farm/pond/pooled samples...)
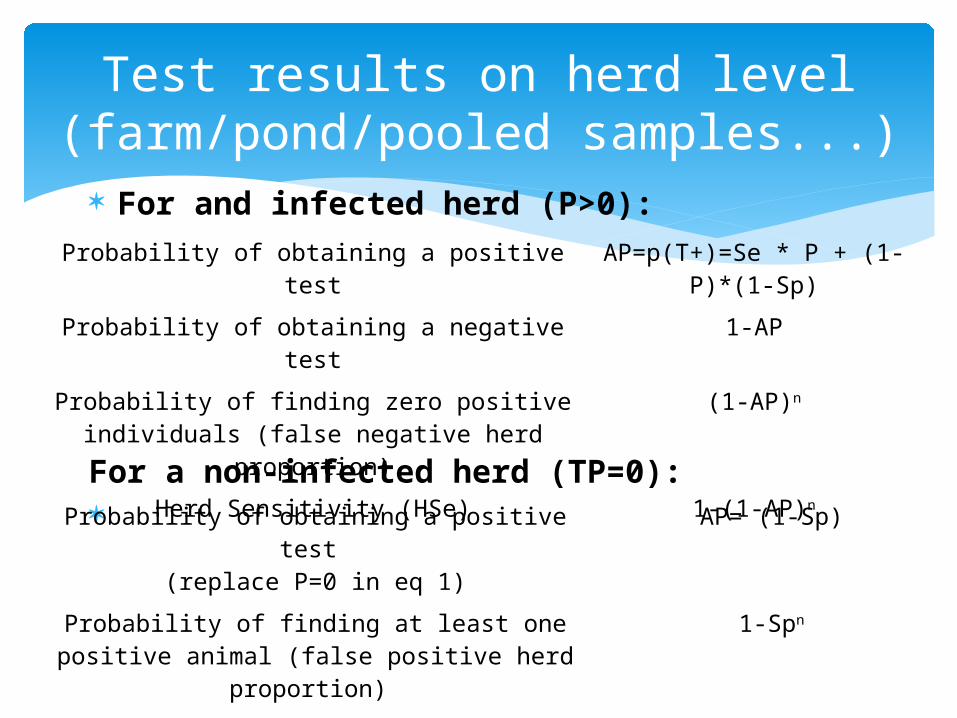
For and infected herd (P>0):
For a non-infected herd (TP=0):
Test results on herd level(farm/pond/pooled samples...)
Probability of obtaining a positive test AP=p(T+)=Se * P + (1-P)*(1-Sp)
Probability of obtaining a negative test 1-AP
Probability of finding zero positive individuals (false negative herd proportion)
(1-AP)n
Herd Sensitivity (HSe) 1-(1-AP)n
Probability of obtaining a positive test (replace P=0 in eq 1)
AP= (1-Sp)
Probability of finding at least one positive animal (false positive herd proportion)
1-Spn
Probability of obtaining a negative test 1-AP = p(T-) = 1-(1-Sp)=Sp
Herd Specificity (HSp) Spn

Number of animals on farm = 200 Within farm prevalence = 10% Sample size = 20 Se = 95% Sp=90% HSe=1- Within farm prevalence =0 HSp==0,122
Example/Assignment
1
100% 10
0 0,864
100

Number of animals on farm = 200 Within farm prevalence = 1% Sample size = 20 Se = 95% Sp=100% HSe=1- Within farm prevalence =0 HSp==1
Example/Assignment
100
100 0,61
5
100
Related Documents


