v Managing our climate change risk: An approach for environmental safe guarding of Global Fund HIV/ AIDS, Tuberculosis and Malaria programmes Dr Kristian Steele Dr Christoph Hamelmann Presentation at The Global Fund Geneva, 15 April 2015

Environmental safeguarding of global fund hiv, aids, tuberculosis and malaria programmes
Jul 16, 2015
Welcome message from author
This document is posted to help you gain knowledge. Please leave a comment to let me know what you think about it! Share it to your friends and learn new things together.
Transcript
v
Managing our climate change risk:
An approach for environmental safe
guarding of Global Fund HIV/
AIDS, Tuberculosis and Malaria
programmes
Dr Kristian Steele
Dr Christoph Hamelmann
Presentation at The Global Fund
Geneva, 15 April 2015

v
Content
Slide deck includes content on
the following aspects
• Why address carbon?
• UNDP
• NHS
• WPP
• Highways Agency
• Anglian Water
• Close
v
Why address carbon?
Addressing the challenge
climate change through reducing
emissions is largely driven by
risk:
• Commercial
• Responsibility
• Reputation
• Compliance
• Innovation
• Opportunity
• Cost saving
• Efficiency
• Investment
• Reporting
v
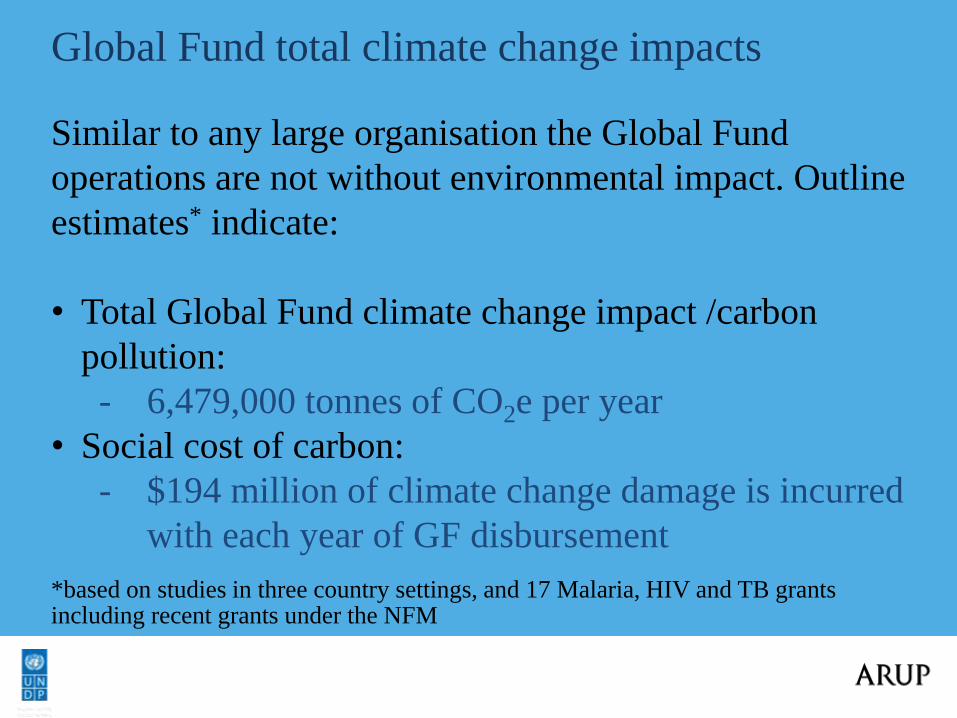
Global Fund total climate change impacts
Similar to any large organisation the Global Fund
operations are not without environmental impact. Outline
estimates* indicate:
• Total Global Fund climate change impact /carbon
pollution:
- 6,479,000 tonnes of CO2e per year
• Social cost of carbon:
- $194 million of climate change damage is incurred
with each year of GF disbursement
*based on studies in three country settings, and 17 Malaria, HIV and TB grants including recent grants under the NFM
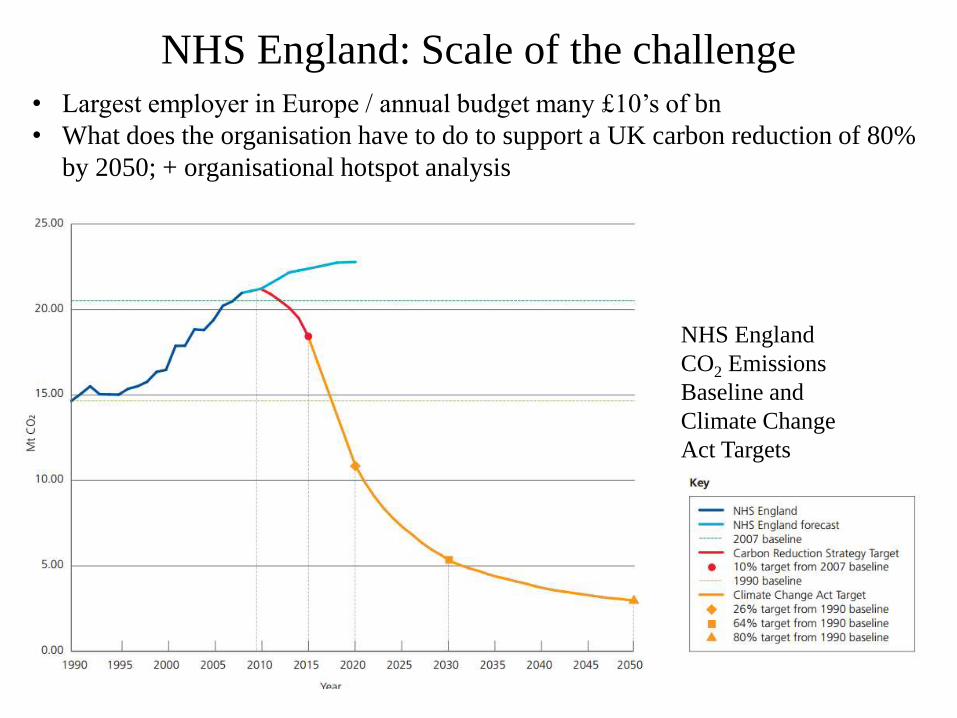
NHS England: Scale of the challenge
NHS England
CO2 Emissions
Baseline and
Climate Change
Act Targets
• Largest employer in Europe / annual budget many £10’s of bn
• What does the organisation have to do to support a UK carbon reduction of 80%
by 2050; + organisational hotspot analysis

Priority areas for NHS carbon reduction
• Less than a quarter of the ‘carbon
budget’ is running the estate
• Procurement is 50%
• Pharmaceuticals the largest
contributor

Strategy for the future
0.00
5.00
10.00
15.00
20.00
25.00
1990 1995 2000 2005 2010 2015 2020
2020
• Project looked at potential strategies to meet an interim 26%
reduction target in 2020
• Informed a number of subsequent strategies, i.e. International
pharmaceutical and medical device guidelines for carbon
footprinting
NH
S E
ng
lan
d a
nn
ual
em
issi
on
s M
tCO
2e
Year

9
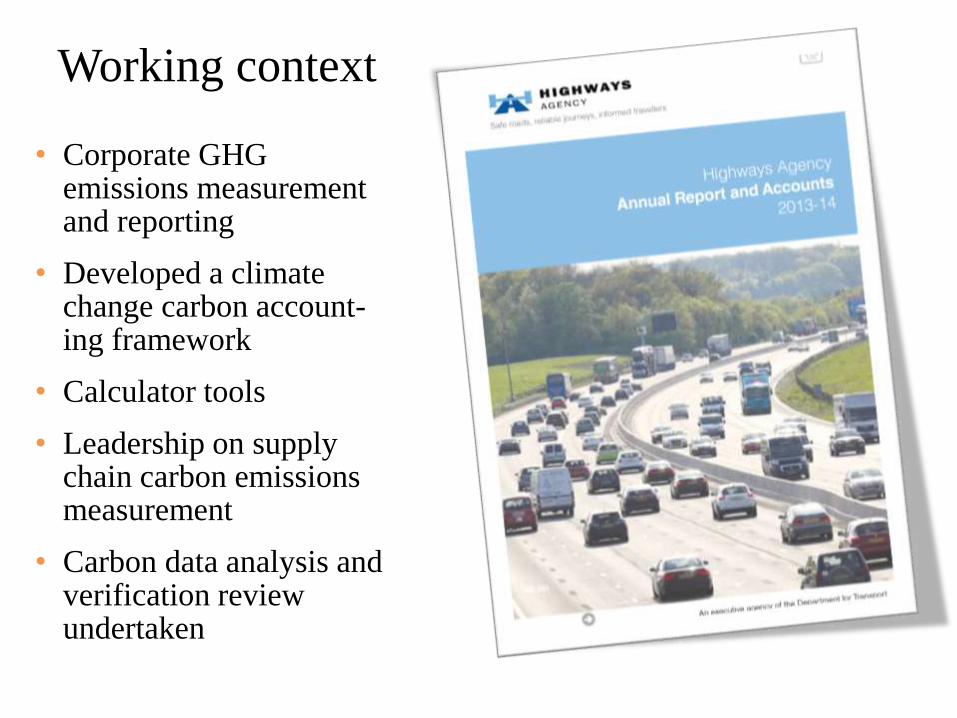
Working context
• Corporate GHG emissions measurement and reporting
• Developed a climate change carbon account-ing framework
• Calculator tools
• Leadership on supply chain carbon emissions measurement
• Carbon data analysis and verification review undertaken

10
Outcomes
• Recommendations report
• Strategic carbon Routemap modelling tool

11
Communication tool

12
• Carbon is proxy for use of material and energy
• Reducing carbon has a bigger effect on cost than trying to reduce cost directly!
Carbon reduction is good business sense
Graphic courtesy of Anglian Water Capital Programme

• Preliminary investigations
completed
• First generation carbon footprint
tool for GF-NFM in place
• More details at the Brown Bag talk
v
Thank you for your attention
Related Documents