Environment for Development Discussion Paper Series March 2015 EfD DP 15-04 Household Energy Conservation in Kenya Estimating the Drivers and Possible Savings John Mutua and Peter Kimuyu

Welcome message from author
This document is posted to help you gain knowledge. Please leave a comment to let me know what you think about it! Share it to your friends and learn new things together.
Transcript

Environment for Development
Discussion Paper Series March 2015 EfD DP 15-04
Household Energy Conservation in Kenya
Estimating the Drivers and Possible Savings
John Mut ua and Pet er K imuyu

Environment for Development Centers
The Environment for Development (EfD) initiative is an environmental economics program focused on international
research collaboration, policy advice, and academic training. Financial support is provided by the Swedish
International Development Cooperation Agency (Sida). Learn more at www.efdinitiative.org or contact
Central America Research Program in Economics and Environment for Development in Central America Tropical Agricultural Research and Higher Education Center (CATIE) Email: [email protected]
Chile Research Nucleus on Environmental and Natural Resource Economics (NENRE) Universidad de Concepción Email: [email protected]
China Environmental Economics Program in China (EEPC) Peking University Email: [email protected]
Ethiopia Environmental Economics Policy Forum for Ethiopia (EEPFE) Ethiopian Development Research Institute (EDRI/AAU) Email: [email protected]
Kenya Environment for Development Kenya University of Nairobi with Kenya Institute for Public Policy Research and Analysis (KIPPRA) Email: [email protected]
South Africa Environmental Economics Policy Research Unit (EPRU) University of Cape Town Email: [email protected]
Sweden Environmental Economics Unit University of Gothenburg
Email: [email protected]
Tanzania Environment for Development Tanzania University of Dar es Salaam Email: [email protected]
USA (Washington, DC) Resources for the Future (RFF) Email: [email protected]
Environment for Development Mutua and Kimuyu
Discussion papers are research materials circulated by their authors for purposes of information and discussion. They have
not necessarily undergone formal peer review.
Household Energy Conservation in Kenya: Estimating the Drivers and
Possible Savings
John Mutua and Peter Kimuyu
Abstract
This paper uses the National Energy Survey Data for Kenya 2009 to investigate the main determinants
of household energy conservation and savings, exploiting discrete choice and Tobit models. We estimate
conservation models for five household fuels—fuel wood, charcoal, kerosene, LPG, and electricity—and
generate information to predict not only the odds for household energy conservation but also the levels of
possible savings. Our findings reveal that demographic variables, such as the household head’s gender and
occupational and educational attainment, as well as household location and size, are key determinants of not
only the propensity to conserve energy but also levels of actual energy savings. Other factors that shape these
decisions and outcomes include total hours of energy utilization, perceptions about cleanliness and affordability
of the energy source, and awareness of conservation measures and regulations. For successful energy
conservation, policy will need to take these factors into account.
Key Words: energy conservation, savings, discrete choice
Environment for Development Mutua and Kimuyu
Contents
1. Introduction ......................................................................................................................... 1
2. Literature Review ............................................................................................................... 2
3. Methodology of the Study .................................................................................................. 5
3.1 Data ............................................................................................................................... 5
3.2 Methodology of Study .................................................................................................. 5
4. Empirical Analysis ............................................................................................................. 8
4.1 Descriptive Statistics ..................................................................................................... 8
4.2 Estimated Results ........................................................................................................ 10
5. Conclusion and Policy Suggestions.................................................................................. 24
References .............................................................................................................................. 25

Environment for Development Mutua and Kimuyu
1
Household Energy Conservation in Kenya: Estimating the Drivers
and Possible Savings
John Mutua and Peter Kimuyu
1. Introduction
Demand for energy in Kenya has been increasing at a rate faster than available supply,
leading to a shortage of primary sources of energy as well as depletion of natural resource
capital. This outcome could be somewhat ameliorated if there were adequate information on how
to conserve energy and use it efficiently. Although many households have only limited energy
switching and use options, they do not conserve available energy or even use it in the most
efficient and sustainable way. The main research questions addressed in this paper are: What are
the key determinants of energy conservation and energy savings in Kenya and what additional
interventions can be beneficially implemented in order to conserve energy and related resources?
The government of Kenya has embarked on energy efficiency and conservation efforts to
educate households on the importance of conserving energy as part of a broader goal of demand
side management. Sessional Paper No. 4 of 2004 aims at promoting energy efficiency (EE) to
reduce the foreign exchange expenditure on oil imports due to high demand for electricity, some
of which is generated from petroleum-based products, and to defer additional investment in
power generation. In order to promote energy efficient technologies and measures, the
government proposes to provide technical and financial support to the private sector. In addition,
a program for subsidizing efficient electric bulbs to reduce consumption at the household level
was begun in 2007. This programme led to significant reduction in electricity consumption.
Other non-monetary measures that have been adopted include disseminating energy efficiency
and conservation information, developing standards and codes of practice for cost-effective
energy use, and establishing a “centre of excellence” for energy efficiency at the national level.
This centre is expected to guide and promote development and implementation of energy
efficiency and conservation technologies and methods.
The government has also put in place measures that aim to conserve and efficiently use
all forms of energy, including modern fuels such as electricity and liquefied petroleum gas
John Mutua, Energy Regulatory Commission (corresponding author: [email protected], ERC, Postal
Code 254, Nairobi, Kenya) and Peter Kimuyu, EfD Kenya and University of Nairobi.

Environment for Development Mutua and Kimuyu
2
(LPG), and dirty fuels such as kerosene, charcoal and fuel wood. The measures have been
expanded to include fuels in the transport sector, where fuel economy initiatives have been
encouraged. Through adoption of energy efficient cooking ‘jikos’, the energy consumed through
use of charcoal and fuel wood has been reduced significantly, thus saving households money and
trips to fetch these fuels and reducing deforestation. Efficient ‘jikos’ use less charcoal and fuel
wood. Improved efficiency in kerosene consumption saves money and protects households from
respiratory diseases. This paper focuses on household cooking, heating and lighting fuels such
electricity, LPG, kerosene, charcoal and fuel wood and is driven by a desire to make policy
proposals in support of existing energy conservation efforts.
Energy efficiency and conservation have long been critical elements of the energy policy
dialogue but took on renewed importance as concerns about global climate change and energy
security intensified (Gillingham et al. 2009). The ensuing debate is important for developing
countries such as Kenya that have ratified the Kyoto protocol and are adopting energy
management and conservation measures. Owing to this policy interest in energy conservation, a
significant amount of literature has developed over the past 30 years that provides a framework
for addressing the issue (Gillingham at al. 2009). Following others, we define energy
conservation as ‘the absolute reduction in energy demand compared to a certain baseline,
measured in energy units’ (Linares and Labandeira 2010: 573).
The primary objective of the paper is to investigate the main determinants of household
energy conservation/savings behaviour and the implications for energy consumption and
environmental quality in Kenya. The specific objectives are to explore key drivers of energy
conservation and savings among Kenyan households and to make policy proposals on how best
to address energy conservation in the country. The paper also contributes to the state of
knowledge on poverty reduction policies.
The rest of the paper is organized as follows: in section two, we review the theoretical
and empirical literature relevant to energy conservation. A summary of the data and
methodology used in the analysis is presented in section three. The empirical findings are the
subject matter of section four while the summary and policy suggestions are presented in the
fifth and last section.
2. Literature Review
In the literature, there is an exploration of the relationships between household energy use
and householders’ intention to reduce energy use on the one hand, and psychological and socio-
Environment for Development Mutua and Kimuyu
3
demographic variables on the other (Abrahamsen and Steg 2011). More specifically, the
literature examines whether household energy use and intentions to reduce are important. Such
examination is informed by the theory of planned behaviour and includes variables from the
value-belief-norm theory, alongside socio-demographic considerations. Household energy use is
strongly related to socio-demographic variables (income, household size, and household head’s
age) (Stern et al. 1999).
Regarding energy conservation modeling, some studies have used discrete choice models
while others (e.g., Dubin and McFadden 1984) use micro-simulations for electricity demand by
residences and jointly model the demand for appliance and that for energy. If, as suggested in
the theory, the demand for durables and their use are joint consumer decisions, model
specifications that ignore this fact are likely to lead to biased and inconsistent estimates of price
and income elasticities.
Others have developed simple empirical models to investigate the main determinants of
household energy conservation patterns (Sardianou 2010; 2007). Fischer (2008) demonstrates
that improved feedback on electricity consumption may provide a tool for customers to better
control their consumption and ultimately save energy. Such work reveals that feedback
mechanisms are most successful in electricity consumption. Fischer (2008) attempts to illustrate
how and why feedback works, using psychological models. Relevant features of feedback that
determine its effectiveness include frequency, duration, content, breakdown, medium and
manner of presentation, comparisons, and combination with other instruments. Other studies
examine the reasons as to why people conserve energy (Malone et al. 2002), and propose that, in
order to motivate people to conserve energy, it is crucial to understand what drives people’s
energy use behaviour and how it can be influenced. This line of literature supports some aspects
of social-psychological models, emphasizing both altruistic and egoistic motives for behavioural
change. Such findings offer insights for other situations where residents are not billed for
individual energy use, including government-subsidized facilities, master-metered apartments,
and university dormitories.
Although it seems obvious that energy efficiency and conservation are important in
reducing greenhouse gas emissions and achieving other energy policy goals, the necessary
market behaviour and policy responses have generated debates (Gillingham et al. 2009). While
theory and empirical evidence suggest the existence of a potential for welfare-enhancing energy
efficiency policies, many questions remain open, particularly those relating to the extent of the
notable market and behavioural failures.

Environment for Development Mutua and Kimuyu
4
Others (Iwaro and Mwasha 2010) observe that the rapid growth of energy use worldwide
has raised concerns over problems of energy supply and exhaustion of energy resources. Most of
the developed countries are implementing energy consumption regulations such as energy
standards, codes and so on in order to reduce energy consumption. The implementation and
enforcement of energy regulations in developing countries is either poorly documented or not
documented at all. Such countries also lack consistent data to guide energy regulation.
Nevertheless, there is literature (Iwaro and Mwasha 2010) that investigates energy regulation in
developing countries and its implication for energy conservation and efficiency. Purchasing
more efficient equipment, according to this literature, involves higher costs, which low-income
consumers cannot afford. Inadequate funding is also identified as one of the most important
barriers to effective implementation of energy regulations in developing countries. There are also
market barriers.
Residential efficient energy and renewable energy (EERE) products play an important
role in energy conservation and reduction of carbon emissions (Zhao et al. 2012). The
effectiveness of financial incentives in encouraging consumers to adopt EERE products is not
very well understood. Efforts to explore such incentives show, as argued earlier, that high
investment cost is a major deterrent to the purchase of these products (Zhao et al. 2012).
Using descriptive statistics and simple projections, Mutua et al. (2010) show that there is
huge potential for energy conservation and its benefits in Kenya. This is because energy
conservation can lead to saving energy at the household level and in other sectors. It is, however,
necessary to dig deeper into the drivers of energy conservation. Others have evaluated the
effectiveness of interventions aiming at encouraging households to reduce energy consumption
(Abrahams et al. 2005) and found that information tends to result in higher knowledge levels, but
not necessarily in behavioural changes or energy savings. It is rewards that encouraged energy
conservation, but with rather short-lived effects. Feedback was also found to have its merits,
particularly when given frequently. Methodological problems, however, undermine drawing
broad conclusions from these studies.
This literature review shows that most of the research on energy conservation has so far
focused on the developed world with little research effort in the developing world. Yet the
developing world has the greatest potential for rapid social and economic transformation. It is
the intention of this paper to make judicious use of new methodologies and increase the stock of
knowledge on energy conservation in the developing world.

Environment for Development Mutua and Kimuyu
5
3. Methodology of the Study
This section of the paper provides a summary of the data used in the analysis as well as
the methodology of the study. The paper uses discrete choice energy conservation models and a
Tobit approach to estimate energy savings.
3.1 Data
We use household data from the National Energy Survey of 2009. The survey involved
3,665 households and was implemented between May and June 2009 in the then eight provinces
of Kenya and administered at the district administrative levels. The provinces have since been
abolished and the former districts converted to counties. The sampling framework was based on
the National Sample Survey and Evaluation Program (NASSEP IV). The Kenya National Bureau
of Statistics (KNBS) established this programme for conducting surveys after the 1999
Population Census. The sampling framework has 1,800 clusters, each on average with 100
households, with the aim of conducting socio-economic surveys. 1260 of the 1,800 clusters are
rural and the rest urban. The National Energy Survey undertook a sample of 20% of the clusters,
resulting in 252 rural and 108 urban clusters. The survey had a target of 2520 rural and 1,080
urban households. The implementation was successful. Furthermore, some non-structured
interviews were carried out with key informants in the energy sector to pick out strategies and
policy initiatives that have taken place since the data collection.
3.2 Methodology of Study
We use two sets of models. The first set comprises discrete choice energy conservation
models, through which we predict the odds that a household would conserve a specific domestic
energy source (Pindyck et al. 1991). The second model exploits Tobit methodology to explore
the determinants of actual household energy savings. In the first set, energy conservation, which
is the dependent variable, is captured as a dichotomous variable. The question on conservation
was whether a household had adopted energy conservation measures, generating Yes or No
responses. In the second model, the amount of energy saved in monetary terms is the dependent
variable. The explanatory variables are demographic factors such as household location,
household size, gender, education and economic factors such as total expenditure and pricing as
well as policy variables such as awareness of energy conservation regulations.

Environment for Development Mutua and Kimuyu
6
3.2.1 Empirical Models
The Odds for Energy Conservation
The empirical model for predicting energy conservation is as indicated in equation 1 below:
𝐸𝑛𝑒𝑟𝑔𝑦𝑐𝑜𝑛𝑠𝑒𝑟𝑣𝑖 =
𝛼0 + 𝛼1Central + 𝛼2𝐸𝑎𝑠𝑡𝑒𝑟𝑛 + 𝛼3Coast + 𝛼4Riftvalley + 𝛼5North_Eastern +
𝛼6Nyanza + 𝛼7Westernn + 𝛼8AGE +𝛼9SEX+𝛼10𝐸𝑑𝑢𝑐 + 𝛼11𝑃𝑟𝑖𝑐𝑒 +
𝛼12𝑃𝑟𝑖𝑐𝑒𝑜𝑓𝑠𝑢𝑏𝑠𝑡𝑖𝑡𝑢𝑡𝑒𝑓𝑢𝑒𝑙 + 𝛼13𝐻𝑠𝑒𝑠𝑖𝑧𝑒 + 𝛼14𝐶𝑙𝑒𝑎𝑛𝑙𝑖𝑛𝑒𝑠𝑠 + 𝛼15𝐴𝑓𝑓𝑜𝑟𝑑𝑎𝑏𝑙𝑒 +
𝛼16𝐶𝑙𝑒𝑎𝑛 + 𝛼17𝑅𝑒𝑔𝑢𝑙𝑎𝑡𝑜𝑟𝑦𝐼𝑚𝑝𝑎𝑐𝑡 + 𝜀𝑖…………..(1)
The dependent variable for the probit model, 𝐸𝑛𝑒𝑟𝑔𝑦𝐶𝑜𝑛𝑠𝑒𝑟𝑣𝑒, represents households’
behaviour toward specific energy-conserving actions. In order to construct the dependent
variable, we follow Stern and Gardner (1981), who distinguished between efficient energy
conservation and conservation curtailment actions.
In this paper, we focus on the decision to conserve energy. The variable
𝐸𝑛𝑒𝑟𝑔𝑦𝐶𝑜𝑛𝑠𝑒𝑟𝑣𝑒 can be estimated in terms of energy savings in monetary terms or as a
discrete number where 1 is for households that have adopted energy conservation measures and 0
is for households that do not conserve. In the first instance, we use the dependent variable as a
discrete variable in order to determine the odds of adopting energy conservation measures. The
explanatory variables are socio-economic attributes of the head of the household such as age
(AG), sex (SEX) and education level for the household head (Educ); household size in terms of
number of persons in the household (𝐻𝑠𝑒𝑠𝑖𝑧𝑒); and information and awareness on energy
conservation (awareness).𝜀𝑖 𝑖𝑠 an error component subject to the usual stochastic assumptions.
We also control for the impact of location by introducing location variables in the model.
Energy Savings Model
The energy saving model is estimated using the Tobin approach, which is closely related
to the probit approach. The model assumes that there is a latent (i.e., unobservable) variable 𝒚𝒊∗
that linearly depends on 𝑥𝑖 via a parameter (vector) 𝛽 ,which in turn determines the relationship
between the independent variable (or vector), 𝑥𝑖 , and the latent variable 𝒚𝒊∗ (just as in a linear
model). In addition, we assume a normally distributed error term, 𝜀𝑖, to capture random influences
on this relationship. The observable variable 𝒚𝒊∗ is defined to be equal to the latent variable
whenever the latent variable is above zero and zero otherwise.
Environment for Development Mutua and Kimuyu
7
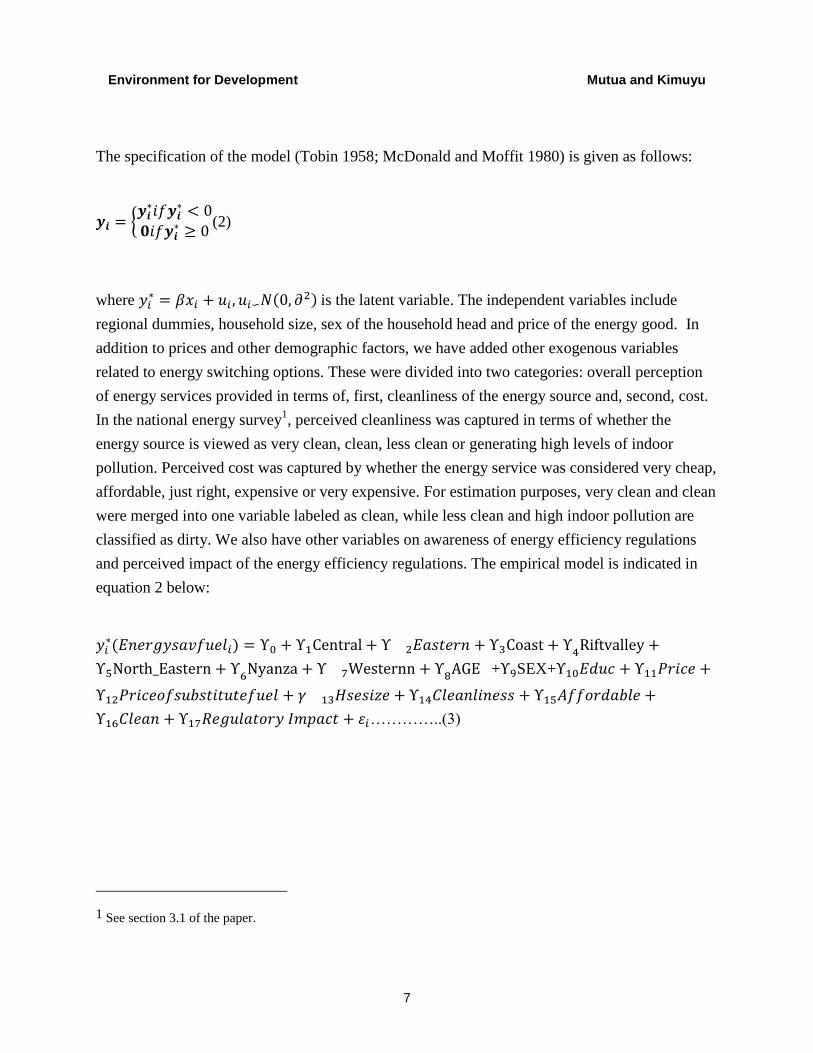
The specification of the model (Tobin 1958; McDonald and Moffit 1980) is given as follows:
𝒚𝒊 = {𝒚𝒊
∗𝑖𝑓𝒚𝒊∗ < 0
𝟎𝑖𝑓𝒚𝒊∗ ≥ 0
(2)
where 𝑦𝑖∗ = 𝛽𝑥𝑖 + 𝑢𝑖 , 𝑢𝑖∽𝑁(0, 𝜕2) is the latent variable. The independent variables include
regional dummies, household size, sex of the household head and price of the energy good. In
addition to prices and other demographic factors, we have added other exogenous variables
related to energy switching options. These were divided into two categories: overall perception
of energy services provided in terms of, first, cleanliness of the energy source and, second, cost.
In the national energy survey1, perceived cleanliness was captured in terms of whether the
energy source is viewed as very clean, clean, less clean or generating high levels of indoor
pollution. Perceived cost was captured by whether the energy service was considered very cheap,
affordable, just right, expensive or very expensive. For estimation purposes, very clean and clean
were merged into one variable labeled as clean, while less clean and high indoor pollution are
classified as dirty. We also have other variables on awareness of energy efficiency regulations
and perceived impact of the energy efficiency regulations. The empirical model is indicated in
equation 2 below:
𝑦𝑖∗(𝐸𝑛𝑒𝑟𝑔𝑦𝑠𝑎𝑣𝑓𝑢𝑒𝑙𝑖) = ϒ0 + ϒ1Central + ϒ 2𝐸𝑎𝑠𝑡𝑒𝑟𝑛 + ϒ3Coast + ϒ
4Riftvalley +
ϒ5North_Eastern + ϒ6
Nyanza + ϒ 7Westernn + ϒ8
AGE +ϒ9SEX+ϒ10𝐸𝑑𝑢𝑐 + ϒ11𝑃𝑟𝑖𝑐𝑒 +
ϒ12𝑃𝑟𝑖𝑐𝑒𝑜𝑓𝑠𝑢𝑏𝑠𝑡𝑖𝑡𝑢𝑡𝑒𝑓𝑢𝑒𝑙 + 𝛾 13𝐻𝑠𝑒𝑠𝑖𝑧𝑒 + ϒ14𝐶𝑙𝑒𝑎𝑛𝑙𝑖𝑛𝑒𝑠𝑠 + ϒ15𝐴𝑓𝑓𝑜𝑟𝑑𝑎𝑏𝑙𝑒 +
ϒ16𝐶𝑙𝑒𝑎𝑛 + ϒ17𝑅𝑒𝑔𝑢𝑙𝑎𝑡𝑜𝑟𝑦 𝐼𝑚𝑝𝑎𝑐𝑡 + 𝜀𝑖…………..(3)
1 See section 3.1 of the paper.

Environment for Development Mutua and Kimuyu
8
4. Empirical Analysis
In this section of the paper, we present descriptive statistics of the variables that were
used in the respective fuel conservation and saving models. We also present results for the probit
models and their marginal effects, Tobit estimations to establish determinants of conservation
achievements through energy savings, and results of predictors of the relative odds of choosing
different energy conservation methods.
4.1 Descriptive Statistics
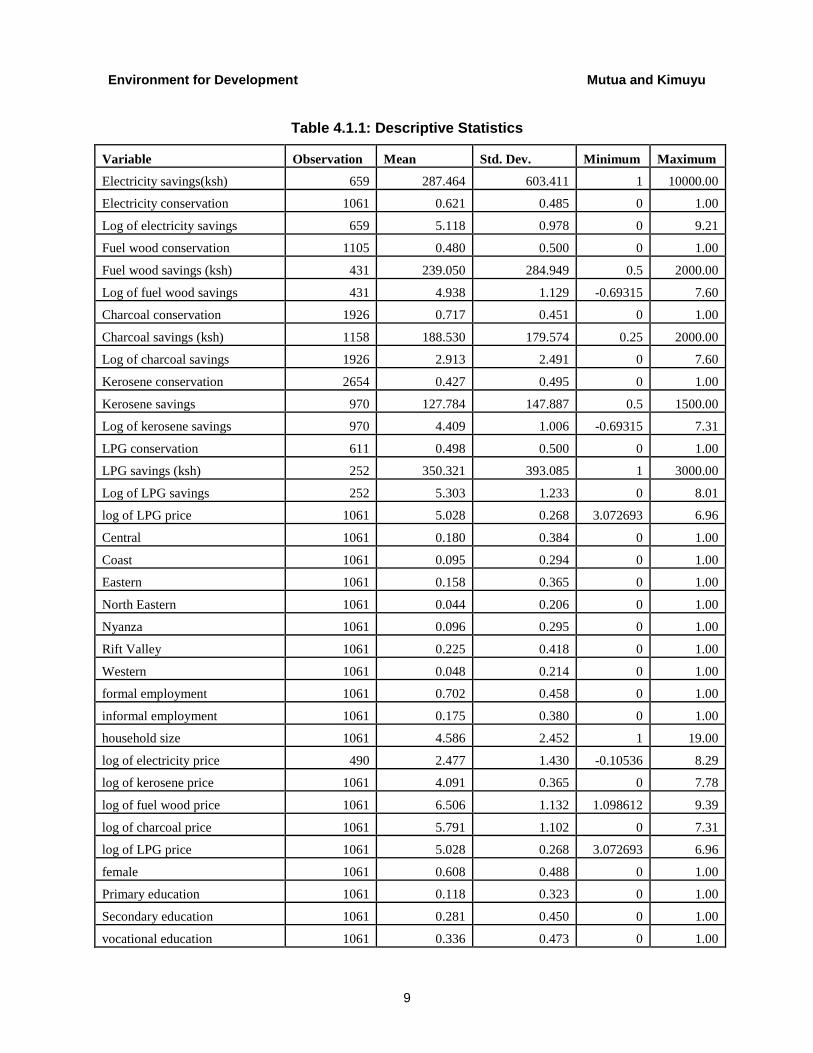
The variables used in this paper are summarized in Table 4.1.1 below. More than 60% of
the households using electricity engage in some conservation measures. The corresponding
figures for fuel wood, charcoal, kerosene and LPG are 48%, 72%, 43% and 50% respectively.
There is therefore a high incidence of energy conservation in Kenya. The energy savings were
thus calculated conditional on a household having chosen to conserve. The survey instrument
sought to establish whether a household had adopted energy conservation measures. This was a
yes or no question. Households that responded “yes” were then asked a follow-up question on
how much they had saved by adopting specific energy conservation measures.
The mean electricity savings from conservation measures is US $3.38, while that for fuel
wood is US $2.82 per month2. Energy savings for fuel wood, charcoal, LPG and kerosene were
US $2.22, 4.12 and 1.50, respectively. LPG, therefore, had the highest savings from energy
conservation efforts and therefore conservation would be most beneficial for LPG, followed by
electricity. These savings are significant given the average monthly fuel costs, which were US
$14.35, US $9.40, US $7.66, US $12.72 and US$ 4.67 for electricity, fuel wood, charcoal, LPG
and kerosene, respectively.
About 60% of the households were headed by females. With regard to education, about
11.7% of the household heads had primary education. Household heads with secondary and
vocational training were 18.1% and 33.6%, respectively. In terms of tenancy, 38.7% of
households live in their own homes and therefore have secure property rights.
2 We have used an exchange rate of Kshs.86 to the US dollar.
Environment for Development Mutua and Kimuyu
9
Table 4.1.1: Descriptive Statistics
Variable Observation Mean Std. Dev. Minimum Maximum
Electricity savings(ksh) 659 287.464 603.411 1 10000.00
Electricity conservation 1061 0.621 0.485 0 1.00
Log of electricity savings 659 5.118 0.978 0 9.21
Fuel wood conservation 1105 0.480 0.500 0 1.00
Fuel wood savings (ksh) 431 239.050 284.949 0.5 2000.00
Log of fuel wood savings 431 4.938 1.129 -0.69315 7.60
Charcoal conservation 1926 0.717 0.451 0 1.00
Charcoal savings (ksh) 1158 188.530 179.574 0.25 2000.00
Log of charcoal savings 1926 2.913 2.491 0 7.60
Kerosene conservation 2654 0.427 0.495 0 1.00
Kerosene savings 970 127.784 147.887 0.5 1500.00
Log of kerosene savings 970 4.409 1.006 -0.69315 7.31
LPG conservation 611 0.498 0.500 0 1.00
LPG savings (ksh) 252 350.321 393.085 1 3000.00
Log of LPG savings 252 5.303 1.233 0 8.01
log of LPG price 1061 5.028 0.268 3.072693 6.96
Central 1061 0.180 0.384 0 1.00
Coast 1061 0.095 0.294 0 1.00
Eastern 1061 0.158 0.365 0 1.00
North Eastern 1061 0.044 0.206 0 1.00
Nyanza 1061 0.096 0.295 0 1.00
Rift Valley 1061 0.225 0.418 0 1.00
Western 1061 0.048 0.214 0 1.00
formal employment 1061 0.702 0.458 0 1.00
informal employment 1061 0.175 0.380 0 1.00
household size 1061 4.586 2.452 1 19.00
log of electricity price 490 2.477 1.430 -0.10536 8.29
log of kerosene price 1061 4.091 0.365 0 7.78
log of fuel wood price 1061 6.506 1.132 1.098612 9.39
log of charcoal price 1061 5.791 1.102 0 7.31
log of LPG price 1061 5.028 0.268 3.072693 6.96
female 1061 0.608 0.488 0 1.00
Primary education 1061 0.118 0.323 0 1.00
Secondary education 1061 0.281 0.450 0 1.00
vocational education 1061 0.336 0.473 0 1.00

Environment for Development Mutua and Kimuyu
10
Tenancy Ownership 1061 0.387 0.487 0 1.00
Electricity utilization hours 1061 7.358 122.758 0.001 4000.00
Fuel wood utilization hours 1061 5.901 24.557 0.01 800.00
Charcoal utilization hours 1061 3.593 4.757 0.3 150.00
Kerosene utilization hours 1061 3.198 15.372 0.01 500.00
Lpg utilization hours 1061 2.627 1.021 0 10.00
Lpg conservation 611 0.498 0.500 0 1.00
Lpg savings in Ksh 296 367.422 402.887 0 3000.00
log of LPG savings 296 5.347 1.242 0 8.01
Source: Analysis from the National Energy Survey Data, 2009.
4.2 Estimated Results
In this sub-section of the paper, we provide estimated results for energy conservation and
saving models by different domestic energy types. We discuss results for fuel wood, charcoal,
kerosene, LPG and electricity. The results are presented for probit/choice of conservation
models, where the choice to conserve or not to conserve is taken as the dependent variable, as
well as for marginal effects, predicted after estimation of the probit models. Secondly, Tobit
estimated results for the determinants of the money value of energy savings are presented. The
exogenous variables for the conservation models are demographic, socio-economic, regional
dummies (for Central, Eastern, North Eastern, Rift Valley, Western and Coast, with Nairobi
taken as the reference region), type of tenancy (in which those households living in their own
homes are compared with those renting or living in semi-permanent structures), technology, and
awareness of regulation.
4.2.1 Fuel Wood Conservation
Households use fuel wood mainly for cooking and heating. It is more commonly used in
rural and peri-urban areas than in modern towns and cities. In addition to estimating a
probit/choice model and predicting marginal effects, a savings model for fuel wood is also
estimated, in which the amount of money saved by the household by adopting fuel wood
conservation measures is used as the dependent variable. As indicated earlier, the savings model
is estimated using the Tobit methodology in order to circumvent selectivity problems. The
estimated results for fuel wood conservation are reported in Table 4.2.1 below.
The results show that regional dummies, price of fuel wood, and household head’s
education are key predictors of the odds for conserving fuel wood. Households located in the
Central and Eastern regions are significantly less likely to conserve fuel wood than those located

Environment for Development Mutua and Kimuyu
11
in Nairobi, which is the reference location. Location in other regions does not make any notable
difference relative to location in Nairobi. Similarly, the gender of the household head does not
count regarding the odds for conserving fuel wood. This is somewhat surprising given the
important role that women play in fetching wood. Other important determinants of fuel wood
conservation include fuel wood price, with a coefficient of 0.062. This means that increasing the
price of fuel wood would lead to adoption of energy conservation measures. On the other hand,
primary and secondary education attainment have coefficients of -0.204 and -0.283, indicating
that, compared to those with vocational education, households headed by persons with primary
and secondary education are less likely to conserve fuel wood.
Regarding actual savings, the Tobit estimates of fuel wood consumption show that, other
than the Central province, regional dummies have negative but generally significant coefficients,
so that households in these regions enjoy less fuel wood savings than those located in Nairobi.
However, the impact on the savings varies from region to region. With regard to education,
households headed by persons with primary and secondary education are more likely to enjoy
higher fuel wood savings compared to those with no education at all.
Going by the marginal effects predictions, for all households located in regions apart
from the Coast, location shows a negative effect on the probability that households will adopt
energy conservation measures. The fact that a household is located in the Central, Eastern or
Nyanza regions reduces the probability of conserving fuel wood energy by 0.309%, 0.287% and
0.142%, compared to those located in Nairobi. On the other hand, increasing the price of fuel
wood by 1% increases the probability of conserving by 0.025%. Households headed by persons
with primary and secondary education are less likely to conserve fuel wood by factors of 0.081%
and 0.112%, respectively, relative to those with no education, which are therefore likely to use
more fuel wood. These results can only be explained in terms of fuel wood poverty, where those
with no access to education are also most likely to be poor. They are likely to lack access to fuel
wood and therefore any amounts available to them have to be conserved as a mechanism for
coping with fuel wood poverty.

Environment for Development Mutua and Kimuyu
12
Table 4.2.1: Fuel Wood Conservation Estimation Results
Probit Results Marginal effects after Probit Tobit Savings Model
Variables Coef.
Std.
Err. Z Coef. Std.Err. z Coef. Std. Err. t
formal employment -0.119 0.085 -1.410 -0.047 0.034 -1.410 -0.249 0.124 -2.010
household size 0.008 0.012 0.700 0.003 0.005 0.700 0.026 0.020 1.260
log of fuel wood price 0.062 0.026 2.350 0.025 0.010 2.350 -0.012 0.037 -0.340
log of charcoal price 0.067 0.045 1.500 0.027 0.018 1.500 0.040 0.067 0.600
Female -0.070 0.081 -0.860 -0.028 0.032 -0.860 -0.188 0.115 -1.630
Primary education -0.204 0.102 -2.000 -0.081 0.040 -2.010 0.287 0.140 2.050
Secondary education -0.283 0.102 -2.770 -0.112 0.040 -2.800 0.197 0.147 1.340
Awareness about conservation -0.150 0.132 -1.130 -0.059 0.052 -1.140 -0.012 0.200 -0.060
Awareness of regulations 0.207 0.156 1.320 0.082 0.062 1.330 0.114 0.225 0.510
Central -0.837 0.181 -4.640 -0.309 0.058 -5.320 0.067 0.270 0.250
Eastern -0.774 0.184 -4.200 -0.287 0.060 -4.780 -1.318 0.263 -5.000
Nyanza -0.363 0.188 -1.930 -0.142 0.071 -2.000 -0.886 0.253 -3.500
Rift Valley -0.057 0.173 -0.330 -0.023 0.069 -0.330 -0.901 0.227 -3.960
Western 0.189 0.190 1.000 0.075 0.075 1.000 -0.615 0.239 -2.570
Coast 0.573 0.365 1.570 0.220 0.128 1.720 -0.789 0.416 -1.900
Constant -0.216 0.329 -0.660 5.129 0.480 10.680
Sigma 1.285 0.039

Environment for Development Mutua and Kimuyu
13
4.2.2 Charcoal Conservation
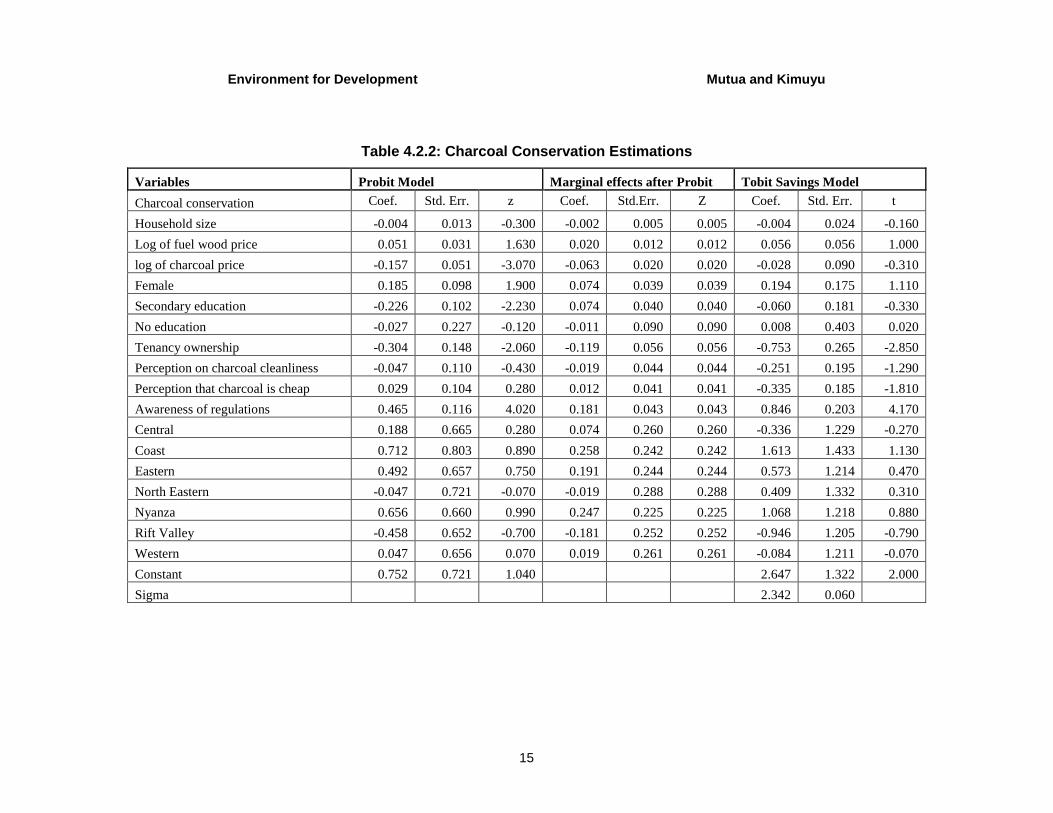
This sub-section of the paper provides estimated results from charcoal conservation
models. The results are reported in Table 4.2.2 below, which shows that location, household size,
household head’s gender, and perceptions about cleanliness of charcoal and its cost or
affordability are key predictors of whether a household does or does not conserve charcoal.
Households in the Central, Coast, Eastern, North Eastern and Western regions are more inclined
to conserve charcoal than are those located in Nairobi. This can be explained by the high usage
of charcoal in these areas and the degradation of the environment that is taking place, resulting in
deforestation and a reduction in the supply of charcoal. Households headed by females are more
likely to conserve charcoal than are those headed by males. Perception variables indicate that the
level of cleanliness of charcoal acts as a determinant of the decision to conserve. The dirtier a
fuel is, the less it is conserved. This perception is also related to its cost. When consumers
perceive a fuel to be clean, they are more likely to conserve it in comparison with that which is
not clean. Awareness of conservation measures also has a positive impact on whether a
household conserves charcoal. This indicates that conservation awareness increases the
probability that a household will adopt charcoal conservation technologies such as energy-
conserving jikos or will even use less charcoal. This also means that a possible policy
intervention is to increase the level of conservation-related training.
The results on charcoal use savings show that only being located in Western Kenya is
statistically significant, so that households in that region save less from charcoal use compared to
those located in Nairobi. Household size, charcoal price, type of tenancy, and perception of
charcoal cleanliness are also statistically significant. The more savings from charcoal
conservation that a household enjoys, the higher the price of fuel wood, which is a substitute, but
the result is not statistically significant. This is also the case for those households that are female
headed. On the other hand, there is a strong inverse association between household size and
charcoal savings. The larger the household, the less it saves from charcoal conservation. With
regard to ownership of tenancy, Tobit results suggest that those living in their own dwellings are
less likely to save on charcoal compared to those in rented premises. As we saw earlier, this can
be explained because poor households, which are likely to be living in rented homes, are more
likely to conserve/save the little charcoal they have because of poverty and low resource
endowments. It is not surprising, then, when they seem to save more compared to those living in
their own homes, who only use charcoal for roasting meat and, once the meal is cooked, leave
the charcoal to burn until the fire dies out.
Environment for Development Mutua and Kimuyu
14
Results for the marginal effects are interesting given the magnitude of the coefficients.
These results show that all regional dummies significantly increase the probability that
households in locations other than Nairobi are likely to conserve charcoal. The marginal effects
indicate the rates of change in the probability of the decision to conserve charcoal fuel and
confirm that being located away from Nairobi increases the odds that households will conserve
charcoal. This is not unreasonable given that, while charcoal may be a dominant source of
domestic energy for the average household in rural Kenya, the story is different for urban
households.
It is evident from this analysis that location, gender of the household head, perception
about cleanliness of charcoal and awareness of charcoal conservation measures are the key
predictors of the decision to conserve and levels of total energy saved by adopting conservation
measures.
Environment for Development Mutua and Kimuyu
15
Table 4.2.2: Charcoal Conservation Estimations
Variables Probit Model Marginal effects after Probit Tobit Savings Model
Charcoal conservation Coef. Std. Err. z Coef. Std.Err. Z Coef. Std. Err. t
Household size -0.004 0.013 -0.300 -0.002 0.005 0.005 -0.004 0.024 -0.160
Log of fuel wood price 0.051 0.031 1.630 0.020 0.012 0.012 0.056 0.056 1.000
log of charcoal price -0.157 0.051 -3.070 -0.063 0.020 0.020 -0.028 0.090 -0.310
Female 0.185 0.098 1.900 0.074 0.039 0.039 0.194 0.175 1.110
Secondary education -0.226 0.102 -2.230 0.074 0.040 0.040 -0.060 0.181 -0.330
No education -0.027 0.227 -0.120 -0.011 0.090 0.090 0.008 0.403 0.020
Tenancy ownership -0.304 0.148 -2.060 -0.119 0.056 0.056 -0.753 0.265 -2.850
Perception on charcoal cleanliness -0.047 0.110 -0.430 -0.019 0.044 0.044 -0.251 0.195 -1.290
Perception that charcoal is cheap 0.029 0.104 0.280 0.012 0.041 0.041 -0.335 0.185 -1.810
Awareness of regulations 0.465 0.116 4.020 0.181 0.043 0.043 0.846 0.203 4.170
Central 0.188 0.665 0.280 0.074 0.260 0.260 -0.336 1.229 -0.270
Coast 0.712 0.803 0.890 0.258 0.242 0.242 1.613 1.433 1.130
Eastern 0.492 0.657 0.750 0.191 0.244 0.244 0.573 1.214 0.470
North Eastern -0.047 0.721 -0.070 -0.019 0.288 0.288 0.409 1.332 0.310
Nyanza 0.656 0.660 0.990 0.247 0.225 0.225 1.068 1.218 0.880
Rift Valley -0.458 0.652 -0.700 -0.181 0.252 0.252 -0.946 1.205 -0.790
Western 0.047 0.656 0.070 0.019 0.261 0.261 -0.084 1.211 -0.070
Constant 0.752 0.721 1.040 2.647 1.322 2.000
Sigma 2.342 0.060

Environment for Development Mutua and Kimuyu
16
4.2.3 Kerosene Conservation
Kerosene is one of the petroleum-based fuels that are commonly used by households in
rural Kenya and the poor in urban and peri-urban areas. People living in informal settlements in
cities consume kerosene in large quantities in cooking and lighting. The estimates of the relevant
probit model show that, while households in the Central region are less likely to conserve
kerosene compared to those residing in Nairobi, those located in other regions are more likely to
conserve. This probably indicates greater access to other domestic forms of energy in the Central
region (See Table 4.2.3). It also reflects higher incomes in this region compared to poor
households in Nairobi, especially those living in sprawling slums that rely almost exclusive on
kerosene for their energy needs. Regarding employment, households headed by persons
employed in the informal sector are more likely to conserve kerosene compared to those in
formal employment. Household size shows a negative coefficient on the odds for kerosene
conservation. It is unclear why this is so, except that larger households are more likely to be
collective rather than unitary, so that common strategies such as those related to energy
conservation are hard to agree on and achieve.
As expected, the price of kerosene pushes households in the direction of energy
conservation. As prices increase, so does the probability for a household to conserve kerosene.
The price of charcoal also increases the odds for conserving kerosene, indicating that, when the
price of alternatives increases, households have no choice but to conserve kerosene. However,
the relevant coefficients are only weakly significant. Secondary and vocational education
attainment by the household head seem to reduce the probability of conserving kerosene relative
to other levels of household heads’ education. On the other hand, households that use kerosene
for a longer period of time are less likely to conserve. The length of utilization of kerosene
therefore has a negative effect on the decision to conserve kerosene. This suggests that, as the
number of hours of use of kerosene increases, households get boxed into kerosene use with
limited opportunity to conserve. This has important policy implications, as policies to promote
behaviour change can be encouraged and implemented. Perception of the cleanliness of kerosene
has a negative impact on the choice to conserve, while awareness of kerosene conservation
measures promotes conservation.
With regard to actual savings from kerosene conservation, results from the Tobit
estimations show that households located in Coastal and Western Kenya enjoy significantly
higher savings from kerosene conservation relative to those based in Nairobi. Those located in
the North Eastern and Rift Valley areas enjoy significantly less savings from kerosene

Environment for Development Mutua and Kimuyu
17
conservation than those located in Nairobi. It is unclear what accounts for these regional
differences. Increasing the price of charcoal also increases savings from kerosene conservation.
Households headed by people with secondary and vocational education enjoy more savings from
charcoal conservation than do those with other levels of education.
These results lead to the conclusion that location, type of employment of household head,
price of kerosene and charcoal, education, kerosene utilization hours, fuel cleanliness and
awareness of conservation are key predictors of odds for kerosene conservation. There is
therefore a battery of variables that are of value for kerosene conservation policy in Kenya.

Environment for Development Mutua and Kimuyu
18
Table 4.2.3: Kerosene Conservation Estimation Results
Probit Model Marginal effects after Probit Tobit Savings Model
Variables
Coef. Std. Err. z Coef. Std.Err. Z Coef.
Std. Err. t
Informal employment 0.155 0.063 2.480 0.061 0.025 2.470 -0.045 0.074 -0.600
Household size -0.022 0.010 -2.220 -0.009 0.004 -2.220 0.003 0.013 0.250
Log of kerosene price 0.104 0.063 1.640 0.041 0.025 1.640 0.156 0.072 2.180
Log of charcoal price 0.050 0.029 1.750 0.011 1.750 0.061 0.038 1.620
Secondary education -0.106 0.062 -1.710 -0.041 0.024 -1.720 0.134 0.076 1.760
Vocational education -0.133 0.075 -1.780 -0.052 0.029 -1.800 0.137 0.090 1.510
Kerosene utilization hours -0.045 0.011 -3.970 -0.018 0.004 -3.970 0.000 0.012 0.010
Perception that kerosene is clean -0.217 0.055 -3.970 -0.085 0.021 -3.990 -0.036 0.066 -0.540
Awareness of regulations 0.179 0.068 2.650 0.071 0.027 2.640 0.152 0.077 1.970
Central -0.386 0.105 -3.670 -0.145 0.037 -3.920 0.336 0.155 2.170
Coast 1.196 0.117 10.220 0.431 0.032 13.490 0.008 0.115 0.070
North Eastern 0.939 0.186 5.050 0.350 0.057 6.100 0.451 0.189 2.390
Nyanza 0.343 0.086 4.010 0.136 0.034 4.010 -0.141 0.110 -1.280
Rift Valley 0.169 0.076 2.210 0.067 0.030 2.200 0.068 0.105 0.640
Western 0.663 0.095 6.960 0.259 0.035 7.350 -0.191 0.110 -1.730
Constant -0.821 0.307 -2.680 3.338 0.385 8.680
Sigma 0.948 0.023

Environment for Development Mutua and Kimuyu
19
4.2.4 Liquefied Petroleum Gas Conservation
LPG is one of the petroleum-based fuels that is commonly used among households in
urban areas for cooking. It is considered cleaner and more efficient than other cooking fuels. The
government of Kenya introduced key regulatory measures and strategies to increase uptake of
LPG in the country. Key among them is the standardization of LPG cylinder valves, removal of
taxes and improvement of infrastructure. The government recently commissioned a gas facility
in Mombasa through a public private partnership (PPP) framework to promote uptake of LPG in
the country.
Results for probit, Tobit and marginal effects are presented in Table 4.2.4 below. These
results show that important determinants of the odds for LPG conservation include location,
household size, household head’s gender, tenancy arrangements and length of LPG utilization.
Households located in the Coast and Western regions are significantly more likely to conserve
LPG than are those located in Nairobi. Being located elsewhere doesn’t make any difference
regarding LPG conservation. Household size somewhat increases the odds for LPG
conservation. Female headship, on the other hand, reduces the probability for conserving LPG,
as does ownership of the dwelling and length of LPG utilization. Surprisingly, those living in
their own dwellings are less likely to conserve LPG, contrary to the belief that such households
would adopt measures that would promote conservation. This could be explained by the
household dynamics in most middle and high income households, where house helps are left to
‘rule’ the kitchen. Due to their low levels of education and lack of incentives to conserve fuel,
this has negative effects on LPG conservation and savings. Results based on marginal effects
generally mimic these probit-based findings.
With regard to the monetary amounts associated with LPG savings, households in the
Rift Valley save significantly less from conservation of LPG compared to those located in
Nairobi. However, location in other regions does not show any difference from location in
Nairobi. The other important factor in LPG savings is vocational education. Compared to
households whose heads have no education, those headed by persons with vocational training
save more from LPG conservation.

Environment for Development Mutua and Kimuyu
20
Table 4.2.4: LPG Conservation Estimation Results
Probit Model Marginal effects after Probit Tobit Savings Model
Variables Coef. Std. Err. z Coef. Std.Err. Z Coef. Std. Err. t
Informal employment 0.179 0.169 1.060 0.071 0.067 1.070 -0.017 0.242 -0.070
Household size 0.047 0.025 1.860 0.019 0.010 1.860 0.041 0.035 1.150
Log of LPG price 0.128 0.131 0.970 0.051 0.052 0.970 0.271 0.176 1.540
Log of electricity tariff 0.149 0.126 1.190 0.060 0.050 1.190 0.039 0.175 0.230
Log of charcoal price -0.070 0.052 -1.350 -0.028 0.021 -1.350 -0.032 0.068 -0.460
Female -0.229 0.111 -2.060 -0.091 0.044 -2.070 -0.011 0.159 -0.070
Secondary education -0.208 0.145 -1.440 -0.083 0.057 -1.450 0.015 0.210 0.070
Vocational education -0.172 0.122 -1.410 -0.068 0.048 -1.410 0.182 0.172 1.060
Tenancy ownership -0.241 0.115 -2.090 -0.096 0.046 -2.100 0.012 0.174 0.070
LPG utilization hours -0.103 0.039 -2.610 -0.041 0.016 -2.610 0.012 0.059 0.210
Awareness of regulations 0.209 0.128 1.630 0.083 0.050 1.640 0.210 0.182 1.150
Central -0.300 0.176 -1.700 -0.119 0.069 -1.730 -0.023 0.284 -0.080
Coast 0.929 0.238 3.900 0.333 0.068 4.870 -0.389 0.280 -1.390
Eastern -0.243 0.190 -1.280 -0.096 0.074 -1.290 0.071 0.298 0.240
Nyanza 0.154 0.184 0.840 0.061 0.073 0.840 -0.042 0.280 -0.150
Rift Valley 0.230 0.170 1.350 0.091 0.067 1.370 -0.542 0.254 -2.140
Western 0.540 0.278 1.950 0.207 0.098 2.120 0.038 0.383 0.100
Constant -0.355 0.849 -0.420 3.875 1.170 3.310
Sigma 1.187 0.053

Environment for Development Mutua and Kimuyu
21
4.2.5 Electricity Conservation
Electricity connectivity in Kenya is currently estimated at about 32% of total households
(Energy Regulatory Commission 2014). This is low compared to other countries. Unlike the
other models, where all regional dummies have been prominent, these were dropped from the
electricity conservation model and replaced by a dummy distinguishing only between rural and
urban location. The results are presented in Table 4.2.5 below.
The probit estimates show that a household located in the rural areas has a lower
probability of conserving electricity than a household located in an urban area, probably because
electricity consumption in Kenya is still largely an urban phenomenon. Vocational training has a
positive coefficient relative to those with no education, while electricity utilization hours has a
negative coefficient on electricity conservation.
The results for savings from electricity conservation yield only four significant variables,
namely, electricity tariff, nature of tenancy and awareness of electricity conservation. Increasing
the electricity tariff by 1 percent would increase savings from electricity consumption by 0.172
percent. The corresponding coefficients for tenancy and conservation awareness are 0.284
percent and 0.323 percent, respectively. Those households residing in their own dwellings are
more likely to enjoy higher savings from electricity conservation compared to those in rented
homes. This suggests that households residing in their own homes are more likely to carry out
investments in energy conservation in the long run, leading to increased energy savings.
Households residing in their own dwellings have exclusive rights to develop and install energy
conservation facilities, compared to those who are renting. Because some owners of rental
property do not allow improvements or modifications to be done on their premises, renters find
themselves in a situation in which they cannot adopt electricity conservation and saving
measures even if they are willing to do so. Tenancy arrangement, therefore, limits adoption.
The marginal effects confirm that households located in the rural areas are less likely to
conserve electricity compared to those located in the urban areas. The marginal effects for
electricity tariff have a perverse effect on the odds for conserving electricity. The higher the
tariff, the less likely households are to conserve electricity. This could be an indication that
households are not conscious of their electricity usage despite change in the tariff and thus it may
not influence their decision to conserve. However, in the case of electricity savings, the higher
the tariff, the higher the savings, which means that households are more conscious of electricity
bills that they pay monthly.

Environment for Development Mutua and Kimuyu
22
These results lead us to conclude that household location, electricity tariff and utilization
hours are important determinants of energy conservation and can inform relevant policy
interventions.

Environment for Development Mutua and Kimuyu
23
Table 4.2.5: Electricity Conservation Estimation Results
Probit Model Marginal effects after Probit Tobit Savings Model
Variables Coef. Std. Err. z Coef. Std.Err. Z Coef. Std. Err. t
Household size -0.008 0.017 -0.480 -0.003 0.007 -0.480 0.064 0.017 3.730
log of electricity tariff -0.134 0.072 -1.860 -0.051 0.027 -1.860 0.172 0.061 2.820
Female -0.046 0.083 -0.560 -0.018 0.031 -0.560 -0.097 0.077 -1.260
Vocational education 0.161 0.085 1.880 0.060 0.032 1.900 0.101 0.076 1.320
Electricity utilization hours -0.042 0.010 -4.040 -0.016 0.004 -4.030 -0.006 0.010 -0.580
Tenancy ownership 0.175 0.094 1.870 0.066 0.035 1.880 0.284 0.085 3.350
Awareness about conservation 0.153 0.128 1.190 0.057 0.047 1.200 0.323 0.117 2.770
Awareness of regulations -0.014 0.148 -0.090 -0.005 0.056 -0.090 -0.133 0.132 -1.000
Rural -0.274 0.090 -3.050 -0.105 0.035 -3.030 -0.108 0.085 -1.270
Constant 0.778 0.207 3.750 4.317 0.184 23.400
Sigma 0.936 0.026

Environment for Development Mutua and Kimuyu
24
5. Conclusion and Policy Suggestions
Following existing literature on energy conservation, we used 2009 National Energy
Survey data sets to estimate probit models to determine the odds for conserving different
forms of energy used by households in Kenya and estimated the marginal effects of the
explanatory variables included in the probit model. We also used a Tobit modeling approach
to determine factors that influence the value of energy saved. The assortment of variables
used include household location unpacked into province-based regional dummies; fuel
prices; household head’s personal attributes such as type of employment, gender and
educational attainment; fuel utilization levels; property rights over dwellings; cleanliness of
fuel; perception of affordability; and awareness of energy conservation regulations.
Theoretically, conservation of energy is motivated by many factors, including the
desire to reduce price/cost, environmental concerns, energy demand management, awareness
of the national needs to conserve energy, regulatory goals and other demographic factors
such as gender of household head, household head’s educational attainment and employment
status, and overall household energy utilization. Although there are many methodologies that
can be used to analyze energy conservation, we have kept matters simple by adopting
discrete choice and ordinary least squares models to track the odds for conserving and the
levels of energy savings conditional on conservation of specific fuels.
Our results show that household location, fuel prices, household head characteristics
(gender, education level and type of employment), property rights over dwellings, perception
of cleanliness and affordability, and awareness of fuel conservation regulations are all key
determinants of the likelihood of conserving energy and the consequential savings in
monetary terms.
These results indicate that energy prices can be used to encourage energy
conservation and sustainable development. The efficacy of adjusting prices as policy
instruments varies from one form of household energy to another but is particularly
efficacious for wood and kerosene. There are also significant location differences in the
tendency to conserve and the quantum of energy savings, which should be taken into account
in policy designs. For example, in the case of charcoal, households in the Central, Coast and
Eastern provinces are significantly more likely to conserve and to derive energy savings from
such conservation, relative to those residing in Nairobi. This information is a useful guide to
national energy conservation policies.

Environment for Development [Authors]
25
References
Abrahamsen, W., and L. Steg. 2011. Factors Related to Household Energy Use and Intention to
Reduce it: The Role of Psychological and Socio-Demographic Variables. Human
Ecology Review 18(1).
Dubin, J.A., and D.L. McFadden. 1984. Econometric Analysis of Residential Electric Appliance
Holding and Consumption. Energy 17(1): 47-60.
Energy Regulatory Commission. 2014. Ten Year Plan for the Least Cost Power Development.
Nairobi.
Fischer, C. 2008. Feedback on Household Electricity Consumption: A Tool for Saving Energy?
Energy Efficiency 1: 79-104.
Gillingham, K., R.G. Newell, and K. Palmer. 2009. Energy Efficiency Economics and Policy
Resources for the Future Discussion Paper 09-13.
Government of Kenya. 2011. Energy Management Regulations. Nairobi, Government Printer.
Government of Kenya. 2008. Vision 2030: A Globally Competitive and Prosperous Kenya.
Nairobi, Government Printer.
Iwaro, J., and Mwasha, A. 2010. A Review of Building Energy Regulation and Policy for Energy
Conservation in Developing Countries. Energy Policy 38: 7744-7755.
Linares, P., and X. Labandeira. 2010. Energy Efficiency: Economics and Policy. Journal of
Economic Survey 24(3): 573-592.
McDonald, J.F., and R.A. Moffit. 1980. The Uses of Tobin Analysis. The Review of Economics
and Statistics (The MIT Press) 62(2): 318-321.
Malone, E.L., A.H. Makin, and R.E. Lundgren. 2002. Motivating Residents to Conserve Energy
without Financial Incentives to Environment. Behavior Journal (509): 372-6013.
Mutua, J.M, D. Ngui, H. Osiolo, W., and E. Aligula. 2010. Energy Consumption Patterns in
Kenya. Client Report to the Energy Regulatory Commission.
Pindyck, R.S., and D.L. Rubinfeld. 1991. Econometric Models and Economic Forecasts. New
York: McGraw-Hill International Edition.
Sardianou, E. 2010. Household Energy Conservation Patterns: Evidence from Greece.
Department of Home Economics and Ecology. Mimeograph.
Environment for Development [Author last names]
26
Sardianou, E. 2007. Estimating Energy Conservation Patterns of Greek Households. Energy
Policy 35: 3778-3791.
Stern, P. C., Doetz, T., Abel, R., Guagnano, G.A., and Kalof, L. 1999. A Value-belief-norm
Theory of Support for Social Movements: The Case of Environmentalism. Human
Ecology Review (6): 81-97.
Stern, P., and G. Gardner. 1981. Psychological Research and Energy Policy. American
Psychologist 36(4): 329-342.
Tobin, J. 1958. Estimation of Relationships for Limited Dependent Variables. Econometrica
26(1): 24-36.
Zhao, T., L.W, Mark, J. Sulik, and J. Zhang. 2012. Consumer Responses towards Home Energy
Financial Incentives: A Survey-based Study. Energy Policy 47: 291-297.
Related Documents