Environment for Development Discussion Paper Series November 2016 EfD DP 16-25 Spatial Distribution of Coal- Fired Power Plants in China Lunyu Xie, Ying Huang, and Ping Qin

Welcome message from author
This document is posted to help you gain knowledge. Please leave a comment to let me know what you think about it! Share it to your friends and learn new things together.
Transcript
Environment for Development
Discussion Paper Series November 2016 EfD DP 16-25
Spatial Distribution of Coal-Fired Power Plants in China
Lunyu X i e , Y i ng Huang, and P ing Q in

Environment for Development Centers
The Environment for Development (EfD) initiative is an environmental economics program focused on international
research collaboration, policy advice, and academic training. Financial support is provided by the Swedish
International Development Cooperation Agency (Sida). Learn more at www.efdinitiative.org or contact
Central America Research Program in Economics and Environment for Development in Central America Tropical Agricultural Research and Higher Education Center (CATIE) Email: [email protected]
Chile Research Nucleus on Environmental and Natural Resource Economics (NENRE) Universidad de Concepción Email: [email protected]
China Environmental Economics Program in China (EEPC) Peking University Email: [email protected]
Ethiopia Environment and Climate Research Center (ECRC) Ethiopian Development Research Institute (EDRI) Email: [email protected]
Kenya School of Economics University of Nairobi Email: [email protected]
South Africa Environmental Economics Policy Research Unit (EPRU) University of Cape Town Email: [email protected]
Sweden Environmental Economics Unit University of GothenburgEmail: [email protected]
Tanzania Environment for Development Tanzania University of Dar es Salaam Email: [email protected]
USA (Washington, DC) Resources for the Future (RFF) Email: [email protected]

Discussion papers are research materials circulated by their authors for purposes of information and discussion. They have
not necessarily undergone formal peer review.
Spatial Distribution of Coal-Fired Power Plants in China
Lunyu Xie, Ying Huang, and Ping Qin
Abstract
Coal has fueled China’s fast growth in the last decades, but it also severely pollutes the
air and causes many health issues. The magnitude of the health damage caused by air pollution
depends on the location of emission sources. In this paper, we look into the spatial distribution of
coal-fired power plants, the major emission sources in China, and investigate the determining
factors behind the distribution. We see an overall increase in installed coal-fired power capacity
in recent years, with capacity leaps in some provinces. We find that the driving factors are
economic development and expansion of electricity grid coverage; the latter factor plays a key
role in provinces that are less developed but have abundant coal resources.We also find that firms
react to utilization hours, which are assigned by the government, but not to electricity prices,
which are set by the government as well. These findings suggest a way to reduce health damages
caused by air pollution without harming the economy: attracting coal-fired plants to less
populated areas by developing trans-province electricity trade and grid coverage.
Key Words: coal-fired power plant, economic geography, electricity price, factor
endowment, installed power capacity, utilization hours
JEL Codes: Q32, Q41, R32

Contents
1. Introduction ......................................................................................................................... 1
2. Location Choice for Coal-Fired Power Plants ................................................................. 3
3. Data and Graphic Analysis ................................................................................................ 5
3.1 Spatial Distribution of Power Capacity ........................................................................ 5
3.2 Factor Endowment ........................................................................................................ 6
3.3 Economic Geographical Factors ................................................................................... 7
3.4 Electricity Price ............................................................................................................. 8
3.5 Utilization Hours ........................................................................................................... 9
4. Econometric Analysis ......................................................................................................... 9
4.1 Factor Endowment ...................................................................................................... 10
4.2 Economic Geographical Factors ................................................................................. 10
4.3 Electricity Price ........................................................................................................... 11
4.4 Production Quota ........................................................................................................ 12
5. Conclusion ......................................................................................................................... 13
References .............................................................................................................................. 14
Figures and Tables ................................................................................................................ 17

Environment for Development Xie, Huang, and Qin
1
Spatial Distribution of Coal-Fired Power Plants in China
Lunyu Xie, Ying Huang, and Ping Qin
1. Introduction
Coal-fired power plants contribute significantly to greenhouse gases and local air
pollution (World Bank 1997; Lopez et al. 2005; International Energy Agency 2012;
Sueyoshi and Goto 2015). Although carbon dioxide from different locations contributes
to greenhouse gases uniformly, the adverse effect of local pollutants on human health1
and economic activities2 depends highly on the spatial distribution of emission sources
(Zhou et al. 2006; Greco et al. 2007). This implies that, holding total emissions
unchanged, changing the spatial distribution of coal-fired power plants could reduce the
health damages caused by air pollution. That is, it is possible to reduce the harm from
power plants’ emissions without harming the growth of an economy if a method can be
identified to shift the location of power plants. In light of the fact that China accounts for
half of the world’s coal consumption (BP 2016) and uses half of that coal to generate
electricity (International Energy Agency 2014), this paper investigates the spatial
distribution of coal-fired power plants in China and identifies the factors driving the
distribution.
A large literature, theoretical and empirical, studies the factors that potentially
affect an industry’s location. This literature can be divided into three main categories: the
factor abundance hypothesis, new economic geography, and the pollution haven
hypothesis. (1) The factor abundance hypothesis, pioneered by the Heckscher-Ohlin (HO)
and Heckscher-Ohlin-Vanek (HOV) models, generally finds the importance of factor
endowment in determining a country’s production and export structure as well as an
industry’s location (Bowen et al. 1987; Davis et al. 1997; Romalis 2004; Gerlagh and
Mathys 2011; Michielsen 2013). (2) New economic geography studies how economies of
Lunyu Xie, Assistant Professor at Renmin University of China, [email protected]. Ying Huang,
Assistant Professor at Renmin University of China, [email protected]. Ping Qin (corresponding author),
Associate Professor at Renmin University of China, [email protected].
1A partial list of literature on the impact of air pollution on human health includes Chay and Greenstone
(2003), Neidell (2004), Currie and Neidell (2005), Currie et al. (2009), Coneus and Spiess (2012), Janke
(2014), Luechinger (2014), and Tanaka (2015).
2For recent examples, see Ho and Nielsen (2007).
Environment for Development Xie, Huang, and Qin
2
scale, transaction costs, and other geographical factors affect the spatial agglomeration of
economic activities (Fujita 1988; Krugman 1991; Wen 2004). Some empirical studies
combine the factor endowment hypothesis with new economic geography to investigate
the determinants of firm location in practice (Ellison and Glaeser 1999; Midelfart-
Knarvik et al. 2000; Crafts and Mulatu 2005; Gutberlet 2012). (3) The pollution haven
hypothesis emphasizes the effect of environmental regulation, among other factors, on
industries’ location choices. A large empirical literature tests the existence of the
hypothesis.3 Although the findings are mixed, the baseline is that stringent environmental
regulation does play a role in the location choices of highly polluting industries.
Most of the literature mentioned above, however, focuses on developed countries.
Little attention is paid to developing countries and in particular to the siting decisions for
coal-fired power plants. In China, electricity generated by coal is above 70 percent of the
total electricity generation (China Energy Year Book 2013). With the massive use of coal
for electricity generation, many cities in China are experiencing severe air pollution and
policy-makers are faced with the difficult task of mitigating air pollution while
supporting economic growth (World Bank 1997). Given that coal-fired power plants in
China contribute greatly to air pollution and that the harm of the pollution varies across
regions with different environmental capacity and population density (Ho and Nielsen
2007), it is important to look into the spatial distribution of coal-fired power plants in
China and the driving factors behind the distribution.
The location choices for coal-fired power plants in China could differ from those
in developed countries, which are market economies. In China, the electricity prices
received by power firms are set by the central government and vary across provinces, and
the utilization hours of power plants are allocated by the provincial government. This
means that a power plant in China chooses price and potential utilization hours through
location choice, instead of through production behavior, as in a market economy.
Therefore, this paper also contributes to the literature by investigating how exogenously
set prices and a production quota system affect an industry’s spatial distribution.
We first build a dataset of provincial capacity of coal-fired power plants from
1998 to 2011. We then merge the dataset with location-specific characteristics, such as
3A partial list of the literature: Jaffe et al. (1995), Becker and Henderson (2000), List and McHone (2000),
Greenstone (2002), Jeppesen et al. (2002), Taylor (2004), Kanbur and Zhang (2005), and Gong and Shen
(2011).

Environment for Development Xie, Huang, and Qin
3
coal reserves, GDP per capita, population, grid coverage, transportation capacity,
electricity price, utilization hour quota, etc. With the provincial panel data, we look into
the spatial distribution of power plants and empirically analyze the factors that drive this
distribution.
We find that coal-fired power plants generally concentrate in the areas with large
electricity markets. We also find that some provinces with abundant coal reserves had
capacity leaps in recent years; the reason could be the development of the electricity grid.
Furthermore, we find that a power plant reacts to utilization hours, but not to electricity
prices. These findings imply that one way to shift coal-fired plants to areas with abundant
coal resources but less population could be to encourage the construction of a trans-
province electricity grid and the establishment of a trans-province electricity market.
The remainder of the paper is organized as follows. Section 2 introduces the
framework of location decisions for coal-fired power plants. Section 3 looks into the
evolution of power plants’ spatial distribution and graphically investigates potential
factors behind the distribution. Section 4 uses econometric models to formally investigate
the correlation between the factors and the installed power capacity. Section 5 concludes.
2. Location Choice for Coal-Fired Power Plants
In 2002, China adopted a power industry reform with the purpose of encouraging
the construction of power plants to alleviate the shortage of power supply. Before the
reform, power generation, dispatch, transmission, and sale were integrated. They were
planned by the central government and executed by the Ministry of State Electric Power
Industry before 1998 and the State Power Corporation between 1998 and 2003. The 2002
reform separated power generation from power dispatch, transmission and sale. The State
Power Corporation was divided into the State Grid Corporation and the Southern Grid
Corporation. Generation firms were formed. Since then, the location choices of plants
have been made by the generation firms, but the government has set the electricity price,
Environment for Development Xie, Huang, and Qin
4
which varies across provinces, and has allocated utilization hours across plants.4
Therefore, resource endowment, market factors, and political factors all could have
played a role in shaping the spatial distribution of power plants in China.
A location choice can affect a power plant’s expected profit through affecting
production costs. Transportation cost is one of the main costs. According to a report by
the China Logistics Information Center, in 2011, about 60 percent of coal consumed in
China was transported by rail, and, in some provinces, the transportation cost for coal
amounted to about 40 percent of the retail price of coal. To save transportation costs, a
firm may choose to build a plant close to coal resources. Besides transportation costs,
transmission costs also could be high in some cases. In areas where grid coverage is low,
connecting a large-capacity power generator to a grid usually involves extension or
upgrade of the grid, which could be very costly in time and money.5 To avoid such costs,
a firm may want to build a plant where the grid coverage is more extensive. In sum, as
proposed by the factor abundance hypothesis and new economic geography, a firm builds
a plant in an area with abundant coal to save on transportation costs or in an area close to
market to save on transmission costs. The firm must make tradeoffs if the two areas do
not coincide, which is the case in China, as shown in Figure 1.
A location choice can also affect a power plant’s profit through affecting
electricity price and quantity of production, i.e., utilization hours. In China, electricity
prices are set by the government, under rules that have been evolving. Before 2004, the
operation period price policy set the electricity price for each power plant, with the aim of
4The government also has the right to approve a firm’s investments. Before 2004, a successful application
needed go through examination and approval by the Development and Reform Commissions (DRC) at
various levels: local, provincial and national. Before the application reached the provincial DRC, the
application needed to get a “pass” from the higher levels, which usually took more than two years to obtain.
The DRCs not only examined the social impacts of the investment, but also analyzed the profitability of the
investment. After 2004, the application procedure was dramatically simplified. A pass is not needed and the
examination on profitability is given back to the applicants. This change in application procedure could
accelerate the development of the power section as a whole, as well as shift the location patterns of coal-
fired plants. However, we will not be able to estimate the magnitude of the impact by regressions, because
the sample to support the full specification only covers the years from 2004 through 2011, which is after
the change in the approval process.
5To be connected to the grid, a firm needs to apply to the power grid company,which owns the grid in this
area. Then, the firm either waits for the power line to be built by the grid company or builds the line by
itself, in which case the grid company provides design diagrams, approves the construction before
acceptance, and purchases back the line. In general, time cost dominates in the first case and financial cost
dominates in the latter case.
Environment for Development Xie, Huang, and Qin
5
securing a certain investment return rate. Therefore, plants with different construction
costs had different prices. After 2004, a benchmark price policy replaced the operation
period price policy and set electricity prices based on the average construction cost of all
plants in the same province. Since then, the electricity prices received by plants have
varied at the provincial level, rather than the plant level. The utilization hours are
allocated by the provincial government.6 In a province with a higher quota of hours and
fewer firms, each firm is likely to get more hours, compared to a province with a lower
quota or more firms.
In sum, the factors that potentially impact the spatial distribution of coal-fired
power capacity in China include coal endowment, market size factors, electricity price,
and utilization hour quota.
3. Data and Graphic Analysis
In this section, we first look into the spatial distributions of coal-fired power
capacity over the years and then we investigate the driving factors discussed above.7 We
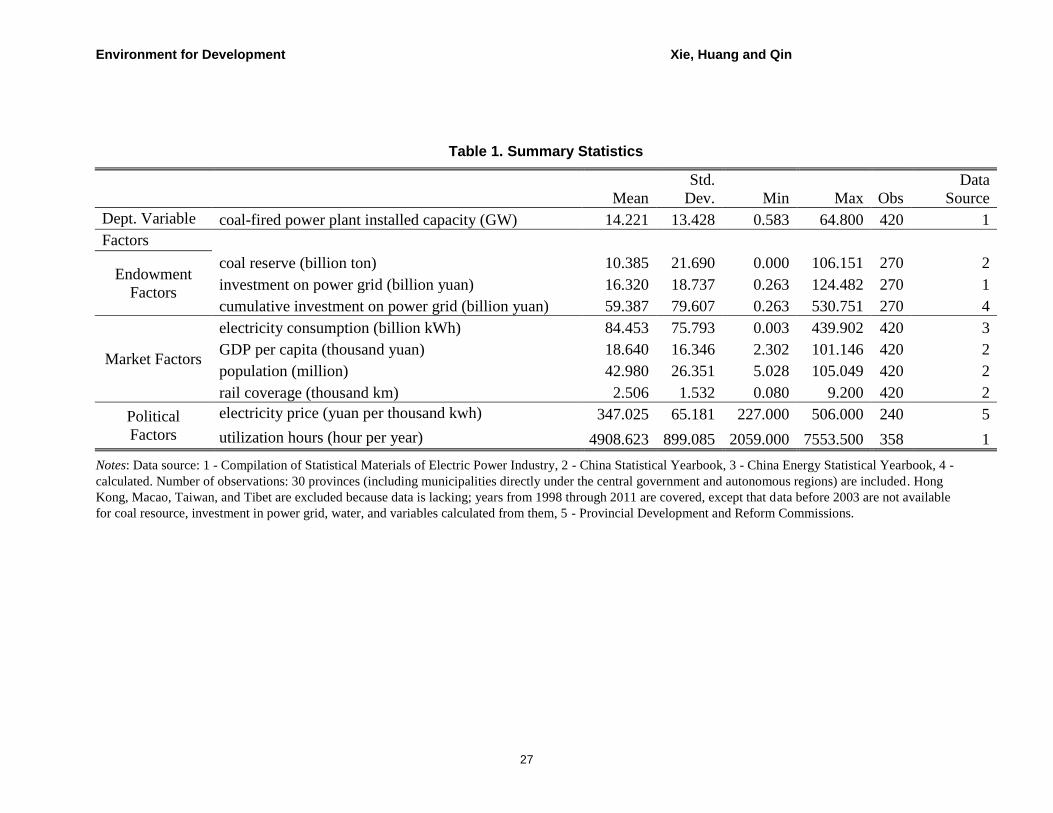
collect provincial level data from various sources, starting in the1990s and continuing
through 2011. We describe the data in detail below and summarize them in Table 1.
3.1 Spatial Distribution of Power Capacity
Data on coal-fired power capacity are collected from the Compilation of
Statistical Materials of the Electric Power Industry (1998–2011), which includes coal-
fired power plants with capacity above 6000 kilowatt (KW).
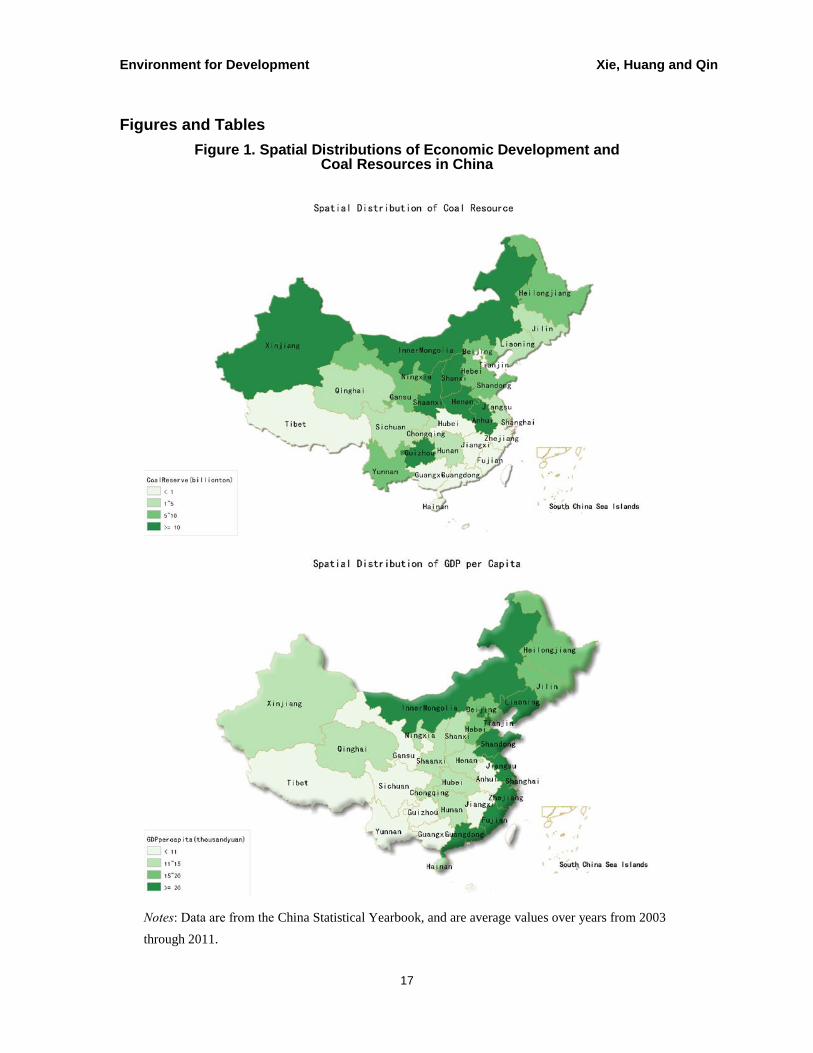
Figure 2 compares the spatial distribution of coal-fired plants in 1998 and 2011. It
shows that coal-fired plants were concentrated in the coastal areas in 1998. The capacity
in Guangdong was more than 15 gigawatts (GW), followed by Shandong and Jiangsu,
6The allocation generally involves several steps: the power plant files an application, the local grid
company adjusts hours based on safety and dispatch capability, and the local government approves the
hours. Before 2006, the allocation rule essentially was to divide hours equally across plants. In 2007, the
State Council issued the “Announcement of Energy Saving Generation Dispatch” to give generation
priority to those plants that are more efficient and less polluting. 7Besides the factors mentioned above, we also investigate the effect of environmental regulations on plants’
location choice. Given the difficulty in measuring the stringency of a regulation, we use expenditure on
environment abatement as a proxy variable. The discussion of the data and the analysis results are available
upon request.

Environment for Development Xie, Huang, and Qin
6
each with capacity over 10 GW. By contrast, the capacity in most central and
northwestern provinces was less than 5 GW. Capacity grew significantly during the
period from 2008 to 2011 for all provinces, except for Tibet and Qinghai. In 2011, coal-
fired power plants were still concentrated in coastal areas, where the average capacity
was above 40 GW. Large growth in capacity was also seen in some inland regions such
as Inner Mongolia, Shanxi and Henan, which are all abundant in coal. Their capacities in
2011 were more than 40 GW, the same magnitude as coastal areas in the same year.
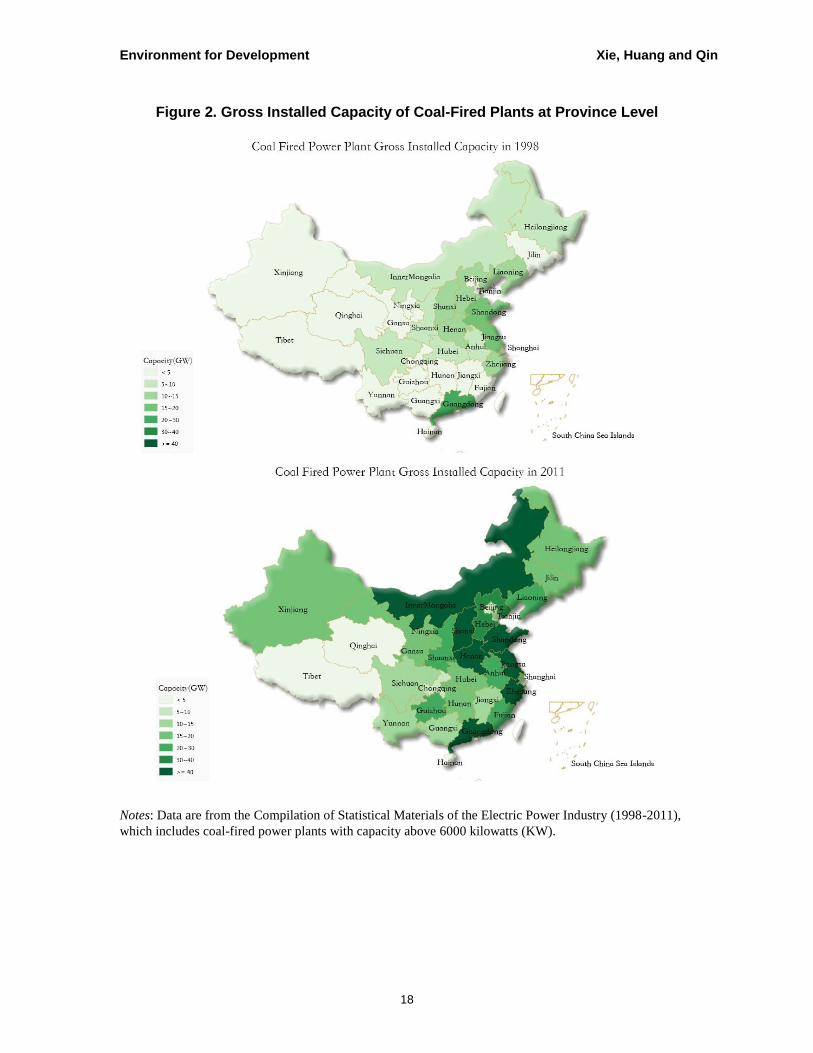
Figure 3 illustrates the capacity trajectory of each province since 1998. Four
features are observed. First, the capacity in all provinces at least doubled from 1998 to
2011, although the increase in capacity varies across provinces. Second, all provinces had
slow growth in power capacity before the power industry reform in 2002. Third, with the
reform, the more-developed provinces experienced a greater increase in capacity. The
unbalanced development in capacity further widened the gap between the leaders in both
economic development and power capacity and the other provinces. Last, Inner
Mongolia, which was less economically developed but has abundant coal, experienced
the most dramatic increase in installed capacity, from 7.7 GW in 1998 to 59.6 GW in
2011, and became the third largest province in capacity in 2011, slightly less than Jiangsu
and Shandong. These features, observed in Figure 3, imply that the power demand due to
economic growth may have consistently driven the increase of power capacity, while
some other factors, such as coal endowment, may also have played a role.
3.2 Factor Endowment
Coal—We proxy a province’s factor endowment by its coal reserve. Data on coal
reserves are collected from the China Statistical Yearbook from 2003 through 2011.
Before 2003, only national coal reserve data are available.
Figure 4 compares the provincial coal reserves and the gross capacity of coal-fired
plants in 2011. The provinces are ordered based on the quantity of coal reserves. Inner
Mongolia and Shanxi are the top two in coal reserves, while they are also among the top
in power capacity in 2011. However, the positive correlation of coal reserves and power
capacity is not clear for other provinces. For example, coal reserves in Jiangsu, Zhejiang,
and Hainan are low, but power capacity is high. Notice that these provinces have a high
level of economic development, and therefore a high demand for power. This suggests
that, besides coal endowment, proximity to markets may be another driving force for the
development of coal-fired plants. We will investigate market factors in the next
subsection.

Environment for Development Xie, Huang, and Qin
7
To further investigate the correlation between coal reserves and installed capacity,
using data in all years (2003–2011), we depict in Figure 5, Panel A the scatter points and
fitted lines of coal reserves and coal-fired power capacity. We find that the slope of the
annual fitted lines increases over the years. The slope is 0.048 in 2003 and not
statistically significant, while it is as large as 0.41 in 2011 and statistically significant at
the 5 percent significance level. The reason could be that the provinces with abundant
coal had more dramatic increases in power capacity in recent years, as shown in Figure 3.
Electricity Grid—Now the puzzle is why power capacity in the provinces with
abundant coal leaped in recent years. One simultaneous phenomenon is the extension of
the power grid in those areas. To investigate the correlation between grid and capacity,
we use investment in the power grid to proxy the development of the grid.8 Investment
data are from the China Statistical Yearbook from 2003 through 2011.9 Investment is
defined as the total investments in a year for maintaining or building the power grid and
replacing grid-related equipment. To measure the grid coverage in a province in a certain
year, we accumulate all the investments in the current year and the previous years. That
is, for each year, we use cumulative investment to proxy the grid coverage, and annual
investment to proxy the grid development year.
In Figure 5, Panel B, we depict the scatter points of grid coverage and power
capacity. As we discussed above, we expect a larger effect of grid development in the
areas with abundant coal but low grid coverage. In the plot, we therefore distinguish the
three provinces with the largest coal reserves, which are Shanxi, Inner Mongolia, and
Shaanxi. The slope of the fitted line for the three provinces is much steeper than that for
the other provinces, which confirms the hypothesis.
3.3 Economic Geographical Factors
Market Size—In determining the location of industries, the presence of
transaction costs (e.g., high transmission costs induced by the low coverage of the
electricity grid) means that the demand side matters and that geographical factors come
8It would be ideal to use the length of transmission lines at various voltage grades to measure the power
grid coverage. But, lacking the power line data, we use investment data instead.
9The statistical standards are inconsistent before and after 2003. Therefore, the investment data before 2003
are not used in this study.

Environment for Development Xie, Huang, and Qin
8
into play. In this section, we focus on the geographical distribution of demand and use the
size of the electricity market to proxy it.
There are different ways to measure the size of the electricity market. Electricity
consumption is a direct measurement; GDP per capita reflects the overall level of
economic development, which demands energy; population reflects the size of the
potential market. We collect electricity consumption data from the China Energy
Statistical Yearbook, and obtain GDP and population data from the China Statistical
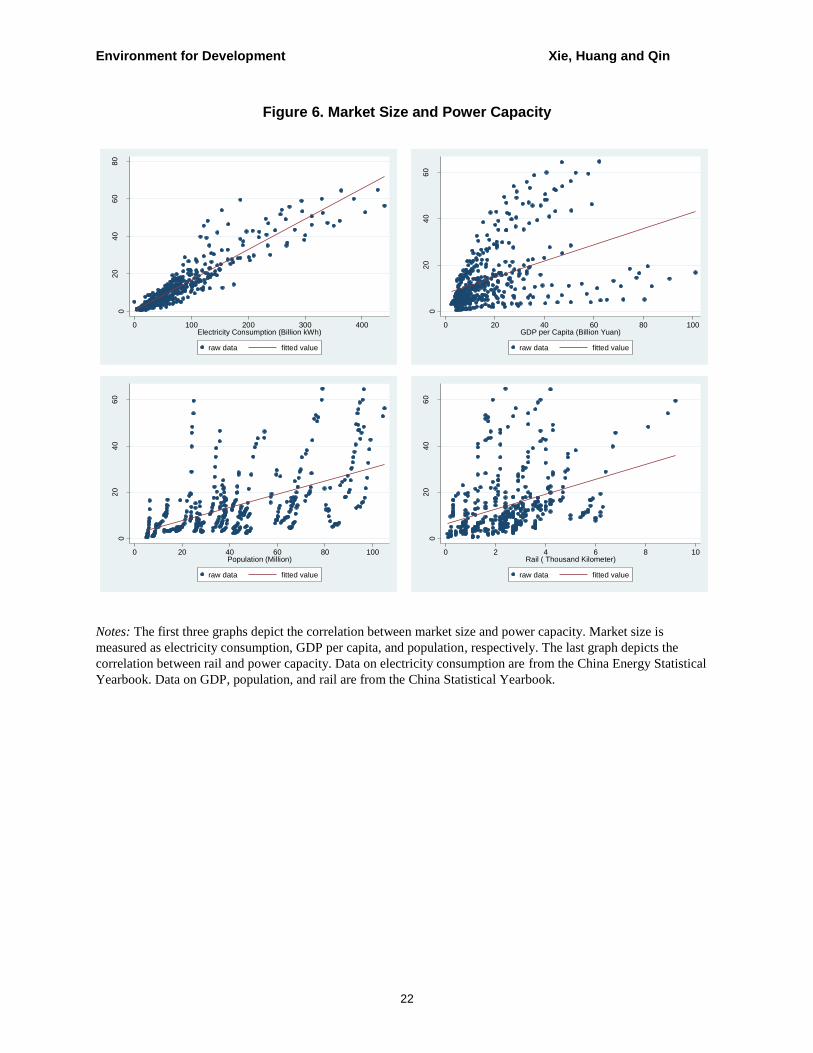
Yearbook. Figure 6 depicts the scatter points of coal-power capacity versus the three
market size variables in the first three plots. In the electricity consumption graph, the raw
data points concentrate along an upward sloping line, indicating a strong positive
correlation between capacity and electricity consumption. Although the graphs of GDP
per capita and population also show positive correlations with power capacity, the
relationship is weaker, because GDP per capita and population size work together to
determine the electricity demand.
Coal Transportation Cost—A positive correlation between capacity and market
size means that capacity concentrates in the areas with larger markets, which are areas far
from coal, as shown in Figure 1. Therefore, coal transportation cost comes into play.
We use rail coverage to proxy coal transportation cost, because provinces with
extensive rail coverage are expected to have lower transportation costs. We collect yearly
rail mileage data at the provincial level from the China Statistical Yearbook, and depict
the relationship of capacity and railway mileage in the fourth plot of Figure 6. Power
capacity and rail mileage are positively correlated, as expected.
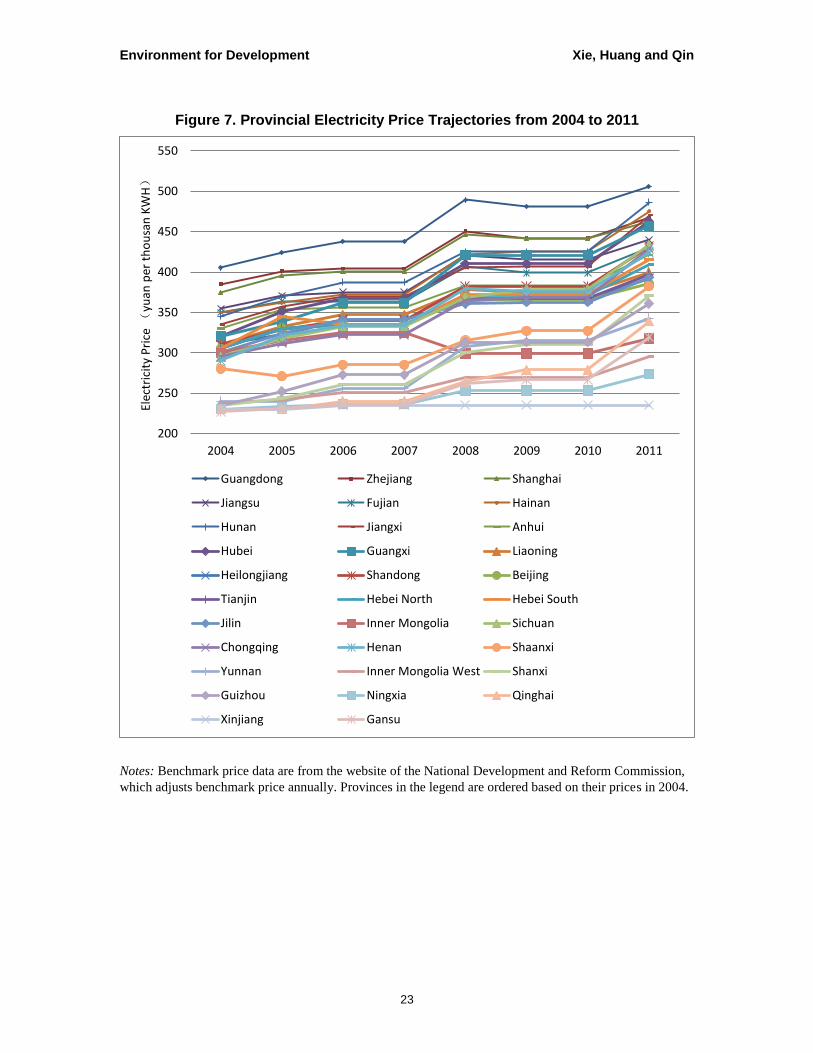
3.4 Electricity Price
Electricity price data are collected from the website of the National Development
and Reform Commission, which adjusts the benchmark price. As shown by Figure 7, the
price varies across provinces, with the highest (over 500 yuan per thousand kilowatt
hours) in Guangdong in 2011, and the lowest (below 250 yuan) in Gansu in all years.
Despite the large variation across provinces, the price trajectories in all provinces have
the same pattern. The price increases gradually every year, with the largest increases in
2008 and 2011. The only exception is Inner Mongolia, where the price dropped in 2007.
To see how power capacity is correlated with benchmark price, in Figure 8 we
depict the scatter points and fitted lines for each year from 2004 through 2011. We see an
upward sloping fitted line for each year, indicating that areas with higher prices have
Environment for Development Xie, Huang, and Qin
9
more power capacity. However, we cannot yet conclude that capacity reacts to price,
because areas with higher prices are also the areas with larger demand (the correlation
between price and GDP per capita is 0.34). We therefore adopt a regression method in the
next section to distinguish the roles of price and demand.
3.5 Utilization Hours
Data on firm-level utilization hours are collected from the Compilation of
Statistical Material of the Electric Power Industry from 1995 through 2011, in which
1996, 1999, and 2001 are missing. All coal-fired power plants with installed capacity of
more than 6 MW are included. We use the median of firm-level utilization hours to proxy
the expected production quota. We choose median rather than mean to alleviate the
influence of outliers. As shown in Figure 9, average and median utilization hours are
different, but the difference remains stable.
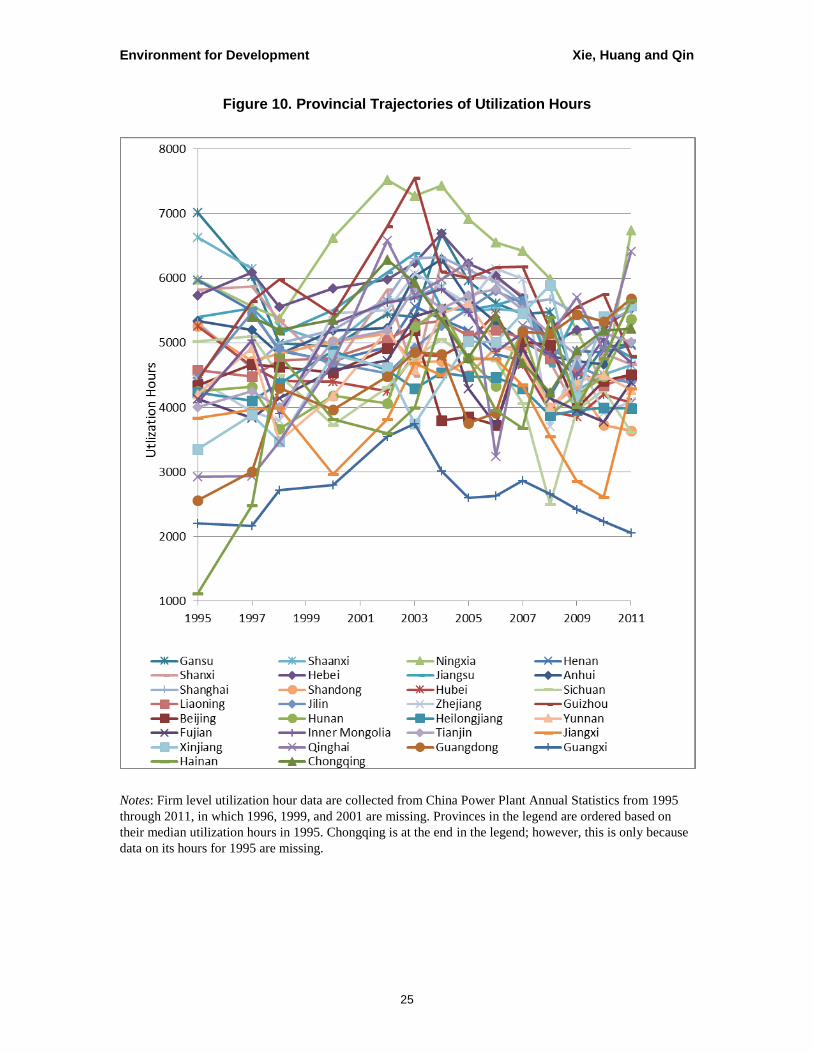
Figure 10 depicts utilization hour trajectories of each province. We see that
utilization hours go up and down over the years and vary dramatically across provinces.
Most provinces remain above 4000 hours for all the years, while Guangxi remains below
3000 hours for most of the years.
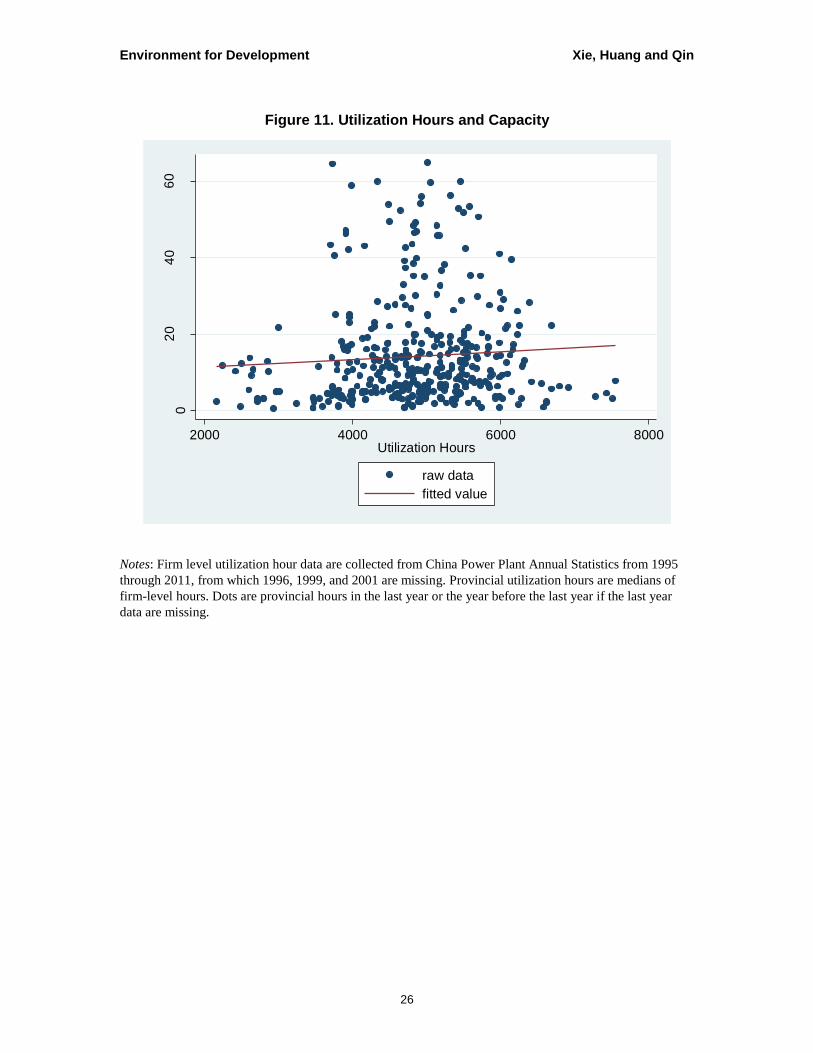
Figure 11 depicts the correlation between utilization hours and power capacity. To
avoid the problem of reverse causality, in which increase in capacity leads to lower
average utilization, we use utilization hours in the last year (or the year before the last
year if last year’s data are missing) in Figure 11. We see a slightly upward sloping fitted
line, indicating that there might be a weak correlation between utilization hours and
capacity. Whether this correlation indicates that capacity reacts to utilization hours will
be investigated by regressions in the next section.
4. Econometric Analysis
In the previous section, we graphically investigated the correlation between
capacity and each of the potential driving factors. In this section, we employ a multiple
regression to disentangle the contributions of the factors in shaping the spatial
distribution of power capacity. In all regressions, we include year fixed effects to account
for the effects of common shocks that are not captured by the control variables. We do
not include province fixed effects, because we rely on the provincial variations to identify
the effects of factors that vary across provinces but do not change much across years for
the same province (e.g., coal reserves). That is, we choose “between estimator” over
Environment for Development Xie, Huang, and Qin
10
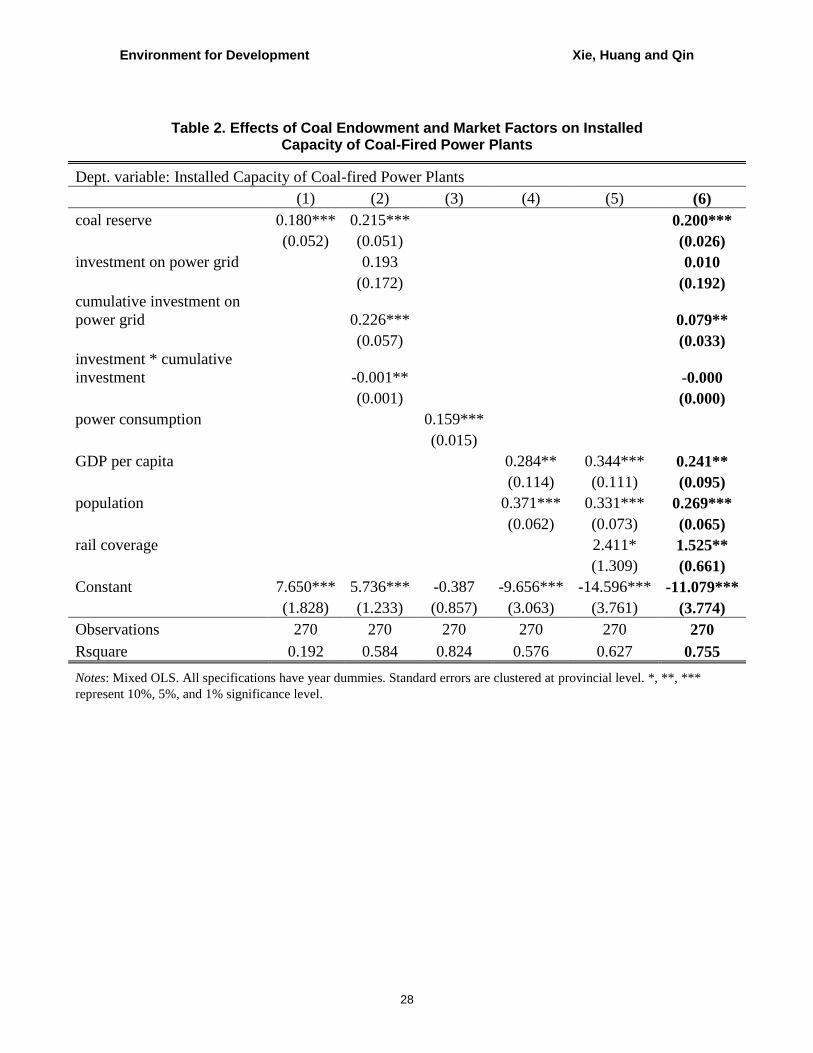
“within estimator.” Regression results are shown in Table 2 for endowment and market
factors, Table 3 for electricity price, and Table 4 for utilization hours.
4.1 Factor Endowment
We start with a regression with coal reserve as the only covariate, besides year
fixed effects. As shown in Table 2, Column 1, the estimated coefficient is 0.18 and
statistically significant; a one standard deviation increase in coal reserve (21.96 billion
ton) leads to a 29 percent standard deviation increase in capacity (0.18 * 21.69 / 13.428 =
0.29). However, the R square shows that only 19 percent of the variation in capacity can
be explained by the variation in coal reserve and time.
As we discussed in the last section, we expect an increase in power capacity when
electricity grid becomes more developed, especially in the areas with abundant coal but
low grid coverage. We use cumulative investment in the grid to proxy grid coverage, and
current investment to proxy grid development. We therefore expect a positive coefficient
of both current investment and cumulative investment, and a negative coefficient of their
interaction term. The regression results are the same as expected, as shown in Table 2,
Column 2. The R square is 0.584, much larger than that of the first regression. This
suggests that the development of the electricity grid is critical to the development of
power plants.
4.2 Economic Geographical Factors
We add in power consumption, as a proxy of market size, in Table 2, Column 3.
As expected, the coefficient of power consumption is positive and statistically significant.
However, power consumption is the equilibrium quantity of the market, decided by
factors from both the demand side (namely the potential market size) and the supply side
(namely the capacity of all power plants) simultaneously. We therefore use GDP per
capita and population size, instead, to measure the potential market size in the following
regressions. GDP per capita will represent the income effect and population size will
represent the scale effect.
As shown in Table 2, Column 4, the coefficients of both GDP per capita and
population are positive and statistically significant at the one percent significance level. R
square is 0.58. These results indicate that market size is an important factor that drives
location choice for coal-fired plants.

Environment for Development Xie, Huang, and Qin
11
Locating close to market, however, may result in higher coal transportation costs
because areas with abundant coal are usually far away from areas with a large market
(Figure 1). Greater rail coverage may decrease coal transportation costs, and this lower
cost attracts firms. We therefore expect greater capacity in provinces with greater rail
coverage. In Table 2, Column 5, we add in rail coverage and indeed get a positive and
statistically significant estimate of the coefficient of rail coverage.
In Table 2, Column 6, we include all the variables that represent factor
endowment, market size, and possible constraints (electricity grid and rail coverage) to
reflect their comprehensive effects. Compared to Column 3, the effects of coal reserves
and cumulative investment in the power grid remain statistically significant, although
their magnitudes decrease. A possible reason is that annual investment in the power grid
is highly correlated with GDP per capita. As for market size, income effect, scale effect,
and the effect of rail coverage, these also remain statistically significant, although their
magnitudes decrease. R square in this regression is much higher than in the regressions in
Columns 2 and 5, which separately consider endowment factors and market factors.
These results indicate that both factor resources and market size are important factors in
location choices for coal-fired power plants; their effects, however, are constrained by
other factors such as electricity grid coverage and rail coverage.
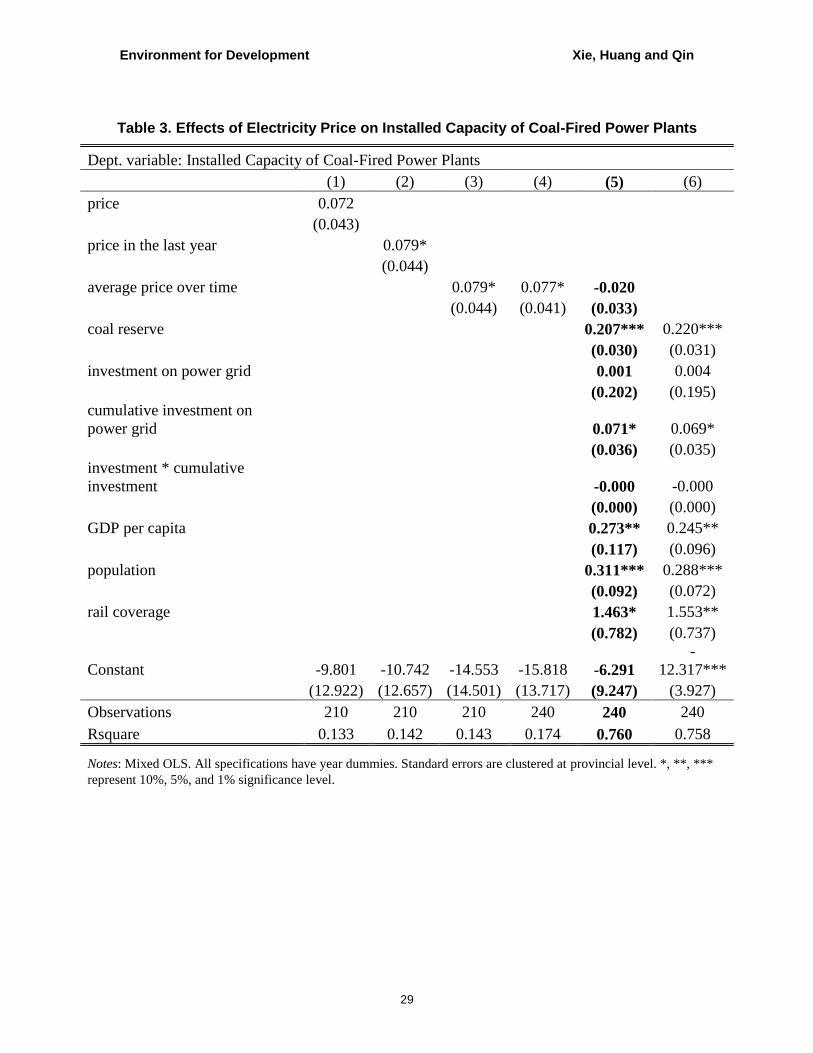
4.3 Electricity Price
In Table 3, we investigate the effect of electricity price on the spatial distribution
of coal-fired plants. First, we regress power capacity on electricity price only – current
price in Column 1, last year’s price in Column 2, and average price over time in Column
3. We have 240 price observations (30 provinces in eight years from 2004 through 2011),
but only 210 price lag observations, because the first year’s lag price data are missing. To
make the regression results of the three price covariates comparable, we also drop the
first year data for the regression of current price and that of average price over time. We
find that the estimated coefficients of price variables are similar. This is expected,
because, as we show in Figure 7, the provincial prices have similar trajectories. So, we
are comfortable in picking any of them and we use average price over time for the rest of
the analysis. In Column 4, we put back the first year to make use of the full dataset, and
the results remain stable. The coefficient is 0.077 and significant at the 10 percent
significance level. This indicates that the provinces with higher electricity prices do have
larger coal-fired plant capacity.

Environment for Development Xie, Huang, and Qin
12
Without controlling other variables, however, we can only interpret this result as a
correlation. No matter whether a firm reacts to price, a positive correlation will be seen if
the government sets the price higher in the provinces where the market is larger or the
coal is abundant. We therefore add in endowment variables and market size factors in
Column 5. We find that the estimated coefficient of price becomes much smaller and not
significant. We also find that the coefficients of endowment variables and market factors
remain stable by comparing Column 5 to Column 6, which repeats the regression in
Table 2, Column 6, but with the same sample as Table 3, Column 5. This suggests that
the firms do not actually react to the exogenous and stable electricity prices; they build
plants where there is a large market or abundant coal.
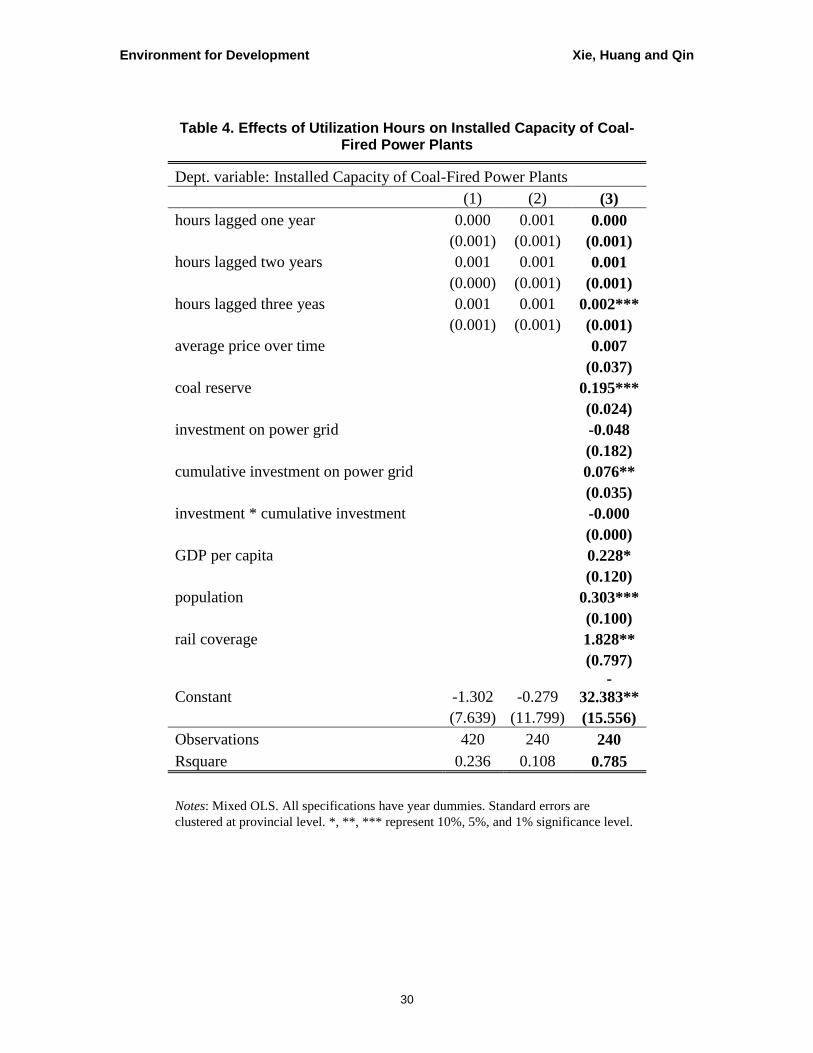
4.4 Production Quota
In Table 4, we investigate how expected utilization hours affect a firm’s location
choice. We use median utilization hours over all plants in the same province in the last
three years to proxy the expected utilization hours. We use lagged hours to avoid the
reverse causality that a leap in capacity leads to lower average utilization hours, holding
demand constant.
In Column 1, we regress capacity on lag hours only, and we find that the
coefficients are small and not statistically significant. One thousand more utilization
hours (more than one standard deviation more hours) only lead to one gigawatt more
installed capacity (less than ten percent standard deviation more capacity).
Utilization hours are also correlated with demand and possibly other factors, so
we add into the regression all the factors we discussed earlier. We are aware that adding
all variables will lose sample size. To eliminate the impact of sample size, we restrict the
regression in Column 2 to the same sample as Column 3, which includes all the variables.
Column 2 shows that sample size has little impact on the estimated coefficients of hours.
Column 3 shows that utilization hours do have some impact on firms’ location choices –
the coefficient of hours in the two years before the last year is statistically significant.
However, the magnitude is not economically significant – one standard deviation more
utilization hours leads to only 14 percent of a standard deviation more capacity
installation. Compared to Table 3, Column 5, Table 4, Column 3 also shows that adding
in the utilization hour variable has little effect on the variables of price, coal endowment,
and market size.
Environment for Development Xie, Huang, and Qin
13
5. Conclusion
In this paper, we investigate the spatial distribution of coal-fired power plants in
China and the potential driving factors, which include coal endowment, market size
factors, electricity prices, and utilization hours.
We find that, in China, coal-fired power plants are located in the areas where the
demand is greater, especially in the earlier years of our sample. Although these areas are
far from where the coal is, a developed railway system in China ensures that coal
transportation cost is lower than the cost of electricity grid expansion. However, with the
development of the electricity grid in areas with abundant coal, power plants started to
locate in coal-rich areas, thus saving transportation costs, now that power transmission
costs are dramatically lowered by the grid expansion. We also find that, when choosing
location, firms do not react to electricity prices, which are set by the government, are
stable over the years, and vary across provinces. However, firms do react to production
quota, i.e., allowable utilization hours.
These findings have important policy implications for reducing the harm caused
by power generation without harming the economy. Air pollution has larger adverse
effects in the areas with large markets, because in those areas population density is high
and the scale of economic activities is large. By contrast, the areas with abundant coal are
usually less developed areas, with lower population density. This implies that one way to
reduce the harm of air pollution is to shift power plants from where the market is to
where the coal is. By identifying the factors driving the choice for location of coal-fired
plants, this paper suggests that such a shift could be induced by lowering the transmission
costs for plants built in the areas abundant in coal and increasing their utilization hours.
The measures to achieve this goal may include encouraging the construction of a trans-
province electricity grid and the establishment of a trans-province electricity market.
Environment for Development Xie, Huang and Qin
14
References
Becker, R., and V. Henderson. 2000. Effects of Air Quality Regulations on Polluting
Industries. Journal of Political Economy 108(2): 379-421.
Bowen, H.P., E.E. Leamer, and L.A. Sveikauskas. 1987. Multicountry, Multifactor Tests
of the Factor Abundance Theory. The American Economic Review 77(5): 791-
809.
B.P. 2016. BP Energy Outlook 2035.
Chay, K.Y., and M. Greenstone. 2003. The Impact of Air Pollution on Infant Mortality:
Evidence from Geographical Variation in Pollution Shocks Induced by a
Recession. Quarterly Journal of Economics 118(3): 1121-1167.
Coneus, K., and C.K. Spiess. 2012. Pollution Exposure and Child Health: Evidence for
Infants and Toddlers in Germany. Journal of Health Economics 31(1): 180-196.
Crafts, N., and A. Mulatu. 2005. What Explains the Location of Industry in Britain, 1871-
1931? Journal of Economic Geography 5: 499-518.
Currie, J., M. Neidell, and J.F. Schmieder. 2009. Air Pollution and Infant Health: Lessons
from New Jersey. Journal of Health Economics 28(3): 688-703.
Currie, J., and M. Neidell. 2005. Air Pollution and Infant Health: What Can We Learn
from California’s Recent Experience? Quarterly Journal of Economics 120(3):
1003-1030.
Davis, D.R., D.E. Weinstein, S.C. Bradford, and K. Shimpo. 1997. Using International
and Japanese Regional Data to Determine When the Factor Abundance Theory of
Trade Works. The American Economic Review 87(3): 421-446.
Ellison, G., and E.L. Glaeser. 1999. The Geographic Concentration of Industry: Does
Natural Advantage Explain Agglomeration? The American Economic Review
89(2): 311-316.
Fujita, M. 1988. A Monopolistic Competition Model of Spatial Agglomeration:
Differentiated Product Approach. Regional Science and Urban Economics 18(1):
87-124.
Gerlagh, R., and N.A. Mathys. 2011. Energy Abundance, Trade and Industry Location.
FEEM Working Paper No. 3.2011.
Environment for Development Xie, Huang and Qin
15
Greenstone, M. 2002. The Impacts of Environmental Regulations on Industrial Activity:
Evidence from the 1970 and 1977 Clean Air Act Amendments and the Census of
Manufactures. Journal of Political Economy 110(6): 1175-1219.
Gong, J., and K. Shen. 2011. Regional Distribution and Environment Pollution of
Energy-intensive Industries in China. The Journal of Quantitative and Technical
Economics 2: 20-36 (Chinese).
Greco, S.L., A.M. Wilson, J.D. Spengler, and J.I. Levy. 2007. Spatial Patterns of Mobile
Source Particulate Matter Emissions-to-exposure Relationships across the United
States. Atmospheric Environment 41(5): 1011-1025.
Gutberlet, T. 2012. Cheap Coal, Market Access, and Industry Location in Germany 1846
to 1882. University of Arizona. Working Paper.
Ho, M.S., and C.P. Nielsen. 2007. Clearing the Air: The Health and Economic Damages
of Air Pollution in China. MIT Press.
International Energy Agency. 2012. Carbon-dioxide Emissions from Fuel Combustion
Highlights. http://www.iea.org/co2highlights/co2highlights.pdf.
International Energy Agency. 2014. World Energy Balances.
Jaffe, A.B., S.R. Peterson, P.R. Portney, and R.N. Stavins. 1995. Environmental
Regulation and the Competitiveness of US Manufacturing: What Does the
Evidence Tell Us? Journal of Economic Literature 33: 132-163.
Janke, K. 2014. Air Pollution, Avoidance Behavior and Children's Respiratory Health:
Evidence from England. Journal of Health Economics 38: 23-42.
Jeppesen, T., J.A. List, and H. Folmer. 2002. Environmental Regulations and New Plant
Location Decisions: Evidence from a Meta‐ analysis. Journal of Regional
Science 42(1): 19-49.
Kanbur, R., and X. Zhang. 2005. Fifty Years of Regional Inequality in China: A Journey
through Central Planning, Reform, and Openness. Review of Development
Economics 9(1): 87-106.
Krugman, P. 1991. Increasing Returns and Economic Geography (No. w3275). National
Bureau of Economic Research.
List, J.A., and W.W. McHone. 2000. Measuring the Effects of Air Quality Regulations
on “Dirty” Firm Births: Evidence from the Neo-and Mature-regulatory
Periods. Papers in Regional Science 79(2): 177-190.

Environment for Development Xie, Huang and Qin
16
Lopez, M.T., M. Zuk, V. Garibay, G. Tzintzun, R. Iniestra, and A. Fernandez. 2005.
Health Impacts from Power Plant Emissions in Mexico. Atmospheric
Environment 39(7): 1199-1209.
Luechinger, S. 2014. Air Pollution and Infant Mortality: A Natural Experiment from
Power Plant Desulfurization. Journal of Health Economics 37: 219-231.
Michielsen, T.O. 2013. The Distribution of Energy-intensive Sectors in the USA. Journal
of Economic Geography 13(5): 871-888.
Midelfart-Knarvik, K.H., H.G. Overman, S.J. Redding, and A.J. Venables. 2000. The
Location of European Industry. Economic Papers No. 142. European
Commission, D-G for Economic and Financial Affairs, Brussels.
Neidell, M.J. 2004. Air Pollution, Health, and Socio-economic Status: The Effect of
Outdoor Air Quality on Childhood Asthma. Journal of Health Economics 23(6):
1209-1236.
Romalis, J. 2004. Factor Proportions and the Structure of Commodity Trade. The
American Economic Review 94(1): 67-97.
Tanaka, S. 2015. Environmental Regulations on Air Pollution in China and Their Impact
on Infant Mortality. Journal of Health Economics 42: 90-103.
Taylor, M.S. 2004. Unbundling the Pollution Haven Hypothesis. Advances in Economic
Analysis and Policy 3(2).
Sueyoshi, T., and M. Goto. 2015. Environmental Assessment on Coal-fired Power Plants
in U.S. North-east Region by DEA Non-radial Measurement. Energy Economics
50: 125-139.
Wen, M. 2004. Relocation and Agglomeration of Chinese Industry. Journal of
Development Economics 73(1): 329-347.
World Bank. 1997. Clear Water, Blue Skies: China’s Environment in the New Century.
Zhou, Y., J.I. Levy, J.S. Evans, and J.K. Hammitt. 2006. The Influence of Geographic
Location on Population Exposure to Emissions from Power Plants throughout
China. Environment International 32(3): 365-373.
Environment for Development Xie, Huang and Qin
17
Figures and Tables
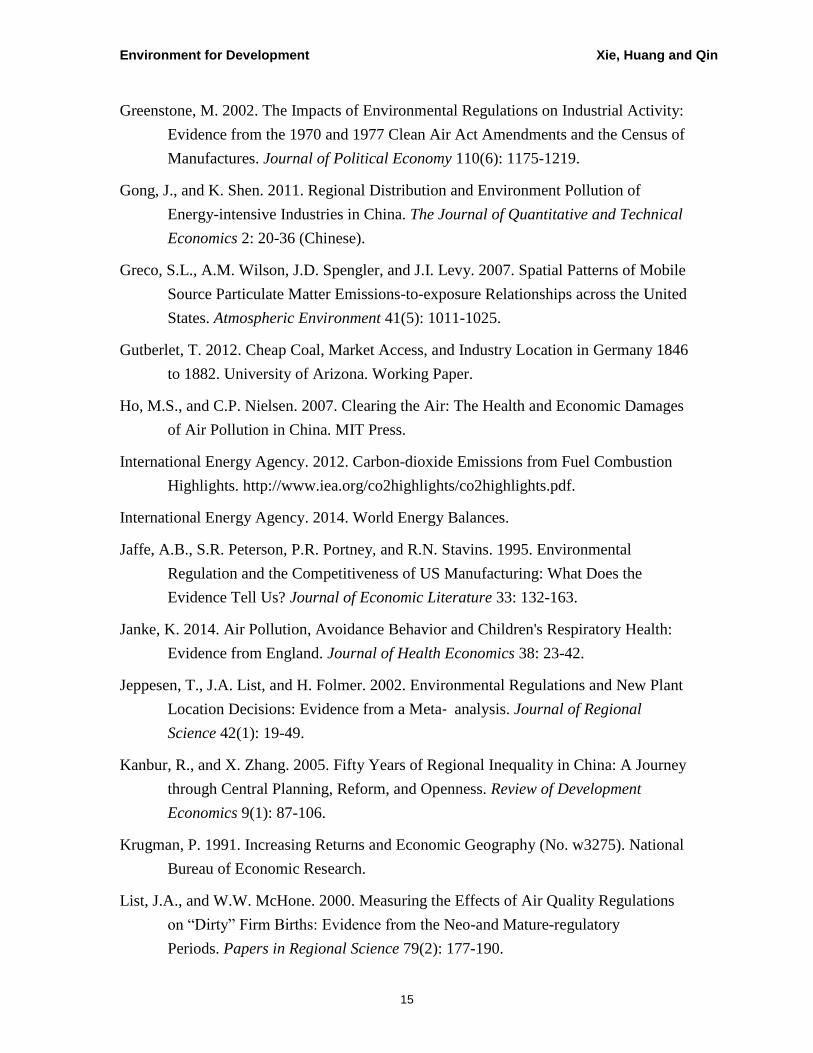
Figure 1. Spatial Distributions of Economic Development and Coal Resources in China
Notes: Data are from the China Statistical Yearbook, and are average values over years from 2003
through 2011.
Environment for Development Xie, Huang and Qin
18
Figure 2. Gross Installed Capacity of Coal-Fired Plants at Province Level
Notes: Data are from the Compilation of Statistical Materials of the Electric Power Industry (1998-2011),
which includes coal-fired power plants with capacity above 6000 kilowatts (KW).
Environment for Development Xie, Huang and Qin
19
Figure 3. Provincial Trajectories of Power Capacity from 1998 through 2011
Notes: Data are from the Compilation of Statistical Materials of the Electric Power Industry (1998-2011),
which includes coal-fired power plants with capacity above 6000 kilowatts (KW). The provinces in the
legend are ordered based on their installed capacities in 1998.
0
10
20
30
40
50
60
70
1998 1999 2000 2001 2002 2003 2004 2005 2006 2007 2008 2009 2010 2011
Inst
alle
d C
apac
ity
(GW
)
Guangdong Shandong Jiangsu Henan
Hebei Liaoning Shanxi Zhejiang
Shanghai Heilongjiang Inner Mongolia Anhui
Hubei Sichuan Shaanxi Hunan
Tianjin Jilin Jiangxi Fujian
Gansu Xinjiang Chongqing Guizhou
Beijing Guangxi Yunnan Ningxia
Hainan Qinghai Tibet

Environment for Development Xie, Huang and Qin
20
Figure 4. Coal-fired Power Capacity and Coal Reserves at Province Level in 2011
Notes: Data are from the China Statistical Yearbook 2011.The provinces are ordered based on their installed capacities in 2011.
0
10
20
30
40
50
60
70
80
90
0
10
20
30
40
50
60
70
Shan
xi
Inn
er M
on
golia
Xin
jian
g
Shaa
nxi
Hen
an
An
hu
i
Shan
do
ng
Hei
lon
gjia
ng
Yun
nan
Gu
izh
ou
Sich
uan
Heb
ei
Nin
gxia
Liao
nin
g
Gan
su
Ch
on
gqin
g
Qin
ghai
Hu
nan
Jian
gsu
Jilin
Fujia
n
Jian
gxi
Be
ijin
g
Hu
bei
Tian
jin
Gu
angx
i
Hai
nan
Zhej
ian
g
Gu
angd
on
g
Shan
ghai
Co
al R
eso
urc
e (b
illio
n t
on
)
Gro
ss I
nst
alle
d C
apac
ity
(GW
)
Gross Installed Capacity (GW) Coal Resource(billion ton)

Environment for Development Xie, Huang and Qin
21
Figure 5. Factor Endowment and Power Capacity
Panel A. Coal Reserve and Capacity
Panel B. Power Grid Coverage and Capacity
Notes: Data on coal reserve and power grid investment are collected from the China Statistical Yearbook
from 2003 through 2011. Panel A plots the correlation between coal reserve and installed capacity. Dots are
yearly data at provincial level. Lines are fitted for all data points, 2003, and 2011, respectively. Panel B
plots the correlation between investment in the power grid and the installed power capacity. Dots are yearly
data at provincial level. The steeper line is for Shanxi, Inner Mongolia, and Shaanxi and the other line is for
the rest of the provinces.
02
04
06
08
0
Insta
lled C
apa
city(G
W)
0 100 200 300 400 500Cumulative Investment on Power Grid (Billion Yuan)
raw data fitted value
Environment for Development Xie, Huang and Qin
22
Figure 6. Market Size and Power Capacity
Notes: The first three graphs depict the correlation between market size and power capacity. Market size is
measured as electricity consumption, GDP per capita, and population, respectively. The last graph depicts the
correlation between rail and power capacity. Data on electricity consumption are from the China Energy Statistical
Yearbook. Data on GDP, population, and rail are from the China Statistical Yearbook.
02
04
06
08
0
Cap
acity(G
W)
0 100 200 300 400Electricity Consumption (Billion kWh)
raw data fitted value
02
04
06
0
Cap
acity(G
W)
0 20 40 60 80 100GDP per Capita (Billion Yuan)
raw data fitted value
02
04
06
0
Cap
acity(G
W)
0 20 40 60 80 100Population (Million)
raw data fitted value
02
04
06
0
Cap
acity(G
W)
0 2 4 6 8 10Rail ( Thousand Kilometer)
raw data fitted value
Environment for Development Xie, Huang and Qin
23
Figure 7. Provincial Electricity Price Trajectories from 2004 to 2011
Notes: Benchmark price data are from the website of the National Development and Reform Commission,
which adjusts benchmark price annually. Provinces in the legend are ordered based on their prices in 2004.
200
250
300
350
400
450
500
550
2004 2005 2006 2007 2008 2009 2010 2011
Elec
tric
ity
Pri
ce (
yuan
per
th
ou
san
KW
H)
Guangdong Zhejiang Shanghai
Jiangsu Fujian Hainan
Hunan Jiangxi Anhui
Hubei Guangxi Liaoning
Heilongjiang Shandong Beijing
Tianjin Hebei North Hebei South
Jilin Inner Mongolia Sichuan
Chongqing Henan Shaanxi
Yunnan Inner Mongolia West Shanxi
Guizhou Ningxia Qinghai
Xinjiang Gansu

Environment for Development Xie, Huang and Qin
24
Figure 8. Electricity Price and Capacity
Notes: Benchmark price data are from the website of the National Development and Reform Commission,
which adjusts benchmark price annually. Dots are raw data from 2004 through 2011. Lines are fitted values
for an individual year, respectively.
Figure 9. Overall Trajectories of Utilization Hours
Source: China Power Plant Annual Statistics.
02
04
06
0
Insta
lled C
apa
city(G
W)
200 300 400 500Electricity Price(yuan per thousand kwh)
raw data fitted value for 2004 2005
2006 2007 2008
2009 2010 2011
4000
4500
5000
5500
1994 1996 1998 2000 2002 2004 2006 2008 2010 2012Average Median U
tiliz
atio
n H
ou
rs
Environment for Development Xie, Huang and Qin
25
Figure 10. Provincial Trajectories of Utilization Hours
Notes: Firm level utilization hour data are collected from China Power Plant Annual Statistics from 1995
through 2011, in which 1996, 1999, and 2001 are missing. Provinces in the legend are ordered based on
their median utilization hours in 1995. Chongqing is at the end in the legend; however, this is only because
data on its hours for 1995 are missing.
Environment for Development Xie, Huang and Qin
26
Figure 11. Utilization Hours and Capacity
Notes: Firm level utilization hour data are collected from China Power Plant Annual Statistics from 1995
through 2011, from which 1996, 1999, and 2001 are missing. Provincial utilization hours are medians of
firm-level hours. Dots are provincial hours in the last year or the year before the last year if the last year
data are missing.
02
04
06
0
Insta
lled C
apa
city(G
W)
2000 4000 6000 8000Utilization Hours
raw data
fitted value
Environment for Development Xie, Huang and Qin
27
Table 1. Summary Statistics
Mean
Std.
Dev. Min Max Obs
Data
Source
Dept. Variable coal-fired power plant installed capacity (GW) 14.221 13.428 0.583 64.800 420 1
Factors
Endowment
Factors
coal reserve (billion ton) 10.385 21.690 0.000 106.151 270 2
investment on power grid (billion yuan) 16.320 18.737 0.263 124.482 270 1
cumulative investment on power grid (billion yuan) 59.387 79.607 0.263 530.751 270 4
Market Factors
electricity consumption (billion kWh) 84.453 75.793 0.003 439.902 420 3
GDP per capita (thousand yuan) 18.640 16.346 2.302 101.146 420 2
population (million) 42.980 26.351 5.028 105.049 420 2
rail coverage (thousand km) 2.506 1.532 0.080 9.200 420 2
Political
Factors
electricity price (yuan per thousand kwh) 347.025 65.181 227.000 506.000 240 5
utilization hours (hour per year) 4908.623 899.085 2059.000 7553.500 358 1
Notes: Data source: 1 - Compilation of Statistical Materials of Electric Power Industry, 2 - China Statistical Yearbook, 3 - China Energy Statistical Yearbook, 4 -
calculated. Number of observations: 30 provinces (including municipalities directly under the central government and autonomous regions) are included. Hong
Kong, Macao, Taiwan, and Tibet are excluded because data is lacking; years from 1998 through 2011 are covered, except that data before 2003 are not available
for coal resource, investment in power grid, water, and variables calculated from them, 5 - Provincial Development and Reform Commissions.
Environment for Development Xie, Huang and Qin
28
Table 2. Effects of Coal Endowment and Market Factors on Installed Capacity of Coal-Fired Power Plants
Dept. variable: Installed Capacity of Coal-fired Power Plants
(1) (2) (3) (4) (5) (6)
coal reserve 0.180*** 0.215***
0.200***
(0.052) (0.051)
(0.026)
investment on power grid
0.193
0.010
(0.172)
(0.192)
cumulative investment on
power grid
0.226***
0.079**
(0.057)
(0.033)
investment * cumulative
investment
-0.001**
-0.000
(0.001)
(0.000)
power consumption
0.159***
(0.015)
GDP per capita
0.284** 0.344*** 0.241**
(0.114) (0.111) (0.095)
population
0.371*** 0.331*** 0.269***
(0.062) (0.073) (0.065)
rail coverage
2.411* 1.525**
(1.309) (0.661)
Constant 7.650*** 5.736*** -0.387 -9.656*** -14.596*** -11.079***
(1.828) (1.233) (0.857) (3.063) (3.761) (3.774)
Observations 270 270 270 270 270 270
Rsquare 0.192 0.584 0.824 0.576 0.627 0.755
Notes: Mixed OLS. All specifications have year dummies. Standard errors are clustered at provincial level. *, **, ***
represent 10%, 5%, and 1% significance level.
Environment for Development Xie, Huang and Qin
29
Table 3. Effects of Electricity Price on Installed Capacity of Coal-Fired Power Plants
Dept. variable: Installed Capacity of Coal-Fired Power Plants
(1) (2) (3) (4) (5) (6)
price 0.072
(0.043)
price in the last year
0.079*
(0.044)
average price over time
0.079* 0.077* -0.020
(0.044) (0.041) (0.033)
coal reserve
0.207*** 0.220***
(0.030) (0.031)
investment on power grid
0.001 0.004
(0.202) (0.195)
cumulative investment on
power grid
0.071* 0.069*
(0.036) (0.035)
investment * cumulative
investment
-0.000 -0.000
(0.000) (0.000)
GDP per capita
0.273** 0.245**
(0.117) (0.096)
population
0.311*** 0.288***
(0.092) (0.072)
rail coverage
1.463* 1.553**
(0.782) (0.737)
Constant -9.801 -10.742 -14.553 -15.818 -6.291
-
12.317***
(12.922) (12.657) (14.501) (13.717) (9.247) (3.927)
Observations 210 210 210 240 240 240
Rsquare 0.133 0.142 0.143 0.174 0.760 0.758
Notes: Mixed OLS. All specifications have year dummies. Standard errors are clustered at provincial level. *, **, ***
represent 10%, 5%, and 1% significance level.
Environment for Development Xie, Huang and Qin
30
Table 4. Effects of Utilization Hours on Installed Capacity of Coal-Fired Power Plants
Dept. variable: Installed Capacity of Coal-Fired Power Plants
(1) (2) (3)
hours lagged one year 0.000 0.001 0.000
(0.001) (0.001) (0.001)
hours lagged two years 0.001 0.001 0.001
(0.000) (0.001) (0.001)
hours lagged three yeas 0.001 0.001 0.002***
(0.001) (0.001) (0.001)
average price over time
0.007
(0.037)
coal reserve
0.195***
(0.024)
investment on power grid
-0.048
(0.182)
cumulative investment on power grid
0.076**
(0.035)
investment * cumulative investment
-0.000
(0.000)
GDP per capita
0.228*
(0.120)
population
0.303***
(0.100)
rail coverage
1.828**
(0.797)
Constant -1.302 -0.279 -
32.383**
(7.639) (11.799) (15.556)
Observations 420 240 240
Rsquare 0.236 0.108 0.785
Notes: Mixed OLS. All specifications have year dummies. Standard errors are
clustered at provincial level. *, **, *** represent 10%, 5%, and 1% significance level.
Related Documents


![FOR THE VIRTUAL BATTLESPACE SYSTEM HYDROGEN – A ... · Lazarus development environment [6]. The compiler and the Lazarus development ... HYDROGEN – a development environment for](https://static.cupdf.com/doc/110x72/5be43a4209d3f233038ceef1/for-the-virtual-battlespace-system-hydrogen-a-lazarus-development-environment.jpg)