Embedded Systems Design and Development Chapter 12 Embedded Systems - Design and Development ............................................................................. 3 Things to Look For… ................................................................................................................... 3 12.0 Introduction .......................................................................................................................... 4 12.1 System Design and Development ....................................................................................... 6 12.1.1 Getting Ready – Start Thinking .................................................................................... 7 12.1.2 Getting Started ............................................................................................................. 8 12.2 Life Cycle Models ................................................................................................................ 9 12.2.1 The Waterfall Model ................................................................................................... 10 12.2.2 The V Cycle Model ..................................................................................................... 11 12.2.3 The Spiral Model ........................................................................................................ 13 12.2.4 Rapid Prototyping - Incremental ................................................................................. 14 12.3 Problem Solving................................................................................................................. 15 12.3.1 Five Steps to Design .................................................................................................. 15 12.4 The Design Process .......................................................................................................... 16 12.5 Identifying the Requirements ............................................................................................. 18 12.6 Formulating the Requirements Specification ..................................................................... 21 12.6.1 The Environment ........................................................................................................ 22 12.6.2 The System ................................................................................................................ 23 12.7 The System Design Specification ...................................................................................... 35 12.7.1 The System ................................................................................................................ 35 12.8 System Specifications versus System Requirements ....................................................... 50 12.8 System Specifications versus System Requirements ....................................................... 51 12.9 Partitioning and Decomposing a System........................................................................... 52 12.9.1 Initial Thoughts ........................................................................................................... 52 12.9.2 Coupling ..................................................................................................................... 55 12.9.3 Cohesion .................................................................................................................... 57 12.9.4 More Considerations .................................................................................................. 59 12.10 Functional Design ............................................................................................................ 59 12.11 Architectural Design......................................................................................................... 66 12.11.1 Hardware and Software Specification and Design................................................... 67 12.12 Functional Model versus Architectural Model .................................................................. 71 12.12.1 The Functional Model ............................................................................................... 72 12.12.2 The Architectural Model ........................................................................................... 72 12.12.3 The Need for Both Models ....................................................................................... 72 12.13 Prototyping....................................................................................................................... 73 Embedded Systems- A Contemporary Design Tool Copyright 2004 Oxford Consulting, Ltd. - 1 -

Welcome message from author
This document is posted to help you gain knowledge. Please leave a comment to let me know what you think about it! Share it to your friends and learn new things together.
Transcript

Embedded Systems Design and Development Chapter 12
Embedded Systems - Design and Development .............................................................................3
Things to Look For… ...................................................................................................................3
12.0 Introduction ..........................................................................................................................4
12.1 System Design and Development .......................................................................................6
12.1.1 Getting Ready – Start Thinking ....................................................................................7
12.1.2 Getting Started .............................................................................................................8
12.2 Life Cycle Models ................................................................................................................9
12.2.1 The Waterfall Model ...................................................................................................10
12.2.2 The V Cycle Model .....................................................................................................11
12.2.3 The Spiral Model ........................................................................................................13
12.2.4 Rapid Prototyping - Incremental.................................................................................14
12.3 Problem Solving.................................................................................................................15
12.3.1 Five Steps to Design ..................................................................................................15
12.4 The Design Process ..........................................................................................................16
12.5 Identifying the Requirements.............................................................................................18
12.6 Formulating the Requirements Specification.....................................................................21
12.6.1 The Environment ........................................................................................................22
12.6.2 The System ................................................................................................................23
12.7 The System Design Specification......................................................................................35
12.7.1 The System ................................................................................................................35
12.8 System Specifications versus System Requirements .......................................................50
12.8 System Specifications versus System Requirements .......................................................51
12.9 Partitioning and Decomposing a System...........................................................................52
12.9.1 Initial Thoughts ...........................................................................................................52
12.9.2 Coupling .....................................................................................................................55
12.9.3 Cohesion ....................................................................................................................57
12.9.4 More Considerations ..................................................................................................59
12.10 Functional Design ............................................................................................................59
12.11 Architectural Design.........................................................................................................66
12.11.1 Hardware and Software Specification and Design...................................................67
12.12 Functional Model versus Architectural Model..................................................................71
12.12.1 The Functional Model...............................................................................................72
12.12.2 The Architectural Model ...........................................................................................72
12.12.3 The Need for Both Models .......................................................................................72
12.13 Prototyping.......................................................................................................................73
Embedded Systems- A Contemporary Design Tool Copyright 2004 Oxford Consulting, Ltd. - 1 -

Embedded Systems Design and Development Chapter 12
12.13.1 Implementation.........................................................................................................73
12.13.2 Analyzing the System Design...................................................................................74
12.14 Other Considerations.......................................................................................................77
12.14.1 Capitalization and Reuse .........................................................................................77
12.14.2 Requirements Traceability and Management ..........................................................78
12.15 Archiving the Project........................................................................................................79
12.16 Summary .........................................................................................................................81
Embedded Systems- A Contemporary Design Tool Copyright 2004 Oxford Consulting, Ltd. - 2 -
Embedded Systems Design and Development Chapter 12
Chapter 12
Embedded Systems - Design and Development
Things to Look For…
• Things to consider in a design.
• The product life cycle.
• The five steps to design.
• The need to understand the environment and the system being
designed.
• The difference between requirements definition and specification.
• Motivation for and objective when partitioning a system.
• Coupling and cohesion and why they are important.
• The differences between functional and architectural models of a
system.
• Motivation for and timing of static and dynamic analysis of a design
• Capitalization and reuse of designs.
• Requirements traceability.
Embedded Systems- A Contemporary Design Tool Copyright 2004 Oxford Consulting, Ltd. - 3 -

Embedded Systems Design and Development Chapter 12
12.0 Introduction
In this chapter, we will study the major phases of the development process for embedded
systems. The more detailed aspects of that process will be explored in conjunction with
the design and test of the specific hardware and software elements of the system.
In this chapter, we will learn that design is the process of translating customer
requirements into a working system and that the complexity of contemporary systems
demands a formal approach and formal methods. Working from a formal specification of
a problem, we will look at ways of partitioning the system as a prelude to developing a
functional design. We will then examine the process of mapping functional model on to
an architectural structure and ultimately to a working prototype. To help to ensure the
robustness of the ultimate product, we will illustrate how to critically analyze the design
both during and after development.
We will also look at several other important considerations in the design lifecycle. These
will include intellectual property, component/module reuse, and requirements
management and the archival process.
As we begin to think about a new product or adding new features to an existing one, we
must look at things from many different points of view. The most important of these is
the customer’s since he or she finances the development of the product either directly
through an agreed upon contract or indirectly through a purchase. The best design of
little value if no one is willing to buy. So, we pose the question: What kinds of things
should be considered?
If we look at products, we must know how to measure costs and features. We must be
able to identify and distinguish between real and perceived needs. Too
often when we talk with customers about new products, the essential
“requirement” in the next generation product is that which was missing
when a problem arose this morning.
Technology
New
New
Old
Old
Market
It’s important to learn to make market and technology trade-offs.
Several years ago the following very simple table was proposed.
Taking old technology into and old markets is a reasonable and safe
Embedded Systems- A Contemporary Design Tool Copyright 2004 Oxford Consulting, Ltd. - 4 -

Embedded Systems Design and Development Chapter 12
strategy. These are the niche markets and often provide support and evolutionary growth
for products that are no longer in a vendor’s mainstream offering. Taking new
technology into new markets is difficult and risky. At the same time, the rewards can be
very high. The personal computer is a very good example. Xerox and Apple both had
limited success with their early offerings. The people and the full technology were
simply not ready. Taking new technology in to an existing area or existing technology in
to a new area is easier. At least one portion of the problem - the market or the technology
- is well understood and well developed.
We must understand the importance of deadlines and costs. Product development is
based upon a (directly or indirectly) negotiated contract between us and the customer(s).
Failure to respect development and delivery costs or schedules leads to loss of sales,
market share, and credibility.
We also must always consider reliability, safety, and quality in the products we design.
We will study these in great detail shortly. Beyond obvious need to work properly, the
product must be robust. That is, simply, ‘Does it do what it’s supposed to?’ and ‘How
does it behave with unexpected inputs?’ Robust means much more than this, however.
Robust also implies that the system performs even if it is partially damaged, or under
extreme temperature conditions, or if it’s dropped. If a product does what it’s supposed to
do but is fragile and buggy, the product is not robust.
The documentation we produce to accompany the product must be clear and
understandable. The product must be easy to use - intuitive rather than counter-intuitive.
Post sales support, including the correction of bugs, is very important. Lack of quality
has two costs. The first cost is obvious and immediate, the cost to repair, which is often
small. The second a hidden cost, the loss of customer confidence and sales, can be very
large. Once confidence lost very difficult to regain.
Embedded Systems- A Contemporary Design Tool Copyright 2004 Oxford Consulting, Ltd. - 5 -
Embedded Systems Design and Development Chapter 12
A Simple Example:
Years ago, when developing some of the early microprocessor based embedded systems, we would encounter problems as we debugged the hardware and software. At that time, tools were few and far between. This was a new field.
One very powerful tool for helping to track down such problems is called a logic analyzer. It allows one to follow which instructions the processor is executing (in real-time) and learn why stuff goes in and never comes out. We had to have one, so, our company purchased two of them from two different vendors.
The analyzer from vendor A arrived was out of the box, on the bench, connected to the system, and making useful measurements within 10-15 minutes. Only several days later did anyone think to take a look at the manual. The analyzer from vendor B had a user interface that rivaled a 1040 tax form. Its one-inch thick manual was equally cryptic and demanded several hours of study before even the simplest measurements could be made.
Guess which instrument always has a queue of people waiting to use it and guess which vendor sold us many more instruments.
12.1 System Design and Development
System design and development is a challenging problem. What makes it fun and
exciting is that there is a very large creative component to it. There are no rules, no steps
to follow to make one creative. There is, however, a large collection of rules to ensure
the opposite. Consider a new child. Each comes into this world, eyes wide open with a
million questions. Why is the sky blue? Why is the sun yellow? Why can’t we see the
air? Where does air come from anyway? What do we do? We put them in school. We
teach them the rules. Walk into any group of little ones and ask, how many of you can
sing? How many of you can draw? Almost every tiny hand leaps up. Go into any
similar group of adults and ask the same questions. Everyone is suddenly fascinated with
their shoes. One hand may come slowly up. Why? We place too many restrictions on
our thinking. Sure, we may need 10 million dollars worth of electronic equipment to give
our voice perfect pitch, but, so what. We need to remove artificial restrictions that we
impose on our thinking.
Embedded Systems- A Contemporary Design Tool Copyright 2004 Oxford Consulting, Ltd. - 6 -

Embedded Systems Design and Development Chapter 12
Look at the little ones drawing or coloring. What do we tell them? No, people aren’t
purple. Cows can’t fly. Fish don’t have legs - anymore. Oh, and by the way, always
color in the lines….and let’s also learn how to be creative.
12.1.1 Getting Ready – Start Thinking
Ok, let’s start. Driving is always a good place to begin. The rules are easy. Keep the
yellow line on your left and the white on your right – except in Britain and several other
places. Now the chance to be creative. In the autumn in the northern parts of the world,
the days are warm, but, the nights start getting colder. Often there is a bit of fog that
makes an appearance as well. By the morning, the fog and chill have combined to give a
very fine glaze of ice on the road. We call this black ice; it gives us the opportunity to be
creative. Hop in the car and race out onto the road. What’s this nonsense about staying
in the lines?
Now perhaps we’ve decided that maybe we can be just a little creative, let’s begin to
explore. As we begin thinking about a new design, we’ll discover that there are a lot
of things to be considered. The problem may not always be what it seems at first
blush. Roger van Oech in A Whack on the Side of the Head, Warner Brooks, says
"Always look for the second right answer.” He’s right. As we begin, it’s important
to understand the problem to make sure that we are solving the right problem.
Consider the adjacent figure. Which one is the correct image? Is it the old lady or the
young one?
When we begin trying to solve a problem, it’s important to talk with everyone involved;
to listen to different opinions; to see how the design might affect the people who have to
work with it. We have to take the time to look at different views of the problem; to look
at it from both the inside and the outside. Based upon our view, we can
have a couple of different interpretations of the following problem. Are we
building a goblet or are we building two statues?
Embedded Systems- A Contemporary Design Tool Copyright 2004 Oxford Consulting, Ltd. - 7 -

Embedded Systems Design and Development Chapter 12
There will always be occasions in which we have too much information, too many
opinions, or too many details. Remember the old expression of not being able to see the
forest for the trees. The same holds true as we begin trying to understand a
problem during the early stages of a design. Look at this next drawing. What do
you see? An interesting design; it looks perhaps like a snowflake. This is a case in
which we have too much information.
Let’s remove some of the information – if we take a more abstract view of the
problem, the solution is easier to see.
Now that we have a start, let’s look at the design problem. Let’s look at
each design as a chance to explore.
12.1.2 Getting Started
Designing and developing embedded systems does raise some interesting challenges and
does require a large number of decisions. Some of those decisions require knowledge
about the problem, others about the tools and techniques that may be available, and still
others choose methods for approaching the solution. There will often be still more things
to think about that are not related to the technical part of the problem at all. The
collection of these things that we do as we move from requirement to application is often
called the product life cycle.
Like so many other things in life, there are probably as many different product life cycle
models as there are people designing these systems. Who said there isn’t any creativity?
Each of these models has its supporters and each also has it group of detractors. The goal
in the next few pages is to introduce some of the more important things that one should
think about when executing a design, present several of the more common life cycle
models, and to present some guidelines for things that have worked on successful
projects. Despite what they tell you, there are no hard and fast rules. Oops, I lied. There
are three: learn a lot with each project, have fun, and do the job right…to the best of your
ability. Let’s get started.
Embedded Systems- A Contemporary Design Tool Copyright 2004 Oxford Consulting, Ltd. - 8 -

Embedded Systems Design and Development Chapter 12
12.2 Life Cycle Models
The product life cycle of an embedded application is purely a descriptive representation.
It breaks the development process into a series of interrelated activities. Each activity
plays a role of transforming its input (specification) into an output (a selected solution).
The organization of the steps is done according to a design process model – the life cycle
model. Formality in design provides the structure for a development that lets one
creatively explore the design while using the tools to manage some of the more
mechanical issues. We use the structure as an aid rather than something that encumbers
design.
As we’ve commented already, in the related literature, one can find that a variety of
different approaches and models have been suggested. At the end of the day, all have the
same basic goal; they all have similar phases. Perhaps, we could more accurately say that
they all have similar needs or goals or objectives. These needs are very simple,
• Find out what the customer wants
• Think of a way to give them what they want
• Prove what you’ve done by building and testing it
• Build a lot of them to prove that it wasn’t an accident
• Use the product to solve the customer’s problem
Several of the historically more common models or approaches include,
• Waterfall
• V Cycle
• Spiral
• Rapid Prototype
Today, we are continually developing new ones. Which ever model one chooses, the
most important point is to understand the meaning and intent or objective of each of the
phases or steps in the process. Understand the deliverables for each step as well as the
necessary outputs and inputs that are required to move, conclude, or to enter each phase
Embedded Systems- A Contemporary Design Tool Copyright 2004 Oxford Consulting, Ltd. - 9 -

Embedded Systems Design and Development Chapter 12
in the selected model. Then follow those – don’t take shortcuts. We’ll look briefly at
each of these four models momentarily. Before we do so, let’s look
at another model that fits just about any phase of engineering; it
looks something like that in the accompanying figure.
This is called the hockey stick model or curve; its shape is strongly
suggestive of where the name came from. We’ve talked about how
important it is to address reliability and safety early in the
requirements specification and design phases of the life cycle. The hockey stick curve
provides an intuitive feel as to why. If we label the horizontal axis as time and the
vertical one as cost, and apply it here, we see that the longer we delay in addressing those
issues, the greater the cost will be. Cost is not constrqained to be money alone.
Let’s begin with the Waterfall model. Use your artistic creativity here. Its name evokes
its sound which evokes the philosophy and approach engendered in the model.
12.2.1 The Waterfall Model
The Waterfall model represents a cycle; a series of steps appearing much like a waterfall,
sequentially, one below the next as we see in the following figure.
Specification
PreliminaryDesign
Detailed Design
Implementation
Review and Revise
Review and Revise
Review and Revise
Review and Revise
Embedded Systems- A Contemporary Design Tool Copyright 2004 Oxford Consulting, Ltd. - 10 -

Embedded Systems Design and Development Chapter 12
The steps are given as,
• Specification
• Preliminary Design
• Design review
• Detailed Design
• Design review
• Implementation
• Review
Together, these capture each of the needs that we identified earlier. Successive steps are
linked in a chained manner. Such a linking tends to say: Complete this phase and go on
to the next.
Observe that each phase is also connected back to the previous phase. That reverse
connection provides an essential verification link backwards to ensure that the solution
(in its current form) agrees with and follows from the specification. With the Waterfall
model, the recognition of problems can be delayed until later states of development
where the cost of repair is higher (the hockey stick curve). The Waterfall model is
limited in the sense that it does not consider the typically iterative nature of real world
design.
12.2.2 The V Cycle Model
The V Cycle is similar to the Waterfall model except that it places greater emphasizes on
the importance of addressing testing activities up front instead of later in the life cycle.
Each stage associates the development activity for that phase with a test or validation at
the same level. Each test phase is identified with its matching development phase as we
see in the following figure.
In the diagram, we have
• Requirements ↔ System/Functional Testing
• High-Level Design ↔ Integration Testing
• Detailed Design ↔ Unit Testing
Embedded Systems- A Contemporary Design Tool Copyright 2004 Oxford Consulting, Ltd. - 11 -
Embedded Systems Design and Development Chapter 12
Requirements
Decomposition
SystemSpecification
PreliminaryDesign
Detailed Design
Code
System Test
SystemIntegration
PerformanceTest
Integration Test
Unit Test
Specification Test and EvaluationDesign and Development Implementation and Maintenance
Verification and Validation
Verification
Specification
Design
Validation
Implementation
Verification
Verification
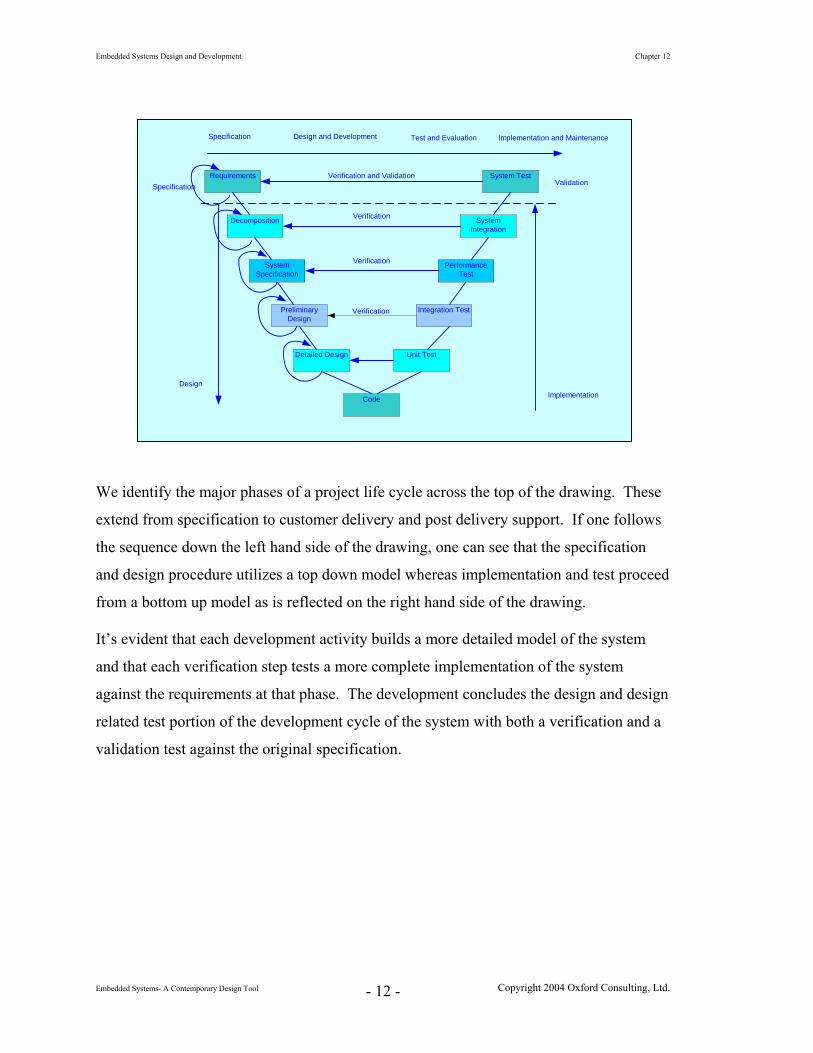
We identify the major phases of a project life cycle across the top of the drawing. These
ed
It’s evident that each development activity builds a more detailed model of the system
esign
extend from specification to customer delivery and post delivery support. If one follows
the sequence down the left hand side of the drawing, one can see that the specification
and design procedure utilizes a top down model whereas implementation and test proce
from a bottom up model as is reflected on the right hand side of the drawing.
and that each verification step tests a more complete implementation of the system
against the requirements at that phase. The development concludes the design and d
related test portion of the development cycle of the system with both a verification and a
validation test against the original specification.
Embedded Systems- A Contemporary Design Tool Copyright 2004 Oxford Consulting, Ltd. - 12 -
Embedded Systems Design and Development Chapter 12
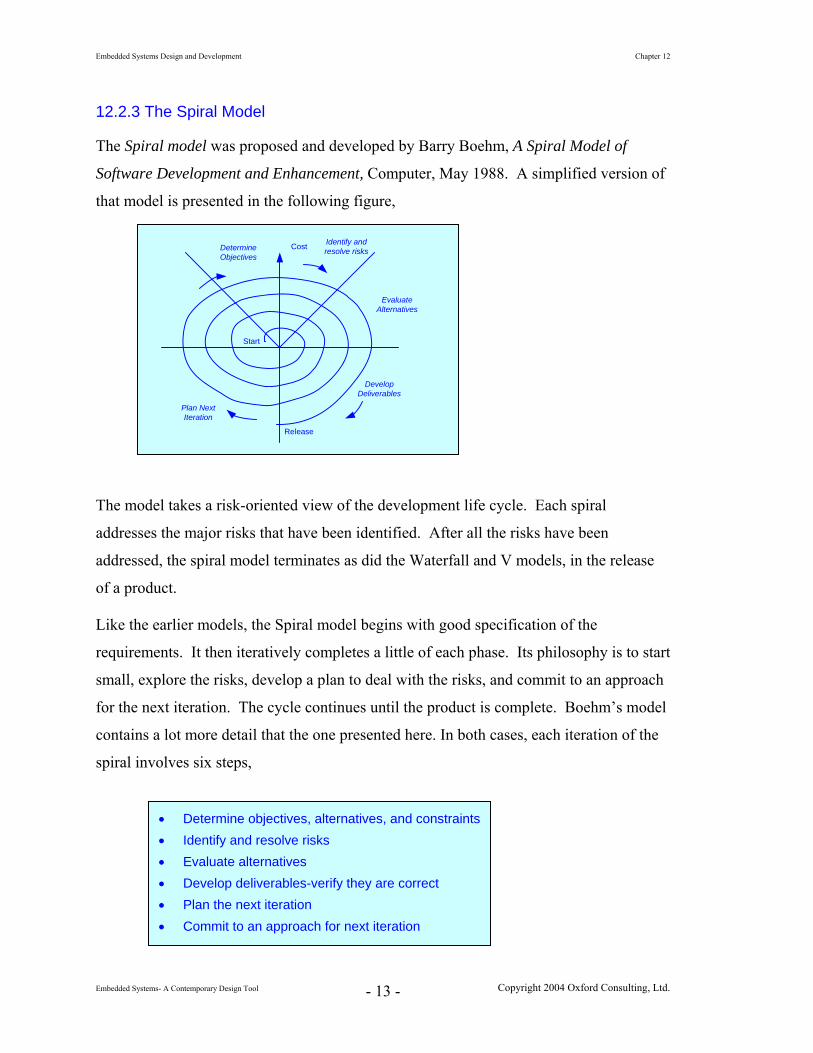
12.2.3 The Spiral Model
The Spiral model was proposed and developed by Barry Boehm, A Spiral Model of
Software Development and Enhancement, Computer, May 1988. A simplified version of
that model is presented in the following figure,
Cost Identify andresolve risks
Plan NextIteration
EvaluateAlternatives
DetermineObjectives
DevelopDeliverables
Start
Release
The model takes a risk-oriented view of the development life cycle. Each spiral
addresses the major risks that have been identified. After all the risks have been
addressed, the spiral model terminates as did the Waterfall and V models, in the release
of a product.
Like the earlier models, the Spiral model begins with good specification of the
requirements. It then iteratively completes a little of each phase. Its philosophy is to start
small, explore the risks, develop a plan to deal with the risks, and commit to an approach
for the next iteration. The cycle continues until the product is complete. Boehm’s model
contains a lot more detail that the one presented here. In both cases, each iteration of the
spiral involves six steps,
• Determine objectives, alternatives, and constraints• Identify and resolve risks • Evaluate alternatives • Develop deliverables-verify they are correct • Plan the next iteration • Commit to an approach for next iteration
Embedded Systems- A Contemporary Design Tool Copyright 2004 Oxford Consulting, Ltd. - 13 -
Embedded Systems Design and Development Chapter 12
The Spiral model is an improvement on the Waterfall and V models because it provides
for multiple builds as well as several opportunities for risk assessment and for customer
involvement. However it is elaborate, difficult to manage, and does not keep all
developers occupied during all of the phases.
12.2.4 Rapid Prototyping - Incremental
The Rapid Prototyping model is intended to provide a rapid implementation (hence the
name) of high level portions of both the software and the hardware early in the project.
The approach allows developers to construct working portions of the hardware and
software in incremental stages. Each stage consists of design, code and unit test,
integration test, and delivery. At each stage through the cycle, one incorporates a little
more of the intended functionality.
The prototype is useful for both the designers and for the customer. For the designer, it
enables the early development of major pieces of the intended functionality of system.
By doing so, it helps to establish and verify the structural architecture as well as the
control flow through the system. Such an approach permits one to identify major
problems early (the hockey stick curve again).
The customer benefits by having the opportunity to work with a functional unit much
earlier in the development cycle than with any of the three previous models. The
customer can use the prototype in the intended context to provide feedback to the
designers about any problems with the design.
Such feedback is a critical aspect of the approach because it encourages backwards or
reverse flow through the process. It can be used to refine or change the prototype to
correct the identified problems and to ensure that the design meets the real needs of the
customer.
The prototype can be either evolutionary or throw away. It has the advantage of having a
working system early in the development process. As noted, problems can be identified
earlier and it provides tangible measures of progress. To be effective, however, the rapid
prototyping approach requires careful planning both at both the project management level
and the designer’s level.
Embedded Systems- A Contemporary Design Tool Copyright 2004 Oxford Consulting, Ltd. - 14 -
Embedded Systems Design and Development Chapter 12
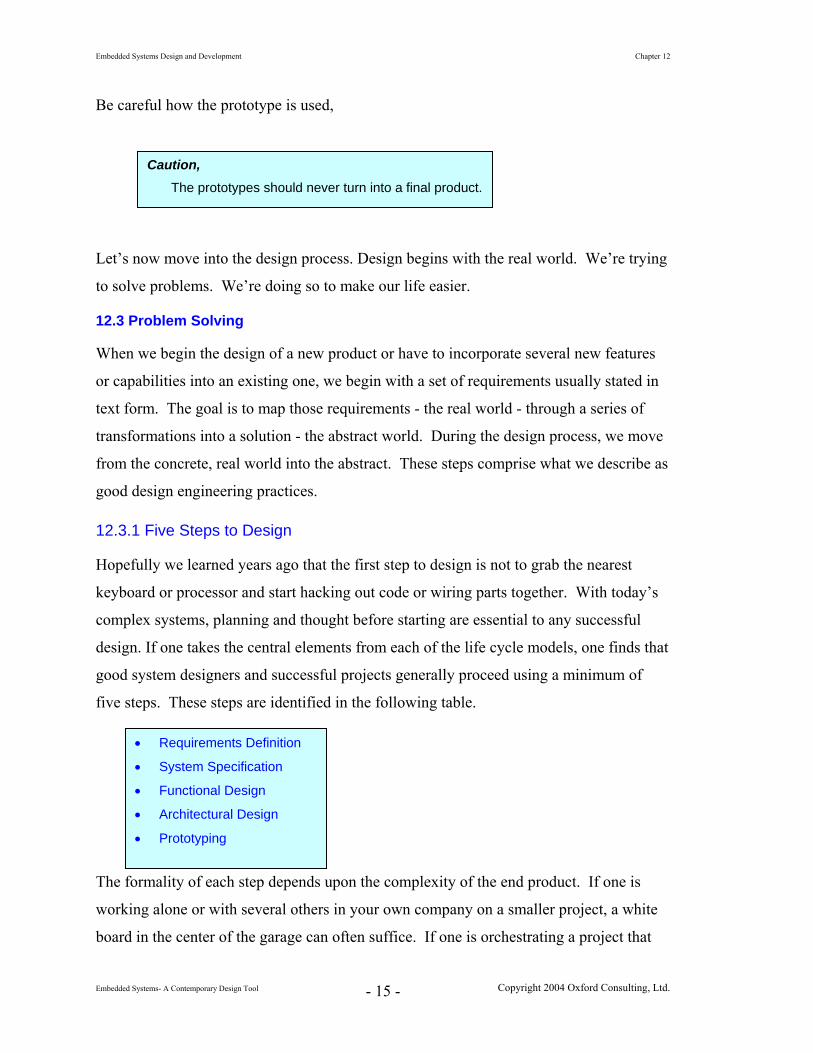
Be careful how the prototype is used,
Caution, The prototypes should never turn into a final product.
Let’s now move into the design process. Design begins with the real world. We’re trying
n of a new product or have to incorporate several new features
12.3.1 Five Steps to Design
that the first step to design is not to grab the nearest
y’s
hat
The formality of each step depends upon the complexity of the end product. If one is
e
to solve problems. We’re doing so to make our life easier.
12.3 Problem Solving
When we begin the desig
or capabilities into an existing one, we begin with a set of requirements usually stated in
text form. The goal is to map those requirements - the real world - through a series of
transformations into a solution - the abstract world. During the design process, we move
from the concrete, real world into the abstract. These steps comprise what we describe as
good design engineering practices.
Hopefully we learned years ago
keyboard or processor and start hacking out code or wiring parts together. With toda
complex systems, planning and thought before starting are essential to any successful
design. If one takes the central elements from each of the life cycle models, one finds t
good system designers and successful projects generally proceed using a minimum of
five steps. These steps are identified in the following table.
• Requirements Definition
• System Specification
• Functional Design
• Architectural Design
• Prototyping
working alone or with several others in your own company on a smaller project, a whit
board in the center of the garage can often suffice. If one is orchestrating a project that
Embedded Systems- A Contemporary Design Tool Copyright 2004 Oxford Consulting, Ltd. - 15 -
Embedded Systems Design and Development Chapter 12
includes developers, manufacturers, and regulations in several countries around the
world, (which is becoming increasingly common today) the need for formality increa
When working with each of these phases of a product life cycle, one must remember that
they are guidelines; collective best practices. They are not a checklist to a successful
project; and they are not exhaustive.
Today the contemporary design proce
ses.
ss must also enforce IP (intellectual property),
he
roduct development cycle, we will walk through each of
step.
rnal behavior of the
will
at of decomposing and refining
capitalization and reuse at every design stage. The days of Bob Widler (the father of t
op amp) lecturing about integrated circuit design in the bars of Silicon Valley are long
gone. One must also consider traceability in both the forward and reverse directions.
Traceability captures the relationships between requirements and all subsequent design
data and helps in managing requirements changes.
12.4 The Design Process
As we begin to explore the p
these five steps. Rather than focus on how one particular model approaches the
interpretation of these steps, we will try to identify the essential elements of each
The approach that we will present is top down and iterative.
The first two steps focus on capturing and formalizing the exte
system. The remaining three move inside the system and repeat the process for the
internal implementation that gives rise to the desired and specified behavior. As we
do from the outside, on the inside, we will move from the general to the specific,
capturing and specifying the each aspect of the design.
A major task, once we move inside the system, will be th
the design from a nebulous entity that someone needs into the product that implements
that need. We will first decompose (organize) the collection of customer’s wishes into
functional blocks that are then mapped into an architecture. That architecture provides
the aggregate of hardware and software modules that will make up the ultimate system.
The final step in the design cycle is that of bringing the design together into a prototype
and ultimately into production.
Embedded Systems- A Contemporary Design Tool Copyright 2004 Oxford Consulting, Ltd. - 16 -
Embedded Systems Design and Development Chapter 12
Because there is not one right answer, the problem represents a challenge and an
opportunity to be creative. A colleague who worked on numerous designs of a particular
piece of measurement technology once said, ‘although each design performs exactly the
same function, each also represents an opportunity to explore a new approach that is
better than the old.’ That colleague built a career around doing what everyone else said
couldn’t be done…including some of the top names in the industry.
One of the best ways to learn how to do something it is simply to do it. So, let’s get
started. As we walk through each of the steps in the design process that we’ve identified,
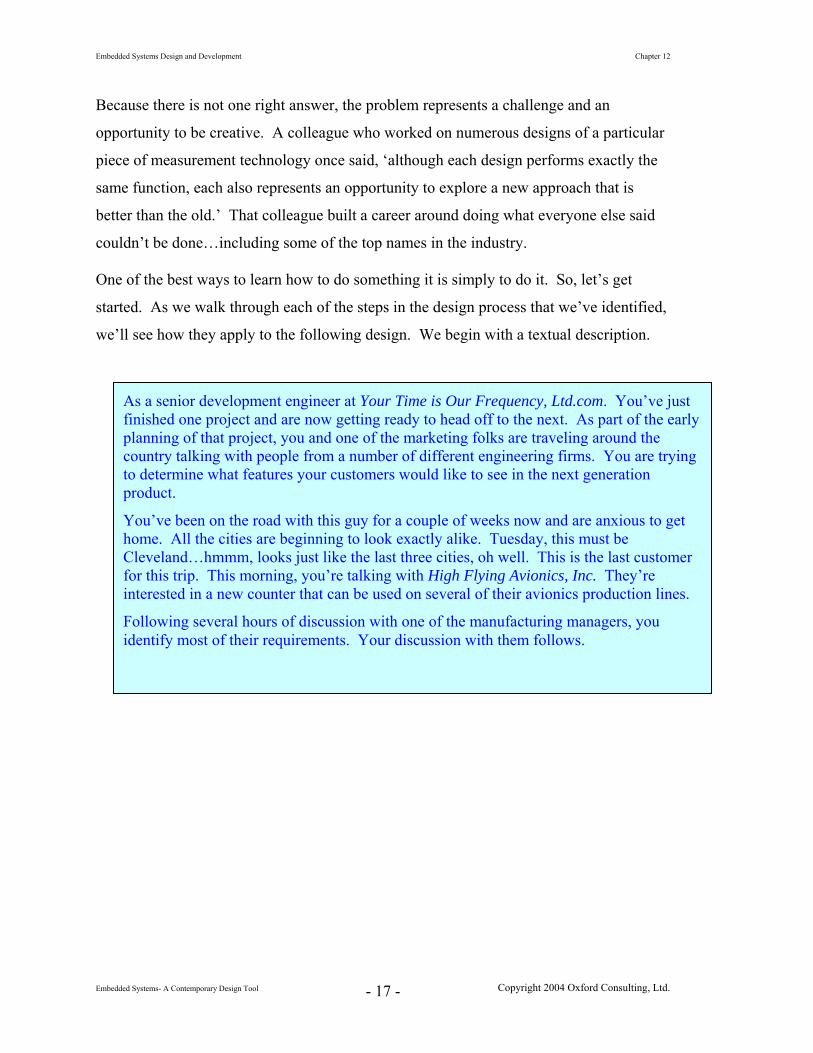
we’ll see how they apply to the following design. We begin with a textual description.
As a senior development engineer at Your Time is Our Frequency, Ltd.com. You’ve just finished one project and are now getting ready to head off to the next. As part of the early planning of that project, you and one of the marketing folks are traveling around the country talking with people from a number of different engineering firms. You are trying to determine what features your customers would like to see in the next generation product.
You’ve been on the road with this guy for a couple of weeks now and are anxious to get home. All the cities are beginning to look exactly alike. Tuesday, this must be Cleveland…hmmm, looks just like the last three cities, oh well. This is the last customer for this trip. This morning, you’re talking with High Flying Avionics, Inc. They’re interested in a new counter that can be used on several of their avionics production lines.
Following several hours of discussion with one of the manufacturing managers, you identify most of their requirements. Your discussion with them follows.
Embedded Systems- A Contemporary Design Tool Copyright 2004 Oxford Consulting, Ltd. - 17 -
Embedded Systems Design and Development Chapter 12
Business is a little slow right now and money is tight, so we don’t have a large budget to purchase a lot of different new instruments. In fact, ideally, we’d like to be able to use the same instrument on several of our lines.
Today, we have our technicians running most of the tests manually, but, in future, we’d like to be able to automate as many of these tests as we can. As we upgrade our systems, we’d like to be able to operate several of these counters remotely from a single PC. Here are some of the other things that we’d like to be able to do.
As part of our ongoing efforts to improve production and flow through our lines, we monitor the rate at which units arrive into each of the major assembly areas. To do that, we need to be able to track how many of our navigation radios come down a production line each hour. Because we support small quantity builds of different kinds of radios, the rate at which the units come past the monitoring points is not constant. As each radio arrives at an entry point, it breaks an IR beam. On most of the lines, breaking the beam generates a 1 μsec wide, negative going 5.0 V pulse. However, we do have several older lines that we must still support. On these, the pulse is positive going.
On several of the newer lines, we have to measure frequency up to 150.000 MHz. We also have several tests for which we must measure frequencies in the range of 50KHz ± 0.001 KHz and 100 Hz with 0.001 Hz resolution. On another line, we have several instruments with output signals that have a duration up to 1.0000 ± 0.0001ms and others that have a duration of up to 9.999 to 10.000 ms and up to 1.000 ± 0.001sec. These signals are not periodic. Finally, we have several periodic signals on those same units that we must be able to measure with the same accuracy and resolution.
12.5 Identifying the Requirements
The development of any kind of well conceived and well designed system must begin
with a requirements definition. Such a need holds, independent of the life cycle model
that one chooses to work with. Unlike the people
in the accompanying drawing paraphrased from an
unknown author, we cannot begin a design until
we know what we are supposed to be designing.
The goal of the requirements identification process
is to capture a formal description of the complete
system from the customer’s point of view then to
document these needs as written definitions and
Embedded Systems- A Contemporary Design Tool Copyright 2004 Oxford Consulting, Ltd. - 18 -

Embedded Systems Design and Development Chapter 12
descriptions. Such documentation forms the subsequent basis for the formal design
specification.
Very often, we use the natural language of the customer and of the application context.
We do so because such a formal expression of the requirements forces the early
discussion and resolution of many complex problems, involving a variety of people with
expertise in many different areas; particularly those who are knowledgeable in the
application domain. We express the role that the requirements definition plays between
the customer and those who execute the design with the
accompanying simple graphic. Customer
RequirementsDefinition
The Design Process
The requirements definition provides the interface between the
customer and the engineering process. It is the first step in
transforming the customer’s wishes into the final product. One can
see, then, that the requirements definition is a description of
something that is wanted or needed. It identifies and captures a set of
required capabilities or operations. As one begins to identify all the
requirements, it’s important to consider both the system to be
designed and the environment in which it is to operate.
At this early stage in the product life cycle, the goal is to capture and express purely
external views of the environment, the system, and their interaction. With respect to the
system, one refers to such a view as its public interface. One tries to identify what needs
to be done (and how well it needs to be done) starting with the user’s needs and
requirements.
The first view of the environment and of the system takes the following form. It’s
evident that the environment surrounds the system. The
inputs to and outputs from the system can come from or go to
anywhere in the environment. As one begins, one should
make no assumptions about the extent of either. System
EnvironmentThe first step is to abstract and consolidate that view such that
both appear as the black boxes seen below.
Embedded Systems- A Contemporary Design Tool Copyright 2004 Oxford Consulting, Ltd. - 19 -
Embedded Systems Design and Development Chapter 12
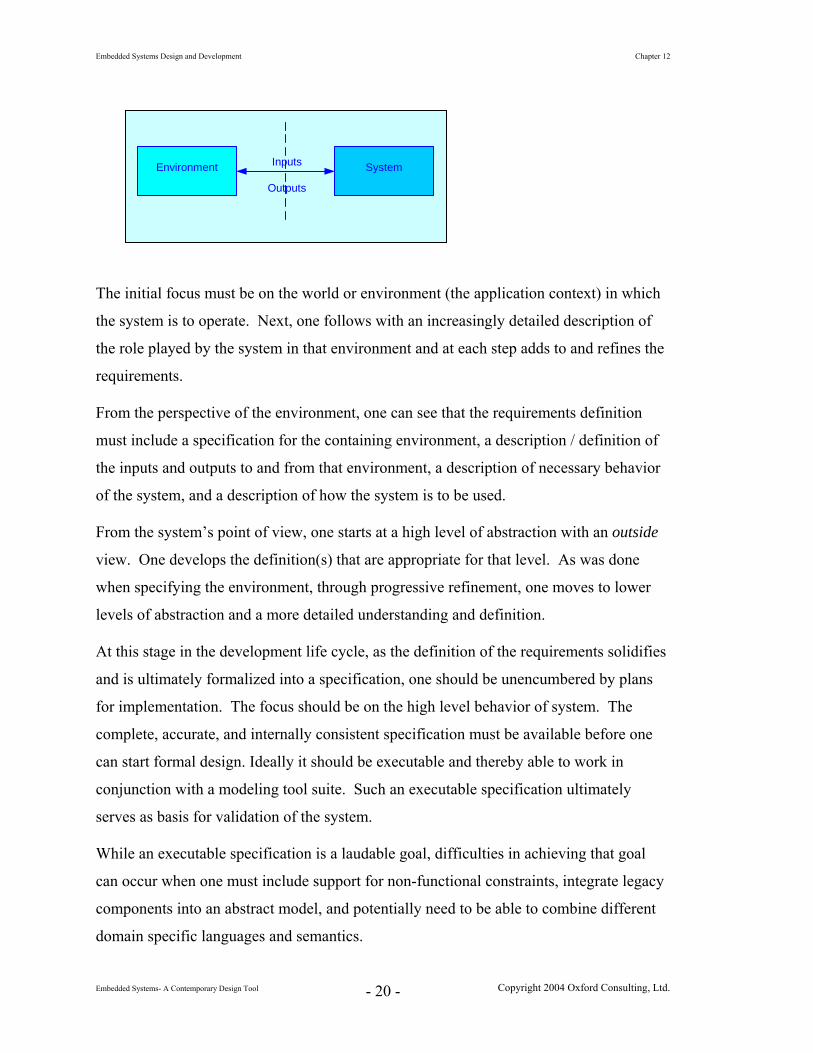
Environment SystemInputs
Outputs
The initial focus must be on the world or environment (the application context) in which
e
From the perspective of the environment, one can see that the requirements definition
f
From the system’s point of view, one starts at a high level of abstraction with an outside
r
At this stage in the development life cycle, as the definition of the requirements solidifies
e
While an executable specification is a laudable goal, difficulties in achieving that goal
y
domain specific languages and semantics.
the system is to operate. Next, one follows with an increasingly detailed description of
the role played by the system in that environment and at each step adds to and refines th
requirements.
must include a specification for the containing environment, a description / definition o
the inputs and outputs to and from that environment, a description of necessary behavior
of the system, and a description of how the system is to be used.
view. One develops the definition(s) that are appropriate for that level. As was done
when specifying the environment, through progressive refinement, one moves to lowe
levels of abstraction and a more detailed understanding and definition.
and is ultimately formalized into a specification, one should be unencumbered by plans
for implementation. The focus should be on the high level behavior of system. The
complete, accurate, and internally consistent specification must be available before on
can start formal design. Ideally it should be executable and thereby able to work in
conjunction with a modeling tool suite. Such an executable specification ultimately
serves as basis for validation of the system.
can occur when one must include support for non-functional constraints, integrate legac
components into an abstract model, and potentially need to be able to combine different
Embedded Systems- A Contemporary Design Tool Copyright 2004 Oxford Consulting, Ltd. - 20 -

Embedded Systems Design and Development Chapter 12
12.6 Formulating the Requirements Specification
Let’s now examine some of the things that one should think about when starting to
fine them in a formal specification.
ule
r’s
and formalizing the requirements.
rs,
cess.
ly on
the
he environment is interacting with the
s.
t alone
of
identify and capture the requirements then trying to de
The form, extent, and formality of such a specification depends upon the project on
which one is working, the target audience, and the company for which one is working.
Remember, too, that it is a product that is being delivered, not a pile of paper. As a r
of thumb, the specification should be the absolute minimum necessary to capture and
clearly identify all of the necessary requirements.
In capturing requirements, one strives to be very specific about the details from the use
point of view. Bear in mind that one is identifying
One still cannot begin to design until the specification has been completed and the
customer has agreed to it. Remember, too, one should not be discussing microprocesso
memory, peripheral chips, or software modules at this point in the development pro
As one begins the designs, one usually has some general ideas, casual discussion,
thoughts, but nothing firm. One can use these as a guide in directing the steps, but one
can’t design from them. It’s important to be careful, however, not to rely too heavi
preconceived ideas. One should always be open to alternative approaches. Starting to
code or draw logic diagrams at this point is inviting major problems as the project
proceeds. In all likelihood, the project will fail.
For the environment, one must establish a description of all relevant entities and of
behaviors of all activities. One must know how t
system and the effects on the environment by the outputs from the system. For the
system, one requires a description of all inputs and outputs as well as a complete
description of the functional and operational behaviors and technological constraint
One can naturally ask at this juncture, how can one get such information about (le
model) the system and the environment without describing or knowing implementation
the system? The internals are inherently unknown at this point. How does one capture
the desired behaviors?
Embedded Systems- A Contemporary Design Tool Copyright 2004 Oxford Consulting, Ltd. - 21 -
Embedded Systems Design and Development Chapter 12
12.6.1 The Environment
A reasonable first step begins with defining and describing the environment; the world in
ate. The environment is a temporal world; it is a
.
consists of the entity’s inputs and outputs as
e entity is or does. The description
should present the nature of the entity. Is it data, an event, a state variable, a
raft or the clear air turbulence that must be accounted for in
• Res actions the environment expected to perform. The
hydraulic system moving the rudder is part of the environment. Its action or
• Rel
which the system must oper
heterogeneous collection of entities of one form or another. It comprises the collection of
physical devices to which the system is interconnected as well as any physical world
attributes that the system is intending to measure or control or that can have an affect on
the system. The initial goals in understanding the environment are to identify all relevant
entities then characterize their affects on the system and vice versa. When the
requirements specification has been completed, one should have all the necessary
information about such entities with sufficient detail to support solving the problem
12.6.1.1 Characterizing External Entities
Each of the entities that make up the environment is characterized by a name and an
abstracted public interface. That interface
well as its functional behavior. The specification of the external environment should
contain the following for each entity,
• Name and description of the entity The name should be suggestive of what th
message etc.?
As an example, an entity may be something that is to be controlled such as the
rudder on an airc
such a control system.
ponsibilities – Activities What are the activities or
responsibility is to move the rudder in response to the signal coming from the
system being designed.
ationships
Embedded Systems- A Contemporary Design Tool Copyright 2004 Oxford Consulting, Ltd. - 22 -

Embedded Systems Design and Development Chapter 12
What are the relationships between the entity and its responsibilities or
a
• Safety and Reliability
ues must be included early in the specification
focus
er whose
12.6.2 The System
’s point of view. The same questions posed for the
e of
12.6.2.1 Characterizing the System
the identification of inputs and outputs.
l world through the entities described and defined in the
en
For each such I/O variable the following information is already available,
The Name of the signal
n input or output
tate variable, etc.
activities? Is that relationship causal or responding? Is it a producer or
consumer?
Safety and reliability iss
process. With respect to the environment, at the requirements stage, the
is primarily on safety. The goal is to identify all safety critical issues and
hazards so that they can be addressed in detail in the system design
specification. One should also identify any regulatory agencies und
auspices the system will operate.
Next, focus shifts to the system
environment are now asked about the system. As with the characterization of the
environment, the initial goals are to identify all of the aspects of the public interfac
the system then characterize their affects on the environment and vice versa.
Characterization of system begins with
• System Inputs and Outputs The system interacts with rea
environmental characterization. The inputs to the system are the outputs from
environmental entities and the outputs from the system are the inputs to the
environmental entities. One can easily see that the system I/O has already be
characterized in environmental entity specification
The use of the signal as a
The nature of the signal as an event, data, s
Embedded Systems- A Contemporary Design Tool Copyright 2004 Oxford Consulting, Ltd. - 23 -

Embedded Systems Design and Development Chapter 12
Working with the environment specification, one can write the structure, domain of
validity, and physical characteristics of each signal. To these, one can add any
technical or technological constraints that are identified.
• Responsibilities – Activities
As was done with the specification of the environment, focus now turns to the
function that the system is intended to perform. Before it’s designed, the system
appears as a black box. It can only be viewed from external point of view. A section
on functional behavior is now included in the specification.
The functional description defines the external behavior of the system. It gives a
characterization of the affects of the system outputs on the environmental entities and
the system’s intended response to inputs from the environmental entities. It
elaborates how the system is used and to be used by user. Such a specification is
equivalent to developing a model of the system.
The functional description can be captured in a variety of ways. One effective
approach is to use the UML tools discussed earlier. One can construct one such view
through use case and class diagrams. Another view can be gained through high level
state charts and activity diagrams; data and control flow diagrams commonly used in
structured design methodologies give a third.
As one formulates these diagrams and the specification, care must be taken to ensure
that the specified (and ultimately modeled) states are appropriate to the application.
One must make certain that the actions that are captured in the specification
accurately reflect the desired (external) behavior of the system as perceived and
intended by the customer. In the specification, one must ensure that the conditions or
constraints on its behavior are only a function of the inputs coming into the system,
the specified states, the internal events, and the appropriate time demarcation (relative
or absolute).
• Safety and Reliability
In formulating the safety and reliability requirements for the system, the focus is on
the high level objectives of each and on the strategy for achieving those goals.
Embedded Systems- A Contemporary Design Tool Copyright 2004 Oxford Consulting, Ltd. - 24 -

Embedded Systems Design and Development Chapter 12
The safety considerations should address
Safety guidelines, rules, or regulations under the governing agencies identified
under the environment portion of the specification.
With respect to reliability, one can specify
The system uptime goals Potential risks, failures, and failure modes Failure management strategy
Example
Starting from the trip report from High Flying Avionics, Inc., which discussed their
needs for a new counter, let’s put the requirements specification together.
As a first step in the thought process, one extracts and summarizes the essential
information from the trip report. By doing so, one can begin to focus on what should
be included in the requirements specification. From the discussions with the
customer, a high level sketch of the system and the environment captures the essential
parts of the problem. The next step is to begin to formalize the model of the system
and the environment.
NavagationRadio Counter Computer
(Future)
Factory
User
In its initial configuration, the environment contains,
• A set of navigation radios which are to be tested
Sig s navigation radio to the counter, but, not the reverse. The
factory has inputs to the counter as well; these include the power system and the
• The user who is doing the testing
• The factory
nal flow from the
Embedded Systems- A Contemporary Design Tool Copyright 2004 Oxford Consulting, Ltd. - 25 -

Embedded Systems Design and Development Chapter 12
ambient environment in the factory. The user’s interaction is bidirectional. The
must select and configure the measurement to be made and then view the results o
the measurement is complete. For the computer, the signal interchange with the
counter similarly occurs in both directions.
In the developing model, the factory can be viewed as an aggregation of test line
the radios to be tested. Later, the remote com
user
nce
s and
puter is to be added. The system to be
Now moving to the next level of detail,
nvironment
counter is to operate in a factory environment on any of several productions lines. Based upon such an understanding, one
ake certain assumptions about temperature, power, and ambient lighting.
•
designed, that is, the counter, interacts with all three entities. Such interaction is
reflected in the following figure.
E
• The customer has stated that the
can m
Navagation RadioMeasurement System
User Counter RemoteComputer Factory
Test Line
Peripheral to the System
System to be Designed
Follow-on ComponentNav. Radio
• Time intervals and frequencies on the navigation radios and events from equipment monitoring the production line are to be measured
The time intervals may be either periodic or aperiodic but cannot be both.
• The polarity of the event signal to be counted can be either positive or negative going.
• The data display and the annunciation for mode and range are the only outputs expected from the counter.
Embedded Systems- A Contemporary Design Tool Copyright 2004 Oxford Consulting, Ltd. - 26 -

Embedded Systems Design and Development Chapter 12
• The assumption is made that the signals to be measured are independent of one another.
• In future, commands will be sent from a computer to the counter to direct itsoperation. Da
ta will be sent from the counter to the computer.
Cou
• The counter must have the ability to measure time intervals, frequencies, and count events.
her periodic or
and ut signals.
off or until the user makes another
•
.
inclusion of the ability irect its operation.
l lay.
The next st
designed.
nter
to
• The frequencies are fixed but, span a range of values.
• The time intervals span a range of values and may be eitaperiodic but cannot be both.
• The counter will support the ability for the user to manually select modemeasurement range for all inp
• The counter will continue to make and display the selected attribute of the signal until power to the system is turnedselection.
The counter will measure only one signal at a time.
• An event can be modeled as an aperiodic time signal
• The design will be sufficiently flexible to allow future to send commands from a computer to the counter to d
• The response of the counter to remote commands will be the same as its response to front panel selections with the exception that measured data wilbe sent from the counter to the computer as well as to the front panel disp
ep is to formalize, in a specification, what is known about the system to be
The document, the System Requirements Specification, opens with a summary
of the design.
Embedded Systems- A Contemporary Design Tool Copyright 2004 Oxford Consulting, Ltd. - 27 -

Embedded Systems Design and Development Chapter 12
Requirements Specification for a Digital Counter
System Description
This specification describes and defines the basic requirements for a digital counter. The counter is to be able to measure frequency, period, time interval and events. The system supports three measurement ranges for each signal and two for events. The counter is to be manually operated with the ability to support remote operation in future. The counter is to be low cost and flexible so that it may be utilized in a variety of applications.
Specification of External Environment The counter is to operate in an industrial environment in a commercial grade temperature and lighting environment. The unit will support either line power and battery operation.
System Input and Output Specification
System Inputs The system shall be able to measure the following signals
Frequency in three ranges: • High range up to 150.000 MHz • Mid range up to 50.000 KHz • Low range up to 100.000 Hz
Period in three ranges • High resolution up to 1.0000 ms • Mid resolution up to 10.000 ms • Low resolution up to 1.000 sec
Time interval in three ranges • High resolution up to 1.0000 ms • Mid resolution up to 10.00 ms • Low resolution up to 1.000 sec
Events – up to 99 events in 1 minute
Embedded Systems- A Contemporary Design Tool Copyright 2004 Oxford Consulting, Ltd. - 28 -
Embedded Systems Design and Development Chapter 12
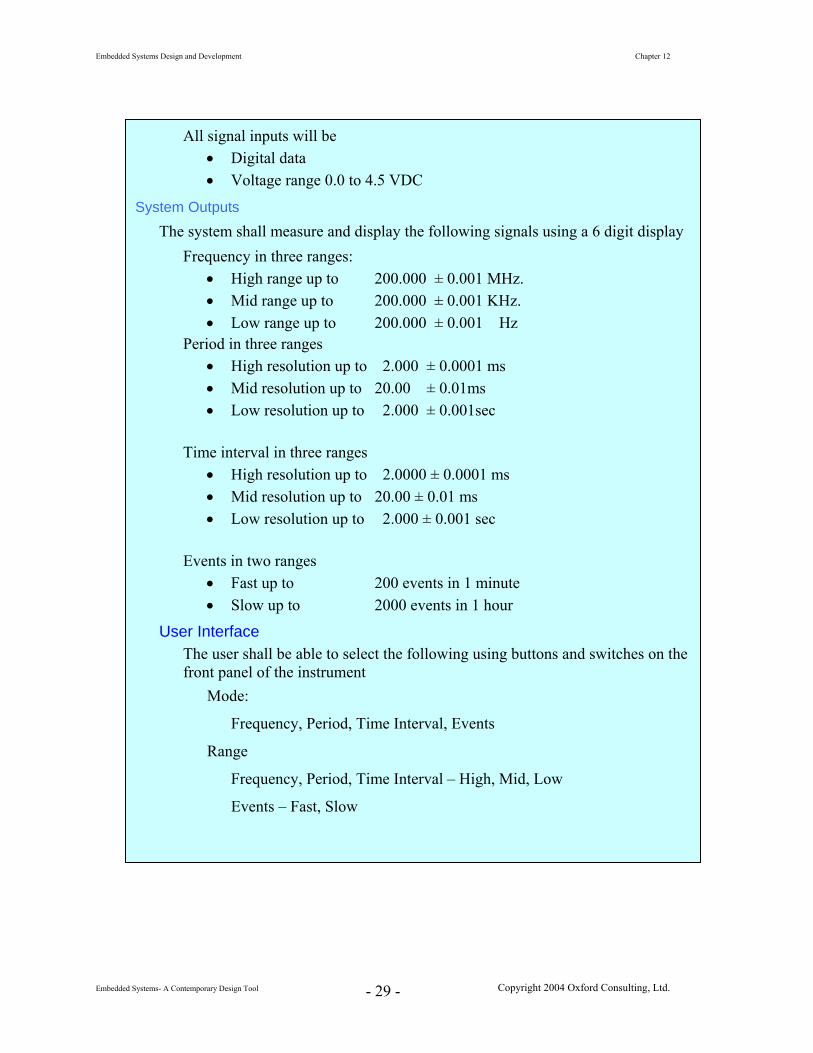
All signal inputs will be • Digital data • Voltage range 0.0 to 4.5 VDC
System Outputs
The system shall measure and display the following signals using a 6 digit display Frequency in three ranges:
• High range up to 200.000 ± 0.001 MHz. • Mid range up to 200.000 ± 0.001 KHz. • Low range up to 200.000 ± 0.001 Hz
Period in three ranges • High resolution up to 2.000 ± 0.0001 ms • Mid resolution up to 20.00 ± 0.01ms • Low resolution up to 2.000 ± 0.001sec
Time interval in three ranges
• High resolution up to 2.0000 ± 0.0001 ms • Mid resolution up to 20.00 ± 0.01 ms • Low resolution up to 2.000 ± 0.001 sec
Events in two ranges
• Fast up to 200 events in 1 minute • Slow up to 2000 events in 1 hour
User Interface The user shall be able to select the following using buttons and switches on the front panel of the instrument
Mode:
Frequency, Period, Time Interval, Events
Range
Frequency, Period, Time Interval – High, Mid, Low
Events – Fast, Slow
Embedded Systems- A Contemporary Design Tool Copyright 2004 Oxford Consulting, Ltd. - 29 -
Embedded Systems Design and Development Chapter 12
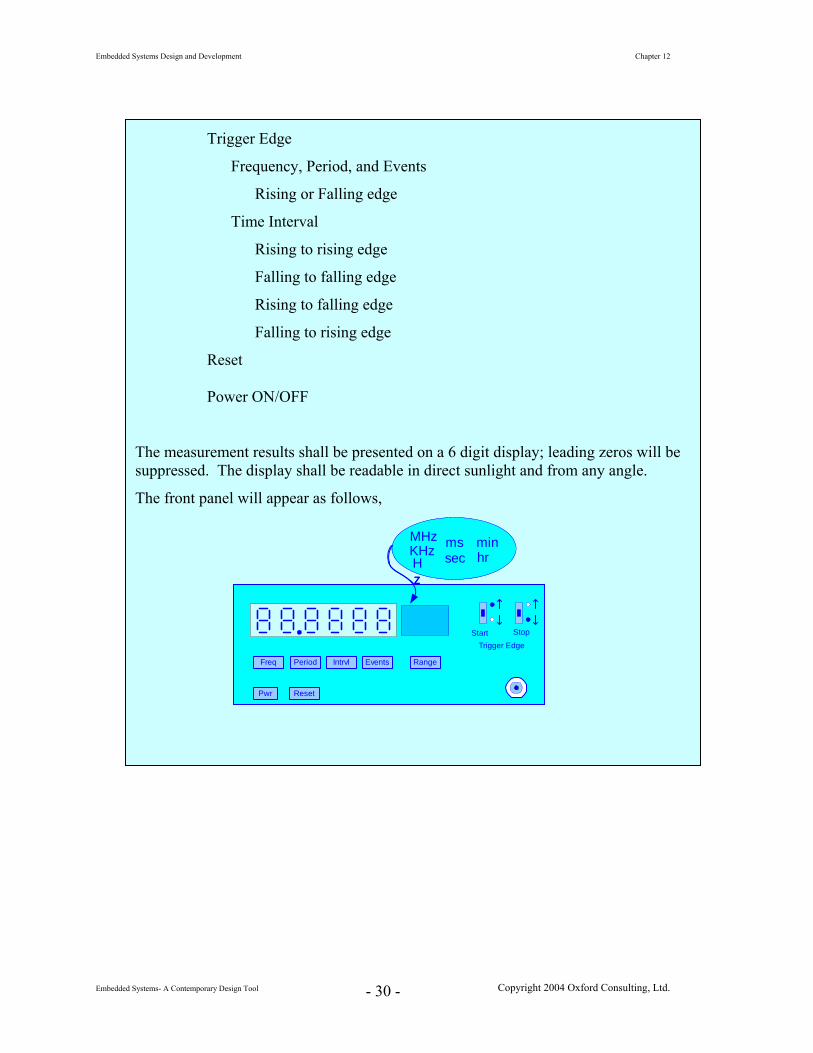
Trigger Edge
Frequency, Period, and Events
Rising or Falling edge
Time Interval
Rising to rising edge
Falling to falling edge
Rising to falling edge
Falling to rising edge
Reset
Power ON/OFF
The measurement results shall be presented on a 6 digit display; leading zeros will be suppressed. The display shall be readable in direct sunlight and from any angle.
The front panel will appear as follows,
Freq Period Intrvl Events
Start
Pwr
MHzKHzHz
mssec
Range
Trigger Edge
Stop
minhr
Freq Period Intrvl Events
Start
Pwr
MHzKHzHz
mssec
Range
Trigger Edge
Stop
minhr
Reset
Embedded Systems- A Contemporary Design Tool Copyright 2004 Oxford Consulting, Ltd. - 30 -
Embedded Systems Design and Development Chapter 12
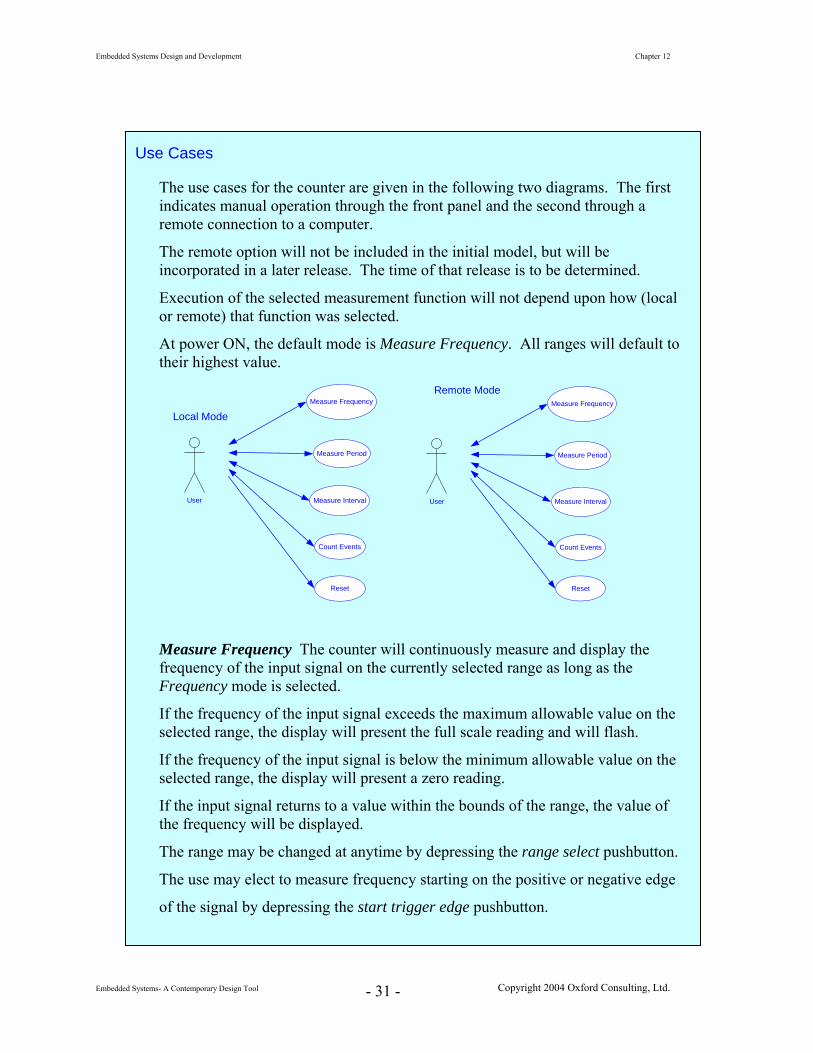
Use Cases
The use cases for the counter are given in the following two diagrams. The first indicates manual operation through the front panel and the second through a remote connection to a computer.
The remote option will not be included in the initial model, but will be incorporated in a later release. The time of that release is to be determined.
Execution of the selected measurement function will not depend upon how (local or remote) that function was selected.
At power ON, the default mode is Measure Frequency. All ranges will default to their highest value.
User
Measure Frequency
Measure Period
Measure Interval
Count Events
Local Mode
Reset
Remote Mode
User
Measure Frequency
Measure Period
Measure Interval
Count Events
Reset
Measure Frequency The counter will continuously measure and display the frequency of the input signal on the currently selected range as long as the Frequency mode is selected.
If the frequency of the input signal exceeds the maximum allowable value on the selected range, the display will present the full scale reading and will flash.
If the frequency of the input signal is below the minimum allowable value on the selected range, the display will present a zero reading.
If the input signal returns to a value within the bounds of the range, the value of the frequency will be displayed.
The range may be changed at anytime by depressing the range select pushbutton.
The use may elect to measure frequency starting on the positive or negative edge
of the signal by depressing the start trigger edge pushbutton.
Embedded Systems- A Contemporary Design Tool Copyright 2004 Oxford Consulting, Ltd. - 31 -

Embedded Systems Design and Development Chapter 12
Measure Period The counter will continuously measure and display the period of the input signal on the currently selected range as long as the Period mode is selected.
If the period of the input signal exceeds the maximum allowable value on the selected range, the display will present the full scale reading and will flash. If the period of the input signal is below the minimum allowable value on the selected range, the display will present a zero reading.
If the input signal returns to a value within the bounds of the range, the value of the period will be displayed.
The range may be changed at anytime by depressing the range select pushbutton.
The use may elect to measure period starting on the positive or negative edge of the signal by depressing the start trigger edge pushbutton.
Measure Interval The counter will continuously measure and display the duration of the selected portion of the input signal on the currently selected range as long as the Interval mode is selected.
If the duration of the selected portion of the input signal exceeds the maximum allowable value on the selected range, the display will present the full scale reading and will flash.
If the duration of the selected portion of the input signal is below the minimum allowable value on the selected range, the display will display zero.
If the input signal returns to a value within the bounds of the range, the value of the duration of the selected portion of the input signal will be displayed.
The range may be changed at anytime by depressing the range select pushbutton.
The user may elect to commence measuring the interval on the positive or negative edge of the signal by depressing the start trigger edge pushbutton.
The user may elect to terminate the measurement interval on the positive or negative edge of the signal by depressing the stop trigger edge pushbutton.
Note that the signal duration from positive edge to positive edge or negative edge to negative edge is the same as the period of the signal.
Embedded Systems- A Contemporary Design Tool Copyright 2004 Oxford Consulting, Ltd. - 32 -
Embedded Systems Design and Development Chapter 12
Embedded Systems- A Contemporary Design Tool Copyright 2004 Oxford Consulting, Ltd. - 33 -
Events The counter will continuously count and display the number of occurrences of the input signal on the currently selected range. The accumulated count will be reset to 0 at the end of the select count duration.
The range may be changed at anytime by depressing the range select pushbutton.
The user may elect to increment the count on the on the positive or negative edge of the input signal by depressing the start trigger edge pushbutton.
If the number of accrued counts exceeds the maximum allowable value on the selected range, the display will present the full scale reading and will flash.
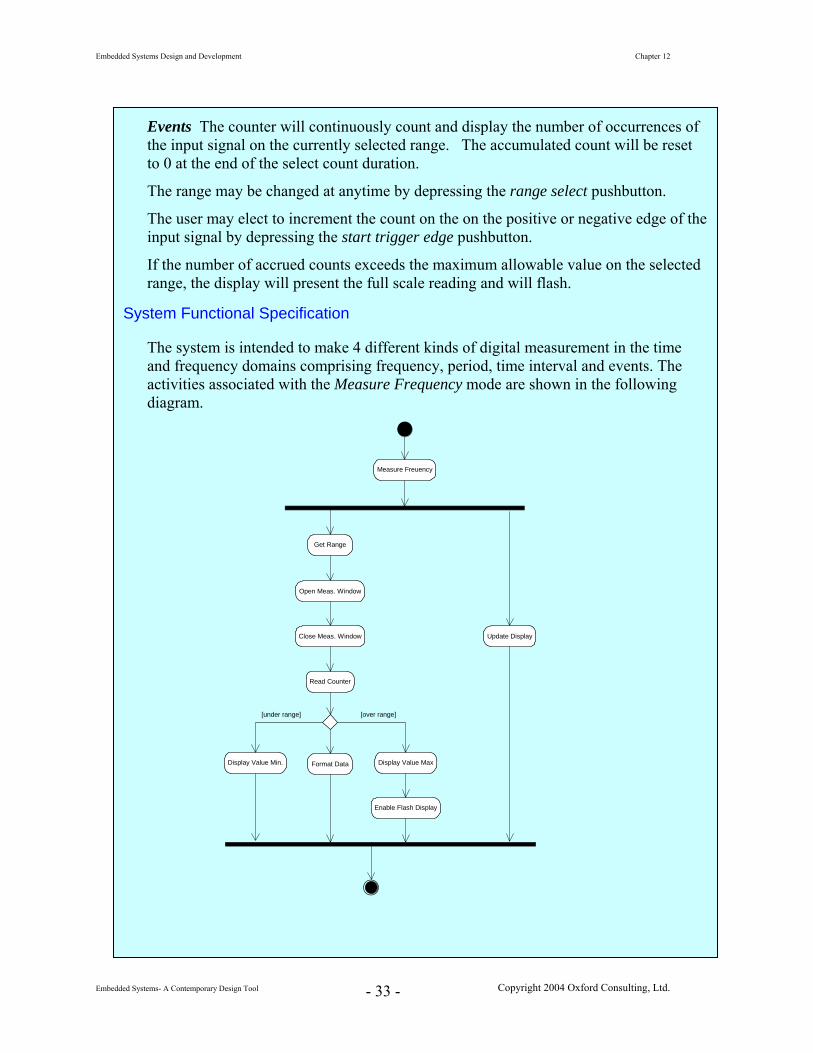
System Functional Specification
The system is intended to make 4 different kinds of digital measurement in the time and frequency domains comprising frequency, period, time interval and events. The activities associated with the Measure Frequency mode are shown in the following diagram.
Measure Freuency
Get Range
Open Meas. Window
Close Meas. Window
Read Counter
Display Value Min. Display Value Max
Enable Flash Display
Format Data
Update Display
[under range] [over range]
Embedded Systems Design and Development Chapter 12
The time and frequency measurements will be implemented to provide three user selectable resolution ranges, high frequency range / shorter duration signals, a second for midrange frequency / midrange duration signals, and a third for low frequency / longer duration signals. The events measurement capability will support two selectable counting durations, shorter and longer.
For frequency, period, and events measurements, the user will be able to select either a positive or negative edge trigger. For interval measurements, the user will be able to select the polarity of the start and stop signals independently.
Operating Specifications
The system shall operate in a standard commercial / industrial environment
Temperature Range 0-85C Humidity up to 90% RH non-condensing Power 120 – 240 VAC 50 Hz, 60 Hz, 400 Hz, 15 VDC
The system shall operate for a minimum of 8 hours on a fully charged battery The system time base shall meet the following specifications
Temperature stability 0-50 C < 6 x 10⁻⁶
Aging Rate 90 day < 3 x 10⁻⁸
6 month < 6 x 10⁻⁷
1 year < 25 x 10-6
Reliability and Safety Specification
The counter shall comply with the appropriate standards
Safety: UL-3111-1, IEC-1010, CSA 1010.1
EMC: CISPR-11, IEC 801-2, -3, -4, EN50082-1
MTBF: Minimum of 10,000 hours
Embedded Systems- A Contemporary Design Tool Copyright 2004 Oxford Consulting, Ltd. - 34 -
Embedded Systems Design and Development Chapter 12
12.7 The System Design Specification
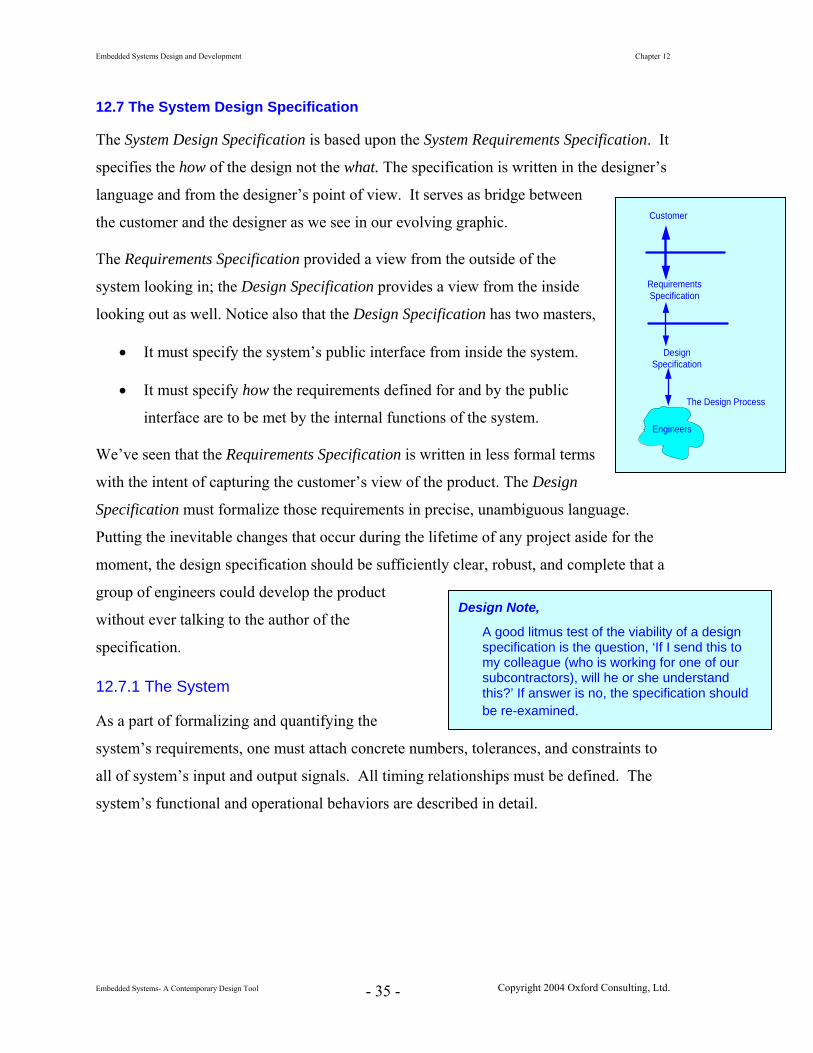
The System Design Specification is based upon the System Requirements Specification. It
specifies the how of the design not the what. The specification is written in the designer’s
language and from the designer’s point of view. It serves as bridge between
the customer and the designer as we see in our evolving graphic.
The Requirements Specification provided a view from the outside of the
system looking in; the Design Specification provides a view from the inside
looking out as well. Notice also that the Design Specification has two masters,
• It must specify the system’s public interface from inside the system.
• It must specify how the requirements defined for and by the public
interface are to be met by the internal functions of the system.
We’ve seen that the Requirements Specification is written in less formal terms
with the intent of capturing the customer’s view of the product. The Design
Specification must formalize those requirements in precise, unambiguous language.
Putting the inevitable changes that occur during the lifetime of any project aside for the
moment, the design specification should be sufficiently clear, robust, and complete that a
group of engineers could develop the product
without ever talking to the author of the
specification.
12.7.1 The System
As a part of formalizing and quantifying the
system’s requirements, one must attach concrete numbers, tolerances, and constraints to
all of system’s input and output signals. All timing relationships must be defined. The
system’s functional and operational behaviors are described in detail.
Customer
RequirementsSpecification
Engineers
DesignSpecification
The Design Process
Design Note,
A good litmus test of the viability of a design specification is the question, ‘If I send this to my colleague (who is working for one of our subcontractors), will he or she understand this?’ If answer is no, the specification should be re-examined.
Embedded Systems- A Contemporary Design Tool Copyright 2004 Oxford Consulting, Ltd. - 35 -
Embedded Systems Design and Development Chapter 12
12.7.1.1 Quantifying the System
The quantification of the system’s characteristics begins with the inputs and outputs,
based upon the specified requirements. The necessary technical details are added to
enable the engineer to accurately and faithfully execute the actual design.
• System Inputs and Outputs For each I/O variable, the following are specified
The Name of the signal
The use of the signal as an input or output
The nature of the signal as an event, data, state variable, etc.
Starting with the requirements specification, we provide detailed descriptions as necessary and incorporate any additional technical or technological constraints that may be needed.
The complete specification of the signal including nominal value, range, level tolerances, timing, timing tolerances.
The interrelationships with other signals including any constraints on those relationships.
• Responsibilities – Activities
Functional and Operational Specifications
The functional and operational specifications that will quantify the dynamic
behavior of the system are now formulated. The functional requirements
specification identifies the major functions that the system must perform from a
high level view. The operational specification endeavors to capture specific
details of how those functions behave within the context of the operating
environment.
The manner in which a particular function must operate, the conditions imposed
on the operation, and the range of that operation are now captured. The
specification must consider concrete numbers – precisions and tolerances.
All variables in the functional specification, all operating conditions, and all
ordinary and extraordinary operating modes must be quantified. The specification
Embedded Systems- A Contemporary Design Tool Copyright 2004 Oxford Consulting, Ltd. - 36 -

Embedded Systems Design and Development Chapter 12
may include domain specific knowledge that is proprietary or heuristically known
to customer. Such knowledge can be very important to the design.
In stating the specific design requirements for the system, one can use tables,
equations or algorithms, formal design language, or pseudo code, flow diagrams,
or detailed UML diagrams such as state charts, sequence diagrams, and timelines.
Schematics, code, or parts lists except in limited circumstances are not included.
Technological (and Other) Specifications
The technological portion includes all detailed and concrete specifications that are
relevant to the design of the system hardware and software. Six areas that should
be considered can easily be identified.
1. Geographical constraints Distributed applications can span a single room, expand to include a complete
factory, or encompass several countries. Consequently, one must address both
the technical items such as interconnection topologies, communications
methods, restrictions on usage, and environmental contamination as well as
non-technical matters such as costs associated with the physical medium and
its installation.
2. Characterization of and constraints on interface signals The assumption is made that signals between the system and the external
world are electrical, optical, or wireless or they can be converted into or from
such a form. The necessary physical characterization of each is obviously
going to depend upon the type of signal. That is, an electrical signal is
specified differently from an optical signal.
Since many of the interface signals may be driven by the external
environment, potentially they are beyond the designer’s control. Therefore,
it’s important to gain as much information about them as possible.
3. User interface requirements
If the system interfaces to such external world devices as medical or
instrumentation equipment, how information is presented and whether there
Embedded Systems- A Contemporary Design Tool Copyright 2004 Oxford Consulting, Ltd. - 37 -

Embedded Systems Design and Development Chapter 12
are any relevant and associated protocols must be considered. There may also
be standards that govern how such information must be presented.
Consider the significant risk that would arise if each avionics vendor
presented critical flight information and controls to the aircraft pilot in a
different way. The near disaster at Three Mile Island arose, in part, because
of the confusion caused by too much information.
4. Temporal constraints
The system may have to perform under hard or soft real-time constraints.
Such constraints may specify delays on signals originating from external
entities, responses to system outputs by external entities, and/or internal
system delays.
5. Electrical Infrastructure considerations
There must be a specification for and electrical characteristics of any of the
electrical infrastructure. Included in this portion of the specification are
power consumption, necessary power supplies, tolerances and capacities of
such supplies, tolerance to degraded power, and power management schemes.
• Safety and Reliability
In formulating the design requirements for the safety and reliability of the system, the
focus shifts to the detailed objectives of each and on the strategy for achieving those
goals.
Safety considerations should address
Understanding and specifying any environmental and safety issues.
The reliability specification should include
Requirements for diagnostic tests, remote maintenance, remote upgrade and their details.
Concrete numbers for MTTF and MTBF of any built in self test circuitry.
There must be concrete numbers for MTTF and MTBF of the system itself.
System performance under partial or full failure must be considered.
Embedded Systems- A Contemporary Design Tool Copyright 2004 Oxford Consulting, Ltd. - 38 -
Embedded Systems Design and Development Chapter 12
Let’s now bring everything together,
Example Continued…
We’ll now continue with the development of the counter. The Design Specification
will follow, but extend, what has been captured in the Requirements Specification.
The focus will now be on providing specific numbers, ranges, and tolerances for
signals that are within the system.
Once again, we’ll put together any thoughts about the environment and the system
prior to writing the specification.
Environment
Specifications relating to the environment have been discussed earlier. There are
no changes here.
Counter
• When specifying measurement and stimulus equipment, the specifications for that equipment are generally 10 times (one order of magnitude) better than for the signals that must be measured or generated.
That margin is provided when specifying the range and tolerances on the counter’s measurement capabilities.
• Specifications on counting events are based upon the granularity of the timing of the interval during which the events are counted.
• The values to be displayed at the measurement boundaries are now defined.
The next step is to provide any additional detail that may be needed and to fully
quantify the counter specifications.
Embedded Systems- A Contemporary Design Tool Copyright 2004 Oxford Consulting, Ltd. - 39 -
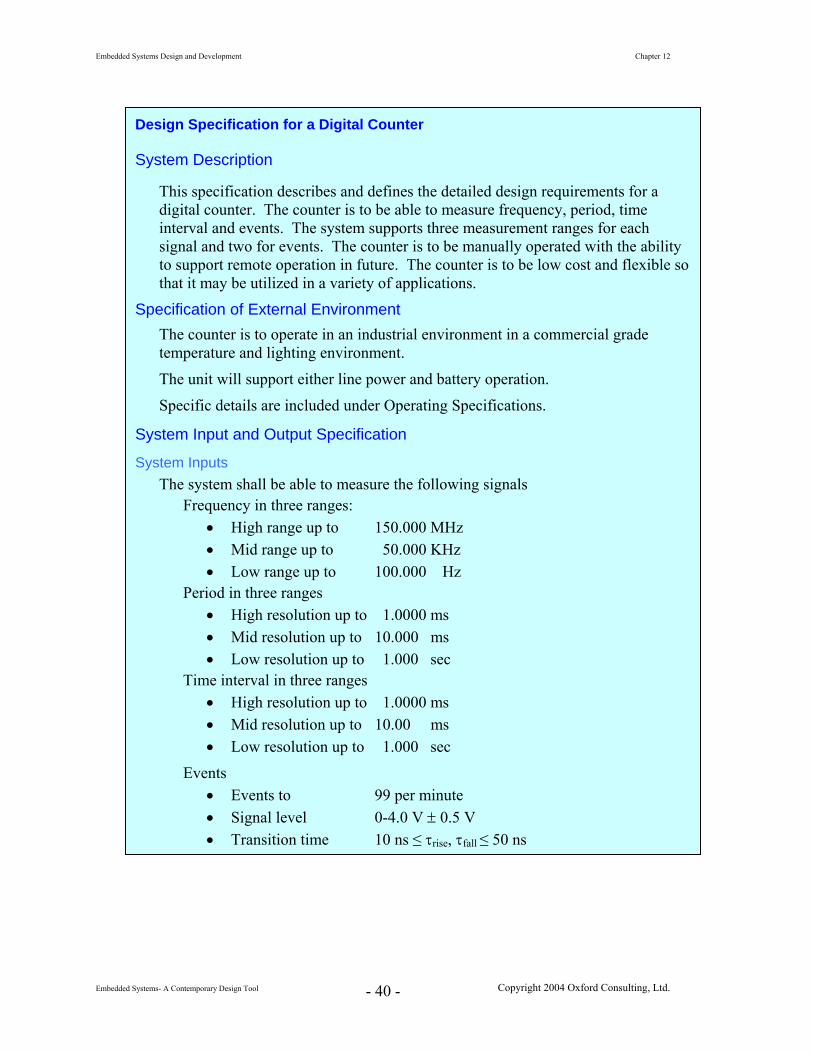
Embedded Systems Design and Development Chapter 12
Embedded Systems- A Contemporary Design Tool Copyright 2004 Oxford Consulting, Ltd. - 40 -
Design Specification for a Digital Counter
System Description
This specification describes and defines the detailed design requirements for a digital counter. The counter is to be able to measure frequency, period, time interval and events. The system supports three measurement ranges for each signal and two for events. The counter is to be manually operated with the ability to support remote operation in future. The counter is to be low cost and flexible so that it may be utilized in a variety of applications.
Specification of External Environment The counter is to operate in an industrial environment in a commercial grade temperature and lighting environment.
The unit will support either line power and battery operation.
Specific details are included under Operating Specifications.
System Input and Output Specification
System Inputs The system shall be able to measure the following signals
Frequency in three ranges: • High range up to 150.000 MHz • Mid range up to 50.000 KHz • Low range up to 100.000 Hz
Period in three ranges • High resolution up to 1.0000 ms • Mid resolution up to 10.000 ms • Low resolution up to 1.000 sec
Time interval in three ranges • High resolution up to 1.0000 ms • Mid resolution up to 10.00 ms • Low resolution up to 1.000 sec
Events • Events to 99 per minute • Signal level 0-4.0 V ± 0.5 V • Transition time 10 ns ≤ τrise, τfall ≤ 50 ns
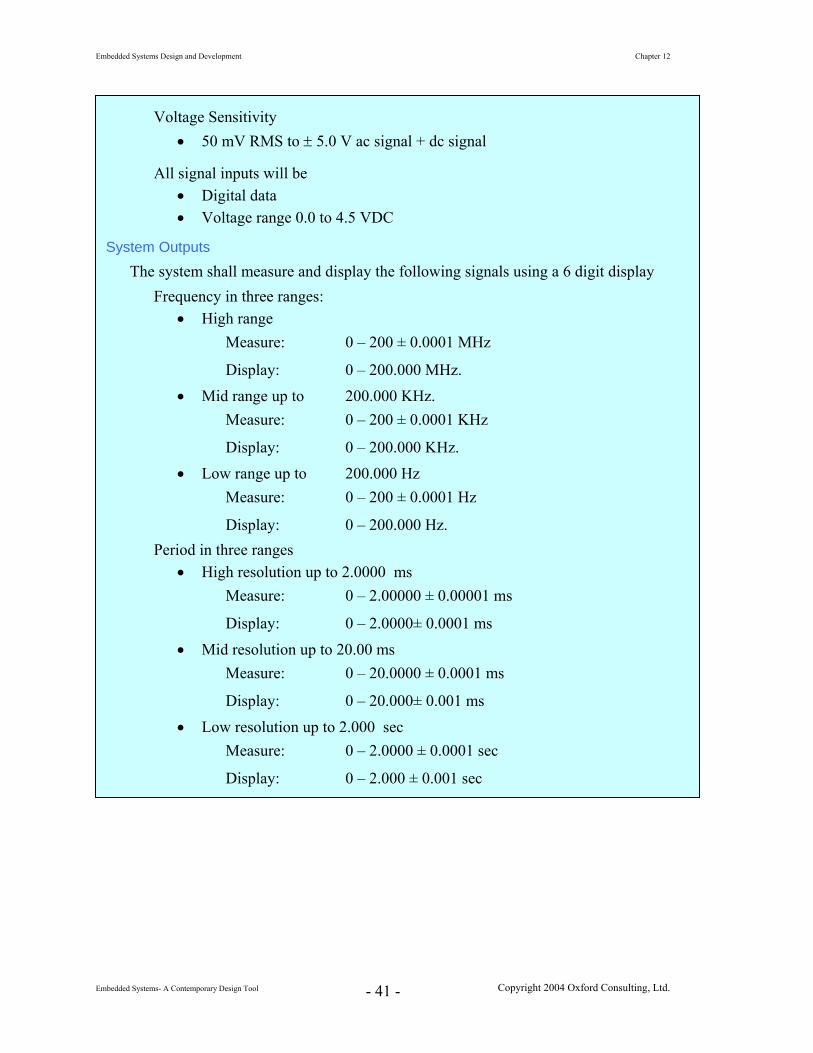
Embedded Systems Design and Development Chapter 12
Voltage Sensitivity • 50 mV RMS to ± 5.0 V ac signal + dc signal
All signal inputs will be • Digital data • Voltage range 0.0 to 4.5 VDC
System Outputs
The system shall measure and display the following signals using a 6 digit display Frequency in three ranges:
• High range Measure: 0 – 200 ± 0.0001 MHz
Display: 0 – 200.000 MHz. • Mid range up to 200.000 KHz.
Measure: 0 – 200 ± 0.0001 KHz
Display: 0 – 200.000 KHz. • Low range up to 200.000 Hz
Measure: 0 – 200 ± 0.0001 Hz
Display: 0 – 200.000 Hz. Period in three ranges
• High resolution up to 2.0000 ms Measure: 0 – 2.00000 ± 0.00001 ms
Display: 0 – 2.0000± 0.0001 ms
• Mid resolution up to 20.00 ms Measure: 0 – 20.0000 ± 0.0001 ms
Display: 0 – 20.000± 0.001 ms • Low resolution up to 2.000 sec
Measure: 0 – 2.0000 ± 0.0001 sec
Display: 0 – 2.000 ± 0.001 sec
Embedded Systems- A Contemporary Design Tool Copyright 2004 Oxford Consulting, Ltd. - 41 -

Embedded Systems Design and Development Chapter 12
Embedded Systems- A Contemporary Design Tool Copyright 2004 Oxford Consulting, Ltd. - 42 -
Time interval in three ranges • High resolution up to 2.0000 ms
Measure: 0 – 2.00000 ± 0.00001 ms
Display: 0 – 2.0000± 0.0001 ms • Mid resolution up to 20.00 ms
Measure: 0 – 20.0000 ± 0.0001 ms
Display: 0 – 20.000± 0.001 ms • Low resolution up to 2.000 sec
Measure: 0 – 2.0000 ± 0.0001 sec
Display: 0 – 2.000 ± 0.001 sec Events in two ranges
• Fast up to 200 events in 1 minute Measure: 0 – 200 ± 1 event
Display: 0 – 200 ± 1 event • Slow up to 2000 events in 1 hour
Measure: 0 – 2000 ± 1 event
Display: 0 – 2000 ± 1 event
User Interface The user shall be able to select the following using buttons and switches on the front panel of the instrument. The mode select push buttons are interlocked to ensure that only one mode at a time can be selected.
Mode:
Frequency, Period, Time Interval, Events
Range
Frequency, Period, Time Interval – High, Mid, Low
Events – Fast, Slow
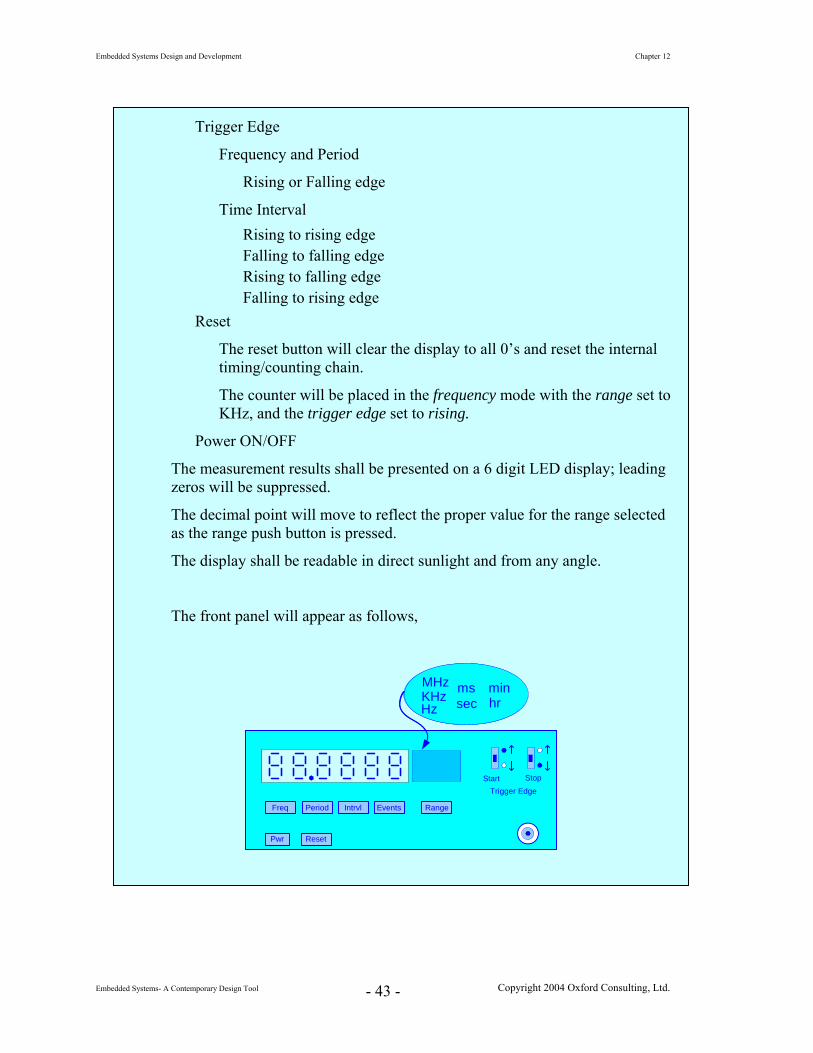
Embedded Systems Design and Development Chapter 12
Embedded Systems- A Contemporary Design Tool Copyright 2004 Oxford Consulting, Ltd. - 43 -
Trigger Edge
Frequency and Period
Rising or Falling edge
Time Interval Rising to rising edge Falling to falling edge Rising to falling edge Falling to rising edge
Reset
The reset button will clear the display to all 0’s and reset the internal timing/counting chain.
The counter will be placed in the frequency mode with the range set to KHz, and the trigger edge set to rising.
Power ON/OFF
The measurement results shall be presented on a 6 digit LED display; leading zeros will be suppressed.
The decimal point will move to reflect the proper value for the range selected as the range push button is pressed.
The display shall be readable in direct sunlight and from any angle.
The front panel will appear as follows,
Freq Period Intrvl Events
Start
Pwr
MHzKHzHz
mssec
Range
Trigger EdgeStop
minhr
Freq Period Intrvl Events
Start
Pwr
MHzKHzHz
mssec
Range
Trigger EdgeStop
minhr
Reset
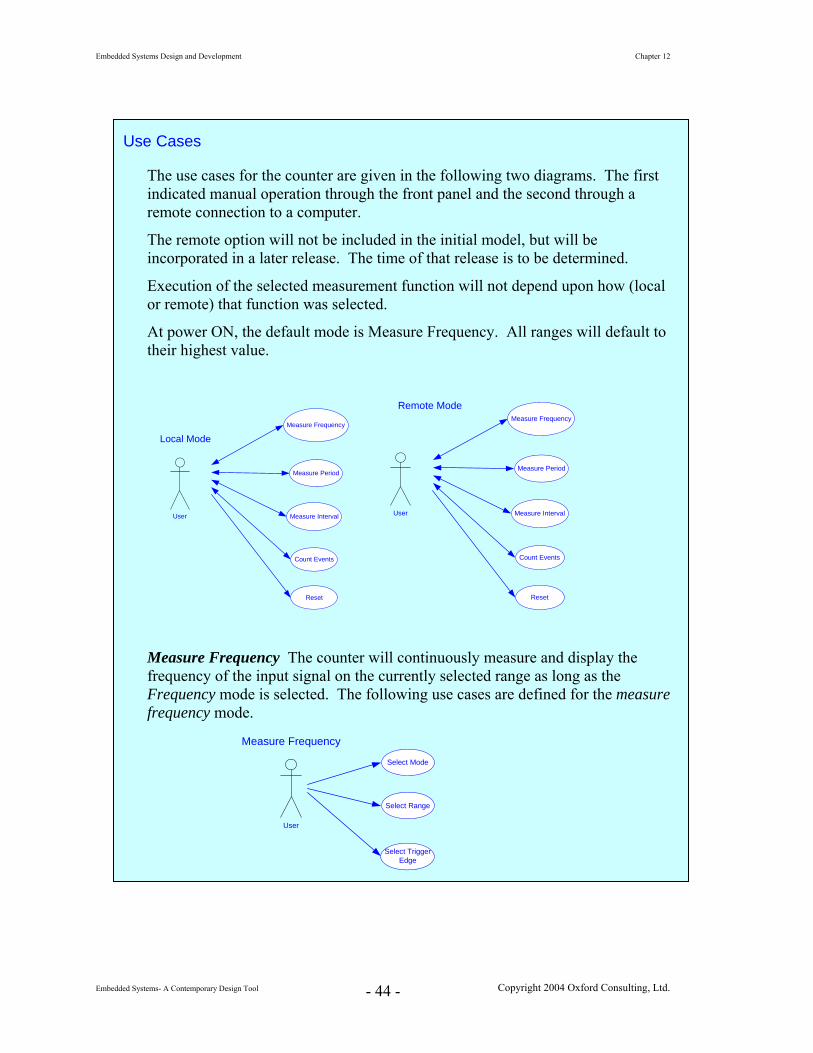
Embedded Systems Design and Development Chapter 12
Use Cases
The use cases for the counter are given in the following two diagrams. The first indicated manual operation through the front panel and the second through a remote connection to a computer.
The remote option will not be included in the initial model, but will be incorporated in a later release. The time of that release is to be determined.
Execution of the selected measurement function will not depend upon how (local or remote) that function was selected.
At power ON, the default mode is Measure Frequency. All ranges will default to their highest value.
User
Measure Frequency
Measure Period
Measure Interval
Count Events
Local Mode
Reset
Remote Mode
User
Measure Frequency
Measure Period
Measure Interval
Count Events
Reset
Measure Frequency The counter will continuously measure and display the frequency of the input signal on the currently selected range as long as the Frequency mode is selected. The following use cases are defined for the measure frequency mode.
User
Measure Frequency
Select Mode
Select Range
Select TriggerEdge
Embedded Systems- A Contemporary Design Tool Copyright 2004 Oxford Consulting, Ltd. - 44 -
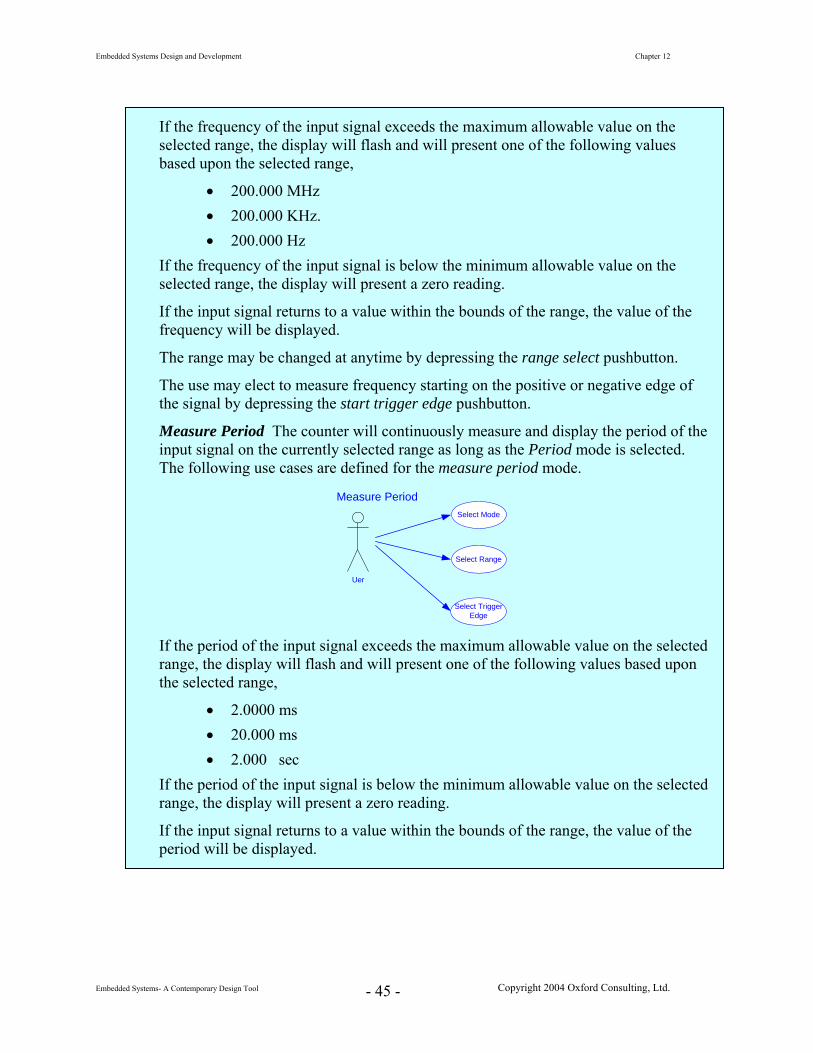
Embedded Systems Design and Development Chapter 12
Embedded Systems- A Contemporary Design Tool Copyright 2004 Oxford Consulting, Ltd. - 45 -
If the frequency of the input signal exceeds the maximum allowable value on the selected range, the display will flash and will present one of the following values based upon the selected range,
• 200.000 MHz • 200.000 KHz. • 200.000 Hz
If the frequency of the input signal is below the minimum allowable value on the selected range, the display will present a zero reading.
If the input signal returns to a value within the bounds of the range, the value of the frequency will be displayed.
The range may be changed at anytime by depressing the range select pushbutton.
The use may elect to measure frequency starting on the positive or negative edge of the signal by depressing the start trigger edge pushbutton.
Measure Period The counter will continuously measure and display the period of the input signal on the currently selected range as long as the Period mode is selected. The following use cases are defined for the measure period mode.
Uer
Select Mode
Select Range
Select TriggerEdge
Measure Period
If the period of the input signal exceeds the maximum allowable value on the selected range, the display will flash and will present one of the following values based upon the selected range,
• 2.0000 ms • 20.000 ms • 2.000 sec
If the period of the input signal is below the minimum allowable value on the selected range, the display will present a zero reading.
If the input signal returns to a value within the bounds of the range, the value of the period will be displayed.
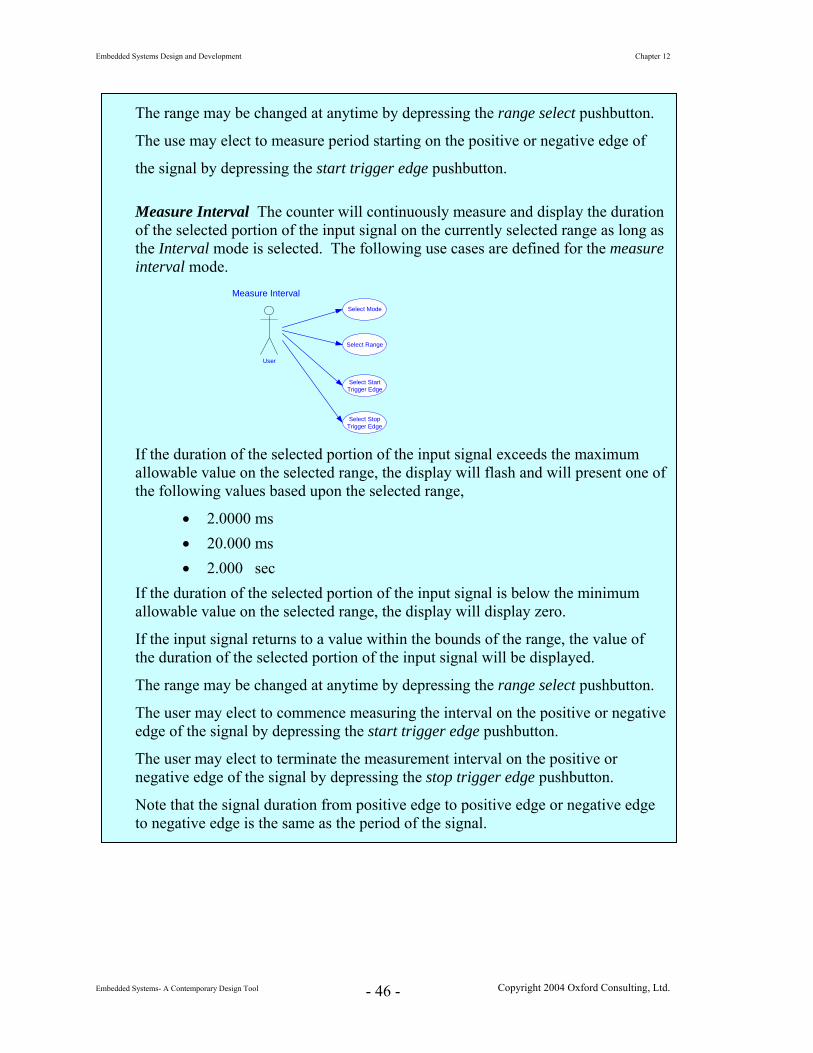
Embedded Systems Design and Development Chapter 12
The range may be changed at anytime by depressing the range select pushbutton.
The use may elect to measure period starting on the positive or negative edge of
the signal by depressing the start trigger edge pushbutton.
Measure Interval The counter will continuously measure and display the duration of the selected portion of the input signal on the currently selected range as long as the Interval mode is selected. The following use cases are defined for the measure interval mode.
User
Select Mode
Select Range
Select StartTrigger Edge
Measure Interval
Select StopTrigger Edge
If the duration of the selected portion of the input signal exceeds the maximum allowable value on the selected range, the display will flash and will present one of the following values based upon the selected range,
• 2.0000 ms • 20.000 ms • 2.000 sec
If the duration of the selected portion of the input signal is below the minimum allowable value on the selected range, the display will display zero.
If the input signal returns to a value within the bounds of the range, the value of the duration of the selected portion of the input signal will be displayed.
The range may be changed at anytime by depressing the range select pushbutton.
The user may elect to commence measuring the interval on the positive or negative edge of the signal by depressing the start trigger edge pushbutton.
The user may elect to terminate the measurement interval on the positive or negative edge of the signal by depressing the stop trigger edge pushbutton.
Note that the signal duration from positive edge to positive edge or negative edge to negative edge is the same as the period of the signal.
Embedded Systems- A Contemporary Design Tool Copyright 2004 Oxford Consulting, Ltd. - 46 -

Embedded Systems Design and Development Chapter 12
Embedded Systems- A Contemporary Design Tool Copyright 2004 Oxford Consulting, Ltd. - 47 -
Events The counter will continuously count and display the number of occurrences of the input signal on the currently selected range. The accumulated count will be reset to 0 at the end of the select count duration. The following use cases are defined for the count events mode.
User
Select Mode
Select Range
Select CountEdge
Count Events
If the number of accrued counts exceeds the maximum allowable value on the selected range, the display will flash and will present one of the following values based upon the selected range,
• 200 min • 2000 hour
The range may be changed at anytime by depressing the range select pushbutton.
The user may elect to increment the count on the on the positive or negative edge of the input signal by depressing the start trigger edge pushbutton.
System Functional Specification
The system is intended to make 4 different kinds of digital measurements comprising frequency, period, time interval and events.
The time and frequency measurements will be implemented to provide three user selectable resolution ranges, high frequency range / shorter duration signals, a second for midrange frequency / midrange duration signals, and a third for low frequency / longer duration signals. The events measurement capability will support two selectable counting durations, shorter and longer.
For frequency, period, and events measurements, the user will be able to select either a positive or negative edge trigger. For interval measurements, the user will be able to select the polarity of the start and stop signals independently.
The system will be designed so as not to preclude the incorporation of a remote access option in future.
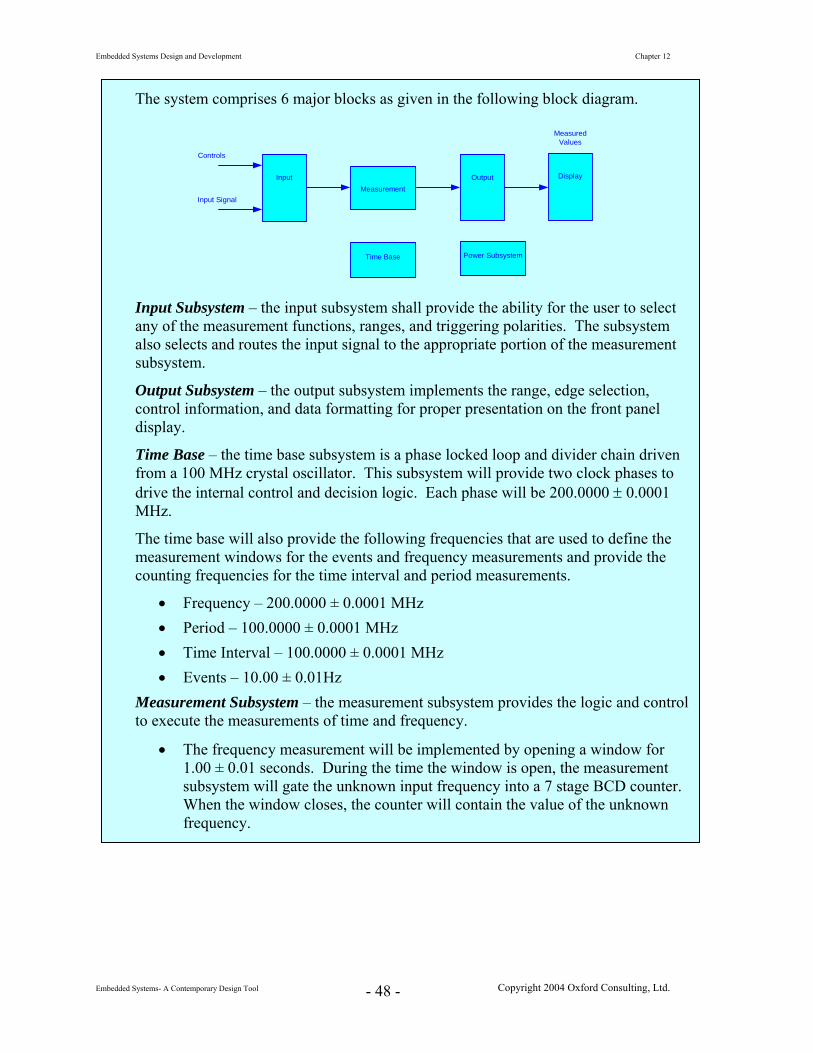
Embedded Systems Design and Development Chapter 12
Embedded Systems- A Contemporary Design Tool Copyright 2004 Oxford Consulting, Ltd. - 48 -
The system comprises 6 major blocks as given in the following block diagram.
Input Output
Time Base
Measurement
Power Subsystem
Display
Controls
Input Signal
MeasuredValues
Input Subsystem – the input subsystem shall provide the ability for the user to select any of the measurement functions, ranges, and triggering polarities. The subsystem also selects and routes the input signal to the appropriate portion of the measurement subsystem.
Output Subsystem – the output subsystem implements the range, edge selection, control information, and data formatting for proper presentation on the front panel display.
Time Base – the time base subsystem is a phase locked loop and divider chain driven from a 100 MHz crystal oscillator. This subsystem will provide two clock phases to drive the internal control and decision logic. Each phase will be 200.0000 ± 0.0001 MHz.
The time base will also provide the following frequencies that are used to define the measurement windows for the events and frequency measurements and provide the counting frequencies for the time interval and period measurements.
• Frequency – 200.0000 ± 0.0001 MHz • Period – 100.0000 ± 0.0001 MHz • Time Interval – 100.0000 ± 0.0001 MHz • Events – 10.00 ± 0.01Hz
Measurement Subsystem – the measurement subsystem provides the logic and control to execute the measurements of time and frequency.
• The frequency measurement will be implemented by opening a window for 1.00 ± 0.01 seconds. During the time the window is open, the measurement subsystem will gate the unknown input frequency into a 7 stage BCD counter. When the window closes, the counter will contain the value of the unknown frequency.
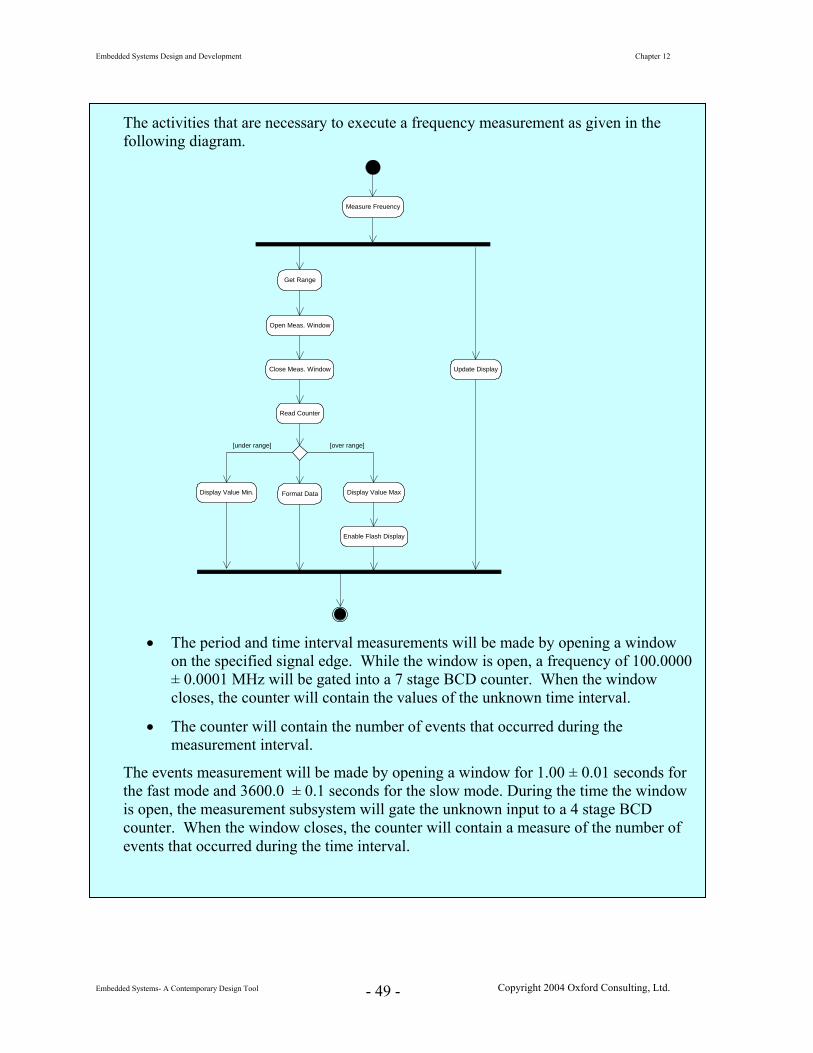
Embedded Systems Design and Development Chapter 12
The activities that are necessary to execute a frequency measurement as given in the following diagram.
Measure Freuency
Get Range
Open Meas. Window
Close Meas. Window
Read Counter
Display Value Min. Display Value Max
Enable Flash Display
Format Data
Update Display
[under range] [over range]
• The period and time interval measurements will be made by opening a window
on the specified signal edge. While the window is open, a frequency of 100.0000 ± 0.0001 MHz will be gated into a 7 stage BCD counter. When the window closes, the counter will contain the values of the unknown time interval.
• The counter will contain the number of events that occurred during the measurement interval.
The events measurement will be made by opening a window for 1.00 ± 0.01 seconds for the fast mode and 3600.0 ± 0.1 seconds for the slow mode. During the time the window is open, the measurement subsystem will gate the unknown input to a 4 stage BCD counter. When the window closes, the counter will contain a measure of the number of events that occurred during the time interval.
Embedded Systems- A Contemporary Design Tool Copyright 2004 Oxford Consulting, Ltd. - 49 -
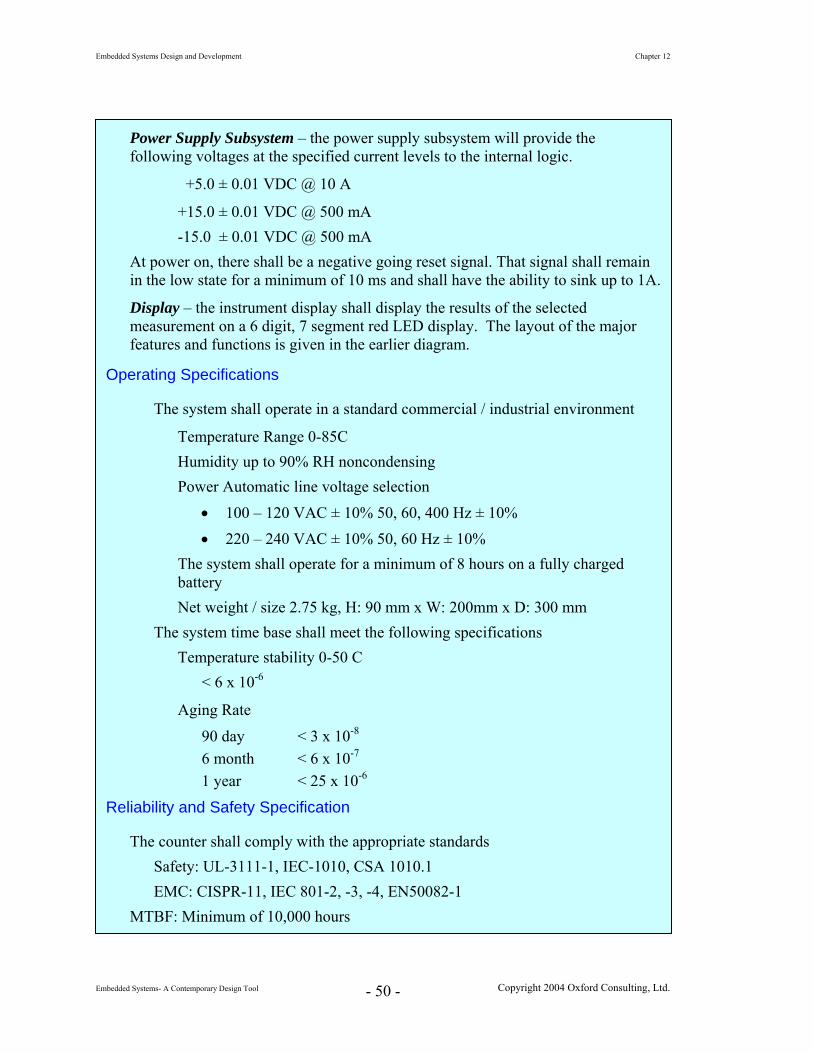
Embedded Systems Design and Development Chapter 12
Power Supply Subsystem – the power supply subsystem will provide the following voltages at the specified current levels to the internal logic.
+5.0 ± 0.01 VDC @ 10 A
+15.0 ± 0.01 VDC @ 500 mA -15.0 ± 0.01 VDC @ 500 mA
At power on, there shall be a negative going reset signal. That signal shall remain in the low state for a minimum of 10 ms and shall have the ability to sink up to 1A.
Display – the instrument display shall display the results of the selected measurement on a 6 digit, 7 segment red LED display. The layout of the major features and functions is given in the earlier diagram.
Operating Specifications
The system shall operate in a standard commercial / industrial environment
Temperature Range 0-85C Humidity up to 90% RH noncondensing Power Automatic line voltage selection
• 100 – 120 VAC ± 10% 50, 60, 400 Hz ± 10% • 220 – 240 VAC ± 10% 50, 60 Hz ± 10%
The system shall operate for a minimum of 8 hours on a fully charged battery Net weight / size 2.75 kg, H: 90 mm x W: 200mm x D: 300 mm
The system time base shall meet the following specifications Temperature stability 0-50 C
< 6 x 10⁻⁶
Aging Rate
90 day < 3 x 10⁻⁸
6 month < 6 x 10⁻⁷
1 year < 25 x 10-6
Reliability and Safety Specification
The counter shall comply with the appropriate standards Safety: UL-3111-1, IEC-1010, CSA 1010.1 EMC: CISPR-11, IEC 801-2, -3, -4, EN50082-1
MTBF: Minimum of 10,000 hours
Embedded Systems- A Contemporary Design Tool Copyright 2004 Oxford Consulting, Ltd. - 50 -
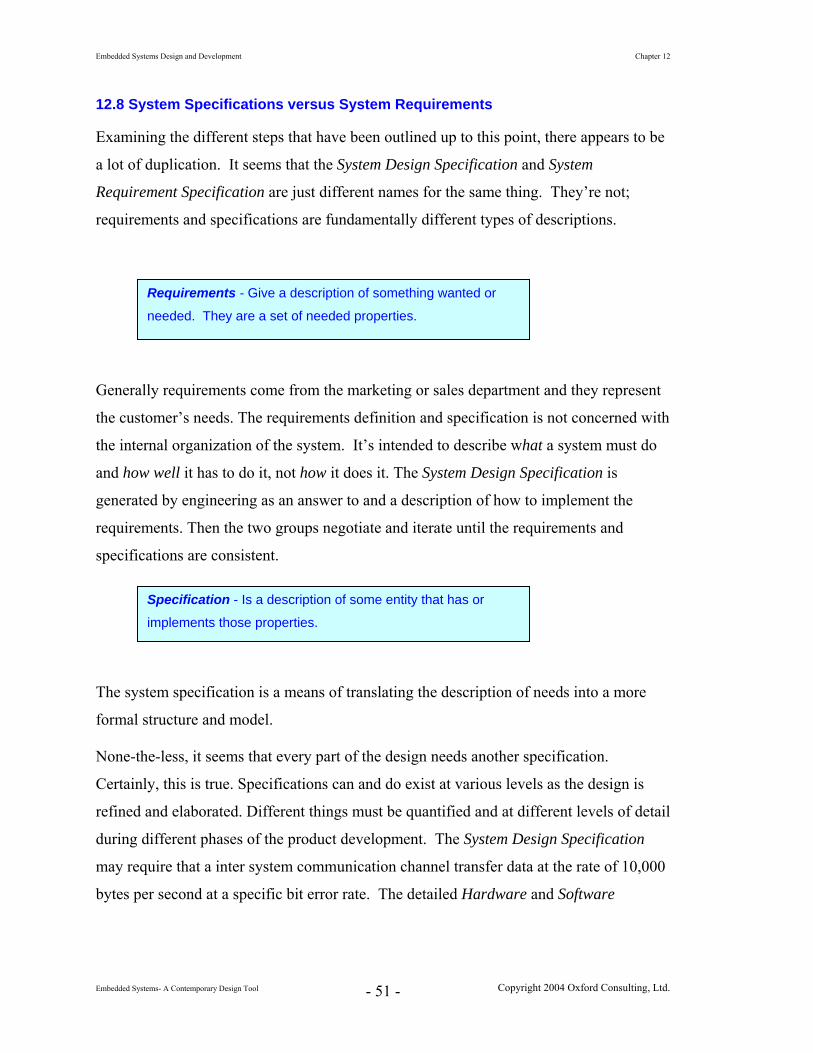
Embedded Systems Design and Development Chapter 12
12.8 System Specifications versus System Requirements
Examining the different steps that have been outlined up to this point, there appears to be
a lot of duplication. It seems that the System Design Specification and System
Requirement Specification are just different names for the same thing. They’re not;
requirements and specifications are fundamentally different types of descriptions.
Generally requirements come from the marketing or sales department and they represent
the customer’s needs. The requirements definition and specification is not concerned with
the internal organization of the system. It’s intended to describe what a system must do
and how well it has to do it, not how it does it. The System Design Specification is
generated by engineering as an answer to and a description of how to implement the
requirements. Then the two groups negotiate and iterate until the requirements and
specifications are consistent.
The system specification is a means of translating the description of needs into a more
formal structure and model.
None-the-less, it seems that every part of the design needs another specification.
Certainly, this is true. Specifications can and do exist at various levels as the design is
refined and elaborated. Different things must be quantified and at different levels of detail
during different phases of the product development. The System Design Specification
may require that a inter system communication channel transfer data at the rate of 10,000
bytes per second at a specific bit error rate. The detailed Hardware and Software
Requirements - Give a description of something wanted or
needed. They are a set of needed properties.
Specification - Is a description of some entity that has or
implements those properties.
Embedded Systems- A Contemporary Design Tool Copyright 2004 Oxford Consulting, Ltd. - 51 -

Embedded Systems Design and Development Chapter 12
Specifications establish the requirements and constraints on their respective components
to be able to meet those specifications.
A specification is a precise description of the system that meets stated requirements.
Ideally a specification document should be
Complete
Consistent
Comprehensible
Traceable to the requirements
Unambiguous
Modifiable
Able to be written
The specification should be expressed in as formal a language or notation as possible yet
readable. Ideally, it should also be executable. A System Specification should focus
precisely on the system itself. It should provide a complete description of its externally
visible characteristics, that is, its public interface. External visibility clearly separates
those aspects that are functionally visible to the environment in which the system
operates from those aspects of the system that reflect its internal structure.
12.9 Partitioning and Decomposing a System
At this point in the design cycle, all of the system requirements have been identified,
captured and formalized into the System Design Specification. The next step is to move
inside the system and begin the process of specifying and designing the functionality that
gives rise to the external behavior.
Throughout all of the previous discussions, modularity and encapsulation have been
repeatedly stressed. We’ll look first at why such an approach is recommended and then
at what should be considered as the process of decomposing and ultimately partitioning
the system into hardware and software modules proceeds.
12.9.1 Initial Thoughts
So, to the first question, ‘Why do we do this?’ Reuse is one important reason. With each
new design, one should always look to the previous project as well as the next one. What
Embedded Systems- A Contemporary Design Tool Copyright 2004 Oxford Consulting, Ltd. - 52 -
Embedded Systems Design and Development Chapter 12
can be used from the last project to expedite the development of this one? How can the
current design be implemented to support a future feature? Are there parts of this design
that can be used in future projects?
Second, many compilers generate object code in segments, one for each module. Such
actions may place size restrictions on the individual modules. Poor module builds can
significantly affect memory accesses, increase cache misses, promote thrashing and
significantly reduce performance.
Thirdly, often, work assignments are made on a module by module basis. Module
boundaries should be defined so as to minimize interfaces amongst different parts of the
system. Such a practice simplifies the process of subcontracting some of the work as
well. Security issues also play a role when subcontracting is considered. Whether
working for a toy company or on a sensitive government project, one needs to consider
what information to make available to outside vendors. By properly decomposing a
system, the portions that can be outsourced and those for which control over should be
retained can be more easily identified.
Fourthly, the modules should be packaged with the goal of stabilizing the module
interfaces during the early part of the design.
Fifthly, partitioning the system into well defined loosely coupled modules helps to ensure
a safe and robust design. Such an approach helps to prevent a failure in one part of the
system from propagating into and affecting another.
The importance of partitioning a new design should be evident; the next step is to
examine the process for doing so. The process starts with the top-level system then
progressively refines that model into smaller and more manageable pieces that can more
easily be designed and built.
Initially, the focus is on a functional view of the system rather than specific pieces of
hardware and software. It’s important to understand and to capture the behavior at a high
level first. The next step will then be to map those functions, that functionality, onto the
hardware and software as necessary to satisfy the constraints identified during the initial
phases of the design. Partitioning is important during the early stages of the development
Embedded Systems- A Contemporary Design Tool Copyright 2004 Oxford Consulting, Ltd. - 53 -
Embedded Systems Design and Development Chapter 12
of the system to aid in attacking the complexities of a large system and then later as a
guide in arriving at a sound physical architecture.
As we begin to think about organizing the system into the collection of pieces that will
implement the customer’s requirements, one should look at the problem from both a high
level view and from a more detailed view. It’s important to remember that developing a
partition is not a one-time process; it isn’t necessary to be perfect the first time. The
partitioning process will probably need to be done several times before a satisfactory and
workable decomposition is achieved.
Prior to beginning the system partition, there are some general thoughts.
1. Remember that with every rule or guideline, there must always be room for exceptions.
2. Each module should solve one well-defined piece of the problem.
Mixing functionality across modules makes all aspects of the development and
support process much more difficult. By doing so, one can easily create noodle
hardware and spaghetti code. Future changes to such modules will very difficult
to implement and easily lead to unexpected side effects and unrelated pieces of
the system suddenly not working.
While it’s desirable to have well-defined modules, with simple interfaces, that
solve nicely encapsulated pieces of the problem, sometimes in embedded
applications one isn’t able to do so because of performance or economic
constraints.
3. The system should be partitioned so that the intended functionality of each
module is easy to understand.
If the design can be understood by other parties, then they will be able to maintain
it and to extend it as necessary throughout the product’s lifetime. Remember,
over half of the engineers who are involved in embedded systems design do not
do new designs; they maintain and enhance existing designs.
During development, easy to understand designs will lead to fewer surprises as
the design nears completion. All interested parties should be able to follow the
Embedded Systems- A Contemporary Design Tool Copyright 2004 Oxford Consulting, Ltd. - 54 -

Embedded Systems Design and Development Chapter 12
design and comment as the process unwinds. A design that is too complex
quickly discourages early criticism. People won’t take the time to learn what the
system is to do. Unfortunately, such early acceptance often is replaced by later
rejection and potentially major redesign efforts. Although it’s important to be
proud of one’s work, one should always seek out others constructive ideas.
4. Partitioning should be done so that connections between modules are only
introduced because of connections between pieces of problem.
Don’t put a piece of functionality into a module just because there’s nowhere else
for it to go.
5. Partitioning should assure that connections between modules are as independent
as possible.
6. Once again, keep like things together. Such a practice helps to reduce errors.
Partitioning is also done to help meet the economic goals of the design.
When forming partitions, the process must be considered from a number of viewpoints.
Taking only single point of view or neglecting any one can have significant long term
effects. At the end of the day, the system may meet neither the customer’s expectations
nor the performance specifications.
As the decomposition process proceeds, the design should first be considered from a
functional point of view. The outcome from the decomposition steps is a functional
model and that can be used to define the system architecture. Among the many things
that should be considered, two that should appear early in the process are the coupling
and the cohesiveness of the modules into which the system is being decomposed. The
goal is to develop loosely coupled, highly cohesive modules. Let’s see what these mean.
12.9.2 Coupling
Coupling is a heuristic that provides an estimate of how interdependent the modules are.
Tightly coupled modules will generally utilize shared data or interchange control
information. As module interdependence increases, so does the complexity of managing
those modules, and the more difficulty one will have,
Embedded Systems- A Contemporary Design Tool Copyright 2004 Oxford Consulting, Ltd. - 55 -

Embedded Systems Design and Development Chapter 12
• Debugging the design during development
• Troubleshooting the system in the event of field failures,
• Maintaining the modules and system, and
• Modifying the design to add features or capabilities.
The major goal is to make the system’s modules as independent as possible – the goal is
to reduce or minimize coupling.
Design Heuristic The lower the coupling, the better job that has been done during partitioning.
Here are several things to think about during the early stages of the design to help to
1. Eliminate all unessential interaction between modules.
is not a part the intended
2. Minimize the amount of essential interaction between modules.
arly analysis
d
Some of the ways to help to reduce complexity include:
a. Reduce the number of interconnections between modules and thereby
b. ate.
c. bles. A better method is to pass
uch sharing is critical to meeting time constraints.
reduce coupling:
If a particular piece of functionality or shared parameter
task of two modules, then eliminate it.
While this sounds the same as the previous point, it’s not. If an e
establishes that some interaction with another module is necessary, effort shoul
be made to reduce the complexity of that required interface. The goal is to keep
things simple.
reduce the number of pieces of data that must flow between modules.
Try to take the most direct route to a signal or piece of data as appropri
There are some cases for which the best implementation is to use a proxy as an interface to a signal or piece of data. In general, however, it’s best toreduce the number of modules involved.
In general, avoid using shared global variadata into a module via its parameter list or calling interface.
With embedded applications, however, there are times when s
Embedded Systems- A Contemporary Design Tool Copyright 2004 Oxford Consulting, Ltd. - 56 -

Embedded Systems Design and Development Chapter 12
d. things simple.
when an
3. Loosen
Unless s a high degree of coordination between several
ation, simply pass
12.9.3
An idea related to coupling is cohesion. The notion of coupling addresses the
; cohesion addresses bringing the pieces together. Cohesion is
goal is to
d
id
1960s. A number of years of refinement and integration of the ideas of many people
Avoid arcane interconnections between or amongst modules. A guiding principle underlying all design is to keep
e. Don’t hard code values into a module’s parameter list or calling interface unless absolutely necessary. We must do so on occasioninterface module or port must be at a specific address location; don’t makethis a general practice.
the essential interaction between modules, if possible.
the environment demand
modules to accomplish a task or to ensure error free communic
the module the information necessary to get the job done. Thereafter, wait for an
indication that the task has completed. Execute some other part of the task.
Cohesion
partitioning of a system
measure of strength of the functional relatedness of elements in a module. The
create strong, highly cohesive modules whose elements are genuinely and tightly relate
to one another. Conversely, elements should not be strongly related to elements in
another module. We want to maximize cohesion and minimize coupling.
The use of cohesion as a reliability and quality metric has been around since the m
studying various designs and design approaches led Constantine and Yordon (Y and C
1979 Page-Jones) to formulate a cohesion scale based upon an ease of maintenance
metric.
Embedded Systems- A Contemporary Design Tool Copyright 2004 Oxford Consulting, Ltd. - 57 -
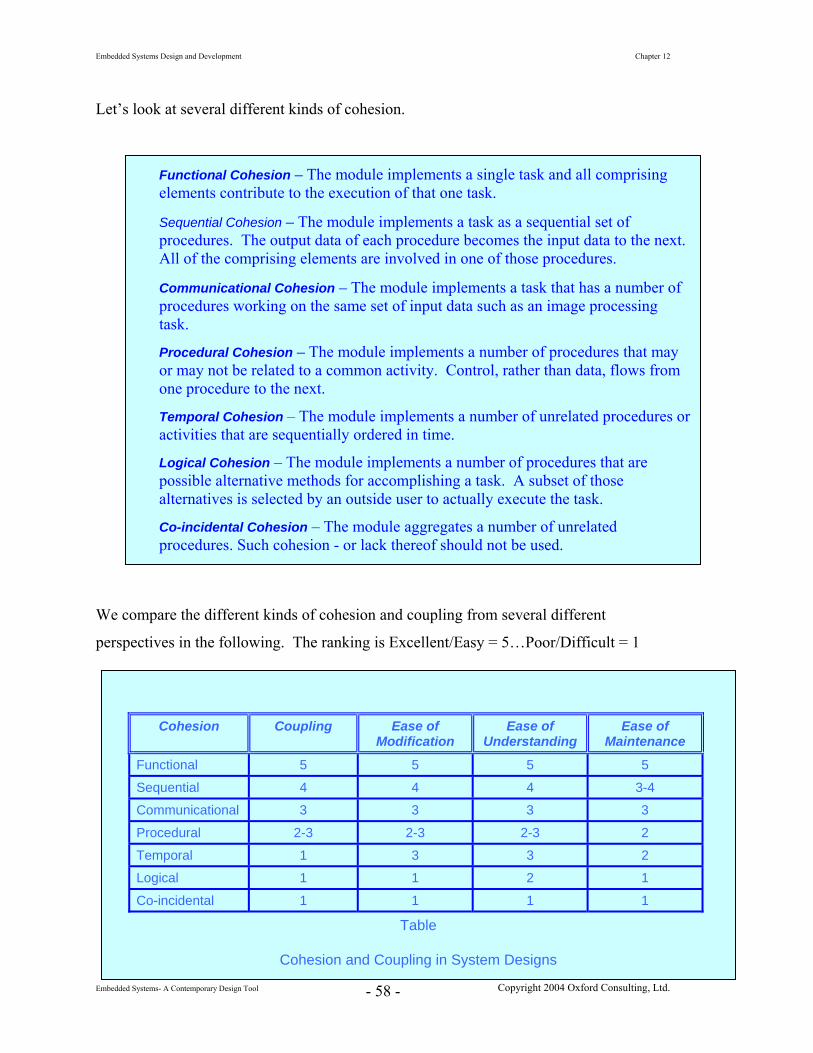
Embedded Systems Design and Development Chapter 12
Let’s look at several different kinds of cohesion.
We compare the different kinds of cohesion and coupling from several different
perspectives in the following. The ranking is Excellent/Easy = 5…Poor/Difficult = 1
Functional Cohesion – The module implements a single task and all comprising elements contribute to the execution of that one task.
Sequential Cohesion – The module implements a task as a sequential set of procedures. The output data of each procedure becomes the input data to the next. All of the comprising elements are involved in one of those procedures.
Communicational Cohesion – The module implements a task that has a number of procedures working on the same set of input data such as an image processing task.
Procedural Cohesion – The module implements a number of procedures that may or may not be related to a common activity. Control, rather than data, flows from one procedure to the next.
Temporal Cohesion – The module implements a number of unrelated procedures or activities that are sequentially ordered in time.
Logical Cohesion – The module implements a number of procedures that are possible alternative methods for accomplishing a task. A subset of those alternatives is selected by an outside user to actually execute the task.
Co-incidental Cohesion – The module aggregates a number of unrelated procedures. Such cohesion - or lack thereof should not be used.
Embedded Systems- A Contemporary Design Tool Copyright 2004 Oxford Consulting, Ltd. - 58 -
Cohesion Coupling Ease of Modification
Ease of Understanding
Ease of Maintenance
Functional 5 5 5 5
Sequential 4 4 4 3-4
Communicational 3 3 3 3
Procedural 2-3 2-3 2-3 2
Temporal 1 3 3 2
Logical 1 1 2 1
Co-incidental 1 1 1 1
Table
Cohesion and Coupling in System Designs

Embedded Systems Design and Development Chapter 12
Cohesion and coupling analyses provide a good set of metrics by which to begin to assess
the high level architectural aspects of a design. Remember, however, that both are
guidelines. The work to ensure that the design is solid and that it’s thoroughly tested still
needs to be done.
There are plenty of good designs that require tightly coupled modules. CDMA cell
phones are a good example of this. One can have tightly coupled multiprocessor designs
as well as designs based upon message passing, the implication is not that one design is
right or wrong, or better than the other, it is just how it was done to meet the
requirements.
12.9.4 More Considerations
With today’s systems, a spatial point of view is often essential. This is an external view
of the system and it yields a distributed functional architecture. With such a view,
performance and communication costs are taken into consideration. Closely associated
with the spatial viewpoint is that of resource allocation; again, an external view. Such
efforts result in a “resource architecture”. Once again, performance, costs, and
dependability are factors that must be considered.
Finally, one must consider the hardware and the software. Decomposition becomes a
design process that leads to a hardware architecture as was discussed earlier. Now
performance must be considered. As embedded developers, we are playing a direct role
in the design and selection of the hardware platform as well as the software environment.
Intelligently making trade-offs in these two areas can be take us a long way towards
developing a safe, robust, and high quality / high performance system.
12.10 Functional Design
The purpose at this stage of the design is to find an appropriate internal functional
architecture for the system. We are beginning to formulate how the requirements that
have been identified can be implemented. The current focus is on analyzing the problem.
Through such analysis, a somewhat loose understanding of the design can be transformed
into a precise description. The result of such a process is a detailed textual or graphical
Embedded Systems- A Contemporary Design Tool Copyright 2004 Oxford Consulting, Ltd. - 59 -
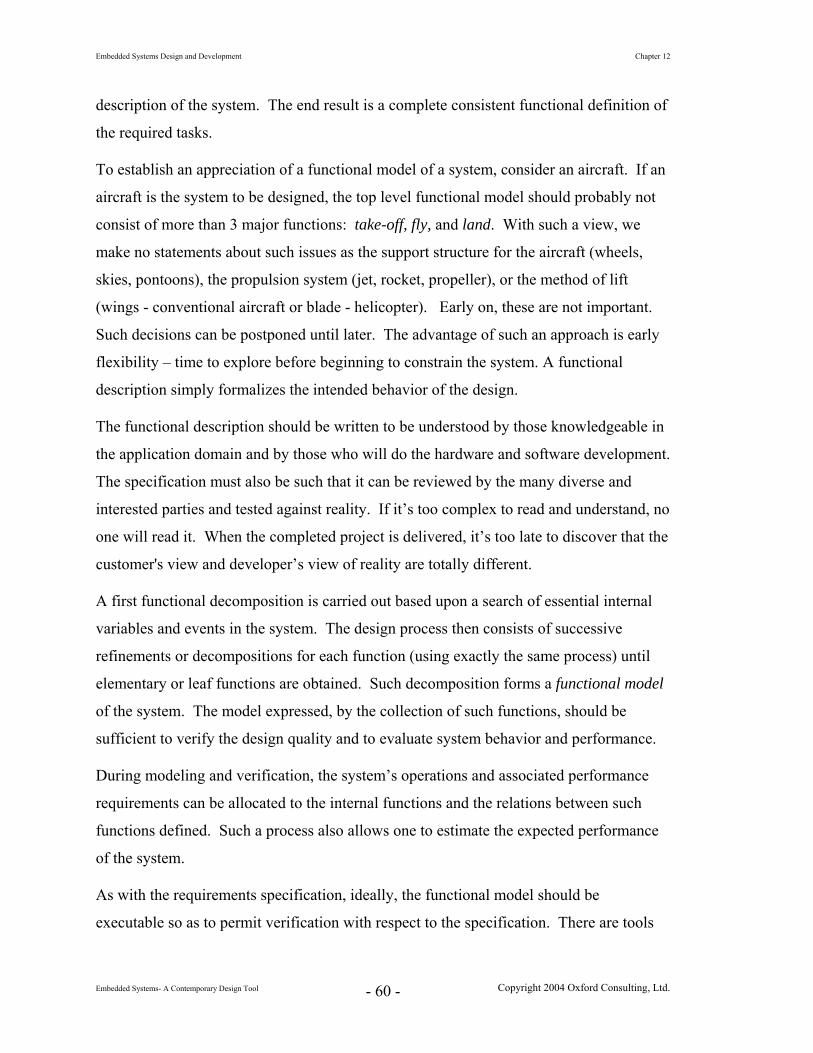
Embedded Systems Design and Development Chapter 12
description of the system. The end result is a complete consistent functional definition of
the required tasks.
To establish an appreciation of a functional model of a system, consider an aircraft. If an
aircraft is the system to be designed, the top level functional model should probably not
consist of more than 3 major functions: take-off, fly, and land. With such a view, we
make no statements about such issues as the support structure for the aircraft (wheels,
skies, pontoons), the propulsion system (jet, rocket, propeller), or the method of lift
(wings - conventional aircraft or blade - helicopter). Early on, these are not important.
Such decisions can be postponed until later. The advantage of such an approach is early
flexibility – time to explore before beginning to constrain the system. A functional
description simply formalizes the intended behavior of the design.
The functional description should be written to be understood by those knowledgeable in
the application domain and by those who will do the hardware and software development.
The specification must also be such that it can be reviewed by the many diverse and
interested parties and tested against reality. If it’s too complex to read and understand, no
one will read it. When the completed project is delivered, it’s too late to discover that the
customer's view and developer’s view of reality are totally different.
A first functional decomposition is carried out based upon a search of essential internal
variables and events in the system. The design process then consists of successive
refinements or decompositions for each function (using exactly the same process) until
elementary or leaf functions are obtained. Such decomposition forms a functional model
of the system. The model expressed, by the collection of such functions, should be
sufficient to verify the design quality and to evaluate system behavior and performance.
During modeling and verification, the system’s operations and associated performance
requirements can be allocated to the internal functions and the relations between such
functions defined. Such a process also allows one to estimate the expected performance
of the system.
As with the requirements specification, ideally, the functional model should be
executable so as to permit verification with respect to the specification. There are tools
Embedded Systems- A Contemporary Design Tool Copyright 2004 Oxford Consulting, Ltd. - 60 -
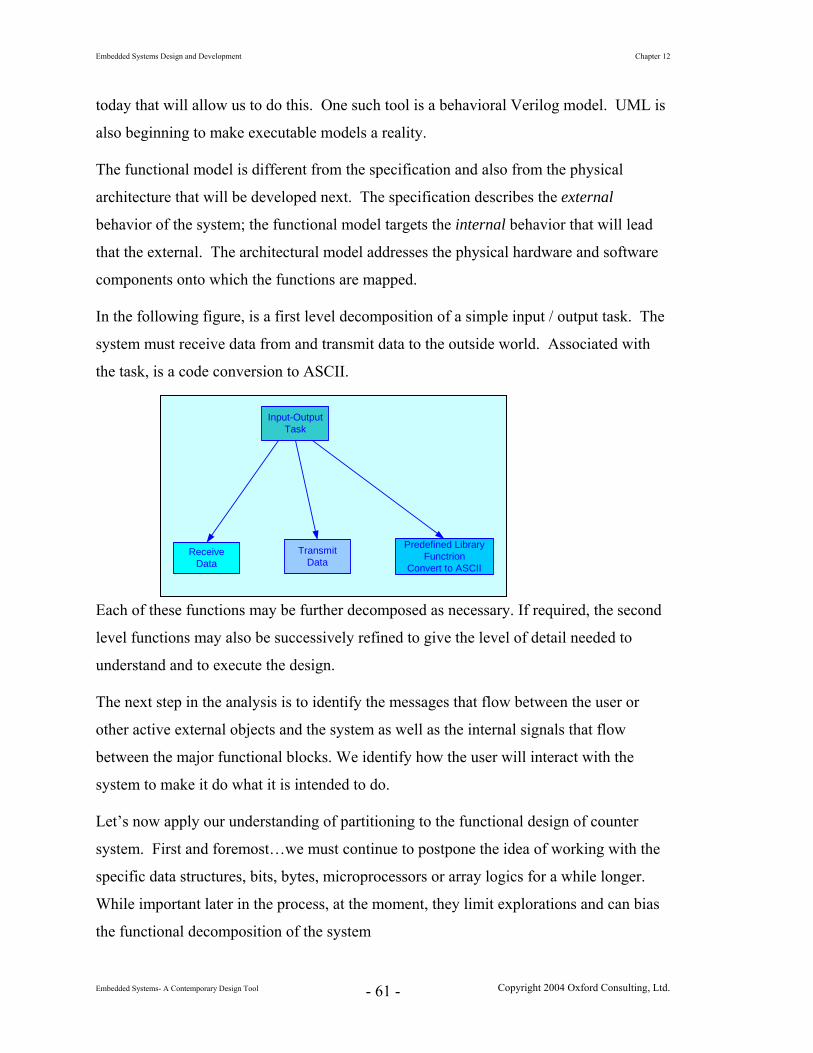
Embedded Systems Design and Development Chapter 12
today that will allow us to do this. One such tool is a behavioral Verilog model. UML is
also beginning to make executable models a reality.
The functional model is different from the specification and also from the physical
architecture that will be developed next. The specification describes the external
behavior of the system; the functional model targets the internal behavior that will lead
that the external. The architectural model addresses the physical hardware and software
components onto which the functions are mapped.
In the following figure, is a first level decomposition of a simple input / output task. The
system must receive data from and transmit data to the outside world. Associated with
the task, is a code conversion to ASCII.
Input-OutputTask
ReceiveData
TransmitData
Predefined LibraryFunctrion
Convert to ASCII
Each of these functions may be further decomposed as necessary. If required, the second
The next step in the analysis is to identify the messages that flow between the user or
Let’s now apply our understanding of partitioning to the functional design of counter
he
the functional decomposition of the system
level functions may also be successively refined to give the level of detail needed to
understand and to execute the design.
other active external objects and the system as well as the internal signals that flow
between the major functional blocks. We identify how the user will interact with the
system to make it do what it is intended to do.
system. First and foremost…we must continue to postpone the idea of working with t
specific data structures, bits, bytes, microprocessors or array logics for a while longer.
While important later in the process, at the moment, they limit explorations and can bias
Embedded Systems- A Contemporary Design Tool Copyright 2004 Oxford Consulting, Ltd. - 61 -

Embedded Systems Design and Development Chapter 12
Example Continued…
The first diagram presents an aggregation of the objects in the system. That aggregation
includes both the environment and the counter being designed.
The model of the measurement system is expressed as a collection of
• The user,
• The future remote computer,
The factory is an aggregation of test lines and numbers of navigation radios that must be
teste er term aggregation rather than composition here.
decomposition of the system. The following diagram elaborates on the counter
first is
nd is charged with
bringing in information from the user and other tasks necessary to support the
• The factory,
System to be DesignedNavagation Radio
Measurement System
User Counter RemoteComputer Factory
Test Line
Peripheral to the System
• The counter
d. Note that we are using the loos
The design specification provided a high level block diagram of the system. For this
problem, such a diagram provides good starting place for the initial hierarchical
component and gives one possible decomposition for that system.
The interface to the outside world is segregated into two functional blocks. The
associated with the presentation of information to the user. The seco
Follow-on ComponentNav. Radio
Embedded Systems- A Contemporary Design Tool Copyright 2004 Oxford Consulting, Ltd. - 62 -
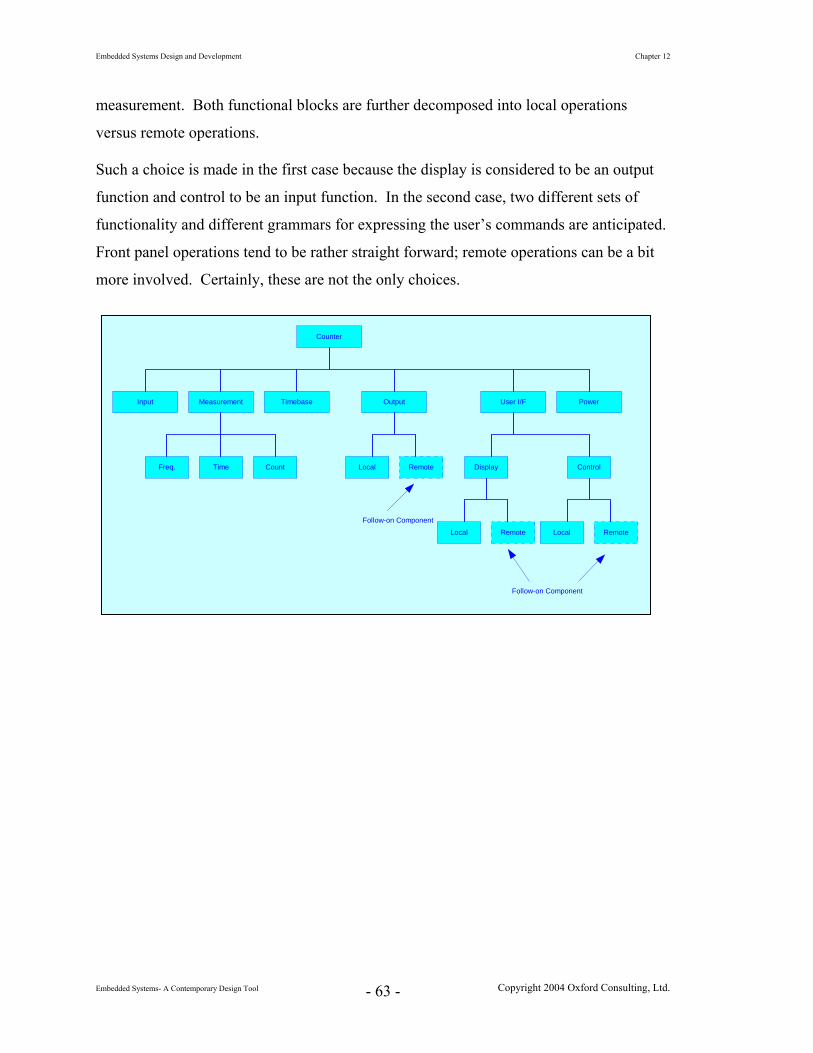
Embedded Systems Design and Development Chapter 12
measurement. Both functional blocks are further decomposed into local operations
versus remote operations.
Such a choice is made in the first case because the display is considered to be a
function and control to be an input function. In the second case, two different sets of
functionality and different g
n output
rammars for expressing the user’s commands are anticipated.
Front panel operations tend to be rather straight forward; remote operations can be a bit
more involved. Certainly, these are not the only choices.
Counter
Input Measurement Output User I/FTimebase Power
Freq. Time Count ControlDisplayRemoteLocal
Follow-on Component
RemoteLocal
Follow-on Component
RemoteLocal
Embedded Systems- A Contemporary Design Tool Copyright 2004 Oxford Consulting, Ltd. - 63 -
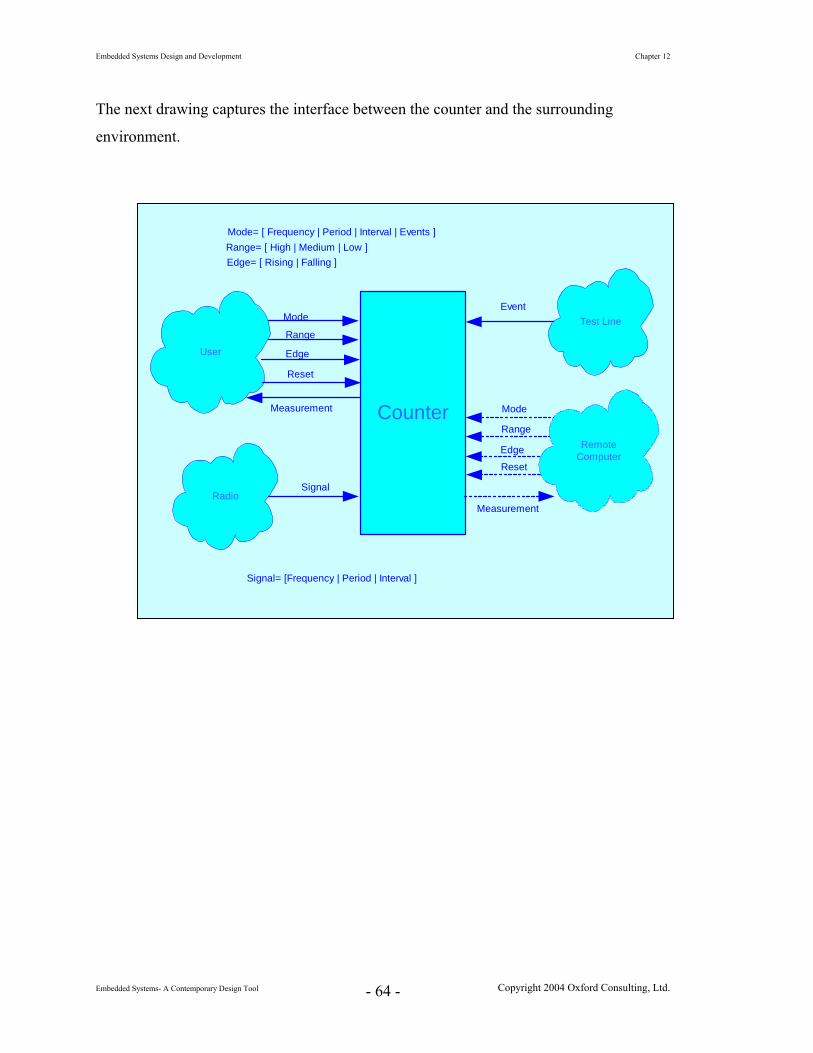
Embedded Systems Design and Development Chapter 12
The next drawing captures the interface between the counter and the surrounding
environment.
User
Counter
Radio
Test LineMode
Range
Measurement
Mode= [ Frequency | Period | Interval | Events ]Range= [ High | Medium | Low ]
Signal= [Frequency | Period | Interval ]
Signal
Edge
Edge= [ Rising | Falling ]
Event
Mode
Range
Measurement
Edge
Reset
RemoteComputer
Reset
Embedded Systems- A Contemporary Design Tool Copyright 2004 Oxford Consulting, Ltd. - 64 -

Embedded Systems Design and Development Chapter 12
The next drawing expresses a functional partitioning and the signal flow between the
major functional blocks.
User I/F
Input
Measure
Data Formatand Output
TimeBase
Mode
Range
Edge
Reset
Results
Signal to beMeasured
cmdMode
cmdRange
cmdEdgem
asterReset
cmdW
indow: 1sec to 1hour
retWindow
retFreq
cmdFreq:
Signal
measuredValueRaw
formattedMeasData
PowerSystem
reset
RemoteInterface
Next the system architecture is formulated and functions are then map onto the hardware
and software blocks comprising that system.
Embedded Systems- A Contemporary Design Tool Copyright 2004 Oxford Consulting, Ltd. - 65 -

Embedded Systems Design and Development Chapter 12
12.11 Architectural Design
In executing an architectural design, the goal is to select the most appropriate solution to
original problem based upon the exploration of variety of architectures and the choice of
the best-suited hardware/software partitioning and allocation of functionality.
The view of a partition now changes to reflect a more detailed understanding of the
system and involves the mapping or allocation of each functional module onto the
appropriate physical hardware or software block(s). Such a mapping completely
describes the hardware implementation of the system.
As noted earlier, one should always endeavor to broaden the scope of the architectural
design so as not to preclude possible future enhancements. Certainly, this involves a
balancing act between generality and practicality as well as simultaneously satisfying
other specified requirements. Nonetheless, the plan should be for a system that evolves
over its lifetime; if this is done well, add-ons, which are inevitable in today’s systems,
will be much easier.
The major objective to the architectural design activity is the allocation or mapping of the
different pieces of system functionality to the appropriate hardware and software blocks.
Work is based upon the detailed functional structure. The performance requirements are
analyzed and finally the constraints that are imposed by the available technologies as well
as those that arise from the hardware and software specifications are taken into
consideration.
The important constraints that must considered include such items as
The geographical distribution,
Physical and user interfaces,
System performance specifications,
Timing constraints and dependability requirements,
Power consumption,
Legacy components and cost.
Such constraints are strong factors for deciding which portions of the system should be
implemented in software and which portions should be done in hardware.
Embedded Systems- A Contemporary Design Tool Copyright 2004 Oxford Consulting, Ltd. - 66 -
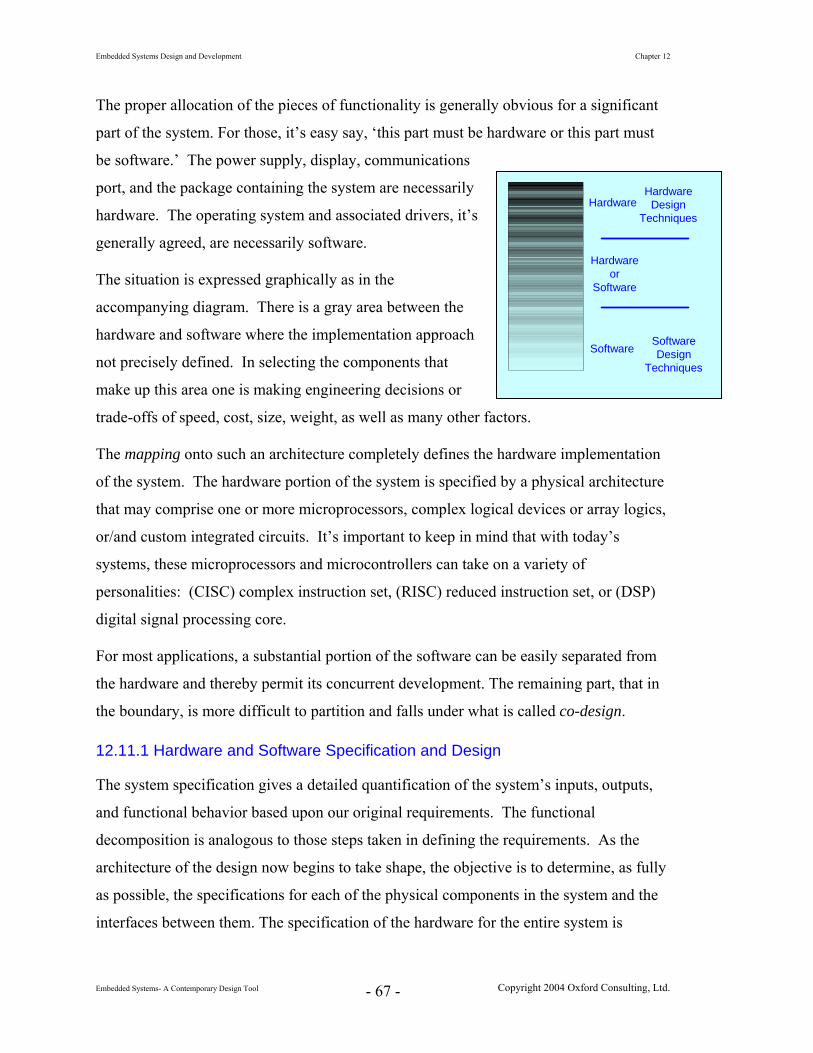
Embedded Systems Design and Development Chapter 12
The proper allocation of the pieces of functionality is generally obvious for a significant
part of the system. For those, it’s easy say, ‘this part must be hardware or this part must
be software.’ The power supply, display, communications
port, and the package containing the system are necessarily
hardware. The operating system and associated drivers, it’s
generally agreed, are necessarily software.
The situation is expressed graphically as in the
accompanying diagram. There is a gray area between the
hardware and software where the implementation approach
not precisely defined. In selecting the components that
make up this area one is making engineering decisions or
trade-offs of speed, cost, size, weight, as well as many other factors.
The mapping onto such an architecture completely defines the hardware implementation
of the system. The hardware portion of the system is specified by a physical architecture
that may comprise one or more microprocessors, complex logical devices or array logics,
or/and custom integrated circuits. It’s important to keep in mind that with today’s
systems, these microprocessors and microcontrollers can take on a variety of
personalities: (CISC) complex instruction set, (RISC) reduced instruction set, or (DSP)
digital signal processing core.
For most applications, a substantial portion of the software can be easily separated from
the hardware and thereby permit its concurrent development. The remaining part, that in
the boundary, is more difficult to partition and falls under what is called co-design.
12.11.1 Hardware and Software Specification and Design
The system specification gives a detailed quantification of the system’s inputs, outputs,
and functional behavior based upon our original requirements. The functional
decomposition is analogous to those steps taken in defining the requirements. As the
architecture of the design now begins to take shape, the objective is to determine, as fully
as possible, the specifications for each of the physical components in the system and the
interfaces between them. The specification of the hardware for the entire system is
Hardware
Software
Hardwareor
Software
HardwareDesign
Techniques
SoftwareDesign
Techniques
Embedded Systems- A Contemporary Design Tool Copyright 2004 Oxford Consulting, Ltd. - 67 -
Embedded Systems Design and Development Chapter 12
decided by defining the hardware architecture and all its properties. The specification of
the software is obtained by defining the software implementation or block diagram (using
any of a variety of methods) for each software component of the architecture.
Each functional subset to be implemented in software is described by a detailed software
specification that expresses the priority of each task and the spatial (data coupling), and
temporal dependence relations between tasks. UML diagrams including detailed state
charts, timing diagrams, sequence diagrams, activity diagrams, and collaboration
diagrams can all be very useful at this stage in the design.
A software implementation may or may not use a real-time kernel. With an off the shelf
real-time kernel, the development time is reduced, but not the factory cost or time based
performance specifications. For systems that don’t use a real-time kernel (which
represents 80% to 90% of small and medium systems) one can achieve a better
optimization of the design when addressing high speed hard real-time constraints. Under
such circumstances, the solution is being hand tailored to the specific problem rather than
adapting a general purpose solution to a specific case.
For the software design, the following must be analyzed and decided:
Whether to use a real-time kernel or not. •
•
•
•
Can several functions be combined in order to reduce the number of software tasks? If so, how?
A priority for each task.
An implementation technique for each inter-task relationship.
When it is appropriate, a real-time kernel or the services of an operating system can be
used. In general, the main objective is to reduce the complexity of the organizational part
in order to reduce the size and complexity of the software and the resulting development,
testing, and debugging times.
Under such circumstances, a frequent choice is the Rate Monotonic Scheduling policy
(this will be discussed shortly … more frequently executed tasks are assigned a higher
priorities). Permanent functions (those that run continuously without an activating event)
Embedded Systems- A Contemporary Design Tool Copyright 2004 Oxford Consulting, Ltd. - 68 -

Embedded Systems Design and Development Chapter 12
and some cyclic functions without timing constraints are usually implemented within a
background task.
For the implementation of inter-task relationships, it is desirable to use procedure calls as
much as possible thereby simplifying the organizational part and reducing the inter-task
overhead. Such an implementation is only possible between functions with increasing
relative priorities. Tasks triggered by hardware events are invoked through the processor
interrupt or polling systems.
For each specific sub-part of the system in which the partition is not obvious, a detailed
specification is written; the final hardware/software partition is determined through a
process of successive refinements as was done in the earlier decomposition process.
Each hardware/software partition must also include the hardware interfaces and the
software drivers to support any inter-component communication.
The result is a complete mapping of all remaining functions and functional relations onto
the hardware architecture. Among the important criteria that we strive to optimize are:
Implementation (or factory) cost, • • • • •
Development time and cost, Performance and dependability constraints, Power consumption, Size
Example Continued…
The next step in developing the counter begins with formulating the hardware
architecture; the software architecture follows. We then map each of the functions
identified earlier onto the architecture. The following diagram presents the hardware
components.
Embedded Systems- A Contemporary Design Tool Copyright 2004 Oxford Consulting, Ltd. - 69 -

Embedded Systems Design and Development Chapter 12
ClockSystem
MicroprocessorROMRAM
Counter - DividerChain and
Control
measValueRaw
mode
cmdFreq
Display
formattedMeasData
Front PanelControls
range
edge
cmdEdge: (start, stop)
cmdTime
Signal tomeasure
PowerSystem
Reset
In the design, the microprocessor, the display, the front panel controls, and the power
The following diagram identifies the major software tasks, shared data, and I/O in a data
in
ppropriate
task.
system are clearly hardware. In theory, the clock system as well as the counter-divider
chain and associated control could be implemented in software. However, the frequency
at which the counter is intended to operate (200 MHz) biases the decision towards a
hardware solution.
and control flow diagram. The front panel task is continually checking (directly by
polling or indirectly by interrupt) the state of the front panel for user input. A change
input is captured and passed to the display task (which will update the display
accordingly) and to the measurement task. The measurement task issues the a
commands to the external counter-divider chain control block. At the end of each
measurement, the raw data is read from the counter-divider and passed to the output
Embedded Systems- A Contemporary Design Tool Copyright 2004 Oxford Consulting, Ltd. - 70 -

Embedded Systems Design and Development Chapter 12
UserInput
Front PanelInput
Mode= [ Frequency | Period | Interval | Events ]Range= [ High | Medium | Low ]Edge= [ Rising | Falling ]
MeasurementControl
cmdFreq
cmdTime
cmdEdge
measValueRaw
Output
Display
Data
Controls
MasterControl
User Commands
User Commands
measValueRaw
formattedMeasData
cmdAvailable
dataAvailable
dataAvailable
cmdAvailable
The output task properly formats the data and sends it to the display task for display on
the front panel. The master control task manages the scheduling of all tasks and
performs any necessary housekeeping or other duties as necessary.
12.12 Functional Model versus Architectural Model
A good question that one might ask at this stage is, ‘Why is it necessary to design a
functional model and an architectural model?’ We start by looking at any system -
hardware, software, a mix, it doesn’t matter. It quickly becomes evident that the internal
organization of a system is based on a collection of components and interconnections
between them. An appropriate model has to include elements both at functional level and
at the architectural level to be able to represent and evaluate hardware/software systems.
Embedded Systems- A Contemporary Design Tool Copyright 2004 Oxford Consulting, Ltd. - 71 -
Embedded Systems Design and Development Chapter 12
12.12.1 The Functional Model
The functional model describes a system through a set of interacting functional elements.
The design proceeds at a high level without initial bias towards any specific
implementation. We have the freedom to explore and to be creative. The behavior of a
functional element is best described with a hierarchical and graphical model. The
functional modules will interact using one of the following three types of relations:
• The shared variable relation - Which defines a data exchange without temporal dependencies.
• The synchronization relation - Which specifies temporal dependency.
• The message transfer by port - Which implies a producer/consumer kind of relationship.
We will discuss each of these when we study processes and inter process communication.
All of them are critical in the design and development of today’s embedded systems.
12.12.2 The Architectural Model
The architectural model describes the physical architecture of the system based on real
components such as microprocessors, arrayed logics, special purpose processors, analog
and digital components, and the many interconnections between them.
12.12.3 The Need for Both Models
These two views, when considered separately, are not sufficient to completely describe
the design of contemporary systems. It is necessary to add the mapping between the
functional viewpoint and the architectural one. Such a mapping defines a (functional)
partition and the allocation of functional components to the hardware elements. This is
also called architectural configuration.
The functional model, located between specification model and the architectural model, is
suitable for representing the internal organization of a system. It explains all necessary
functions and the couplings between them - expressed from the point of view of the
original problem. Using such a scheme leads to a technology-independent solution. In
particular with this kind of model, all or part of the description can be implemented either
in software or hardware.
Embedded Systems- A Contemporary Design Tool Copyright 2004 Oxford Consulting, Ltd. - 72 -

Embedded Systems Design and Development Chapter 12
The functional model is the basis for a coarse-grain partitioning of the system. Such a
partitioning leads naturally to the selection of which functions to implement in hardware
or software. The architectural structure is finer grained and generally follows from the
functional model; the architecture may also be imposed a priori.
12.13 Prototyping
The prototype phase leads to an operational system prototype. A prototype
implementation includes:
• Detailed Design
• Debugging
• Validation
• Testing
Prototyping is naturally a bottom-up process since it consists of assembling individual
parts and fleshing out more and more of the abstract functionalities. Each level of the
implementation must be validated. That is, it must be checked for compliance with the
specifications on the corresponding level in the top-down design.
Hardware and software implementations can be developed simultaneously and involve
specialists in both domains, hopefully reducing the total implementation time. Often this
doesn’t happen in reality. Typically, the software leads hardware. None-the-less, a
complete solution can be generated and/or synthesized both for hardware (in the form of
ASICs and standard cores etc.) and software (in the form of hardware / software
interfaces). The resulting prototype can then be verified.
12.13.1 Implementation
Activities in this step are highly dependent on the technology used. Remember, the
prototype is tool for understanding and confirming system design. It is a proof of concept.
A word of caution, don't rush the analysis or design to get to the prototype. Also, don't be
afraid to throw the prototype away. For small projects, it sometimes works to try to
transform the prototype into the final product. For large projects, it's usually more of a
proof-of-concept that almost never can be migrated.
Embedded Systems- A Contemporary Design Tool Copyright 2004 Oxford Consulting, Ltd. - 73 -
Embedded Systems Design and Development Chapter 12
Remember, those who hurry through the design and coding because there's a lot of testing
to do are going to be spending long nights getting things to work and even longer nights
with unhappy customers. For some reason, customers don't seem to have much of a
sense of humor when the failure of a product they have purchased has just cost them
several million dollars. If you’re selling to a general market, your company has just lost
several million in R&D costs and you still don’t have a product to take to market. So
now, it’s even worse, because you’ve missed an opportunity for sales revenue with a
product that you can’t sell because it is poorly conceived, or it still isn’t ready.
12.13.2 Analyzing the System Design
We’ve been studying the system design process while moving from requirements to a
design. Now that the first level design is in place, it must be critically analyzed. This
step provides several important checks on the design, first, and foremost, it verifies that
the solution meets the original requirements and specifications. At this stage in the
design flow, it may also be necessary to trade-off different architectural and functional
aspects of the design. Such trade-offs must be made according to criteria identified in the
original specification.
The first step entails a static analysis of the system. At this stage, the architecture of the
system is examined. Of immediate interest is not how the system will behave at run time.
The major objectives are to have a system that is easy to understand, build, test, and
maintain. All too often from new designers (and, unfortunately, some who should know
better), have I heard the phrase, "…but it works!!!" For systems that we're proud to put
our name on, getting it to work is only one very small part of the job. Moreover, it’s easy
to make a one-off version of any system to work. Making one or ten million of the same
design in production that will ultimately work safely and reliably is a much larger
challenge.
The main goal in any design is to work ourselves out of a job. We want the design to be
so reliable and so well documented that any future modifications and extensions are
effortless. The caveat, of course, is that one must also know what sufficient reliability is
and when to stop documenting. Well documented means just enough so that people can
easily understand the design, but not so much that it becomes the primary deliverable.
Embedded Systems- A Contemporary Design Tool Copyright 2004 Oxford Consulting, Ltd. - 74 -

Embedded Systems Design and Development Chapter 12
12.13.2.1 Static Analysis
Static analysis should consider 3 areas:
1. Coupling
We have examined this aspect of a design already. Coupling is related to
number and complexities of the relationships that exist have amongst the
various system modules. It also gives a measure a measure of implications of
a change. The goal is loose coupling.
2. Cohesiveness
Another issue that is worth re-stressing, cohesiveness is a measure of
functional homogeneity of elements that comprise the modules. This applies
to both the components and the relations. One must consider both external
and internal views. External cohesion begins with the appropriate naming and
meaning for elements. Internally, the structure and relationships among
components is analyzed. For example, coupling through shared data is more
cohesive than messages. Messages imply a temporal dependency.
3. Complexity
Two kinds of complexity are identified: functional and behavioral.
Functional complexity is characterized by:
• The number of internal functions and relational components
The goal is to keep these small. Generally, as the number of functions and
relations decreases so does the complexity of the design. Note, this does
not mean to sacrifice clarity.
• Interconnections amongst elements comprising each module.
The earlier discussion of coupling applies here as well. Keep things
simple.
Embedded Systems- A Contemporary Design Tool Copyright 2004 Oxford Consulting, Ltd. - 75 -
Embedded Systems Design and Development Chapter 12
Behavioral complexity is characterized by
• The number of inputs and outputs
Once again, the target is a smaller number.
• The length and ease of reading and understanding the description of the module.
If several paragraphs or a page of written text (in sub 6 point font) are
required to describe the function of one of the modules, that module is
probably too complex. To simplify such descriptions, use tables, logical
equations, or pseudo code.
• The flow control through the module and the number and structure of state variables.
Have a single major thread of control through the module and keep the
number of states small.
12.13.2.2 Dynamic Analysis
The objective in performing a dynamic analysis on the system is to determine how it will
behave in a context that closely approximates the ultimate working environment.
Dynamic analysis considers the following:
• Behavior Verification
The goal is to ensure that the behavior of system, in its operating environment,
meets the operational specification. That is, does it perform the functions it was
intended to perform? This verification includes behavior at the boundaries of
those functions. To be able to do so, of course, we need a good specification in
the first place.
• Performance Analysis
Performance Analysis ensures that the system, in its operating environment, meets
the performance specification. The focus is on specific values for inputs and
outputs. We’ll talk about this in a later chapter.
Embedded Systems- A Contemporary Design Tool Copyright 2004 Oxford Consulting, Ltd. - 76 -
Embedded Systems Design and Development Chapter 12
• Trade-off Analysis
A Trade-off Analysis is necessary to determine optimal solution for the given
constraints and objectives. Such an analysis, based upon only small set of
performance criteria, may affect the ultimate success or failure of the product.
12.14 Other Considerations
The two additional complementary and concurrent activities that need to be considered in
today’s business world are capitalization and reuse and requirements and traceability
management. Let’s look briefly at capitalization. Design reuse is one of the central
threads in this text.
12.14.1 Capitalization and Reuse
Capitalization
Capitalization and reuse are activities that are essential to the contemporary design
process. Proper and efficient exploitation of intellectual properties (IPs) is very
important today. Intellectual properties are designs, often patented, that can be sold to
another party to develop and sell as (a part of) their product. The company MIPS, for
example, designs computer architectures. They don’t actually do any implementation
themselves, the design is their product.
Reuse
Any consideration of component reuse is an activity to be done during the functional and
architectural design phases of the project. Note, one can sometimes consider these during
prototyping as well.
One of the main purposes is to help designers shorten the development life cycle.
Component reuse is facilitated in two ways: present and future. Reuse is supported in
the present by identifying a set of external (existing) functional or architectural
components that can satisfy some parts of desired functionality. Future reuse is supported
by identifying components in the system under design that will be reusable in other
projects or products.
Embedded Systems- A Contemporary Design Tool Copyright 2004 Oxford Consulting, Ltd. - 77 -
Embedded Systems Design and Development Chapter 12
To be reused, a component needs to be
• Well-defined
• Properly modularized
• Conform to some interchange standard
A well thought out, well designed module will be much easier to adapt to a new situation
than one that someone pieced together for some ad hoc purpose and barely got working.
The same is true for a portion of a well modularized system.
If, during the design phase, one makes decisions with an eye to modules that could be
reused, the chances of such reuse are greatly enhanced. Finally, if the goal is for a
module to have wider applicability than a local venue, then the designs must
accommodate existing national and international standards. With today’s international
market growing daily, it is incumbent upon us design to such standards.
Once again, the real-world intrudes, and trade-offs are part of the process. While
designing for reusability or striving for a modular design, there are other factors to be
considered. Suppose there isn’t enough ROM space for the code if it’s designed to be
completely modular, the may be modified to be very application specific. While it’s
known that the decision might create problems in the future, we’ll end up with a non-
competitive product if the budget is exceeded.
12.14.2 Requirements Traceability and Management
Requirements Management
Requirements traceability refers to the ability to follow the life of a requirement (from the
original specification) in both the forward and reverse directions through the entire design
process and the design. It should be clear that traceability is potentially a one-to-many
relationship between a requirement and the components it relates or traces to (or that
implement it). An accurate and complete record of traceability between requirements and
system components provides several important pieces of information through the product
life cycle. Among these are included,
Embedded Systems- A Contemporary Design Tool Copyright 2004 Oxford Consulting, Ltd. - 78 -

Embedded Systems Design and Development Chapter 12
• The means for the project manager (potentially) the customer to monitor the
development progress.
• A path that can be used during the verification and validation of the product
against the original specification. Knowing where and how a specified
requirement has been implemented facilitates confirming that the requirement has
been faithfully implemented.
• A means of identifying which hardware or software modules are affected if a
requirement changes.
Requirements Management
Requirements management addresses
Requirement modifications
Changes
Improvements
Corrections
During the design, such changes are difficult to avoid for many reasons. Therefore a
clear procedure that facilitates a way to accommodate such modifications has to be used
during the whole design process.
12.15 Archiving the Project
When the product has finally been released to production, there is some work that
remains to be done. During development, a tremendous amount of important design
information has been produced. Most of that information must be retained for a variety of
reasons. If the product follows the typical life cycle, bugs that must be fixed will be
discovered as customers use the product, there will be future revisions, new features will
be expected and added, the next generation product will build on the current to name just
a few. The obvious question is what must be saved?
The problem of dealing with what to archive is no different from confronting the original
design. That said, we use the same approach and start at the top. The typical project will
have had many contributors. A basic list can include,
Embedded Systems- A Contemporary Design Tool Copyright 2004 Oxford Consulting, Ltd. - 79 -

Embedded Systems Design and Development Chapter 12
• Product Planning • Design and Development • Test • Manufacturing • Marketing • Sales
Each group will have information, knowledge, documentation, tools that will be
important in future. Let’s focus on the technical subset of these: design and
development, test, and manufacturing. In earlier studies of safe and robust design, we
identified a typical software project directory structure. That diagram is presented here
for reference.
Binaries
Project
Sources Tools DocumentationMakefiles Specifications Data DictionaryLibraries
Each of the groups participating in the development should have a similar directory
ts are
Now, the less obvious. Today, software, firmware, and software tools are essential to the
ng
In previous years, hardware was generally supported by hand drawn hard copy
rs by
),
have supplanted the old methods.
documenting their portion of the project. The project directories and all their conten
one of the main items that must be archived. These are obvious.
design and development of any embedded system. If the source code it is lost or the
ability to rebuild from sources is lost, any future work on the project will be seriously
impaired. Today, source code no longer means just the C, C++, Java, or assembler listi
in electronic form or on magnetic media.
documentation. If a drawing was lost, it could be regenerated by skilled designe
reverse engineering the existing part. Today a rich set of CAD (computer aided design
CAM (computer aided manufacturing), and IC and FPGA modeling and synthesis tools
Embedded Systems- A Contemporary Design Tool Copyright 2004 Oxford Consulting, Ltd. - 80 -
Embedded Systems Design and Development Chapter 12
All of those tools run on a computer. All of those tools are routinely modified or updated
by their vendor. All of those tools
also have a product life cycle and ultimately will no
a
h a completely new environment or context. Next,
to
se is an important closure to the
chapter, we have introduced and studied the major phases of the development
ded systems. The more detailed aspects of that process are covered in
e
he complexity of contemporary systems now demands a more
k at
te
longer be supported. If the archived tools will not execute on today’s computer running
today’s operating system, they are of little use. Today, in addition to archiving the end
product, archiving the complete development environment – computer, hard drive,
operating system, etc. – is well worth considering. The documentation for the tools
should be included in that list as well.
An essential step once the collected archive has been set is to conduct what is called
virgin build. A virgin build begins wit
the archived tools are installed and set up. The tools are run, as appropriate, and tested
see if the designated components of the product can be recreated. If the process fails, the
missing components must be identified, added to the archive, and the process repeated.
Too often, over the span of the product development we build simple special purpose
tools to help manage the tasks of developing and building the system then forget that
they’re an essential part of the build or synthesis when creating the archive. The virgin
build quickly reveals when those tools are missing.
Today, the financial investment in all aspects of a project development is significant.
Retaining and protecting that investment for future u
cycle.
12.16 Summary
In this
process for embed
conjunction with the study of the design and test of the specific hardware and softwar
elements of the system.
We’ve see that design is process of translating customer requirements into working
system. We’ve learned t
formal approach and more formal methods. Following a formal specification, we loo
ways of partitioning the system as a step in developing a functional design. We formula
a functional model then develop and refine the model. Eventually we map our functional
Embedded Systems- A Contemporary Design Tool Copyright 2004 Oxford Consulting, Ltd. - 81 -

Embedded Systems Design and Development Chapter 12
model on to the architectural structure. We conclude with a working prototype,
meanwhile, analyzing the system design both during and after development.
We have looked at several other important considerations in the design lifecycle.
include intellectual property, component/module reuse, and requirements man
These
agement
and the archival process.
Embedded Systems- A Contemporary Design Tool Copyright 2004 Oxford Consulting, Ltd. - 82 -
Related Documents