Elevated amyloid b protein (Ab42) and late onset Alzheimer’s disease are associated with single nucleotide polymorphisms in the urokinase-type plasminogen activator gene Nilu ¨ fer Ertekin-Taner 1 , James Ronald 1 , Lars Feuk 3 , Jonathan Prince 3 , Michael Tucker 4,5 , Linda Younkin 1 , Maria Hella 1 , Shushant Jain 1 , Alyssa Hackett 1 , Leah Scanlin 1 , Jason Kelly 1 , Muthoni Kihiko-Ehman 4,5 , Matthew Neltner 4,5 , Louis Hersh 5 , Mark Kindy 5 , William Markesbery 5 , Michael Hutton 1 , Mariza de Andrade 6 , Ronald C. Petersen 7 , Neill Graff-Radford 2 , Steve Estus 4,5 , Anthony J. Brookes 3 and Steven G. Younkin 1, * 1 Department of Neuroscience and 2 Department of Neurology, Mayo Clinic Jacksonville, 4500 San Pablo Road, Jacksonville, FL 32224, USA, 3 Center for Genomics and Bioinformatics, Karolinska Institute, Stockholm, Sweden, 4 Department of Physiology and 5 Sanders-Brown Center on Aging, University of Kentucky, Lexington, KY, USA and 6 Department of Health Sciences Research and 7 Department of Neurology, Mayo Clinic Rochester, 200 First Street SW, Rochester, MN 55905, USA Received June 11, 2004; Revised October 8, 2004; Accepted December 10, 2004 Plasma amyloid b protein (Ab42) levels and late onset Alzheimer’s disease (LOAD) have been linked to the same region on chromosome 10q. The PLAU gene within this region encodes urokinase-type plasminogen activator, which converts plasminogen to plasmin. Ab aggregates induce PLAU expression thereby increas- ing plasmin, which degrades both aggregated and non-aggregated forms of Ab. We evaluated single nucleo- tide polymorphisms (SNPs) in PLAU for association with Ab42 and LOAD. PLAU SNP compound genotypes composed of haplotype pairs showed significant association with AD in three independent case–control series. PLAU SNP haplotypes associated significantly with plasma Ab42 in 10 extended LOAD families. One of the SNPs analyzed was a missense C/T polymorphism in exon 6 of PLAU (PLAU_1 5 rs2227564), which causes a proline to leucine change (P141L). We analyzed PLAU_1 for association with AD in six case–control series and 24 extended LOAD families. The CT and TT PLAU_1 genotypes showed association (P 5 0.05) with an overall estimated odds ratio of 1.2 (1.0 – 1.5). The CT and TT genotypes of PLAU_1 were also associated with significant age-dependent elevation of plasma Ab42 in 24 extended LOAD families (P 5 0.0006). In knockout mice lacking the PLAU gene, plasma—but not brain—Ab42 as well as Ab40 was significantly elevated, also in an age-dependent manner. The PLAU_1 associations were independent of the associations we found among plasma Ab42, LOAD and variants in the IDE or VR22 region. These results provide strong evidence that PLAU or a nearby gene is involved in the development of LOAD. PLAU_1 is a plausible pathogenic mutation that could act by increasing Ab42, but additional biological experiments are required to show this definitively. INTRODUCTION In previous studies, we and others showed that plasma amyloid b protein (Ab42) (1) and late onset Alzheimer’s disease (LOAD) (2) are linked to a locus at 81 cM on chromosome 10. Together these two independent studies provide strong evidence for a novel Alzheimer’s disease (AD) risk gene at this locus that acts on Ab42. The uroki- nase-type plasminogen activator gene (PLAU ) is located on chromosome 10q21–22 at 95 cM within the 1 2 LOD Human Molecular Genetics, Vol. 14, No. 3 # Oxford University Press 2005; all rights reserved *To whom correspondence should be addressed. Email: [email protected] Human Molecular Genetics, 2005, Vol. 14, No. 3 447–460 doi:10.1093/hmg/ddi041 Advance Access published on December 22, 2004 by guest on November 30, 2015 http://hmg.oxfordjournals.org/ Downloaded from

Welcome message from author
This document is posted to help you gain knowledge. Please leave a comment to let me know what you think about it! Share it to your friends and learn new things together.
Transcript
Elevated amyloid b protein (Ab42) and late onsetAlzheimer’s disease are associated with singlenucleotide polymorphisms in the urokinase-typeplasminogen activator gene
Nilufer Ertekin-Taner1, James Ronald1, Lars Feuk3, Jonathan Prince3, Michael Tucker4,5,
Linda Younkin1, Maria Hella1, Shushant Jain1, Alyssa Hackett1, Leah Scanlin1, Jason Kelly1,
Muthoni Kihiko-Ehman4,5, Matthew Neltner4,5, Louis Hersh5, Mark Kindy5, William Markesbery5,
Michael Hutton1, Mariza de Andrade6, Ronald C. Petersen7, Neill Graff-Radford2, Steve Estus4,5,
Anthony J. Brookes3 and Steven G. Younkin1,*
1Department of Neuroscience and 2Department of Neurology, Mayo Clinic Jacksonville, 4500 San Pablo Road,
Jacksonville, FL 32224, USA, 3Center for Genomics and Bioinformatics, Karolinska Institute, Stockholm, Sweden,4Department of Physiology and 5Sanders-Brown Center on Aging, University of Kentucky, Lexington, KY, USA and6Department of Health Sciences Research and 7Department of Neurology, Mayo Clinic Rochester,
200 First Street SW, Rochester, MN 55905, USA
Received June 11, 2004; Revised October 8, 2004; Accepted December 10, 2004
Plasma amyloid b protein (Ab42) levels and late onset Alzheimer’s disease (LOAD) have been linked to thesame region on chromosome 10q. The PLAU gene within this region encodes urokinase-type plasminogenactivator, which converts plasminogen to plasmin. Ab aggregates induce PLAU expression thereby increas-ing plasmin, which degrades both aggregated and non-aggregated forms of Ab. We evaluated single nucleo-tide polymorphisms (SNPs) in PLAU for association with Ab42 and LOAD. PLAU SNP compound genotypescomposed of haplotype pairs showed significant association with AD in three independent case–controlseries. PLAU SNP haplotypes associated significantly with plasma Ab42 in 10 extended LOAD families.One of the SNPs analyzed was a missense C/T polymorphism in exon 6 of PLAU (PLAU_1 5 rs2227564),which causes a proline to leucine change (P141L). We analyzed PLAU_1 for association with AD in sixcase–control series and 24 extended LOAD families. The CT and TT PLAU_1 genotypes showed association(P 5 0.05) with an overall estimated odds ratio of 1.2 (1.0–1.5). The CT and TT genotypes of PLAU_1 were alsoassociated with significant age-dependent elevation of plasma Ab42 in 24 extended LOAD families(P 5 0.0006). In knockout mice lacking the PLAU gene, plasma—but not brain—Ab42 as well as Ab40 wassignificantly elevated, also in an age-dependent manner. The PLAU_1 associations were independent ofthe associations we found among plasma Ab42, LOAD and variants in the IDE or VR22 region. These resultsprovide strong evidence that PLAU or a nearby gene is involved in the development of LOAD. PLAU_1 is aplausible pathogenic mutation that could act by increasing Ab42, but additional biological experiments arerequired to show this definitively.
INTRODUCTION
In previous studies, we and others showed that plasmaamyloid b protein (Ab42) (1) and late onset Alzheimer’sdisease (LOAD) (2) are linked to a locus at 81 cM on
chromosome 10. Together these two independent studiesprovide strong evidence for a novel Alzheimer’s disease(AD) risk gene at this locus that acts on Ab42. The uroki-nase-type plasminogen activator gene (PLAU ) is located onchromosome 10q21–22 at �95 cM within the 1 2 LOD
Human Molecular Genetics, Vol. 14, No. 3 # Oxford University Press 2005; all rights reserved
*To whom correspondence should be addressed. Email: [email protected]
Human Molecular Genetics, 2005, Vol. 14, No. 3 447–460doi:10.1093/hmg/ddi041Advance Access published on December 22, 2004
by guest on Novem
ber 30, 2015http://hm
g.oxfordjournals.org/D
ownloaded from
support interval of the linkage peak at 81 cM. Urokinase-typeplasminogen activator is a serine protease that converts plasmi-nogen to plasmin (3). PLAU expression is induced by Ab aggre-gates, and plasmin degrades both aggregated and non-aggregatedAb in vitro in a possible negative feedback loop. Thus, PLAUcould have an important role in controlling Ab aggregation,which is widely believed to play an important role in AD patho-genesis. Ab is the major proteinaceous component of senileplaques, one of the main pathologic hallmarks of AD (4). Abcomposed of 42(43) amino acids (Ab42) is present in all senileplaques, and Ab40 is also found in most cases (5). Ab42 wasshown to be elevated in serum, brain and cell culture studiesperformed in patients and animal models of familial AD due toknown autosomal dominant mutations (6–12). Some of thesestudies have also shown elevations in Ab40, though not asconsistently and to the same degree as Ab42. Thus, it is postu-lated that although both Ab42 and Ab40 associate with one ofthe pathogenic hallmarks of AD, owing to its consistent andmore prominent presence along with the biochemical propertiesof greater fibrillogenicity and aggregation potential, Ab42 is amore pathogenic biomarker of AD.
Given its genomic location and potential functionalrelevance to AD, we tested PLAU as a candidate gene forLOAD. PLAU is a relatively small, 5970 bp gene found onthe NT_008583 chromosome 10 contig and also defined bythe AF377330 sequence (www.ncbi.nlm.nih.gov). We geno-typed a total of seven single nucleotide polymorphisms(SNPs) spanning the whole length of this gene from the72nd to the 5885th bp. We found evidence for significantlinkage disequilibrium (LD) among these variants, allowingfor complex genotype analysis. In this article, we initiallydepict the results of the association analyses between plasmaAb42 and PLAU haplotypes in 10 LOAD families andbetween AD and PLAU compound genotypes forming the‘haplotype pairs’ in three case–control series. After establish-ing significant association between PLAU variants and twoAD phenotypes, plasma Ab42 levels and AD-affected status,we focus on a single missense mutation in a larger data setof 24 LOAD families and six case–control series.
The missense mutation is a variant in exon 6(rs2227564 ¼ PLAU_1) that causes a proline to leucinechange (P141L) within the kringle domain of PLAU at thejunction between two b-pleated sheets (13,14). The minor Tvariant of PLAU_1 does not appear to affect PLAU activity,but Yoshimoto et al. (14) have reported that the P141-PLAUzymogen binds fibrin aggregates less efficiently than theL141-PLAU zymogen, suggesting the possibility of alteredextracellular PLAU localization or stability.
Previously, Finckh et al. (15) have shown significant associ-ation between the major C/C genotype of rs2227564and LOAD in their series from Germany, Switzerland andItaly. In this article, we show evidence of significant associ-ation between LOAD and the minor allele of this variantand discuss potential reasons for the discrepancy. We findevidence of significant association with PLAU variants inboth extended LOAD families and independent case–controlseries using both plasma Ab42 and LOAD-affected status asthe phenotypes. In addition, we provide functional data fromPLAU knock out (KO) mice, supporting the role of this genein Ab metabolism. Our results are depicted subsequently.
RESULTS
Identification of SNPs, haplotypes and compoundgenotypes in PLAU
We identified six SNPs by sequencing PLAU exons in LOADfamily members. An additional SNP in exon 2 was identifiedusing the public SNP databases. The seven PLAU SNPs, theirlocations and NCBI SNP names are summarized in Table 1.These SNPs, which spanned 5.8 kb in the PLAU gene, wereanalyzed in the 10 LOAD families used to link plasmaAb42 to chromosome 10 (1). In addition, they were genotypedin three independent case–control series collected at MayoClinic Rochester (MCR), Mayo Clinic Jacksonville (MCJ)and University of Kentucky (UKy). The SNP allele frequen-cies, deviations from Hardy–Weinberg equilibrium (HWE)and allelic association results are summarized in Table 2.Given that the two exon 11 SNPs are in complete LD, theresults for only one of these exon 11 SNPs are summarizedin Table 2. In summary, the rare exon 2 SNP showedHardy–Weinberg disequilibrium in the MCJ and MCRseries in both the case and the control groups. Apart fromthis, there was only one instance where an SNP deviated signi-ficantly from the HWE in the control group (exon 6SNP ¼ PLAU_1 in MCJ controls).
From the PLAU SNP genotypes of the family members,PLAU SNP haplotypes were identified using the haplotypingalgorithm within the computer program Simwalk2 (17,18).Three major PLAU SNP haplotypes were identified, as werethree minor haplotypes. Collectively, the six PLAU SNPhaplotypes accounted for .95% of all of the haplotypes inthese families. The frequency of each PLAU SNP haplotypein the 10 AD families is summarized in Table 1. Becausethere was profound LD (D0 . 0.95 for all SNPs andd2 . 0.4 for all SNPs except exon 8 SNP), only five of theseven SNPs were required to construct all six haplotypes.
Table 3 summarizes the LD parameters, Lewontin’s stan-dardized disequilibrium coefficient (19) D0 and d2, estimatedfrom the founders in the 10 extended LOAD families. The pro-found LD between the SNPs can easily be appreciated in thistable. Exon 11 deletion mutant was in complete LD with theother exon 11 SNP. Exon 2 SNP was too rare to yield mean-ingful results. Thus, these two SNPs were omitted from the LDanalysis. LD was also estimated in the MCR, MCJ and UKyseries within the cases and controls and yielded similarresults. As each individual carries two haplotypes, wetermed the genotype formed by these two haplotypes as ‘com-pound genotypes’. As described subsequently, each compoundgenotype essentially unambiguously defines a haplotype pairdue to profound LD between PLAU SNPs and limited haplo-type diversity. We next tested for association betweenplasma Ab42 levels and PLAU haplotypes.
Association of PLAU variants with plasma Ab42 levelsin 10 LOAD families
To test for association between plasma Ab42 and PLAUvariants in family members, we used the variance componentsmethodology implemented in the computer program SOLAR(20). Using the within-pedigree identity-by-state model ofHopper and Mathews (21), PLAU SNP haplotypes were
448 Human Molecular Genetics, 2005, Vol. 14, No. 3
by guest on Novem
ber 30, 2015http://hm
g.oxfordjournals.org/D
ownloaded from
initially analyzed in family members between the ages of 20and 65 years because this was the age group in whichplasma Ab42 was linked to the chromosome 10 locus (1).In this age group, there was no significant associationbetween PLAU variants and plasma Ab42 levels (Table 4).Inspection of our data suggested that there might be an associ-ation between PLAU SNP haplotypes and plasma Ab42 inolder family members, so we performed a second analysisusing family members of all ages. Remarkably, this groupshowed significant association between PLAU SNP haplotypesand plasma Ab42 (P ¼ 0.02), with PLAU association account-ing for an estimated 12% of the total variance in Ab42.
Association of PLAU variants with AD in threecase–control series
Our working hypothesis is that any gene with variants influ-encing Ab42 is likely to have variants influencing risk forAD. To determine whether PLAU has variants that are associ-ated with AD in case–control series, we analyzed the PLAUSNPs in three independent series obtained at MCR, MCJand UKy. All three series were entirely composed of Cauca-sian subjects, and in every AD patient the age of onset was�59 years. Using the computer program GOLD (22) toanalyze the PLAU SNPs, we determined that there is profoundLD among the five PLAU SNPs in the case–control seriessimilar to the LOAD family founders (data not shown).
An important consequence of the profound LD among thefive PLAU SNPs that we analyzed was that there wererelatively few common genotypes such that 96–100% ofthe subjects were accounted for by only 12 compound geno-types (Table 5). In Table 5, the two haplotypes producingsix of the 12 compound genotypes (A, D, F, I, J and K)were unambiguous, because no more than one SNP was het-erozygous. Each of the remaining six genotypes is producedby one and only one pair of the six haplotypes identified inthe LOAD families (Table 1). The only other pairs thatcould produce these categories would include at least onehaplotype that is so rare it was never identified unambiguously
in the case–control series or by Simwalk2 haplotype analysisof the LOAD families. As these combinations will be rare, thePLAU SNP haplotypes in 96–100% of the subjects in ourLOAD case–control series were easily identified and essen-tially unambiguous (Table 5).
To evaluate association between AD and the compoundgenotypes summarized in Table 5, we performed x2-tests oneach series using the Monte Carlo approach (T1) implementedin CLUMP to determine significance. In each of the threeseries examined, these genotypes showed significant associ-ation with AD (MCR, P ¼ 0.001; MCJ, P ¼ 0.03 and UKy,P ¼ 0.03). Some compound genotypes tended to have thesame trends in two or more series analyzed (e.g. 2/2, 1/4and 3/5), suggesting the presence of functional variants onthe backbones of these genotypes.
After we found the association between PLAU ‘compoundgenotypes’ and three case–control series, MCR, MCJ andUKy, we tested for association between the missensePLAU_1 SNP and the larger data set of six case–controlseries, the results of which are depicted subsequently. Finally,we went back to test for association between PLAU compoundgenotypes and the three additional case–control series (Gothen-burg, Gothenburg-Postmortem, Scottish) and did not findsignificant association in these series (data not shown).
Association of PLAU_1 SNP (rs2227564) with plasmaAb42 levels in 24 LOAD families
Of the PLAU variants analyzed, rs2227564, which we intern-ally termed PLAU_1, is a relatively common missense SNP,which leads to a proline to leucine change in the kringledomain of PLAU at the junction between two b-pleatedsheets (13,14) and has been shown to have a functionaleffect on the fibrin binding of PLAU zymogen (14). To deter-mine whether PLAU_1 genotypes are associated with plasmaAb42, we analyzed a larger set of 24 extended LOADfamilies, which includes the original group of 10 families.To take family relationships into account, these analyses
Table 1. PLAU SNPs and haplotypes
PLAU Ex 2a Ex 6b Int 7b Ex 8b Int 9b Ex 11b Ex 11a
Bpc 2249 3995 4625 4773 5634 7358 8061VAL/leud PRO/leud
rs2227580 rs2227564 Rs2227566 rs2227568 rs2227571 rs4065 rs22275741 (54%)e G C T C T T O2 (12%) G C C Tf C C G3 (26%) G Tf C C C C G4 (0.4%) Tf C C C C T O5 (4%) G C C C C C G6 (2%) G C T C C T O
PLAU SNP haplotypes were constructed from the seven SNPs identified in exons 2, 6, 8, 11 and introns 7 and 9 of PLAU gene.aThese SNPs yield redundant information for haplotype construction, therefore they were excluded from the statistical analyses.bThese SNP genotypes are required to construct the major haplotypes. They were used in all of the statistical analyses.cThe bp locations of the PLAU SNPs are based on the NCBI GenBank PLAU gene sequence AF377330 (URL: http://www.ncbi.nlm.nih.gov/).dThese SNPs lead to amino acid changes. The amino acid for the common SNP allele is shown in capital letters and that for the rare SNP is shown insmall letters.eThe six common SNP haplotypes (and their frequencies in the 24 LOAD families).fThese variants are unique to their respective haplotypes. They are not found on any other major haplotypes.
Human Molecular Genetics, 2005, Vol. 14, No. 3 449
by guest on Novem
ber 30, 2015http://hm
g.oxfordjournals.org/D
ownloaded from
were performed using variance components methodologyimplemented in the program SOLAR (20).
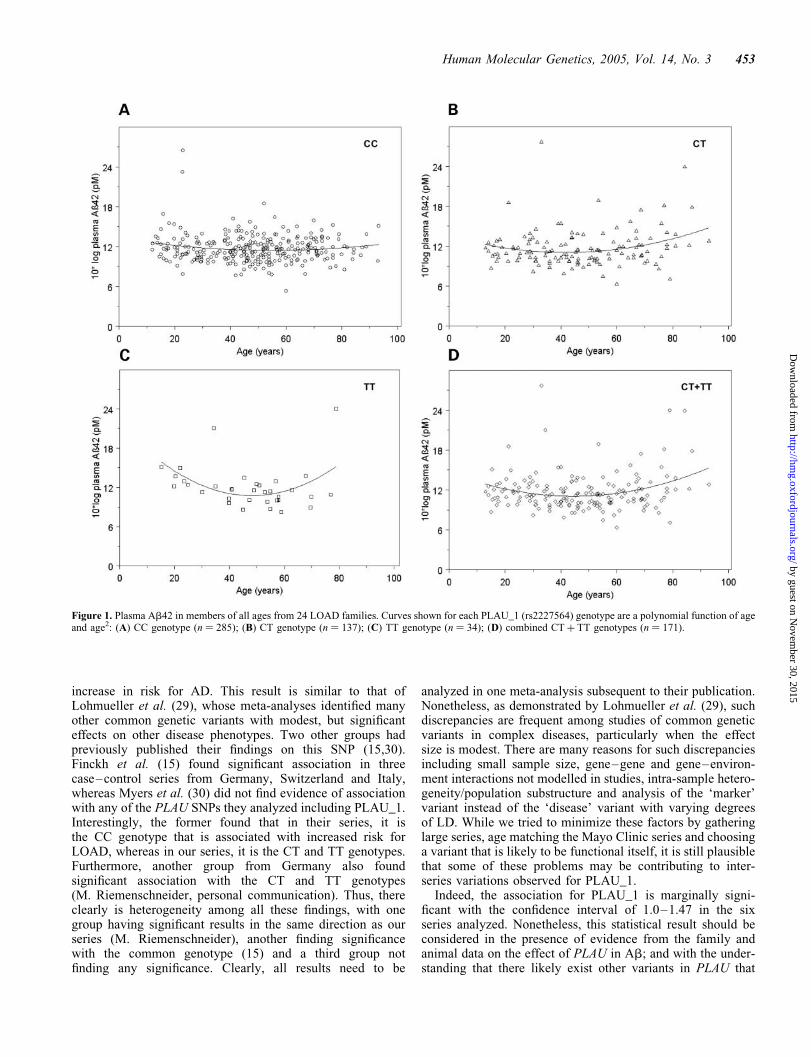
In the members of these 24 families, the change that occursin plasma Ab42 with aging is complex. Plasma Ab42, whichis elevated in young subjects, first decreases and then increasesagain with age .50. This is shown in Figure 1, where plasma
Ab42 stratified by PLAU_1 genotype is plotted as a functionof age. Non-linear analysis, in which we analyzed age, age(2)
and PLAU_1 genotype (CC, CT, TT or CT þ TT) and theinteractions among age, age(2) and PLAU_1 genotype inthe variance components framework, showed a significantage-dependent association between plasma Ab42 and
Table 2. PLAU SNP frequencies
MCJ-AD MCJ-NODEM MCR-AD MCR-NODEM UKY-AD UKY-NODEM 24 Families
Ex2G 299 (98%) 270 (99%) 448 (99%) 446 (99%) NA NA 290 (100%)T 5 (2%) 2 (1%) 4 (1%) 6 (1%) NA NA 0 (0%)Sum 304 272 452 452 NA NA 290HWE-Pa ,0.05 ,0.05 ,0.05 ,0.05 NA NA 0.500x2b NA NA NAPc NA NA NAOddsd NA NA NA
Ex6C 234 (71%) 245 (75%) 327 (72%) 355 (78%) 168 (74%) 251 (78%) 216 (74%)T 94 (29%) 83 (25%) 127 (28%) 99 (22%) 58 (26%) 69 (22%) 76 (26%)Sum 328 328 454 454 226 320 292HWE-P 0.09 0.03 0.11 0.11 0.01 0.13 0.18x2 NA 4.295 NAP NA 0.04 NAOdds NA 1.393 (1.018–1.906) NA
Int7T 147 (47%) 176 (54%) 223 (50%) 273 (60%) 127 (56%) 186 (58%) 124 (42%)C 165 (53%) 152 (46%) 223 (50%) 179 (40%) 99 (44%) 134 (42%) 170 (58%)Sum 312 328 446 452 226 320 294HWE- P 0.07 0.29 0.10 0.44 0.45 0.25 0.27x2 2.483 9.401 0.131P 0.12 0.003 0.72Odds NA 1.525 (1.161–2.004) NA
Ex8C 269 (82%) 267 (82%) 367 (83%) 379 (86%) 187 (83%) 264 (83%) 255 (87%)T 59 (18%) 59 (18%) 77 (17%) 61 (14%) 39 (17%) 56 (18%) 37 (13%)Sum 328 326 444 440 226 320 292HWE-P 0.36 0.24 0.06 0.10 0.40 0.06 0.40x2 0 1.775 0P 1.00 0.18 1.00Odds NA NA NA
Int9T 155 (48%) 175 (54%) 220 (48%) 269 (59%) 125 (55%) 177 (55%) 114 (44%)C 171 (52%) 149 (46%) 234 (52%) 185 (41%) 101 (45%) 143 (45%) 144 (56%)Sum 326 324 454 454 226 320 258HWE-P 0.03 0.41 0.08 0.26 0.29 0.27 0.39x2 NA 10.21 0P NA 0.002 1.00Odds NA 1.547 (1.18–.028) NA
Ex11T 68 (54%) 51 (55%) 230 (51%) 280 (63%) 127 (56%) 187 (58%) 124 (42%)C 58 (46%) 41 (45%) 218 (49%) 168 (38%) 99 (44%) 133 (42%) 170 (58%)Sum 126 92 448 448 226 320 294HWE-P 0.25 0.25 0.29 0.44 0.45 0.20 0.17x2 0.006 10.928 0.189P 0.94 0.001 0.66Odds NA 1.580 (1.2–2.08) NA
PLAU SNP frequencies are summarized for the AD and control groups in three case–control series, MCR, MCJ and UKy, as well as the 24 LOADfamilies.aP-value for HWE.bx2-value for allelic association.cP-value for the allelic association.dOR for the allelic association.
450 Human Molecular Genetics, 2005, Vol. 14, No. 3
by guest on Novem
ber 30, 2015http://hm
g.oxfordjournals.org/D
ownloaded from
PLAU_1 CT and TT genotypes (CT � age, TT � age(2), CT þ
TT � age(2) and age(2) were all significant at P , 0.05)(Table 6). As our main concern was to determine whetherthere is a significant age-dependent elevation of plasmaAb42 in elderly subjects associated with the CT, TT orpooled CT þ TT genotypes, we performed a second analysisin which family members .50 years (Fig. 2) were analyzedusing linear regression in the variance components framework.This analysis showed that the CT � age and TT � age covari-ates had significant effects (P ¼ 0.003 and P ¼ 0.007, respect-ively) in the 24 LOAD families (Table 7). When the CT andTT variables were tested as a single CT þ TT variable, theCT þ TT � age covariate was even more significant(P ¼ 0.0006). It is noteworthy that even when we correct forthe fact that three age groups were tested prior to the analysisof the �50 age group summarized in Table 7, using the mostconservative approach of Bonferroni correction, there is stillhighly significant age-related PLAU genotype effect in thesefamilies (overall corrected P-values are 0.000024 for Model1 and 0.00006 for Model 2).
On the basis of these findings, when we re-analyzed thehaplotypic associations in the 10 LOAD families for subjects�50 years of age, the association was even more significant atP ¼ 0.005 (Table 4). We subsequently went back to analyzethe haplotypes in the 24 families in this age group, whichaccounted for 22% of the total variance in the plasma Ab42phenotype and was also significant (P ¼ 0.009, data notshown).
Association of PLAU_1 SNP (rs2227564) with AD in sixcase–control series
We initially analyzed three series from two groups, MCR andMCJ series from Mayo Clinic and UKy series from theUniversity of Kentucky. To analyze the missense PLAU_1SNP, we obtained three more series from our collaboratorsat Karolinska Institute: the Gothenburg LOAD-controlseries, an autopsy-confirmed LOAD series from Gothenburgand a Scottish early onset AD (LOAD) series.
In the MCR series, significant association was observed forthe CT (P ¼ 0.006) and CT þ TT (P ¼ 0.008) genotypes withodds ratio (OR) of 1.7 (1.2–2.6) and 1.7 (1.1–2.4), respect-ively. The TT genotype was enriched in the LOAD patientsof the MCR series, but this enrichment did not achieve signi-ficance. In the UKy series, the first series where PLAU_1 was
analyzed, the TT genotype showed significant (P ¼ 0.029)association with LOAD and had an OR of 3.5 (1.1–10.7).Three of the four remaining series (MCJ, Gothenburg andScottish) showed some non-significant enrichment of the CTand/or TT genotypes (Table 8), but this did not occur in theautopsy-confirmed Gothenburg series. Testing for homo-geneity (Breslow–Day) showed no evidence for heterogeneityamong the six series (P ¼ 0.45), and meta analysis gave apooled estimate of the OR for the CT þ TT genotype of1.21 (1.0–1.47) with a fixed effects P ¼ 0.056 and a randomeffects P ¼ 0.051 (Fig. 3).
Analysis of Ab in PLAU knockout mice
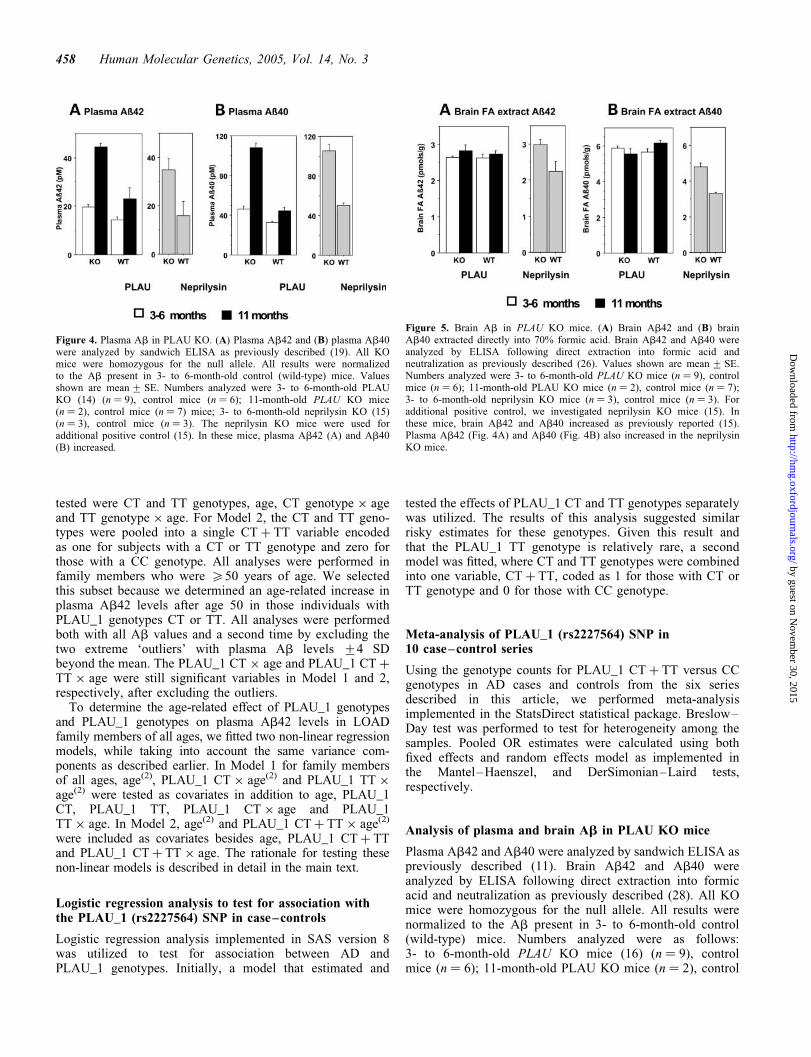
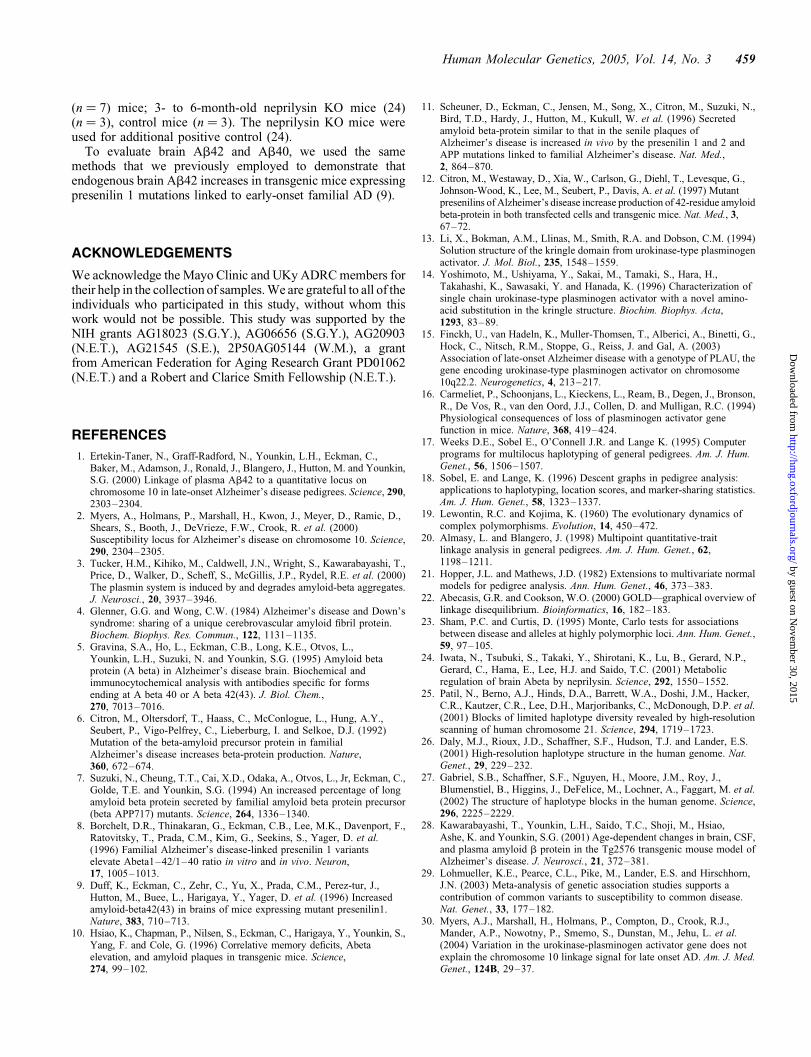
Our finding that PLAU variants are associated with elevatedplasma Ab42 predicts that plasma Ab42 should be elevatedin KO mice lacking a functional PLAU gene. To test this,we analyzed plasma Ab42 in 11 PLAU KO mice (16) and14 control mice with the same genetic background. Forcomparison, KO mice lacking a functional neprilysin gene,which is known to be involved in Ab degradation (24), wereanalyzed in parallel. When compared with controls, 3 to6-month-old PLAU KO mice showed a highly significantincrease in plasma Ab42 (P ¼ 0.006 by Mann–Whitneytest) (Fig. 4A). Plasma Ab40 also increased (P ¼ 0.003) inthe PLAU KO mice (Fig. 4B). By 11 months, plasma Ab42and Ab40 increased and the difference between KO andcontrol mice appeared to increase in the small number ofmice analyzed (two PLAU KO versus six controls). Thus,the PLAU gene influences plasma Ab42 and our datasuggest that this effect may become more pronounced withaging, consistent with our genetic analyses in LOAD families.Remarkably, brain Ab42 (Fig. 5A) and Ab40 (Fig. 5B)showed no detectable increase in PLAU KO mice whencompared with control mice. The implications of this resultare presented in the Discussion.
Table 3. PLAU SNPs LD
Ex6 Int7 Ex8 Int9 Ex11
Ex6 1 1 0.953 0.956Int7 0.484 1 0.974 0.975Ex8 0.05 0.216 1 1Int9 0.408 0.883 0.201 0.974Ex11 0.453 0.928 0.222 0.861
The LD statistics on the five PLAU SNPs calculated from the founders inthe 10 LOAD families. The MCR, MCJ, UKy cases and controls werealso calculated separately and yielded similar results. The table depictsD0 on upper right hand half and d2 on lower left hand half.
Table 4. Association of PLAU SNP haplotypes with plasma Ab42 in 10 LOADfamilies
Variable Parameter (SE)a
All ages(10 families)
.50(10 families)
20–65(10 families)
N 292 117 204Mean 11.66 (0.27) 11.59 11.30 (0.29)Additive genetic 0.06 (0.11) 0.20 (0.21) 0.38 (0.18)Household 0.05 (0.06) 0 (NA) 0.13 (0.11)Association 0.12 (0.08) 0.32 (0.13) 0.08 (0.11)Environment 0.76 (0.12) 0.48 (0.23) 0.41 (0.15)Log likelihood
(no association)2361.73 2127.60 2199.47
Log likelihood(with association)
2359.69 2124.23 2199.22
P association 0.02 0.005 0.24
The association for PLAU haplotypes were tested using the within-pedigree identity-by-descent approach by Hopper and Matthews asdescribed in detail in Materials and Methods. The test has one degreeof freedom (association fixed versus association tested) and is one-sided.aEstimates of the parameters (and standard errors).
Human Molecular Genetics, 2005, Vol. 14, No. 3 451
by guest on Novem
ber 30, 2015http://hm
g.oxfordjournals.org/D
ownloaded from
DISCUSSION
Identification of an LOAD risk locus on chromosome 10 (2),which also affects plasma Ab (1) levels in extended LOADfamilies, has led to the search for genes that are goodfunctional candidates in this region. PLAU is both agood functional and a good positional candidate gene that con-verts plasminogen to plasmin, which in turn degrades Ab. Wegenotyped seven SNPs within this relatively small gene span-ning almost its entire length. We found that these SNPs werein profound LD with each other leading to limited haplotypediversity in the region analyzed, a finding consistent withprevious work (25–27). The limited haplotype diversityallowed us to perform association analysis using the com-pound genotypes that make up the haplotype pair for eachsubject. The advantage of this approach is that it does notrequire phase information as each compound genotype formsa group per se. Nonetheless, given the small number of com-pound genotypes observed in all series, one can identify theunderlying haplotype pair for .95% of all subjects essentiallyunambiguously. The other advantage of the compound geno-type approach is that it allows for the analysis of the ‘haplo-type pair’ rather than individual haplotypes. Thus, variantsthat are effective in an additive fashion, but not when encoun-tered alone, will be easier to identify using this approach. Wedetermined significant association between the PLAU com-pound genotypes with AD in three independent case–controlseries.
We then analyzed a common missense SNP, PLAU_1(rs2227564) in a larger set of 24 families and six case–control series that include the initial series analyzed. In theextended families, this SNP was associated with an age-related elevation in plasma Ab levels in individuals .50years of age. Plasma Ab displays a complex characteristic inthat it appears to decline in an age-related fashion until
50 years of age and increase thereafter. This characteristic ismuch more pronounced in subjects who have the CT or TTgenotype for PLAU_1. It is also noteworthy that the signifi-cance of association with PLAU haplotypes is enhancedwhen the .50 age group is analyzed separately in the 10families, as expected (Table 4). The finding of age-relatedincrease in Ab is also evident in the plasma Ab of PLAUKO mice, consistent with the finding in humans. These micehave significantly higher plasma Ab levels when comparedwith wild-type littermates; however, their brain Ab levelsdid not show significant difference. This finding could haveseveral explanations. This may suggest that PLAU variantsinfluence AD through an effect on plasma but not brainAb42. While this is conceivable, it is more likely that PLAUinfluences both plasma and brain Ab in a way that is notevident in KO mice. Thus, PLAU may have a greater influenceon secreted than on cell-associated Ab. As most brain Ab iscell-associated (28), effects on secreted Ab that are easilydetected in plasma could be hard to detect in brain. Alterna-tively, compensatory changes triggered by PLAU KO maymaintain brain Ab more effectively than plasma Ab.
We analyzed PLAU_1 in six case–control series usingmeta-analysis. Lohmueller et al. (29) reported their meta-analyses of published genetic associations with variousdisease phenotypes. Of the 25 reported associations that theyinvestigated by meta-analysis, eight showed significant associ-ation that replicated the original study, with most ORs in the1.1–2.0 range. On the basis of these findings, the authors rec-ommended that large, collaborative genetic association studiesshould be encouraged, that all sound studies, positive or nega-tive, should be published and that reports of association shouldinclude a meta-analysis of all available data. Our meta-analyses of the PLAU_1 SNP in six case–control series indi-cate that the PLAU_1 CT þ TT is associated with a modest(OR ¼ 1.21), but marginally significant (P ¼ 0.051–0.056)
Table 5. Association of PLAU compound genotypes with AD in three case–control series
PLAU SNP genotypes Compound genotype(haplotype pairs)a
MCR MCJ UKy
Ex 6 Int 7 Ex 8 Int 9 Ex 11 AD (%) CON (%) AD (%) CON (%) AD (%) CON (%)
CC TT CC TT TT A (1/1) 43 (21.08) 77 (37.75) 27 (18.24) 43 (29.05) 36 (31.86) 47 (29.38)CC CT CT CT CT B (1/2) 32 (15.69) 35 (17.16) 27 (18.24) 27 (18.24) 27 (23.89) 32 (20.00)CT CT CC CT CT C (1/3) 64 (31.37) 40 (19.61) 48 (32.43) 39 (26.35) 26 (23.01) 40 (25.00)CC CC TT CC CC D (2/2) 9 (4.41) 2 (0.98) 6 (4.05) 4 (2.70) 3 (2.65) 2 (1.25)CT CC CT CC CC E (2/3) 19 (9.31) 13 (6.37) 11 (7.43) 20 (13.51) 6 (5.31) 16 (10.00)TT CC CC CC CC F (3/3) 13 (6.37) 13 (6.37) 9 (6.08) 5 (3.38) 12 (10.62) 5 (3.13)CC CT CC CT TT G (1/4) 3 (1.47) 2 (0.98) 5 (3.38) 0 (0.00) 0 (0.00) 0 (0.00)CC CT CC CT CT H (1/5) 8 (3.92) 10 (4.90) 0 (0.00) 2 (1.35) 0 (0.00) 5 (3.13)CC TT CC CT TT I (1/6) 5 (2.45) 2 (0.98) 3 (2.03) 2 (1.35) 0 (0.00) 5 (3.13)CC CC CT CC CC J (2/5) 2 (0.98) 0 (0.00) 2 (1.35) 2 (1.35) 0 (0.00) 0 (0.00)CT CC CC CC CC K (3/5) 5 (2.45) 2 (0.98) 4 (2.70) 0 (0.00) 1 (0.88) 1 (0.63)CT CT CC CC CT L (3/6) 0 (0.00) 3 (1.47) 0 (0.00) 0 (0.00) 1 (0.88) 2 (1.25)
Otherb 1 (0.49) 5 (2.45) 6 (4.05) 4 (2.70) 1 (0.88) 5 (3.13)
Total number of subjects 204 204 148 148 113 160CLUMP T1 0.001 0.032 0.034
aThe 12 most common compound genotypes are summarized. The haplotypes comprising six of the compound genotypes can be identified unambi-guously, because there is no more than one heterozygote SNP among the five-SNPs genotyped. These unequivocal haplotypes are A, D, F, I, J andK. For the remaining compound genotypes, the underlying haplotypes are essentially unambiguous as described in the text.bAll remaining rare compound genotypes are grouped into a single category named ‘Other’.
452 Human Molecular Genetics, 2005, Vol. 14, No. 3
by guest on Novem
ber 30, 2015http://hm
g.oxfordjournals.org/D
ownloaded from
increase in risk for AD. This result is similar to that ofLohmueller et al. (29), whose meta-analyses identified manyother common genetic variants with modest, but significanteffects on other disease phenotypes. Two other groups hadpreviously published their findings on this SNP (15,30).Finckh et al. (15) found significant association in threecase–control series from Germany, Switzerland and Italy,whereas Myers et al. (30) did not find evidence of associationwith any of the PLAU SNPs they analyzed including PLAU_1.Interestingly, the former found that in their series, it isthe CC genotype that is associated with increased risk forLOAD, whereas in our series, it is the CT and TT genotypes.Furthermore, another group from Germany also foundsignificant association with the CT and TT genotypes(M. Riemenschneider, personal communication). Thus, thereclearly is heterogeneity among all these findings, with onegroup having significant results in the same direction as ourseries (M. Riemenschneider), another finding significancewith the common genotype (15) and a third group notfinding any significance. Clearly, all results need to be
analyzed in one meta-analysis subsequent to their publication.Nonetheless, as demonstrated by Lohmueller et al. (29), suchdiscrepancies are frequent among studies of common geneticvariants in complex diseases, particularly when the effectsize is modest. There are many reasons for such discrepanciesincluding small sample size, gene–gene and gene–environ-ment interactions not modelled in studies, intra-sample hetero-geneity/population substructure and analysis of the ‘marker’variant instead of the ‘disease’ variant with varying degreesof LD. While we tried to minimize these factors by gatheringlarge series, age matching the Mayo Clinic series and choosinga variant that is likely to be functional itself, it is still plausiblethat some of these problems may be contributing to inter-series variations observed for PLAU_1.
Indeed, the association for PLAU_1 is marginally signi-ficant with the confidence interval of 1.0–1.47 in the sixseries analyzed. Nonetheless, this statistical result should beconsidered in the presence of evidence from the family andanimal data on the effect of PLAU in Ab; and with the under-standing that there likely exist other variants in PLAU that
Figure 1. Plasma Ab42 in members of all ages from 24 LOAD families. Curves shown for each PLAU_1 (rs2227564) genotype are a polynomial function of ageand age2: (A) CC genotype (n ¼ 285); (B) CT genotype (n ¼ 137); (C) TT genotype (n ¼ 34); (D) combined CT þ TT genotypes (n ¼ 171).
Human Molecular Genetics, 2005, Vol. 14, No. 3 453
by guest on Novem
ber 30, 2015http://hm
g.oxfordjournals.org/D
ownloaded from
affect the risk of AD, as suggested by the ‘compound geno-type’ data in the case–control series. Furthermore, given thelikely presence of important variants in other genes, such asVR22 and IDE, the finding of highly significant P-values forvariants of modest effect in complex diseases may need toawait the identification of most, if not all, functionalmutations in multiple genes and their analyses in multiplelarge series.
We recently published our findings of significant associ-ation in two other genes on chromosome 10 (31,32), IDEand VR22. When we tested the key variants in all threegenes, we did not find evidence of LD. Joint analysis of thekey variants demonstrates separate, independent effects. Ofall of the variants, only those in VR22 account for thelinkage on chromosome 10. PLAU variants are differentfrom the other two in their age-related effects that manifestthemselves more strongly after age 50. Thus, each of thesegenes appears to act independently of one another via appar-ent separate mechanisms. While the unequivocal effects ofthese genes in the pathogenesis of AD await the identificationof all of the functional variants and testing them in largeseries, these findings provide evidence for the existence ofLOAD risk variants that affect Ab, within and/or in the vicin-ity of these genes.
MATERIALS AND METHODS
Subjects
We initially collected 10 extended LOAD families. Four ofthese families were collected via an LOAD patient who hadextremely high plasma Ab42 and/or Ab40 levels (‘extremes’,top 10th percentile of the 545 AD patients in our series). Theremaining six families were ascertained via a LOAD probandwho had multiple relatives with LOAD, without prior Abmeasurements (‘non-extremes’). One of the probands fromthe ‘non-extreme’ families was determined to have extremelyhigh-plasma Ab levels after the family collection; therefore,this family was grouped with the ‘extreme families’ sub-sequently. The detailed collection strategies and family pro-files for these families are provided elsewhere (1). Inaddition to these 10 families, 14 independent extendedLOAD pedigrees were subsequently collected. Theseadditional pedigrees were collected via a proband who was afirst-degree relative of a LOAD patient. All except one ofthese probands for the 14 additional pedigrees had elevatedplasma Ab levels. The LOAD families studied in this articlelacked a clear autosomal dominant mode of segregationfor AD.
In addition to the extended LOAD families, six differentcase–control series were analyzed in this study. These seriesare named as follows: Mayo Clinic Rochester (MCR), MayoClinic Jacksonville (MCJ), University of Kentucky (UKy),Gothenburg, Gothenburg-Postmortem and Scottish. MCRsamples were collected as part of the Mayo Clinic Alzheimer’sdisease patient registry, a community-based prospective regis-try and the Mayo Clinic Rochester memory disorders cliniccase–control series. MCJ samples were collected at MayoClinic Jacksonville memory disorders clinic. UKy serieswere collected as part of the University of Kentuckymemory disorders clinic and BRAINS program. MCR, MCJand UKy series consisted of Caucasian subjects from theUnited States. The Gothenburg and Gothenburg-Postmortemseries consisted of Swedish AD cases recruited from a pro-spective longitudinal study of patients with dementia (TheMolndal prospective dementia study). Swedish controls con-sisted of healthy volunteers (Gothenburg) and autopsy cases(Gothenburg-Postmortem). Finally, the Scottish sampleswere composed of EOAD patients from the Lothian Psychia-tric case register, and Scottish controls consisting of localchurch congregation volunteers from the Lothian region.The EOAD materials were selected from non-familial cases,and the most common presenilin-I mutations have beenscreened for. The few positives found were discarded fromthe test set.
Clinical AD diagnoses in all series were made according tothe NINCDS-ADRDA criteria (33). All neuropathologicallydiagnosed AD patients (Gothenburg-Postmortem) alsofulfilled the clinical NINCDS criteria for probable AD andmet the neuropathological CERAD criteria for definitiveAD. The ADs in all series except the Scottish series hadages of onset �59 years.
This study was approved by the appropriate institutionalreview boards, and appropriate informed consent was obtainedfrom all participants.
Table 6. Association of PLAU exon 6 SNP with plasma Ab42 in members ofall ages from 24 LOAD families
Variable Coefficient (SE)a Pb-value
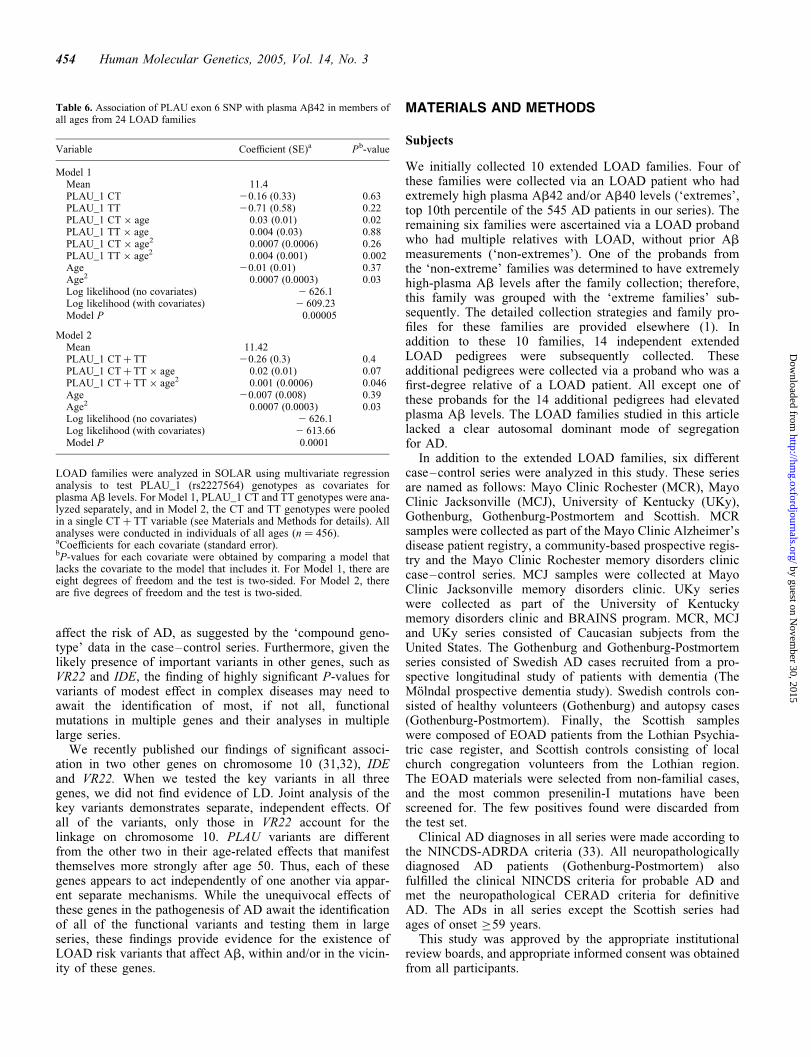
Model 1Mean 11.4PLAU_1 CT 20.16 (0.33) 0.63PLAU_1 TT 20.71 (0.58) 0.22PLAU_1 CT � age 0.03 (0.01) 0.02PLAU_1 TT � age 0.004 (0.03) 0.88PLAU_1 CT � age2 0.0007 (0.0006) 0.26PLAU_1 TT � age2 0.004 (0.001) 0.002Age 20.01 (0.01) 0.37Age2 0.0007 (0.0003) 0.03Log likelihood (no covariates) 2 626.1Log likelihood (with covariates) 2 609.23Model P 0.00005
Model 2Mean 11.42PLAU_1 CT þ TT 20.26 (0.3) 0.4PLAU_1 CT þ TT � age 0.02 (0.01) 0.07PLAU_1 CT þ TT � age2 0.001 (0.0006) 0.046Age 20.007 (0.008) 0.39Age2 0.0007 (0.0003) 0.03Log likelihood (no covariates) 2 626.1Log likelihood (with covariates) 2 613.66Model P 0.0001
LOAD families were analyzed in SOLAR using multivariate regressionanalysis to test PLAU_1 (rs2227564) genotypes as covariates forplasma Ab levels. For Model 1, PLAU_1 CT and TT genotypes were ana-lyzed separately, and in Model 2, the CT and TT genotypes were pooledin a single CT þ TT variable (see Materials and Methods for details). Allanalyses were conducted in individuals of all ages (n ¼ 456).aCoefficients for each covariate (standard error).bP-values for each covariate were obtained by comparing a model thatlacks the covariate to the model that includes it. For Model 1, there areeight degrees of freedom and the test is two-sided. For Model 2, thereare five degrees of freedom and the test is two-sided.
454 Human Molecular Genetics, 2005, Vol. 14, No. 3
by guest on Novem
ber 30, 2015http://hm
g.oxfordjournals.org/D
ownloaded from
Identification and genotyping of PLAU SNPs
Eleven members were selected from the 10 extended LOADfamilies that gave the linkage signal on chromosome 10 (1).The genomic DNA from five family members and two pro-bands with high-plasma Ab level and from two membersand two married-in spouses with low levels were sequenced.The samples came from four different families, three ofwhich had probands with ‘extreme high’ Ab levels. Intronicprimers flanking the PLAU exons were used for PCR amplifi-cation. All of the coding regions, �400 bp of the 50 untrans-lated region (50 UTR) and �1000 bp of the 30-UTR ofPLAU were sequenced. The sequencing was done via asemi-automated fluorescent method using an ABI377 sequen-cer and associated Factura software packages. The SNP data-bases at the National Center for Biotechnology Information(NCBI; URL: http://www.ncbi.nlm.nih.gov/SNP/) and Uni-versity of Washington and the Fred Hutchinson Cancer Res-earch Center (UW-FHCRC; URL: http://pga.mbt.washington.edu) were also screened for SNP identification. The SNPs
identified via the sequencing effort were used in the analysisas well as a rare missense SNP in exon 2 identified in the bio-informatics screen. When the seven SNPs, thus identified,were analyzed in haplotype analysis, it was determined thattwo of them, the missense exon 2 SNP and exon 11 deletionSNP yielded redundant information. Therefore, remainder ofthe analysis was carried out with five SNPs.
PLAU SNP frequencies estimated in MCJ, MCR, UKyseries and 24 LOAD families are summarized in Table 2. Ofall the SNPs tested in all these groups, the rare Exon 2 SNPis in Hardy–Weinberg disequilibrium in the control groupsin MCJ and MCR. This SNP is not used in the compound gen-otype analysis. In addition, exon 6 SNP is in Hardy–Weinbergdisequilibrium in the MCJ control series.
DNA was extracted from peripheral blood leukocytes usingroutine methods. The Gothenburg, Gothenburg-Postmortemand Scottish series were genotyped using dynamic allele specifichybridization (34,35). The other series were genotyped onan ABI7900 instrument using TaqMan technology. For theTaqMan assays, software for designing primers and probes
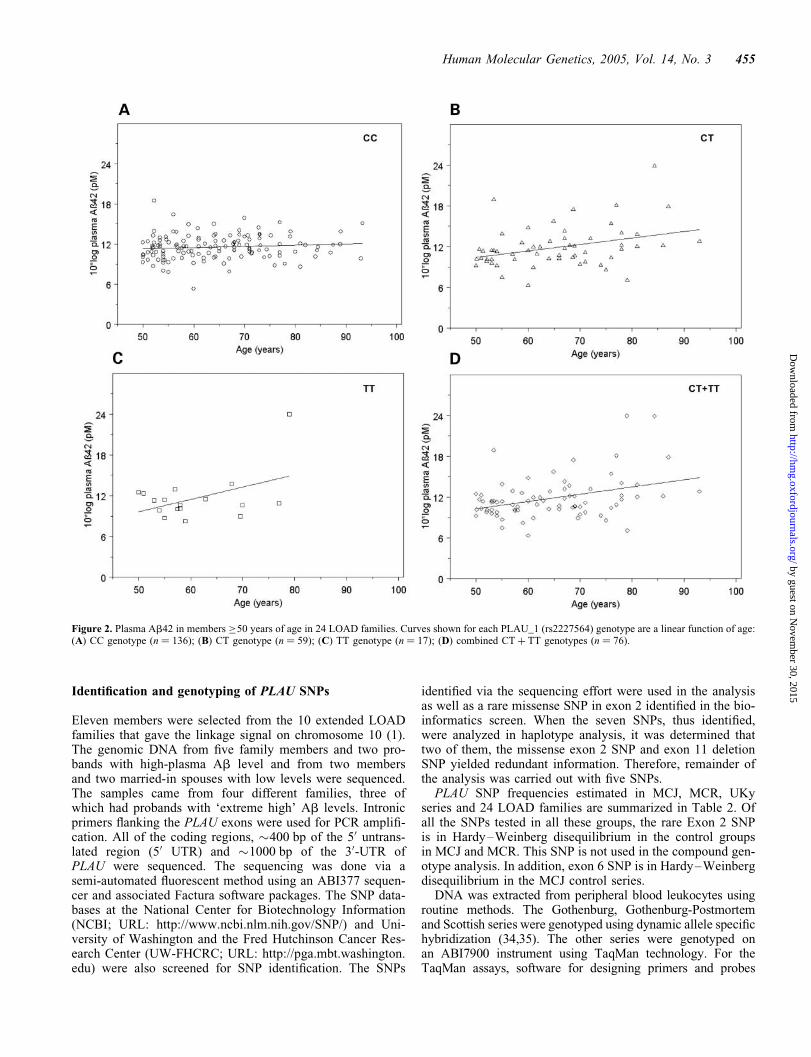
Figure 2. Plasma Ab42 in members �50 years of age in 24 LOAD families. Curves shown for each PLAU_1 (rs2227564) genotype are a linear function of age:(A) CC genotype (n ¼ 136); (B) CT genotype (n ¼ 59); (C) TT genotype (n ¼ 17); (D) combined CT þ TT genotypes (n ¼ 76).
Human Molecular Genetics, 2005, Vol. 14, No. 3 455
by guest on Novem
ber 30, 2015http://hm
g.oxfordjournals.org/D
ownloaded from
implemented within the ABI PRISM 7900 HT sequence detec-tion system was utilized. The NCBI GenBank PLAU genesequence AF377330 was used. The pedigree structure, phenoty-pic and genotypic information, was maintained in PEDSYS (36)(http://www.sfbr.org/sfbr/public/software/pedsys/pedsys.html),which also produced output files for the analysis performedwith SOLAR, as explained subsequently.
Analysis of LD among the SNPs
We measured LD between the SNPs within the 10 extendedLOAD families by using the GOLD program (22). Thisprogram determines various pairwise statistical parametersfor LD, such as Lewontin’s standardized disequilibrium co-efficient (19) D0 and d2. LD was detected from the foundersand married-ins using the expectation–maximization algor-ithm of Slatkin and Excoffier (37). We also detected LDwithin the ADs and controls from MCR, MCJ and UKyseries using the same program.
Tests of association between PLAU SNP haplotypes andplasma Ab levels in LOAD families
We estimated the haplotypes for the five PLAU SNPs geno-typed in the members of the ten LOAD families usingGOLD (22) and Simwalk2 (17). There was highly significantLD among all five PLAU SNPs, and no crossover events wereobserved. In our 10 extended LOAD families, we testedfor association between PLAU haplotypes and plasma Ab42
phenotype using the variance components method imple-mented in the computer program SOLAR (20).
This method, described in detail elsewhere (20), estimatesthe amount of variance in a quantitative trait owing to residualgenetic factors (sg
2), shared-family environment (s2h) and indi-
vidual specific, random environmental factors (s2e), based on
the phenotype covariance between arbitrary relative pairs.The covariance matrix takes the form
V ¼ 2s2gFþ s2
hH þ s2gI
where 2F is the matrix of kinship coefficients describing poly-genic factors, I is the identity matrix describing sporadicenvironmental factors and H is the household matrix. This isa matrix whose ijth element is equal to 1 if individuals i andj share a specified environment, and 0 otherwise. Our familycollection is largely composed of extended pedigrees, wherewe have measured the plasma Ab of most members fromeach family in a single batch of ELISAs. To rigorouslyaccount for any possible assay batch to batch variations thatmay affect the variance in plasma Ab, we included a house-hold matrix in the models. As almost all individuals fromeach family were measured in one batch, the householdmatrix included an element equal to 1 for those individualsfrom the same extended family, and 0 otherwise. We realizethat by doing so, we may be overly conservative. Our collec-tion is largely weighted towards families with high-Ab segre-gating within the family. Given that the shared-family effect(household) overlaps with kinship, we may have overcorrected and underestimated the shared-genetic effect byincluding the household term in the model. The scalars sg
2,sh
2 and se2 are estimated using maximum likelihood.
To formulate an association model for PLAU SNP haplo-types, we used the within-pedigree association model ofHopper and Mathews (21). Under this model, the matrix ofallelic sharing within pedigrees, C ¼ (cij), is defined such
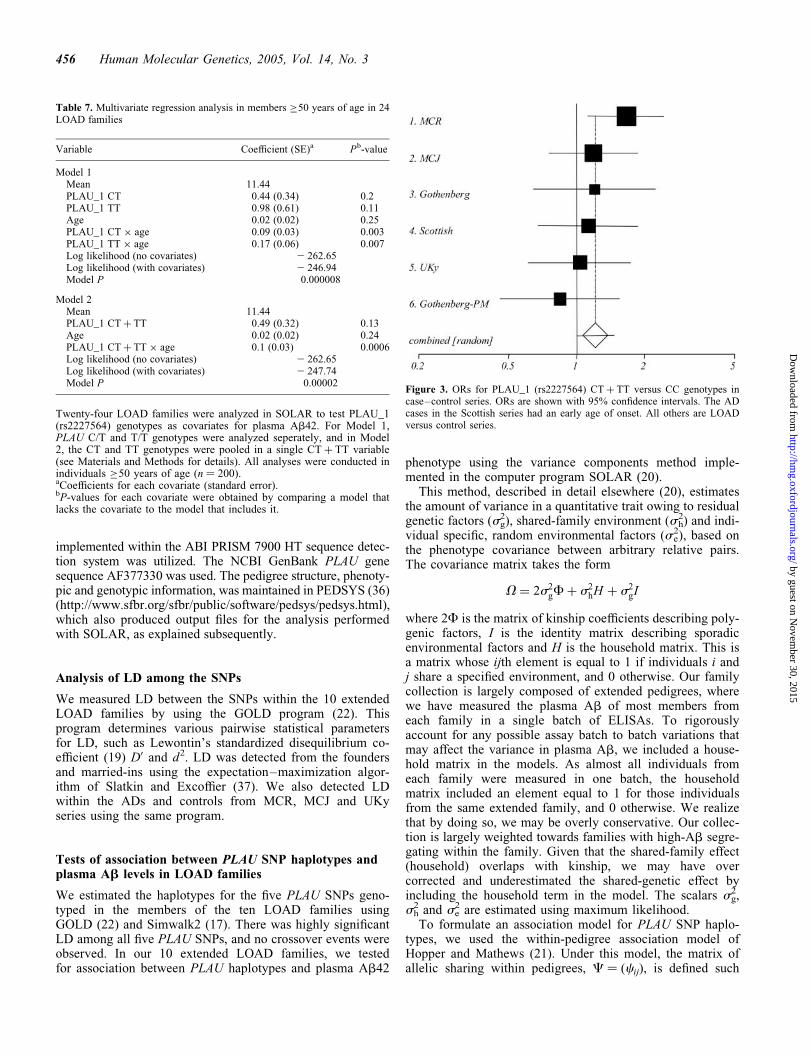
Figure 3. ORs for PLAU_1 (rs2227564) CT þ TT versus CC genotypes incase–control series. ORs are shown with 95% confidence intervals. The ADcases in the Scottish series had an early age of onset. All others are LOADversus control series.
Table 7. Multivariate regression analysis in members �50 years of age in 24LOAD families
Variable Coefficient (SE)a Pb-value
Model 1Mean 11.44PLAU_1 CT 0.44 (0.34) 0.2PLAU_1 TT 0.98 (0.61) 0.11Age 0.02 (0.02) 0.25PLAU_1 CT � age 0.09 (0.03) 0.003PLAU_1 TT � age 0.17 (0.06) 0.007Log likelihood (no covariates) 2 262.65Log likelihood (with covariates) 2 246.94Model P 0.000008
Model 2Mean 11.44PLAU_1 CT þ TT 0.49 (0.32) 0.13Age 0.02 (0.02) 0.24PLAU_1 CT þ TT � age 0.1 (0.03) 0.0006Log likelihood (no covariates) 2 262.65Log likelihood (with covariates) 2 247.74Model P 0.00002
Twenty-four LOAD families were analyzed in SOLAR to test PLAU_1(rs2227564) genotypes as covariates for plasma Ab42. For Model 1,PLAU C/T and T/T genotypes were analyzed seperately, and in Model2, the CT and TT genotypes were pooled in a single CT þ TT variable(see Materials and Methods for details). All analyses were conducted inindividuals �50 years of age (n ¼ 200).aCoefficients for each covariate (standard error).bP-values for each covariate were obtained by comparing a model thatlacks the covariate to the model that includes it.
456 Human Molecular Genetics, 2005, Vol. 14, No. 3
by guest on Novem
ber 30, 2015http://hm
g.oxfordjournals.org/D
ownloaded from
that cij ¼ 1 if individuals i and j are from the same pedigreeand share both alleles of a haplotype identical in state,cij ¼ 1/2 if individuals i and j are from the same pedigreeand share one allele identical in state and cij ¼ 0 otherwise.Under the ‘association’ model, SOLAR estimates the variancein the quantitative trait owing to association (sa
2), residualgenetic factors (sg
2), same-household effects (sh2) and environ-
mental effects (se2). Under the null-model of ‘no association’,
sa2 is fixed to zero. The difference between the log10 likeli-
hoods of these two models produces a test statistic with thesame distribution as the LOD score of genetic linkage analy-sis. There is one degree of freedom between the two models(association fixed, association tested) and one-sided test isperformed.
Tests of association in the LOAD case–control seriesby CLUMP
In our case–control series, we tested for association betweenthe PLAU compound genotypes and LOAD using CLUMP.The CLUMP program (23) measures the statistical signifi-cance of a variety of 2 � m contingency tables by simulation.We employed the T1 test within CLUMP, which analyzes theraw 2 � m table where m is the total number of categories. Inour application of CLUMP, the 2 � m table consisted of twodiagnostic categories and m genotypic categories, each corre-sponding to a unique combination of genotypes at the fivePLAU SNPs.
Ab analysis
Plasma Ab40 and Ab42 were measured as previouslydescribed (11). The relationship between plasma Ab42, ageand PLAU_1 genotypes in LOAD family members wasinitially analyzed by fitting polynomial regression curvesseparately for all family members with rs2227564 CC, CT,
TT or CT þ TT genotypes, using 10 log(Ab42) as the depen-dent variable and age and age(2) as the independent variables.These analyses showed genotype-specific age-related effectson plasma Ab42 levels and indicated that plasma Ab42increases with aging beginning at age 50 in those individualswith a CT or TT genotype.
We had used the 20–65 year age group in our previousstudies where we found linkage between plasma Ab levelsand a locus on chromosome 10 (1). As described previously,the 20–65 year age group was initially chosen because ofour observation that plasma Ab is elevated in individuals,25 and .65 years old. In addition, plasma Ab appears tohave complex likely deposition-related changes in individualswith AD, who are in the .65 age group. In this study, wedetermined significant age-related effects of PLAU_1 geno-types on plasma Ab levels in those individuals .50 years,depicted subsequent. Thus, all analyses were performed inthe ‘all ages’, ‘20- to 65-year-old’ and ‘.50 years’ groups.
Tests of association between the PLAU_1 (rs2227564)SNP and plasma Ab levels in LOAD families
We applied variance components methodology implementedin the software package SOLAR (20) to estimate the effectof covariates on plasma Ab levels, while controlling for thepairwise genetic relationships and shared-family effectsamong family members in the extended LOAD pedigrees.
We tested for the association of PLAU_1 genotypes onplasma Ab by performing a multivariate regression analysis,while including the kinship, identity and household matrices,described earlier, in the model. We tested two differentmodels. The significance and coefficients for all covariateswere tested using the polygenic-screen-all option of SOLAR,which provides a p-value and coefficient by comparing amodel that includes the covariate to a model that excludesit. This option causes all covariates to stay in the modelregardless of their significance. In Model 1, the covariates
Table 8. PLAU_1 (rs2227564) genotypes and Odds ratios in six AD case–control series
Series Dx n Age Genotype distributiona Odds ratios (95% CI)b
CTc TTc CT þ TTd
CC CT TT OR P-value OR P-value OR P-value
UKy AD 113 75.1 (0.6) 67 (0.59) 34 (0.30) 12 (0.11) 0.7 (0.4–1.3) 0.28 3.5 (1.1–10.7) 0.03 0.9 (0.6–1.6) 0.82Con 160 79.2 (0.6) 96 (0.60) 59 (0.37) 5 (0.03)
MCR AD 227 80.4 (0.5) 114 (0.50) 99 (0.44) 14 (0.6) 1.7 (1.2–2.6) 0.006 1.3 (0.6–2.7) 0.58 1.7 (1.1–2.4) 0.008Con 227 80.3 (0.5) 142 (0.63) 71 (0.31) 14 (0.6)
MCJ AD 164 78.3 (0.4) 80 (0.49) 74 (0.45) 10 (0.6) 1.1 (0.7–1.8) 0.56 1.8 (0.6–5.2) 0.27 1.2 (0.8–1.9) 0.42Con 164 77.8 (0.4) 87 (0.53) 71 (0.43) 6 (0.4)
Goth AD 111 75.3 (0.7) 54 (0.49) 46 (0.41) 11 (0.10) 1.2 (0.6–2.3) 0.69 0.8 (0.3–2.4) 0.69 1.1 (0.6–2.0) 0.84Con 77 68.8 (0.9) 41 (0.53) 28 (0.36) 8 (0.10)
Goth PM AD 93 80.2 (0.9) 49 (0.53) 37 (0.40) 7 (0.8) 0.9 (0.5–1.7) 0.81 0.8 (0.3–2.4) 0.69 0.9 (0.5–1.6) 0.72Con 95 76.6 (1.0) 46 (0.48) 39 (0.41) 10 (0.11)
Scottish AD 121 57.8 (0.6) 61 (0.50) 48 (0.40) 12 (0.10) 1.1 (0.7–1.8) 0.77 1.5 (0.6–3.5) 0.41 1.1 (0.7–1.8) 0.6Con 150 58.1 (0.8) 80 (0.53) 59 (0.39) 11 (0.7)
aGenotype counts (and frequencies) are depicted.bORs for each series were determined by logistic regression adjusting for age.cORs for CT and TT genotypes were estimated in a model where each genotype was encoded separately with CC as the reference genotype.dThe OR for the pooled CT þ TT genotype was estimated in a model where subjects with the CT or TT genotypes were equally weighted (both codedas 1) in a single CT þ TT variable with CC as the reference genotype. Analysis was performed using the SAS version 8 package.
Human Molecular Genetics, 2005, Vol. 14, No. 3 457
by guest on Novem
ber 30, 2015http://hm
g.oxfordjournals.org/D
ownloaded from
tested were CT and TT genotypes, age, CT genotype � ageand TT genotype � age. For Model 2, the CT and TT geno-types were pooled into a single CT þ TT variable encodedas one for subjects with a CT or TT genotype and zero forthose with a CC genotype. All analyses were performed infamily members who were 550 years of age. We selectedthis subset because we determined an age-related increase inplasma Ab42 levels after age 50 in those individuals withPLAU_1 genotypes CT or TT. All analyses were performedboth with all Ab values and a second time by excluding thetwo extreme ‘outliers’ with plasma Ab levels +4 SDbeyond the mean. The PLAU_1 CT � age and PLAU_1 CT þ
TT � age were still significant variables in Model 1 and 2,respectively, after excluding the outliers.
To determine the age-related effect of PLAU_1 genotypesand PLAU_1 genotypes on plasma Ab42 levels in LOADfamily members of all ages, we fitted two non-linear regressionmodels, while taking into account the same variance com-ponents as described earlier. In Model 1 for family membersof all ages, age(2), PLAU_1 CT � age(2) and PLAU_1 TT �
age(2) were tested as covariates in addition to age, PLAU_1CT, PLAU_1 TT, PLAU_1 CT � age and PLAU_1TT � age. In Model 2, age(2) and PLAU_1 CT þ TT � age(2)
were included as covariates besides age, PLAU_1 CT þ TTand PLAU_1 CT þ TT � age. The rationale for testing thesenon-linear models is described in detail in the main text.
Logistic regression analysis to test for association withthe PLAU_1 (rs2227564) SNP in case–controls
Logistic regression analysis implemented in SAS version 8was utilized to test for association between AD andPLAU_1 genotypes. Initially, a model that estimated and
tested the effects of PLAU_1 CT and TT genotypes separatelywas utilized. The results of this analysis suggested similarrisky estimates for these genotypes. Given this result andthat the PLAU_1 TT genotype is relatively rare, a secondmodel was fitted, where CT and TT genotypes were combinedinto one variable, CT þ TT, coded as 1 for those with CT orTT genotype and 0 for those with CC genotype.
Meta-analysis of PLAU_1 (rs2227564) SNP in10 case–control series
Using the genotype counts for PLAU_1 CT þ TT versus CCgenotypes in AD cases and controls from the six seriesdescribed in this article, we performed meta-analysisimplemented in the StatsDirect statistical package. Breslow–Day test was performed to test for heterogeneity among thesamples. Pooled OR estimates were calculated using bothfixed effects and random effects model as implemented inthe Mantel–Haenszel, and DerSimonian–Laird tests,respectively.
Analysis of plasma and brain Ab in PLAU KO mice
Plasma Ab42 and Ab40 were analyzed by sandwich ELISA aspreviously described (11). Brain Ab42 and Ab40 wereanalyzed by ELISA following direct extraction into formicacid and neutralization as previously described (28). All KOmice were homozygous for the null allele. All results werenormalized to the Ab present in 3- to 6-month-old control(wild-type) mice. Numbers analyzed were as follows:3- to 6-month-old PLAU KO mice (16) (n ¼ 9), controlmice (n ¼ 6); 11-month-old PLAU KO mice (n ¼ 2), control
Figure 4. Plasma Ab in PLAU KO. (A) Plasma Ab42 and (B) plasma Ab40were analyzed by sandwich ELISA as previously described (19). All KOmice were homozygous for the null allele. All results were normalizedto the Ab present in 3- to 6-month-old control (wild-type) mice. Valuesshown are mean + SE. Numbers analyzed were 3- to 6-month-old PLAUKO (14) (n ¼ 9), control mice (n ¼ 6); 11-month-old PLAU KO mice(n ¼ 2), control mice (n ¼ 7) mice; 3- to 6-month-old neprilysin KO (15)(n ¼ 3), control mice (n ¼ 3). The neprilysin KO mice were used foradditional positive control (15). In these mice, plasma Ab42 (A) and Ab40(B) increased.
Figure 5. Brain Ab in PLAU KO mice. (A) Brain Ab42 and (B) brainAb40 extracted directly into 70% formic acid. Brain Ab42 and Ab40 wereanalyzed by ELISA following direct extraction into formic acid andneutralization as previously described (26). Values shown are mean + SE.Numbers analyzed were 3- to 6-month-old PLAU KO mice (n ¼ 9), controlmice (n ¼ 6); 11-month-old PLAU KO mice (n ¼ 2), control mice (n ¼ 7);3- to 6-month-old neprilysin KO mice (n ¼ 3), control mice (n ¼ 3). Foradditional positive control, we investigated neprilysin KO mice (15). Inthese mice, brain Ab42 and Ab40 increased as previously reported (15).Plasma Ab42 (Fig. 4A) and Ab40 (Fig. 4B) also increased in the neprilysinKO mice.
458 Human Molecular Genetics, 2005, Vol. 14, No. 3
by guest on Novem
ber 30, 2015http://hm
g.oxfordjournals.org/D
ownloaded from
(n ¼ 7) mice; 3- to 6-month-old neprilysin KO mice (24)(n ¼ 3), control mice (n ¼ 3). The neprilysin KO mice wereused for additional positive control (24).
To evaluate brain Ab42 and Ab40, we used the samemethods that we previously employed to demonstrate thatendogenous brain Ab42 increases in transgenic mice expressingpresenilin 1 mutations linked to early-onset familial AD (9).
ACKNOWLEDGEMENTS
We acknowledge the Mayo Clinic and UKy ADRC members fortheir help in the collection of samples. We are grateful to all of theindividuals who participated in this study, without whom thiswork would not be possible. This study was supported by theNIH grants AG18023 (S.G.Y.), AG06656 (S.G.Y.), AG20903(N.E.T.), AG21545 (S.E.), 2P50AG05144 (W.M.), a grantfrom American Federation for Aging Research Grant PD01062(N.E.T.) and a Robert and Clarice Smith Fellowship (N.E.T.).
REFERENCES
1. Ertekin-Taner, N., Graff-Radford, N., Younkin, L.H., Eckman, C.,Baker, M., Adamson, J., Ronald, J., Blangero, J., Hutton, M. and Younkin,S.G. (2000) Linkage of plasma Ab42 to a quantitative locus onchromosome 10 in late-onset Alzheimer’s disease pedigrees. Science, 290,2303–2304.
2. Myers, A., Holmans, P., Marshall, H., Kwon, J., Meyer, D., Ramic, D.,Shears, S., Booth, J., DeVrieze, F.W., Crook, R. et al. (2000)Susceptibility locus for Alzheimer’s disease on chromosome 10. Science,290, 2304–2305.
3. Tucker, H.M., Kihiko, M., Caldwell, J.N., Wright, S., Kawarabayashi, T.,Price, D., Walker, D., Scheff, S., McGillis, J.P., Rydel, R.E. et al. (2000)The plasmin system is induced by and degrades amyloid-beta aggregates.J. Neurosci., 20, 3937–3946.
4. Glenner, G.G. and Wong, C.W. (1984) Alzheimer’s disease and Down’ssyndrome: sharing of a unique cerebrovascular amyloid fibril protein.Biochem. Biophys. Res. Commun., 122, 1131–1135.
5. Gravina, S.A., Ho, L., Eckman, C.B., Long, K.E., Otvos, L.,Younkin, L.H., Suzuki, N. and Younkin, S.G. (1995) Amyloid betaprotein (A beta) in Alzheimer’s disease brain. Biochemical andimmunocytochemical analysis with antibodies specific for formsending at A beta 40 or A beta 42(43). J. Biol. Chem.,270, 7013–7016.
6. Citron, M., Oltersdorf, T., Haass, C., McConlogue, L., Hung, A.Y.,Seubert, P., Vigo-Pelfrey, C., Lieberburg, I. and Selkoe, D.J. (1992)Mutation of the beta-amyloid precursor protein in familialAlzheimer’s disease increases beta-protein production. Nature,360, 672–674.
7. Suzuki, N., Cheung, T.T., Cai, X.D., Odaka, A., Otvos, L., Jr, Eckman, C.,Golde, T.E. and Younkin, S.G. (1994) An increased percentage of longamyloid beta protein secreted by familial amyloid beta protein precursor(beta APP717) mutants. Science, 264, 1336–1340.
8. Borchelt, D.R., Thinakaran, G., Eckman, C.B., Lee, M.K., Davenport, F.,Ratovitsky, T., Prada, C.M., Kim, G., Seekins, S., Yager, D. et al.(1996) Familial Alzheimer’s disease-linked presenilin 1 variantselevate Abeta1–42/1–40 ratio in vitro and in vivo. Neuron,17, 1005–1013.
9. Duff, K., Eckman, C., Zehr, C., Yu, X., Prada, C.M., Perez-tur, J.,Hutton, M., Buee, L., Harigaya, Y., Yager, D. et al. (1996) Increasedamyloid-beta42(43) in brains of mice expressing mutant presenilin1.Nature, 383, 710–713.
10. Hsiao, K., Chapman, P., Nilsen, S., Eckman, C., Harigaya, Y., Younkin, S.,Yang, F. and Cole, G. (1996) Correlative memory deficits, Abetaelevation, and amyloid plaques in transgenic mice. Science,274, 99–102.
11. Scheuner, D., Eckman, C., Jensen, M., Song, X., Citron, M., Suzuki, N.,Bird, T.D., Hardy, J., Hutton, M., Kukull, W. et al. (1996) Secretedamyloid beta-protein similar to that in the senile plaques ofAlzheimer’s disease is increased in vivo by the presenilin 1 and 2 andAPP mutations linked to familial Alzheimer’s disease. Nat. Med.,2, 864–870.
12. Citron, M., Westaway, D., Xia, W., Carlson, G., Diehl, T., Levesque, G.,Johnson-Wood, K., Lee, M., Seubert, P., Davis, A. et al. (1997) Mutantpresenilins of Alzheimer’s disease increase production of 42-residue amyloidbeta-protein in both transfected cells and transgenic mice. Nat. Med., 3,67–72.
13. Li, X., Bokman, A.M., Llinas, M., Smith, R.A. and Dobson, C.M. (1994)Solution structure of the kringle domain from urokinase-type plasminogenactivator. J. Mol. Biol., 235, 1548–1559.
14. Yoshimoto, M., Ushiyama, Y., Sakai, M., Tamaki, S., Hara, H.,Takahashi, K., Sawasaki, Y. and Hanada, K. (1996) Characterization ofsingle chain urokinase-type plasminogen activator with a novel amino-acid substitution in the kringle structure. Biochim. Biophys. Acta,1293, 83–89.
15. Finckh, U., van Hadeln, K., Muller-Thomsen, T., Alberici, A., Binetti, G.,Hock, C., Nitsch, R.M., Stoppe, G., Reiss, J. and Gal, A. (2003)Association of late-onset Alzheimer disease with a genotype of PLAU, thegene encoding urokinase-type plasminogen activator on chromosome10q22.2. Neurogenetics, 4, 213–217.
16. Carmeliet, P., Schoonjans, L., Kieckens, L., Ream, B., Degen, J., Bronson,R., De Vos, R., van den Oord, J.J., Collen, D. and Mulligan, R.C. (1994)Physiological consequences of loss of plasminogen activator genefunction in mice. Nature, 368, 419–424.
17. Weeks D.E., Sobel E., O’Connell J.R. and Lange K. (1995) Computerprograms for multilocus haplotyping of general pedigrees. Am. J. Hum.Genet., 56, 1506–1507.
18. Sobel, E. and Lange, K. (1996) Descent graphs in pedigree analysis:applications to haplotyping, location scores, and marker-sharing statistics.Am. J. Hum. Genet., 58, 1323–1337.
19. Lewontin, R.C. and Kojima, K. (1960) The evolutionary dynamics ofcomplex polymorphisms. Evolution, 14, 450–472.
20. Almasy, L. and Blangero, J. (1998) Multipoint quantitative-traitlinkage analysis in general pedigrees. Am. J. Hum. Genet., 62,1198–1211.
21. Hopper, J.L. and Mathews, J.D. (1982) Extensions to multivariate normalmodels for pedigree analysis. Ann. Hum. Genet., 46, 373–383.
22. Abecasis, G.R. and Cookson, W.O. (2000) GOLD—graphical overview oflinkage disequilibrium. Bioinformatics, 16, 182–183.
23. Sham, P.C. and Curtis, D. (1995) Monte, Carlo tests for associationsbetween disease and alleles at highly polymorphic loci. Ann. Hum. Genet.,59, 97–105.
24. Iwata, N., Tsubuki, S., Takaki, Y., Shirotani, K., Lu, B., Gerard, N.P.,Gerard, C., Hama, E., Lee, H.J. and Saido, T.C. (2001) Metabolicregulation of brain Abeta by neprilysin. Science, 292, 1550–1552.
25. Patil, N., Berno, A.J., Hinds, D.A., Barrett, W.A., Doshi, J.M., Hacker,C.R., Kautzer, C.R., Lee, D.H., Marjoribanks, C., McDonough, D.P. et al.(2001) Blocks of limited haplotype diversity revealed by high-resolutionscanning of human chromosome 21. Science, 294, 1719–1723.
26. Daly, M.J., Rioux, J.D., Schaffner, S.F., Hudson, T.J. and Lander, E.S.(2001) High-resolution haplotype structure in the human genome. Nat.Genet., 29, 229–232.
27. Gabriel, S.B., Schaffner, S.F., Nguyen, H., Moore, J.M., Roy, J.,Blumenstiel, B., Higgins, J., DeFelice, M., Lochner, A., Faggart, M. et al.(2002) The structure of haplotype blocks in the human genome. Science,296, 2225–2229.
28. Kawarabayashi, T., Younkin, L.H., Saido, T.C., Shoji, M., Hsiao,Ashe, K. and Younkin, S.G. (2001) Age-dependent changes in brain, CSF,and plasma amyloid b protein in the Tg2576 transgenic mouse model ofAlzheimer’s disease. J. Neurosci., 21, 372–381.
29. Lohmueller, K.E., Pearce, C.L., Pike, M., Lander, E.S. and Hirschhorn,J.N. (2003) Meta-analysis of genetic association studies supports acontribution of common variants to susceptibility to common disease.Nat. Genet., 33, 177–182.
30. Myers, A.J., Marshall, H., Holmans, P., Compton, D., Crook, R.J.,Mander, A.P., Nowotny, P., Smemo, S., Dunstan, M., Jehu, L. et al.(2004) Variation in the urokinase-plasminogen activator gene does notexplain the chromosome 10 linkage signal for late onset AD. Am. J. Med.Genet., 124B, 29–37.
Human Molecular Genetics, 2005, Vol. 14, No. 3 459
by guest on Novem
ber 30, 2015http://hm
g.oxfordjournals.org/D
ownloaded from
31. Ertekin-Taner, N., Ronald, J., Asahara, H., Younkin, L., Hella, M.,Jain, S., Gnida, E., Younkin, S., Fadale, D., Ohyagi, Y. et al. (2003) Finemapping of the falphag-T catenin gene to a quantitative trait locus onchromosome 10 in late-onset Alzheimer’s disease pedigrees. Hum. Mol.Genet., 12, 3133–3143.
32. Ertekin-Taner, N., Allen, M., Fadale, D., Scanlin, L., Younkin, L.,Petersen, R.C., Graff-Radford, N. and Younkin, S.G. (2004) Geneticvariants in a haplotype block spanning IDE are significantly associatedwith plasma Ab42 levels and risk for Alzheimer’s disease. Hum. Mutat.,23, 334–342.
33. McKhann, G., Drachman, D., Folstein, M., Katzman, R., Price, D. andStadlan, E.M. (1984) Clinical diagnosis of Alzheimer’s disease: report ofthe NINCDS-ADRDA Work Group under the auspices of Department ofHealth and Human Services Task Force on Alzheimer’s Disease.Neurology, 34, 939–944.
34. Howell, W.M., Jobs, M., Gyllensten, U. and Brookes, A.J. (1999)Dynamic allele-specific hybridization. A new method for scoring singlenucleotide polymorphisms. Nat. Biotechnol., 17, 87–88.
35. Prince, J.A., Feuk, L., Howell, W.M., Jobs, M., Emahazion, T.,Blennow, K. and Brookes, A.J. (2001) Robust and accurate singlenucleotide polymorphism genotyping by dynamic allele-specifichybridization (DASH): design criteria and assay validation. Genome Res.,11, 152–162.
36. Dyke, B. and Mamelka, P. (1996) PEDSYS, A Pedigree DataManagement System, version 2.0. Population Genetics LaboratoryDepartment of Genetics Southwest Foundation for Biomedical Research,San Antonio, TX.
37. Excoffier, L. and Slatkin, M. (1995) Maximum-likelihood estimation ofmolecular haplotype frequencies in a diploid population. Mol. Biol. Evol.,12, 921–927.
460 Human Molecular Genetics, 2005, Vol. 14, No. 3
by guest on Novem
ber 30, 2015http://hm
g.oxfordjournals.org/D
ownloaded from
Related Documents

![Arecombinantchimeric plasminogenactivatorwithhighaffinity for … › content › pnas › 88 › 22 › 10337.full.pdf · urokinase-type plasminogen activator [scuPA(32kDa)], afi-brin-selective](https://static.cupdf.com/doc/110x72/5f1cd2e4e4e08d6801761b19/arecombinantchimeric-plasminogenactivatorwithhighaffinity-for-a-content-a-pnas.jpg)