The maps depicted here are without prejudice to the status of or sovereignty over any territory, to the delimitation of international frontiers and boundaries and to the name of any territory, city or area. United States EV Stock: 275,104 EVSE Stock: 21,814 Japan EV Stock: 108,248 EVSE Stock: 11,511 Germany EV Stock: 24,419 EVSE Stock: 2,821 France EV Stock: 30,912 EVSE Stock: 8,600 Sweden EV Stock: 6,990 EVSE Stock: 3,100 Italy EV Stock: 7,584 EVSE Stock: 2,520 Canada EV Stock: 10,778 EVSE Stock: 3,117 Global EV Outlook 2015 key takeaways 95%+ Percentage of 2014 Global EV Stock in EVI Countries © 2015 Global EV Outlook (GEO 2015) OECD/IEA, 9 rue de la Fédération, 75739 Paris Cedex 15, France. GEO 2015 is subject to the IEA’s terms and conditions at http://www.iea.org/t&c/. India EV Stock: 2,689 EVSE Stock: 328 South Africa EV Stock: 48 EVSE Stock: N/A China EV Stock: 83,198 EVSE Stock: 30,000 Portugal EV Stock: 743 EVSE Stock: 1,330 United Kingdom EV Stock: 21,425 EVSE Stock: 2,866 Spain EV Stock: 3,536 EVSE Stock: 775 Norway EV Stock: 40,887 EVSE Stock: 6,208 Denmark EV Stock: 2,799 EVSE Stock: 1,721 Netherlands EV Stock: 43,762 EVSE Stock: 12,114 For more information and for other reports go to: http://www.iea.org/evi Annual sales in thousands spotlight on China 230 million 83,000 36,500 e-bikes e-cars e-buses EV market share Market sales shares of EVs reached over 1% in bolded EVI countries. by percentage (2014) 0 3 6 9 12 15 US UK Sweden Spain Portugal Norway Netherlands Japan Italy Germany France Denmark China Canada global EV stock The Global EV Outlook represents the collective effort of seven years of primary data gathering and analysis from the Electric Vehicle Initiative’s 16 member governments. Below are key takeaways and insights from this work. Overall, EV and charging infrastructure deployment has continued growing since the 2013 Global EV Outlook. Battery costs have come down while energy density has climbed; vehicle electrification has gone multi-modal with 46,000 electric buses and 235 million electric two-wheelers deployed; and total EV spending by EVI governments equalled 16 billion USD between 2008-2014. 665,000+ (through end of 2014) represents 0.08% of total passenger cars global EVSE stock global EV sales EV spending by category EVSE stock more than doubled for slow charging points between the end of 2012 and 2014, and increased eightfold for fast charging points. 0 2 4 6 8 10 RD&D Infrastructure Fiscal incentives USD Billion 15,000+ fast- charging points 94,000+ slow- charging points 0 50 100 150 200 250 300 BEV PHEV 2014 2013 2012 2011 2010 (For EVI countries, 2008 - 2014) 81% +729% 49% +150% 54% +70% 57% +53% 51% 46% 43% (Through end of 2014) + + + + + + 2011 2013 2012 2022 target Battery cost ($/kWh) Energy density (Wh/L) 0 200 600 800 400 0 100 300 400 200 _ _ _ _ _ _ _ PHEV battery progress 12% 16% 39% % of global EV Stock in 2014 TOP 3 market share growth (%) 0 2 4 6 8 10 12 14 2014 PHEV 2014 BEV 2013 PHEV 2013 BEV US UK Sweden Spain Portugal Norway Netherlands Japan Italy Germany France Denmark China Canada Market sales shares of EVs for 2013 (lighter colors) and 2014 (darker colors). 0.1% (2013) 0.3% (2014) 0.1% 0.3% 0.3% 0.9% 0.5% 0.7% 0.2% 0.4% 0.2% 0.1% 0.7% 0.7% 5.3% 3.9% 7.3% 12.5% 0.2% 0.2% 0.1% 0.2% 0.6% 1.4% 0.2% 0.6% 1.3% 1.5%

Welcome message from author
This document is posted to help you gain knowledge. Please leave a comment to let me know what you think about it! Share it to your friends and learn new things together.
Transcript
The maps depicted here are without prejudice to the status of or sovereignty over any territory, to the delimitation of international frontiers and boundaries and to the name of any territory, city or area.
United StatesEV Stock: 275,104EVSE Stock: 21,814
JapanEV Stock: 108,248EVSE Stock: 11,511
GermanyEV Stock: 24,419EVSE Stock: 2,821
FranceEV Stock: 30,912EVSE Stock: 8,600
SwedenEV Stock: 6,990EVSE Stock: 3,100
ItalyEV Stock: 7,584EVSE Stock: 2,520
CanadaEV Stock: 10,778EVSE Stock: 3,117
Global EV Outlook 2015key takeaways
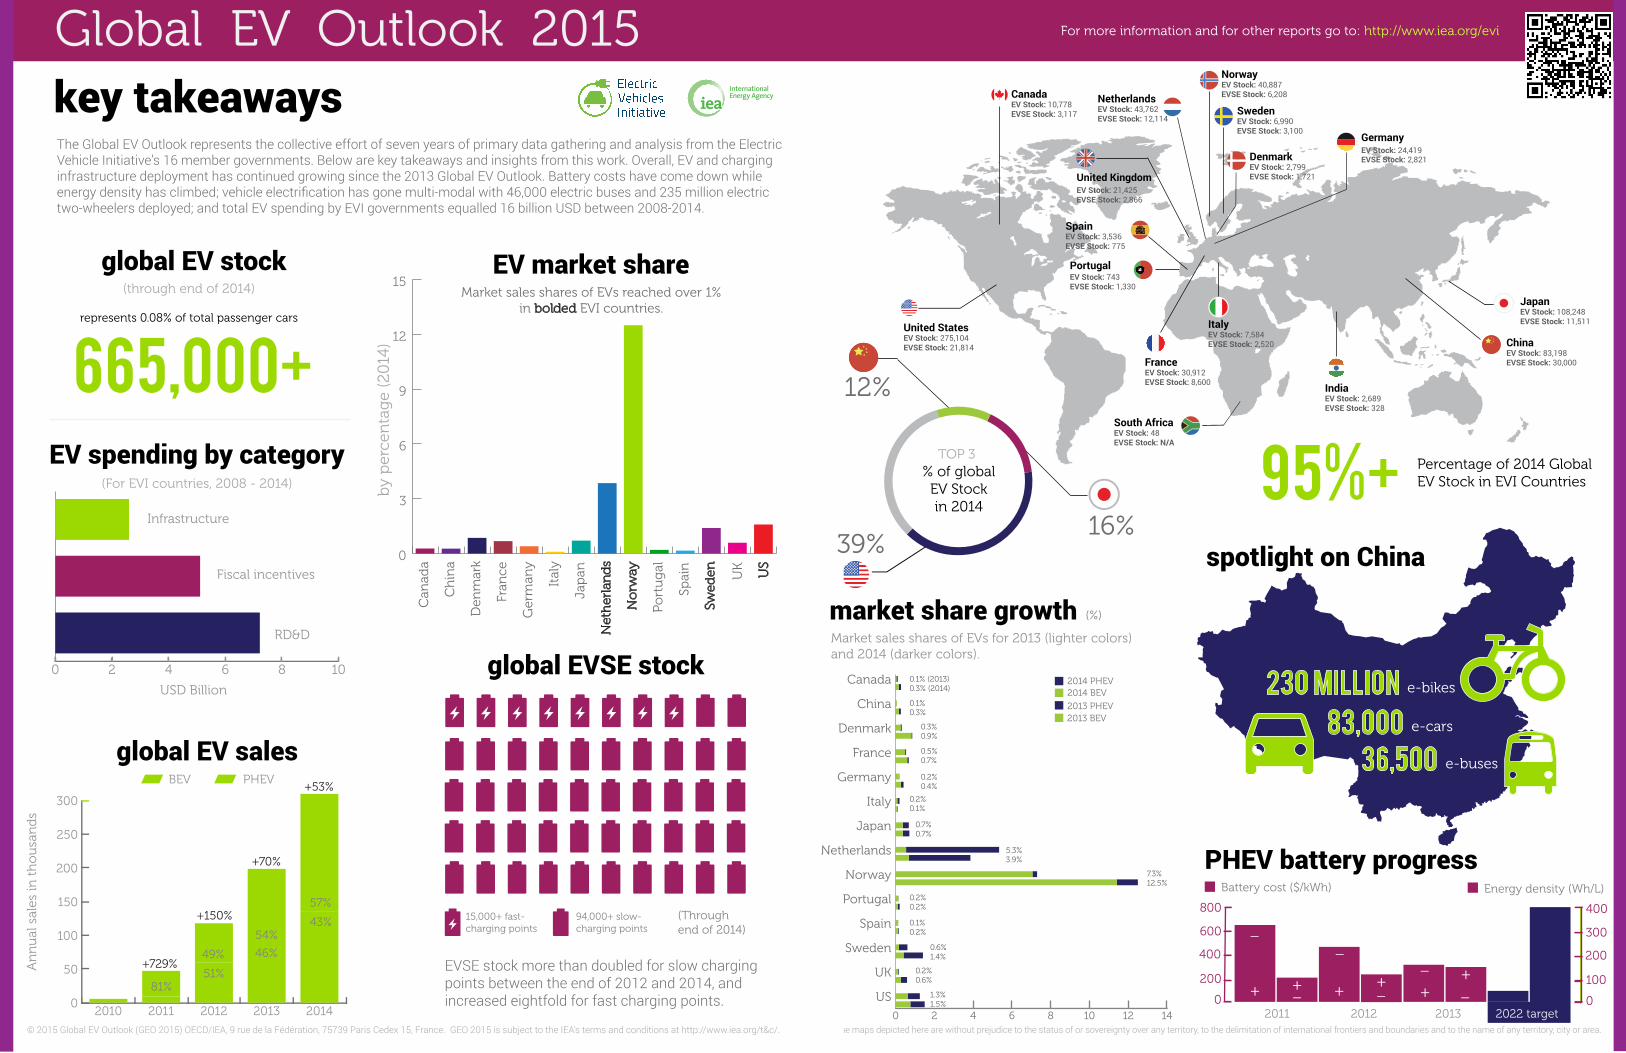
95%+ Percentage of 2014 Global EV Stock in EVI Countries
© 2015 Global EV Outlook (GEO 2015) OECD/IEA, 9 rue de la Fédération, 75739 Paris Cedex 15, France. GEO 2015 is subject to the IEA’s terms and conditions at http://www.iea.org/t&c/.
IndiaEV Stock: 2,689EVSE Stock: 328
South AfricaEV Stock: 48EVSE Stock: N/A
ChinaEV Stock: 83,198EVSE Stock: 30,000
PortugalEV Stock: 743EVSE Stock: 1,330
United KingdomEV Stock: 21,425EVSE Stock: 2,866
SpainEV Stock: 3,536EVSE Stock: 775
NorwayEV Stock: 40,887EVSE Stock: 6,208
DenmarkEV Stock: 2,799EVSE Stock: 1,721
NetherlandsEV Stock: 43,762EVSE Stock: 12,114
For more information and for other reports go to: http://www.iea.org/eviA
nn
ual
sal
es in
th
ou
san
ds
spotlight on China
230 million83,000
36,500
e-bikes
e-cars
e-buses
EV market shareMarket sales shares of EVs reached over 1%
in bolded EVI countries.
by
per
cen
tag
e (2
014
)
0
3
6
9
12
15
US
UK
Swed
en
Spai
n
Port
ug
al
No
rway
Net
her
lan
ds
Jap
an
Ital
y
Ger
man
y
Fran
ce
Den
mar
k
Ch
ina
Can
ada
global EV stock
The Global EV Outlook represents the collective effort of seven years of primary data gathering and analysis from the Electric Vehicle Initiative’s 16 member governments. Below are key takeaways and insights from this work. Overall, EV and charging infrastructure deployment has continued growing since the 2013 Global EV Outlook. Battery costs have come down while energy density has climbed; vehicle electrification has gone multi-modal with 46,000 electric buses and 235 million electric two-wheelers deployed; and total EV spending by EVI governments equalled 16 billion USD between 2008-2014.
665,000+(through end of 2014)
represents 0.08% of total passenger cars
global EVSE stock
global EV sales
EV spending by category
EVSE stock more than doubled for slow charging points between the end of 2012 and 2014, and increased eightfold for fast charging points.
0 2 4 6 8 10
RD&D
Infrastructure
Fiscal incentives
USD Billion
15,000+ fast- charging points
94,000+ slow-charging points
0
50
100
150
200
250
300
BEV PHEV
20142013201220112010
(For EVI countries, 2008 - 2014)
81%
+729%49%
+150%
54%
+70%
57%
+53%
51%
46%
43% (Through end of 2014)
+ + ++
++
2011 20132012 2022 target
Battery cost ($/kWh) Energy density (Wh/L)
0
200
600
800
400
0
100
300
400
200
_
_
_
_
_
_
_
PHEV battery progress
12%
16%39%
% of global EV Stock in 2014
TOP 3
market share growth (%)
0 2 4 6 8 10 12 14
2014 PHEV2014 BEV
2013 PHEV2013 BEV
US
UK
Sweden
Spain
Portugal
Norway
Netherlands
Japan
Italy
Germany
France
Denmark
China
Canada
Market sales shares of EVs for 2013 (lighter colors) and 2014 (darker colors).
0.1% (2013)0.3% (2014)
0.1% 0.3%
0.3% 0.9%
0.5% 0.7%
0.2% 0.4%
0.2% 0.1%
0.7% 0.7%
5.3% 3.9%
7.3% 12.5%
0.2% 0.2%
0.1% 0.2%
0.6% 1.4%
0.2% 0.6%
1.3% 1.5%
Related Documents