University of Southern Queensland Faculty of Engineering and Surveying Effects of On-board HHO and Water Injection in a Diesel Generator A dissertation submitted by Rick Cameron In fulfilment of the requirements of Courses ENG4111 and ENG4112 Research project Toward the degree of Bachelor of Engineering (Power) Submitted: October 2012

Welcome message from author
This document is posted to help you gain knowledge. Please leave a comment to let me know what you think about it! Share it to your friends and learn new things together.
Transcript
University of Southern Queensland
Faculty of Engineering and Surveying
Effects of On-board HHO and Water
Injection in a Diesel Generator
A dissertation submitted by
Rick Cameron
In fulfilment of the requirements of
Courses ENG4111 and ENG4112 Research project
Toward the degree of
Bachelor of Engineering (Power)
Submitted: October 2012
i
Abstract
HHO otherwise known as hydroxy or Browns Gas is the gas produced from splitting
water into hydrogen and oxygen from electrolysis and allowing the gas to stay in a
premixed state for use on-demand without the need for storage. In 1918 Charles
Frazer, a North American inventor, patented the first water electrolysis machine act
as a hydrogen booster for internal combustion engines. Yull Brown, a Bulgarian
born Australian inventor patented and attempted to popularize Browns Gas as a
cutting gas and fuel additive during the 1970’s and 80’s. During the 2000’s there
was a huge influx in Browns Gas devices coming to the mark, with many sensational
claims of bringing dramatic reductions in fuel consumption and exhaust emissions in
internal combustion engines.
This research project involved experimentally validating the effects of on-board
HHO addition on fuel economy and emissions in a 28kW diesel generator. The
diesel generator was run at 30% and 55% of the engines rated power output with
three rates of HHO injection, with and without water injection.
Results include accurate measurement and analysis of diesel consumption and
exhaust emissions of the diesel generator under 16 combinations of generator
loading, HHO injection and water injection. The HHO and water are injected into
the air intake manifold of the engine. Error margins and calibrations are detailed,
and environmental conditions accounted for in the findings.
HHO was shown to increase diesel consumption under all conditions tested,
proportional to the rate of injection – up to a 5.2% increase at 55% load with 6L/min
of HHO addition. Oxides of nitrogen (NOx) emissions were reduced up to 11.8%
with the addition of water and HHO from an externally powered electrolyser. Even
if the efficiency of the HHO system could be raised to 100%, the thermal losses in
the engine stage would still outweigh the economy gains from on-board HHO
addition.

ii
University of Southern Queensland
Faculty of Engineering and Surveying
ENG4111 Research Project Part 1
ENG4112 Research Project Part 2
Limitations of Use
The Council of the University of Southern Queensland, its Faculty of Engineering
and Surveying, and the staff of the University of Southern Queensland, do not accept
any responsibility for the truth, accuracy or completeness of material contained
within or associated with this dissertation.
Persons using all or any part of this material do so at their own risk, and not at the
risk of the Council of the University of Southern Queensland, its Faculty of
Engineering and Surveying or the staff of the University of Southern Queensland.
This dissertation reports an educational exercise and has no purpose or validity
beyond this exercise. The sole purpose of the course pair entitled “Research Project”
is to contribute to the overall education within the student’s chosen degree program.
This document, the associated hardware, software, drawings, and other material set
out in the associated appendices should not be used for any other purpose: if they are
so used, it is entirely at the risk of the user.
Professor Frank Bullen
Dean
Faculty of Engineering and Surveying

iii
Certification
I certify that the ideas, designs and experimental work, results, analyses and
conclusions set out in this dissertation are entirely my own effort, except where
otherwise indicated and acknowledged.
I further certify that the work is original and has not been previously submitted for
assessment in any other course or institution, except where specifically stated.
Student Name: Roderick Cameron
Student Number: w0050093559
Signature
Date

iv
Acknowledgment
Dr Les Bowtell, for his support and interest in the topic and his advice during
difficult periods
Dr Paul Baker, for his insight into environmental corrections for engine testing and
access to the engine lab
Brett Richards, for all his supervision and availability in the testing phase
Dr Ron Sharma, for allowing me to use the diesel generator set as a contingency
Bill McHugh, for providing a good example of a dissertation
Racheal Cameron, for her support

v
Table of Contents
Abstract ............................................................................................... i
Certification ....................................................................................... iii
Acknowledgment ............................................................................... iv
Table of Contents ............................................................................... v
List of Figures .................................................................................... viii
List of Tables ....................................................................................... x
Nomenclature and Acronyms ............................................................ xi
Chapter 1 Introduction ....................................................................... 1
1.1 Outline of the Study ..................................................................................... 1
1.2 Introduction ................................................................................................. 1
1.3 Research Objectives ..................................................................................... 2
Chapter 2 Literature Review ............................................................... 3
2.1 Literature Review: Properties of Brown’s Gas ............................................. 3
2.2 Literature Review: Hydrogen Assisted Combustion .................................... 4
2.3 Literature Review: HHO as an additive in diesel engines ............................ 7
2.4 Literature Review: Water injection in diesel engines .................................. 9
2.5 Summary ...................................................................................................... 9
Chapter 3 Safety ............................................................................... 11
3.1 Construction ............................................................................................... 11
3.2 Oxyhdrogen as an additive......................................................................... 12
3.3 Operation ................................................................................................... 16
Chapter 4 Methodology .................................................................... 17
vi
4.1 Question ..................................................................................................... 17
4.2 Hypothesis .................................................................................................. 17
4.3 Test ............................................................................................................. 17
Chapter 5 Experimental System ........................................................ 18
5.1 Experimental Design .................................................................................. 18
5.1.1 Automated Tests .............................................................................................. 18
5.2 System Design ............................................................................................ 21
5.2.1 Introduction ..................................................................................................... 21
5.2.2 HHO Subsystem ................................................................................................ 22
5.2.3 Water Mist Injection Subsystem ...................................................................... 26
5.2.4 Diesel Metering System ................................................................................... 29
5.2.5 PLC Control and Data Logging System ............................................................. 32
5.2.6 HMI / Text Display ............................................................................................ 35
Chapter 6 Conversion Efficiency ........................................................ 38
6.1 Chemistry ................................................................................................... 38
6.2 Energy Efficiency ........................................................................................ 39
6.3 Typical Energy Losses ................................................................................. 41
Chapter 7 Results .............................................................................. 44
7.1 Data processing .......................................................................................... 44
7.2 Power Correction ....................................................................................... 44
7.3 Engine Loading ........................................................................................... 47
7.4 Specific Fuel Consumption ......................................................................... 48
7.5 Exhaust Emissions ...................................................................................... 51
Chapter 8 Future Research Recommendations ................................. 54
Chapter 9 Project Conclusion ............................................................ 55
9.1 On-board HHO Addition Research Gap ...................................................... 55

vii
9.2 On-board HHO’s Effect on Diesel Consumption ........................................ 55
9.3 HHO’s Effect on NOx Exhaust Emissions .................................................... 56
9.4 Financial Analysis ....................................................................................... 56
Appendix A: Project Specification ..................................................... 57
Appendix B: Experiment HAZOP ....................................................... 58
Appendix C: Experiment P&ID .......................................................... 62
Appendix D: Project Schedule ENG4111 ............................................ 66
Appendix E: Mid-Semester Schedule for New Experiment ................ 67
Appendix F: Logged Data – Fuel Consumption .................................. 68
Appendix G: Logged Data – Exhaust Emissions .................................. 69
Appendix H: MATLAB Script for Processing PLC Data ........................ 70
References ........................................................................................ 77
viii
List of Figures
Figure 1: Rydberg clusters containing water molecules with highly energized
electrons, but unenergized nuclei[4]. ........................................................................... 3
Figure 2: Brake specific fuel consumption for a 2.5L turbo diesel engine, courtesy
Lilik [9]. ....................................................................................................................... 6
Figure 3: Variation of engine torque with speed, and two rates of HHO fromYilmaz
et al. experiment [1]. .................................................................................................... 9
Figure 4: Test Bed Schematic ................................................................................... 21
Figure 5: P&ID for the Water electrolyser ................................................................ 22
Figure 6: Representation of gas volume calibration setup. ....................................... 24
Figure 7: HHO volumetric flow rate error. ............................................................... 24
Figure 8: Water injection system layout ................................................................... 26
Figure 9: Exhaust water-to-steam heat exchanger on the left, and internal 6mm
copper pipe coil inside the unit on the right. .............................................................. 27
Figure 10: Voltage measurement from a Sensirion SLQ-HC60 flow meter connected
to the peristaltic pump. ............................................................................................... 28
Figure 11: Layout of diesel supply and metering system. ........................................ 29
Figure 12: PLC control and data logging system and electrolyser DC power supply.
.................................................................................................................................... 32
Figure 13: Example of the noise in the diesel readings ............................................ 33
Figure 14: Text display of the control screen............................................................. 35
Figure 15: Text display of ultrasonic level sensor real time level and limits. .......... 36
Figure 16: Single cell water electrolysis, showing formation of hydrogen gas at
cathode and oxygen gas at anode. .............................................................................. 39
Figure 17: Diesel to on-board HHO conversion efficiency diagram, depending on
engine load and HHO injection rate. .......................................................................... 43
Figure 18: Power correction applied to the 9.91kW electrical load. ......................... 46
Figure 19: Power correction applied to the 19.1kW electrical load. .......................... 46
Figure 20: Effect of HHO injection with 0% additional water injection .................. 48
Figure 21: Effect of HHO injection with 10% additional water injection ................ 48
ix
Figure 22: Comparison of measure and break even energy efficiency for on board
electrolysis.................................................................................................................. 49
Figure 23: The effects of HHO and water injection on NOx at 30% engine load. ... 52
Figure 24: The effects of HHO and water injection on NOx at 55% engine load. ... 53

x
List of Tables
Table 1: Change in NOx emissions and BSFC on a 2.5L turbo diesel at 1800r/min . 6
Table 2: Added electrical load due to on-board water electrolysis. ............................ 8
Table 3: Risk assessment for grinding and cutting steel with an angle grinder ........ 11
Table 4: Probability versus consequence table ......................................................... 12
Table 5: Generator set specifications. ....................................................................... 18
Table 6: Energy requirements for on-board electrolysis ........................................... 25
Table 7: HHO subsystem advantages and disadvantages ......................................... 25
Table 8: Water injection error margin. ...................................................................... 27
Table 9: Water system design appraisal. ................................................................... 28
Table 10: Diesel system linearity test results. ........................................................... 30
Table 11: Sensor and control variable accuracy ....................................................... 37
Table 12: Net efficiency of HHO production for different engine loads and HHO
flow rates. ................................................................................................................... 42
Table 13: Coefficient of performance of HHO as an additive, compared to diesel. In
brackets is the COP HHO needs to recover production losses and not increase diesel
consumption. .............................................................................................................. 50
xi
Nomenclature and Acronyms
AC Alternating Current
ADC Analog to Digital Converter
BG Browns Gas
BSEC Brake Specific Energy Consumption
BSFC Brake Specific Fuel Consumption
BTDC Before Top Dead Centre
DAC Digital to analog converter
DC Direct Current
EGR Exhaust Gas Recirculation
HCCI Homogeneous Charge Compression Ignition
HHO Gas mixture made of 1/3 oxygen and 2/3 hydrogen by volume
HMI Human-machine interface
HOD HHO on demand
H2-O2 HHO
NOx Nitrate of oxides
PLC Programmable Logic Controller
STP Standard temperature and pressure: 298.15 K, 101.325 kPa
1
Chapter 1 Introduction
1.1 Outline of the Study
The outline of this study is to research the effects of HHO produced on-demand
combined water injection as an additive for combustion in a diesel generator. The
effects of current known phenomena of HHO and water on diesel engine exhaust
emissions and fuel consumption will be discussed. This study will describe the
design of the experiment – stating the controls and variables. Chapter 5,
Experimental System, will include analysis of the water injection system, the on-
board water electrolyser system, the industrial control system, the diesel supply
system and the data logging system used in the experiment. The results of this test
will be focussed at proving the quality and magnitude fuel consumption and exhaust
emissions of HHO on-demand systems similar to what is currently available on the
market.
1.2 Introduction
There has been much conjuncture in the public domain as to the effects on fuel
economy of hydrogen on-demand systems made for internal combustion engines, as
is evident with a simple search on the internet. There is little solid experimental
evidence from controlled repeatable tests quantitatively proving the economy
enhancing effects of on-board HHO for naturally aspirated or turbo diesel engines.
Two independent sets of researchers have shown experimentally that HHO on-board
can reduce diesel consumption [1, 2], while another team found a reduction in engine
efficiency [3]. To the authors knowledge no on–board testing has been performed
under a controlled environment where the systems variables and environmental
conditions are accurately controlled and corrected for. On-board HHO addition
means HHO produced by taking a portion of the engines power to crack water into a
small volume of HHO to be fed back into the air intake as a fuel saving additive.
This study will experimentally verify the economy and emissions effects of adding
small rates of HHO produced on-demand by a diesel generators own power
combined with 0% water injection and 10% water injection.
2
1.3 Research Objectives
The rationale behind the research objectives are derived from the research gap in
testing hydrogen on demand by other researchers, as well as the need to
experimentally prove or disprove the validity of the claims of hydrogen on demand
vendors.
The experimental research objectives of this research include;
Experimentally test the effect on fuel consumption and exhaust emissions of
adding 0L/min to 6L/min of HHO to a constant speed 28kW diesel generator
under two loading conditions - 30% and 55% of the engines rated load.
Accurately automate and data-log the experiment with an industrial control
system, where water injection rate, HHO production and generator load are
the independent variables.
Optimize HHO and water injection ratios to yield lowest brake specific fuel
consumption, if HHO is shown to have a positive effect on fuel economy.
Record and discuss the effects of HHO on oxides of nitrogen (NOx)
emissions.
Discuss the financial feasibility of on-board HHO, if HHO proves to reduce
diesel consumption.
3
Chapter 2 Literature Review
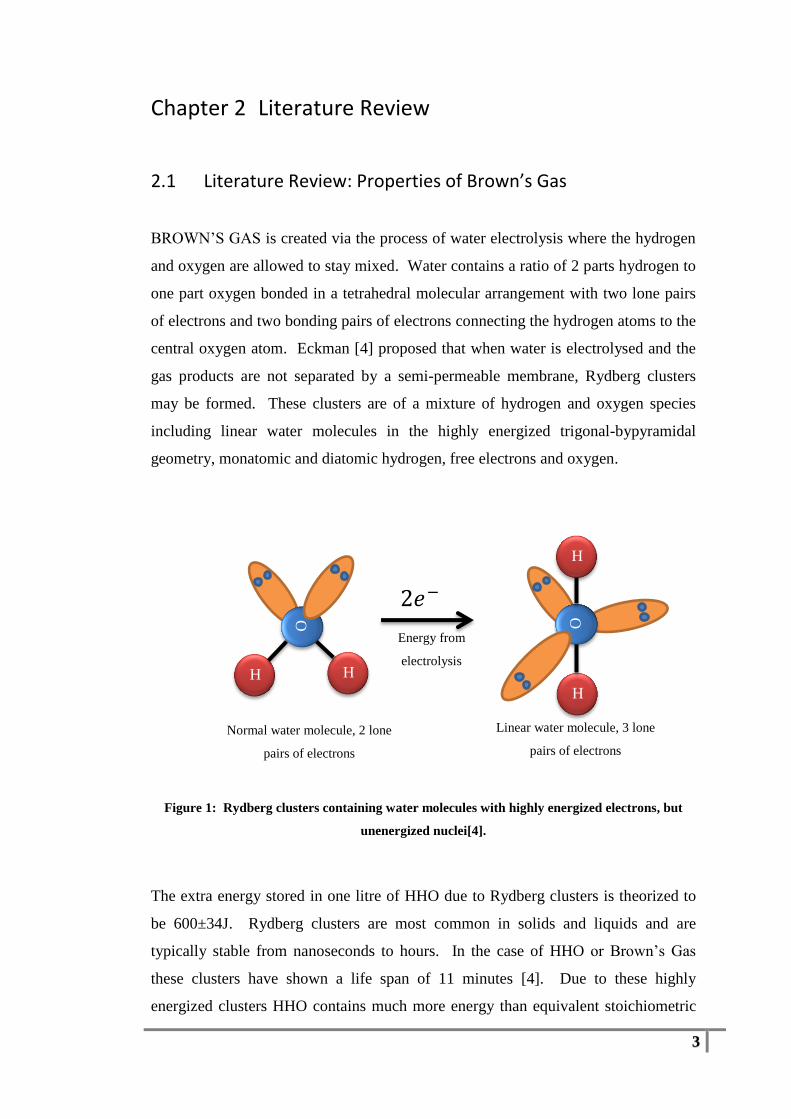
2.1 Literature Review: Properties of Brown’s Gas
BROWN’S GAS is created via the process of water electrolysis where the hydrogen
and oxygen are allowed to stay mixed. Water contains a ratio of 2 parts hydrogen to
one part oxygen bonded in a tetrahedral molecular arrangement with two lone pairs
of electrons and two bonding pairs of electrons connecting the hydrogen atoms to the
central oxygen atom. Eckman [4] proposed that when water is electrolysed and the
gas products are not separated by a semi-permeable membrane, Rydberg clusters
may be formed. These clusters are of a mixture of hydrogen and oxygen species
including linear water molecules in the highly energized trigonal-bypyramidal
geometry, monatomic and diatomic hydrogen, free electrons and oxygen.
Figure 1: Rydberg clusters containing water molecules with highly energized electrons, but
unenergized nuclei[4].
The extra energy stored in one litre of HHO due to Rydberg clusters is theorized to
be 600±34J. Rydberg clusters are most common in solids and liquids and are
typically stable from nanoseconds to hours. In the case of HHO or Brown’s Gas
these clusters have shown a life span of 11 minutes [4]. Due to these highly
energized clusters HHO contains much more energy than equivalent stoichiometric
H
O
H
H
O
H
Normal water molecule, 2 lone
pairs of electrons
Linear water molecule, 3 lone
pairs of electrons
Energy from
electrolysis
2𝑒−
4
ratio of hydrogen and oxygen in the form of extra electrons, this state has been
explained as cold plasma. Cold plasma is a state of matter where the atom nuclei are
relatively unenergetic or slowly moving, but the electrons are in highly energized
states at higher atomic orbitals. If this is true HHO releases additional electrons
during combustion that are stored in the gas resulting in higher electrical and thermal
energy transfer compared to the equivalent mixture of hydrogen oxygen and water.
Normally the presence of water in a burning fuel gas greatly reduces the heat energy
due to the high specific heat capacity of water (4.18J/g-K), however the linear water
content of HHO has greatly reduced hydrogen bonds and electrically transfers its
electrons under combustion at the surface of the contacting material. The flame
temperature generated by HHO can range from 150°C to over 9000°C [5] based on
the contact materials’ electrical conductivity, thermal conductivity, density and
vapour point. The HHO generated for addition into the diesel engine in this research
project will not have a water vapour removal (desiccant) stage at the output, so as to
test the effects of the claimed additional energy release during combustion.
2.2 Literature Review: Hydrogen Assisted Combustion
This review covers tank hydrogen-diesel experiments that have several similarities to
the experimental setup in this research project. Conditions for commonality include
naturally aspirated diesel engine, constant engine speeds at or near 1500r/min
replicating a generator, small rates of either hydrogen or HHO injection into the air
intake, with fuel consumption and NOx emissions analysis. Throughout this paper,
all gas mass flow rates are converted to volumetric flow rate at standard temperature
and pressure – 298.15K and 101.325kPa. HHO injection is most commonly cited in
terms of volumetric flow rates, so all references to hydrogen or HHO injection will
be on a litre per minute injection base unit. Chapter 6 will discuss the energy
required to crack water into hydrogen. Three values will be taken from chapter 6 to
tie the reviewed literature into this research project. Firstly it takes 7.79kJ to
produce 1L of HHO, and secondly the net efficiency of converting the equivalent
diesel energy to HHO energy was between 11.4% and 16%. Thirdly 4.4Wh of
electrical energy was required make 1L of HHO with the experimental setup; this
includes losses from the switch mode power supply. Taking an arbitrary net HHO
5
conversion efficiency of 15%, it would require 51.9kJ or 14.426W h of diesel energy
to produce 1L of HHO.
Adnan et al. [6] found gaseous hydrogen injection rate of 20L/min at standard
temperature and pressure (STP) doubled oxides of nitrogen (NOx) emission at
1500r/min in a 7.4kW 406cm3 naturally aspirated Yanmar diesel engine, with a
compression ratio of 19.3:1. The engine load or power output was not stated. The
cylinder peak pressure increased 11% and delayed the peak pressure event 10° in the
combustion stroke, indicated power increased 33% at 1500r/min. The power gain
would correspond to a reduction of fuel consumption all things being equal. If the
hydrogen was produced on-demand at 4.4Wh/L then the added load would be
5.3kW, leaving around 29% of the engines power for useful work, and most likely
dramatically increasing diesel consumption.
Bose and Maji [7] injected 27.8L/min of hydrogen and EGR gas into a 5.2kW,
17.5:1 compression diesel engine running at 1500r/min under various loads. Break
Specific Energy Consumption (BSEC) was reduced 64% and 36%, NOx emissions
increased 70% and 90% at 20% and 40% load respectively due to hydrogen
injection. The efficiency of the diesel engine increased due to the increased lean
limit and flame speed due to the properties of hydrogen combustion. 27.8L/min of
hydrogen is a high injection rate for a small engine if the hydrogen had to be split
from water by the engines own power. If this hydrogen were to be produced on
demand at 4.4Wh/L, the added load due to electrolysis would be 7.34kW – 41%
greater than the engines rated power.
Miyamoto et al. [8] injected tank hydrogen at varying rates into a 551cm3 single
cylinder diesel engine with a 16.7:1 compression ratio operating at a constant
1500r/min. The engine had varying diesel injection timing, and the coolant and air
temperature were maintained at a constant level. Diesel injection timing was from
12° to 0° BTDC, NOx emissions due to 6.0% vol. H2 injection caused NOx to drop
24% at 12° BTDC injection timing, to equal the NOx emissions with no hydrogen
injection.
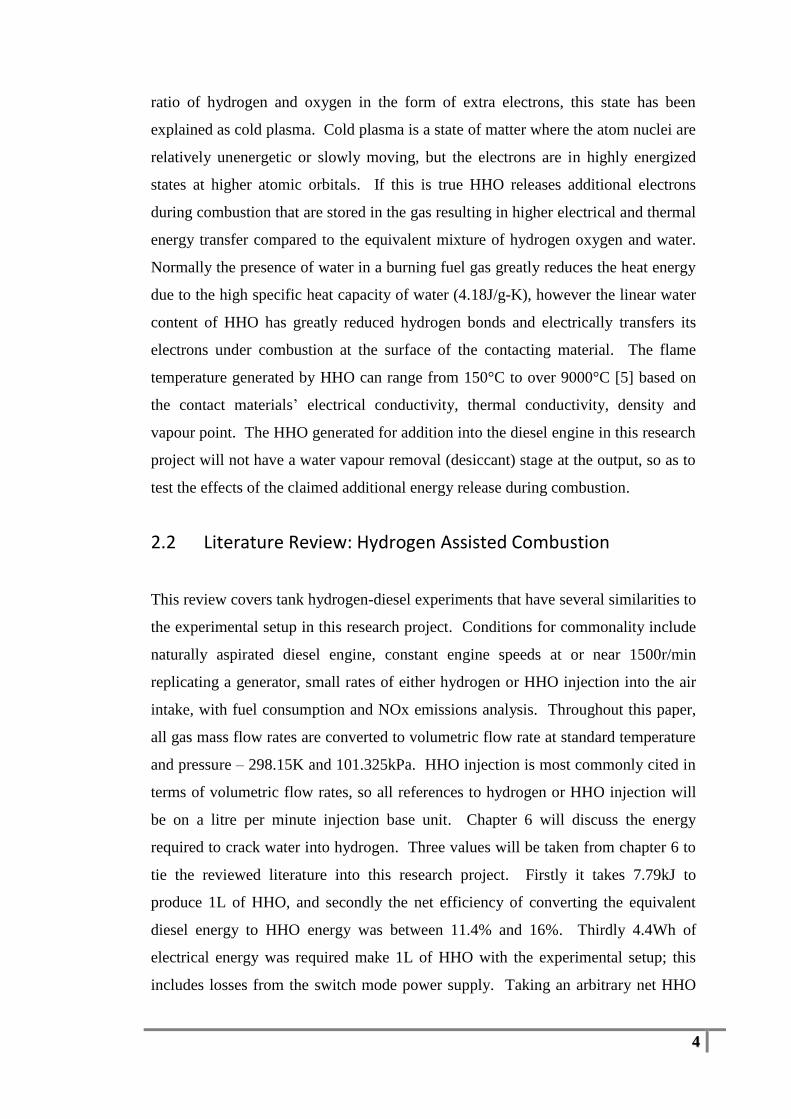
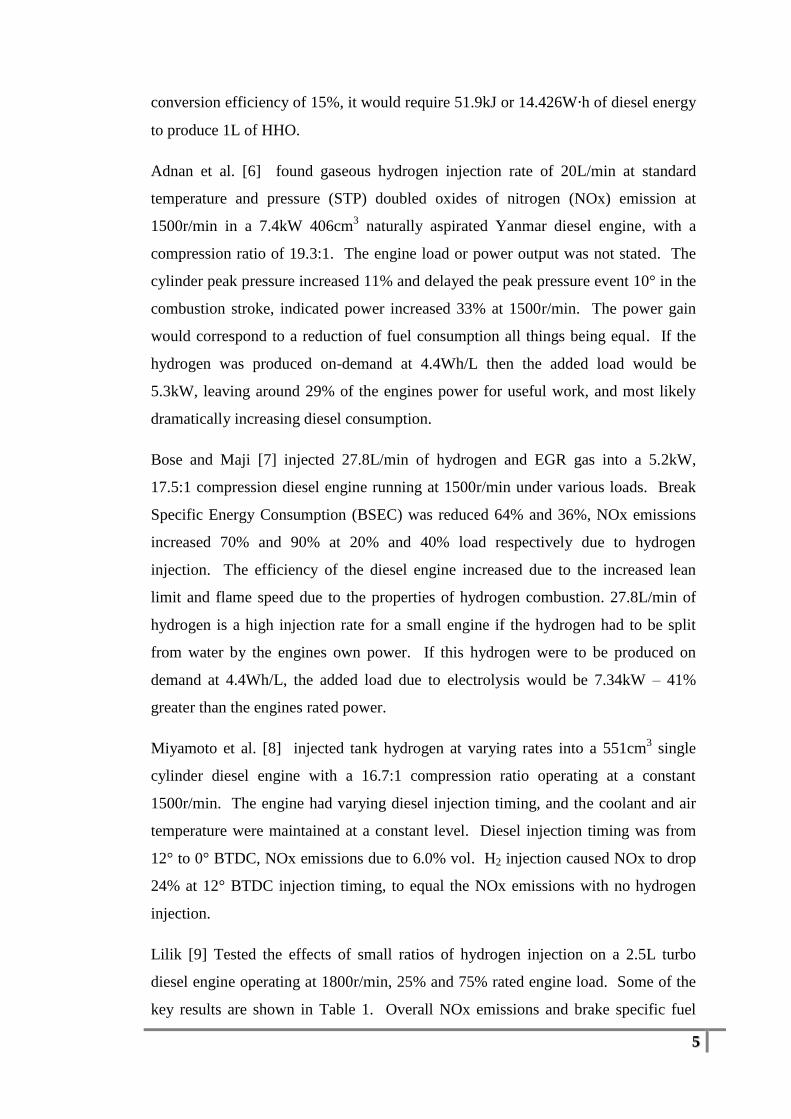
Lilik [9] Tested the effects of small ratios of hydrogen injection on a 2.5L turbo
diesel engine operating at 1800r/min, 25% and 75% rated engine load. Some of the
key results are shown in Table 1. Overall NOx emissions and brake specific fuel
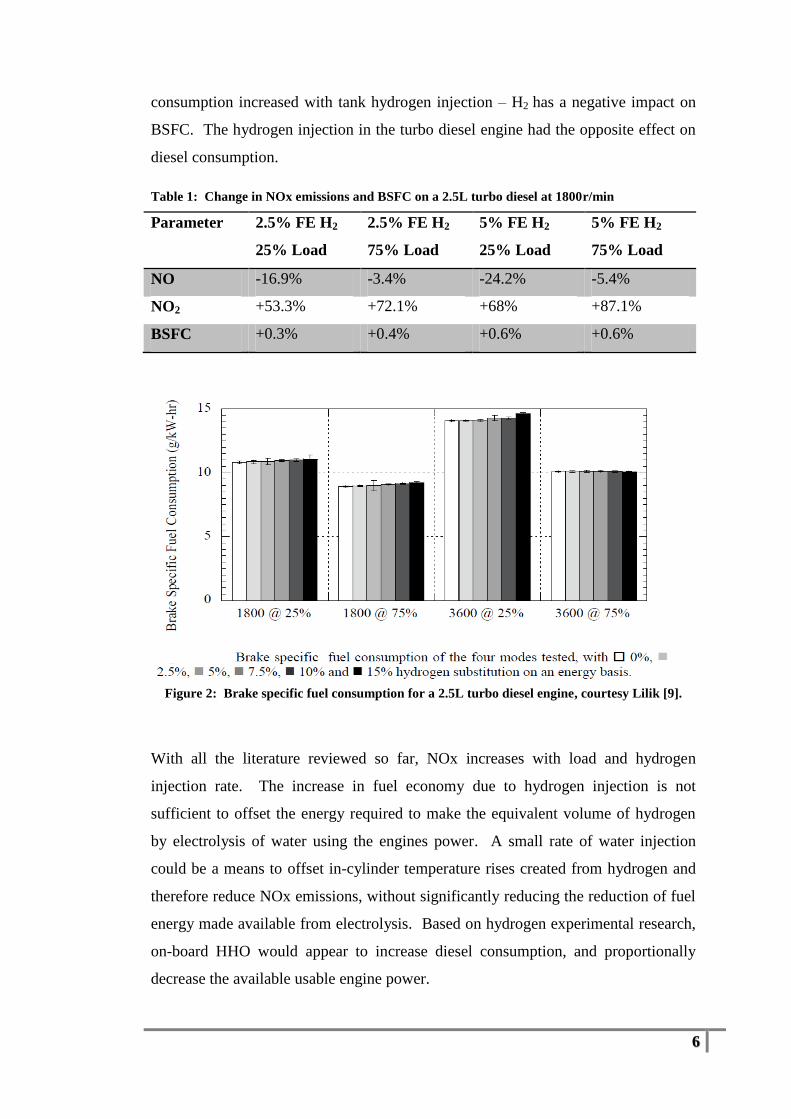
6
consumption increased with tank hydrogen injection – H2 has a negative impact on
BSFC. The hydrogen injection in the turbo diesel engine had the opposite effect on
diesel consumption.
Table 1: Change in NOx emissions and BSFC on a 2.5L turbo diesel at 1800r/min
Parameter 2.5% FE H2
25% Load
2.5% FE H2
75% Load
5% FE H2
25% Load
5% FE H2
75% Load
NO -16.9% -3.4% -24.2% -5.4%
NO2 +53.3% +72.1% +68% +87.1%
BSFC +0.3% +0.4% +0.6% +0.6%
Figure 2: Brake specific fuel consumption for a 2.5L turbo diesel engine, courtesy Lilik [9].
With all the literature reviewed so far, NOx increases with load and hydrogen
injection rate. The increase in fuel economy due to hydrogen injection is not
sufficient to offset the energy required to make the equivalent volume of hydrogen
by electrolysis of water using the engines power. A small rate of water injection
could be a means to offset in-cylinder temperature rises created from hydrogen and
therefore reduce NOx emissions, without significantly reducing the reduction of fuel
energy made available from electrolysis. Based on hydrogen experimental research,
on-board HHO would appear to increase diesel consumption, and proportionally
decrease the available usable engine power.
7
2.3 Literature Review: HHO as an additive in diesel engines
Bari and Esmaeil [2] operated a 4L direct injection (DI) diesel engine in simulated
generator mode at three loads at constant speed, supplying 0-32L/min of HHO
supplied by an externally supplied high power water electrolyser. Yilmaz et al. [1]
injected small rates of HHO into a diesel engine and performed tests with engine
load, speed and two stage unspecified HHO delivery rates as the system input
variables. Experiments performed by both teams of researchers showed positive
results in improving the fuel efficiency of the engines, but the quality of the data and
equipment varied significantly.
Bari and Esmaeil [2] operated a 4L DI diesel engine generator at three loads at
1500r/min, supplying up to 32L/min of HHO supplied by an externally powered
electrolyser. They sought to verify whether an on-board electrolyser can reduce fuel
consumption in a diesel engine. They reported around 14-15% reduction in fuel
energy consumption (diesel and hydrogen energy both included) across all loading
conditions and HHO injection rates. They found HHO is best used in small ratios,
up to 4% because up to this injection rate HHO acted as an additive rather than a 1:1
diesel replacement fuel. NOx emissions increased up to 27% with an increasing rate
of HHO injection, the same as for tank hydrogen injection.
There were a couple of problems with the experimental setup, the first was in the use
of a Dwyer air flow meter, and the second was in the assumption of unattainably
high oxy-hydrogen efficiency. The author attempted to use the same brand of flow
meter to measure HHO production, but found the Dwyer flow meter indicated
4.5L/min of gas when in fact 6L/min was measured using an upside down bucket test
due to the lighter density of hydrogen in the HHO mixture. If there is this much
constant measurement error, then the HHO gas rates would be 33% higher than
stated in the paper, significantly over optimizing the BSFC results. The water
electrolyser used in the experiment was an Epoch model EP-500 water electrolyser,
rated for an input power of 11.5kW, consuming 1.4L/h of water – the equivalent of
47.53L/min of HHO at 4Wh/L (using the pV=nRT gas volume formula), this would
confirm the 33% underestimate of HHO addition.
8
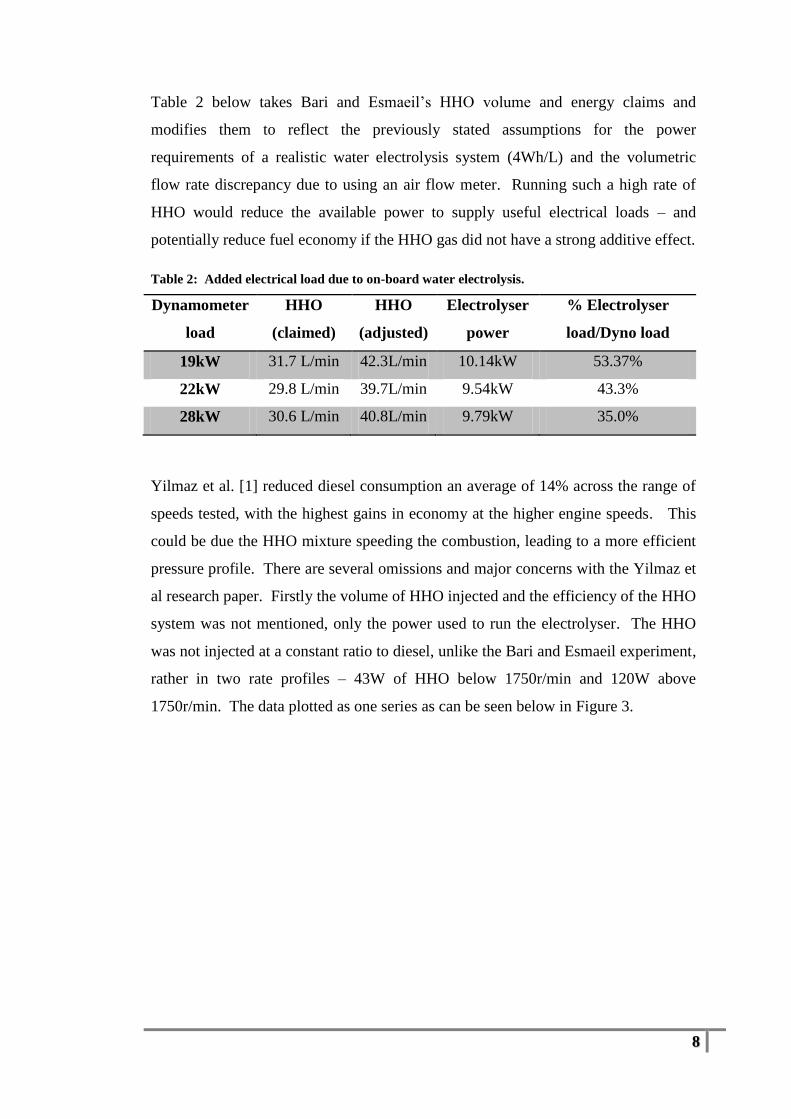
Table 2 below takes Bari and Esmaeil’s HHO volume and energy claims and
modifies them to reflect the previously stated assumptions for the power
requirements of a realistic water electrolysis system (4Wh/L) and the volumetric
flow rate discrepancy due to using an air flow meter. Running such a high rate of
HHO would reduce the available power to supply useful electrical loads – and
potentially reduce fuel economy if the HHO gas did not have a strong additive effect.
Table 2: Added electrical load due to on-board water electrolysis.
Dynamometer
load
HHO
(claimed)
HHO
(adjusted)
Electrolyser
power
% Electrolyser
load/Dyno load
19kW 31.7 L/min 42.3L/min 10.14kW 53.37%
22kW 29.8 L/min 39.7L/min 9.54kW 43.3%
28kW 30.6 L/min 40.8L/min 9.79kW 35.0%
Yilmaz et al. [1] reduced diesel consumption an average of 14% across the range of
speeds tested, with the highest gains in economy at the higher engine speeds. This
could be due the HHO mixture speeding the combustion, leading to a more efficient
pressure profile. There are several omissions and major concerns with the Yilmaz et
al research paper. Firstly the volume of HHO injected and the efficiency of the HHO
system was not mentioned, only the power used to run the electrolyser. The HHO
was not injected at a constant ratio to diesel, unlike the Bari and Esmaeil experiment,
rather in two rate profiles – 43W of HHO below 1750r/min and 120W above
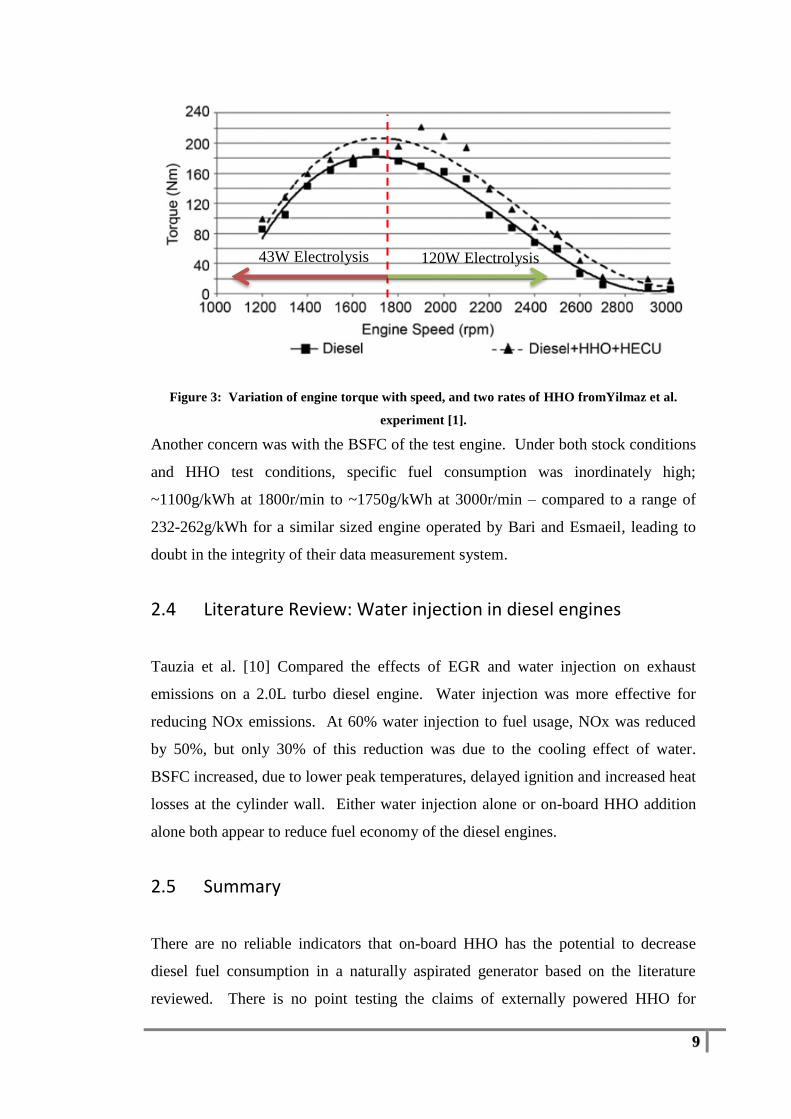
1750r/min. The data plotted as one series as can be seen below in Figure 3.
9
Figure 3: Variation of engine torque with speed, and two rates of HHO fromYilmaz et al.
experiment [1].
Another concern was with the BSFC of the test engine. Under both stock conditions
and HHO test conditions, specific fuel consumption was inordinately high;
~1100g/kWh at 1800r/min to ~1750g/kWh at 3000r/min – compared to a range of
232-262g/kWh for a similar sized engine operated by Bari and Esmaeil, leading to
doubt in the integrity of their data measurement system.
2.4 Literature Review: Water injection in diesel engines
Tauzia et al. [10] Compared the effects of EGR and water injection on exhaust
emissions on a 2.0L turbo diesel engine. Water injection was more effective for
reducing NOx emissions. At 60% water injection to fuel usage, NOx was reduced
by 50%, but only 30% of this reduction was due to the cooling effect of water.
BSFC increased, due to lower peak temperatures, delayed ignition and increased heat
losses at the cylinder wall. Either water injection alone or on-board HHO addition
alone both appear to reduce fuel economy of the diesel engines.
2.5 Summary
There are no reliable indicators that on-board HHO has the potential to decrease
diesel fuel consumption in a naturally aspirated generator based on the literature
reviewed. There is no point testing the claims of externally powered HHO for
120W Electrolysis 43W Electrolysis

10
reducing fuel consumption, as the energy required to make it could be more
effectively used directly, and HHO needs to be produced on-board and on-demand to
reflect the current application of this technology. This necessitates an experiment
using a real water electrolyser with real losses, and seeing if the additive effect can
outweigh the considerable inefficiencies of on-board hydrogen production. NOx
emissions were increased in all the papers review, but the factors that may lead to a
reduction in this experiment are the water content in the HHO and the added water
injection.
11
Chapter 3 Safety
3.1 Construction
This research project had a large experimental portion requiring fabrication of a few
different components. The components included manufacture of intake and exhaust
manifolds for the engine, plumbing the diesel supply and metering system,
rebuilding of electrolyser, and calibrating the electrolyser. The activities requiring
risk assessment included cutting, drilling, grinding, welding and removal of old
sodium hydroxide electrolyte (drain cleaner). A risk assessment was performed on
each task so as to reduce the risks to as low as reasonable practicable. In each case
two layers of controls were used to reduce risk and consequence of harm - personal
protective equipment (PPE) and competence. PPE was used as the means to reduce
risk of injury to acceptable levels. PPE for this task included wearing leather gloves,
long sleeve shirt, welding mask for welding, room ventilation, face shield for
cutting, grinding and drilling.
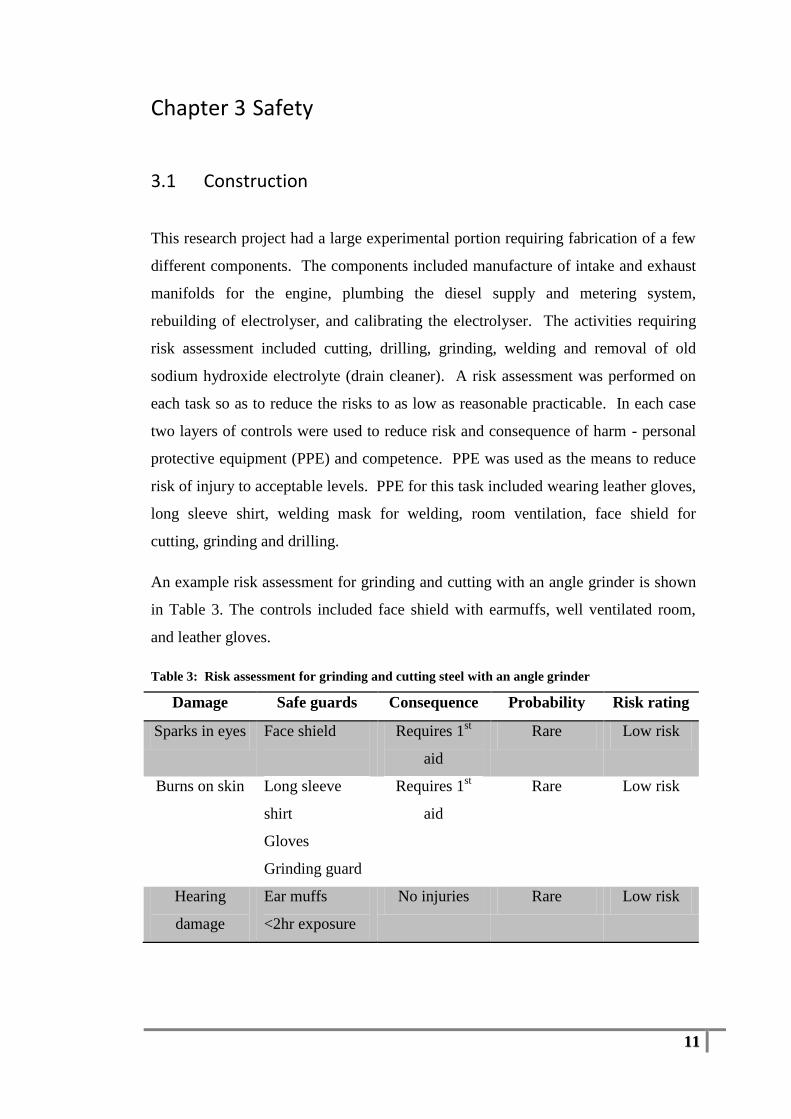
An example risk assessment for grinding and cutting with an angle grinder is shown
in Table 3. The controls included face shield with earmuffs, well ventilated room,
and leather gloves.
Table 3: Risk assessment for grinding and cutting steel with an angle grinder
Damage Safe guards Consequence Probability Risk rating
Sparks in eyes Face shield
Requires 1st
aid
Rare Low risk
Burns on skin Long sleeve
shirt
Gloves
Grinding guard
Requires 1st
aid
Rare Low risk
Hearing
damage
Ear muffs
<2hr exposure
No injuries Rare Low risk
12
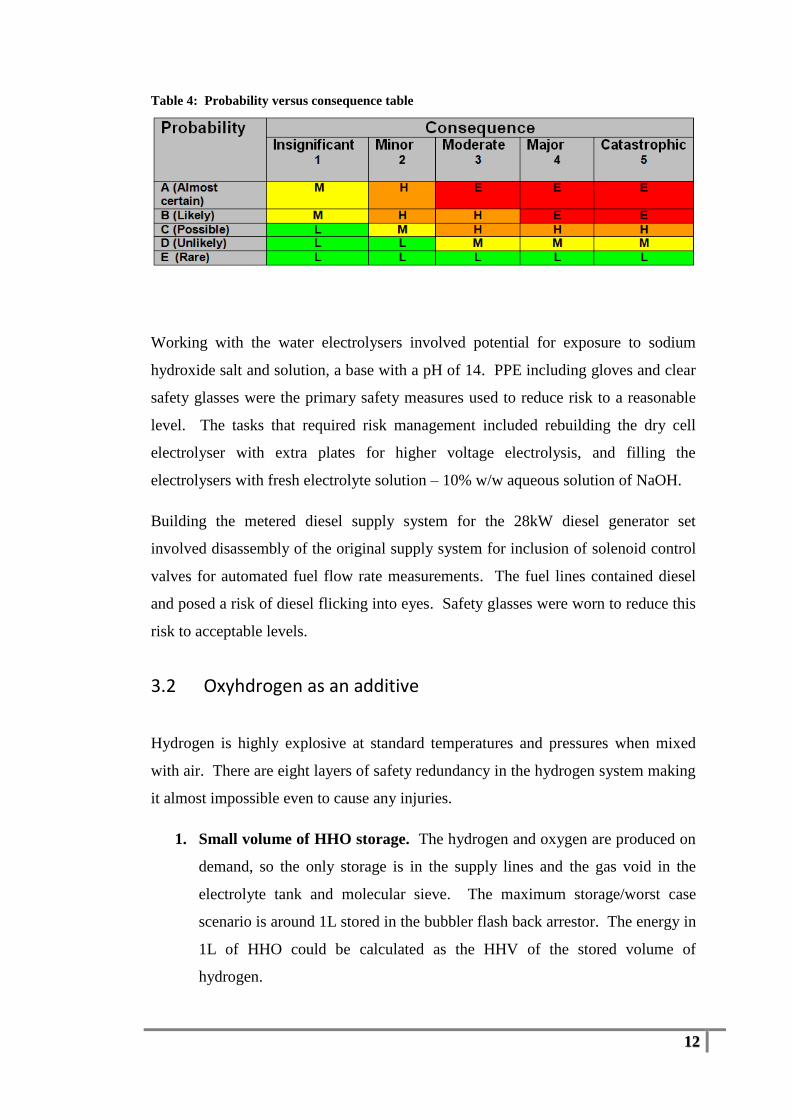
Table 4: Probability versus consequence table
Working with the water electrolysers involved potential for exposure to sodium
hydroxide salt and solution, a base with a pH of 14. PPE including gloves and clear
safety glasses were the primary safety measures used to reduce risk to a reasonable
level. The tasks that required risk management included rebuilding the dry cell
electrolyser with extra plates for higher voltage electrolysis, and filling the
electrolysers with fresh electrolyte solution – 10% w/w aqueous solution of NaOH.
Building the metered diesel supply system for the 28kW diesel generator set
involved disassembly of the original supply system for inclusion of solenoid control
valves for automated fuel flow rate measurements. The fuel lines contained diesel
and posed a risk of diesel flicking into eyes. Safety glasses were worn to reduce this
risk to acceptable levels.
3.2 Oxyhdrogen as an additive
Hydrogen is highly explosive at standard temperatures and pressures when mixed
with air. There are eight layers of safety redundancy in the hydrogen system making
it almost impossible even to cause any injuries.
1. Small volume of HHO storage. The hydrogen and oxygen are produced on
demand, so the only storage is in the supply lines and the gas void in the
electrolyte tank and molecular sieve. The maximum storage/worst case
scenario is around 1L stored in the bubbler flash back arrestor. The energy in
1L of HHO could be calculated as the HHV of the stored volume of
hydrogen.
13
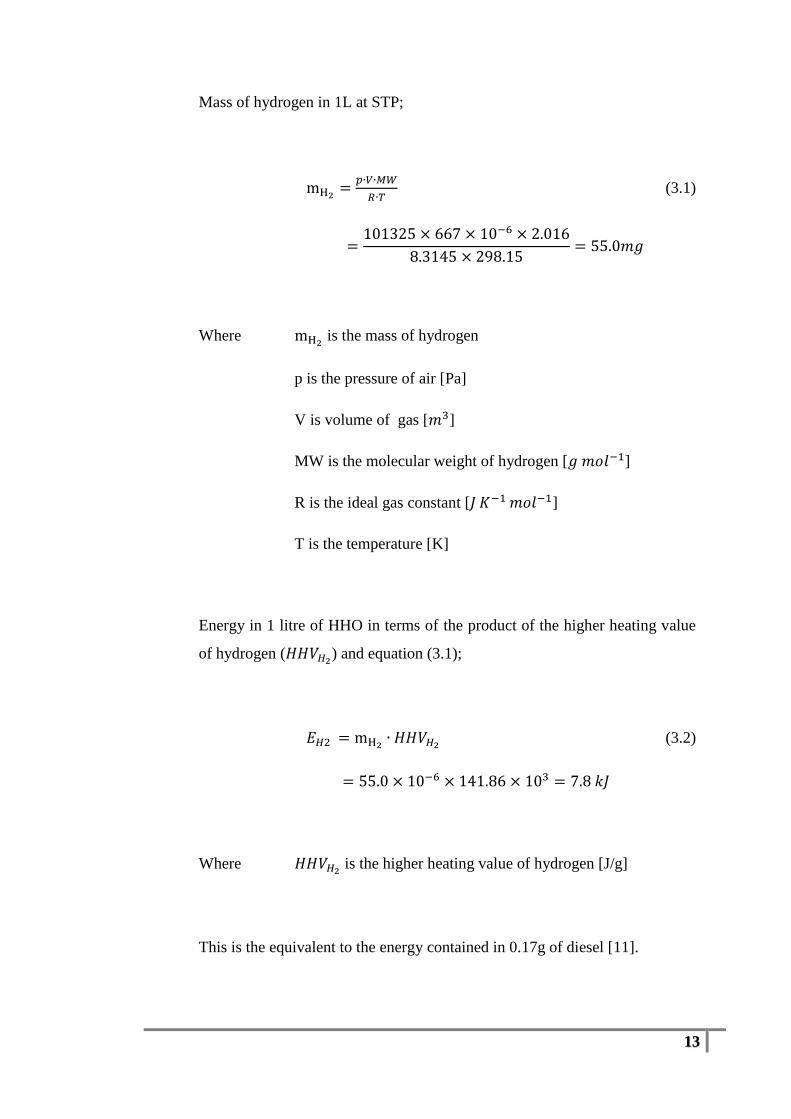
Mass of hydrogen in 1L at STP;
(3.1)
2 − 2
2
Where is the mass of hydrogen
p is the pressure of air [Pa]
V is volume of gas [ ]
MW is the molecular weight of hydrogen [ − ]
R is the ideal gas constant [ − − ]
T is the temperature [K]
Energy in 1 litre of HHO in terms of the product of the higher heating value
of hydrogen ( ) and equation (3.1);
(3.2)
−
Where is the higher heating value of hydrogen [J/g]
This is the equivalent to the energy contained in 0.17g of diesel [11].
14
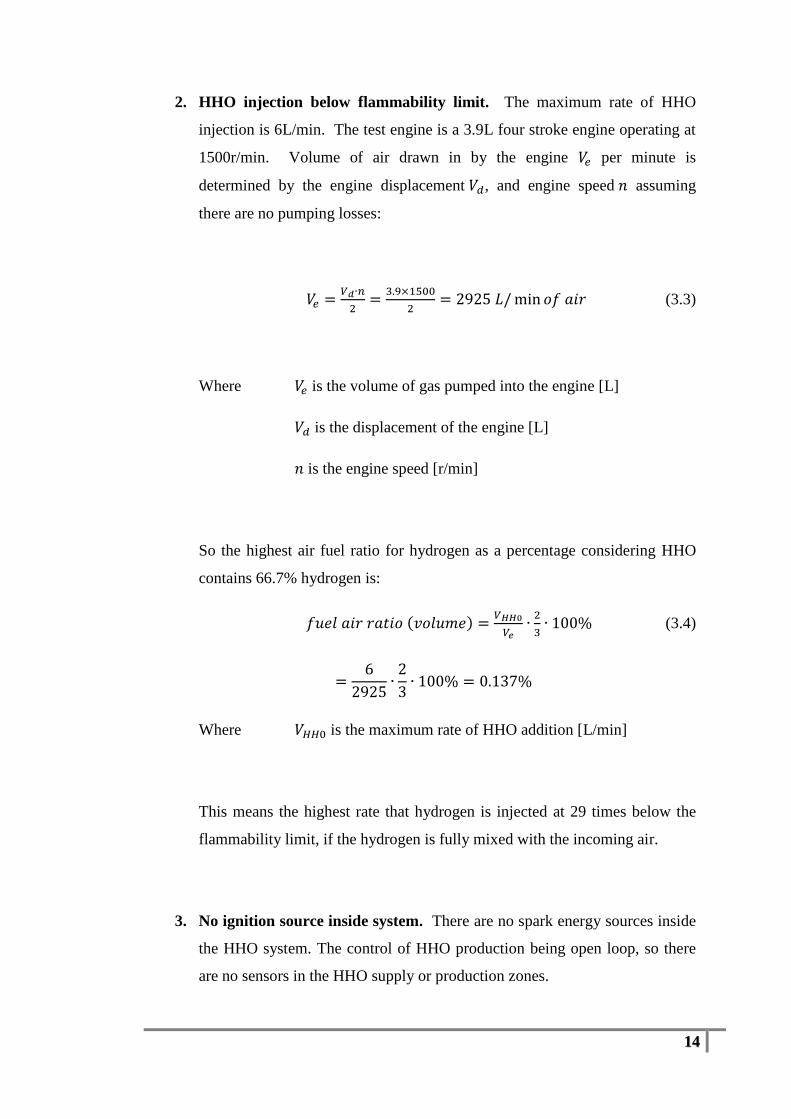
2. HHO injection below flammability limit. The maximum rate of HHO
injection is 6L/min. The test engine is a 3.9L four stroke engine operating at
1500r/min. Volume of air drawn in by the engine per minute is
determined by the engine displacement , and engine speed assuming
there are no pumping losses:
2 2 (3.3)
Where is the volume of gas pumped into the engine [L]
is the displacement of the engine [L]
is the engine speed [r/min]
So the highest air fuel ratio for hydrogen as a percentage considering HHO
contains 66.7% hydrogen is:
( )
(3.4)
2 2 2
Where is the maximum rate of HHO addition [L/min]
This means the highest rate that hydrogen is injected at 29 times below the
flammability limit, if the hydrogen is fully mixed with the incoming air.
3. No ignition source inside system. There are no spark energy sources inside
the HHO system. The control of HHO production being open loop, so there
are no sensors in the HHO supply or production zones.
15
4. High auto ignition temperature of 585°C [11]. The hottest part of the
exhaust pipe was measured at 440 under full load, so this is ~140 below
the flammability limit. There is no mechanism to allow HHO to be vented to
the exhaust manifold in any case of failure.
5. Leak tested. The system was tested for hydrogen flow at the electrolyte tank
and then at the bubbler where the gas leaves the system. The seals in the
flash back arrestor where leak proofed with Vaseline for easy of servicing.
6. Hydrogen is highly dissipative. Hydrogen is 14 times lighter than air rising
at 20m/s [11].
7. Room ventilation. USQ’s engine laboratory is fully ventilated, even if it
was sealed the hydrogen would dissipate out of the room quicker then it
could be produced.
8. Emergency stop isolation. The emergency stop button (E-stop) breaks
power to the diesel supply valve, and makes a separated isolated contact to
the PLC control system. On activation the DC electrical supply to the water
electrolyser is isolated, preventing an more production of HHO. The main
supply relay is supplied from generators 24V DC PLC power supply, which
is only active when the engine is running.

16
3.3 Operation
A hazard operability assessment was conducted before the experimental equipment
was installed on the diesel generator set as per Appendix B: Experiment HAZOP.
Two academic staff (one having RPEQ registration) and an electrical technician
where present to review all plant and procedure to be used in the experiment that
differed from standard procedure. All risks identified were reduced to acceptable
levels primarily through procedural safeguards and having hearing and eye
protection. Safe operation of the experiment mainly involved operators
understanding the correct start, run, stop and emergency shutdown procedures for the
equipment.
17
Chapter 4 Methodology
4.1 Question
Can on-board HHO addition and water injection in any ratio provide significant fuel
savings and reduce exhaust emissions over baseline conditions for a natural aspirated
diesel engine? The independent variables include on-board HHO addition at varying
rates, and water injection at 0% and 10% of the baseline diesel consumption. The
dependant variables include brake specific fuel consumption and NOx emissions.
The test bed is a naturally aspirated 39kW diesel engine mechanically coupled to a
28kW three phase 415V AC generator. This generator loads the engine to 30% and
55% of its rated capacity via a resistive load bank.
4.2 Hypothesis
According to the literature reviewed, HHO takes more energy to create through
electrolysis then can be recovered from using HHO addition as a fuel additive. The
combined losses of the diesel engine, generator, switch mode power supply and
water electrolysers are significant. The additive effect of HHO for improving
combustion would have to be greater than the combination of these losses to increase
fuel economy. However the benefits of combining water injection and on-board
HHO addition may allow a reduction in NOx emissions while still maintaining the
fuel economy of the diesel generator.
4.3 Test
An experiment was performed to prove the effects of on-board HHO and water
addition to a diesel generators performance. The test was automated with an
industrial PLC system for the sake of repeatability of the test and experimental
rigour in the results. The final test involved injecting 0-6L/min of HHO produced
on-board, with and without 10% water substitution for diesel. The key results of the
test included the trend in relationship between the on-board HHO addition, water
injection and generator load with the diesel consumption and NOx emissions.
18
Chapter 5 Experimental System
5.1 Experimental Design
The experiment is designed to automatically cycle four rates of HHO injection, two
rates of water injection at two engine loads. Primary goals of the experimental
design include;
Repeatability of tests
Accurate control over the input/system variables
Adjustment for environmental conditions such as ambient air temperature
and relative humidity
Steady state engine operating conditions – constant 1500 r/min engine speed
and stable exhaust gas temperatures.
The generator used in the tests was a Cummins 4B3.9 series naturally aspirated
diesel generator set. The details of the engine and generator are listed in Table 5.
Table 5: Generator set specifications.
Make and Model Cummins 4B3.9
Combustion System Type Cast iron 4 stroke, 4 cylinder, inline, direct
injection
Bore Stroke 102 120 mm
Piston Displacement 3.9 litre
Compression Ratio 16.5:1
Rated Power 39 kW at 1500 r/min
Generator rated power 28 kW at 1500 r/min
5.1.1 Automated Tests
The test was controlled and automated with a Siemens S7-200 series PLC system.
Industrial automation allowed good adaptability of the program structure, ease of
19
program design, real time monitoring of the engine states, and because of its 11 bit
digital to analog converter (DAC) and analog to digital converter (ADC) resolution.
Initial Test Procedure
Initially the test cycle was designed to be fully automated, where the PLC stepped
through the engine through three loads, having water injection rates incremented up
to 25% of the diesel consumption, as well as stepping through sixty rates of HHO
injection from 0-6L/min. This gave a total of 1500 system states. All sensors were
programmed to be read every 100ms with the average value logged every 500ms.
The data was processed immediately after each automated test into three dimensional
surface plots of fuel consumption and exhaust gas temperature versus HHO injection
and water injection. This method required heavy filtering of the data in the PLC
with a digital filter and in the MATLAB script due to the noise in the fuel metering
system. The noise was caused by the short time base magnifying the ±1/7200 ADC
noise in the ultrasonic level sensor. The error in a single sequential pair of fuel
consumption recordings was in the order of ±33% of the single load diesel
consumption rate, for example ±1200g/h for a 3600g/h diesel consumption rate. A
digital filtering with a moving average of 12 samples reduced the error down to less
than ±36g/h over 3600g/h or 1%, but the time shift in the diesel consumption data
and the low confidence level in the data resulted in a modified sampling algorithm
over a much larger time base. Another issue was with the engine not being given
enough time to reach its steady state operating temperature when the loads were
increased automatically in the test cycle.
Final Test Procedure
The final test cycle involved running the engine with fixed input variables for the
time the engine took to drain 100g of diesel – about 70 seconds at the 55% engine
loading. This represents a 700x greater time base for acquiring diesel consumption
data for a given combination of input variables compared to the previous test cycle
used. The test procedure in this final experimental structure involved the operator
setting the load and water injection rate then allowing the PLC to step through four
discrete increases in HHO injection from 0L/min to 6L/min. There were a total of
20
four test cycles, running HHO injection with and without 10% water injection at
30% and 55% engine load. The PLC was programmed to only allow a new test
cycle to commence after the exhaust gas temperature stabilized to a temperature rise
of under 3°C/min. The exhaust temperature would rise in the order of 100 over 10
minutes when the load on the generator was increased from 30% to 55% of the
engine load.
The test cycle used to collect the data only had 16 system states but with much lower
noise and error margin - under 1% for the diesel metering. When the initial
automated test scheme was run, the engine was logged in 1080 states. It was
apparent even at that stage that there were no significant reductions in fuel
consumption could be obtained for any rate of HHO or water injection. There was
no need to test a high number of system states, and there was no optimization
required.
Optimized Testing
Optimized testing would have taken place if on-board HHO or HHO combined with
water injection reduced diesel consumption. It was obvious after the full tests that
there were no optimal rates or ratios of water injection. On board HHO injection led
to no gains in fuel economy in any rates tested – with or without water injection. If a
reduction in diesel consumption was discovered, the next step would have been to
interpolate the optimal HHO to water injection ratio for a given engine load based on
recorded data, and then confirm those rates with a final phase of testing.
21
5.2 System Design
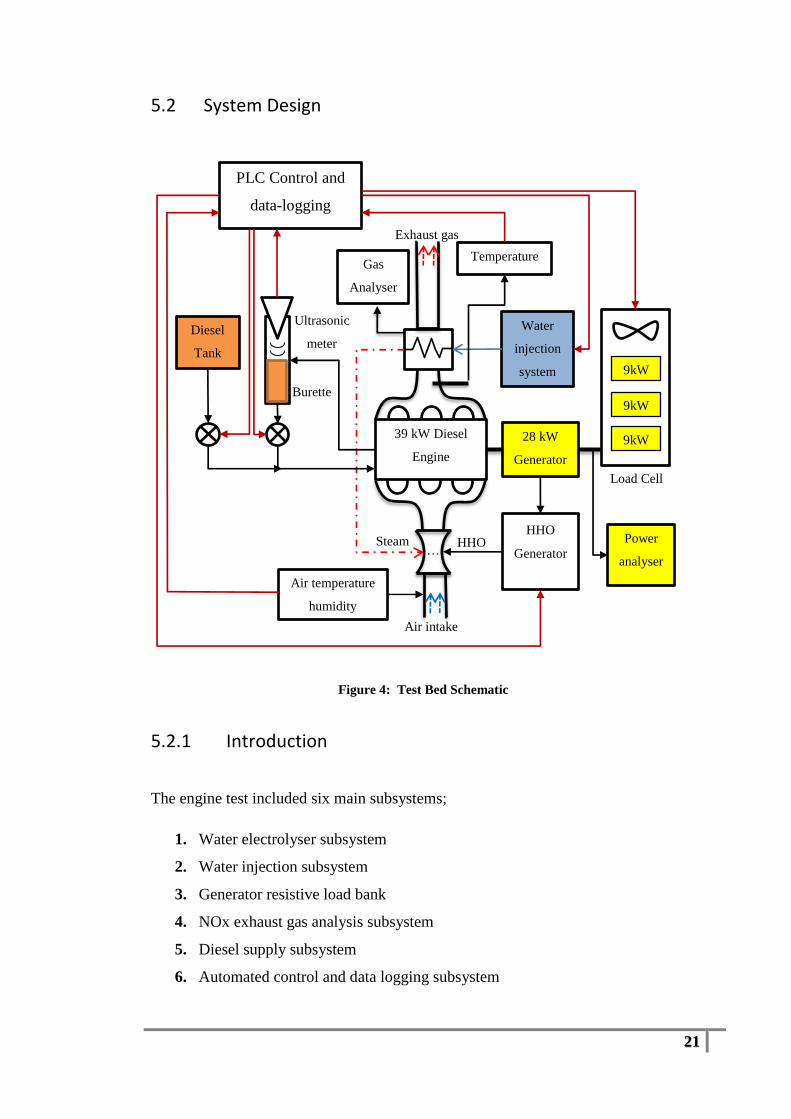
Figure 4: Test Bed Schematic
5.2.1 Introduction
The engine test included six main subsystems;
1. Water electrolyser subsystem
2. Water injection subsystem
3. Generator resistive load bank
4. NOx exhaust gas analysis subsystem
5. Diesel supply subsystem
6. Automated control and data logging subsystem
39 kW Diesel
Engine
28 kW
Generator
9kW
9kW
9kW
Load Cell
Water
injection
system
HHO
Generator
Burette
Diesel
Tank
Ultrasonic
meter
Power
analyser
Temperature Gas
Analyser
Air intake
Exhaust gas
…
PLC Control and
data-logging
Air temperature
humidity
Steam HHO
22
The selection process for each subsystem was based on balancing accuracy and
reliability of control, availability of parts, simplicity of design, time constraints and
replication of equivalent HHO products or concepts in the public domain.
5.2.2 HHO Subsystem
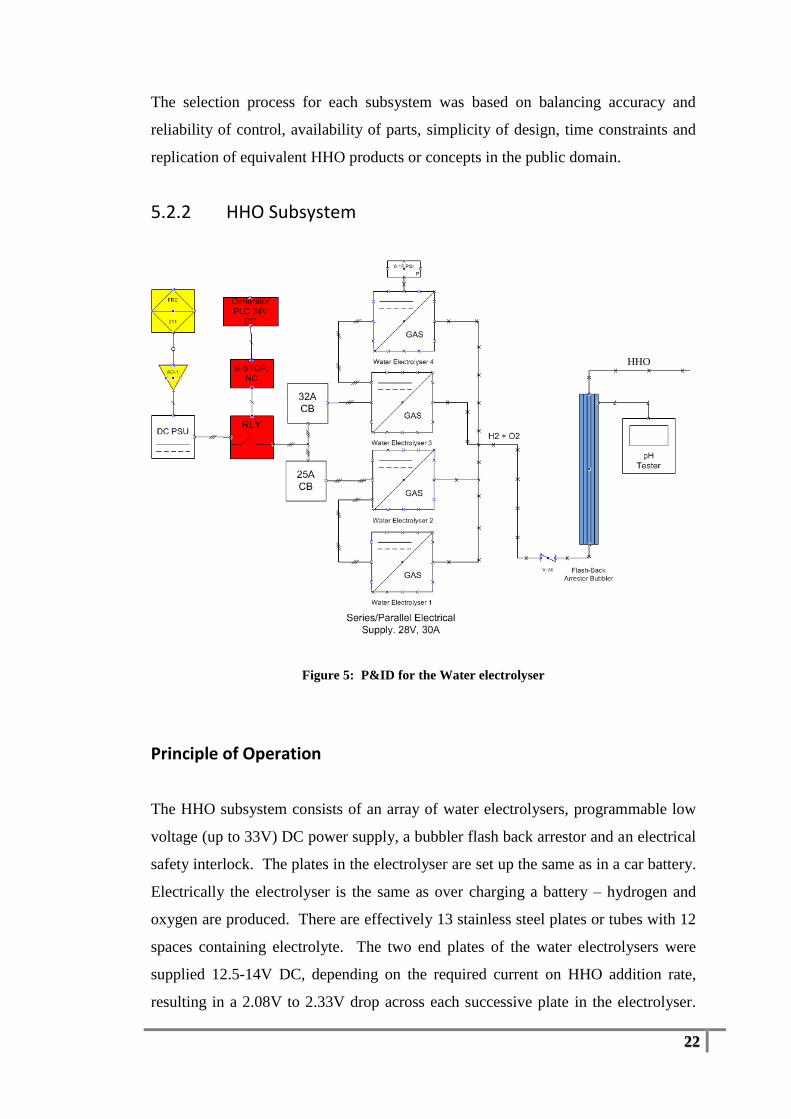
Figure 5: P&ID for the Water electrolyser
Principle of Operation
The HHO subsystem consists of an array of water electrolysers, programmable low
voltage (up to 33V) DC power supply, a bubbler flash back arrestor and an electrical
safety interlock. The plates in the electrolyser are set up the same as in a car battery.
Electrically the electrolyser is the same as over charging a battery – hydrogen and
oxygen are produced. There are effectively 13 stainless steel plates or tubes with 12
spaces containing electrolyte. The two end plates of the water electrolysers were
supplied 12.5-14V DC, depending on the required current on HHO addition rate,
resulting in a 2.08V to 2.33V drop across each successive plate in the electrolyser.
HHO
23
When the voltage is supplied current flows, work is done in the form of splitting
water into hydrogen and oxygen and waste heat. HHO production is directly
proportional to current flow, so the greater the current supplied to the electrolysers,
the greater the production of HHO in linear proportion. This process is explained in
more detail in Chapter 6.
Electrolyser Control
The water electrolyser had its current supplied from a Sorenson XG 1700 series 33V,
50A DC programmable power supply. The power supply’s current was controlled
by a 0-10V DC signal from a PLC DAC output. Four 6-cell electrolysers were used
– two where rated at 18A and two where rated at 30A. To reduce the current at full
HHO production, the cells were run in series/parallel. The 18A electrolyser were
connected in series with each other and the 30A electrolysers were connected in
series with each other. These two sets of electrolysers connected in parallel (Figure
5) so as two both have 25-28V. The cables and electrolysers were protected by the
DC power supply’s current limiting function, and by two DC circuit breakers rated at
25A and 32A. The system could be isolated by manually activating the emergency
stop button. This would break the current to the solenoid relay, and send a control
signal to the PLC notifying the program that there was a fault.
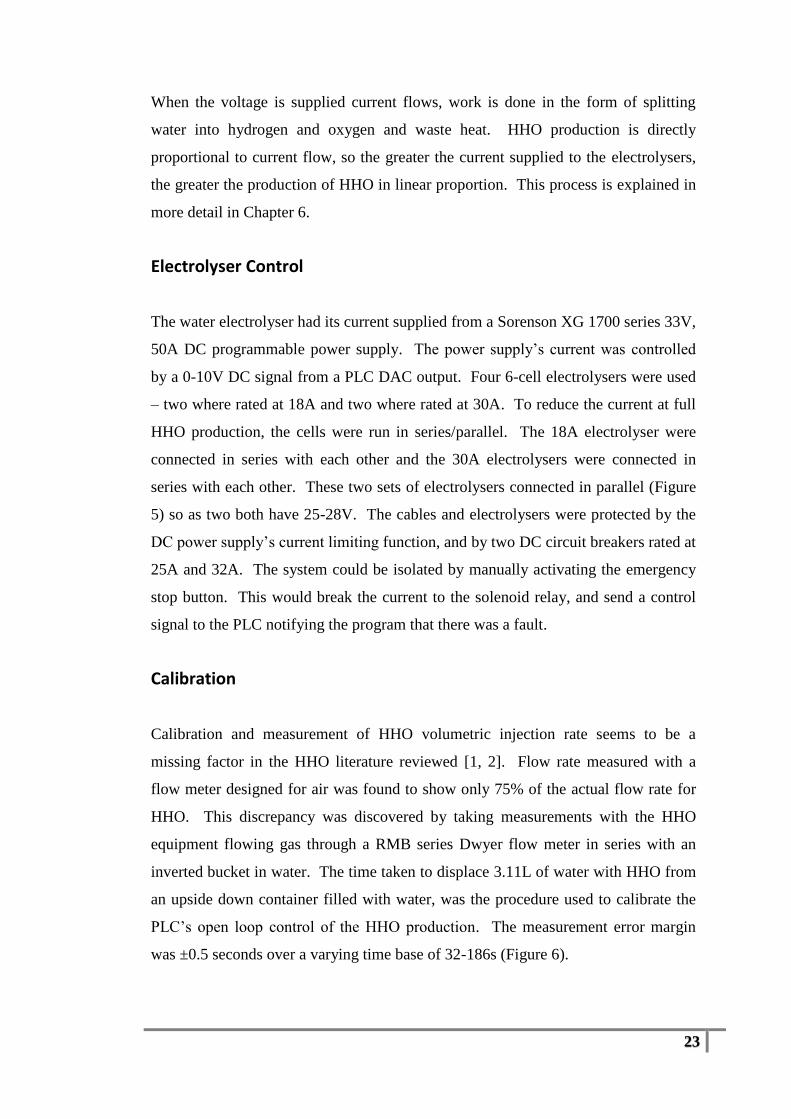
Calibration
Calibration and measurement of HHO volumetric injection rate seems to be a
missing factor in the HHO literature reviewed [1, 2]. Flow rate measured with a
flow meter designed for air was found to show only 75% of the actual flow rate for
HHO. This discrepancy was discovered by taking measurements with the HHO
equipment flowing gas through a RMB series Dwyer flow meter in series with an
inverted bucket in water. The time taken to displace 3.11L of water with HHO from
an upside down container filled with water, was the procedure used to calibrate the
PLC’s open loop control of the HHO production. The measurement error margin
was ±0.5 seconds over a varying time base of 32-186s (Figure 6).
24
Figure 6: Representation of gas volume calibration setup.
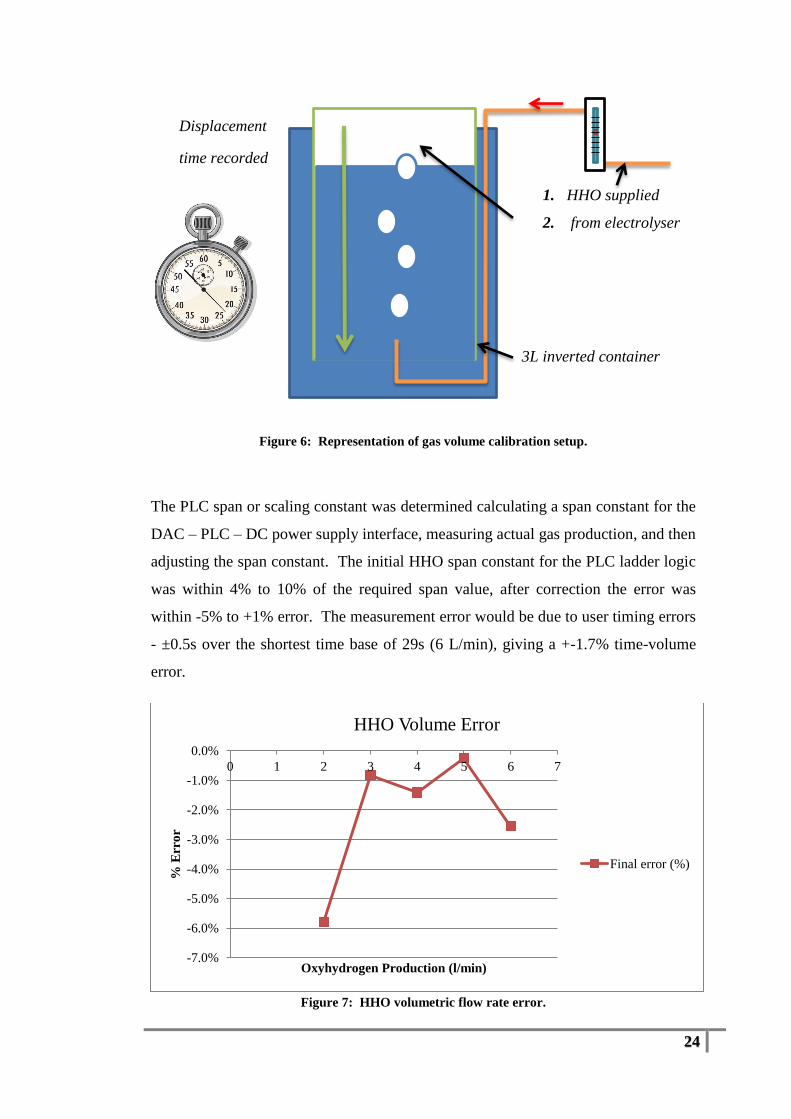
The PLC span or scaling constant was determined calculating a span constant for the
DAC – PLC – DC power supply interface, measuring actual gas production, and then
adjusting the span constant. The initial HHO span constant for the PLC ladder logic
was within 4% to 10% of the required span value, after correction the error was
within -5% to +1% error. The measurement error would be due to user timing errors
- ±0.5s over the shortest time base of 29s (6 L/min), giving a +-1.7% time-volume
error.
Figure 7: HHO volumetric flow rate error.
-7.0%
-6.0%
-5.0%
-4.0%
-3.0%
-2.0%
-1.0%
0.0%
0 1 2 3 4 5 6 7
% E
rro
r
Oxyhydrogen Production (l/min)
HHO Volume Error
Final error (%)
1. HHO supplied
2. from electrolyser
3L inverted container
Displacement
time recorded
25
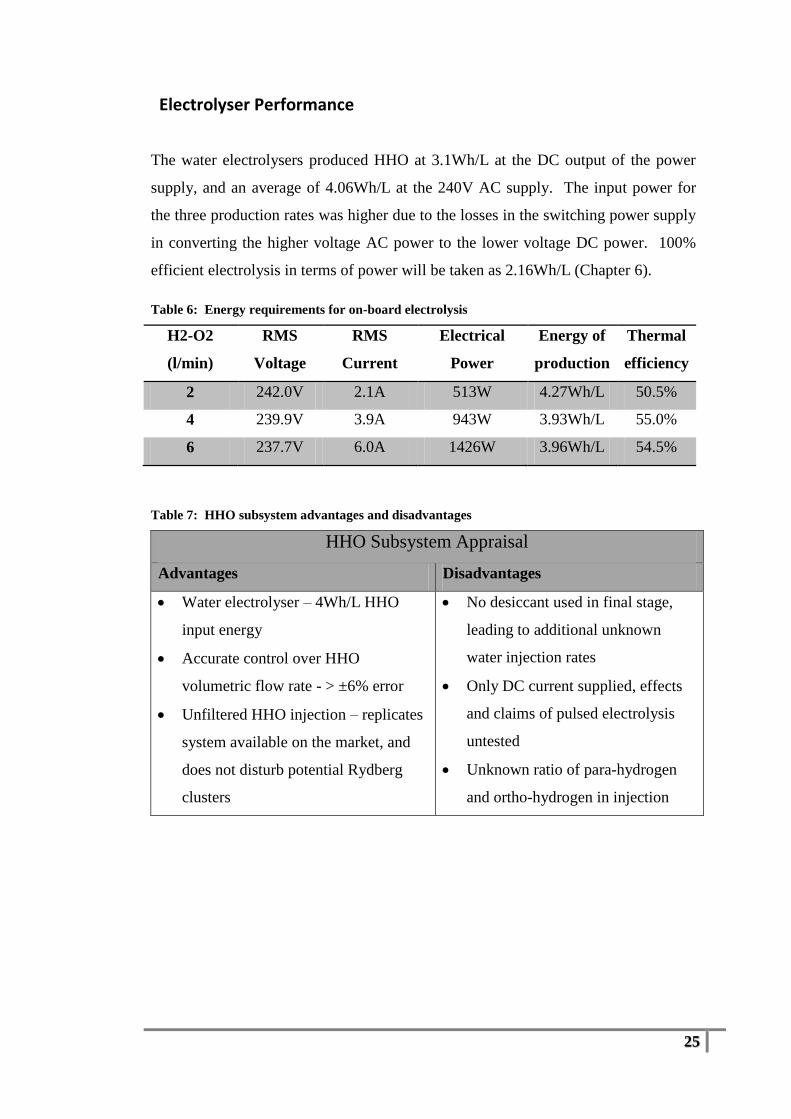
Electrolyser Performance
The water electrolysers produced HHO at 3.1Wh/L at the DC output of the power
supply, and an average of 4.06Wh/L at the 240V AC supply. The input power for
the three production rates was higher due to the losses in the switching power supply
in converting the higher voltage AC power to the lower voltage DC power. 100%
efficient electrolysis in terms of power will be taken as 2.16Wh/L (Chapter 6).
Table 6: Energy requirements for on-board electrolysis
H2-O2
(l/min)
RMS
Voltage
RMS
Current
Electrical
Power
Energy of
production
Thermal
efficiency
2 242.0V 2.1A 513W 4.27Wh/L 50.5%
4 239.9V 3.9A 943W 3.93Wh/L 55.0%
6 237.7V 6.0A 1426W 3.96Wh/L 54.5%
Table 7: HHO subsystem advantages and disadvantages
HHO Subsystem Appraisal
Advantages Disadvantages
Water electrolyser – 4Wh/L HHO
input energy
Accurate control over HHO
volumetric flow rate - > ±6% error
Unfiltered HHO injection – replicates
system available on the market, and
does not disturb potential Rydberg
clusters
No desiccant used in final stage,
leading to additional unknown
water injection rates
Only DC current supplied, effects
and claims of pulsed electrolysis
untested
Unknown ratio of para-hydrogen
and ortho-hydrogen in injection
26
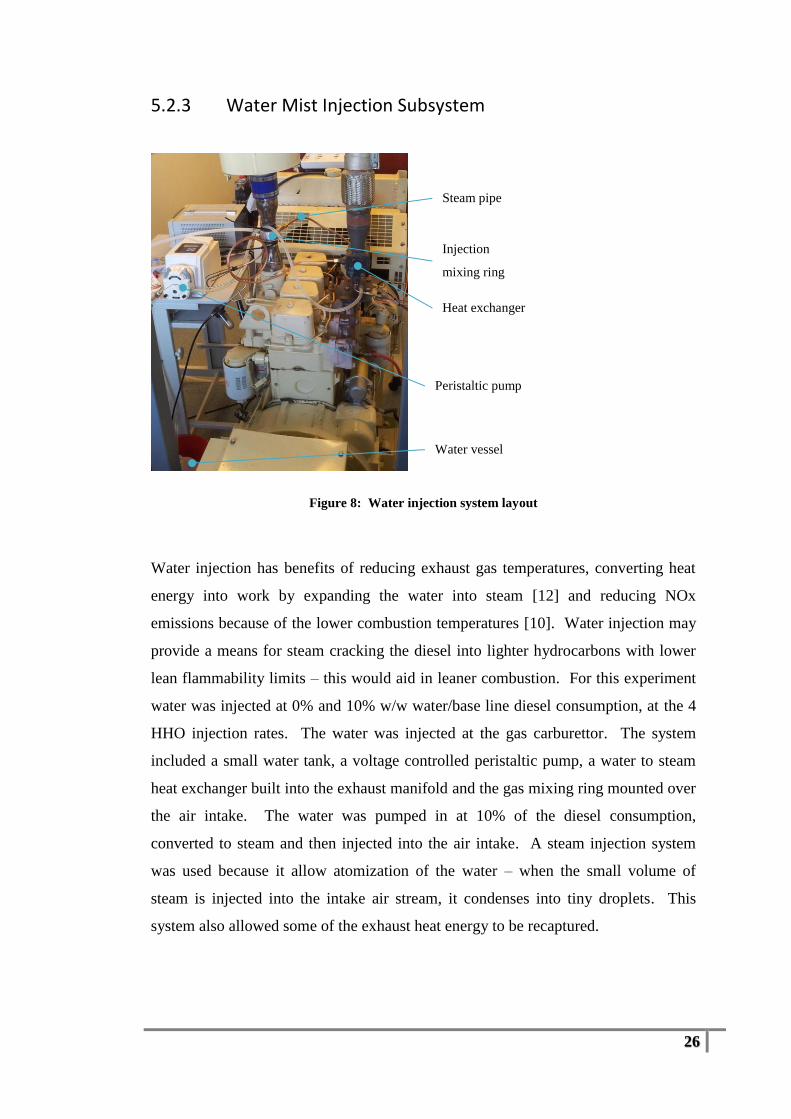
5.2.3 Water Mist Injection Subsystem
Figure 8: Water injection system layout
Water injection has benefits of reducing exhaust gas temperatures, converting heat
energy into work by expanding the water into steam [12] and reducing NOx
emissions because of the lower combustion temperatures [10]. Water injection may
provide a means for steam cracking the diesel into lighter hydrocarbons with lower
lean flammability limits – this would aid in leaner combustion. For this experiment
water was injected at 0% and 10% w/w water/base line diesel consumption, at the 4
HHO injection rates. The water was injected at the gas carburettor. The system
included a small water tank, a voltage controlled peristaltic pump, a water to steam
heat exchanger built into the exhaust manifold and the gas mixing ring mounted over
the air intake. The water was pumped in at 10% of the diesel consumption,
converted to steam and then injected into the air intake. A steam injection system
was used because it allow atomization of the water – when the small volume of
steam is injected into the intake air stream, it condenses into tiny droplets. This
system also allowed some of the exhaust heat energy to be recaptured.
Heat exchanger
Peristaltic pump
Steam pipe
Injection
mixing ring
Water vessel
27
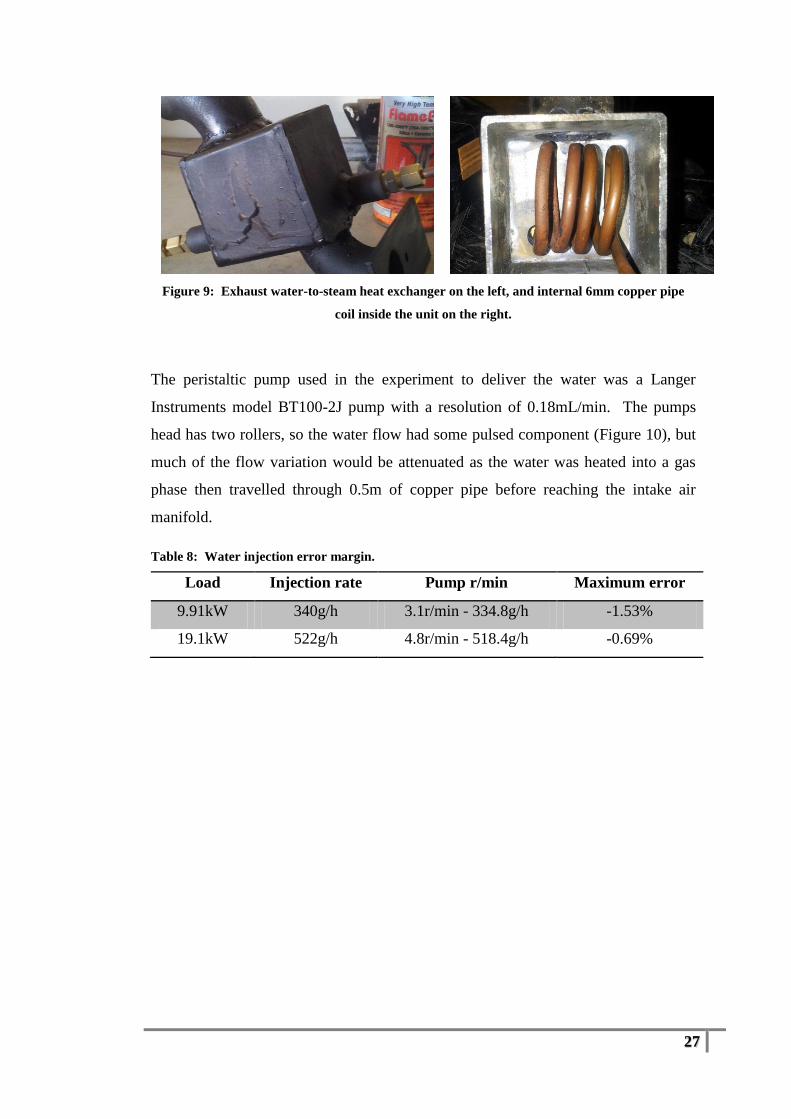
Figure 9: Exhaust water-to-steam heat exchanger on the left, and internal 6mm copper pipe
coil inside the unit on the right.
The peristaltic pump used in the experiment to deliver the water was a Langer
Instruments model BT100-2J pump with a resolution of 0.18mL/min. The pumps
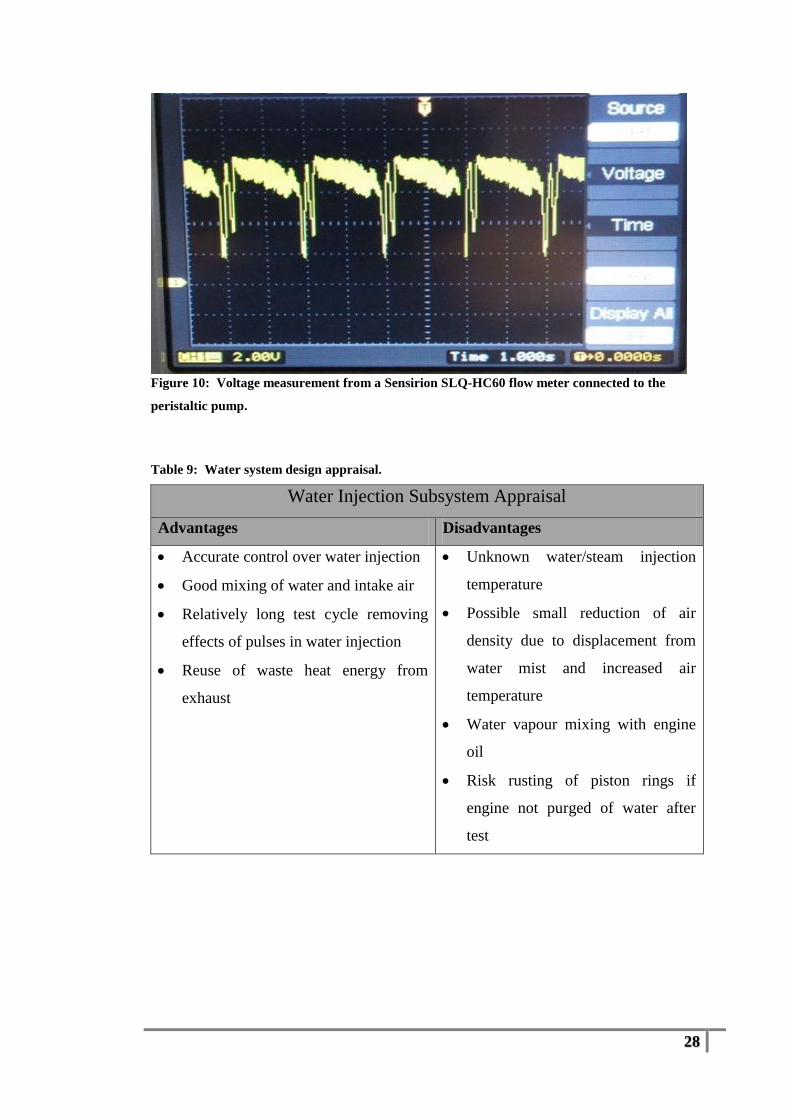
head has two rollers, so the water flow had some pulsed component (Figure 10), but
much of the flow variation would be attenuated as the water was heated into a gas
phase then travelled through 0.5m of copper pipe before reaching the intake air
manifold.
Table 8: Water injection error margin.
Load Injection rate Pump r/min Maximum error
9.91kW 340g/h 3.1r/min - 334.8g/h -1.53%
19.1kW 522g/h 4.8r/min - 518.4g/h -0.69%
28
Figure 10: Voltage measurement from a Sensirion SLQ-HC60 flow meter connected to the
peristaltic pump.
Table 9: Water system design appraisal.
Water Injection Subsystem Appraisal
Advantages Disadvantages
Accurate control over water injection
Good mixing of water and intake air
Relatively long test cycle removing
effects of pulses in water injection
Reuse of waste heat energy from
exhaust
Unknown water/steam injection
temperature
Possible small reduction of air
density due to displacement from
water mist and increased air
temperature
Water vapour mixing with engine
oil
Risk rusting of piston rings if
engine not purged of water after
test
29
5.2.4 Diesel Metering System
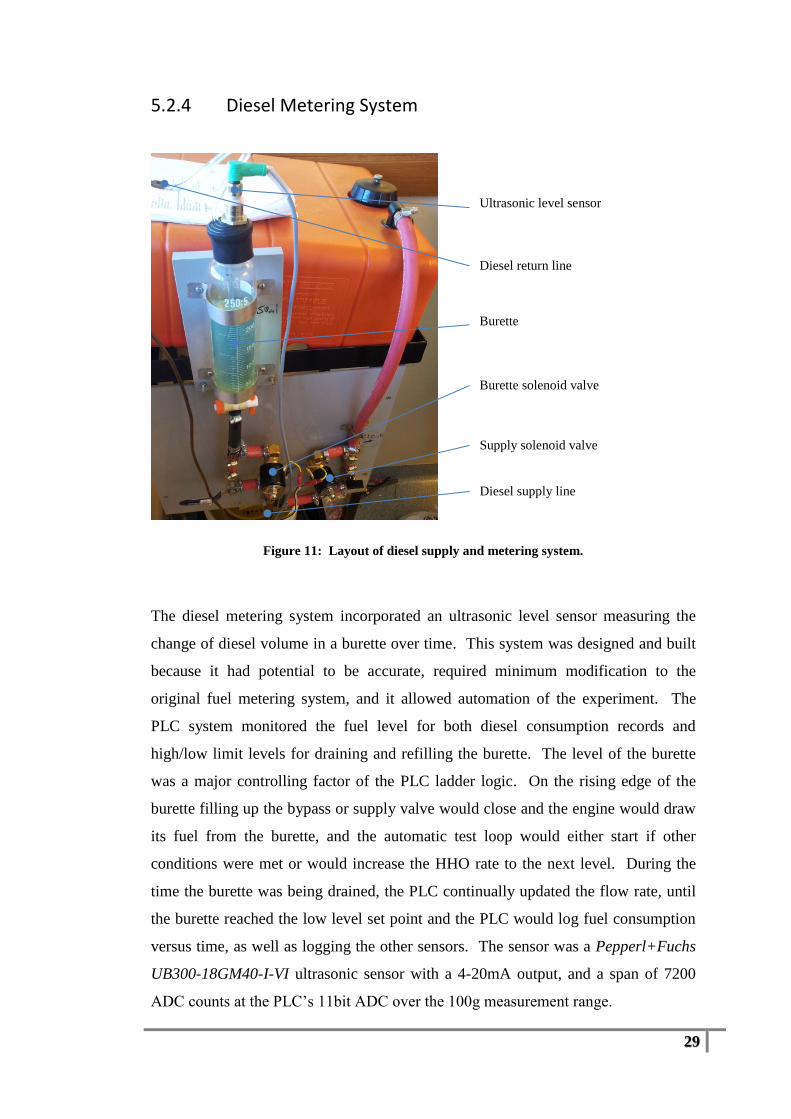
Figure 11: Layout of diesel supply and metering system.
The diesel metering system incorporated an ultrasonic level sensor measuring the
change of diesel volume in a burette over time. This system was designed and built
because it had potential to be accurate, required minimum modification to the
original fuel metering system, and it allowed automation of the experiment. The
PLC system monitored the fuel level for both diesel consumption records and
high/low limit levels for draining and refilling the burette. The level of the burette
was a major controlling factor of the PLC ladder logic. On the rising edge of the
burette filling up the bypass or supply valve would close and the engine would draw
its fuel from the burette, and the automatic test loop would either start if other
conditions were met or would increase the HHO rate to the next level. During the
time the burette was being drained, the PLC continually updated the flow rate, until
the burette reached the low level set point and the PLC would log fuel consumption
versus time, as well as logging the other sensors. The sensor was a Pepperl+Fuchs
UB300-18GM40-I-VI ultrasonic sensor with a 4-20mA output, and a span of 7200
ADC counts at the PLC’s 11bit ADC over the 100g measurement range.
Burette
Diesel return line
Ultrasonic level sensor
Supply solenoid valve
Burette solenoid valve
Diesel supply line

30
Calibration the diesel system included; measuring the density of the diesel, checking
the linearity of the ultrasonic metering system, and calculating the analog-to-mass
conversion constant for the output from the ultrasonic sensor. The mass of the diesel
was calculated by measuring 100g of water in a measuring cylinder with jewellers
scales (resolution of 10mg) marking the level, then measuring the mass of the diesel
filled up to the same level. The mass of the diesel was measured at 835kg/m3. The
calibration of the peristaltic pump was performed by pumping diesel at 1r/min, the
mass flow rate at this speed was the same relative mass flow rate/rpm as other r/min.
The mass flow rate was calculated at 1.5g per revolution per r/min. Next the
peristaltic pump was used to move the burette level from low too high in 15g
increments and check the difference in the analog readings. It was found there was
up to 0.92% non-linearity error over the measurement range, but this is most likely
due to the human error in pressing the stop watch stop button at the start and end of
the 60 second measurement period.
Table 10: Diesel system linearity test results.
Added diesel
mass (g)
Start ADC End ADC delta ADC
( )
15 4032 5272 1240 82.67
15 5272 6510 1238 82.53
15 6510 7753 1243 82.87
15 7753 9008 1255 83.67
15 9008 10255 1247 83.13
15 10255 11487 1232 82.13
15 11487 12737 1250 83.33
The resolution of the ultrasonic was adequate for the task, with 100g of diesel equal
to a 7200 ADC span. The sensor noise was monitored while the engine was
shutdown. It was observed the signal only fluctuated ±1 ADC units over the
measurement range – accounting for 0.013% error. Inaccuracy in fuel measurement
was more effected by the burette draining past the low point. After further
observation it was found the overshoot could be offset in the. Below are the

31
calculation performed by the PLC to measure mass flow rate, accounting for refill
overshoot.
(5.1)
− −
−
(5.2)
(5.3)
Where is PLC counter time [ms]
is diesel drain time [h]
is the measured ADC value when the burette is full
is the real-time measured ADC value of the ultrasonic sensor
is the overshoot ADC magnitude when the burette is refilled
is the mass of diesel consumed [g]
is the constant relating change in ADC value to change in mass
is the mass flow rate of diesel [g/h]
32
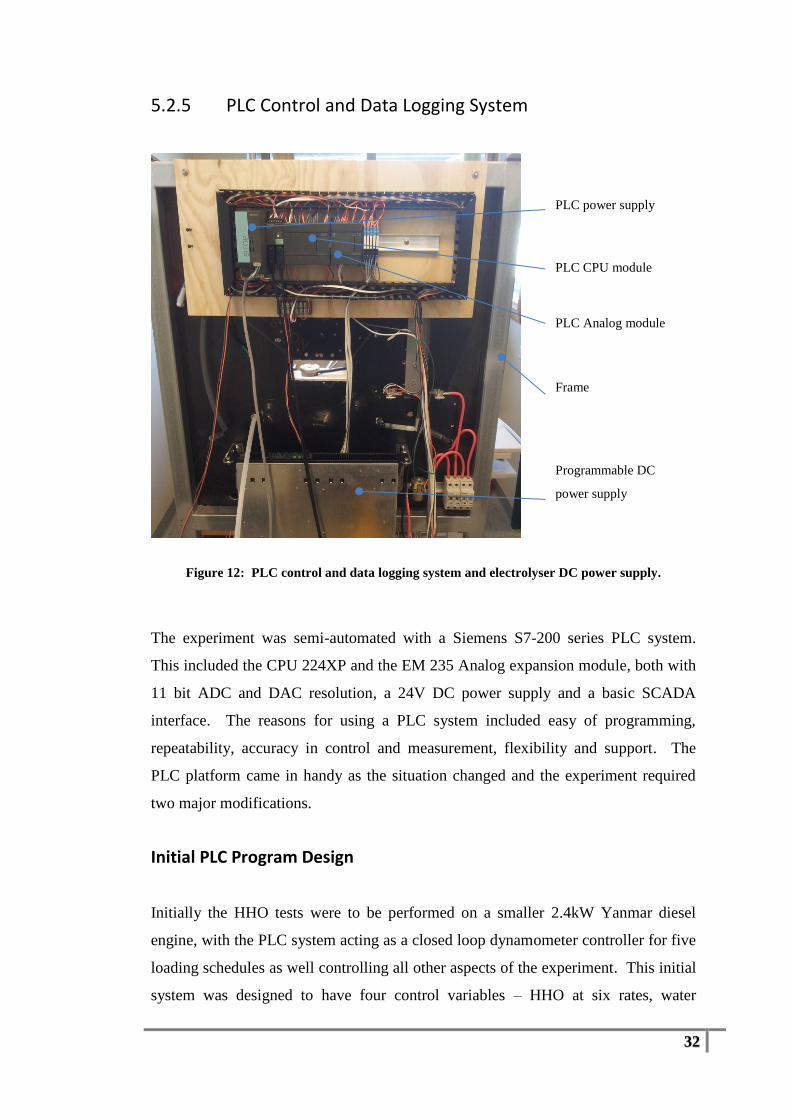
5.2.5 PLC Control and Data Logging System
Figure 12: PLC control and data logging system and electrolyser DC power supply.
The experiment was semi-automated with a Siemens S7-200 series PLC system.
This included the CPU 224XP and the EM 235 Analog expansion module, both with
11 bit ADC and DAC resolution, a 24V DC power supply and a basic SCADA
interface. The reasons for using a PLC system included easy of programming,
repeatability, accuracy in control and measurement, flexibility and support. The
PLC platform came in handy as the situation changed and the experiment required
two major modifications.
Initial PLC Program Design
Initially the HHO tests were to be performed on a smaller 2.4kW Yanmar diesel
engine, with the PLC system acting as a closed loop dynamometer controller for five
loading schedules as well controlling all other aspects of the experiment. This initial
system was designed to have four control variables – HHO at six rates, water
PLC Analog module
PLC CPU module
PLC power supply
Frame
Programmable DC
power supply
33
injection at six rates, water electrolyser efficiency at three rates and engine
dynamometer load at five levels. This is a total of 540 system states. The goal was
to find the greatest fuel reduction from measured data and then optimize BSFC with
three dimensional interpolation.
Second PLC Program Design
When the 2.4kW engine became unavailable for any future testing, a new simpler
experiment was devised with a larger 39kW Cummins engine that was set up as a
generator with three input variables – HHO addition at 60 increments, water
injection at six increments, and three engine loads for a total 0f 1080 system states.
Most of the calibrations for the first system could not be used for the final test bed as
the diesel, HHO, engine loading and data logging subsystem’s had to be rebuilt and
new calibrations carried out. Having a PLC system reduced programming overhead
in designing the new experiment, as the program was modularized so certain ladder
logic modules could be kept from the initial experiment and modified for the new
experiment.
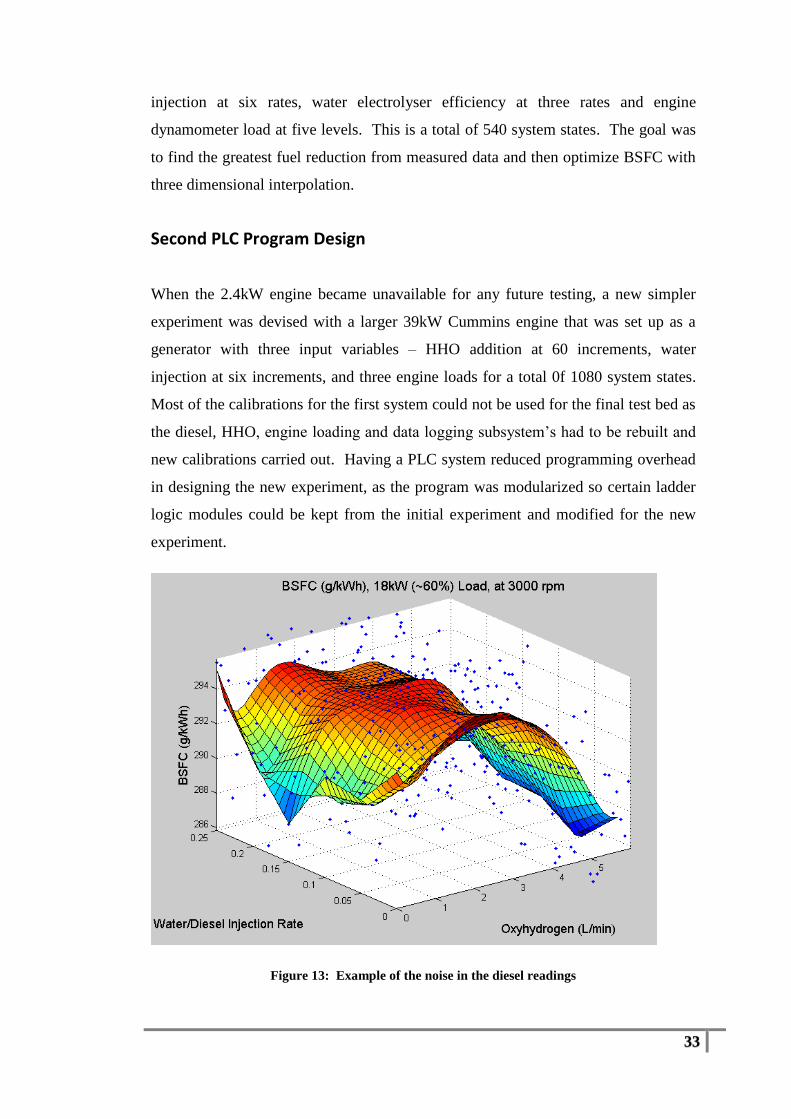
Figure 13: Example of the noise in the diesel readings
34
Problems with second PLC program design
The MATLAB script for processing the logged data was developed simultaneously
with the ladder logic, so the results could be interpreted immediately at the location
of the experiment (Appendix H). After running the second experiment design at the
1080 system states, processing of the data revealed several improvements to the test
were required. High noise margin, time shift in data from filtering noise, insufficient
time to reach steady state in exhaust temperature, generator instability under full load
(~28kW generator electrical load) and no apparent fuel savings all necessitated a
change in test procedure. The BSFC data had a high margin of noise that required
not only filtering in the data sampling phase, but further filtering in the MATLAB
script. This introduced a large time shift into the results so the independent variables
could not be aligned accurately with the dependant variables of BSFC and engine
temperature.
Final PLC Program Structure
The final experiment involved the operator setting engine load and water injection
rate manually, then allowing the PLC to step through the HHO injection rates. For
each HHO injection rate the engine ran for the time it took to drain 100g of diesel,
then the injection volume would increase and another 100g of diesel would be
consumed and so forth. After all four volume flow rates of HHO were trialled and
engine states logged, the test would conclude and a new load and/or water injection
rate would be selected for testing. The new test cycle could only commence after the
exhaust gas temperature stabilized to a rate of temperature rise below 3°C/min.
The final method used to test the effects of HHO on diesel consumption and exhaust
emission removed the key problems of the initial tests. The initial tests were useful
for revealing large changes in fuel consumption and acted as a guide for the final
test. The final test method tested the effects of HHO and water injection over the
full range but at larger increments and at a much higher measurement resolution.
The engine was much more stable in operating temperature and a second stage of
filtering was not required. If the diesel measurements were more accurate on a
35
shorter time base, then the initial PLC program structure would be ideal, as a larger
range of HHO volumes and water injection rates could be trialled.
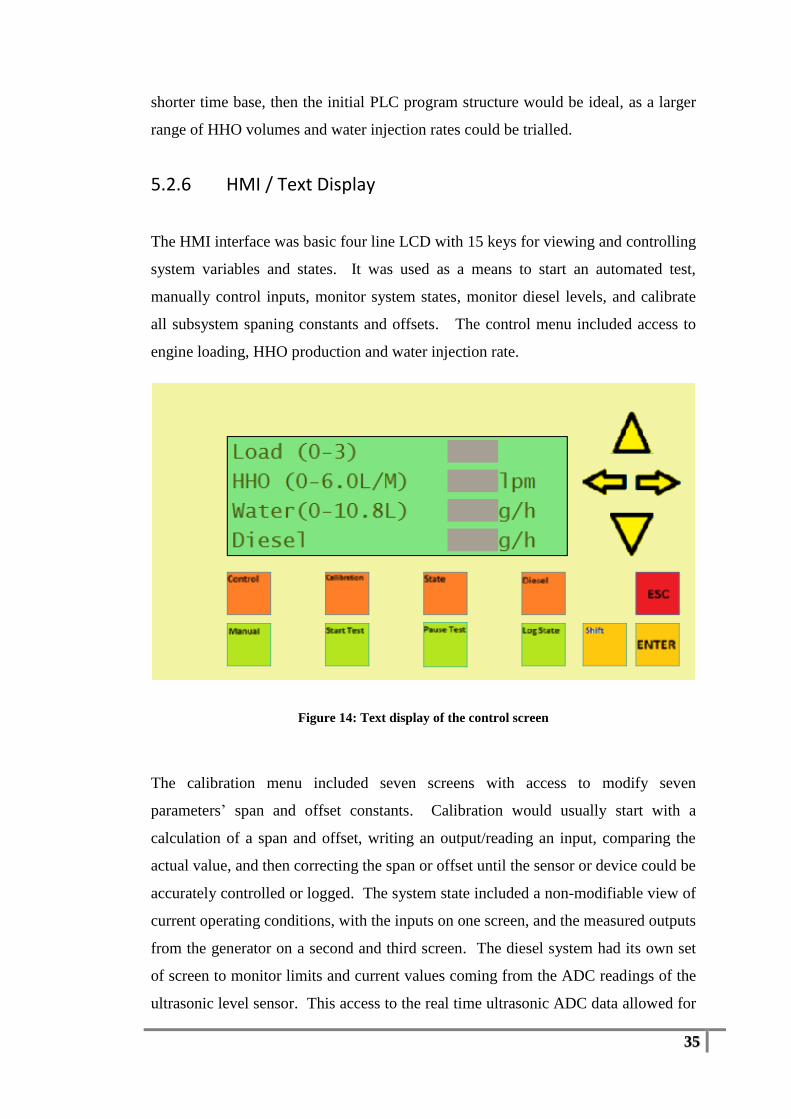
5.2.6 HMI / Text Display
The HMI interface was basic four line LCD with 15 keys for viewing and controlling
system variables and states. It was used as a means to start an automated test,
manually control inputs, monitor system states, monitor diesel levels, and calibrate
all subsystem spaning constants and offsets. The control menu included access to
engine loading, HHO production and water injection rate.
Figure 14: Text display of the control screen
The calibration menu included seven screens with access to modify seven
parameters’ span and offset constants. Calibration would usually start with a
calculation of a span and offset, writing an output/reading an input, comparing the
actual value, and then correcting the span or offset until the sensor or device could be
accurately controlled or logged. The system state included a non-modifiable view of
current operating conditions, with the inputs on one screen, and the measured outputs
from the generator on a second and third screen. The diesel system had its own set
of screen to monitor limits and current values coming from the ADC readings of the
ultrasonic level sensor. This access to the real time ultrasonic ADC data allowed for
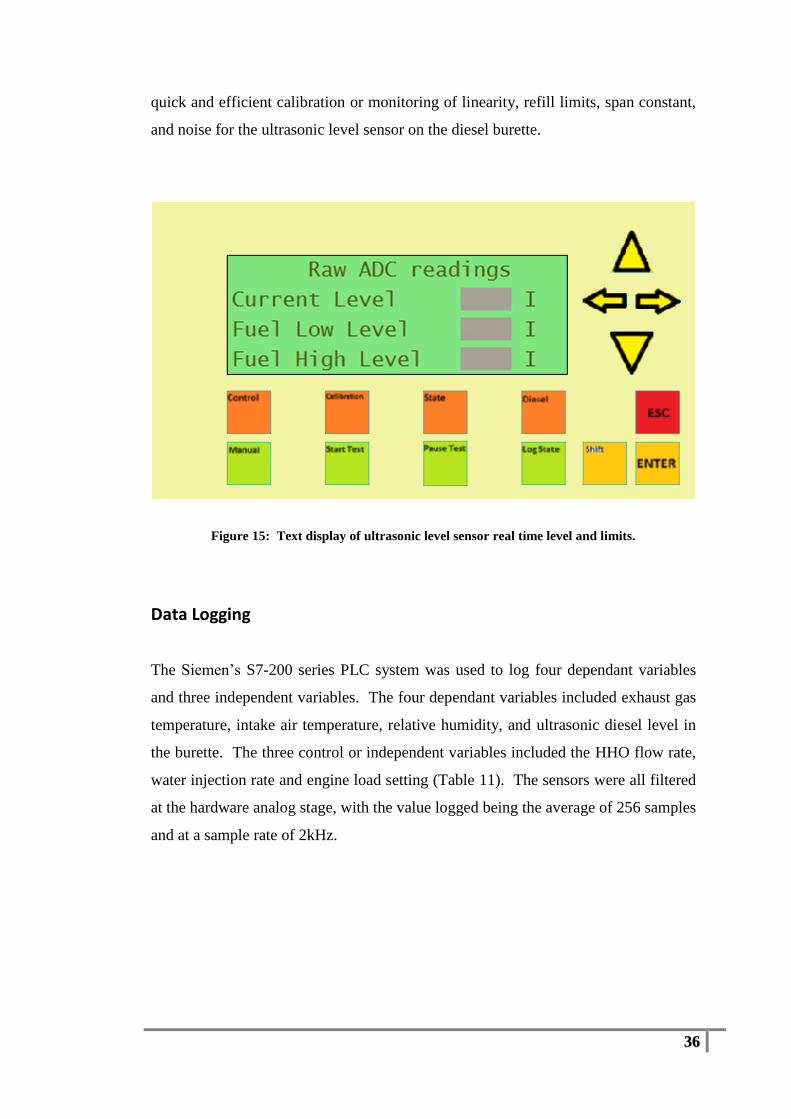
36
quick and efficient calibration or monitoring of linearity, refill limits, span constant,
and noise for the ultrasonic level sensor on the diesel burette.
Figure 15: Text display of ultrasonic level sensor real time level and limits.
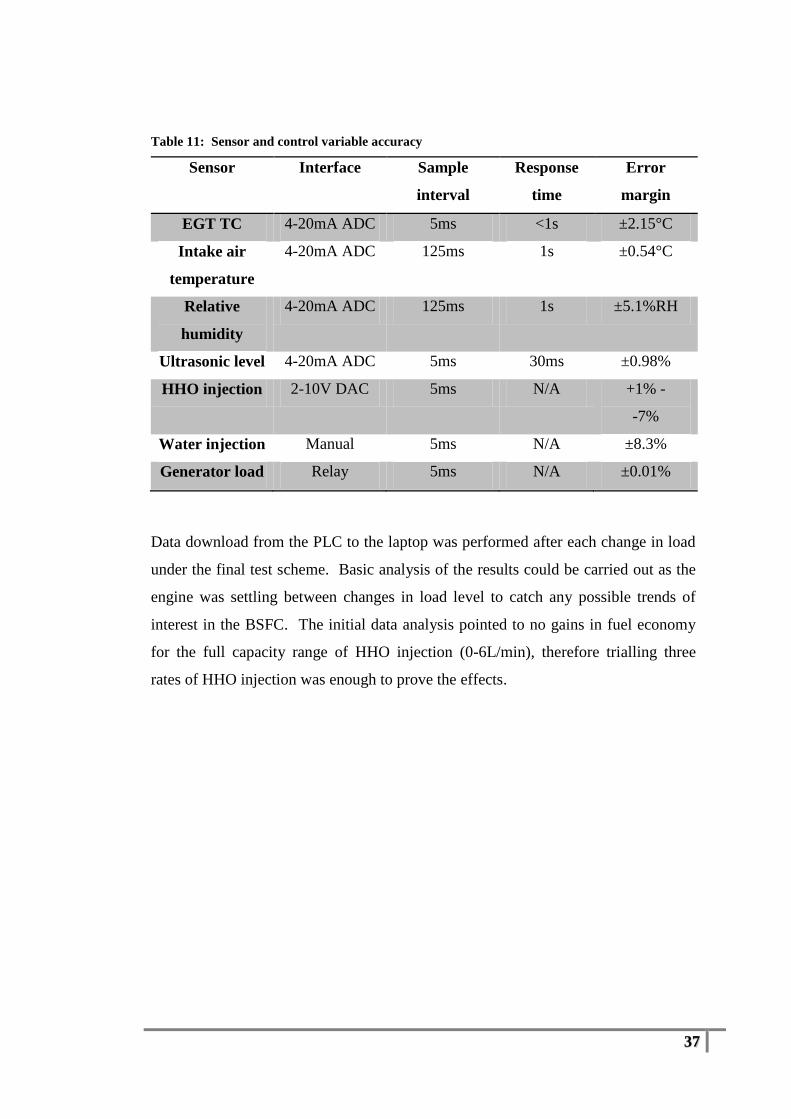
Data Logging
The Siemen’s S7-200 series PLC system was used to log four dependant variables
and three independent variables. The four dependant variables included exhaust gas
temperature, intake air temperature, relative humidity, and ultrasonic diesel level in
the burette. The three control or independent variables included the HHO flow rate,
water injection rate and engine load setting (Table 11). The sensors were all filtered
at the hardware analog stage, with the value logged being the average of 256 samples
and at a sample rate of 2kHz.
37
Table 11: Sensor and control variable accuracy
Sensor Interface Sample
interval
Response
time
Error
margin
EGT TC 4-20mA ADC 5ms <1s ±2.15°C
Intake air
temperature
4-20mA ADC 125ms 1s ±0.54°C
Relative
humidity
4-20mA ADC 125ms 1s ±5.1%RH
Ultrasonic level 4-20mA ADC 5ms 30ms ±0.98%
HHO injection 2-10V DAC 5ms N/A +1% -
-7%
Water injection Manual 5ms N/A ±8.3%
Generator load Relay 5ms N/A ±0.01%
Data download from the PLC to the laptop was performed after each change in load
under the final test scheme. Basic analysis of the results could be carried out as the
engine was settling between changes in load level to catch any possible trends of
interest in the BSFC. The initial data analysis pointed to no gains in fuel economy
for the full capacity range of HHO injection (0-6L/min), therefore trialling three
rates of HHO injection was enough to prove the effects.
38
Chapter 6 Conversion Efficiency
6.1 Chemistry
HHO is the stoichiometric mixture of hydrogen and oxygen generated from water
electrolysis. Water electrolysis occurs when DC electron current flows from a
negative electrode (cathode) to the positive conductor (anode) via an electrolytic
solution. Aqueous hydrogen cations H+ are attracted to the cathode where they
accept electrons and form covalent bonds resulting in H2 gas generation. The
hydroxide anions balance the flow of current in the electrolyte solution and are
attracted to positive (anode) conductor, where they release electrons to the anode to
form water and covalently bonded oxygen gas or O2. In this way current is balanced
at anode and cathode[13].
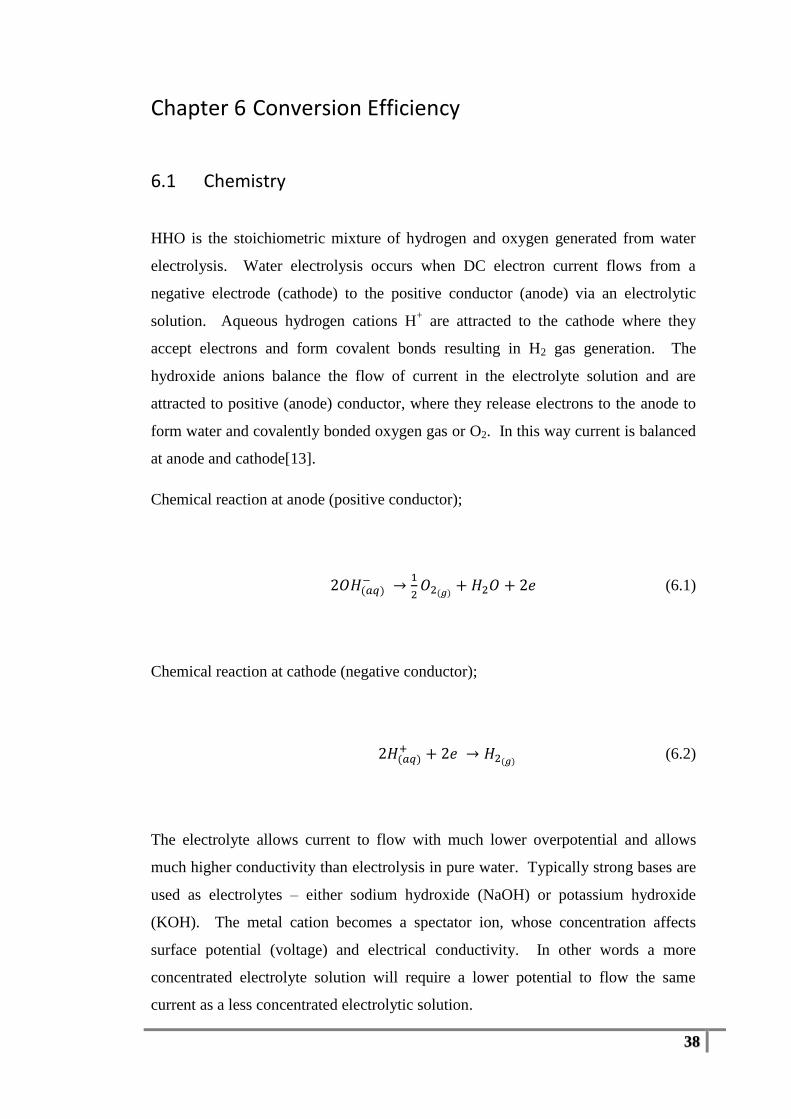
Chemical reaction at anode (positive conductor);
2 ( )−
( ) 2 (6.1)
Chemical reaction at cathode (negative conductor);
2 ( ) 2 ( ) (6.2)
The electrolyte allows current to flow with much lower overpotential and allows
much higher conductivity than electrolysis in pure water. Typically strong bases are
used as electrolytes – either sodium hydroxide (NaOH) or potassium hydroxide
(KOH). The metal cation becomes a spectator ion, whose concentration affects
surface potential (voltage) and electrical conductivity. In other words a more
concentrated electrolyte solution will require a lower potential to flow the same
current as a less concentrated electrolytic solution.
39
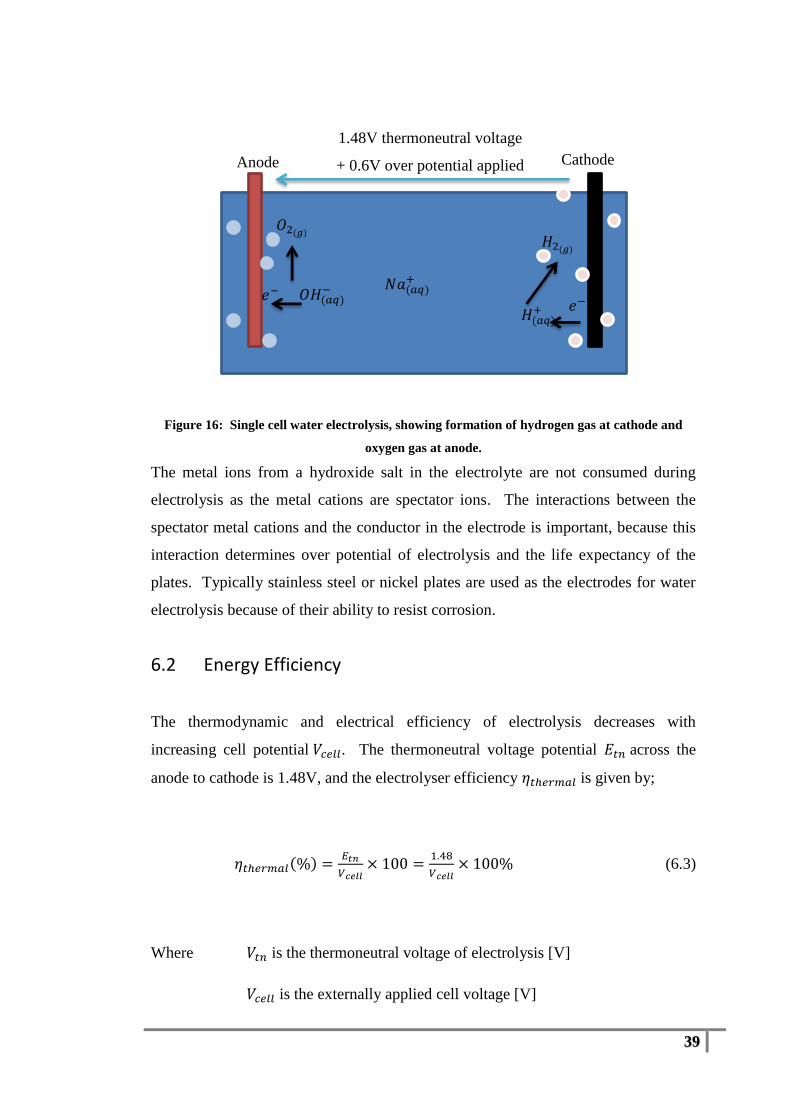
Figure 16: Single cell water electrolysis, showing formation of hydrogen gas at cathode and
oxygen gas at anode.
The metal ions from a hydroxide salt in the electrolyte are not consumed during
electrolysis as the metal cations are spectator ions. The interactions between the
spectator metal cations and the conductor in the electrode is important, because this
interaction determines over potential of electrolysis and the life expectancy of the
plates. Typically stainless steel or nickel plates are used as the electrodes for water
electrolysis because of their ability to resist corrosion.
6.2 Energy Efficiency
The thermodynamic and electrical efficiency of electrolysis decreases with
increasing cell potential . The thermoneutral voltage potential across the
anode to cathode is 1.48V, and the electrolyser efficiency is given by;
( )
(6.3)
Where is the thermoneutral voltage of electrolysis [V]
is the externally applied cell voltage [V]
𝑂𝐻(𝑎𝑞)−
𝑂 (𝑔)
𝑒− 𝑁𝑎(𝑎𝑞)
𝑒−
𝐻 (𝑔)
𝐻(𝑎𝑞)
Anode Cathode
1.48V thermoneutral voltage
+ 0.6V over potential applied
40
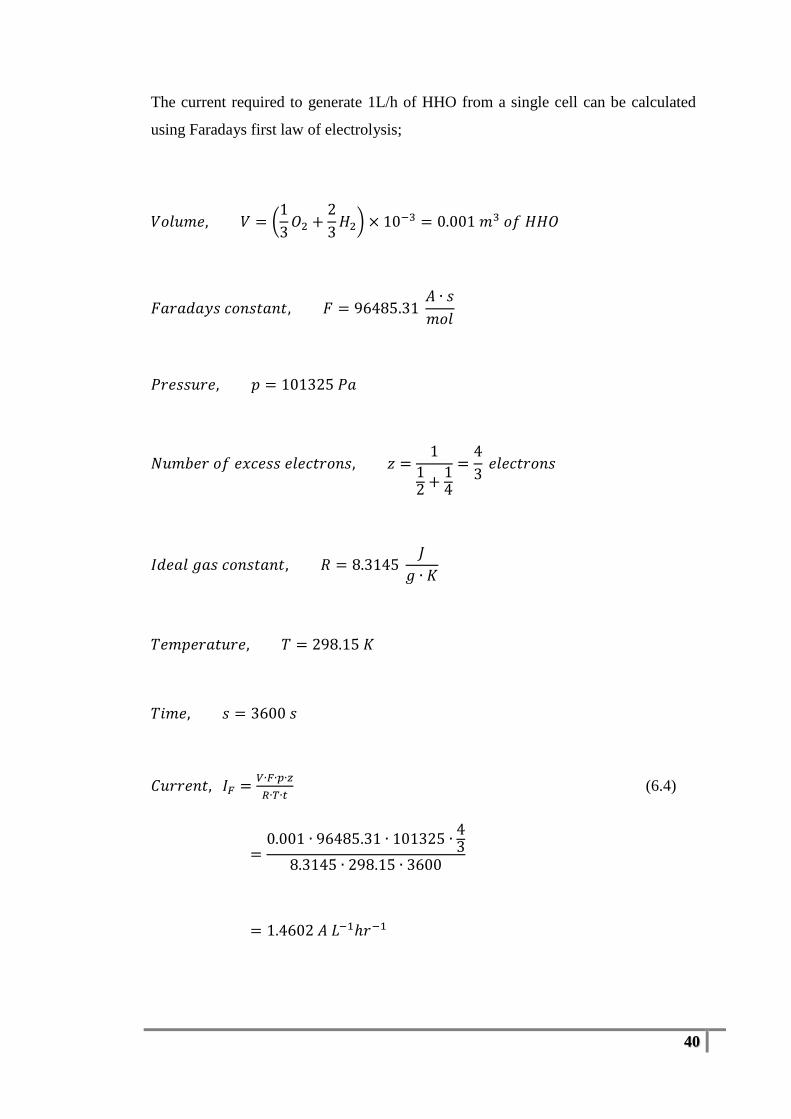
The current required to generate 1L/h of HHO from a single cell can be calculated
using Faradays first law of electrolysis;
(
2
)
−
2
2
2
(6.4)
2
2
2 − −

41
A 100% current efficient cell will require 1.46A of current per hour to produce 1L of
HHO. The product of the thermoneutral voltage and current required to produce 1L
of HHO will give the energy required to produce 1L of HHO at 100% efficiency[14].
2 (6.5)
2 ⁄ ⁄
Comparing this energy value with the energy in the equivalent volume of hydrogen
(2/3 litre) at the lower heating value ( ) of 120MJ/kg;
(6.6)
2
2
− 2 2
2
This means is takes 2.163Wh/L at standard temperature and pressure (STP) to
produce HHO at 100% efficiency. Knowing the power efficiency is more useful
than voltage efficiency because system efficiencies can be calculated almost directly.
The energy required to crack hydrogen from water is the same as the LHV energy of
the equivalent volume of tank hydrogen.
6.3 Typical Energy Losses
A voltage overpotential of typically 0.6V above the 1.48V thermoneutral voltage is
required for any significant current to flow at STP[13]. This is due to a low reaction
rate, the activation energy barrier, electrical resistance of the electrolyte and
electrodes, and bubble formation[13].
Cell potentials in on-board water electrolysers are a compromise between voltage of
the alternator charging system and the cell potential required to generate sufficient
current flow. So in the case of a 13.8V charging system, six series cells are used to
42
divide the potential down to ( )
2 per electrolyser cell. In terms of
voltage efficiency, these electrolysers are less than
efficient, if the cell is operating a 100% current efficiency. The net electrical
conversion efficiency of the electrolysis system used ranged from 50.6% to
55% (Table 2), this includes losses from the switch mode DC supply, but not the
generator.
The conversion efficiency of diesel into 3 phase electrical power by the diesel engine
and generator was calculated from the corrected baseline fuel consumption
measurements. At 30% and 55% engine load the BSFC was 352g/kWh and
272g/kWh respectively. If diesel has an energy content of ⁄ [15] then
the efficiency of the generator set would be;
(6.7)
( )
22
( )
2 2 2
The net efficiency of the generator and electrolyser systems to convert diesel into
HHO can be calculated by taking the product of the generator and electrolyser
system efficiencies.
Table 12: Net efficiency of HHO production for different engine loads and HHO flow rates.
HHO
30% engine load 55% engine load
2L/min 50.6% 11.4% 14.7%
4L/min 55.0% 12.5% 16.0%
6L/min 54.6% 12.6% 15.8%
43
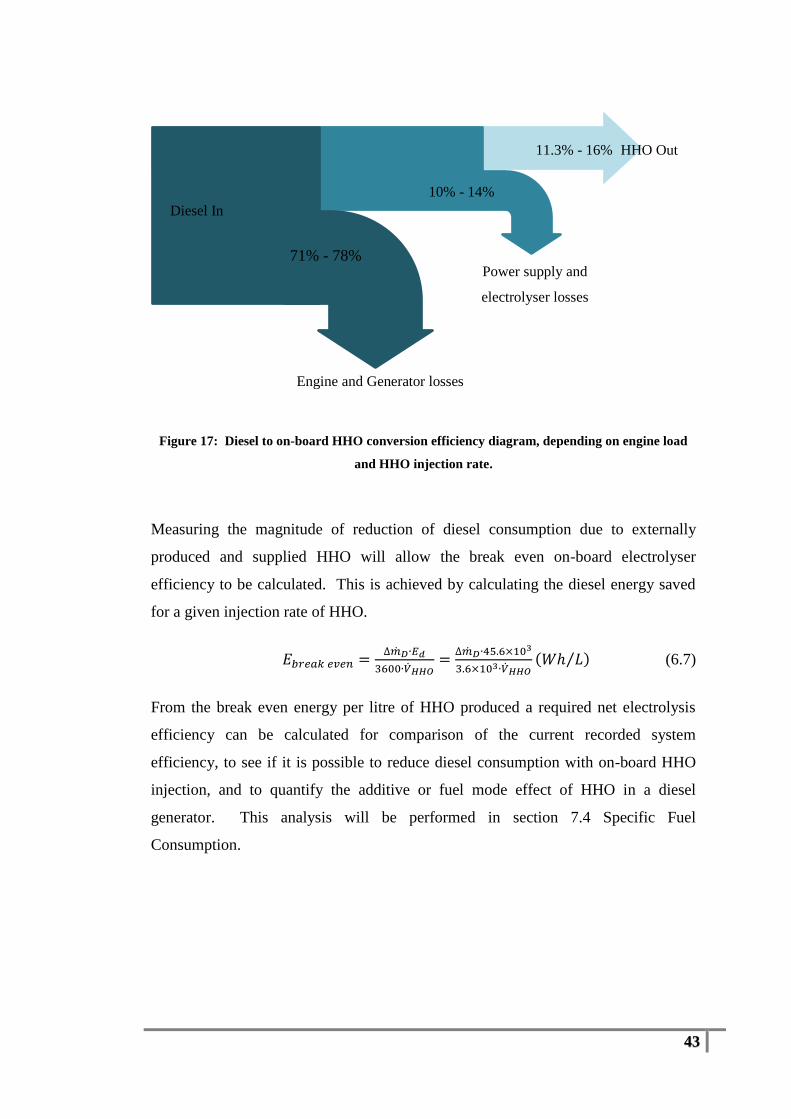
Figure 17: Diesel to on-board HHO conversion efficiency diagram, depending on engine load
and HHO injection rate.
Measuring the magnitude of reduction of diesel consumption due to externally
produced and supplied HHO will allow the break even on-board electrolyser
efficiency to be calculated. This is achieved by calculating the diesel energy saved
for a given injection rate of HHO.
( ⁄ ) (6.7)
From the break even energy per litre of HHO produced a required net electrolysis
efficiency can be calculated for comparison of the current recorded system
efficiency, to see if it is possible to reduce diesel consumption with on-board HHO
injection, and to quantify the additive or fuel mode effect of HHO in a diesel
generator. This analysis will be performed in section 7.4 Specific Fuel
Consumption.
Engine and Generator losses
71% - 78% Power supply and
electrolyser losses
10% - 14%
11.3% - 16% HHO Out
Diesel In
44
Chapter 7 Results
7.1 Data processing
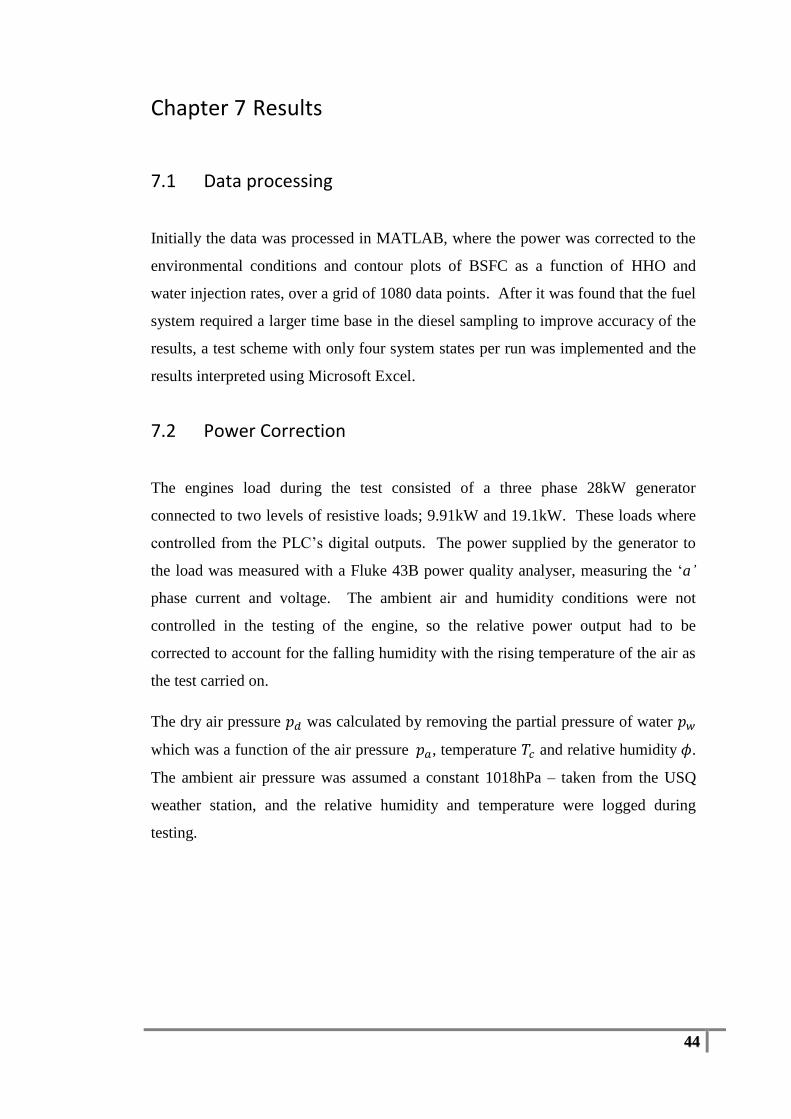
Initially the data was processed in MATLAB, where the power was corrected to the
environmental conditions and contour plots of BSFC as a function of HHO and
water injection rates, over a grid of 1080 data points. After it was found that the fuel
system required a larger time base in the diesel sampling to improve accuracy of the
results, a test scheme with only four system states per run was implemented and the
results interpreted using Microsoft Excel.
7.2 Power Correction
The engines load during the test consisted of a three phase 28kW generator
connected to two levels of resistive loads; 9.91kW and 19.1kW. These loads where
controlled from the PLC’s digital outputs. The power supplied by the generator to
the load was measured with a Fluke 43B power quality analyser, measuring the ‘a’
phase current and voltage. The ambient air and humidity conditions were not
controlled in the testing of the engine, so the relative power output had to be
corrected to account for the falling humidity with the rising temperature of the air as
the test carried on.
The dry air pressure was calculated by removing the partial pressure of water
which was a function of the air pressure , temperature and relative humidity .
The ambient air pressure was assumed a constant 1018hPa – taken from the USQ
weather station, and the relative humidity and temperature were logged during
testing.
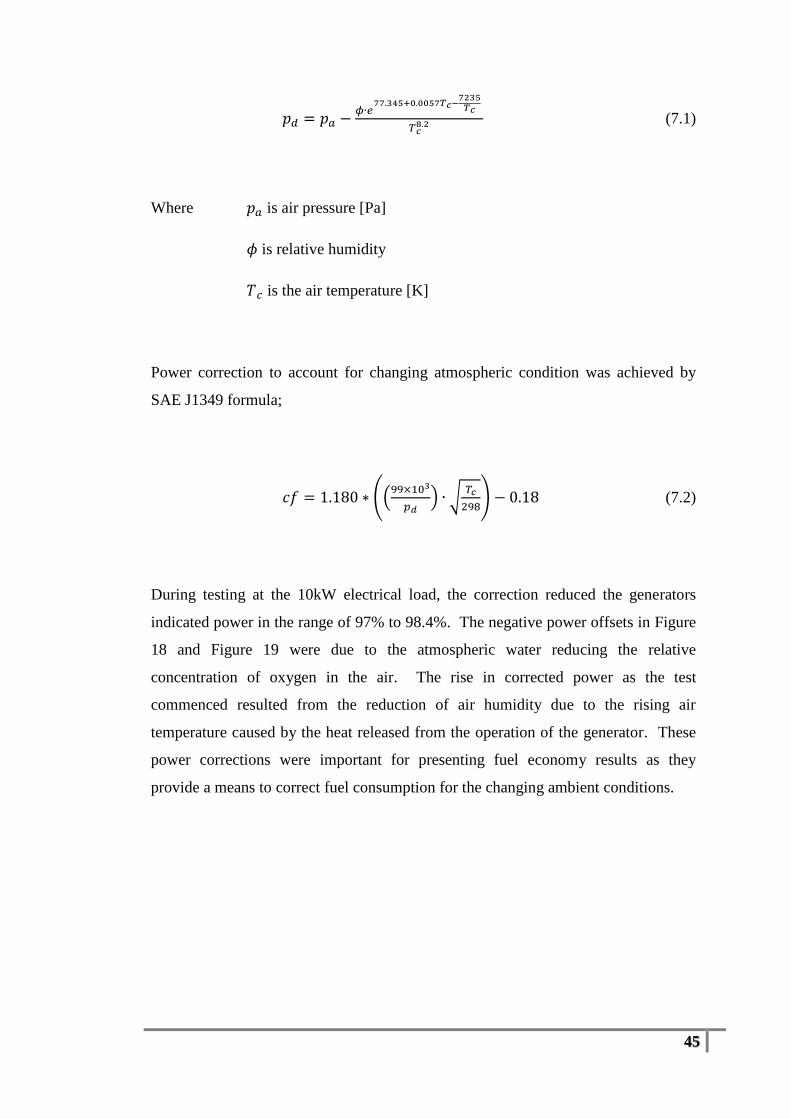
45
(7.1)
Where is air pressure [Pa]
is relative humidity
is the air temperature [K]
Power correction to account for changing atmospheric condition was achieved by
SAE J1349 formula;
((
) √
) (7.2)
During testing at the 10kW electrical load, the correction reduced the generators
indicated power in the range of 97% to 98.4%. The negative power offsets in Figure
18 and Figure 19 were due to the atmospheric water reducing the relative
concentration of oxygen in the air. The rise in corrected power as the test
commenced resulted from the reduction of air humidity due to the rising air
temperature caused by the heat released from the operation of the generator. These
power corrections were important for presenting fuel economy results as they
provide a means to correct fuel consumption for the changing ambient conditions.
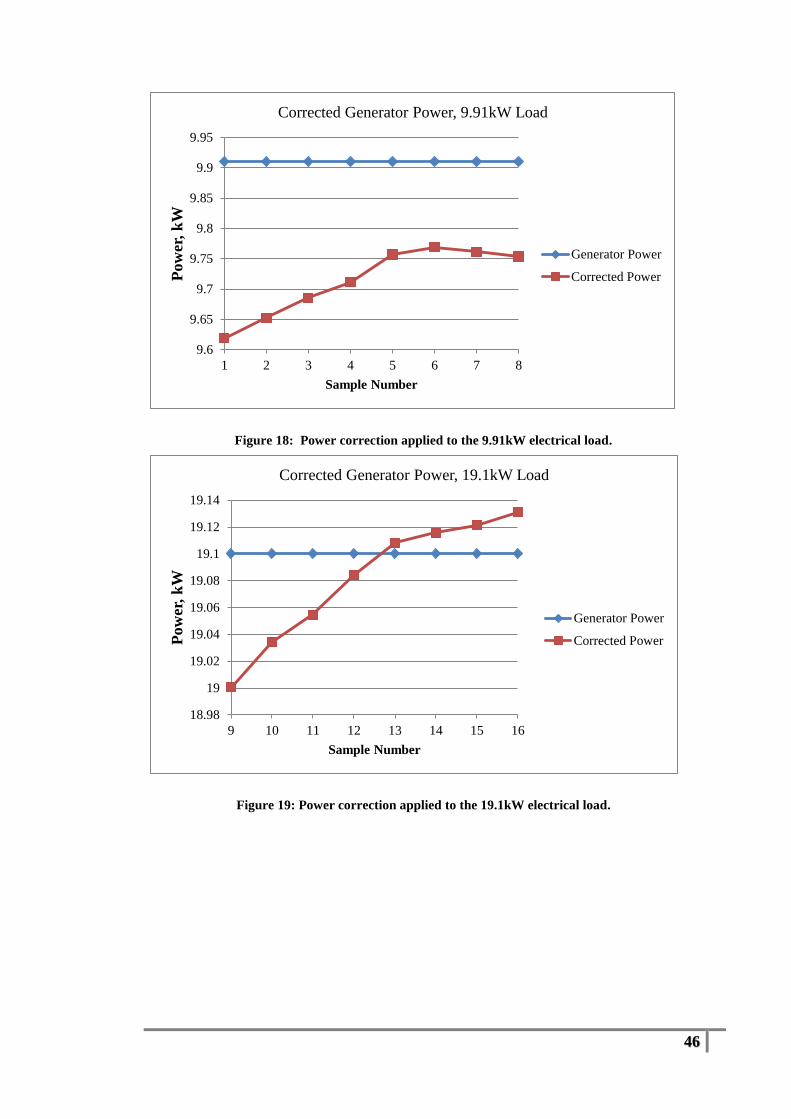
46
Figure 18: Power correction applied to the 9.91kW electrical load.
Figure 19: Power correction applied to the 19.1kW electrical load.
9.6
9.65
9.7
9.75
9.8
9.85
9.9
9.95
1 2 3 4 5 6 7 8
Pow
er,
kW
Sample Number
Corrected Generator Power, 9.91kW Load
Generator Power
Corrected Power
18.98
19
19.02
19.04
19.06
19.08
19.1
19.12
19.14
9 10 11 12 13 14 15 16
Pow
er,
kW
Sample Number
Corrected Generator Power, 19.1kW Load
Generator Power
Corrected Power
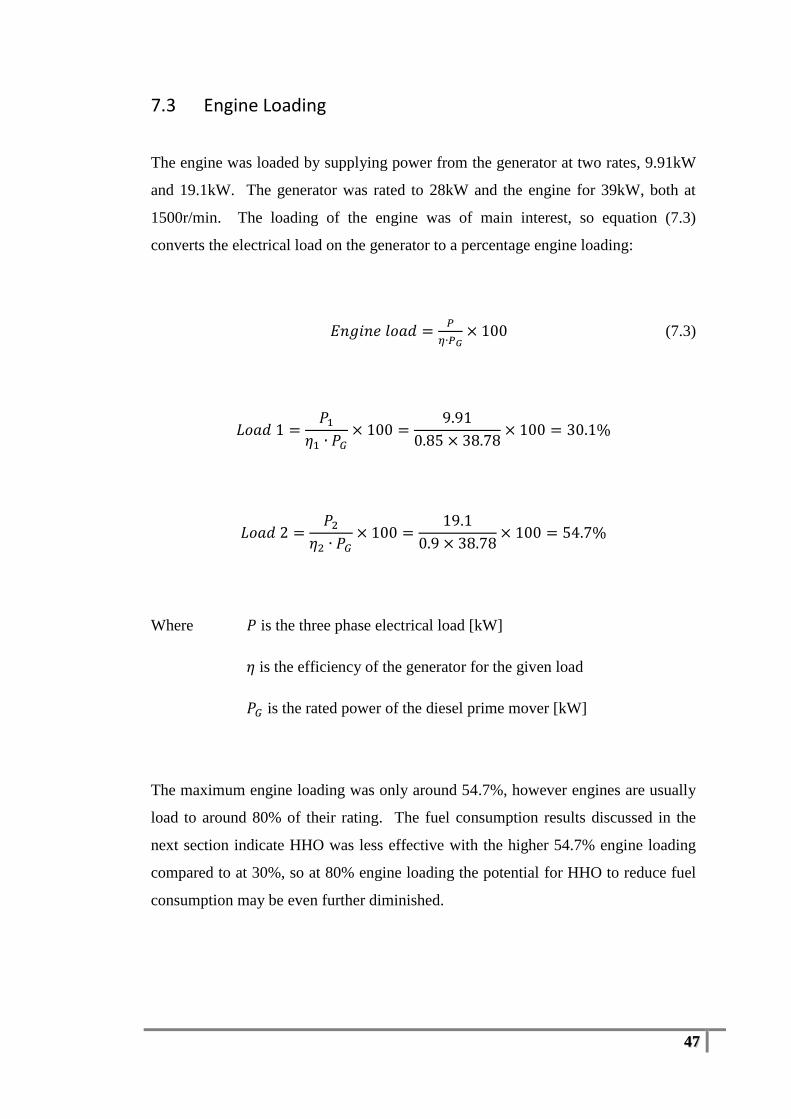
47
7.3 Engine Loading
The engine was loaded by supplying power from the generator at two rates, 9.91kW
and 19.1kW. The generator was rated to 28kW and the engine for 39kW, both at
1500r/min. The loading of the engine was of main interest, so equation (7.3)
converts the electrical load on the generator to a percentage engine loading:
(7.3)
2
Where is the three phase electrical load [kW]
is the efficiency of the generator for the given load
is the rated power of the diesel prime mover [kW]
The maximum engine loading was only around 54.7%, however engines are usually
load to around 80% of their rating. The fuel consumption results discussed in the
next section indicate HHO was less effective with the higher 54.7% engine loading
compared to at 30%, so at 80% engine loading the potential for HHO to reduce fuel
consumption may be even further diminished.
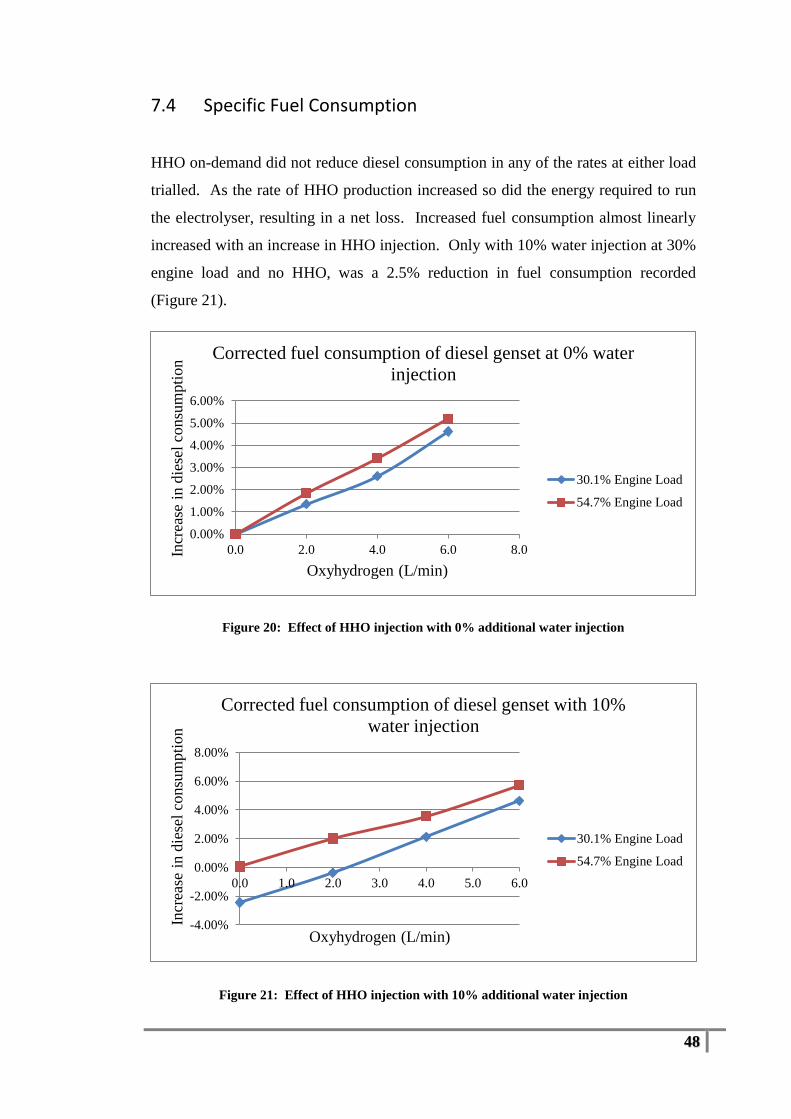
48
7.4 Specific Fuel Consumption
HHO on-demand did not reduce diesel consumption in any of the rates at either load
trialled. As the rate of HHO production increased so did the energy required to run
the electrolyser, resulting in a net loss. Increased fuel consumption almost linearly
increased with an increase in HHO injection. Only with 10% water injection at 30%
engine load and no HHO, was a 2.5% reduction in fuel consumption recorded
(Figure 21).
Figure 20: Effect of HHO injection with 0% additional water injection
Figure 21: Effect of HHO injection with 10% additional water injection
0.00%
1.00%
2.00%
3.00%
4.00%
5.00%
6.00%
0.0 2.0 4.0 6.0 8.0Incr
ease
in d
iese
l co
nsu
mpti
on
Oxyhydrogen (L/min)
Corrected fuel consumption of diesel genset at 0% water
injection
30.1% Engine Load
54.7% Engine Load
-4.00%
-2.00%
0.00%
2.00%
4.00%
6.00%
8.00%
0.0 1.0 2.0 3.0 4.0 5.0 6.0
Incr
ease
in d
iese
l co
nsu
mpti
on
Oxyhydrogen (L/min)
Corrected fuel consumption of diesel genset with 10%
water injection
30.1% Engine Load
54.7% Engine Load
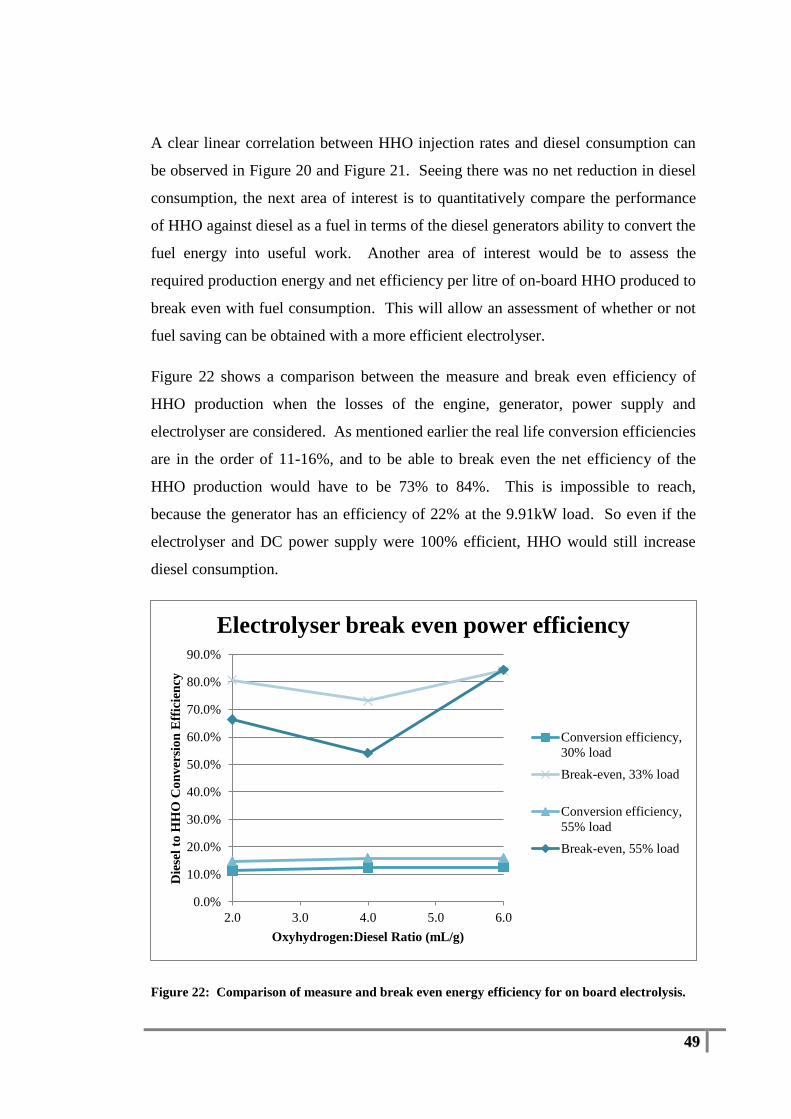
49
A clear linear correlation between HHO injection rates and diesel consumption can
be observed in Figure 20 and Figure 21. Seeing there was no net reduction in diesel
consumption, the next area of interest is to quantitatively compare the performance
of HHO against diesel as a fuel in terms of the diesel generators ability to convert the
fuel energy into useful work. Another area of interest would be to assess the
required production energy and net efficiency per litre of on-board HHO produced to
break even with fuel consumption. This will allow an assessment of whether or not
fuel saving can be obtained with a more efficient electrolyser.
Figure 22 shows a comparison between the measure and break even efficiency of
HHO production when the losses of the engine, generator, power supply and
electrolyser are considered. As mentioned earlier the real life conversion efficiencies
are in the order of 11-16%, and to be able to break even the net efficiency of the
HHO production would have to be 73% to 84%. This is impossible to reach,
because the generator has an efficiency of 22% at the 9.91kW load. So even if the
electrolyser and DC power supply were 100% efficient, HHO would still increase
diesel consumption.
Figure 22: Comparison of measure and break even energy efficiency for on board electrolysis.
0.0%
10.0%
20.0%
30.0%
40.0%
50.0%
60.0%
70.0%
80.0%
90.0%
2.0 3.0 4.0 5.0 6.0
Die
sel
to H
HO
Co
nv
ersi
on
Eff
icie
ncy
Oxyhydrogen:Diesel Ratio (mL/g)
Electrolyser break even power efficiency
Conversion efficiency,
30% load
Break-even, 33% load
Conversion efficiency,
55% load
Break-even, 55% load
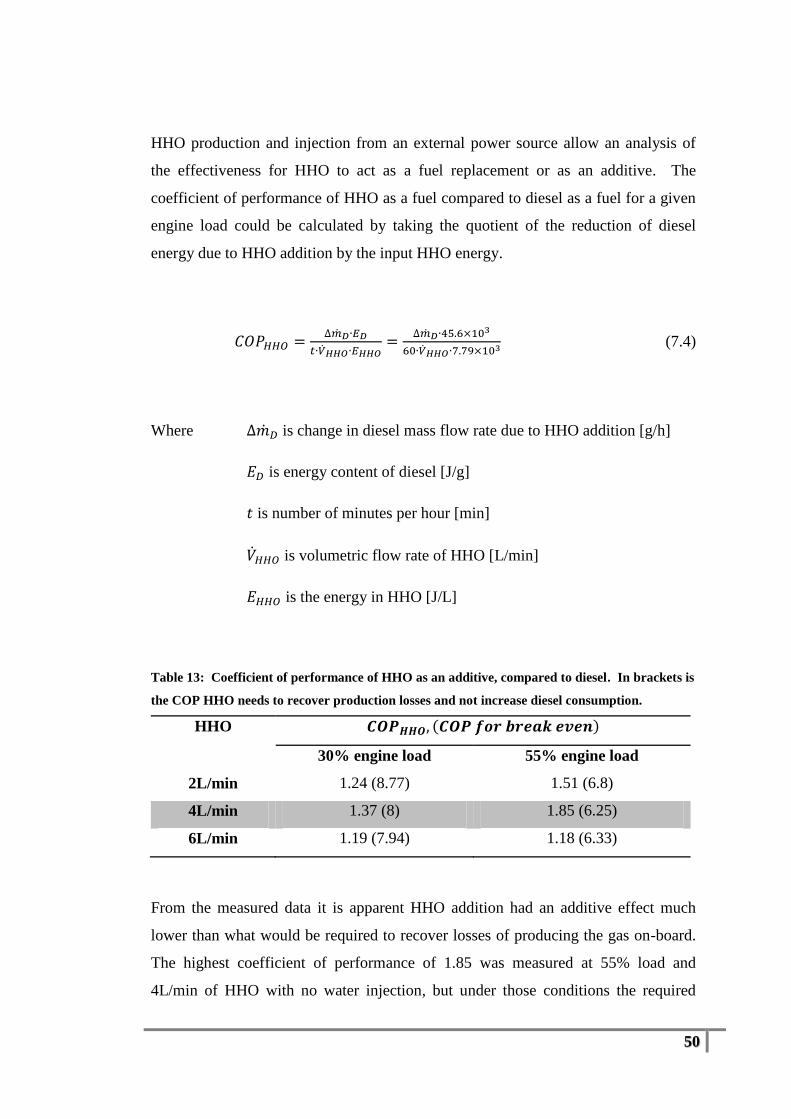
50
HHO production and injection from an external power source allow an analysis of
the effectiveness for HHO to act as a fuel replacement or as an additive. The
coefficient of performance of HHO as a fuel compared to diesel as a fuel for a given
engine load could be calculated by taking the quotient of the reduction of diesel
energy due to HHO addition by the input HHO energy.
(7.4)
Where is change in diesel mass flow rate due to HHO addition [g/h]
is energy content of diesel [J/g]
is number of minutes per hour [min]
is volumetric flow rate of HHO [L/min]
is the energy in HHO [J/L]
Table 13: Coefficient of performance of HHO as an additive, compared to diesel. In brackets is
the COP HHO needs to recover production losses and not increase diesel consumption.
HHO ( )
30% engine load 55% engine load
2L/min 1.24 (8.77) 1.51 (6.8)
4L/min 1.37 (8) 1.85 (6.25)
6L/min 1.19 (7.94) 1.18 (6.33)
From the measured data it is apparent HHO addition had an additive effect much
lower than what would be required to recover losses of producing the gas on-board.
The highest coefficient of performance of 1.85 was measured at 55% load and
4L/min of HHO with no water injection, but under those conditions the required
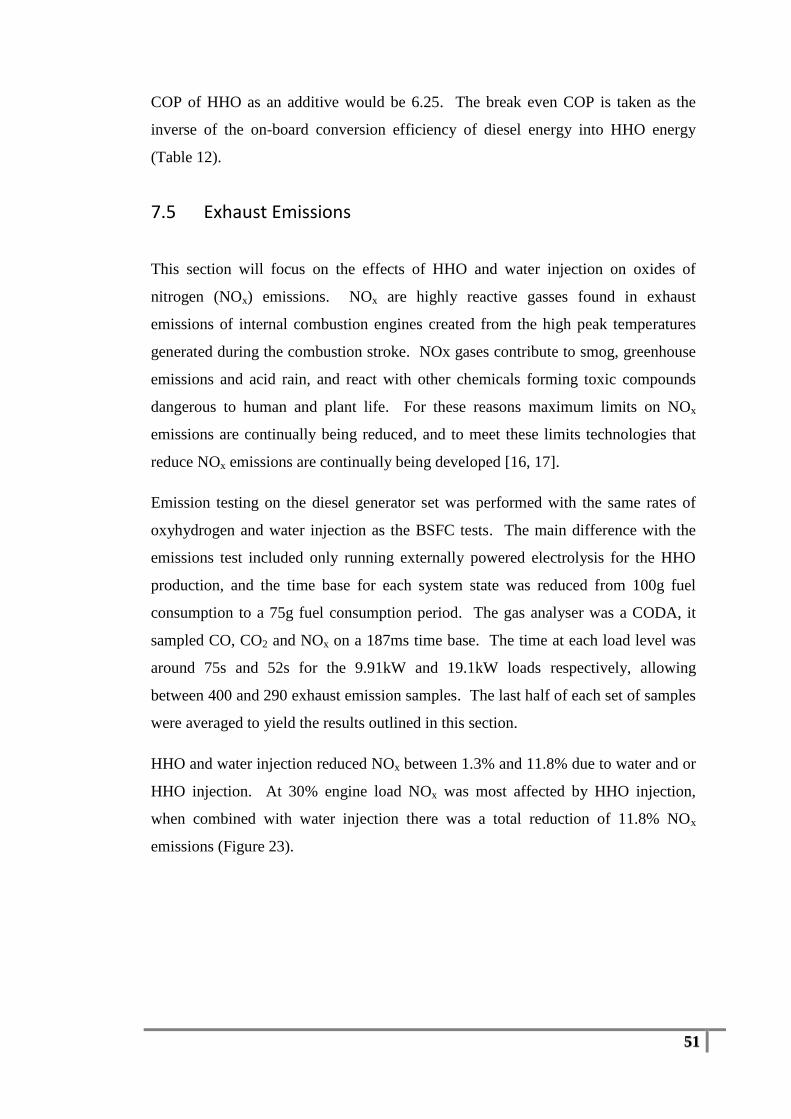
51
COP of HHO as an additive would be 6.25. The break even COP is taken as the
inverse of the on-board conversion efficiency of diesel energy into HHO energy
(Table 12).
7.5 Exhaust Emissions
This section will focus on the effects of HHO and water injection on oxides of
nitrogen (NOx) emissions. NOx are highly reactive gasses found in exhaust
emissions of internal combustion engines created from the high peak temperatures
generated during the combustion stroke. NOx gases contribute to smog, greenhouse
emissions and acid rain, and react with other chemicals forming toxic compounds
dangerous to human and plant life. For these reasons maximum limits on NOx
emissions are continually being reduced, and to meet these limits technologies that
reduce NOx emissions are continually being developed [16, 17].
Emission testing on the diesel generator set was performed with the same rates of
oxyhydrogen and water injection as the BSFC tests. The main difference with the
emissions test included only running externally powered electrolysis for the HHO
production, and the time base for each system state was reduced from 100g fuel
consumption to a 75g fuel consumption period. The gas analyser was a CODA, it
sampled CO, CO2 and NOx on a 187ms time base. The time at each load level was
around 75s and 52s for the 9.91kW and 19.1kW loads respectively, allowing
between 400 and 290 exhaust emission samples. The last half of each set of samples
were averaged to yield the results outlined in this section.
HHO and water injection reduced NOx between 1.3% and 11.8% due to water and or
HHO injection. At 30% engine load NOx was most affected by HHO injection,
when combined with water injection there was a total reduction of 11.8% NOx
emissions (Figure 23).
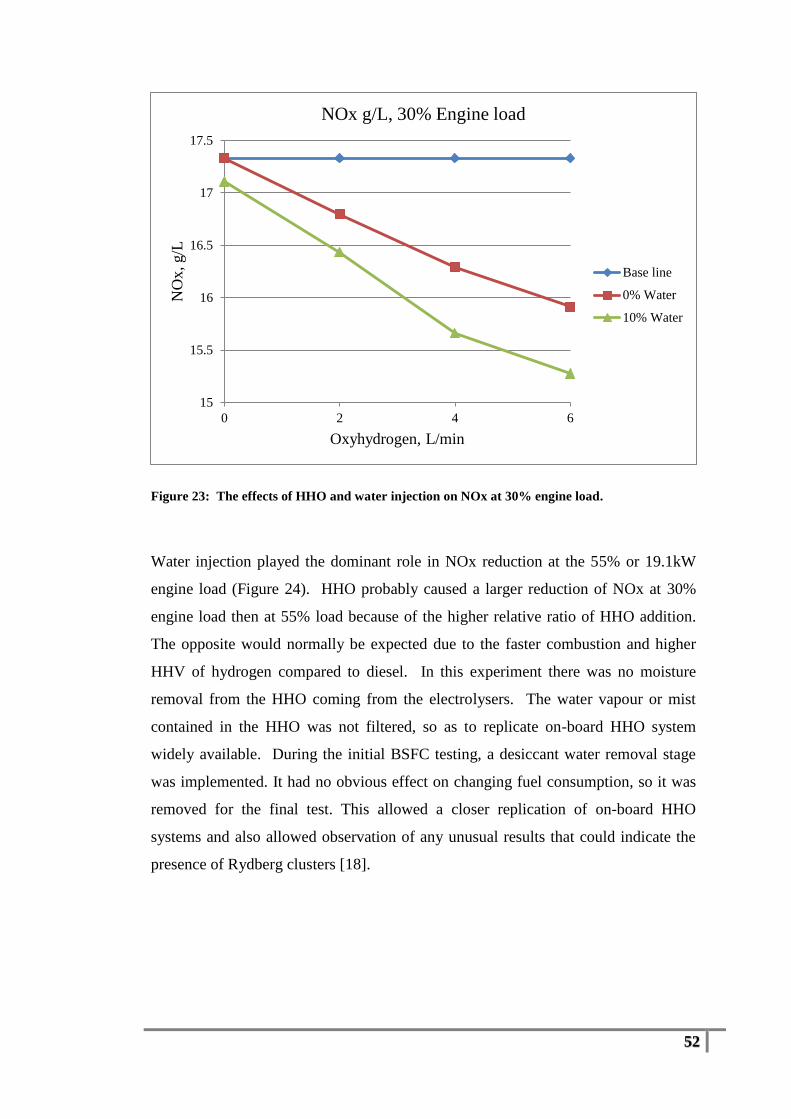
52
Figure 23: The effects of HHO and water injection on NOx at 30% engine load.
Water injection played the dominant role in NOx reduction at the 55% or 19.1kW
engine load (Figure 24). HHO probably caused a larger reduction of NOx at 30%
engine load then at 55% load because of the higher relative ratio of HHO addition.
The opposite would normally be expected due to the faster combustion and higher
HHV of hydrogen compared to diesel. In this experiment there was no moisture
removal from the HHO coming from the electrolysers. The water vapour or mist
contained in the HHO was not filtered, so as to replicate on-board HHO system
widely available. During the initial BSFC testing, a desiccant water removal stage
was implemented. It had no obvious effect on changing fuel consumption, so it was
removed for the final test. This allowed a closer replication of on-board HHO
systems and also allowed observation of any unusual results that could indicate the
presence of Rydberg clusters [18].
15
15.5
16
16.5
17
17.5
0 2 4 6
NO
x, g/L
Oxyhydrogen, L/min
NOx g/L, 30% Engine load
Base line
0% Water
10% Water
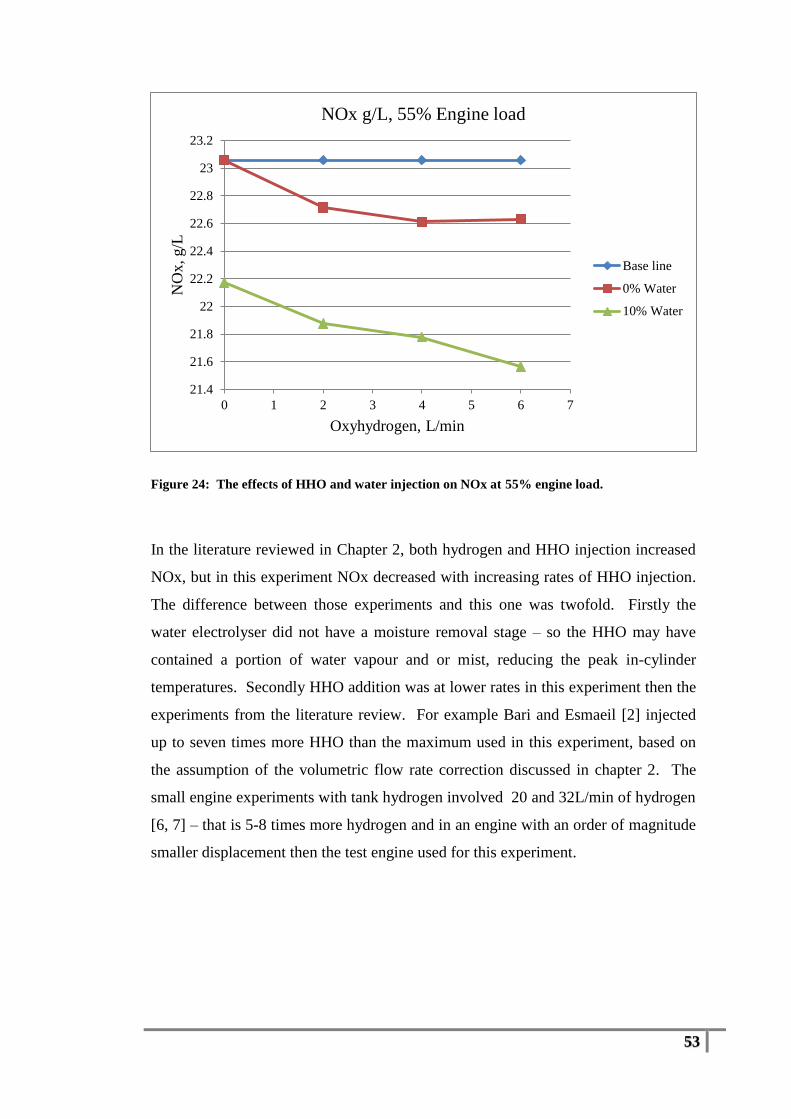
53
Figure 24: The effects of HHO and water injection on NOx at 55% engine load.
In the literature reviewed in Chapter 2, both hydrogen and HHO injection increased
NOx, but in this experiment NOx decreased with increasing rates of HHO injection.
The difference between those experiments and this one was twofold. Firstly the
water electrolyser did not have a moisture removal stage – so the HHO may have
contained a portion of water vapour and or mist, reducing the peak in-cylinder
temperatures. Secondly HHO addition was at lower rates in this experiment then the
experiments from the literature review. For example Bari and Esmaeil [2] injected
up to seven times more HHO than the maximum used in this experiment, based on
the assumption of the volumetric flow rate correction discussed in chapter 2. The
small engine experiments with tank hydrogen involved 20 and 32L/min of hydrogen
[6, 7] – that is 5-8 times more hydrogen and in an engine with an order of magnitude
smaller displacement then the test engine used for this experiment.
21.4
21.6
21.8
22
22.2
22.4
22.6
22.8
23
23.2
0 1 2 3 4 5 6 7
NO
x, g/L
Oxyhydrogen, L/min
NOx g/L, 55% Engine load
Base line
0% Water
10% Water
54
Chapter 8 Future Research Recommendations
Future research opportunities that could extend the findings of this research paper
definitely exist. Most diesel generators are turbo charged, and loaded at higher
percentages then the loads used in this test. The effects of HHO addition and water
injection in a turbo diesel engine under a wider range of generator loads would be of
interest. Other areas of interest in terms of diesel engines would include testing the
effects of HHO on truck and mining equipment engines, within the normal engine
speed and load conditions that they are subject to. The effects of on-board HHO
injection could be trialled for typical engine load and speed cycles that spark ignition
engines are subject to in road vehicles.
Another area of research potential stemming from this research would be to develop
methods for increasing the energy in the HHO gas via plasma electrolysis, or via
high voltage resonant electrolysis, or any other method, and then test the effects of
these altered states of HHO on internal combustion engines to see if fuel economy
could be raised. This research project has only shown that on-board HHO addition is
ineffective for reducing diesel consumption on a light to medium loaded naturally
aspirated diesel generator. This inability for on-board HHO addition to reduce fuel
consumption cannot be inferred to other types of internal combustion engines, or
speed load cycles until it is tested.
It is important in future research of on-board HHO addition to; state the power
efficiency of the electrolyser, have properly calibrated flow control and measurement
for HHO, and have HHO production rates that leave a reasonably large portion of the
engines power to do useful work. If the research is aimed at determining the ability
for HHO to reduce fuel consumption in an engine, then the HHO should be produced
by the engines power, especially for road transport (unless the external electrical
supply could be feasibly carried).
55
Chapter 9 Project Conclusion
9.1 On-board HHO Addition Research Gap
Literature review of small rates of tank hydrogen or HHO addition in diesel engines
and generators agreed on a reduction of diesel consumption. However the reductions
in diesel consumption were not enough to overcome the typical production losses
when generating on-board HHO. The claims of small rates of on-board HHO
addition to reduce diesel consumption in a generator were based on a purely
theoretical stance of producing HHO at 100% efficiency (Chapter 2). The literature
review revealed the need for experimental testing and validation of an on-board
electrolyser system on a diesel generator, since this is one major area where the
claims of fuel saving are made.
9.2 On-board HHO’s Effect on Diesel Consumption
The experiment included the addition of 0-6L/min of HHO produced from an on-
board electrolyser into a diesel generator at 30% and 55% of the 3.9L engines rating.
The experiment was run with and without 10% water/diesel injection ratio to test
whether water injection could have alleviated potential NOx exhaust emission,
should a reduction in diesel consumption be possible. The results conclusively
showed that diesel consumption linearly increases with increasing on board HHO
addition – up to a 5.2% increase in diesel consumption with 6L/min at 55% engine
loading. The coefficient of performance of HHO compared to diesel as a fuel was
measured at 1.19 to 1.85, but HHO required a COP of 6.33 to 8.77 to break even
with the losses of production. Water injection in conjunction with HHO addition
slightly increased diesel consumption, most likely due to reduced combustion
temperatures.
56
9.3 HHO’s Effect on NOx Exhaust Emissions
Oxides of nitrogen (NOx) emissions were reduced up to 11.8% and 6.5% at 30% and
50% loads respectively from 6L/min HHO and 10% water addition with an
externally powered electrolyser. At the lighter 30% engine load 70% of the NOx
reduction was as a result of the HHO injection, the remaining 30% reduction due to
water injection. At the increased 55% engine load, water injection was the main
contributor to NOx reduction. HHO was only responsible for 28% of the NOx
reduction. HHO did not increase NOx most likely due to the small gaseous and
liquid water content of the gas, and because the electrolyser was powered externally
for the emissions test. A moisture removal stage in the water electrolyser system
was omitted from the experiment to better replicate ‘fuel saving’ HHO generators
that this experiment was aimed at validating.
9.4 Financial Analysis
No financial feasibility studies were conducted for on-board HHO injection because
HHO increased fuel consumption for all rates of injection for the 3.9L 28kW
Cummins diesel generator set. Even if the water electrolyser and the DC power
supply were 100% efficient, HHO’s COP as an additive would be negated by the
mechanical losses of the generator.

57
Appendix A: Project Specification
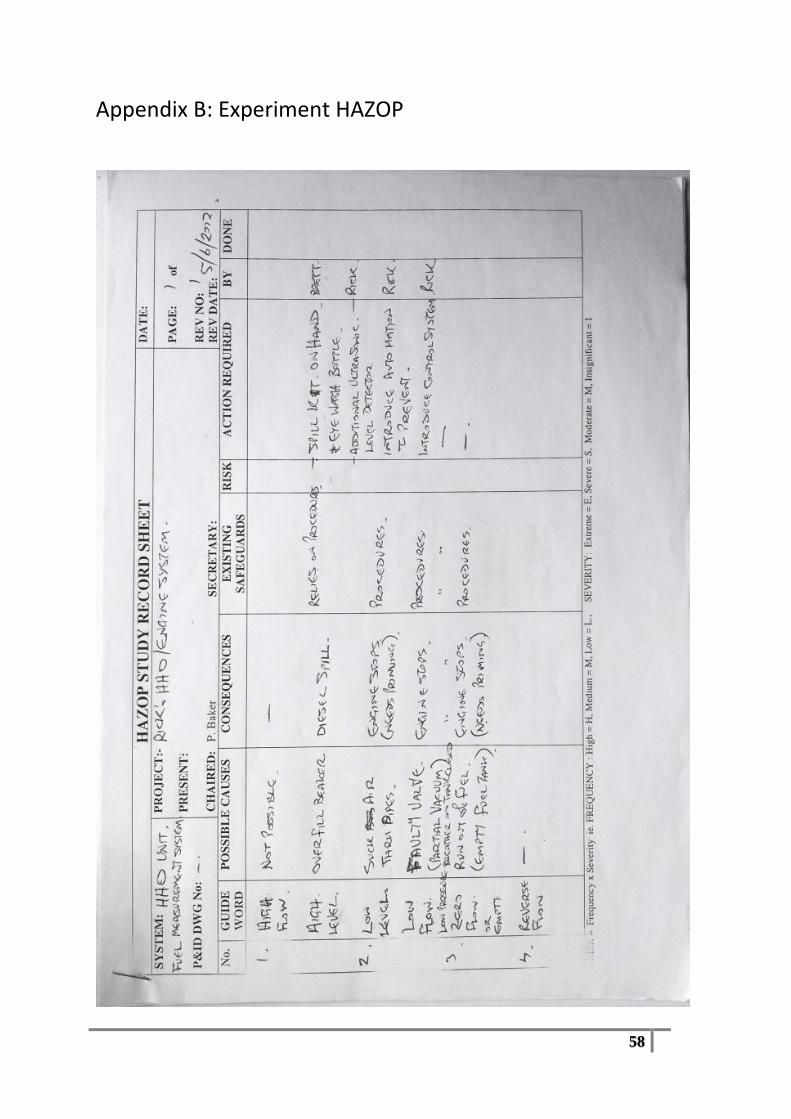
58
Appendix B: Experiment HAZOP
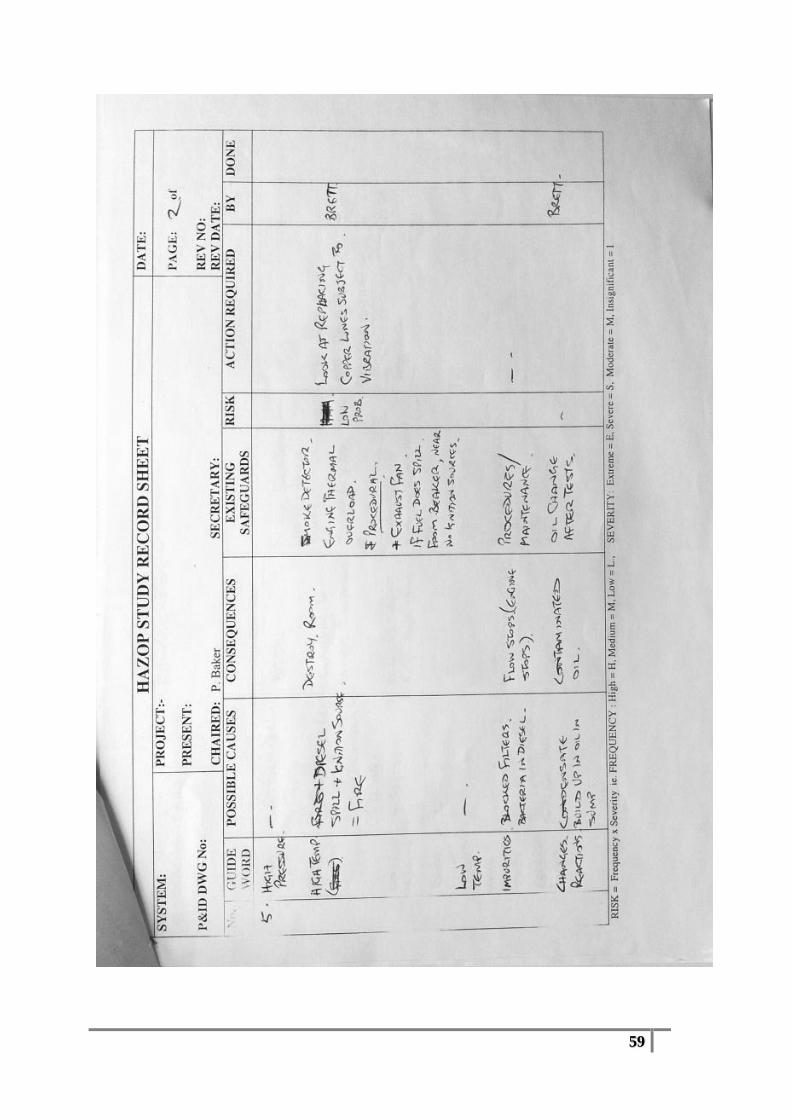
59
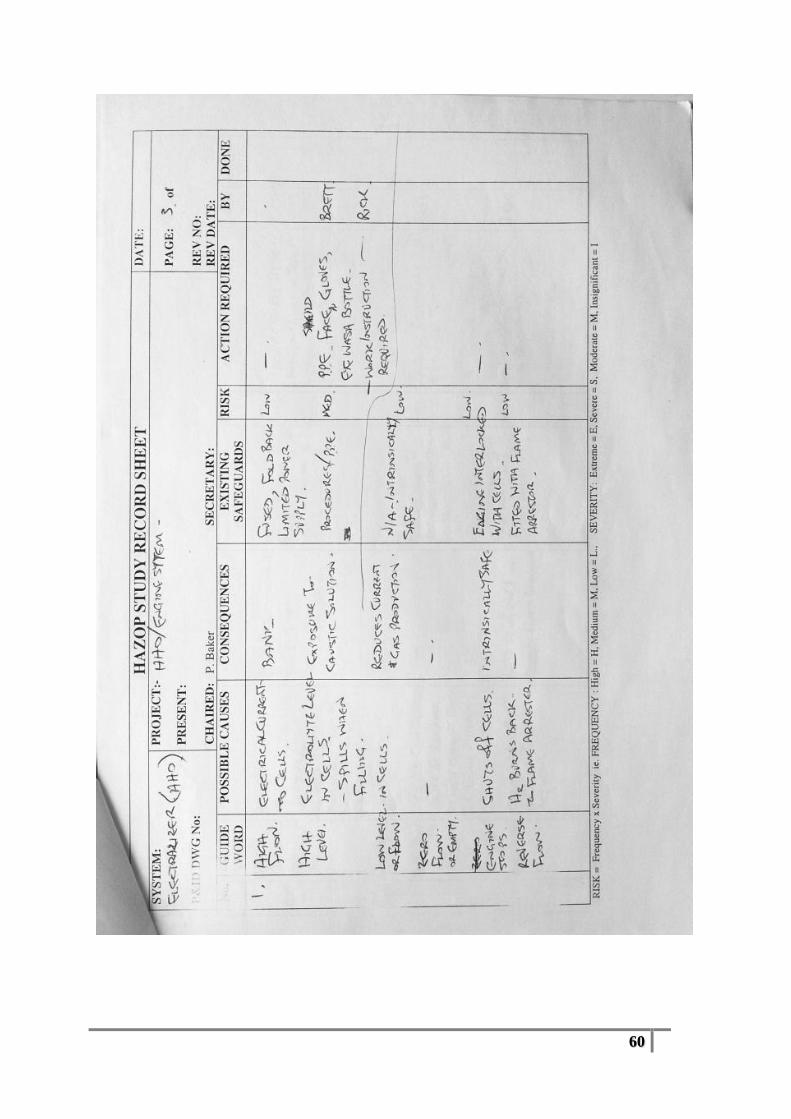
60
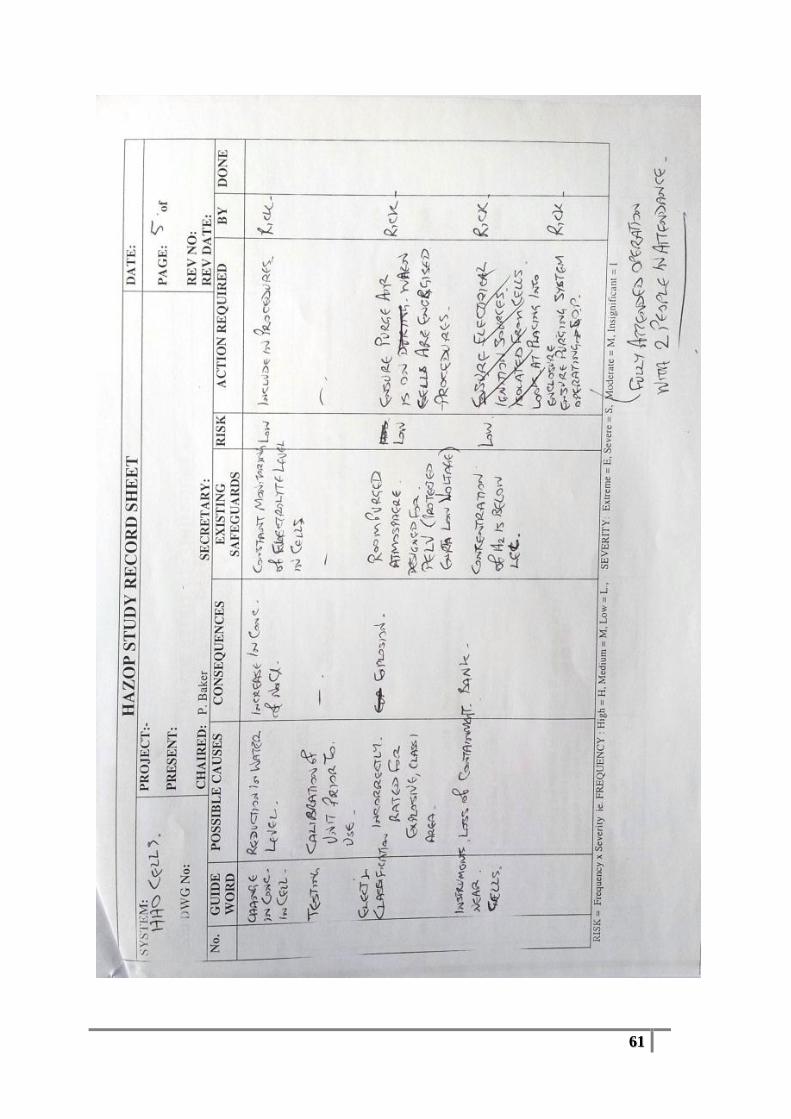
61
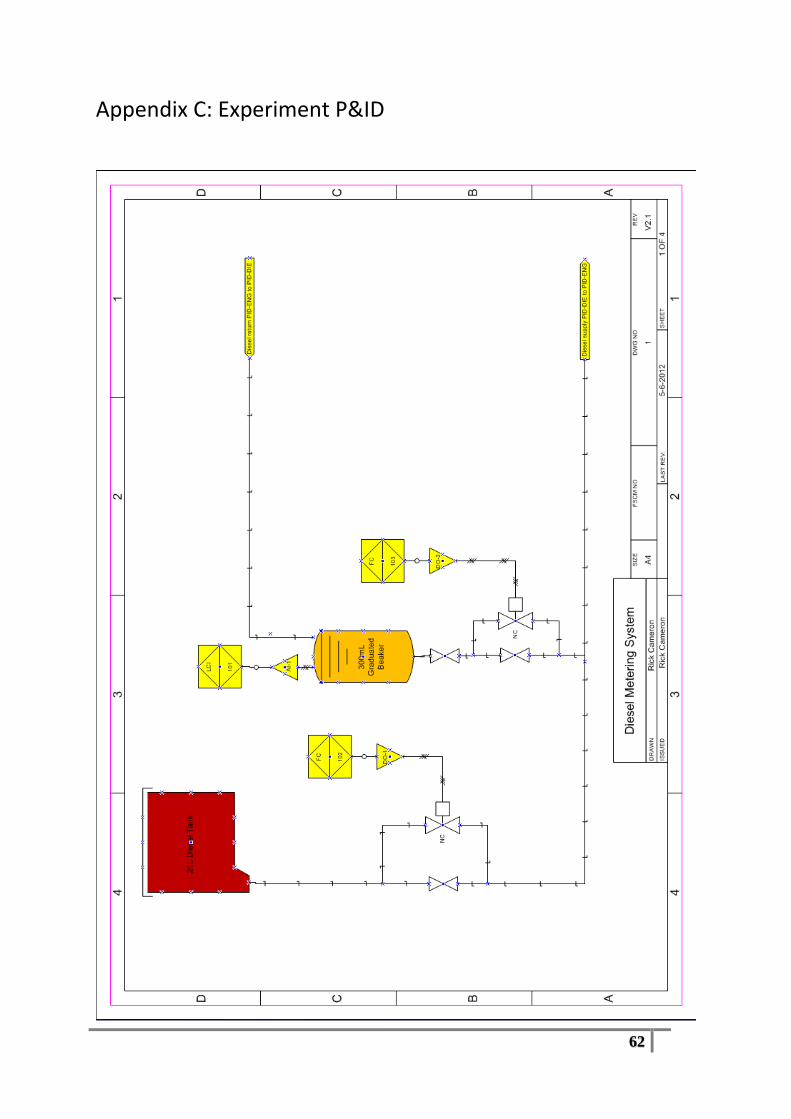
62
Appendix C: Experiment P&ID
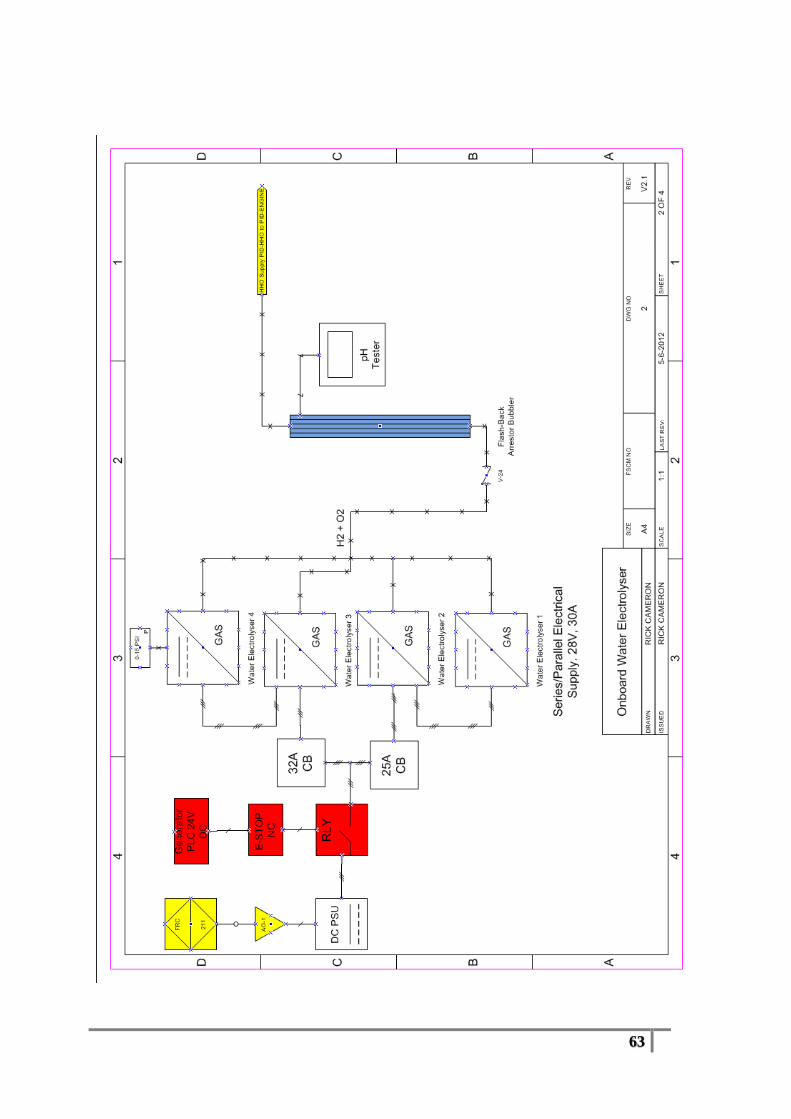
63
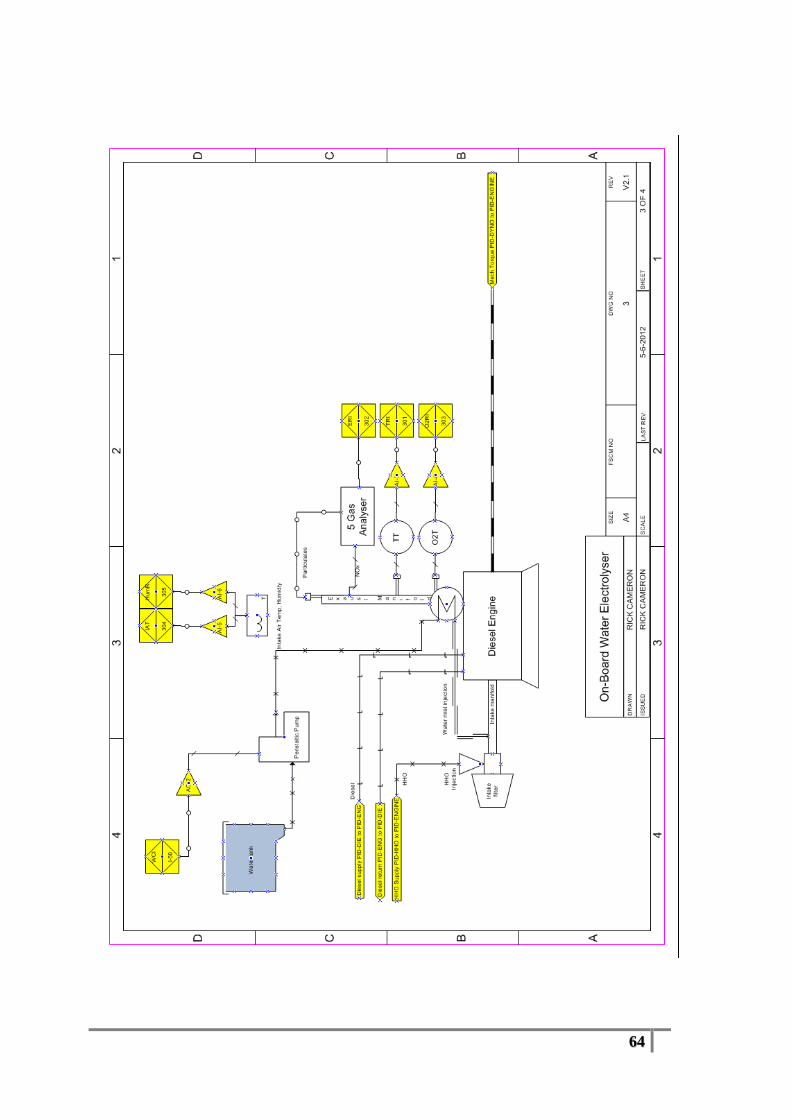
64
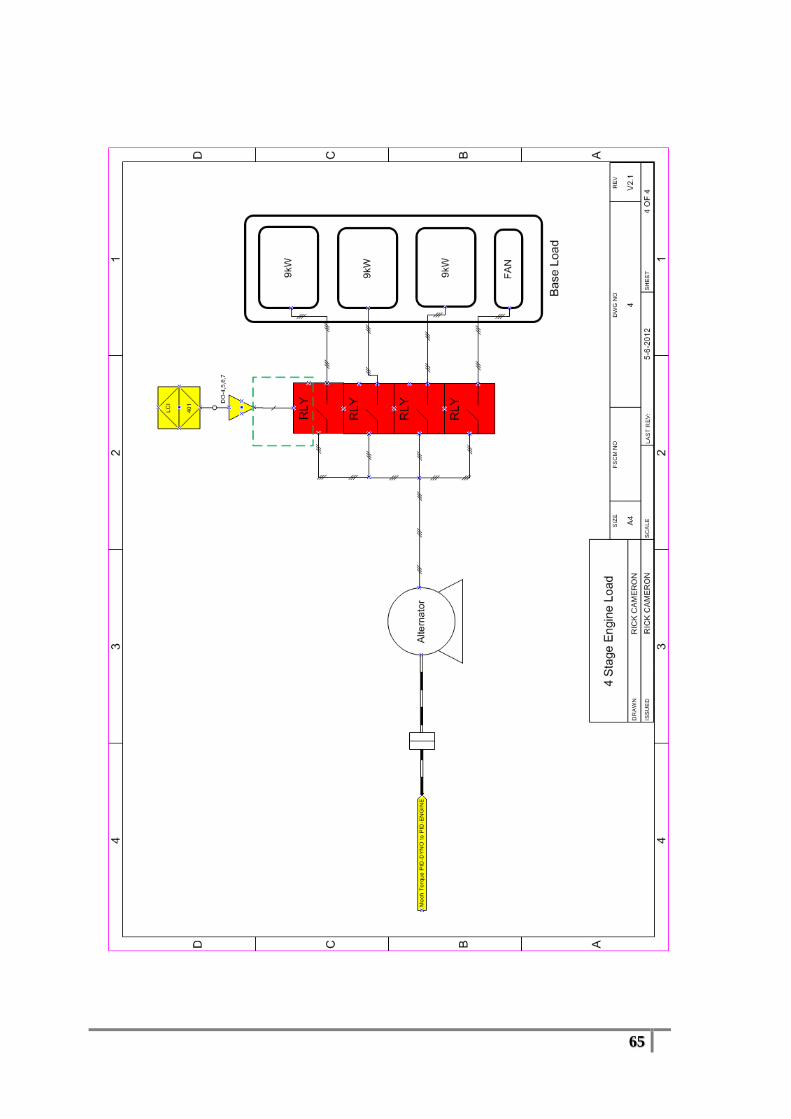
65
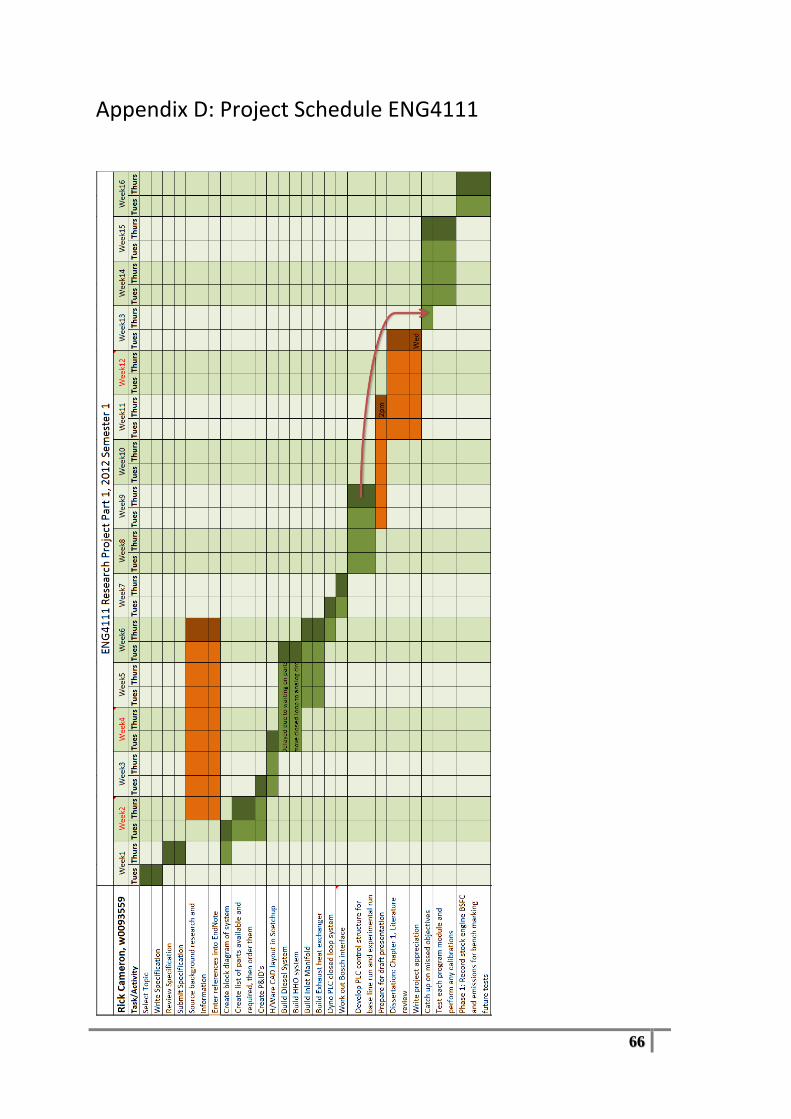
66
Appendix D: Project Schedule ENG4111
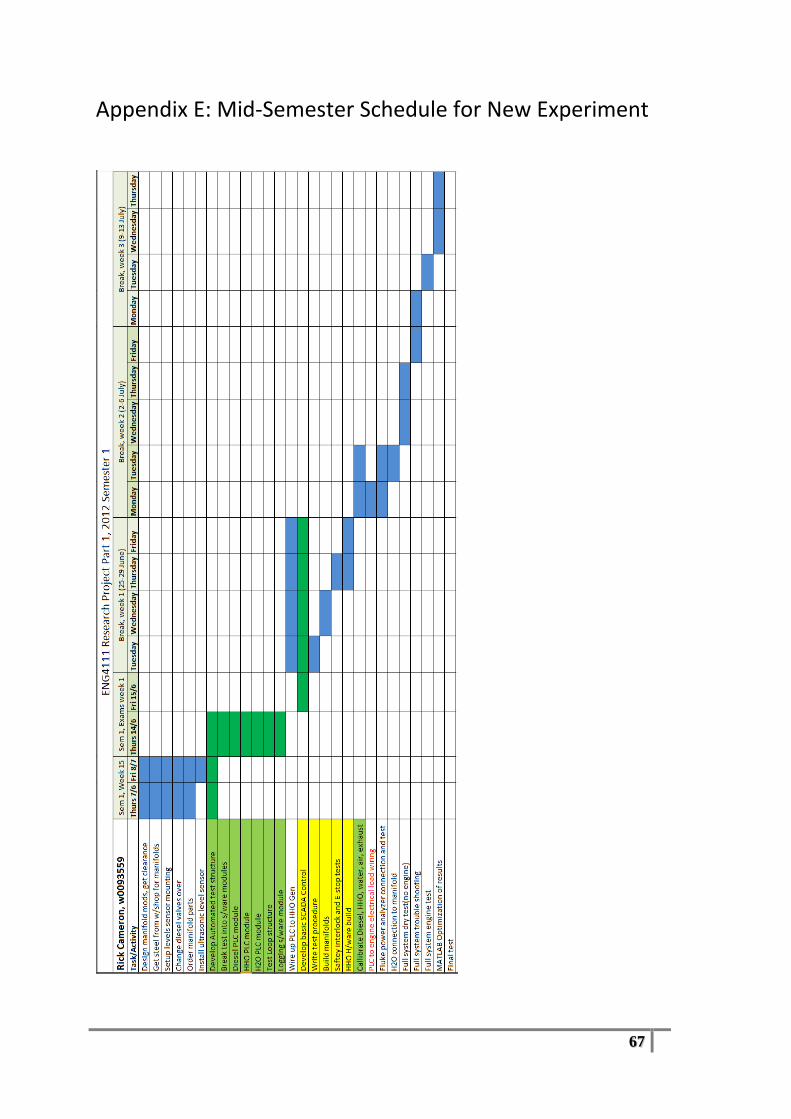
67
Appendix E: Mid-Semester Schedule for New Experiment
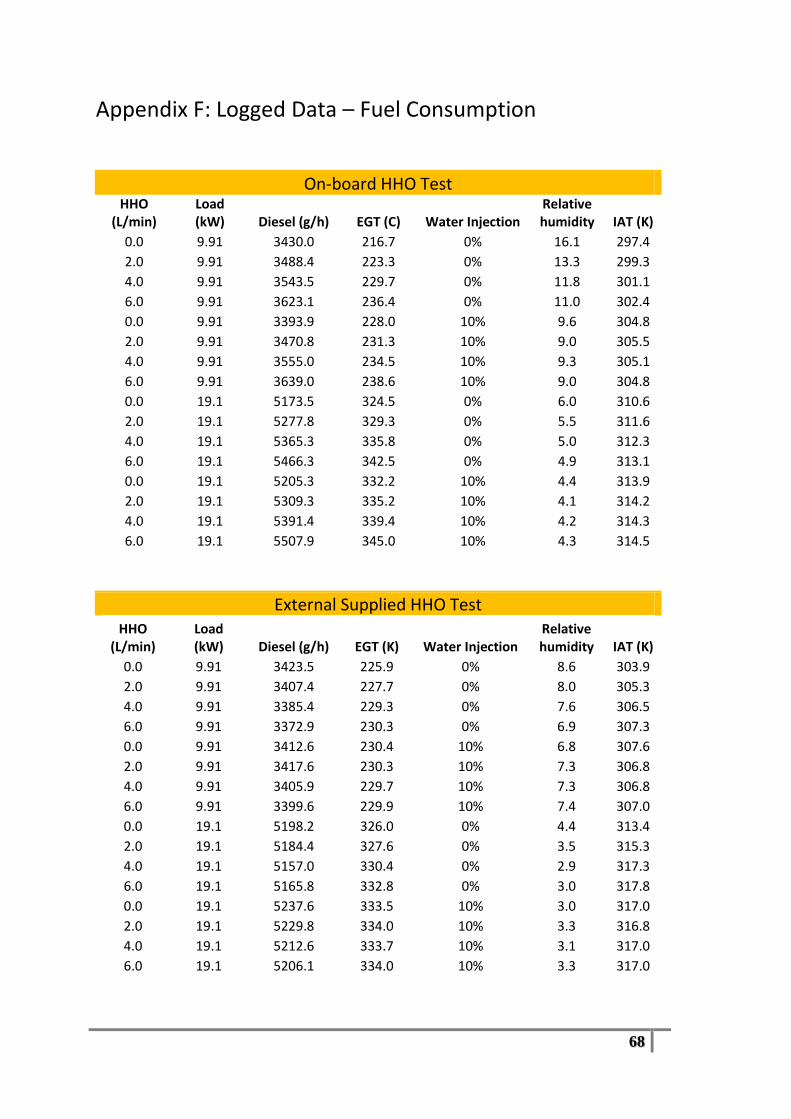
68
Appendix F: Logged Data – Fuel Consumption
On-board HHO Test HHO
(L/min) Load (kW) Diesel (g/h) EGT (C) Water Injection
Relative humidity IAT (K)
0.0 9.91 3430.0 216.7 0% 16.1 297.4
2.0 9.91 3488.4 223.3 0% 13.3 299.3
4.0 9.91 3543.5 229.7 0% 11.8 301.1
6.0 9.91 3623.1 236.4 0% 11.0 302.4
0.0 9.91 3393.9 228.0 10% 9.6 304.8
2.0 9.91 3470.8 231.3 10% 9.0 305.5
4.0 9.91 3555.0 234.5 10% 9.3 305.1
6.0 9.91 3639.0 238.6 10% 9.0 304.8
0.0 19.1 5173.5 324.5 0% 6.0 310.6
2.0 19.1 5277.8 329.3 0% 5.5 311.6
4.0 19.1 5365.3 335.8 0% 5.0 312.3
6.0 19.1 5466.3 342.5 0% 4.9 313.1
0.0 19.1 5205.3 332.2 10% 4.4 313.9
2.0 19.1 5309.3 335.2 10% 4.1 314.2
4.0 19.1 5391.4 339.4 10% 4.2 314.3
6.0 19.1 5507.9 345.0 10% 4.3 314.5
External Supplied HHO Test HHO
(L/min) Load (kW) Diesel (g/h) EGT (K) Water Injection
Relative humidity IAT (K)
0.0 9.91 3423.5 225.9 0% 8.6 303.9
2.0 9.91 3407.4 227.7 0% 8.0 305.3
4.0 9.91 3385.4 229.3 0% 7.6 306.5
6.0 9.91 3372.9 230.3 0% 6.9 307.3
0.0 9.91 3412.6 230.4 10% 6.8 307.6
2.0 9.91 3417.6 230.3 10% 7.3 306.8
4.0 9.91 3405.9 229.7 10% 7.3 306.8
6.0 9.91 3399.6 229.9 10% 7.4 307.0
0.0 19.1 5198.2 326.0 0% 4.4 313.4
2.0 19.1 5184.4 327.6 0% 3.5 315.3
4.0 19.1 5157.0 330.4 0% 2.9 317.3
6.0 19.1 5165.8 332.8 0% 3.0 317.8
0.0 19.1 5237.6 333.5 10% 3.0 317.0
2.0 19.1 5229.8 334.0 10% 3.3 316.8
4.0 19.1 5212.6 333.7 10% 3.1 317.0
6.0 19.1 5206.1 334.0 10% 3.3 317.0
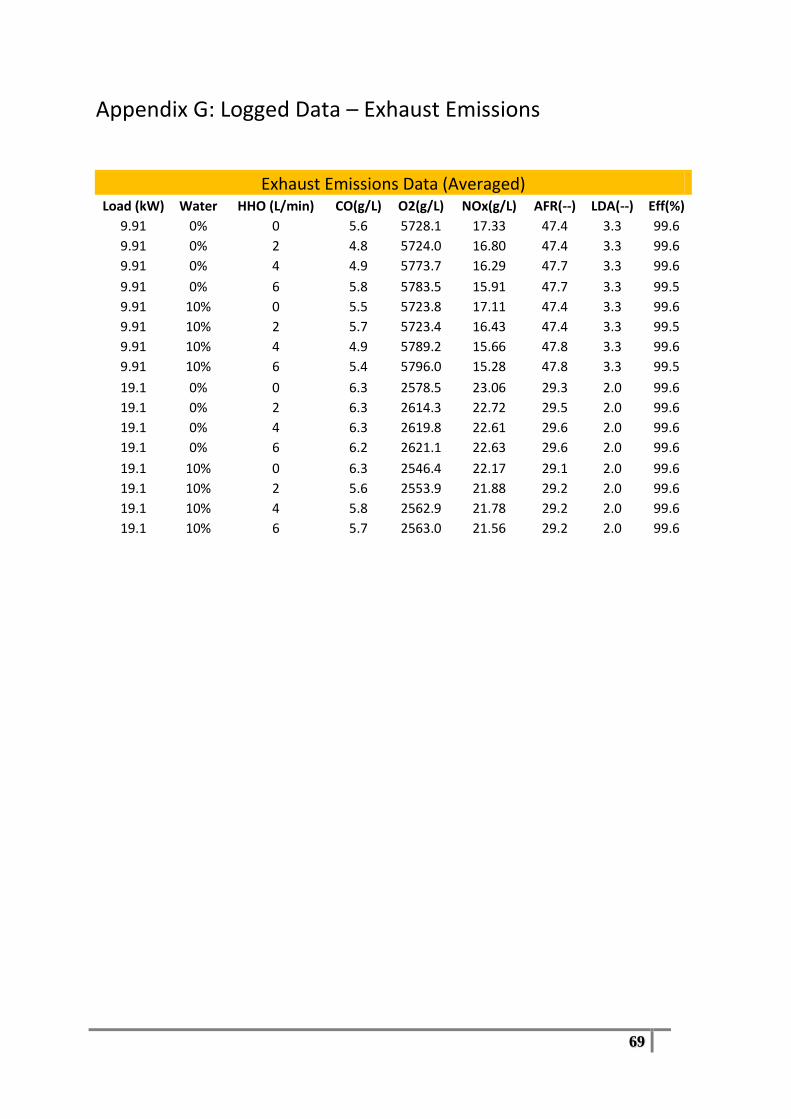
69
Appendix G: Logged Data – Exhaust Emissions
Exhaust Emissions Data (Averaged) Load (kW) Water HHO (L/min) CO(g/L) O2(g/L) NOx(g/L) AFR(--) LDA(--) Eff(%)
9.91 0% 0 5.6 5728.1 17.33 47.4 3.3 99.6
9.91 0% 2 4.8 5724.0 16.80 47.4 3.3 99.6
9.91 0% 4 4.9 5773.7 16.29 47.7 3.3 99.6
9.91 0% 6 5.8 5783.5 15.91 47.7 3.3 99.5
9.91 10% 0 5.5 5723.8 17.11 47.4 3.3 99.6
9.91 10% 2 5.7 5723.4 16.43 47.4 3.3 99.5
9.91 10% 4 4.9 5789.2 15.66 47.8 3.3 99.6
9.91 10% 6 5.4 5796.0 15.28 47.8 3.3 99.5
19.1 0% 0 6.3 2578.5 23.06 29.3 2.0 99.6
19.1 0% 2 6.3 2614.3 22.72 29.5 2.0 99.6
19.1 0% 4 6.3 2619.8 22.61 29.6 2.0 99.6
19.1 0% 6 6.2 2621.1 22.63 29.6 2.0 99.6
19.1 10% 0 6.3 2546.4 22.17 29.1 2.0 99.6
19.1 10% 2 5.6 2553.9 21.88 29.2 2.0 99.6
19.1 10% 4 5.8 2562.9 21.78 29.2 2.0 99.6
19.1 10% 6 5.7 2563.0 21.56 29.2 2.0 99.6

70
Appendix H: MATLAB Script for Processing PLC Data
This MATLAB script extracted raw data from the PLC’s logged .csv file and
generated surface and contour plots of BSFC and exhaust temperature over the range
of HHO addition and water injection rates. This allowed data to be analysed at the
time and location of the experiment in the initial stages.
% main.m
% Created: Rick Cameron, 2012 % What it does: % Processes raw data logged with a Siemens S7-200 PLC system from a
30kW % diesel genset test contour plots showing the effects of varying
rates of % HHO and water mist injection on brake specific fuel consumption of % a diesel engine.
% Requirements: % CSV file from PLC containing logged data % Barometric pressure in kPa % active electrical power data from generator
clc; clear; close all
diesel_col = 1; egt_col = 2; HHO_col = 4; water_col = 5; load_col = 6;
%% Import logged data from PLC importfile();
%%Correct the power and BSFC to ambient conditions T = data(:,7)+273.15; %dry bulb air temperature in kelvin R_humidity = data(:,8)./100; %relative humidity 0-1 % pressure of water, hPa pp_water = R_humidity .* (exp(77.345+0.0057.*T-
7235./T)./(T.^8.2.*100)); dry_air_pressure = 1019.0 - pp_water; % dry air pressure, hPa % SAE J1349 formula for power correction factor cf = 1.18.*((990./dry_air_pressure).*sqrt(T./298))-0.18; p = polyfit([1,2,3],[9.91,19.1,28],3); %convert load 1,2,3 with
power function % Use logged data from EDMI power meter if available, in kW corrected_power = cf.*polyval(p,data(:,load_col)); % Convert fuel consumption into BSFC data(:,diesel_col) = data(:,diesel_col)./(data(:,load_col)*9);
max_hho = max(data(:,HHO_col)); water_max = max(data(:,water_col)); water_step = unique(data(:,water_col));
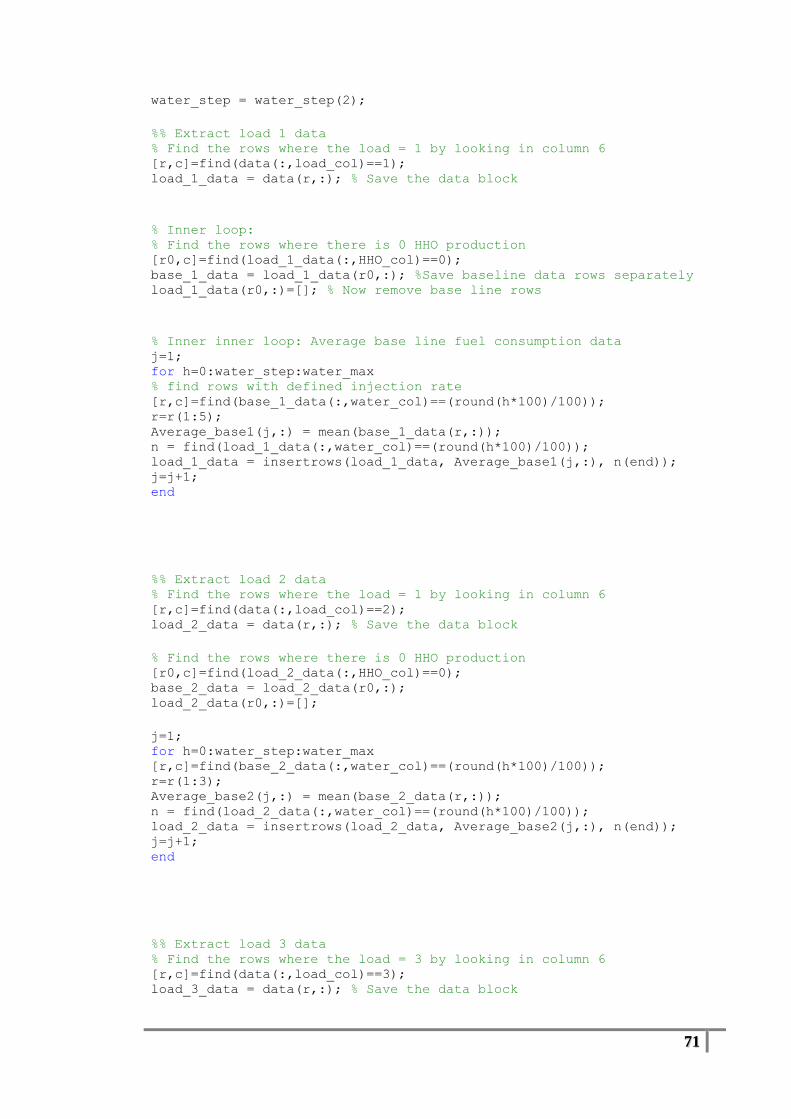
71
water_step = water_step(2);
%% Extract load 1 data % Find the rows where the load = 1 by looking in column 6 [r,c]=find(data(:,load_col)==1); load_1_data = data(r,:); % Save the data block
% Inner loop: % Find the rows where there is 0 HHO production [r0,c]=find(load_1_data(:,HHO_col)==0); base_1_data = load_1_data(r0,:); %Save baseline data rows separately load_1_data(r0,:)=[]; % Now remove base line rows
% Inner inner loop: Average base line fuel consumption data j=1; for h=0:water_step:water_max % find rows with defined injection rate [r,c]=find(base_1_data(:,water_col)==(round(h*100)/100)); r=r(1:5); Average_base1(j,:) = mean(base_1_data(r,:)); n = find(load_1_data(:,water_col)==(round(h*100)/100)); load_1_data = insertrows(load_1_data, Average_base1(j,:), n(end)); j=j+1; end
%% Extract load 2 data % Find the rows where the load = 1 by looking in column 6 [r,c]=find(data(:,load_col)==2); load_2_data = data(r,:); % Save the data block
% Find the rows where there is 0 HHO production [r0,c]=find(load_2_data(:,HHO_col)==0); base_2_data = load_2_data(r0,:); load_2_data(r0,:)=[];
j=1; for h=0:water_step:water_max [r,c]=find(base_2_data(:,water_col)==(round(h*100)/100)); r=r(1:3); Average_base2(j,:) = mean(base_2_data(r,:)); n = find(load_2_data(:,water_col)==(round(h*100)/100)); load_2_data = insertrows(load_2_data, Average_base2(j,:), n(end)); j=j+1; end
%% Extract load 3 data % Find the rows where the load = 3 by looking in column 6 [r,c]=find(data(:,load_col)==3); load_3_data = data(r,:); % Save the data block

72
% Find the rows where there is 0 HHO production [r0,c]=find(load_3_data(:,HHO_col)==0); base_3_data = load_3_data(r0,:); load_3_data(r0,:)=[];
j=1; for h=0:water_step:water_max [r,c]=find(base_3_data(:,water_col)==(round(h*100)/100)); r=r(1:3); Average_base3(j,:) = mean(base_3_data(r,:)); n = find(load_3_data(:,water_col)==(round(h*100)/100)); load_3_data = insertrows(load_3_data, Average_base3(j,:), n(end)); j=j+1; end
%% General set up for surface and contour plots scrn_size = get(0,'ScreenSize'); scrn_init_loc = scrn_size + [20 50 -600 -250]; scrn_offset = [150 0 0 0]; k=0; screen_current = scrn_init_loc + k.*scrn_offset; plot_res = 36;
% Equal increments between min and max sampled HHO xlin = linspace(0,max_hho,plot_res); % Equal increments between min and max sampled water ylin = linspace(0,water_max,6); ylinfine = linspace(0,water_max,plot_res); %2d row and column matrices of HHO and water rates [X,Y] = meshgrid(xlin,ylin); %2d row and column matrices of HHO and water rates [X1,Y1] = meshgrid(xlin,ylinfine);
% Sampled data % Smooth the noise from the SFC data for the interpolated surface
plots. j = 1; z1 = load_1_data(:,diesel_col); %SFC z2 = load_2_data(:,diesel_col); %SFC z3 = load_3_data(:,diesel_col); %SFC for h = 0:water_step:water_max [r,c] =
find((round(load_1_data(:,water_col)*100)/100)==(round(h*100)/100)); % z1(r,1) = medfilt1(load_1_data(r,1),5); z_egt1(r,1) = medfilt1(load_1_data(r,egt_col),5); % Polynomial curve fitting option z1(r,1) = polyval(polyfit(load_1_data(r,HHO_col),... load_1_data(r,diesel_col),6),load_1_data(r,HHO_col));
[r,c] =
find((round(load_2_data(:,water_col)*100)/100)==(round(h*100)/100)); % z2(r,1) = medfilt1(load_2_data(r,1),5); z_egt2(r,1) = medfilt1(load_2_data(r,egt_col),5); z2(r,1) = polyval(polyfit(load_2_data(r,HHO_col),... load_2_data(r,diesel_col),6),load_2_data(r,HHO_col));

73
[r,c] =
find((round(load_3_data(:,water_col)*100)/100)==(round(h*100)/100)); % z3(r,1) = medfilt1(load_3_data(r,1),5); z_egt3(r,1) = medfilt1(load_3_data(r,egt_col),5); z3(r,1) = polyval(polyfit(load_3_data(r,HHO_col),... load_3_data(r,diesel_col),6),load_3_data(r,HHO_col));
j = j+1; end
% HHO rate extraction x1 = load_1_data(:,HHO_col); x2 = load_2_data(:,HHO_col); x3 = load_3_data(:,HHO_col); % Water/diesel rate extraction y1 = load_1_data(:,water_col); y2 = load_2_data(:,water_col); y3 = load_3_data(:,water_col); % Construct interpolant function for BSFC F1 = TriScatteredInterp(x1, y1, z1); F2 = TriScatteredInterp(x2, y2, z2); F3 = TriScatteredInterp(x3, y3, z3); % Construct interpolant function for EGT F_egt1 = TriScatteredInterp(x1, y1, z_egt1); F_egt2 = TriScatteredInterp(x2, y2, z_egt2); F_egt3 = TriScatteredInterp(x3, y3, z_egt3); %Evaluate the interpolant at loactions X1 and Y1. Z1 = F1(X,Y); Z2 = F2(X,Y); Z3 = F3(X,Y); Z_egt1 = F_egt1(X,Y); Z_egt2 = F_egt2(X,Y); Z_egt3 = F_egt3(X,Y); Z1 = interp2(X,Y,Z1,X1,Y1,'linear'); Z2 = interp2(X,Y,Z2,X1,Y1,'linear'); Z3 = interp2(X,Y,Z3,X1,Y1,'linear'); Z_egt1 = interp2(X,Y,Z_egt1,X1,Y1,'spline'); Z_egt2 = interp2(X,Y,Z_egt2,X1,Y1,'spline'); Z_egt3 = interp2(X,Y,Z_egt3,X1,Y1,'spline');
base_1_BSFC = base_1_data(end,1) * ones(plot_res,plot_res); base_2_BSFC = base_2_data(end,1) * ones(plot_res,plot_res); base_3_BSFC = base_3_data(end,1) * ones(plot_res,plot_res);
%% Load 1: 3D graph for non-uniform and noisy data figure; set(gcf,'Position',screen_current); [C,b] = contourf(X1,Y1,Z1,linspace(floor(min(min(Z1/10)))*10,... ceil(max(max(Z1/10)))*10,21)); text_handle = clabel(C,b); title('BSFC (g/kWh), 9.91kW (30%) Load, at 1500 rpm','FontSize',14); xlabel('Oxyhydrogen (L/min)','FontSize',13); ylabel('Water/Diesel Injection Rate','FontSize',13); saveas(gcf , 'bsfc_1_contour.jpg')
figure; set(gcf,'Position',screen_current); [C,b] =
contourf(X1,Y1,Z_egt1,linspace(floor(min(min(Z_egt1/10)))*10,... ceil(max(max(Z_egt1/10)))*10,11));

74
text_handle = clabel(C,b); title('Exhaust Temperature (C), 9kW (~30%) Load, at 3000
rpm','FontSize',14); xlabel('Oxyhydrogen (L/min)','FontSize',13); ylabel('Water/Diesel Injection Rate','FontSize',13); saveas(gcf , 'egt_1_contour.jpg');
figure; set(gcf,'Position',screen_current); axis([0 6 0 0.5]) surf(X1,Y1,Z1); % interpolated axis tight; % hold on % mesh(X1,Y1,base_1_BSFC); hold on; plot3(x1,y1,load_1_data(:,diesel_col),'.','MarkerSize',13) title('BSFC (g/kWh), 9.91kW (30%) Load, at 1500 rpm','FontSize',14); xlabel('Oxyhydrogen (L/min)','FontSize',13); ylabel('Water/Diesel Injection Rate','FontSize',13); zlabel('BSFC (g/kWh)','FontSize',13); saveas(gcf , 'bsfc_1_surf.jpg')
k = k+1; screen_current = scrn_init_loc + k*scrn_offset; % End load 1
%% Load 2: 3D graph for non-uniform data
figure; set(gcf,'Position',screen_current); %axis([0 6 0 0.5]) [C,b] = contourf(X1,Y1,Z2,linspace(floor(min(min(Z2/10)))*10,... ceil(max(max(Z2/10)))*10,21)); text_handle = clabel(C,b); title('BSFC (g/kWh), 19.1kW (58%) Load, at 1500 rpm','FontSize',14); xlabel('Oxyhydrogen (L/min)','FontSize',13); ylabel('Water/Diesel Injection Rate','FontSize',13); saveas(gcf , 'bsfc_2_contour.jpg')
figure; set(gcf,'Position',screen_current); [C,b] =
contourf(X1,Y1,Z_egt2,linspace(floor(min(min(Z_egt2/10)))*10,... ceil(max(max(Z_egt2/10)))*10,11)); text_handle = clabel(C,b); title('Exhaust Temperature (C), 19.1kW (58%) Load, at 1500
rpm','FontSize',14); xlabel('Oxyhydrogen (L/min)','FontSize',13); ylabel('Water/Diesel Injection Rate','FontSize',13); saveas(gcf , 'egt_2_contour.jpg');
figure; set(gcf,'Position',screen_current); axis([0 6 0 0.5]) surf(X1,Y1,Z2); % interpolated axis tight; hold on % mesh(X1,Y1,base_2_BSFC); % hold on;

75
plot3(x2,y2,load_2_data(:,diesel_col),'.','MarkerSize',13) title('BSFC (g/kWh), 19.1kW (58%) Load, at 1500 rpm','FontSize',14); xlabel('Oxyhydrogen (L/min)','FontSize',13); ylabel('Water/Diesel Injection Rate','FontSize',13); zlabel('BSFC (g/kWh)','FontSize',13); saveas(gcf , 'bsfc_2_surf.jpg')
k = k+1; screen_current = scrn_init_loc + k*scrn_offset; % End load 2
%% Load 3: 3D graph for non-uniform data
figure; set(gcf,'Position',screen_current); [C,b] = contourf(X1,Y1,Z3,linspace(floor(min(min(Z3/10)))*10,... ceil(max(max(Z3/10)))*10,21)); text_handle = clabel(C,b); title('BSFC (g/kWh), 28kW (~90%) Load, at 3000 rpm','FontSize',14); xlabel('Oxyhydrogen (L/min)','FontSize',13); ylabel('Water/Diesel Injection Rate','FontSize',13); saveas(gcf , 'bsfc_3_contour.jpg')
figure; set(gcf,'Position',screen_current); [C,b] =
contourf(X1,Y1,Z_egt3,linspace(floor(min(min(Z_egt3/10)))*10,... ceil(max(max(Z_egt3/10)))*10,11)); text_handle = clabel(C,b); title('Exhaust Temperature (C), 27kW (~90%) Load, at 3000
rpm','FontSize',14); xlabel('Oxyhydrogen (L/min)','FontSize',13); ylabel('Water/Diesel Injection Rate','FontSize',13); saveas(gcf , 'egt_3_contour.jpg');
figure; set(gcf,'Position',screen_current); axis([0 6 0 0.5]) surf(X1,Y1,Z3); % interpolated axis tight; hold on % mesh(X1,Y1,base_3_BSFC); % hold on; plot3(x3,y3,load_3_data(:,diesel_col),'.','MarkerSize',13) title('BSFC (g/kWh), 28kW (~90%) Load, at 3000 rpm','FontSize',14); xlabel('Oxyhydrogen (L/min)','FontSize',13); ylabel('Water/Diesel Injection Rate','FontSize',13); zlabel('BSFC (g/kWh)','FontSize',13); saveas(gcf , 'bsfc_3_surf.jpg')
k = k+1; screen_current = scrn_init_loc + k*scrn_offset; % End load 3 % clc %% Print to Command Window results base_BSFC(1) = base_1_data(end,1); base_BSFC(2) = base_2_data(end,1); base_BSFC(3) = base_3_data(end,1); lowest_BSFC(1) = min(min(Z1)); lowest_BSFC(2) = min(min(Z2)); lowest_BSFC(3) = min(min(Z3));

76
[r1,c1] = find(Z1 == min(min(Z1))); [r2,c2] = find(Z2 == min(min(Z2))); [r3,c3] = find(Z3 == min(min(Z3))); Opt_HHO_vol(1) = X1(1,c1); Opt_HHO_vol(2) = X1(1,c2); Opt_HHO_vol(3) = X1(1,c3); %LPM of HHO produced/ kg hr^-1 diesel consumed Opt_HHO_rate = Opt_HHO_vol ./ [9 18 27]; Opt_H2O_rate(1) = Y1(r1,1); Opt_H2O_rate(2) = Y1(r2,1); Opt_H2O_rate(3) = Y1(r3,1); BSFC_reduction = 100.*(1-lowest_BSFC./base_BSFC);
for i=1:3 fprintf('\n%1.0ikW Load (%2.2g%%):\n',i*9,i*30) fprintf('Base line BSFC: %5.4g g/kWh\n',base_BSFC(i)) fprintf('Optimized BSFC: %5.4g g/kWh\n', lowest_BSFC(i)) fprintf('Optimized HHO/diesel volume: %3.3g L/min\n',Opt_HHO_vol(i)) fprintf('Optimized HHO/diesel ratio: %3.3g
(L/min)/(g/Hr)\n',Opt_HHO_rate(i)) fprintf('Optimized water mist/diesel ratio: %4.3g
(g/Hr)/(g/Hr)\n',Opt_H2O_rate(i)) fprintf('Expected reduction in fuel consumption:
%3.3g%%\n',BSFC_reduction(i)) end save('main_test_data')

77
References
[1] A. C. Yilmaz, E. Uludamar, and K. Aydin, "Effect of hydroxy (HHO) gas
addition on performance and exhaust emissions in compression ignition
engines," International Journal of Hydrogen Energy, vol. 35, pp. 11366-
11372, 2010.
[2] S. Bari and M. M. Esmaeil, "Effect of H2/O2 addition in increasing the
thermal efficiency of a diesel engine," Fuel, vol. 89, pp. 378-383, 2010.
[3] A. Birtas, I. Voicu, C. Petcu, R. Chiriac, and N. Apostolescu, "The effect of
HRG gas addition on diesel engine combustion characteristics and exhaust
emissions," International Journal of Hydrogen Energy, vol. 36, pp. 12007-
12014, 2011.
[4] C. Eckman, "Plasma orbital expansion of the electrons in water," Proc. NPA,
vol. 7, pp. 142-144, 2010.
[5] R. M. Santilli, "A new gaseous and combustible form of water,"
International Journal of Hydrogen Energy, vol. 31, pp. 1113-1128, 2006.
[6] R. Adnan, H. Masjuki, and T. Mahlia, "An experimental investigation of
unmodified DI diesel engine with hydrogen addition," 2009, pp. 45-49.
[7] P. K. Bose and D. Maji, "An experimental investigation on engine
performance and emissions of a single cylinder diesel engine using hydrogen
as inducted fuel and diesel as injected fuel with exhaust gas recirculation,"
International Journal of Hydrogen Energy, vol. 34, pp. 4847-4854, 2009.
[8] T. Miyamoto, H. Hasegawa, M. Mikami, N. Kojima, H. Kabashima, and Y.
Urata, "Effect of hydrogen addition to intake gas on combustion and exhaust
emission characteristics of a diesel engine," International Journal of
Hydrogen Energy, 2011.
[9] G. K. Lilik, H. Zhang, J. M. Herreros, D. C. Haworth, and A. L. Boehman,
"Hydrogen assisted diesel combustion," International Journal of Hydrogen
Energy, vol. 35, pp. 4382-4398, 2010.
[10] X. Tauzia, A. Maiboom, and S. R. Shah, "Experimental study of inlet
manifold water injection on combustion and emissions of an automotive
direct injection Diesel engine," Energy, vol. 35, pp. 3628-3639, 2010.
[11] (2001, 8 May 2012). Hydrogen Properties.
[12] (2011, 9th June 2011). Understanding Diesel Water-Methanol Injection.
Available: http://www.motortopia.com/dieselworld/tech/understanding-
diesel-water-methanol-injection-2580/
[13] K. Zeng and D. Zhang, "Recent progress in alkaline water electrolysis for
hydrogen production and applications," Progress in Energy and Combustion
Science, vol. 36, pp. 307-326, 2010.
[14] T. Ranta. (2006, 22 August 2012). High-efficiency series-cell electrolyzer
[PDF].
[15] "Energy in Australia 2011," D. of and E. a. T. Resources, Eds., ed. Canberra:
Australian Bureau of Agriculture and Resource Economics and Sciences,
2011.
[16] M. P. Walsh, "Global Trends in Diesel Emissions Regulation-A 2001
Update," SAE paper, pp. 01-0183, 2001.
[17] C. T. Bowman, "Control of combustion-generated nitrogen oxide emissions:
technology driven by regulation," 1992, pp. 859-878.
[18] J. Wall, "Affirmative Expert Report," 2010.

78
Related Documents