BioMed Central Page 1 of 14 (page number not for citation purposes) BMC Neuroscience Open Access Research article A role for cryptochromes in sleep regulation Jonathan P Wisor 1 , Bruce F O'Hara 2 , Akira Terao 3 , Chris P Selby 4 , Thomas S Kilduff 3 , Aziz Sancar 4 , Dale M Edgar* 1 and Paul Franken 2 Address: 1 Dept. of Psychiatry and Behavioral Sciences, Stanford University School of Medicine, Stanford, CA, USA, 2 Dept. of Biological Sciences, Stanford University, Stanford, CA, USA, 3 Molecular Neurobiology Laboratory, SRI International, Menlo Park, CA, USA and 4 Dept. of Biochemistry and Biophysics, University of North Carolina School of Medicine, Chapel Hill, NC, USA Email: Jonathan P Wisor - [email protected]; Bruce F O'Hara - [email protected]; Akira Terao - [email protected]; Chris P Selby - [email protected]; Thomas S Kilduff - [email protected]; Aziz Sancar - [email protected]; Dale M Edgar* - [email protected]; Paul Franken - [email protected] * Corresponding author circadian genesoscillatory network of transcriptional factorsEEG slow-wave activity Abstract Background: The cryptochrome 1 and 2 genes (cry1 and cry2) are necessary for the generation of circadian rhythms, as mice lacking both of these genes (cry1,2 -/- ) lack circadian rhythms. We studied sleep in cry1,2 -/- mice under baseline conditions as well as under conditions of constant darkness and enforced wakefulness to determine whether cryptochromes influence sleep regulatory processes. Results: Under all three conditions, cry1,2 -/- mice exhibit the hallmarks of high non-REM sleep (NREMS) drive (i.e., increases in NREMS time, NREMS consolidation, and EEG delta power during NREMS). This unexpected phenotype was associated with elevated brain mRNA levels of period 1 and 2 (per1,2), and albumin d-binding protein (dbp), which are known to be transcriptionally inhibited by CRY1,2. To further examine the relationship between circadian genes and sleep homeostasis, we examined wild type mice and rats following sleep deprivation and found increased levels of per1,2 mRNA and decreased levels of dbp mRNA specifically in the cerebral cortex; these changes subsided with recovery sleep. The expression of per3, cry1,2, clock, npas2, bmal1, and casein-kinase- 1ε did not change with sleep deprivation. Conclusions: These results indicate that mice lacking cryptochromes are not simply a genetic model of circadian arrhythmicity in rodents and functionally implicate cryptochromes in the homeostatic regulation of sleep. Background Sleep is regulated by both circadian and homeostatic mechanisms. As a consequence of a signal from the circa- dian clock, located in the suprachiasmatic nuclei (SCN) of the anterior hypothalamus in mammals [1], sleep is more likely to occur at certain times of the 24-h day than others, thereby determining the daily sleep-wake distribution [2]. Sleep is homeostatically regulated in the sense that sleep drive accumulates in the absence of sleep and decreases during sleep. Changes in sleep drive are thus driven by the sleep-wake history. Homeostatic and circadian mecha- nisms interact to determine the duration and quality of sleep and wakefulness [3–5]. Homeostatic regulation of sleep can still be observed in animals that lack circadian Published: 20 December 2002 BMC Neuroscience 2002, 3:20 Received: 12 November 2002 Accepted: 20 December 2002 This article is available from: http://www.biomedcentral.com/1471-2202/3/20 © 2002 Wisor et al; licensee BioMed Central Ltd. This is an Open Access article: verbatim copying and redistribution of this article are permitted in all media for any purpose, provided this notice is preserved along with the article's original URL.

Welcome message from author
This document is posted to help you gain knowledge. Please leave a comment to let me know what you think about it! Share it to your friends and learn new things together.
Transcript

BioMed CentralBMC Neuroscience
ss
Open AcceResearch articleA role for cryptochromes in sleep regulationJonathan P Wisor1, Bruce F O'Hara2, Akira Terao3, Chris P Selby4, Thomas S Kilduff3, Aziz Sancar4, Dale M Edgar*1 and Paul Franken2Address: 1Dept. of Psychiatry and Behavioral Sciences, Stanford University School of Medicine, Stanford, CA, USA, 2Dept. of Biological Sciences, Stanford University, Stanford, CA, USA, 3Molecular Neurobiology Laboratory, SRI International, Menlo Park, CA, USA and 4Dept. of Biochemistry and Biophysics, University of North Carolina School of Medicine, Chapel Hill, NC, USA
Email: Jonathan P Wisor - [email protected]; Bruce F O'Hara - [email protected]; Akira Terao - [email protected]; Chris P Selby - [email protected]; Thomas S Kilduff - [email protected]; Aziz Sancar - [email protected]; Dale M Edgar* - [email protected]; Paul Franken - [email protected]
* Corresponding author
circadian genesoscillatory network of transcriptional factorsEEG slow-wave activity
AbstractBackground: The cryptochrome 1 and 2 genes (cry1 and cry2) are necessary for the generation ofcircadian rhythms, as mice lacking both of these genes (cry1,2-/-) lack circadian rhythms. We studiedsleep in cry1,2-/- mice under baseline conditions as well as under conditions of constant darknessand enforced wakefulness to determine whether cryptochromes influence sleep regulatoryprocesses.
Results: Under all three conditions, cry1,2-/- mice exhibit the hallmarks of high non-REM sleep(NREMS) drive (i.e., increases in NREMS time, NREMS consolidation, and EEG delta power duringNREMS). This unexpected phenotype was associated with elevated brain mRNA levels of period 1and 2 (per1,2), and albumin d-binding protein (dbp), which are known to be transcriptionally inhibitedby CRY1,2. To further examine the relationship between circadian genes and sleep homeostasis,we examined wild type mice and rats following sleep deprivation and found increased levels ofper1,2 mRNA and decreased levels of dbp mRNA specifically in the cerebral cortex; these changessubsided with recovery sleep. The expression of per3, cry1,2, clock, npas2, bmal1, and casein-kinase-1ε did not change with sleep deprivation.
Conclusions: These results indicate that mice lacking cryptochromes are not simply a genetic modelof circadian arrhythmicity in rodents and functionally implicate cryptochromes in the homeostaticregulation of sleep.
BackgroundSleep is regulated by both circadian and homeostaticmechanisms. As a consequence of a signal from the circa-dian clock, located in the suprachiasmatic nuclei (SCN) ofthe anterior hypothalamus in mammals [1], sleep is morelikely to occur at certain times of the 24-h day than others,thereby determining the daily sleep-wake distribution [2].
Sleep is homeostatically regulated in the sense that sleepdrive accumulates in the absence of sleep and decreasesduring sleep. Changes in sleep drive are thus driven by thesleep-wake history. Homeostatic and circadian mecha-nisms interact to determine the duration and quality ofsleep and wakefulness [3–5]. Homeostatic regulation ofsleep can still be observed in animals that lack circadian
Published: 20 December 2002
BMC Neuroscience 2002, 3:20
Received: 12 November 2002Accepted: 20 December 2002
This article is available from: http://www.biomedcentral.com/1471-2202/3/20
© 2002 Wisor et al; licensee BioMed Central Ltd. This is an Open Access article: verbatim copying and redistribution of this article are permitted in all media for any purpose, provided this notice is preserved along with the article's original URL.
Page 1 of 14(page number not for citation purposes)

BMC Neuroscience 2002, 3 http://www.biomedcentral.com/1471-2202/3/20
rhythms after lesioning of the SCN [6–9], suggesting thatcircadian rhythms and sleep homeostasis are independentprocesses.
Homeostatic regulation of sleep can be quantified objec-tively after a period of enforced wakefulness (i.e., sleepdeprivation), although a similar relationship betweensleep parameters and spontaneous wakefulness can bequantified under baseline conditions as well [10,11]. Thecompensatory responses in time spent asleep, sleep con-solidation (i.e., sleep bout duration; [12]), and/or sleepintensity observed after an extended period of wakeful-ness are all taken as evidence that sleep drive is increasedduring wakefulness and thus that sleep is homeostaticallyregulated. Non-REM sleep (NREMS) intensity, quantifiedas EEG power in the delta frequency range (1–4 Hz), andNREMS consolidation are in a quantitative and predictiverelationship with sleep history: both variables increasewith the duration of prior wakefulness and subsequentlydecline during NREMS [3,4,10,12,13]. These variables arethus quantitative markers of NREMS homeostasis and arepresumed to reflect an underlying physiological drive forsleep [4].
The time constants describing the dynamics of the increas-ing NREMS drive during wakefulness and decreasingNREMS drive during NREMS [10,14] are compatible witha role for changes in gene expression in their regulation.Although past studies have shown that extended periodsof wakefulness cause changes in gene expression (for re-view see [15]), no causal relationship between changes ingene expression and sleep homeostasis has been identi-fied. A recent study in Drosophila melanogaster implicatestranscriptional regulation by the circadian gene cycle, a ho-molog of the mammalian bmal1 gene, in the homeostaticregulation of rest [16]. While rest in flies shares severalfeatures with sleep in mammals [17,18], it remains to bedetermined whether a similar role for BMAL1 or relatedtranscriptional regulators is necessary for the homeostaticregulation of sleep.
In both flies and mammals, circadian rhythms arethought to be generated by transcriptional/translationalfeedback loops comprising a network of transcriptionalregulators [19–21]. The core of this self-sustained molec-ular oscillation consists of positive and negative elements.In mammals, the positive elements are two basic helix-loop-helix (bHLH) PAS-domain-containing transcriptionfactors, CLOCK and BMAL1, that form heterodimers thatcan drive the transcription of three period (per) genes per1–3 and two cryptochromes (cry1,2). PER1,2 and CRY1,2 pro-teins suppress CLOCK:BMAL1-mediated transcriptionthereby forming the negative elements in the feedbackloop. Consistent with their central role in circadianrhythm generation, genetic inactivation of both crypto-
chromes (cry1,2-/-) results in circadian arrhythmicity inmice [22,23]. Given the widespread expression of the ele-ments of the molecular clock in the brain (and elsewhere)and the large number of genes regulated by bHLH-PAStranscription factors (e.g. [24]), the role of cryptochromesmay extend beyond circadian clock function. To deter-mine whether transcriptional regulation by CRY1,2 influ-ences the homeostatic regulation of sleep, we studiedsleep in cry1,2-/- mice under baseline conditions, underconditions of constant darkness, and after sleep depriva-tion (SD). The expression of circadian genes that are regu-lated by cryptochromes were evaluated in the brain ofcry1,2-/- mice and in sleep deprived wild type mice andrats.
ResultsSleep regulation in cry1,2-/- miceIn baseline conditions, wild type mice showed the sleep-wake distribution typical for this nocturnal species withhigh values of sleep in the light period and low values inthe dark period (Figure 1, Table 1). The sleep-wake distri-bution in cry1,2-/- mice was distinct from that of wild typecontrols (Figure 1) in that sleep variables did not differ be-tween the 12-h light (L) and dark (D) periods (Table 1).Nevertheless, as in wild type controls, the light-to-darktransition was accompanied by a pronounced decrease insleep time in cry1,2-/- mice (Figure 1).
During baseline, total daily NREMS time was significantlygreater in cry1,2-/- mice than in wild type mice (683 ± 25vs. 576 ± 12 min, P < 0.002, unpaired t-test), whereas thedaily time spent in REM sleep did not differ (118 ± 7 vs.113 ± 10 min). The difference between genotypes inNREMS time was present only in the dark period and notin the light (Table 1; Figure 1). Average NREMS bout du-ration, a measure of NREMS consolidation that is posi-tively correlated with a high homeostatic sleep pressure[13], was greater by 34% in cry1,2-/- mice relative to wildtype mice during the light period, and by 41% during thedark period (Table 1). Consistent with this increase insleep consolidation, NREMS delta power was significantlyhigher in cry1,2-/- than in cry1,2+/+ mice during most ofbaseline (Figure 1). This difference in EEG delta powerwas specific for NREMS and did not extend to other EEGfrequencies (Figure 2A), indicating that the increase indelta power is not due to a difference in EEG amplifica-tion. This state-specific EEG difference in delta power wasespecially evident at the wake-to-NREMS transition.cry1,2-/- mice exhibited higher delta power values thancry1,2+/+ immediately after the onset of NREMS (Figure2B).
The same genotypic differences in sleep were observed inconstant dark (DD) conditions (Figure 3). Mice lackingcry1,2 spent more time in NREMS (719 ± 29 vs. 629 ± 29
Page 2 of 14(page number not for citation purposes)

BMC Neuroscience 2002, 3 http://www.biomedcentral.com/1471-2202/3/20
Figure 1Time course of sleep (upper panels) and NREMS EEG delta power (lower panel). Data from baseline (BSL), sleep deprivation (SD), and recovery (REC) are shown. Open (Cry1,2-/-) and closed (Cry1,2+/+) symbols designate mean hourly values ± 1 SEM. In the lower panel, thicker lines connect mean predicted delta power values based on the sleep-wake distribution in individual mice; (see Methods). Triangles mark intervals in which recovery values differed from corresponding baseline values within each genotype (triangle orientation designates direction of deviation; P < 0.05, post-hoc paired t-tests). Gray bars at the bottom of each panel mark intervals with significant genotype differences (P < 0.05, post-hoc t-tests). The baseline dark period was depicted twice to illustrate the changes at the dark-to-light transition.
Page 3 of 14(page number not for citation purposes)

BMC Neuroscience 2002, 3 http://www.biomedcentral.com/1471-2202/3/20
min, P = 0.053, unpaired t-test), NREMS bouts were long-er (3.8 ± 0.3 vs. 2.6 ± 0.1 min, P < 0.001, unpaired t-test),and EEG delta power in NREMS was higher in cry1,2-/-
compared to cry1,2+/+ controls (594 ± 21 vs. 448 ± 52 µV2/0.1 Hz, P < 0.04, unpaired t-test; Figure 3). The decrease insleep time prior to the onset of the dark period (Figure 1)was still present in DD in cry1,2+/+ mice; sleep time de-creased in the latter half of the subjective day and mini-mum average sleep time was reached immediately afterthe onset of the subjective night (Figure 3). The anticipa-tory decrease in sleep time that occurred prior to the onsetof dark in cry1,2-/- mice in LD did not occur under DDconditions (Figure 3). Under DD conditions, less REMSwas present in cry1,2-/- mice than in cry1,2+/+ mice (119 ±7 vs. 149 ± 9 min, P < 0.03, unpaired t-test) due to an in-crease in REMS in cry1,2+/+ mice in DD (149 ± 9 min) rel-ative to LD (113 ± 10 min, P < 0.03, paired t-test).
To further investigate the homeostatic regulation of sleepin cry1,2-/- mice, we assayed the compensatory response toa 6 h SD (see Figure 1). After SD, wild type mice displayedthe typical increase in REMS and NREMS time, NREMSbout duration, and EEG delta power above baseline levels([10,13] Table 2, Figure 1). In contrast, cry1,2-/- mice didnot exhibit significant increases in REMS, NREMS time orNREMS bout duration after SD; only a brief increase inNREMS delta power was observed (lasting 1 h in cry1,2-/-
vs. 5 h in wild type mice; Figure 1). The initial increase indelta power (relative to baseline), measured over the firstrecovery hour, was significantly smaller in cry1,2-/- thanthe increase observed in wild type mice (Table 2). Deltapower (Figure 1, Table 2) and NREMS bout duration (Ta-
bles 1, 2), in cry1,2-/- mice is maintained at a level only at-tained by the wild type mice when their sleep pressure washighest, i.e., at the end of the active or dark period and af-ter SD.
In wild type mice, EEG delta power still varied as a func-tion of the sleep-wake history with high values at the endof the baseline dark period and after the SD and low val-ues at the end of the light or major rest period (Figure 1).Presumably due to the altered sleep-wake distribution, thedaily range of EEG delta power values was smaller incry1,2-/- mice than in wild type mice (Table 1, Figure 1).We tested the assumption of a relationship between deltapower and the sleep-wake history by using a mathemati-cal method that predicts the level of EEG delta power oc-curring in individual NREMS bouts based on the 42 hsequence of 10-sec behavioral state scores for individualanimals [10]. With this analytical tool, the time constantsof the increasing delta power during wakefulness and itsdecrease during NREMS are estimated. For both geno-types, delta power in both baseline and recovery from SDcould be reliably predicted on the basis of sleep-wake his-tory (Figure 1), which is underscored by the highly signif-icant correlations between empirical and simulated data(r = 0.91 and 0.87 for cry1,2+/+ and cry1,2-/-, respectively,P < 0.0001 for both genotypes). Thus, in the absence ofcryptochromes, NREMS delta power varied as a function ofthe prior sleep-wake history. However, in cry1,2-/- mice, asignificantly shorter time constant for the increase (i.e., afaster build-up) of delta power was obtained (τincrease: 5.0± 0.3 h in cry1,2+/+ vs. 3.5 ± 0.5 h in cry1,2-/-; P < 0.05; un-
Table 1: Sleep in 12-h light and dark periods under baseline conditions in cry1,2+/+ and cry1,2-/- mice.
NREMS amount [%]
light dark Differencecry1,2+/+ 48.8 ± 1.9# 31.3 ± 2.3 17.5 ± 3.9cry1,2-/- 49.5 ± 1.9 45.4 ± 1.9* 4.2 ± 1.6*
NREMS bout duration [min]
light dark differencecry1,2+/+ 2.9 ± 0.2 2.9 ± 0.2 0.1 + 0.2cry1,2-/- 3.9 ± 0.2* 4.1 ± 0.4* -0.2 + 0.2
REMS amount [%]
light dark Differencecry1,2+/+ 11.9 ± 1.1# 3.8 ± 1.0 8.2 ± 1.5cry1,2-/- 8.5 ± 0.5* 7.8 ± 0.7* 0.8 ± 0.8*
Post-hoc comparisons: * P < 0.05 vs. wild type, unpaired t-tests; # P < 0.05 vs. dark period, within same genotype, paired t-tests. Differences repre-sent the mean of individual light-dark differences.
Page 4 of 14(page number not for citation purposes)

BMC Neuroscience 2002, 3 http://www.biomedcentral.com/1471-2202/3/20
Figure 2EEG power in the 1–20 Hz range for NREMS, REM sleep (REMS) and wake during baseline. (A) EEG spectral power in cry1,2-/- (thick lines) and wild type mice (thin lines). Differences between the genotypes are limited to NREMS delta power. (B) Delta power (1–4 Hz) during wake-to-NREMS transitions in the baseline light (left) and dark (right panel) period. Gray horizontal bars underneath the curves indicate significant genotype differences (P < 0.05; post-hoc t-tests). Error bars span ± 1 SEM.
FREQUENCY [Hz]5 10 15 20
0
200
400
600WT NREM
KO NREM
EE
G P
OW
ER
[µ
V2 /
0.1
Hz]
0100200300
FREQUENCY [Hz]5 10 15 20
0100200300
REMS
WAKE
NREMS
b
aD
ELT
A P
OW
ER
[µV
2 / 0.1
Hz]
200
300
400
500
600
700
TIME [Min]
-2 1 0 1 2 3
WAKE NREMS WAKE NREMS
TIME [Min]
-2 1 0 1 2 3
Page 5 of 14(page number not for citation purposes)
BMC Neuroscience 2002, 3 http://www.biomedcentral.com/1471-2202/3/20
Figure 3Time course of sleep and NREMS EEG delta power during constant dark conditions (DD). Layout and symbols are same as in Figure 1. Gray bars at the bottom of each panel mark intervals with significant genotype differences (P < 0.05, post-hoc t-tests). The subjective day is marked with a gray horizontal bar at the top of the upper panel. The first 12-h represents the last dark-period under baseline (BSL) light-dark conditions.
Page 6 of 14(page number not for citation purposes)
BMC Neuroscience 2002, 3 http://www.biomedcentral.com/1471-2202/3/20
paired t-test), whereas the time constant describing the de-cline of delta power during NREMS did not differ(τdecrease: 1.7 ± 0.2 h in cry1,2+/+ vs. 1.8 ± 0.3 h in cry1,2-/
-).
Circadian gene expression in the brain of cry1,2-/- miceDeletion of the cryptochromes disinhibits the transcription-al activation of CLOCK:BMAL1 and NPAS2:BMAL1 targetgenes, resulting in increased levels of their transcripts inthe SCN, liver, and retina [20,23,25]. We assayed the ex-pression in the brain of three genes that are known targetsof cryptochrome mediated transcriptional inhibition: albu-min D-binding protein (dbp [26]), period (per)1, and per2[20,23,27], in the middle of the daily light period. Con-firming the earlier studies in other tissues, mRNA levelsfor all three genes were higher in the brains of cry1,2-/-
mice compared to wild type mice (Figure 4). This relativeincrease was highly significant for all three genes (dbp,per1: 3.3-fold; per2: 5.6-fold; P < 0.0003, unpaired t-tests,n = 5/genotype).
Sleep deprivation-induced differences in circadian gene expressionMessenger RNA levels for per1,2, cry1,2, and dbp werequantified by RT-PCR in three brain areas (cerebral cortex,basal forebrain, and hypothalamus) from C57BL/6 mice
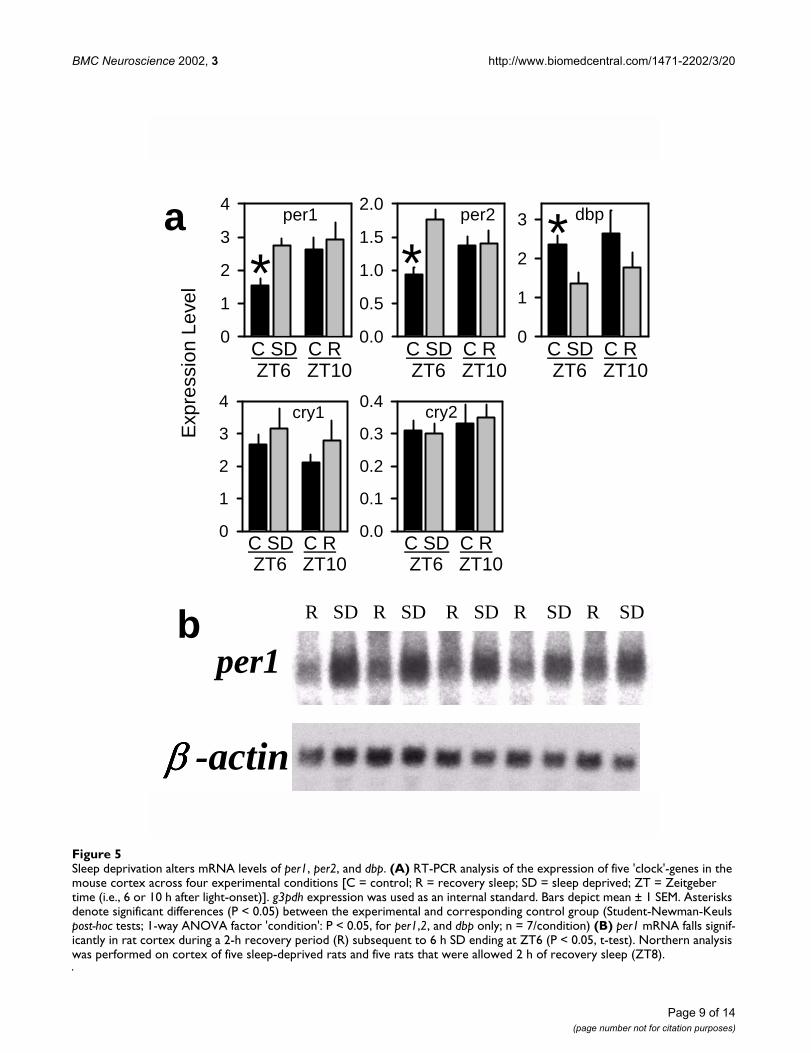
that were sacrificed immediately after 6 h of SD or after 4h of recovery sleep (ZT10). Significant differences in ex-pression were observed only in the cortex (Figure 5A) andnot in hypothalamus or basal forebrain (data not shown).Both per1 and per2 mRNA levels were higher immediatelyafter SD compared to controls, cry1,2 expression did notchange, and dbp mRNA decreased significantly (Figure5A). After 4 h of recovery sleep, per1,2 and dbp expressionreturned to the normal levels for that time of day (ZT10;Figure 5A). We also measured the expression of five othercircadian genes: bmal1, clock, npas2, per3, and casein kinase-1-ε (csnk1e) in the cortex; the levels of these five mRNAswere not affected by SD (data not shown).
As confirmation of our results in the mouse, we deter-mined the expression of per2 and per1 in the rat by RT-PCR and Northern analysis, respectively. In a similar ex-perimental paradigm, rats were sleep deprived for 6 h andthen either sacrificed immediately after the SD (ZT6), orafter 2 h of recovery sleep (ZT8; n = 5/group). The cortex-specific increase in per2 mRNA was confirmed by the RT-PCR analysis and, as in the mouse, per2 expression re-turned to basal levels after a period of recovery sleep (datanot shown). Northern analysis confirmed that recoverysleep was associated with a decline in per1 mRNA relative
Table 2: Effect of 6 h SD on sleep time and delta power in cry1,2+/+ and cry1,2-/- mice.
NREMS amount [min]
baseline post-SD differencecry1,2+/+ 264 ± 9 297 ± 15# 33 ± 8cry1,2-/- 312 ± 9* 318 ± 9 5 ± 4*
NREMS bout duration [min]
baseline post-SD differencecry1,2+/+ 2.6 ± 0.1 3.3 ± 0.3# 0.7 ± 0.3cry1,2-/- 4.2 ± 0.4* 3.7 ± 0.2 -0.4 ± 0.3*
NREMS Delta power [µV2/0.1 Hz]
baseline post-SD difference [%]cry1,2+/+ 407 ± 59 704 ± 125# 170 ± 14cry1,2-/- 619 ± 67* 805 ± 40# 134 ± 8*
REMS amount [min]
baseline post-SD differencecry1,2+/+ 52 ± 6 63 ± 3# 11 ± 7cry1,2-/- 53 ± 4 58 ± 1 5 ± 3
Post-hoc comparisons: * P < 0.05 vs. wild type, unpaired t-test; # P < 0.05, vs. baseline day, within same genotype, paired t-test. Delta power was calculated over the first hour after the SD (ZT6-ZT7). REMS and NREMS amount and bout duration were calculated over 12 hours (ZT6-ZT18). Differences indicate mean individual post-SD – baseline differences except for delta power which is calculated as percentage of baseline.
Page 7 of 14(page number not for citation purposes)

BMC Neuroscience 2002, 3 http://www.biomedcentral.com/1471-2202/3/20
Figure 4Whole-brain mRNA levels for dbp, per1, and per2 in cry1,2-/- and wild type mice. Levels of all three genes are elevated in cry1,2-/- mice (KO) relative to wild type (WT) controls at ZT6 when dbp, per1, and per2 mRNAs are lowest in the forebrain of wild type mice [37]. In the lower three panels mean (± 1 SEM) expression levels are depicted. β-actin expression was used as an internal standard.
KO WT KO WT KO WT KO WT KO WT
dbp
per1
per2
ββββ-actin
dbp
Exp
ress
ion
leve
l
0
1
2
WT KO
per1
0
1
2
3
4
WT KO
per2
0
1
2
3
WT KO
Page 8 of 14(page number not for citation purposes)
BMC Neuroscience 2002, 3 http://www.biomedcentral.com/1471-2202/3/20
Figure 5Sleep deprivation alters mRNA levels of per1, per2, and dbp. (A) RT-PCR analysis of the expression of five 'clock'-genes in the mouse cortex across four experimental conditions [C = control; R = recovery sleep; SD = sleep deprived; ZT = Zeitgeber time (i.e., 6 or 10 h after light-onset)]. g3pdh expression was used as an internal standard. Bars depict mean ± 1 SEM. Asterisks denote significant differences (P < 0.05) between the experimental and corresponding control group (Student-Newman-Keuls post-hoc tests; 1-way ANOVA factor 'condition': P < 0.05, for per1,2, and dbp only; n = 7/condition) (B) per1 mRNA falls signif-icantly in rat cortex during a 2-h recovery period (R) subsequent to 6 h SD ending at ZT6 (P < 0.05, t-test). Northern analysis was performed on cortex of five sleep-deprived rats and five rats that were allowed 2 h of recovery sleep (ZT8).
R SD R SD R SD R SD R SD
ββββ -actin
per1b
a per1
0
1
2
3
4per2
0.0
0.5
1.0
1.5
2.0dbp
0
1
2
3
* * *
C SD C R ZT6 ZT10
C SD C R ZT6 ZT10
C SD C R ZT6 ZT10
cry1
C SD C R ZT6 ZT10
0
1
2
3
4cry2
0.0
0.1
0.2
0.3
0.4
C SD C R ZT6 ZT10
Exp
ress
ion
Leve
l
Page 9 of 14(page number not for citation purposes)
BMC Neuroscience 2002, 3 http://www.biomedcentral.com/1471-2202/3/20
to the level of expression reached at the end of the SD (Fig-ure 5B).
DiscussionUpon release into constant darkness cry1,2-/- mice imme-diately become arrhythmic at the behavioral level [22,23],at the level of SCN electrophysiology [28], and at the cel-lular/molecular level [23]. Of the available mouse modelsfor circadian dysfunction, only per1,2 double mutant mice[29], bmal1 knockout mice [30], and mice with an abla-tion of the SCN [31] show a similarly dramatic pheno-type. Thus, cry1,2-/- mice appear to be a suitable model forstudies of the regulation of sleep in the absence of an in-tact circadian clock.
Under light / dark (LD) conditions, running wheel activitypatterns and, as we show here, the distribution of sleep incry1,2-/- mice still exhibit diurnal variation. LD cycles caninfluence the expression of sleep by entraining the circadi-an pacemaker that drives the diurnal rhythm of sleep and/or by directly affecting the expression of sleep, thereby'masking' the influence of the pacemaker on sleep. Mask-ing seems to be the mechanism by which light drives theserhythms under LD conditions in cry1,2-/- mice [22], sincethe daily modulation of NREMS that occurs in cry1,2-/-
mice under a light/dark cycle immediately disappearsupon placement in constant darkness ([22], Figure 3). Atthe molecular level, per2 expression (but not that of per1)is rhythmic in the SCN of cry1,2-/- mice under LD condi-tions. Upon release into constant dark conditions, per2rhythmicity disappears concomitant with the immediateloss of behavioral rhythmicity, suggesting a role for 'light-driven' per2 expression in generating behavioral rhythms[23].
The most striking and unexpected finding of the currentstudy is that, under baseline conditions, cry1,2-/- mice ex-hibit all the hallmarks of high NREMS pressure, includingmore consolidated NREMS, increased NREMS time, andhigher levels of EEG delta power relative to wild type micethat were attained immediately after NREMS onset. Thefailure of cry1,2-/- mice to exhibit a robust increase in anyof these measures after 6 h SD is consistent with the inter-pretation that these mice are already under high NREMSpressure during baseline conditions. Determination of thetime constants that most accurately describe the dynamicsof NREMS delta power revealed that during wake, the pro-pensity for high NREMS delta power increases duringwake in cry1,2-/- mice at a faster rate than in wild typemice. This could help explain why NREMS delta power ischronically high in cry1,2-/- mice. The coincidence of highNREMS time and chronically high delta power in cry1,2-/-
mice is all the more striking when one considers that dur-ing NREMS, the drive for NREMS should dissipate and re-sult in lower delta power [14,32].
These findings in cry1,2-/- mice contrast with the findingsof sleep studies in animals that are rendered arrhythmicby lesioning of the SCN. In nocturnal rodents, lesioningthe SCN results in more fragmented sleep, with lower EEGdelta power, but leaving the daily sleep time unchanged[6–8,31]. Lesioning the SCN in a diurnal primate, thesquirrel monkey, did result in an increase in NREMS time,but sleep was more fragmented, with a higher proportionof 'light' NREMS [5]; i.e., with lower overall levels of EEGdelta power. Furthermore, the homeostatic response tosleep deprivation does not seem to be altered in SCN-le-sioned rodents [6–8]. Thus, the sleep characteristics ofcry1,2-/- mice do not support the concept of cry1,2-/- miceas simply a genetic model for ablation of the circadianclock in the SCN. Together, these unexpected results arecompatible with a role for cryptochromes in the homeostat-ic regulation of sleep in addition to their role in generat-ing circadian rhythms.
Recent observations, including the current report, suggesta complex interrelationship between homeostatic and cir-cadian influences on sleep at the molecular level. Deletionof the cycle gene in Drosophila produces flies that have anexaggerated homeostatic response to rest deprivation inaddition to their lack of circadian rhythmicity [16]. In astriking parallel to our current results, flies with a muta-tion in the cryptochrome gene also exhibit increased resttime as well as a reduced compensatory response to restdeprivation (P. Shaw, personal communication). Theclock mutation in mice, which has a profound effect on cir-cadian rhythmicity [33], decreases NREMS time and con-solidation under baseline conditions [34]. The clock sleepphenotype is the inverse of the sleep characteristics we re-port here for the cry1,2-/- mice and is thus consistent withCLOCK and CRY1,2 being positive and negative transcrip-tional regulators, respectively. Albumin D-binding protein(Dbp) is a transcription factor whose expression is underthe direct transcriptional control of CLOCK:BMAL1 [26].Deletion of the dbp gene, which results in a shortening ofthe circadian period [35], also results in decreased sleepconsolidation and NREMS delta power [36].
We assume that the effects on sleep we observed in cry1,2-
/- mice are a result of a lack of cryptochrome-dependent in-hibition of the transcriptional activation provided by thebHLH-PAS heterodimers CLOCK:BMAL1 andNPAS2:BMAL1 [19,20,37], although cryptochromes alsoplay a role in stabilizing and nuclear sequestration of PERproteins [38], and in photoreception [39]. Lack of crypto-chromes results in increased mRNA levels of CLOCK/NPAS2:BMAL1 target genes, including the circadian genesper1 and per2 [20,23]. The expression of these two genes isviewed as a state variable of the molecular circadian clockor a marker of CLOCK/NPAS2:BMAL1-induced transcrip-tion, although at least per1 transcription can also be (rap-
Page 10 of 14(page number not for citation purposes)
BMC Neuroscience 2002, 3 http://www.biomedcentral.com/1471-2202/3/20
idly) induced by light [40,41], through a CREB-dependentsignaling pathway [42–44]. The observation of high brainlevels of per1,2 transcripts under baseline conditions incry1,2-/- mice raises the possibility that these or otherCLOCK/NPAS2:BMAL1 target genes are involved in thehomeostatic regulation of sleep. The observation of ele-vated per gene expression in the cortex of sleep-deprivedrats and mice (Figure 5) supports this hypothesis.
The increase in per expression after the sleep deprivationwas specific to the cerebral cortex, although it cannot beruled out, based on the present study, that circadian geneexpression changes with sleep-wake history in specific nu-clei within the other two regions examined; i.e., the hy-pothalamus and basal forebrain. A surprisingly smallnumber (~0.5%) of the ~10,000 genes screened by mRNAdifferential display and cDNA microarrays in the cortex todate change their expression with sleep deprivation [45].It is intriguing and encouraging that, of the initial geneswe assayed, three changed their expression with sleep dep-rivation (per1, per2, dbp), none of which were identified inthe aforementioned screens. cry1,2 expression at themRNA level did not change with sleep deprivation in wildtype mice. This observation does not necessarily obviate adirect role for CRY proteins in mediating a response tosleep deprivation. CRY poteins may play a role at steadystate levels or there may be post-translational changes inthe functioning of CRY proteins in association with sleepdeprivation, such as phosphorylation state, ubiquitina-tion [38], or intracellular localization [46] of the protein,all of which are regulated dynamically, at least in vitro. Inthe liver, CRY protein oscillations are not necessary for cir-cadian oscillations of target transcripts, as CRY proteinsare present in excess of PER and oscillations in the latterproduce rhythmicity [46]. A similar situation might existin the cortex.
The high per levels in cry1,2-/- mice and the low per levelsin clock mutant mice [26,47] correlate with their contrast-ing sleep phenotype (see above; [34]). In this context, thesleep abnormalities in dbp-/- mice might also be related toa reduction in per expression since, at least in vitro, DBPcan amplify the CLOCK:BMAL1-induced transcription ofper [48], but it is not known whether per transcript levelsare altered in dbp-/- mice. Apart from the present observa-tions in sleep-deprived rats and mice, several other reportsconfirm that cortical levels of per expression in wild typeanimals are high at times when sleep drive is high, irre-spective of the phase at which the circadian expression ofper peaks in the SCN. Thus, in both nocturnal and diurnalspecies, per expression in the cortex is maximal in con-junction with the major waking episode [37,49,50]. Un-der conditions where the phase (methamphetamineadministration, restricted feeding) or distribution (circa-dian splitting) of locomotor activity is altered, per expres-
sion in the cortex parallels the overt rhythm ofwakefulness, whereas the circadian oscillation of per geneexpression in the SCN remains unaffected [49,51,52].Thus, in contrast to its role in the SCN, PER protein in thecortex is not a component of a self-sustaining circadian os-cillator [53]. Instead, per expression in the cortex seems tothe follow sleep-wake history, consistent with the hypoth-esis that it is related to homeostatic regulation of sleep.However, in the current study and those cited above, theexpression of per genes was studied at the mRNA level.PER protein level may be affected differentially from thatof per mRNA and levels of the PER protein are reduced incry1,2-/- mice due to reduced stability of PER proteins inthe absence of heterodimerizing CRY partners [19,38,46].
ConclusionsIn the discussion, we have focused on per1,2 mRNAs astranscriptional targets of cry1,2 because the expressionpatterns of these circadian genes have been widely de-scribed and because their transcriptional control by CRYproteins and by CLOCK/NPAS2:BMAL1 has been well es-tablished. At least 90 genes are regulated in a similar fash-ion by NPAS2:BMAL1 [37] and the identity of the targetgenes critical for the NREMS phenotype in cry1,2-/- miceremains to be determined. In the absence of cry1,2, thestability and overall level of PER proteins, particularly inthe nucleus of the cell, is reduced [19,38,46]. It wouldtherefore be interesting to observe sleep in per1,2 singleand double mutant mice, the latter of which have beensubjected to behavioral observation [29] but not to sleepEEG studies. per1 single knockout mice and mice express-ing a non-functional PER2 protein both exhibit subtle dif-ferences from wild type in the homeostatic rebound afterSD [54], an observation compatible with the hypothesisthat these genes are correlates of sleep homeostasis. In ad-dition, measurement of the effects of sleep deprivation onthe expression of cry1,2 and per1,2 genes at the proteinlevel will provide critical information. Finally, from afunctional perspective, it is interesting that CLOCK/NPAS2:BMAL1 transcriptional activity is sensitive to re-dox state [24]. This transcriptional activity might thus pro-vide a link between neuronal activity and an energyregulatory function for NREMS, as has been suggested pre-viously [55].
MethodsSleep studiesMice were generated by mating cry1 and cry2 single knock-out mice, both of mixed background (ca. 3/4 C57BL/6 –1/4 129/Sv; [23]) to generate double heterozygotes thatwere interbred to generate double knockouts (cry1,2-/-)and wild type controls (cry1,2+/+). Eight wild type and 6cry1,2-/- male mice were surgically prepared for EEG andelectromyographic (EMG) recordings as described previ-ously [56]. Following two weeks of post-surgical recovery,
Page 11 of 14(page number not for citation purposes)

BMC Neuroscience 2002, 3 http://www.biomedcentral.com/1471-2202/3/20
mice were isolated for recordings in sound-attenuatedchambers. The experiments were conducted under anLD12:12 cycle (lights-on; i.e., Zeitgeber Time ZT0, at 0600h). Twenty-four hour baseline recordings, starting at ZT0,were followed by a 6 h sleep deprivation (SD) starting atZT0. The sleep deprivations in this experiment and theother two experiments (see below) were performed by theintroduction of novel objects into the cage or by gentlehandling. In addition to the SD experiment, animals weresubjected to one day of baseline recording in constantdarkness separated from the SD experiment by 72 hours.All experimental procedures complied with institutionaland NIH guidelines.
Digitized EEG and integrated EMG were stored in 10-s ep-ochs and classified as NREMS, REM sleep (REMS), orwakefulness by visual inspection. The EEG was subjectedto a Fast-Fourier-Transformation yielding power spectrabetween 0–20 Hz. Delta power was calculated as the aver-age EEG power in the delta (1–4 Hz) frequencies for ep-ochs scored as NREMS. For visual representation, hourlydelta-power values (Figure 1) were expressed relative to anindividual mean (i.e., 24-h baseline mean) before trans-forming back to absolute values to capture both the highlyreproducible individual time course of delta power andthe genotype differences in absolute values [10]. Statisticalevaluation of genotype differences were based, however,on the absolute EEG values. Post-SD delta power wascompared to baseline during the first hour of spontaneoussleep subsequent to SD, while NREMS amount and boutduration (Table 2) were compared over 12 hours (ZT6-ZT18), in accordance with the distinct dynamics of thecompensatory responses of these variables to SD [57].NREMS bouts were defined as periods of NREMS initiatedby three consecutive 10-second epochs of NREMS and ter-minated by three consecutive epochs not classified asNREMS. EEG delta power changes at transitions betweenwakefulness and NREMS were measured during thosetransitions characterized by at least 12 consecutive 10-sepochs of wake followed by at least 18 consecutive 10-ep-ochs of NREMS.
A mathematical algorithm was used to quantify the sleep-wake dependent dynamics of delta power during bothbaseline and recovery from SD [10]. In this algorithm, del-ta power decreases during NREMS and increases duringwakefulness according to saturating exponential func-tions, the time constants of which are estimated by mini-mizing the square of the differences between empirical(delta power) data and the values produced by the math-ematical functions. The two time constants (for the in-crease and decrease of delta power) that resulted in thesmallest deviation from empirical values within each indi-vidual were used to statistically assess genotype effect onthe dynamics of delta power [10].
Northern analysisFive cry1,2-/- mice and 5 wild type controls were sacrificedin the middle of the light period (ZT6). Brains were rapid-ly removed and frozen on dry ice. Total RNA was extractedand Northern analysis was performed with 10 µg wholebrain total RNA as previously described [58].
Ten Wistar rats were sleep deprived for 6 h beginning atlight-onset (ZT0). Five rats were sacrificed at ZT6 at theend of the SD and five were allowed to recover for 2 h fol-lowing the SD and were sacrificed at ZT8. Rats were mon-itored by EEG/EMG throughout this period as described[59]. Brains were rapidly removed, dissected and frozen,and Northern analysis performed.
Quantitative real-time Reverse-Transcriptase Polymerase-Chain-Reaction (RT-PCR) analysesFour experimental groups of male C57BL/6J mice werestudied: 1) sleep deprived from light-onset (ZT0) to ZT6;2) control mice for the SD group; 3) 6 h SD (ZT0-ZT6) fol-lowed by 4-h recovery sleep (ZT6-ZT10); and 4) controlmice for the recovery group (n = 7 mice/group). Animalswere sacrificed by decapitation. Brains were rapidly re-moved and the cerebral cortex, basal forebrain, and hy-pothalamus were dissected. After a mid-sagittal cut, theentire cortical tissue was peeled off and separated from thehippocampus and underlying diencephalon. Striatal tis-sue was also removed. From each animal, quantitativereal-time PCR determinations of 5 target genes (cry1,2,per1,2, and dbp) and a reference cDNA (glyceraldehyde-3-phosphate dehydrogenase, g3pdh) were made from thecortex, basal forebrain, and hypothalamus (primer/probesequences available upon request). For five other targets(bmal1, clock, npas2, per3, and csnk1e), expression wasquantified in the cortex only. To confirm the specificity ofthe nucleotide sequences chosen for the primers andprobes and the absence of DNA polymorphisms, BLASTNsearches were conducted against the dbEST and nonre-dundant set of Genbank, EMBL, and DDBJ databases.Dual color fluorescence was detected using an ABI Prism7700 Sequence Detection System (Perkin-Elmer Corp.,Foster City, CA). For each experimental sample, theamount of the target and g3pdh reference was determinedfrom the standard curve (range of 0.2–200 ng total RNA)measured in the same assay. A normalized value was ob-tained by dividing the target cDNA amount by the g3pdhreference. For details see [59].
Authors' contributionsCPS and AS generated the cry1,2-/- mice and providedsome preliminary data on microarray gene expressionprofiles in the brains of these mice. JPW and DME con-ceived and implemented sleep studies in cry1,2-/- mice. PFanalyzed sleep EEG data and conceived, with BFO, AT,and TSK, the molecular studies. BFO, AT, and TSK per-
Page 12 of 14(page number not for citation purposes)
BMC Neuroscience 2002, 3 http://www.biomedcentral.com/1471-2202/3/20
formed gene expression assays on brain tissues from miceand rats. JPW and PF drafted the manuscript. All authorsread and approved the manuscript.
AcknowledgmentsWe appreciate the generous gifts of cDNA clones from Drs. Ueli Schibler (dbp cDNA), Steven Reppert (per2 cDNA), and Hajime Tei (per1 cDNA). Funding was provided by the following NIH grants: HL64243 (JPW and DME), R01HL/MH59658 and R01MH61755 (AT and TSK), GM31082 (CPS and AS), and HL64148 and DA13349 (BFO and PF).
References1. Klein DC, Moore RY and Reppert SM Suprachiasmatic nucleus:
The mind's clock. New York: Oxford University Press 1991, 2. Edgar DM Functional role of the suprachiasmatic nuclei in the
regulation of sleep and wakefulness. In: Fatal Familial Insomnia: In-herited prion diseases, sleep and the thalamus (Edited by: Guilleminault C)New York: Raven Press, Ltd 1994, 203-213
3. Dijk DJ and Czeisler CA Contribution of the circadian pace-maker and the sleep homeostat to sleep propensity, sleepstructure, electroencephalographic slow waves, and sleepspindle activity in humans. J Neurosci 1995, 15:3526-38
4. Borbely AA and Achermann P Sleep homeostasis and models ofsleep regulation. In: Principles and practice in sleep medicine (Edited by:Kryger MH, Roth T, Dement WC) Philadelphia: W.B. Saunders 2000, 377-390
5. Edgar DM, Dement WC and Fuller CA Effect of SCN lesions onsleep in squirrel monkeys: evidence for opponent processesin sleep-wake regulation. J Neurosci 1993, 13:1065-79
6. Mistlberger RE, Bergmann BM, Waldenar W and Rechtschaffen A Re-covery sleep following sleep deprivation in intact and supra-chiasmatic nuclei-lesioned rats. Sleep 1983, 6:217-33
7. Tobler I, Borbely AA and Groos G The effect of sleep deprivationon sleep in rats with suprachiasmatic lesions. Neurosci Lett1983, 42:49-54
8. Trachsel L, Edgar DM, Seidel WF, Heller HC and Dement WC Sleephomeostasis in suprachiasmatic nuclei-lesioned rats: effectsof sleep deprivation and triazolam administration. Brain Res1992, 589:253-61
9. Wurts SW and Edgar DM Circadian and homeostatic control ofrapid eye movement (REM) sleep: promotion of REM ten-dency by the suprachiasmatic nucleus. J Neurosci 2000, 20:4300-10
10. Franken P, Chollet D and Tafti M The homeostatic regulation ofsleep need is under genetic control. J Neurosci 2001, 21:2610-21
11. Huber R, Deboer T and Tobler I Effects of sleep deprivation onsleep and sleep EEG in three mouse strains: empirical dataand simulations. Brain Res 2000, 857:8-19
12. Edgar DM and Seidel WF Modafinil induces wakefulness withoutintensifying motor activity or subsequent rebound hyper-somnolence in the rat. J Pharmacol Exp Ther 1997, 283:757-769
13. Franken P, Dijk DJ, Tobler I and Borbely AA Sleep deprivation inrats: effects on EEG power spectra, vigilance states, and cor-tical temperature. Am J Physiol 1991, 261:R198-208
14. Daan S, Beersma DG and Borbely AA Timing of human sleep: re-covery process gated by a circadian pacemaker. Am J Physiol1984, 246:R161-83
15. Cirelli C How sleep deprivation affects gene expression in thebrain: a review of recent findings. J Appl Physiol 2002, 92:394-400
16. Shaw PJ, Tononi G, Greenspan RJ and Robinson DF Stress responsegenes protect against lethal effects of sleep deprivation inDrosophila. Nature 2002, 417:287-91
17. Shaw PJ, Cirelli C, Greenspan RJ and Tononi G Correlates of sleepand waking in Drosophila melanogaster. Science 2000,287:1834-7
18. Hendricks JC, Finn SM, Panckeri KA, Chavkin J, Williams JA, Sehgal Aand Pack AI Rest in Drosophila is a sleep-like state. Neuron 2000,25:129-38
19. Kume K, Zylka MJ, Sriram S, Shearman LP, Weaver DR, Jin X, May-wood ES, Hastings MH and Reppert SM mCRY1 and mCRY2 areessential components of the negative limb of the circadianclock feedback loop. Cell 1999, 98:193-205
20. Shearman LP, Sriram S, Weaver DR, Maywood ES, Chaves I, Zheng B,Kume K, Lee CC, van der Horst GT and Hastings MH Interactingmolecular loops in the mammalian circadian clock. Science2000, 288:1013-9
21. Reppert SM and Weaver DR Molecular analysis of mammaliancircadian rhythms. Annu Rev Physiol 2001, 63:647-76
22. van der Horst GT, Muijtjens M, Kobayashi K, Takano R, Kanno S,Takao M, de Wit J, Verkerk A, Eker AP and van Leenen D Mamma-lian Cry1 and Cry2 are essential for maintenance of circadianrhythms. Nature 1999, 398:627-30
23. Vitaterna MH, Selby CP, Todo T, Niwa H, Thompson C, Fruechte EM,Hitomi K, Thresher RJ, Ishikawa T and Miyazaki J Differential regu-lation of mammalian period genes and circadian rhythmicityby cryptochromes 1 and 2. Proc Natl Acad Sci U S A 1999, 96:12114-9
24. Rutter J, Reick M, Wu LC and McKnight SL Regulation of clock andNPAS2 DNA binding by the redox state of NAD cofactors.Science 2001, 293:510-4
25. Okamura H, Miyake S, Sumi Y, Yamaguchi S, Yasui A, Muijtjens M,Hoeijmakers JH and van der Horst GT Photic induction of mPer1and mPer2 in cry-deficient mice lacking a biological clock. Sci-ence 1999, 286:2531-4
26. Ripperger JA, Shearman LP, Reppert SM and Schibler U CLOCK, anessential pacemaker component, controls expression of thecircadian transcription factor DBP. Genes Dev 2000, 14:679-89
27. Griffin EA Jr, Staknis D and Weitz CJ Light-independent role ofCRY1 and CRY2 in the mammalian circadian clock. Science1999, 286:768-71
28. Albus H, Bonnefont X, Chaves I, Yasui A, Doczy J, van der Horst GTand Meijer JH Cryptochrome-deficient mice lack circadianelectrical activity in the suprachiasmatic nuclei. Current biology: CB 2002, 12(13):1130-3
29. Zheng B, Albrecht U, Kaasik K, Sage M, Lu W, Vaishnav S, Li Q, SunZS, Eichele G and Bradley A Nonredundant roles of the mPer1and mPer2 genes in the mammalian circadian clock. Cell 2001,105:683-94
30. Bunger MK, Wilsbacher LD, Moran SM, Clendenin C, Radcliffe LA,Hogenesch JB, Simon MC, Takahashi JS and Bradfield CA Mop3 is anessential component of the master circadian pacemaker inmammals. Cell 2000, 103:1009-17
31. Ibuka N, Nihonmatsu I and Sekiguchi S Sleep-wakefulnessrhythms in mice after suprachiasmatic nucleus lesions. Wak-ing Sleeping 1980, 4:167-73
32. Borbely AA A two process model of sleep regulation. Hum Neu-robiol 1982, 1:195-204
33. Vitaterna MH, King DP, Chang AM, Kornhauser JM, Lowrey PL, Mc-Donald JD, Dove WF, Pinto LH, Turek FW and Takahashi JS Muta-genesis and mapping of a mouse gene, Clock, essential forcircadian behavior. Science 1994, 264:719-725
34. Naylor E, Bergmann BM, Krauski K, Zee PC, Takahashi JS, VitaternaMH and Turek FW The circadian clock mutation alters sleephomeostasis in the mouse. J Neurosci 2000, 20:8138-43
35. Lopez-Molina L, Conquet F, Dubois-Dauphin M and Schibler U TheDBP gene is expressed according to a circadian rhythm inthe suprachiasmatic nucleus and influences circadian behav-ior. Embo J 1997, 16:6762-71
36. Franken P, Lopez-Molina L, Marcacci L, Schibler U and Tafti M Thetranscription factor DBP affects circadian sleep consolida-tion and rhythmic EEG activity. J Neurosci 2000, 20:617-25
37. Reick M, Garcia JA, Dudley C and McKnight SL NPAS2: an analogof clock operative in the mammalian forebrain. Science 2001,293:506-9
38. Yagita K, Tamanini F, Yasuda M, Hoeijmakers JH, van Der Horst GTand Okamura H Nucleocytoplasmic shuttling and mCRY-de-pendent inhibition of ubiquitylation of the mPER2 clock pro-tein. Embo J 2002, 21:1301-1314
39. Selby C, Thompson C, Schmitz T, Van Gelder R and S A Functionalredundancy of cryptochrome and classical photoreceptors fornonvisual ocular photoreception in mice. Proc Natl Acad Sci, USA2000,
40. Albrecht U, Sun ZS, Eichele G and Lee CC A differential responseof two putative mammalian circadian regulators, mper1 andmper2, to light. Cell 1997, 91:1055-1064
41. Shigeyoshi Y, Taguchi K, Yamamoto S, Takekida S, Yan L, Tei H, Mori-ya T, Shibata S, Loros JJ and Dunlap JC Light-induced resetting of
Page 13 of 14(page number not for citation purposes)
http://www.ncbi.nlm.nih.gov/entrez/query.fcgi?cmd=Retrieve&db=PubMed&dopt=Abstract&list_uids=7751928
http://www.ncbi.nlm.nih.gov/entrez/query.fcgi?cmd=Retrieve&db=PubMed&dopt=Abstract&list_uids=7751928
http://www.ncbi.nlm.nih.gov/entrez/query.fcgi?cmd=Retrieve&db=PubMed&dopt=Abstract&list_uids=7751928
http://www.ncbi.nlm.nih.gov/entrez/query.fcgi?cmd=Retrieve&db=PubMed&dopt=Abstract&list_uids=8441003
http://www.ncbi.nlm.nih.gov/entrez/query.fcgi?cmd=Retrieve&db=PubMed&dopt=Abstract&list_uids=8441003
http://www.ncbi.nlm.nih.gov/entrez/query.fcgi?cmd=Retrieve&db=PubMed&dopt=Abstract&list_uids=8441003
http://www.ncbi.nlm.nih.gov/entrez/query.fcgi?cmd=Retrieve&db=PubMed&dopt=Abstract&list_uids=6622879
http://www.ncbi.nlm.nih.gov/entrez/query.fcgi?cmd=Retrieve&db=PubMed&dopt=Abstract&list_uids=6622879
http://www.ncbi.nlm.nih.gov/entrez/query.fcgi?cmd=Retrieve&db=PubMed&dopt=Abstract&list_uids=6622879
http://www.ncbi.nlm.nih.gov/entrez/query.fcgi?cmd=Retrieve&db=PubMed&dopt=Abstract&list_uids=6657146
http://www.ncbi.nlm.nih.gov/entrez/query.fcgi?cmd=Retrieve&db=PubMed&dopt=Abstract&list_uids=6657146
http://www.ncbi.nlm.nih.gov/entrez/query.fcgi?cmd=Retrieve&db=PubMed&dopt=Abstract&list_uids=1393593
http://www.ncbi.nlm.nih.gov/entrez/query.fcgi?cmd=Retrieve&db=PubMed&dopt=Abstract&list_uids=1393593
http://www.ncbi.nlm.nih.gov/entrez/query.fcgi?cmd=Retrieve&db=PubMed&dopt=Abstract&list_uids=1393593
http://www.ncbi.nlm.nih.gov/entrez/query.fcgi?cmd=Retrieve&db=PubMed&dopt=Abstract&list_uids=9353396
http://www.ncbi.nlm.nih.gov/entrez/query.fcgi?cmd=Retrieve&db=PubMed&dopt=Abstract&list_uids=9353396
http://www.ncbi.nlm.nih.gov/entrez/query.fcgi?cmd=Retrieve&db=PubMed&dopt=Abstract&list_uids=9353396
http://www.ncbi.nlm.nih.gov/entrez/query.fcgi?cmd=Retrieve&db=PubMed&dopt=Abstract&list_uids=1858947
http://www.ncbi.nlm.nih.gov/entrez/query.fcgi?cmd=Retrieve&db=PubMed&dopt=Abstract&list_uids=1858947
http://www.ncbi.nlm.nih.gov/entrez/query.fcgi?cmd=Retrieve&db=PubMed&dopt=Abstract&list_uids=1858947
http://www.ncbi.nlm.nih.gov/entrez/query.fcgi?cmd=Retrieve&db=PubMed&dopt=Abstract&list_uids=6696142
http://www.ncbi.nlm.nih.gov/entrez/query.fcgi?cmd=Retrieve&db=PubMed&dopt=Abstract&list_uids=6696142
http://www.ncbi.nlm.nih.gov/entrez/query.fcgi?cmd=Retrieve&db=PubMed&dopt=Abstract&list_uids=7190752
http://www.ncbi.nlm.nih.gov/entrez/query.fcgi?cmd=Retrieve&db=PubMed&dopt=Abstract&list_uids=7190752
http://www.ncbi.nlm.nih.gov/entrez/query.fcgi?cmd=Retrieve&db=PubMed&dopt=Abstract&list_uids=7185792
http://www.ncbi.nlm.nih.gov/entrez/query.fcgi?cmd=Retrieve&db=PubMed&dopt=Abstract&list_uids=8171325
http://www.ncbi.nlm.nih.gov/entrez/query.fcgi?cmd=Retrieve&db=PubMed&dopt=Abstract&list_uids=8171325
http://www.ncbi.nlm.nih.gov/entrez/query.fcgi?cmd=Retrieve&db=PubMed&dopt=Abstract&list_uids=8171325
http://www.ncbi.nlm.nih.gov/entrez/query.fcgi?cmd=Retrieve&db=PubMed&dopt=Abstract&list_uids=9362490
http://www.ncbi.nlm.nih.gov/entrez/query.fcgi?cmd=Retrieve&db=PubMed&dopt=Abstract&list_uids=9362490

BMC Neuroscience 2002, 3 http://www.biomedcentral.com/1471-2202/3/20
Publish with BioMed Central and every scientist can read your work free of charge
"BioMed Central will be the most significant development for disseminating the results of biomedical research in our lifetime."
Sir Paul Nurse, Cancer Research UK
Your research papers will be:
available free of charge to the entire biomedical community
peer reviewed and published immediately upon acceptance
cited in PubMed and archived on PubMed Central
yours — you keep the copyright
Submit your manuscript here:http://www.biomedcentral.com/info/publishing_adv.asp
BioMedcentral
a mammalian circadian clock is associated with rapid induc-tion of the mPer1 transcript. Cell 1997, 91:1043-1053
42. Yokota S, Yamamoto M, Moriya T, Akiyama M, Fukunaga K, Miyamo-to E and Shibata S Involvement of calcium-calmodulin proteinkinase but not mitogen-activated protein kinase in light-in-duced phase delays and Per gene expression in the suprach-iasmatic nucleus of the hamster. J Neurochem 2001, 77:618-27
43. Tischkau SA, Mitchell JW, Tyan SH, Buchanan GF and Gillette MUCREB-dependent activation of Per1 is required for light-in-duced signaling in the suprachiasmatic nucleus circadianclock. J Biol Chem 2002,
44. Gau D, Lemberger T, von Gall C, Kretz O, Le Minh N, Gass P, SchmidW, Schibler U, Korf HW and Schutz G Phosphorylation of CREBSer142 regulates light-induced phase shifts of the circadianclock. Neuron 2002, 34:245-53
45. Cirelli C and Tononi G Gene expression in the brain across thesleep-waking cycle. Brain Res 2000, 885:303-21
46. Lee C, Etchegaray JP, Cagampang FR, Loudon AS and Reppert SMPosttranslational mechanisms regulate the mammalian cir-cadian clock. Cell 2001, 107:855-67
47. Oishi K, Fukui H and Ishida N Rhythmic expression of BMAL1mRNA is altered in Clock mutant mice: differential regula-tion in the suprachiasmatic nucleus and peripheral tissues. Bi-ochem Biophys Res Commun 2000, 268:164-71
48. Yamaguchi S, Mitsui S, Yan L, Yagita K, Miyake S and Okamura H Roleof DBP in the circadian oscillatory mechanism. Mol Cell Biol2000, 20:4773-81
49. Abe H, Honma S, Namihira M, Masubuchi S and Honma K Behav-ioural rhythm splitting in the CS mouse is related to clockgene expression outside the suprachiasmatic nucleus. Eur JNeurosci 2001, 14:1121-8
50. Mrosovsky N, Edelstein K, Hastings MH and Maywood ES Cycle ofperiod gene expression in a diurnal mammal (Spermophilustridecemlineatus): implications for nonphotic phase shifting.J Biol Rhythms 2001, 16:471-8
51. Masubuchi S, Honma S, Abe H, Ishizaki K, Namihira M, Ikeda M andHonma K Clock genes outside the suprachiasmatic nucleus in-volved in manifestation of locomotor activity rhythm in rats.Eur J Neurosci 2000, 12:4206-14
52. Wakamatsu H, Yoshinobu Y, Aida R, Moriya T, Akiyama M and Shiba-ta S Restricted-feeding-induced anticipatory activity rhythmis associated with a phase-shift of the expression of mPer1and mPer2 mRNA in the cerebral cortex and hippocampusbut not in the suprachiasmatic nucleus of mice. Eur J Neurosci2001, 13:1190-6
53. Abe M, Herzog ED, Yamazaki S, Straume M, Tei H, Sakaki Y, MenakerM and Block GD Circadian rhythms in isolated brain regions. JNeurosci 2002, 22:350-6
54. Kopp C, Albrecht U, Zheng B and Tobler I Homeostatic sleep reg-ulation is preserved in mPer1 and mPer2 mutant mice. Eur JNeurosci 2002, 16:1099-106
55. Benington JH and Heller HC Restoration of brain energy metab-olism as the function of sleep. Prog Neurobiol 1995, 45:347-360
56. Edgar DM, Kilduff TS, Martin CE and Dement WC Influence of run-ning wheel activity on free-running sleep/wake and drinkingcircadian rhythms in mice. Physiol Behav 1991, 50:373-378
57. Franken P, Malafosse A and Tafti M Genetic determinants ofsleep regulation in inbred mice. Sleep 1999, 22:155-69
58. O'Hara BF, Watson FL, Srere HK, Kumar H, Wiler SW, Welch SK,Bitting L, Heller HC and Kilduff TS Gene expression in the brainacross the hibernation cycle. J Neurosci 1999, 19:3781-90
59. Terao A, Peyron C, Ding J, Wurts SW, Edgar DM, Heller HC andKilduff TS Prepro-hypocretin (prepro-orexin) expression isunaffected by short-term sleep deprivation in rats and mice.Sleep 2000, 23:867-74
Page 14 of 14(page number not for citation purposes)
http://www.ncbi.nlm.nih.gov/entrez/query.fcgi?cmd=Retrieve&db=PubMed&dopt=Abstract&list_uids=9428526
http://www.ncbi.nlm.nih.gov/entrez/query.fcgi?cmd=Retrieve&db=PubMed&dopt=Abstract&list_uids=7624482
http://www.ncbi.nlm.nih.gov/entrez/query.fcgi?cmd=Retrieve&db=PubMed&dopt=Abstract&list_uids=7624482
http://www.ncbi.nlm.nih.gov/entrez/query.fcgi?cmd=Retrieve&db=PubMed&dopt=Abstract&list_uids=1745682
http://www.ncbi.nlm.nih.gov/entrez/query.fcgi?cmd=Retrieve&db=PubMed&dopt=Abstract&list_uids=1745682
Related Documents


![Malignant hyperthermia [final]](https://static.cupdf.com/doc/110x72/58ceb1b71a28abb2218b5123/malignant-hyperthermia-final.jpg)