Research Article Proceedings of the Pakistan Academy of Sciences: Pakistan Academy of Sciences B. Life and Environmental Sciences 54 (3): 165–175 (2017) Copyright © Pakistan Academy of Sciences ISSN: 2518-4261 (print), ISSN 2518-427X (online) ———————————————— Received, May 2016; Accepted, August 2017 *Corresponding author: Ishfaq Ahmed; Email: [email protected] Effect of Antioxidants on Storage Quality of Apple Sucrose Bars Zarmeena Azmat, Yasser Durrani, Ihsan Mabood Qazi, Ishfaq Ahmed*, and Sadia Rasheed a Department of Food Science and Technology, The University of Agriculture, Peshawar, Pakistan Abstract: An experiment was conducted to study the comparative effect of citric acid and ascorbic acid as antioxidants and variations in concentration of sugar (20, 30 and 35 °brix) on over-all quality of apple bars. Potassium meta-bisulphite and pectin were added as preservatives and binding agent, respectively. Quality of apple bars was evaluated within 3 months of storage, at 15-day intervals, in consideration of physicochemical and sensory aspects. In the bar samples, decrease was observed in water activity (0.69-0.64), moisture content (17.3-15.0 %), non-reducing sugars (4.12-3.92 %), pH (3.64-3.43), and ascorbic acid (3.11-0.61 mg/100 g). Increasing trends were noted in reducing sugars (17.28-17.31 %), titratable acidity (1.24-1.47%) total solids (83.26-87.38 %) and total soluble solids (63.17-68.46 °Brix) within 30 days of storage. Also, the apple bars exhibited noticeable changes in color (8.50-6.73), texture (8.50- 6.58), taste (8.50-6.51) and overall acceptability (8.00-5.68) during 90 days of storage. The bars prepared with 35° Brix and 0.1% citric acid exhibited comparatively higher stability in terms of physicochemical and sensory traits. Keywords: Apple bar, sucrose, antioxidants, physico-chemical properties, sensory properties 1. INTRODUCTION Apple is an important fruit and is produced mainly in central and south-western Asia. In Pakistan, it is nurtured in northern hilly areas of Khyber Pakhtunkhwa, Punjab and Baluchistan [1]. Apple is normally consumed as fresh fruit or as an ingredient in a variety of food products. Fruit bar is an intermediate moisture food (IMF) product having soft pliable texture, high moisture content (11-67% on dry weight basis) with minimum water activity of 0.60 sufficient to hold down enzymatic and microbial activities during storage at room temperature [2-5]. Fruit bar is developed by mixing proper amount of sugar, pectin, acid and color to fruit pulp, and then drying to the desired intermediate moisture content. These bars are like dried raisins having a chewy texture and are considered a natural source of dietary fiber [6]. In Pakistan, apple bars are commonly prepared in hilly areas of Gilgit-Baltistan with addition of sucrose which impart it extreme sweet taste and dark brown colour, probably due to the process of caramalization. Sucrose, known as table sugar, is an organic compound of white color, which is odorless and crystalline with a sweet taste [7]. Earlier, sugar and preservatives were added in fresh mango and banana purees and slices to enhance their shelf-life and to minimize deterioration by using proper packaging and storage condition [8]. Application of flavoring agent citrate can extend shelf-life by preventing phenolase oxidase enzymatic reactions in sliced apple. Citric acid and ascorbic acids are found to be more useful [9-10]. Previously, it was noted that the addition of citric acid at a level of 0.6 % can improve the color, flavor and overall acceptability of the bars [11]. However, pectin in fruits act as a structural constituent but its proper integration with acids and sugar has to be maintained because it provide high ductile strength to leather [6, 12]. Food antioxidants also possess scavenging

Welcome message from author
This document is posted to help you gain knowledge. Please leave a comment to let me know what you think about it! Share it to your friends and learn new things together.
Transcript
Research Article
Proceedings of the Pakistan Academy of Sciences: Pakistan Academy of SciencesB. Life and Environmental Sciences 54 (3): 165–175 (2017)Copyright © Pakistan Academy of SciencesISSN: 2518-4261 (print), ISSN 2518-427X (online)
————————————————Received, May 2016; Accepted, August 2017*Corresponding author: Ishfaq Ahmed; Email: [email protected]
Effect of Antioxidants on Storage Quality of Apple Sucrose Bars
Zarmeena Azmat, Yasser Durrani, Ihsan Mabood Qazi, Ishfaq Ahmed*, and Sadia Rasheed
aDepartment of Food Science and Technology, The University of Agriculture, Peshawar, Pakistan
Abstract: An experiment was conducted to study the comparative effect of citric acid and ascorbic acid as antioxidants and variations in concentration of sugar (20, 30 and 35 °brix) on over-all quality of apple bars. Potassium meta-bisulphite and pectin were added as preservatives and binding agent, respectively. Quality of apple bars was evaluated within 3 months of storage, at 15-day intervals, in consideration of physicochemical and sensory aspects. In the bar samples, decrease was observed in water activity (0.69-0.64), moisture content (17.3-15.0 %), non-reducing sugars (4.12-3.92 %), pH (3.64-3.43), and ascorbic acid (3.11-0.61 mg/100 g). Increasing trends were noted in reducing sugars (17.28-17.31 %), titratable acidity (1.24-1.47%) total solids (83.26-87.38 %) and total soluble solids (63.17-68.46 °Brix) within 30 days of storage. Also, the apple bars exhibited noticeable changes in color (8.50-6.73), texture (8.50- 6.58), taste (8.50-6.51) and overall acceptability (8.00-5.68) during 90 days of storage. The bars prepared with 35° Brix and 0.1% citric acid exhibited comparatively higher stability in terms of physicochemical and sensory traits.
Keywords: Apple bar, sucrose, antioxidants, physico-chemical properties, sensory properties
1. INTRODUCTION
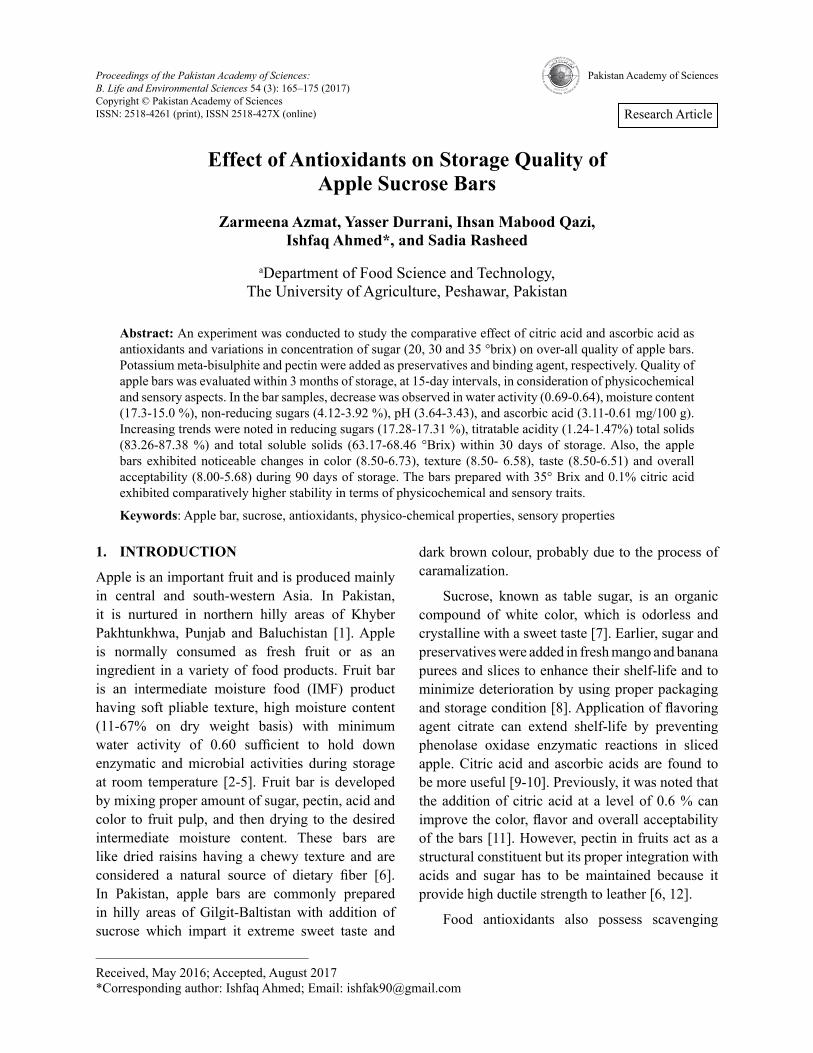
Apple is an important fruit and is produced mainly in central and south-western Asia. In Pakistan, it is nurtured in northern hilly areas of Khyber Pakhtunkhwa, Punjab and Baluchistan [1]. Apple is normally consumed as fresh fruit or as an ingredient in a variety of food products. Fruit bar is an intermediate moisture food (IMF) product having soft pliable texture, high moisture content (11-67% on dry weight basis) with minimum water activity of 0.60 sufficient to hold down enzymatic and microbial activities during storage at room temperature [2-5]. Fruit bar is developed by mixing proper amount of sugar, pectin, acid and color to fruit pulp, and then drying to the desired intermediate moisture content. These bars are like dried raisins having a chewy texture and are considered a natural source of dietary fiber [6]. In Pakistan, apple bars are commonly prepared in hilly areas of Gilgit-Baltistan with addition of sucrose which impart it extreme sweet taste and
dark brown colour, probably due to the process of caramalization.
Sucrose, known as table sugar, is an organic compound of white color, which is odorless and crystalline with a sweet taste [7]. Earlier, sugar and preservatives were added in fresh mango and banana purees and slices to enhance their shelf-life and to minimize deterioration by using proper packaging and storage condition [8]. Application of flavoring agent citrate can extend shelf-life by preventing phenolase oxidase enzymatic reactions in sliced apple. Citric acid and ascorbic acids are found to be more useful [9-10]. Previously, it was noted that the addition of citric acid at a level of 0.6 % can improve the color, flavor and overall acceptability of the bars [11]. However, pectin in fruits act as a structural constituent but its proper integration with acids and sugar has to be maintained because it provide high ductile strength to leather [6, 12].
Food antioxidants also possess scavenging
166 Zarmeena Azmat et al
properties for free radicals. Previously it has been conferred that various plant extracts namely ascorbates, ascorbic acids, tocopherols, carotenoids, and phenolic compounds lessen the rancidity and discoloration of food products [13-14]. Citric acid is a phenolase oxidase chelating agent, and the inhibition of polyphenol oxidase (PPO) was attributed to the chelating action [15]. Citric acid application to the sliced apple can prevent browning and thus extends their life span but the combination of citric and ascorbic acids were proved more effective in maintaining the overall quality of IMF products [9-10]. This study was undertaken with the objective to develop apple bars with extended shelf life by the incorporation of sucrose and antioxidants at various levels. The study also aimed to investigate the effect of these additives on the physicochemical and sensory properties of apple bars during the storage period. Additionally, it offers opportunity to combat the post-harvest losses of apple fruits, consequently aids in the improvement of the farmer’s economy.
2. MATERIALS AND METHODS
This research was carried out in the Food Processing Laboratory of Department of Food Science and Technology, The University of Agriculture, Peshawar. Apple and sugar were procured from the local market in Peshawar city for preparing apple bars. The needed chemicals were provided by the laboratory.
2.1 Preparation of Apple Bars
Sound and healthy apple fruits were rinsed carefully with tap water to remove dust and dirt particles and
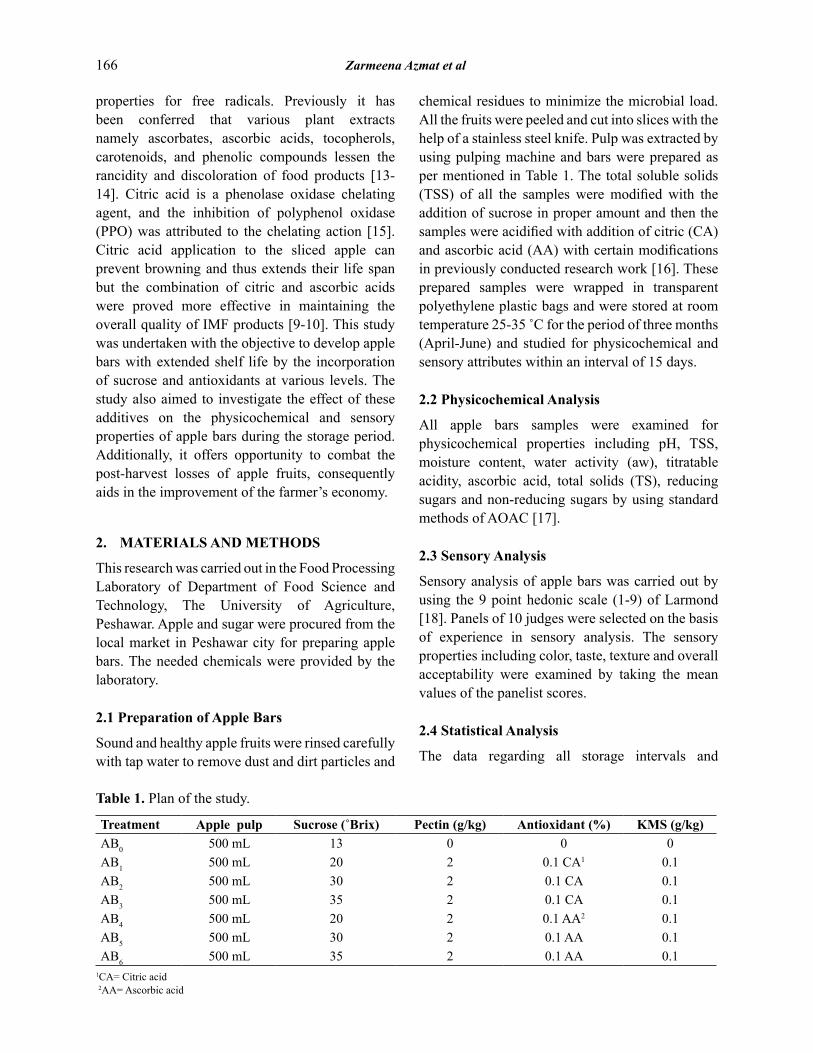
chemical residues to minimize the microbial load. All the fruits were peeled and cut into slices with the help of a stainless steel knife. Pulp was extracted by using pulping machine and bars were prepared as per mentioned in Table 1. The total soluble solids (TSS) of all the samples were modified with the addition of sucrose in proper amount and then the samples were acidified with addition of citric (CA) and ascorbic acid (AA) with certain modifications in previously conducted research work [16]. These prepared samples were wrapped in transparent polyethylene plastic bags and were stored at room temperature 25-35 ̊ C for the period of three months (April-June) and studied for physicochemical and sensory attributes within an interval of 15 days.
2.2 Physicochemical Analysis
All apple bars samples were examined for physicochemical properties including pH, TSS, moisture content, water activity (aw), titratable acidity, ascorbic acid, total solids (TS), reducing sugars and non-reducing sugars by using standard methods of AOAC [17].
2.3 Sensory Analysis
Sensory analysis of apple bars was carried out by using the 9 point hedonic scale (1-9) of Larmond [18]. Panels of 10 judges were selected on the basis of experience in sensory analysis. The sensory properties including color, taste, texture and overall acceptability were examined by taking the mean values of the panelist scores.
2.4 Statistical Analysis
The data regarding all storage intervals and
Table 1. Plan of the study.
Treatment Apple pulp Sucrose (˚Brix) Pectin (g/kg) Antioxidant (%) KMS (g/kg)AB0 500 mL 13 0 0 0AB1 500 mL 20 2 0.1 CA1 0.1AB2 500 mL 30 2 0.1 CA 0.1AB3 500 mL 35 2 0.1 CA 0.1AB4 500 mL 20 2 0.1 AA2 0.1AB5 500 mL 30 2 0.1 AA 0.1AB6 500 mL 35 2 0.1 AA 0.1
1CA= Citric acid 2AA= Ascorbic acid
Effect of Antioxidants on Storage Quality of Apple Sucrose Bars 167
treatments were statistically analyzed by CRD 2 factorial as recommended by Gomez and Gomez [19] and the means were separated by LSD test at 5% probability level as defined by Steel and Torrie [20].
3. RESULTS AND DISCUSSION
3.1 Physico-chemical Analysis
In this study the effect of added antioxidants on water activity, ascorbic acid, percent acidity, moisture content, pH, total solids, total soluble solids, reducing sugar and non-reducing sugar contents of apple bars were analyzed during storage period of three months.
3.1.1 Water Activity (aw)
The water activity of the entire sample analyzed
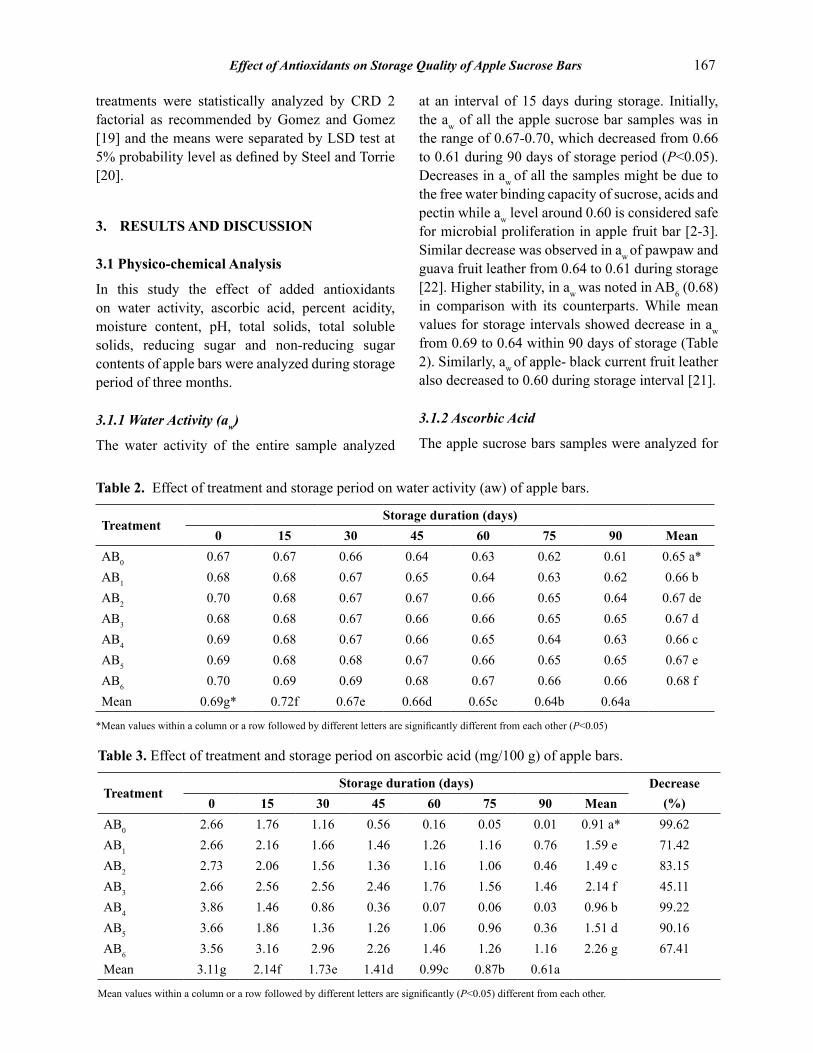
at an interval of 15 days during storage. Initially, the aw of all the apple sucrose bar samples was in the range of 0.67 -0.70, which decreased from 0.66 to 0.61 during 90 days of storage period (P<0.05). Decreases in aw of all the samples might be due to the free water binding capacity of sucrose, acids and pectin while aw level around 0.60 is considered safe for microbial proliferation in apple fruit bar [2-3]. Similar decrease was observed in aw of pawpaw and guava fruit leather from 0.64 to 0.61 during storage [22]. Higher stability, in aw was noted in AB6 (0.68) in comparison with its counterparts. While mean values for storage intervals showed decrease in aw from 0.69 to 0.64 within 90 days of storage (Table 2). Similarly, aw of apple- black current fruit leather also decreased to 0.60 during storage interval [21].
3.1.2 Ascorbic Acid
The apple sucrose bars samples were analyzed for
Table 2. Effect of treatment and storage period on water activity (aw) of apple bars.
TreatmentStorage duration (days)
0 15 30 45 60 75 90 MeanAB0 0.67 0.67 0.66 0.64 0.63 0.62 0.61 0.65 a*AB1 0.68 0.68 0.67 0.65 0.64 0.63 0.62 0.66 bAB2 0.70 0.68 0.67 0.67 0.66 0.65 0.64 0.67 deAB3 0.68 0.68 0.67 0.66 0.66 0.65 0.65 0.67 dAB4 0.69 0.68 0.67 0.66 0.65 0.64 0.63 0.66 cAB5 0.69 0.68 0.68 0.67 0.66 0.65 0.65 0.67 eAB6 0.70 0.69 0.69 0.68 0.67 0.66 0.66 0.68 fMean 0.69g* 0.72f 0.67e 0.66d 0.65c 0.64b 0.64a
*Mean values within a column or a row followed by different letters are significantly different from each other (P<0.05)
Table 3. Effect of treatment and storage period on ascorbic acid (mg/100 g) of apple bars.
TreatmentStorage duration (days) Decrease
(%)0 15 30 45 60 75 90 MeanAB0 2.66 1.76 1.16 0.56 0.16 0.05 0.01 0.91 a* 99.62AB1 2.66 2.16 1.66 1.46 1.26 1.16 0.76 1.59 e 71.42AB2 2.73 2.06 1.56 1.36 1.16 1.06 0.46 1.49 c 83.15AB3 2.66 2.56 2.56 2.46 1.76 1.56 1.46 2.14 f 45.11AB4 3.86 1.46 0.86 0.36 0.07 0.06 0.03 0.96 b 99.22AB5 3.66 1.86 1.36 1.26 1.06 0.96 0.36 1.51 d 90.16AB6 3.56 3.16 2.96 2.26 1.46 1.26 1.16 2.26 g 67.41Mean 3.11g 2.14f 1.73e 1.41d 0.99c 0.87b 0.61a
Mean values within a column or a row followed by different letters are significantly (P<0.05) different from each other.
168 Zarmeena Azmat et al
Table 4. Effect of treatment and storage period on % acidity of apple bars.
TreatmentStorage duration (days) Increase
(%) 0 15 30 45 60 75 90 Mean
AB0 1.20 1.30 1.38 1.44 1.49 1.52 1.59 1.42 f* 32.5
AB1 1.21 1.27 1.31 1.34 1.37 1.41 1.44 1.34 b 19.00
AB2 1.33 1.37 1.40 1.43 1.46 1.48 1.52 1.43 g 14.28
AB3 1.30 1.34 1.36 1.39 1.42 1.45 1. 48 1.39 d 13.84
AB4 1.24 1.27 1.32 1.36 1.39 1.43 1.47 1.35 c 18.54
AB5 1.30 1.32 1.37 1.40 1.44 1.47 1.49 1.40 e 14.61
AB6 1.10 1.14 1.18 1.22 1.25 1.28 1.31 1.21 a 19.09
Mean 1.24 a* 1.29 b 1.33 c 1.37 d 1.40 e 1.43 f 1.47 g
*Mean values within a column or a row followed by different letters are significantly different from each other (P<0.05).
Table 5. Effect of treatment and storage period on moisture (%) of apple bars.
TreatmentStorage duration (days) Decrease
(%)0 15 30 45 60 75 90 Mean
AB0 16.5 16.20 15.47 15.12 14.51 14.14 13.90 15.12 a* 15.70
AB1 16.95 16.84 16.42 16.14 15.97 15.48 15.21 16.14 c 10.20
AB2 16.98 16.79 16.77 15.92 15.81 15.76 15.61 16.23 c 8.06
AB3 16.90 16.88 16.79 16.76 15.90 15.82 15.76 16.40 d 6.74
AB4 17.91 16.68 16.46 15.87 15.75 15.54 15.02 16.17 c 16.1
AB5 16.97 16.74 16.26 15.84 15.48 15.12 14.96 15.91 b 11.8
AB6 16.96 16.76 16.38 15.46 15.23 15.08 14.82 15.81 b 12.6
Mean 17.03 g* 16.70 f 16.36 e 15.87 d 15.52 c 15.28 b 15.04 a
*Mean values within a column or a row followed by different letters are significantly different from each other (P<0.05).
Table 6. Effect of treatment and storage period on pH of apple bars.
TreatmentStorage duration (days) Decrease
(%)0 15 30 45 60 75 90 Mean
AB0 3.43 3.40 3.37 3.34 3.31 3.28 3.25 3.34 b* 5.24
AB1 3.25 3.21 3.17 3.13 3.06 3.05 3.01 3.13 a 7.38
AB2 3.83 3.80 3.77 3.74 3.71 3.68 3.65 3.74 f 4.69
AB3 3.95 3.93 3.91 3.87 3.86 3.85 3.83 3.88 g 3.03
AB4 3.75 3.70 3.65 3.60 3.55 3.50 3.45 3.60 e 8.00
AB5 3.55 3.51 3.47 3.43 3.36 3.35 3.31 3.43 c 6.76
AB6 3.67 3.64 3.61 3.58 3.55 3.52 3.46 3.58 d 5.72
Mean 3.64 g* 3.60 f 3.57 e 3.48 d 3.48 c 3.46 b 3.43 a
*Mean values within a column or a row followed by different letters are significantly different from each other (P<0.05).
Effect of Antioxidants on Storage Quality of Apple Sucrose Bars 169
ascorbic acid content initially the ascorbic acid for treatments from AB0 to AB6 was 2.66 to 3.56 mg/100 gm which significantly (P<0.05) decreased to 0.01 and 1.16 mg/100 g during the entire storage period. Maximum stability in ascorbic acid content was observed in AB3 (1.46 mg/100 g). While mean values for storage intervals showed decrease in ascorbic acid content from 3.11 to 0.61 mg/100g during three months of storage (Table 3). The losses in the ascorbic acid content might be due to high temperature provided in apple bar preparation, variation in storage temperature and oxidation of ascorbic acid to dehydro-ascorbic acid [26]. Previously, reduction in vitamin C content of guava (176.27 to 104.87 mg/100 g) and pawpaw (83.33 to 74.70 mg/g) fruits leather were observed during storage [24-25]. Similarly, reduction in ascorbic acid content due to oxidation was noted from 1.7 to 0.8% in IMF food product [27].
3.1.3 Acidity
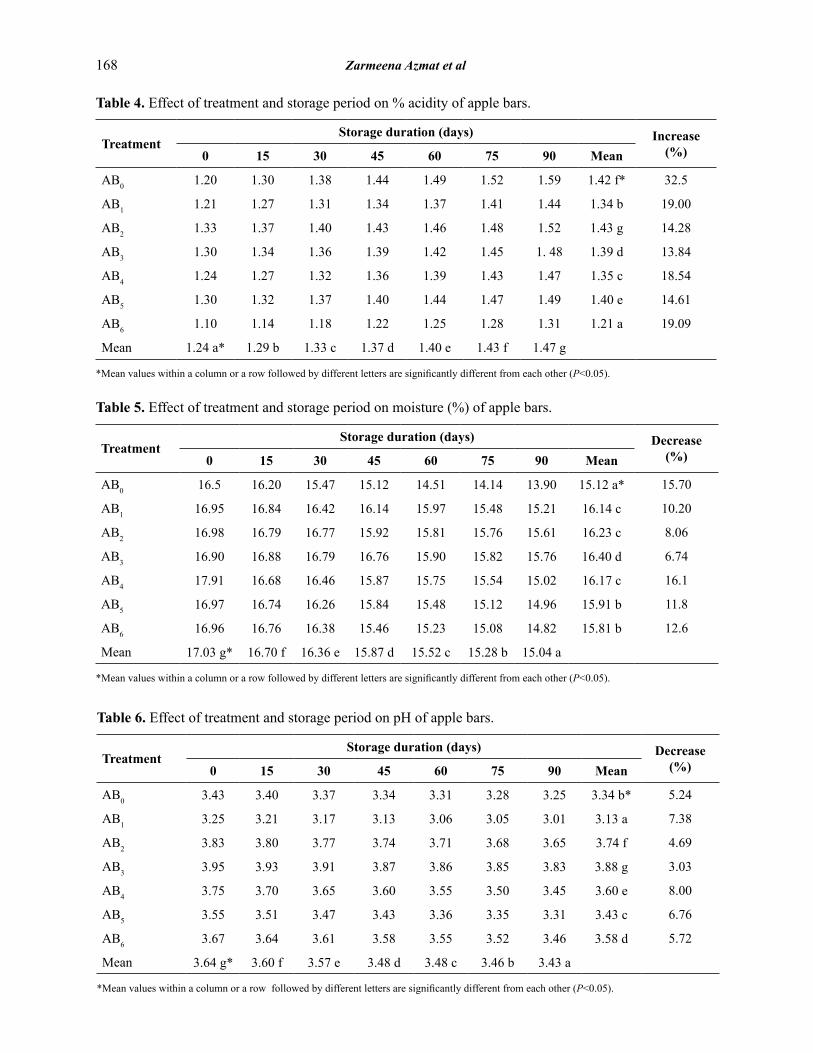
The samples were tested for percent acidity at 15 days interval during storage and the initial values for the treatments AB0 to AB6 were 1.20 and 1.10%, respectively, which significantly (P<0.05) increased finally to 1.59 and 1.31% during 90 days of storage period. Similar increase in percent acidity up to 1.11% and 1.66% was noted in apple fruit bar during 60 and 90 days of storage [6]. Table 4 shows that higher increase in acidity was observed in AB2 (1.43%) followed by AB0 (1.42%) however, stability in acidity was observed in AB 6 (1.21%) followed by AB1 (1.34%) during 90 days of storage. Increase in acidity of all the samples might be due to the addition of citric and ascorbic acid and also due to break down of sugar into acids during dehydration and storage. Similarly, percent acidity increased during storage from 0.42 to 0.48% in guava and 0.37 to 0.44% in mango leather [24-28].
3.1.4 Moisture Content
The moisture content of the apple sucrose bars declined during storage. The initial moisture content of the entire sample from AB0 to AB6 was 16.5 and 16.96%, which significantly (P<0.05) decreased to 13.90, 15.76% after 90 days of
storage time. Maximum mean values of moisture content were noticed in AB3 (16.40%) followed by AB2 (16.23%), while the lowest mean values were observed in AB0 (15.12%) followed by AB6 (15.81%) in table 5. While mean values for storage intervals showed decrease in moisture content from 17.03 to 15.04% during 90 days. Decrease in moisture content is responsible for lower aw of apple bar and it may be attributed to the water binding capacity of sucrose, pectin and also due to rise in environmental and room temperature at the onset of summer season. Similarly, reduction in moisture content of pear from (12.13 to 7.97%) and durian (15.82 to 14.36 %) fruit leathers was noticed during storage [29-30].
3.1.5 pH
The pH of the samples decreased during storage. Initially, the pH value with treatments AB0 to AB6 were 3.4 and 3.67, which declined to 3.25 and 3.46 (P<0.05) during three months of storage time. The highest mean value for pH was observed in AB3 (3.88) followed by AB2 (3.74) and AB4 (3.60), while lowest mean value for pH was observed in AB1 (3.13) and AB0. While mean values for storage intervals showed decrease in pH from 3.64 to 3.43 throughout 90 days of room storage conditions (Table 6). Decrease in pH is always due to rise in acidity, while in apple bar samples decrease in pH might be due to the addition of citric acid and ascorbic acid. Previously, decline in pH from 3.80 to 3.60 was observed in mango and pine-apple fruits during storage [31-32].
3.1.6 Total Solids
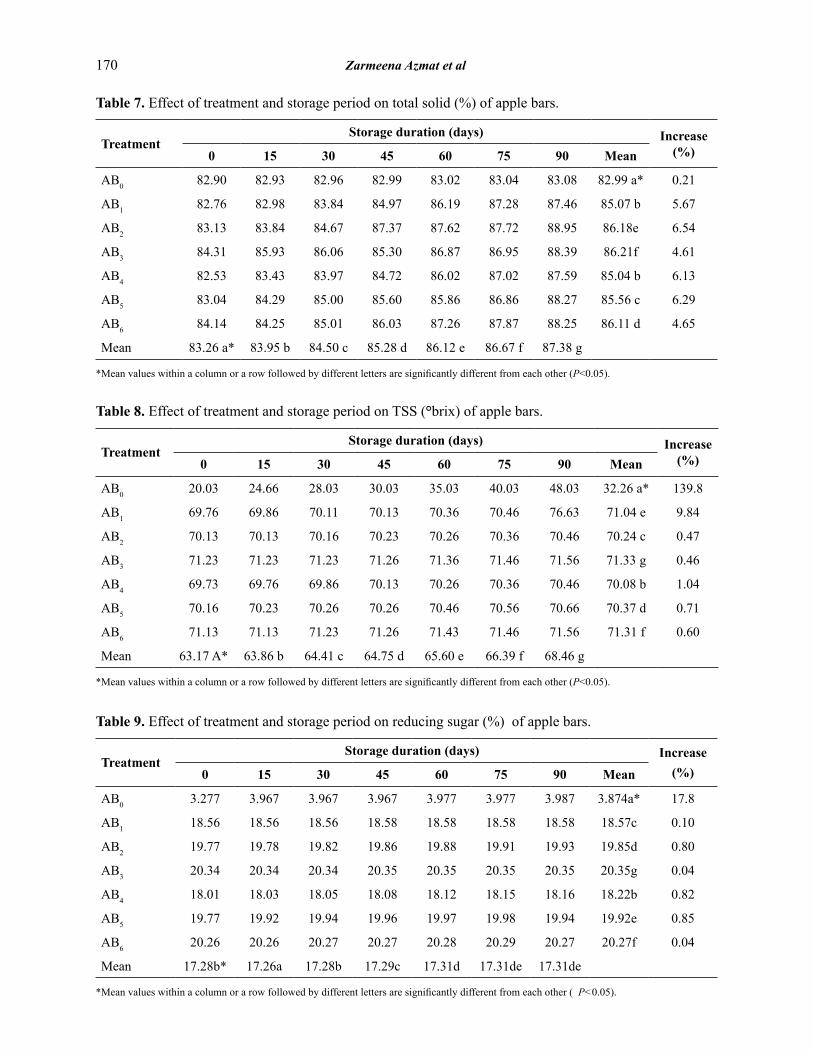
The apple sucrose bars samples were analyzed at 15 days of interval for total solids. Initial total solids (TS) value of apple bar with treatments AB0 to AB6 were 82.90 and 84.14 which significant (P<0.05) increased to 83.08% and 88.27% within 3 months of storage at room temperature. Mean total solids for all the storage intervals increased from 83.26 to 87.38% (Table 7). Increase in TS may be due to the presence of fiber content and addition of pectin in apple bar preparation. Previous study showed that total solids increased from 69.66 to 70.77 in fruit bar during storage [23].
170 Zarmeena Azmat et al
Table 7. Effect of treatment and storage period on total solid (%) of apple bars.
TreatmentStorage duration (days) Increase
(%) 0 15 30 45 60 75 90 Mean
AB0 82.90 82.93 82.96 82.99 83.02 83.04 83.08 82.99 a* 0.21
AB1 82.76 82.98 83.84 84.97 86.19 87.28 87.46 85.07 b 5.67
AB2 83.13 83.84 84.67 87.37 87.62 87.72 88.95 86.18e 6.54
AB3 84.31 85.93 86.06 85.30 86.87 86.95 88.39 86.21f 4.61
AB4 82.53 83.43 83.97 84.72 86.02 87.02 87.59 85.04 b 6.13
AB5 83.04 84.29 85.00 85.60 85.86 86.86 88.27 85.56 c 6.29
AB6 84.14 84.25 85.01 86.03 87.26 87.87 88.25 86.11 d 4.65
Mean 83.26 a* 83.95 b 84.50 c 85.28 d 86.12 e 86.67 f 87.38 g
*Mean values within a column or a row followed by different letters are significantly different from each other (P<0.05).
Table 8. Effect of treatment and storage period on TSS (°brix) of apple bars.
TreatmentStorage duration (days) Increase
(%) 0 15 30 45 60 75 90 Mean
AB0 20.03 24.66 28.03 30.03 35.03 40.03 48.03 32.26 a* 139.8
AB1 69.76 69.86 70.11 70.13 70.36 70.46 76.63 71.04 e 9.84
AB2 70.13 70.13 70.16 70.23 70.26 70.36 70.46 70.24 c 0.47
AB3 71.23 71.23 71.23 71.26 71.36 71.46 71.56 71.33 g 0.46
AB4 69.73 69.76 69.86 70.13 70.26 70.36 70.46 70.08 b 1.04
AB5 70.16 70.23 70.26 70.26 70.46 70.56 70.66 70.37 d 0.71
AB6 71.13 71.13 71.23 71.26 71.43 71.46 71.56 71.31 f 0.60
Mean 63.17 A* 63.86 b 64.41 c 64.75 d 65.60 e 66.39 f 68.46 g
*Mean values within a column or a row followed by different letters are significantly different from each other (P<0.05).
Table 9. Effect of treatment and storage period on reducing sugar (%) of apple bars.
TreatmentStorage duration (days) Increase
(%)0 15 30 45 60 75 90 Mean
AB0 3.277 3.967 3.967 3.967 3.977 3.977 3.987 3.874a* 17.8
AB1 18.56 18.56 18.56 18.58 18.58 18.58 18.58 18.57c 0.10
AB2 19.77 19.78 19.82 19.86 19.88 19.91 19.93 19.85d 0.80
AB3 20.34 20.34 20.34 20.35 20.35 20.35 20.35 20.35g 0.04
AB4 18.01 18.03 18.05 18.08 18.12 18.15 18.16 18.22b 0.82
AB5 19.77 19.92 19.94 19.96 19.97 19.98 19.94 19.92e 0.85
AB6 20.26 20.26 20.27 20.27 20.28 20.29 20.27 20.27f 0.04
Mean 17.28b* 17.26a 17.28b 17.29c 17.31d 17.31de 17.31de
*Mean values within a column or a row followed by different letters are significantly different from each other ( P<0.05).
Effect of Antioxidants on Storage Quality of Apple Sucrose Bars 171
3.1.7 Total Soluble Solids
The initial readings for TSS from AB0 to AB6 were 20.03 and 71.13º Brix, which significantly (P<0.05) increased up to 48.03 and 71.56° Brix during storage period. Highest mean values for treatment were noted in AB3 (71.33° Brix) followed by AB6 (71.31° Brix), while the lowest mean values were noted in AB0 (32.26° Brix) followed by AB2 (70.25° Brix). The mean values of the storage interval increased from 63.17 to 68.46° Brix during storage (Table 8). Steady increase in TSS may be attributed to the addition of sucrose which was converted into glucose and fructose and also due to the loss of moisture content, which aided in increasing the shelf life of apple fruit bars [33]. Previous research work showed that TSS of IMF products including fruits jam, jellies, marmalade and leather minimally increases during storage, which stabilized the shelf life of these products [34-35].
3.1.8 Reducing Sugars
The apple sucrose bars samples were tested for reducing sugars at 15 days of interval. Initially the reducing sugar value for the sample AB0 (3.27%) to AB6 (20.26%) were recorded, which statistically (P<0.05) increased up to (20.27%) during storage period. Maximum mean values for treatment were noticed in AB3 (20.35%) followed by AB6 (20.27%). While mean values for storage interval showed increase in reducing sugar from 17.28 to 17.33% in (Table 9). Reducing sugar of all the apple bars might be increased due to conversion of polysaccharides and disaccharides to monosaccharaides. Previously researchers showed that reducing sugar content of strawberry jam and grape fruit-apple marmalade increased at par with apple sucrose bar during 3 months of storage at room temperature [34-35].
Table 10. Effect of treatment and storage period on non-reducing sugar (%) of apple bars.
TreatmentStorage duration (days) Decrease
(%)0 15 30 45 60 75 90 MeanAB0 2.34 2.31 2.28 2.26 2.23 2.22 2.18 2.26 a* 6.83AB1 2.37 2.34 2.26 2.28 2.23 2.21 2.18 2.26 a 8.01AB2 4.48 4.46 4.43 4.41 4.38 4.34 4.33 4.41 c 3.34AB3 6.41 6.36 6.35 6.31 6.26 6.28 6.26 6.32 d 2.34AB4 2.41 2.36 2.36 2.33 2.26 2.28 2.25 2.32 b 6.63AB5 4.48 4.46 4.45 4.42 4.38 4.02 4.34 4.36 c 3.12AB6 6.38 6.36 6.34 6.31 6.28 6.26 6.23 6.30 d 2.35Mean 4.12 e* 4.09 de 4.07 de 4.04 cd 4.00 bc 3.98 ab 3.92 a
**Mean values within a column or a row followed by different letters are significantly different from each other (P<0.05).
Table 11. Effect of treatment and storage period on color (using the 1–9 point hedonic scale of Larmond [18]) of apple bars.
TreatmentStorage duration (days) Decrease
(%)0 15 30 45 60 75 90 MeanAB0 8.50 6.56 6.23 5.73 5.23 4.83 4.53 5.94 a* 46.70AB1 8.50 8.23 7.86 7.86 7.63 7.33 6.83 7.74 b 19.64AB2 8.50 8.43 8.23 8.03 8.86 7.83 7.53 8.07 g 11.41AB3 8.50 8.43 8.13 7.83 7.73 7.23 7.03 7.84 d 17.29AB4 8.50 8.43 8.03 7.83 7.73 7.43 6.86 7.81 c 19.29AB5 8.50 8.33 8.13 7.83 7.83 7.53 7.13 7.91 e 16.11AB6 8.50 8.43 8.16 7.86 7.86 7.66 7.23 7.95 f 14.94Mean 8.50 g* 7.86 d 7.95 f 7.66 e 7.45 c 7.12 b 6.73 a
*Mean values within a column or a row followed by different letters are significantly different from each other (P<0.05).
172 Zarmeena Azmat et al
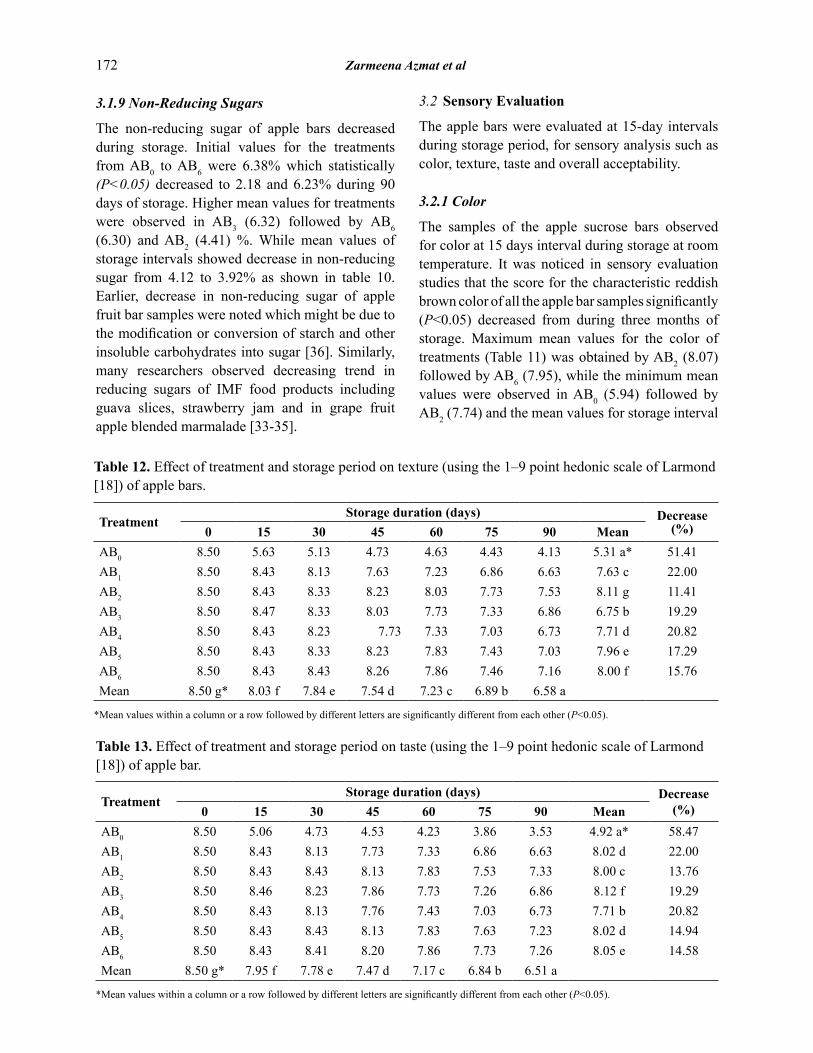
3.1.9 Non-Reducing Sugars
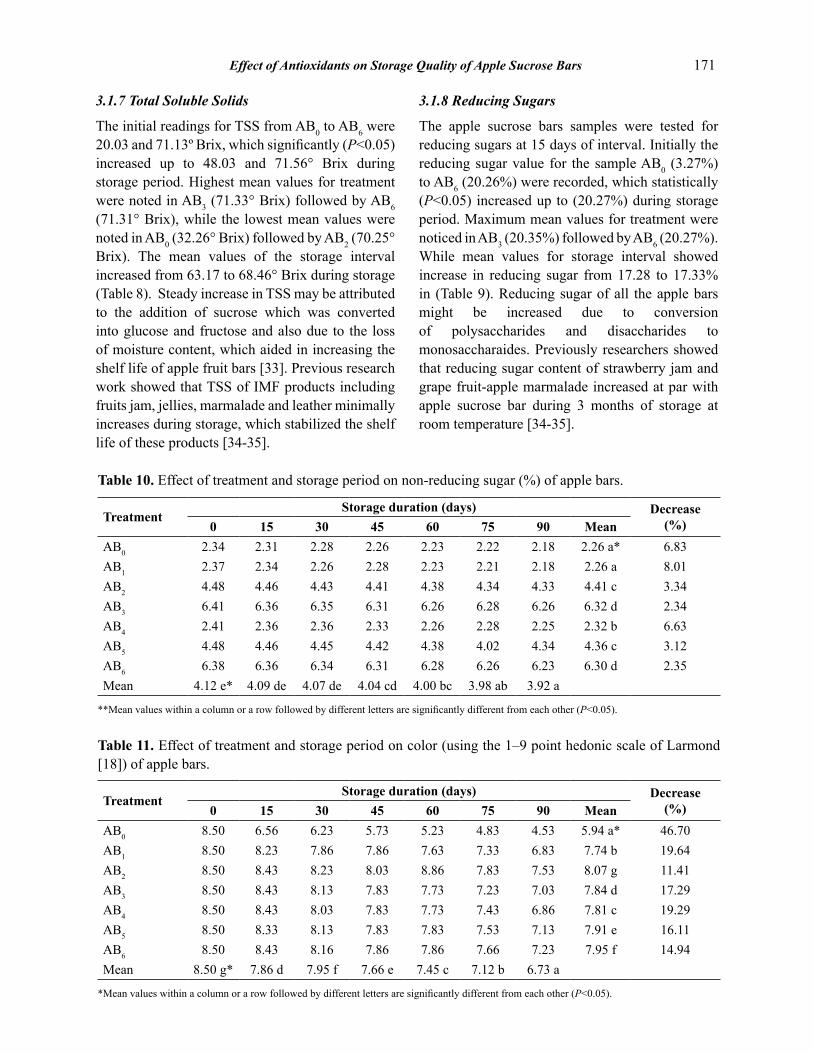
The non-reducing sugar of apple bars decreased during storage. Initial values for the treatments from AB0 to AB6 were 6.38% which statistically (P<0.05) decreased to 2.18 and 6.23% during 90 days of storage. Higher mean values for treatments were observed in AB3 (6.32) followed by AB6 (6.30) and AB2 (4.41) %. While mean values of storage intervals showed decrease in non-reducing sugar from 4.12 to 3.92% as shown in table 10. Earlier, decrease in non-reducing sugar of apple fruit bar samples were noted which might be due to the modification or conversion of starch and other insoluble carbohydrates into sugar [36]. Similarly, many researchers observed decreasing trend in reducing sugars of IMF food products including guava slices, strawberry jam and in grape fruit apple blended marmalade [33-35].
3.2 Sensory Evaluation
The apple bars were evaluated at 15-day intervals during storage period, for sensory analysis such as color, texture, taste and overall acceptability.
3.2.1 Color
The samples of the apple sucrose bars observed for color at 15 days interval during storage at room temperature. It was noticed in sensory evaluation studies that the score for the characteristic reddish brown color of all the apple bar samples significantly (P<0.05) decreased from during three months of storage. Maximum mean values for the color of treatments (Table 11) was obtained by AB2 (8.07) followed by AB6 (7.95), while the minimum mean values were observed in AB0 (5.94) followed by AB2 (7.74) and the mean values for storage interval
Table 12. Effect of treatment and storage period on texture (using the 1–9 point hedonic scale of Larmond [18]) of apple bars.
TreatmentStorage duration (days) Decrease
(%)0 15 30 45 60 75 90 MeanAB0 8.50 5.63 5.13 4.73 4.63 4.43 4.13 5.31 a* 51.41AB1 8.50 8.43 8.13 7.63 7.23 6.86 6.63 7.63 c 22.00AB2 8.50 8.43 8.33 8.23 8.03 7.73 7.53 8.11 g 11.41AB3 8.50 8.47 8.33 8.03 7.73 7.33 6.86 6.75 b 19.29AB4 8.50 8.43 8.23 7.73 7.33 7.03 6.73 7.71 d 20.82AB5 8.50 8.43 8.33 8.23 7.83 7.43 7.03 7.96 e 17.29AB6 8.50 8.43 8.43 8.26 7.86 7.46 7.16 8.00 f 15.76Mean 8.50 g* 8.03 f 7.84 e 7.54 d 7.23 c 6.89 b 6.58 a
*Mean values within a column or a row followed by different letters are significantly different from each other (P<0.05).
Table 13. Effect of treatment and storage period on taste (using the 1–9 point hedonic scale of Larmond [18]) of apple bar.
TreatmentStorage duration (days) Decrease
(%)0 15 30 45 60 75 90 MeanAB0 8.50 5.06 4.73 4.53 4.23 3.86 3.53 4.92 a* 58.47AB1 8.50 8.43 8.13 7.73 7.33 6.86 6.63 8.02 d 22.00AB2 8.50 8.43 8.43 8.13 7.83 7.53 7.33 8.00 c 13.76AB3 8.50 8.46 8.23 7.86 7.73 7.26 6.86 8.12 f 19.29AB4 8.50 8.43 8.13 7.76 7.43 7.03 6.73 7.71 b 20.82AB5 8.50 8.43 8.43 8.13 7.83 7.63 7.23 8.02 d 14.94AB6 8.50 8.43 8.41 8.20 7.86 7.73 7.26 8.05 e 14.58Mean 8.50 g* 7.95 f 7.78 e 7.47 d 7.17 c 6.84 b 6.51 a
*Mean values within a column or a row followed by different letters are significantly different from each other (P<0.05).
Effect of Antioxidants on Storage Quality of Apple Sucrose Bars 173
also showed decrease in color from 8.50 to 6.73. The slight conversion in typical apple sucrose bar might be due to the activation of Maillard browning and oxidation of ascorbic acid into dehydroascorbic acid. Similarly, decrease in color score of apple and guava leather was observed from 6.00 to 5.00 and 7.10 to 6.16 during storage [5, 24].
3.2.2 Texture
Study showed significant effect of treatments and storage interval on texture of apple sucrose bars during storage period. It was noted that mean score of judges for texture of apple sucrose bar decreased significantly (P<0.05) from AB0 8.50 to AB6 to 4.13, 6.63, 7.53, 6.86, 6.73, 7.03 and 7.16 within 3 months of storage intervals. Highest mean value for texture was observed in AB2 (8.11) followed by AB6 (8.00) and the lowest mean values were recorded in AB0 (5.31) followed by AB3 (6.75). Concurrently, the mean values for texture of apple bar during 90 days of storage decreased from 8.50 to 6.58 (Table 12). Several ways can be used to note the texture of fruit leather but human taste buds are more complex in evaluating the texture of fruit bars in comparison with penetrometer which normally measures only one aspect of texture [29, 37].
3.2.3 Taste
As it is shown in table 13 that maximum mean values for taste among all the treatments were obtained by AB3 (8.12) followed by AB6 (8.05) and AB1 (8.02) and the minimum mean values were observed in AB0 (4.92) followed by AB4 (7.71)
(Table 13). Consequently, mean values for storage decreased from 8.50 to 6.51, respectively. Changes in taste of apple sucrose fruit leather might be due to variation in the amount of sugar and acids which require optimization [24] but the sweetness and acid ratio also depends upon type of fruit and may vary during storage [25].
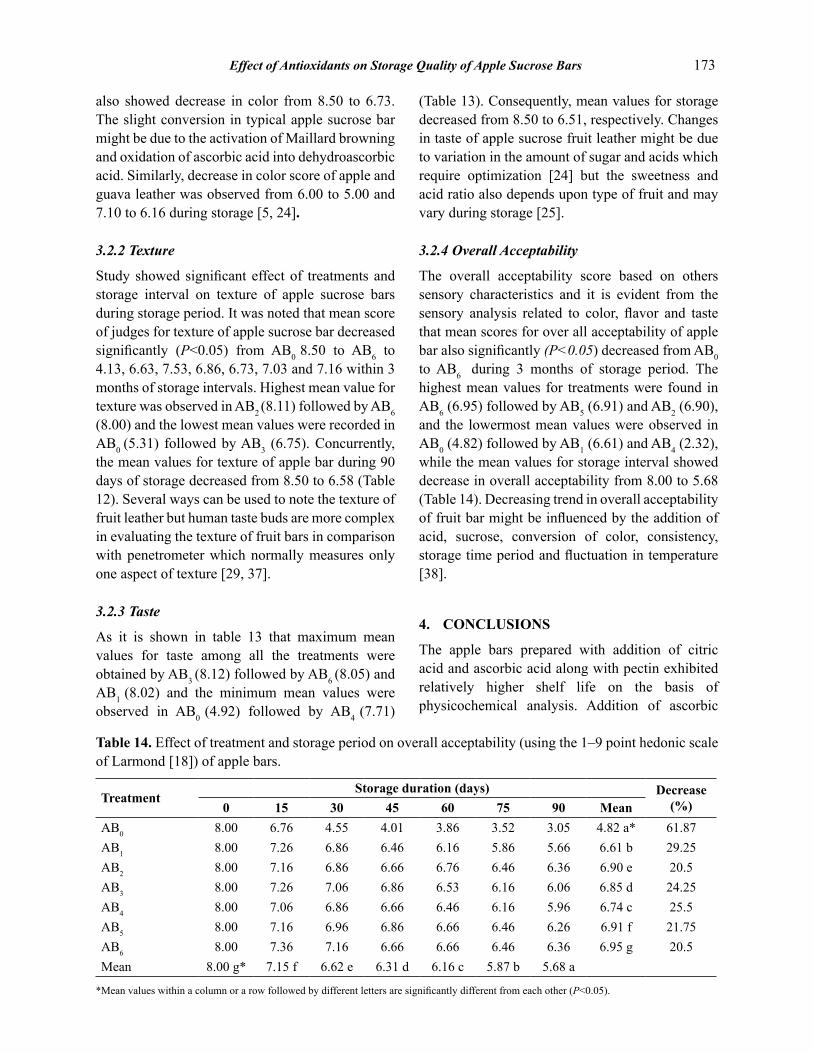
3.2.4 Overall Acceptability
The overall acceptability score based on others sensory characteristics and it is evident from the sensory analysis related to color, flavor and taste that mean scores for over all acceptability of apple bar also significantly (P<0.05) decreased from AB0 to AB6 during 3 months of storage period. The highest mean values for treatments were found in AB6 (6.95) followed by AB5 (6.91) and AB2 (6.90), and the lowermost mean values were observed in AB0 (4.82) followed by AB1 (6.61) and AB4 (2.32), while the mean values for storage interval showed decrease in overall acceptability from 8.00 to 5.68 (Table 14). Decreasing trend in overall acceptability of fruit bar might be influenced by the addition of acid, sucrose, conversion of color, consistency, storage time period and fluctuation in temperature [38].
4. CONCLUSIONS
The apple bars prepared with addition of citric acid and ascorbic acid along with pectin exhibited relatively higher shelf life on the basis of physicochemical analysis. Addition of ascorbic
Table 14. Effect of treatment and storage period on overall acceptability (using the 1–9 point hedonic scale of Larmond [18]) of apple bars.
TreatmentStorage duration (days) Decrease
(%)0 15 30 45 60 75 90 MeanAB0 8.00 6.76 4.55 4.01 3.86 3.52 3.05 4.82 a* 61.87AB1 8.00 7.26 6.86 6.46 6.16 5.86 5.66 6.61 b 29.25AB2 8.00 7.16 6.86 6.66 6.76 6.46 6.36 6.90 e 20.5AB3 8.00 7.26 7.06 6.86 6.53 6.16 6.06 6.85 d 24.25AB4 8.00 7.06 6.86 6.66 6.46 6.16 5.96 6.74 c 25.5AB5 8.00 7.16 6.96 6.86 6.66 6.46 6.26 6.91 f 21.75AB6 8.00 7.36 7.16 6.66 6.66 6.46 6.36 6.95 g 20.5Mean 8.00 g* 7.15 f 6.62 e 6.31 d 6.16 c 5.87 b 5.68 a
*Mean values within a column or a row followed by different letters are significantly different from each other (P<0.05).
174 Zarmeena Azmat et al
acid enhanced availability of vitamin C in the bars. Further, specific red brown colour of apple bars persisted during 3-month storage period and addition of acids minimized sweetness of the bars, by imparting mild sourness, compared with non-acidified bars, which resulted in higher acceptability of the product.
5. REFERENCES
1. GoP. Agricultural Statistics of Pakistan. Government of Pakistan, Ministry of National Food Security and Research (Economic Wing), Islamabad (2011-12).
2. Gould, G.W. Methods for preservation and extension of shelf life. Food Research International 33: 51-64 (1996).
3. Tapia, M.S., S.M. Alzamora & J. Chirife. Effects of water activity (aw) on microbial stability: as hurdle in food preservation. In: Water Activity in Foods: Fundamentals and Applications, Barbosa-Canovas, G.V., A.J. J. Fontana, S.J. Schmidt, T.P. Labuza (Ed.). Blackwell Publishing Professional, Ames, I.A, USA, p. 237–272 (2008).
4. Taoukis, P.S., M. Richardson, Principles of intermediate-moisture foods and related technology. In: Water Activity in Foods: Fundamentals and Applications, Barbosa-Canovas, G.V., A.J.J. Fontana, S.J. Schmidt, T.P. Labuza (Ed.). Blackwell Publishing Professional, Ames, I. A, USA. p. 273–312 (2007).
5. Naz, R. Physical properties, sensory attributes and consumer preference of fruit leather. Pakistan Journal of Food Sciences 22(4): 188-19 (2012).
6. Vidhya, R. & A. Narain. Development of preserved products (Jam and Fruit Bar) from under exploited wood apple “Limoniaacidissima” fruits. African Journal of Food Science and Technology 1(2): 051-057 (2010).
7. USDA. The School Nutrition Dietary Assessment Study: School Food Service, Meals Offered and Dietary Intakes. Mathematical Policy Research, Princeton, NJ (1993).
8. Alzamora, S.M. Fundamentos del me´ todo de conservacio´ n porfactorescombinados. In: Aplicacion de factorescombinadosen la conservacion de alimentos, P.F. Maupoey, A.A. Grau & A.C. Boix (Ed.). Valencia: Universidade Politecnica de Valencia. p. 1–26 (1994).
9. Santerre, C.R., J.N. Cash & D.J. Vannorman. Ascorbic acid/citric acid combination in the processing of frozen apple slices. Journal of Food Science 53: 1713–1716 (1988).
10. Pizzocaro, F., D. Torreggiani & G. Gilardi. Inhibition of apple polyphenoloxidase (PPO) by ascorbic acid, citric acid and sodium chloride.
Journal of Food Processing and Preservation 17: 21–30 (1993).
11. Parsad, K. Dehydration behavior of plain and fortified banana pulp in the preparation of bars. Journal of Dairy Foods and Home Science 29(1): 37-41 (2009).
12. Ratphitagsanti, W., F. Hsieh & H.E. Huff. Physical properties of strawberry leather. Session 83D, Fruit and vegetable products: Processed fruit. In: IFT Annual Meeting, July 12–16, 2004, Las Vegas, Nevada (2004).
13. Mitsumoto, M., R.G. Cassen, D.M. Scheafer, R.N. Arnold & K.K. Scheller. Improvement of color and lipid stability in beef longissimus with dietary vitamin E and vitamin C dip treatments. Journal of Food Science 56: 1489-1492 (1991).
14. Decker, E.A. & Z. Xu. Minimizing rancidity in muscle foods. Food Technology 52: 54-59 (1998).
15. Jiang, Y.M., J.R. Fu, G. Zauberman & Y. Fuchs. Purification of polyphenol oxidase and the browning control of litchi fruit by glutathione and citric acid. Journal of Food and Agriculture 79: 950–954 (1999).
16. Agrahari, P.R., D.S. Khurdna, C. Lata, C. Kaur & H.C. Kapoor. Antioxidant activity and quality of soy enriched apple bar. Journal of Food Processing and Preservation 28: 145-159 (2004).
17. AOAC. Official Methods of Analysis of AOAC International, 19th ed., Volume II. Association of Official Analytical Chemists. Gaithersburg, Maryland. USA. p. 2087-2417 (2012).
18. Larmond, E. Laboratory Methods for Sensory Evaluation of Food. Publication Canada, Department of Agriculture, Ottawa (1977).
19. Gomez, K.A. & A.A. Gomez. Statistical Procedures for Agricultural Research. John Wiley and sons, Inc. London, UK (2nd edn) 13-175 (1984).
20. Steel, R.G.D. & J.H. Torrie. Principles and Procedures of Statistics. McGraw. Hill Publishing, New York (1997).
21. Diamante, L.M., G.P. Savage, L. Vanhanen & R. Ihns. Vacuum-frying of apricot slices: Effects of frying temperature, time and maltodextrin levels on the moisture, color and texture properties. Journal of Food Processing and Preservation 36(4): 320–328 (2012).
22. Babalola, S.O., O.A. Ashaye, A.O. Babalola & J.O. Aina. Effect of cold temperature storage on the quality attributes of pawpaw and guava leathers. African Journal of Biotechnology 1(2): 61-63 (2002).
23. Sharma, S.K., S.P. Chaudhary, V.K. Rao, Yadav & T.S. Bisht. Standardization of technology for preparation and storage of wild apricot fruit bar. Journal of Food Science and Technology 50(4): 784-790 (2013).
Effect of Antioxidants on Storage Quality of Apple Sucrose Bars 175
24. Jain, P.K. & P.K. Nema. Processing of pulp of various cultivars of guava (Psidiumguajaval) for leather production. Agricultural Engineering International 9: 1-9 (2007).
25. Ashaye, O.A., S.O. Babalola, A.O. Babalola, J.O. Aina & S.B. Fasoyiro, Chemical and organoleptic characterization of pawpaw and guava leathers. World Journal of Agricultural Science 1(1): 50-51 (2005).
26. Johnson, M. & M. Hessel. Stability of ascorbic acid in ready to drink juices. Varfoda 34(5): 267-279 (1982).
27. Gupta, G.K. Standardisation of recipie for preparation of sweet papaya chutney. Beverage and Food World 32(11): 80-81 (2000).
28. Manu, M.L., I. Oduro & A. Addo. Effect of dextrinized sweet potatoes on the physicochemical and sensory quality of infrared dried mango leather. Journal of Food Processing and Technology 4: 5 (2013).
29. Huang, X. & F.H. Hsieh. Physical properties, sensory attributes and consumer preference of pear fruit leather. Journal of Food Science 70: 177–186 (2005).
30. Irwandi, J., Y.B. CheMan, S. Yusof, S. Jinap & H. Sugisawa, Effects of type of packaging materials on physicochemical, microbiological and sensory characteristics of durian fruit leather during storage. Journal of Food Science and Agriculture 76: 427-434 (1998).
31. Azeredo, H.M.C., E.S. Brito, G.E.G. Moreira, V.L. Farais & L.M. Bruno. Effect of drying and storage time on the physicochemical properties of mango leathers. International Journal of Food Science and
Technology 41: 635-638 (2006).32. Phimpharian, C., A. Jangchud, K. Jangchud,
N. Therdthai, W. Prinyawiwatkul & H.K. No. Physicochemical characteristics and sensory optimization of pineapple leather snack as affected by glucose syrup and pectin concentrations. International Journal of Food Science and Technology 46: 972–981 (2011).
33. Ayub, M., R. Khan, A. Zeb, S. Wahab & J. Muhammad. Influence of various sweeteners and their concentrations during osmosis on the water activity and shelf stability of intermediate moisture of guava slices. Sarhad Journal of Agriculture 7(3): 361-368 (1996).
34. Riaz, M.N., G. Mohyuddin & M.I. Al Haq. Physical, chemical and sensory characteristics of jams made from fresh and frozen strawberries. Pakistan Journal of Arid Agriculture 2(1): 51-60 (1999).
35. Ehsan, E.B., Z.P. Naeem, A., Javed & A. Nazi. Development standardization and storage studies on grape fruit apple marmalade. Pakistan Journal of Food Sciences 12(3-4): 21-24 (2003).
36. Pota, S.O., S. Ketsa & M.L.C. Thongtham. Effect of packaging material and temperature on quality and storage life of pomegranate fruits. Kasetsart Journal of Natural Science 23(4): 328-333 (1987).
37. Pomeranz, Y., & C.E. Meloan. Food Analysis: Theory and Practice, 3rd ed. Aspan Publishers, Gaithersbury Maryland, 416 pp. (2000).
38. Adedeji, A.A., T.K. Gachovska, M.O. Ngadi & G.S.V. Raghavan. Effect of pretreatment on the drying characteristic of okra. Drying Technology 26: 1251–1256 (2006).
Related Documents