Temporal Methods Seminar April 2013 Temporal Methods Seminar 1:00 to 5:00 PM Wednesday April 17 th 2013 Seminar Leaders: Suzanne Pecore General Mills Inc Chris Findlay Compusense Inc Sarah Kirkmeyer Givaudan Inc.

Welcome message from author
This document is posted to help you gain knowledge. Please leave a comment to let me know what you think about it! Share it to your friends and learn new things together.
Transcript
Temporal Methods Seminar April 2013
Temporal Methods Seminar
1:00 to 5:00 PM Wednesday April 17th 2013
Seminar Leaders: Suzanne Pecore General Mills Inc Chris Findlay Compusense Inc Sarah Kirkmeyer Givaudan Inc.
Temporal Methods Seminar April 2013
Temporal Methods Seminar April 2013
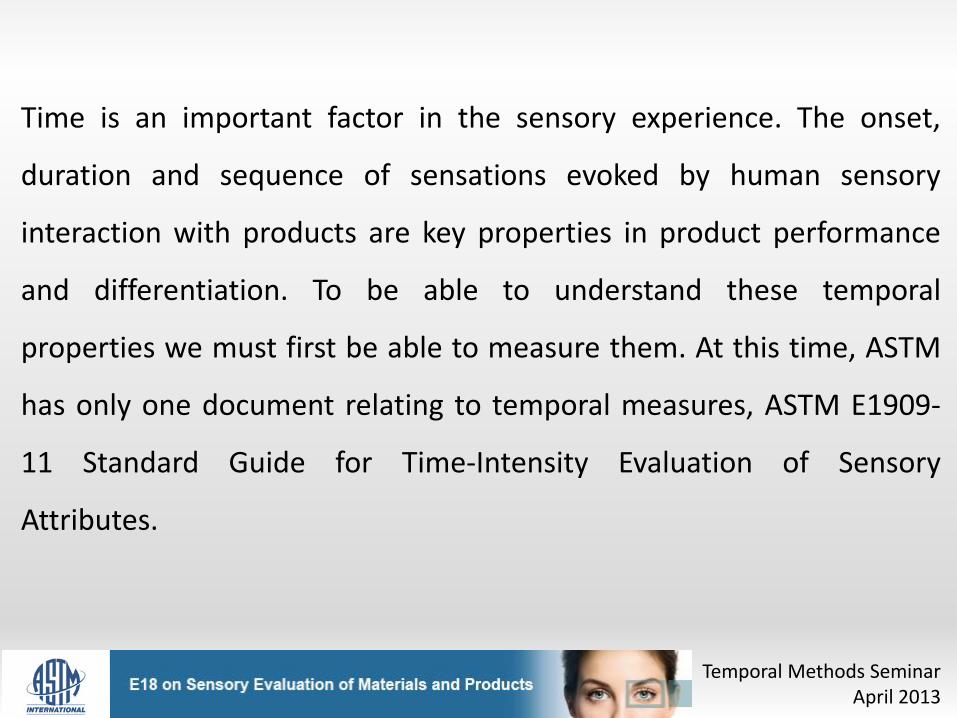
Time is an important factor in the sensory experience. The onset,
duration and sequence of sensations evoked by human sensory
interaction with products are key properties in product performance
and differentiation. To be able to understand these temporal
properties we must first be able to measure them. At this time, ASTM
has only one document relating to temporal measures, ASTM E1909-
11 Standard Guide for Time-Intensity Evaluation of Sensory
Attributes.

I max
T max Dur
AUC
Inc AUC Dec AUC
Dec Angle Inc Angle
STANDARDIZED PARAMETERS FROM T-I CURVES
Tmax – time at maximum intensity
Imax – maximum intensity
DUR – duration
AUC – area under curve
Inc. Angle – increase angle
Inc. Area – increase area
Dec. Angle – decrease angle
Dec. Area – decrease area
Time Intensity Parameters
Analyzing Curve Parameters
Temporal Methods Seminar April 2013

Temporal Methods Seminar April 2013
A number of newer methods have been developed and are being used
by sensory researchers around the world. In the interest of learning
more about these methods and considering their inclusion in the
ASTM publications, this seminar will focus on three of those methods
and provide participants with a “Hands-on” experience with real
products and real data collection.
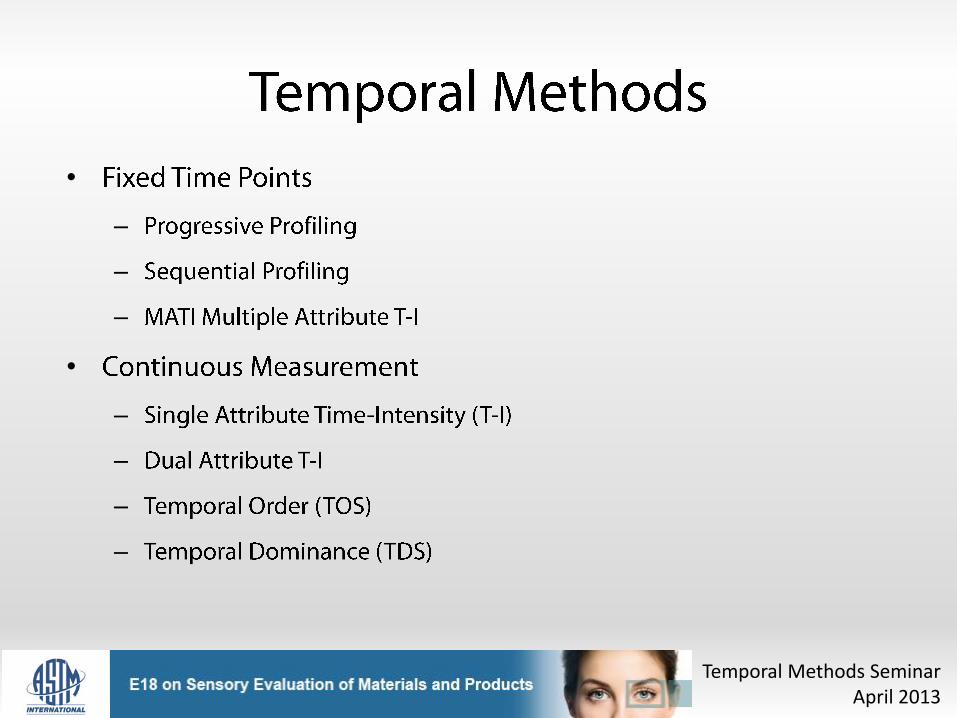
•
–
–
–
•
–
–
–
–
Temporal Methods Seminar April 2013
Temporal Methods Seminar April 2013
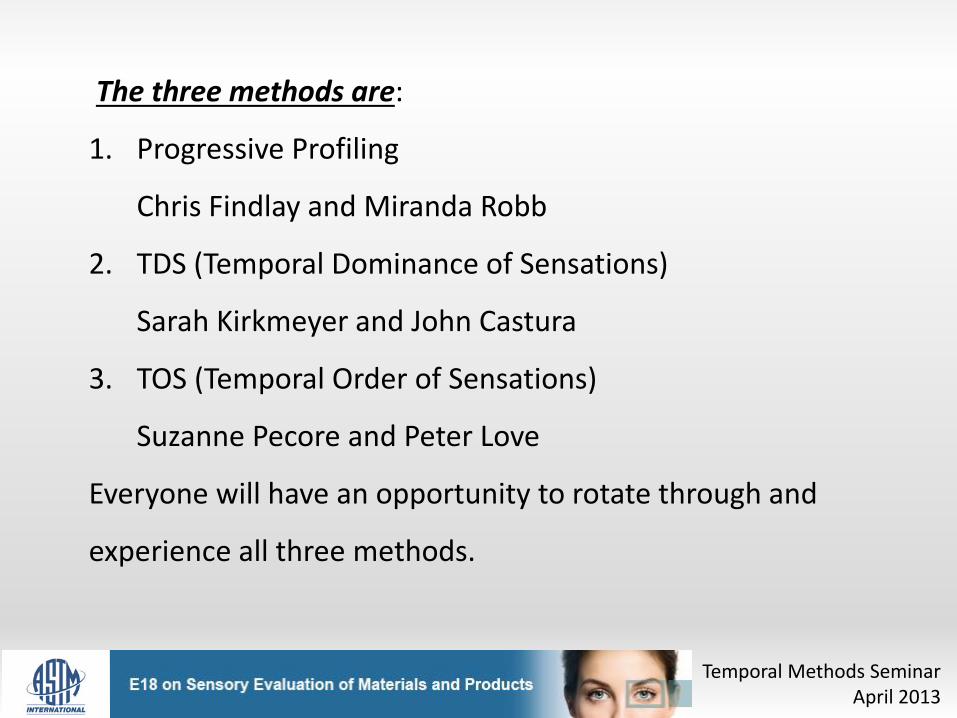
The three methods are:
1. Progressive Profiling
Chris Findlay and Miranda Robb
2. TDS (Temporal Dominance of Sensations)
Sarah Kirkmeyer and John Castura
3. TOS (Temporal Order of Sensations)
Suzanne Pecore and Peter Love
Everyone will have an opportunity to rotate through and
experience all three methods.

Temporal Methods Seminar April 2013
The final part of the seminar will be devoted to analysis, interpretation
and evaluation of the strengths, weaknesses and challenges of these
temporal methods. Participants will be able to determine the ease of use
by panelists, the clarity of results, the skills required for the analyst and
finally the potential value to their business.
E18 will be able to consider developing a new document or documents on
Temporal Methods
Temporal Methods Seminar April 2013
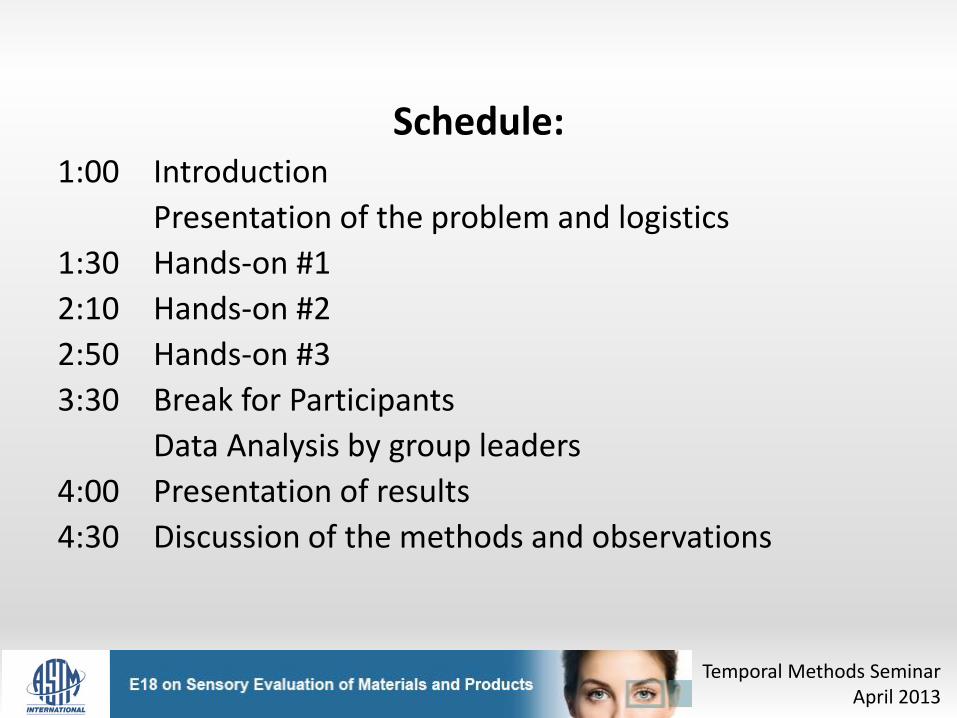
Schedule: 1:00 Introduction
Presentation of the problem and logistics
1:30 Hands-on #1
2:10 Hands-on #2
2:50 Hands-on #3
3:30 Break for Participants
Data Analysis by group leaders
4:00 Presentation of results
4:30 Discussion of the methods and observations
Temporal Methods Seminar April 2013
Application of Temporal Methods Problem Statement

Project Objective
• The E18 Snack Bar is being reformulated to improve its health credentials.
• Goal is to match the sensory characteristics of the current E18 Bar as closely as possible.
Temporal Methods Seminar April 2013
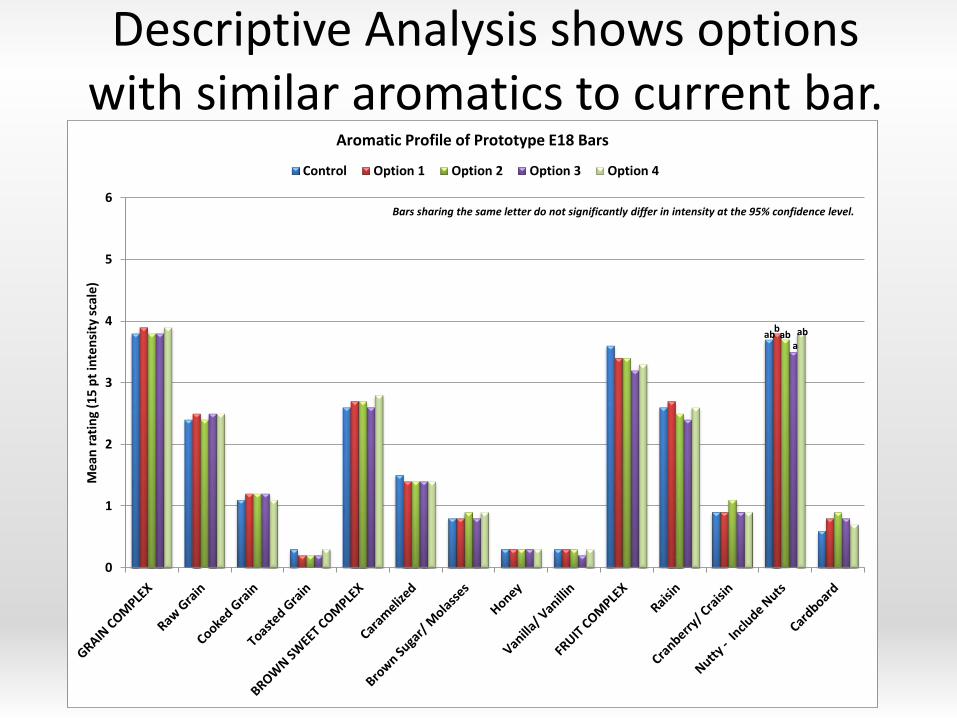
Descriptive Analysis shows options with similar aromatics to current bar.
0
1
2
3
4
5
6
Mea
n r
atin
g (1
5 p
t in
ten
sity
sca
le)
Aromatic Profile of Prototype E18 Bars
Control Option 1 Option 2 Option 3 Option 4
ab ababb
a
Bars sharing the same letter do not significantly differ in intensity at the 95% confidence level.

Descriptive Analysis also shows potential issues with the temporal taste profile.
0
1
2
3
4
5
6
Sweet 60 Sec Sweet Salt Sour 60 Sec Sour Bitter 60 Sec Bitter
Mea
n R
atin
g (1
5 p
t in
ten
sity
sca
le)
Tastes/Aftertastes of Prototype E18 Bars
Control Option 1 Option 2 Option 3 Option 4
ab
abab
b
a
Bars sharing the same letter do not significantly differ in intensity at the 95% confidence level.
Option 2, for example, is less sweet in-mouth, but with more lingering sweet taste.
Temporal Study
• Objective is to understand if the temporal profile has been affected by the reformulation of the E18 bar, and
• To identify a formulation option that more closely matches the Control bar.
Temporal Methods Seminar April 2013

Attributes To Be Evaluated By The Temporal Methods
Attributes Definition
Grain Aromatics associated with grains such as oat, wheat, etc. An overall grain aromatic, inclusive of raw, cooked and toasted aspects.
Caramelized Aromatic associated with caramelized sucrose or browned sugars
Dried Fruit A brown sweet aromatic associated with dried fruits such as raisins and prunes.
Nutty Aromatics associated with nut meats such as almonds. An overall nutty aromatic, inclusive of raw and roasted aspects.
Sweet Taste on the tongue stimulated by sugars and potent sweeteners; reference is sucrose in water.
Temporal Methods Seminar April 2013
Evaluation Protocol
• Bite through the bar with incisors, about ½ inch into bar.
• Try to sample a representative section of bar, i.e., avoid large particulates. (Can break-up bar to reach representative sections.)
• Chew bar with molar teeth.
• Start of timing should coincide with first chew. (Details provided at each station.)
• Expectorating is encouraged!
Temporal Methods Seminar April 2013

Logistics • Three samples: 227, 648, 950
• Evaluated as two pairs:
Group 1 (Blue circle) : 227 vs. 950
Group 2 (Red triangle): 227 vs. 648
• You are assigned to Group 1 or Group 2
• Each Group will evaluate the same pair at each of three stations:
Station 1 (A) Room 307: Progressive Profiling
Station 2 (B) Room 308: TDS
Station 3 (C) Room 309: TOS
• Observations collected at each station
Temporal Methods Seminar April 2013
Temporal Methods Seminar April 2013
Temporal Methods Seminar
Progressive Profiling
Chris Findlay Miranda Robb Compusense Inc
Temporal Methods Seminar April 2013
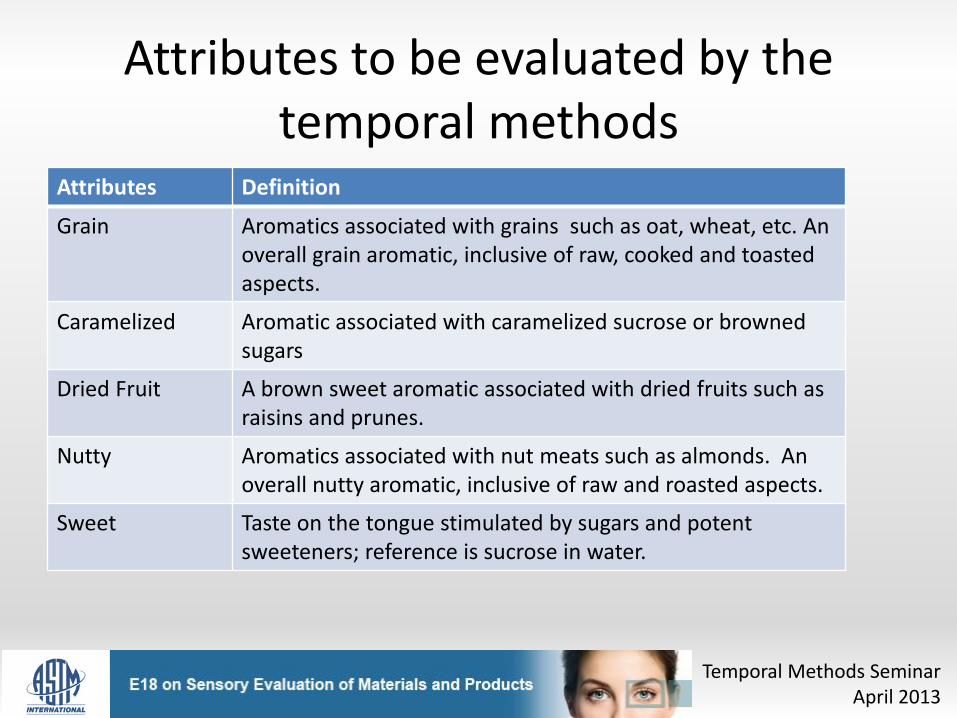
Attributes to be evaluated by the temporal methods
Attributes Definition
Grain Aromatics associated with grains such as oat, wheat, etc. An overall grain aromatic, inclusive of raw, cooked and toasted aspects.
Caramelized Aromatic associated with caramelized sucrose or browned sugars
Dried Fruit A brown sweet aromatic associated with dried fruits such as raisins and prunes.
Nutty Aromatics associated with nut meats such as almonds. An overall nutty aromatic, inclusive of raw and roasted aspects.
Sweet Taste on the tongue stimulated by sugars and potent sweeteners; reference is sucrose in water.
Temporal Methods Seminar April 2013
Temporal Methods Seminar April 2013
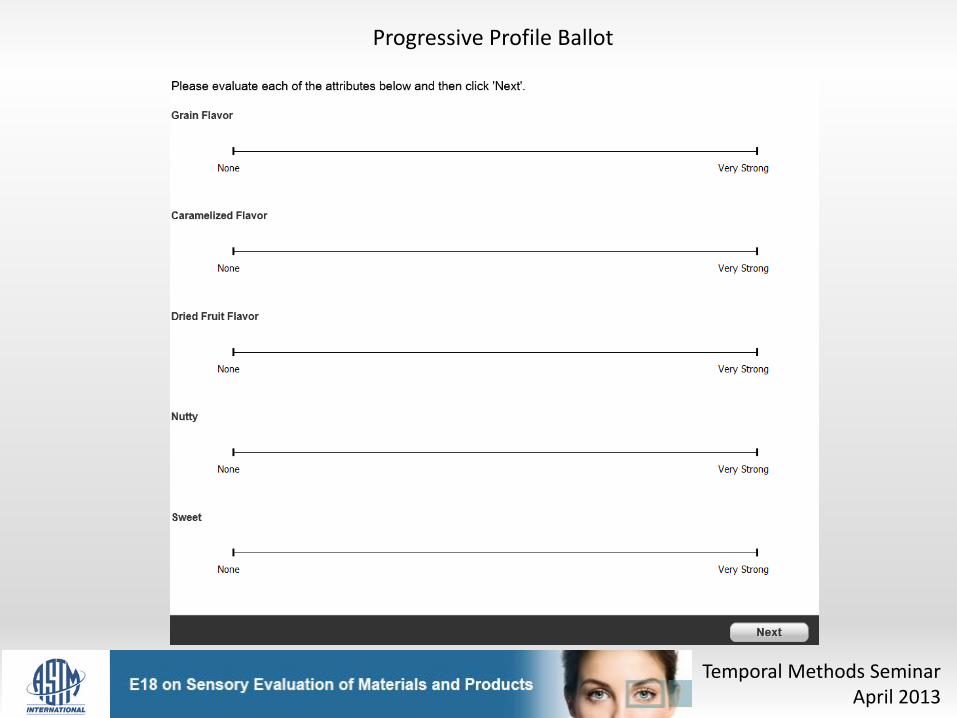
Progressive Profile Ballot

Temporal Methods Seminar April 2013

Temporal Methods Seminar April 2013

Temporal Methods Seminar April 2013

Observations
Temporal Methods Seminar April 2013
• Thoughts / Insights as you experience this approach?
• Build on comments from prior groups (see flip charts)

LET’S COLLECT SOME DATA
Temporal Methods Seminar April 2013
Temporal Methods Seminar April 2013
Temporal Order of Sensations
Session Leaders: Suzanne Pecore General Mills Inc Peter Love Compusense Inc

What is TOS?
• TOS is a technique to measure the order that key attributes appear over the eating experience, i.e., over several spoonfuls and into the aftertaste
Temporal Methods Seminar April 2013

Evaluation Protocol
• Bite through the bar with incisors, about ½ inch into bar.
• Try to sample a representative section of bar, i.e., avoid large particulates. (Can break-up bar to reach representative sections.)
• Chew bar with molar teeth.
• Start of timing should coincide with first chew.
• Expectorating is encouraged!
Temporal Methods Seminar April 2013

Specifics of E18 Bar Evaluation • You will see one of two pairs:
Group 1: 227 vs. 648
Group 2: 227 vs. 950
• Focus is to identify the appearance, in order, of the first three attributes from a possible six attributes.
• Repeated THREE TIMES
• 4th bite is chewed 10-12 times, then most intense aftertaste is selected 10 seconds after expectoration.
Temporal Methods Seminar April 2013
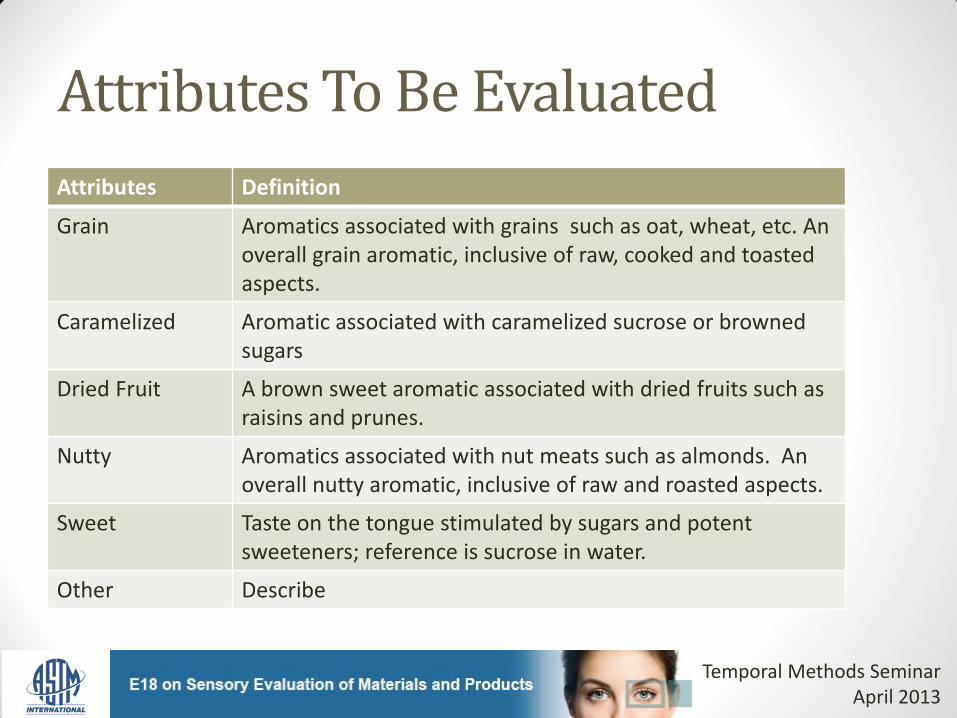
Attributes To Be Evaluated
Attributes Definition
Grain Aromatics associated with grains such as oat, wheat, etc. An overall grain aromatic, inclusive of raw, cooked and toasted aspects.
Caramelized Aromatic associated with caramelized sucrose or browned sugars
Dried Fruit A brown sweet aromatic associated with dried fruits such as raisins and prunes.
Nutty Aromatics associated with nut meats such as almonds. An overall nutty aromatic, inclusive of raw and roasted aspects.
Sweet Taste on the tongue stimulated by sugars and potent sweeteners; reference is sucrose in water.
Other Describe
Temporal Methods Seminar April 2013
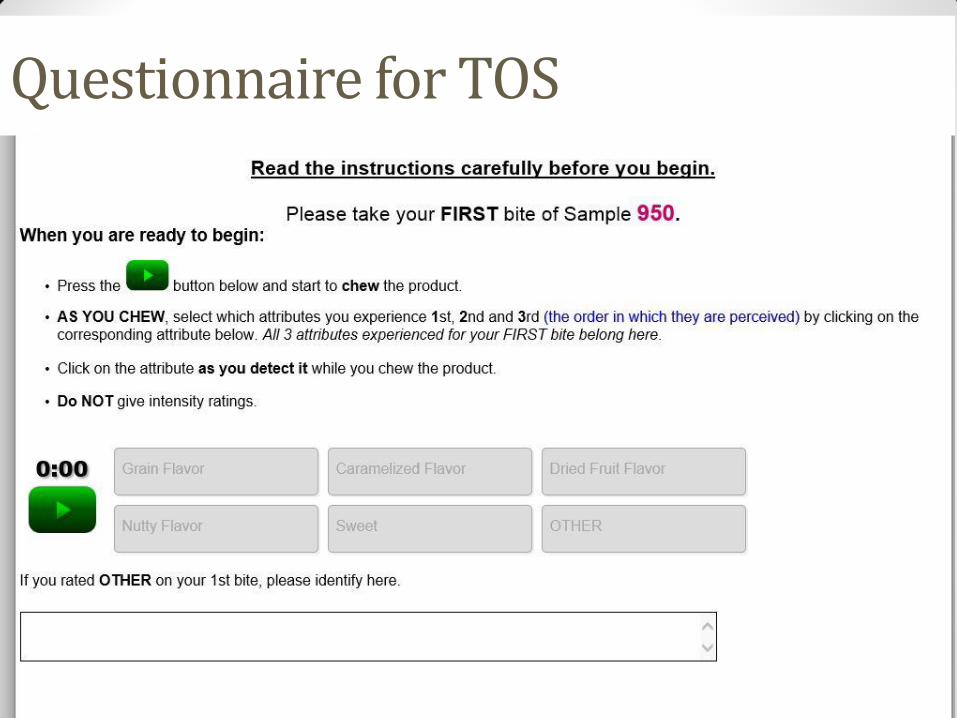
Questionnaire for TOS
Observations
Temporal Methods Seminar April 2013
• Thoughts / Insights as you experience this approach?
• Build on comments from prior groups (see flip charts)

Introduction to TDS Sarah V. Kirkmeyer, Givaudan
John Castura, Compusense
ASTM - April 2013
Temporal Methods Seminar
April 2013
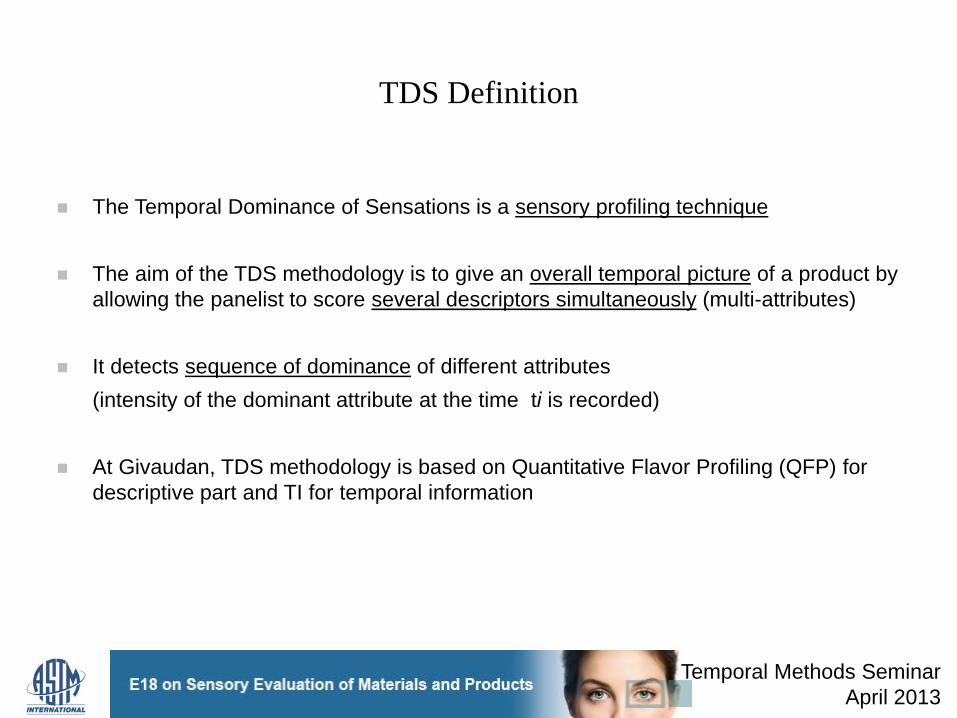
TDS Definition
The Temporal Dominance of Sensations is a sensory profiling technique
The aim of the TDS methodology is to give an overall temporal picture of a product by
allowing the panelist to score several descriptors simultaneously (multi-attributes)
It detects sequence of dominance of different attributes
(intensity of the dominant attribute at the time ti is recorded)
At Givaudan, TDS methodology is based on Quantitative Flavor Profiling (QFP) for
descriptive part and TI for temporal information
Temporal Methods Seminar
April 2013
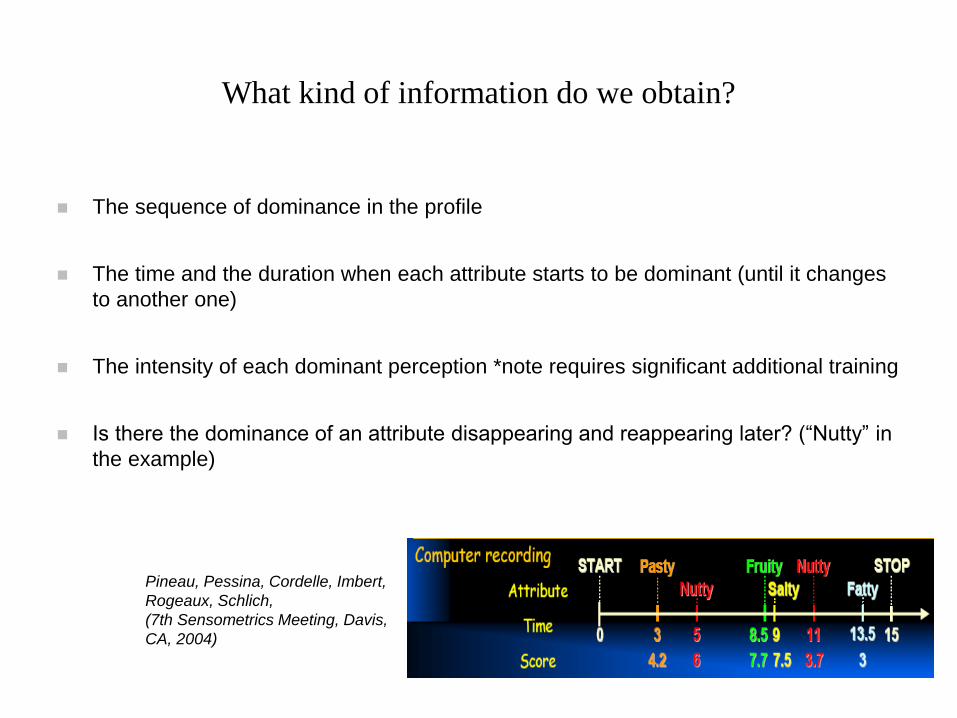
What kind of information do we obtain?
The sequence of dominance in the profile
The time and the duration when each attribute starts to be dominant (until it changes
to another one)
The intensity of each dominant perception *note requires significant additional training
Is there the dominance of an attribute disappearing and reappearing later? (“Nutty” in
the example)
Pineau, Pessina, Cordelle, Imbert,
Rogeaux, Schlich,
(7th Sensometrics Meeting, Davis,
CA, 2004)
General Training sessions
Learning instruments/descriptive attributes
Recognize instruments/descriptive attributes quickly at the first note/perception
Learning sequencing
Check that sequencing and time dependent is understood
Learn sequencing taking into account the intensity
Defining dominance
Sequence then scoring
Dominance, NOT intensity
Dominance scale is a proportion
Temporal Methods Seminar
April 2013
The process with food products
Defining language used
Defining in mouth and after swallowing profile, protocol of tasting
Defining temporality flavor beginning/middle/end
Checking time of shift
Checking score
Temporal Methods Seminar
April 2013

Interpreting Results
6
Remember Dominance, NOT intensity
Dominance scale is a proportion
Significance line keeps the focus on the meaningful output
Do not create chances for obsessing over noise
Highlight the main points/conclusions
Useful to compare two TDS curves side by side when comparing samples or products
Temporal Methods Seminar
April 2013

Attributes To Be Evaluated
Attributes Definition
Grain Aromatics associated with grains such as oat, wheat,
etc. An overall grain aromatic, inclusive of raw, cooked
and toasted aspects.
Caramelized Aromatic associated with caramelized sucrose or
browned sugars
Dried Fruit A brown sweet aromatic associated with dried fruits
such as raisins and prunes.
Nutty Aromatics associated with nut meats such as almonds.
An overall nutty aromatic, inclusive of raw and roasted
aspects.
Sweet Taste on the tongue stimulated by sugars and potent
sweeteners; reference is sucrose in water.
Temporal Methods Seminar
April 2013

What do we ask the panel?
Observations
Temporal Methods Seminar
April 2013
Thoughts / Insights as you experience this approach?
Build on comments from prior groups (see flip charts)

Temporal Methods Seminar April 2013
Temporal Methods Seminar Conclusion 4:00 to 5:00 PM
Wednesday April 17th 2013
Break out Groups: Progressive Profile Chris Findlay Compusense TDS Sarah Kirkmeyer Givaudan TOS Suzanne Pecore General Mills

Temporal Methods Seminar April 2013
The intent of the final session in the seminar:
Analysis, interpretation and evaluation of the strengths, weaknesses and
challenges of these temporal methods, the ease of use by panelists, the
clarity of results, the skills required for the analyst and finally the
potential value to any business.
The outcome for ASTM:
E18 will be able to commence developing a new document or documents
on Temporal Methods.

Temporal Methods Seminar April 2013
Data Analysis

• Each data point is made up of the 5 well-defined attributes whose intensity has been scored on an unstructured line-scale anchored at 0 and 100
• Timing is achieved by specific pauses between data points. A well-trained and calibrated panel will be recording data at very similar times. Our seminar panelists have been disrupted by connectivity problems, lack of practice and distraction.
• The time points were planned to be as follows – Initial point about 10 seconds
– Point 2 about 30 seconds
– Point 3 20 seconds after 2nd Bite
– Point 4 20 seconds after 3rd Bite
– Aftertaste 30 seconds after swallowing or spitting the 3rd Bite
• Total time elapsed, about 3 minutes
• Exact time stamps may be collected to achieve individual timing of panelists for training and analysis. Analysis has yet to be developed for this data.
Temporal Methods Seminar April 2013

Temporal Methods Seminar April 2013
Test Name: Progressive Profiling 227 Combined from Both Groups
# of Evaluations: 46 23 Per Group
Summary Results
Multiple Comparison Test Used: Tukey's HSD 0.05
Attribute Title time p value HSD value 950 227 648
Grain Flavor 1 0.06 9.96 50.78 a 41.15 a 41.91 a
Caramelized Flavor 1 0.07 10.51 36.87 a 33.46 ab 25.43 b
Dried Fruit Flavor 1 0.11 12.36 47.7 a 37.67 a 36.78 a
Nutty 1 0.1 11.23 52.39 a 42.13 a 45.26 a
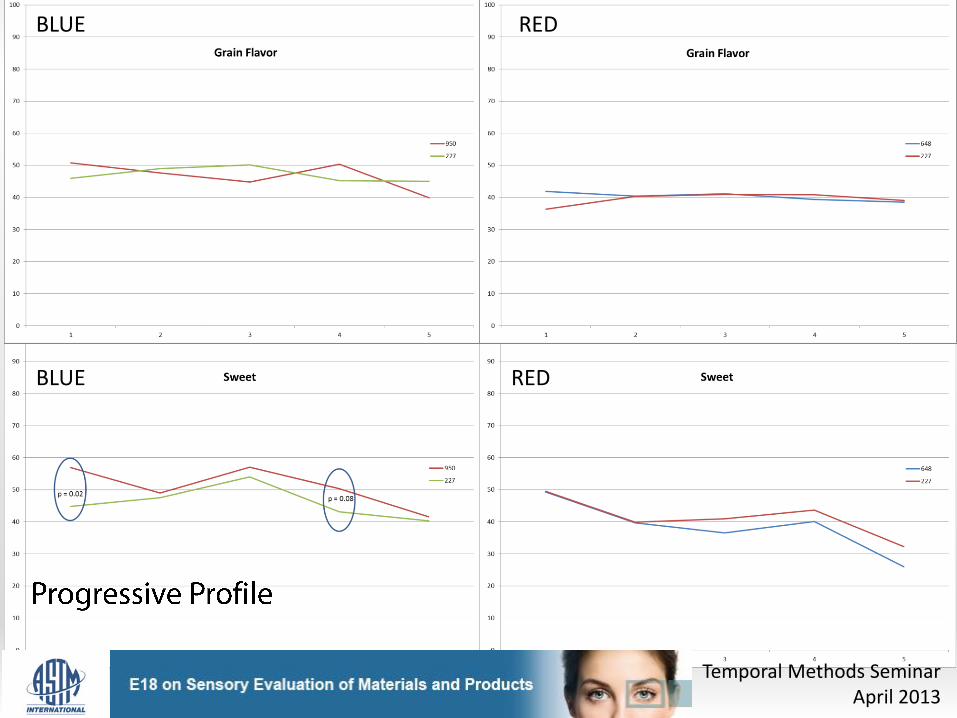
Sweet 1 0.05 9.42 56.91 a 47.13 b 49.26 ab
Grain Flavor 2 0.45 11.97 47.65 a 44.63 a 40.43 a
Caramelized Flavor 2 0.17 8.45 32.61 a 32.54 a 26.22 a
Dried Fruit Flavor 2 0.39 14.49 40.65 a 38.11 a 31.52 a
Nutty 2 0.38 12.28 48.57 a 41.43 a 43.83 a
Sweet 2 0.1 9.02 49 a 43.72 ab 39.65 b
Grain Flavor 3 0.41 8.12 44.78 a 45.54 a 41.09 a
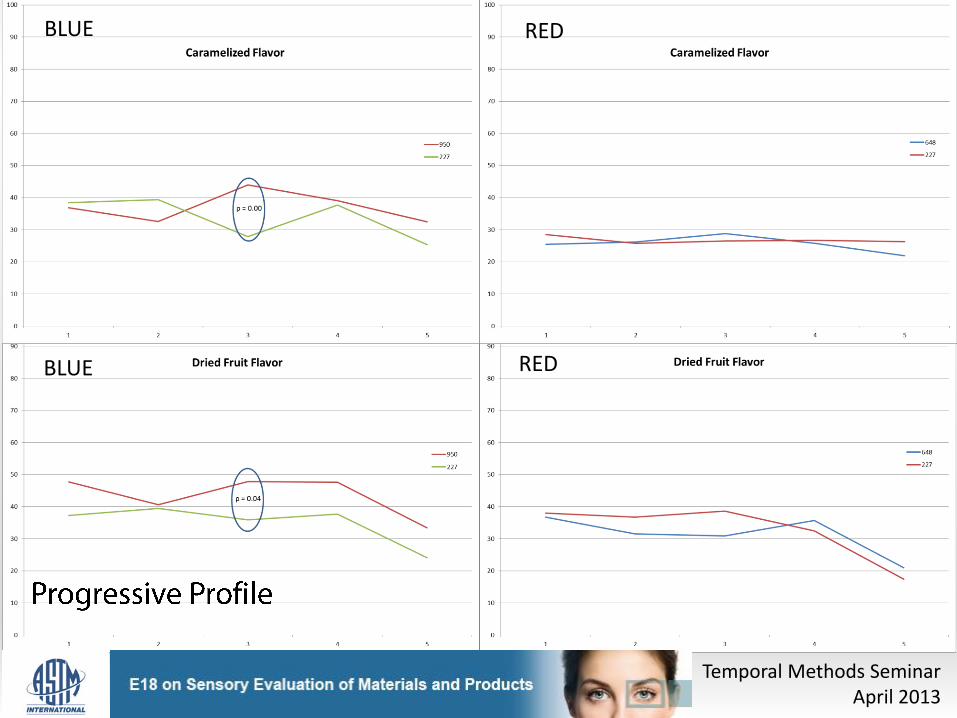
Caramelized Flavor 3 0 7.62 43.96 a 27.2 b 28.78 b
Dried Fruit Flavor 3 0.01 10.5 47.83 a 37.3 b 30.91 b
Nutty 3 0.2 8.3 45.57 a 44.43 a 39 a
Sweet 3 0 6.34 57.04 a 47.48 b 36.57 c
Grain Flavor 4 0.02 8.14 50.39 a 43.04 ab 39.35 b
Caramelized Flavor 4 0.01 8.23 39.09 a 32.17 ab 25.74 b
Dried Fruit Flavor 4 0.04 12.32 47.65 a 35.09 b 35.65 ab
Nutty 4 0.02 9.71 44.22 a 45.09 a 33.83 b
Sweet 4 0.01 7.15 50.3 a 43.39 ab 40.04 b
Grain Flavor 5 0.57 8.21 39.91 a 42.04 a 38.57 a
Caramelized Flavor 5 0.04 8.69 32.43 a 25.83 ab 21.91 b
Dried Fruit Flavor 5 0.02 11.27 33.43 a 20.7 b 20.91 b
Nutty 5 0.42 11.53 35.91 a 35.46 a 29.7 a
Sweet 5 0.01 10.58 41.52 a 36.26 ab 25.96 b
Summary Analysis of Variance Produced immediately after data collection

Temporal Methods Seminar April 2013
RED Only evaluated 648 and 227
Attribute Title 648 227 p
1 Grain Flavor 41.91 36.3 0.13
1 Caramelized Flavor 25.43 28.52 0.50
1 Dried Fruit Flavor 36.78 38.04 0.83
1 Nutty 45.26 42.26 0.58
1 Sweet 49.26 49.48 0.96
2 Grain Flavor 40.43 40.26 0.98
2 Caramelized Flavor 26.22 25.74 0.83
2 Dried Fruit Flavor 31.52 36.78 0.39
2 Nutty 43.83 41.74 0.76
2 Sweet 39.65 39.91 0.94
3 Grain Flavor 41.09 40.96 0.97
3 Caramelized Flavor 28.78 26.52 0.64
3 Dried Fruit Flavor 30.91 38.65 0.13
3 Nutty 39 42.7 0.35
3 Sweet 36.57 40.96 0.21
4 Grain Flavor 39.35 40.87 0.71
4 Caramelized Flavor 25.74 26.7 0.66
4 Dried Fruit Flavor 35.65 32.48 0.61
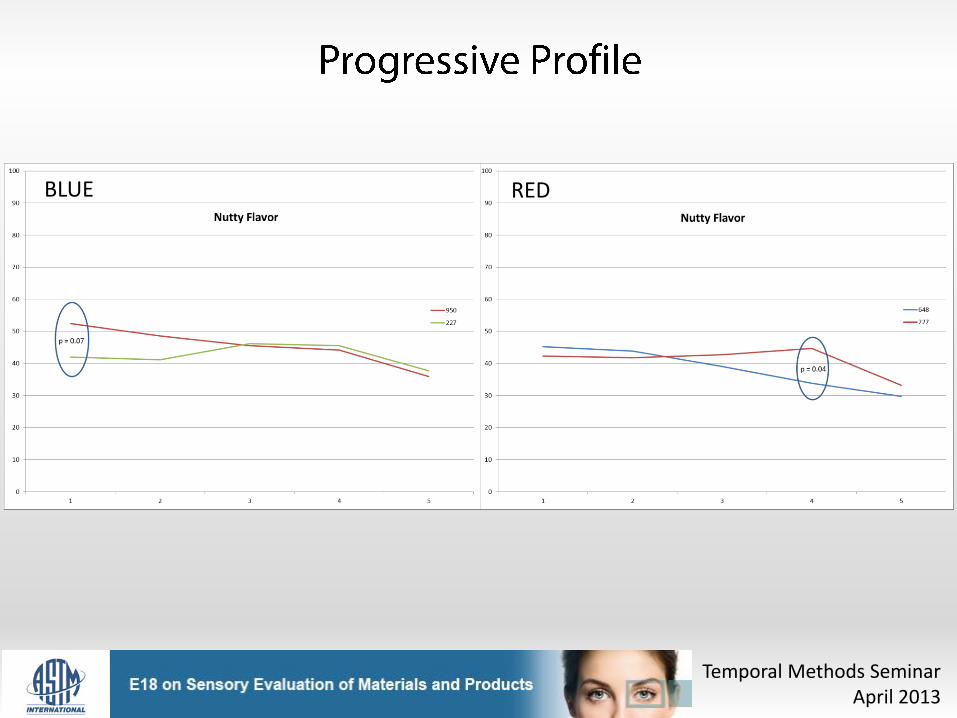
4 Nutty 33.83 44.65 0.07
4 Sweet 40.04 43.61 0.27
5 Grain Flavor 38.57 39.04 0.90
5 Caramelized Flavor 21.91 26.3 0.18
5 Dried Fruit Flavor 20.91 17.35 0.42
5 Nutty 29.7 33.22 0.58
5 Sweet 25.96 32.22 0.28
BLUE Only evaluated 950 and 227
Attribute Title 950 227 p
1 Grain Flavor 50.78 41.15 0.43
1 Caramelized Flavor 36.87 33.46 0.80
1 Dried Fruit Flavor 47.7 37.67 0.11
1 Nutty 52.39 42.13 0.07
1 Sweet 56.91 47.13 0.02
2 Grain Flavor 47.65 44.63 0.82
2 Caramelized Flavor 32.61 32.54 0.22
2 Dried Fruit Flavor 40.65 38.11 0.88
2 Nutty 48.57 41.43 0.13
2 Sweet 49 43.72 0.79
3 Grain Flavor 44.78 45.54 0.20
3 Caramelized Flavor 43.96 27.2 0.00
3 Dried Fruit Flavor 47.83 37.3 0.04
3 Nutty 45.57 44.43 0.89
3 Sweet 57.04 47.48 0.54
4 Grain Flavor 50.39 43.04 0.24
4 Caramelized Flavor 39.09 32.17 0.81
4 Dried Fruit Flavor 47.65 35.09 0.11
4 Nutty 44.22 45.09 0.72
4 Sweet 50.3 43.39 0.08
5 Grain Flavor 39.91 42.04 0.23
5 Caramelized Flavor 32.43 25.83 0.18
5 Dried Fruit Flavor 33.43 20.7 0.18
5 Nutty 35.91 35.46 0.71
5 Sweet 41.52 36.26 0.82
The Blue Group (950 vs 227) and the Red Group (648 vs 227)
Temporal Methods Seminar April 2013
BLUE
BLUE
RED
RED
Temporal Methods Seminar April 2013
BLUE
BLUE RED
RED
Temporal Methods Seminar April 2013
BLUE RED

Temporal Methods Seminar April 2013
Two Controls (227) plotted together.

Preliminary Conclusions
Temporal Methods Seminar April 2013
• Both options, 950 and 648 , show significant differences from sample 227.
• Sample 227 in both Red and Blue groups show great similarity in all attributes at all time points.
• Sample 648 appears to be the closer option given that the only significantly different attribute was Nutty at time point 4.
Temporal Methods Seminar April 2013
TDS Conclusions
Sarah Kirkmeyer Givaudan Flavors John Castura Compusense

Objectives of TDS Evaluation
• To understand if the temporal profile has been affected by the reformulation of the E18 bar, and
• To identify a formulation option that more closely matches the Control bar. That is, among the two pairs, does one sample more closely match 227? – Group 1: 227 vs. 648
– Group 2: 227 vs. 950
Temporal Methods Seminar
April 2013

Grain Flavor
Temporal Methods Seminar April 2013

Grain Flavor
Temporal Methods Seminar April 2013
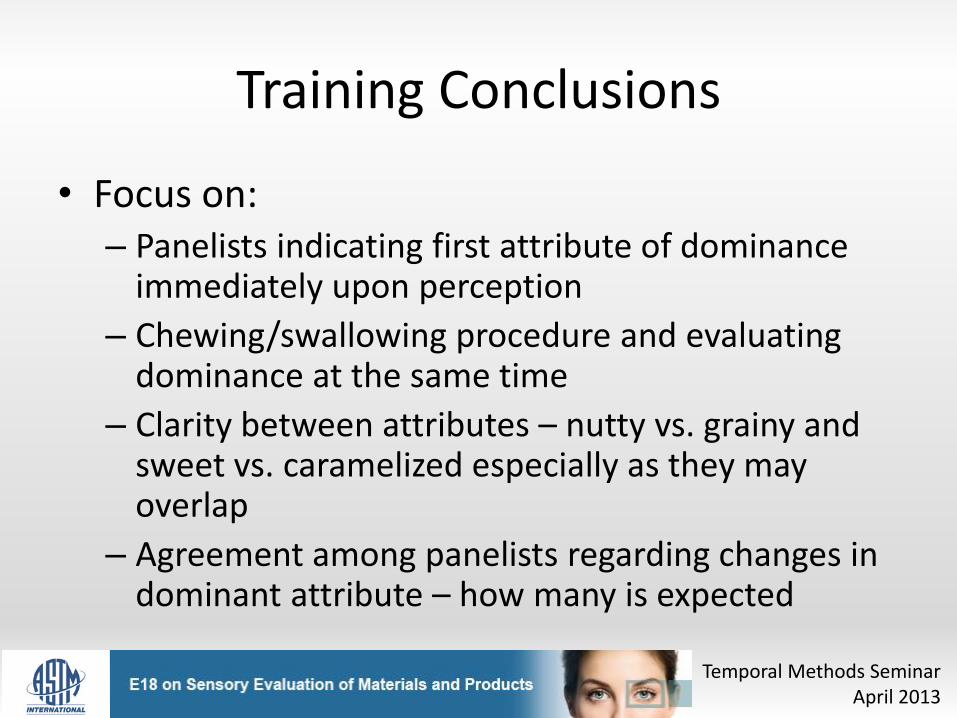
Training Conclusions
• Focus on: – Panelists indicating first attribute of dominance
immediately upon perception
– Chewing/swallowing procedure and evaluating dominance at the same time
– Clarity between attributes – nutty vs. grainy and sweet vs. caramelized especially as they may overlap
– Agreement among panelists regarding changes in dominant attribute – how many is expected
Temporal Methods Seminar April 2013

0 10 20 30 40
0.0
0.2
0.4
0.6
0.8
1.0
TDS Panel Average (smoothed data) - Product 227
Time (seconds)
Do
min
an
ce
(ra
te)
chance
significance
Caramelized Flavor
Dried Fruit Flavor
Grain Flavor
Nutty Flavor
Sweet
TDS – Temporal Dominance
Temporal Methods Seminar April 2013
0 10 20 30 40
0.0
0.2
0.4
0.6
0.8
1.0
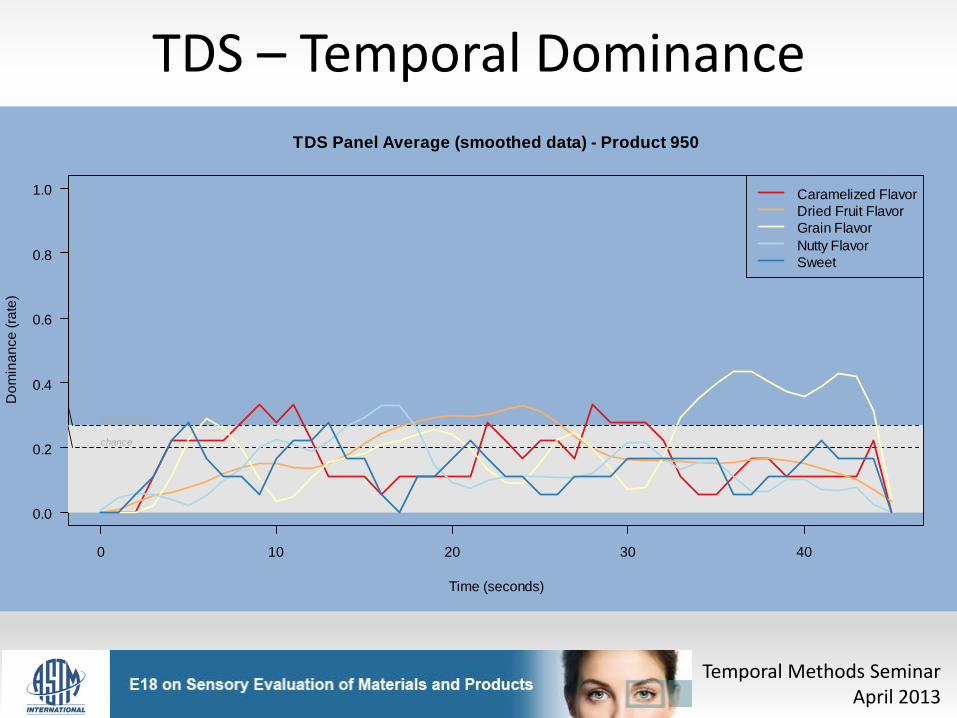
TDS Panel Average (smoothed data) - Product 950
Time (seconds)
Do
min
an
ce
(ra
te)
chance
significance
Caramelized Flavor
Dried Fruit Flavor
Grain Flavor
Nutty Flavor
Sweet
TDS – Temporal Dominance
Temporal Methods Seminar April 2013
TDS Blue Group Results
• During 20 second chew: – 227 showed dominance progression of Grain Nutty
Caramelized
– 950 not clear for Grain initially, co-dominant with Sweet then Caramelized Nutty
• After swallow at 20 sec, 950 dominant for dried fruit and might consider lack of training or effect of heterogeneous product for 227 not showing dominance for Dried Fruit versus Sweet
• 227 showed Sweet and Grain linger, 950 showed Caramelized and Grain linger
Temporal Methods Seminar April 2013

0 10 20 30 40
0.0
0.2
0.4
0.6
0.8
1.0
TDS Panel Average (smoothed data) - Product 227
Time (seconds)
Do
min
an
ce
(ra
te)
chance
significance
Caramelized Flavor
Dried Fruit Flavor
Grain Flavor
Nutty Flavor
Sweet
TDS – Temporal Dominance
Temporal Methods Seminar April 2013
0 10 20 30 40
0.0
0.2
0.4
0.6
0.8
1.0
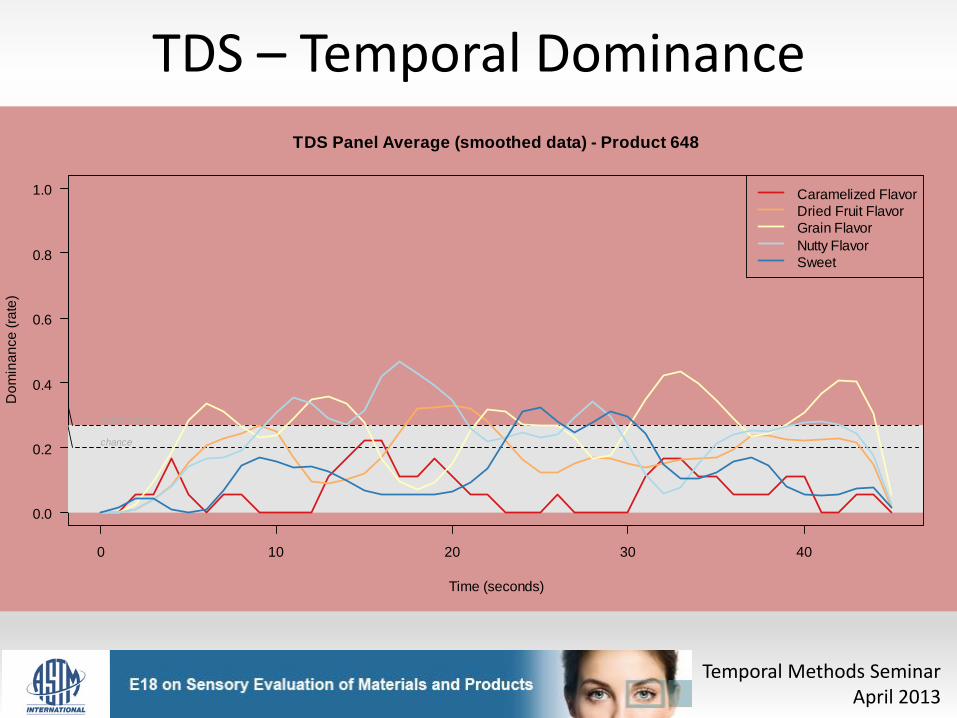
TDS Panel Average (smoothed data) - Product 648
Time (seconds)
Do
min
an
ce
(ra
te)
chance
significance
Caramelized Flavor
Dried Fruit Flavor
Grain Flavor
Nutty Flavor
Sweet
TDS – Temporal Dominance
Temporal Methods Seminar April 2013

TDS Red Group Results
• Chewing occurred for 20 Seconds, during that time:
– Both samples initially showed significance for Grain followed by Nutty
– 648 dominance for Nutty closer to the swallow at 20 sec.
• After swallow, both samples dominant for dried fruit
– Then 648 dominant changed quickly in dominance GrainSweetNutty however 227 dominant for GrainNutty
• Both samples lingered with significant Grain
Temporal Methods Seminar April 2013
Preliminary Conclusions
• Both 648 and 950 show differences in TDS dominance profile versus 227
• Due to lack of training and replicate evaluations, data might not be stable enough to draw firm conclusions
Temporal Methods Seminar April 2013

Temporal Methods Seminar April 2013
Session Leaders: Suzanne Pecore General Mills Inc Peter Love Compusense Inc

Objectives of TOS Study
• To understand if the temporal profile has been affected by the reformulation of the E18 bar, and
• To identify a formulation option that more closely matches the Control bar. That is, among the two pairs, does one sample more closely match 227? – Group 1: 227 vs. 648
– Group 2: 227 vs. 950

Proportion Appearing First
Temporal Methods Seminar April 2013
• This plot helps to quickly see if differences were observed in the up-front attribute.
• Further data analyses can be focused among those attributes appearing above chance.
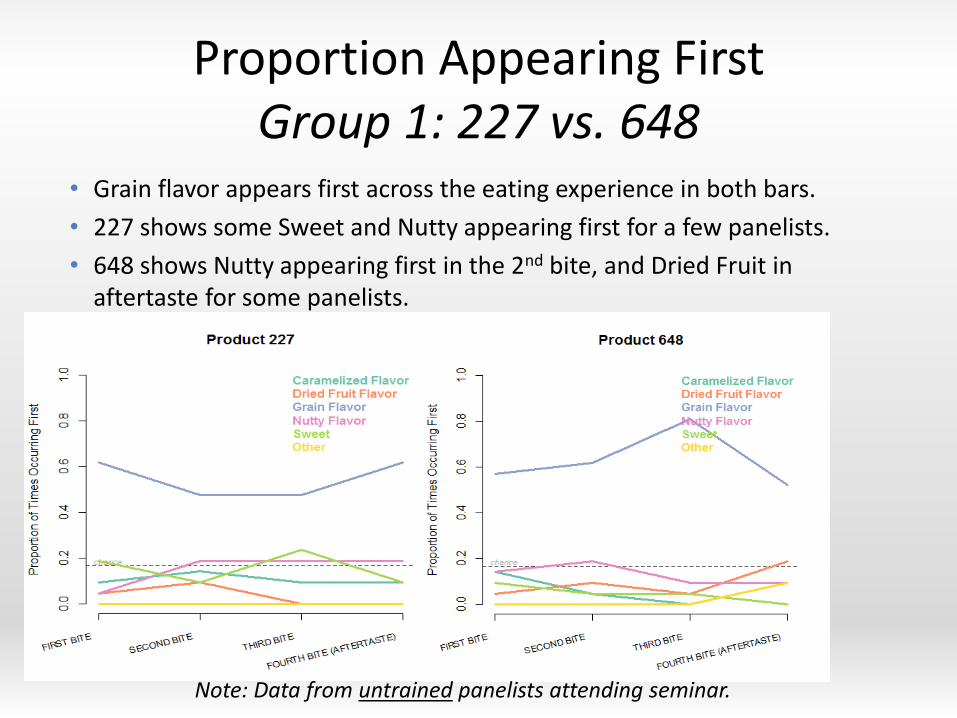
Proportion Appearing First Group 1: 227 vs. 648
• Grain flavor appears first across the eating experience in both bars.
• 227 shows some Sweet and Nutty appearing first for a few panelists.
• 648 shows Nutty appearing first in the 2nd bite, and Dried Fruit in aftertaste for some panelists.
Note: Data from untrained panelists attending seminar.

Proportion Appearing First Group 2: 227 vs. 950
• 950 shows more Caramelized in first two bites, and a strong hit of Grain flavor by the 3rd bite. 227 shows some Sweet in 2nd bite.
• Nutty is other attribute appearing above chance in both bars.
Note: Data from untrained panelists attending seminar.
Weighted Order of Occurrence
Temporal Methods Seminar April 2013
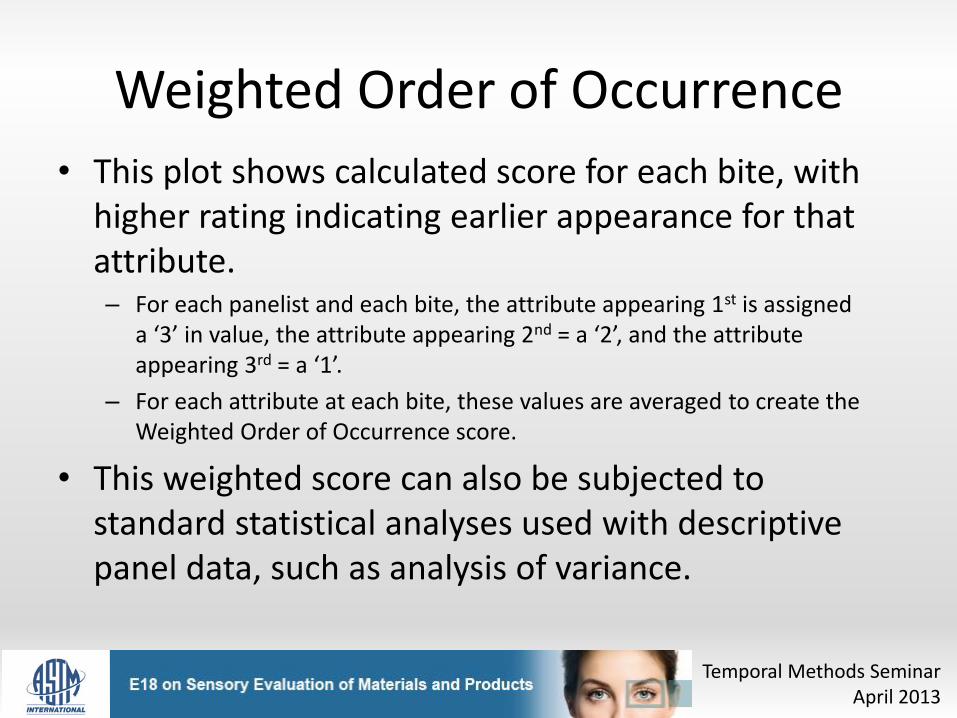
• This plot shows calculated score for each bite, with higher rating indicating earlier appearance for that attribute. – For each panelist and each bite, the attribute appearing 1st is assigned
a ‘3’ in value, the attribute appearing 2nd = a ‘2’, and the attribute appearing 3rd = a ‘1’.
– For each attribute at each bite, these values are averaged to create the Weighted Order of Occurrence score.
• This weighted score can also be subjected to standard statistical analyses used with descriptive panel data, such as analysis of variance.
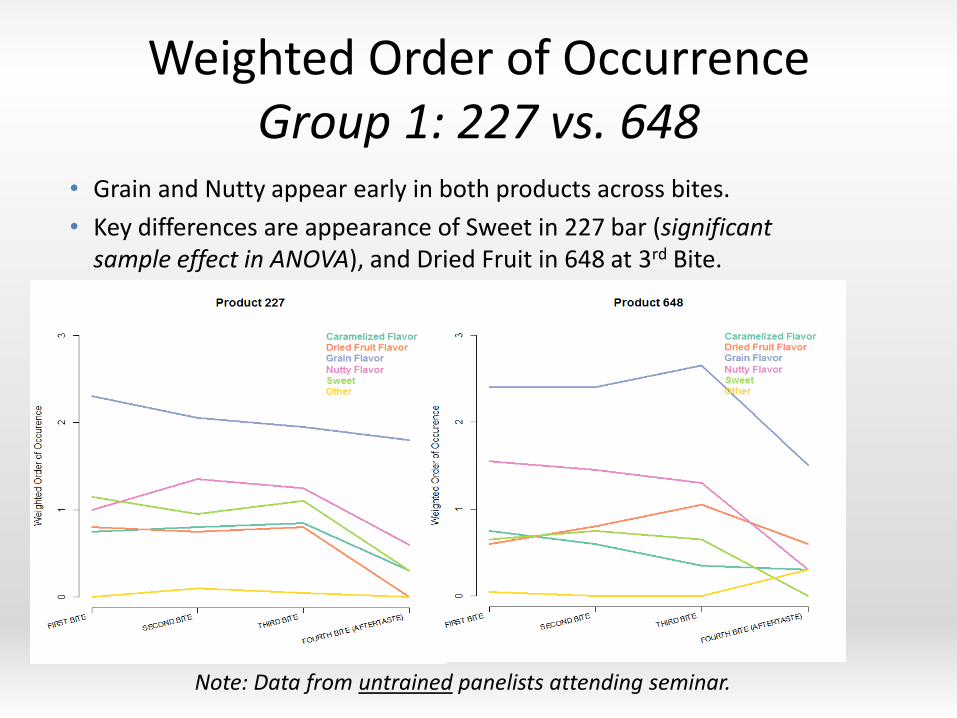
Weighted Order of Occurrence Group 1: 227 vs. 648
• Grain and Nutty appear early in both products across bites.
• Key differences are appearance of Sweet in 227 bar (significant sample effect in ANOVA), and Dried Fruit in 648 at 3rd Bite.
Note: Data from untrained panelists attending seminar.
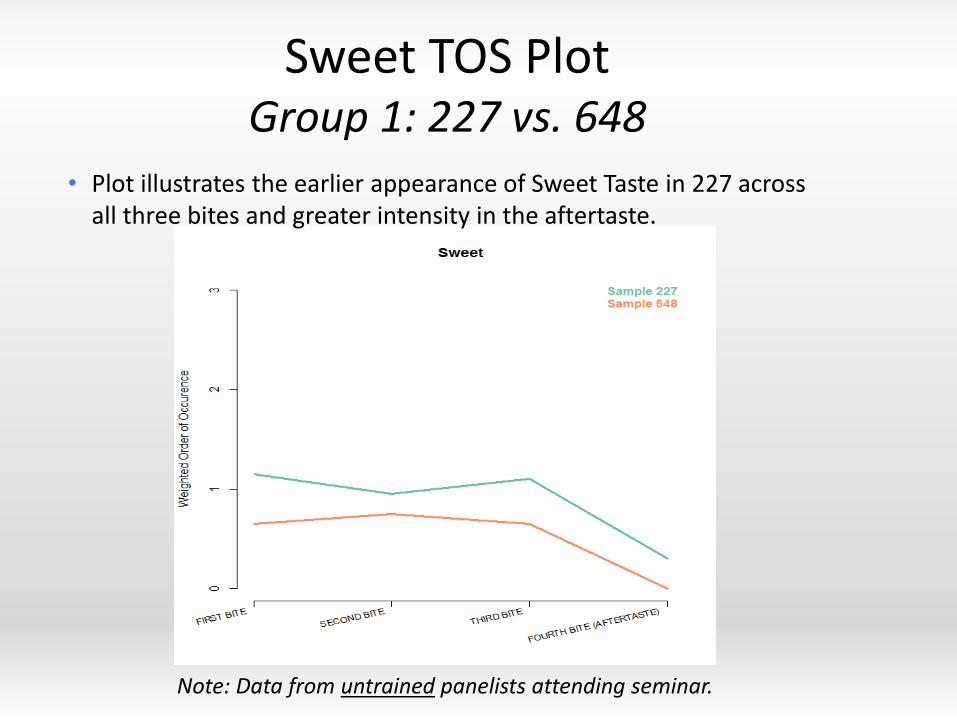
Sweet TOS Plot Group 1: 227 vs. 648
Note: Data from untrained panelists attending seminar.
• Plot illustrates the earlier appearance of Sweet Taste in 227 across all three bites and greater intensity in the aftertaste.
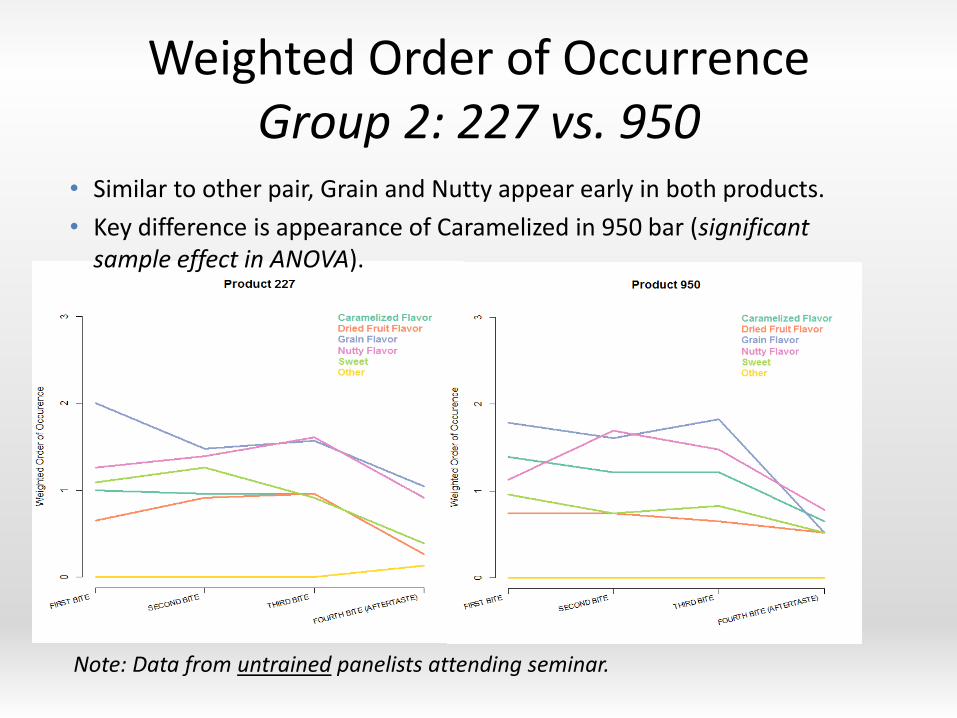
Weighted Order of Occurrence Group 2: 227 vs. 950
Note: Data from untrained panelists attending seminar.
• Similar to other pair, Grain and Nutty appear early in both products.
• Key difference is appearance of Caramelized in 950 bar (significant sample effect in ANOVA).
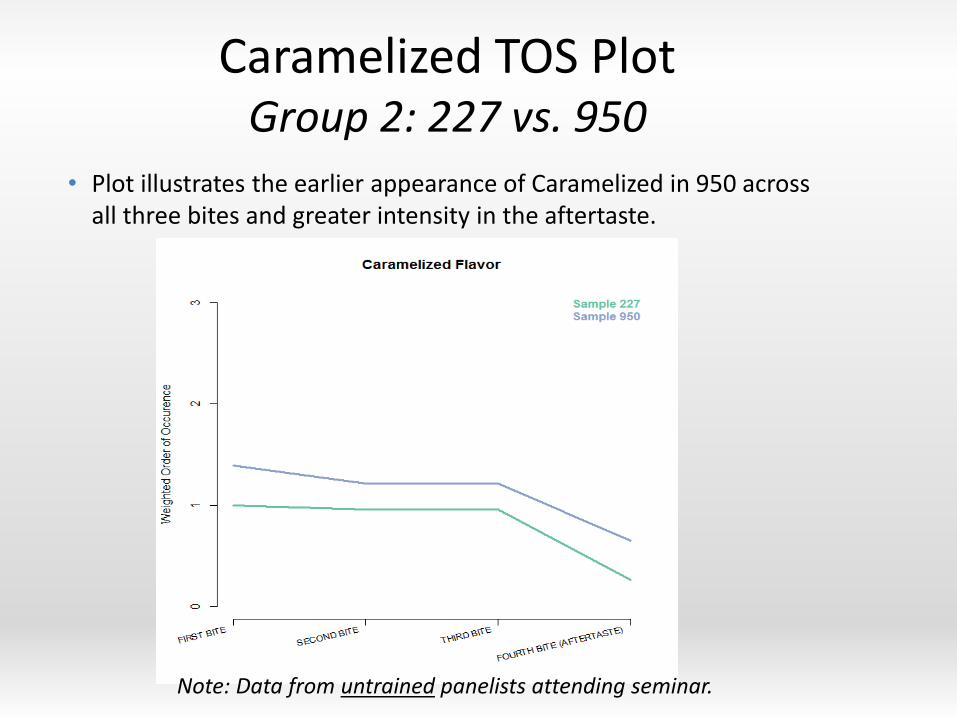
Caramelized TOS Plot Group 2: 227 vs. 950
• Plot illustrates the earlier appearance of Caramelized in 950 across all three bites and greater intensity in the aftertaste.
Note: Data from untrained panelists attending seminar.
Preliminary Conclusions
Temporal Methods Seminar April 2013
• Both options, 648 and 950, show TOS differences from sample 227.
• Due to lack of training among these panelists, data might not be stable enough to draw firm conclusions

Project Objective • The E18 Snack Bar is being reformulated to
improve its health credentials.
• Goal is to match the sensory characteristics of the current E18 Bar as closely as possible.
• How well did the each of the methods answer the question?
• Please draw your own conclusions.
Temporal Methods Seminar April 2013

Observations
• All temporal methods require training and practice to deliver optimal results.
• Each method provided unique temporal information that demonstrated difference amongst the products.
• The data collected in this seminar represent examples for illustrative purposes and do not represent data obtained from well-trained and experienced panelists.
Temporal Methods Seminar
April 2013

Flip Charts for the Breakout Rooms
Please note, these are transposed verbatim and would probably benefit from discussion and clear
attribution. I cannot be certain which method is being referred to in all cases.
1. Progressive Profiling
a. Needed spot for “Other”; plastic note in 227
b. A bit of delay in loading data. Love you can go back and change rating
c. During one Eval the screen froze, so invalid data (since while waiting expectorated etc.)
d. Yes. Where is “Other” – cardboard
e. Slow screen transition time could lead to faulty conclusions
f. Due to quick dissolution, technique may not fit to product form.
g. Bars very similar in taste & texture, so differentiation not apparent during the test
h. Memory may affect the rating
i. The accumulating may lead to a different 1st and 2nd bite.
j. Be very careful if want to use with untrained/consumers. Need to learn protocol.
k. Hard to have part left to expectorate because eval time longer.
l. Time transitions were too long – product disintegrated
m. Clearer instructions
n. Found additional flavors- Not able to express fully descriptive experience.
2. T O S
a. Expectorate/swallow need discussion (per objective)
b. No rinsing between smp (unused to)
c. Influenced by visual cues (nut=nutty;sticky=sweet)
d. Pre-portioning helpful/important
e. Lag time from perception to recording
f. Frustrated – not able to show intensity diffs (even tho doing D.A. separately)
g. 2 Aftertastes – couldn’t show
h. Aftertaste timing by computer good.
3. TDS
a. Can’t capture 2 simultaneously
b. Time between clips good to capture
c. Reps and panelists with such variable products
d. Profiling and clock captures it all
e. Rapid – no time to think
f. Need to consume more in TOS
g. Can see bite-to-bite diffs
h. Other is not consistent among panelists thus, NSD
i. Aftertaste dependent on the 4th bite
j. Does it work with very dominant flavor?
Related Documents