8 th Five Year Plan Background Papers Volume-4 Education, Health, Poverty and Social Inclusiveness General Economics Division (GED) Bangladesh Planning Commission Ministry of Planning Government of the People’s Republic of Bangladesh

Welcome message from author
This document is posted to help you gain knowledge. Please leave a comment to let me know what you think about it! Share it to your friends and learn new things together.
Transcript
8th Five Year PlanBackground Papers
Volume-4
Education, Health, Poverty andSocial Inclusiveness
General Economics Division (GED)Bangladesh Planning Commission
Ministry of PlanningGovernment of the People’s Republic of Bangladesh
ii General Economics Division (GED)
Education, Health, Poverty and Social Inclusiveness
Published and Cover Designed by:General Economics Division (GED)Bangladesh Planning CommissionGovernment of the People’s Republic of BangladeshSher-e-Bangla Nagar, Dhaka-1207, BangladeshWebsite: www.plancomm.gov.bd
First Published: December 2021
Editor:Dr. Shamsul AlamMinister of StateMinistry of Planning
Editorial Assistance:Md. Mafidul Islam, ChiefMd. Mahbubul Hoque Patwary, Joint ChiefMunira Begum, Joint ChiefMd. Mahbubul Alam Siddiquee, Deputy ChiefMohammad Fahim Afsan Chowdhury, Senior Assistant ChiefShimul Sen, Senior Assistant Chief
Copyright© General Economics Division (GED), Bangladesh Planning Commission, 2021
All rights are reserved. Though we encourage use of these background research papers by any interested person, but no part of this publication may be reproduced or transmitted in any form or by any means without prior notification in writing from the publisher.
Disclaimer: At the behest of GED, the Background Papers were prepared by Bangladeshi eminent researchers/scholars with the aim to use as inputs of the 8th Five Year Plan of Bangladesh (July 2020-June 2025). GED, Bangladesh Planning Commission, in no way bears any responsibility for accuracy of any statement, figure/data that contained in the background papers where onus lies to author(s) only.
This document is prepared and published with the support of “Preparation and Monitoring of Medium Term Development Plans (8th Five Year Plan) to Implement SDGs and Vision-2041” project being implemented by General Economics Division, Bangladesh Planning Commission.
Printed By:Chhoa19/A, Lakecircus, Kalabagan, Dhaka-1205.Cell: +88 01865-282828
iiiBackground Papers
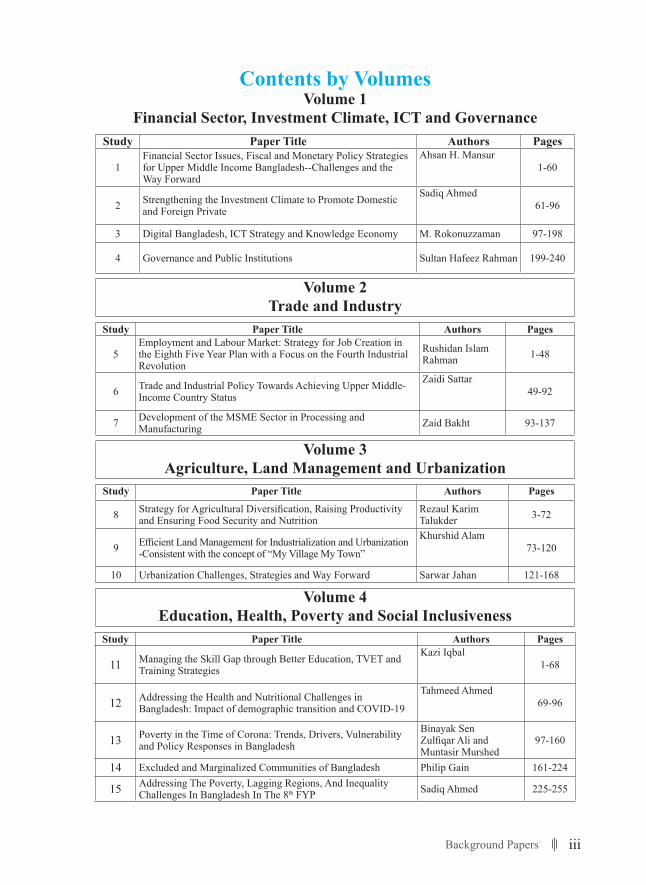
Contents by VolumesVolume 1
Financial Sector, Investment Climate, ICT and GovernanceStudy Paper Title Authors Pages
1Financial Sector Issues, Fiscal and Monetary Policy Strategies for Upper Middle Income Bangladesh--Challenges and the Way Forward
Ahsan H. Mansur1-60
2 Strengthening the Investment Climate to Promote Domestic and Foreign Private
Sadiq Ahmed 61-96
3 Digital Bangladesh, ICT Strategy and Knowledge Economy M. Rokonuzzaman 97-198
4 Governance and Public Institutions Sultan Hafeez Rahman 199-240
Volume 2Trade and Industry
Study Paper Title Authors Pages
5Employment and Labour Market: Strategy for Job Creation in the Eighth Five Year Plan with a Focus on the Fourth Industrial Revolution
Rushidan Islam Rahman 1-48
6 Trade and Industrial Policy Towards Achieving Upper Middle-Income Country Status
Zaidi Sattar49-92
7 Development of the MSME Sector in Processing and Manufacturing Zaid Bakht 93-137
Volume 3Agriculture, Land Management and Urbanization
Study Paper Title Authors Pages
8 Strategy for Agricultural Diversification, Raising Productivity and Ensuring Food Security and Nutrition
Rezaul Karim Talukder 3-72
9 Efficient Land Management for Industrialization and Urbanization -Consistent with the concept of “My Village My Town”
Khurshid Alam73-120
10 Urbanization Challenges, Strategies and Way Forward Sarwar Jahan 121-168
Volume 4Education, Health, Poverty and Social Inclusiveness
Study Paper Title Authors Pages
11 Managing the Skill Gap through Better Education, TVET and Training Strategies
Kazi Iqbal1-68
12 Addressing the Health and Nutritional Challenges in Bangladesh: Impact of demographic transition and COVID-19
Tahmeed Ahmed69-96
13 Poverty in the Time of Corona: Trends, Drivers, Vulnerability and Policy Responses in Bangladesh
Binayak SenZulfiqar Ali and Muntasir Murshed
97-160
14 Excluded and Marginalized Communities of Bangladesh Philip Gain 161-224
15 Addressing The Poverty, Lagging Regions, And Inequality Challenges In Bangladesh In The 8th FYP Sadiq Ahmed 225-255
iv General Economics Division (GED)
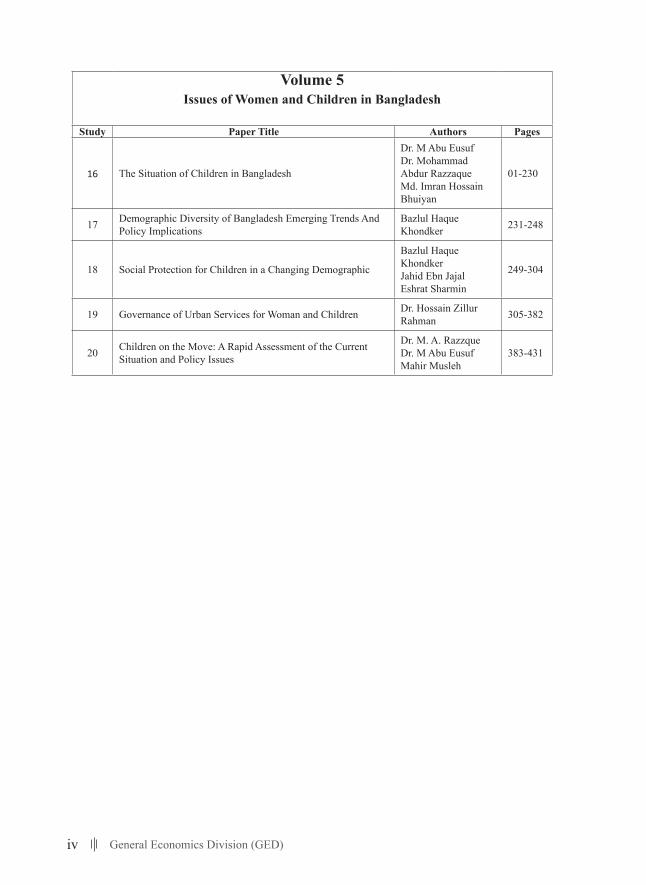
Volume 5Issues of Women and Children in Bangladesh
Study Paper Title Authors Pages
16 The Situation of Children in Bangladesh
Dr. M Abu EusufDr. Mohammad Abdur RazzaqueMd. Imran Hossain Bhuiyan
01-230
17 Demographic Diversity of Bangladesh Emerging Trends And Policy Implications
Bazlul Haque Khondker 231-248
18 Social Protection for Children in a Changing Demographic
Bazlul Haque KhondkerJahid Ebn JajalEshrat Sharmin
249-304
19 Governance of Urban Services for Woman and Children Dr. Hossain Zillur Rahman 305-382
20 Children on the Move: A Rapid Assessment of the Current Situation and Policy Issues
Dr. M. A. RazzqueDr. M Abu EusufMahir Musleh
383-431
vBackground Papers
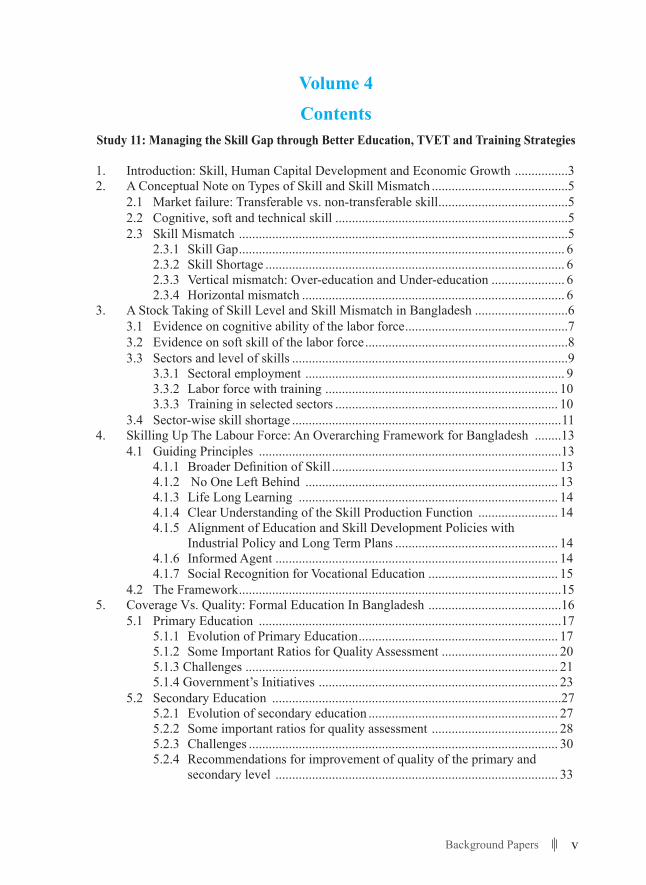
Volume 4Contents
Study 11: Managing the Skill Gap through Better Education, TVET and Training Strategies
1. Introduction: Skill, Human Capital Development and Economic Growth ................32. A Conceptual Note on Types of Skill and Skill Mismatch .........................................5
2.1 Market failure: Transferable vs. non-transferable skill .......................................52.2 Cognitive, soft and technical skill ......................................................................52.3 Skill Mismatch ...................................................................................................5
2.3.1 Skill Gap .................................................................................................. 62.3.2 Skill Shortage .......................................................................................... 62.3.3 Vertical mismatch: Over-education and Under-education ...................... 62.3.4 Horizontal mismatch ............................................................................... 6
3. A Stock Taking of Skill Level and Skill Mismatch in Bangladesh ............................63.1 Evidence on cognitive ability of the labor force .................................................73.2 Evidence on soft skill of the labor force .............................................................83.3 Sectors and level of skills ...................................................................................9
3.3.1 Sectoral employment .............................................................................. 93.3.2 Labor force with training ...................................................................... 103.3.3 Training in selected sectors ................................................................... 10
3.4 Sector-wise skill shortage .................................................................................114. Skilling Up The Labour Force: An Overarching Framework for Bangladesh ........13
4.1 Guiding Principles ...........................................................................................134.1.1 Broader Definition of Skill .................................................................... 134.1.2 No One Left Behind ............................................................................ 134.1.3 Life Long Learning .............................................................................. 144.1.4 Clear Understanding of the Skill Production Function ........................ 144.1.5 Alignment of Education and Skill Development Policies with
Industrial Policy and Long Term Plans ................................................. 144.1.6 Informed Agent ..................................................................................... 144.1.7 Social Recognition for Vocational Education ....................................... 15
4.2 The Framework .................................................................................................155. Coverage Vs. Quality: Formal Education In Bangladesh ........................................16
5.1 Primary Education ...........................................................................................175.1.1 Evolution of Primary Education ............................................................ 175.1.2 Some Important Ratios for Quality Assessment ................................... 205.1.3 Challenges .............................................................................................. 215.1.4 Government’s Initiatives ........................................................................ 23
5.2 Secondary Education .......................................................................................275.2.1 Evolution of secondary education ......................................................... 275.2.2 Some important ratios for quality assessment ...................................... 285.2.3 Challenges ............................................................................................. 305.2.4 Recommendations for improvement of quality of the primary and
secondary level ..................................................................................... 33
vi General Economics Division (GED)
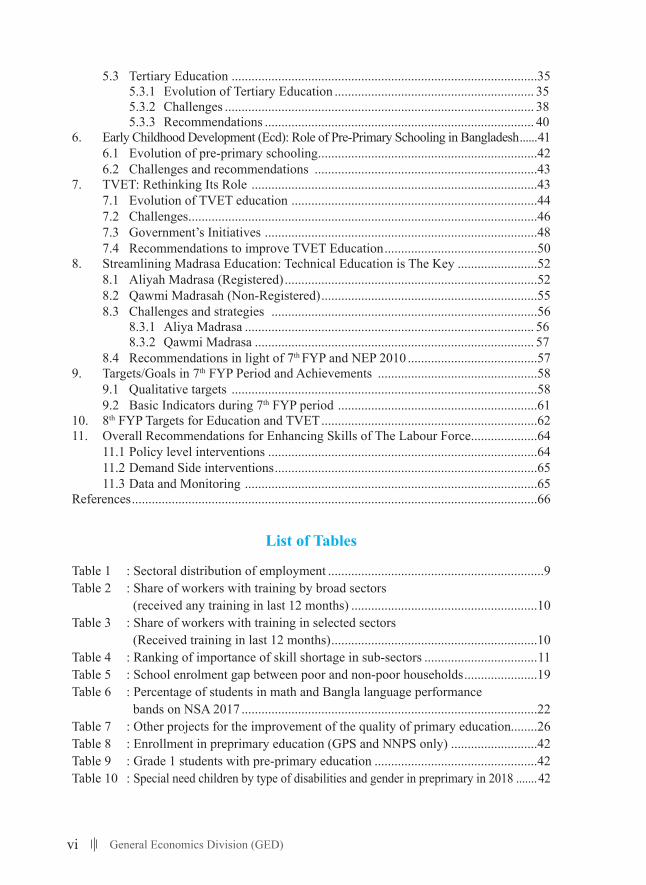
5.3 Tertiary Education ............................................................................................355.3.1 Evolution of Tertiary Education ............................................................ 355.3.2 Challenges ............................................................................................. 385.3.3 Recommendations ................................................................................. 40
6. Early Childhood Development (Ecd): Role of Pre-Primary Schooling in Bangladesh ......416.1 Evolution of pre-primary schooling ..................................................................426.2 Challenges and recommendations ...................................................................43
7. TVET: Rethinking Its Role ......................................................................................437.1 Evolution of TVET education ..........................................................................447.2 Challenges .........................................................................................................467.3 Government’s Initiatives ..................................................................................487.4 Recommendations to improve TVET Education ..............................................50
8. Streamlining Madrasa Education: Technical Education is The Key ........................528.1 Aliyah Madrasa (Registered) ............................................................................528.2 Qawmi Madrasah (Non-Registered) .................................................................558.3 Challenges and strategies ................................................................................56
8.3.1 Aliya Madrasa ....................................................................................... 568.3.2 Qawmi Madrasa .................................................................................... 57
8.4 Recommendations in light of 7th FYP and NEP 2010 .......................................579. Targets/Goals in 7th FYP Period and Achievements ................................................58
9.1 Qualitative targets ............................................................................................589.2 Basic Indicators during 7th FYP period ............................................................61
10. 8th FYP Targets for Education and TVET .................................................................6211. Overall Recommendations for Enhancing Skills of The Labour Force ....................64
11.1 Policy level interventions .................................................................................6411.2 Demand Side interventions ...............................................................................6511.3 Data and Monitoring ........................................................................................65
References ..........................................................................................................................66
List of Tables
Table 1 : Sectoral distribution of employment .................................................................9Table 2 : Share of workers with training by broad sectors (received any training in last 12 months) ........................................................10Table 3 : Share of workers with training in selected sectors (Received training in last 12 months) ..............................................................10Table 4 : Ranking of importance of skill shortage in sub-sectors ..................................11Table 5 : School enrolment gap between poor and non-poor households ......................19Table 6 : Percentage of students in math and Bangla language performance bands on NSA 2017 .........................................................................................22Table 7 : Other projects for the improvement of the quality of primary education........26Table 8 : Enrollment in preprimary education (GPS and NNPS only) ..........................42Table 9 : Grade 1 students with pre-primary education .................................................42Table 10 : Special need children by type of disabilities and gender in preprimary in 2018 .......42
viiBackground Papers
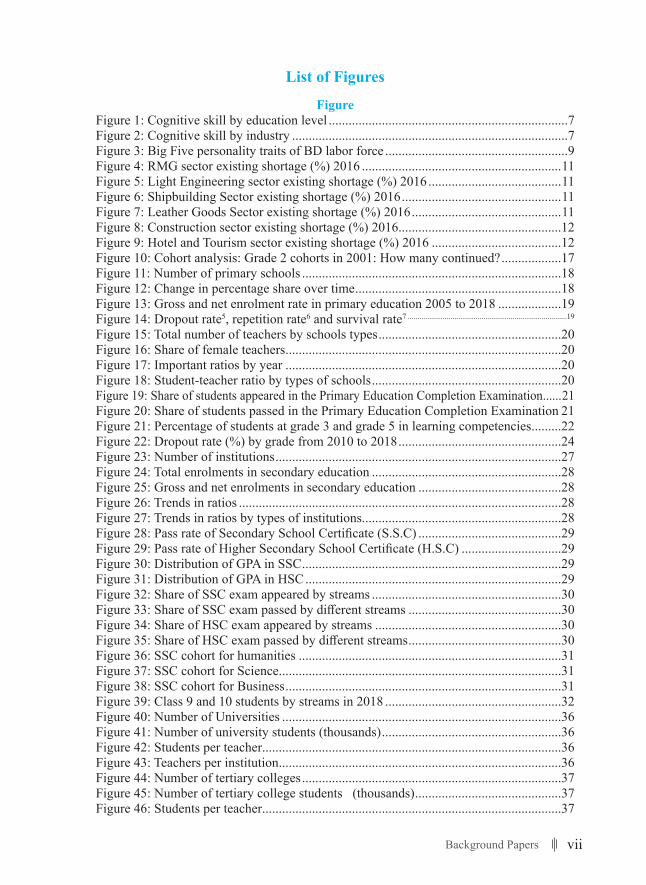
List of Figures
FigureFigure 1: Cognitive skill by education level ........................................................................7Figure 2: Cognitive skill by industry ...................................................................................7Figure 3: Big Five personality traits of BD labor force .......................................................9Figure 4: RMG sector existing shortage (%) 2016 ............................................................11Figure 5: Light Engineering sector existing shortage (%) 2016 ........................................11Figure 6: Shipbuilding Sector existing shortage (%) 2016 ................................................11Figure 7: Leather Goods Sector existing shortage (%) 2016 .............................................11Figure 8: Construction sector existing shortage (%) 2016 .................................................12Figure 9: Hotel and Tourism sector existing shortage (%) 2016 .......................................12Figure 10: Cohort analysis: Grade 2 cohorts in 2001: How many continued? ..................17Figure 11: Number of primary schools ..............................................................................18Figure 12: Change in percentage share over time ..............................................................18Figure 13: Gross and net enrolment rate in primary education 2005 to 2018 ...................19Figure 14: Dropout rate5, repetition rate6 and survival rate7 ..................................................................................19
Figure 15: Total number of teachers by schools types .......................................................20Figure 16: Share of female teachers ...................................................................................20Figure 17: Important ratios by year ...................................................................................20Figure 18: Student-teacher ratio by types of schools .........................................................20Figure 19: Share of students appeared in the Primary Education Completion Examination ......21Figure 20: Share of students passed in the Primary Education Completion Examination 21Figure 21: Percentage of students at grade 3 and grade 5 in learning competencies .........22Figure 22: Dropout rate (%) by grade from 2010 to 2018 .................................................24Figure 23: Number of institutions ......................................................................................27Figure 24: Total enrolments in secondary education .........................................................28Figure 25: Gross and net enrolments in secondary education ...........................................28Figure 26: Trends in ratios .................................................................................................28Figure 27: Trends in ratios by types of institutions............................................................28Figure 28: Pass rate of Secondary School Certificate (S.S.C) ...........................................29Figure 29: Pass rate of Higher Secondary School Certificate (H.S.C) ..............................29Figure 30: Distribution of GPA in SSC ..............................................................................29Figure 31: Distribution of GPA in HSC .............................................................................29Figure 32: Share of SSC exam appeared by streams .........................................................30Figure 33: Share of SSC exam passed by different streams ..............................................30Figure 34: Share of HSC exam appeared by streams ........................................................30Figure 35: Share of HSC exam passed by different streams ..............................................30Figure 36: SSC cohort for humanities ...............................................................................31Figure 37: SSC cohort for Science .....................................................................................31Figure 38: SSC cohort for Business ...................................................................................31Figure 39: Class 9 and 10 students by streams in 2018 .....................................................32Figure 40: Number of Universities ....................................................................................36Figure 41: Number of university students (thousands) ......................................................36Figure 42: Students per teacher ..........................................................................................36Figure 43: Teachers per institution .....................................................................................36Figure 44: Number of tertiary colleges ..............................................................................37Figure 45: Number of tertiary college students (thousands) ............................................37Figure 46: Students per teacher ..........................................................................................37
viii General Economics Division (GED)
Figure 47: Teacher per institution ......................................................................................37Figure 48: Number of professional institutes .....................................................................38Figure 49: Number of students of per teacher ...................................................................38Figure 50: Discipline-wise enrolment (University) ...........................................................39Figure 51: Gross enrollment ratio in South Asia ...............................................................39Figure 52: Share of enrolled students of Public University ...............................................40Figure 53: Share of enrolled students of Private University ..............................................40Figure 54: Number of TVET Institutions ..........................................................................44Figure 55: Number of TVET Students (thousands) ...........................................................44Figure 56: Number of Teachers of TVET Institutions .......................................................44Figure 57: Number of students per teacher in TEVT institutions ......................................44Figure 58: Number of TVET Institutions (SSC and HSC level .........................................45Figure 59: Students of TVET Institutions (SSC and HSC level) .......................................45Figure 60: Number of Tertiary TVET Institutions (Polytechnic and Monotechnic Institutes) ....................................................................................46Figure 61: Teachers of Tertiary TVET Institutions (Polytechnic and Monotechnic Institutes) .........................................................................................................46Figure 62: Number of Madrasah (Dakhil to Kamil) ..........................................................53Figure 63: Number of madrasah (Dakhil to Kamil) by type ..............................................53Figure 64: Share of madrasah (Dakhil to Kamil) by type ..................................................53Figure 65: Number of teachers without attached Ebtedayee section (only Dakhil to Kamil) ...............................................................................................54Figure 66: Number of students without attached Ebtedayee section (Dakhil to Kamil) ...54Figure 67: Figure: Number of enrolment in Madrasah (Dakhil to Kamil) ........................54Figure 68: Share of enrolment in Madrasah (Dakhil to Kamil) .........................................54Figure 69: Ratios for all institutions ................................................................................55Figure 70: Students per teacher ..........................................................................................55Figure 71: Students per institutions ...................................................................................55Figure 72: Teachers per institutions ...................................................................................55
List of Boxes
Box 1: Soft Skill: Big Five Personality Traits .....................................................................8Box-2: Key Achievements of PEDP-4 ...............................................................................25
ixBackground Papers
Study 12 : Addressing the Health and Nutritional Challenges in Bangladesh: Impact of demographic transition and COVID-19
Introduction ........................................................................................................................711. Nutritional problems and needs of the elderly ........................................................72
1.1 Burden ...............................................................................................................721.2 Assessment of nutritional status of the elderly .................................................731.3 Causative factors for malnutrition in elderly ....................................................741.4 Tentative solutions and recommendations ........................................................74
2. Micronutrient needs of the population and solution through fortification ................752.1 Burden ...............................................................................................................752.2 Micronutrients and nutritional status in the slums ............................................762.3 Micronutrients from food .................................................................................762.4 Supplementation programs ...............................................................................772.5 Solution by fortification of food .......................................................................772.6 Recommendations for reduction of micronutrient deficiencies ........................78
3. Adolescent nutrition ..................................................................................................784. Low birth weight ......................................................................................................795. Underweight and Wasting .........................................................................................806. Stunting or linear growth failure ...............................................................................817. Double Burden of Malnutrition ................................................................................828. The growing burden of overweight and obesity ......................................................839. Maternal undernutrition, pregnancy weight gain, and intrauterine growth restriction 8610. Nutrition-related Non-Communicable Diseases (NCDs) ........................................8711. Economic impact of nutrition-related NCDs in Bangladesh ....................................9112. Impact of COVID-19 on nutrition and food insecurity ............................................91References: .........................................................................................................................93
List of TablesTable 1 : Nutrition, vitamins and micronutrient status of elderly and middle aged .......73Table 2 : Iron consumption vs iron RDA .......................................................................76Table 3 : Consumption of Zinc from food vs RDA ........................................................77Table 4 : Salt iodization vs Iodine status in school-aged children ...............................77Table 5 : Dietary practices of adults aged 18-69 years in Bangladesh [42] ..................89
x General Economics Division (GED)
List of Figures
Figure 1: Trend of gradual increase in the elderly population in Bangladesh ...................72Figure 2: Nutritional status of elderly people in a rural area in Bangladesh as evaluated by Mini Nutritional Assessment (MNA) ............................................................74Figure 3: Trends in nutritional status of adolescent girls (FSNSP: Food Security and Nutritional Surveillance Project; NNS: National Nutrition Services) ...............78Figure 4: Prevalence of underweight and wasting in Bangladesh from 1997 to 2017 ......80Figure 5: Trends in stunting rates for Bangladesh .............................................................81Figure 6: Prevalence of household-level mother–child double burden of
malnutrition in Bangladesh (n=5951), with 95 % CI represented by vertical bars. Data from the Bangladesh Demographic and Health Survey 2014 (OWOBM/UWC, overweight or obese mother and underweight child; OWOBM/STC, overweight or obese mother and stunted child; OWOBM/WSC, overweight or obese mother and wasted child; OWOBM/USWC, overweight or obese mother and underweight or stunted or wasted child) .......83
Figure 7: Prevalence of overweight and obesity among women aged between 15 and 49 years in Bangladesh by survey year, Bangladesh Demographic and Health Survey 1999–2014 .............................................................................................84Figure 8: Prevalence of overweight and obesity in terms of place of residence [42] ........85Figure 9: Percentage of undernourishment (BMI <18.5) among ever-married women age 15-49 years .........................................................................................................86Figure 10: Life expectancy at birth in Bangladesh ............................................................87Figure 11: Population aged 65 and above (% of total population) in Bangladesh [54] .....88Figure 12: Prevalence of nutrition related non-communicable diseases in Bangladesh in 2018 [42] ..........................................................................................................89Figure 13: Number of people (20-79 years) with diabetes in 2019 [55] ...........................90Figure 14: Number (in million) of Bangladeshi adults (20–79 years) with diabetes in 2019, 2030 and 2045 ........................................................................................90
xiBackground Papers
Study 13 : Poverty in the Time of Corona: Trends, Drivers, Vulnerability and PolicyResponses in Bangladesh
1. Achievements and Drivers of Successes of Poverty Reduction in the Seventh Plan 1001.1 Income-Poverty: Trends and Profiles ..............................................................101
1.1.1 Trends in Poverty in Rural vs. Urban Areas ........................................ 1011.1.2 Consistency with the Real Wage Trends ............................................. 1031.1.3 Profile of the Poor and Non-Poor ........................................................ 105
1.2 Trends in Non-Income Poverty .......................................................................1071.2.1 Health, Nutrition and Childhood Mortality in Bangladesh ................. 1071.2.2 School Attendance and Quality of Education...................................... 1121.2.3 Access to Improved Sanitation Facilities ............................................ 1151.2.4 Child Protection Issues: Child Labor and Early Childhood Marriage ....116
1.3 Regional Differences in Income and Non-Income Dimensions of Poverty....1171.3.1 Regional Poverty in Bangladesh: Evidence from HIES 2016
and Other Studies ................................................................................ 1171.3.2. Pockets of Social Deprivation: Evidence from Equity Atlas 2013 ...... 120
1.4 Drivers of Poverty Reduction .........................................................................1232. Pre-Existing Vulnerabilities and Poverty Effects of Covid-19 Lockdown .............128
2.1 Bunching of the Near-Poor and Risks of Slippages .......................................1282.2 Poverty Effects of Covid-19 Lockdown .........................................................1292.3 Reach of Social Protection ..............................................................................1322.4 Can Bangladesh Reach the Poverty SDG Target: Simulations with
and without Covid-19 Effects .........................................................................1372.4.1 Gross vs. Net Growth Elasticity of Poverty Reduction ....................... 1372.4.2 Poverty Projections over 2011-2031: Assessing Long-term
Implications of Covid-19..................................................................... 1382.5 Conclusions and Possible Policy Responses in the Eighth Plan .....................142
2.5.1 Results of Poverty Diagnostics with and without Covid-19 ............... 1422.5.2 Policy Implications for Addressing Poverty in the Backdrop of Covid-19 ...... 143
References ........................................................................................................................147
List of TablesTable 1 : Long Trends in Macro Indicators ..................................................................101Table 2 : Comparison of Poverty and Inequality trends across HIES 2010 & HIES 2016 ............. 102Table 3 : Trends in Nominal and Real Agricultural Wages between 2010 and 2016 for Agricultural Laborers by Division (Taka per day) ..................104Table 4 : Distribution of HH across different poverty cohorts .....................................106Table 5 : Nutritional Status of Children in Bangladesh, 2007-2017/18 .......................107Table 6 : Disparities in Child Nutrition between the Richest and the Poorest, 2007-2017/18 ...................................................................................108Table 7 : Nutritional Status of Mothers: The Body Mass Index (BMI), 2007-2004 ....108Table 8 : Disparities in Maternal Nutrition between the Richest and the Poorest, 2007-2014 ........................................................................................109Table 9 : Childhood Mortality in Bangladesh, 2007-2014 ...........................................109Table 10 : Disparities in Childhood Mortality between the Richest and the Poorest, 2007-2014 ........................................................................................110Table 11 : Status of Maternal Health and Delivery Assistance in
xii General Economics Division (GED)
Bangladesh, 2006-2018 .................................................................................111Table 12 : Disparities in Maternal Health and Delivery Assistance between the Richest and the Poorest in Bangladesh, 2006-2018 ......................................111Table 13 : School Attendance and Out of School Children in Bangladesh, 2006-2018 .....112Table 14 : Disparities in School Attendance and Out of School Children between the Richest and the Poorest in Bangladesh, 2006-2018 ................................113Table 15 : School Attendance of Children of Different Age Group by Poverty Status, 2010-2016 ..........................................................................................113Table 16 : Quality of Education for Children Aged 6-14 Years in Bangladesh, 2018 ...114Table 17 : Access to Sanitation Facilities, 2006-2018 ....................................................115Table 18 : Disparities in Access to Sanitation Facilities between the Richest and the Poorest in Bangladesh, 2006-2018 ................................................115Table 19 : Child Protection: Child Labor, Child in Hazardous Work, and Child Marriage, 2006-2018 ...........................................................................116Table 20 : Disparities in Child Protection Issues (Child Labor, Child in Hazardous Work, and Child Marriage) between the Richest and the Poorest in Bangladesh, 2006-2018 .................................................................................116Table 21 : Proportion of Women Married before the Age of 15 Years by Poverty Status, 2016 ...................................................................................................117Table 22 : Poverty Hot-Spots: Districts with High and Increased Poverty, 2016 ..........118Table 23 : Incidence of poverty in the selected districts ................................................119Table 24 : Poverty Status in the survey districts: Qualitative Assessment .....................119Table 25 : Non-income Dimensions of Wellbeing .........................................................120Table 26 : Poverty hotspots based on income and social dimensions ............................121Table 27 : Correlates of Different Categories of Poor and Non-Poor in Rural Areas ....124Table 28 : Correlates of Different Categories of Poor and Non-Poor in Urban Areas ...126Table 29 : Bunching around the Poverty Line: Sensitivity of Headcount Poverty Rate with Respect to the Choice of Poverty Line in Rural Areas ................128Table 30 : Bunching around the Poverty Line: Sensitivity of Headcount Poverty Rate with Respect to the Choice of Poverty Line in Urban Areas ...129Table 31 : Poverty Effects of Covid-19 Lockdown—Simulation Results under “Hard” Lockdown .........................................................................................131Table 32 : Benefit Incidence for Broad category of SP Programs as per MICS 2018 Data ........134Table 33 : Growth Elasticity Estimates (2000-2010)- Datt and Ravallion (1992) Method ..........................................................................................................138Table 34 : Poverty Headcount Projections for 2011-2031 if the “Hard Lockdown” Option Persists throughout the Calendar Year of 2020 ..................................140Table 35 : Projection of Poverty Headcount for the Calendar Year of 2020 by Quarter 141Table 36 : Poverty Headcount Projections for 2011-2031 under “Soft Lockdown” and “Fast Recovery” Option as Envisaged in the Eighth Five Year Plan ......141
xiiiBackground Papers
List of Annex
Annex Table 1: Descriptive Statistics for Different Groups of Rural Households (HIES 2016) ...........................................................................................148Annex Table 2: Descriptive Statistics for Different Groups of Urban Households (HIES 2016) ............................................................................................149Annex Table 3: Poverty Trends during the Pre-Covid Situation in the second half of the 2010s, 2016-2020 ................................................................152Annex Table 4: Rise of Poverty due to Covid-19 Shock and Lockdown, 2020 (Q1 vs. Q2): Scenario-1 ..........................................................................152Annex Table 5: Rise of Poverty due to Covid-19 Shock and Lockdown, 2020 (Q1 vs. Q2): Scenario-2 ..........................................................................153Annex Table 6: Rise of Poverty due to Covid-19 Shock and Lockdown, 2020 (Q1 vs. Q2): Scenario-3 (Reference Scenario) .....................................154Annex Table 7: Rise of Poverty due to Covid-19 Shock and Lockdown, 2020 (Q1 vs. Q2): Scenario-4 ..........................................................................154Annex Table 8: Rise of Poverty due to Covid-19 Shock and Lockdown, 2020 (Q1 vs. Q2): Scenario-5 ..........................................................................155Annex 9: Poverty Estimate for 2020: Q3 .........................................................................156Annex 10: Poverty Estimate for 2020: Q4 .......................................................................156Annex Table 11: Correlates of Different Categories of Poor and Non-Poor in Rural Areas under Alternative Definitions of VNP and CNP .........................157
xiv General Economics Division (GED)
Study 14: Excluded and Marginalized Communities of Bangladesh
1. Background to social exclusion and marginalization in Bangladesh .....................1632. Who are the excluded, social outcasts and marginalized communities of Bangladesh? .......................................................................................................164
2.1 Khudra Nri-goshthi or small ethnic groups of the plains ..............................1642.2 Tea workers and their communities ................................................................1652.3 Harijan ............................................................................................................1662.4 Bede (water gypsy) .........................................................................................1672.5 Sex workers and transgenders ........................................................................1682.6 Kaiputra/Kawra (pig-rearing community) ......................................................1692.7 Rishi ................................................................................................................1692.8 Jaladas ............................................................................................................1702.9 Bihari ..............................................................................................................1712.10 Other excluded and special communities .......................................................171
3. Current condition and difficulties of the excluded and marginalized communities ........ 1733.1 Economic condition ........................................................................................1733.2 Socio-cultural protection ...............................................................................1773.3 Political protection and human rights ............................................................1783.4 Some common disadvantages ........................................................................1803.5 Group specific key concerns ..........................................................................181
4. Government policies, strategies and actions for protection of the excluded and marginalized communities .....................................................................................186
4.1 Strategies of the Government .........................................................................1864.2 Overarching strategy of the government for social protection ......................1874.3 Major actions undertaken by the government for excluded and marginalized
communities for their protection ...................................................................1885. Progress made during the 6th and 7th Five Year Plan and the major gaps in policies and practices .............................................................................................1926. National and international laws, instruments and institutions providing safeguards to the marginalized communities ..........................................................2087. Recommendations and way forward ......................................................................2108. Notes ......................................................................................................................217
xvBackground Papers
List of Tables
Table 1: Excluded, social outcasts and marginalized communities at a glance ............172Table 2: Major social protection programmes and programmes targeting select excluded and marginal communities (2019-2020). (Budget and beneficiaries in million) ...........................................................188Table 3: Trends in increase and changes in beneficiaries and budget of major social protection programmes and programmes targeting select excluded and marginal communities. (Budget and beneficiaries both in million) ................193Table 4: Social Safety Net Programmes in Bangladesh: Beneficiaries and budget (summary) ........................................................................................................195Table 5: Household distribution of benefits (%) from SSNPs .......................................196Table 6A: Average monthly household income from the main occupations of the excluded and marginalized communities in 2017-2018 (Taka) ......................197Table 6B: Average highest and lowest monthly household income of select excluded and marginalized communities (Taka)............................................................198Table 7: Excluded and marginal communities under major social protection programmes (% of HHs) ...............................................................................201Table 8: Current implementation status .........................................................................202
List of Figures
Figure 1: Beneficiaries in Million-man .........................................................................190Figure 2: Budget in Crore Taka .....................................................................................196
xvi General Economics Division (GED)
Study 15: Addressing The Poverty, Lagging Regions, And Inequality Challenges In Bangladesh In The 8th FYP
Development Context ......................................................................................................227Main Objectives and Scope of the Paper .........................................................................227Past Progress with Poverty Reduction ............................................................................228Factors That Helped Achieve Poverty Results Outcome ................................................229Some Unfavorable Developments on the Poverty Front .................................................235Poverty Reduction Progress During the Seventh Plan .....................................................237Poverty Impact of COVID-19 ..........................................................................................239Suggested Eighth Plan Strategy for Reduction of Poverty ..............................................2418FYP Targets for Poverty Reduction ..............................................................................242Poverty Reduction Strategy .............................................................................................242Additional Measures to Address Extreme Poverty ..........................................................246Progress with Reducing Regional Disparities ..................................................................246Regional Distribution of Poverty .....................................................................................247Strategy for Addressing the Poverty Problems for the Lagging Regions ........................249Tackling the Income Inequality Challenge ......................................................................250Strategy for Better Income Distribution ..........................................................................251References ........................................................................................................................255
List of TablesTable 1: Past Progress with Poverty Reduction 2000-2016 (%) ...................................228Table 2: Growth, Structural Change and Employment 2000-2010 ...............................229Table 3: Access to Microcredit ......................................................................................235Table 4: Growth Elasticity of Poverty ...........................................................................236Table 5: Reduction in Poverty During the Seventh Plan Period ..................................237Table 6: Expansion of Microcredit During 7FYP..........................................................239Table 7: Poverty Effects of Covid-19 Lockdown—Simulation Results ........................240Table 8: Poverty Projections Under COVID-19 Scenario 3 (% of population) ............241Table 9: Poverty Targets for the Eighth Plan .................................................................242Table 10: Regional Poverty Incidence (%) ......................................................................247Table 11: Fiscal Reforms for Lowering Income Inequality (% of GDP) ........................253
xviiBackground Papers
List of Figures
Figure 1: Number of Poor People (millions) ...................................................................228Figure 2: Annual Percentage Point Decline in Poverty ...................................................230Figure 3: Rate of Growth of Rural Employment 2000-2016 (% per Year) ......................230Figure 4: Growth Rate of Labor Force (% per year) ......................................................231Figure 5: Rural Employment Structure 2000-2016 (%) .................................................231Figure 6: Real Wages in Rural Areas (Taka/day 2016 prices) .........................................232Figure 7: Employment Growth in Urban Sector, 2000-2016 ...........................................232Figure 8: Urban Sector Wage Rate (Taka/day, 2016 prices) ............................................233Figure 9: Number of Migrant Workers 2000-2016 ..........................................................233Figure 10: Inflow of Remittances 2000-2016 ($ billion) .................................................234Figure 11: Percentage of Households Receiving Social Protection Transfers ................235Figure 12: 2016 Poverty Incidence with Unchanged Poverty Elasticity .........................236Figure 13: Cumulative Consumption Distribution in 2016 .............................................237Figure 13: Migrant Labor Outflows During 7FYP (million) ...........................................238Figure 14: Top 10 Least-Poor and Top 10 Poorest Districts 2016 ...................................248Figure 15: Trend in Gini Coefficient ...............................................................................250Figure 16: Trend in the Palma Ratio ................................................................................251
List of Boxes
Box 1: Impact of COVID-19 on Poverty .........................................................................240Box 2: Simulated Impacts on Inequality with Fiscal Transfer in Bangladesh .................252

xviii General Economics Division (GED)
xixBackground Papers
M.A. Mannan, MPMinister
Ministry of PlanningGovernment of the People’s Republic of Bangladesh
MessageI am happy to know that the General Economics Division (GED) of the Planning Commission is publishing the background papers conducted for the preparation of Eighth Five Year Plan (July 2020-June 2025).
The background papers have been provided with valuable inputs on both quantitative and qualitative data. These studies have made it easier to identify the areas of interventions and proposed some policy recommendations on how to achieve the targets set by the government in the 8th Five Year Plan.
Bangladesh has made commendable progress in MDGs. The success also continues in SDG period which is reflected by the SDG Progress Award received by honorable Prime Minister Sheikh Hasina from Sustainable Development Solution Network. Despite the achievement, we have to go a long way to materialize the dream of Father of Nation to become a happy and prosperous nation. We should not be complacent as we have to carry out the ongoing rapid transformation of the country. I hope these studies will be a useful reference for the policymakers, development partners, academics and researcher alike to further research endeavors and knowledge sharing and I would like to see the continuation of such publications in the future as well.
I am confident that the Eighth Five Year Plan will amply guide us in realising the agenda of our “Vision 2041” of becoming a High-Income Country (HIC) by 2041.
In this instance, I would like to take this opportunity to thank the state minister for Planning and GED officials for this initiative and hard work. My sincere appreciation goes to the experts in their respective fields for completing the Background Studies for the Eighth Five Year Plan preparation.
(M. A. Mannan, MP)
xx General Economics Division (GED)
Dr. Shamsul AlamMinister of State
Ministry of PlanningGovernment of the People’s Republic of Bangladesh
MessageI am glad that General Economics Division (GED) of Bangladesh Planning Commission is going to publish background papers which have been used as the inputs for preparing the country’s Eighth Five Year Plan (July 2020-June 2025). These papers are the culmination of macroeconomic and sectoral issues of Bangladesh for future intervention that GED has pursued with various eminent economists, social scientists, researchers, academia etc. at national level.
These background papers were undertaken for generating quantitative/qualitative benchmark values and targets for relevant indicators of the Plan and fill in critical knowledge gaps. Renowned economists and development practitioners in the relevant fields with a long-standing flair were assigned to conduct the studies within the stipulated timeframe.
In the light of Vision 2041, the Eighth Plan looks to improved standard of living of the citizens, population better educated, better social justice and a more equitable socio-economic environment. Special emphasis was given on the investment of health and education as well as skill development of the upcoming and existing labor force. We must act now to protect the cognitive capital of our future generation and I believe we can act more vigorously because recent positive trends in Bangladesh’s development give us that confidence. We can act more purposefully because it is evident that research-based policy making and practice can be successful in Bangladesh.
I congratulate the GED for taking up this bold and timely initiative. I would like to thank the authors and also the organizations who have contributed to prepare these background papers. Well Documented background papers will also be helpful for policy planners, development practitioners, researchers, academicians and even students as well. I expect that the background papers will be valuable for the officials of GED to prepare necessary policy briefs and write-ups they often prepare. I believe that not only GED but also other relevant officials will be immensely benefited with these background papers for upgrading and updating their knowledge and professional competences.
Finally, I convey my gratitude towards our Honorable Minister, Ministry of Planning, Mr. M.A. Mannan, MP for his guidance, instructions and continuous support in making this publication a reality.
(Dr. Shamsul Alam)
xxiBackground Papers
Dr. Md. Kawser AhmedMember (Secretary)
General Economics Division (GED)Bangladesh Planning Commission
ForewordIt is of immense pleasure that General Economics Division (GED) of Bangladesh Planning Commission is going to publish background papers which have been used as the inputs for preparing the country’s Eighth Five Year Plan (July 2020-June 2025).
For developing the Plan strategies and indicating the desirable development path that would lead to fulfilling its objectives, twenty different background studies covering different socio-economic sectors and sub-sectors, and a technical framework for macroeconomic projection for FY21-25 were prepared. Renowned economists and development practitioners in the relevant fields with a long-standing flair were assigned to conduct the studies within the stipulated timeframe.
These background studies are rich in contents and, if made available, will enrich the knowledge base relating to development challenges and development options facing Bangladesh. The background papers are going to publish in five separate volumes which will help the readers to understand the rational for the choice of the specific domain underlying the Plan and the design of the policy package adapted for the Plan for reconciling the goals of efficiency with those of equity.
I would like to express my deep gratitude to the authors and reviewers of the background studies for their sincere efforts in finalising the manuscripts in time. I am also indebted to the relevant officials of GED for their untiring support and cooperation in managing all the studies. I hope that the relevance of the issues and the diverse contents and analyses would make these volumes useful for the research community, policymakers, and others who are interested in understanding the development challenges of Bangladesh. I believe, readers would find all these approach papers of the Eighth Five Year Plan as source of rich treasure of knowledge and insights.
Dr. Md. Kawser Ahmed
xxii General Economics Division (GED)
Acknowledgements
The preparation of Eighth Five Year Plan (8FYP) was commissioned in 2019. Initially, a ‘National Steering Committee’ was formed under the chairmanship of the Hon’ble Minister of Planning to oversight the preparation of the plan. A Panel of Economists’, under the chairmanship of Dr. Wahiduddin Mahmud, was also formed comprising luminous Bangladeshi economists, sociologists, educationalists and experts on relevant fields, who gave continuous support in shaping the 8FYP. In this important initiative, General Economics Division (GED) ensured partnership of all the ministries/divisions/agencies, policy makers, academia, civil society organizations, NGOs, development partners, think-tanks and thought leaders in formulating this plan. A total of twenty (20) background studies were conducted with the help of the eminent experts in their respective fields. As GED is going to publish the background studies in 05 volumes, it would like to exert its gratitude to all the stakeholders involved.
First and foremost, GED would like to express its humble gratitude to the Hon’ble Prime Minister and the Chairman of the National Economic Council (NEC) H.E. Sheikh Hasina for her strategic direction and well-judged suggestions for finalizing the 8FYP.
GED is thankful for the guidance and timely direction provided by the Hon’ble Minister, Ministry of Planning Mr. M.A. Mannan, MP. His visionary leadership expedited the process of finalizing the 8FYP.
We are indebted to the outstanding leadership of Dr. Shamsul Alam, Hon’ble Minister of State, Ministry of Planning. He led the review and editorial process of the background papers and guided us to formulate the 8FYP.
Our heartfelt thanks to Mr. Md. Mafidul Islam, Chief, GED for his coordination and guidance in conducting the background studies. This would have not been possible without the extensive technical support from Mr. Md. Mahbubul Hoque Patwary, Joint Chief; Ms. Munira Begum, Joint Chief; Mr. Md. Mahbubul Alam Siddiquee, Deputy Chief; Mr. Mohammad Fahim Afsan Chowdhury, Senior Assistant Chief; and Mr. Shimul Sen, Senior Assistant Chief.
Finally, we would like to acknowledge with gratitude the continuing support being received from the officials and staff of the ‘Preparation and Monitoring of Medium-Term Development Plans (8th Five Year Plan) to Implement SDGs and Vision-2041’ project being implemented by GED for consolidating and publishing the aforesaid background studies in volume
1Background Papers
Study 11Managing the Skill Gap through Better Education,
TVET and Training Strategies
Kazi Iqbal*
* Senior Research Fellow, Bangladesh Institute of Development Studies (BIDS)

2 General Economics Division (GED)
3Background Papers
1. Introduction: Skill, Human Capital Development and Economic Growth
Bangladesh has made a remarkable success in achieving steady and persistent acceleration of growth over the last few decades, with about one percentage point increase in every decade since the 1980s. Average real GDP growth over the last five years has been above 7 per cent, which is much higher than the average growth rate of the comparators. Bangladesh is now a lower middle income country, has been growing at 7.9 percent, with per capita income of USD 1827 in 2018-19. In this backdrop, the fundamental question is: to what extent the economy of Bangladesh can sustain this high growth. The aspiration of becoming a higher middle income country by 2030 and a developed country by 2041 critically hinges on the answer to this question.
A country’s growth depends on the accumulation of the factors of production (capital and labor) and how efficiently these factors of production are used in the production process (total factor productivity). The history of growth in Bangladesh so far has been the accumulation of factors of production. That is, we have used more and more capital and labor over time and consequently output has increased. The risk of growth relying solely on factor accumulation is that at one stage the diminishing marginal return of factors set in, which ultimately leads to a stagnation of growth. This means that similar increase in capital and labor will result in less and less output overtime. The only solution to break this shackle is to increase total factor productivity. Education and skill of the labor force is the key to enhance the total factor productivity of the economy. For example, output generated by a low skilled typist with a computer is much lower than the output generated by a programmer with the same computer. That is, the challenge lies to what extent we can produce new programmers and skill up the current typists.
Remittances and RMGs are the two major drivers of growth in Bangladesh and both of these sectors are low skill intensive sectors. These two engines of growth are critical in accelerating growth at the early stage of development, however, they may not be sufficient to sustain the high growth. The economy requires to move up to the product ladder to produce more technologically sophisticated products with high value addition (e.g., electronics, machineries, etc.) and integrate itself into the regional and global value chains of these products. To this end, development of human capital through better education and skill is the only solution to sustain the current high growth of the economy.
The role of human capital in promoting economic growth has long been a forgone conclusion. But both the theories and empirical studies did not try to unbundle the abstract concept of human capital until recently. It is now argued that the number of years of school attainment or the expansion of school are not the good predictors of growth. Rather the quality of education, measured by cognitive ability of the students and the quality of schools matters more. There is strong evidence that the cognitive skills of the population rather than mere school attainment are strongly related to individual earnings, to the distribution of income, and to economic growth (Hanushek, 2008). Schooling that does not improve cognitive skills, measured by comparable international tests of mathematics, science, and reading, has limited impact on economic development. Econometric models that include direct measures of cognitive skills can account for about three times the variation in economic growth than models that include only years of schooling (Hanushek & Kimko, 2000). One implication of the impact of cognitive skills on individual earnings is that the distribution of those skills in the economy will have a direct effect on the distribution of income. The
4 General Economics Division (GED)
shift of focus from years of schooling to cognitive skills has important policy implications because policies that extend schooling may be very different from the best policies to improve skills.
The middle income trap has become a stylized fact for most of the middle income countries – a large number of lower middle income countries graduated to upper middle income countries in a very short period but could not escape the trap of upper middle income countries for a long period. Case studies suggest that the countries that were able to advance to developed countries, invested significantly in education and skill development such as South Korea. On the other hand, South American countries are argued to fall behind because of poorer quality of education system. Analysis of empirical growth model suggests that the low levels of cognitive skills account for the poor growth performance of Latin America (Hanushek & Woessmann, 2009). The lessons from these country case studies indicate the strong relationship between the education policy, skill development policy and industrial policy and their impact on economic growth.
There is a long debate on the optimal mix of general education vs. occupation specific skill and the timing of starting the programs for specific skills. There is a no definite answer. Theory and evidence suggest that this depends on the level of development and how the country envisions to grow. For example, European education policies that favored specialized, vocational education might have worked well, both in terms of growth rates and welfare, during the 1960s and 1970s when available technologies changed slowly. However, in the information age of the 1980s and 1990s when new technologies emerged at a more rapid rate they might have contributed to an increased growth gap relative to the US (Krueger & Kumar, 2004). That is, general education is well suited to adapt new changes in a rapidly changing world whereas vocational training is consistent with slow pace of technological change. One major policy implication for the developing countries is that too much focus on vocational training in the name of skill development can stymie the potential of the economy to advance to a higher growth trajectory. Hence, a prudent mix of quality general education with vocational training is essential for sustained growth and development.
A dilemma that a developing country with limited resources always encounter is: where to emphasize more – tertiary or non-tertiary. Without quality tertiary education, good teachers cannot be produced for non-tertiary level. On the other hand, without building on strong basic skills at the primary and secondary levels, investments in tertiary education appears to have little extra value. In fact, empirical studies for both developed and developing countries show that tertiary education has little added value in explaining economic growth after consideration of cognitive skills (Hanushek E. A., 2013). The lesson is that the cost of trade-off is very high – higher investment in tertiary education at the cost of primary and secondary education will not yield the desired result. Similarly, quality tertiary education cannot be ensured without quality primary and secondary schooling. That is a holistic approach, where all levels of general education are treated equally, is essential for the quality enhancement of education as well as building a skilled labor force.
In essence, in order to sustain the high economic growth, reduce poverty and income inequality, enhancement of the quality of general education of all levels and quality of the vocation education and training should be core theme of the ensuing 8th Five Year Plan. While the 7th FYP and the Perspective Plans lay out the foundation for developing
5Background Papers
the ecosystem of skill development of the country, the focus of the 8th FYP should be the wholesale reforms in education and skill development sector to reflect the aspiration of the citizens.
2. A Conceptual Note on Types of Skill and Skill MismatchAt the very outset, it is essential to conceptualize a few issues regarding skill mismatch. This is important for a few reasons. First, the Skill Development Policy 2011 lacks the understanding of such variations of skill mismatch. Second, in order to track the level of skills and skill mismatch in various sector, it is also imperative to measure such skill and skill mismatch with a uniform definition across sectors and over time. The tracking of targets of SDGs and 8th Five Year Plan will also require standardized measurement of skill and skill mismatch. Third, poor understanding of such variations will result in weak policy to correct the mismatch.
2.1 Market failure: Transferable vs. non-transferable skillEmployers have little incentives to invest in skill development of the employees if skills are transferable in nature across firms or industries. Becker (1962) argued that firms will not pay for the training for general skills where return to firm is lower than the returns to employees (Becker, 1962). In this case, market fails and this justifies the intervention of the government. This provides a guideline for identifying the areas the government should consider to impart training on. If the skill is very firm-specific, or transferable across only a small number of firms, wages may not rise as much as the productivity of the trained worker, and hence the firm can appropriate some of the returns to these skills. In such cases, the firm has a greater incentive to invest in an employee acquiring the skill.
2.2 Cognitive, soft and technical skillCognitive skills include literacy and numeracy. They refer to the ability to understand complex ideas, adapt effectively to the environment, learn from experience, and reason. Soft skill includes non-cognitive abilities or personality traits such as teamwork, communication, work ethic, time management, leadership, work under pressure, etc. While there is an increasing evidence on the high return of soft skills, skill development policies in the developing countries tend to ignore this important aspect of skill. Technical skills refer to the acquired knowledge, expertise and interactions needed to perform a specific job, including the mastery of the materials, tools, or technologies.
2.3 Skill Mismatch Skill mismatch is defined as the discrepancies between skills demanded and skills supplied in the labor market. There are four major types of skill mismatch – skill shortage, skill gap, horizontal mismatch, and vertical mismatch. In developing countries, the first order problem is skill shortage and skill gap – there are not enough skilled workers available and if available they do not possess the required level of skill. Horizontal mismatch refers to the situation where there is a mismatch of field of study, for example, students of humanities working in the financial sector. On the other hand, vertical mismatch refers to over and under education and both are inefficient use of resources. If workers in a firm are overeducated than what is required to perform a task, this implies that the firm is wasting a part of labor productivity which, if skill had matched perfectly, could have been used to generate a higher level of output.
6 General Economics Division (GED)
Forms of Skill Mismatch
2.3.1 Skill Gap
Skill gap is a measure at the intensive margin. It is measured based on employer’s perception about the performance of employees. It measures the degree to which workers lack adequate proficiencies to efficiently perform their tasks. For example, there are many welders in the country but most of them are not trained for welding with high precision. Low skilled managers in the RMG sector are also subject to skill gap. This type of skill mismatch may cause lower output per worker, increase labor cost, incur additional costs on recruitment and training and adversely affect firm-level profitability. Skill gaps are typically measured from information perceived by the employer on skill insufficiencies among the workers in a firm. However, similar perception-based information are also collected from the employees themselves on their skills and expertise.
2.3.2 Skill Shortage
Skill shortage is a measure at the extensive margin. Skill Shortage refers to a situation where there are hard to fill vacancies, that is, employers cannot find suitable candidates with certain skills. Industrial engineers in the light engineering sector or the R &D in the RMG sector are good examples of skill shortage. Skill shortage is characterized by market failure where the demand for skills by employers cannot be met by the available supply at the equilibrium wage rates. The skill shortage can result in skill gap too - whenever firms find it hard to fill vacancies due to lack of a particular skill, they are forced to recruit inadequately skilled workers to fill up the positions.
2.3.3 Vertical mismatch: Over-education and Under-education
Over-education and under-education refer to the situation where employers end up hiring employees with the qualifications which are above or below what is required to perform the tasks of the job. A large number of graduates are found to work as clerks in many offices which actually require qualification of higher secondary level. In this case, investments in the higher education of these workers is a waste of resources. On the other hand, under education is prevalent among the occupations where experiences dominate more than institutional degrees. Three are three approaches in literature to measure over-education and under-education, namely subjective method, realized matches method and job evaluation method. The first two are the most commonly used methods in the literature.
2.3.4 Horizontal mismatch
Horizontal mismatch refers to situations where workers work in the occupations that are neither related to their education, nor to their skills and knowledge. The discrepancy between the workers’ primary field of study and the field of training actually required for the jobs is measured as horizontal mismatch. Measuring horizontal mismatch involves asking workers to assess the relevance of their current job with their field of study and expertise.
3. A Stock Taking of Skill Level and Skill Mismatch in Bangladesh
One third of the working age population in low- and middle-income countries lack the basic skills required to get decent jobs, leaving them unable to achieve their full productive
7Background Papers
potential and thus limiting economic growth. The challenge is further exacerbated by a rapidly changing global economy that increasingly requires workers to be innovative, flexible and adaptive. According to World Bank calculations, more than two billion working-age adults are not equipped with the most essential literacy skills required by employers. Among young adults under the age of 25, the number is about 420 million worldwide.
Our current knowledge about the stock of skill and skill mismatch in various occupations of different sectors in Bangladesh is very poor, largely because of paucity of reliable data and robust study. It is unfortunate that there is no robust empirical study to track the skill demand and skill mismatch of the major sectors of the country. Nor we have any study that compares various sector with a uniform definition of skill and skill mismatch to ensure meaningful comparison. Our analysis of the stock taking of skill mismatch relies primarily on two studies – labor market and skill gap in Bangladesh conducted (2017) by BIDS (BIDS, 2017) and an assessment of skills in the formal sector labor market in Bangladesh (2013) conducted by World Bank (Nomura, Hong, Nordman, Remi Sarr, & Vawda, 2013).
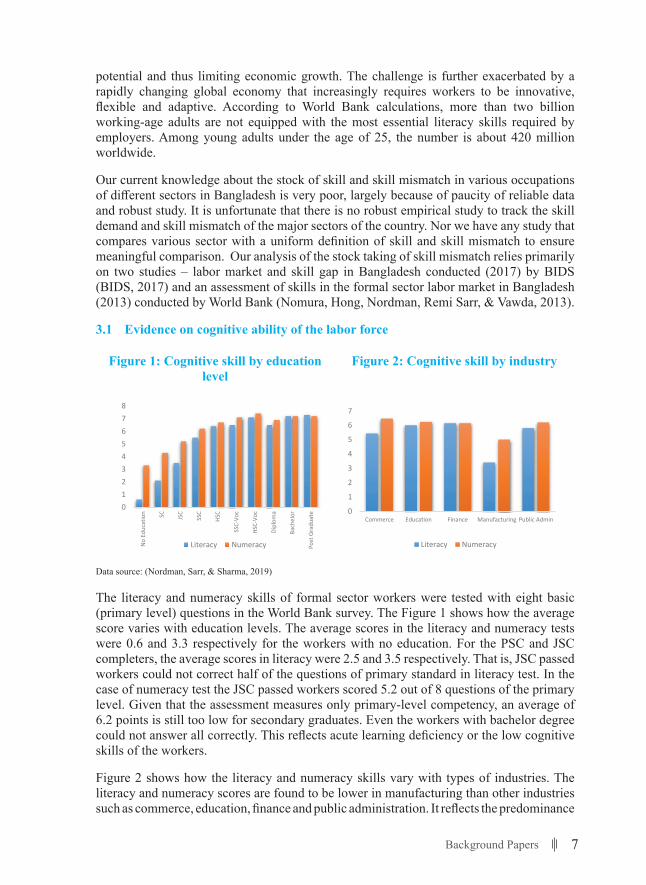
3.1 Evidence on cognitive ability of the labor force
Figure 1: Cognitive skill by education level
Figure 2: Cognitive skill by industry
14
3. A STOCK TAKING OF SKILL LEVEL AND SKILL MISMATCH IN BANGLADESH One third of the working age population in low- and middle-income countries lack the basic skills required to get decent jobs, leaving them unable to achieve their full productive potential and thus limiting economic growth. The challenge is further exacerbated by a rapidly changing global economy that increasingly requires workers to be innovative, flexible and adaptive. According to World Bank calculations, more than two billion working-age adults are not equipped with the most essential literacy skills required by employers. Among young adults under the age of 25, the number is about 420 million worldwide.
Our current knowledge about the stock of skill and skill mismatch in various occupations of different sectors in Bangladesh is very poor, largely because of paucity of reliable data and robust study. It is unfortunate that there is no robust empirical study to track the skill demand and skill mismatch of the major sectors of the country. Nor we have any study that compares various sector with a uniform definition of skill and skill mismatch to ensure meaningful comparison. Our analysis of the stock taking of skill mismatch relies primarily on two studies – labor market and skill gap in Bangladesh conducted (2017) by BIDS (BIDS, 2017) and an assessment of skills in the formal sector labor market in Bangladesh (2013) conducted by World Bank (Nomura, Hong, Nordman, Remi Sarr, & Vawda, 2013).
3.1 Evidence on cognitive ability of the labor force
Figure 1: Cognitive skill by education level
Figure 2: Cognitive skill by industry
Data source: (Nordman, Sarr, & Sharma, 2019)
The literacy and numeracy skills of formal sector workers were tested with eight basic (primary level) questions in the World Bank survey. The Figure 1 shows how the average score varies with education levels. The average scores in the literacy and numeracy tests were 0.6 and 3.3 respectively for the workers with no education. For the PSC and JSC completers, the average scores in literacy were 2.5 and 3.5 respectively. That is, JSC passed workers could not correct half of the questions of primary standard in literacy test. In the case of numeracy test the JSC passed workers scored 5.2 out of 8 questions of the primary level. Given that the assessment measures only primary-level competency, an average of 6.2
012345678
No E
duca
tion SC JSC
SSC
HSC
SSC-
Voc
HSC-
Voc
Dipl
oma
Bach
elor
Post
Gra
duat
e
Literacy Numeracy
0
1
2
3
4
5
6
7
Commerce Education Finance Manufacturing Public Admin
Literacy Numeracy
Data source: (Nordman, Sarr, & Sharma, 2019)
The literacy and numeracy skills of formal sector workers were tested with eight basic (primary level) questions in the World Bank survey. The Figure 1 shows how the average score varies with education levels. The average scores in the literacy and numeracy tests were 0.6 and 3.3 respectively for the workers with no education. For the PSC and JSC completers, the average scores in literacy were 2.5 and 3.5 respectively. That is, JSC passed workers could not correct half of the questions of primary standard in literacy test. In the case of numeracy test the JSC passed workers scored 5.2 out of 8 questions of the primary level. Given that the assessment measures only primary-level competency, an average of 6.2 points is still too low for secondary graduates. Even the workers with bachelor degree could not answer all correctly. This reflects acute learning deficiency or the low cognitive skills of the workers.
Figure 2 shows how the literacy and numeracy skills vary with types of industries. The literacy and numeracy scores are found to be lower in manufacturing than other industries such as commerce, education, finance and public administration. It reflects the predominance
8 General Economics Division (GED)
of low skilled jobs in the manufacturing sectors which requires low cognitive ability to perform the tasks. While the country envisions to become an upper middle country in the next 10 years, riding on the growth of manufacturing, this low level of cognitive ability of the manufacturing workers is far from what the country requires.
3.2 Evidence on soft skill of the labor force
As discussed in section 2, the importance of soft skills or the non-cognitive skills has been increasingly recognized in both developed and developing countries. The labor market outcomes of soft skills are also well documented. The World Bank survey measures Big Five personality traits of the labor force in Bangladesh. We discussed their findings very briefly here.
Box 1: Soft Skill: Big Five Personality Traits
Openness: People who like to learn new things and enjoy new experiences usually score high in openness. Openness includes traits like being insightful and imaginative and having a wide variety of interests.
Conscientiousness: People that have a high degree of conscientiousness are reliable and prompt. Traits include being organized, methodic, and thorough.
Extraversion: Extraverts get their energy from interacting with others, while introverts get their energy from within themselves. Extraversion includes the traits of energetic, talkative, and assertive.
Agreeableness: These individuals are friendly, cooperative, and compassionate. People with low agreeableness may be more distant. Traits include being kind, affectionate, and sympathetic.
Neuroticism: Neuroticism is also sometimes called emotional stability. This dimension relates to one’s emotional stability and degree of negative emotions. People that score high on neuroticism often experience emotional instability and negative emotions. Traits include being moody and tense.Source: https://www.123test.com/big-five-personality-theory/
Some of the aspects of the soft skills of the manufacturing workers are found to be lower than other industries such as commerce. However, the broad categories of industries cannot distinguish the level of soft skills among the workers, since each category is highly heterogeneous. For example, soft skill is required more for floor supervisor than the sewing machine operator in RMG sector. We need occupation-wise measures of soft skill for each industry.
Wages are found to depend more on cognitive ability than personal traits or soft skills in the formal sector in Bangladesh (Nordman, Sarr, & Sharma, 2019). The cognitive attainment as measured by reading and numeracy seems to vary with gender. The Big Five traits of agreeableness are positively associated with females’ wages.
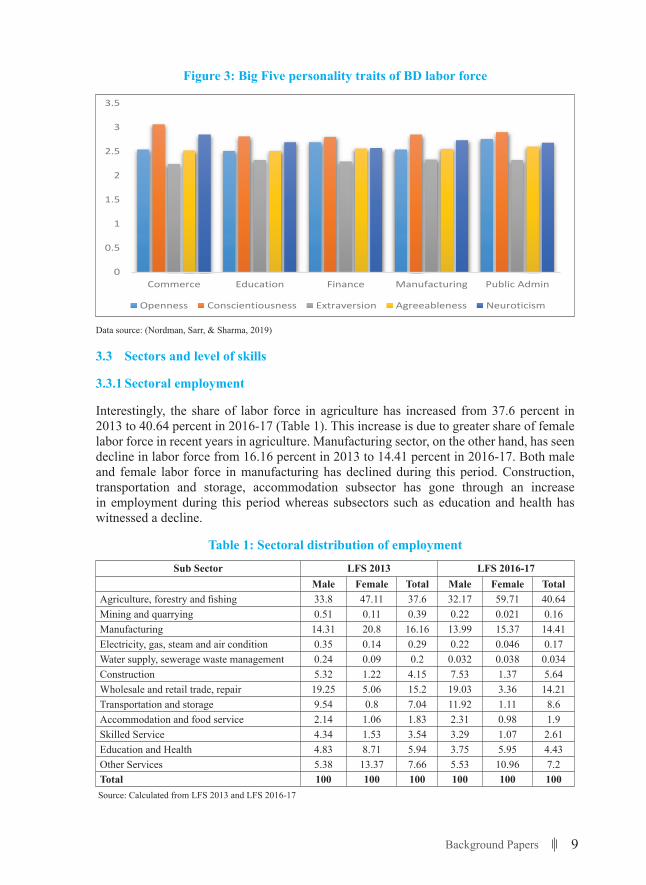
9Background Papers
Figure 3: Big Five personality traits of BD labor force
16
Wages are found to depend more on cognitive ability than personal traits or soft skills in the formal sector in Bangladesh (Nordman, Sarr, & Sharma, 2019). The cognitive attainment as measured by reading and numeracy seems to vary with gender. The Big Five traits of agreeableness are positively associated with females’ wages. Figure 3: Big Five personality traits of BD labor force
Data source: (Nordman, Sarr, & Sharma, 2019)
3.3 Sectors and level of skills
3.3.1 Sectoral employment
Interestingly, the share of labor force in agriculture has increased from 37.6 percent in 2013 to 40.64 percent in 2016-17 (Table 1). This increase is due to greater share of female labor force in recent years in agriculture. Manufacturing sector, on the other hand, has seen decline in labor force from 16.16 percent in 2013 to 14.41 percent in 2016-17. Both male and female labor force in manufacturing has declined during this period. Construction, transportation and storage, accommodation subsector has gone through an increase in employment during this period whereas subsectors such as education and health has witnessed a decline.
Table 1: Sectoral distribution of employment
Sub Sector LFS 2013 LFS 2016-17 Male Female Total Male Female Total Agriculture, forestry and fishing 33.8 47.11 37.6 32.17 59.71 40.64 Mining and quarrying 0.51 0.11 0.39 0.22 0.021 0.16 Manufacturing 14.31 20.8 16.16 13.99 15.37 14.41 Electricity, gas, steam and air condition 0.35 0.14 0.29 0.22 0.046 0.17 Water supply, sewerage waste management
0.24 0.09 0.2 0.032 0.038 0.034
Construction 5.32 1.22 4.15 7.53 1.37 5.64
0
0.5
1
1.5
2
2.5
3
3.5
Commerce Education Finance Manufacturing Public Admin
Openness Conscientiousness Extraversion Agreeableness Neuroticism
Data source: (Nordman, Sarr, & Sharma, 2019)
3.3 Sectors and level of skills
3.3.1 Sectoral employment
Interestingly, the share of labor force in agriculture has increased from 37.6 percent in 2013 to 40.64 percent in 2016-17 (Table 1). This increase is due to greater share of female labor force in recent years in agriculture. Manufacturing sector, on the other hand, has seen decline in labor force from 16.16 percent in 2013 to 14.41 percent in 2016-17. Both male and female labor force in manufacturing has declined during this period. Construction, transportation and storage, accommodation subsector has gone through an increase in employment during this period whereas subsectors such as education and health has witnessed a decline.
Table 1: Sectoral distribution of employment
Sub Sector LFS 2013 LFS 2016-17Male Female Total Male Female Total
Agriculture, forestry and fishing 33.8 47.11 37.6 32.17 59.71 40.64Mining and quarrying 0.51 0.11 0.39 0.22 0.021 0.16Manufacturing 14.31 20.8 16.16 13.99 15.37 14.41Electricity, gas, steam and air condition 0.35 0.14 0.29 0.22 0.046 0.17Water supply, sewerage waste management 0.24 0.09 0.2 0.032 0.038 0.034Construction 5.32 1.22 4.15 7.53 1.37 5.64Wholesale and retail trade, repair 19.25 5.06 15.2 19.03 3.36 14.21Transportation and storage 9.54 0.8 7.04 11.92 1.11 8.6Accommodation and food service 2.14 1.06 1.83 2.31 0.98 1.9Skilled Service 4.34 1.53 3.54 3.29 1.07 2.61Education and Health 4.83 8.71 5.94 3.75 5.95 4.43Other Services 5.38 13.37 7.66 5.53 10.96 7.2Total 100 100 100 100 100 100
Source: Calculated from LFS 2013 and LFS 2016-17
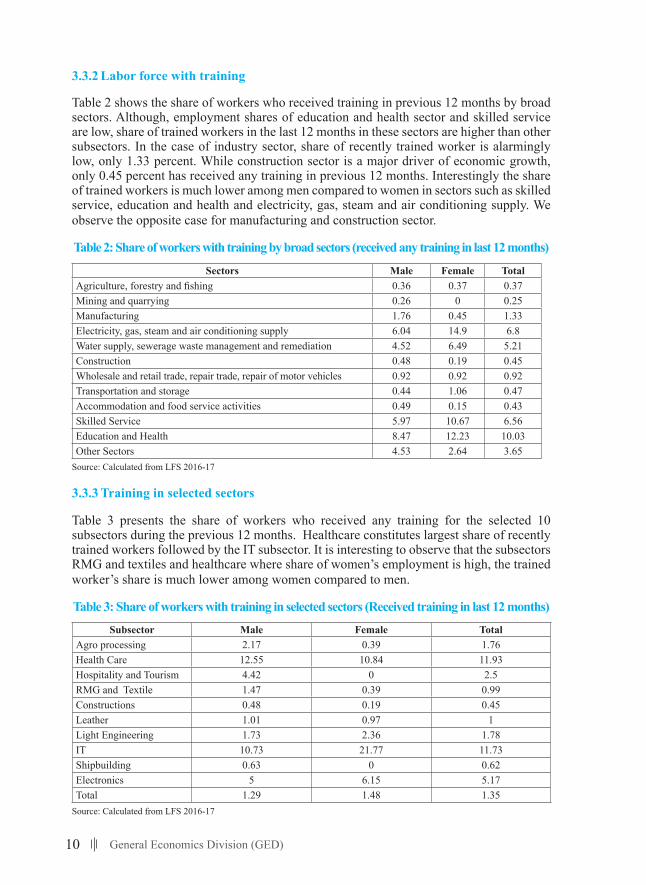
10 General Economics Division (GED)
3.3.2 Labor force with training
Table 2 shows the share of workers who received training in previous 12 months by broad sectors. Although, employment shares of education and health sector and skilled service are low, share of trained workers in the last 12 months in these sectors are higher than other subsectors. In the case of industry sector, share of recently trained worker is alarmingly low, only 1.33 percent. While construction sector is a major driver of economic growth, only 0.45 percent has received any training in previous 12 months. Interestingly the share of trained workers is much lower among men compared to women in sectors such as skilled service, education and health and electricity, gas, steam and air conditioning supply. We observe the opposite case for manufacturing and construction sector.
Table 2: Share of workers with training by broad sectors (received any training in last 12 months)
Sectors Male Female TotalAgriculture, forestry and fishing 0.36 0.37 0.37Mining and quarrying 0.26 0 0.25Manufacturing 1.76 0.45 1.33Electricity, gas, steam and air conditioning supply 6.04 14.9 6.8Water supply, sewerage waste management and remediation 4.52 6.49 5.21Construction 0.48 0.19 0.45Wholesale and retail trade, repair trade, repair of motor vehicles 0.92 0.92 0.92Transportation and storage 0.44 1.06 0.47Accommodation and food service activities 0.49 0.15 0.43Skilled Service 5.97 10.67 6.56Education and Health 8.47 12.23 10.03Other Sectors 4.53 2.64 3.65
Source: Calculated from LFS 2016-17
3.3.3 Training in selected sectors
Table 3 presents the share of workers who received any training for the selected 10 subsectors during the previous 12 months. Healthcare constitutes largest share of recently trained workers followed by the IT subsector. It is interesting to observe that the subsectors RMG and textiles and healthcare where share of women’s employment is high, the trained worker’s share is much lower among women compared to men.
Table 3: Share of workers with training in selected sectors (Received training in last 12 months)
Subsector Male Female TotalAgro processing 2.17 0.39 1.76Health Care 12.55 10.84 11.93Hospitality and Tourism 4.42 0 2.5RMG and Textile 1.47 0.39 0.99Constructions 0.48 0.19 0.45Leather 1.01 0.97 1Light Engineering 1.73 2.36 1.78IT 10.73 21.77 11.73Shipbuilding 0.63 0 0.62Electronics 5 6.15 5.17Total 1.29 1.48 1.35
Source: Calculated from LFS 2016-17
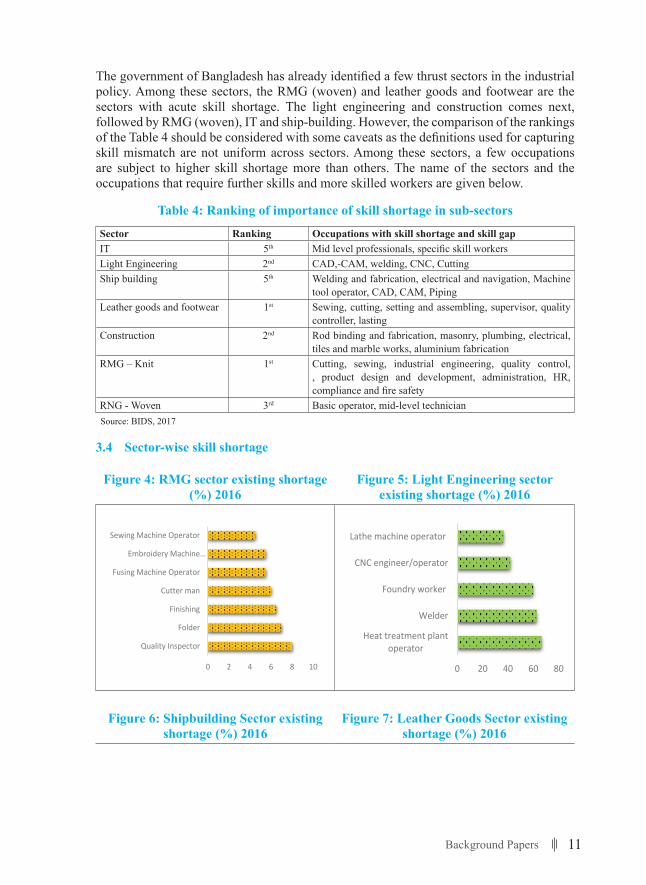
11Background Papers
The government of Bangladesh has already identified a few thrust sectors in the industrial policy. Among these sectors, the RMG (woven) and leather goods and footwear are the sectors with acute skill shortage. The light engineering and construction comes next, followed by RMG (woven), IT and ship-building. However, the comparison of the rankings of the Table 4 should be considered with some caveats as the definitions used for capturing skill mismatch are not uniform across sectors. Among these sectors, a few occupations are subject to higher skill shortage more than others. The name of the sectors and the occupations that require further skills and more skilled workers are given below.
Table 4: Ranking of importance of skill shortage in sub-sectors
Sector Ranking Occupations with skill shortage and skill gapIT 5th Mid level professionals, specific skill workersLight Engineering 2nd CAD,-CAM, welding, CNC, Cutting Ship building 5th Welding and fabrication, electrical and navigation, Machine
tool operator, CAD, CAM, PipingLeather goods and footwear 1st Sewing, cutting, setting and assembling, supervisor, quality
controller, lasting Construction 2nd Rod binding and fabrication, masonry, plumbing, electrical,
tiles and marble works, aluminium fabrication RMG – Knit 1st Cutting, sewing, industrial engineering, quality control,
, product design and development, administration, HR, compliance and fire safety
RNG - Woven 3rd Basic operator, mid-level technician Source: BIDS, 2017
3.4 Sector-wise skill shortage
Figure 4: RMG sector existing shortage (%) 2016
Figure 5: Light Engineering sector existing shortage (%) 2016
19
Figure 4: RMG sector existing shortage (%) 2016
Figure 5: Light Engineering sector existing shortage (%) 2016
Figure 6: Shipbuilding Sector existing shortage (%) 2016
Figure 7: Leather Goods Sector existing shortage (%) 2016
Figure 8: Construction sector existing shortage (%) 2016
Figure 9: Hotel and Tourism sector existing shortage (%) 2016
Data source: (BIDS, 2017)
0 2 4 6 8 10
Quality Inspector
Folder
Finishing
Cutter man
Fusing Machine Operator
Embroidery Machine…
Sewing Machine Operator
0 20 40 60 80
Heat treatment plantoperator
Welder
Foundry worker
CNC engineer/operator
Lathe machine operator
0.0 5.0 10.0 15.0 20.0 25.0
WelderFitter
ElectricianMechanist/Machine man
PainterCutter man
GrinderPlumber
0.00 5.00 10.00 15.00
Engineer and otherprofessional
Sewing operator
Machine operator andwelder/electrician
Cutting operator andaged colours
Lasting, setting andassembling operator
1.89 1.9 1.91 1.92
Mason
Painter
Fitter
Fixer
Plumber
Tillers
0 20 40 60 80
Front Office(Manager,Executive)
Food & Beverage (Service)(Manager, Supervisor, Captain
etc)
Food & Beverage (Production)(Sous Chef,Chef the Partie,Demi Chef the Partie etc)
Housekeeping
Figure 6: Shipbuilding Sector existing shortage (%) 2016
Figure 7: Leather Goods Sector existing shortage (%) 2016
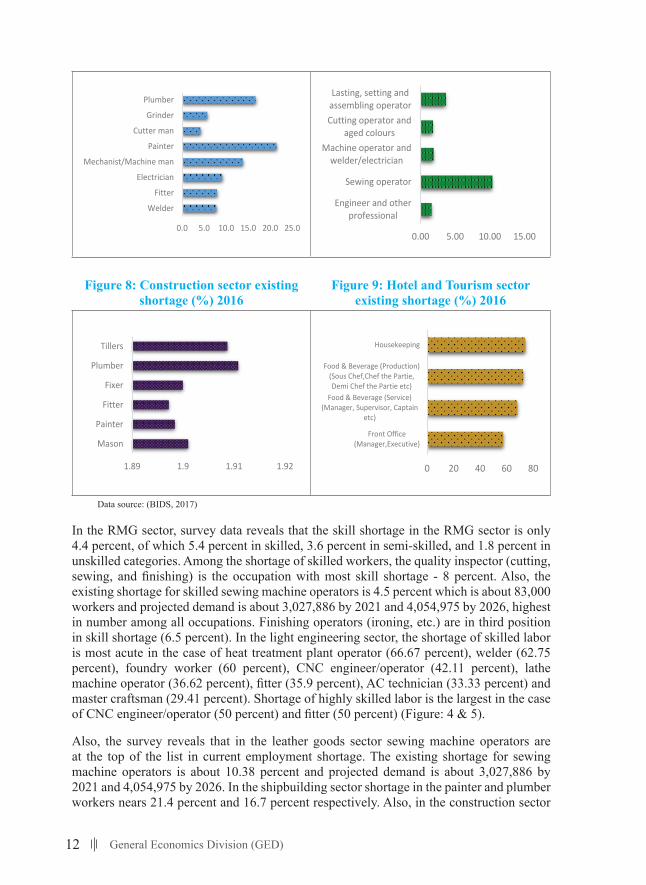
12 General Economics Division (GED)
19
Figure 4: RMG sector existing shortage (%) 2016
Figure 5: Light Engineering sector existing shortage (%) 2016
Figure 6: Shipbuilding Sector existing shortage (%) 2016
Figure 7: Leather Goods Sector existing shortage (%) 2016
Figure 8: Construction sector existing shortage (%) 2016
Figure 9: Hotel and Tourism sector existing shortage (%) 2016
Data source: (BIDS, 2017)
0 2 4 6 8 10
Quality Inspector
Folder
Finishing
Cutter man
Fusing Machine Operator
Embroidery Machine…
Sewing Machine Operator
0 20 40 60 80
Heat treatment plantoperator
Welder
Foundry worker
CNC engineer/operator
Lathe machine operator
0.0 5.0 10.0 15.0 20.0 25.0
WelderFitter
ElectricianMechanist/Machine man
PainterCutter man
GrinderPlumber
0.00 5.00 10.00 15.00
Engineer and otherprofessional
Sewing operator
Machine operator andwelder/electrician
Cutting operator andaged colours
Lasting, setting andassembling operator
1.89 1.9 1.91 1.92
Mason
Painter
Fitter
Fixer
Plumber
Tillers
0 20 40 60 80
Front Office(Manager,Executive)
Food & Beverage (Service)(Manager, Supervisor, Captain
etc)
Food & Beverage (Production)(Sous Chef,Chef the Partie,Demi Chef the Partie etc)
Housekeeping
Figure 8: Construction sector existing shortage (%) 2016
Figure 9: Hotel and Tourism sector existing shortage (%) 2016
19
Figure 4: RMG sector existing shortage (%) 2016
Figure 5: Light Engineering sector existing shortage (%) 2016
Figure 6: Shipbuilding Sector existing shortage (%) 2016
Figure 7: Leather Goods Sector existing shortage (%) 2016
Figure 8: Construction sector existing shortage (%) 2016
Figure 9: Hotel and Tourism sector existing shortage (%) 2016
Data source: (BIDS, 2017)
0 2 4 6 8 10
Quality Inspector
Folder
Finishing
Cutter man
Fusing Machine Operator
Embroidery Machine…
Sewing Machine Operator
0 20 40 60 80
Heat treatment plantoperator
Welder
Foundry worker
CNC engineer/operator
Lathe machine operator
0.0 5.0 10.0 15.0 20.0 25.0
WelderFitter
ElectricianMechanist/Machine man
PainterCutter man
GrinderPlumber
0.00 5.00 10.00 15.00
Engineer and otherprofessional
Sewing operator
Machine operator andwelder/electrician
Cutting operator andaged colours
Lasting, setting andassembling operator
1.89 1.9 1.91 1.92
Mason
Painter
Fitter
Fixer
Plumber
Tillers
0 20 40 60 80
Front Office(Manager,Executive)
Food & Beverage (Service)(Manager, Supervisor, Captain
etc)
Food & Beverage (Production)(Sous Chef,Chef the Partie,Demi Chef the Partie etc)
Housekeeping
Data source: (BIDS, 2017)
In the RMG sector, survey data reveals that the skill shortage in the RMG sector is only 4.4 percent, of which 5.4 percent in skilled, 3.6 percent in semi-skilled, and 1.8 percent in unskilled categories. Among the shortage of skilled workers, the quality inspector (cutting, sewing, and finishing) is the occupation with most skill shortage - 8 percent. Also, the existing shortage for skilled sewing machine operators is 4.5 percent which is about 83,000 workers and projected demand is about 3,027,886 by 2021 and 4,054,975 by 2026, highest in number among all occupations. Finishing operators (ironing, etc.) are in third position in skill shortage (6.5 percent). In the light engineering sector, the shortage of skilled labor is most acute in the case of heat treatment plant operator (66.67 percent), welder (62.75 percent), foundry worker (60 percent), CNC engineer/operator (42.11 percent), lathe machine operator (36.62 percent), fitter (35.9 percent), AC technician (33.33 percent) and master craftsman (29.41 percent). Shortage of highly skilled labor is the largest in the case of CNC engineer/operator (50 percent) and fitter (50 percent) (Figure: 4 & 5).
Also, the survey reveals that in the leather goods sector sewing machine operators are at the top of the list in current employment shortage. The existing shortage for sewing machine operators is about 10.38 percent and projected demand is about 3,027,886 by 2021 and 4,054,975 by 2026. In the shipbuilding sector shortage in the painter and plumber workers nears 21.4 percent and 16.7 percent respectively. Also, in the construction sector
13Background Papers
highest shortage was found in the occupations of plumbers, which is about 2 percent. The survey also finds that the hotel and tourism sector in 2016 experienced shortage of 136.4 thousands labor across different occupations. The largest shortage exists in housekeeping (74 percent) and in the food and beverage (production) department (73 percent) where employers expect to employ 54.13 thousands of skilled workers.
In short, the labor force lacks the necessary cognitive abilities measured by numeracy and literacy skills. Soft skills of the labor force vary with industry and are also found to be moderate. The incidence of training is low - a large share of the workforce are found to have no training in the previous one year. The sectoral skill shortage for different occupations are also very large.
4. Skilling Up The Labour Force: An Overarching Framework for Bangladesh
4.1 Guiding Principles
The framework for skill development must follow some principles to guide objectives, scopes and methods. These principles and the framework will also help craft the new Skill Development Policy 2020.
4.1.1BroaderDefinitionofSkill
Section 2 describes various types of skills such as cognitive, non-cognitive or soft, and technical skills. These three are the important determinants of the individual earnings. Moreover, the distinction between transferable (general) and non-transferable (occupation or task specific) skills helps justify government interventions. Understanding and recognition of the importance of different types of skills is central to designing an overarching framework for skill development. It is important to note that NSDP 2011 defines Skills development “as the full range of formal and non-formal vocational, technical and skills based education and training for employment and or self- employment” (NSDP, 2011). That is, the definition is very narrow and focuses only on the technical skill, ignoring the cognitive and soft parts of it. It is also empirically established that the level of technical skill acquisition critically hinges on the level of cognitive abilities. Therefore, it is essential to define skills with a larger scope so that the framework for skill development becomes an overarching one.
4.1.2 No One Left Behind
The central theme of “Leaving no one behind” of the 2030 agenda for sustainable development goal can serve as the core principle of skill development framework for the labor force. While this theme is pivotal to achieving the inclusive and equitable society, it also stresses the importance of equipping all with the right skill sets so that he or she can live a decent life. To this end, skilling up the citizen so that they can participate in the formal labor market is an important strategy for the government to uphold the spirit of no one left behind. It is not only the right to education, but the right to learn and acquire some marketable skill that matters. Therefore, the provision of equal access for all to acquire desired skill is also a core principle that dictates the framework.
14 General Economics Division (GED)
4.1.3 Life Long Learning
The concept of lifelong learning entails the creation of opportunity for learning and skill acquisition at any age of life. Being a central theme of SDG4, it also helps guide the skill development strategy of a country. Any person at any age should be able to learn something new and it is the responsibility of the government to create the enabling environment for it. The education ecosystem that supports the lifelong learning promotes early childhood development, adult literacy and training, no entry barrier to general education and TVET based on age, seamless movement between general and vocational education, etc.
4.1.4 Clear Understanding of the Skill Production Function
What constitutes skills? What makes a welder a proficient welder? Cognitive skills earned at the primary and secondary level, off-job training at training institute, on job training, experiences, etc. matter in producing a skilled welder. That is, understanding of the skill production function - the factors and the process that contrite to skill production, is essential for designing the skill development framework. Hence, the role of vocational training cannot be seen in isolation; it has to be embedded in the overall education system of the country. Without solid foundation in the primary level, we cannot expect better outcome in the secondary level and similarly, sound primary and secondary training lays the foundation for skill accumulation in the vocational education as well as in the tertiary level. ‘Skills beget skills’, though sounds like a catch-22 problem, - is the main mantra for any skill development strategy.
4.1.5 Alignment of Education and Skill Development Policies with Industrial Policy and Long Term Plans
Every developing country has an aspiration and plan on how to grow and how to grow fast. Hence the policy makers envisage the share of manufacturing along the transitional path and the sectors that will push the manufacturing growth. This projection is laid out in the Five Year Plan and the Industrial Policy elaborates the details of the route to higher industrial growth in Bangladesh. One of the critical elements required for the industrial growth is the human capital. That is, the plan for developing human capital has to be aligned and consistent with the industrial policy and growth strategy. Education and skill development policies cannot be stand-alone documents. Since the country aspires to become an upper middle country by 2030, it is essential to investment in human capital to help grow the thrust sectors as defined in the industrial policy. The polices that highlights the trade-offs between STEM (Science, technology, engineering and mathematics) vs. other streams, between general and vocational education, between tertiary vs. non-tertiary education have to be aligned with the industrial policy and the projected growth path of the country.
4.1.6 Informed Agent
The ideal framework for skill development should create such an enabling situation so that all agents can make informed decision about the choice of education stream, disciplines and career. Is the rate of return of vocational education is higher compared to comparable groups who choose general stream? How many students who pass SSC and HSC are aware of the vocational stream, particularly in the rural areas? How many are them are aware of the job prospects of different education stream? Anecdotal evidence suggest that there is a severe lack of awareness about the vocational education and its job prospects.
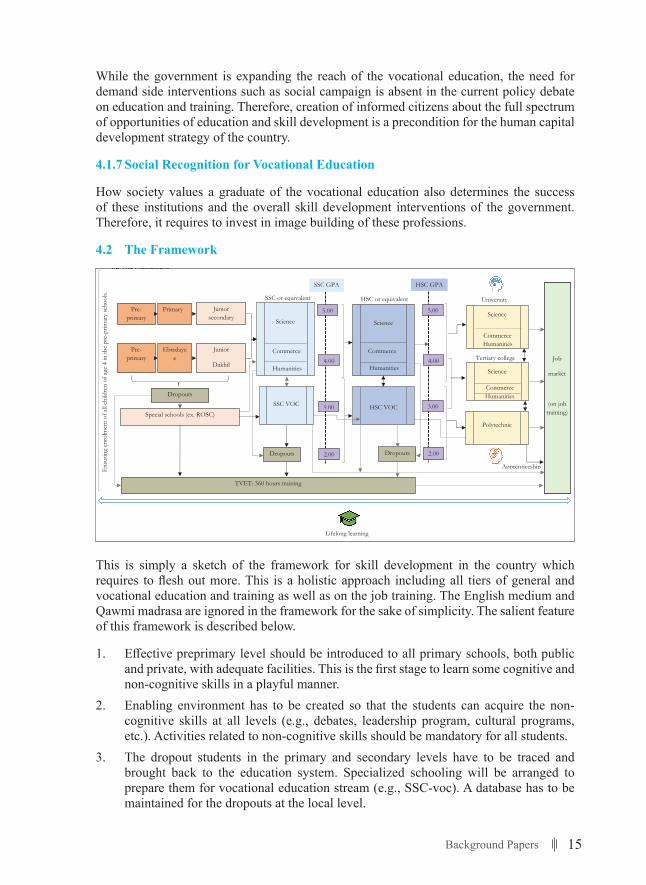
15Background Papers
While the government is expanding the reach of the vocational education, the need for demand side interventions such as social campaign is absent in the current policy debate on education and training. Therefore, creation of informed citizens about the full spectrum of opportunities of education and skill development is a precondition for the human capital development strategy of the country.
4.1.7 Social Recognition for Vocational Education
How society values a graduate of the vocational education also determines the success of these institutions and the overall skill development interventions of the government. Therefore, it requires to invest in image building of these professions.
4.2 The Framework
23
4.2 The Framework
TVET: 360 hours training
Dropouts Dropouts
Commerce
HSC GPA
HSC or equivalent
Science
Humanities
Commerce
SSC GPA
5.00
Pre-primary
Ebtedayee
Junior
Dakhil
Pre-primary
Primary Junior secondary
Dropouts
Special schools (ex. ROSC)
SSC or equivalent
Science
Humanities
Commerce
SSC VOC
Ens
urin
g en
rolm
ent o
f all
child
ren
of a
ge 4
in th
e pr
e-pr
imar
y sc
hool
s.
Lifelong learning
Job
market
(on job training)
University
Tertiary college
Polytechnic
Humanities
Science
Science
Humanities Commerce
Apprenticeship
4.00
3.00
2.00
4.00
3.00
2.00
5.00
HSC VOC
This is simply a sketch of the framework for skill development in the country which requires to flesh out more. This is a holistic approach including all tiers of general and vocational education and training as well as on the job training. The English medium and Qawmi madrasa are ignored in the framework for the sake of simplicity. The salient feature of this framework is described below.
1. Effective preprimary level should be introduced to all primary schools, both public and private, with adequate facilities. This is the first stage to learn some cognitive and non-cognitive skills in a playful manner.
2. Enabling environment has to be created so that the students can acquire the non-cognitive skills at all levels (e.g., debates, leadership program, cultural programs, etc.). Activities related to non-cognitive skills should be mandatory for all students.
3. The dropout students in the primary and secondary levels have to be traced and brought back to the education system. Specialized schooling will be arranged to prepare them for vocational education stream (e.g., SSC-voc). A database has to be maintained for the dropouts at the local level.
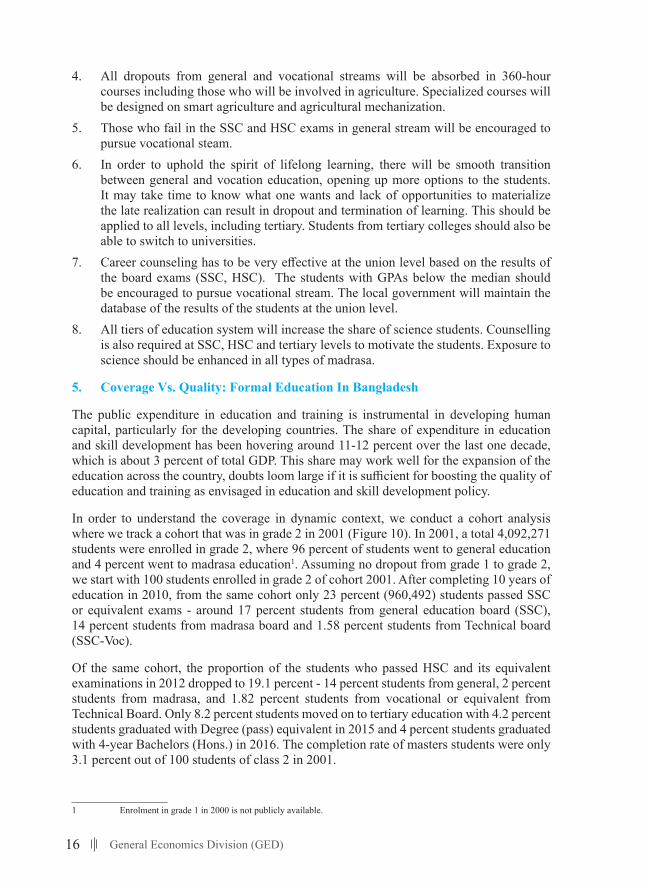
16 General Economics Division (GED)
4. All dropouts from general and vocational streams will be absorbed in 360-hour courses including those who will be involved in agriculture. Specialized courses will be designed on smart agriculture and agricultural mechanization.
5. Those who fail in the SSC and HSC exams in general stream will be encouraged to pursue vocational steam.
6. In order to uphold the spirit of lifelong learning, there will be smooth transition between general and vocation education, opening up more options to the students. It may take time to know what one wants and lack of opportunities to materialize the late realization can result in dropout and termination of learning. This should be applied to all levels, including tertiary. Students from tertiary colleges should also be able to switch to universities.
7. Career counseling has to be very effective at the union level based on the results of the board exams (SSC, HSC). The students with GPAs below the median should be encouraged to pursue vocational stream. The local government will maintain the database of the results of the students at the union level.
8. All tiers of education system will increase the share of science students. Counselling is also required at SSC, HSC and tertiary levels to motivate the students. Exposure to science should be enhanced in all types of madrasa.
5. Coverage Vs. Quality: Formal Education In Bangladesh
The public expenditure in education and training is instrumental in developing human capital, particularly for the developing countries. The share of expenditure in education and skill development has been hovering around 11-12 percent over the last one decade, which is about 3 percent of total GDP. This share may work well for the expansion of the education across the country, doubts loom large if it is sufficient for boosting the quality of education and training as envisaged in education and skill development policy.
In order to understand the coverage in dynamic context, we conduct a cohort analysis where we track a cohort that was in grade 2 in 2001 (Figure 10). In 2001, a total 4,092,271 students were enrolled in grade 2, where 96 percent of students went to general education and 4 percent went to madrasa education1. Assuming no dropout from grade 1 to grade 2, we start with 100 students enrolled in grade 2 of cohort 2001. After completing 10 years of education in 2010, from the same cohort only 23 percent (960,492) students passed SSC or equivalent exams - around 17 percent students from general education board (SSC), 14 percent students from madrasa board and 1.58 percent students from Technical board (SSC-Voc).
Of the same cohort, the proportion of the students who passed HSC and its equivalent examinations in 2012 dropped to 19.1 percent - 14 percent students from general, 2 percent students from madrasa, and 1.82 percent students from vocational or equivalent from Technical Board. Only 8.2 percent students moved on to tertiary education with 4.2 percent students graduated with Degree (pass) equivalent in 2015 and 4 percent students graduated with 4-year Bachelors (Hons.) in 2016. The completion rate of masters students were only 3.1 percent out of 100 students of class 2 in 2001.
1 Enrolment in grade 1 in 2000 is not publicly available.
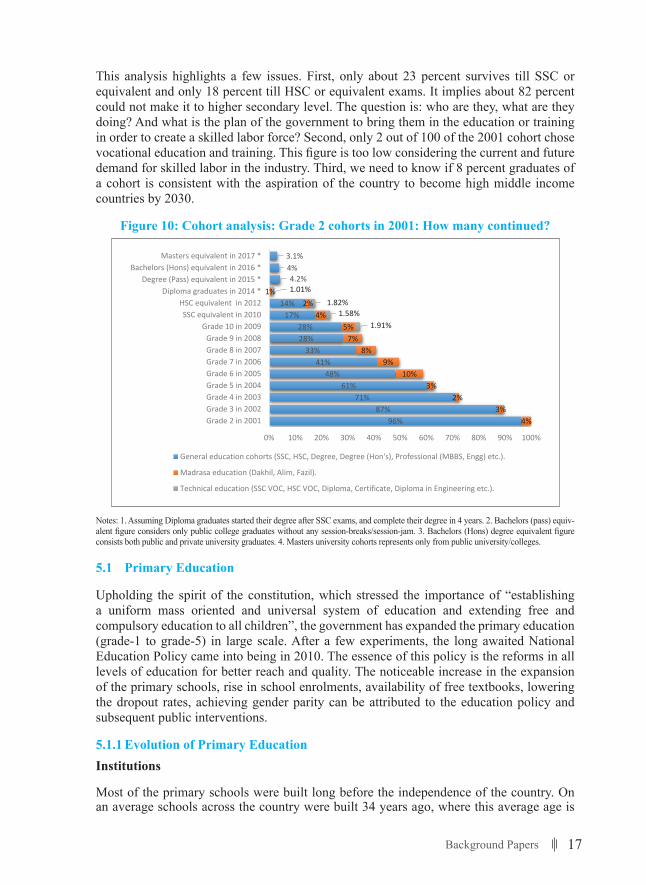
17Background Papers
This analysis highlights a few issues. First, only about 23 percent survives till SSC or equivalent and only 18 percent till HSC or equivalent exams. It implies about 82 percent could not make it to higher secondary level. The question is: who are they, what are they doing? And what is the plan of the government to bring them in the education or training in order to create a skilled labor force? Second, only 2 out of 100 of the 2001 cohort chose vocational education and training. This figure is too low considering the current and future demand for skilled labor in the industry. Third, we need to know if 8 percent graduates of a cohort is consistent with the aspiration of the country to become high middle income countries by 2030.
Figure 10: Cohort analysis: Grade 2 cohorts in 2001: How many continued?
26
Figure 10: Cohort analysis: Grade 2 cohorts in 2001: How many continued?
Notes: 1. Assuming Diploma graduates started their degree after SSC exams, and complete their degree in 4 years. 2. Bachelors (pass) equivalent figure considers only public college graduates without any session-breaks/session-jam. 3. Bachelors (Hons) degree equivalent figure consists both public and private university graduates. 4. Masters university cohorts represents only from public university/colleges.
96%87%
71%61%
48%41%
33%28%28%
17%14%
4.2%4%3.1%
4%3%
2%3%
10%9%
8%7%
5%4%
2%1%
1.91%1.58%
1.82%1.01%
0% 10% 20% 30% 40% 50% 60% 70% 80% 90% 100%
Grade 2 in 2001Grade 3 in 2002Grade 4 in 2003Grade 5 in 2004Grade 6 in 2005Grade 7 in 2006Grade 8 in 2007Grade 9 in 2008
Grade 10 in 2009SSC equivalent in 2010
HSC equivalent in 2012Diploma graduates in 2014 *
Degree (Pass) equivalent in 2015 *Bachelors (Hons) equivalent in 2016 *
Masters equivalent in 2017 *
General education cohorts (SSC, HSC, Degree, Degree (Hon's), Professional (MBBS, Engg) etc.).
Madrasa education (Dakhil, Alim, Fazil).
Technical education (SSC VOC, HSC VOC, Diploma, Certificate, Diploma in Engineering etc.).
Notes: 1. Assuming Diploma graduates started their degree after SSC exams, and complete their degree in 4 years. 2. Bachelors (pass) equiv-alent figure considers only public college graduates without any session-breaks/session-jam. 3. Bachelors (Hons) degree equivalent figure consists both public and private university graduates. 4. Masters university cohorts represents only from public university/colleges.
5.1 Primary Education
Upholding the spirit of the constitution, which stressed the importance of “establishing a uniform mass oriented and universal system of education and extending free and compulsory education to all children”, the government has expanded the primary education (grade-1 to grade-5) in large scale. After a few experiments, the long awaited National Education Policy came into being in 2010. The essence of this policy is the reforms in all levels of education for better reach and quality. The noticeable increase in the expansion of the primary schools, rise in school enrolments, availability of free textbooks, lowering the dropout rates, achieving gender parity can be attributed to the education policy and subsequent public interventions.
5.1.1 Evolution of Primary EducationInstitutions
Most of the primary schools were built long before the independence of the country. On an average schools across the country were built 34 years ago, where this average age is
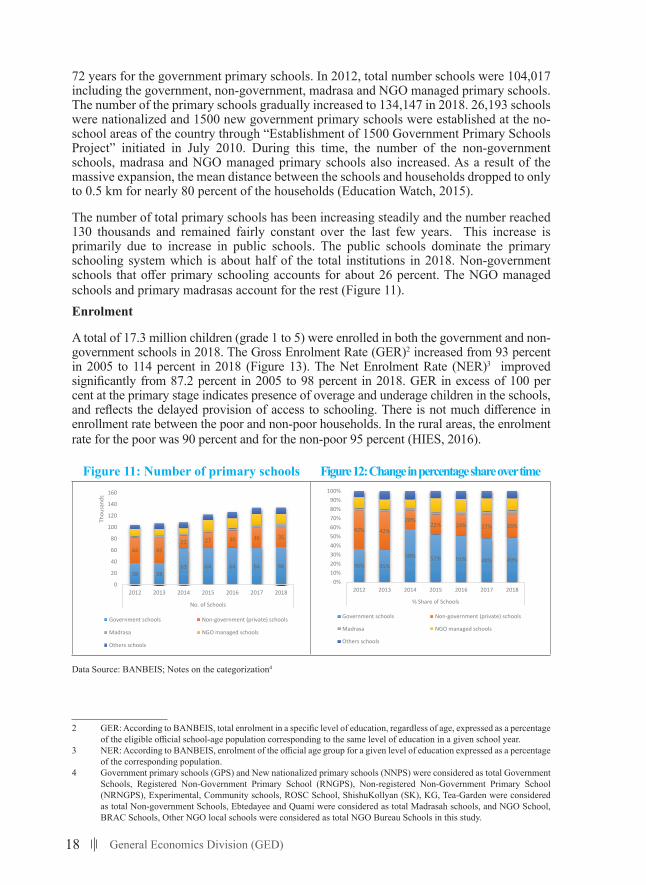
18 General Economics Division (GED)
72 years for the government primary schools. In 2012, total number schools were 104,017 including the government, non-government, madrasa and NGO managed primary schools. The number of the primary schools gradually increased to 134,147 in 2018. 26,193 schools were nationalized and 1500 new government primary schools were established at the no-school areas of the country through “Establishment of 1500 Government Primary Schools Project” initiated in July 2010. During this time, the number of the non-government schools, madrasa and NGO managed primary schools also increased. As a result of the massive expansion, the mean distance between the schools and households dropped to only to 0.5 km for nearly 80 percent of the households (Education Watch, 2015).
The number of total primary schools has been increasing steadily and the number reached 130 thousands and remained fairly constant over the last few years. This increase is primarily due to increase in public schools. The public schools dominate the primary schooling system which is about half of the total institutions in 2018. Non-government schools that offer primary schooling accounts for about 26 percent. The NGO managed schools and primary madrasas account for the rest (Figure 11).Enrolment
A total of 17.3 million children (grade 1 to 5) were enrolled in both the government and non-government schools in 2018. The Gross Enrolment Rate (GER)2 increased from 93 percent in 2005 to 114 percent in 2018 (Figure 13). The Net Enrolment Rate (NER)3 improved significantly from 87.2 percent in 2005 to 98 percent in 2018. GER in excess of 100 per cent at the primary stage indicates presence of overage and underage children in the schools, and reflects the delayed provision of access to schooling. There is not much difference in enrollment rate between the poor and non-poor households. In the rural areas, the enrolment rate for the poor was 90 percent and for the non-poor 95 percent (HIES, 2016).
Figure 11: Number of primary schools Figure 12: Change in percentage share over time
28
Figure 11: Number of primary schools
Figure 12: Change in percentage share over time
Data Source: BANBEIS; Notes on the categorization4
Figure 13: Gross and net enrolment rate in primary education 2005 to 2018
Figure 14: Dropout rate5, repetition rate6 and survival rate7
Data Source: BANBEIS
4 Government primary schools (GPS) and New nationalized primary schools (NNPS) were considered as total Government Schools, Registered Non-Government Primary School (RNGPS), Non-registered Non-Government Primary School (NRNGPS), Experimental, Community schools, ROSC School, ShishuKollyan (SK), KG, Tea-Garden were considered as total Non-government Schools, Ebtedayee and Quami were considered as total Madrasah schools, and NGO School, BRAC Schools, Other NGO local schools were considered as total NGO Bureau Schools in this study. 5 Dropout rate: Proportion of pupils from a cohort enrolled in a given grade at a given school year who are no longer enrolled in the following school year. 6 Repetition rate: Proportion of pupils from a cohort enrolled in a given grade at a given school year who study in the same grade in the following school year. 7 Survival Rate: Percentage of a cohort of pupils (or students) enrolled in the first grade of a given level or cycle of education in a given schools year expected to reach successive grades, regardless of repetition.
38 3863 64 64 64 66
44 4522 27 30 36 35
0
20
40
60
80
100
120
140
160
2012 2013 2014 2015 2016 2017 2018
No. of Schools
Thou
sand
s
Government schools Non-government (private) schools
Madrasa NGO managed schools
Others schools
36% 35%
58% 52% 51% 48% 49%
42% 42%
20%22% 24% 27% 26%
0%10%20%30%40%50%60%70%80%90%
100%
2012 2013 2014 2015 2016 2017 2018
% Share of Schools
Government schools Non-government (private) schools
Madrasa NGO managed schools
Others schools
0%
20%
40%
60%
80%
100%
120%
140%
2005 2006 2007 2008 2009 2010 2011 2012 2013 2014 2015 2016 2017 2018
GER (%) Girls GER (%) Total
NER (%) Girls NER (%) Total0
10
20
30
40
50
60
70
80
90
2005 2006 2007 2008 2009 2010 2011 2012 2013 2014 2015 2016 2017 2018
Dropout Rate (%) Repetition Rate (%) Survival Rate (%)
Data Source: BANBEIS; Notes on the categorization4
2 GER: According to BANBEIS, total enrolment in a specific level of education, regardless of age, expressed as a percentage of the eligible official school-age population corresponding to the same level of education in a given school year.
3 NER: According to BANBEIS, enrolment of the official age group for a given level of education expressed as a percentage of the corresponding population.
4 Government primary schools (GPS) and New nationalized primary schools (NNPS) were considered as total Government Schools, Registered Non-Government Primary School (RNGPS), Non-registered Non-Government Primary School (NRNGPS), Experimental, Community schools, ROSC School, ShishuKollyan (SK), KG, Tea-Garden were considered as total Non-government Schools, Ebtedayee and Quami were considered as total Madrasah schools, and NGO School, BRAC Schools, Other NGO local schools were considered as total NGO Bureau Schools in this study.
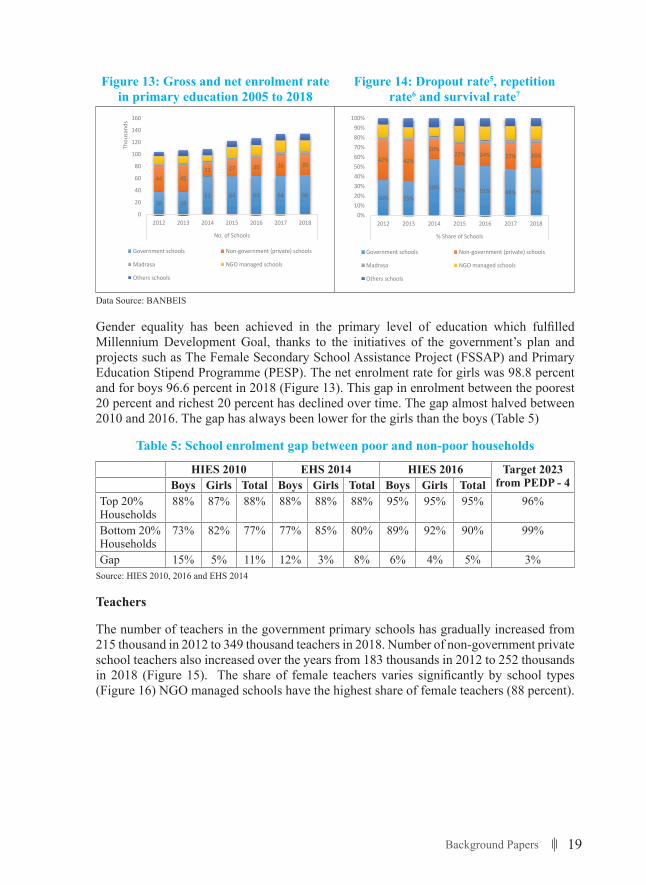
19Background Papers
Figure 13: Gross and net enrolment rate in primary education 2005 to 2018
Figure 14: Dropout rate5, repetition rate6 and survival rate7
28
Figure 11: Number of primary schools
Figure 12: Change in percentage share over time
Data Source: BANBEIS; Notes on the categorization4
Figure 13: Gross and net enrolment rate in primary education 2005 to 2018
Figure 14: Dropout rate5, repetition rate6 and survival rate7
Data Source: BANBEIS
4 Government primary schools (GPS) and New nationalized primary schools (NNPS) were considered as total Government Schools, Registered Non-Government Primary School (RNGPS), Non-registered Non-Government Primary School (NRNGPS), Experimental, Community schools, ROSC School, ShishuKollyan (SK), KG, Tea-Garden were considered as total Non-government Schools, Ebtedayee and Quami were considered as total Madrasah schools, and NGO School, BRAC Schools, Other NGO local schools were considered as total NGO Bureau Schools in this study. 5 Dropout rate: Proportion of pupils from a cohort enrolled in a given grade at a given school year who are no longer enrolled in the following school year. 6 Repetition rate: Proportion of pupils from a cohort enrolled in a given grade at a given school year who study in the same grade in the following school year. 7 Survival Rate: Percentage of a cohort of pupils (or students) enrolled in the first grade of a given level or cycle of education in a given schools year expected to reach successive grades, regardless of repetition.
38 3863 64 64 64 66
44 4522 27 30 36 35
0
20
40
60
80
100
120
140
160
2012 2013 2014 2015 2016 2017 2018
No. of Schools
Thou
sand
s
Government schools Non-government (private) schools
Madrasa NGO managed schools
Others schools
36% 35%
58% 52% 51% 48% 49%
42% 42%
20%22% 24% 27% 26%
0%10%20%30%40%50%60%70%80%90%
100%
2012 2013 2014 2015 2016 2017 2018
% Share of Schools
Government schools Non-government (private) schools
Madrasa NGO managed schools
Others schools
0%
20%
40%
60%
80%
100%
120%
140%
2005 2006 2007 2008 2009 2010 2011 2012 2013 2014 2015 2016 2017 2018
GER (%) Girls GER (%) Total
NER (%) Girls NER (%) Total0
10
20
30
40
50
60
70
80
90
2005 2006 2007 2008 2009 2010 2011 2012 2013 2014 2015 2016 2017 2018
Dropout Rate (%) Repetition Rate (%) Survival Rate (%)
Data Source: BANBEIS
Gender equality has been achieved in the primary level of education which fulfilled Millennium Development Goal, thanks to the initiatives of the government’s plan and projects such as The Female Secondary School Assistance Project (FSSAP) and Primary Education Stipend Programme (PESP). The net enrolment rate for girls was 98.8 percent and for boys 96.6 percent in 2018 (Figure 13). This gap in enrolment between the poorest 20 percent and richest 20 percent has declined over time. The gap almost halved between 2010 and 2016. The gap has always been lower for the girls than the boys (Table 5)
Table 5: School enrolment gap between poor and non-poor households
HIES 2010 EHS 2014 HIES 2016 Target 2023 from PEDP - 4Boys Girls Total Boys Girls Total Boys Girls Total
Top 20% Households
88% 87% 88% 88% 88% 88% 95% 95% 95% 96%
Bottom 20% Households
73% 82% 77% 77% 85% 80% 89% 92% 90% 99%
Gap 15% 5% 11% 12% 3% 8% 6% 4% 5% 3%Source: HIES 2010, 2016 and EHS 2014
Teachers
The number of teachers in the government primary schools has gradually increased from 215 thousand in 2012 to 349 thousand teachers in 2018. Number of non-government private school teachers also increased over the years from 183 thousands in 2012 to 252 thousands in 2018 (Figure 15). The share of female teachers varies significantly by school types (Figure 16) NGO managed schools have the highest share of female teachers (88 percent).
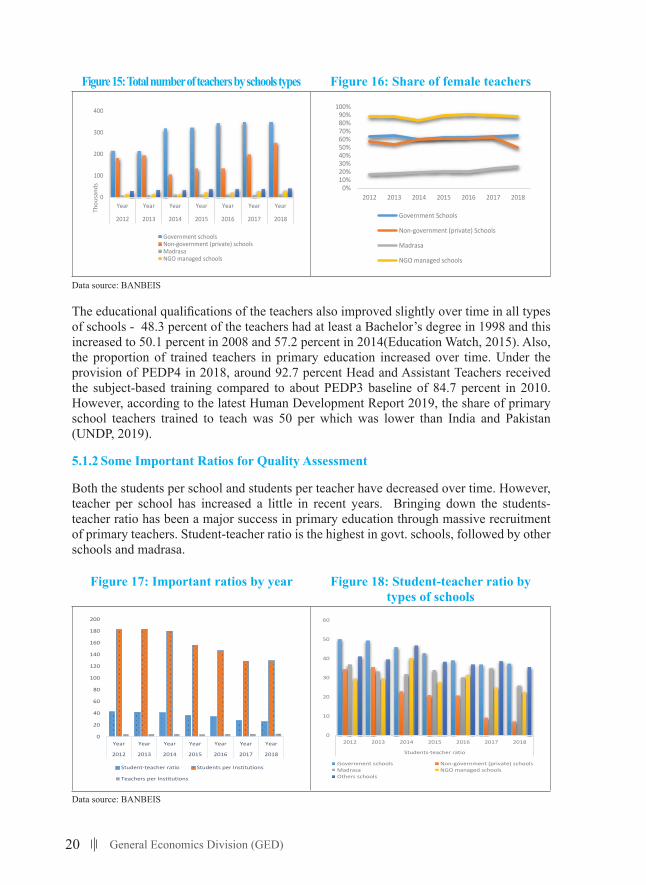
20 General Economics Division (GED)
Figure 15: Total number of teachers by schools types Figure 16: Share of female teachers
29
Gender equality has been achieved in the primary level of education which fulfilled Millennium Development Goal, thanks to the initiatives of the government’s plan and projects such as The Female Secondary School Assistance Project (FSSAP) and Primary Education Stipend Programme (PESP). The net enrolment rate for girls was 98.8 percent and for boys 96.6 percent in 2018 (Figure 13). This gap in enrolment between the poorest 20 percent and richest 20 percent has declined over time. The gap almost halved between 2010 and 2016. The gap has always been lower for the girls than the boys (Table 5)
Table 5: School enrolment gap between poor and non-poor households
HIES 2010 EHS 2014 HIES 2016 Target 2023 from PEDP - 4 Boys Girls Total Boys Girls Total Boys Girls Total
Top 20% Households 88% 87% 88% 88% 88% 88% 95% 95% 95% 96%
Bottom 20% Households 73% 82% 77% 77% 85% 80% 89% 92% 90% 99%
Gap 15% 5% 11% 12% 3% 8% 6% 4% 5% 3%
Source: HIES 2010, 2016 and EHS 2014
Teachers
The number of teachers in the government primary schools has gradually increased from 215 thousand in 2012 to 349 thousand teachers in 2018. Number of non-government private school teachers also increased over the years from 183 thousands in 2012 to 252 thousands in 2018 (Figure 15). The share of female teachers varies significantly by school types (Figure 16) NGO managed schools have the highest share of female teachers (88 percent).
Figure 15: Total number of teachers by schools types
Figure 16: Share of female teachers
Data source: BANBEIS
The educational qualifications of the teachers also improved slightly over time in all types of schools - 48.3 percent of the teachers had at least a Bachelor’s degree in 1998 and this increased to 50.1 percent
0
100
200
300
400
Year Year Year Year Year Year Year
2012 2013 2014 2015 2016 2017 2018
Thou
sand
s
Government schoolsNon-government (private) schoolsMadrasaNGO managed schools
0%10%20%30%40%50%60%70%80%90%
100%
2012 2013 2014 2015 2016 2017 2018
Government Schools
Non-government (private) Schools
Madrasa
NGO managed schools
Data source: BANBEIS
The educational qualifications of the teachers also improved slightly over time in all types of schools - 48.3 percent of the teachers had at least a Bachelor’s degree in 1998 and this increased to 50.1 percent in 2008 and 57.2 percent in 2014(Education Watch, 2015). Also, the proportion of trained teachers in primary education increased over time. Under the provision of PEDP4 in 2018, around 92.7 percent Head and Assistant Teachers received the subject-based training compared to about PEDP3 baseline of 84.7 percent in 2010. However, according to the latest Human Development Report 2019, the share of primary school teachers trained to teach was 50 per which was lower than India and Pakistan (UNDP, 2019).
5.1.2 Some Important Ratios for Quality Assessment
Both the students per school and students per teacher have decreased over time. However, teacher per school has increased a little in recent years. Bringing down the students-teacher ratio has been a major success in primary education through massive recruitment of primary teachers. Student-teacher ratio is the highest in govt. schools, followed by other schools and madrasa.
Figure 17: Important ratios by year Figure 18: Student-teacher ratio by types of schools
30
in 2008 and 57.2 percent in 2014(Education Watch, 2015). Also, the proportion of trained teachers in primary education increased over time. Under the provision of PEDP4 in 2018, around 92.7 percent Head and Assistant Teachers received the subject-based training compared to about PEDP3 baseline of 84.7 percent in 2010. However, according to the latest Human Development Report 2019, the share of primary school teachers trained to teach was 50 per which was lower than India and Pakistan (UNDP, 2019).
5.1.2 Some Important Ratios for Quality Assessment
Both the students per school and students per teacher have decreased over time. However, teacher per school has increased a little in recent years. Bringing down the students-teacher ratio has been a major success in primary education through massive recruitment of primary teachers. Student-teacher ratio is the highest in govt. schools, followed by other schools and madrasa.
Figure 17: Important ratios by year
Figure 18: Student-teacher ratio by types of schools
Data source: BANBEIS
Dropouts and Repetition
Over the last decade repetition rate declined from 12.6 percent in 2008 to 5.4 percent (boys 5.8 percent and girls 5.0 percent) in all grades. Also, there was a significant reduction in the dropout rates from 47.2 percent in 2005 to 18.6 percent in 2018 at the primary education. The Primary Education Development Projects 3 and 4 have played critical roles in reducing dropouts and repeaters. The government has also started National School Meal Policy, which provides midday meal to ensure minimum 30 percent calories and 50 percent micronutrient of the 3 to 12 years primary school going students. The piloting has been successful which resulted in the approval of the National School Meal Policy, 2019 setting a
0
20
40
60
80
100
120
140
160
180
200
Year Year Year Year Year Year Year
2012 2013 2014 2015 2016 2017 2018
Student-teacher ratio Students per Institutions
Teachers per Institutions
0
10
20
30
40
50
60
2012 2013 2014 2015 2016 2017 2018
Students-teacher ratio
Government schools Non-government (private) schoolsMadrasa NGO managed schoolsOthers schools
30
in 2008 and 57.2 percent in 2014(Education Watch, 2015). Also, the proportion of trained teachers in primary education increased over time. Under the provision of PEDP4 in 2018, around 92.7 percent Head and Assistant Teachers received the subject-based training compared to about PEDP3 baseline of 84.7 percent in 2010. However, according to the latest Human Development Report 2019, the share of primary school teachers trained to teach was 50 per which was lower than India and Pakistan (UNDP, 2019).
5.1.2 Some Important Ratios for Quality Assessment
Both the students per school and students per teacher have decreased over time. However, teacher per school has increased a little in recent years. Bringing down the students-teacher ratio has been a major success in primary education through massive recruitment of primary teachers. Student-teacher ratio is the highest in govt. schools, followed by other schools and madrasa.
Figure 17: Important ratios by year
Figure 18: Student-teacher ratio by types of schools
Data source: BANBEIS
Dropouts and Repetition
Over the last decade repetition rate declined from 12.6 percent in 2008 to 5.4 percent (boys 5.8 percent and girls 5.0 percent) in all grades. Also, there was a significant reduction in the dropout rates from 47.2 percent in 2005 to 18.6 percent in 2018 at the primary education. The Primary Education Development Projects 3 and 4 have played critical roles in reducing dropouts and repeaters. The government has also started National School Meal Policy, which provides midday meal to ensure minimum 30 percent calories and 50 percent micronutrient of the 3 to 12 years primary school going students. The piloting has been successful which resulted in the approval of the National School Meal Policy, 2019 setting a
0
20
40
60
80
100
120
140
160
180
200
Year Year Year Year Year Year Year
2012 2013 2014 2015 2016 2017 2018
Student-teacher ratio Students per Institutions
Teachers per Institutions
0
10
20
30
40
50
60
2012 2013 2014 2015 2016 2017 2018
Students-teacher ratio
Government schools Non-government (private) schoolsMadrasa NGO managed schoolsOthers schools
Data source: BANBEIS
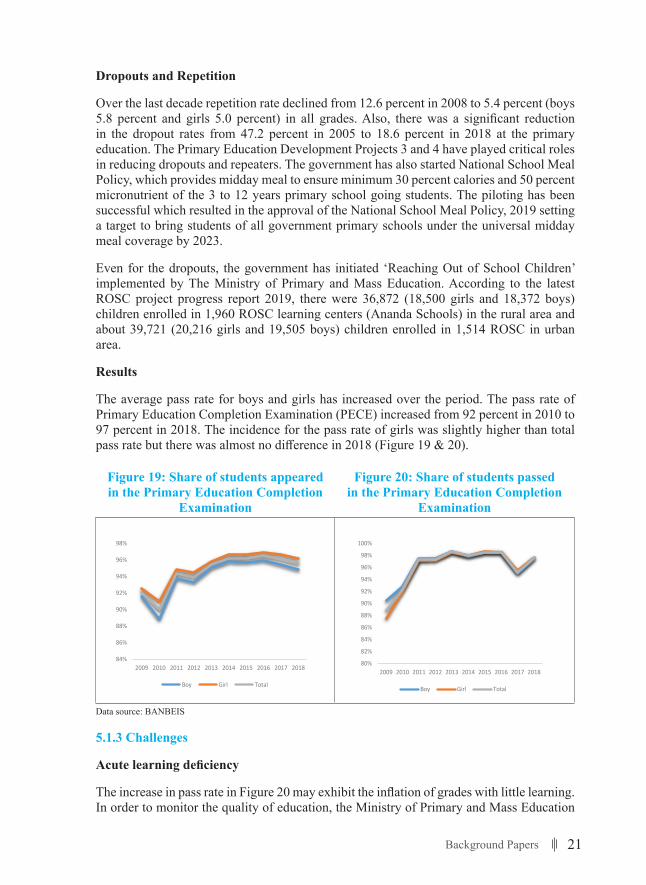
21Background Papers
Dropouts and Repetition
Over the last decade repetition rate declined from 12.6 percent in 2008 to 5.4 percent (boys 5.8 percent and girls 5.0 percent) in all grades. Also, there was a significant reduction in the dropout rates from 47.2 percent in 2005 to 18.6 percent in 2018 at the primary education. The Primary Education Development Projects 3 and 4 have played critical roles in reducing dropouts and repeaters. The government has also started National School Meal Policy, which provides midday meal to ensure minimum 30 percent calories and 50 percent micronutrient of the 3 to 12 years primary school going students. The piloting has been successful which resulted in the approval of the National School Meal Policy, 2019 setting a target to bring students of all government primary schools under the universal midday meal coverage by 2023.
Even for the dropouts, the government has initiated ‘Reaching Out of School Children’ implemented by The Ministry of Primary and Mass Education. According to the latest ROSC project progress report 2019, there were 36,872 (18,500 girls and 18,372 boys) children enrolled in 1,960 ROSC learning centers (Ananda Schools) in the rural area and about 39,721 (20,216 girls and 19,505 boys) children enrolled in 1,514 ROSC in urban area.
Results
The average pass rate for boys and girls has increased over the period. The pass rate of Primary Education Completion Examination (PECE) increased from 92 percent in 2010 to 97 percent in 2018. The incidence for the pass rate of girls was slightly higher than total pass rate but there was almost no difference in 2018 (Figure 19 & 20).
Figure 19: Share of students appeared in the Primary Education Completion
Examination
Figure 20: Share of students passed in the Primary Education Completion
Examination
31
target to bring students of all government primary schools under the universal midday meal coverage by 2023.
Even for the dropouts, the government has initiated ‘Reaching Out of School Children’ implemented by The Ministry of Primary and Mass Education. According to the latest ROSC project progress report 2019, there were 36,872 (18,500 girls and 18,372 boys) children enrolled in 1,960 ROSC learning centers (Ananda Schools) in the rural area and about 39,721 (20,216 girls and 19,505 boys) children enrolled in 1,514 ROSC in urban area.
Results
The average pass rate for boys and girls has increased over the period. The pass rate of Primary Education Completion Examination (PECE) increased from 92 percent in 2010 to 97 percent in 2018. The incidence for the pass rate of girls was slightly higher than total pass rate but there was almost no difference in 2018 (Figure 19 & 20).
Figure 19: Share of students appeared in the Primary Education Completion Examination
Figure 20: Share of students passed in the Primary Education Completion Examination
Data source: BANBEIS
5.1.3 Challenges Acute learning deficiency The increase in pass rate in Figure 20 may exhibit the inflation of grades with little learning. In order to monitor the quality of education, the Ministry of Primary and Mass Education (MoPME) initiated the National Student Assessment (NSA) programme in 2006 aiming to evaluate the outcomes of primary education in Bangladesh. The sample survey includes students from class 3 and class 5 across 64 Upazilas from 7 administrative divisions of the country. A sampling of primary school students at the end of grade three and grade five are being tested in alternate years in Bangla and mathematics.
The assessment shows no sign of improvement in either grade in both subjects in recent years. In fact, the results worsened for grade 5. In Mathematics and in grade 3, the proportion of students who achieved the grade-wise competency declined from 58 percent in 2013 to 41 percent in 2017. By the
84%
86%
88%
90%
92%
94%
96%
98%
2009 2010 2011 2012 2013 2014 2015 2016 2017 2018
Boy Girl Total
80%
82%
84%
86%
88%
90%
92%
94%
96%
98%
100%
2009 2010 2011 2012 2013 2014 2015 2016 2017 2018
Boy Girl Total
Data source: BANBEIS
5.1.3 Challenges
Acutelearningdeficiency
The increase in pass rate in Figure 20 may exhibit the inflation of grades with little learning. In order to monitor the quality of education, the Ministry of Primary and Mass Education
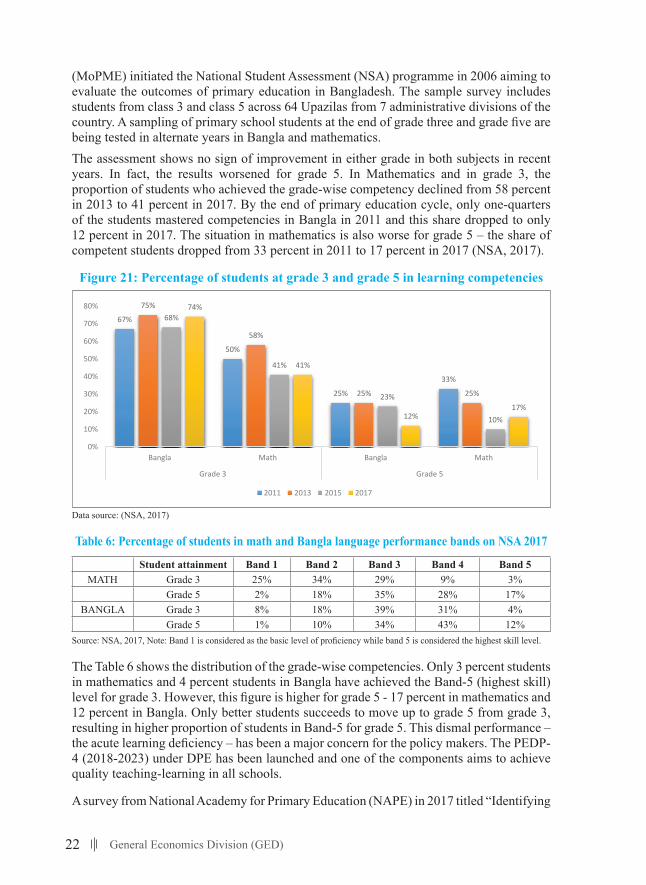
22 General Economics Division (GED)
(MoPME) initiated the National Student Assessment (NSA) programme in 2006 aiming to evaluate the outcomes of primary education in Bangladesh. The sample survey includes students from class 3 and class 5 across 64 Upazilas from 7 administrative divisions of the country. A sampling of primary school students at the end of grade three and grade five are being tested in alternate years in Bangla and mathematics.The assessment shows no sign of improvement in either grade in both subjects in recent years. In fact, the results worsened for grade 5. In Mathematics and in grade 3, the proportion of students who achieved the grade-wise competency declined from 58 percent in 2013 to 41 percent in 2017. By the end of primary education cycle, only one-quarters of the students mastered competencies in Bangla in 2011 and this share dropped to only 12 percent in 2017. The situation in mathematics is also worse for grade 5 – the share of competent students dropped from 33 percent in 2011 to 17 percent in 2017 (NSA, 2017).
Figure 21: Percentage of students at grade 3 and grade 5 in learning competencies
32
end of primary education cycle, only one-quarters of the students mastered competencies in Bangla in 2011 and this share dropped to only 12 percent in 2017. The situation in mathematics is also worse for grade 5 – the share of competent students dropped from 33 percent in 2011 to 17 percent in 2017 (NSA, 2017).
Figure 21: Percentage of students at grade 3 and grade 5 in learning competencies
Data source: (NSA, 2017)
Table 6: Percentage of students in math and Bangla language performance bands on NSA 2017
Student attainment Band 1 Band 2 Band 3 Band 4 Band 5
MATH Grade 3 25% 34% 29% 9% 3% Grade 5 2% 18% 35% 28% 17%
BANGLA Grade 3 8% 18% 39% 31% 4% Grade 5 1% 10% 34% 43% 12%
Source: NSA, 2017, Note: Band 1 is considered as the basic level of proficiency while band 5 is considered the highest skill level.
The Table 6 shows the distribution of the grade-wise competencies. Only 3 percent students in mathematics and 4 percent students in Bangla have achieved the Band-5 (highest skill) level for grade 3. However, this figure is higher for grade 5 - 17 percent in mathematics and 12 percent in Bangla. Only better students succeeds to move up to grade 5 from grade 3, resulting in higher proportion of students in Band-5 for grade 5. This dismal performance – the acute learning deficiency – has been a major concern for the policy makers. The PEDP-4 (2018-2023) under DPE has been launched and one of the components aims to achieve quality teaching-learning in all schools.
67%
50%
25%
33%
75%
58%
25% 25%
68%
41%
23%
10%
74%
41%
12%17%
0%
10%
20%
30%
40%
50%
60%
70%
80%
Bangla Math Bangla Math
Grade 3 Grade 5
2011 2013 2015 2017
Data source: (NSA, 2017)
Table 6: Percentage of students in math and Bangla language performance bands on NSA 2017
Student attainment Band 1 Band 2 Band 3 Band 4 Band 5MATH Grade 3 25% 34% 29% 9% 3%
Grade 5 2% 18% 35% 28% 17%BANGLA Grade 3 8% 18% 39% 31% 4%
Grade 5 1% 10% 34% 43% 12%Source: NSA, 2017, Note: Band 1 is considered as the basic level of proficiency while band 5 is considered the highest skill level.
The Table 6 shows the distribution of the grade-wise competencies. Only 3 percent students in mathematics and 4 percent students in Bangla have achieved the Band-5 (highest skill) level for grade 3. However, this figure is higher for grade 5 - 17 percent in mathematics and 12 percent in Bangla. Only better students succeeds to move up to grade 5 from grade 3, resulting in higher proportion of students in Band-5 for grade 5. This dismal performance – the acute learning deficiency – has been a major concern for the policy makers. The PEDP-4 (2018-2023) under DPE has been launched and one of the components aims to achieve quality teaching-learning in all schools.
A survey from National Academy for Primary Education (NAPE) in 2017 titled “Identifying
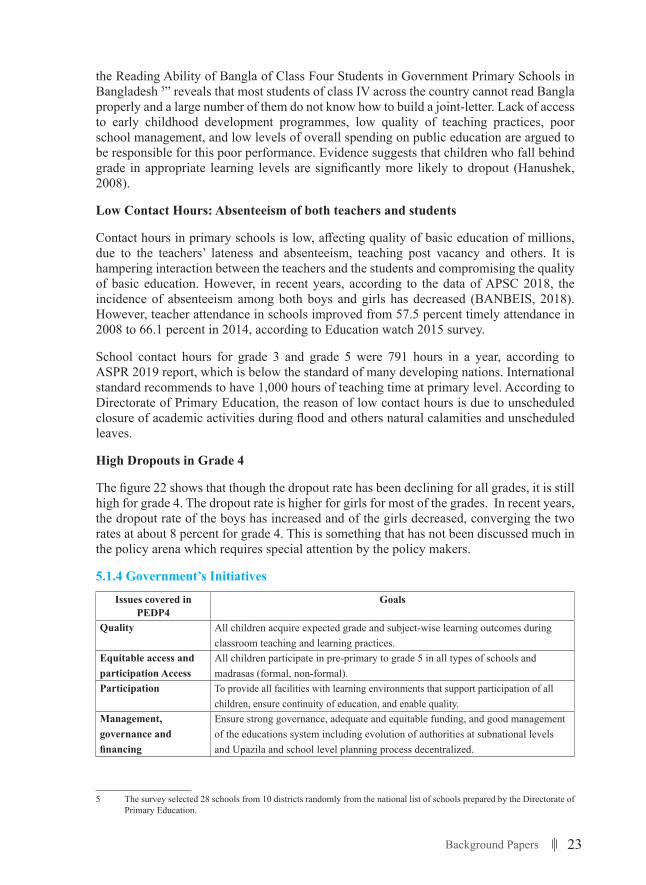
23Background Papers
the Reading Ability of Bangla of Class Four Students in Government Primary Schools in Bangladesh 5” reveals that most students of class IV across the country cannot read Bangla properly and a large number of them do not know how to build a joint-letter. Lack of access to early childhood development programmes, low quality of teaching practices, poor school management, and low levels of overall spending on public education are argued to be responsible for this poor performance. Evidence suggests that children who fall behind grade in appropriate learning levels are significantly more likely to dropout (Hanushek, 2008).
Low Contact Hours: Absenteeism of both teachers and students
Contact hours in primary schools is low, affecting quality of basic education of millions, due to the teachers’ lateness and absenteeism, teaching post vacancy and others. It is hampering interaction between the teachers and the students and compromising the quality of basic education. However, in recent years, according to the data of APSC 2018, the incidence of absenteeism among both boys and girls has decreased (BANBEIS, 2018). However, teacher attendance in schools improved from 57.5 percent timely attendance in 2008 to 66.1 percent in 2014, according to Education watch 2015 survey.
School contact hours for grade 3 and grade 5 were 791 hours in a year, according to ASPR 2019 report, which is below the standard of many developing nations. International standard recommends to have 1,000 hours of teaching time at primary level. According to Directorate of Primary Education, the reason of low contact hours is due to unscheduled closure of academic activities during flood and others natural calamities and unscheduled leaves.
High Dropouts in Grade 4
The figure 22 shows that though the dropout rate has been declining for all grades, it is still high for grade 4. The dropout rate is higher for girls for most of the grades. In recent years, the dropout rate of the boys has increased and of the girls decreased, converging the two rates at about 8 percent for grade 4. This is something that has not been discussed much in the policy arena which requires special attention by the policy makers.
5.1.4 Government’s Initiatives
Issues covered in PEDP4
Goals
Quality All children acquire expected grade and subject-wise learning outcomes during classroom teaching and learning practices.
Equitable access and participation Access
All children participate in pre-primary to grade 5 in all types of schools and madrasas (formal, non-formal).
Participation To provide all facilities with learning environments that support participation of all children, ensure continuity of education, and enable quality.
Management, governance and financing
Ensure strong governance, adequate and equitable funding, and good management of the educations system including evolution of authorities at subnational levels and Upazila and school level planning process decentralized.
5 The survey selected 28 schools from 10 districts randomly from the national list of schools prepared by the Directorate of Primary Education.
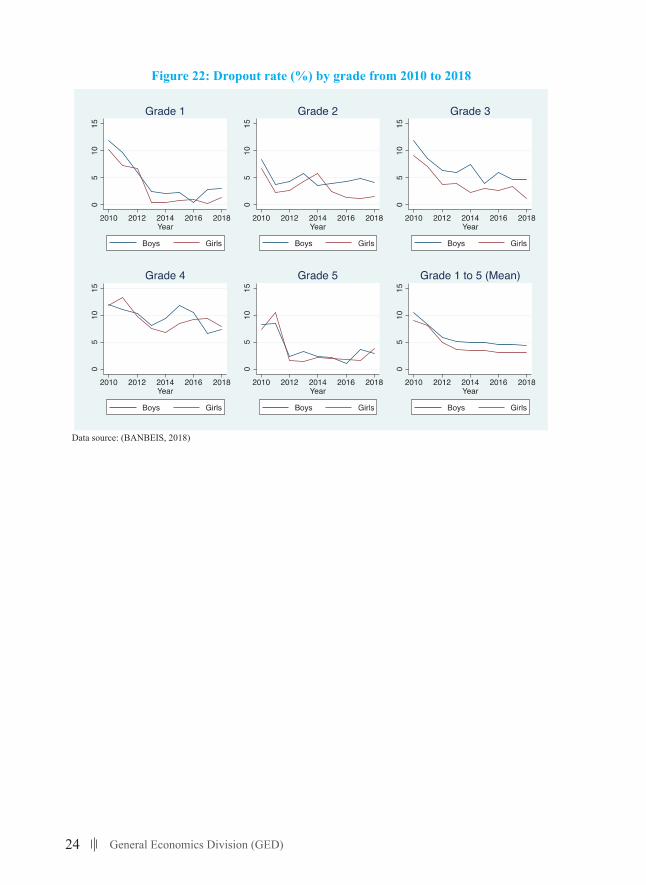
24 General Economics Division (GED)
Figure 22: Dropout rate (%) by grade from 2010 to 2018
34
Management, governance and financing
Ensure strong governance, adequate and equitable funding, and good management of the educations system including evolution of authorities at subnational levels and Upazila and school level planning process decentralized.
Figure 22: Dropout rate (%) by grade from 2010 to 2018
Data source: (BANBEIS, 2018)
Key Achievements of PEDP-4 GER 112.12% in 2016 and NER 97.94% in 2016 (KPI 6 and 7) Increased PPE Enrolment and stands to 35,78,384 in 2018 compared to about 3.1 million in 2016 GER and NER of PPE: GER of PPE was 125.2% and NER of PPE was 94.2% in 2018 (KPI 16 and 17) Total enrolment of Grade 1 to Grade 5 stands 17.3m in 2018 compared to 18.6m in 2016 Increased Gross Intake Rate (GIR): 112.32% in 2018 and 112.2% in 2016) (SCI 1) Increased Net Intake Rate (NIR): 96.48% in 2018 and 97.94% in 2016), (SCI2) Primary cycle completion rate by 81.4% in 2018 compared to 80.8% in 2016 (KPI 8) Improving Survival rate to Grade 5 by 83.53% in 2018 compared to 82.1% in 2016 (non-KPI 2) Improving Coefficient of Efficiency by 82.21% in 2018 compared to 80.9% in 2016 (KPI 11) Improved year inputs per graduate by 6.08 years in 2018 compared to 6.18 years in 2016 (KPI 11) Reducing the net enrolment gap between richest (93%) and poorest quintiles (88%) (KPI 13) All (99.9%) children now get free textbooks in the first month of the school academic year, 92% before
starting the academic year (PSQL1) Majority of Head and Assistant teachers have achieved the required training qualification standard (PSQLs
6-10)
Data source: (BANBEIS, 2018)
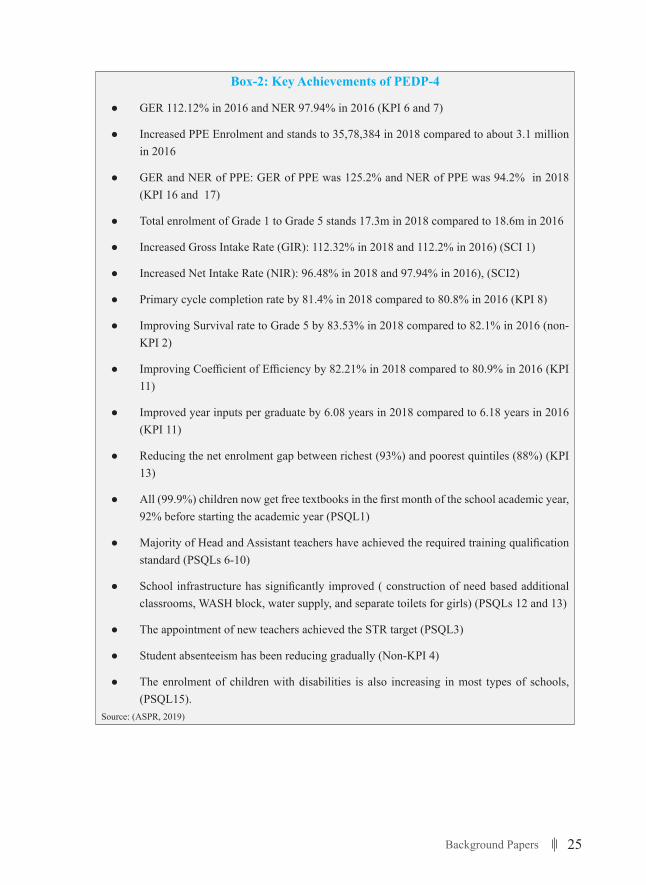
25Background Papers
Box-2: Key Achievements of PEDP-4
● GER 112.12% in 2016 and NER 97.94% in 2016 (KPI 6 and 7)
● Increased PPE Enrolment and stands to 35,78,384 in 2018 compared to about 3.1 million in 2016
● GER and NER of PPE: GER of PPE was 125.2% and NER of PPE was 94.2% in 2018 (KPI 16 and 17)
● Total enrolment of Grade 1 to Grade 5 stands 17.3m in 2018 compared to 18.6m in 2016
● Increased Gross Intake Rate (GIR): 112.32% in 2018 and 112.2% in 2016) (SCI 1)
● Increased Net Intake Rate (NIR): 96.48% in 2018 and 97.94% in 2016), (SCI2)
● Primary cycle completion rate by 81.4% in 2018 compared to 80.8% in 2016 (KPI 8)
● Improving Survival rate to Grade 5 by 83.53% in 2018 compared to 82.1% in 2016 (non-KPI 2)
● Improving Coefficient of Efficiency by 82.21% in 2018 compared to 80.9% in 2016 (KPI 11)
● Improved year inputs per graduate by 6.08 years in 2018 compared to 6.18 years in 2016 (KPI 11)
● Reducing the net enrolment gap between richest (93%) and poorest quintiles (88%) (KPI 13)
● All (99.9%) children now get free textbooks in the first month of the school academic year, 92% before starting the academic year (PSQL1)
● Majority of Head and Assistant teachers have achieved the required training qualification standard (PSQLs 6-10)
● School infrastructure has significantly improved ( construction of need based additional classrooms, WASH block, water supply, and separate toilets for girls) (PSQLs 12 and 13)
● The appointment of new teachers achieved the STR target (PSQL3)
● Student absenteeism has been reducing gradually (Non-KPI 4)
● The enrolment of children with disabilities is also increasing in most types of schools, (PSQL15).
Source: (ASPR, 2019)
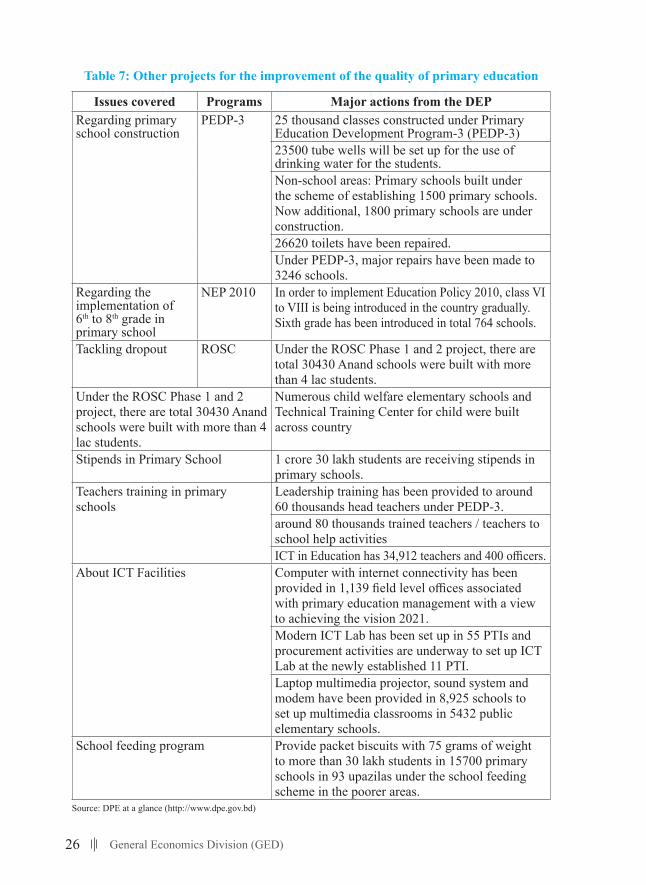
26 General Economics Division (GED)
Table 7: Other projects for the improvement of the quality of primary education
Issues covered Programs Major actions from the DEPRegarding primary school construction
PEDP-3 25 thousand classes constructed under Primary Education Development Program-3 (PEDP-3)23500 tube wells will be set up for the use of drinking water for the students.Non-school areas: Primary schools built under the scheme of establishing 1500 primary schools. Now additional, 1800 primary schools are under construction.26620 toilets have been repaired.Under PEDP-3, major repairs have been made to 3246 schools.
Regarding the implementation of 6th to 8th grade in primary school
NEP 2010 In order to implement Education Policy 2010, class VI to VIII is being introduced in the country gradually. Sixth grade has been introduced in total 764 schools.
Tackling dropout ROSC Under the ROSC Phase 1 and 2 project, there are total 30430 Anand schools were built with more than 4 lac students.
Under the ROSC Phase 1 and 2 project, there are total 30430 Anand schools were built with more than 4 lac students.
Numerous child welfare elementary schools and Technical Training Center for child were built across country
Stipends in Primary School 1 crore 30 lakh students are receiving stipends in primary schools.
Teachers training in primary schools
Leadership training has been provided to around 60 thousands head teachers under PEDP-3.around 80 thousands trained teachers / teachers to school help activitiesICT in Education has 34,912 teachers and 400 officers.
About ICT Facilities Computer with internet connectivity has been provided in 1,139 field level offices associated with primary education management with a view to achieving the vision 2021.Modern ICT Lab has been set up in 55 PTIs and procurement activities are underway to set up ICT Lab at the newly established 11 PTI.Laptop multimedia projector, sound system and modem have been provided in 8,925 schools to set up multimedia classrooms in 5432 public elementary schools.
School feeding program Provide packet biscuits with 75 grams of weight to more than 30 lakh students in 15700 primary schools in 93 upazilas under the school feeding scheme in the poorer areas.
Source: DPE at a glance (http://www.dpe.gov.bd)
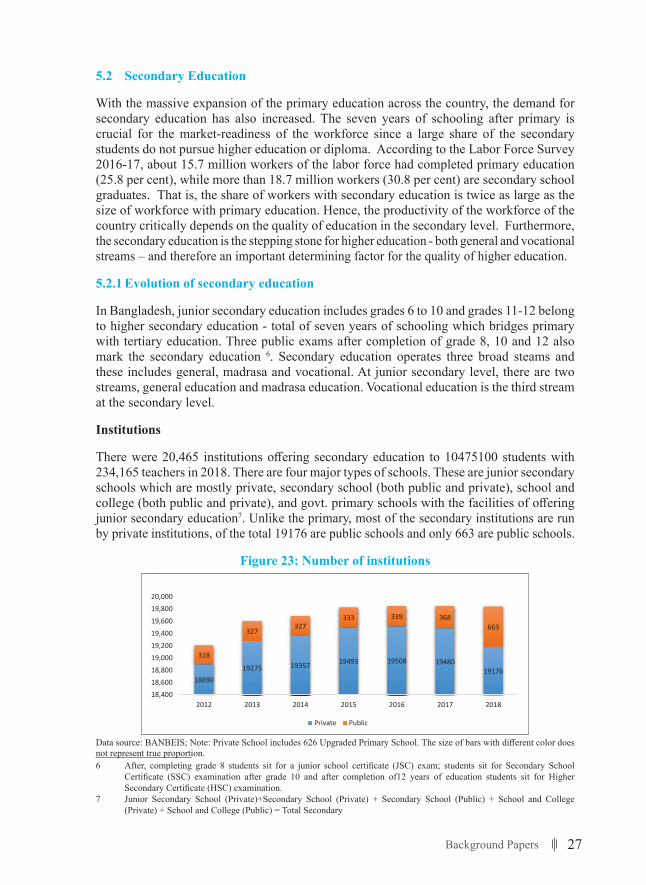
27Background Papers
5.2 Secondary Education
With the massive expansion of the primary education across the country, the demand for secondary education has also increased. The seven years of schooling after primary is crucial for the market-readiness of the workforce since a large share of the secondary students do not pursue higher education or diploma. According to the Labor Force Survey 2016-17, about 15.7 million workers of the labor force had completed primary education (25.8 per cent), while more than 18.7 million workers (30.8 per cent) are secondary school graduates. That is, the share of workers with secondary education is twice as large as the size of workforce with primary education. Hence, the productivity of the workforce of the country critically depends on the quality of education in the secondary level. Furthermore, the secondary education is the stepping stone for higher education - both general and vocational streams – and therefore an important determining factor for the quality of higher education.
5.2.1 Evolution of secondary education
In Bangladesh, junior secondary education includes grades 6 to 10 and grades 11-12 belong to higher secondary education - total of seven years of schooling which bridges primary with tertiary education. Three public exams after completion of grade 8, 10 and 12 also mark the secondary education 6. Secondary education operates three broad steams and these includes general, madrasa and vocational. At junior secondary level, there are two streams, general education and madrasa education. Vocational education is the third stream at the secondary level.
Institutions
There were 20,465 institutions offering secondary education to 10475100 students with 234,165 teachers in 2018. There are four major types of schools. These are junior secondary schools which are mostly private, secondary school (both public and private), school and college (both public and private), and govt. primary schools with the facilities of offering junior secondary education7. Unlike the primary, most of the secondary institutions are run by private institutions, of the total 19176 are public schools and only 663 are public schools.
Figure 23: Number of institutions
36
readiness of the workforce since a large share of the secondary students do not pursue higher education or diploma. According to the Labor Force Survey 2016-17, about 15.7 million workers of the labor force had completed primary education (25.8 per cent), while more than 18.7 million workers (30.8 per cent) are secondary school graduates. That is, the share of workers with secondary education is twice as large as the size of workforce with primary education. Hence, the productivity of the workforce of the country critically depends on the quality of education in the secondary level. Furthermore, the secondary education is the stepping stone for higher education - both general and vocational streams – and therefore an important determining factor for the quality of higher education.
5.2.1 Evolution of secondary education
In Bangladesh, junior secondary education includes grades 6 to 10 and grades 11-12 belong to higher secondary education - total of seven years of schooling which bridges primary with tertiary education. Three public exams after completion of grade 8, 10 and 12 also mark the secondary education9. Secondary education operates three broad steams and these includes general, madrasa and vocational. At junior secondary level, there are two streams, general education and madrasa education. Vocational education is the third stream at the secondary level.
Institutions
There were 20,465 institutions offering secondary education to 10475100 students with 234,165 teachers in 2018. There are four major types of schools. These are junior secondary schools which are mostly private, secondary school (both public and private), school and college (both public and private), and govt. primary schools with the facilities of offering junior secondary education10. Unlike the primary, most of the secondary institutions are run by private institutions, of the total 19176 are public schools and only 663 are public schools.
Figure 23: Number of institutions
9 After, completing grade 8 students sit for a junior school certificate (JSC) exam; students sit for Secondary School Certificate (SSC) examination after grade 10 and after completion of12 years of education students sit for Higher Secondary Certificate (HSC) examination. 10 10 Junior Secondary School (Private)+Secondary School (Private) + Secondary School (Public) + School and College (Private) + School and College (Public) = Total Secondary
1889019275 19357 19493 19508 19480
19176
318
327 327333 339 368
663
18,40018,60018,80019,00019,20019,40019,60019,80020,000
2012 2013 2014 2015 2016 2017 2018
Private Public
Data source: BANBEIS; Note: Private School includes 626 Upgraded Primary School. The size of bars with different color does not represent true proportion.6 After, completing grade 8 students sit for a junior school certificate (JSC) exam; students sit for Secondary School
Certificate (SSC) examination after grade 10 and after completion of12 years of education students sit for Higher Secondary Certificate (HSC) examination.
7 Junior Secondary School (Private)+Secondary School (Private) + Secondary School (Public) + School and College (Private) + School and College (Public) = Total Secondary
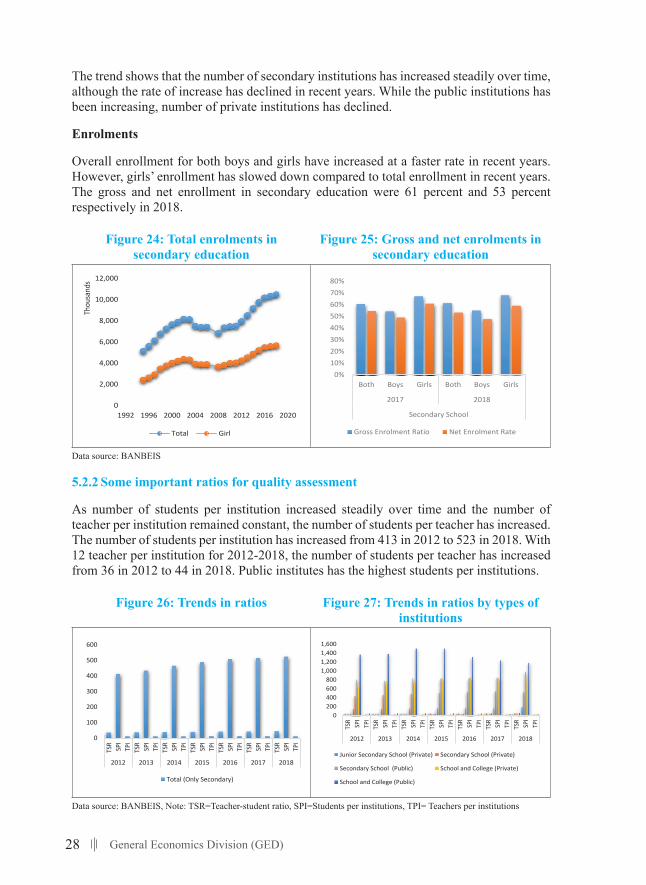
28 General Economics Division (GED)
The trend shows that the number of secondary institutions has increased steadily over time, although the rate of increase has declined in recent years. While the public institutions has been increasing, number of private institutions has declined.
Enrolments
Overall enrollment for both boys and girls have increased at a faster rate in recent years. However, girls’ enrollment has slowed down compared to total enrollment in recent years. The gross and net enrollment in secondary education were 61 percent and 53 percent respectively in 2018.
Figure 24: Total enrolments in secondary education
Figure 25: Gross and net enrolments in secondary education
37
Data source: BANBEIS; Note: Private School includes 626 Upgraded Primary School. The size of bars with different color does not represent true proportion.
The trend shows that the number of secondary institutions has increased steadily over time, although the rate of increase has declined in recent years. While the public institutions has been increasing, number of private institutions has declined.
Enrolments
Overall enrollment for both boys and girls have increased at a faster rate in recent years. However, girls’ enrollment has slowed down compared to total enrollment in recent years. The gross and net enrollment in secondary education were 61 percent and 53 percent respectively in 2018.
Figure 24: Total enrolments in secondary education
Figure 25: Gross and net enrolments in secondary education
Data source: BANBEIS
5.2.2 Some important ratios for quality assessment
As number of students per institution increased steadily over time and the number of teacher per institution remained constant, the number of students per teacher has increased. The number of students per institution has increased from 413 in 2012 to 523 in 2018. With 12 teacher per institution for 2012-2018, the number of students per teacher has increased from 36 in 2012 to 44 in 2018. Public institutes has the highest students per institutions.
0
2,000
4,000
6,000
8,000
10,000
12,000
1992 1996 2000 2004 2008 2012 2016 2020
Thou
sand
s
Total Girl
0%10%20%30%40%50%60%70%80%
Both Boys Girls Both Boys Girls
2017 2018
Secondary School
Gross Enrolment Ratio Net Enrolment Rate
Data source: BANBEIS
5.2.2 Some important ratios for quality assessment
As number of students per institution increased steadily over time and the number of teacher per institution remained constant, the number of students per teacher has increased. The number of students per institution has increased from 413 in 2012 to 523 in 2018. With 12 teacher per institution for 2012-2018, the number of students per teacher has increased from 36 in 2012 to 44 in 2018. Public institutes has the highest students per institutions.
Figure 26: Trends in ratios Figure 27: Trends in ratios by types of institutions
38
Figure 26: Trends in ratios
Figure 27: Trends in ratios by types of institutions
Data source: BANBEIS, Note: TSR=Teacher-student ratio, SPI=Students per institutions, TPI= Teachers per institutions
Results
While the passing rate increases very steadily in SSC exams, the HSC examinees have experienced a bumpy ride over time. A sharp increase in passing rate has been observed since 2002, though the momentum has tapered off in recent years. The passing rate of science tends to be higher than humanity and commerce in SSC. In the case of HSC, in recent years, science students tend to pass more than other streams in recent years. Students of humanity have performed worst in both SSC and HSC.
Figure 28: Pass rate of Secondary School Certificate (S.S.C)
Figure 29: Pass rate of Higher Secondary School Certificate (H.S.C)
Data source: BANBEIS
Figure 30 and 31 show how the distribution of GPA has changed over time for both SSC and HSC exams. The share of GAP 5 has increased substantially over the years as well as the share of students with GPA between 4 and 5. Share of GPA less than 3.5 and higher than 1 (grade D) has also decreased. Overall, the results of SSC and HSC are better in recent years than before.
0
100
200
300
400
500
600
TSR SPI
TPI
TSR SPI
TPI
TSR SPI
TPI
TSR SPI
TPI
TSR SPI
TPI
TSR SPI
TPI
TSR SPI
TPI
2012 2013 2014 2015 2016 2017 2018
Total (Only Secondary)
0200400600800
1,0001,2001,4001,600
TSR SPI
TPI
TSR SPI
TPI
TSR SPI
TPI
TSR SPI
TPI
TSR SPI
TPI
TSR SPI
TPI
TSR SPI
TPI
2012 2013 2014 2015 2016 2017 2018
Junior Secondary School (Private) Secondary School (Private)
Secondary School (Public) School and College (Private)
School and College (Public)
0
20
40
60
80
100
120
2004
2005
2006
2007
2008
2009
2010
2011
2012
2013
2014
2015
2016
2017
2018
% of Pass in Humanities
% of Pass in Science
% of Pass in Business studies
0102030405060708090
1990
1992
1994
1996
1998
2000
2002
2004
2006
2008
2010
2012
2014
2016
2018
% of Pass in Humanities
% of Pass in Science
% of Pass Business Studies
Data source: BANBEIS, Note: TSR=Teacher-student ratio, SPI=Students per institutions, TPI= Teachers per institutions
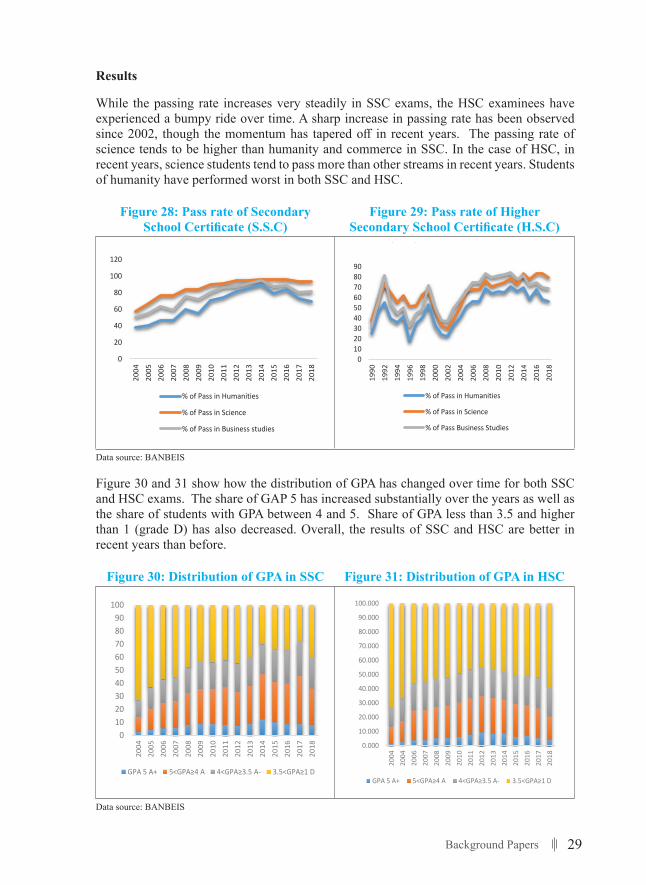
29Background Papers
Results
While the passing rate increases very steadily in SSC exams, the HSC examinees have experienced a bumpy ride over time. A sharp increase in passing rate has been observed since 2002, though the momentum has tapered off in recent years. The passing rate of science tends to be higher than humanity and commerce in SSC. In the case of HSC, in recent years, science students tend to pass more than other streams in recent years. Students of humanity have performed worst in both SSC and HSC.
Figure 28: Pass rate of Secondary SchoolCertificate(S.S.C)
Figure 29: Pass rate of Higher SecondarySchoolCertificate(H.S.C)
38
Figure 26: Trends in ratios
Figure 27: Trends in ratios by types of institutions
Data source: BANBEIS, Note: TSR=Teacher-student ratio, SPI=Students per institutions, TPI= Teachers per institutions
Results
While the passing rate increases very steadily in SSC exams, the HSC examinees have experienced a bumpy ride over time. A sharp increase in passing rate has been observed since 2002, though the momentum has tapered off in recent years. The passing rate of science tends to be higher than humanity and commerce in SSC. In the case of HSC, in recent years, science students tend to pass more than other streams in recent years. Students of humanity have performed worst in both SSC and HSC.
Figure 28: Pass rate of Secondary School Certificate (S.S.C)
Figure 29: Pass rate of Higher Secondary School Certificate (H.S.C)
Data source: BANBEIS
Figure 30 and 31 show how the distribution of GPA has changed over time for both SSC and HSC exams. The share of GAP 5 has increased substantially over the years as well as the share of students with GPA between 4 and 5. Share of GPA less than 3.5 and higher than 1 (grade D) has also decreased. Overall, the results of SSC and HSC are better in recent years than before.
0
100
200
300
400
500
600
TSR
SPI
TPI
TSR
SPI
TPI
TSR
SPI
TPI
TSR
SPI
TPI
TSR
SPI
TPI
TSR
SPI
TPI
TSR
SPI
TPI
2012 2013 2014 2015 2016 2017 2018
Total (Only Secondary)
0200400600800
1,0001,2001,4001,600
TSR
SPI
TPI
TSR
SPI
TPI
TSR
SPI
TPI
TSR
SPI
TPI
TSR
SPI
TPI
TSR
SPI
TPI
TSR
SPI
TPI
2012 2013 2014 2015 2016 2017 2018
Junior Secondary School (Private) Secondary School (Private)
Secondary School (Public) School and College (Private)
School and College (Public)
0
20
40
60
80
100
120
2004
2005
2006
2007
2008
2009
2010
2011
2012
2013
2014
2015
2016
2017
2018
% of Pass in Humanities
% of Pass in Science
% of Pass in Business studies
0102030405060708090
1990
1992
1994
1996
1998
2000
2002
2004
2006
2008
2010
2012
2014
2016
2018
% of Pass in Humanities
% of Pass in Science
% of Pass Business Studies
Data source: BANBEIS
Figure 30 and 31 show how the distribution of GPA has changed over time for both SSC and HSC exams. The share of GAP 5 has increased substantially over the years as well as the share of students with GPA between 4 and 5. Share of GPA less than 3.5 and higher than 1 (grade D) has also decreased. Overall, the results of SSC and HSC are better in recent years than before.
Figure 30: Distribution of GPA in SSC Figure 31: Distribution of GPA in HSC
39
Figure 30: Distribution of GPA in SSC
Figure 31: Distribution of GPA in HSC
Data source: BANBEIS
5.2.3 Challenges
Low share of science students
Figure 32: Share of SSC exam appeared by streams
Figure 33: Share of SSC exam passed by different streams
0102030405060708090
100
2004
2005
2006
2007
2008
2009
2010
2011
2012
2013
2014
2015
2016
2017
2018
GPA 5 A+ 5<GPA≥4 A 4<GPA≥3.5 A- 3.5<GPA≥1 D
0.000
10.000
20.000
30.000
40.000
50.000
60.000
70.000
80.000
90.000
100.000
2004
2004
2006
2007
2008
2009
2010
2011
2012
2013
2014
2015
2016
2017
2018
GPA 5 A+ 5<GPA≥4 A 4<GPA≥3.5 A- 3.5<GPA≥1 D
0
20
40
60
80
100
1998
1999
2000
2001
2002
2003
2004
2005
2006
2007
2008
2009
2010
2011
2012
2013
2014
2015
2016
2017
2018
SSC - % share of appeared in business studies
SSC - % share of appeared in science
SSC - % share of appeared in humanities
0%
20%
40%
60%
80%
100%
1998
1999
2000
2001
2002
2003
2004
2005
2006
2007
2008
2009
2010
2011
2012
2013
2014
2015
2016
2017
2018
SSC - % share of pass in business studies
SSC - % share of pass in science
SSC - % share of pass in humanities
Data source: BANBEIS
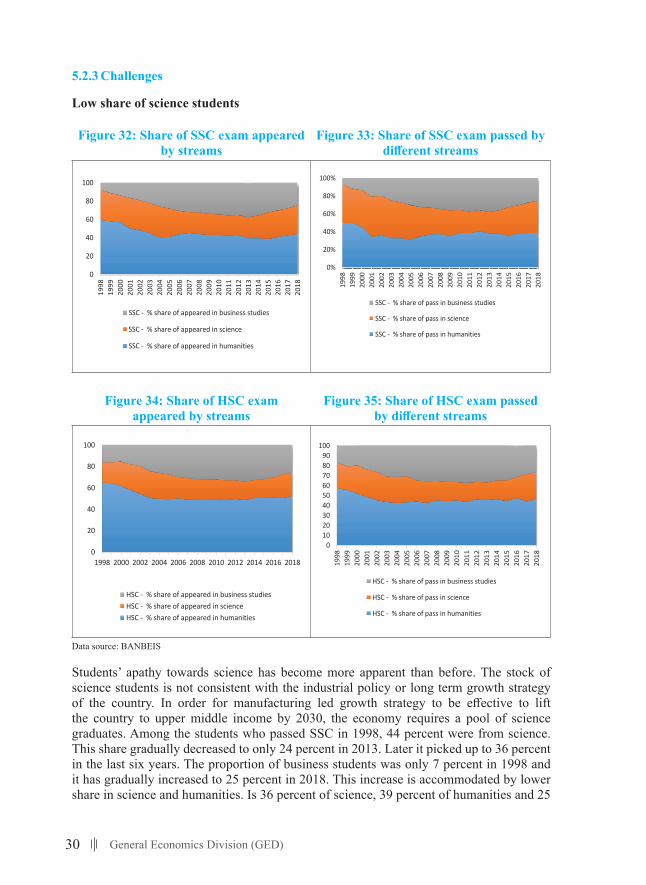
30 General Economics Division (GED)
5.2.3 Challenges
Low share of science students
Figure 32: Share of SSC exam appeared by streams
Figure 33: Share of SSC exam passed by differentstreams
39
Figure 30: Distribution of GPA in SSC
Figure 31: Distribution of GPA in HSC
Data source: BANBEIS
5.2.3 Challenges
Low share of science students
Figure 32: Share of SSC exam appeared by streams
Figure 33: Share of SSC exam passed by different streams
0102030405060708090
100
2004
2005
2006
2007
2008
2009
2010
2011
2012
2013
2014
2015
2016
2017
2018
GPA 5 A+ 5<GPA≥4 A 4<GPA≥3.5 A- 3.5<GPA≥1 D
0.000
10.000
20.000
30.000
40.000
50.000
60.000
70.000
80.000
90.000
100.000
2004
2004
2006
2007
2008
2009
2010
2011
2012
2013
2014
2015
2016
2017
2018
GPA 5 A+ 5<GPA≥4 A 4<GPA≥3.5 A- 3.5<GPA≥1 D
0
20
40
60
80
100
1998
1999
2000
2001
2002
2003
2004
2005
2006
2007
2008
2009
2010
2011
2012
2013
2014
2015
2016
2017
2018
SSC - % share of appeared in business studies
SSC - % share of appeared in science
SSC - % share of appeared in humanities
0%
20%
40%
60%
80%
100%
1998
1999
2000
2001
2002
2003
2004
2005
2006
2007
2008
2009
2010
2011
2012
2013
2014
2015
2016
2017
2018
SSC - % share of pass in business studies
SSC - % share of pass in science
SSC - % share of pass in humanities
Figure 34: Share of HSC exam appeared by streams
Figure 35: Share of HSC exam passed bydifferentstreams
40
Figure 34: Share of HSC exam appeared by streams
Figure 35: Share of HSC exam passed by different streams
Data source: BANBEIS
Students’ apathy towards science has become more apparent than before. The stock of science students is not consistent with the industrial policy or long term growth strategy of the country. In order for manufacturing led growth strategy to be effective to lift the country to upper middle income by 2030, the economy requires a pool of science graduates. Among the students who passed SSC in 1998, 44 percent were from science. This share gradually decreased to only 24 percent in 2013. Later it picked up to 36 percent in the last six years. The proportion of business students was only 7 percent in 1998 and it has gradually increased to 25 percent in 2018. This increase is accommodated by lower share in science and humanities. Is 36 percent of science, 39 percent of humanities and 25 percent of business students consistent with the country’s aspiration to excel in science and technology? This remains an open question.
In HSC, the share of science students is much lower. Only 22 percent of students who appeared for HSC exams in 2018 are from science group. This figure is 53 percent for humanities and 25 percent for business. Since, science students are argued to be better than other streams, the passing rate for science is higher than the appearance rate, compared to other streams. Those who passed HSC exam in 2018, 27 percent of them are from science, 46 percent from humanities and 27 percent from business. This low share of science students remains a concern for the policy makers.
Cohort analysis
The cohort analysis gives us some idea about the dropouts by stream and the switch of stream from one to another. The figures are drawn for SSC cohorts, that is, if a student sits for SSC in 1998, he or she will sit for HSC in 2000 and these points are shown against 1998 SSC cohort with blue (SSC) lines and yellow (HSC) lines.
0
20
40
60
80
100
1998 2000 2002 2004 2006 2008 2010 2012 2014 2016 2018
HSC - % share of appeared in business studiesHSC - % share of appeared in scienceHSC - % share of appeared in humanities
0102030405060708090
100
1998
1999
2000
2001
2002
2003
2004
2005
2006
2007
2008
2009
2010
2011
2012
2013
2014
2015
2016
2017
2018
HSC - % share of pass in business studies
HSC - % share of pass in science
HSC - % share of pass in humanities
40
Figure 34: Share of HSC exam appeared by streams
Figure 35: Share of HSC exam passed by different streams
Data source: BANBEIS
Students’ apathy towards science has become more apparent than before. The stock of science students is not consistent with the industrial policy or long term growth strategy of the country. In order for manufacturing led growth strategy to be effective to lift the country to upper middle income by 2030, the economy requires a pool of science graduates. Among the students who passed SSC in 1998, 44 percent were from science. This share gradually decreased to only 24 percent in 2013. Later it picked up to 36 percent in the last six years. The proportion of business students was only 7 percent in 1998 and it has gradually increased to 25 percent in 2018. This increase is accommodated by lower share in science and humanities. Is 36 percent of science, 39 percent of humanities and 25 percent of business students consistent with the country’s aspiration to excel in science and technology? This remains an open question.
In HSC, the share of science students is much lower. Only 22 percent of students who appeared for HSC exams in 2018 are from science group. This figure is 53 percent for humanities and 25 percent for business. Since, science students are argued to be better than other streams, the passing rate for science is higher than the appearance rate, compared to other streams. Those who passed HSC exam in 2018, 27 percent of them are from science, 46 percent from humanities and 27 percent from business. This low share of science students remains a concern for the policy makers.
Cohort analysis
The cohort analysis gives us some idea about the dropouts by stream and the switch of stream from one to another. The figures are drawn for SSC cohorts, that is, if a student sits for SSC in 1998, he or she will sit for HSC in 2000 and these points are shown against 1998 SSC cohort with blue (SSC) lines and yellow (HSC) lines.
0
20
40
60
80
100
1998 2000 2002 2004 2006 2008 2010 2012 2014 2016 2018
HSC - % share of appeared in business studiesHSC - % share of appeared in scienceHSC - % share of appeared in humanities
0102030405060708090
100
1998
1999
2000
2001
2002
2003
2004
2005
2006
2007
2008
2009
2010
2011
2012
2013
2014
2015
2016
2017
2018
HSC - % share of pass in business studies
HSC - % share of pass in science
HSC - % share of pass in humanities
Data source: BANBEIS
Students’ apathy towards science has become more apparent than before. The stock of science students is not consistent with the industrial policy or long term growth strategy of the country. In order for manufacturing led growth strategy to be effective to lift the country to upper middle income by 2030, the economy requires a pool of science graduates. Among the students who passed SSC in 1998, 44 percent were from science. This share gradually decreased to only 24 percent in 2013. Later it picked up to 36 percent in the last six years. The proportion of business students was only 7 percent in 1998 and it has gradually increased to 25 percent in 2018. This increase is accommodated by lower share in science and humanities. Is 36 percent of science, 39 percent of humanities and 25
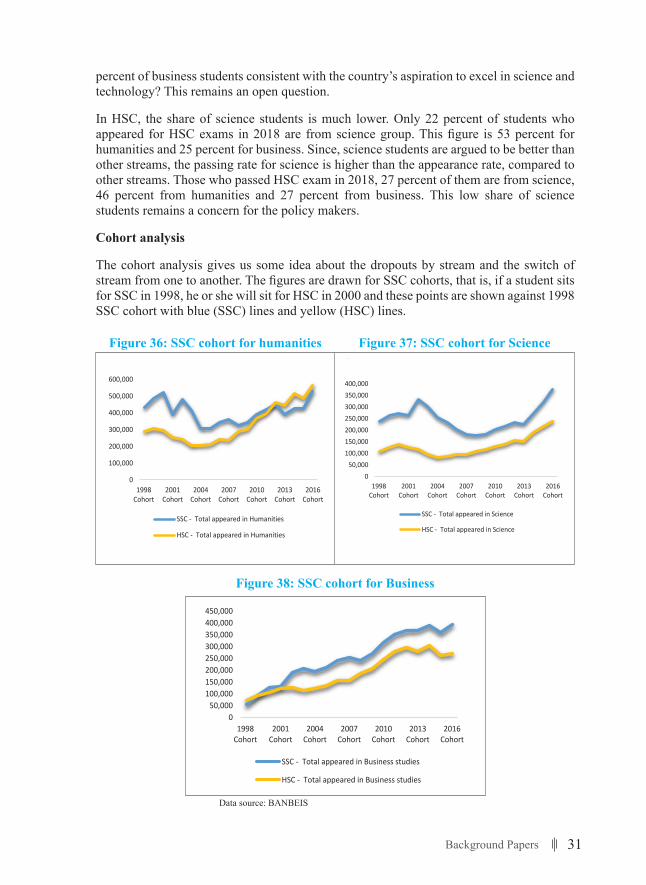
31Background Papers
percent of business students consistent with the country’s aspiration to excel in science and technology? This remains an open question.
In HSC, the share of science students is much lower. Only 22 percent of students who appeared for HSC exams in 2018 are from science group. This figure is 53 percent for humanities and 25 percent for business. Since, science students are argued to be better than other streams, the passing rate for science is higher than the appearance rate, compared to other streams. Those who passed HSC exam in 2018, 27 percent of them are from science, 46 percent from humanities and 27 percent from business. This low share of science students remains a concern for the policy makers.
Cohort analysis
The cohort analysis gives us some idea about the dropouts by stream and the switch of stream from one to another. The figures are drawn for SSC cohorts, that is, if a student sits for SSC in 1998, he or she will sit for HSC in 2000 and these points are shown against 1998 SSC cohort with blue (SSC) lines and yellow (HSC) lines.
Figure 36: SSC cohort for humanities Figure 37: SSC cohort for Science
41
Data source: BANBEIS
The figure 36 shows that about 431 thousands appeared in SSC in humanities group in 1998. Of them, only about 300 thousands continued in humanities for HSC in 2000. Assuming that a student would find difficult to switch to science group from humanities in HSC after having taken humanities in SSC, the gap represents the students who either dropped out or switched to commerce group. Interestingly, after 2013, the number of students with humanities of HSC was higher than that of SSC for the same cohort. It implies that more students with science and business in SSC have switched to humanities.
In 1998, 238494 students took science group. However, only 107,406 students among them went on to take science in HSC in 2000. Number of science students increased to almost 3.5 lakhs in SSC in 2002, and then this number started to fall gradually. The rate of decrease in students taking science in SSC is greater than that in HSC, which contributed to the gap decreasing over time. Since 2013, the gap between SSC and HSC has widened in the recent years, implying either higher dropouts from science or switching to other steams.
Figure 36: SSC cohort for humanities
Figure 37: SSC cohort for Science
Figure 38: SSC cohort for Business
0
100,000
200,000
300,000
400,000
500,000
600,000
1998Cohort
2001Cohort
2004Cohort
2007Cohort
2010Cohort
2013Cohort
2016Cohort
SSC - Total appeared in Humanities
HSC - Total appeared in Humanities
050,000
100,000150,000200,000250,000300,000350,000400,000
1998Cohort
2001Cohort
2004Cohort
2007Cohort
2010Cohort
2013Cohort
2016Cohort
SSC - Total appeared in Science
HSC - Total appeared in Science
050,000
100,000150,000200,000250,000300,000350,000400,000450,000
1998Cohort
2001Cohort
2004Cohort
2007Cohort
2010Cohort
2013Cohort
2016Cohort
SSC - Total appeared in Business studies
HSC - Total appeared in Business studies
Figure 38: SSC cohort for Business
41
Data source: BANBEIS
The figure 36 shows that about 431 thousands appeared in SSC in humanities group in 1998. Of them, only about 300 thousands continued in humanities for HSC in 2000. Assuming that a student would find difficult to switch to science group from humanities in HSC after having taken humanities in SSC, the gap represents the students who either dropped out or switched to commerce group. Interestingly, after 2013, the number of students with humanities of HSC was higher than that of SSC for the same cohort. It implies that more students with science and business in SSC have switched to humanities.
In 1998, 238494 students took science group. However, only 107,406 students among them went on to take science in HSC in 2000. Number of science students increased to almost 3.5 lakhs in SSC in 2002, and then this number started to fall gradually. The rate of decrease in students taking science in SSC is greater than that in HSC, which contributed to the gap decreasing over time. Since 2013, the gap between SSC and HSC has widened in the recent years, implying either higher dropouts from science or switching to other steams.
Figure 36: SSC cohort for humanities
Figure 37: SSC cohort for Science
Figure 38: SSC cohort for Business
0
100,000
200,000
300,000
400,000
500,000
600,000
1998Cohort
2001Cohort
2004Cohort
2007Cohort
2010Cohort
2013Cohort
2016Cohort
SSC - Total appeared in Humanities
HSC - Total appeared in Humanities
050,000
100,000150,000200,000250,000300,000350,000400,000
1998Cohort
2001Cohort
2004Cohort
2007Cohort
2010Cohort
2013Cohort
2016Cohort
SSC - Total appeared in Science
HSC - Total appeared in Science
050,000
100,000150,000200,000250,000300,000350,000400,000450,000
1998Cohort
2001Cohort
2004Cohort
2007Cohort
2010Cohort
2013Cohort
2016Cohort
SSC - Total appeared in Business studies
HSC - Total appeared in Business studies
Data source: BANBEIS
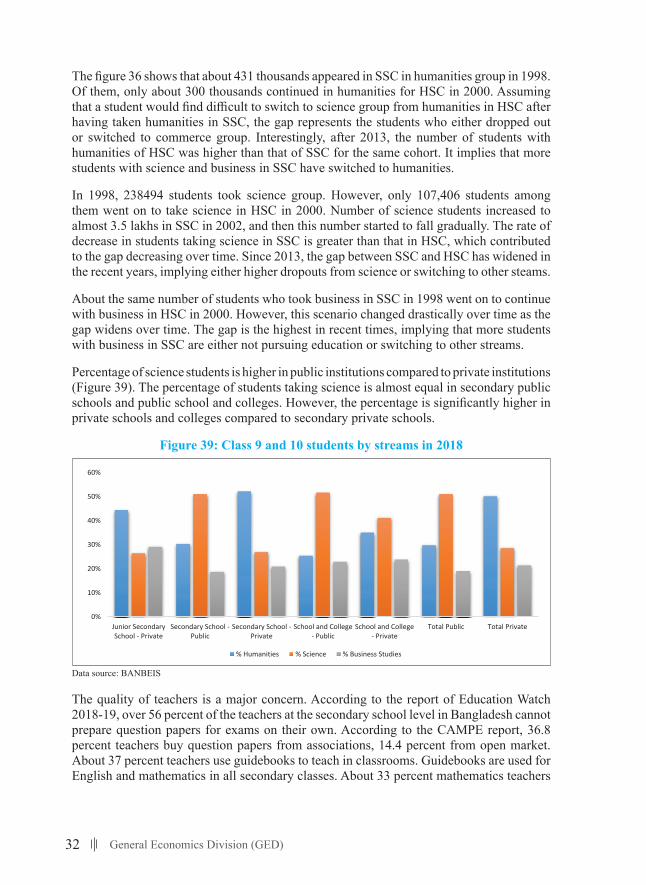
32 General Economics Division (GED)
The figure 36 shows that about 431 thousands appeared in SSC in humanities group in 1998. Of them, only about 300 thousands continued in humanities for HSC in 2000. Assuming that a student would find difficult to switch to science group from humanities in HSC after having taken humanities in SSC, the gap represents the students who either dropped out or switched to commerce group. Interestingly, after 2013, the number of students with humanities of HSC was higher than that of SSC for the same cohort. It implies that more students with science and business in SSC have switched to humanities.
In 1998, 238494 students took science group. However, only 107,406 students among them went on to take science in HSC in 2000. Number of science students increased to almost 3.5 lakhs in SSC in 2002, and then this number started to fall gradually. The rate of decrease in students taking science in SSC is greater than that in HSC, which contributed to the gap decreasing over time. Since 2013, the gap between SSC and HSC has widened in the recent years, implying either higher dropouts from science or switching to other steams.
About the same number of students who took business in SSC in 1998 went on to continue with business in HSC in 2000. However, this scenario changed drastically over time as the gap widens over time. The gap is the highest in recent times, implying that more students with business in SSC are either not pursuing education or switching to other streams.
Percentage of science students is higher in public institutions compared to private institutions (Figure 39). The percentage of students taking science is almost equal in secondary public schools and public school and colleges. However, the percentage is significantly higher in private schools and colleges compared to secondary private schools.
Figure 39: Class 9 and 10 students by streams in 2018
42
About the same number of students who took business in SSC in 1998 went on to continue with business in HSC in 2000. However, this scenario changed drastically over time as the gap widens over time. The gap is the highest in recent times, implying that more students with business in SSC are either not pursuing education or switching to other streams.
Percentage of science students is higher in public institutions compared to private institutions (Figure 39). The percentage of students taking science is almost equal in secondary public schools and public school and colleges. However, the percentage is significantly higher in private schools and colleges compared to secondary private schools.
Figure 39: Class 9 and 10 students by streams in 2018
Data source: BANBEIS
The quality of teachers is a major concern. According to the report of Education Watch 2018-19, over 56 percent of the teachers at the secondary school level in Bangladesh cannot prepare question papers for exams on their own. According to the CAMPE report, 36.8 percent teachers buy question papers from associations, 14.4 percent from open market. About 37 percent teachers use guidebooks to teach in classrooms. Guidebooks are used for English and mathematics in all secondary classes. About 33 percent mathematics teachers and 23 percent science teachers are found to use unauthorized guidebooks (Education Watch, 2018-19).
Students fear of math or science based subjects is evident. Evidence suggests that pass rates in mathematics and science is lower than that of other subjects and the rates fall further in higher classes. In essence, lack of qualified science teacher, lack of adequate pedagogical materials and lab facilities, fear for math and the perceived poor job market opportunities have contributed to the lower share of science in secondary education in Bangladesh
The Secondary Education Sector Investment Program (2013-2023)
The Secondary Education Sector Investment Program (2013-2023) in Bangladesh is designed with the assistance of ADB to achieve a more relevant secondary education in terms of quality, efficiency and equity through developing the secondary education sector as a whole.
0%
10%
20%
30%
40%
50%
60%
Junior SecondarySchool - Private
Secondary School -Public
Secondary School -Private
School and College- Public
School and College- Private
Total Public Total Private
% Humanities % Science % Business Studies
Data source: BANBEIS
The quality of teachers is a major concern. According to the report of Education Watch 2018-19, over 56 percent of the teachers at the secondary school level in Bangladesh cannot prepare question papers for exams on their own. According to the CAMPE report, 36.8 percent teachers buy question papers from associations, 14.4 percent from open market. About 37 percent teachers use guidebooks to teach in classrooms. Guidebooks are used for English and mathematics in all secondary classes. About 33 percent mathematics teachers
33Background Papers
and 23 percent science teachers are found to use unauthorized guidebooks (Education Watch, 2018-19).
Students fear of math or science based subjects is evident. Evidence suggests that pass rates in mathematics and science is lower than that of other subjects and the rates fall further in higher classes. In essence, lack of qualified science teacher, lack of adequate pedagogical materials and lab facilities, fear for math and the perceived poor job market opportunities have contributed to the lower share of science in secondary education in Bangladesh.
5.2.4 Recommendations for improvement of quality of the primary and secondary level
PEDP-4 and SESIP projects are very comprehensive and encompass all the aspects of the development of the primary and secondary education. On top of the areas covered by these projects, the following recommendations can be incorporated in the 8th FYP.
Ensure learning at the primary and secondary level
The National Student Assessment (NSA) conducted by DPE shows that the students hardly learn anything at the primary level and this does not match with the results of the PSC exams. This also questions the usefulness of PSC exam. All the interventions of the government, private sectors and NGOs thus should only aim at enhancing the learning outcomes. All the skill enhancement projects will become futile if the students learn little at the primary level.
There should be similar NSA for the secondary students. Poor NSA performance at the primary level indicates that the quality of secondary level is not significantly different. Since secondary level is the stepping stone for tertiary and vocational education, weak learning at this level jeopardizes any investment at the tertiary level.
Stress more on science education
The share of science students at the secondary and higher secondary levels do not match with the growth strategy or the growth projection of the country. Less than one fifth of the students who appeared for HSC are from science group and this is a dismally low figure. Special programs and investments are required to boost up the number of science students and this include greater training for science teachers, special BSC for recruiting science teachers in colleges, organizing science and math Olympiads at the union levels, wider social campaign communicating the benefits of learning science, etc.
Ensure universal access to web based learning
In this digital world, there is no scarcity of web-based learning materials. Government’s Shikhok Batayan is an excellent example of such initiative8. It already has 245049 contents with 953 model contents. The government has a plan to involve 9 lacs teachers in this initiative by 2021. There are many private initiatives in home and abroad, such as 10-minute schools, Khan’s Academy, etc. The challenge is to provide access to such learning materials. A frameworks should be crafted to ensure at least one hour of learning using these web contents in all primary and secondary schools in school premises.
8 https://www.teachers.gov.bd/
34 General Economics Division (GED)
Institutionalize parents-teacher meeting
Recent empirical evidence suggests that regular and effective parents-teacher meeting has significant impact on the learning outcome. Experimental evidence suggest that that the overall test scores of the students, whose parents met regularly with the teachers, increased by 0.26 standard deviation in the first year, and 0.38 standard deviation by the end of the second year. This study encourages parents to spend more time assisting their children and monitoring their school work (Islam, 2019). This is a very strong result and has significant policy mileage. Though schools are required to have students-parents meeting on regular basis, anecdotal evidence suggest that they only exist in name. Involvement of the community, Upazila education officer, local elected representatives, local elites to educate parents on the benefit of the regular meeting with teachers can result in better outcomes. This should be promoted at all levels of schooling.
Special development programs for ecologically vulnerable areasEvidence shows that educational outcomes in the ecologically vulnerable areas are worse than other parts of the country. The impact of natural disaster on education outcome and thus the overall skill development is a critical issues. Floods, cyclones, etc. inundate and damage the schools in almost every year and this causes losses of teaching hours. These institutions can hardly make up the loss due to disasters. Hence, special programs should be taken to help these institutions. The mid-day meal program of the government has been piloted in the backward regions of the county.
Ensure regular and timely attendance of the teachers and students It is a big challenge to monitor the attendance of the teachers. Anecdotal evidence indicates that the school starts late because that teachers cannot attend the school in time. The situation is more severe during the harvesting or planting seasons in rural areas. Students often work in the filed as the daily wage rate is very high during the peak seasons. It requires to put more emphasis on the attendance issues of the teachers and the students.
GreateraccountabilityofSub-districtEducationOfficerandtheschoolmanagementcommittee for the results of the institutionsThe accountability framework of the education system is very weak. Who will take the responsibility of the fact that a student cannot read properly even after five years of education? There has to be a mechanism of accountability in place with adequate reward and punishment.
Develop ‘adopt a school’ programs This type of program is highly popular in developed countries where the rich people take part in the development of a school. Government can develop such programs where NRBs and the rich people or group of people of the country (e.g., district specific association, etc.) can adopt a school for its development. A framework for engagement can be drafted.
Social recognition and image of the school and college teachers In order to attract better students to teaching in schools and colleges, uplifting the image of this profession is also essential. Scholars and policy makers should come up with roadmap of how to improve the image of school and college teachers in the society.
35Background Papers
Introduce regular professional development trainings for the teachers A strategic framework for the training of the teachers is required at pre-primary, primary and secondary levels. Teachers should upgrade themselves in regular interval, particularly at the primary level. The teachers have to prove their proficiency in the subjects through standard trainings with exams on regular basis.
Create a database on the students who pass SSC and HSC at the union level This database will help track the students for their career consultancy such as whether a student should go for general education or TVET stream based on results. Upazila education officer can play an active role in sorting out the students suitable for TVET streams and encourage, educate and help choose the vocational paths. The local government can partner with local NGOs in the career counselling.
5.3 Tertiary Education Tertiary education plays a critical role in the skill development of the country. Quality of the outcome of tertiary education depends on the quality of primary and secondary education. If there is a learning deficiency in the pre-tertiary level, the tertiary level itself cannot produce desired outcomes. On the other hand, quality tertiary education produces quality teachers which in turn determines the quality of primary and secondary education. Therefore, primary, secondary and tertiary are all inter-related, one tier cannot be upgraded in isolation. Improvement of productivity of labor force, adoption of sophisticated technology, research and development, embracement of Fourth Industrial Revolution (4IR) – all depends on the size and quality of tertiary education. The speed at which the country will transition from low middle income to high middle country relies on how prompt the policy makers respond to the need of highly trained workers produced at the tertiary level.5.3.1 Evolution of Tertiary EducationBangladesh has a structured system of tertiary education. The tertiary education providing institutions of Bangladesh can broadly be divided into three categories. They are universities, tertiary colleges under general education system and the polytechnics under the technical and vocational education and training (TVET) system. Our focus in this section will be on universities (both public and private) and tertiary colleges.Universities: public and privateThe country witnessed a major growth of the tertiary educational institutions during 2008-2018. The total number of universities increased from 82 in 2008 to 145 in 2018. One noticeable change is that despite the wide spread criticism of the quality of the private universities, the number of private universities doubled in ten years – the number increased from 51 in 2008 to 103 in 2018.Similar increase occurred in the number of university students. The total number of university students increased from 0.38 million in 2008 to about 1 million in 2018. This increase is due to expansion of higher education as well as the increasing pool of higher secondary graduates wanting to pursue higher education. Despite the growing number of private universities, majority (65%) of these students study in the public universities.
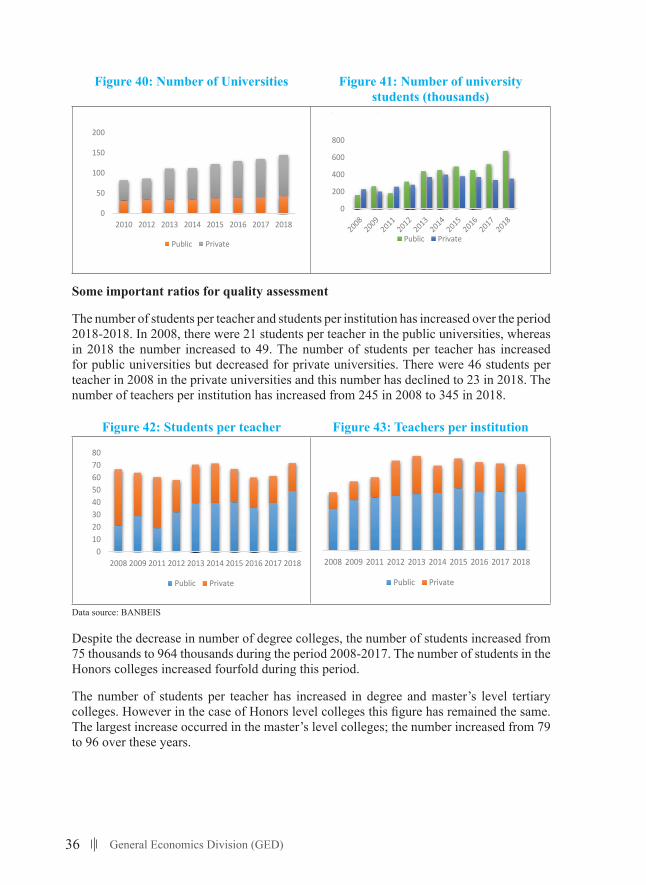
36 General Economics Division (GED)
Figure 40: Number of Universities Figure 41: Number of university students (thousands)
46
5.3 Tertiary Education
Tertiary education plays a critical role in the skill development of the country. Quality of the outcome of tertiary education depends on the quality of primary and secondary education. If there is a learning deficiency in the pre-tertiary level, the tertiary level itself cannot produce desired outcomes. On the other hand, quality tertiary education produces quality teachers which in turn determines the quality of primary and secondary education. Therefore, primary, secondary and tertiary are all inter-related, one tier cannot be upgraded in isolation.
Improvement of productivity of labor force, adoption of sophisticated technology, research and development, embracement of Fourth Industrial Revolution (4IR) – all depends on the size and quality of tertiary education. The speed at which the country will transition from low middle income to high middle country relies on how prompt the policy makers respond to the need of highly trained workers produced at the tertiary level.
5.3.1 Evolution of Tertiary Education
Bangladesh has a structured system of tertiary education. The tertiary education providing institutions of Bangladesh can broadly be divided into three categories. They are universities, tertiary colleges under general education system and the polytechnics under the technical and vocational education and training (TVET) system. Our focus in this section will be on universities (both public and private) and tertiary colleges.
Universities: public and private
The country witnessed a major growth of the tertiary educational institutions during 2008-2018. The total number of universities increased from 82 in 2008 to 145 in 2018. One noticeable change is that despite the wide spread criticism of the quality of the private universities, the number of private universities doubled in ten years – the number increased from 51 in 2008 to 103 in 2018.
Similar increase occurred in the number of university students. The total number of university students increased from 0.38 million in 2008 to about 1 million in 2018. This increase is due to expansion of higher education as well as the increasing pool of higher secondary graduates wanting to pursue higher education. Despite the growing number of private universities, majority (65%) of these students study in the public universities.
Figure 40: Number of Universities
Figure 41: Number of university students (thousands)
0
50
100
150
200
2010 2012 2013 2014 2015 2016 2017 2018
Public Private
0
200
400
600
800
Public Private
Some important ratios for quality assessment
The number of students per teacher and students per institution has increased over the period 2018-2018. In 2008, there were 21 students per teacher in the public universities, whereas in 2018 the number increased to 49. The number of students per teacher has increased for public universities but decreased for private universities. There were 46 students per teacher in 2008 in the private universities and this number has declined to 23 in 2018. The number of teachers per institution has increased from 245 in 2008 to 345 in 2018.
Figure 42: Students per teacher Figure 43: Teachers per institution
47
Some important ratios for quality assessment
The number of students per teacher and students per institution has increased over the period 2018-2018. In 2008, there were 21 students per teacher in the public universities, whereas in 2018 the number increased to 49. The number of students per teacher has increased for public universities but decreased for private universities. There were 46 students per teacher in 2008 in the private universities and this number has declined to 23 in 2018. The number of teachers per institution has increased from 245 in 2008 to 345 in 2018.
Figure 42: Students per teacher
Figure 43: Teachers per institution
Data source: BANBEIS
Tertiary colleges: public and private
Although the total number of tertiary colleges increased during this period, the number of degree colleges plummeted during this period. The number decreased from 1212 in 2008 to 1126 in 2017. This is perhaps linked to the National Education Policy 2010 (NEP, 2010). NEP 2010 states that "4-year Honours course will be introduced in the colleges gradually instead of the existing 3-year degree courses." So some of the existing degree colleges may have converted into Honors colleges; the number of Honours colleges increased more than threefold during this period. NEP 2010 also suggests to increase the number of master's degree providing colleges. The number of master's degree providing colleges increased from 100 to 168 during this period.
Figure 44: Number of tertiary colleges
Figure 45: Number of tertiary college students (thousands)
Data source: BANBEIS
01020304050607080
2008 2009 2011 2012 2013 2014 2015 2016 2017 2018
Public Private
0
100
200
300
400
500
600
2008 2009 2011 2012 2013 2014 2015 2016 2017 2018
Public Private
0
500
1000
1500
2000
2008 2009 2010 2011 2012 2013 2014 2015 2016 2017
Degree Bachelor Masters
0
2000
4000
2008 2009 2010 2011 2012 2013 2014 2015 2016 2017
Degree Bachelor Masters
Data source: BANBEIS
Despite the decrease in number of degree colleges, the number of students increased from 75 thousands to 964 thousands during the period 2008-2017. The number of students in the Honors colleges increased fourfold during this period.
The number of students per teacher has increased in degree and master’s level tertiary colleges. However in the case of Honors level colleges this figure has remained the same. The largest increase occurred in the master’s level colleges; the number increased from 79 to 96 over these years.
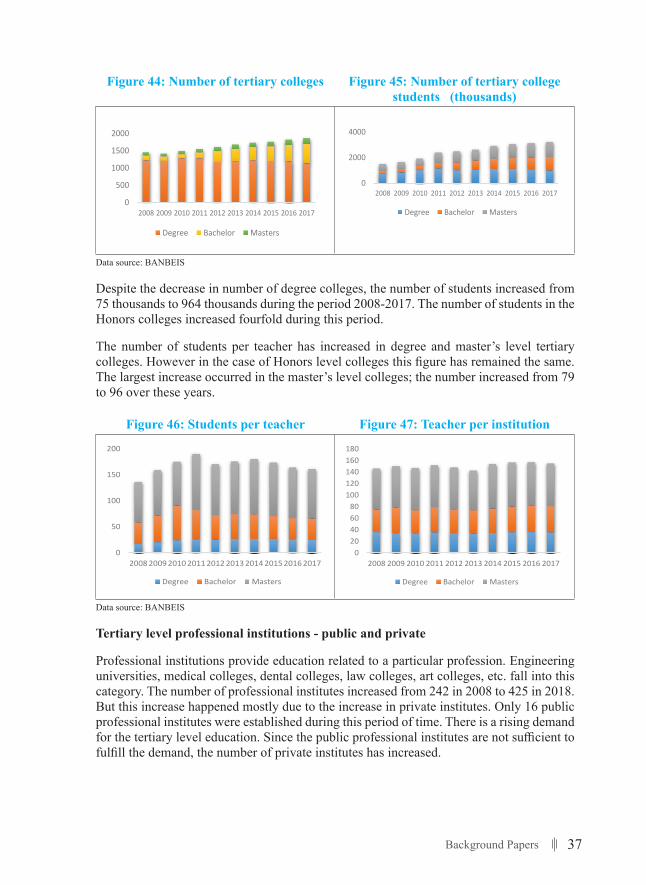
37Background Papers
Figure 44: Number of tertiary colleges Figure 45: Number of tertiary college students (thousands)
47
Some important ratios for quality assessment
The number of students per teacher and students per institution has increased over the period 2018-2018. In 2008, there were 21 students per teacher in the public universities, whereas in 2018 the number increased to 49. The number of students per teacher has increased for public universities but decreased for private universities. There were 46 students per teacher in 2008 in the private universities and this number has declined to 23 in 2018. The number of teachers per institution has increased from 245 in 2008 to 345 in 2018.
Figure 42: Students per teacher
Figure 43: Teachers per institution
Data source: BANBEIS
Tertiary colleges: public and private
Although the total number of tertiary colleges increased during this period, the number of degree colleges plummeted during this period. The number decreased from 1212 in 2008 to 1126 in 2017. This is perhaps linked to the National Education Policy 2010 (NEP, 2010). NEP 2010 states that "4-year Honours course will be introduced in the colleges gradually instead of the existing 3-year degree courses." So some of the existing degree colleges may have converted into Honors colleges; the number of Honours colleges increased more than threefold during this period. NEP 2010 also suggests to increase the number of master's degree providing colleges. The number of master's degree providing colleges increased from 100 to 168 during this period.
Figure 44: Number of tertiary colleges
Figure 45: Number of tertiary college students (thousands)
Data source: BANBEIS
01020304050607080
2008 2009 2011 2012 2013 2014 2015 2016 2017 2018
Public Private
0
100
200
300
400
500
600
2008 2009 2011 2012 2013 2014 2015 2016 2017 2018
Public Private
0
500
1000
1500
2000
2008 2009 2010 2011 2012 2013 2014 2015 2016 2017
Degree Bachelor Masters
0
2000
4000
2008 2009 2010 2011 2012 2013 2014 2015 2016 2017
Degree Bachelor Masters
Data source: BANBEIS
Despite the decrease in number of degree colleges, the number of students increased from 75 thousands to 964 thousands during the period 2008-2017. The number of students in the Honors colleges increased fourfold during this period.
The number of students per teacher has increased in degree and master’s level tertiary colleges. However in the case of Honors level colleges this figure has remained the same. The largest increase occurred in the master’s level colleges; the number increased from 79 to 96 over these years.
Figure 46: Students per teacher Figure 47: Teacher per institution
48
Despite the decrease in number of degree colleges, the number of students increased from 75 thousands to 964 thousands during the period 2008-2017. The number of students in the Honors colleges increased fourfold during this period.
The number of students per teacher has increased in degree and master's level tertiary colleges. However in the case of Honors level colleges this figure has remained the same. The largest increase occurred in the master's level colleges; the number increased from 79 to 96 over these years.
Figure 46: Students per teacher
Figure 47: Teacher per institution
Data source: BANBEIS
Tertiary level professional institutions - public and private
Professional institutions provide education related to a particular profession. Engineering universities, medical colleges, dental colleges, law colleges, art colleges, etc. fall into this category. The number of professional institutes increased from 242 in 2008 to 425 in 2018. But this increase happened mostly due to the increase in private institutes. Only 16 public professional institutes were established during this period of time. There is a rising demand for the tertiary level education. Since the public professional institutes are not sufficient to fulfill the demand, the number of private institutes has increased.
Figure 48: Number of professional institutes
Figure 49: Number of students of per teacher
Data source: BANBEIS
0
50
100
150
200
2008 2009 2010 2011 2012 2013 2014 2015 2016 2017
Degree Bachelor Masters
020406080
100120140160180
2008 2009 2010 2011 2012 2013 2014 2015 2016 2017
Degree Bachelor Masters
0
200
400
600
800
1000
2008 2009 2010 2011 2012 2013 2014 2015 2016 2017 2018
Public Private
0102030405060
2008 2009 2010 2011 2012 2013 2014 2015 2016 2017 2018
Public Private
Data source: BANBEIS
Tertiary level professional institutions - public and private
Professional institutions provide education related to a particular profession. Engineering universities, medical colleges, dental colleges, law colleges, art colleges, etc. fall into this category. The number of professional institutes increased from 242 in 2008 to 425 in 2018. But this increase happened mostly due to the increase in private institutes. Only 16 public professional institutes were established during this period of time. There is a rising demand for the tertiary level education. Since the public professional institutes are not sufficient to fulfill the demand, the number of private institutes has increased.
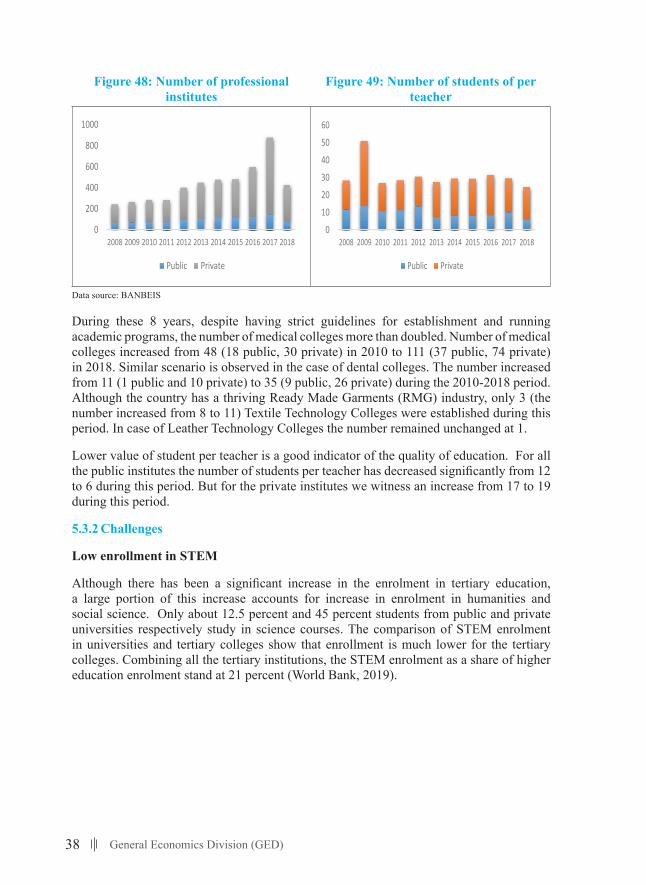
38 General Economics Division (GED)
Figure 48: Number of professional institutes
Figure 49: Number of students of per teacher
48
Despite the decrease in number of degree colleges, the number of students increased from 75 thousands to 964 thousands during the period 2008-2017. The number of students in the Honors colleges increased fourfold during this period.
The number of students per teacher has increased in degree and master's level tertiary colleges. However in the case of Honors level colleges this figure has remained the same. The largest increase occurred in the master's level colleges; the number increased from 79 to 96 over these years.
Figure 46: Students per teacher
Figure 47: Teacher per institution
Data source: BANBEIS
Tertiary level professional institutions - public and private
Professional institutions provide education related to a particular profession. Engineering universities, medical colleges, dental colleges, law colleges, art colleges, etc. fall into this category. The number of professional institutes increased from 242 in 2008 to 425 in 2018. But this increase happened mostly due to the increase in private institutes. Only 16 public professional institutes were established during this period of time. There is a rising demand for the tertiary level education. Since the public professional institutes are not sufficient to fulfill the demand, the number of private institutes has increased.
Figure 48: Number of professional institutes
Figure 49: Number of students of per teacher
Data source: BANBEIS
0
50
100
150
200
2008 2009 2010 2011 2012 2013 2014 2015 2016 2017
Degree Bachelor Masters
020406080
100120140160180
2008 2009 2010 2011 2012 2013 2014 2015 2016 2017
Degree Bachelor Masters
0
200
400
600
800
1000
2008 2009 2010 2011 2012 2013 2014 2015 2016 2017 2018
Public Private
0102030405060
2008 2009 2010 2011 2012 2013 2014 2015 2016 2017 2018
Public Private
Data source: BANBEIS
During these 8 years, despite having strict guidelines for establishment and running academic programs, the number of medical colleges more than doubled. Number of medical colleges increased from 48 (18 public, 30 private) in 2010 to 111 (37 public, 74 private) in 2018. Similar scenario is observed in the case of dental colleges. The number increased from 11 (1 public and 10 private) to 35 (9 public, 26 private) during the 2010-2018 period. Although the country has a thriving Ready Made Garments (RMG) industry, only 3 (the number increased from 8 to 11) Textile Technology Colleges were established during this period. In case of Leather Technology Colleges the number remained unchanged at 1.
Lower value of student per teacher is a good indicator of the quality of education. For all the public institutes the number of students per teacher has decreased significantly from 12 to 6 during this period. But for the private institutes we witness an increase from 17 to 19 during this period.
5.3.2 Challenges
Low enrollment in STEM
Although there has been a significant increase in the enrolment in tertiary education, a large portion of this increase accounts for increase in enrolment in humanities and social science. Only about 12.5 percent and 45 percent students from public and private universities respectively study in science courses. The comparison of STEM enrolment in universities and tertiary colleges show that enrollment is much lower for the tertiary colleges. Combining all the tertiary institutions, the STEM enrolment as a share of higher education enrolment stand at 21 percent (World Bank, 2019).
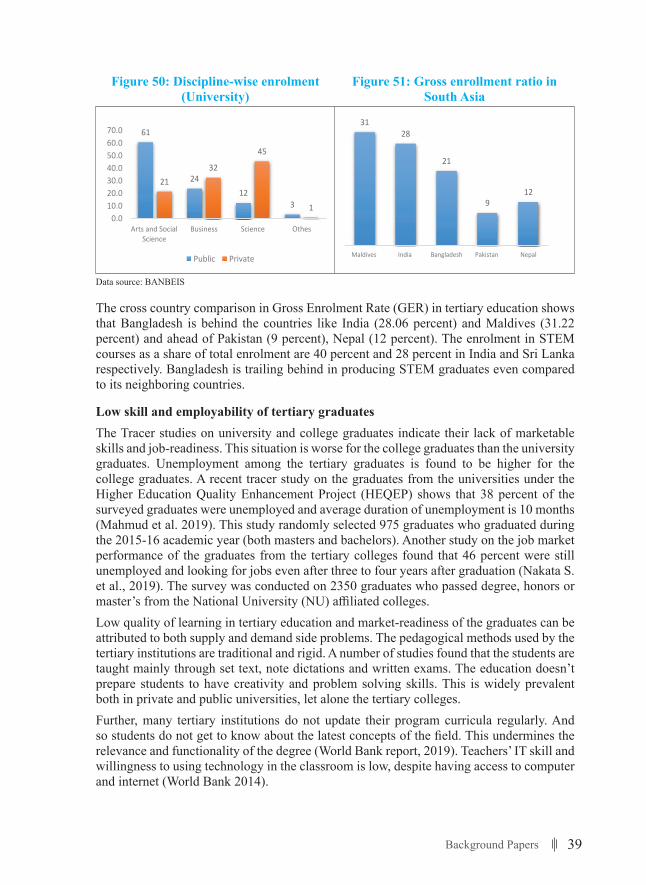
39Background Papers
Figure 50: Discipline-wise enrolment (University)
Figure 51: Gross enrollment ratio in South Asia
49
During these 8 years, despite having strict guidelines for establishment and running academic programs, the number of medical colleges more than doubled. Number of medical colleges increased from 48 (18 public, 30 private) in 2010 to 111 (37 public, 74 private) in 2018. Similar scenario is observed in the case of dental colleges. The number increased from 11 (1 public and 10 private) to 35 (9 public, 26 private) during the 2010-2018 period. Although the country has a thriving Ready Made Garments (RMG) industry, only 3 (the number increased from 8 to 11) Textile Technology Colleges were established during this period. In case of Leather Technology Colleges the number remained unchanged at 1.
Lower value of student per teacher is a good indicator of the quality of education. For all the public institutes the number of students per teacher has decreased significantly from 12 to 6 during this period. But for the private institutes we witness an increase from 17 to 19 during this period.
5.3.2 Challenges
Low enrollment in STEM
Although there has been a significant increase in the enrolment in tertiary education, a large portion of this increase accounts for increase in enrolment in humanities and social science. Only about 12.5 percent and 45 percent students from public and private universities respectively study in science courses. The comparison of STEM enrolment in universities and tertiary colleges show that enrollment is much lower for the tertiary colleges. Combining all the tertiary institutions, the STEM enrolment as a share of higher education enrolment stand at 21 percent (World Bank, 2019).
Figure 50: Discipline-wise enrolment (University)
Figure 51: Gross enrollment ratio in South Asia
Data source: BANBEIS Data source: UNESCO
The cross country comparison in Gross Enrolment Rate (GER) in tertiary education shows that Bangladesh is behind the countries like India (28.06 percent) and Maldives (31.22 percent) and ahead of Pakistan (9 percent), Nepal (12 percent). The enrolment in STEM courses as a share of total enrolment are 40 percent and 28 percent in India and Sri Lanka respectively. Bangladesh is trailing behind in producing STEM graduates even compared to its neighboring countries.
61
2412
3
2132
45
10.0
10.020.030.040.050.060.070.0
Arts and SocialScience
Business Science Othes
Public Private
3128
21
912
0
5
10
15
20
25
30
35
Maldives India Bangladesh Pakistan Nepal
Data source: BANBEIS
The cross country comparison in Gross Enrolment Rate (GER) in tertiary education shows that Bangladesh is behind the countries like India (28.06 percent) and Maldives (31.22 percent) and ahead of Pakistan (9 percent), Nepal (12 percent). The enrolment in STEM courses as a share of total enrolment are 40 percent and 28 percent in India and Sri Lanka respectively. Bangladesh is trailing behind in producing STEM graduates even compared to its neighboring countries.
Low skill and employability of tertiary graduates The Tracer studies on university and college graduates indicate their lack of marketable skills and job-readiness. This situation is worse for the college graduates than the university graduates. Unemployment among the tertiary graduates is found to be higher for the college graduates. A recent tracer study on the graduates from the universities under the Higher Education Quality Enhancement Project (HEQEP) shows that 38 percent of the surveyed graduates were unemployed and average duration of unemployment is 10 months (Mahmud et al. 2019). This study randomly selected 975 graduates who graduated during the 2015-16 academic year (both masters and bachelors). Another study on the job market performance of the graduates from the tertiary colleges found that 46 percent were still unemployed and looking for jobs even after three to four years after graduation (Nakata S. et al., 2019). The survey was conducted on 2350 graduates who passed degree, honors or master’s from the National University (NU) affiliated colleges.Low quality of learning in tertiary education and market-readiness of the graduates can be attributed to both supply and demand side problems. The pedagogical methods used by the tertiary institutions are traditional and rigid. A number of studies found that the students are taught mainly through set text, note dictations and written exams. The education doesn’t prepare students to have creativity and problem solving skills. This is widely prevalent both in private and public universities, let alone the tertiary colleges.Further, many tertiary institutions do not update their program curricula regularly. And so students do not get to know about the latest concepts of the field. This undermines the relevance and functionality of the degree (World Bank report, 2019). Teachers’ IT skill and willingness to using technology in the classroom is low, despite having access to computer and internet (World Bank 2014).
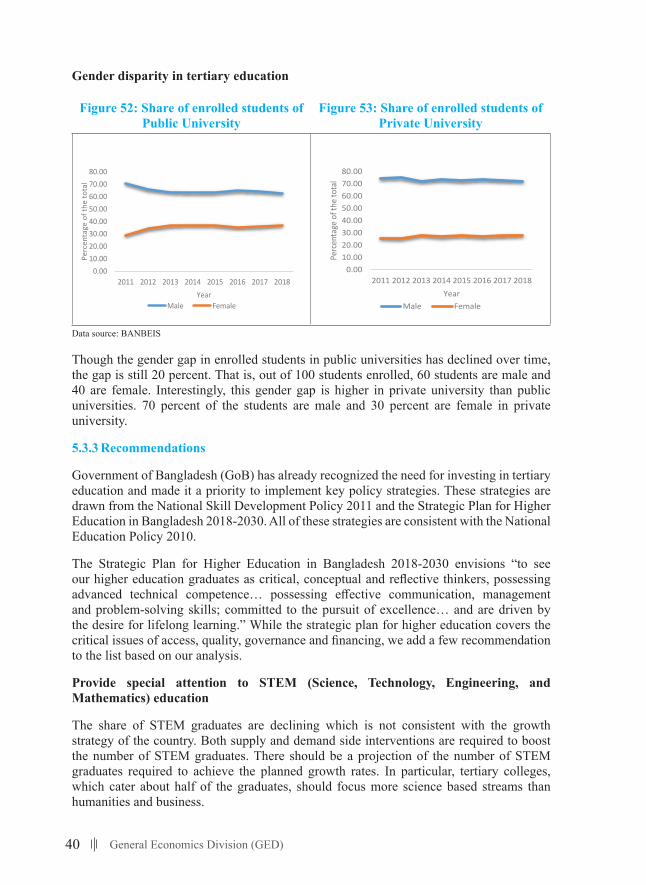
40 General Economics Division (GED)
Gender disparity in tertiary education
Figure 52: Share of enrolled students of Public University
Figure 53: Share of enrolled students of Private University
50
Low skill and employability of tertiary graduates
The Tracer studies on university and college graduates indicate their lack of marketable skills and job-readiness. This situation is worse for the college graduates than the university graduates. Unemployment among the tertiary graduates is found to be higher for the college graduates. A recent tracer study on the graduates from the universities under the Higher Education Quality Enhancement Project (HEQEP) shows that 38 percent of the surveyed graduates were unemployed and average duration of unemployment is 10 months (Mahmud et al. 2019). This study randomly selected 975 graduates who graduated during the 2015-16 academic year (both masters and bachelors). Another study on the job market performance of the graduates from the tertiary colleges found that 46 percent were still unemployed and looking for jobs even after three to four years after graduation (Nakata S. et al., 2019). The survey was conducted on 2350 graduates who passed degree, honors or master's from the National University (NU) affiliated colleges.
Low quality of learning in tertiary education and market-readiness of the graduates can be attributed to both supply and demand side problems. The pedagogical methods used by the tertiary institutions are traditional and rigid. A number of studies found that the students are taught mainly through set text, note dictations and written exams. The education doesn't prepare students to have creativity and problem solving skills. This is widely prevalent both in private and public universities, let alone the tertiary colleges.
Further, many tertiary institutions do not update their program curricula regularly. And so students do not get to know about the latest concepts of the field. This undermines the relevance and functionality of the degree (World Bank report, 2019). Teachers' IT skill and willingness to using technology in the classroom is low, despite having access to computer and internet (World Bank 2014).
Gender disparity in tertiary education
Figure 52: Share of enrolled students of Public University Figure 53: Share of enrolled students of Private University
Data source: BANBEIS
Though the gender gap in enrolled students in public universities has declined over time, the gap is still 20 percent. That is, out of 100 students enrolled, 60 students are male and 40 are female. Interestingly,
0.0010.0020.0030.0040.0050.0060.0070.0080.00
2011 2012 2013 2014 2015 2016 2017 2018
Perc
enta
ge o
f the
tota
l
YearMale Female
0.0010.0020.0030.0040.0050.0060.0070.0080.00
2011 2012 2013 2014 2015 2016 2017 2018
Perc
enta
ge o
f the
tota
l
YearMale Female
Data source: BANBEIS
Though the gender gap in enrolled students in public universities has declined over time, the gap is still 20 percent. That is, out of 100 students enrolled, 60 students are male and 40 are female. Interestingly, this gender gap is higher in private university than public universities. 70 percent of the students are male and 30 percent are female in private university.
5.3.3 Recommendations
Government of Bangladesh (GoB) has already recognized the need for investing in tertiary education and made it a priority to implement key policy strategies. These strategies are drawn from the National Skill Development Policy 2011 and the Strategic Plan for Higher Education in Bangladesh 2018-2030. All of these strategies are consistent with the National Education Policy 2010.
The Strategic Plan for Higher Education in Bangladesh 2018-2030 envisions “to see our higher education graduates as critical, conceptual and reflective thinkers, possessing advanced technical competence… possessing effective communication, management and problem-solving skills; committed to the pursuit of excellence… and are driven by the desire for lifelong learning.” While the strategic plan for higher education covers the critical issues of access, quality, governance and financing, we add a few recommendation to the list based on our analysis.
Provide special attention to STEM (Science, Technology, Engineering, and Mathematics) education
The share of STEM graduates are declining which is not consistent with the growth strategy of the country. Both supply and demand side interventions are required to boost the number of STEM graduates. There should be a projection of the number of STEM graduates required to achieve the planned growth rates. In particular, tertiary colleges, which cater about half of the graduates, should focus more science based streams than humanities and business.
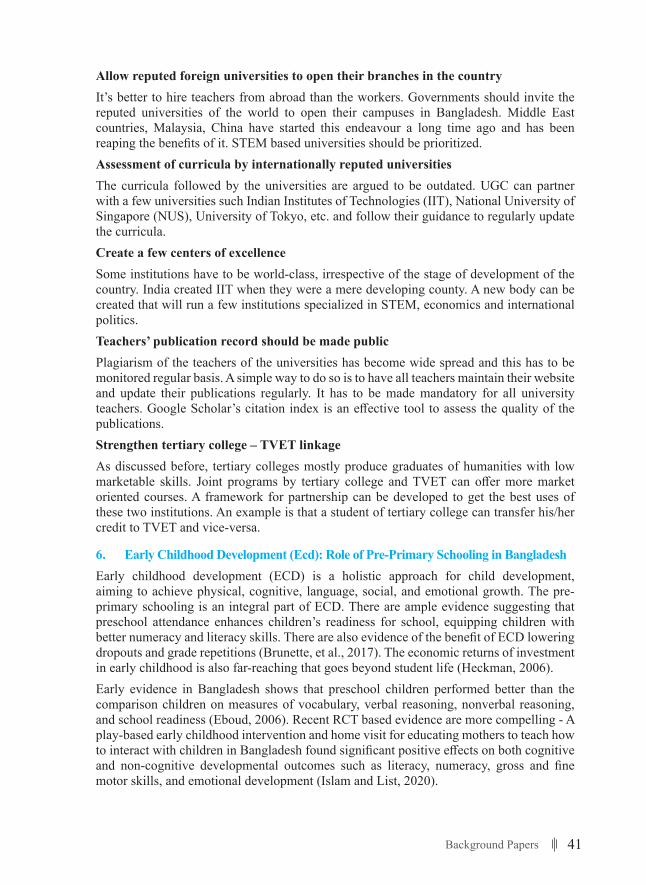
41Background Papers
Allow reputed foreign universities to open their branches in the country It’s better to hire teachers from abroad than the workers. Governments should invite the reputed universities of the world to open their campuses in Bangladesh. Middle East countries, Malaysia, China have started this endeavour a long time ago and has been reaping the benefits of it. STEM based universities should be prioritized. Assessment of curricula by internationally reputed universities The curricula followed by the universities are argued to be outdated. UGC can partner with a few universities such Indian Institutes of Technologies (IIT), National University of Singapore (NUS), University of Tokyo, etc. and follow their guidance to regularly update the curricula.Create a few centers of excellence Some institutions have to be world-class, irrespective of the stage of development of the country. India created IIT when they were a mere developing county. A new body can be created that will run a few institutions specialized in STEM, economics and international politics. Teachers’ publication record should be made public Plagiarism of the teachers of the universities has become wide spread and this has to be monitored regular basis. A simple way to do so is to have all teachers maintain their website and update their publications regularly. It has to be made mandatory for all university teachers. Google Scholar’s citation index is an effective tool to assess the quality of the publications.Strengthen tertiary college – TVET linkageAs discussed before, tertiary colleges mostly produce graduates of humanities with low marketable skills. Joint programs by tertiary college and TVET can offer more market oriented courses. A framework for partnership can be developed to get the best uses of these two institutions. An example is that a student of tertiary college can transfer his/her credit to TVET and vice-versa.
6. Early Childhood Development (Ecd): Role of Pre-Primary Schooling in BangladeshEarly childhood development (ECD) is a holistic approach for child development, aiming to achieve physical, cognitive, language, social, and emotional growth. The pre-primary schooling is an integral part of ECD. There are ample evidence suggesting that preschool attendance enhances children’s readiness for school, equipping children with better numeracy and literacy skills. There are also evidence of the benefit of ECD lowering dropouts and grade repetitions (Brunette, et al., 2017). The economic returns of investment in early childhood is also far-reaching that goes beyond student life (Heckman, 2006). Early evidence in Bangladesh shows that preschool children performed better than the comparison children on measures of vocabulary, verbal reasoning, nonverbal reasoning, and school readiness (Eboud, 2006). Recent RCT based evidence are more compelling - A play-based early childhood intervention and home visit for educating mothers to teach how to interact with children in Bangladesh found significant positive effects on both cognitive and non-cognitive developmental outcomes such as literacy, numeracy, gross and fine motor skills, and emotional development (Islam and List, 2020).
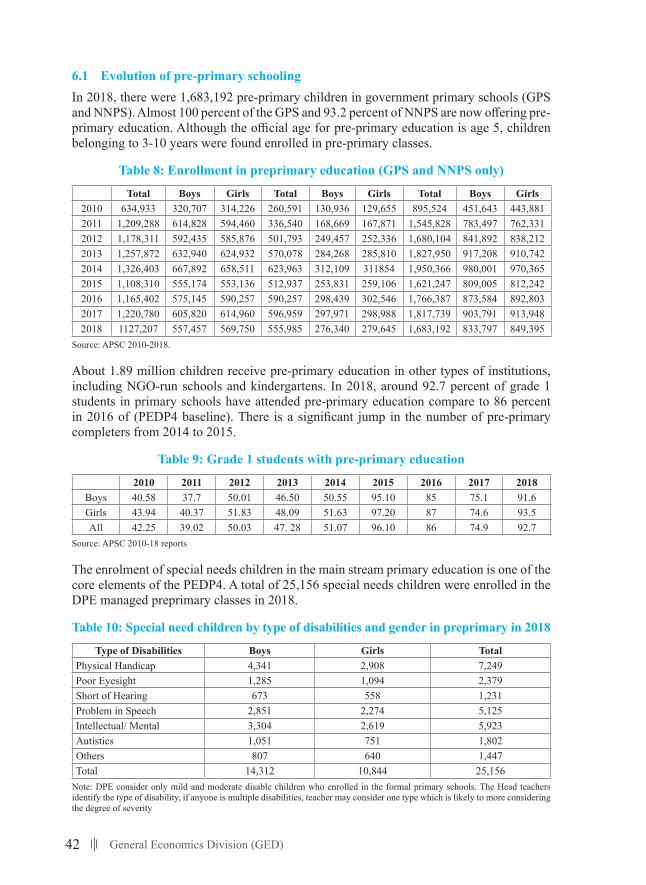
42 General Economics Division (GED)
6.1 Evolution of pre-primary schoolingIn 2018, there were 1,683,192 pre-primary children in government primary schools (GPS and NNPS). Almost 100 percent of the GPS and 93.2 percent of NNPS are now offering pre-primary education. Although the official age for pre-primary education is age 5, children belonging to 3-10 years were found enrolled in pre-primary classes.
Table 8: Enrollment in preprimary education (GPS and NNPS only)
Total Boys Girls Total Boys Girls Total Boys Girls2010 634,933 320,707 314,226 260,591 130,936 129,655 895,524 451,643 443,8812011 1,209,288 614,828 594,460 336,540 168,669 167,871 1,545,828 783,497 762,3312012 1,178,311 592,435 585,876 501,793 249,457 252,336 1,680,104 841,892 838,2122013 1,257,872 632,940 624,932 570,078 284,268 285,810 1,827,950 917,208 910,7422014 1,326,403 667,892 658,511 623,963 312,109 311854 1,950,366 980,001 970,3652015 1,108,310 555,174 553,136 512,937 253,831 259,106 1,621,247 809,005 812,2422016 1,165,402 575,145 590,257 590,257 298,439 302,546 1,766,387 873,584 892,8032017 1,220,780 605,820 614,960 596,959 297,971 298,988 1,817,739 903,791 913,9482018 1127,207 557,457 569,750 555,985 276,340 279,645 1,683,192 833,797 849,395
Source: APSC 2010-2018.
About 1.89 million children receive pre-primary education in other types of institutions, including NGO-run schools and kindergartens. In 2018, around 92.7 percent of grade 1 students in primary schools have attended pre-primary education compare to 86 percent in 2016 of (PEDP4 baseline). There is a significant jump in the number of pre-primary completers from 2014 to 2015.
Table 9: Grade 1 students with pre-primary education
2010 2011 2012 2013 2014 2015 2016 2017 2018Boys 40.58 37.7 50.01 46.50 50.55 95.10 85 75.1 91.6Girls 43.94 40.37 51.83 48.09 51.63 97.20 87 74.6 93.5All 42.25 39.02 50.03 47. 28 51.07 96.10 86 74.9 92.7
Source: APSC 2010-18 reports
The enrolment of special needs children in the main stream primary education is one of the core elements of the PEDP4. A total of 25,156 special needs children were enrolled in the DPE managed preprimary classes in 2018.
Table 10: Special need children by type of disabilities and gender in preprimary in 2018
Type of Disabilities Boys Girls TotalPhysical Handicap 4,341 2,908 7,249Poor Eyesight 1,285 1,094 2,379Short of Hearing 673 558 1,231Problem in Speech 2,851 2,274 5,125Intellectual/ Mental 3,304 2,619 5,923Autistics 1,051 751 1,802Others 807 640 1,447Total 14,312 10,844 25,156
Note: DPE consider only mild and moderate disable children who enrolled in the formal primary schools. The Head teachers identify the type of disability, if anyone is multiple disabilities, teacher may consider one type which is likely to more considering the degree of severity
43Background Papers
6.2 Challenges and recommendations The preprimary schooling is yet to be matured in Bangladesh. The National Pre-primary Operational Framework is being followed in public projects such as PEDP-4. This framework includes a plan for two years of pre-primary education. After completing one year of pre-primary education in all primary schools, the plan is to expand gradually into a two-year program. While the recommendations and targets in PEDP-4 are very comprehensive, we suggest a few for the 8th FYP based on recent empirical evidence.TargetingfirstgenerationlearnersInvestment in pre-schooling can be seen as an effective tool of the government to address the inequality in the society. The low cost intervention can target children, especially first-generation learners and help them catch up with others. Therefore, the expansion of preprimary schooling should also be grounded on equity principles, among others.Special training for the teachersIt is now well established that teaching in preprimary is not just teaching primary level with lower level of difficulties. The teachers require special trainings for the preprimary pedagogy which includes understanding of child psychology. Supporting parents Since children’s education starts at home and parents are the first teacher, it is essential to support parents particularly mothers to encourage play-based learning at home. Hence public intervention is required to educate the parents on what they can do at home and how they can interact with children.Designing a play-based curriculumLearning has to be fun and the children should only be taught through play-based curricula. Therefore, carefully designed play-based curriculum is central to the effectiveness of the preprimary education, as advocated by RCT based studies.Teaching moral education It is argued that the pre-primary level is the right time to discuss the issues of honesty, equity, justice, indiscrimination, and other pro-social behaviour through stories, drama and debate.
7. TVET: Rethinking Its Role
Bangladesh has a youth population of 41.63 million (BBS, 2017). Among various age groups of the labor force unemployment among the youth is the highest. The youth unemployment rate is 10.6% and the share of unemployed youth in total unemployment is 79.6% (QLFS 2016/17, BBS). Lack of proper skill and competency is one of the many reasons of this problem. Development of skill of the youth population largely depends on the effectiveness of TVET institutions to reach and offer quality education and training.
The perspective plan (2010-2021) and the 7th Five Year Plan emphasizes the role of expansion and modernization of TVET for building a skilled workforce. The 3rd sub-goal under Sustainable Development Goal (SDG) 4 is about ensuring equal access for all women and men to affordable and quality technical, vocational and tertiary education, including university.
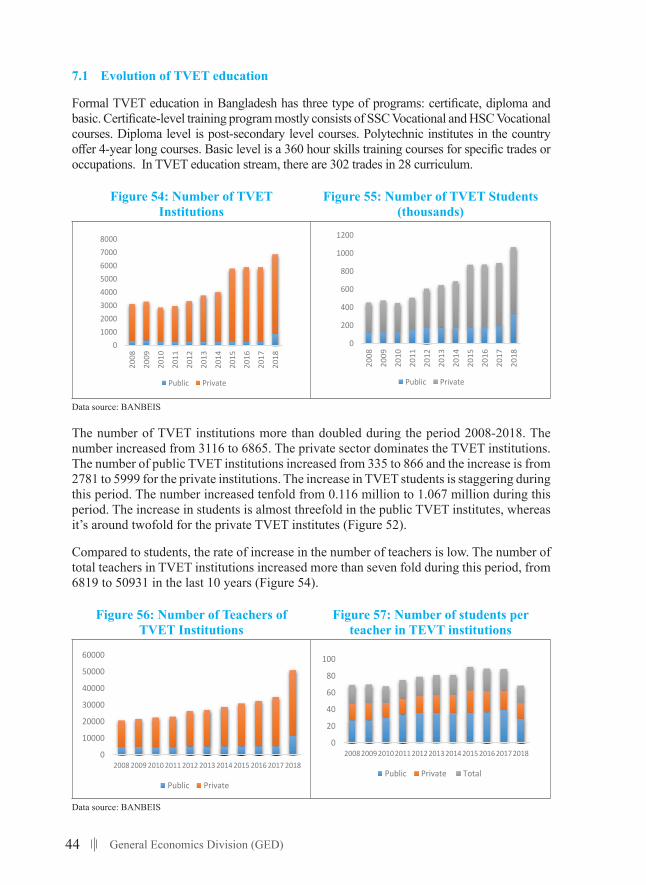
44 General Economics Division (GED)
7.1 Evolution of TVET education
Formal TVET education in Bangladesh has three type of programs: certificate, diploma and basic. Certificate-level training program mostly consists of SSC Vocational and HSC Vocational courses. Diploma level is post-secondary level courses. Polytechnic institutes in the country offer 4-year long courses. Basic level is a 360 hour skills training courses for specific trades or occupations. In TVET education stream, there are 302 trades in 28 curriculum.
Figure 54: Number of TVET Institutions
Figure 55: Number of TVET Students (thousands)
56
7. TVET: RETHINKING ITS ROLE Bangladesh has a youth population of 41.63 million (BBS, 2017). Among various age groups of the labor force unemployment among the youth is the highest. The youth unemployment rate is 10.6% and the share of unemployed youth in total unemployment is 79.6% (QLFS 2016/17, BBS). Lack of proper skill and competency is one of the many reasons of this problem. Development of skill of the youth population largely depends on the effectiveness of TVET institutions to reach and offer quality education and training.
The perspective plan (2010-2021) and the 7th Five Year Plan emphasizes the role of expansion and modernization of TVET for building a skilled workforce. The 3rd sub-goal under Sustainable Development Goal (SDG) 4 is about ensuring equal access for all women and men to affordable and quality technical, vocational and tertiary education, including university.
7.1 Evolution of TVET education
Formal TVET education in Bangladesh has three type of programs: certificate, diploma and basic. Certificate-level training program mostly consists of SSC Vocational and HSC Vocational courses. Diploma level is post-secondary level courses. Polytechnic institutes in the country offer 4-year long courses. Basic level is a 360 hour skills training courses for specific trades or occupations. In TVET education stream, there are 302 trades in 28 curriculum.
Figure 54: Number of TVET Institutions
Figure 55: Number of TVET Students (thousands)
Data source: BANBEIS
The number of TVET institutions more than doubled during the period 2008-2018. The number increased from 3116 to 6865. The private sector dominates the TVET institutions. The number of public TVET institutions increased from 335 to 866 and the increase is from 2781 to 5999 for the private institutions. The increase in TVET students is staggering during this period. The number increased tenfold from 0.116 million to 1.067 million during this period. The increase in students is almost threefold in the public TVET institutes, whereas it's around twofold for the private TVET institutes (Figure 52).
010002000300040005000600070008000
2008
2009
2010
2011
2012
2013
2014
2015
2016
2017
2018
Public Private
0
200
400
600
800
1000
1200
2008
2009
2010
2011
2012
2013
2014
2015
2016
2017
2018
Public Private
Data source: BANBEIS
The number of TVET institutions more than doubled during the period 2008-2018. The number increased from 3116 to 6865. The private sector dominates the TVET institutions. The number of public TVET institutions increased from 335 to 866 and the increase is from 2781 to 5999 for the private institutions. The increase in TVET students is staggering during this period. The number increased tenfold from 0.116 million to 1.067 million during this period. The increase in students is almost threefold in the public TVET institutes, whereas it’s around twofold for the private TVET institutes (Figure 52).
Compared to students, the rate of increase in the number of teachers is low. The number of total teachers in TVET institutions increased more than seven fold during this period, from 6819 to 50931 in the last 10 years (Figure 54).
Figure 56: Number of Teachers of TVET Institutions
Figure 57: Number of students per teacher in TEVT institutions
57
Compared to students, the rate of increase in the number of teachers is low. The number of total teachers in TVET institutions increased more than seven fold during this period, from 6819 to 50931 in the last 10 years (Figure 54).
Figure 56: Number of Teachers of TVET Institutions
Figure 57: Number of students per teacher in TEVT institutions
Data source: BANBEIS
There are two types of TVET institutions based on attachment to other educational institutions. The ones having attachment to other main stream educational institutions are called attached TVET institutions and the ones which do not have any attachment of such kind are called Independent TVET institutions. During the period 2010-2017, the number of independent TVET institutions almost doubled - increased from 1194 to 2248, whereas the number of attached institutions increased from 2096 to 3649.
NEP-2010 was very specific on the students per teachers in TVET. It states, “In the vocational and technical educational institutions, teacher-student ratio will be 1: 12”. The TVET institutions are far from achieving this goal. During the 10 year period we observe a slight decrease from 22 to 21 in the number of students per teachers. Surprisingly the number increased from 27 to 29 during this period for the public TVET institutions. During the period students per institutions have increased from 145 to 155 whereas teacher per institutions has remained unchanged at 7.
Figure 58: Number of TVET Institutions (SSC and HSC level
Figure 59: Students of TVET Institutions (SSC and HSC level)
Data source: BANBEIS
0
10000
20000
30000
40000
50000
60000
2008 2009 2010 2011 2012 2013 2014 2015 2016 2017 2018
Public Private
0
20
40
60
80
100
20082009201020112012201320142015201620172018
Public Private Total
0
2000
4000
6000
2009 2010 2011 2012 2013 2014 2015 2016 2017 2018
HSC voc SSC voc
0
200
400
600
800
2009 2010 2011 2012 2013 2014 2015 2016 2017 2018
HSC voc SSC voc
Data source: BANBEIS
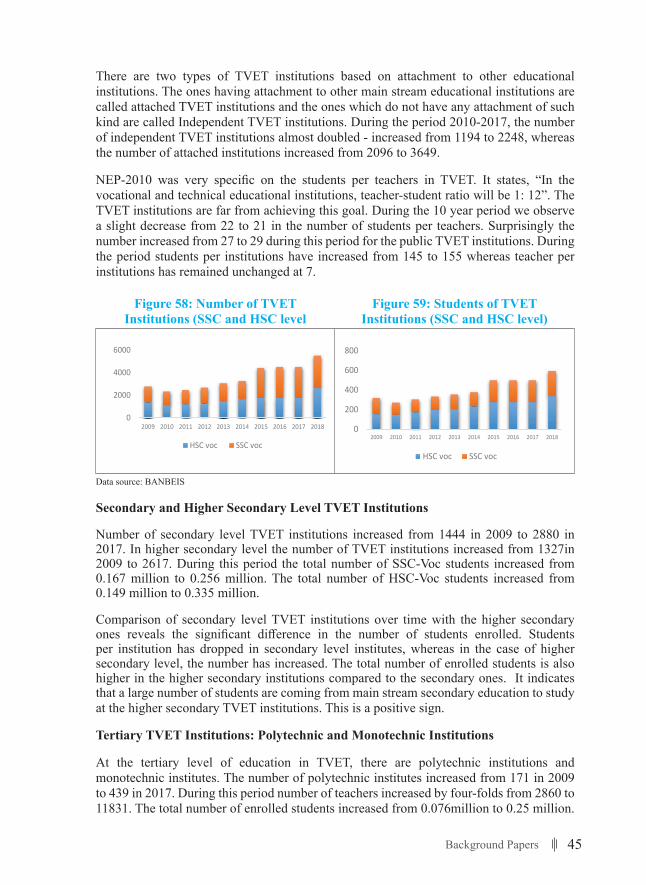
45Background Papers
There are two types of TVET institutions based on attachment to other educational institutions. The ones having attachment to other main stream educational institutions are called attached TVET institutions and the ones which do not have any attachment of such kind are called Independent TVET institutions. During the period 2010-2017, the number of independent TVET institutions almost doubled - increased from 1194 to 2248, whereas the number of attached institutions increased from 2096 to 3649.
NEP-2010 was very specific on the students per teachers in TVET. It states, “In the vocational and technical educational institutions, teacher-student ratio will be 1: 12”. The TVET institutions are far from achieving this goal. During the 10 year period we observe a slight decrease from 22 to 21 in the number of students per teachers. Surprisingly the number increased from 27 to 29 during this period for the public TVET institutions. During the period students per institutions have increased from 145 to 155 whereas teacher per institutions has remained unchanged at 7.
Figure 58: Number of TVET Institutions (SSC and HSC level
Figure 59: Students of TVET Institutions (SSC and HSC level)
57
Compared to students, the rate of increase in the number of teachers is low. The number of total teachers in TVET institutions increased more than seven fold during this period, from 6819 to 50931 in the last 10 years (Figure 54).
Figure 56: Number of Teachers of TVET Institutions
Figure 57: Number of students per teacher in TEVT institutions
Data source: BANBEIS
There are two types of TVET institutions based on attachment to other educational institutions. The ones having attachment to other main stream educational institutions are called attached TVET institutions and the ones which do not have any attachment of such kind are called Independent TVET institutions. During the period 2010-2017, the number of independent TVET institutions almost doubled - increased from 1194 to 2248, whereas the number of attached institutions increased from 2096 to 3649.
NEP-2010 was very specific on the students per teachers in TVET. It states, “In the vocational and technical educational institutions, teacher-student ratio will be 1: 12”. The TVET institutions are far from achieving this goal. During the 10 year period we observe a slight decrease from 22 to 21 in the number of students per teachers. Surprisingly the number increased from 27 to 29 during this period for the public TVET institutions. During the period students per institutions have increased from 145 to 155 whereas teacher per institutions has remained unchanged at 7.
Figure 58: Number of TVET Institutions (SSC and HSC level
Figure 59: Students of TVET Institutions (SSC and HSC level)
Data source: BANBEIS
0
10000
20000
30000
40000
50000
60000
2008 2009 2010 2011 2012 2013 2014 2015 2016 2017 2018
Public Private
0
20
40
60
80
100
20082009201020112012201320142015201620172018
Public Private Total
0
2000
4000
6000
2009 2010 2011 2012 2013 2014 2015 2016 2017 2018
HSC voc SSC voc
0
200
400
600
800
2009 2010 2011 2012 2013 2014 2015 2016 2017 2018
HSC voc SSC voc
Data source: BANBEIS
Secondary and Higher Secondary Level TVET Institutions
Number of secondary level TVET institutions increased from 1444 in 2009 to 2880 in 2017. In higher secondary level the number of TVET institutions increased from 1327in 2009 to 2617. During this period the total number of SSC-Voc students increased from 0.167 million to 0.256 million. The total number of HSC-Voc students increased from 0.149 million to 0.335 million.
Comparison of secondary level TVET institutions over time with the higher secondary ones reveals the significant difference in the number of students enrolled. Students per institution has dropped in secondary level institutes, whereas in the case of higher secondary level, the number has increased. The total number of enrolled students is also higher in the higher secondary institutions compared to the secondary ones. It indicates that a large number of students are coming from main stream secondary education to study at the higher secondary TVET institutions. This is a positive sign.
Tertiary TVET Institutions: Polytechnic and Monotechnic Institutions
At the tertiary level of education in TVET, there are polytechnic institutions and monotechnic institutes. The number of polytechnic institutes increased from 171 in 2009 to 439 in 2017. During this period number of teachers increased by four-folds from 2860 to 11831. The total number of enrolled students increased from 0.076million to 0.25 million.
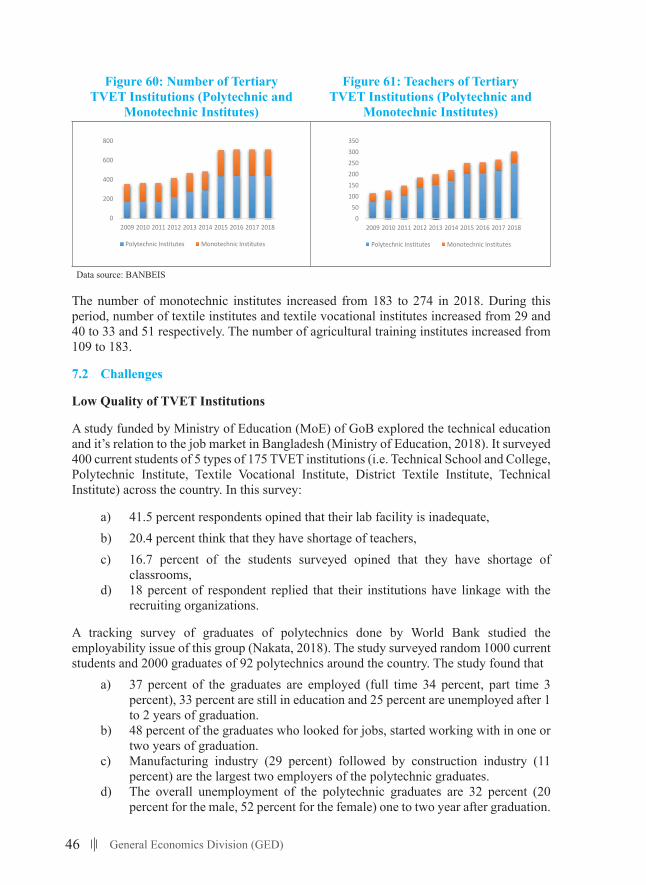
46 General Economics Division (GED)
Figure 60: Number of Tertiary TVET Institutions (Polytechnic and
Monotechnic Institutes)
Figure 61: Teachers of Tertiary TVET Institutions (Polytechnic and
Monotechnic Institutes)
58
Secondary and Higher Secondary Level TVET Institutions
Number of secondary level TVET institutions increased from 1444 in 2009 to 2880 in 2017. In higher secondary level the number of TVET institutions increased from 1327in 2009 to 2617. During this period the total number of SSC-Voc students increased from 0.167 million to 0.256 million. The total number of HSC-Voc students increased from 0.149 million to 0.335 million.
Comparison of secondary level TVET institutions over time with the higher secondary ones reveals the significant difference in the number of students enrolled. Students per institution has dropped in secondary level institutes, whereas in the case of higher secondary level, the number has increased. The total number of enrolled students is also higher in the higher secondary institutions compared to the secondary ones. It indicates that a large number of students are coming from main stream secondary education to study at the higher secondary TVET institutions. This is a positive sign.
Tertiary TVET Institutions: Polytechnic and Monotechnic Institutions
At the tertiary level of education in TVET, there are polytechnic institutions and monotechnic institutes. The number of polytechnic institutes increased from 171 in 2009 to 439 in 2017. During this period number of teachers increased by four-folds from 2860 to 11831. The total number of enrolled students increased from 0.076million to 0.25 million.
Figure 60: Number of Tertiary TVET Institutions (Polytechnic and Monotechnic Institutes)
Figure 61: Teachers of Tertiary TVET Institutions (Polytechnic and Monotechnic Institutes)
Data source: BANBEIS
The number of monotechnic institutes increased from 183 to 274 in 2018. During this period, number of textile institutes and textile vocational institutes increased from 29 and 40 to 33 and 51 respectively. The number of agricultural training institutes increased from 109 to 183.
7.2 Challenges
Low Quality of TVET Institutions
A study funded by Ministry of Education (MoE) of GoB explored the technical education and it's relation to the job market in Bangladesh (Ministry of Education, 2018). It surveyed 400 current students of 5
0
200
400
600
800
2009 2010 2011 2012 2013 2014 2015 2016 2017 2018
Polytechnic Institutes Monotechnic Institutes
050
100150200250300350
2009 2010 2011 2012 2013 2014 2015 2016 2017 2018
Polytechnic Institutes Monotechnic Institutes
Data source: BANBEIS
The number of monotechnic institutes increased from 183 to 274 in 2018. During this period, number of textile institutes and textile vocational institutes increased from 29 and 40 to 33 and 51 respectively. The number of agricultural training institutes increased from 109 to 183.
7.2 Challenges
Low Quality of TVET Institutions
A study funded by Ministry of Education (MoE) of GoB explored the technical education and it’s relation to the job market in Bangladesh (Ministry of Education, 2018). It surveyed 400 current students of 5 types of 175 TVET institutions (i.e. Technical School and College, Polytechnic Institute, Textile Vocational Institute, District Textile Institute, Technical Institute) across the country. In this survey:
a) 41.5 percent respondents opined that their lab facility is inadequate, b) 20.4 percent think that they have shortage of teachers,c) 16.7 percent of the students surveyed opined that they have shortage of
classrooms,d) 18 percent of respondent replied that their institutions have linkage with the
recruiting organizations.
A tracking survey of graduates of polytechnics done by World Bank studied the employability issue of this group (Nakata, 2018). The study surveyed random 1000 current students and 2000 graduates of 92 polytechnics around the country. The study found that
a) 37 percent of the graduates are employed (full time 34 percent, part time 3 percent), 33 percent are still in education and 25 percent are unemployed after 1 to 2 years of graduation.
b) 48 percent of the graduates who looked for jobs, started working with in one or two years of graduation.
c) Manufacturing industry (29 percent) followed by construction industry (11 percent) are the largest two employers of the polytechnic graduates.
d) The overall unemployment of the polytechnic graduates are 32 percent (20 percent for the male, 52 percent for the female) one to two year after graduation.
47Background Papers
The study also finds that opportunities across technologies/trades are not uniform. Since Bangladesh has a thriving apparel manufacturing industry, graduates of textile and garments technology find it easier to get a job after graduation. Graduates of technologies such as electrical, mechanical engineering technology, etc. are also doing better. But graduates of technologies like construction, automobile, and computer do not fare well. Graduates of these technologies are more likely to pursue further education after a few years of job search.
Poor quality of the teacher remains a major concern. The polytechnics lack teachers with higher education - only a quarter of teachers have master’s degree and one third of them only have diploma degree. The situation is worse when industry or practical experience is concerned in the relevant industries. Only 34 percent (26 percent from public, 43 percent from private) of the teachers have work experience in the relevant industries. The opportunities for teacher training are limited – there are only two teachers’ training institute in the country for TVET. As a result, the supply of teachers cannot keep pace with the increase in the number of students, particularly the private TVETs. Evidence suggest that the demand for qualified teachers are very high and the market has failed to supply.
Weak TVET-Industry linkages
Industry experience is a key element in the vocational training. The vocational training remains incomplete without the industry attachment of the TVET students. The last TVET census 2015 shows that only 28 percent of the TVET students had some industry experiences while they were in TVET institutions. Apprenticeship is administered by the Bureau of Manpower Employment and Training (BMET) and there are three Apprenticeship Offices under BMET in Dhaka, Chittagong, and Khulna. However, the institutional structure of these institutions is very weak.
Mismatch between supply and demand
Studies on TVET suggest that TVET institutions are not very responsive to market demand. There is a huge mismatch between the skills supplied by the TVET and skills demanded by market. In general, employers do not participate actively in setting training content and TVET institutions lack the initiative to consult employers in preparing and updating the curricula.
Weak quality assurance
The accreditation process of BTEB is very weak and this results in proliferation of weak TVET institutions. The procedures of accreditation are found to be time consuming, complicated, rigid, and often not followed properly (ADB, 2015).
Organizational weakness
NSDP 2011 pointed out the organizational limitations, “Many of the key challenges facing skills development in Bangladesh derive from the structure and management of the skills development system. Chief among these are limited interagency coordination, poor linkages with industry and the labor market, insufficient capacity in key agencies, piecemeal regulation and quality assurance, and limited planning of delivery and infrastructure development” (Section 20.1). This calls for organizational reforms to better govern the TVET sector.
48 General Economics Division (GED)
7.3 Government’s Initiatives
The National Education policy-2010, National Skills Development Policy 2010, 7th Five year plan, the Perspective Plan (2010- 2021) provide the essential backbone to build the ecosystem of TVET in Bangladesh. The government is also in the process of drafting a new skill development policy. Some of the plans such as including pre-vocational and ICT courses in the primary and junior level have been implemented. Following the NSDP-2011, the system of labeling qualification consists of a) National Technical & Vocational Qualifications Framework (NTVQF), b) Competency Based Industry Sector Standards & Qualifications (CBT & A), and c) Bangladesh Skills Quality Assurance System. A list of recent initiatives by the government for the development of skill of the labor force is given below.
National Skill Development Authority Act (NSDA) 2018
One of the most remarkable initiatives taken by the GoB in the recent years is passing the National Skill Development Authority (NSDA) bill in September, 2018. This bill was approved by the Honorable President and was published as a gazette later that year. Tasks and functions of NSDA include
a) Preparing and updating the National Skill Development Policy (NSDP) and make strategies to implicate this.
b) Forming Industry Skill councils (ISC). There are currently 12 ISCs in Bangladesh.
c) Fixing the key performance indicators (KPI) for the all the training institutes.d) Preparing a uniform training manual.e) Coordinating 23 ministries, 35 departments, nearly 250 NGOs and around
13,163 registered TVET institutions to fulfill its goals.f) Developing a skill data system and collecting skills demand and supply data.g) Forecasting the national and international labor market demand and creating
sector-wise skill data bank.h) Providing recognition of prior learning (RPL) of professionals. i) Monitoring all skill development related projects under the act.j) Developing infrastructure of the TVET institutions to increase participation of
women in TVET in education.k) Upgrading the laboratory and workshops as well as training system of the
trainers. l) Organizing ‘Job Fairs’ and ‘Skill competitions’ on a regular basis.m) Strengthening industry institutes linkage.
Industry Skill Council (ISC)
Industry Skill Councils (ISCs) are playing a pivotal role in strengthening linkages between industry and national training system. By bringing workers, employers and government together ISCs improve the skills development system. There are 12 ISCs in Bangladesh.
49Background Papers
They are: 1. Agro food ISC, 2. Leather and leather goods ISC, 3. ICT ISC, 4. Transport ISC, 5. Readymade garments ISC, 6. Furniture ISC, 7. Ceramics ISC, 8. Pharmaceuticals ISC 9. Informal ISC, 10. Construction ISC, 11. Light engineering ISC 12. Tourism and hospitality ISC. An ISC named creative media ISC is about to be built. Functions of the ISCs are as follows:
a) Introducing skills training institutions to the latest employment and technology trends.
b) Improving social dialogues to encourage public/private/ donor partnerships.c) Increasing the efficacy of the skills data system to strengthen industry’s role in
data collection and ensuring the demand side data is correct.
National Skill Development Council (NSDC)
Currently one of the major players in improving the coordination of skill development across Bangladesh is NSDC. There are a number of challenges in the skill development process due to the structure of the skill development system of the country. The challenges are as follows-
a) Multiple institutions providing the same skills while much needed skilled are provided by no institutions.
b) Due to weak industry-institution linkage, training does not ensure a job.c) Lack of regulation and support is unavailable in many institutions.d) Limited planning of infrastructural development.
To deal with these challenges NSDC is essential. NSDC is working on ensuring the efficacy of the public institutions in using resources and implementing arrangements to facilitate private training providers to access public facilities to enhance the scope of skills training.
In recent years NSDC has achieved some results. They are listed below-a) The NSDC Secretariat is functioning and providing servicesb) A number of dissemination workshops have been conducted around the country.c) A mechanism for collaboratively funding skills development is being piloted.
National Human Resource Development Fund
In 2015-16 budget speech, the Finance Minister proposed to allocate BDT 100 crore for National Human Resource Development fund. This fund will be used for a) pre-employment training, b) up-skill training for existing workers and c) training of women and disadvantaged people. In addition to this fund, there will be an institutional framework for collecting and allocating fund to training providers.
Setting up 329 new technical schools and colleges
In January 2020, a 20,525.69 crore project was approved by the Executive Committee of the National Economic Council (ECNEC) to establish 329 technical schools and colleges at upazila level in the country. The aim of the project is to create employment opportunities and skilled human resources.
50 General Economics Division (GED)
7.4 Recommendations to improve TVET Education
Expansion of vocational training to the Union level
The government has been actively pursuing the policy for rapid expansion of the TVET institutions. Evidence shows that proximity matters – a SSC passed student is more likely to get enrolled to TVET institutions if he or she lives closer to the institutions. That is, in order for skill development interventions to be successful, we have to bring the institutions closer to the households, particularly in the rural areas. In this light, the 8th FYP and the ensuing skill development policy should stress more on building small scale specialized TVET institutions at the union level. The specialization can be based on SME clusters, local craftsmanship, subnational and national demand.
Modernization of the current TVETs
Existing studies show that the current TVETs lack modern equipment and training facilities. This has been a major obstacle for improving the quality of teaching and learning at TVETs. Therefore, a few TVETs, one from each district, can be upgraded as ‘model TVET’ on pilot basis. These models later can be replicated all over the countries.
More support is needed in the public-private partnerships (PPPs) in training
Public-private partnership can play a vital role to the develop market driven skills system and professional skills according to industries’ demand. Both National Education Policy (NEP)-2010 and National Skill Development Policy (NSDP)-2011 espouse the idea that PPPs are imperative in the establishment and management of new TVET institutions. Suggestions such as private training providers leasing and using public training establishments can be found in the NSDP-2011. There are two major reasons why more investments are needed to make these provision of training possible across the country. First, the public-private arrangements between private enterprises and public institutions require some funding. Second, Investments can finance the startup costs of private management of public institutions. There are a number of examples of such initiatives of skill provision under PPP. One such example is provision of training by Bangladesh Garments Manufacturers and Exporters Association (BGMEA) through technical training centers (TTCs).
Promoting GO-NGO partnership
Currently there are hundreds of large and small NGOs which are offering short courses. Most of these courses offered are non –accredited training courses. NGOs like BRAC, TMMS, UCEP, Dhaka Ahsania Mission, MAWTS-Caritas, SOS Children Village, Muslim Aid, CMES, and Practical Action etc. are providing training to many target groups (e.g. rural population, under privileged youths etc.). Most of these trainings have a duration of 4 to 6 months and have a small enrolment capacity. That’s why the partnership between GO and NGOs are needed to introduce long term courses and to increase the size of enrolment of the existing courses.
More support is needed for enterprise based Training
Bangladesh is lagging behind in enterprise-based training. In 2019, Bangladesh ranked 127th in ‘extent of staff training’ in the enterprises among 141 countries around the world, compared with India (50), Sri Lanka (78) and Vietnam (73) (World Economic Forum 2019).
51Background Papers
In 2008 only 54 apprentices were registered under the Bureau of Manpower, Employment and Training (BMET). In the recent years though the number increased from mere 54 to more than 15,000, the number is still very insignificant.
More emphasis on practical training: Industry-TVET linkage
The effectiveness of industry training in TVET curricula determines the success of TVET education. Still there is no formal framework on how this collaboration will take place. Although there are proven benefits of industry-TVET linkages, some structural rigidities and lack of incentives are limiting the success of establishing linkages. First, in many cases enterprises lack incentives in investing. Second, TVET institutes lack operational capacity to collaborate with the enterprises in many cases. Third, sometimes the immediate cost of collaboration with TVET institutes exceeds the immediate benefit of it to the enterprises. In order for this kind of collaboration to be successful, the incentive structure has to be in place. That is, all the parties involved - TVET institutions, students and industries must have adequate incentives for such collaboration. The fiscal incentives for industries, stipends for students and recognition for TVETs for placing their students in industries are required.
The labor law of 2006 and 2013 clearly states that all industries that employ at least 50 workers must have at least 10 percent of apprentices. There is a tripartite national advisory committee for apprenticeship. The obligations of the employers are: 25 percent new recruitment through apprenticeship; the curriculum is supposed to be designed such that 20 percent time is in classroom, and 80 percent is for hands-on work; and 100 percent cost is borne by employer. However, this law has been implemented. In order to make this law effective, it is essential to provide some benefit to the industry. Though there are provisions for tax exemption, it is not at all popular among the employers. A carefully designed incentive structure can make this apprentice law effective.
Addressing the credit constraints for skill acquisition
Evidence suggests that high cost of training deters potential trainees from taking up training. The government can provide subsidized credit with flexible terms and conditions. The role of NGOs and PKSF can also be reviewed as a delivery mechanism of credits to the training seekers.
More teacher’s training institutes to be built
Continuous training of the trainers are required in a dynamic education system like TVET. There are only two major public teachers training centers (Technical Teacher Training College and Vocational Teacher Training Institute) with 37 teachers and enrolment of 139 (BANBEIS, 2018) in Bangladesh. There are 50,931 teachers employed in various TVET institutions around the country. Clearly, the number of training institute for the trainers is far from being adequate.
Greaterflexibilityinchangingcurriculatoreflectthedemandforthemarket
As discussed before TVET is a dynamic education system which demands continuous upgrading and updating. One of the major reasons of the present supply demand mismatch and low employability of TVET graduates of Bangladesh is the rigidity of curricula. Although a number of initiatives have been taken through NSDA in the recent years to
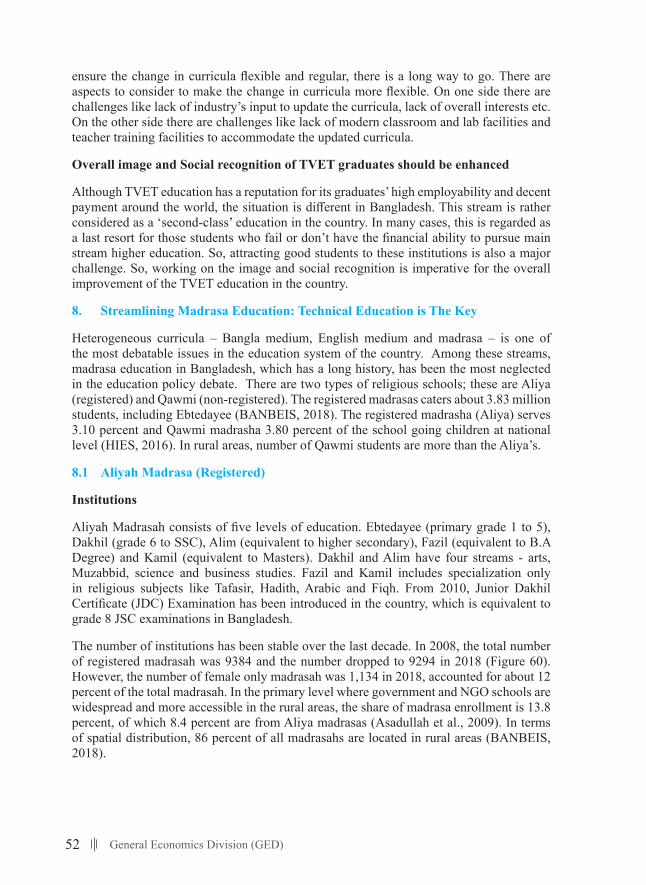
52 General Economics Division (GED)
ensure the change in curricula flexible and regular, there is a long way to go. There are aspects to consider to make the change in curricula more flexible. On one side there are challenges like lack of industry’s input to update the curricula, lack of overall interests etc. On the other side there are challenges like lack of modern classroom and lab facilities and teacher training facilities to accommodate the updated curricula.
Overall image and Social recognition of TVET graduates should be enhanced
Although TVET education has a reputation for its graduates’ high employability and decent payment around the world, the situation is different in Bangladesh. This stream is rather considered as a ‘second-class’ education in the country. In many cases, this is regarded as a last resort for those students who fail or don’t have the financial ability to pursue main stream higher education. So, attracting good students to these institutions is also a major challenge. So, working on the image and social recognition is imperative for the overall improvement of the TVET education in the country.
8. Streamlining Madrasa Education: Technical Education is The Key
Heterogeneous curricula – Bangla medium, English medium and madrasa – is one of the most debatable issues in the education system of the country. Among these streams, madrasa education in Bangladesh, which has a long history, has been the most neglected in the education policy debate. There are two types of religious schools; these are Aliya (registered) and Qawmi (non-registered). The registered madrasas caters about 3.83 million students, including Ebtedayee (BANBEIS, 2018). The registered madrasha (Aliya) serves 3.10 percent and Qawmi madrasha 3.80 percent of the school going children at national level (HIES, 2016). In rural areas, number of Qawmi students are more than the Aliya’s.
8.1 Aliyah Madrasa (Registered)
Institutions
Aliyah Madrasah consists of five levels of education. Ebtedayee (primary grade 1 to 5), Dakhil (grade 6 to SSC), Alim (equivalent to higher secondary), Fazil (equivalent to B.A Degree) and Kamil (equivalent to Masters). Dakhil and Alim have four streams - arts, Muzabbid, science and business studies. Fazil and Kamil includes specialization only in religious subjects like Tafasir, Hadith, Arabic and Fiqh. From 2010, Junior Dakhil Certificate (JDC) Examination has been introduced in the country, which is equivalent to grade 8 JSC examinations in Bangladesh.
The number of institutions has been stable over the last decade. In 2008, the total number of registered madrasah was 9384 and the number dropped to 9294 in 2018 (Figure 60). However, the number of female only madrasah was 1,134 in 2018, accounted for about 12 percent of the total madrasah. In the primary level where government and NGO schools are widespread and more accessible in the rural areas, the share of madrasa enrollment is 13.8 percent, of which 8.4 percent are from Aliya madrasas (Asadullah et al., 2009). In terms of spatial distribution, 86 percent of all madrasahs are located in rural areas (BANBEIS, 2018).
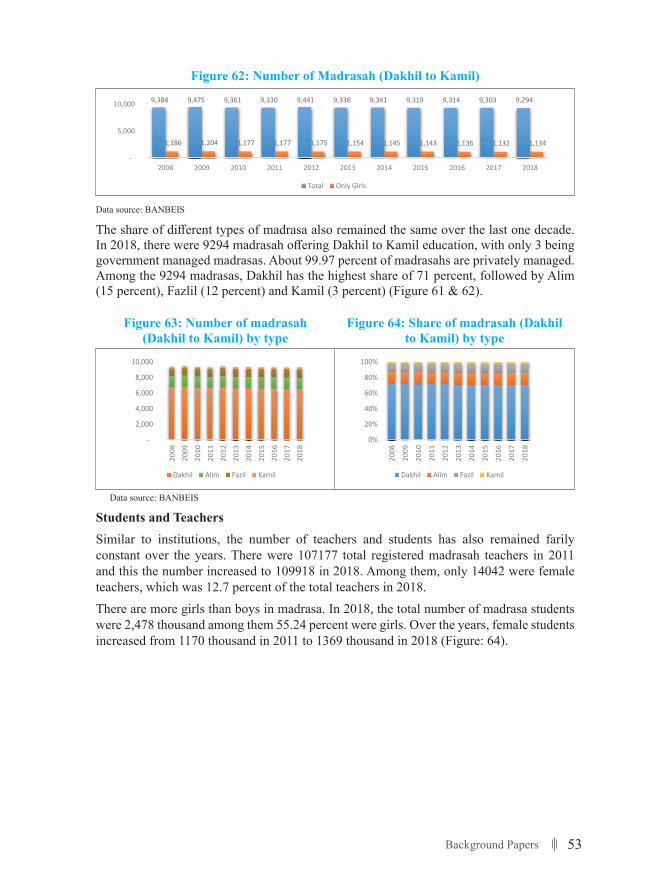
53Background Papers
Figure 62: Number of Madrasah (Dakhil to Kamil)
65
8. STREAMLINING MADRASA EDUCATION: TECHNICAL EDUCATION IS THE KEY
Heterogeneous curricula – Bangla medium, English medium and madrasa – is one of the most debatable issues in the education system of the country. Among these streams, madrasa education in Bangladesh, which has a long history, has been the most neglected in the education policy debate. There are two types of religious schools; these are Aliya (registered) and Qawmi (non-registered). The registered madrasas caters about 3.83 million students, including Ebtedayee (BANBEIS, 2018). The registered madrasha (Aliya) serves 3.10 percent and Qawmi madrasha 3.80 percent of the school going children at national level (HIES, 2016). In rural areas, number of Qawmi students are more than the Aliya’s.
8.1 Aliyah Madrasa (Registered)
Institutions
Aliyah Madrasah consists of five levels of education. Ebtedayee (primary grade 1 to 5), Dakhil (grade 6 to SSC), Alim (equivalent to higher secondary), Fazil (equivalent to B.A Degree) and Kamil (equivalent to Masters). Dakhil and Alim have four streams - arts, Muzabbid, science and business studies. Fazil and Kamil includes specialization only in religious subjects like Tafasir, Hadith, Arabic and Fiqh. From 2010, Junior Dakhil Certificate (JDC) Examination has been introduced in the country, which is equivalent to grade 8 JSC examinations in Bangladesh.
The number of institutions has been stable over the last decade. In 2008, the total number of registered madrasah was 9384 and the number dropped to 9294 in 2018 (Figure 60). However, the number of female only madrasah was 1,134 in 2018, accounted for about 12 percent of the total madrasah. In the primary level where government and NGO schools are widespread and more accessible in the rural areas, the share of madrasa enrollment is 13.8 percent, of which 8.4 percent are from Aliya madrasas (Asadullah et al., 2009). In terms of spatial distribution, 86 percent of all madrasahs are located in rural areas (BANBEIS, 2018).
Figure 62: Number of Madrasah (Dakhil to Kamil)
Data source: BANBEIS
The share of different types of madrasa also remained the same over the last one decade. In 2018, there were 9294 madrasah offering Dakhil to Kamil education, with only 3 being government managed madrasas. About 99.97 percent of madrasahs are privately managed. Among the 9294 madrasas, Dakhil has the highest share of 71 percent, followed by Alim (15 percent), Fazlil (12 percent) and Kamil (3 percent) (Figure 61 & 62).
9,384 9,475 9,361 9,330 9,441 9,336 9,341 9,319 9,314 9,303 9,294
1,186 1,204 1,177 1,177 1,175 1,154 1,145 1,143 1,136 1,132 1,134
-
5,000
10,000
2008 2009 2010 2011 2012 2013 2014 2015 2016 2017 2018
Total Only Girls
Data source: BANBEIS
The share of different types of madrasa also remained the same over the last one decade. In 2018, there were 9294 madrasah offering Dakhil to Kamil education, with only 3 being government managed madrasas. About 99.97 percent of madrasahs are privately managed. Among the 9294 madrasas, Dakhil has the highest share of 71 percent, followed by Alim (15 percent), Fazlil (12 percent) and Kamil (3 percent) (Figure 61 & 62).
Figure 63: Number of madrasah (Dakhil to Kamil) by type
Figure 64: Share of madrasah (Dakhil to Kamil) by type
66
Figure 63: Number of madrasah (Dakhil to Kamil) by type
Figure 64: Share of madrasah (Dakhil to Kamil) by type
Data source: BANBEIS
Students and Teachers
Similar to institutions, the number of teachers and students has also remained farily constant over the years. There were 107177 total registered madrasah teachers in 2011 and this the number increased to 109918 in 2018. Among them, only 14042 were female teachers, which was 12.7 percent of the total teachers in 2018.
There are more girls than boys in madrasa. In 2018, the total number of madrasa students were 2,478 thousand among them 55.24 percent were girls. Over the years, female students increased from 1170 thousand in 2011 to 1369 thousand in 2018 (Figure: 64).
Figure 65: Number of teachers without attached Ebtedayee section (only Dakhil to Kamil)
Figure 66: Number of students without attached Ebtedayee section (Dakhil to Kamil)
Data source: BANBEIS
-
2,000
4,000
6,000
8,000
10,000
2008
2009
2010
2011
2012
2013
2014
2015
2016
2017
2018
Dakhil Alim Fazil Kamil
0%
20%
40%
60%
80%
100%20
08
2009
2010
2011
2012
2013
2014
2015
2016
2017
2018
Dakhil Alim Fazil Kamil
-
20
40
60
80
100
120
2011 2012 2013 2014 2015 2016 2017 2018
Thou
sand
s
Total Number of Teacher Number Female of Teacher
-
500
1,000
1,500
2,000
2,500
3,000
2011 2012 2013 2014 2015 2016 2017 2018
Thou
sand
s
Total Number of Students Number of Student (Girls)
66
Figure 63: Number of madrasah (Dakhil to Kamil) by type
Figure 64: Share of madrasah (Dakhil to Kamil) by type
Data source: BANBEIS
Students and Teachers
Similar to institutions, the number of teachers and students has also remained farily constant over the years. There were 107177 total registered madrasah teachers in 2011 and this the number increased to 109918 in 2018. Among them, only 14042 were female teachers, which was 12.7 percent of the total teachers in 2018.
There are more girls than boys in madrasa. In 2018, the total number of madrasa students were 2,478 thousand among them 55.24 percent were girls. Over the years, female students increased from 1170 thousand in 2011 to 1369 thousand in 2018 (Figure: 64).
Figure 65: Number of teachers without attached Ebtedayee section (only Dakhil to Kamil)
Figure 66: Number of students without attached Ebtedayee section (Dakhil to Kamil)
Data source: BANBEIS
-
2,000
4,000
6,000
8,000
10,000
2008
2009
2010
2011
2012
2013
2014
2015
2016
2017
2018
Dakhil Alim Fazil Kamil
0%
20%
40%
60%
80%
100%
2008
2009
2010
2011
2012
2013
2014
2015
2016
2017
2018
Dakhil Alim Fazil Kamil
-
20
40
60
80
100
120
2011 2012 2013 2014 2015 2016 2017 2018
Thou
sand
s
Total Number of Teacher Number Female of Teacher
-
500
1,000
1,500
2,000
2,500
3,000
2011 2012 2013 2014 2015 2016 2017 2018
Thou
sand
s
Total Number of Students Number of Student (Girls)
Data source: BANBEIS
Students and TeachersSimilar to institutions, the number of teachers and students has also remained farily constant over the years. There were 107177 total registered madrasah teachers in 2011 and this the number increased to 109918 in 2018. Among them, only 14042 were female teachers, which was 12.7 percent of the total teachers in 2018. There are more girls than boys in madrasa. In 2018, the total number of madrasa students were 2,478 thousand among them 55.24 percent were girls. Over the years, female students increased from 1170 thousand in 2011 to 1369 thousand in 2018 (Figure: 64).
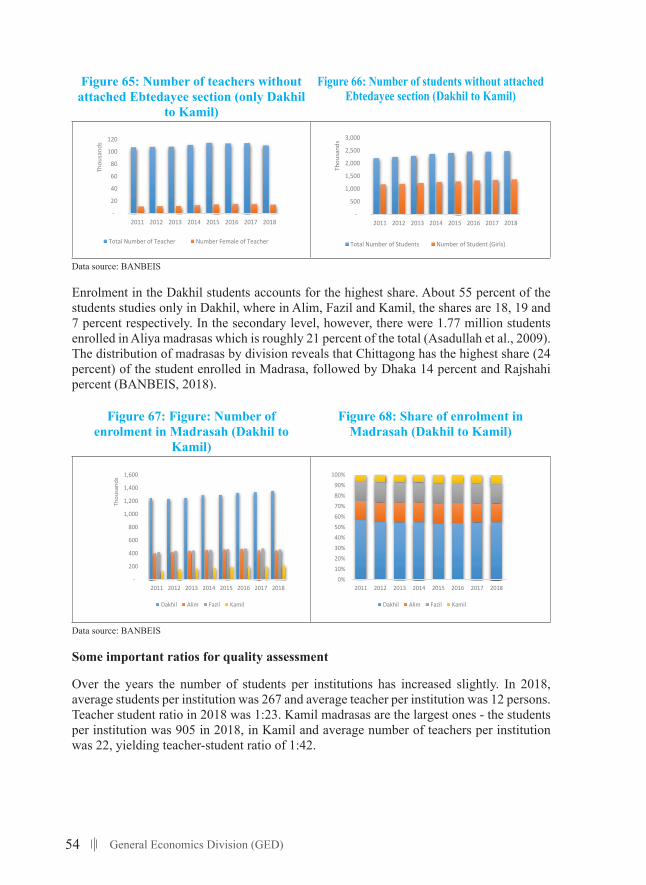
54 General Economics Division (GED)
Figure 65: Number of teachers without attached Ebtedayee section (only Dakhil
to Kamil)
Figure 66: Number of students without attached Ebtedayee section (Dakhil to Kamil)
66
Figure 63: Number of madrasah (Dakhil to Kamil) by type
Figure 64: Share of madrasah (Dakhil to Kamil) by type
Data source: BANBEIS
Students and Teachers
Similar to institutions, the number of teachers and students has also remained farily constant over the years. There were 107177 total registered madrasah teachers in 2011 and this the number increased to 109918 in 2018. Among them, only 14042 were female teachers, which was 12.7 percent of the total teachers in 2018.
There are more girls than boys in madrasa. In 2018, the total number of madrasa students were 2,478 thousand among them 55.24 percent were girls. Over the years, female students increased from 1170 thousand in 2011 to 1369 thousand in 2018 (Figure: 64).
Figure 65: Number of teachers without attached Ebtedayee section (only Dakhil to Kamil)
Figure 66: Number of students without attached Ebtedayee section (Dakhil to Kamil)
Data source: BANBEIS
-
2,000
4,000
6,000
8,000
10,000
2008
2009
2010
2011
2012
2013
2014
2015
2016
2017
2018
Dakhil Alim Fazil Kamil
0%
20%
40%
60%
80%
100%
2008
2009
2010
2011
2012
2013
2014
2015
2016
2017
2018
Dakhil Alim Fazil Kamil
-
20
40
60
80
100
120
2011 2012 2013 2014 2015 2016 2017 2018
Thou
sand
s
Total Number of Teacher Number Female of Teacher
-
500
1,000
1,500
2,000
2,500
3,000
2011 2012 2013 2014 2015 2016 2017 2018
Thou
sand
s
Total Number of Students Number of Student (Girls)
Data source: BANBEIS
Enrolment in the Dakhil students accounts for the highest share. About 55 percent of the students studies only in Dakhil, where in Alim, Fazil and Kamil, the shares are 18, 19 and 7 percent respectively. In the secondary level, however, there were 1.77 million students enrolled in Aliya madrasas which is roughly 21 percent of the total (Asadullah et al., 2009). The distribution of madrasas by division reveals that Chittagong has the highest share (24 percent) of the student enrolled in Madrasa, followed by Dhaka 14 percent and Rajshahi percent (BANBEIS, 2018).
Figure 67: Figure: Number of enrolment in Madrasah (Dakhil to
Kamil)
Figure 68: Share of enrolment in Madrasah (Dakhil to Kamil)
67
Enrolment in the Dakhil students accounts for the highest share. About 55 percent of the students studies only in Dakhil, where in Alim, Fazil and Kamil, the shares are 18, 19 and 7 percent respectively. In the secondary level, however, there were 1.77 million students enrolled in Aliya madrasas which is roughly 21 percent of the total (Asadullah et al., 2009). The distribution of madrasas by division reveals that Chittagong has the highest share (24 percent) of the student enrolled in Madrasa, followed by Dhaka 14 percent and Rajshahi percent (BANBEIS, 2018).
Figure 67: Figure: Number of enrolment in Madrasah (Dakhil to Kamil)
Figure 68: Share of enrolment in Madrasah (Dakhil to Kamil)
Data source: BANBEIS
Some important ratios for quality assessment
Over the years the number of students per institutions has increased slightly. In 2018, average students per institution was 267 and average teacher per institution was 12 persons. Teacher student ratio in 2018 was 1:23. Kamil madrasas are the largest ones - the students per institution was 905 in 2018, in Kamil and average number of teachers per institution was 22, yielding teacher-student ratio of 1:42.
-
200
400
600
800
1,000
1,200
1,400
1,600
2011 2012 2013 2014 2015 2016 2017 2018
Thou
sand
s
Dakhil Alim Fazil Kamil
0%10%20%30%40%50%60%70%80%90%
100%
2011 2012 2013 2014 2015 2016 2017 2018
Dakhil Alim Fazil Kamil
Data source: BANBEIS
Some important ratios for quality assessment
Over the years the number of students per institutions has increased slightly. In 2018, average students per institution was 267 and average teacher per institution was 12 persons. Teacher student ratio in 2018 was 1:23. Kamil madrasas are the largest ones - the students per institution was 905 in 2018, in Kamil and average number of teachers per institution was 22, yielding teacher-student ratio of 1:42.
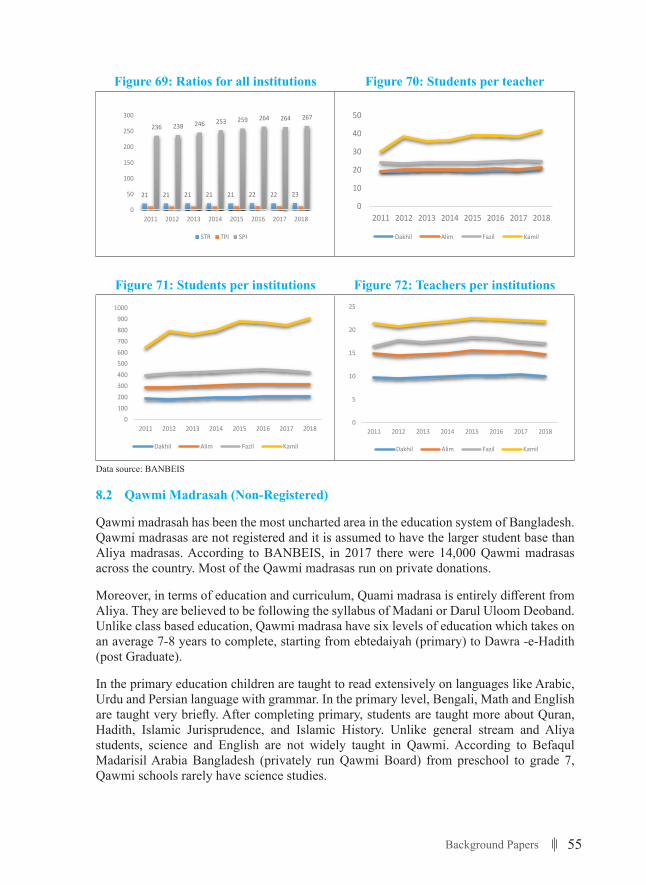
55Background Papers
Figure 69: Ratios for all institutions Figure 70: Students per teacher
68
Figure 69: Ratios for all institutions
Figure 70: Students per teacher
Figure 71: Students per institutions
Figure 72: Teachers per institutions
Data source: BANBEIS
8.2 Qawmi Madrasah (Non-Registered)
Qawmi madrasah has been the most uncharted area in the education system of Bangladesh. Qawmi madrasas are not registered and it is assumed to have the larger student base than Aliya madrasas. According to BANBEIS, in 2017 there were 14,000 Qawmi madrasas across the country. Most of the Qawmi madrasas run on private donations.
Moreover, in terms of education and curriculum, Quami madrasa is entirely different from Aliya. They are believed to be following the syllabus of Madani or Darul Uloom Deoband. Unlike class based education, Qawmi madrasa have six levels of education which takes on an average 7-8 years to complete, starting from ebtedaiyah (primary) to Dawra -e-Hadith (post Graduate).
In the primary education children are taught to read extensively on languages like Arabic, Urdu and Persian language with grammar. In the primary level, Bengali, Math and English are taught very briefly. After completing primary, students are taught more about Quran, Hadith, Islamic Jurisprudence, and
21 21 21 21 21 22 22 23
236 238 246 253 259 264 264 267
0
50
100
150
200
250
300
2011 2012 2013 2014 2015 2016 2017 2018
STR TPI SPI
0
10
20
30
40
50
2011 2012 2013 2014 2015 2016 2017 2018
Dakhil Alim Fazil Kamil
0100200300400500600700800900
1000
2011 2012 2013 2014 2015 2016 2017 2018
Dakhil Alim Fazil Kamil
0
5
10
15
20
25
2011 2012 2013 2014 2015 2016 2017 2018
Dakhil Alim Fazil Kamil
Figure 71: Students per institutions Figure 72: Teachers per institutions
68
Figure 69: Ratios for all institutions
Figure 70: Students per teacher
Figure 71: Students per institutions
Figure 72: Teachers per institutions
Data source: BANBEIS
8.2 Qawmi Madrasah (Non-Registered)
Qawmi madrasah has been the most uncharted area in the education system of Bangladesh. Qawmi madrasas are not registered and it is assumed to have the larger student base than Aliya madrasas. According to BANBEIS, in 2017 there were 14,000 Qawmi madrasas across the country. Most of the Qawmi madrasas run on private donations.
Moreover, in terms of education and curriculum, Quami madrasa is entirely different from Aliya. They are believed to be following the syllabus of Madani or Darul Uloom Deoband. Unlike class based education, Qawmi madrasa have six levels of education which takes on an average 7-8 years to complete, starting from ebtedaiyah (primary) to Dawra -e-Hadith (post Graduate).
In the primary education children are taught to read extensively on languages like Arabic, Urdu and Persian language with grammar. In the primary level, Bengali, Math and English are taught very briefly. After completing primary, students are taught more about Quran, Hadith, Islamic Jurisprudence, and
21 21 21 21 21 22 22 23
236 238 246 253 259 264 264 267
0
50
100
150
200
250
300
2011 2012 2013 2014 2015 2016 2017 2018
STR TPI SPI
0
10
20
30
40
50
2011 2012 2013 2014 2015 2016 2017 2018
Dakhil Alim Fazil Kamil
0100200300400500600700800900
1000
2011 2012 2013 2014 2015 2016 2017 2018
Dakhil Alim Fazil Kamil
0
5
10
15
20
25
2011 2012 2013 2014 2015 2016 2017 2018
Dakhil Alim Fazil Kamil
Data source: BANBEIS
8.2 Qawmi Madrasah (Non-Registered)
Qawmi madrasah has been the most uncharted area in the education system of Bangladesh. Qawmi madrasas are not registered and it is assumed to have the larger student base than Aliya madrasas. According to BANBEIS, in 2017 there were 14,000 Qawmi madrasas across the country. Most of the Qawmi madrasas run on private donations.
Moreover, in terms of education and curriculum, Quami madrasa is entirely different from Aliya. They are believed to be following the syllabus of Madani or Darul Uloom Deoband. Unlike class based education, Qawmi madrasa have six levels of education which takes on an average 7-8 years to complete, starting from ebtedaiyah (primary) to Dawra -e-Hadith (post Graduate).
In the primary education children are taught to read extensively on languages like Arabic, Urdu and Persian language with grammar. In the primary level, Bengali, Math and English are taught very briefly. After completing primary, students are taught more about Quran, Hadith, Islamic Jurisprudence, and Islamic History. Unlike general stream and Aliya students, science and English are not widely taught in Qawmi. According to Befaqul Madarisil Arabia Bangladesh (privately run Qawmi Board) from preschool to grade 7, Qawmi schools rarely have science studies.
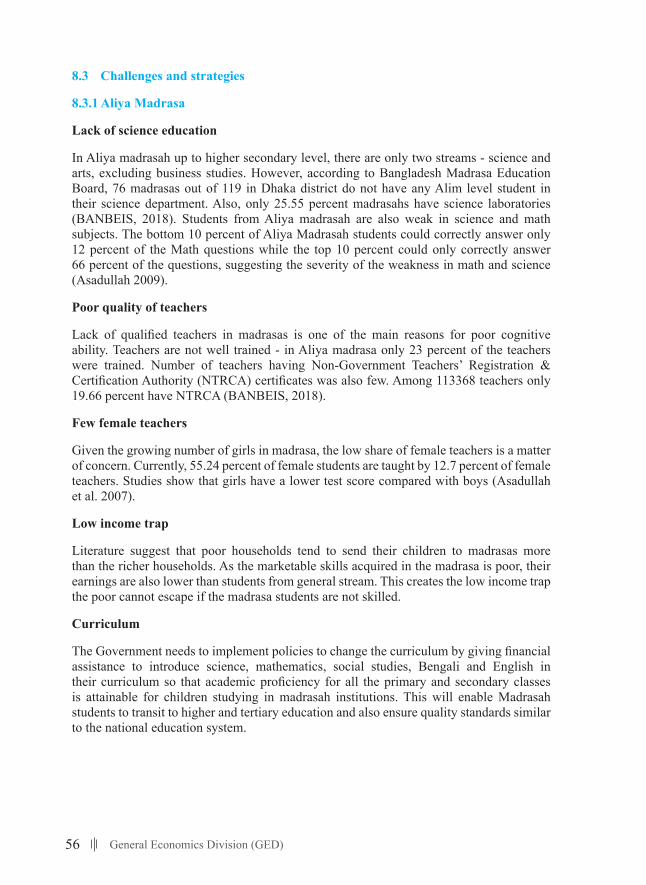
56 General Economics Division (GED)
8.3 Challenges and strategies
8.3.1 Aliya Madrasa
Lack of science education
In Aliya madrasah up to higher secondary level, there are only two streams - science and arts, excluding business studies. However, according to Bangladesh Madrasa Education Board, 76 madrasas out of 119 in Dhaka district do not have any Alim level student in their science department. Also, only 25.55 percent madrasahs have science laboratories (BANBEIS, 2018). Students from Aliya madrasah are also weak in science and math subjects. The bottom 10 percent of Aliya Madrasah students could correctly answer only 12 percent of the Math questions while the top 10 percent could only correctly answer 66 percent of the questions, suggesting the severity of the weakness in math and science (Asadullah 2009).
Poor quality of teachers
Lack of qualified teachers in madrasas is one of the main reasons for poor cognitive ability. Teachers are not well trained - in Aliya madrasa only 23 percent of the teachers were trained. Number of teachers having Non-Government Teachers’ Registration & Certification Authority (NTRCA) certificates was also few. Among 113368 teachers only 19.66 percent have NTRCA (BANBEIS, 2018).
Few female teachers
Given the growing number of girls in madrasa, the low share of female teachers is a matter of concern. Currently, 55.24 percent of female students are taught by 12.7 percent of female teachers. Studies show that girls have a lower test score compared with boys (Asadullah et al. 2007).
Low income trap
Literature suggest that poor households tend to send their children to madrasas more than the richer households. As the marketable skills acquired in the madrasa is poor, their earnings are also lower than students from general stream. This creates the low income trap the poor cannot escape if the madrasa students are not skilled.
Curriculum
The Government needs to implement policies to change the curriculum by giving financial assistance to introduce science, mathematics, social studies, Bengali and English in their curriculum so that academic proficiency for all the primary and secondary classes is attainable for children studying in madrasah institutions. This will enable Madrasah students to transit to higher and tertiary education and also ensure quality standards similar to the national education system.
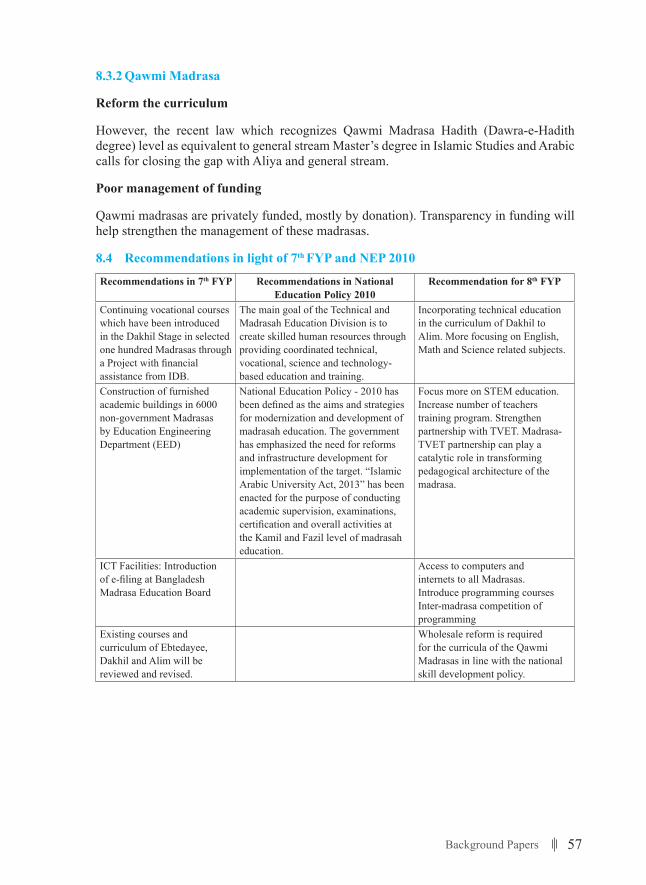
57Background Papers
8.3.2 Qawmi Madrasa
Reform the curriculum
However, the recent law which recognizes Qawmi Madrasa Hadith (Dawra-e-Hadith degree) level as equivalent to general stream Master’s degree in Islamic Studies and Arabic calls for closing the gap with Aliya and general stream.
Poor management of funding
Qawmi madrasas are privately funded, mostly by donation). Transparency in funding will help strengthen the management of these madrasas.
8.4 Recommendations in light of 7th FYP and NEP 2010
Recommendations in 7th FYP Recommendations in National Education Policy 2010
Recommendation for 8th FYP
Continuing vocational courses which have been introduced in the Dakhil Stage in selected one hundred Madrasas through a Project with financial assistance from IDB.
The main goal of the Technical and Madrasah Education Division is to create skilled human resources through providing coordinated technical, vocational, science and technology-based education and training.
Incorporating technical education in the curriculum of Dakhil to Alim. More focusing on English, Math and Science related subjects.
Construction of furnished academic buildings in 6000 non-government Madrasas by Education Engineering Department (EED)
National Education Policy - 2010 has been defined as the aims and strategies for modernization and development of madrasah education. The government has emphasized the need for reforms and infrastructure development for implementation of the target. “Islamic Arabic University Act, 2013” has been enacted for the purpose of conducting academic supervision, examinations, certification and overall activities at the Kamil and Fazil level of madrasah education.
Focus more on STEM education. Increase number of teachers training program. Strengthen partnership with TVET. Madrasa-TVET partnership can play a catalytic role in transforming pedagogical architecture of the madrasa.
ICT Facilities: Introduction of e-filing at Bangladesh Madrasa Education Board
Access to computers and internets to all Madrasas. Introduce programming courses Inter-madrasa competition of programming
Existing courses and curriculum of Ebtedayee, Dakhil and Alim will be reviewed and revised.
Wholesale reform is required for the curricula of the Qawmi Madrasas in line with the national skill development policy.
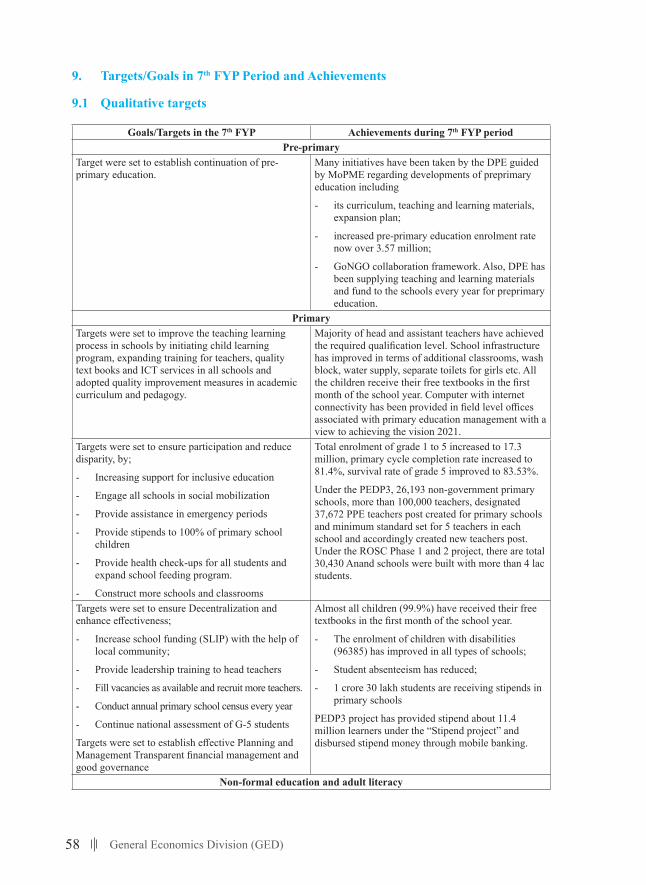
58 General Economics Division (GED)
9. Targets/Goals in 7th FYP Period and Achievements
9.1 Qualitative targets
Goals/Targets in the 7th FYP Achievements during 7th FYP periodPre-primary
Target were set to establish continuation of pre-primary education.
Many initiatives have been taken by the DPE guided by MoPME regarding developments of preprimary education including
- its curriculum, teaching and learning materials, expansion plan;
- increased pre-primary education enrolment rate now over 3.57 million;
- GoNGO collaboration framework. Also, DPE has been supplying teaching and learning materials and fund to the schools every year for preprimary education.
PrimaryTargets were set to improve the teaching learning process in schools by initiating child learning program, expanding training for teachers, quality text books and ICT services in all schools and adopted quality improvement measures in academic curriculum and pedagogy.
Majority of head and assistant teachers have achieved the required qualification level. School infrastructure has improved in terms of additional classrooms, wash block, water supply, separate toilets for girls etc. All the children receive their free textbooks in the first month of the school year. Computer with internet connectivity has been provided in field level offices associated with primary education management with a view to achieving the vision 2021.
Targets were set to ensure participation and reduce disparity, by;
- Increasing support for inclusive education
- Engage all schools in social mobilization
- Provide assistance in emergency periods
- Provide stipends to 100% of primary school children
- Provide health check-ups for all students and expand school feeding program.
- Construct more schools and classrooms
Total enrolment of grade 1 to 5 increased to 17.3 million, primary cycle completion rate increased to 81.4%, survival rate of grade 5 improved to 83.53%.
Under the PEDP3, 26,193 non-government primary schools, more than 100,000 teachers, designated 37,672 PPE teachers post created for primary schools and minimum standard set for 5 teachers in each school and accordingly created new teachers post. Under the ROSC Phase 1 and 2 project, there are total 30,430 Anand schools were built with more than 4 lac students.
Targets were set to ensure Decentralization and enhance effectiveness;
- Increase school funding (SLIP) with the help of local community;
- Provide leadership training to head teachers
- Fill vacancies as available and recruit more teachers.
- Conduct annual primary school census every year
- Continue national assessment of G-5 students
Targets were set to establish effective Planning and Management Transparent financial management and good governance
Almost all children (99.9%) have received their free textbooks in the first month of the school year.
- The enrolment of children with disabilities (96385) has improved in all types of schools;
- Student absenteeism has reduced;
- 1 crore 30 lakh students are receiving stipends in primary schools
PEDP3 project has provided stipend about 11.4 million learners under the “Stipend project” and disbursed stipend money through mobile banking.
Non-formal education and adult literacy
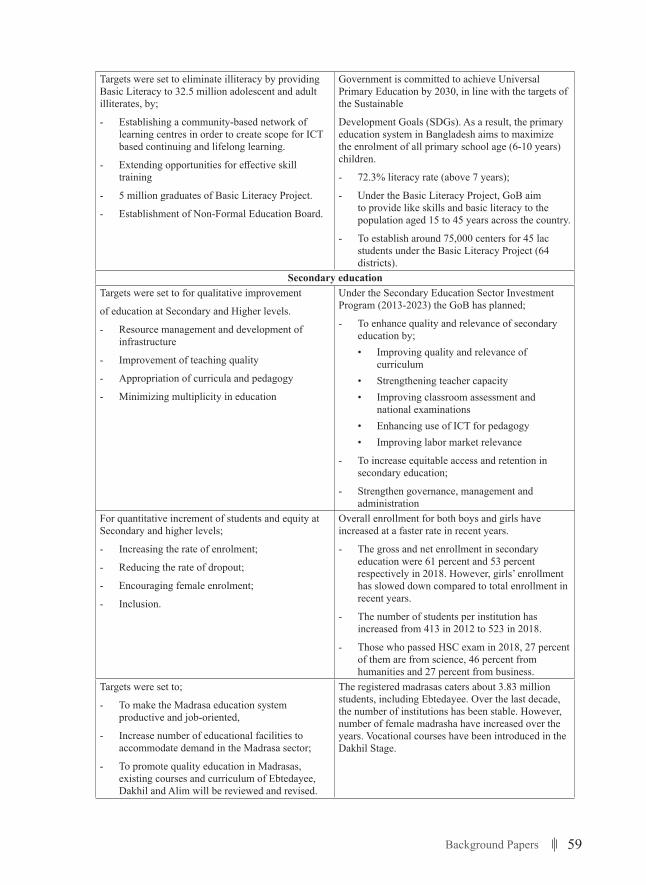
59Background Papers
Targets were set to eliminate illiteracy by providing Basic Literacy to 32.5 million adolescent and adult illiterates, by;
- Establishing a community-based network of learning centres in order to create scope for ICT based continuing and lifelong learning.
- Extending opportunities for effective skill training
- 5 million graduates of Basic Literacy Project.
- Establishment of Non-Formal Education Board.
Government is committed to achieve Universal Primary Education by 2030, in line with the targets of the Sustainable
Development Goals (SDGs). As a result, the primary education system in Bangladesh aims to maximize the enrolment of all primary school age (6-10 years) children.
- 72.3% literacy rate (above 7 years);
- Under the Basic Literacy Project, GoB aim to provide like skills and basic literacy to the population aged 15 to 45 years across the country.
- To establish around 75,000 centers for 45 lac students under the Basic Literacy Project (64 districts).
Secondary educationTargets were set to for qualitative improvement
of education at Secondary and Higher levels.
- Resource management and development of infrastructure
- Improvement of teaching quality
- Appropriation of curricula and pedagogy
- Minimizing multiplicity in education
Under the Secondary Education Sector Investment Program (2013-2023) the GoB has planned;
- To enhance quality and relevance of secondary education by;• Improving quality and relevance of
curriculum• Strengthening teacher capacity• Improving classroom assessment and
national examinations• Enhancing use of ICT for pedagogy• Improving labor market relevance
- To increase equitable access and retention in secondary education;
- Strengthen governance, management and administration
For quantitative increment of students and equity at Secondary and higher levels;
- Increasing the rate of enrolment;
- Reducing the rate of dropout;
- Encouraging female enrolment;
- Inclusion.
Overall enrollment for both boys and girls have increased at a faster rate in recent years.
- The gross and net enrollment in secondary education were 61 percent and 53 percent respectively in 2018. However, girls’ enrollment has slowed down compared to total enrollment in recent years.
- The number of students per institution has increased from 413 in 2012 to 523 in 2018.
- Those who passed HSC exam in 2018, 27 percent of them are from science, 46 percent from humanities and 27 percent from business.
Targets were set to;
- To make the Madrasa education system productive and job-oriented,
- Increase number of educational facilities to accommodate demand in the Madrasa sector;
- To promote quality education in Madrasas, existing courses and curriculum of Ebtedayee, Dakhil and Alim will be reviewed and revised.
The registered madrasas caters about 3.83 million students, including Ebtedayee. Over the last decade, the number of institutions has been stable. However, number of female madrasha have increased over the years. Vocational courses have been introduced in the Dakhil Stage.
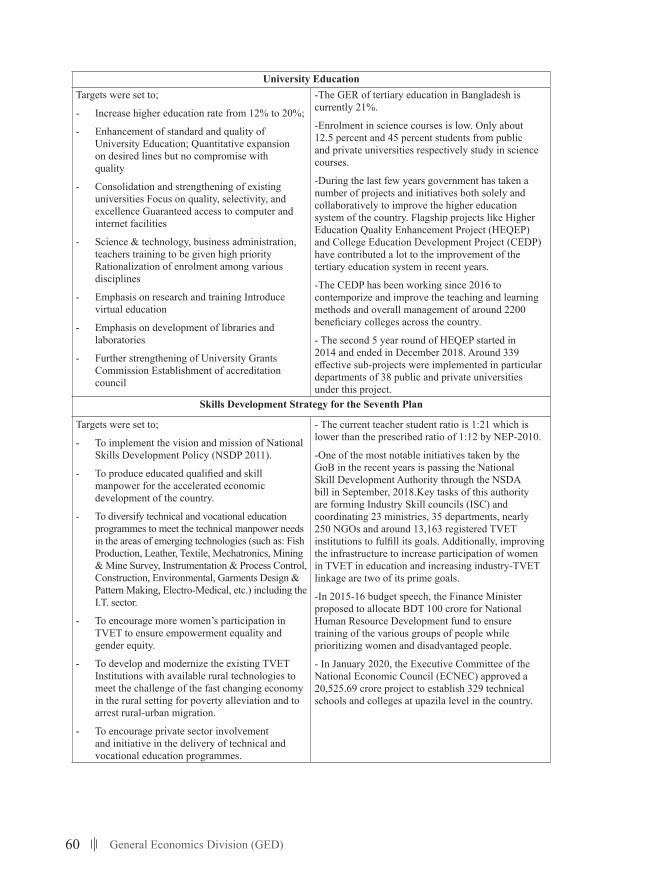
60 General Economics Division (GED)
University EducationTargets were set to;
- Increase higher education rate from 12% to 20%;
- Enhancement of standard and quality of University Education; Quantitative expansion on desired lines but no compromise with quality
- Consolidation and strengthening of existing universities Focus on quality, selectivity, and excellence Guaranteed access to computer and internet facilities
- Science & technology, business administration, teachers training to be given high priority Rationalization of enrolment among various disciplines
- Emphasis on research and training Introduce virtual education
- Emphasis on development of libraries and laboratories
- Further strengthening of University Grants Commission Establishment of accreditation council
-The GER of tertiary education in Bangladesh is currently 21%.
-Enrolment in science courses is low. Only about 12.5 percent and 45 percent students from public and private universities respectively study in science courses.
-During the last few years government has taken a number of projects and initiatives both solely and collaboratively to improve the higher education system of the country. Flagship projects like Higher Education Quality Enhancement Project (HEQEP) and College Education Development Project (CEDP) have contributed a lot to the improvement of the tertiary education system in recent years.
-The CEDP has been working since 2016 to contemporize and improve the teaching and learning methods and overall management of around 2200 beneficiary colleges across the country.
- The second 5 year round of HEQEP started in 2014 and ended in December 2018. Around 339 effective sub-projects were implemented in particular departments of 38 public and private universities under this project.
Skills Development Strategy for the Seventh Plan
Targets were set to;
- To implement the vision and mission of National Skills Development Policy (NSDP 2011).
- To produce educated qualified and skill manpower for the accelerated economic development of the country.
- To diversify technical and vocational education programmes to meet the technical manpower needs in the areas of emerging technologies (such as: Fish Production, Leather, Textile, Mechatronics, Mining & Mine Survey, Instrumentation & Process Control, Construction, Environmental, Garments Design & Pattern Making, Electro-Medical, etc.) including the I.T. sector.
- To encourage more women’s participation in TVET to ensure empowerment equality and gender equity.
- To develop and modernize the existing TVET Institutions with available rural technologies to meet the challenge of the fast changing economy in the rural setting for poverty alleviation and to arrest rural-urban migration.
- To encourage private sector involvement and initiative in the delivery of technical and vocational education programmes.
- The current teacher student ratio is 1:21 which is lower than the prescribed ratio of 1:12 by NEP-2010.
-One of the most notable initiatives taken by the GoB in the recent years is passing the National Skill Development Authority through the NSDA bill in September, 2018.Key tasks of this authority are forming Industry Skill councils (ISC) and coordinating 23 ministries, 35 departments, nearly 250 NGOs and around 13,163 registered TVET institutions to fulfill its goals. Additionally, improving the infrastructure to increase participation of women in TVET in education and increasing industry-TVET linkage are two of its prime goals.
-In 2015-16 budget speech, the Finance Minister proposed to allocate BDT 100 crore for National Human Resource Development fund to ensure training of the various groups of people while prioritizing women and disadvantaged people.
- In January 2020, the Executive Committee of the National Economic Council (ECNEC) approved a 20,525.69 crore project to establish 329 technical schools and colleges at upazila level in the country.
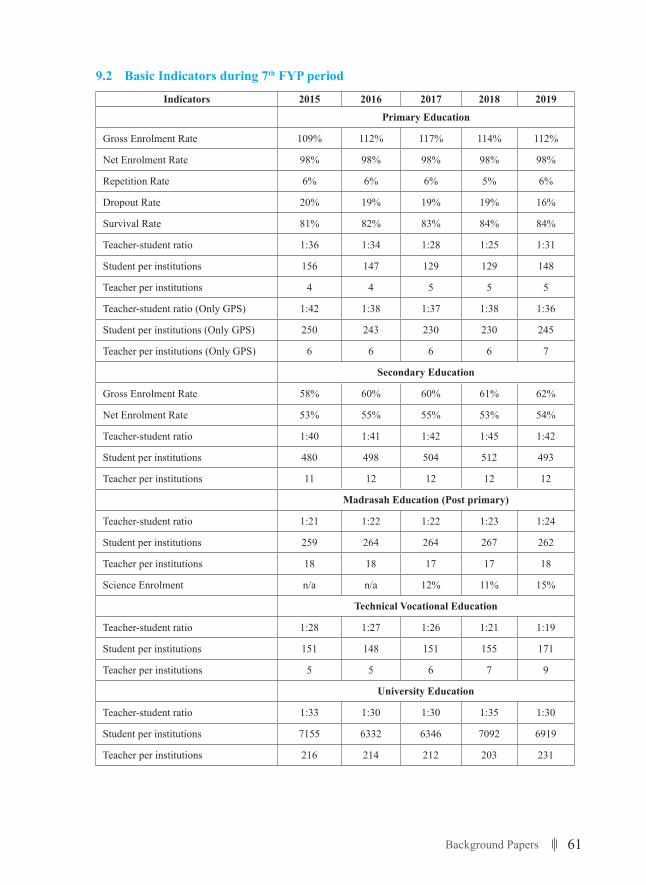
61Background Papers
9.2 Basic Indicators during 7th FYP period
Indicators 2015 2016 2017 2018 2019
Primary Education
Gross Enrolment Rate 109% 112% 117% 114% 112%
Net Enrolment Rate 98% 98% 98% 98% 98%
Repetition Rate 6% 6% 6% 5% 6%
Dropout Rate 20% 19% 19% 19% 16%
Survival Rate 81% 82% 83% 84% 84%
Teacher-student ratio 1:36 1:34 1:28 1:25 1:31
Student per institutions 156 147 129 129 148
Teacher per institutions 4 4 5 5 5
Teacher-student ratio (Only GPS) 1:42 1:38 1:37 1:38 1:36
Student per institutions (Only GPS) 250 243 230 230 245
Teacher per institutions (Only GPS) 6 6 6 6 7
Secondary Education
Gross Enrolment Rate 58% 60% 60% 61% 62%
Net Enrolment Rate 53% 55% 55% 53% 54%
Teacher-student ratio 1:40 1:41 1:42 1:45 1:42
Student per institutions 480 498 504 512 493
Teacher per institutions 11 12 12 12 12
Madrasah Education (Post primary)
Teacher-student ratio 1:21 1:22 1:22 1:23 1:24
Student per institutions 259 264 264 267 262
Teacher per institutions 18 18 17 17 18
Science Enrolment n/a n/a 12% 11% 15%
Technical Vocational Education
Teacher-student ratio 1:28 1:27 1:26 1:21 1:19
Student per institutions 151 148 151 155 171
Teacher per institutions 5 5 6 7 9
University Education
Teacher-student ratio 1:33 1:30 1:30 1:35 1:30
Student per institutions 7155 6332 6346 7092 6919
Teacher per institutions 216 214 212 203 231
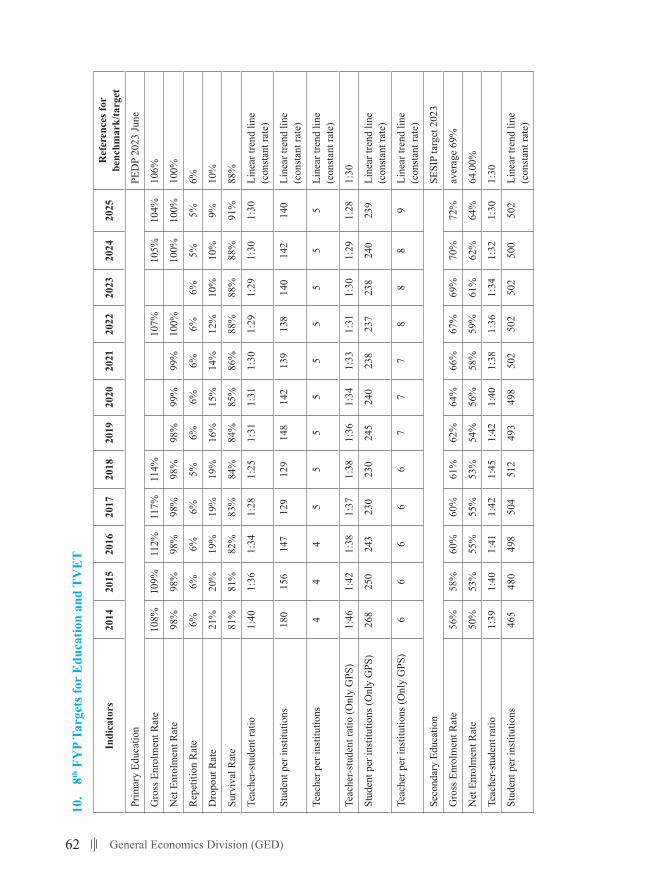
62 General Economics Division (GED)
10.
8th F
YP
Targ
ets f
or E
duca
tion
and
TV
ET
Indi
cato
rs20
1420
1520
1620
1720
1820
1920
2020
2120
2220
2320
2420
25R
efer
ence
s for
be
nchm
ark/
targ
et
Prim
ary
Educ
atio
nPE
DP
2023
June
Gro
ss E
nrol
men
t Rat
e10
8%10
9%11
2%11
7%11
4%10
7%10
5%10
4%10
6%
Net
Enr
olm
ent R
ate
98%
98%
98%
98%
98%
98%
99%
99%
100%
100%
100%
100%
Rep
etiti
on R
ate
6%6%
6%6%
5%6%
6%6%
6%6%
5%5%
6%
Dro
pout
Rat
e21
%20
%19
%19
%19
%16
%15
%14
%12
%10
%10
%9%
10%
Surv
ival
Rat
e81
%81
%82
%83
%84
%84
%85
%86
%88
%88
%88
%91
%88
%
Teac
her-s
tude
nt ra
tio
1:40
1:36
1:34
1:28
1:25
1:31
1:31
1:30
1:29
1:29
1:30
1:30
Line
ar tr
end
line
(con
stan
t rat
e)
Stud
ent p
er in
stitu
tions
180
156
147
129
129
148
142
139
138
140
142
140
Line
ar tr
end
line
(con
stan
t rat
e)
Teac
her p
er in
stitu
tions
44
45
55
55
55
55
Line
ar tr
end
line
(con
stan
t rat
e)
Teac
her-s
tude
nt ra
tio (O
nly
GPS
)1:
461:
421:
381:
371:
381:
361:
341:
331:
311:
301:
291:
281:
30
Stud
ent p
er in
stitu
tions
(Onl
y G
PS)
268
250
243
230
230
245
240
238
237
238
240
239
Line
ar tr
end
line
(con
stan
t rat
e)
Teac
her p
er in
stitu
tions
(Onl
y G
PS)
66
66
67
77
88
89
Line
ar tr
end
line
(con
stan
t rat
e)
Seco
ndar
y Ed
ucat
ion
SESI
P ta
rget
202
3
Gro
ss E
nrol
men
t Rat
e56
%58
%60
%60
%61
%62
%64
%66
%67
%69
%70
%72
%av
erag
e 69
%
Net
Enr
olm
ent R
ate
50%
53%
55%
55%
53%
54%
56%
58%
59%
61%
62%
64%
64.0
0%
Teac
her-s
tude
nt ra
tio1:
391:
401:
411:
421:
451:
421:
401:
381:
361:
341:
321:
301:
30
Stud
ent p
er in
stitu
tions
465
480
498
504
512
493
498
502
502
502
500
502
Line
ar tr
end
line
(con
stan
t rat
e)
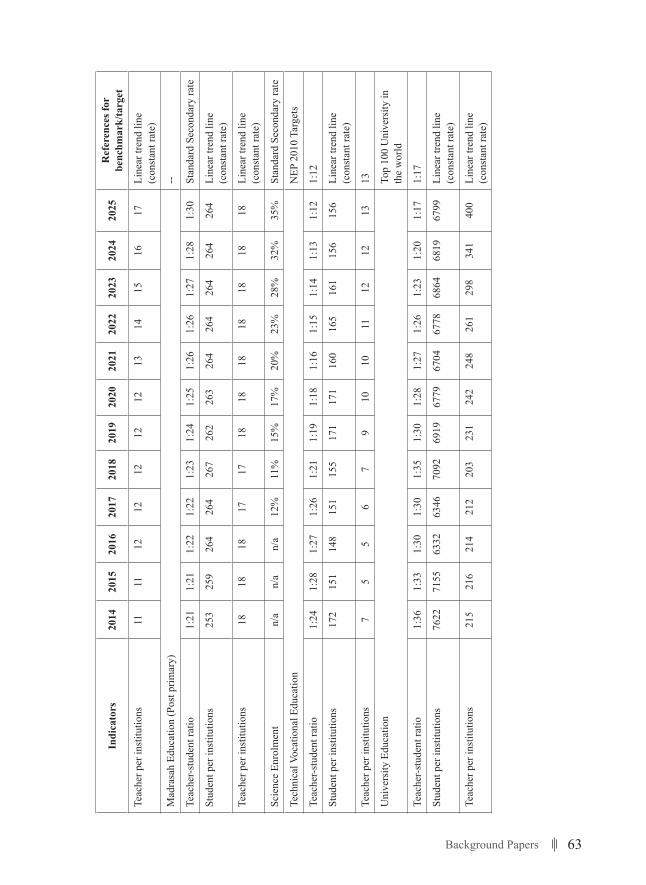
63Background Papers
Indi
cato
rs20
1420
1520
1620
1720
1820
1920
2020
2120
2220
2320
2420
25R
efer
ence
s for
be
nchm
ark/
targ
et
Teac
her p
er in
stitu
tions
1111
1212
1212
1213
1415
1617
Line
ar tr
end
line
(con
stan
t rat
e)
Mad
rasa
h Ed
ucat
ion
(Pos
t prim
ary)
--
Teac
her-s
tude
nt ra
tio1:
211:
211:
221:
221:
231:
241:
251:
261:
261:
271:
281:
30St
anda
rd S
econ
dary
rate
Stud
ent p
er in
stitu
tions
253
259
264
264
267
262
263
264
264
264
264
264
Line
ar tr
end
line
(con
stan
t rat
e)
Teac
her p
er in
stitu
tions
1818
1817
1718
1818
1818
1818
Line
ar tr
end
line
(con
stan
t rat
e)
Scie
nce
Enro
lmen
t n/
an/
an/
a12
%11
%15
%17
%20
%23
%28
%32
%35
%St
anda
rd S
econ
dary
rate
Tech
nica
l Voc
atio
nal E
duca
tion
NEP
201
0 Ta
rget
s
Teac
her-s
tude
nt ra
tio1:
241:
281:
271:
261:
211:
191:
181:
161:
151:
141:
131:
121:
12
Stud
ent p
er in
stitu
tions
172
151
148
151
155
171
171
160
165
161
156
156
Line
ar tr
end
line
(con
stan
t rat
e)
Teac
her p
er in
stitu
tions
75
56
79
1010
1112
1213
13
Uni
vers
ity E
duca
tion
Top
100
Uni
vers
ity in
th
e w
orld
Teac
her-s
tude
nt ra
tio1:
361:
331:
301:
301:
351:
301:
281:
271:
261:
231:
201:
171:
17
Stud
ent p
er in
stitu
tions
7622
7155
6332
6346
7092
6919
6779
6704
6778
6864
6819
6799
Line
ar tr
end
line
(con
stan
t rat
e)
Teac
her p
er in
stitu
tions
215
216
214
212
203
231
242
248
261
298
341
400
Line
ar tr
end
line
(con
stan
t rat
e)
64 General Economics Division (GED)
11. Overall Recommendations for Enhancing Skills of The Labour ForceWe have already discussed the sector-specific challenges and recommendations. In this section, we only elaborate on the broader and cross-cutting issues of the skill development in the country.
11.1 Policy level interventionsAlignment of policies for education, TVET, industry and long term growth strategy As stressed in several times in the previous sections, the success of skill development of the labor market hinges on the holistic approach as all tiers of education and vocational training are interlinked. High cognitive ability in the primary and secondary level determines the success in the vocational and tertiary education and which in turn influences the labor market outcomes. Therefore, all education and skill related policies should complement each other to achieve the broader goal of creating a knowledge and skilled based society. On the other hand, the country has a long term strategy for industrial development and growth. The industrial policy has also identified the thrust sectors which will propel the economy into higher growth trajectory to become the higher middle income country by 2013. Hence, polices for education and vocational training must be aligned with long term growth trajectory.
Sector wide approach (SWAp) for secondary education and TVETThe discussions have started to adopt sector wide approach for secondary and TVET education. The lessons learnt from the SWAp of the primary education and health sector can be applied to the secondary education and TVET to enhance the efficiency of the use of resources and to avoid duplications through better coordination.
A framework for public-private-NGO partnershipRole of the private sector and NGOs is instrumental in developing skills. As we know, learning or skill acquisition occurs most at the industry level through on-job training. There should be a framework how to incentivize training of the workers for the employers. The upcoming skill development policy should be very specific about it. There are a number of success cases of NGO initiatives in providing skills, particularly to the disadvantaged people (e.g., UCEP). The government (e.g., NSDC) should partner with them to scale up the already tested cases. The private sector is the ultimate users of the skilled labor; they know the best what kind of skill is required in present and in future. Therefore, involvement of the private sector in policy making, implementation (e.g., curricula development) and financing are critical for developing a holistic approach for skilling the labor force.
Recognition of soft skill in Skill Development Policy Soft skill is an important element in skill set; its labor market outcome is well recognized. Anecdotal evidence suggests that a large number of foreign workers work in the positions of mangers, both at mid and top level, in our industry and service sectors. The local technical persons or managers cannot grab these positions, largely because of the lack of their soft skills. These non-cognitive skills also help the technical persons to go up the ladder of the organorgram. Therefore, it is essential to recognize the importance of soft skill in the ensuing Skill Development Policy and prepare a strategic guideline on how to educate these skills. This training should start from the pre-primary level of education and should be an integral part of the curricula.
65Background Papers
11.2 Demand Side interventions
It is important to inform citizens about the demand for specific skills, both hard and soft, in the market. It is not the degree or a mere certificate but the proficiency in performing some tasks are more important - this message should be spread through effective campaign. The increasing share of graduates with humanities is a major concern who have little marketable skills. Girls are now increasingly sent to female madrasa, particularly in rural areas. The demand side interventions can work on choosing the right stream of education and vocational training. The return of vocational training for a below average students can be higher than general education. Parents and students in the villages or remote areas are not aware of the set of options they have and therefore cannot make educated decisions. Hence, large scale social campaign is required to achieve a socially desirable outcome.
11.3 Data and Monitoring
Datatotracksectorspecificskillsandskillmismatch
Unfortunately, we don’t have the data to track the skill level and skill mismatch at the sectoral level. In order to keep track of the progress and monitoring we need quality data to be generated at regular basis. In order to monitor the progress of SDG-4, we also require such data. To this end, BBS can take the initiative to conduct separate survey on skills or can include a module in the existing labor force survey. A subsample can also focus on cognitive and non-cognitive abilities.
Introduction of new indicators for the quality of education
Conventional indicators such as average years of schooling, net enrolment, student-teacher ratio, etc. cannot capture the quality of education and training. We have to go beyond these indicators and come up with a set of indicators that truly reflect the quality of education and skill level of the labor force.
66 General Economics Division (GED)
ReferencesADB, 2015a, Innovative Strategies for Accelerated Human Resource Development in South Asia, Manila, Philippines.
ADB, 2015b. Bangladesh Secondary Education Sector Investment Program. Manila, Philippines.
Asian Development Bank.
ADB, 2008, Education Sector in Bangladesh: What Worked Well and Why under the Sector-Wide Approach? Manila, Philippines.
Asadullah, M. N., Chakrabarti, R., & Chaudhury, N. (2013). What determines religious school choice? Theory and evidence from rural Bangladesh. Bulletin of Economic Research.
Asadullah, M. N., Chaudhury, N., & Josh, S. R.-Z. (2009). Secondary School Madrasas in Bangladesh: Incidence, Quality, and Implications for Reform. South Asia Region: Human Development Sector South Asia Region.
Asadullahah, M. N., Chaudhurye, N., & Amit. (2007). Student achievement conditioned upon school selection: Religious and secular secondary school quality in Bangladesh. Economics of Education Review, 26 (2007) 648–659.
ASPR. (2019). Annual sector performance report 2019. Dhaka, Bangladesh Primary Education, Government of the People’s Republic of Bangladesh Directorate of Primary Education Fourth Primary Education Development Programme (PEDP4).
BANBEIS. (2018). Annual Primary School Census 2018. Bangladesh: Bangladesh Bureau of Educational Information and Statistics.
Becker, G. S. (1962). Investment in Human Capital: A Theoretical Analysis . Journal of Political Economy, Volume 70 (Number 5, Part 2).
BIDS. (2017). Labor Market Skill Gap for Bangladesh (Macro and Micro level Study). Skills for Employment Investment Program (SEIP), Finance Division, Ministry of Finance. Bangladesh Institute of Development Studies (BIDS).
Brunette, T., Crouch, L., Cummiskey, C., Dick, A., Henny, C., Jordan, R., . . . Weatherholt, T. (2017). Primary 1 Repetition and Pre-Primary Education in Uganda. Research Brief . RTI International.
Education Watch, 2013, Skills Development in Bangladesh: Enhancing the Youth Skills Profile, Campaign for Popular Education (CAMPE), Dhaka, Bangladesh.
Education Watch, (2015). Moving forward from SDG: Accelerating progress for quality primary education. Bangladesh: Campaign for Popular Education (CAMPE) .
Education Watch, (2018-19). Secondary School Teachers in Bangladesh In the Light of SDG4. Bangladesh: Campaign for Popular Education (CAMPE).
Eric A. Hanushek, V. L. (2008). Do Students Care about School Quality? Determinants of Dropout Behavior in Developing Countries. The University of Chicago Press Journals, 2(1).
General Economic Division, 2017, 7th Five Year Plan FY 2016- FY 2020: Accelerating Growth and Empowering Citizens, Planning Commission, Government of Bangladesh.
General Economic Division, 2011, Planning Commission, Perspective Plan of Bangladesh 2010-
67Background Papers
2021, Planning Commission, Government of Bangladesh.
General Economic Division, 2020, Perspective Plan 2041, Planning Commission, Government of Bangladesh.
Hanushek, E. A. (2013). Economic growth in developing countries: The role of human capital. Economics of Education Review, Volume 37(December 2013), Pages 204-212.
Hanushek, E. A., & Kimko, D. D. (2000). Schooling, Labor-Force Quality, and the Growth of Nations. American Economic Review, 1184-1208.
Hanushek, E. A., & Woessmann, L. (2009). Schooling, Cognitive Skills, and the Latin American Growth Puzzle. The National Bureau of Economic Research, Paper No. 15066.
Hasan, U., Islam, M. F., Islam, M. N., Zaman, S. B., Anuva, S. T., Emu, F. I., & Zaki, T. (2020). Towards Developing an IoT Based Gaming Application for Improving Cognitive Skills of Autistic Kids. Asian Conference on Intelligent Information and Database Systems. ACIIDS 2020: Intelligent Information and Database Systems.
Heckman, J. J. (2006). Skill Formation and the Economics of Investing in Disadvantaged Children. Science, Pages 1900-1902.
HIES. (2016). Household Income Expenditure Survey (HIES). Bangladesh Bureau of Statistics (BBS).
Islam, A. (2019). Parent–teacher meetings and student outcomes: Evidence from a developing country. European Economic Review, 11(C), 273-304.
Islam, A. John List (2020). Investing in Our Future: The Early Childhood Intervention and Parental Involvement in Bangladesh, unpublished.
Krueger, D., & Kumar, K. B. (2004). Skill-Specific rather than General Education: A Reason for US–Europe Growth Differences? Journal of Economic Growth , Volume 9, Pages 167–207(2004).
Mahmud, Z., M. I., Shahana, S., Islam, S., & Ibon, W. F. (2018). Tracer Study of Graduates of Universities in Bangladesh. Bangladesh Institute of Development Studies (BIDS).
Mia, Ahmadullah and Md. Rezaul Karim, Survey of TVET Providers Bangladesh, Bangladesh Technical Education Board, GoB, 2015.
Ministry of Education. (2010). National Education Policy 2010.
Ministry of Education, 2013. Master Plan for ICT in Education in Bangladesh (2012-2021), GoB.
Nomura, S., Hong, S. Y., Nordman, C. J., Remi Sarr, L., & Vawda, A. Y. (2013). An assessment of skills in the formal sector labor market in Bangladesh: a technical report on the enterprise-based skills survey 2012. Bangladesh, The World Bank.
Nordman, C. J., Sarr, L. R., & Sharma, S. (2019). Skills, personality traits, and gender wage gaps: evidence from Bangladesh. Oxford Economic Papers, Volume 71, Issue 3(July 2019), Pages 687–708,.
NSA. (2017). National Student Assessment 2017 for Grades 3 and 5. Bangladesh: Monitoring & Evaluation Division Directorate of Primary Education Ministry of Primary & Mass Education.
NSDP. (2011). National Skill Development Policy (NSDP). Ministry of Education.
68 General Economics Division (GED)
UNDP. (2019). Inequalities in Human Development in the 21st Century. Bangladesh: Human Development Report.
University Grants Commission, 2018. Strategic Plan for Higher Education in Bangladesh: 2018-2030, Government of Bangladesh.
World Bank, 2013, Bangladesh Education Sector Review: Seeding Fertile Ground: Education That Works for Bangladesh, Report No. 80613-BD, Washington, DC
World Bank, 2017, Graduate Employability of Affiliated Colleges New Evidence from Bangladesh
Graduate Tracking Survey on Affiliated Colleges of Bangladesh National University., Washington DC.
World Bank, 2017, Breaking the Glass Ceiling: Challenges in Female Participation in Technical Diploma Education in Bangladesh, Washington DC.
World Bank, 2017. Employability of Post-Secondary TVET in Bangladesh: Tracking Survey of Graduates of Polytechnics, Washington DC.
World Bank, (2019). Bangladesh Tertiary Education Review. 1818 H Street NW, Washington, The World Bank
World Bank, 2019, Bangladesh Tertiary Education Sector Review: Skills and Innovation for Growth, Washington DC.
69Background Papers
Study 12: Addressing the Health and Nutritional Challenges in Bangladesh: Impact of demographic transition and
COVID-19
Dr. Tahmeed Ahmed MBBS, PhD*
* Executive Director, International Centre for Diarrhoeal Disease Research, Bangladesh (icddr,b).

70 General Economics Division (GED)
71Background Papers
Introduction
Since achieving independence in 1971 the demographic, health and nutritional status of the population of Bangladesh has changed dramatically. From a nation of 75 million people struggling to be emancipated from the clutches of subjugation, food insecurity and profoundly high rates of malnutrition among children and women, Bangladesh is now a nation of 165 million people self-sufficient in the staple rice, fish and vegetables. Yet, this has happened despite the arable land decreasing by about 0.5% every year. The situation has changed considerably even over the last 10 years. Malnutrition rates among children and women have decreased considerably during the last decade, micronutrient deficiencies are still present but in substantially reduced proportions. How has this been made possible? Agricultural production has increased many folds, fresh water fish farming as well as catch from the ocean have expanded, the poultry and cattle rearing industries have successfully blossomed providing eggs and milk to the population. Remittance from migrant workers has increased substantially charging up the economy. Not to speak of the huge earning from the ready-made garments industry. But overall, it is the national development over the last couple of decades that has contributed to the huge exemplary impact on nutrition and food security in Bangladesh.
Like many other low and middle countries, Bangladesh also faces shifts in population dynamics. Life expectancy has increased from 65 years in 2000 to 72 years in 2017. Purchasing power of the population in general has increased. Given the need to adapt to the faster ‘corporate’ lifestyle, people particularly the young are indulging more in fast food and shying away from unprocessed, healthier dietary habits. The economic development has ushered a burgeoning corporate culture in office and at home leaving less room for physical activity. Sedentary lifestyle, reliance on diets rich in carbohydrates and fat, overweight and obesity are a consequence resulting in an alarming increase in the burden of nutrition related non-communicable diseases including type II diabetes mellitus, hypertension, high blood cholesterol, ischemic heart disease and fatty liver disease.
The population of the country is expected to grow and stabilize at around 250 million in 2050. With this huge population will come the problems of food insecurity, water and sanitation issues, and the deleterious effects of climate change on health and nutrition of the population, vector-borne illnesses that are likely to increase because of the increase in atmospheric temperature, and reduced agricultural productivity associated with saturation of the yield of crops. Natural calamities notably flash floods are occurring with increased frequency and badly affecting crops.
Even though the numbers are inconsequential given the size of the country’s population, the Forcibly Displaced Myanmar Nationals (FDMN, Rohingyas) are indeed creating a dent in the economy of the country. The feeding of the 1 million plus population of the Rohingyas requires a huge volume of food, not to speak of the negative impact on the environment. But considering it as one of the most intense humanitarian issues ever seen, the country has rightfully decided to support them at this time of distress. The next, and perhaps the most significant, game changer is the COVID-19 pandemic. With the first case detected in the first week of March 2020, the country already has 800,540 PCR proven cases and has seen 12,619 deaths due to COVID-19 as of 31st May 2021. The pandemic has caused economic crisis as well as a dent on the entire food supply chain in the country which may further hamper the progress in relation to health and nutrition of the population.
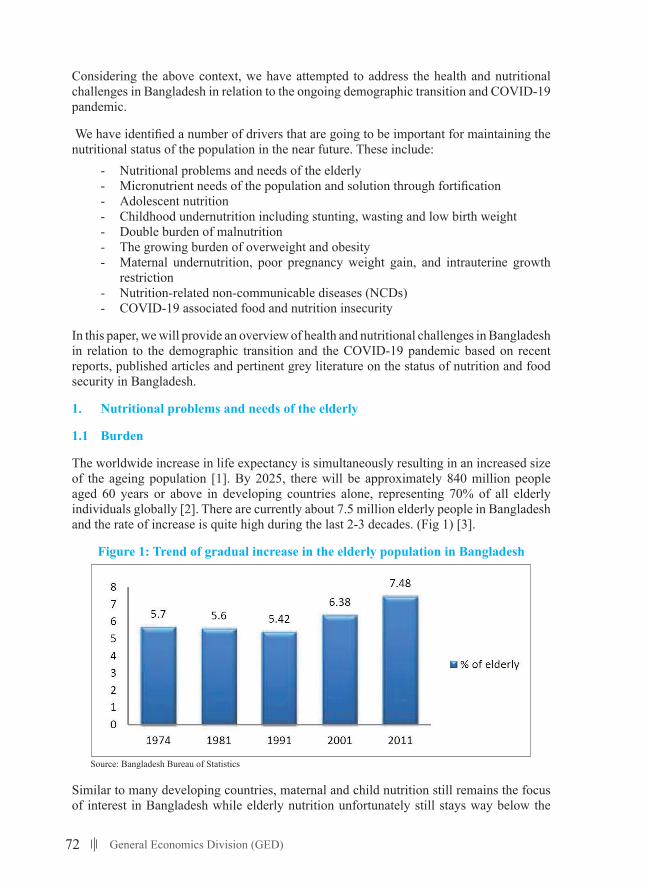
72 General Economics Division (GED)
Considering the above context, we have attempted to address the health and nutritional challenges in Bangladesh in relation to the ongoing demographic transition and COVID-19 pandemic.
We have identified a number of drivers that are going to be important for maintaining the nutritional status of the population in the near future. These include:
- Nutritional problems and needs of the elderly - Micronutrient needs of the population and solution through fortification - Adolescent nutrition- Childhood undernutrition including stunting, wasting and low birth weight- Double burden of malnutrition- The growing burden of overweight and obesity - Maternal undernutrition, poor pregnancy weight gain, and intrauterine growth
restriction - Nutrition-related non-communicable diseases (NCDs) - COVID-19 associated food and nutrition insecurity
In this paper, we will provide an overview of health and nutritional challenges in Bangladesh in relation to the demographic transition and the COVID-19 pandemic based on recent reports, published articles and pertinent grey literature on the status of nutrition and food security in Bangladesh.
1. Nutritional problems and needs of the elderly
1.1 Burden
The worldwide increase in life expectancy is simultaneously resulting in an increased size of the ageing population [1]. By 2025, there will be approximately 840 million people aged 60 years or above in developing countries alone, representing 70% of all elderly individuals globally [2]. There are currently about 7.5 million elderly people in Bangladesh and the rate of increase is quite high during the last 2-3 decades. (Fig 1) [3].
Figure 1: Trend of gradual increase in the elderly population in Bangladesh
Page 3 of 22
The demography and health and nutritional status of the population are changing and there are a number of drivers that are going to be important for maintain the nutritional status of the population in the near future. These include:
- Nutritional needs of the elderly - Micronutrient needs of the population and solution through fortification - Adolescent nutrition - Stunting - Double burden of malnutrition - Overweight and obesity - Maternal undernutrition - Low birth weight - Nutrition-related non-communicable disease (NCD) - COVID-19 associated food and nutrition insecurity
1. Nutritional problems and needs of the elderly
Burden
The worldwide increase in life expectancy is simultaneously resulting in an increased size of the ageing population [1]. By 2025, there will be approximately 840 million people aged 60 years or above in developing countries alone, representing 70% of all elderly individuals globally [2]. There are currently about 7.5 million elderly people in Bangladesh and the rate of their increase is quite high during the last 2-3 decades. (Fig 1) [3].
Figure 1. Trend of gradual increase in the elderly population in Bangladesh
(Source: Bangladesh Bureau of Statistics)
Like other developing countries, maternal and child nutrition still remains the focus of interest in Bangladesh while elderly nutrition still stays way below the priority list [1]. Information on the nutritional status of the elderly in Bangladesh is scarce and not well documented [4]. Studies show, majority of the people over 60 reside in rural areas where there is lack of proper health care services [5] and more than
Source: Bangladesh Bureau of Statistics
Similar to many developing countries, maternal and child nutrition still remains the focus of interest in Bangladesh while elderly nutrition unfortunately still stays way below the
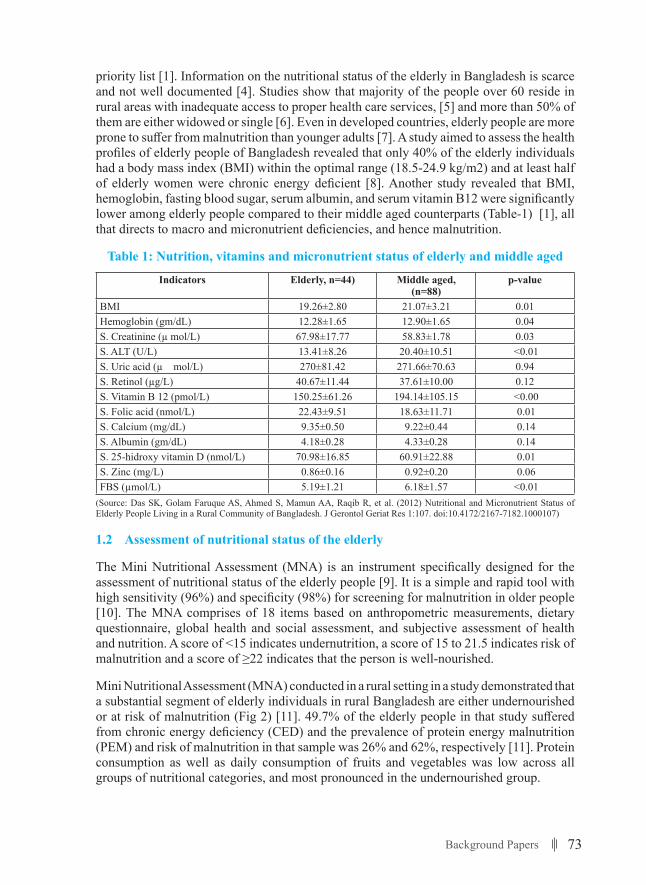
73Background Papers
priority list [1]. Information on the nutritional status of the elderly in Bangladesh is scarce and not well documented [4]. Studies show that majority of the people over 60 reside in rural areas with inadequate access to proper health care services, [5] and more than 50% of them are either widowed or single [6]. Even in developed countries, elderly people are more prone to suffer from malnutrition than younger adults [7]. A study aimed to assess the health profiles of elderly people of Bangladesh revealed that only 40% of the elderly individuals had a body mass index (BMI) within the optimal range (18.5-24.9 kg/m2) and at least half of elderly women were chronic energy deficient [8]. Another study revealed that BMI, hemoglobin, fasting blood sugar, serum albumin, and serum vitamin B12 were significantly lower among elderly people compared to their middle aged counterparts (Table-1) [1], all that directs to macro and micronutrient deficiencies, and hence malnutrition.
Table 1: Nutrition, vitamins and micronutrient status of elderly and middle aged
Indicators Elderly, n=44) Middle aged, (n=88)
p-value
BMI 19.26±2.80 21.07±3.21 0.01Hemoglobin (gm/dL) 12.28±1.65 12.90±1.65 0.04S. Creatinine (µ mol/L) 67.98±17.77 58.83±1.78 0.03S. ALT (U/L) 13.41±8.26 20.40±10.51 <0.01S. Uric acid (µ mol/L) 270±81.42 271.66±70.63 0.94S. Retinol (µg/L) 40.67±11.44 37.61±10.00 0.12S. Vitamin B 12 (pmol/L) 150.25±61.26 194.14±105.15 <0.00S. Folic acid (nmol/L) 22.43±9.51 18.63±11.71 0.01S. Calcium (mg/dL) 9.35±0.50 9.22±0.44 0.14S. Albumin (gm/dL) 4.18±0.28 4.33±0.28 0.14S. 25-hidroxy vitamin D (nmol/L) 70.98±16.85 60.91±22.88 0.01S. Zinc (mg/L) 0.86±0.16 0.92±0.20 0.06FBS (µmol/L) 5.19±1.21 6.18±1.57 <0.01
(Source: Das SK, Golam Faruque AS, Ahmed S, Mamun AA, Raqib R, et al. (2012) Nutritional and Micronutrient Status of Elderly People Living in a Rural Community of Bangladesh. J Gerontol Geriat Res 1:107. doi:10.4172/2167-7182.1000107)
1.2 Assessment of nutritional status of the elderly
The Mini Nutritional Assessment (MNA) is an instrument specifically designed for the assessment of nutritional status of the elderly people [9]. It is a simple and rapid tool with high sensitivity (96%) and specificity (98%) for screening for malnutrition in older people [10]. The MNA comprises of 18 items based on anthropometric measurements, dietary questionnaire, global health and social assessment, and subjective assessment of health and nutrition. A score of <15 indicates undernutrition, a score of 15 to 21.5 indicates risk of malnutrition and a score of ≥22 indicates that the person is well-nourished.
Mini Nutritional Assessment (MNA) conducted in a rural setting in a study demonstrated that a substantial segment of elderly individuals in rural Bangladesh are either undernourished or at risk of malnutrition (Fig 2) [11]. 49.7% of the elderly people in that study suffered from chronic energy deficiency (CED) and the prevalence of protein energy malnutrition (PEM) and risk of malnutrition in that sample was 26% and 62%, respectively [11]. Protein consumption as well as daily consumption of fruits and vegetables was low across all groups of nutritional categories, and most pronounced in the undernourished group.
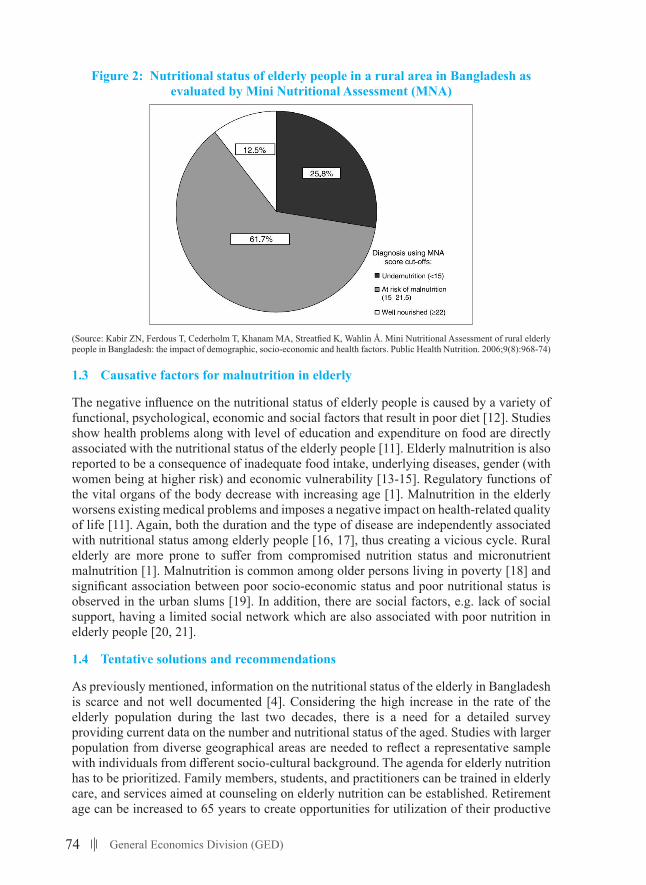
74 General Economics Division (GED)
Figure 2: Nutritional status of elderly people in a rural area in Bangladesh as evaluated by Mini Nutritional Assessment (MNA)
Page 5 of 22
Figure 2. Nutritional status of elderly people in a rural area in Bangladesh as evaluated by Mini Nutritional Assessment (MNA)
(Source: Kabir ZN, Ferdous T, Cederholm T, Khanam MA, Streatfied K, Wahlin Å. Mini Nutritional Assessment of rural elderly people in Bangladesh: the impact of demographic, socio-economic and health factors. Public Health Nutrition. 2006;9(8):968-74.)
Causative factors for malnutrition in elderly The negative influence on the nutritional status of elderly people is caused by a variety of functional, psychological, economic and social factors that result in poor diet [12]. Studies show health problems along with level of education and expenditure on food are directly associated with the nutritional status of the elderly people [11]. Elderly malnutrition is also reported to be a consequence of inadequate food intake, underlying diseases, gender (with women being at higher risk) and economic vulnerability [13-15]. Regulatory functions of the vital organs of the body decreases with increasing age [1]. Malnutrition in the elderly worsens existing medical problems and imposes a negative impact on health-related quality of life [11]. Again, both the duration and the type of disease are independently associated with nutritional status among elderly people [16, 17], thus creating a vicious cycle. Rural elderly are more prone to suffer from compromised nutrition status and micronutrient malnutrition [1]. Malnutrition is common among older persons living in poverty [18] and significant association between poor socio-economic status and poor nutritional status is observed in the urban slums [19]. In addition, there are social factors, e.g. lack of social support, having a limited social network which are also associated with poor nutrition in elderly people [20, 21].
Tentative solution and recommendations As previously mentioned, information on the nutritional status of the elderly in Bangladesh is scarce and not well documented [4]. Considering the high increase rate of the elderly population during the last two decades, there is a need for a detailed survey providing current data on the number and nutritional status of the aged. Studies with larger population from diverse geographical areas are needed to reflect a
(Source: Kabir ZN, Ferdous T, Cederholm T, Khanam MA, Streatfied K, Wahlin Å. Mini Nutritional Assessment of rural elderly people in Bangladesh: the impact of demographic, socio-economic and health factors. Public Health Nutrition. 2006;9(8):968-74)
1.3 Causative factors for malnutrition in elderly
The negative influence on the nutritional status of elderly people is caused by a variety of functional, psychological, economic and social factors that result in poor diet [12]. Studies show health problems along with level of education and expenditure on food are directly associated with the nutritional status of the elderly people [11]. Elderly malnutrition is also reported to be a consequence of inadequate food intake, underlying diseases, gender (with women being at higher risk) and economic vulnerability [13-15]. Regulatory functions of the vital organs of the body decrease with increasing age [1]. Malnutrition in the elderly worsens existing medical problems and imposes a negative impact on health-related quality of life [11]. Again, both the duration and the type of disease are independently associated with nutritional status among elderly people [16, 17], thus creating a vicious cycle. Rural elderly are more prone to suffer from compromised nutrition status and micronutrient malnutrition [1]. Malnutrition is common among older persons living in poverty [18] and significant association between poor socio-economic status and poor nutritional status is observed in the urban slums [19]. In addition, there are social factors, e.g. lack of social support, having a limited social network which are also associated with poor nutrition in elderly people [20, 21].
1.4 Tentative solutions and recommendations
As previously mentioned, information on the nutritional status of the elderly in Bangladesh is scarce and not well documented [4]. Considering the high increase in the rate of the elderly population during the last two decades, there is a need for a detailed survey providing current data on the number and nutritional status of the aged. Studies with larger population from diverse geographical areas are needed to reflect a representative sample with individuals from different socio-cultural background. The agenda for elderly nutrition has to be prioritized. Family members, students, and practitioners can be trained in elderly care, and services aimed at counseling on elderly nutrition can be established. Retirement age can be increased to 65 years to create opportunities for utilization of their productive
75Background Papers
years and expansion of large-scale social security programs, such as, pension, old age allowance and health insurance should be considered. Various societal and economic factors have resulted in erosion in the traditional values of respecting and taking care of the elders. These values are very important and have to inculcated in the family starting from childhood. Finally, a package of nutritious food and micronutrients affordable with the help of the old age allowance should be developed for the elderly.
2. Micronutrientneedsofthepopulationandsolutionthroughfortification
2.1 Burden
Prevalence of micronutrient deficiency still exists at a level of high magnitude. The major micronutrient deficiency problems affecting Bangladesh are vitamin A, anemia and iron deficiency, zinc, vitamin D and iodine.
Vitamin A: According to the report of the National Micronutrient Deficiency Survey done in 2011-12, the prevalence of subclinical vitamin A deficiency is 20.5% among preschool age children and 38.1% in preschool aged slum-dwelling children [22]. The prevalence is 20.9% and 5.4% respectively in the school age children and the non-pregnant and non-lactating (NPNL) women.
Anemia: More than half of young children, one fourth of the school age children and one-third of the women are anemic. More than 60% under-two children suffer from anemia. The prevalence of anemia in the preschool age children is 33.1%; 37% and 23% respectively in rural and urban strata. The prevalence of anemia in the school age children is 19% and 17% respectively in the 6-11 year and 12-14 year groups, while it is 26% among NPNL women [22].
Irondeficiency: The national prevalence of iron deficiency in preschool age children and NPNL women is 10.7% and 7.1% respectively. It is 3.9% and 9.5 % in the school age children aged 6-11 year and 12-14 year respectively. [22].
Zinc status: The national prevalence of zinc deficiency is 44.6% in the preschool age children, which is higher in the slum-dwelling children (51.7%) compared to non-slum dwelling urban ones (29.5%). In the NPNL women the national prevalence is 57.3%, the prevalence in slums being a staggering 66.4% [22].
B12 and folate status: Nationally representative data on B12 and folate status is limited to NPNL women. The national prevalence of folate deficiency is 9.1% and B12 deficiency is 23% at the national level [22].
Iodine: The prevalence of iodine deficiency of the school age children was 40%. In the NPNL women, the prevalence of iodine deficiency was 42.1%. The impoverished section of the women is iodine deficient [22].
Calcium and vitamin-D: Mean serum calcium concentrations in preschool-aged children, school–aged children, and NPNL reproductive-age women living in Bangladesh are 9.1, 9.3, and 8.9 mg/dL respectively; and mean vitamin D (25-hydroxyvitamin D) status is 56.3, 50.7, and 41.8 nmol/L, respectively. Vitamin D sufficiency, insufficiency, and deficiency of living in rural, urban, and urban slum areas of Bangladesh are 18.3%, 42.1%, 39.6%; 7.6%, 46.9%, 45.5%; and 6.4%, 22.1%, 71.5%, respectively. This nationally representative serum
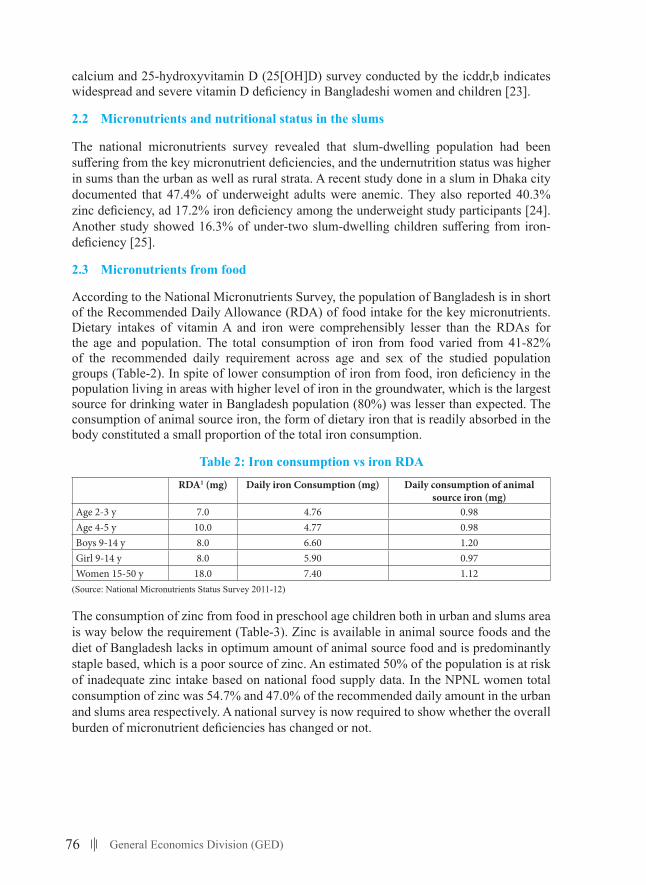
76 General Economics Division (GED)
calcium and 25-hydroxyvitamin D (25[OH]D) survey conducted by the icddr,b indicates widespread and severe vitamin D deficiency in Bangladeshi women and children [23].
2.2 Micronutrients and nutritional status in the slums
The national micronutrients survey revealed that slum-dwelling population had been suffering from the key micronutrient deficiencies, and the undernutrition status was higher in sums than the urban as well as rural strata. A recent study done in a slum in Dhaka city documented that 47.4% of underweight adults were anemic. They also reported 40.3% zinc deficiency, ad 17.2% iron deficiency among the underweight study participants [24]. Another study showed 16.3% of under-two slum-dwelling children suffering from iron-deficiency [25].
2.3 Micronutrients from food
According to the National Micronutrients Survey, the population of Bangladesh is in short of the Recommended Daily Allowance (RDA) of food intake for the key micronutrients. Dietary intakes of vitamin A and iron were comprehensibly lesser than the RDAs for the age and population. The total consumption of iron from food varied from 41-82% of the recommended daily requirement across age and sex of the studied population groups (Table-2). In spite of lower consumption of iron from food, iron deficiency in the population living in areas with higher level of iron in the groundwater, which is the largest source for drinking water in Bangladesh population (80%) was lesser than expected. The consumption of animal source iron, the form of dietary iron that is readily absorbed in the body constituted a small proportion of the total iron consumption.
Table 2: Iron consumption vs iron RDA
RDA1 (mg) Daily iron Consumption (mg) Daily consumption of animal source iron (mg)
Age 2-3 y 7.0 4.76 0.98Age 4-5 y 10.0 4.77 0.98Boys 9-14 y 8.0 6.60 1.20Girl 9-14 y 8.0 5.90 0.97Women 15-50 y 18.0 7.40 1.12
(Source: National Micronutrients Status Survey 2011-12)
The consumption of zinc from food in preschool age children both in urban and slums area is way below the requirement (Table-3). Zinc is available in animal source foods and the diet of Bangladesh lacks in optimum amount of animal source food and is predominantly staple based, which is a poor source of zinc. An estimated 50% of the population is at risk of inadequate zinc intake based on national food supply data. In the NPNL women total consumption of zinc was 54.7% and 47.0% of the recommended daily amount in the urban and slums area respectively. A national survey is now required to show whether the overall burden of micronutrient deficiencies has changed or not.
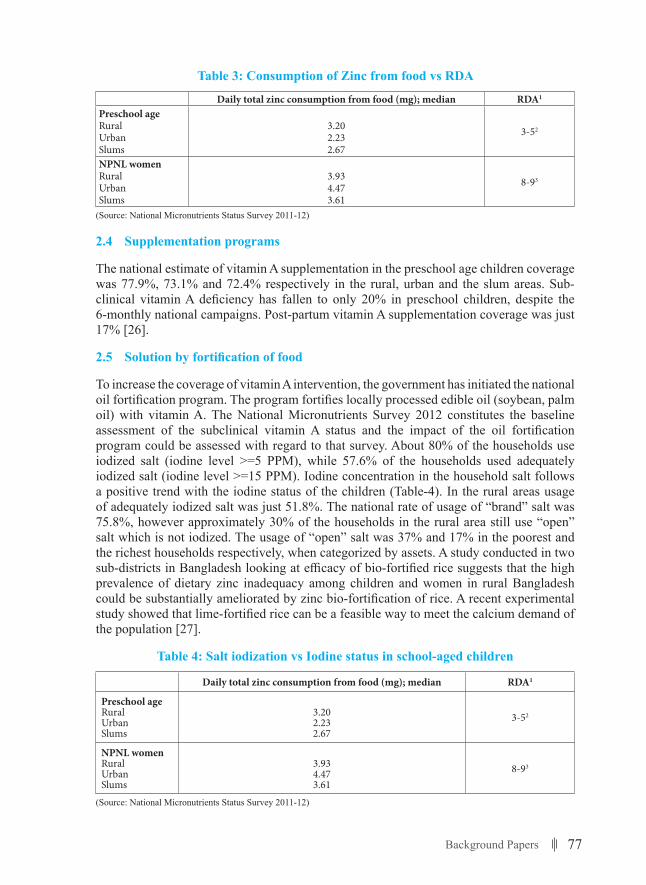
77Background Papers
Table 3: Consumption of Zinc from food vs RDA
Daily total zinc consumption from food (mg); median RDA1
Preschool ageRuralUrbanSlums
3.202.232.67
3-52
NPNL womenRural Urban Slums
3.934.473.61
8-93
(Source: National Micronutrients Status Survey 2011-12)
2.4 Supplementation programs
The national estimate of vitamin A supplementation in the preschool age children coverage was 77.9%, 73.1% and 72.4% respectively in the rural, urban and the slum areas. Sub-clinical vitamin A deficiency has fallen to only 20% in preschool children, despite the 6-monthly national campaigns. Post-partum vitamin A supplementation coverage was just 17% [26].
2.5 Solutionbyfortificationoffood
To increase the coverage of vitamin A intervention, the government has initiated the national oil fortification program. The program fortifies locally processed edible oil (soybean, palm oil) with vitamin A. The National Micronutrients Survey 2012 constitutes the baseline assessment of the subclinical vitamin A status and the impact of the oil fortification program could be assessed with regard to that survey. About 80% of the households use iodized salt (iodine level >=5 PPM), while 57.6% of the households used adequately iodized salt (iodine level >=15 PPM). Iodine concentration in the household salt follows a positive trend with the iodine status of the children (Table-4). In the rural areas usage of adequately iodized salt was just 51.8%. The national rate of usage of “brand” salt was 75.8%, however approximately 30% of the households in the rural area still use “open” salt which is not iodized. The usage of “open” salt was 37% and 17% in the poorest and the richest households respectively, when categorized by assets. A study conducted in two sub-districts in Bangladesh looking at efficacy of bio-fortified rice suggests that the high prevalence of dietary zinc inadequacy among children and women in rural Bangladesh could be substantially ameliorated by zinc bio-fortification of rice. A recent experimental study showed that lime-fortified rice can be a feasible way to meet the calcium demand of the population [27].
Table 4: Salt iodization vs Iodine status in school-aged children
Daily total zinc consumption from food (mg); median RDA1
Preschool ageRuralUrbanSlums
3.202.232.67
3-52
NPNL womenRural Urban Slums
3.934.473.61
8-93
(Source: National Micronutrients Status Survey 2011-12)
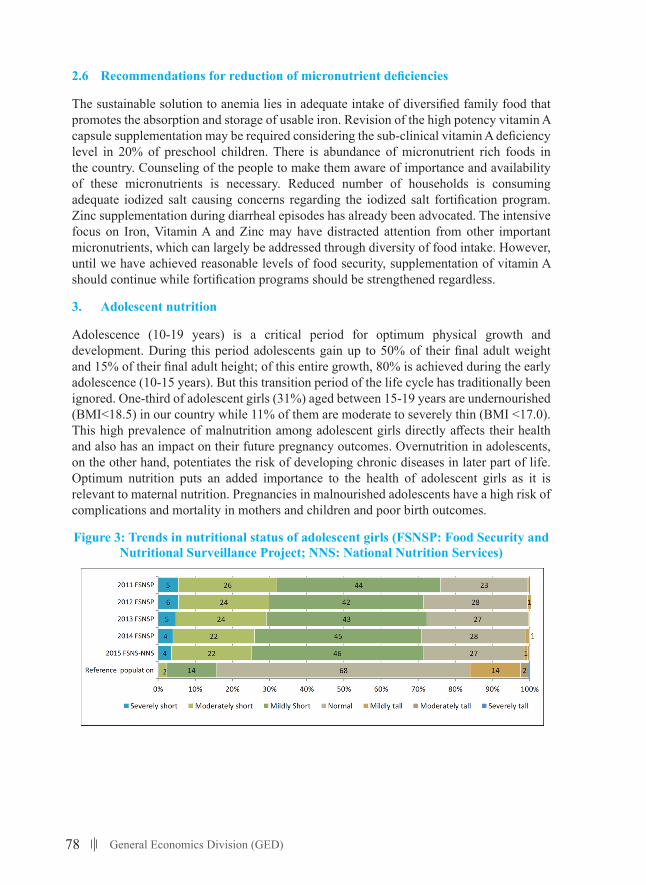
78 General Economics Division (GED)
2.6 Recommendationsforreductionofmicronutrientdeficiencies
The sustainable solution to anemia lies in adequate intake of diversified family food that promotes the absorption and storage of usable iron. Revision of the high potency vitamin A capsule supplementation may be required considering the sub-clinical vitamin A deficiency level in 20% of preschool children. There is abundance of micronutrient rich foods in the country. Counseling of the people to make them aware of importance and availability of these micronutrients is necessary. Reduced number of households is consuming adequate iodized salt causing concerns regarding the iodized salt fortification program. Zinc supplementation during diarrheal episodes has already been advocated. The intensive focus on Iron, Vitamin A and Zinc may have distracted attention from other important micronutrients, which can largely be addressed through diversity of food intake. However, until we have achieved reasonable levels of food security, supplementation of vitamin A should continue while fortification programs should be strengthened regardless.
3. Adolescent nutrition
Adolescence (10-19 years) is a critical period for optimum physical growth and development. During this period adolescents gain up to 50% of their final adult weight and 15% of their final adult height; of this entire growth, 80% is achieved during the early adolescence (10-15 years). But this transition period of the life cycle has traditionally been ignored. One-third of adolescent girls (31%) aged between 15-19 years are undernourished (BMI<18.5) in our country while 11% of them are moderate to severely thin (BMI <17.0). This high prevalence of malnutrition among adolescent girls directly affects their health and also has an impact on their future pregnancy outcomes. Overnutrition in adolescents, on the other hand, potentiates the risk of developing chronic diseases in later part of life. Optimum nutrition puts an added importance to the health of adolescent girls as it is relevant to maternal nutrition. Pregnancies in malnourished adolescents have a high risk of complications and mortality in mothers and children and poor birth outcomes.
Figure 3: Trends in nutritional status of adolescent girls (FSNSP: Food Security and Nutritional Surveillance Project; NNS: National Nutrition Services)
Page 10 of 28
Figure 3. Trends in nutritional status of adolescent girls (FSNSP: Food Security and Nutritional Surveillance Project; NNS: National Nutrition Services)
Prevalence of undernutrition among adolescent girls in Bangladesh is reducing but still, it is very high when compared to the WHO targets. According to the Bangladesh Demographic and health survey (BDHS) 2017-18, prevalence of underweight decreased from 39.5% to 30.9% from 2004 to 2014. However, the prevalence of overweight/obesity among adolescent girls increased from 1.7% to 7.0% during the same period. Additionally, adolescent girls in Bangladesh are also facing micronutrient deficiencies. The National Micronutrients Status Survey (NMSS) 2011-2012 in Bangladesh shows that nationally 74% in children 6-14 years old and 40% in 15-49 year old non-pregnant, non-lactating women (NPNLW) suffer from vitamin A deficiency, 40% children and 39% NPNLW are suffering from iodine deficiency. Anemia and iron deficiencies in adolescents are not as high as vitamin A, iodine. Nationally, anemia is highest for NPNL women 15-49 years (26%) compared to children 6-11 years (19%) and 12-14 years (17%).
In Bangladesh, various organizations are implementing programs for the adolescent population. Among the nutrition-specific programs, school-based nutrition education, school feeding program and national food fortification programs should be mentioned. Different national and international organizations are also implementing various nutrition-sensitive programs such as Sexual and Reproductive Health and rights
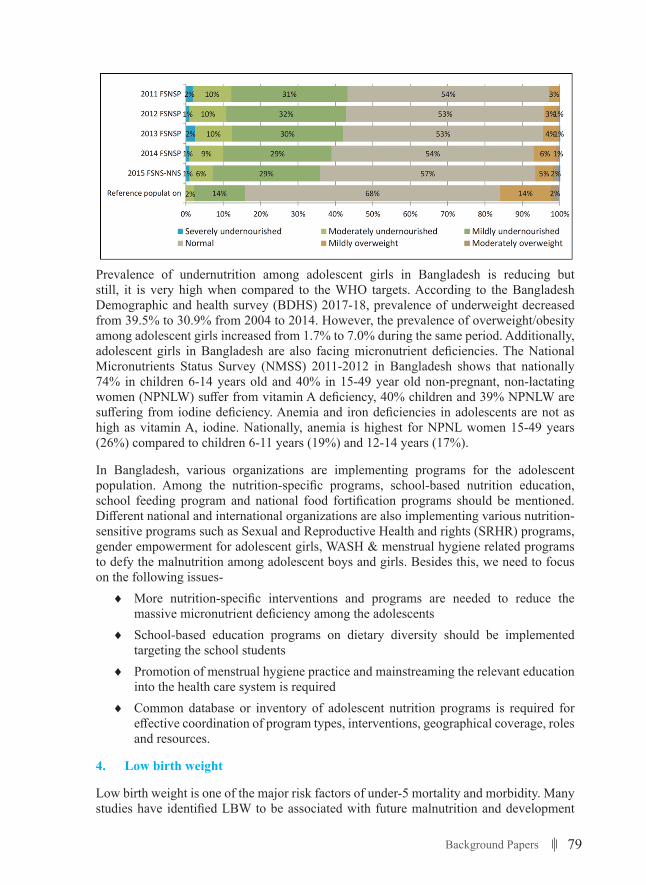
79Background Papers
Page 10 of 28
Figure 3. Trends in nutritional status of adolescent girls (FSNSP: Food Security and Nutritional Surveillance Project; NNS: National Nutrition Services)
Prevalence of undernutrition among adolescent girls in Bangladesh is reducing but still, it is very high when compared to the WHO targets. According to the Bangladesh Demographic and health survey (BDHS) 2017-18, prevalence of underweight decreased from 39.5% to 30.9% from 2004 to 2014. However, the prevalence of overweight/obesity among adolescent girls increased from 1.7% to 7.0% during the same period. Additionally, adolescent girls in Bangladesh are also facing micronutrient deficiencies. The National Micronutrients Status Survey (NMSS) 2011-2012 in Bangladesh shows that nationally 74% in children 6-14 years old and 40% in 15-49 year old non-pregnant, non-lactating women (NPNLW) suffer from vitamin A deficiency, 40% children and 39% NPNLW are suffering from iodine deficiency. Anemia and iron deficiencies in adolescents are not as high as vitamin A, iodine. Nationally, anemia is highest for NPNL women 15-49 years (26%) compared to children 6-11 years (19%) and 12-14 years (17%).
In Bangladesh, various organizations are implementing programs for the adolescent population. Among the nutrition-specific programs, school-based nutrition education, school feeding program and national food fortification programs should be mentioned. Different national and international organizations are also implementing various nutrition-sensitive programs such as Sexual and Reproductive Health and rights
Prevalence of undernutrition among adolescent girls in Bangladesh is reducing but still, it is very high when compared to the WHO targets. According to the Bangladesh Demographic and health survey (BDHS) 2017-18, prevalence of underweight decreased from 39.5% to 30.9% from 2004 to 2014. However, the prevalence of overweight/obesity among adolescent girls increased from 1.7% to 7.0% during the same period. Additionally, adolescent girls in Bangladesh are also facing micronutrient deficiencies. The National Micronutrients Status Survey (NMSS) 2011-2012 in Bangladesh shows that nationally 74% in children 6-14 years old and 40% in 15-49 year old non-pregnant, non-lactating women (NPNLW) suffer from vitamin A deficiency, 40% children and 39% NPNLW are suffering from iodine deficiency. Anemia and iron deficiencies in adolescents are not as high as vitamin A, iodine. Nationally, anemia is highest for NPNL women 15-49 years (26%) compared to children 6-11 years (19%) and 12-14 years (17%).
In Bangladesh, various organizations are implementing programs for the adolescent population. Among the nutrition-specific programs, school-based nutrition education, school feeding program and national food fortification programs should be mentioned. Different national and international organizations are also implementing various nutrition-sensitive programs such as Sexual and Reproductive Health and rights (SRHR) programs, gender empowerment for adolescent girls, WASH & menstrual hygiene related programs to defy the malnutrition among adolescent boys and girls. Besides this, we need to focus on the following issues-
♦ More nutrition-specific interventions and programs are needed to reduce the massive micronutrient deficiency among the adolescents
♦ School-based education programs on dietary diversity should be implemented targeting the school students
♦ Promotion of menstrual hygiene practice and mainstreaming the relevant education into the health care system is required
♦ Common database or inventory of adolescent nutrition programs is required for effective coordination of program types, interventions, geographical coverage, roles and resources.
4. Low birth weight
Low birth weight is one of the major risk factors of under-5 mortality and morbidity. Many studies have identified LBW to be associated with future malnutrition and development
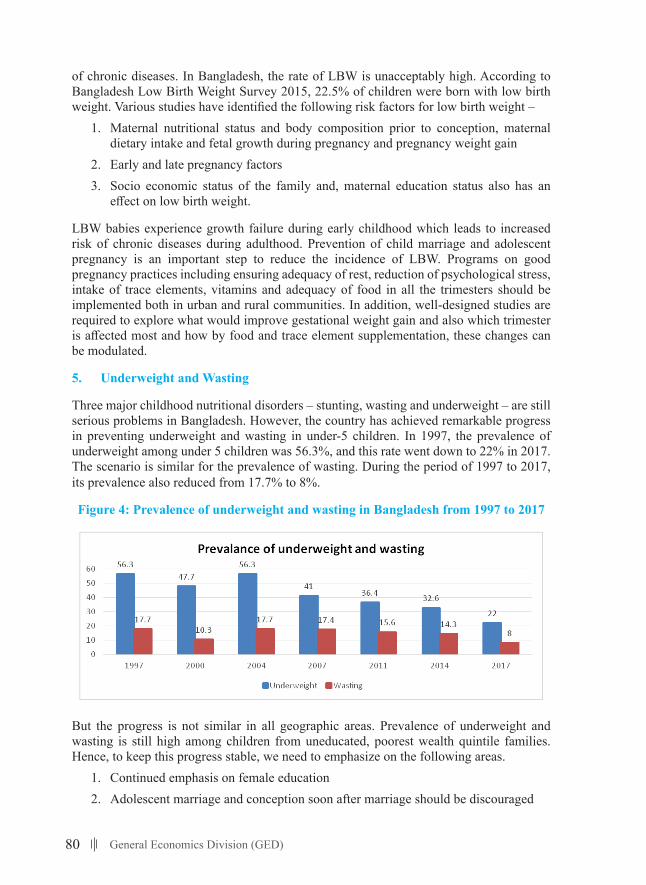
80 General Economics Division (GED)
of chronic diseases. In Bangladesh, the rate of LBW is unacceptably high. According to Bangladesh Low Birth Weight Survey 2015, 22.5% of children were born with low birth weight. Various studies have identified the following risk factors for low birth weight –
1. Maternal nutritional status and body composition prior to conception, maternal dietary intake and fetal growth during pregnancy and pregnancy weight gain
2. Early and late pregnancy factors3. Socio economic status of the family and, maternal education status also has an
effect on low birth weight.
LBW babies experience growth failure during early childhood which leads to increased risk of chronic diseases during adulthood. Prevention of child marriage and adolescent pregnancy is an important step to reduce the incidence of LBW. Programs on good pregnancy practices including ensuring adequacy of rest, reduction of psychological stress, intake of trace elements, vitamins and adequacy of food in all the trimesters should be implemented both in urban and rural communities. In addition, well-designed studies are required to explore what would improve gestational weight gain and also which trimester is affected most and how by food and trace element supplementation, these changes can be modulated.
5. Underweight and Wasting
Three major childhood nutritional disorders – stunting, wasting and underweight – are still serious problems in Bangladesh. However, the country has achieved remarkable progress in preventing underweight and wasting in under-5 children. In 1997, the prevalence of underweight among under 5 children was 56.3%, and this rate went down to 22% in 2017. The scenario is similar for the prevalence of wasting. During the period of 1997 to 2017, its prevalence also reduced from 17.7% to 8%.
Figure 4: Prevalence of underweight and wasting in Bangladesh from 1997 to 2017
Page 12 of 28
Figure 4. Prevalence of underweight and wasting in Bangladesh from 1997 to 2017
But the progress is not similar in all geographic areas. Prevalence of underweight and wasting is still high among children from uneducated, poorest wealth quintile families. Hence, to keep this progress stable, we need to emphasize on the following areas.
1. Continued emphasis on female education 2. Adolescent marriage and conception soon after marriage should be discouraged 3. Exclusive breastfeeding should be ensured 4. Complementary feeding should be provided accordingly to ensure the dietary adequacy and
diversity 5. Supplementary foods should be introduced for the poor and marginalized population 6. More focus should be given to the regions where the prevalence of underweight and wasting is
higher than the other areas, for example Sylhet division.
6. Stunting or linear growth failure
Stunting (length-for-age more than two standard deviations below the WHO child growth standards median) is an indicator of chronic undernutrition and is one of the best measures of child health inequality. It is the most prevalent form of malnutrition which is responsible for higher mortality and cognitive impairment of affected children. Given the adversity of the disease, a global target is set to reduce by 40% the number of under-five children who are stunted by 2025. Worldwide 144 million under 5 children are stunted with a substantial burden in South Asia. According to recent report of BDHS, 31% of children under age 5 were stunted and 9% were severely stunted. However, the country is on track in reduction of stunting in children. We have assessed the progress in stunting reduction by calculating average annual rate of reduction (AARR) from trends in prevalence of stunting in Bangladesh. It showed that prevalence of stunting would be 21% in 2025 if current trend continues, while the target is 27% (figure 5).
But the progress is not similar in all geographic areas. Prevalence of underweight and wasting is still high among children from uneducated, poorest wealth quintile families. Hence, to keep this progress stable, we need to emphasize on the following areas.
1. Continued emphasis on female education2. Adolescent marriage and conception soon after marriage should be discouraged
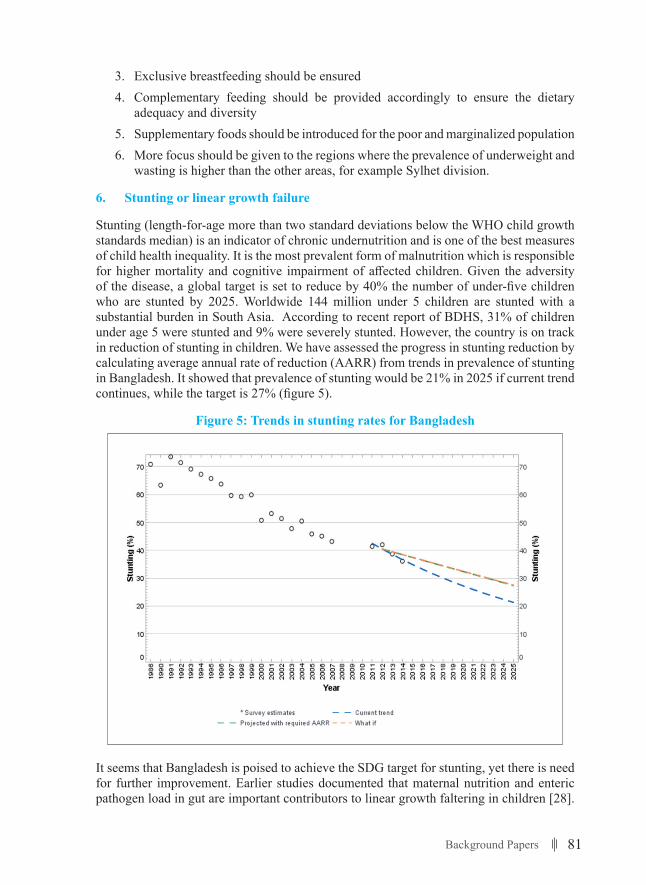
81Background Papers
3. Exclusive breastfeeding should be ensured4. Complementary feeding should be provided accordingly to ensure the dietary
adequacy and diversity 5. Supplementary foods should be introduced for the poor and marginalized population6. More focus should be given to the regions where the prevalence of underweight and
wasting is higher than the other areas, for example Sylhet division.
6. Stunting or linear growth failure
Stunting (length-for-age more than two standard deviations below the WHO child growth standards median) is an indicator of chronic undernutrition and is one of the best measures of child health inequality. It is the most prevalent form of malnutrition which is responsible for higher mortality and cognitive impairment of affected children. Given the adversity of the disease, a global target is set to reduce by 40% the number of under-five children who are stunted by 2025. Worldwide 144 million under 5 children are stunted with a substantial burden in South Asia. According to recent report of BDHS, 31% of children under age 5 were stunted and 9% were severely stunted. However, the country is on track in reduction of stunting in children. We have assessed the progress in stunting reduction by calculating average annual rate of reduction (AARR) from trends in prevalence of stunting in Bangladesh. It showed that prevalence of stunting would be 21% in 2025 if current trend continues, while the target is 27% (figure 5).
Figure 5: Trends in stunting rates for Bangladesh
Page 13 of 28
Figure 5. Trends in stunting rates for Bangladesh
It seems that Bangladesh is poised to achieve the SDG target for stunting, yet there is need for further improvement. Earlier studies documented that maternal nutrition and enteric pathogen load in gut are important contributors to linear growth faltering in children [28]. Environmental enteric dysfunction (EED), an asymptomatic condition resulting from frequent exposure to intestinal pathogens, was found to be associated with lower length-for-age-Z-score in young children living in contaminated environmental conditions [29, 30]. EED is responsible for altered immune response, epithelial damage and microbial translocation in the small intestine leading to impaired nutrient absorption and compromised growth [31]. A number of studies documented EED as an immediate causal factor childhood linear growth failure and impaired neuro-cognitive development [32, 33]. EED is also found to be associated with attenuated vaccine responses during early years of life. It is, therefore, imperative to develop policies and find out effective therapeutic solutions in order to avert the adverse consequences of EED in relation to childhood stunting in Bangladesh. In addition to EED, increasing population size, associated problems of water scarcity, poor hygiene and sanitation, and food insecurity will be even greater threats in future for ensuring optimum childhood linear growth in Bangladeshi children. To that end, specific measures to be taken to control the population size, improve water, sanitation and hygiene practices, and emphasize research to further increase yield of staples, livestock, and fisheries. Besides, it is recommended to mark on the following issues to ensure optimal growth of young children in the country -
Focus on the first 1,000 days Early initiation of breastfeeding Exclusive breastfeeding to 6 months
It seems that Bangladesh is poised to achieve the SDG target for stunting, yet there is need for further improvement. Earlier studies documented that maternal nutrition and enteric pathogen load in gut are important contributors to linear growth faltering in children [28].
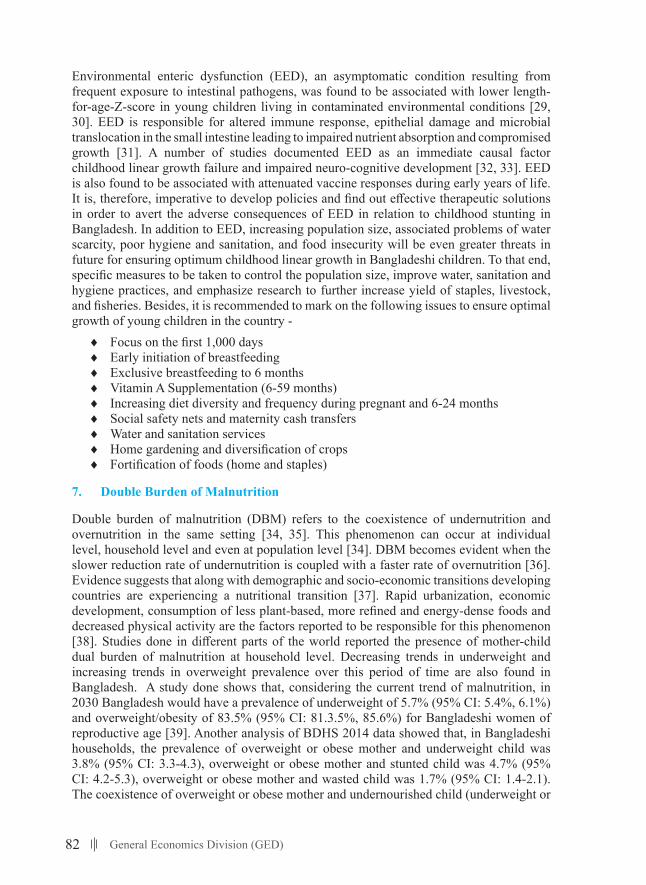
82 General Economics Division (GED)
Environmental enteric dysfunction (EED), an asymptomatic condition resulting from frequent exposure to intestinal pathogens, was found to be associated with lower length-for-age-Z-score in young children living in contaminated environmental conditions [29, 30]. EED is responsible for altered immune response, epithelial damage and microbial translocation in the small intestine leading to impaired nutrient absorption and compromised growth [31]. A number of studies documented EED as an immediate causal factor childhood linear growth failure and impaired neuro-cognitive development [32, 33]. EED is also found to be associated with attenuated vaccine responses during early years of life. It is, therefore, imperative to develop policies and find out effective therapeutic solutions in order to avert the adverse consequences of EED in relation to childhood stunting in Bangladesh. In addition to EED, increasing population size, associated problems of water scarcity, poor hygiene and sanitation, and food insecurity will be even greater threats in future for ensuring optimum childhood linear growth in Bangladeshi children. To that end, specific measures to be taken to control the population size, improve water, sanitation and hygiene practices, and emphasize research to further increase yield of staples, livestock, and fisheries. Besides, it is recommended to mark on the following issues to ensure optimal growth of young children in the country -
♦ Focus on the first 1,000 days ♦ Early initiation of breastfeeding ♦ Exclusive breastfeeding to 6 months ♦ Vitamin A Supplementation (6-59 months) ♦ Increasing diet diversity and frequency during pregnant and 6-24 months ♦ Social safety nets and maternity cash transfers ♦ Water and sanitation services ♦ Home gardening and diversification of crops ♦ Fortification of foods (home and staples)
7. Double Burden of Malnutrition
Double burden of malnutrition (DBM) refers to the coexistence of undernutrition and overnutrition in the same setting [34, 35]. This phenomenon can occur at individual level, household level and even at population level [34]. DBM becomes evident when the slower reduction rate of undernutrition is coupled with a faster rate of overnutrition [36]. Evidence suggests that along with demographic and socio-economic transitions developing countries are experiencing a nutritional transition [37]. Rapid urbanization, economic development, consumption of less plant-based, more refined and energy-dense foods and decreased physical activity are the factors reported to be responsible for this phenomenon [38]. Studies done in different parts of the world reported the presence of mother-child dual burden of malnutrition at household level. Decreasing trends in underweight and increasing trends in overweight prevalence over this period of time are also found in Bangladesh. A study done shows that, considering the current trend of malnutrition, in 2030 Bangladesh would have a prevalence of underweight of 5.7% (95% CI: 5.4%, 6.1%) and overweight/obesity of 83.5% (95% CI: 81.3.5%, 85.6%) for Bangladeshi women of reproductive age [39]. Another analysis of BDHS 2014 data showed that, in Bangladeshi households, the prevalence of overweight or obese mother and underweight child was 3.8% (95% CI: 3.3-4.3), overweight or obese mother and stunted child was 4.7% (95% CI: 4.2-5.3), overweight or obese mother and wasted child was 1.7% (95% CI: 1.4-2.1). The coexistence of overweight or obese mother and undernourished child (underweight or
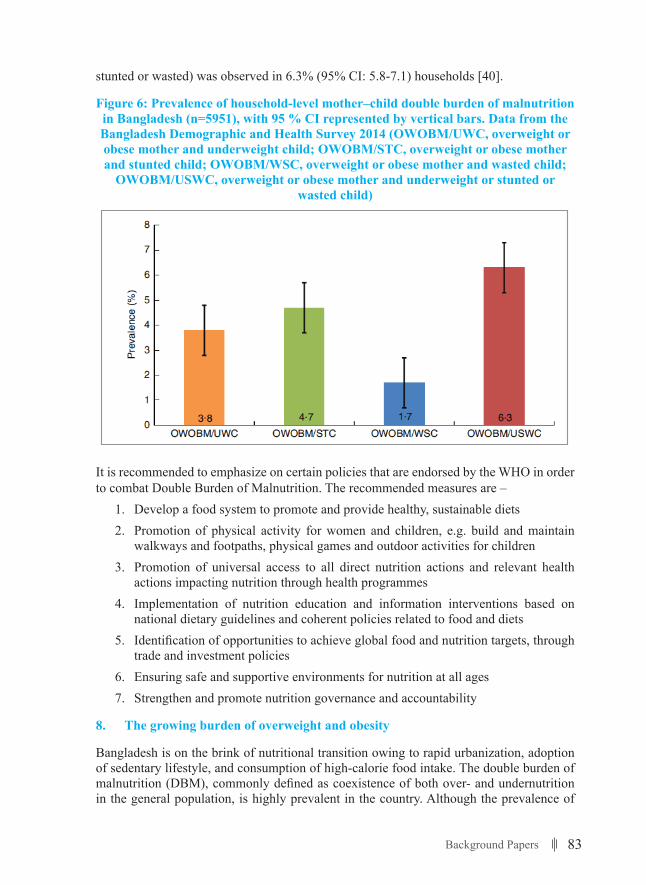
83Background Papers
stunted or wasted) was observed in 6.3% (95% CI: 5.8-7.1) households [40].
Figure 6: Prevalence of household-level mother–child double burden of malnutrition in Bangladesh (n=5951), with 95 % CI represented by vertical bars. Data from the Bangladesh Demographic and Health Survey 2014 (OWOBM/UWC, overweight or obese mother and underweight child; OWOBM/STC, overweight or obese mother and stunted child; OWOBM/WSC, overweight or obese mother and wasted child;
OWOBM/USWC, overweight or obese mother and underweight or stunted or wasted child)
Page 14 of 28
Vitamin A Supplementation (6-59 months) Increasing diet diversity and frequency during pregnant and 6-24 months Social safety nets and maternity cash transfers Water and sanitation services Home gardening and diversification of crops Fortification of foods (home and staples)
7. Double Burden of Malnutrition
Double burden of malnutrition (DBM) refers to the coexistence of undernutrition and overnutrition in the same setting [34, 35]. This phenomenon can occur at individual level, household level and even at population level [34]. DBM becomes evident when the slower reduction rate of undernutrition is coupled with a faster rate of overnutrition [36]. Evidence suggests that along with demographic and socio-economic transitions developing countries are experiencing a nutritional transition [37]. Rapid urbanization, economic development, consumption of less plant-based, more refined and energy-dense foods and decreased physical activity are the factors reported to be responsible for this phenomenon [38]. Studies done in different parts of the world reported the presence of mother-child dual burden of malnutrition at household level. Decreasing trends in underweight and increasing trends in overweight prevalence over this period of time are also found in Bangladesh. A study done shows that, considering the current trend of malnutrition, in 2030 Bangladesh would have a prevalence of underweight of 5.7% (95% CI: 5.4%, 6.1%) and overweight/obesity of 83.5% (95% CI: 81.3.5%, 85.6%) for Bangladeshi women of reproductive age [39]. Another analysis of BDHS 2014 data showed that, in Bangladeshi households, the prevalence of overweight or obese mother and underweight child was 3.8% (95% CI: 3.3-4.3), overweight or obese mother and stunted child was 4.7% (95% CI: 4.2-5.3), overweight or obese mother and wasted child was 1.7% (95% CI: 1.4-2.1). The coexistence of overweight or obese mother and undernourished child (underweight or stunted or wasted) was observed in 6.3% (95% CI: 5.8-7.1) households [40].
Figure 6. Prevalence of household-level mother–child double burden of malnutrition in Bangladesh (n=5951), with 95 % CI represented by vertical bars. Data from the Bangladesh Demographic and Health Survey 2014 (OWOBM/UWC, overweight or obese mother and underweight child;
It is recommended to emphasize on certain policies that are endorsed by the WHO in order to combat Double Burden of Malnutrition. The recommended measures are –
1. Develop a food system to promote and provide healthy, sustainable diets2. Promotion of physical activity for women and children, e.g. build and maintain
walkways and footpaths, physical games and outdoor activities for children3. Promotion of universal access to all direct nutrition actions and relevant health
actions impacting nutrition through health programmes4. Implementation of nutrition education and information interventions based on
national dietary guidelines and coherent policies related to food and diets 5. Identification of opportunities to achieve global food and nutrition targets, through
trade and investment policies6. Ensuring safe and supportive environments for nutrition at all ages7. Strengthen and promote nutrition governance and accountability
8. The growing burden of overweight and obesity
Bangladesh is on the brink of nutritional transition owing to rapid urbanization, adoption of sedentary lifestyle, and consumption of high-calorie food intake. The double burden of malnutrition (DBM), commonly defined as coexistence of both over- and undernutrition in the general population, is highly prevalent in the country. Although the prevalence of
84 General Economics Division (GED)
undernutrition is declining, overnutrition – being overweight and obese – has emerged as a growing public health concern. The proportion of being overweight or obese (BMI ≥25 kg/m2) is on a rise over the past two decades. According to Bangladesh Demographic and Health Survey (BDHS) 2014, the proportion of being overweight or obese among ever-married Bangladeshi women aged between 15 and 49 years was 24% [41]. The proportion was estimated 39% in the same group using a lower cut-off (BMI ≥23 kg/m2) recommended by the World Health Organization (WHO) for Asian people [41]. Figure 7 illustrates the prevalence of overweight and obesity among ever-married Bangladeshi women aged between 15 and 49 years using the Asian cut-off for overweight (23-27.4 kg/m2) and obesity (≥27.5 kg/m2).
Figure 7: Prevalence of overweight and obesity among women aged between 15 and 49 years in Bangladesh by survey year, Bangladesh Demographic and Health Survey
1999–2014
Page 15 of 22
8. Overweight and obesity
Bangladesh is on the brink of nutritional transition owing to rapid urbanization, adoption of sedentary lifestyle, and consumption of high-calorie food intake. The double burden of malnutrition (DBM), commonly defined as coexistence of both over- and undernutrition in the general population, is highly prevalent in the country. Although the prevalence of undernutrition is declining, overnutrition – being overweight and obese – has been emerged as a growing public health concern. The proportion of being overweight or obese (BMI ≥25 kg/m2) is on a rise over the past two decades. According to Bangladesh Demographic and Health Survey (BDHS) 2014, the proportion of being overweight or obese among ever-married Bangladeshi women aged between 15 and 49 years was 24% [1]. The proportion was estimated 39% in the same group using a lower cut-off (BMI ≥23 kg/m2) recommended by the World Health Organization (WHO) for Asian people [1]. Figure 1 illustrates the prevalence of overweight and obesity among ever-married Bangladeshi women aged between 15 and 49 years using the Asian cut-off for overweight (23-27.4 kg/m2) and obesity (≥27.5 kg/m2).
Figure 1. Prevalence of overweight and obesity among women aged between 15 and 49 years in
Bangladesh by survey year, Bangladesh Demographic and Health Survey 1999–2014
However, the national NCD risk factor survey 2018 explored the prevalence of overweight (≥25 kg/m2) and obesity (≥30 kg/m2) as 25.0% and 8.7%, respectively among women aged between 18-69 years [2]. The proportion of overweight and obesity among men for the same age group were estimated as 15.8% and 2.3%, respectively. The report stated that the overall proportion of overweight and obesity were 20.3% and 5.5% [2]. The prevalence of central obesity was estimated much higher in women (43.1%) than in men (9.5%) [2].
Evidence suggests that the likelihood of being overweight or obese increases with age. It was also evident in BDHS 2014 that urban women are more likely to be overweight or obese compared to rural women (36% and 19%, respectively) [1]. In BDHS 2011, the proportion of being overweight or obese was higher in men living in urban areas, from highest wealth quintile, and in those who had attained higher education
7.53
13.73
16.84
22.01
28.37
1.823.48
4.987.2
10.77
0
5
10
15
20
25
30
1999 2004 2007 2011 2014
Overweight Obesity
However, the national NCD risk factor survey 2018 estimated the prevalence of overweight (≥25 kg/m2) and obesity (≥30 kg/m2) as 25.0% and 8.7%, respectively among women aged between 18-69 years [42]. The proportion of overweight and obesity among men for the same age group were estimated as 15.8% and 2.3%, respectively. The report stated that the overall proportion of overweight and obesity were 20.3% and 5.5% [42]. The prevalence of central obesity was estimated much higher in women (43.1%) than in men (9.5%) [42].
Evidence suggests that the likelihood of being overweight or obese increases with age. It was also evident in BDHS 2014 that urban women are more likely to be overweight or obese compared to rural women (36% and 19%, respectively) [41]. In BDHS 2011, the proportion of being overweight or obese was higher in men living in urban areas, from highest wealth quintile, and in those who had attained higher education (secondary complete or more) [43]. Figure 8 shows the prevalence of overweight and obesity both in men and women in terms of place of residence.
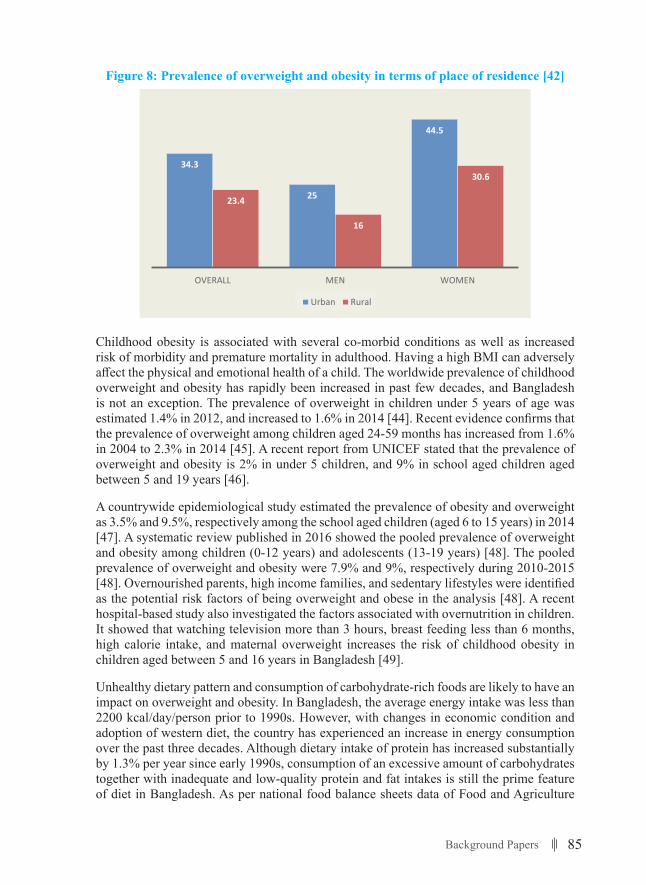
85Background Papers
Figure 8: Prevalence of overweight and obesity in terms of place of residence [42]
Page 17 of 28
Figure 8. Prevalence of overweight and obesity in terms of place of residence [42]
Childhood obesity is associated with several co-morbid conditions as well as increased risk of morbidity and premature mortality in adulthood. Having a high BMI can adversely affect the physical and emotional health of a child. The worldwide prevalence of childhood overweight and obesity has rapidly been increased in past few decades, and Bangladesh is not an exception. The prevalence of overweight in children under 5 years of age was estimated 1.4% in 2012, and increased to 1.6% in 2014 [44]. Recent evidence confirms that the prevalence of overweight among children aged 24-59 months has increased from 1.6% in 2004 to 2.3% in 2014 [45]. A recent report from UNICEF stated that the prevalence of overweight and obesity is 2% in under 5 children, and 9% in school aged children aged between 5 and 19 years [46].
A countrywide epidemiological study estimated the prevalence of obesity and overweight as 3.5% and 9.5%, respectively among the school aged children (aged 6 to 15 years) in 2014 [47]. A systematic review published in 2016 showed the pooled prevalence of overweight and obesity among children (0-12 years) and adolescents (13-19 years) [48]. The pooled prevalence of overweight and obesity were 7.9% and 9%, respectively during 2010-2015 [48]. Overnourished parents, high income families, and sedentary lifestyles were identified as the potential risk factors of being overweight and obese in the analysis [48]. A recent hospital-based study also investigated the factors associated with overnutrition in children. It showed that watching television more than 3 hours, breast feeding less than 6 months, high calorie intake, and maternal overweight increases the risk of childhood obesity in children aged between 5 and 16 years in Bangladesh [49].
Unhealthy dietary pattern and consumption of carbohydrate-rich foods are likely to have an impact on overweight and obesity. In Bangladesh, the average energy intake was less than 2200 kcal/day/person prior to 1990s. However, with changes in economic condition and adoption of western diet, the country has experienced an increase in energy consumption over the past three decades. Although dietary intake of protein has increased substantially by 1.3% per year since early 1990s, consumption of an excessive amount of carbohydrates together with inadequate and low-quality protein and fat intakes is still the
34.3
25
44.5
23.4
16
30.6
OVERALL MEN WOMEN
Urban Rural
Childhood obesity is associated with several co-morbid conditions as well as increased risk of morbidity and premature mortality in adulthood. Having a high BMI can adversely affect the physical and emotional health of a child. The worldwide prevalence of childhood overweight and obesity has rapidly been increased in past few decades, and Bangladesh is not an exception. The prevalence of overweight in children under 5 years of age was estimated 1.4% in 2012, and increased to 1.6% in 2014 [44]. Recent evidence confirms that the prevalence of overweight among children aged 24-59 months has increased from 1.6% in 2004 to 2.3% in 2014 [45]. A recent report from UNICEF stated that the prevalence of overweight and obesity is 2% in under 5 children, and 9% in school aged children aged between 5 and 19 years [46].
A countrywide epidemiological study estimated the prevalence of obesity and overweight as 3.5% and 9.5%, respectively among the school aged children (aged 6 to 15 years) in 2014 [47]. A systematic review published in 2016 showed the pooled prevalence of overweight and obesity among children (0-12 years) and adolescents (13-19 years) [48]. The pooled prevalence of overweight and obesity were 7.9% and 9%, respectively during 2010-2015 [48]. Overnourished parents, high income families, and sedentary lifestyles were identified as the potential risk factors of being overweight and obese in the analysis [48]. A recent hospital-based study also investigated the factors associated with overnutrition in children. It showed that watching television more than 3 hours, breast feeding less than 6 months, high calorie intake, and maternal overweight increases the risk of childhood obesity in children aged between 5 and 16 years in Bangladesh [49].
Unhealthy dietary pattern and consumption of carbohydrate-rich foods are likely to have an impact on overweight and obesity. In Bangladesh, the average energy intake was less than 2200 kcal/day/person prior to 1990s. However, with changes in economic condition and adoption of western diet, the country has experienced an increase in energy consumption over the past three decades. Although dietary intake of protein has increased substantially by 1.3% per year since early 1990s, consumption of an excessive amount of carbohydrates together with inadequate and low-quality protein and fat intakes is still the prime feature of diet in Bangladesh. As per national food balance sheets data of Food and Agriculture
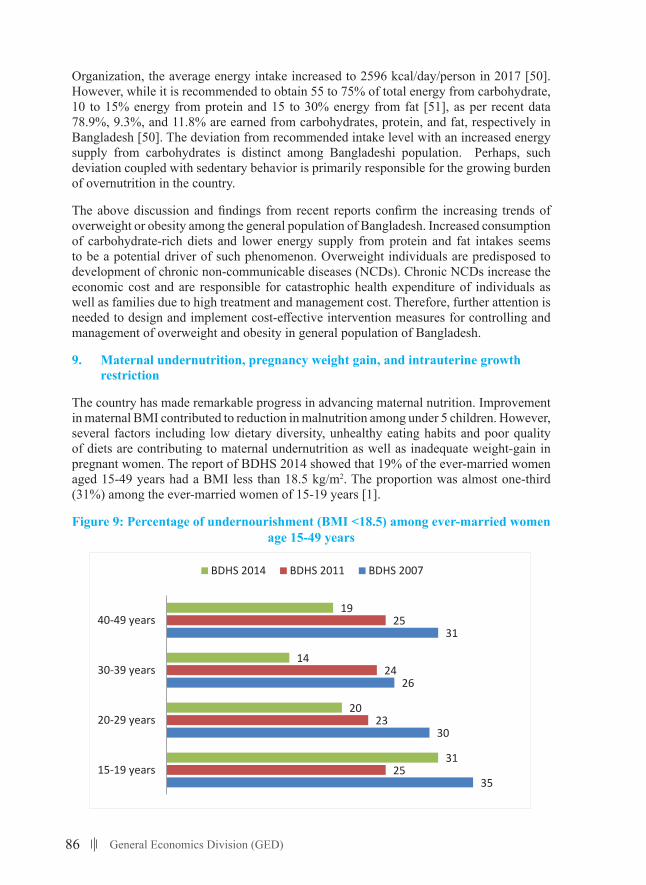
86 General Economics Division (GED)
Organization, the average energy intake increased to 2596 kcal/day/person in 2017 [50]. However, while it is recommended to obtain 55 to 75% of total energy from carbohydrate, 10 to 15% energy from protein and 15 to 30% energy from fat [51], as per recent data 78.9%, 9.3%, and 11.8% are earned from carbohydrates, protein, and fat, respectively in Bangladesh [50]. The deviation from recommended intake level with an increased energy supply from carbohydrates is distinct among Bangladeshi population. Perhaps, such deviation coupled with sedentary behavior is primarily responsible for the growing burden of overnutrition in the country.
The above discussion and findings from recent reports confirm the increasing trends of overweight or obesity among the general population of Bangladesh. Increased consumption of carbohydrate-rich diets and lower energy supply from protein and fat intakes seems to be a potential driver of such phenomenon. Overweight individuals are predisposed to development of chronic non-communicable diseases (NCDs). Chronic NCDs increase the economic cost and are responsible for catastrophic health expenditure of individuals as well as families due to high treatment and management cost. Therefore, further attention is needed to design and implement cost-effective intervention measures for controlling and management of overweight and obesity in general population of Bangladesh.
9. Maternal undernutrition, pregnancy weight gain, and intrauterine growth restriction
The country has made remarkable progress in advancing maternal nutrition. Improvement in maternal BMI contributed to reduction in malnutrition among under 5 children. However, several factors including low dietary diversity, unhealthy eating habits and poor quality of diets are contributing to maternal undernutrition as well as inadequate weight-gain in pregnant women. The report of BDHS 2014 showed that 19% of the ever-married women aged 15-49 years had a BMI less than 18.5 kg/m2. The proportion was almost one-third (31%) among the ever-married women of 15-19 years [1].
Figure 9: Percentage of undernourishment (BMI <18.5) among ever-married women age 15-49 years
Page 18 of 28
prime feature of diet in Bangladesh. As per national food balance sheets data of Food and Agriculture Organization, the average energy intake increased to 2596 kcal/day/person in 2017 [50]. However, while it is recommended to obtain 55 to 75% of total energy from carbohydrate, 10 to 15% energy from protein and 15 to 30% energy from fat [51], as per recent data 78.9%, 9.3%, and 11.8% are earned from carbohydrates, protein, and fat, respectively in Bangladesh [50]. The deviation from recommended intake level with an increased energy supply from carbohydrates is distinct among Bangladeshi population. Perhaps, such deviation coupled with sedentary behavior is primarily responsible for the growing burden of overnutrition in the country.
The above discussion and findings from recent reports confirm the increasing trends of overweight or obesity among the general population of Bangladesh. Increased consumption of carbohydrate-rich diets and lower energy supply from protein and fat intakes seems to be a potential driver of such phenomenon. Overweight individuals are predisposed to development of chronic non-communicable diseases (NCDs). Chronic NCDs increase the economic cost and are responsible for catastrophic health expenditure of individuals as well as families due to high treatment and management cost. Therefore, further attention is needed to design and implement cost-effective intervention measures for controlling and management of overweight and obesity in general population of Bangladesh.
9. Maternal undernutrition, pregnancy weight gain, and intrauterine growth restriction
The country has made remarkable progress in advancing maternal nutrition. Improvement in maternal BMI contributed to reduction in malnutrition among under 5 children. However, several factors including low dietary diversity, unhealthy eating habits and poor quality of diets are contributing to maternal undernutrition as well as inadequate weight-gain in pregnant women. The report of BDHS 2014 showed that 19% of the ever-married women aged 15-49 years had a BMI less than 18.5 kg/m2. The proportion was almost one-third (31%) among the ever-married women of 15-19 years [1].
Figure 9. Percentage of undernourishment (BMI <18.5) among ever-married women age 15-49 years
35
30
26
31
25
23
24
25
31
20
14
19
15-19 years
20-29 years
30-39 years
40-49 years
BDHS 2014 BDHS 2011 BDHS 2007
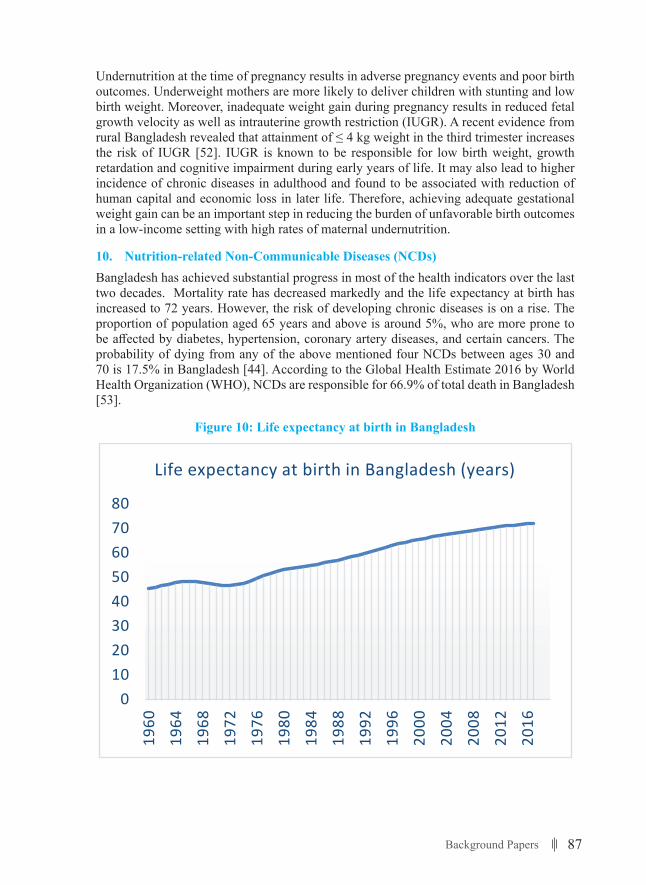
87Background Papers
Undernutrition at the time of pregnancy results in adverse pregnancy events and poor birth outcomes. Underweight mothers are more likely to deliver children with stunting and low birth weight. Moreover, inadequate weight gain during pregnancy results in reduced fetal growth velocity as well as intrauterine growth restriction (IUGR). A recent evidence from rural Bangladesh revealed that attainment of ≤ 4 kg weight in the third trimester increases the risk of IUGR [52]. IUGR is known to be responsible for low birth weight, growth retardation and cognitive impairment during early years of life. It may also lead to higher incidence of chronic diseases in adulthood and found to be associated with reduction of human capital and economic loss in later life. Therefore, achieving adequate gestational weight gain can be an important step in reducing the burden of unfavorable birth outcomes in a low‐income setting with high rates of maternal undernutrition.
10. Nutrition-related Non-Communicable Diseases (NCDs) Bangladesh has achieved substantial progress in most of the health indicators over the last two decades. Mortality rate has decreased markedly and the life expectancy at birth has increased to 72 years. However, the risk of developing chronic diseases is on a rise. The proportion of population aged 65 years and above is around 5%, who are more prone to be affected by diabetes, hypertension, coronary artery diseases, and certain cancers. The probability of dying from any of the above mentioned four NCDs between ages 30 and 70 is 17.5% in Bangladesh [44]. According to the Global Health Estimate 2016 by World Health Organization (WHO), NCDs are responsible for 66.9% of total death in Bangladesh [53].
Figure 10: Life expectancy at birth in Bangladesh
Page 19 of 28
Undernutrition at the time of pregnancy results in adverse pregnancy events and poor birth outcomes. Underweight mothers are more likely to deliver children with stunting and low birth weight. Moreover, inadequate weight gain during pregnancy results in reduced fetal growth velocity as well as intrauterine growth restriction (IUGR). A recent evidence from rural Bangladesh revealed that attainment of ≤ 4 kg weight in the third trimester increases the risk of IUGR [52]. IUGR is known to be responsible for low birth weight, growth retardation and cognitive impairment during early years of life. It may also lead to higher incidence of chronic diseases in adulthood and found to be associated with reduction of human capital and economic loss in later life. Therefore, achieving adequate gestational weight gain can be an important step in reducing the burden of unfavorable birth outcomes in a low‐income setting with high rates of maternal undernutrition.
10. Nutrition-related Non-Communicable Diseases (NCDs)
Bangladesh has achieved substantial progress in most of the health indicators over the last two decades. Mortality rate has decreased markedly and the life expectancy at birth has increased to 72 years. However, the risk of developing chronic diseases is on a rise. The proportion of population aged 65 years and above is around 5%, who are more prone to be affected by diabetes, hypertension, coronary artery diseases, and certain cancers. The probability of dying from any of the above mentioned four NCDs between ages 30 and 70 is 17.5% in Bangladesh [44]. According to the Global Health Estimate 2016 by World Health Organization (WHO), NCDs are responsible for 66.9% of total death in Bangladesh [53].
Figure 10. Life expectancy at birth in Bangladesh
01020304050607080
1960
1964
1968
1972
1976
1980
1984
1988
1992
1996
2000
2004
2008
2012
2016
Life expectancy at birth in Bangladesh (years)
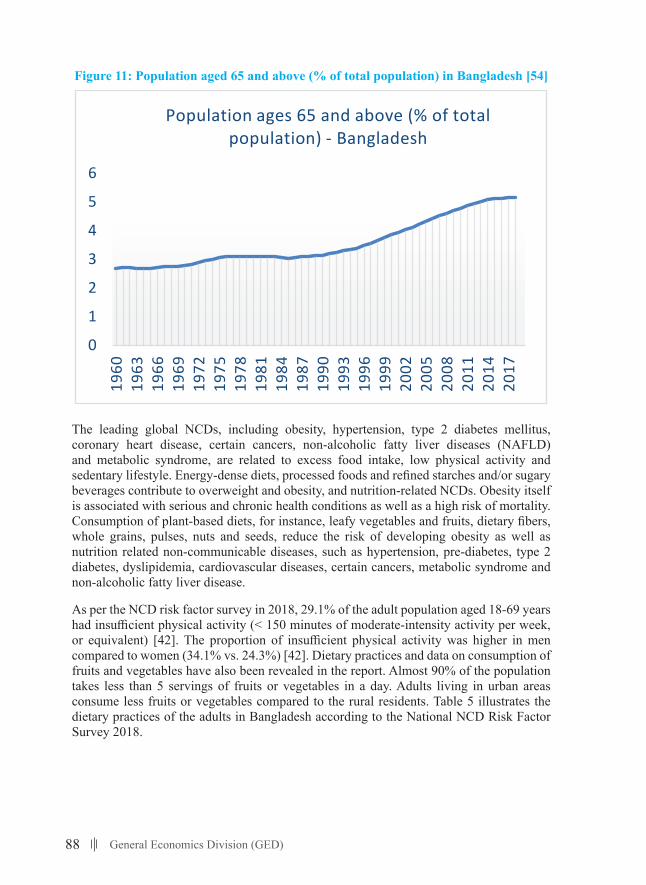
88 General Economics Division (GED)
Figure 11: Population aged 65 and above (% of total population) in Bangladesh [54]
Page 20 of 28
Figure 11. Population aged 65 and above (% of total population) in Bangladesh [54]
The leading global NCDs, including obesity, hypertension, type 2 diabetes mellitus, coronary heart disease, certain cancers, non‐alcoholic fatty liver diseases (NAFLD) and metabolic syndrome, are related to excess food intake, low physical activity and sedentary lifestyle. Energy‐dense diets, processed foods and refined starches and/or sugary beverages contribute to overweight and obesity, and nutrition‐related NCDs. Obesity itself is associated with serious and chronic health conditions as well as a high risk of mortality. Consumption of plant‐based diets, for instance, leafy vegetables and fruits, dietary fibers, whole grains, pulses, nuts and seeds, reduce the risk of developing obesity as well as nutrition related non‐communicable diseases, such as hypertension, pre‐diabetes, type 2 diabetes, dyslipidemia, cardiovascular diseases, certain cancers, metabolic syndrome and non‐alcoholic fatty liver disease.
As per the NCD risk factor survey in 2018, 29.1% of the adult population aged 18‐69 years had insufficient physical activity (< 150 minutes of moderate‐intensity activity per week, or equivalent) [42]. The proportion of insufficient physical activity was higher in men compared to women (34.1% vs. 24.3%) [42]. Dietary practices and data on consumption of fruits and vegetables have also been revealed in the report. Almost 90% of the population takes less than 5 servings of fruits or vegetables in a day. Adults living in urban areas consume less fruits or vegetables compared to the rural residents. Table 5 illustrates the dietary practices of the adults in Bangladesh according to the National NCD Risk Factor Survey 2018.
Table 5. Dietary practices of adults aged 18‐69 years in Bangladesh [42] Dietary practices Overall (95% CI) Men (95% CI) Women (95% CI) Mean number of days fruits consumed in a typical week 1.6 (1.5 – 1.7) 1.7 (1.6 – 1.8) 1.5 (1.4 – 1.6)
Mean number of servings of fruits consumed on average per day 0.4 (0.3 – 0.4) 0.4 (0.3 – 0.4) 0.4 (0.3 – 0.4)
Mean number of days vegetables consumed in a typical week 5.9 (5.8 – 6.0) 5.7 (5.6 – 5.8) 6.1 (6.0 – 6.2)
Mean number of servings of vegetables consumed on average per day 2.3 (2.2 – 2.4) 2.2 (2.0 – 2.3) 2.4 (2.2 – 2.5)
Percentage who eat <5 servings of fruits and/or vegetables on average per day 89.6 (8.8 – 11.9) 89.9 (7.7 – 12.4) 89.3 (8.8 – 12.6)
0
1
2
3
4
5
6
1960
1963
1966
1969
1972
1975
1978
1981
1984
1987
1990
1993
1996
1999
2002
2005
2008
2011
2014
2017
Population ages 65 and above (% of total population) ‐ Bangladesh
The leading global NCDs, including obesity, hypertension, type 2 diabetes mellitus, coronary heart disease, certain cancers, non-alcoholic fatty liver diseases (NAFLD) and metabolic syndrome, are related to excess food intake, low physical activity and sedentary lifestyle. Energy-dense diets, processed foods and refined starches and/or sugary beverages contribute to overweight and obesity, and nutrition-related NCDs. Obesity itself is associated with serious and chronic health conditions as well as a high risk of mortality. Consumption of plant-based diets, for instance, leafy vegetables and fruits, dietary fibers, whole grains, pulses, nuts and seeds, reduce the risk of developing obesity as well as nutrition related non-communicable diseases, such as hypertension, pre-diabetes, type 2 diabetes, dyslipidemia, cardiovascular diseases, certain cancers, metabolic syndrome and non-alcoholic fatty liver disease.
As per the NCD risk factor survey in 2018, 29.1% of the adult population aged 18-69 years had insufficient physical activity (< 150 minutes of moderate-intensity activity per week, or equivalent) [42]. The proportion of insufficient physical activity was higher in men compared to women (34.1% vs. 24.3%) [42]. Dietary practices and data on consumption of fruits and vegetables have also been revealed in the report. Almost 90% of the population takes less than 5 servings of fruits or vegetables in a day. Adults living in urban areas consume less fruits or vegetables compared to the rural residents. Table 5 illustrates the dietary practices of the adults in Bangladesh according to the National NCD Risk Factor Survey 2018.
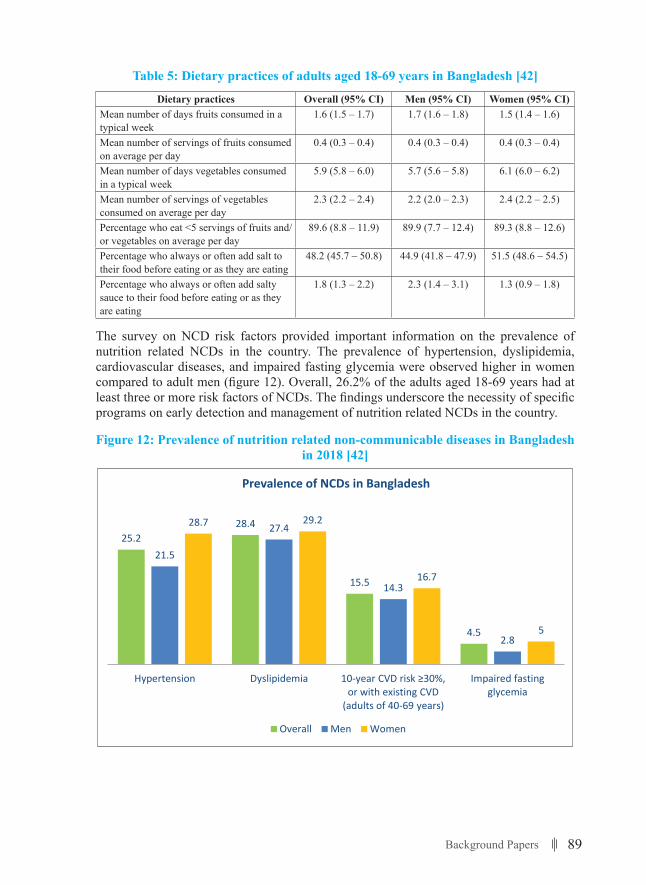
89Background Papers
Table 5: Dietary practices of adults aged 18-69 years in Bangladesh [42]
Dietary practices Overall (95% CI) Men (95% CI) Women (95% CI)Mean number of days fruits consumed in a typical week
1.6 (1.5 – 1.7) 1.7 (1.6 – 1.8) 1.5 (1.4 – 1.6)
Mean number of servings of fruits consumed on average per day
0.4 (0.3 – 0.4) 0.4 (0.3 – 0.4) 0.4 (0.3 – 0.4)
Mean number of days vegetables consumed in a typical week
5.9 (5.8 – 6.0) 5.7 (5.6 – 5.8) 6.1 (6.0 – 6.2)
Mean number of servings of vegetables consumed on average per day
2.3 (2.2 – 2.4) 2.2 (2.0 – 2.3) 2.4 (2.2 – 2.5)
Percentage who eat <5 servings of fruits and/or vegetables on average per day
89.6 (8.8 – 11.9) 89.9 (7.7 – 12.4) 89.3 (8.8 – 12.6)
Percentage who always or often add salt to their food before eating or as they are eating
48.2 (45.7 – 50.8) 44.9 (41.8 – 47.9) 51.5 (48.6 – 54.5)
Percentage who always or often add salty sauce to their food before eating or as they are eating
1.8 (1.3 – 2.2) 2.3 (1.4 – 3.1) 1.3 (0.9 – 1.8)
The survey on NCD risk factors provided important information on the prevalence of nutrition related NCDs in the country. The prevalence of hypertension, dyslipidemia, cardiovascular diseases, and impaired fasting glycemia were observed higher in women compared to adult men (figure 12). Overall, 26.2% of the adults aged 18-69 years had at least three or more risk factors of NCDs. The findings underscore the necessity of specific programs on early detection and management of nutrition related NCDs in the country.
Figure 12: Prevalence of nutrition related non-communicable diseases in Bangladesh in 2018 [42]
Page 21 of 28
Percentage who always or often add salt to their food before eating or as they are eating
48.2 (45.7 – 50.8) 44.9 (41.8 – 47.9) 51.5 (48.6 – 54.5)
Percentage who always or often add salty sauce to their food before eating or as they are eating
1.8 (1.3 – 2.2) 2.3 (1.4 – 3.1) 1.3 (0.9 – 1.8)
The survey on NCD risk factors provided important information on the prevalence of nutrition related NCDs in the country. The prevalence of hypertension, dyslipidemia, cardiovascular diseases, and impaired fasting glycemia were observed higher in women compared to adult men (figure 11). Overall, 26.2% of the adults aged 18-69 years had at least three or more risk factors of NCDs. The findings underscore the necessity of specific programs on early detection and management of nutrition related NCDs in the country.
Figure 12. Prevalence of nutrition related non-communicable diseases in Bangladesh in 2018 [42]
25.228.4
15.5
4.5
21.5
27.4
14.3
2.8
28.7 29.2
16.7
5
Hypertension Dyslipidemia 10-year CVD risk ≥30%, or with existing CVD
(adults of 40-69 years)
Impaired fastingglycemia
Prevalence of NCDs in Bangladesh
Overall Men Women
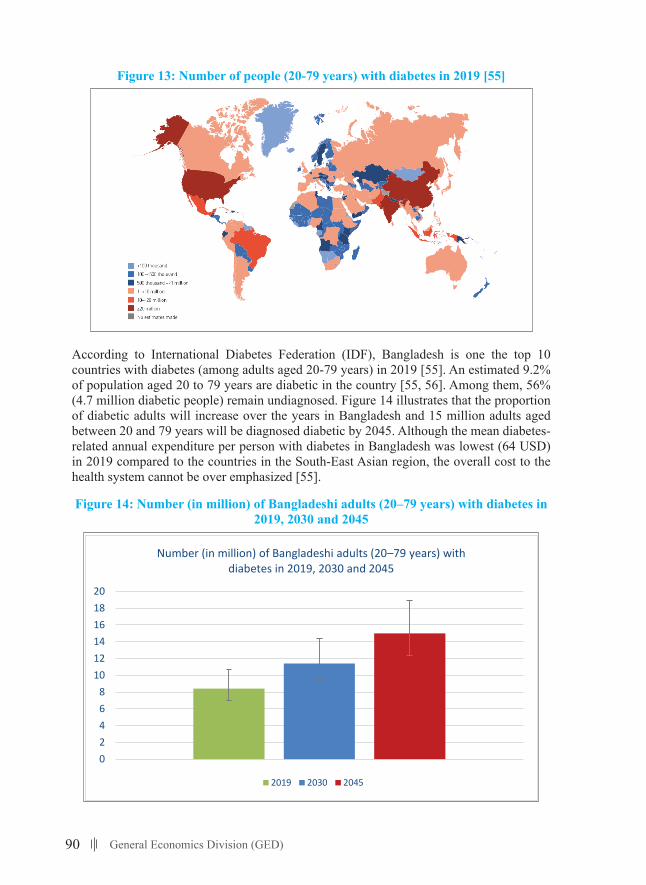
90 General Economics Division (GED)
Figure 13: Number of people (20-79 years) with diabetes in 2019 [55]
Page 22 of 28
Figure 13. Number of people (20-79 years) with diabetes in 2019 [55]
According to International Diabetes Federation (IDF), Bangladesh is one the top 10 countries with diabetes (among adults aged 20-79 years) in 2019 [55]. An estimated 9.2% of population aged 20 to 79 years are diabetic in the country [55, 56]. Among them, 56% (4.7 million diabetic people) remain undiagnosed. Figure 14 illustrates that the proportion of diabetic adults will increase over the years in Bangladesh and 15 million adults aged between 20 and 79 years will be diagnosed diabetic by 2045. Although the mean diabetes-related annual expenditure per person with diabetes in Bangladesh was lowest (64 USD) in 2019 compared to the countries in the South-East Asian region, the overall cost to the health system cannot be over emphasized [55].
Figure 14. Number (in million) of Bangladeshi adults (20–79 years) with diabetes in 2019, 2030 and 2045
02468
101214161820
Number (in million) of Bangladeshi adults (20–79 years) with diabetes in 2019, 2030 and 2045
2019 2030 2045
According to International Diabetes Federation (IDF), Bangladesh is one the top 10 countries with diabetes (among adults aged 20-79 years) in 2019 [55]. An estimated 9.2% of population aged 20 to 79 years are diabetic in the country [55, 56]. Among them, 56% (4.7 million diabetic people) remain undiagnosed. Figure 14 illustrates that the proportion of diabetic adults will increase over the years in Bangladesh and 15 million adults aged between 20 and 79 years will be diagnosed diabetic by 2045. Although the mean diabetes-related annual expenditure per person with diabetes in Bangladesh was lowest (64 USD) in 2019 compared to the countries in the South-East Asian region, the overall cost to the health system cannot be over emphasized [55].
Figure 14: Number (in million) of Bangladeshi adults (20–79 years) with diabetes in 2019, 2030 and 2045
Page 22 of 28
Figure 13. Number of people (20-79 years) with diabetes in 2019 [55]
According to International Diabetes Federation (IDF), Bangladesh is one the top 10 countries with diabetes (among adults aged 20-79 years) in 2019 [55]. An estimated 9.2% of population aged 20 to 79 years are diabetic in the country [55, 56]. Among them, 56% (4.7 million diabetic people) remain undiagnosed. Figure 14 illustrates that the proportion of diabetic adults will increase over the years in Bangladesh and 15 million adults aged between 20 and 79 years will be diagnosed diabetic by 2045. Although the mean diabetes-related annual expenditure per person with diabetes in Bangladesh was lowest (64 USD) in 2019 compared to the countries in the South-East Asian region, the overall cost to the health system cannot be over emphasized [55].
Figure 14. Number (in million) of Bangladeshi adults (20–79 years) with diabetes in 2019, 2030 and 2045
02468
101214161820
Number (in million) of Bangladeshi adults (20–79 years) with diabetes in 2019, 2030 and 2045
2019 2030 2045
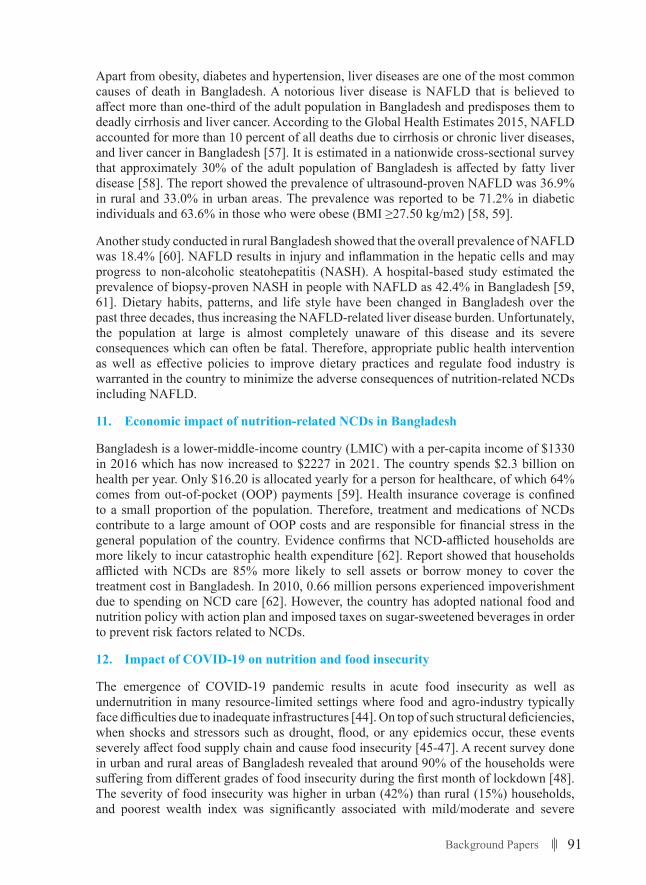
91Background Papers
Apart from obesity, diabetes and hypertension, liver diseases are one of the most common causes of death in Bangladesh. A notorious liver disease is NAFLD that is believed to affect more than one-third of the adult population in Bangladesh and predisposes them to deadly cirrhosis and liver cancer. According to the Global Health Estimates 2015, NAFLD accounted for more than 10 percent of all deaths due to cirrhosis or chronic liver diseases, and liver cancer in Bangladesh [57]. It is estimated in a nationwide cross-sectional survey that approximately 30% of the adult population of Bangladesh is affected by fatty liver disease [58]. The report showed the prevalence of ultrasound-proven NAFLD was 36.9% in rural and 33.0% in urban areas. The prevalence was reported to be 71.2% in diabetic individuals and 63.6% in those who were obese (BMI ≥27.50 kg/m2) [58, 59].
Another study conducted in rural Bangladesh showed that the overall prevalence of NAFLD was 18.4% [60]. NAFLD results in injury and inflammation in the hepatic cells and may progress to non-alcoholic steatohepatitis (NASH). A hospital-based study estimated the prevalence of biopsy-proven NASH in people with NAFLD as 42.4% in Bangladesh [59, 61]. Dietary habits, patterns, and life style have been changed in Bangladesh over the past three decades, thus increasing the NAFLD-related liver disease burden. Unfortunately, the population at large is almost completely unaware of this disease and its severe consequences which can often be fatal. Therefore, appropriate public health intervention as well as effective policies to improve dietary practices and regulate food industry is warranted in the country to minimize the adverse consequences of nutrition-related NCDs including NAFLD.
11. Economic impact of nutrition-related NCDs in Bangladesh
Bangladesh is a lower-middle-income country (LMIC) with a per-capita income of $1330 in 2016 which has now increased to $2227 in 2021. The country spends $2.3 billion on health per year. Only $16.20 is allocated yearly for a person for healthcare, of which 64% comes from out-of-pocket (OOP) payments [59]. Health insurance coverage is confined to a small proportion of the population. Therefore, treatment and medications of NCDs contribute to a large amount of OOP costs and are responsible for financial stress in the general population of the country. Evidence confirms that NCD-afflicted households are more likely to incur catastrophic health expenditure [62]. Report showed that households afflicted with NCDs are 85% more likely to sell assets or borrow money to cover the treatment cost in Bangladesh. In 2010, 0.66 million persons experienced impoverishment due to spending on NCD care [62]. However, the country has adopted national food and nutrition policy with action plan and imposed taxes on sugar-sweetened beverages in order to prevent risk factors related to NCDs.
12. Impact of COVID-19 on nutrition and food insecurity
The emergence of COVID-19 pandemic results in acute food insecurity as well as undernutrition in many resource-limited settings where food and agro-industry typically face difficulties due to inadequate infrastructures [44]. On top of such structural deficiencies, when shocks and stressors such as drought, flood, or any epidemics occur, these events severely affect food supply chain and cause food insecurity [45-47]. A recent survey done in urban and rural areas of Bangladesh revealed that around 90% of the households were suffering from different grades of food insecurity during the first month of lockdown [48]. The severity of food insecurity was higher in urban (42%) than rural (15%) households, and poorest wealth index was significantly associated with mild/moderate and severe
92 General Economics Division (GED)
food insecurity. The rural households with mild/moderate food insecurity adopted either financial (27%) or both financial and food compromised (32%) coping strategies, but 61% of urban mild/moderate food insecure households applied both forms of coping strategies. Similarly, nearly 90% of severely food insecure households implemented both types of coping strategies [48]. A recently report also documented that nearly 70% of the rural households in Bangladesh were suffering from some forms of food insecurity during COVID-19 lockdown [49].
Conclusions and Recommendations
Despite remarkable progress, there are remaining challenges pertaining to health and nutritional status of the population in Bangladesh. The recent upsurge of COVID-19 pandemic coupled with ongoing demographic transition exerts multiple challenges to ensure optimum health and general well-being of the population. This review highlights the current scenario and indicates the gaps that should be addressed through appropriate and effective policies. We have several recommendations based on the above discussion. Taking the First 1000 Days approach, anemia and nutritional status of adolescents have to be improved through dietary diversity, and the government’s existing school education program should step forward. Research should highlight ways to improve weight gain of women during pregnancy so that IUGR and LBW are prevented. Emphasis should be given to in improvement of micronutrient status both in children and adults. Raising awareness in people on the importance of taking micronutrient rich fruits and vegetables is essential necessary.
The COVID-19 pandemic has brought the importance of enhancing vitamin D status through controlled exposure to sunlight and intake of food rich in vitamin D. In addition, new national or sub-national survey is needed to assess how nutritional status of children in particular has been affected by food insecurity and health services disrupted due to the pandemic. Micronutrient deficiencies are evolving among the population. This is imperative because of the predictions of an even larger burden of childhood wasting and food insecurity related deaths globally in the second year of the pandemic. We recommend appropriate policies to tackle micronutrient deficiencies as well as an impending acute undernutrition, in addition to repurposing the safety net programs to support people with short-term emergency help, budgeting and nutritional counseling to combat the long-term impacts should also be considered. Such ‘shock-responsive social protection’ approach that links social welfare with humanitarian support by enrolling additional needy people to the already existing safety net programs and by paying additional benefits to social welfare recipients as well as new enrollees has already been initiated by the government and is could be a timely approach to mitigate the impending nutritional issues we are reporting here. Steps should also be taken to prevent any sudden spike in food prices by ensuring no prohibition to global food imports as well as uninterrupted supply of food in local markets. Finally, Bangladesh has a very small land mass in relation to its huge population. Further increase in population density will lead to saturation of agricultural land produce as well as in livestock, poultry resources. It is most important that we initiate research as well as planning now to cope with the effects of further increase in population density and that of climate change on food production and food security.
93Background Papers
References:1. Das SK, Faruque ASG, Ahmed S, Mamun AA, Rabiq R, Roy AK, Chisti MJ, Ahmed T, Salam MA:
Nutritional and micronutrient status of elderly people living in a rural community of Bangladesh. Journal of Gerontology and Geriatric Research 2012, 1(3):107.101-107.105.
2. Organization WH: Active ageing: A policy framework. In.: Geneva: World Health Organization; 2002.
3. UNICEF: Bangladesh Bureau of Statistics. Report on anaemia prevalence survey of urban Bangladesh and the rural Chittagong Hill Tracts 2003.
4. Organization WH, Science TUSoN, Policy, UNAIDS: Keep fit for life: meeting the nutritional needs of older persons: World Health Organization; 2002.
5. Barikdar A, Ahmed T, Lasker SP: The situation of the elderly in Bangladesh. Bangladesh Journal of Bioethics 2016, 7(1):27-36.
6. Abedin S: Population aging in Bangladesh. Issues and Perspectives, Summary of the Country Paper, ESCP, Asian Popultion Studies Series 1996(145).
7. Pirlich M, Lochs H: Nutrition in the elderly. Best Practice & Research Clinical Gastroenterology 2001, 15(6):869-884.
8. Faruque AS, Khan A, Roy CN, Malek MA, Salam MA, Khaled MA: Anthropometric characteristics of elderly people: observations at a large diarrheal hospital in Dhaka, Bangladesh. Southeast Asian journal of tropical medicine and public health 2006, 37(4):784.
9. Guigoz Y, Vellas B, Garry PJ: Assessing the nutritional status of the elderly: The Mini Nutritional Assessment as part of the geriatric evaluation. Nutrition reviews 1996, 54(1):S59-S65.
10. Vellas B, Lauque S, Andrieu S, Nourhashemi F, Rolland Y, Baumgartner R, Garry P: Nutrition assessment in the elderly. Current Opinion in Clinical Nutrition & Metabolic Care 2001, 4(1):5-8.
11. Kabir ZN, Ferdous T, Cederholm T, Khanam MA, Streatfied K, Wahlin Å: Mini Nutritional Assessment of rural elderly people in Bangladesh: the impact of demographic, socio-economic and health factors. Public Health Nutrition 2006, 9(8):968-974.
12. Whitney E, Rolfes S: Life cycle nutrition: adulthood and the later years. Understanding Nutrition, 9th ed Belmont, CA: Wadsworth/Thomson Learning 2002:576-593.
13. Griep MI, Mets TF, Collys K, Ponjaert-Kristoffersen I, Massart DL: Risk of malnutrition in retirement homes elderly persons measured by the “mini-nutritional assessment”. J Gerontol A Biol Sci Med Sci 2000, 55(2):M57-M63.
14. Rubenstein LZ, Harker JO, Salvà A, Guigoz Y, Vellas B: Screening for undernutrition in geriatric practice: developing the short-form mini-nutritional assessment (MNA-SF). The Journals of Gerontology Series A: Biological Sciences and Medical Sciences 2001, 56(6):M366-M372.
15. Suzana S, Earland J, Suriah A, Warnes A: Socialandhealthfactorsinfluencingpoornutritionalstatus among rural elderly Malays. The journal of nutrition, health & aging 2002, 6(6):363-369.
16. Cederholm T, Jägrén C, Hellström K: Nutritional status and performance capacity in internal medical patients. Clinical Nutrition 1993, 12(1):8-14.
94 General Economics Division (GED)
17. Cederholm T, Jägren C, Hellström K: Outcome of protein-energy malnutrition in elderly medical patients. The American journal of medicine 1995, 98(1):67-74.
18. Chen CCH, Schilling LS, Lyder CH: A concept analysis of malnutrition in the elderly. Journal of advanced nursing 2001, 36(1):131-142.
19. Pryer JA, Rogers S: Epidemiology of undernutrition in adults in Dhaka slum households, Bangladesh. European journal of clinical nutrition 2006, 60(7):815.
20. Locher JL, Ritchie CS, Roth DL, Baker PS, Bodner EV, Allman RM: Social isolation, support, and capitalandnutritionalriskinanoldersample:ethnicandgenderdifferences. Social Science & Medicine 2005, 60(4):747-761.
21. Pirlich M, Schütz T, Kemps M, Luhman N, Minko N, Lübke HJ, Rossnagel K, Willich SN, Lochs H: Social risk factors for hospital malnutrition. Nutrition 2005, 21(3):295-300.
22. UNICEF B: National Micronutrients Status Survey. 2013.
23. Bromage S, Ahmed T, Fawzi WW: Calciumdeficiency inBangladesh:burdenandproposedsolutionsforthefirst1000days. Food and nutrition bulletin 2016, 37(4):475-493.
24. Fahim SM, Das S, Gazi MA, Alam MA, Mahfuz M, Ahmed T: Evidence of gut enteropathy and factors associated with undernutrition among slum-dwelling adults in Bangladesh. The American Journal of Clinical Nutrition 2020.
25. Hossain MS, Das S, Gazi MA, Mahfuz M, Ahmed T: Ascaris lumbricoides infection: Still a threat forirondeficiencyanaemiain2-year-oldBangladeshislum-dwellingchildren. The Journal of Infection in Developing Countries 2019, 13(10):933-938.
26. Research NIoP, Training, Mitra, Associates, International M: Bangladesh Demographic and Health Survey, 2007: NIPORT; 2009.
27. Naila NN, Mondal P, Bromage S, Islam MM, Huda MM, Shomik MS, Mondal D, Fawzi W, Ahmed T: HomeFortificationofRiceWithLime:ANovelPotentialWaytoReduceCalciumDeficiencyin Bangladesh. Food and nutrition bulletin 2019, 40(3):357-368.
28. Mal-Ed Network Investigators: Childhood stunting in relation to the pre-and postnatal environment during the first 2 years of life: theMAL-ED longitudinal birth cohort study. PLoS medicine 2017, 14(10):e1002408.
29. Kosek M, Haque R, Lima A, Babji S, Shrestha S, Qureshi S, Amidou S, Mduma E, Lee G, Yori PP: Fecalmarkersofintestinalinflammationandpermeabilityassociatedwiththesubsequentacquisitionof lineargrowthdeficits ininfants. The American journal of tropical medicine and hygiene 2013, 88(2):390-396.
30. Arndt MB, Richardson BA, Ahmed T, Mahfuz M, Haque R, John-Stewart GC, Denno DM, Petri Jr WA, Kosek M, Walson JL: Fecal markers of environmental enteropathy and subsequent growth in Bangladeshi children. The American journal of tropical medicine and hygiene 2016, 95(3):694-701.
31. Fahim SM, Das S, Gazi MA, Alam MA, Hasan MM, Hossain MS, Mahfuz M, Rahman MM, Haque R, Sarker SA: Helicobacter pylori infection is associated with fecal biomarkers of environmental enteric dysfunction but not with the nutritional status of children living in Bangladesh. PLoS neglected tropical diseases 2020, 14(4):e0008243.
32. Owino V, Ahmed T, Freemark M, Kelly P, Loy A, Manary M, Loechl C: Environmental enteric dysfunction and growth failure/stunting in global child health. Pediatrics 2016, 138(6):e20160641.
95Background Papers
33. Chen RY, Kung VL, Das S, Hossain MS, Hibberd MC, Guruge J, Mahfuz M, Begum SKN, Rahman MM, Fahim SM: Duodenal microbiota in stunted undernourished children with enteropathy. New England Journal of Medicine 2020, 383(4):321-333.
34. Sekiyama M, Jiang HW, Gunawan B, Dewanti L, Honda R, Shimizu-Furusawa H, Abdoellah OS, Watanabe C: Double burden of malnutrition in rural West Java: household-level analysis for father-child and mother-child pairs and the association with dietary intake. Nutrients 2015, 7(10):8376-8391.
35. Ramirez-Zea M, Kroker-Lobos MF, Close-Fernandez R, Kanter R: The double burden of malnutrition in indigenous and nonindigenous Guatemalan populations. The American journal of clinical nutrition 2014, 100(6):1644S-1651S.
36. Kimani-Murage EW, Muthuri SK, Oti SO, Mutua MK, Van De Vijver S, Kyobutungi C: Evidence of a double burden of malnutrition in urban poor settings in Nairobi, Kenya. PloS one 2015, 10(6):e0129943.
37. Kapoor S, Anand K: Nutritional transition: a public health challenge in developing countries. In.: BMJ Publishing Group Ltd; 2002.
38. El Kishawi RR, Soo KL, Abed YA, Wan Muda WAM: Prevalence and associated factors for dual form of malnutrition in mother-child pairs at the same household in the Gaza Strip-Palestine. PloS one 2016, 11(3):e0151494.
39. Biswas T, Townsend N, Magalhaes RS, Islam MS, Hasan MM, Mamun A: Current progress and future directions in the double burden of malnutrition among women in South and Southeast Asian countries. Current developments in nutrition 2019, 3(7):nzz026.
40. Das S, Fahim SM, Islam MS, Biswas T, Mahfuz M, Ahmed T: Prevalence and sociodemographic determinants of household-level double burden of malnutrition in Bangladesh. Public health nutrition 2019, 22(8):1425-1432.
41. National Institute of Population Research and Training (NIPORT), Mitra and Associates, ICF International: Bangladesh Demographic and Health Survey (BDHS) 2014: Key Indicators. In. Dhaka, Bangladesh and Calverton, Maryland, USA: National Institute of Population Research and Training (NIPORT), Mitra and Associates, and ICF International; 2016.
42. National Institute of Preventive and Social Medicine (NIPSOM), NCDC DGHS MoHFW B, World Health Organization (WHO): Bangladesh NCD Risk Factor Survey 2018 In. Dhaka, Bangladesh: National Institute of Preventive and Social Medicine (NIPSOM); 2018.
43. Bangladesh Demographic and Health Survey 2011. In. Dhaka, Bangladesh and Calverton, Maryland, USA: National Institute of Population Research and Training (NIPORT), Mitra and Associates, and ICF International; 2013.
44. World Health Organization: World health statistics 2016: monitoring health for the SDGs sustainable development goals: World Health Organization; 2016.
45. Shawon MSR, Hossain FB, Thomson B, Adhikary G, Chowdhury A, Chowdhury R, Townsend N: Trends in the prevalence of overweight among Bangladeshi children aged 24–59 months (2004–2014) by sex and socioeconomic status. International Journal of Obesity 2019:1-11.
46. UNICEF: The State of the World’s Children 2019. Children, Food and Nutrition: Growing well in a changing world. . In. New York, USA: UNICEF; 2019.
47. Bulbul T, Hoque M: PrevalenceofchildhoodobesityandoverweightinBangladesh:findingsfrom a countrywide epidemiological study. BMC pediatrics 2014, 14(1):86.
96 General Economics Division (GED)
48. Biswas T, Islam A, Islam MS, Pervin S, Rawal LB: Overweight and obesity among children and adolescents in Bangladesh: a systematic review and meta-analysis. public health 2017, 142:94-101.
49. Hossain M, Zannat IA, Begum S, Rahman S: Risk Factors for Overweight and Obesity among Children and Adolescents in Bangladesh: A Hospital Based Study. Bangladesh Journal of Child Health 2019, 43(1):9-14.
50. Al Hasan SM, Saulam J, Kanda K, Murakami A, Yamadori Y, Mashima Y, Ngatu NR, Hirao T: Temporal Trends in Apparent Energy and Macronutrient Intakes in the Diet in Bangladesh: A Joinpoint Regression Analysis of the FAO’s Food Balance Sheet Data from 1961 to 2017. Nutrients 2020, 12(8):2319.
51. Nahar Q, Choudhury S, Faruque M, Sultana S, Siddiquee M: Desirable Dietary Pattern for Bangladesh. Final Research Results 2013:227-244.
52. Hasan ST, Khan MA, Ahmed T: Inadequate maternal weight gain in the third trimester increases the risk of intrauterine growth restriction in rural Bangladesh. PloS one 2019, 14(2):e0212116.
53. Cause of death, by non-communicable diseases (% of total) - Bangladesh [https://data.worldbank.org/indicator/SH.DTH.NCOM.ZS?locations=BD&view=chart]
54. Population ages 65 and above (% of total population) - Bangladesh [https://data.worldbank.org/indicator/SP.POP.65UP.TO.ZS?locations=BD&view=chart]
55. International Diabetes Federation: IDF DIABETES ATLAS. In., 9th edition edn. Brussels, Belgium: International Diabetes Federation; 2019.
56. Diabetes prevalence (% of population ages 20 to 79) - Bangladesh [https://data.worldbank.org/indicator/SH.STA.DIAB.ZS?locations=BD ]
57. WHO: Global health estimates 2015: deaths by cause, age, sex, by country and by region, 2000–2015. In.: World Health Organization Geneva; 2016.
58. Alam S, Fahim SM, Chowdhury MAB, Hassan MZ, Azam G, Mustafa G, Ahsan M, Ahmad N: Prevalenceandriskfactorsofnon‐alcoholicfattyliverdiseaseinBangladesh. JGH Open 2018, 2(2):39-46.
59. Sarin SK, Kumar M, Eslam M, George J, Al Mahtab M, Akbar SMF, Jia J, Tian Q, Aggarwal R, Muljono DH: LiverdiseasesintheAsia-Pacificregion:aLancetGastroenterology&HepatologyCommission. The Lancet Gastroenterology & Hepatology 2019.
60. Rahman MM, Kibria MG, Begum H, Haque M, Sultana N, Akhter M, Rowshon A, Ahmed F, Hasan M: Su1037 Prevalence and Risk Factors of Nonalcoholic Fatty Liver Disease in a Rural Community of South Asia. Gastroenterology 2015, 148(4):S-1045-S-1046.
61. Alam S, Noor-E-Alam SM, Chowdhury ZR, Alam M, Kabir J: Nonalcoholic steatohepatitis in nonalcoholic fatty liver disease patients of Bangladesh. World journal of hepatology 2013, 5(5):281.
62. Datta BK, Husain MJ, Husain MM, Kostova D: Noncommunicable disease-attributable medical expenditures,householdfinancialstressandimpoverishmentinBangladesh. SSM-Population Health 2018, 6:252-258.
97Background Papers
Study 13:Poverty in the Time of Corona: Trends, Drivers,
Vulnerability and Policy Responses in Bangladesh
Binayak Sen*ZulfiqarAli**
and Muntasir Murshed***
* Director General, BIDS.** Senior Research Fellow, BIDS.*** Research officer BIDS.

98 General Economics Division (GED)
99Background Papers
Alfred Marshall’s Principles of Economics (the first great text in neoclassical economics) opens up with these lines: “Now at last we are setting ourselves seriously to inquire whether it is necessary that there should be any so called “lower classes” at all: that is whether there need be large numbers of people doomed from their birth to hard work in order to provide for others the requisites of a refined and cultured life, while they themselves are prevented by their poverty and toil from having any share or part in that life…The answer depends in a great measure upon facts and inferences, which are within the provinces of economics; and this is it which gives to economics studies their chief and their highest interest” (as quoted in Bowles 2004).1 This remark by Marshall reverberates with even more alarming urgency in the time of COVID-19. The global pandemic threatens to destroy the lives and livelihoods of all, but it reveals underlying racial and income divides across the developed and developing countries. The poor are likely to be affected much more than the rich because of twin pressure of economic lockdown and pre-exiting vulnerabilities that comes with extreme income and non-income deprivations.
With stunning pace, the current pandemic has inflicted disproportionate suffering on poor communities. Even in developed countries, many families have become suddenly vulnerable to shocks as unemployment mounts and savings are eroded. The COVID-19 pandemic signals an even more disaster for developing countries confronted with unprecedented rise in food insecurity and poverty. UN predicts that “biblical famines” have become a distinct possibility for the Third World. As Thomas Piketty (2020) warns in a recent interview, “this is a crisis that illustrates a virulent inequality” and much would depend on the effectiveness, timeliness and sequencing of strategic policy responses. 2A central motivation for this paper is whether the present pandemic crisis will turn out to be a catalyst for the long-awaited much- needed policy changes for sustainable poverty reduction—from a well-endowed universal public health system and universal social protection to a reordering of the public spending (and taxing) priorities and effective local state. In all of this, arguably, the focus needs to be on encompassing and safeguarding the interest of the poorest first.
The paper has three central messages. First, the country achieved many celebratory successes in the sphere of poverty reduction, food security, human development and job creation. Past successes signal enormous potentials to reach still higher goals and tackle new challenges of reaching the core SDG targets by 2030 in a post-COVID world. Second, these successes however have been marked by some distinct vulnerabilities that are discernible in poverty reduction process even before the COVID-19 shock hit the country in 2020. The latter has only made these inherent vulnerabilities even more salient. Third, the COVID-19 shock is likely to be damaging for wellbeing of the poor in the short run. Clearly, a large segment of the poor will be affected that will demand urgent policy attention . As regards the medium-* This is a background paper commissioned by the GED and prepared for the 8th Five Year Plan. The authors are grateful to
Sadiq Ahmed and Shamsul Alam for their comments and suggestions on successive drafts. The paper is an outcome of a team-effort. Binayak Sen was responsible for the overall conceptual framework, assessment of income-poverty trends and drivers, analysis of pre-existing vulnerabilities, poverty simulations under COVID-19, poverty projections for reaching the SDG target of ‘zero poverty’ under alternative growth scenarios, and policy conclusions; Zulfiqar Ali was responsible for the analysis of non-income dimensions of poverty as well as regional dimensions of poverty; Muntasir Murshed was responsible for the analysis of social protection. In addition, the authors are grateful to Tanima Ahmed, Rizwana Islam and Sania Akter for their generous help in data analysis during the lockdown.
1 Alfred Marshall had “two selves”—a calm head of a mathematical economist influenced by Marginal Revolution not easily clouded by emotional judgments and a warm soul influenced by John Stuart Mill’s liberal ideas about equity and justice not easily swayed away by cold calculated market rationalism alone (on Marshall’s double inspirations, Reisman 2011).
2 2 See, “Economist’s warnings on inequality draw attention with virus” accessed on 20 June 2020 https://federalnewsnetwork.com/government-news/2020/04/covid-19-reinforces-an-economists-warnings-about- inequality/
100 General Economics Division (GED)
term impact of Covid-19 on poverty much would depend on the gravity of the shock itself (which is still evolving) as well as on the strategic policy responses to economic recovery and mitigating adverse health consequences.
Structure of the Paper
The rest of the paper has organized into two parts. The first part discusses the past achievements and drivers of success in the 2010s. It has three distinct sub-sections. Section 1.1 captures the past trends in income (consumption) dimension of poverty in the 2010s with special focus of changes between 2010 and
2016, the latest available HIES. It also checks the consistency of real wage trends with poverty trends. Section 1.2 assesses the past trends in non-income dimensions of poverty based on DHS and MICS data with focus on the poor-rich ration as the measure of inequality in health, nutrition, and education indicators. Section 1.3 discusses the key attributes of regional poverty differences. Section 1.4 analyzes the drivers of poverty reductions through the prism of different groups of poor and non-poor, namely, extreme poor, moderate poor, vulnerable non-poor and comfortable non-poor.The second part discusses the vulnerabilities and challenges facing the country’s poverty reduction prospects. It has three distinct sub-sections. Section 2.1 pinpoints the revealed vulnerabilities in the poverty reduction process that became more prominent with the passage of time. It focuses on the increasing bundling of the near-poor crowding just above the poverty line and assesses the risks of slippages of moderate poor into extreme poverty. Section 2.2 carries out poverty simulations to assess the likely effects of Covid-19 on poverty outcomes under different scenarios—from the doomsday scenario to more likely public action driven scenario. Section 2.3 discusses the effectiveness of the current practices of social protection for different groups of the poor and vulnerable non-poor. Section 2.4 presents poverty projections to examine the viability of reaching the SDG target of ‘zero poverty’ by 2031. Section 2.5 presents the main conclusions of the paper and discusses some of the key elements of the strategic policy responses in the short and medium term.1. Achievements and Drivers of Successes of Poverty Reduction in the Seventh Plan
Bangladesh has come a long way since it became independent in 1971. The most dramatic expression of its progress is, perhaps, revealed in impressive poverty reduction recorded over the last nearly 50 years of Independence. In 1973/74, about 71.3% of rural population lived in absolute poverty (as defined by the Cost-of-Basic-Needs approach); the matched figure has gone down to the estimated level of just 22% in the first quarter of 2020.3 Bangladesh’s development experience during this period can be summarized as the time of the ascent of the poor and the poorest. It can be seen in respect of both income and non- income indicators. From the employment point of view, it was an ascent underpinned primarily by the rise of the relatively unskilled labor through technology-intensive agricultural growth, rural non-farm sector development, export led industrialization, and direct and indirect effects of international migration of workers; the last two having important effects on the rapid pace of urbanization (on this, see Hossain et al 2016).The ascent of the poor took place in a remarkably stable macro framework marked by growth acceleration, progressive shifts towards manufacturing and services, supported 3 The estimate for 1973/74 is taken from Hossain and Sen (1992) and the 2020 (first quarter) estimate has been derived by
the present study. For an early discussion of the Cost-of-Basic Needs (CBN) approach for monitoring long- term poverty trends, see Ravallion and Sen (1996).
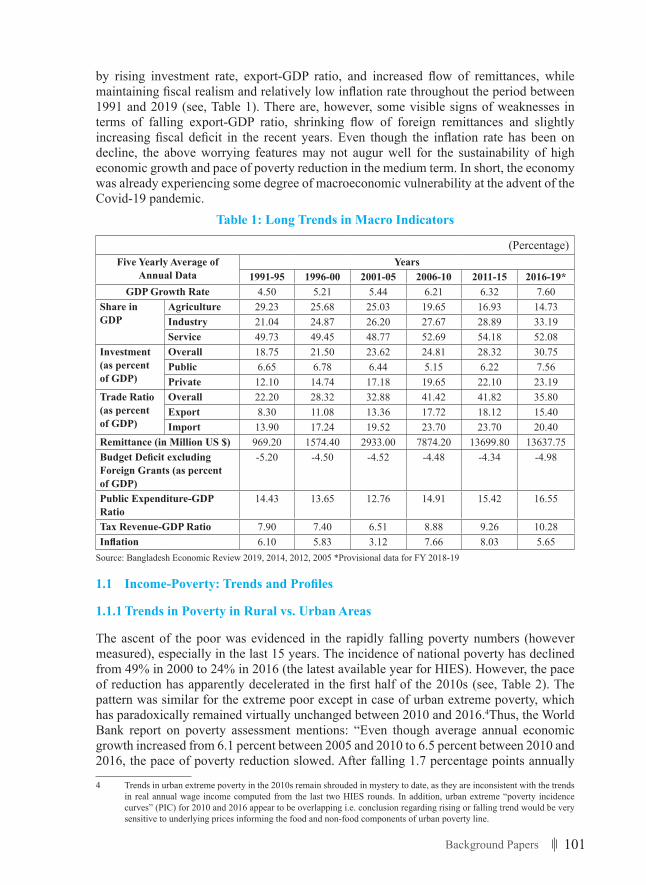
101Background Papers
by rising investment rate, export-GDP ratio, and increased flow of remittances, while maintaining fiscal realism and relatively low inflation rate throughout the period between 1991 and 2019 (see, Table 1). There are, however, some visible signs of weaknesses in terms of falling export-GDP ratio, shrinking flow of foreign remittances and slightly increasing fiscal deficit in the recent years. Even though the inflation rate has been on decline, the above worrying features may not augur well for the sustainability of high economic growth and pace of poverty reduction in the medium term. In short, the economy was already experiencing some degree of macroeconomic vulnerability at the advent of the Covid-19 pandemic.
Table 1: Long Trends in Macro Indicators
(Percentage)Five Yearly Average of
Annual DataYears
1991-95 1996-00 2001-05 2006-10 2011-15 2016-19*GDP Growth Rate 4.50 5.21 5.44 6.21 6.32 7.60
Share in GDP
Agriculture 29.23 25.68 25.03 19.65 16.93 14.73Industry 21.04 24.87 26.20 27.67 28.89 33.19Service 49.73 49.45 48.77 52.69 54.18 52.08
Investment (as percent of GDP)
Overall 18.75 21.50 23.62 24.81 28.32 30.75Public 6.65 6.78 6.44 5.15 6.22 7.56Private 12.10 14.74 17.18 19.65 22.10 23.19
Trade Ratio (as percent of GDP)
Overall 22.20 28.32 32.88 41.42 41.82 35.80Export 8.30 11.08 13.36 17.72 18.12 15.40Import 13.90 17.24 19.52 23.70 23.70 20.40
Remittance (in Million US $) 969.20 1574.40 2933.00 7874.20 13699.80 13637.75BudgetDeficitexcludingForeign Grants (as percent of GDP)
-5.20 -4.50 -4.52 -4.48 -4.34 -4.98
Public Expenditure-GDP Ratio
14.43 13.65 12.76 14.91 15.42 16.55
Tax Revenue-GDP Ratio 7.90 7.40 6.51 8.88 9.26 10.28Inflation 6.10 5.83 3.12 7.66 8.03 5.65
Source: Bangladesh Economic Review 2019, 2014, 2012, 2005 *Provisional data for FY 2018-19
1.1 Income-Poverty:TrendsandProfiles
1.1.1 Trends in Poverty in Rural vs. Urban Areas
The ascent of the poor was evidenced in the rapidly falling poverty numbers (however measured), especially in the last 15 years. The incidence of national poverty has declined from 49% in 2000 to 24% in 2016 (the latest available year for HIES). However, the pace of reduction has apparently decelerated in the first half of the 2010s (see, Table 2). The pattern was similar for the extreme poor except in case of urban extreme poverty, which has paradoxically remained virtually unchanged between 2010 and 2016.4Thus, the World Bank report on poverty assessment mentions: “Even though average annual economic growth increased from 6.1 percent between 2005 and 2010 to 6.5 percent between 2010 and 2016, the pace of poverty reduction slowed. After falling 1.7 percentage points annually
4 Trends in urban extreme poverty in the 2010s remain shrouded in mystery to date, as they are inconsistent with the trends in real annual wage income computed from the last two HIES rounds. In addition, urban extreme “poverty incidence curves” (PIC) for 2010 and 2016 appear to be overlapping i.e. conclusion regarding rising or falling trend would be very sensitive to underlying prices informing the food and non-food components of urban poverty line.
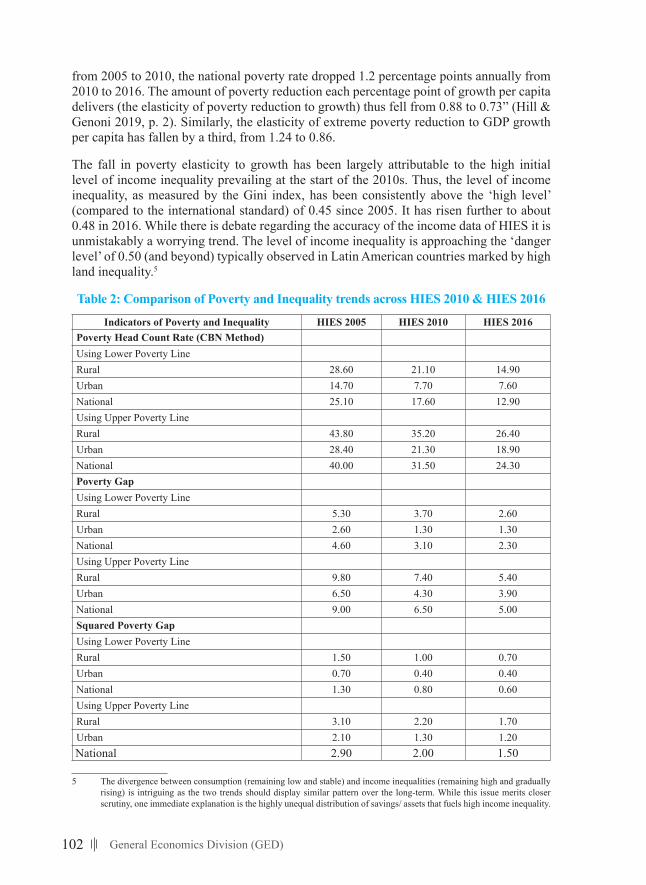
102 General Economics Division (GED)
from 2005 to 2010, the national poverty rate dropped 1.2 percentage points annually from 2010 to 2016. The amount of poverty reduction each percentage point of growth per capita delivers (the elasticity of poverty reduction to growth) thus fell from 0.88 to 0.73” (Hill & Genoni 2019, p. 2). Similarly, the elasticity of extreme poverty reduction to GDP growth per capita has fallen by a third, from 1.24 to 0.86.
The fall in poverty elasticity to growth has been largely attributable to the high initial level of income inequality prevailing at the start of the 2010s. Thus, the level of income inequality, as measured by the Gini index, has been consistently above the ‘high level’ (compared to the international standard) of 0.45 since 2005. It has risen further to about 0.48 in 2016. While there is debate regarding the accuracy of the income data of HIES it is unmistakably a worrying trend. The level of income inequality is approaching the ‘danger level’ of 0.50 (and beyond) typically observed in Latin American countries marked by high land inequality.5
Table2:ComparisonofPovertyandInequalitytrendsacrossHIES2010&HIES2016
Indicators of Poverty and Inequality HIES 2005 HIES 2010 HIES 2016Poverty Head Count Rate (CBN Method)Using Lower Poverty LineRural 28.60 21.10 14.90Urban 14.70 7.70 7.60National 25.10 17.60 12.90Using Upper Poverty LineRural 43.80 35.20 26.40Urban 28.40 21.30 18.90National 40.00 31.50 24.30Poverty GapUsing Lower Poverty LineRural 5.30 3.70 2.60Urban 2.60 1.30 1.30National 4.60 3.10 2.30Using Upper Poverty LineRural 9.80 7.40 5.40Urban 6.50 4.30 3.90National 9.00 6.50 5.00Squared Poverty GapUsing Lower Poverty LineRural 1.50 1.00 0.70Urban 0.70 0.40 0.40National 1.30 0.80 0.60Using Upper Poverty LineRural 3.10 2.20 1.70Urban 2.10 1.30 1.20National 2.90 2.00 1.50
5 The divergence between consumption (remaining low and stable) and income inequalities (remaining high and gradually rising) is intriguing as the two trends should display similar pattern over the long-term. While this issue merits closer scrutiny, one immediate explanation is the highly unequal distribution of savings/ assets that fuels high income inequality.
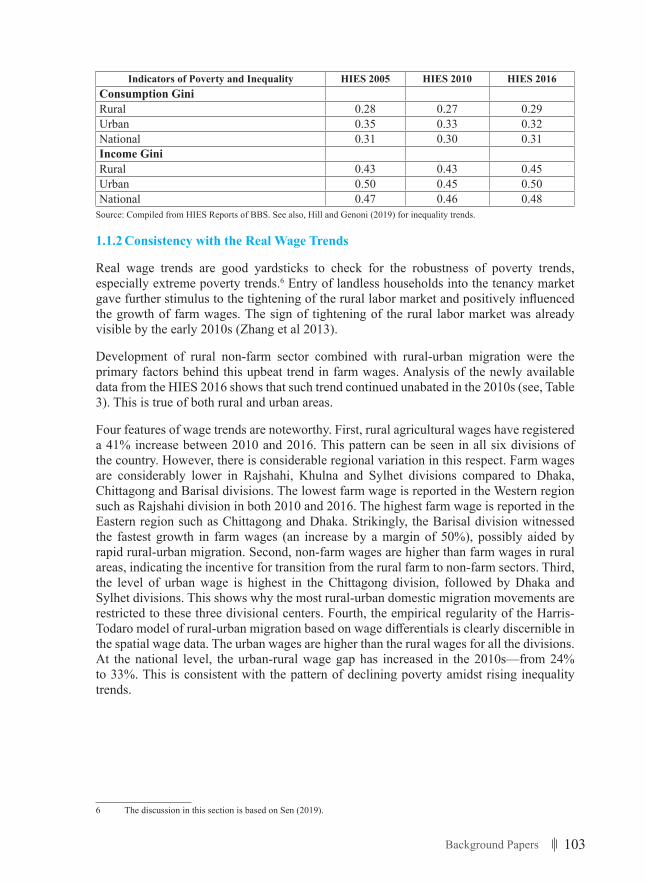
103Background Papers
Indicators of Poverty and Inequality HIES 2005 HIES 2010 HIES 2016Consumption GiniRural 0.28 0.27 0.29Urban 0.35 0.33 0.32National 0.31 0.30 0.31Income GiniRural 0.43 0.43 0.45Urban 0.50 0.45 0.50National 0.47 0.46 0.48
Source: Compiled from HIES Reports of BBS. See also, Hill and Genoni (2019) for inequality trends.
1.1.2 Consistency with the Real Wage Trends
Real wage trends are good yardsticks to check for the robustness of poverty trends, especially extreme poverty trends.6 Entry of landless households into the tenancy market gave further stimulus to the tightening of the rural labor market and positively influenced the growth of farm wages. The sign of tightening of the rural labor market was already visible by the early 2010s (Zhang et al 2013).
Development of rural non-farm sector combined with rural-urban migration were the primary factors behind this upbeat trend in farm wages. Analysis of the newly available data from the HIES 2016 shows that such trend continued unabated in the 2010s (see, Table 3). This is true of both rural and urban areas.
Four features of wage trends are noteworthy. First, rural agricultural wages have registered a 41% increase between 2010 and 2016. This pattern can be seen in all six divisions of the country. However, there is considerable regional variation in this respect. Farm wages are considerably lower in Rajshahi, Khulna and Sylhet divisions compared to Dhaka, Chittagong and Barisal divisions. The lowest farm wage is reported in the Western region such as Rajshahi division in both 2010 and 2016. The highest farm wage is reported in the Eastern region such as Chittagong and Dhaka. Strikingly, the Barisal division witnessed the fastest growth in farm wages (an increase by a margin of 50%), possibly aided by rapid rural-urban migration. Second, non-farm wages are higher than farm wages in rural areas, indicating the incentive for transition from the rural farm to non-farm sectors. Third, the level of urban wage is highest in the Chittagong division, followed by Dhaka and Sylhet divisions. This shows why the most rural-urban domestic migration movements are restricted to these three divisional centers. Fourth, the empirical regularity of the Harris-Todaro model of rural-urban migration based on wage differentials is clearly discernible in the spatial wage data. The urban wages are higher than the rural wages for all the divisions. At the national level, the urban-rural wage gap has increased in the 2010s—from 24% to 33%. This is consistent with the pattern of declining poverty amidst rising inequality trends.
6 The discussion in this section is based on Sen (2019).
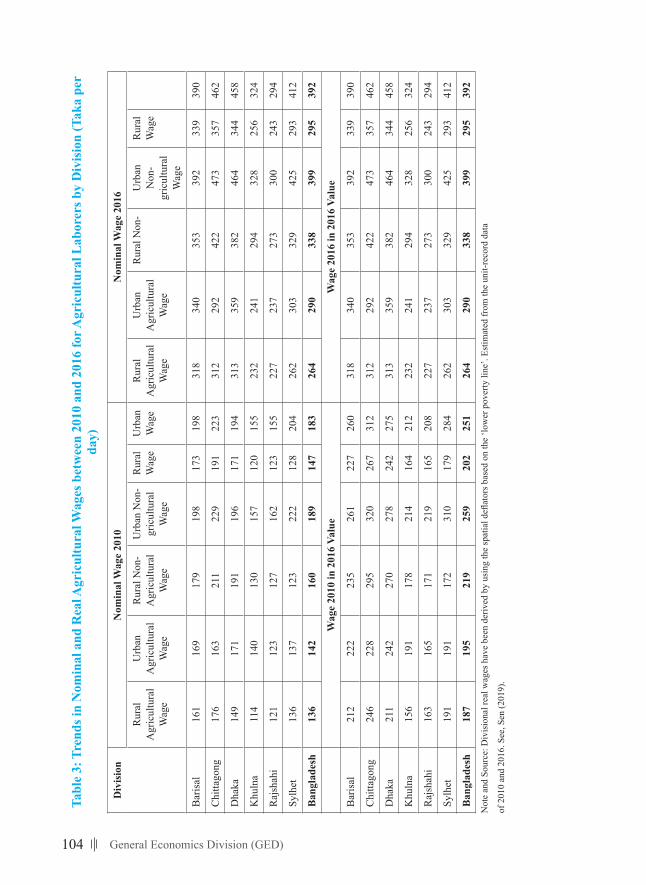
104 General Economics Division (GED)
Tabl
e 3:
Tre
nds i
n N
omin
al a
nd R
eal A
gric
ultu
ral W
ages
bet
wee
n 20
10 a
nd 2
016
for A
gric
ultu
ral L
abor
ers b
y D
ivis
ion
(Tak
a pe
r da
y)
Div
isio
nN
omin
al W
age
2010
Nom
inal
Wag
e 20
16
Rur
al
Agr
icul
tura
l W
age
Urb
an
Agr
icul
tura
l W
age
Rur
al N
on-
Agr
icul
tura
l W
age
Urb
an N
on-
gric
ultu
ral
Wag
e
Rur
al
Wag
eU
rban
W
age
Rur
al
Agr
icul
tura
l W
age
Urb
an
Agr
icul
tura
l W
age
Rur
al N
on-
Urb
an
Non
-gr
icul
tura
l W
age
Rur
al
Wag
e
Bar
isal
161
169
179
198
173
198
318
340
353
392
339
390
Chi
ttago
ng17
616
321
122
919
122
331
229
242
247
335
746
2
Dha
ka14
917
119
119
617
119
431
335
938
246
434
445
8
Khu
lna
114
140
130
157
120
155
232
241
294
328
256
324
Raj
shah
i12
112
312
716
212
315
522
723
727
330
024
329
4
Sylh
et13
613
712
322
212
820
426
230
332
942
529
341
2
Ban
glad
esh
136
142
160
189
147
183
264
290
338
399
295
392
Wag
e 20
10 in
201
6 Va
lue
Wag
e 20
16 in
201
6 Va
lue
Bar
isal
212
222
235
261
227
260
318
340
353
392
339
390
Chi
ttago
ng24
622
829
532
026
731
231
229
242
247
335
746
2
Dha
ka21
124
227
027
824
227
531
335
938
246
434
445
8
Khu
lna
156
191
178
214
164
212
232
241
294
328
256
324
Raj
shah
i16
316
517
121
916
520
822
723
727
330
024
329
4
Sylh
et19
119
117
231
017
928
426
230
332
942
529
341
2
Ban
glad
esh
187
195
219
259
202
251
264
290
338
399
295
392
Not
e an
d So
urce
: Div
isio
nal r
eal w
ages
hav
e be
en d
eriv
ed b
y us
ing
the
spat
ial d
eflat
ors b
ased
on
the
‘low
er p
over
ty li
ne’.
Estim
ated
from
the
unit-
reco
rd d
ata
of 2
010
and
2016
. See
, Sen
(201
9).
105Background Papers
This negates the often-heard claims about falling real wages in rural and urban areas in the 2010s. Such claims were based on deflating nominal wage rate series published by BBS with rural CPI. The latter method does not capture the complexities of ground reality on three counts. Firstly, the focus should be on the real wage annual income rather than the daily wage rate. This is because the concept of daily wage rate is no longer a valid description of agricultural wage labor market. The daily wage rate was earlier used to be defined as a workday of 8 to 10 hours duration. In recent years, we see the preponderance of a workday of 4-6 hours duration. Thus, in infrastructurally backward areas, a daily wage rate of 8-10 hours duration is equivalent to the daily wage rate of 4-6 hours duration in advanced areas (usually 500-700
Taka). In that case, a computation on the hourly basis would be a more appropriate method to allow valid comparisons of wages over time and across space. Second, half-day work duration means that rural workers are having a space of extra 2-4 hours to work either in self-employment or in non-farm wage employment. Hence, a computation of annual wage income over time and across space would have given a more correct assessment of the well-being situation of the poor (which is what we have done in Table
3). Third, urban wages have increased in all administrative divisions in real terms between 2010 and 2016 as per our calculations. This would surely suggest a significant drop in urban extreme poverty as most of the urban extreme poor are wage earners. Why, then, BBS data on urban extreme poverty shows stagnating trend during this period? We surmise that this may be due to statistical deficiencies with the collection of consumption data of the urban very poor.
1.1.3ProfileofthePoorandNon-Poor
As Amartya Sen (1981) pointed out many years ago, poverty incidence is useful, but it does not put a human face on poverty. Different heterogenous groups are “huddled together” under the rubric of income-poor or consumption-poor using the poverty line cut-off. This is justified to assess the trends in poverty but hardly qualify as a guide to policy action attuned to the different needs of diverse poverty groups. However, this heterogeneity marks not only the poor but also the non-poor. The latter issue has become increasingly important in the context of a pandemic shock, which affects not just the poor but also the non-poor. Operating on the J. C. Jack’s (1916/ 1975) definition of distinguishing the “comfort line” from the “indigence line” , we identify the 4 layers poor and non-poor groups. These are—extreme poor, moderate poor, vulnerable non-poor, and comfortable non-poor.7These groups have been quantified with the help of 2016 HIES (Table 4). The results show that vulnerable non-poor (VNP) who live below the “comfort line” but above the (upper) poverty line constitute about 22% of urban households and 26% of rural households. The category of VNP is likely to be susceptible to downward economic pressure in times of pandemic shock as layoffs mount and savings are drained. In contrast, comfortable non-poor (CNP) households live above the comfort line and may be viewed as the richer segment of the non-poor, comprising of middle class and rich. They constitute about 48% of rural households and 58% of urban households.
7 For an early discussion of J. C. Jack’s contribution to the development of the survey instrument using household - level income/ consumption data in colonial Bengal (Faridpur), and for his pioneering use of the concept of “comfort
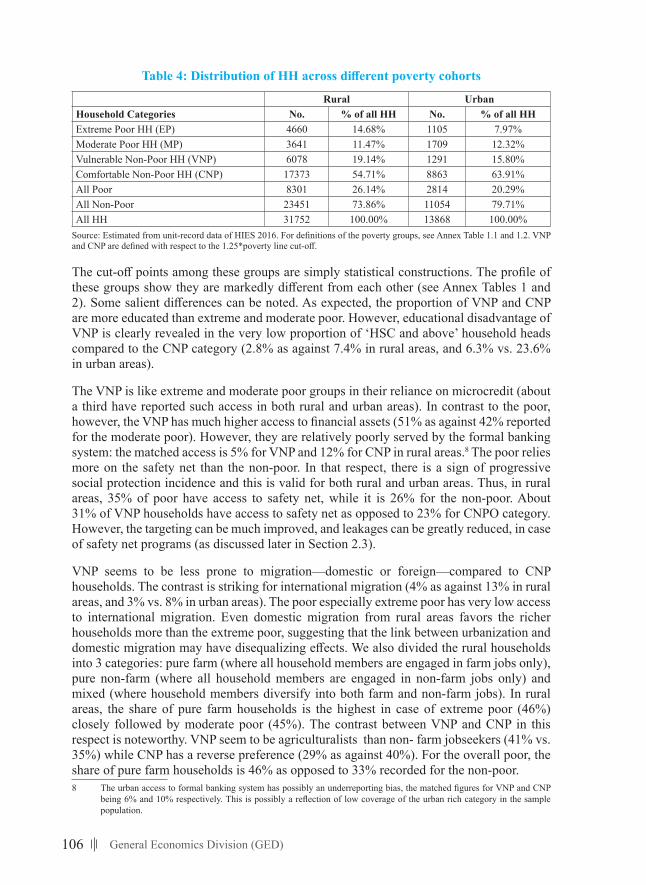
106 General Economics Division (GED)
Table4:DistributionofHHacrossdifferentpovertycohorts
Rural UrbanHousehold Categories No. % of all HH No. % of all HHExtreme Poor HH (EP) 4660 14.68% 1105 7.97%Moderate Poor HH (MP) 3641 11.47% 1709 12.32%Vulnerable Non-Poor HH (VNP) 6078 19.14% 1291 15.80%Comfortable Non-Poor HH (CNP) 17373 54.71% 8863 63.91%All Poor 8301 26.14% 2814 20.29%All Non-Poor 23451 73.86% 11054 79.71%All HH 31752 100.00% 13868 100.00%
Source: Estimated from unit-record data of HIES 2016. For definitions of the poverty groups, see Annex Table 1.1 and 1.2. VNP and CNP are defined with respect to the 1.25*poverty line cut-off.
The cut-off points among these groups are simply statistical constructions. The profile of these groups show they are markedly different from each other (see Annex Tables 1 and 2). Some salient differences can be noted. As expected, the proportion of VNP and CNP are more educated than extreme and moderate poor. However, educational disadvantage of VNP is clearly revealed in the very low proportion of ‘HSC and above’ household heads compared to the CNP category (2.8% as against 7.4% in rural areas, and 6.3% vs. 23.6% in urban areas).
The VNP is like extreme and moderate poor groups in their reliance on microcredit (about a third have reported such access in both rural and urban areas). In contrast to the poor, however, the VNP has much higher access to financial assets (51% as against 42% reported for the moderate poor). However, they are relatively poorly served by the formal banking system: the matched access is 5% for VNP and 12% for CNP in rural areas.8 The poor relies more on the safety net than the non-poor. In that respect, there is a sign of progressive social protection incidence and this is valid for both rural and urban areas. Thus, in rural areas, 35% of poor have access to safety net, while it is 26% for the non-poor. About 31% of VNP households have access to safety net as opposed to 23% for CNPO category. However, the targeting can be much improved, and leakages can be greatly reduced, in case of safety net programs (as discussed later in Section 2.3).
VNP seems to be less prone to migration—domestic or foreign—compared to CNP households. The contrast is striking for international migration (4% as against 13% in rural areas, and 3% vs. 8% in urban areas). The poor especially extreme poor has very low access to international migration. Even domestic migration from rural areas favors the richer households more than the extreme poor, suggesting that the link between urbanization and domestic migration may have disequalizing effects. We also divided the rural households into 3 categories: pure farm (where all household members are engaged in farm jobs only), pure non-farm (where all household members are engaged in non-farm jobs only) and mixed (where household members diversify into both farm and non-farm jobs). In rural areas, the share of pure farm households is the highest in case of extreme poor (46%) closely followed by moderate poor (45%). The contrast between VNP and CNP in this respect is noteworthy. VNP seem to be agriculturalists than non- farm jobseekers (41% vs. 35%) while CNP has a reverse preference (29% as against 40%). For the overall poor, the share of pure farm households is 46% as opposed to 33% recorded for the non-poor.8 The urban access to formal banking system has possibly an underreporting bias, the matched figures for VNP and CNP
being 6% and 10% respectively. This is possibly a reflection of low coverage of the urban rich category in the sample population.
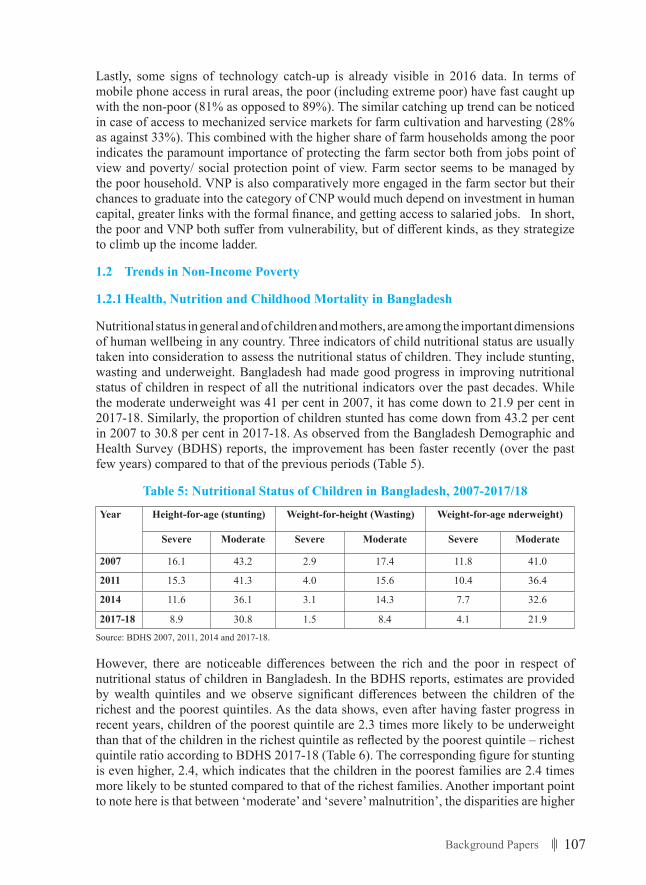
107Background Papers
Lastly, some signs of technology catch-up is already visible in 2016 data. In terms of mobile phone access in rural areas, the poor (including extreme poor) have fast caught up with the non-poor (81% as opposed to 89%). The similar catching up trend can be noticed in case of access to mechanized service markets for farm cultivation and harvesting (28% as against 33%). This combined with the higher share of farm households among the poor indicates the paramount importance of protecting the farm sector both from jobs point of view and poverty/ social protection point of view. Farm sector seems to be managed by the poor household. VNP is also comparatively more engaged in the farm sector but their chances to graduate into the category of CNP would much depend on investment in human capital, greater links with the formal finance, and getting access to salaried jobs. In short, the poor and VNP both suffer from vulnerability, but of different kinds, as they strategize to climb up the income ladder.
1.2 Trends in Non-Income Poverty
1.2.1 Health, Nutrition and Childhood Mortality in Bangladesh
Nutritional status in general and of children and mothers, are among the important dimensions of human wellbeing in any country. Three indicators of child nutritional status are usually taken into consideration to assess the nutritional status of children. They include stunting, wasting and underweight. Bangladesh had made good progress in improving nutritional status of children in respect of all the nutritional indicators over the past decades. While the moderate underweight was 41 per cent in 2007, it has come down to 21.9 per cent in 2017-18. Similarly, the proportion of children stunted has come down from 43.2 per cent in 2007 to 30.8 per cent in 2017-18. As observed from the Bangladesh Demographic and Health Survey (BDHS) reports, the improvement has been faster recently (over the past few years) compared to that of the previous periods (Table 5).
Table 5: Nutritional Status of Children in Bangladesh, 2007-2017/18
Year Height-for-age (stunting) Weight-for-height (Wasting) Weight-for-age nderweight)
Severe Moderate Severe Moderate Severe Moderate
2007 16.1 43.2 2.9 17.4 11.8 41.0
2011 15.3 41.3 4.0 15.6 10.4 36.4
2014 11.6 36.1 3.1 14.3 7.7 32.6
2017-18 8.9 30.8 1.5 8.4 4.1 21.9
Source: BDHS 2007, 2011, 2014 and 2017-18.
However, there are noticeable differences between the rich and the poor in respect of nutritional status of children in Bangladesh. In the BDHS reports, estimates are provided by wealth quintiles and we observe significant differences between the children of the richest and the poorest quintiles. As the data shows, even after having faster progress in recent years, children of the poorest quintile are 2.3 times more likely to be underweight than that of the children in the richest quintile as reflected by the poorest quintile – richest quintile ratio according to BDHS 2017-18 (Table 6). The corresponding figure for stunting is even higher, 2.4, which indicates that the children in the poorest families are 2.4 times more likely to be stunted compared to that of the richest families. Another important point to note here is that between ‘moderate’ and ‘severe’ malnutrition’, the disparities are higher
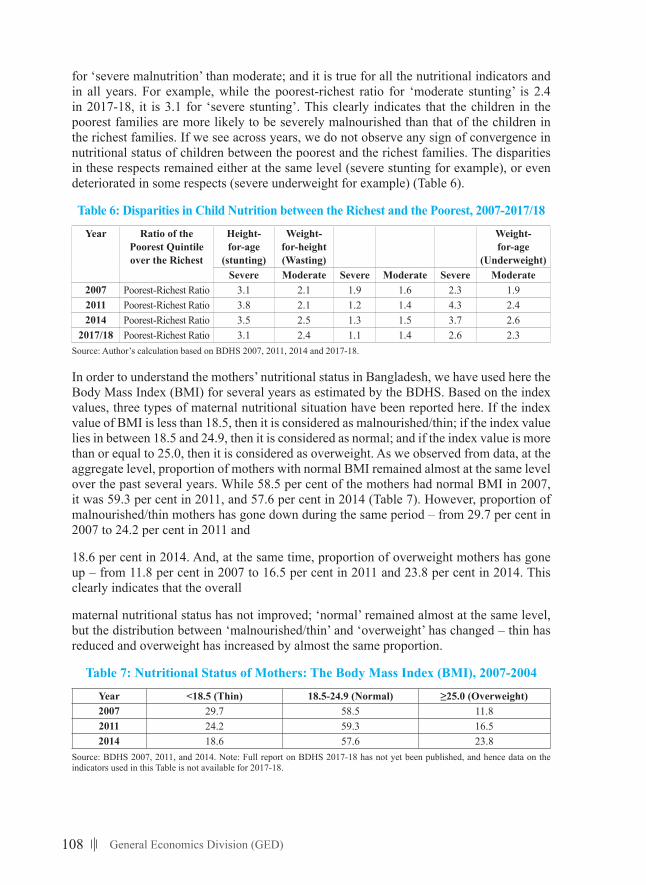
108 General Economics Division (GED)
for ‘severe malnutrition’ than moderate; and it is true for all the nutritional indicators and in all years. For example, while the poorest-richest ratio for ‘moderate stunting’ is 2.4 in 2017-18, it is 3.1 for ‘severe stunting’. This clearly indicates that the children in the poorest families are more likely to be severely malnourished than that of the children in the richest families. If we see across years, we do not observe any sign of convergence in nutritional status of children between the poorest and the richest families. The disparities in these respects remained either at the same level (severe stunting for example), or even deteriorated in some respects (severe underweight for example) (Table 6).
Table 6: Disparities in Child Nutrition between the Richest and the Poorest, 2007-2017/18
Year Ratio of the Poorest Quintile over the Richest
Height-for-age
(stunting)
Weight-for-height (Wasting)
Weight-for-age
(Underweight)Severe Moderate Severe Moderate Severe Moderate
2007 Poorest-Richest Ratio 3.1 2.1 1.9 1.6 2.3 1.92011 Poorest-Richest Ratio 3.8 2.1 1.2 1.4 4.3 2.42014 Poorest-Richest Ratio 3.5 2.5 1.3 1.5 3.7 2.6
2017/18 Poorest-Richest Ratio 3.1 2.4 1.1 1.4 2.6 2.3Source: Author’s calculation based on BDHS 2007, 2011, 2014 and 2017-18.
In order to understand the mothers’ nutritional status in Bangladesh, we have used here the Body Mass Index (BMI) for several years as estimated by the BDHS. Based on the index values, three types of maternal nutritional situation have been reported here. If the index value of BMI is less than 18.5, then it is considered as malnourished/thin; if the index value lies in between 18.5 and 24.9, then it is considered as normal; and if the index value is more than or equal to 25.0, then it is considered as overweight. As we observed from data, at the aggregate level, proportion of mothers with normal BMI remained almost at the same level over the past several years. While 58.5 per cent of the mothers had normal BMI in 2007, it was 59.3 per cent in 2011, and 57.6 per cent in 2014 (Table 7). However, proportion of malnourished/thin mothers has gone down during the same period – from 29.7 per cent in 2007 to 24.2 per cent in 2011 and
18.6 per cent in 2014. And, at the same time, proportion of overweight mothers has gone up – from 11.8 per cent in 2007 to 16.5 per cent in 2011 and 23.8 per cent in 2014. This clearly indicates that the overall
maternal nutritional status has not improved; ‘normal’ remained almost at the same level, but the distribution between ‘malnourished/thin’ and ‘overweight’ has changed – thin has reduced and overweight has increased by almost the same proportion.
Table 7: Nutritional Status of Mothers: The Body Mass Index (BMI), 2007-2004
Year <18.5 (Thin) 18.5-24.9 (Normal) ≥25.0(Overweight)2007 29.7 58.5 11.82011 24.2 59.3 16.52014 18.6 57.6 23.8
Source: BDHS 2007, 2011, and 2014. Note: Full report on BDHS 2017-18 has not yet been published, and hence data on the indicators used in this Table is not available for 2017-18.
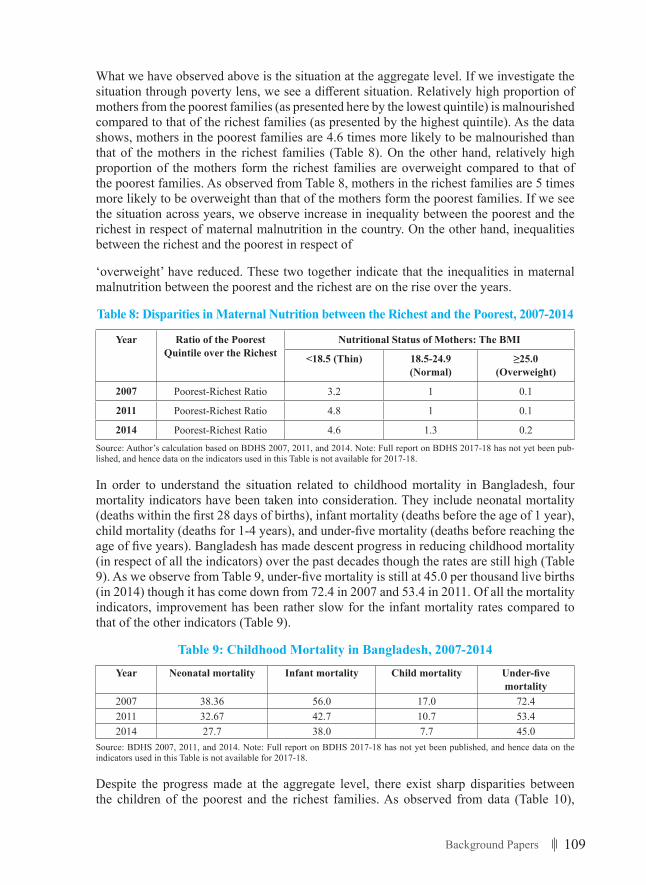
109Background Papers
What we have observed above is the situation at the aggregate level. If we investigate the situation through poverty lens, we see a different situation. Relatively high proportion of mothers from the poorest families (as presented here by the lowest quintile) is malnourished compared to that of the richest families (as presented by the highest quintile). As the data shows, mothers in the poorest families are 4.6 times more likely to be malnourished than that of the mothers in the richest families (Table 8). On the other hand, relatively high proportion of the mothers form the richest families are overweight compared to that of the poorest families. As observed from Table 8, mothers in the richest families are 5 times more likely to be overweight than that of the mothers form the poorest families. If we see the situation across years, we observe increase in inequality between the poorest and the richest in respect of maternal malnutrition in the country. On the other hand, inequalities between the richest and the poorest in respect of
‘overweight’ have reduced. These two together indicate that the inequalities in maternal malnutrition between the poorest and the richest are on the rise over the years.
Table 8: Disparities in Maternal Nutrition between the Richest and the Poorest, 2007-2014
Year Ratio of the Poorest Quintile over the Richest
Nutritional Status of Mothers: The BMI
<18.5 (Thin) 18.5-24.9 (Normal)
≥25.0(Overweight)
2007 Poorest-Richest Ratio 3.2 1 0.1
2011 Poorest-Richest Ratio 4.8 1 0.1
2014 Poorest-Richest Ratio 4.6 1.3 0.2Source: Author’s calculation based on BDHS 2007, 2011, and 2014. Note: Full report on BDHS 2017-18 has not yet been pub-lished, and hence data on the indicators used in this Table is not available for 2017-18.
In order to understand the situation related to childhood mortality in Bangladesh, four mortality indicators have been taken into consideration. They include neonatal mortality (deaths within the first 28 days of births), infant mortality (deaths before the age of 1 year), child mortality (deaths for 1-4 years), and under-five mortality (deaths before reaching the age of five years). Bangladesh has made descent progress in reducing childhood mortality (in respect of all the indicators) over the past decades though the rates are still high (Table 9). As we observe from Table 9, under-five mortality is still at 45.0 per thousand live births (in 2014) though it has come down from 72.4 in 2007 and 53.4 in 2011. Of all the mortality indicators, improvement has been rather slow for the infant mortality rates compared to that of the other indicators (Table 9).
Table 9: Childhood Mortality in Bangladesh, 2007-2014
Year Neonatal mortality Infant mortality Child mortality Under-fivemortality
2007 38.36 56.0 17.0 72.42011 32.67 42.7 10.7 53.42014 27.7 38.0 7.7 45.0
Source: BDHS 2007, 2011, and 2014. Note: Full report on BDHS 2017-18 has not yet been published, and hence data on the indicators used in this Table is not available for 2017-18.
Despite the progress made at the aggregate level, there exist sharp disparities between the children of the poorest and the richest families. As observed from data (Table 10),
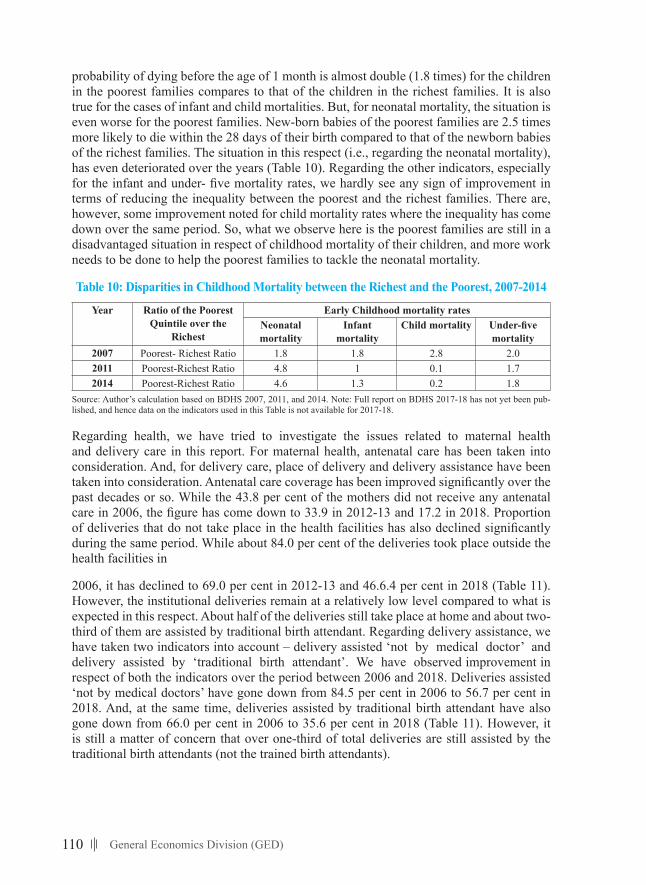
110 General Economics Division (GED)
probability of dying before the age of 1 month is almost double (1.8 times) for the children in the poorest families compares to that of the children in the richest families. It is also true for the cases of infant and child mortalities. But, for neonatal mortality, the situation is even worse for the poorest families. New-born babies of the poorest families are 2.5 times more likely to die within the 28 days of their birth compared to that of the newborn babies of the richest families. The situation in this respect (i.e., regarding the neonatal mortality), has even deteriorated over the years (Table 10). Regarding the other indicators, especially for the infant and under- five mortality rates, we hardly see any sign of improvement in terms of reducing the inequality between the poorest and the richest families. There are, however, some improvement noted for child mortality rates where the inequality has come down over the same period. So, what we observe here is the poorest families are still in a disadvantaged situation in respect of childhood mortality of their children, and more work needs to be done to help the poorest families to tackle the neonatal mortality.
Table 10: Disparities in Childhood Mortality between the Richest and the Poorest, 2007-2014
Year Ratio of the Poorest Quintile over the
Richest
Early Childhood mortality ratesNeonatal mortality
Infant mortality
Child mortality Under-fivemortality
2007 Poorest- Richest Ratio 1.8 1.8 2.8 2.0 2011 Poorest-Richest Ratio 4.8 1 0.1 1.72014 Poorest-Richest Ratio 4.6 1.3 0.2 1.8
Source: Author’s calculation based on BDHS 2007, 2011, and 2014. Note: Full report on BDHS 2017-18 has not yet been pub-lished, and hence data on the indicators used in this Table is not available for 2017-18.
Regarding health, we have tried to investigate the issues related to maternal health and delivery care in this report. For maternal health, antenatal care has been taken into consideration. And, for delivery care, place of delivery and delivery assistance have been taken into consideration. Antenatal care coverage has been improved significantly over the past decades or so. While the 43.8 per cent of the mothers did not receive any antenatal care in 2006, the figure has come down to 33.9 in 2012-13 and 17.2 in 2018. Proportion of deliveries that do not take place in the health facilities has also declined significantly during the same period. While about 84.0 per cent of the deliveries took place outside the health facilities in
2006, it has declined to 69.0 per cent in 2012-13 and 46.6.4 per cent in 2018 (Table 11). However, the institutional deliveries remain at a relatively low level compared to what is expected in this respect. About half of the deliveries still take place at home and about two-third of them are assisted by traditional birth attendant. Regarding delivery assistance, we have taken two indicators into account – delivery assisted ‘not by medical doctor’ and delivery assisted by ‘traditional birth attendant’. We have observed improvement in respect of both the indicators over the period between 2006 and 2018. Deliveries assisted ‘not by medical doctors’ have gone down from 84.5 per cent in 2006 to 56.7 per cent in 2018. And, at the same time, deliveries assisted by traditional birth attendant have also gone down from 66.0 per cent in 2006 to 35.6 per cent in 2018 (Table 11). However, it is still a matter of concern that over one-third of total deliveries are still assisted by the traditional birth attendants (not the trained birth attendants).
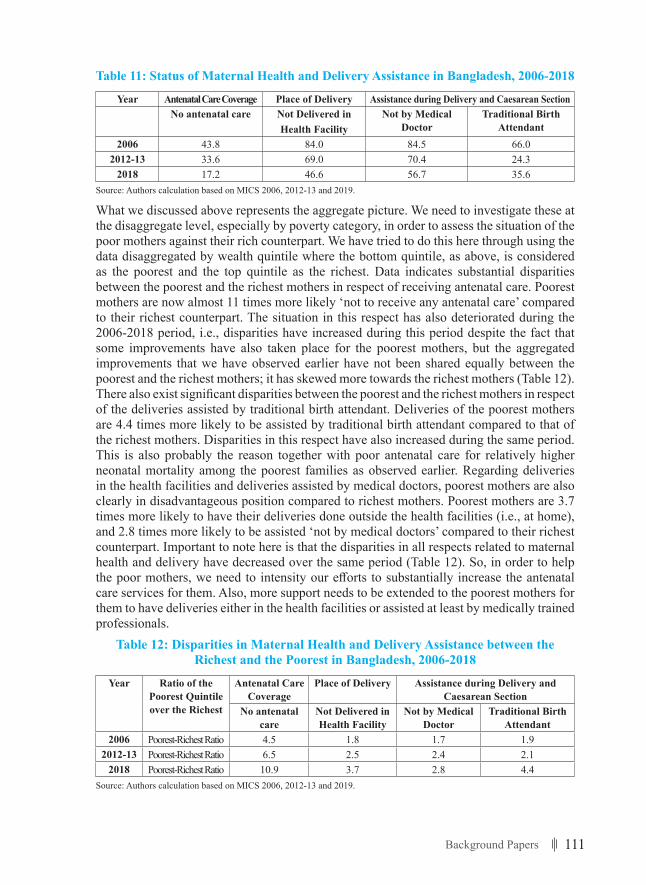
111Background Papers
Table 11: Status of Maternal Health and Delivery Assistance in Bangladesh, 2006-2018
Year Antenatal Care Coverage Place of Delivery Assistance during Delivery and Caesarean SectionNo antenatal care Not Delivered in
Health FacilityNot by Medical
DoctorTraditional Birth
Attendant2006 43.8 84.0 84.5 66.0
2012-13 33.6 69.0 70.4 24.32018 17.2 46.6 56.7 35.6
Source: Authors calculation based on MICS 2006, 2012-13 and 2019.
What we discussed above represents the aggregate picture. We need to investigate these at the disaggregate level, especially by poverty category, in order to assess the situation of the poor mothers against their rich counterpart. We have tried to do this here through using the data disaggregated by wealth quintile where the bottom quintile, as above, is considered as the poorest and the top quintile as the richest. Data indicates substantial disparities between the poorest and the richest mothers in respect of receiving antenatal care. Poorest mothers are now almost 11 times more likely ‘not to receive any antenatal care’ compared to their richest counterpart. The situation in this respect has also deteriorated during the 2006-2018 period, i.e., disparities have increased during this period despite the fact that some improvements have also taken place for the poorest mothers, but the aggregated improvements that we have observed earlier have not been shared equally between the poorest and the richest mothers; it has skewed more towards the richest mothers (Table 12). There also exist significant disparities between the poorest and the richest mothers in respect of the deliveries assisted by traditional birth attendant. Deliveries of the poorest mothers are 4.4 times more likely to be assisted by traditional birth attendant compared to that of the richest mothers. Disparities in this respect have also increased during the same period. This is also probably the reason together with poor antenatal care for relatively higher neonatal mortality among the poorest families as observed earlier. Regarding deliveries in the health facilities and deliveries assisted by medical doctors, poorest mothers are also clearly in disadvantageous position compared to richest mothers. Poorest mothers are 3.7 times more likely to have their deliveries done outside the health facilities (i.e., at home), and 2.8 times more likely to be assisted ‘not by medical doctors’ compared to their richest counterpart. Important to note here is that the disparities in all respects related to maternal health and delivery have decreased over the same period (Table 12). So, in order to help the poor mothers, we need to intensity our efforts to substantially increase the antenatal care services for them. Also, more support needs to be extended to the poorest mothers for them to have deliveries either in the health facilities or assisted at least by medically trained professionals.
Table 12: Disparities in Maternal Health and Delivery Assistance between the Richest and the Poorest in Bangladesh, 2006-2018
Year Ratio of the Poorest Quintile over the Richest
Antenatal Care Coverage
Place of Delivery Assistance during Delivery and Caesarean Section
No antenatal care
Not Delivered in Health Facility
Not by Medical Doctor
Traditional Birth Attendant
2006 Poorest-Richest Ratio 4.5 1.8 1.7 1.92012-13 Poorest-Richest Ratio 6.5 2.5 2.4 2.1
2018 Poorest-Richest Ratio 10.9 3.7 2.8 4.4Source: Authors calculation based on MICS 2006, 2012-13 and 2019.
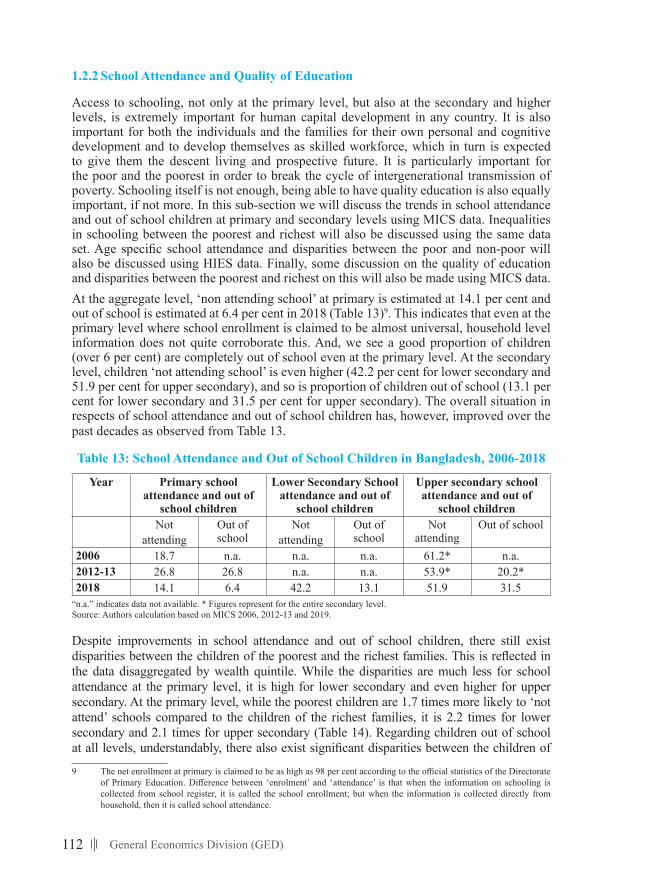
112 General Economics Division (GED)
1.2.2 School Attendance and Quality of Education
Access to schooling, not only at the primary level, but also at the secondary and higher levels, is extremely important for human capital development in any country. It is also important for both the individuals and the families for their own personal and cognitive development and to develop themselves as skilled workforce, which in turn is expected to give them the descent living and prospective future. It is particularly important for the poor and the poorest in order to break the cycle of intergenerational transmission of poverty. Schooling itself is not enough, being able to have quality education is also equally important, if not more. In this sub-section we will discuss the trends in school attendance and out of school children at primary and secondary levels using MICS data. Inequalities in schooling between the poorest and richest will also be discussed using the same data set. Age specific school attendance and disparities between the poor and non-poor will also be discussed using HIES data. Finally, some discussion on the quality of education and disparities between the poorest and richest on this will also be made using MICS data.At the aggregate level, ‘non attending school’ at primary is estimated at 14.1 per cent and out of school is estimated at 6.4 per cent in 2018 (Table 13)9. This indicates that even at the primary level where school enrollment is claimed to be almost universal, household level information does not quite corroborate this. And, we see a good proportion of children (over 6 per cent) are completely out of school even at the primary level. At the secondary level, children ‘not attending school’ is even higher (42.2 per cent for lower secondary and 51.9 per cent for upper secondary), and so is proportion of children out of school (13.1 per cent for lower secondary and 31.5 per cent for upper secondary). The overall situation in respects of school attendance and out of school children has, however, improved over the past decades as observed from Table 13.
Table 13: School Attendance and Out of School Children in Bangladesh, 2006-2018
Year Primary school attendance and out of
school children
Lower Secondary School attendance and out of
school children
Upper secondary school attendance and out of
school childrenNot
attendingOut of school
Not attending
Out of school
Not attending
Out of school
2006 18.7 n.a. n.a. n.a. 61.2* n.a.2012-13 26.8 26.8 n.a. n.a. 53.9* 20.2*2018 14.1 6.4 42.2 13.1 51.9 31.5
“n.a.” indicates data not available. * Figures represent for the entire secondary level.Source: Authors calculation based on MICS 2006, 2012-13 and 2019.
Despite improvements in school attendance and out of school children, there still exist disparities between the children of the poorest and the richest families. This is reflected in the data disaggregated by wealth quintile. While the disparities are much less for school attendance at the primary level, it is high for lower secondary and even higher for upper secondary. At the primary level, while the poorest children are 1.7 times more likely to ‘not attend’ schools compared to the children of the richest families, it is 2.2 times for lower secondary and 2.1 times for upper secondary (Table 14). Regarding children out of school at all levels, understandably, there also exist significant disparities between the children of
9 The net enrollment at primary is claimed to be as high as 98 per cent according to the official statistics of the Directorate of Primary Education. Difference between ‘enrolment’ and ‘attendance’ is that when the information on schooling is collected from school register, it is called the school enrollment; but when the information is collected directly from household, then it is called school attendance.
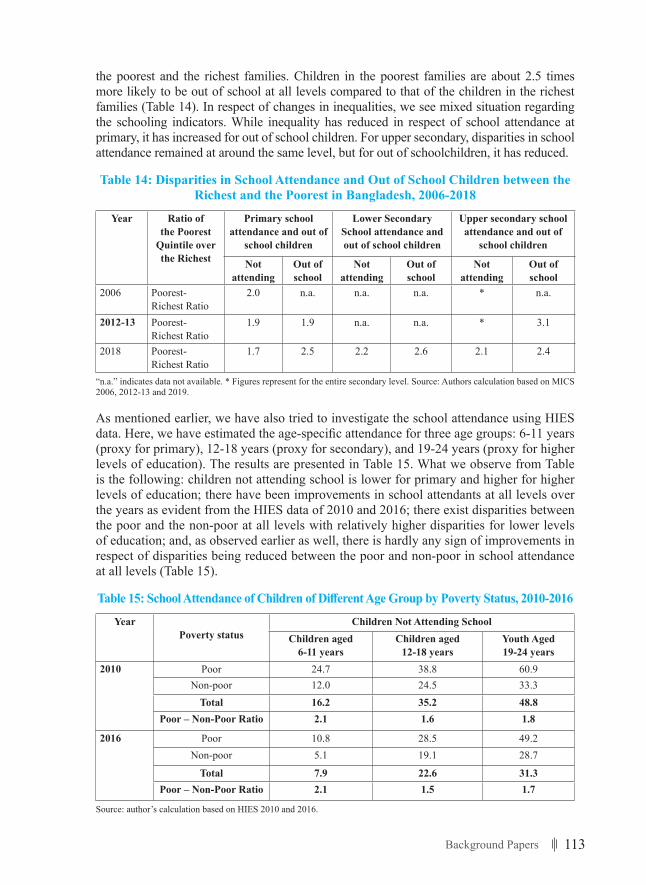
113Background Papers
the poorest and the richest families. Children in the poorest families are about 2.5 times more likely to be out of school at all levels compared to that of the children in the richest families (Table 14). In respect of changes in inequalities, we see mixed situation regarding the schooling indicators. While inequality has reduced in respect of school attendance at primary, it has increased for out of school children. For upper secondary, disparities in school attendance remained at around the same level, but for out of schoolchildren, it has reduced.
Table 14: Disparities in School Attendance and Out of School Children between the Richest and the Poorest in Bangladesh, 2006-2018
Year Ratio of the Poorest
Quintile over the Richest
Primary school attendance and out of
school children
Lower Secondary School attendance and out of school children
Upper secondary school attendance and out of
school children
Not attending
Out of school
Not attending
Out of school
Not attending
Out of school
2006 Poorest- Richest Ratio
2.0 n.a. n.a. n.a. * n.a.
2012-13 Poorest- Richest Ratio
1.9 1.9 n.a. n.a. * 3.1
2018 Poorest- Richest Ratio
1.7 2.5 2.2 2.6 2.1 2.4
“n.a.” indicates data not available. * Figures represent for the entire secondary level. Source: Authors calculation based on MICS 2006, 2012-13 and 2019.
As mentioned earlier, we have also tried to investigate the school attendance using HIES data. Here, we have estimated the age-specific attendance for three age groups: 6-11 years (proxy for primary), 12-18 years (proxy for secondary), and 19-24 years (proxy for higher levels of education). The results are presented in Table 15. What we observe from Table is the following: children not attending school is lower for primary and higher for higher levels of education; there have been improvements in school attendants at all levels over the years as evident from the HIES data of 2010 and 2016; there exist disparities between the poor and the non-poor at all levels with relatively higher disparities for lower levels of education; and, as observed earlier as well, there is hardly any sign of improvements in respect of disparities being reduced between the poor and non-poor in school attendance at all levels (Table 15).
Table15:SchoolAttendanceofChildrenofDifferentAgeGroupbyPovertyStatus,2010-2016
YearPoverty status
Children Not Attending SchoolChildren aged
6-11 yearsChildren aged
12-18 yearsYouth Aged19-24 years
2010 Poor 24.7 38.8 60.9Non-poor 12.0 24.5 33.3
Total 16.2 35.2 48.8Poor – Non-Poor Ratio 2.1 1.6 1.8
2016 Poor 10.8 28.5 49.2Non-poor 5.1 19.1 28.7
Total 7.9 22.6 31.3Poor – Non-Poor Ratio 2.1 1.5 1.7
Source: author’s calculation based on HIES 2010 and 2016.
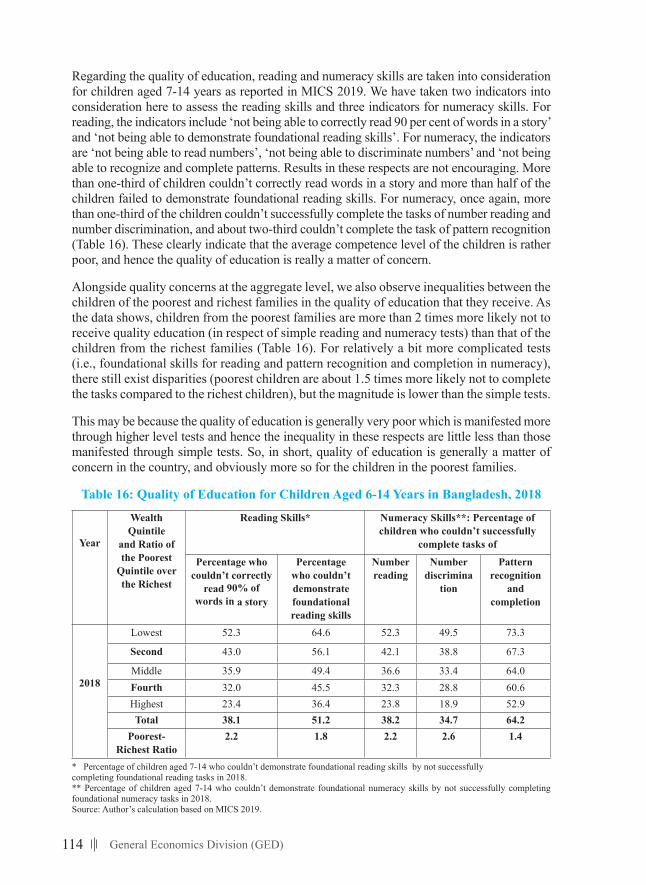
114 General Economics Division (GED)
Regarding the quality of education, reading and numeracy skills are taken into consideration for children aged 7-14 years as reported in MICS 2019. We have taken two indicators into consideration here to assess the reading skills and three indicators for numeracy skills. For reading, the indicators include ‘not being able to correctly read 90 per cent of words in a story’ and ‘not being able to demonstrate foundational reading skills’. For numeracy, the indicators are ‘not being able to read numbers’, ‘not being able to discriminate numbers’ and ‘not being able to recognize and complete patterns. Results in these respects are not encouraging. More than one-third of children couldn’t correctly read words in a story and more than half of the children failed to demonstrate foundational reading skills. For numeracy, once again, more than one-third of the children couldn’t successfully complete the tasks of number reading and number discrimination, and about two-third couldn’t complete the task of pattern recognition (Table 16). These clearly indicate that the average competence level of the children is rather poor, and hence the quality of education is really a matter of concern.
Alongside quality concerns at the aggregate level, we also observe inequalities between the children of the poorest and richest families in the quality of education that they receive. As the data shows, children from the poorest families are more than 2 times more likely not to receive quality education (in respect of simple reading and numeracy tests) than that of the children from the richest families (Table 16). For relatively a bit more complicated tests (i.e., foundational skills for reading and pattern recognition and completion in numeracy), there still exist disparities (poorest children are about 1.5 times more likely not to complete the tasks compared to the richest children), but the magnitude is lower than the simple tests.
This may be because the quality of education is generally very poor which is manifested more through higher level tests and hence the inequality in these respects are little less than those manifested through simple tests. So, in short, quality of education is generally a matter of concern in the country, and obviously more so for the children in the poorest families.
Table 16: Quality of Education for Children Aged 6-14 Years in Bangladesh, 2018
Year
Wealth Quintile
and Ratio of the Poorest
Quintile over the Richest
Reading Skills* Numeracy Skills**: Percentage of children who couldn’t successfully
complete tasks of
Percentage who couldn’t correctly
read 90% of words in a story
Percentage who couldn’t demonstrate foundational reading skills
Number reading
Number discrimina
tion
Pattern recognition
and completion
2018
Lowest 52.3 64.6 52.3 49.5 73.3
Second 43.0 56.1 42.1 38.8 67.3
Middle 35.9 49.4 36.6 33.4 64.0Fourth 32.0 45.5 32.3 28.8 60.6Highest 23.4 36.4 23.8 18.9 52.9Total 38.1 51.2 38.2 34.7 64.2
Poorest-Richest Ratio
2.2 1.8 2.2 2.6 1.4
* Percentage of children aged 7-14 who couldn’t demonstrate foundational reading skills by not successfullycompleting foundational reading tasks in 2018.** Percentage of children aged 7-14 who couldn’t demonstrate foundational numeracy skills by not successfully completing foundational numeracy tasks in 2018.Source: Author’s calculation based on MICS 2019.
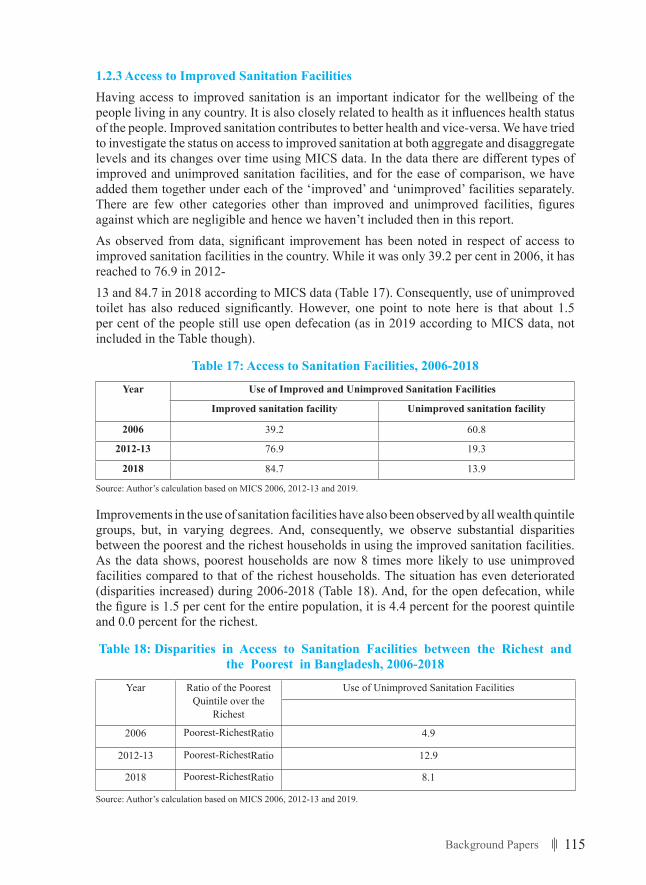
115Background Papers
1.2.3 Access to Improved Sanitation FacilitiesHaving access to improved sanitation is an important indicator for the wellbeing of the people living in any country. It is also closely related to health as it influences health status of the people. Improved sanitation contributes to better health and vice-versa. We have tried to investigate the status on access to improved sanitation at both aggregate and disaggregate levels and its changes over time using MICS data. In the data there are different types of improved and unimproved sanitation facilities, and for the ease of comparison, we have added them together under each of the ‘improved’ and ‘unimproved’ facilities separately. There are few other categories other than improved and unimproved facilities, figures against which are negligible and hence we haven’t included then in this report.As observed from data, significant improvement has been noted in respect of access to improved sanitation facilities in the country. While it was only 39.2 per cent in 2006, it has reached to 76.9 in 2012-13 and 84.7 in 2018 according to MICS data (Table 17). Consequently, use of unimproved toilet has also reduced significantly. However, one point to note here is that about 1.5 per cent of the people still use open defecation (as in 2019 according to MICS data, not included in the Table though).
Table 17: Access to Sanitation Facilities, 2006-2018
Year Use of Improved and Unimproved Sanitation Facilities
Improved sanitation facility Unimproved sanitation facility
2006 39.2 60.8
2012-13 76.9 19.3
2018 84.7 13.9
Source: Author’s calculation based on MICS 2006, 2012-13 and 2019.
Improvements in the use of sanitation facilities have also been observed by all wealth quintile groups, but, in varying degrees. And, consequently, we observe substantial disparities between the poorest and the richest households in using the improved sanitation facilities. As the data shows, poorest households are now 8 times more likely to use unimproved facilities compared to that of the richest households. The situation has even deteriorated (disparities increased) during 2006-2018 (Table 18). And, for the open defecation, while the figure is 1.5 per cent for the entire population, it is 4.4 percent for the poorest quintile and 0.0 percent for the richest.
Table 18: Disparities in Access to Sanitation Facilities between the Richest and the Poorest in Bangladesh, 2006-2018
Year Ratio of the Poorest Quintile over the
Richest
Use of Unimproved Sanitation Facilities
2006 Poorest-RichestRatio 4.9
2012-13 Poorest-RichestRatio 12.9
2018 Poorest-RichestRatio 8.1
Source: Author’s calculation based on MICS 2006, 2012-13 and 2019.
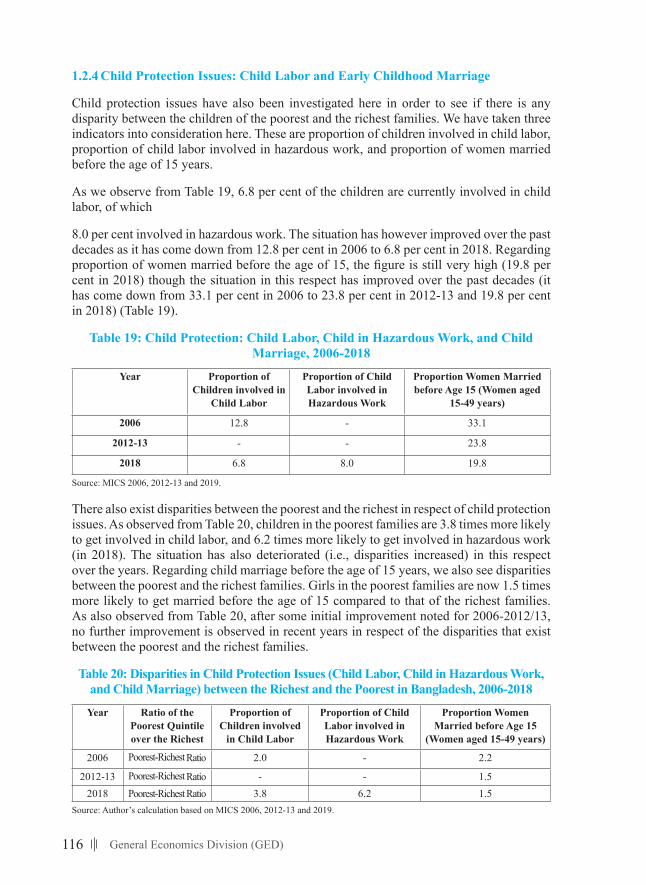
116 General Economics Division (GED)
1.2.4 Child Protection Issues: Child Labor and Early Childhood Marriage
Child protection issues have also been investigated here in order to see if there is any disparity between the children of the poorest and the richest families. We have taken three indicators into consideration here. These are proportion of children involved in child labor, proportion of child labor involved in hazardous work, and proportion of women married before the age of 15 years.
As we observe from Table 19, 6.8 per cent of the children are currently involved in child labor, of which
8.0 per cent involved in hazardous work. The situation has however improved over the past decades as it has come down from 12.8 per cent in 2006 to 6.8 per cent in 2018. Regarding proportion of women married before the age of 15, the figure is still very high (19.8 per cent in 2018) though the situation in this respect has improved over the past decades (it has come down from 33.1 per cent in 2006 to 23.8 per cent in 2012-13 and 19.8 per cent in 2018) (Table 19).
Table 19: Child Protection: Child Labor, Child in Hazardous Work, and Child Marriage, 2006-2018
Year Proportion of Children involved in
Child Labor
Proportion of Child Labor involved in Hazardous Work
Proportion Women Married before Age 15 (Women aged
15-49 years)
2006 12.8 - 33.1
2012-13 - - 23.8
2018 6.8 8.0 19.8
Source: MICS 2006, 2012-13 and 2019.
There also exist disparities between the poorest and the richest in respect of child protection issues. As observed from Table 20, children in the poorest families are 3.8 times more likely to get involved in child labor, and 6.2 times more likely to get involved in hazardous work (in 2018). The situation has also deteriorated (i.e., disparities increased) in this respect over the years. Regarding child marriage before the age of 15 years, we also see disparities between the poorest and the richest families. Girls in the poorest families are now 1.5 times more likely to get married before the age of 15 compared to that of the richest families. As also observed from Table 20, after some initial improvement noted for 2006-2012/13, no further improvement is observed in recent years in respect of the disparities that exist between the poorest and the richest families.
Table 20: Disparities in Child Protection Issues (Child Labor, Child in Hazardous Work, and Child Marriage) between the Richest and the Poorest in Bangladesh, 2006-2018
Year Ratio of the Poorest Quintile over the Richest
Proportion of Children involved
in Child Labor
Proportion of Child Labor involved in Hazardous Work
Proportion Women Married before Age 15
(Women aged 15-49 years)
2006 Poorest-Richest Ratio 2.0 - 2.2
2012-13 Poorest-Richest Ratio - - 1.52018 Poorest-Richest Ratio 3.8 6.2 1.5
Source: Author’s calculation based on MICS 2006, 2012-13 and 2019.
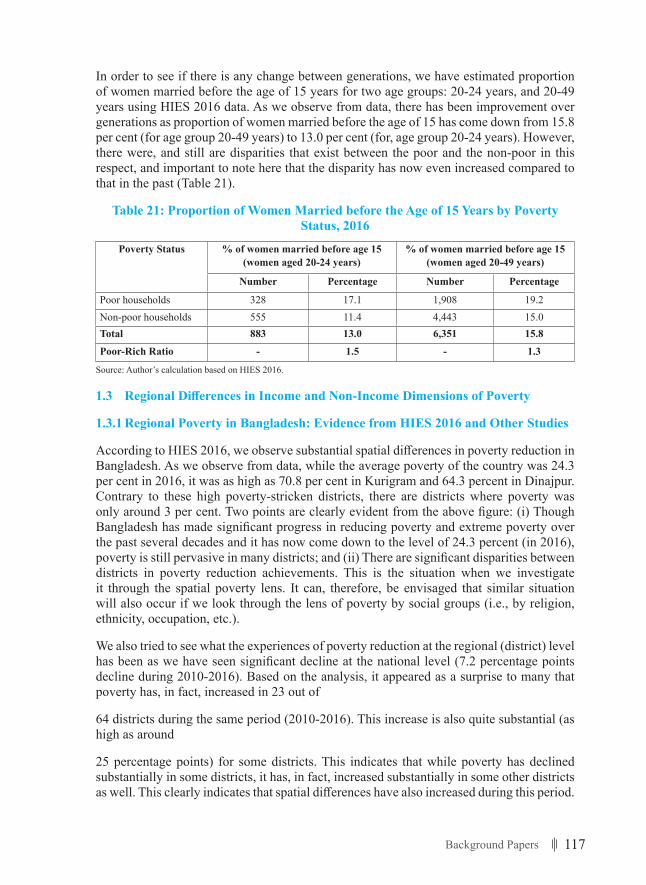
117Background Papers
In order to see if there is any change between generations, we have estimated proportion of women married before the age of 15 years for two age groups: 20-24 years, and 20-49 years using HIES 2016 data. As we observe from data, there has been improvement over generations as proportion of women married before the age of 15 has come down from 15.8 per cent (for age group 20-49 years) to 13.0 per cent (for, age group 20-24 years). However, there were, and still are disparities that exist between the poor and the non-poor in this respect, and important to note here that the disparity has now even increased compared to that in the past (Table 21).
Table 21: Proportion of Women Married before the Age of 15 Years by Poverty Status, 2016
Poverty Status % of women married before age 15 (women aged 20-24 years)
% of women married before age 15 (women aged 20-49 years)
Number Percentage Number Percentage
Poor households 328 17.1 1,908 19.2Non-poor households 555 11.4 4,443 15.0Total 883 13.0 6,351 15.8
Poor-Rich Ratio - 1.5 - 1.3
Source: Author’s calculation based on HIES 2016.
1.3 RegionalDifferencesinIncomeandNon-IncomeDimensionsofPoverty
1.3.1 Regional Poverty in Bangladesh: Evidence from HIES 2016 and Other Studies
According to HIES 2016, we observe substantial spatial differences in poverty reduction in Bangladesh. As we observe from data, while the average poverty of the country was 24.3 per cent in 2016, it was as high as 70.8 per cent in Kurigram and 64.3 percent in Dinajpur. Contrary to these high poverty-stricken districts, there are districts where poverty was only around 3 per cent. Two points are clearly evident from the above figure: (i) Though Bangladesh has made significant progress in reducing poverty and extreme poverty over the past several decades and it has now come down to the level of 24.3 percent (in 2016), poverty is still pervasive in many districts; and (ii) There are significant disparities between districts in poverty reduction achievements. This is the situation when we investigate it through the spatial poverty lens. It can, therefore, be envisaged that similar situation will also occur if we look through the lens of poverty by social groups (i.e., by religion, ethnicity, occupation, etc.).
We also tried to see what the experiences of poverty reduction at the regional (district) level has been as we have seen significant decline at the national level (7.2 percentage points decline during 2010-2016). Based on the analysis, it appeared as a surprise to many that poverty has, in fact, increased in 23 out of
64 districts during the same period (2010-2016). This increase is also quite substantial (as high as around
25 percentage points) for some districts. This indicates that while poverty has declined substantially in some districts, it has, in fact, increased substantially in some other districts as well. This clearly indicates that spatial differences have also increased during this period.
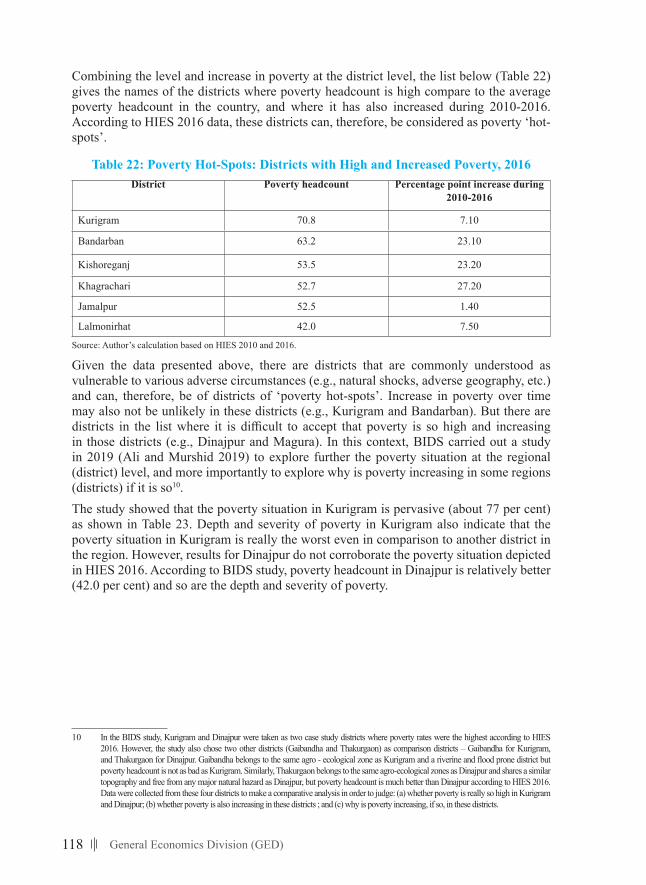
118 General Economics Division (GED)
Combining the level and increase in poverty at the district level, the list below (Table 22) gives the names of the districts where poverty headcount is high compare to the average poverty headcount in the country, and where it has also increased during 2010-2016. According to HIES 2016 data, these districts can, therefore, be considered as poverty ‘hot-spots’.
Table 22: Poverty Hot-Spots: Districts with High and Increased Poverty, 2016District Poverty headcount Percentage point increase during
2010-2016
Kurigram 70.8 7.10
Bandarban 63.2 23.10
Kishoreganj 53.5 23.20
Khagrachari 52.7 27.20
Jamalpur 52.5 1.40
Lalmonirhat 42.0 7.50
Source: Author’s calculation based on HIES 2010 and 2016.
Given the data presented above, there are districts that are commonly understood as vulnerable to various adverse circumstances (e.g., natural shocks, adverse geography, etc.) and can, therefore, be of districts of ‘poverty hot-spots’. Increase in poverty over time may also not be unlikely in these districts (e.g., Kurigram and Bandarban). But there are districts in the list where it is difficult to accept that poverty is so high and increasing in those districts (e.g., Dinajpur and Magura). In this context, BIDS carried out a study in 2019 (Ali and Murshid 2019) to explore further the poverty situation at the regional (district) level, and more importantly to explore why is poverty increasing in some regions (districts) if it is so10.The study showed that the poverty situation in Kurigram is pervasive (about 77 per cent) as shown in Table 23. Depth and severity of poverty in Kurigram also indicate that the poverty situation in Kurigram is really the worst even in comparison to another district in the region. However, results for Dinajpur do not corroborate the poverty situation depicted in HIES 2016. According to BIDS study, poverty headcount in Dinajpur is relatively better (42.0 per cent) and so are the depth and severity of poverty.
10 In the BIDS study, Kurigram and Dinajpur were taken as two case study districts where poverty rates were the highest according to HIES 2016. However, the study also chose two other districts (Gaibandha and Thakurgaon) as comparison districts – Gaibandha for Kurigram, and Thakurgaon for Dinajpur. Gaibandha belongs to the same agro - ecological zone as Kurigram and a riverine and flood prone district but poverty headcount is not as bad as Kurigram. Similarly, Thakurgaon belongs to the same agro-ecological zones as Dinajpur and shares a similar topography and free from any major natural hazard as Dinajpur, but poverty headcount is much better than Dinajpur according to HIES 2016. Data were collected from these four districts to make a comparative analysis in order to judge: (a) whether poverty is really so high in Kurigram and Dinajpur; (b) whether poverty is also increasing in these districts ; and (c) why is poverty increasing, if so, in these districts.
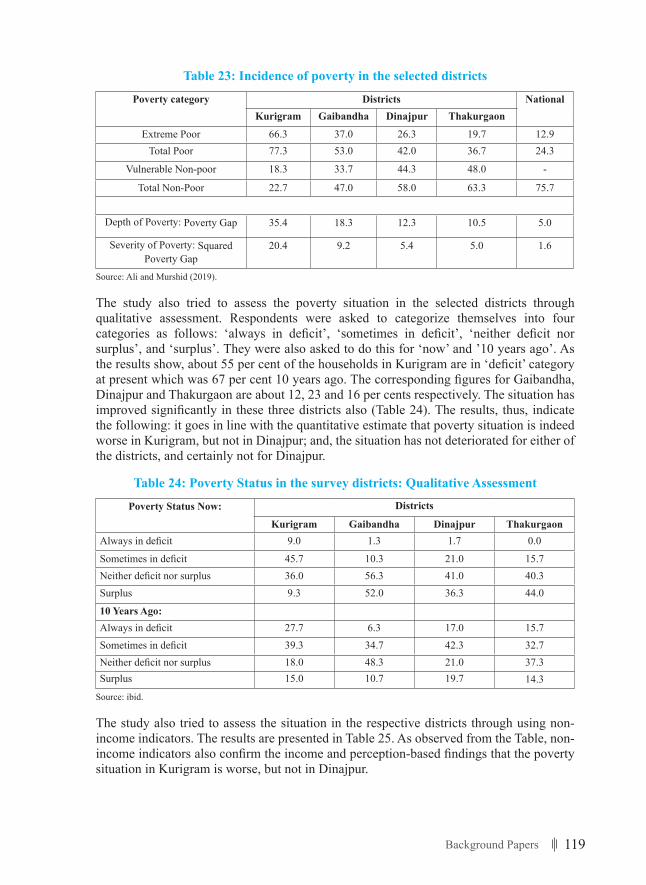
119Background Papers
Table 23: Incidence of poverty in the selected districts
Poverty category Districts NationalKurigram Gaibandha Dinajpur Thakurgaon
Extreme Poor 66.3 37.0 26.3 19.7 12.9Total Poor 77.3 53.0 42.0 36.7 24.3
Vulnerable Non-poor 18.3 33.7 44.3 48.0 -
Total Non-Poor 22.7 47.0 58.0 63.3 75.7
Depth of Poverty: Poverty Gap 35.4 18.3 12.3 10.5 5.0
Severity of Poverty: Squared Poverty Gap
20.4 9.2 5.4 5.0 1.6
Source: Ali and Murshid (2019).
The study also tried to assess the poverty situation in the selected districts through qualitative assessment. Respondents were asked to categorize themselves into four categories as follows: ‘always in deficit’, ‘sometimes in deficit’, ‘neither deficit nor surplus’, and ‘surplus’. They were also asked to do this for ‘now’ and ’10 years ago’. As the results show, about 55 per cent of the households in Kurigram are in ‘deficit’ category at present which was 67 per cent 10 years ago. The corresponding figures for Gaibandha, Dinajpur and Thakurgaon are about 12, 23 and 16 per cents respectively. The situation has improved significantly in these three districts also (Table 24). The results, thus, indicate the following: it goes in line with the quantitative estimate that poverty situation is indeed worse in Kurigram, but not in Dinajpur; and, the situation has not deteriorated for either of the districts, and certainly not for Dinajpur.
Table 24: Poverty Status in the survey districts: Qualitative Assessment
Poverty Status Now: Districts
Kurigram Gaibandha Dinajpur ThakurgaonAlways in deficit 9.0 1.3 1.7 0.0
Sometimes in deficit 45.7 10.3 21.0 15.7Neither deficit nor surplus 36.0 56.3 41.0 40.3Surplus 9.3 52.0 36.3 44.0
10 Years Ago:Always in deficit 27.7 6.3 17.0 15.7Sometimes in deficit 39.3 34.7 42.3 32.7Neither deficit nor surplus 18.0 48.3 21.0 37.3Surplus 15.0 10.7 19.7 14.3
Source: ibid.
The study also tried to assess the situation in the respective districts through using non-income indicators. The results are presented in Table 25. As observed from the Table, non-income indicators also confirm the income and perception-based findings that the poverty situation in Kurigram is worse, but not in Dinajpur.
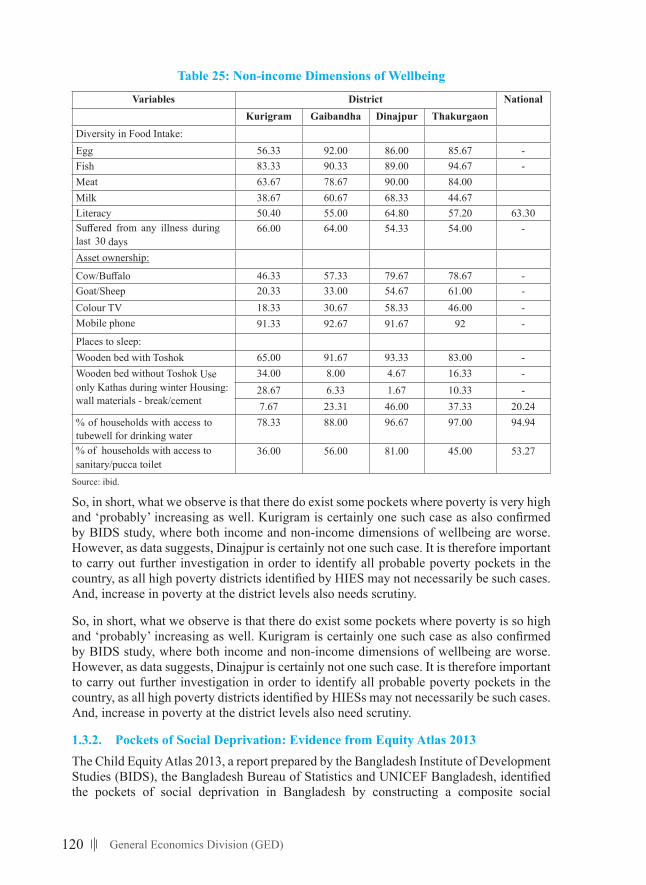
120 General Economics Division (GED)
Table 25: Non-income Dimensions of Wellbeing
Variables District NationalKurigram Gaibandha Dinajpur Thakurgaon
Diversity in Food Intake:Egg 56.33 92.00 86.00 85.67 -Fish 83.33 90.33 89.00 94.67 -Meat 63.67 78.67 90.00 84.00Milk 38.67 60.67 68.33 44.67Literacy 50.40 55.00 64.80 57.20 63.30Suffered from any illness during last 30 days
66.00 64.00 54.33 54.00 -
Asset ownership:
Cow/Buffalo 46.33 57.33 79.67 78.67 -Goat/Sheep 20.33 33.00 54.67 61.00 -Colour TV 18.33 30.67 58.33 46.00 -Mobile phone 91.33 92.67 91.67 92 -
Places to sleep:Wooden bed with Toshok 65.00 91.67 93.33 83.00 -Wooden bed without Toshok Use only Kathas during winter Housing: wall materials - break/cement
34.00 8.00 4.67 16.33 -28.67 6.33 1.67 10.33 -7.67 23.31 46.00 37.33 20.24
% of households with access to tubewell for drinking water
78.33 88.00 96.67 97.00 94.94
% of households with access to sanitary/pucca toilet
36.00 56.00 81.00 45.00 53.27
Source: ibid.
So, in short, what we observe is that there do exist some pockets where poverty is very high and ‘probably’ increasing as well. Kurigram is certainly one such case as also confirmed by BIDS study, where both income and non-income dimensions of wellbeing are worse. However, as data suggests, Dinajpur is certainly not one such case. It is therefore important to carry out further investigation in order to identify all probable poverty pockets in the country, as all high poverty districts identified by HIES may not necessarily be such cases. And, increase in poverty at the district levels also needs scrutiny.
So, in short, what we observe is that there do exist some pockets where poverty is so high and ‘probably’ increasing as well. Kurigram is certainly one such case as also confirmed by BIDS study, where both income and non-income dimensions of wellbeing are worse. However, as data suggests, Dinajpur is certainly not one such case. It is therefore important to carry out further investigation in order to identify all probable poverty pockets in the country, as all high poverty districts identified by HIESs may not necessarily be such cases. And, increase in poverty at the district levels also need scrutiny.
1.3.2. Pockets of Social Deprivation: Evidence from Equity Atlas 2013The Child Equity Atlas 2013, a report prepared by the Bangladesh Institute of Development Studies (BIDS), the Bangladesh Bureau of Statistics and UNICEF Bangladesh, identified the pockets of social deprivation in Bangladesh by constructing a composite social
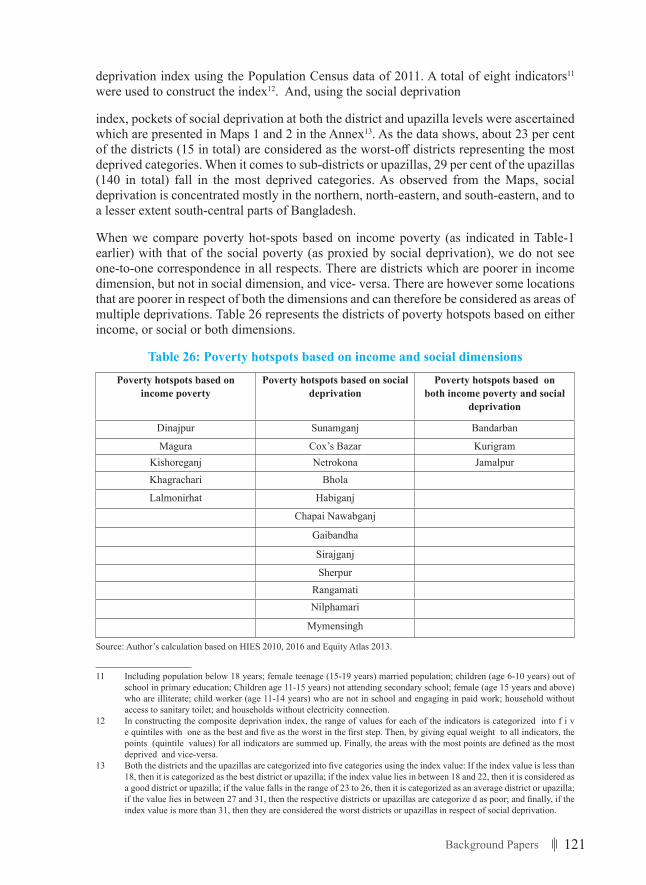
121Background Papers
deprivation index using the Population Census data of 2011. A total of eight indicators11 were used to construct the index12. And, using the social deprivation
index, pockets of social deprivation at both the district and upazilla levels were ascertained which are presented in Maps 1 and 2 in the Annex13. As the data shows, about 23 per cent of the districts (15 in total) are considered as the worst-off districts representing the most deprived categories. When it comes to sub-districts or upazillas, 29 per cent of the upazillas (140 in total) fall in the most deprived categories. As observed from the Maps, social deprivation is concentrated mostly in the northern, north-eastern, and south-eastern, and to a lesser extent south-central parts of Bangladesh.
When we compare poverty hot-spots based on income poverty (as indicated in Table-1 earlier) with that of the social poverty (as proxied by social deprivation), we do not see one-to-one correspondence in all respects. There are districts which are poorer in income dimension, but not in social dimension, and vice- versa. There are however some locations that are poorer in respect of both the dimensions and can therefore be considered as areas of multiple deprivations. Table 26 represents the districts of poverty hotspots based on either income, or social or both dimensions.
Table 26: Poverty hotspots based on income and social dimensions
Poverty hotspots based on income poverty
Poverty hotspots based on social deprivation
Poverty hotspots based on both income poverty and social
deprivation
Dinajpur Sunamganj Bandarban
Magura Cox’s Bazar KurigramKishoreganj Netrokona JamalpurKhagrachari Bhola
Lalmonirhat Habiganj
Chapai Nawabganj
Gaibandha
Sirajganj
SherpurRangamatiNilphamari
Mymensingh
Source: Author’s calculation based on HIES 2010, 2016 and Equity Atlas 2013.
11 Including population below 18 years; female teenage (15-19 years) married population; children (age 6-10 years) out of school in primary education; Children age 11-15 years) not attending secondary school; female (age 15 years and above) who are illiterate; child worker (age 11-14 years) who are not in school and engaging in paid work; household without access to sanitary toilet; and households without electricity connection.
12 In constructing the composite deprivation index, the range of values for each of the indicators is categorized into f i v e quintiles with one as the best and five as the worst in the first step. Then, by giving equal weight to all indicators, the points (quintile values) for all indicators are summed up. Finally, the areas with the most points are defined as the most deprived and vice-versa.
13 Both the districts and the upazillas are categorized into five categories using the index value: If the index value is less than 18, then it is categorized as the best district or upazilla; if the index value lies in between 18 and 22, then it is considered as a good district or upazilla; if the value falls in the range of 23 to 26, then it is categorized as an average district or upazilla; if the value lies in between 27 and 31, then the respective districts or upazillas are categorize d as poor; and finally, if the index value is more than 31, then they are considered the worst districts or upazillas in respect of social deprivation.
122 General Economics Division (GED)
So, the message here is that in order to identify the pockets of poverty or areas of deprivation, we need to explore this in a multi-dimensional space (i.e., from both income and non-income perspectives). In doing so, we can identify the locations that are deprived in both dimensions and the ones that are deprived in either of the dimensions. This will then help the policy makers in designing location specific strategies and allocating resources accordingly in order to ensure the deprived locations to also catch up.
The district level Map of social deprivation, as referred earlier, shows an interesting pattern: with few exceptions: the whole western and southern parts of the country fall within the ‘good’ category while the northern and eastern parts fall in the more deprived category. The best performing districts are located around Khulna and Barisal divisions, compared to Sylhet division which visibly lags behind.
The upazilla Map with its much greater geographic resolution features many other poorly performing areas indicating disparities within districts and between upazillas, which were obscured by district averages in the district Map. Overall district performance is often a combination of ‘good’ and ‘poor’ performance at the upazilla level. Data mapping at lower administrative levels allows us to recognize more important patterns and pockets of social deprivations.
The analysis reported in the Atlas also shows that there were elements of disparities and uniformities by different characteristics within diverse areas. The Noakhali district, for example, was home to both the best and the worst performing upazillas, showing great sign of disparity. In the same district of Noakhali,
Chatkhil was featured as one of the best performing upazillas, and Hatiya was among the worst. In respect of uniformity, seven upazillas in Dinajpur district had the same value for the deprivation index, an expression of homogeneity within a district.
Viewed from the east to the west of the country (that is from right to the left on the Map), the intensity of deprivation generally changes from highest deprivation to lowest deprivation. The high deprivation areas are mainly in the divisions of Chittagong and Sylhet, particularly in the hilly areas of Chittagong. The high deprivation areas are mostly associated with geographic remoteness.
The location of the 100 most deprived upazillas is presented in Map 3 in the Annex. The Map shows that the 100 most deprived upazillas are located near the borders of the country which are less assessable as well. This indicates how physical accessibility is related with deprivation of Basic social services.
The Atlas also pointed out that the progress has been least in the most deprived areas. In order to arrive at that conclusion, among others, the generational progress of literacy was examined by comparing the youth literacy rate with that of the adult literacy rates in Bangladesh. The average difference between the two rates was 23.9 per cent. It indicates that Bangladesh made a good progress within a generation in increasing the overall literacy rate. This remarkable national progress has, however, not been across the sub-national areas of Bangladesh, as the least progress has been recorded in the most deprived upazillas where more advancement is most needed to narrow the equity gap.
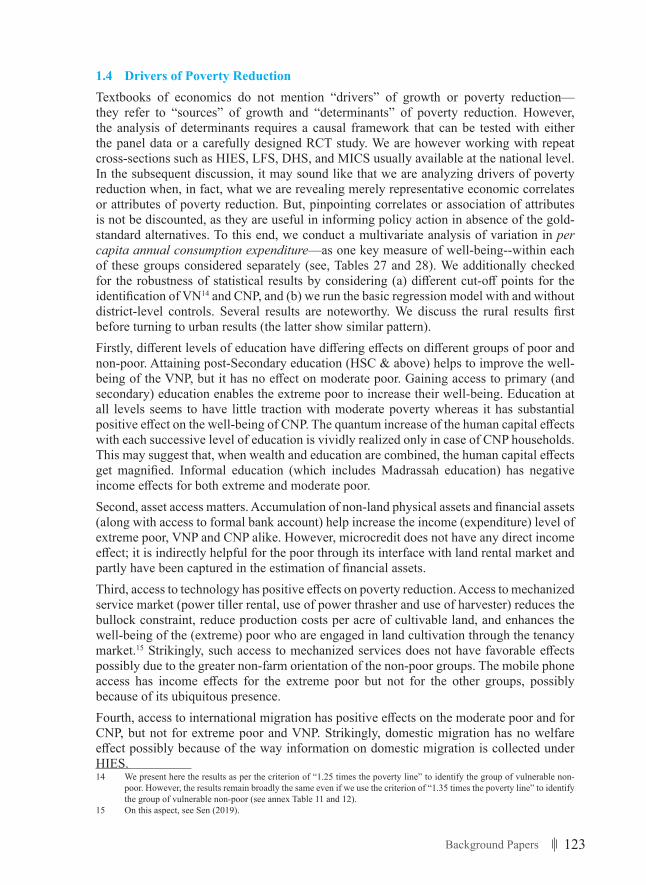
123Background Papers
1.4 Drivers of Poverty ReductionTextbooks of economics do not mention “drivers” of growth or poverty reduction—they refer to “sources” of growth and “determinants” of poverty reduction. However, the analysis of determinants requires a causal framework that can be tested with either the panel data or a carefully designed RCT study. We are however working with repeat cross-sections such as HIES, LFS, DHS, and MICS usually available at the national level. In the subsequent discussion, it may sound like that we are analyzing drivers of poverty reduction when, in fact, what we are revealing merely representative economic correlates or attributes of poverty reduction. But, pinpointing correlates or association of attributes is not be discounted, as they are useful in informing policy action in absence of the gold-standard alternatives. To this end, we conduct a multivariate analysis of variation in per capita annual consumption expenditure—as one key measure of well-being--within each of these groups considered separately (see, Tables 27 and 28). We additionally checked for the robustness of statistical results by considering (a) different cut-off points for the identification of VN14 and CNP, and (b) we run the basic regression model with and without district-level controls. Several results are noteworthy. We discuss the rural results first before turning to urban results (the latter show similar pattern).Firstly, different levels of education have differing effects on different groups of poor and non-poor. Attaining post-Secondary education (HSC & above) helps to improve the well-being of the VNP, but it has no effect on moderate poor. Gaining access to primary (and secondary) education enables the extreme poor to increase their well-being. Education at all levels seems to have little traction with moderate poverty whereas it has substantial positive effect on the well-being of CNP. The quantum increase of the human capital effects with each successive level of education is vividly realized only in case of CNP households. This may suggest that, when wealth and education are combined, the human capital effects get magnified. Informal education (which includes Madrassah education) has negative income effects for both extreme and moderate poor.Second, asset access matters. Accumulation of non-land physical assets and financial assets (along with access to formal bank account) help increase the income (expenditure) level of extreme poor, VNP and CNP alike. However, microcredit does not have any direct income effect; it is indirectly helpful for the poor through its interface with land rental market and partly have been captured in the estimation of financial assets.Third, access to technology has positive effects on poverty reduction. Access to mechanized service market (power tiller rental, use of power thrasher and use of harvester) reduces the bullock constraint, reduce production costs per acre of cultivable land, and enhances the well-being of the (extreme) poor who are engaged in land cultivation through the tenancy market.15 Strikingly, such access to mechanized services does not have favorable effects possibly due to the greater non-farm orientation of the non-poor groups. The mobile phone access has income effects for the extreme poor but not for the other groups, possibly because of its ubiquitous presence.Fourth, access to international migration has positive effects on the moderate poor and for CNP, but not for extreme poor and VNP. Strikingly, domestic migration has no welfare effect possibly because of the way information on domestic migration is collected under HIES.14 We present here the results as per the criterion of “1.25 times the poverty line” to identify the group of vulnerable non-
poor. However, the results remain broadly the same even if we use the criterion of “1.35 times the poverty line” to identify the group of vulnerable non-poor (see annex Table 11 and 12).
15 On this aspect, see Sen (2019).
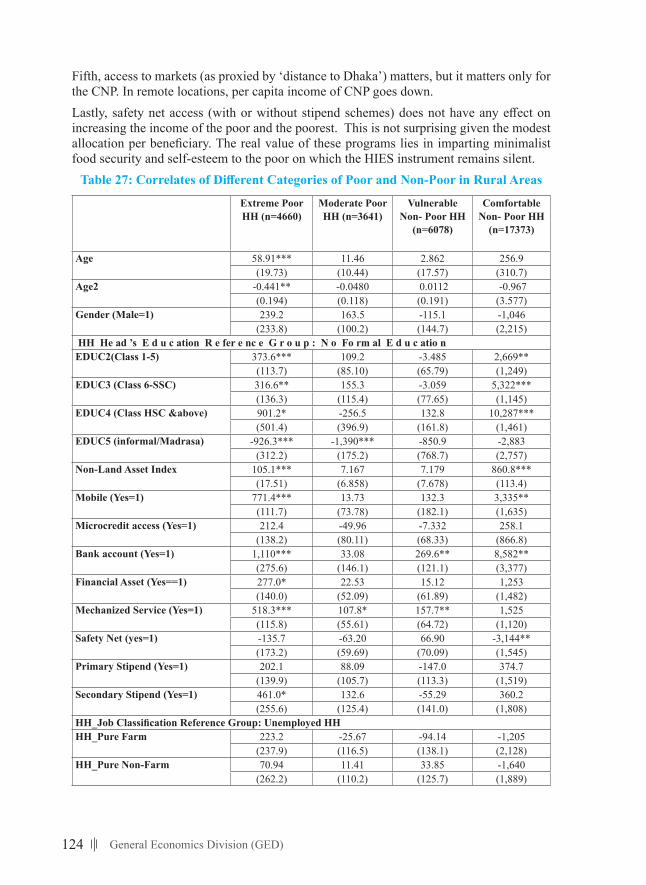
124 General Economics Division (GED)
Fifth, access to markets (as proxied by ‘distance to Dhaka’) matters, but it matters only for the CNP. In remote locations, per capita income of CNP goes down.Lastly, safety net access (with or without stipend schemes) does not have any effect on increasing the income of the poor and the poorest. This is not surprising given the modest allocation per beneficiary. The real value of these programs lies in imparting minimalist food security and self-esteem to the poor on which the HIES instrument remains silent.Table27:CorrelatesofDifferentCategoriesofPoorandNon-PoorinRuralAreas
Extreme Poor HH (n=4660)
Moderate Poor HH (n=3641)
Vulnerable Non- Poor HH
(n=6078)
Comfortable Non- Poor HH
(n=17373)
Age 58.91*** 11.46 2.862 256.9(19.73) (10.44) (17.57) (310.7)
Age2 -0.441** -0.0480 0.0112 -0.967(0.194) (0.118) (0.191) (3.577)
Gender (Male=1) 239.2 163.5 -115.1 -1,046(233.8) (100.2) (144.7) (2,215)
HH He ad ’s E d u c ation R e fer e nc e G r o u p : N o Fo rm al E d u c atio nEDUC2(Class 1-5) 373.6*** 109.2 -3.485 2,669**
(113.7) (85.10) (65.79) (1,249)EDUC3 (Class 6-SSC) 316.6** 155.3 -3.059 5,322***
(136.3) (115.4) (77.65) (1,145)EDUC4(ClassHSC&above) 901.2* -256.5 132.8 10,287***
(501.4) (396.9) (161.8) (1,461)EDUC5 (informal/Madrasa) -926.3*** -1,390*** -850.9 -2,883
(312.2) (175.2) (768.7) (2,757)Non-Land Asset Index 105.1*** 7.167 7.179 860.8***
(17.51) (6.858) (7.678) (113.4)Mobile (Yes=1) 771.4*** 13.73 132.3 3,335**
(111.7) (73.78) (182.1) (1,635)Microcredit access (Yes=1) 212.4 -49.96 -7.332 258.1
(138.2) (80.11) (68.33) (866.8)Bank account (Yes=1) 1,110*** 33.08 269.6** 8,582**
(275.6) (146.1) (121.1) (3,377)Financial Asset (Yes==1) 277.0* 22.53 15.12 1,253
(140.0) (52.09) (61.89) (1,482)Mechanized Service (Yes=1) 518.3*** 107.8* 157.7** 1,525
(115.8) (55.61) (64.72) (1,120)Safety Net (yes=1) -135.7 -63.20 66.90 -3,144**
(173.2) (59.69) (70.09) (1,545)Primary Stipend (Yes=1) 202.1 88.09 -147.0 374.7
(139.9) (105.7) (113.3) (1,519)Secondary Stipend (Yes=1) 461.0* 132.6 -55.29 360.2
(255.6) (125.4) (141.0) (1,808)HH_JobClassificationReferenceGroup:UnemployedHHHH_Pure Farm 223.2 -25.67 -94.14 -1,205
(237.9) (116.5) (138.1) (2,128)HH_Pure Non-Farm 70.94 11.41 33.85 -1,640
(262.2) (110.2) (125.7) (1,889)
125Background Papers
Extreme Poor HH (n=4660)
Moderate Poor HH (n=3641)
Vulnerable Non- Poor HH
(n=6078)
Comfortable Non- Poor HH
(n=17373)
HH_Mixed 201.6 29.99 -15.25 -1,165(268.8) (148.0) (151.4) (2,612)
Distance to Dhaka -0.0441 0.0160 0.0470 -27.81**(1.393) (0.568) (0.668) (13.84)
Household size -455.5*** -24.64 -70.85*** -4,822***(42.19) (18.83) (21.62) (495.9)
Female Earners -260.8 -8.463 107.8 1,156(194.0) (80.80) (174.2) (1,467)
Male Earners 98.72 -50.07 61.83 1,615(107.0) (56.41) (70.10) (1,009)
Migrating HH Reference: Non-Migrating HHForeign Migrating HH 257.5 356.0*** 36.79 7,694***
(315.5) (121.3) (117.6) (2,541)Domestic Migrating HH 200.6 -87.22 139.6 3,907
(419.5) (210.8) (162.6) (3,010)Natural Disaster Shock 301.0* 104.7 -12.86 4,227*
(155.9) (75.51) (118.8) (2,372)Division reference: BarisalChittagong 2,965*** 3,840*** 5,123*** 3,977
(388.4) (89.06) (177.8) (3,089)Dhaka 814.3* 864.6*** 1,230*** -573.3
(482.2) (111.9) (196.7) (3,270)Khulna -643.6* -798.3*** -584.9*** -4,794
(365.3) (80.54) (157.2) (3,248)Mymensingh 1,149*** 909.8*** 1,418*** -9,316***
(372.4) (109.5) (199.1) (2,691)Rajshahi -489.3 -292.8*** 2.554 -4,325**
(347.7) (79.26) (154.9) (2,126)Rangpur -985.4** -416.7*** -256.6 964.5
(373.1) (73.05) (168.7) (2,225)Sylhet 1,411*** -1,232*** -2,504*** 1,274
(453.5) (54.95) (198.8) (2,272)Constant 15,075*** 22,463*** 27,665*** 44,803***
(817.9) (289.9) (395.6) (7,507)Observations 4,660 3,641 6,078 17,373R-squared 0.244 0.643 0.593 0.483
Notes: Robust standard errors are reported within the parentheses; *** p<0.01, ** p<0.05, * p<0.1; Extreme poor
HH is defined as HH whose annual per capita consumption expenditure is below the lower poverty line annual per capita con-sumption expenditure; Moderate poor HH is defined as the HH whose annual per capita consumption expenditure is above the lower poverty line but lower than the upper poverty line annual per capit a consumption expenditure; Vulnerable non-poor HH is defined as the HH whose annual per capita consumption expenditure is more than the upper poverty line and less than 1.25 times (25% more than) the upper poverty line annual per capita consumption expenditure; Comfortable non-poor HH is defined as the HH whose annual per capita consumption expenditure is more than 1.25 times (25% more than) the upper poverty line annual per capita consumption expenditure. All regressions include district-level controls such as % of HH receiving foreign remittance, % of HH receiving domestic remittance, % of HH with credit access, % of HH with safety net access, and % of HH having access to secondary and post-secondary education.
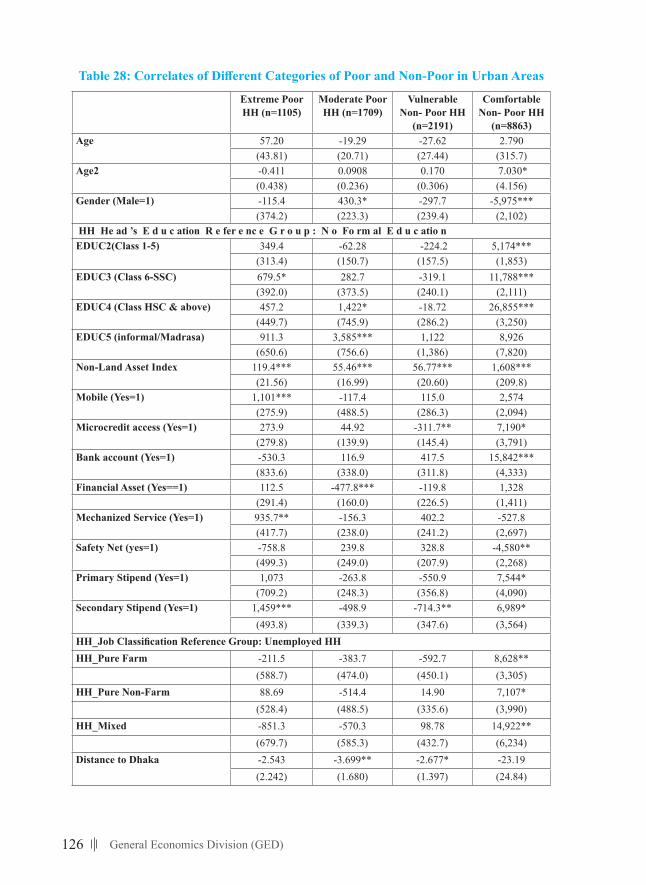
126 General Economics Division (GED)
Table28:CorrelatesofDifferentCategoriesofPoorandNon-PoorinUrbanAreas
Extreme Poor HH (n=1105)
Moderate Poor HH (n=1709)
Vulnerable Non- Poor HH
(n=2191)
Comfortable Non- Poor HH
(n=8863)Age 57.20 -19.29 -27.62 2.790
(43.81) (20.71) (27.44) (315.7)Age2 -0.411 0.0908 0.170 7.030*
(0.438) (0.236) (0.306) (4.156)Gender (Male=1) -115.4 430.3* -297.7 -5,975***
(374.2) (223.3) (239.4) (2,102) HH He ad ’s E d u c ation R e fer e nc e G r o u p : N o Fo rm al E d u c atio nEDUC2(Class 1-5) 349.4 -62.28 -224.2 5,174***
(313.4) (150.7) (157.5) (1,853)EDUC3 (Class 6-SSC) 679.5* 282.7 -319.1 11,788***
(392.0) (373.5) (240.1) (2,111)EDUC4(ClassHSC&above) 457.2 1,422* -18.72 26,855***
(449.7) (745.9) (286.2) (3,250)EDUC5 (informal/Madrasa) 911.3 3,585*** 1,122 8,926
(650.6) (756.6) (1,386) (7,820)Non-Land Asset Index 119.4*** 55.46*** 56.77*** 1,608***
(21.56) (16.99) (20.60) (209.8)Mobile (Yes=1) 1,101*** -117.4 115.0 2,574
(275.9) (488.5) (286.3) (2,094)Microcredit access (Yes=1) 273.9 44.92 -311.7** 7,190*
(279.8) (139.9) (145.4) (3,791)Bank account (Yes=1) -530.3 116.9 417.5 15,842***
(833.6) (338.0) (311.8) (4,333)Financial Asset (Yes==1) 112.5 -477.8*** -119.8 1,328
(291.4) (160.0) (226.5) (1,411)Mechanized Service (Yes=1) 935.7** -156.3 402.2 -527.8
(417.7) (238.0) (241.2) (2,697)Safety Net (yes=1) -758.8 239.8 328.8 -4,580**
(499.3) (249.0) (207.9) (2,268)Primary Stipend (Yes=1) 1,073 -263.8 -550.9 7,544*
(709.2) (248.3) (356.8) (4,090)Secondary Stipend (Yes=1) 1,459*** -498.9 -714.3** 6,989*
(493.8) (339.3) (347.6) (3,564)HH_JobClassificationReferenceGroup:UnemployedHHHH_Pure Farm -211.5 -383.7 -592.7 8,628**
(588.7) (474.0) (450.1) (3,305)HH_Pure Non-Farm 88.69 -514.4 14.90 7,107*
(528.4) (488.5) (335.6) (3,990)HH_Mixed -851.3 -570.3 98.78 14,922**
(679.7) (585.3) (432.7) (6,234)Distance to Dhaka -2.543 -3.699** -2.677* -23.19
(2.242) (1.680) (1.397) (24.84)
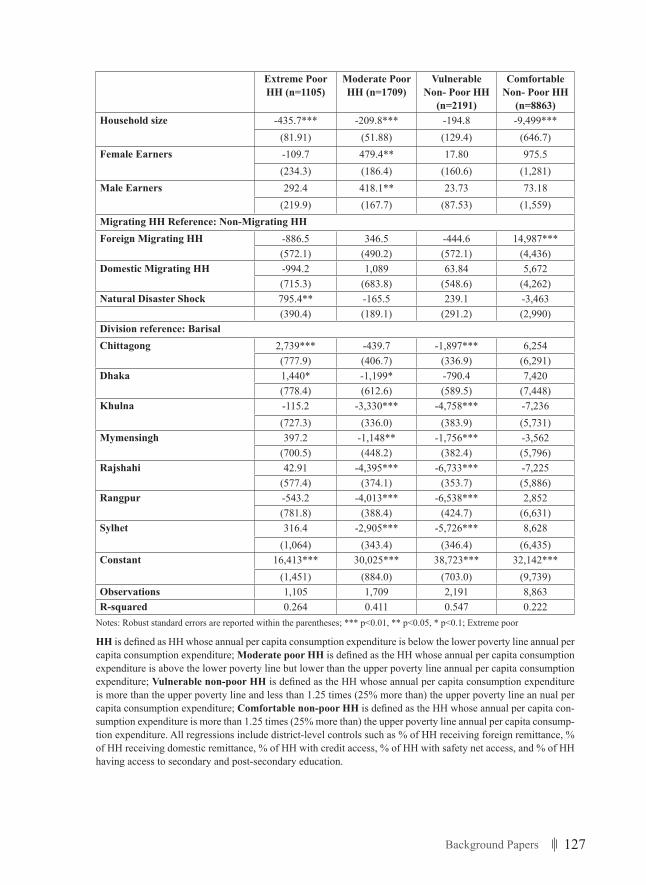
127Background Papers
Extreme Poor HH (n=1105)
Moderate Poor HH (n=1709)
Vulnerable Non- Poor HH
(n=2191)
Comfortable Non- Poor HH
(n=8863)Household size -435.7*** -209.8*** -194.8 -9,499***
(81.91) (51.88) (129.4) (646.7)Female Earners -109.7 479.4** 17.80 975.5
(234.3) (186.4) (160.6) (1,281)Male Earners 292.4 418.1** 23.73 73.18
(219.9) (167.7) (87.53) (1,559)Migrating HH Reference: Non-Migrating HHForeign Migrating HH -886.5 346.5 -444.6 14,987***
(572.1) (490.2) (572.1) (4,436)Domestic Migrating HH -994.2 1,089 63.84 5,672
(715.3) (683.8) (548.6) (4,262)Natural Disaster Shock 795.4** -165.5 239.1 -3,463
(390.4) (189.1) (291.2) (2,990)Division reference: BarisalChittagong 2,739*** -439.7 -1,897*** 6,254
(777.9) (406.7) (336.9) (6,291)Dhaka 1,440* -1,199* -790.4 7,420
(778.4) (612.6) (589.5) (7,448)Khulna -115.2 -3,330*** -4,758*** -7,236
(727.3) (336.0) (383.9) (5,731)Mymensingh 397.2 -1,148** -1,756*** -3,562
(700.5) (448.2) (382.4) (5,796)Rajshahi 42.91 -4,395*** -6,733*** -7,225
(577.4) (374.1) (353.7) (5,886)Rangpur -543.2 -4,013*** -6,538*** 2,852
(781.8) (388.4) (424.7) (6,631)Sylhet 316.4 -2,905*** -5,726*** 8,628
(1,064) (343.4) (346.4) (6,435)Constant 16,413*** 30,025*** 38,723*** 32,142***
(1,451) (884.0) (703.0) (9,739)Observations 1,105 1,709 2,191 8,863R-squared 0.264 0.411 0.547 0.222
Notes: Robust standard errors are reported within the parentheses; *** p<0.01, ** p<0.05, * p<0.1; Extreme poor
HH is defined as HH whose annual per capita consumption expenditure is below the lower poverty line annual per capita consumption expenditure; Moderate poor HH is defined as the HH whose annual per capita consumption expenditure is above the lower poverty line but lower than the upper poverty line annual per capita consumption expenditure; Vulnerable non-poor HH is defined as the HH whose annual per capita consumption expenditure is more than the upper poverty line and less than 1.25 times (25% more than) the upper poverty line an nual per capita consumption expenditure; Comfortable non-poor HH is defined as the HH whose annual per capita con-sumption expenditure is more than 1.25 times (25% more than) the upper poverty line annual per capita consump-tion expenditure. All regressions include district-level controls such as % of HH receiving foreign remittance, % of HH receiving domestic remittance, % of HH with credit access, % of HH with safety net access, and % of HH having access to secondary and post-secondary education.
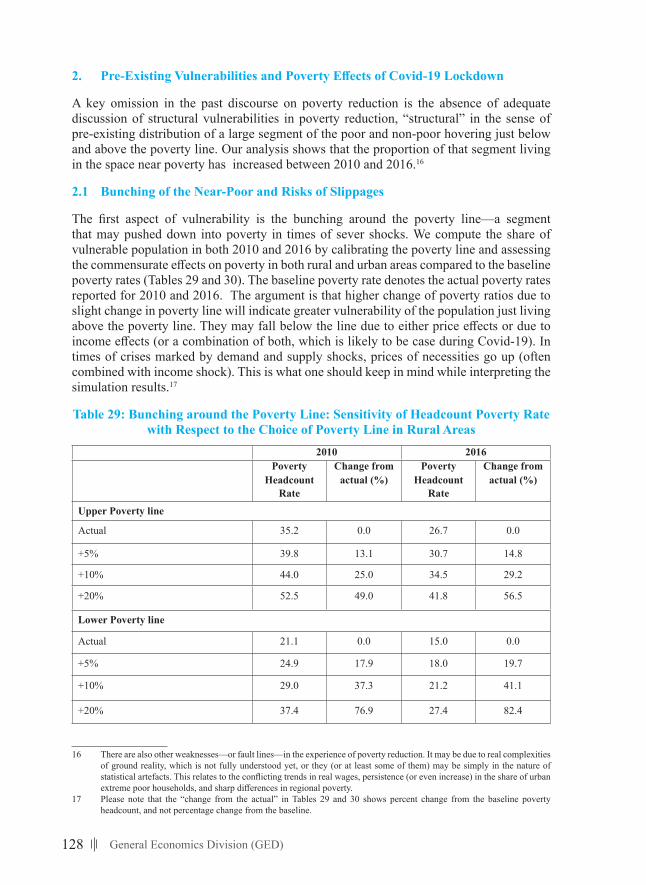
128 General Economics Division (GED)
2. Pre-ExistingVulnerabilitiesandPovertyEffectsofCovid-19Lockdown
A key omission in the past discourse on poverty reduction is the absence of adequate discussion of structural vulnerabilities in poverty reduction, “structural” in the sense of pre-existing distribution of a large segment of the poor and non-poor hovering just below and above the poverty line. Our analysis shows that the proportion of that segment living in the space near poverty has increased between 2010 and 2016.16
2.1 Bunching of the Near-Poor and Risks of Slippages
The first aspect of vulnerability is the bunching around the poverty line—a segment that may pushed down into poverty in times of sever shocks. We compute the share of vulnerable population in both 2010 and 2016 by calibrating the poverty line and assessing the commensurate effects on poverty in both rural and urban areas compared to the baseline poverty rates (Tables 29 and 30). The baseline poverty rate denotes the actual poverty rates reported for 2010 and 2016. The argument is that higher change of poverty ratios due to slight change in poverty line will indicate greater vulnerability of the population just living above the poverty line. They may fall below the line due to either price effects or due to income effects (or a combination of both, which is likely to be case during Covid-19). In times of crises marked by demand and supply shocks, prices of necessities go up (often combined with income shock). This is what one should keep in mind while interpreting the simulation results.17
Table 29: Bunching around the Poverty Line: Sensitivity of Headcount Poverty Rate with Respect to the Choice of Poverty Line in Rural Areas
2010 2016Poverty
Headcount Rate
Change fromactual (%)
Poverty Headcount
Rate
Change from actual (%)
Upper Poverty line
Actual 35.2 0.0 26.7 0.0
+5% 39.8 13.1 30.7 14.8
+10% 44.0 25.0 34.5 29.2
+20% 52.5 49.0 41.8 56.5
Lower Poverty line
Actual 21.1 0.0 15.0 0.0
+5% 24.9 17.9 18.0 19.7
+10% 29.0 37.3 21.2 41.1
+20% 37.4 76.9 27.4 82.4
16 There are also other weaknesses—or fault lines—in the experience of poverty reduction. It may be due to real complexities of ground reality, which is not fully understood yet, or they (or at least some of them) may be simply in the nature of statistical artefacts. This relates to the conflicting trends in real wages, persistence (or even increase) in the share of urban extreme poor households, and sharp differences in regional poverty.
17 Please note that the “change from the actual” in Tables 29 and 30 shows percent change from the baseline poverty headcount, and not percentage change from the baseline.
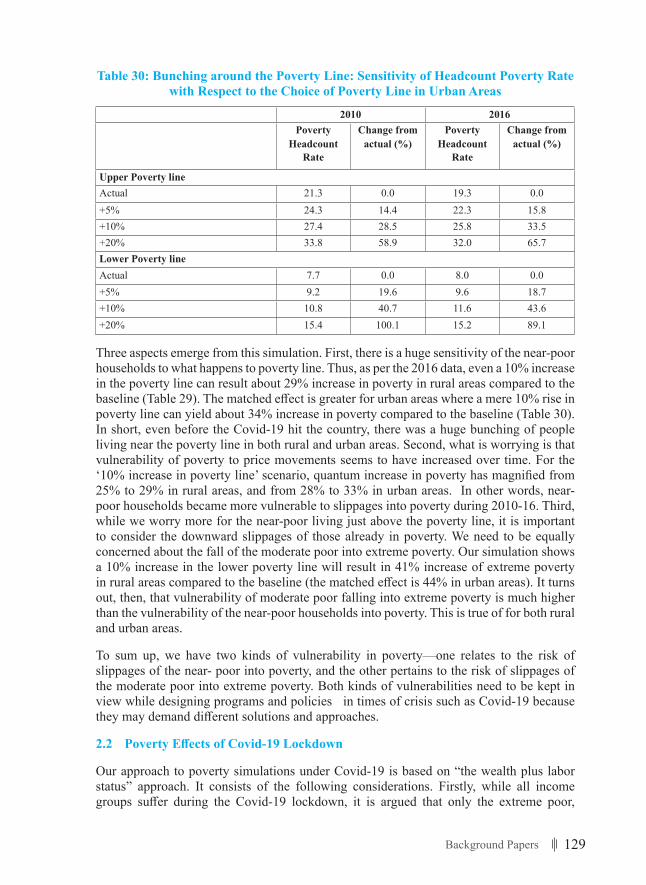
129Background Papers
Table 30: Bunching around the Poverty Line: Sensitivity of Headcount Poverty Rate with Respect to the Choice of Poverty Line in Urban Areas
2010 2016Poverty
Headcount Rate
Change from actual (%)
Poverty Headcount
Rate
Change from actual (%)
Upper Poverty lineActual 21.3 0.0 19.3 0.0+5% 24.3 14.4 22.3 15.8+10% 27.4 28.5 25.8 33.5+20% 33.8 58.9 32.0 65.7Lower Poverty lineActual 7.7 0.0 8.0 0.0+5% 9.2 19.6 9.6 18.7+10% 10.8 40.7 11.6 43.6+20% 15.4 100.1 15.2 89.1
Three aspects emerge from this simulation. First, there is a huge sensitivity of the near-poor households to what happens to poverty line. Thus, as per the 2016 data, even a 10% increase in the poverty line can result about 29% increase in poverty in rural areas compared to the baseline (Table 29). The matched effect is greater for urban areas where a mere 10% rise in poverty line can yield about 34% increase in poverty compared to the baseline (Table 30). In short, even before the Covid-19 hit the country, there was a huge bunching of people living near the poverty line in both rural and urban areas. Second, what is worrying is that vulnerability of poverty to price movements seems to have increased over time. For the ‘10% increase in poverty line’ scenario, quantum increase in poverty has magnified from 25% to 29% in rural areas, and from 28% to 33% in urban areas. In other words, near-poor households became more vulnerable to slippages into poverty during 2010-16. Third, while we worry more for the near-poor living just above the poverty line, it is important to consider the downward slippages of those already in poverty. We need to be equally concerned about the fall of the moderate poor into extreme poverty. Our simulation shows a 10% increase in the lower poverty line will result in 41% increase of extreme poverty in rural areas compared to the baseline (the matched effect is 44% in urban areas). It turns out, then, that vulnerability of moderate poor falling into extreme poverty is much higher than the vulnerability of the near-poor households into poverty. This is true of for both rural and urban areas.
To sum up, we have two kinds of vulnerability in poverty—one relates to the risk of slippages of the near- poor into poverty, and the other pertains to the risk of slippages of the moderate poor into extreme poverty. Both kinds of vulnerabilities need to be kept in view while designing programs and policies in times of crisis such as Covid-19 because they may demand different solutions and approaches.
2.2 PovertyEffectsofCovid-19Lockdown
Our approach to poverty simulations under Covid-19 is based on “the wealth plus labor status” approach. It consists of the following considerations. Firstly, while all income groups suffer during the Covid-19 lockdown, it is argued that only the extreme poor,
130 General Economics Division (GED)
moderate poor and the VNP run the immediate risks of going down the spiral of poverty. The CNP category is wealthy enough to prevent fall into poverty or extreme poverty in the short run. This is not an unreasonable assumption if we recall the CNP category has much higher amount of land and nonland assets as well as financial assets with stronger links to the formal banking system and greater access to foreign remittance. This is true for CNP residing in both rural and urban areas (see, Annex 1 and Annex 2). In urban areas, the CNP category is more involved in salaried work comparted to other poverty categories as they are also better endowed with human capital. In other words, the assumption is that the less wealthy sections are more vulnerable to slippages into poverty under Covid-19.
Second, we also make a distinction between types of labor that are likely to be more vulnerable during the lockdown. Specifically, we argue that those who are involved in casual work of all kinds, salaried work in non-public sectors, and those involved in non-agricultural self-employment (manufacturing, transport, trade, and services) run the greater risks of slippages into poverty. Henceforth, we denote them as income of the laboring classes. If they were already in poverty prior to Covid-19, then they are likely to be more prone to slip into even greater depth of poverty.
Third, we not only assess the adverse poverty effects due to the descending vulnerable non-poor households, but also quantify the swelling of the ranks of the extreme poor triggered, in part, by the descent of the moderate poor into extreme poverty. Fourth, we present the results not only in relation to what happens to poverty headcounts (the usual headline-catching number) but also trace the Covid-19 effects on poverty gap and squared poverty gap ratios. This enables us to judge the effects on the poorest of the poor as well.
We run several scenarios under the above “wealth plus labor status” approach. They are: (1) “zero income” for laboring classes in urban areas, but rural income is assumed to be unaffected; (2) 80% drop in income for laboring class in urban areas and 5% drop in income for laboring class in rural areas; (3) 80% drop in income for laboring class in urban areas and 10% drop in income for laboring class in rural areas; (4) 80% drop in income for laboring class in urban areas and 20% drop in income for laboring class in rural areas; and (5) 70% drop in income for laboring class in urban areas and 30% drop in income for laboring class in rural areas. Please note that these simulations are based on “hard” i.e. prolonged and draconian lockdown having very adverse effects on the income of the poor. We shall also consider later the poverty effects of the possible “soft” i.e. short-lived and humane lockdown—currently underway--with a 50% income recovery in the 3rd quarter of 2020 and 80% income recovery in the 4th quarter of 2020 from the level of losses envisaged in the 2nd quarter of 2020.
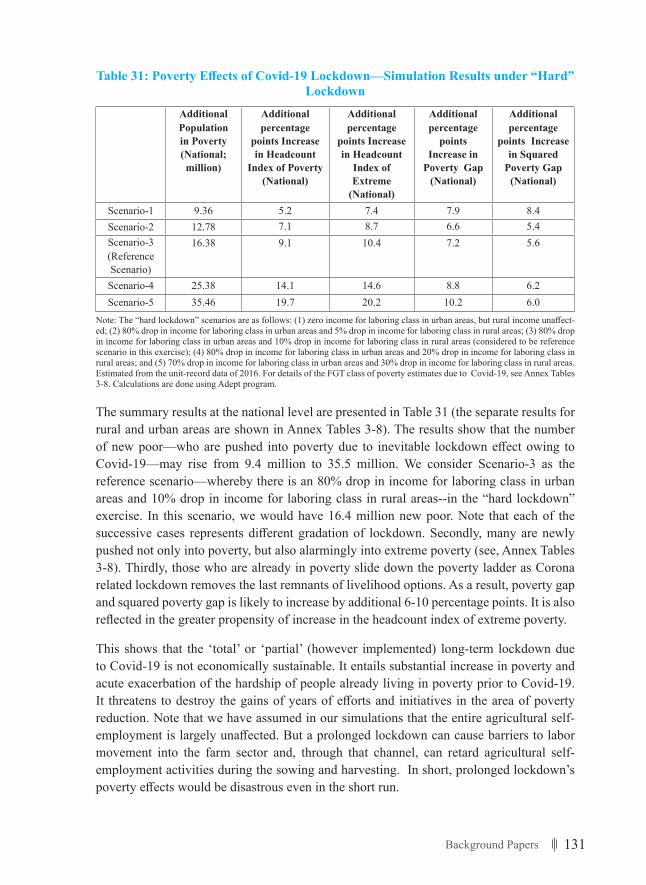
131Background Papers
Table31:PovertyEffectsofCovid-19Lockdown—SimulationResultsunder“Hard”Lockdown
Additional Population in Poverty (National; million)
Additional percentage
points Increase in Headcount
Index of Poverty (National)
Additional percentage
points Increase in Headcount
Index of Extreme
(National)
Additional percentage
points Increase in
Poverty Gap (National)
Additional percentage
points Increase in Squared
Poverty Gap (National)
Scenario-1 9.36 5.2 7.4 7.9 8.4Scenario-2 12.78 7.1 8.7 6.6 5.4Scenario-3 (Reference Scenario)
16.38 9.1 10.4 7.2 5.6
Scenario-4 25.38 14.1 14.6 8.8 6.2Scenario-5 35.46 19.7 20.2 10.2 6.0
Note: The “hard lockdown” scenarios are as follows: (1) zero income for laboring class in urban areas, but rural income unaffect-ed; (2) 80% drop in income for laboring class in urban areas and 5% drop in income for laboring class in rural areas; (3) 80% drop in income for laboring class in urban areas and 10% drop in income for laboring class in rural areas (considered to be reference scenario in this exercise); (4) 80% drop in income for laboring class in urban areas and 20% drop in income for laboring class in rural areas; and (5) 70% drop in income for laboring class in urban areas and 30% drop in income for laboring class in rural areas. Estimated from the unit-record data of 2016. For details of the FGT class of poverty estimates due to Covid-19, see Annex Tables 3-8. Calculations are done using Adept program.
The summary results at the national level are presented in Table 31 (the separate results for rural and urban areas are shown in Annex Tables 3-8). The results show that the number of new poor—who are pushed into poverty due to inevitable lockdown effect owing to Covid-19—may rise from 9.4 million to 35.5 million. We consider Scenario-3 as the reference scenario—whereby there is an 80% drop in income for laboring class in urban areas and 10% drop in income for laboring class in rural areas--in the “hard lockdown” exercise. In this scenario, we would have 16.4 million new poor. Note that each of the successive cases represents different gradation of lockdown. Secondly, many are newly pushed not only into poverty, but also alarmingly into extreme poverty (see, Annex Tables 3-8). Thirdly, those who are already in poverty slide down the poverty ladder as Corona related lockdown removes the last remnants of livelihood options. As a result, poverty gap and squared poverty gap is likely to increase by additional 6-10 percentage points. It is also reflected in the greater propensity of increase in the headcount index of extreme poverty.
This shows that the ‘total’ or ‘partial’ (however implemented) long-term lockdown due to Covid-19 is not economically sustainable. It entails substantial increase in poverty and acute exacerbation of the hardship of people already living in poverty prior to Covid-19. It threatens to destroy the gains of years of efforts and initiatives in the area of poverty reduction. Note that we have assumed in our simulations that the entire agricultural self-employment is largely unaffected. But a prolonged lockdown can cause barriers to labor movement into the farm sector and, through that channel, can retard agricultural self-employment activities during the sowing and harvesting. In short, prolonged lockdown’s poverty effects would be disastrous even in the short run.
132 General Economics Division (GED)
2.3 Reach of Social Protection
Social transfers or social protection cannot compensate for the enormous welfare loss entailed by lockdown enforced by Covid-19. This is not just because of the paucity of safety net transfers. It is also because of the enormous non-targeting that seems to characterize social protection across the transfer modalities. We use both HIES 2016 and MICS 2018 data to conduct this analysis.18Here we present the MICS results. Arguably, the MICS 2018 data is better than the HIES 2016 data as it allows us to investigate the incidence of social protection programs by analytically more meaningful categories: (a) educational stipend schemes (primary and secondary); (b) allowance programs (old-age informal pension, widow allowance, etc.); (c) food-assisted programs (VGD, VGF, EGPP, TR, GR, etc.); (d) maternity allowance; (e) formal pension schemes; and (f) all ‘other’ social protection programs. However, we could not conduct disaggregated analysis by individual programs as the MICS 2018 data lack further disaggregation.
As may be seen from Table 32, notwithstanding the overall progressivity in the incidence of safety net benefits, a bulk of the transfers end up in ‘non-deserving’ non-poor groups. The share of Comfortable Non-Poor (CNP) is about 30% in case of allowance programs, 32% in case of food-supported programs, 44% in case of maternity allowance, 51% in vase of stipend schemes, and 33% in case of ‘other’ social protection programs in rural areas. In case of formal pension schemes, the matched share increases to 89%, which is expected. But formal pension schemes should not have been included in the category of routine social protection programs in the first place.
Secondly, one may also consider how the core extreme poor group fares in getting access to social protection programs in competition with other asset groups. After all, these programs have been initially conceived as safety net programs and largely designed for the poorest having in mind both in theory and in practice.19 Our incidence analysis shows that, even when it comes to social protection, the extreme poor group constitutes a minority. For rural areas, their share in total beneficiaries of stipend schemes is only 9%; it is only 26% in allowance programs, 24% in food-assisted programs, 25% in maternity allowance and 24% in ‘other programs’.
Third, what we observe from the rural MICS data that roughly a quarter of social protection beneficiaries are from Vulnerable Non-Poor (VNP) households. This is, of course, leakage in the narrow sense of the term but may be viewed as “permissive leakage” in times of in times of severe shocks (pandemic). This is an important attribute of Bangladesh’s social protection programs that needs to be considered while designing transfers for mitigating distress from Covid-19. After all, in times of pandemic shocks, they too are in high risks of slippages into poverty and hence merit SP support. The moot policy point is whether the
18 For the incidence results based on HIES and MICS by expenditure/ asset deciles, see World Bank (2020). It is true that HIES allows us to conduct consumption expenditure-based ranking while MICS data permits only asset-based ranking. However, in terms of capturing the incidence of the social protection programs, MICS seems to be better than HIES in terms of providing broad snapshots, while the HIES is marked by low individual program-specific responses. In future, the HIES should use the MICS survey instrument for its social protection module.
19 In practice, because it is the extreme poor who are more disadvantaged than others in getting market access or have less powerful voices to extract fiscal benefits to their benefits. In theory, because they constitute the ethically most deserving category in the overall distribution matrix of a society. It is for them a Rawlsian ‘Maximin” principle has been devised as a way of progressing towards more equitable distributional outcomes.
133Background Papers
existing social protection programs can be rolled out with greater injection of resources to reach not just the poor but also the VNP (or the New poor) who are also in need of support in a post-lockdown scenario.
Fourth, what we observed for rural areas is a valid description of distribution of benefits in urban areas as well. The non-deserving CNP category prevails in urban SP schemes; VNP seek SP assistance; and the urban extreme poor are a minority voice as in rural areas. Two additional moments relate to overall low quantum of resources earmarked for urban areas and the pronounced presence of the moderate poor group in the urban setting. The low overall allocation of social protection benefits for urban areas—lower not only compared to the proportionate share of the urban population but also compared to relative incidence of urban vs. rural poverty--further reduces the compensatory access of the urban extreme poor to such transfers. It may have been one of the reasons for slow progress in urban extreme poverty reduction.
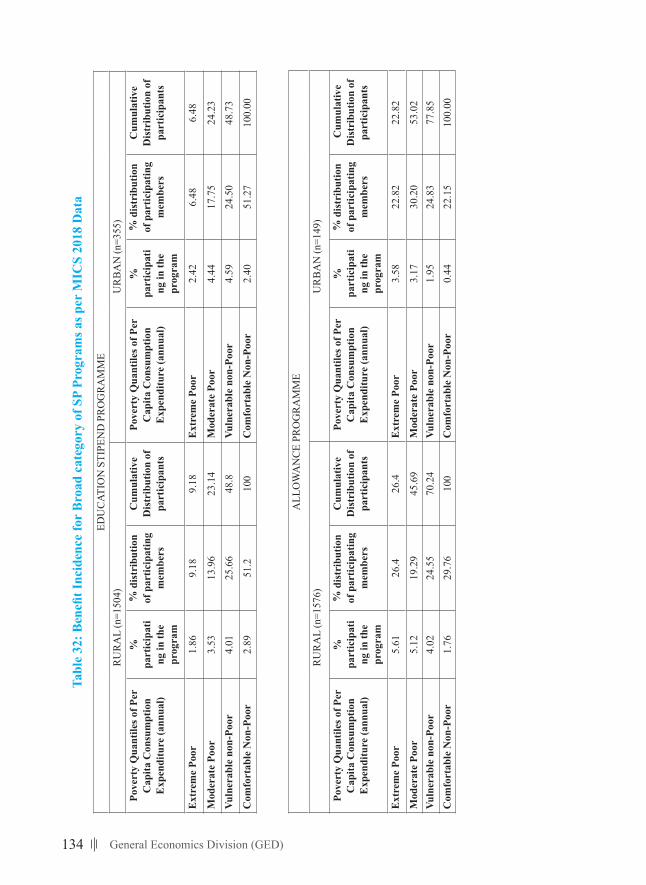
134 General Economics Division (GED)
Table32:B
enefitIncidenceforBroadcategoryofSPProgramsasp
erM
ICS2018Data
EDU
CATI
ON
STI
PEN
D P
ROG
RAM
ME
RU
RA
L (n
=150
4)U
RBA
N (n
=355
)Po
vert
y Q
uant
iles o
f Per
C
apita
Con
sum
ptio
n E
xpen
ditu
re (a
nnua
l)
%
part
icip
ati
ng in
the
prog
ram
% d
istr
ibut
ion
of p
artic
ipat
ing
mem
bers
Cum
ulat
ive
Dis
trib
utio
n of
pa
rtic
ipan
ts
Pove
rty
Qua
ntile
s of P
er
Cap
ita C
onsu
mpt
ion
Exp
endi
ture
(ann
ual)
%
part
icip
ati
ng in
the
prog
ram
% d
istr
ibut
ion
of p
artic
ipat
ing
mem
bers
Cum
ulat
ive
Dis
trib
utio
n of
pa
rtic
ipan
ts
Ext
rem
e Po
or1.
869.
189.
18E
xtre
me
Poor
2.42
6.48
6.48
Mod
erat
e Po
or3.
5313
.96
23.1
4M
oder
ate
Poor
4.44
17.7
524
.23
Vuln
erab
le n
on-P
oor
4.01
25.6
648
.8Vu
lner
able
non
-Poo
r4.
5924
.50
48.7
3
Com
fort
able
Non
-Poo
r2.
8951
.210
0C
omfo
rtab
le N
on-P
oor
2.40
51.2
710
0.00
ALL
OW
AN
CE
PRO
GR
AM
ME
RU
RA
L (n
=157
6)U
RBA
N (n
=149
)
Pove
rty
Qua
ntile
s of P
er
Cap
ita C
onsu
mpt
ion
Exp
endi
ture
(ann
ual)
%
part
icip
ati
ng in
the
prog
ram
% d
istr
ibut
ion
of p
artic
ipat
ing
mem
bers
Cum
ulat
ive
Dis
trib
utio
n of
pa
rtic
ipan
ts
Pove
rty
Qua
ntile
s of P
er
Cap
ita C
onsu
mpt
ion
Exp
endi
ture
(ann
ual)
%
part
icip
ati
ng in
the
prog
ram
% d
istr
ibut
ion
of p
artic
ipat
ing
mem
bers
Cum
ulat
ive
Dis
trib
utio
n of
pa
rtic
ipan
ts
Ext
rem
e Po
or5.
6126
.426
.4E
xtre
me
Poor
3.58
22.8
222
.82
Mod
erat
e Po
or5.
1219
.29
45.6
9M
oder
ate
Poor
3.17
30.2
053
.02
Vuln
erab
le n
on-P
oor
4.02
24.5
570
.24
Vuln
erab
le n
on-P
oor
1.95
24.8
377
.85
Com
fort
able
Non
-Poo
r1.
7629
.76
100
Com
fort
able
Non
-Poo
r0.
4422
.15
100.
00
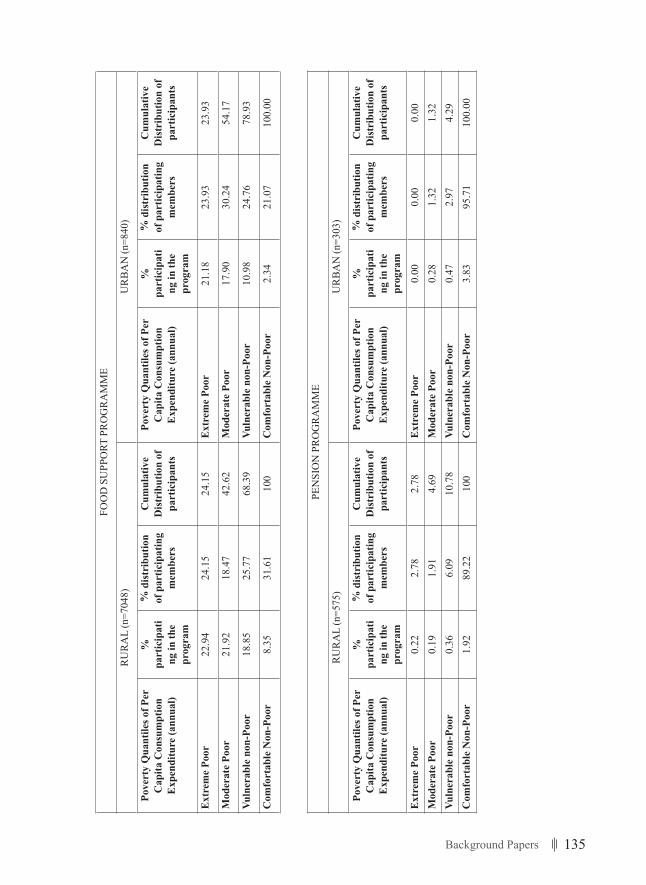
135Background Papers
FOO
D S
UPP
ORT
PR
OG
RAM
ME
RU
RA
L (n
=704
8)U
RBA
N (n
=840
)
Pove
rty
Qua
ntile
s of P
er
Cap
ita C
onsu
mpt
ion
Exp
endi
ture
(ann
ual)
%
part
icip
ati
ng in
the
prog
ram
% d
istr
ibut
ion
of p
artic
ipat
ing
mem
bers
Cum
ulat
ive
Dis
trib
utio
n of
pa
rtic
ipan
ts
Pove
rty
Qua
ntile
s of P
er
Cap
ita C
onsu
mpt
ion
Exp
endi
ture
(ann
ual)
%
part
icip
ati
ng in
the
prog
ram
% d
istr
ibut
ion
of p
artic
ipat
ing
mem
bers
Cum
ulat
ive
Dis
trib
utio
n of
pa
rtic
ipan
ts
Ext
rem
e Po
or22
.94
24.1
524
.15
Ext
rem
e Po
or21
.18
23.9
323
.93
Mod
erat
e Po
or21
.92
18.4
742
.62
Mod
erat
e Po
or17
.90
30.2
454
.17
Vuln
erab
le n
on-P
oor
18.8
525
.77
68.3
9Vu
lner
able
non
-Poo
r10
.98
24.7
678
.93
Com
fort
able
Non
-Poo
r8.
3531
.61
100
Com
fort
able
Non
-Poo
r2.
3421
.07
100.
00
PEN
SIO
N P
RO
GRA
MM
E
RU
RA
L (n
=575
)U
RBA
N (n
=303
)
Pove
rty
Qua
ntile
s of P
er
Cap
ita C
onsu
mpt
ion
Exp
endi
ture
(ann
ual)
%
part
icip
ati
ng in
the
prog
ram
% d
istr
ibut
ion
of p
artic
ipat
ing
mem
bers
Cum
ulat
ive
Dis
trib
utio
n of
pa
rtic
ipan
ts
Pove
rty
Qua
ntile
s of P
er
Cap
ita C
onsu
mpt
ion
Exp
endi
ture
(ann
ual)
%
part
icip
ati
ng in
the
prog
ram
% d
istr
ibut
ion
of p
artic
ipat
ing
mem
bers
Cum
ulat
ive
Dis
trib
utio
n of
pa
rtic
ipan
ts
Ext
rem
e Po
or0.
222.
782.
78E
xtre
me
Poor
0.00
0.00
0.00
Mod
erat
e Po
or0.
191.
914.
69M
oder
ate
Poor
0.28
1.32
1.32
Vuln
erab
le n
on-P
oor
0.36
6.09
10.7
8Vu
lner
able
non
-Poo
r0.
472.
974.
29C
omfo
rtab
le N
on-P
oor
1.92
89.2
210
0C
omfo
rtab
le N
on-P
oor
3.83
95.7
110
0.00
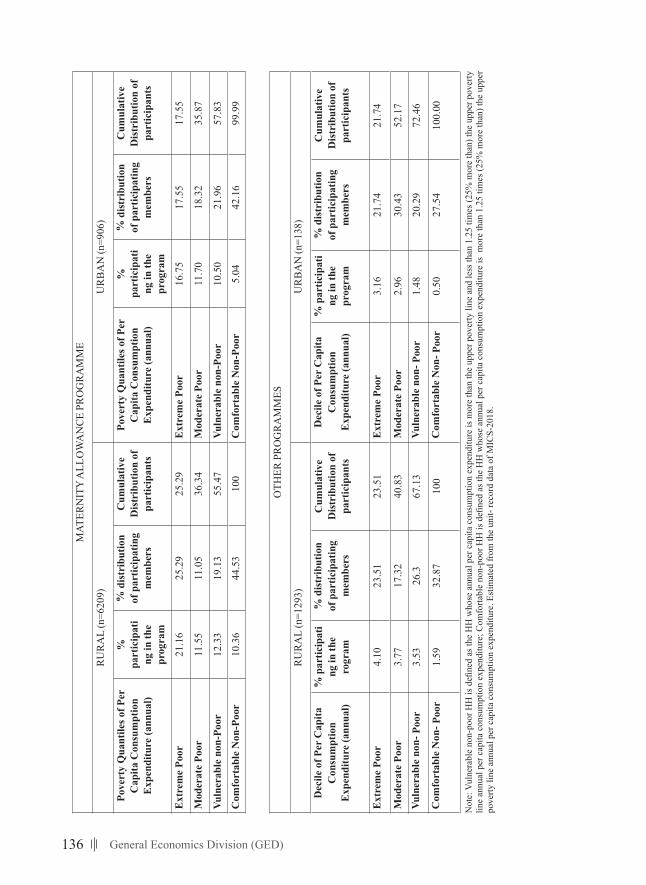
136 General Economics Division (GED)
MAT
ERN
ITY
ALL
OW
AN
CE P
RO
GRA
MM
E
RU
RA
L (n
=620
9)U
RBA
N (n
=906
)
Pove
rty
Qua
ntile
s of P
er
Cap
ita C
onsu
mpt
ion
Exp
endi
ture
(ann
ual)
%
part
icip
ati
ng in
the
prog
ram
% d
istr
ibut
ion
of p
artic
ipat
ing
mem
bers
Cum
ulat
ive
Dis
trib
utio
n of
pa
rtic
ipan
ts
Pove
rty
Qua
ntile
s of P
er
Cap
ita C
onsu
mpt
ion
Exp
endi
ture
(ann
ual)
%
part
icip
ati
ng in
the
prog
ram
% d
istr
ibut
ion
of p
artic
ipat
ing
mem
bers
Cum
ulat
ive
Dis
trib
utio
n of
pa
rtic
ipan
ts
Ext
rem
e Po
or21
.16
25.2
925
.29
Ext
rem
e Po
or16
.75
17.5
517
.55
Mod
erat
e Po
or11
.55
11.0
536
.34
Mod
erat
e Po
or11
.70
18.3
235
.87
Vuln
erab
le n
on-P
oor
12.3
319
.13
55.4
7Vu
lner
able
non
-Poo
r10
.50
21.9
657
.83
Com
fort
able
Non
-Poo
r10
.36
44.5
310
0C
omfo
rtab
le N
on-P
oor
5.04
42.1
699
.99
OTH
ER P
RO
GRA
MM
ES
RU
RA
L (n
=129
3)U
RBA
N (n
=138
)
Dec
ile o
f Per
Cap
ita
Con
sum
ptio
n E
xpen
ditu
re (a
nnua
l)
% p
artic
ipat
i ng
in th
e
rogr
am
% d
istr
ibut
ion
of p
artic
ipat
ing
mem
bers
Cum
ulat
ive
Dis
trib
utio
n of
pa
rtic
ipan
ts
Dec
ile o
f Per
Cap
ita
Con
sum
ptio
n E
xpen
ditu
re (a
nnua
l)
% p
artic
ipat
i ng
in th
e pr
ogra
m
% d
istr
ibut
ion
of p
artic
ipat
ing
mem
bers
Cum
ulat
ive
Dis
trib
utio
n of
pa
rtic
ipan
ts
Ext
rem
e Po
or4.
1023
.51
23.5
1E
xtre
me
Poor
3.16
21.7
421
.74
Mod
erat
e Po
or3.
7717
.32
40.8
3M
oder
ate
Poor
2.96
30.4
352
.17
Vuln
erab
le n
on- P
oor
3.53
26.3
67.1
3Vu
lner
able
non
- Poo
r1.
4820
.29
72.4
6
Com
fort
able
Non
- Poo
r1.
5932
.87
100
Com
fort
able
Non
- Poo
r0.
5027
.54
100.
00
Not
e: V
ulne
rabl
e no
n-po
or H
H is
defi
ned
as th
e H
H w
hose
ann
ual p
er c
apita
con
sum
ptio
n ex
pend
iture
is m
ore
than
the
uppe
r pov
erty
line
and
less
than
1.2
5 tim
es (2
5% m
ore
than
) the
upp
er p
over
ty
line
annu
al p
er c
apita
con
sum
ptio
n ex
pend
iture
; Com
forta
ble
non-
poor
HH
is d
efine
d as
the
HH
who
se a
nnua
l per
cap
ita c
onsu
mpt
ion
expe
nditu
re is
mor
e th
an 1
.25
times
(25%
mor
e th
an) t
he u
pper
po
verty
line
ann
ual p
er c
apita
con
sum
ptio
n ex
pend
iture
. Est
imat
ed fr
om th
e un
it- re
cord
dat
a of
MIC
S-20
18.
137Background Papers
2.4 Can Bangladesh Reach the Poverty SDG Target: Simulations with and withoutCovid-19Effects
Bangladesh was well poised for reaching the SDG poverty target until the Covid-19 hit the country in March 2020. As we discussed in Section 2.2, the immediate economic impact of lockdown induced by efforts to mitigate the health impacts was disastrous from poverty point of view. This was expected but the extent of vulnerability to poverty due to shocks was not anticipated earlier. The trade-offs between lives and livelihoods were acutely felt in the early days of lockdown. Subsequently, the GoB rightly in our view shifted to a path of balancing economic and health wellbeing objectives of development and opted for a model of “humane lockdown” i.e. focusing on economic recovery but with an eye on health concerns. In this section, we pose the question—can Bangladesh aspire to achieve the SDG target of zero poverty by 2031?
We closely follow the methodology adopted by Gimenez et al (2014) and Sen and Ali (2016) to conduct poverty simulations under two main scenarios: (a) without Covid-19 (the counterfactual); (b) with Covd- 19 (the reality today). The highlights of this method as applied to 2016 HIES data are discussed below.
2.4.1 Gross vs. Net Growth Elasticity of Poverty Reduction
We estimate the elasticity of poverty with respect to growth following the poverty decomposition approach explained in Datt and Ravallion (1992). The basic idea behind the decomposition is to separate the change in poverty headcount into its expenditure growth component and redistribution component. The overall change in poverty from period 0 to period 1 can be decomposed as follows:
45
2.4 Can Bangladesh Reach the Poverty SDG Target: Simulations with and without Covid-19 Effects
Bangladesh was well poised for reaching the SDG poverty target until the Covid-19 hit the country in March 2020. As we discussed in Section 2.2, the immediate economic impact of lockdown induced by efforts to mitigate the health impacts was disastrous from poverty point of view. This was expected but the extent of vulnerability to poverty due to shocks was not anticipated earlier. The trade-offs between lives and livelihoods were acutely felt in the early days of lockdown. Subsequently, the GoB rightly in our view shifted to a path of balancing economic and health wellbeing objectives of development and opted for a model of “humane lockdown” i.e. focusing on economic recovery but with an eye on health concerns. In this section, we pose the question—can Bangladesh aspire to achieve the SDG target of zero poverty by 2031?
We closely follow the methodology adopted by Gimenez et al (2014) and Sen and Ali (2016) to conduct poverty simulations under two main scenarios: (a) without Covid-19 (the counterfactual); (b) with Covd-19 (the reality today). The highlights of this method as applied to 2016 HIES data are discussed below.
2.4.1 Gross vs. Net Growth Elasticity of Poverty Reduction
We estimate the elasticity of poverty with respect to growth following the poverty decomposition approach explained in Datt and Ravallion (1992). The basic idea behind the decomposition is to separate the change in poverty headcount into its expenditure growth component and redistribution component. The overall change in poverty from period 0 to period 1 can be decomposed as follows:
∆𝑝𝑝= [𝑃𝑃(𝜇𝜇1, 𝐿𝐿0) − 𝑃𝑃(𝜇𝜇0, 𝐿𝐿0)] − [𝑃𝑃(𝜇𝜇0, 𝐿𝐿1) − 𝑃𝑃(𝜇𝜇0, 𝐿𝐿0)] + 𝜀𝜀
Where p stands for poverty measures, μ stands for average consumption, and L represent the relative inequality measure.
The first component represents the change in poverty due to growth in the per-capita consumption expenditure holding distribution of the per-capita consumption expenditure constant, while the second component represents the change in poverty due to a change of distribution in the per-capita consumption expenditure holding income constant. Following the decomposition of poverty reduction into the growth component and the redistribution component, we will estimate net elasticity of poverty with respect to growth in the per-capita consumption expenditure to project poverty rates till 2031 based on upper poverty lines because our focus is on the viability of reaching the SDG target of zero poverty.
The relationship between net elasticity of poverty with respect to growth (λ) and gross elasticity of poverty (γ) with respect to growth can be presented as follows:
λ=γ+β×δ
Here γ is the gross elasticity of poverty to growth implying the percentage change in poverty due to percentage change in consumption expenditure holding the level of distribution of per-capita real expenditure unchanged. The second component, β×δ (a product of “elasticity of poverty to inequality” and “elasticity of inequality to growth”), captures the percentage change in poverty rates due to percentage change in the inequality keeping the level of per-capita real expenditure constant. While the first component is expected to be negative, the second component could be either positive or negative
Where p stands for poverty measures, μ stands for average consumption, and L represent the relative inequality measure.
The first component represents the change in poverty due to growth in the per-capita consumption expenditure holding distribution of the per-capita consumption expenditure constant, while the second component represents the change in poverty due to a change of distribution in the per-capita consumption expenditure holding income constant. Following the decomposition of poverty reduction into the growth component and the redistribution component, we will estimate net elasticity of poverty with respect to growth in the per-capita consumption expenditure to project poverty rates till 2031 based on upper poverty lines because our focus is on the viability of reaching the SDG target of zero poverty.
The relationship between net elasticity of poverty with respect to growth (λ) and gross elasticity of poverty (γ) with respect to growth can be presented as follows:
λ=γ+β×δ
Here γ is the gross elasticity of poverty to growth implying the percentage change in poverty due to percentage change in consumption expenditure holding the level of distribution of per-capita real expenditure unchanged. The second component, β×δ (a product of
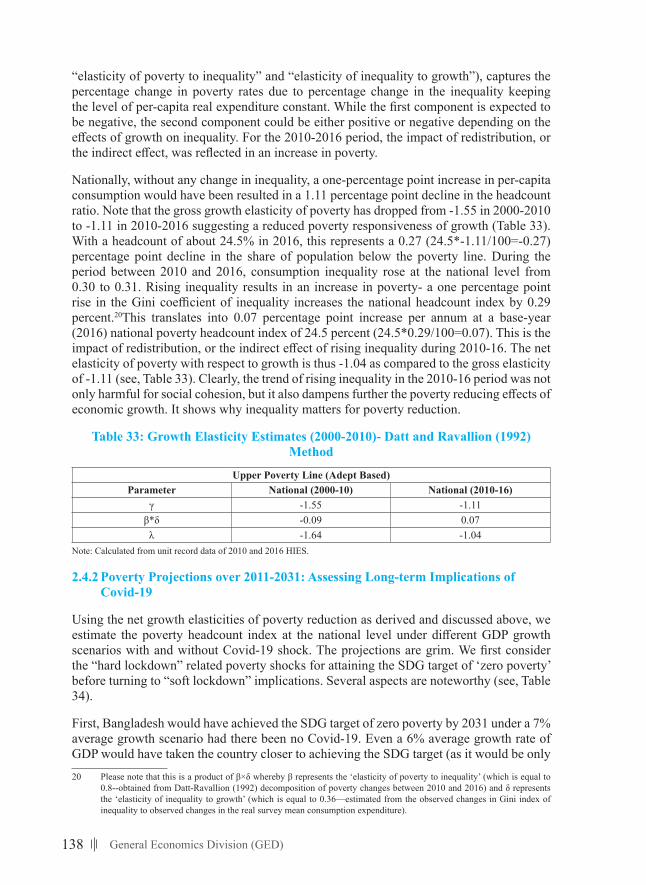
138 General Economics Division (GED)
“elasticity of poverty to inequality” and “elasticity of inequality to growth”), captures the percentage change in poverty rates due to percentage change in the inequality keeping the level of per-capita real expenditure constant. While the first component is expected to be negative, the second component could be either positive or negative depending on the effects of growth on inequality. For the 2010-2016 period, the impact of redistribution, or the indirect effect, was reflected in an increase in poverty.
Nationally, without any change in inequality, a one-percentage point increase in per-capita consumption would have been resulted in a 1.11 percentage point decline in the headcount ratio. Note that the gross growth elasticity of poverty has dropped from -1.55 in 2000-2010 to -1.11 in 2010-2016 suggesting a reduced poverty responsiveness of growth (Table 33). With a headcount of about 24.5% in 2016, this represents a 0.27 (24.5*-1.11/100=-0.27) percentage point decline in the share of population below the poverty line. During the period between 2010 and 2016, consumption inequality rose at the national level from 0.30 to 0.31. Rising inequality results in an increase in poverty- a one percentage point rise in the Gini coefficient of inequality increases the national headcount index by 0.29 percent.20This translates into 0.07 percentage point increase per annum at a base-year (2016) national poverty headcount index of 24.5 percent (24.5*0.29/100=0.07). This is the impact of redistribution, or the indirect effect of rising inequality during 2010-16. The net elasticity of poverty with respect to growth is thus -1.04 as compared to the gross elasticity of -1.11 (see, Table 33). Clearly, the trend of rising inequality in the 2010-16 period was not only harmful for social cohesion, but it also dampens further the poverty reducing effects of economic growth. It shows why inequality matters for poverty reduction.
Table 33: Growth Elasticity Estimates (2000-2010)- Datt and Ravallion (1992) Method
Upper Poverty Line (Adept Based) Parameter National (2000-10) National (2010-16)
γ -1.55 -1.11β*δ -0.09 0.07λ -1.64 -1.04
Note: Calculated from unit record data of 2010 and 2016 HIES.
2.4.2 Poverty Projections over 2011-2031: Assessing Long-term Implications of Covid-19
Using the net growth elasticities of poverty reduction as derived and discussed above, we estimate the poverty headcount index at the national level under different GDP growth scenarios with and without Covid-19 shock. The projections are grim. We first consider the “hard lockdown” related poverty shocks for attaining the SDG target of ‘zero poverty’ before turning to “soft lockdown” implications. Several aspects are noteworthy (see, Table 34).
First, Bangladesh would have achieved the SDG target of zero poverty by 2031 under a 7% average growth scenario had there been no Covid-19. Even a 6% average growth rate of GDP would have taken the country closer to achieving the SDG target (as it would be only 20 Please note that this is a product of β×δ whereby β represents the ‘elasticity of poverty to inequality’ (which is equal to
0.8--obtained from Datt-Ravallion (1992) decomposition of poverty changes between 2010 and 2016) and δ represents the ‘elasticity of inequality to growth’ (which is equal to 0.36—estimated from the observed changes in Gini index of inequality to observed changes in the real survey mean consumption expenditure).
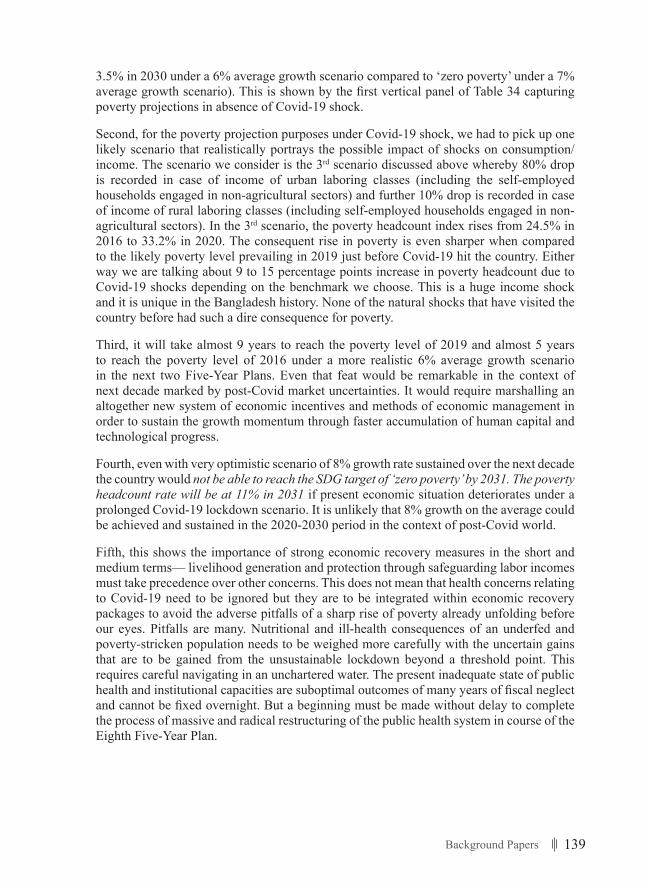
139Background Papers
3.5% in 2030 under a 6% average growth scenario compared to ‘zero poverty’ under a 7% average growth scenario). This is shown by the first vertical panel of Table 34 capturing poverty projections in absence of Covid-19 shock.
Second, for the poverty projection purposes under Covid-19 shock, we had to pick up one likely scenario that realistically portrays the possible impact of shocks on consumption/ income. The scenario we consider is the 3rd scenario discussed above whereby 80% drop is recorded in case of income of urban laboring classes (including the self-employed households engaged in non-agricultural sectors) and further 10% drop is recorded in case of income of rural laboring classes (including self-employed households engaged in non-agricultural sectors). In the 3rd scenario, the poverty headcount index rises from 24.5% in 2016 to 33.2% in 2020. The consequent rise in poverty is even sharper when compared to the likely poverty level prevailing in 2019 just before Covid-19 hit the country. Either way we are talking about 9 to 15 percentage points increase in poverty headcount due to Covid-19 shocks depending on the benchmark we choose. This is a huge income shock and it is unique in the Bangladesh history. None of the natural shocks that have visited the country before had such a dire consequence for poverty.
Third, it will take almost 9 years to reach the poverty level of 2019 and almost 5 years to reach the poverty level of 2016 under a more realistic 6% average growth scenario in the next two Five-Year Plans. Even that feat would be remarkable in the context of next decade marked by post-Covid market uncertainties. It would require marshalling an altogether new system of economic incentives and methods of economic management in order to sustain the growth momentum through faster accumulation of human capital and technological progress.
Fourth, even with very optimistic scenario of 8% growth rate sustained over the next decade the country would not be able to reach the SDG target of ‘zero poverty’ by 2031. The poverty headcount rate will be at 11% in 2031 if present economic situation deteriorates under a prolonged Covid-19 lockdown scenario. It is unlikely that 8% growth on the average could be achieved and sustained in the 2020-2030 period in the context of post-Covid world.
Fifth, this shows the importance of strong economic recovery measures in the short and medium terms— livelihood generation and protection through safeguarding labor incomes must take precedence over other concerns. This does not mean that health concerns relating to Covid-19 need to be ignored but they are to be integrated within economic recovery packages to avoid the adverse pitfalls of a sharp rise of poverty already unfolding before our eyes. Pitfalls are many. Nutritional and ill-health consequences of an underfed and poverty-stricken population needs to be weighed more carefully with the uncertain gains that are to be gained from the unsustainable lockdown beyond a threshold point. This requires careful navigating in an unchartered water. The present inadequate state of public health and institutional capacities are suboptimal outcomes of many years of fiscal neglect and cannot be fixed overnight. But a beginning must be made without delay to complete the process of massive and radical restructuring of the public health system in course of the Eighth Five-Year Plan.
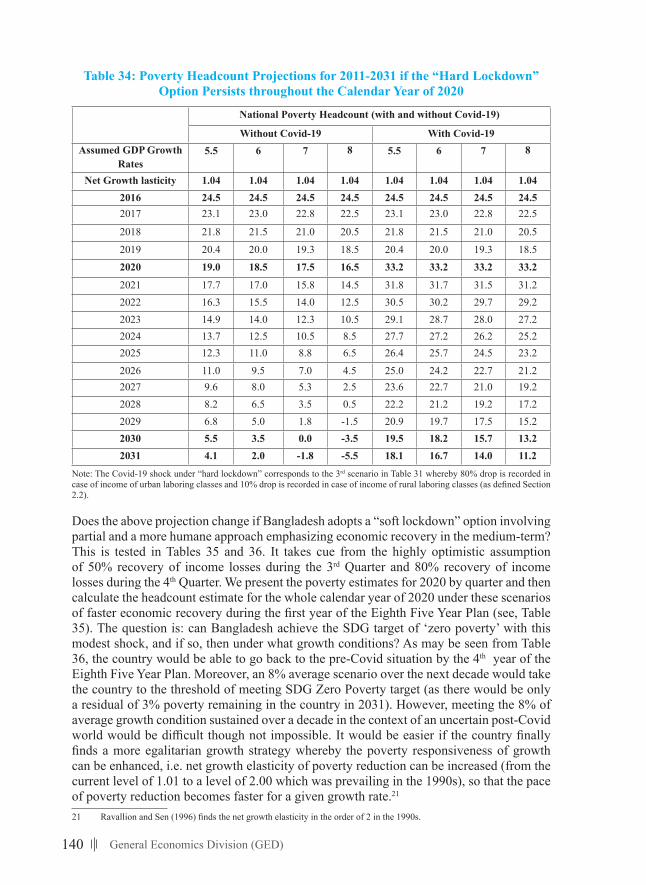
140 General Economics Division (GED)
Table 34: Poverty Headcount Projections for 2011-2031 if the “Hard Lockdown” Option Persists throughout the Calendar Year of 2020
National Poverty Headcount (with and without Covid-19)
Without Covid-19 With Covid-19Assumed GDP Growth
Rates5.5 6 7 8 5.5 6 7 8
Net Growth lasticity 1.04 1.04 1.04 1.04 1.04 1.04 1.04 1.042016 24.5 24.5 24.5 24.5 24.5 24.5 24.5 24.52017 23.1 23.0 22.8 22.5 23.1 23.0 22.8 22.5
2018 21.8 21.5 21.0 20.5 21.8 21.5 21.0 20.5
2019 20.4 20.0 19.3 18.5 20.4 20.0 19.3 18.52020 19.0 18.5 17.5 16.5 33.2 33.2 33.2 33.2
2021 17.7 17.0 15.8 14.5 31.8 31.7 31.5 31.22022 16.3 15.5 14.0 12.5 30.5 30.2 29.7 29.22023 14.9 14.0 12.3 10.5 29.1 28.7 28.0 27.22024 13.7 12.5 10.5 8.5 27.7 27.2 26.2 25.22025 12.3 11.0 8.8 6.5 26.4 25.7 24.5 23.2
2026 11.0 9.5 7.0 4.5 25.0 24.2 22.7 21.22027 9.6 8.0 5.3 2.5 23.6 22.7 21.0 19.22028 8.2 6.5 3.5 0.5 22.2 21.2 19.2 17.22029 6.8 5.0 1.8 -1.5 20.9 19.7 17.5 15.22030 5.5 3.5 0.0 -3.5 19.5 18.2 15.7 13.22031 4.1 2.0 -1.8 -5.5 18.1 16.7 14.0 11.2
Note: The Covid-19 shock under “hard lockdown” corresponds to the 3rd scenario in Table 31 whereby 80% drop is recorded in case of income of urban laboring classes and 10% drop is recorded in case of income of rural laboring classes (as defined Section 2.2).
Does the above projection change if Bangladesh adopts a “soft lockdown” option involving partial and a more humane approach emphasizing economic recovery in the medium-term? This is tested in Tables 35 and 36. It takes cue from the highly optimistic assumption of 50% recovery of income losses during the 3rd Quarter and 80% recovery of income losses during the 4th Quarter. We present the poverty estimates for 2020 by quarter and then calculate the headcount estimate for the whole calendar year of 2020 under these scenarios of faster economic recovery during the first year of the Eighth Five Year Plan (see, Table 35). The question is: can Bangladesh achieve the SDG target of ‘zero poverty’ with this modest shock, and if so, then under what growth conditions? As may be seen from Table 36, the country would be able to go back to the pre-Covid situation by the 4th year of the Eighth Five Year Plan. Moreover, an 8% average scenario over the next decade would take the country to the threshold of meeting SDG Zero Poverty target (as there would be only a residual of 3% poverty remaining in the country in 2031). However, meeting the 8% of average growth condition sustained over a decade in the context of an uncertain post-Covid world would be difficult though not impossible. It would be easier if the country finally finds a more egalitarian growth strategy whereby the poverty responsiveness of growth can be enhanced, i.e. net growth elasticity of poverty reduction can be increased (from the current level of 1.01 to a level of 2.00 which was prevailing in the 1990s), so that the pace of poverty reduction becomes faster for a given growth rate.21
21 Ravallion and Sen (1996) finds the net growth elasticity in the order of 2 in the 1990s.
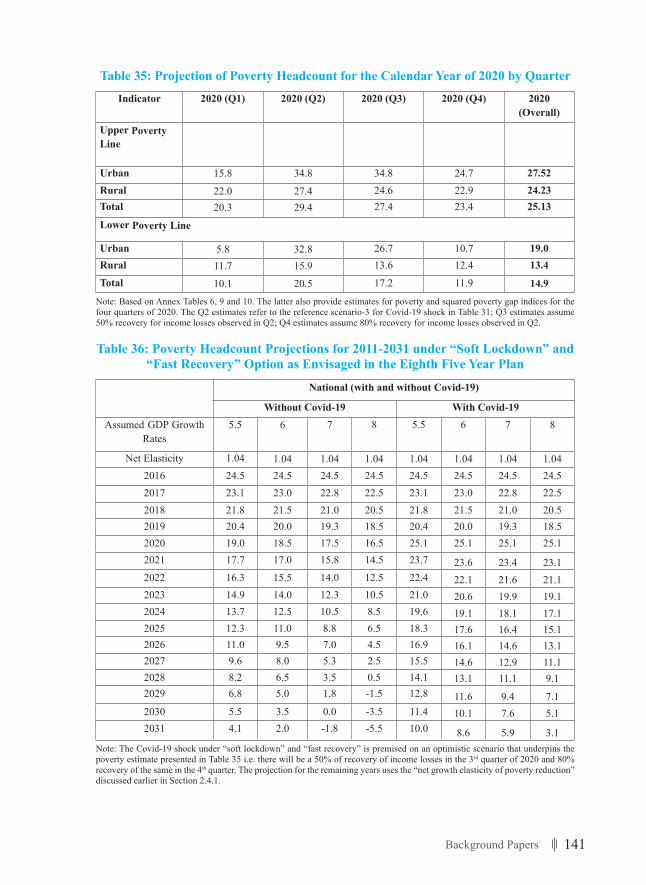
141Background Papers
Table 35: Projection of Poverty Headcount for the Calendar Year of 2020 by QuarterIndicator 2020 (Q1) 2020 (Q2) 2020 (Q3) 2020 (Q4) 2020
(Overall)Upper Poverty Line
Urban 15.8 34.8 34.8 24.7 27.52Rural 22.0 27.4 24.6 22.9 24.23Total 20.3 29.4 27.4 23.4 25.13
Lower Poverty Line
Urban 5.8 32.8 26.7 10.7 19.0Rural 11.7 15.9 13.6 12.4 13.4
Total 10.1 20.5 17.2 11.9 14.9Note: Based on Annex Tables 6, 9 and 10. The latter also provide estimates for poverty and squared poverty gap indices for the four quarters of 2020. The Q2 estimates refer to the reference scenario-3 for Covid-19 shock in Table 31; Q3 estimates assume 50% recovery for income losses observed in Q2; Q4 estimates assume 80% recovery for income losses observed in Q2.
Table 36: Poverty Headcount Projections for 2011-2031 under “Soft Lockdown” and “Fast Recovery” Option as Envisaged in the Eighth Five Year Plan
National (with and without Covid-19)
Without Covid-19 With Covid-19Assumed GDP Growth
Rates5.5 6 7 8 5.5 6 7 8
Net Elasticity 1.04 1.04 1.04 1.04 1.04 1.04 1.04 1.042016 24.5 24.5 24.5 24.5 24.5 24.5 24.5 24.52017 23.1 23.0 22.8 22.5 23.1 23.0 22.8 22.52018 21.8 21.5 21.0 20.5 21.8 21.5 21.0 20.52019 20.4 20.0 19.3 18.5 20.4 20.0 19.3 18.52020 19.0 18.5 17.5 16.5 25.1 25.1 25.1 25.12021 17.7 17.0 15.8 14.5 23.7 23.6 23.4 23.12022 16.3 15.5 14.0 12.5 22.4 22.1 21.6 21.12023 14.9 14.0 12.3 10.5 21.0 20.6 19.9 19.12024 13.7 12.5 10.5 8.5 19.6 19.1 18.1 17.12025 12.3 11.0 8.8 6.5 18.3 17.6 16.4 15.12026 11.0 9.5 7.0 4.5 16.9 16.1 14.6 13.12027 9.6 8.0 5.3 2.5 15.5 14.6 12.9 11.12028 8.2 6.5 3.5 0.5 14.1 13.1 11.1 9.12029 6.8 5.0 1.8 -1.5 12.8 11.6 9.4 7.12030 5.5 3.5 0.0 -3.5 11.4 10.1 7.6 5.12031 4.1 2.0 -1.8 -5.5 10.0 8.6 5.9 3.1
Note: The Covid-19 shock under “soft lockdown” and “fast recovery” is premised on an optimistic scenario that underpins the poverty estimate presented in Table 35 i.e. there will be a 50% of recovery of income losses in the 3rd quarter of 2020 and 80% recovery of the same in the 4th quarter. The projection for the remaining years uses the “net growth elasticity of poverty reduction” discussed earlier in Section 2.4.1.
142 General Economics Division (GED)
2.5 Conclusions and Possible Policy Responses in the Eighth Plan
In this section, we discuss the main findings of the study and offer some policy alternatives.
2.5.1 Results of Poverty Diagnostics with and without Covid-19
Bangladesh has achieved impressive success in the past three decades in the area of growth acceleration, poverty reduction, human development and female advancement. Success in poverty reduction is expressed in the long-term sharp decline in the incidence of income-poverty from 56.8% in 1991/92 to 24.5% in 2016 as per HIES data, decreasing further to an estimated level of 20.3% in the first quarter of 2020. Similarly, the proportion of under-five children who are stunted has come down from 54.6% in 1996/97 to 30.8 per cent in 2017/18 as per DHS data. Equally impressive were improvements in terms of the non-income dimensions of poverty. It is important to protect the past economic gains and tackle the new challenges of development in terms of achieving the goal of ‘zero poverty’ in the shortest possible time and shared prosperity while maintaining the momentum of growth acceleration and the rapid pace of structural transformation. One needs to address the pitfalls of poverty reduction process. These weaknesses were already discernible in the recent trends in poverty—a slow-down of the overall pace of poverty reduction rate (1.7 percentage point reduction per year in 2005-10 vs. 1.2 percentage point decline in 2010-16), emergence of hotspots of regional poverty, persistent asset-based inequality observed in educational and health outcomes, and, in general, rising tendencies of consumption and income inequalities.
While these successes and pitfalls were subjected to much discussions in the Bangladesh literature, one less-discussed dimension is the enhanced pre-existent vulnerability of the poverty reduction process itself even before the Covid-19 shock hit the country in March 2020. This is reflected in three dimensions: (a) susceptibility of falling into poverty due to price shocks from the pandemic; (b) increased bunching of the “near-poor” around the poverty line; and (c) greater chances of slippages into extreme poverty. The first dimension tells us that even a slight increase in the poverty line due to price shocks can push a large segment of population into poverty. Thus, even a 10% increase in the poverty line can result about 34% increase in poverty in urban areas compared to the baseline. The second dimension tells us that the bunching around the poverty line has increased during 2010-16. For the ‘10% increase in poverty line’ scenario, quantum increase in poverty has magnified from 25% to 29% in rural areas, and from 28% to 33% in urban areas during this period. The third dimension indicates the higher risks of descending into greater poverty for households who are already in poverty. Our calculation shows a 10% increase in the lower poverty line will result in 41% increase of extreme poverty in rural areas compared to the baseline (the matched effect is 44% in urban areas). It turns out that vulnerability of moderate poor falling into extreme poverty is much higher than the vulnerability of the near-poor households slipping into poverty.
These pre-existent vulnerabilities have become more acute due to the Covid-19 shock in 2020. Our calculations show that the poverty impact of prolonged ‘hard’ lockdown—as opposed to short-duration ‘soft’ lockdowns—can be disastrous. Anything between 9 million to 35 million of the population may descend into poverty due to the Covid-19 shock depending on the assumptions we make about the quantum of income/employment loss. Taking a plausible scenario whereby there is a 80% drop in income of the urban laboring
143Background Papers
classes (including the self-employed who are engaged in non-agricultural sectors) and additional 10% drop in income of the rural laboring classes (including self-employed who are engaged in non-agricultural sectors), we find that the poverty headcount index would rise from 20.3% in 2019 to 29.4% in the 2nd quarter of 2020 corresponding to the addition of 25 million of new poor. This segment of vulnerable population requires a new kind of policy support as they were not the usual target group of the traditional social protection programs.
If we conduct poverty projections to 2031 from the derailment caused by the Covid-19 shock in 2020, grim realities emerge inescapably. Bangladesh was on track in meeting the SDG goal of ‘zero poverty’ by 2031 comfortably under a 7% average growth scenario. Even a 6% average growth rate of GDP would have taken the country closer to achieving the SDG target (poverty headcount projected as being only 2% in 2031). Covid-19 has altered this comfortable on-track situation altogether. Now it appears that, with a sharp rise in poverty from the projected 20.3% in 2019 to 25.1% in 2020 due to Covid-19 shock, Bangladesh’s GDP needs to grow at an average 8% per year over the next decade in order to meet the SDG target of zero poverty by 2031. Even that feat would be remarkable in the context of post-Covid market uncertainties at home and in the world.
2.5.2 Policy Implications for Addressing Poverty in the Backdrop of Covid-19
The explosive combination of pre-existing vulnerabilities combined with the onslaught of a massive pandemic shock is threatening presently to wipe out most of the gains in poverty reduction accumulated over the years. But crisis also provides scope for new opportunities. As Dostoevsky once remarked, epidemics show who we really are. We can foster our creative potentials to look for new and innovative solutions to some long neglected pro-poor investment strategies and institutional reforms. Several policy points are noteworthy. We group these into two broad categories: (a) short-term measures, and (b) medium-term measures.
Short-term measures
Short-term measures include ways to mitigate the adverse effects of lockdown pertaining to Covid-19 shocks and to undertake immediate health sector capacity-building measures to prevent the spread of the corona virus and provide cure to the needy. The strategy here is to focus on economy with an eye on the health situation to prevent further spread and to mitigate the humanitarian distress. A quick check with the ground reality shows us that a strategy of a prolonged lockdown in order to bring down the‘infection curve’ in line with the country’s ‘health system capacity’ will work only for a temporary period. Beyond a few weeks down the line, this model turns to be economically and politically unsustainable. In course of analysis of the drivers of wellbeing in various groups of poor and non-poor, we have noticed that only few urban poor households have access to non-land physical assets (16%), financial assets (39%), and account with the formal banking system (4%). The access to such financial assets is even more limited for rural poor households. The situation is only slightly better in case of VNP households in these respects (see, Annex Table 1 and 2). This indirectly indicates the very low incidence of financial savings in a typically poor household in Bangladesh. A sizable amount of financial savings could have supported them in times of severe distress. After all, most of the working poor in Bangladesh rely heavily on daily or monthly wage incomes for their survival. If there are no labor earnings even for two consecutive weeks, the scarcity of food and other daily necessities emerges as a
144 General Economics Division (GED)
real possibility. If the stalemate on the earnings front stretches about 3 to 4 weeks, a food crisis breaks out. This suggests that a prolonged economic lockdown based on the Western model of ‘social distancing’ is not feasible from purely economic livelihood point of view even if we discount the population density factor in a country such as Bangladesh. This has prompted many governments in the developing world (including Bangladesh) to opt for a ‘soft’ (more humane as opposed to draconian) lockdown model so that the poor and the vulnerable can get access to labor income opportunities and can prevent slippage into dire poverty and food insecurity through their own initiatives. Seen from this perspective, a relatively steady flow of labor income is the best social protection for the poor in developing countries with limited social transfer capacities to which Bangladesh is no exception.
Granting access to labor income opportunities however limited to economically important sectors such as export-oriented ready-made garments, agriculture, transport, marketing, and essential service sectors, does not mean that we should be oblivious of the pandemic context within which the economy now operates. This requires integration of heath safety measures with the participation of workers in the above labor income activities—not only in their workplaces i.e. inside the factories but also outside the factories. The experience of initial months of Covid-19 suggests that such an integration is a difficult feat to achieve. Firstly, there is stark capacity deficit in the public health sector—accumulated due to severe underinvestment in public health system over the successive years. This has resulted in a few hospitals in the country with adequate ICU facilities; even in Dhaka, only a handful of public and private hospitals have such facilities. To aggravate the problem of regional inequality in health care, only a few districts have designated “district hospitals”, and only a few district hospitals have ICU facilities with ventilators, trained nurse and experienced doctors to provide ICU-based treatments to severely Covid-19 affected patients. Secondly, it is not clear how the WHO catch-all slogan “test, test and test” can be operationalized in Bangladesh with a few testing facilities available even in urban areas.22 Such an ambitious program of testing cannot be accomplished just relying on imports of PCRs for Covid-19 test. Domestic production of PCRs and Antibody test kits are necessary in order to meet the emergency need for Covid-19 testing in the coming months. It is important to make these testing facilities widely available. Thirdly, the present pandemic shock also underscores the need for more trained nurses, doctors, and medical technologists in the overall public health system.
Not everyone can immediately benefit from the opening of labor income opportunities as lockdown is still broadly enforced and it will only gradually be lifted. Many are informal workers who fall outside the purview of export-oriented manufacturing units or registered trading enterprises. After all, 70% of the workers in urban areas correspond to the informal sector employment as per the Labor Force Survey data. Those workers who are going to be affected by partial lockdown will need some forms of social assistance or formal social protection. We have noted earlier—based on MICS 2018 data-- that many of the existing social protection programs while showing ‘progressive benefit incidence’ still suffer from the problems of non-targeting so much so that about 50% of the benefits end up in the non-deserving CNP group. The same pattern can be observed with respect to the HIES 2016 evidence as well. In short, the idea of compensatory social protection transfer is fine, but the system requires repairing to be effective in aiding poor people in times of pandemic shock. This brings us to a range of medium-term issues.
22 Admittedly, the testing capacity has increased in recent months—from just 1 PCR Lab in March 2020 to 66 Labs inJune 2020. But, the inadequacy of testing facility--compared to the demand in the health market--persists.
145Background Papers
Medium-term measures
The experience of Covid-19 suggests two empirical regularities. First, health inequalities reveal severe economic divides within a society. The Covid-19 shows high variance in mortalities and hospitalization rates by economic classes and racial divides. While the hard data is not presently unavailable for Bangladesh, we suspect that the poor are placed in a much more disadvantaged position than the non- poor with respect to accessing the Covid-19 diagnosis tests as well as the associated treatment facilities. In any case, their access to formal health care (not exceeding 25% for major diseases) was much limited even before the pandemic shock hit the country and they are more likely to be rationed out now more than ever in the health market where there is an acute competition for scarce health resources. Thus, in a resource-constrained situation with limited Covid-19 testing facility, limited hospital beds for Covid patients, and limited ICU facilities, the health system tends to favor the non-poor than the relatively deserving poor. These health inequalities cannot be addressed by growth-mediated health security strategies alone. Access to basic and emergency public health care needs to be recognized as essential non-negotiable inalienable right of every citizen of Bangladesh irrespective of the economic divides and social markers. Such a right should get adequate fiscal and institutional expressions in terms of producing a radically altered universal public health system.
Second, initial experience suggests countries that performed well in reducing the number deaths from Covid-19 represent countries with developed or universal public health coverage of their population. The list includes diverse regime types: Vietnam, the Indian State of Kerala, Sri Lanka, Taiwan, Cuba, South Korea, Singapore, New Zealand, Norway, Denmark, Finland, Slovenia, etc. It is not the form of the government but the broad-based system of universal or near-universal public health coverage that these countries had established made the difference. Bangladesh is constitutionally committed to “ensure health for all” and it should take this commitment to practice. It is well-known that the public health expenditure- GDP ratio has been well below 1% in the past two decades; it was already at a low of 0.8% in 2014 and has dropped further to a paltry 0.7% in 2019. For universal health system, we need to raise the matched ratio to 3% of the GDP. Such a system needs to be backed up by a carefully designed employer-supported micro health insurance system especially in formal public and private entities/enterprises.23
Third, initial experience also suggests countries with developed social protection system performed well in helping the poor and vulnerable in times of pandemic shocks. This is much more than the issue of raising adequate funds for social protection. Our analysis shows that the problem of non-targeting is high in case of most social protection programs. Linking the beneficiary participation in social protection programs with the NID cards digitally—as has been done in case of Aadhar card in India—can facilitate the transfer to the deserving poor in times of distress as well as help minimize the extent of leakage and non-targeting errors of transfers. The same principle of digital linking may be introduced in case of disbursing industrial incentives to small and micro enterprises who currently lack access to formal bank accounts. The
‘household data base for identification of the poor’ developed by BBS (based on the PMT score method) can be used for the initial identification of the beneficiaries of the SP 23 It is not clear why the foreign buyers and employers in the RMG sector would be concerned only with health compliance
inside the factories in order to ensure workers’ occupational health and ignore the general health concerns of the same workers outside the factories. The least they could do is to come up with a system of employer- supported micro health insurance to aid mitigation against health shocks in times of pandemic crisis.
146 General Economics Division (GED)
programs. But, Covid-19 shock possibly changed the relative ranking of these households especially that of the VNP households, many of whom are now likely to be among the ranks of the poor. In order to draw an updated list of the SP beneficiaries, one needs to cross-check with the local government functionaries (i.e. UP Chairman and the Ward Members). In short, while digital technology based on prior survey information will help but there is a need for constant engagement with the local governments for updating the list of the SP beneficiaries.24
Fourth, technology access can play an important role in times of crisis. Widespread use of power threshers and combined harvesters have been put to good use in recent Boro harvesting season in the Haor areas of Bangladesh at a time when the labor movement was relatively restricted due to Covid-19 lockdown. Such use of technology needs to be encouraged further. However, unequal access to technology has become a new source of economic inequality between the poor and non-poor. The rich people’s kids had access to internet-based platforms for pursuing uninterrupted educational activities during lockdown while the poor people’s kids were cut-off from that facility. It is true that 80% of poor households have access to mobile phone technology but only a few of them have smart-phone access with internet facility (for Bangladesh as a whole, the smart-phone penetration does not exceed 25%). This aspect of distant education of e-learning needs to be encouraged further by making internet-technology widely available, and at subsidized costs, among the more disadvantaged groups.
Fifth, resourcing the system of universal public health and development of a poverty-focused social protection system will require some creative thinking about fiscal strengthening. Introduction of wealth tax is one option; the instrument of inheritance tax may also be an important option in the next decade provided the dismal state of revenue sourced from the income taxes still prevails.
Lastly, the poverty responsiveness of growth–represented by gross and net elasticities of growth—have been declining in the 2010s compared to 2000s even before the Covid-19 shock hit the country. This disturbing trend needs to be reversed in the 8th Five Year Plan—both to reach the SDG goal-10 on mitigating inequality and for achieving the SDG target of ‘zero poverty’. Rising income inequality (Bangladesh has already entered the high-inequality club at a relatively low level of income) is neither economically inevitable nor ethically acceptable. Acceleration of agricultural/rural growth, expansion of job creating MSMEs in urban areas, development of secondary towns, greater female participation in high-end labor markets, broad-based access to human and financial capital--backed up by progressive income and wealth taxation--will help to restore the poverty responsiveness of growth and stop the rising trends of inequality in Bangladesh.
24 The other option is to go for massive income transfer to the poor and the new-poor as observed in case of redistributive policies in developed welfare-state countries during Covid-19. In that case, Bangladesh could have achieved better results in terms of reducing Covid-19 infection rate to the minimum. However, this broad entitlement-based option is not practically available for Bangladesh in the short-term due to limited fiscal capacity and institutional rigidities.
147Background Papers
ReferencesAhsan, S. M. and S. Q. Ahsan (2018). “One Sunshine Doth Not a Harvest Make: An Examination of the Growth Momentum in Bangladesh”, Bangladesh Development Studies, No. 4, December.
Ali, Z. and K. A. S. Murshid (2019). Why is Poverty so Pervasive and Increasing in Some Districts in Bangladesh, a study carried out by the Bangladesh Institute of Development Studies (BIDS), Dhaka, December (draft).
Begum, S. and B. Sen (2010). “Identifying and Targeting the Extreme Poor: A Methodology for Rural Bangladesh”. In: D. Lawson, D. Hulme, I. Matin, and K. Moore (Eds.), What Works for the Poorest? Poverty Reduction Programmes for the World’s Extreme Poor, Practical Action Publishing Ltd, Warwickshire, UK.
Bowles, S. (2004). Economic Institutions and Behavior: An Evolutionary Approach to Microeconomics, Princeton: Princeton University Press.
Datt, G. & M. Ravallion (1992). “Growth and Redistribution Components of Changes in Poverty Measures: A Decomposition with Applications to Brazil and India in the 1980s”. Journal of Development Economics, 38(2).
Giménez, L., Jolliffe, D. & Sharif, I. (2014). “Bangladesh, a Middle Income Country by 2021: What Will It Take in terms of Poverty Reduction?” Bangladesh Development Studies, No. 1&2.
Hill, R. and Genoni, M. E. (2019). Bangladesh Poverty Assessment : Facing Old and New Frontiers in Poverty Reduction. Washington, D.C. : World Bank Group.
Hossain, M. and B. Sen (1992). “Rural Poverty in Bangladesh: Trends and Determinants”, Asian Development Review, Vol. 10, No. 1, January, pp. 1-31
Hossain, M., B. Sen and Y. Sawada (2016). “Bangladesh: Jobs and Growth in an Urbanizing Economy” in G. Betcherman and M. Rama (eds.), Jobs for Development: Challenges and SolutionsinDifferentCountrySettings, Oxford University Press: New York, pp. 62-101.
Jack, J. C. (1916/ 1975). The Economic Life of a Bengal District: A Study (with an introduction of Shahid Amin), Oxford: London.
Ravallion, M. and B. Sen (1996), “When Method Matters: Monitoring Poverty in Bangladesh”, Economic Development and Cultural Change, Vol. 44, No. 4, July 1996, pp. 761-792.
Reisman, D. (2011). Alfred Marshall: Progress and Politics, Routledge: London.
Sen, A. (1981). Poverty and Famines, Oxford: London.
Sen, B. (2019). “Rural Transformation and Poverty Reduction in Bangladesh: Analysis of Recent Evidence from the Household Income and Expenditure Survey 2016.” In: Hill, R. and Genoni, M. E. (2019). Eds. Bangladesh Poverty Assessment : Facing Old and New Frontiers in Poverty Reduction, Vol. 2, pp. 175- 200.
Sen, B. and Z. Ali (2016). “Ending Extreme Poverty in Bangladesh: Trends, Drivers, and Policies” in J. Devine, G. D. Wood, Z. Ali and S. Alam (eds.), Extreme Poverty, Growth and Inequality in Bangladesh, Practical Action Publishing: Warwickshire, U.K.
World Bank (2020). Bangladesh Social Protection Public Expenditure Review (Draft for consultations). Social Protection and Jobs, Washington, D.C. : World Bank Group.
Zhang, X., S. Rashid, K. Ahmad, V. Mueller, H. L. Lee, S. Lemma, S. Belal, and A. U. Ahmed (2013). Rising Wages in Bangladesh. Washington, DC: International Food Policy Research Institute.
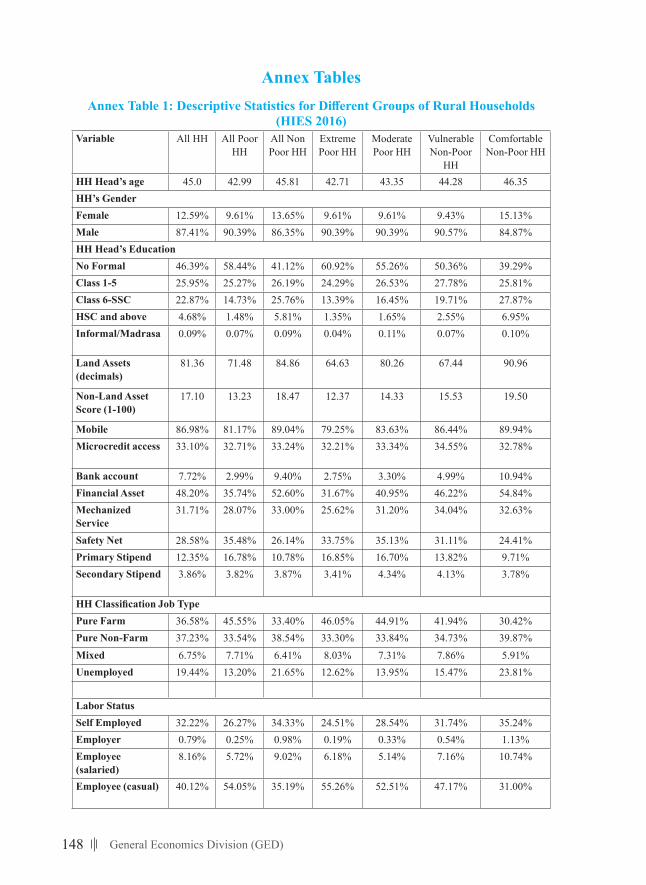
148 General Economics Division (GED)
Annex TablesAnnexTable1:DescriptiveStatisticsforDifferentGroupsofRuralHouseholds
(HIES 2016)Variable All HH All Poor
HHAll Non Poor HH
Extreme Poor HH
Moderate Poor HH
Vulnerable Non-Poor
HH
Comfortable Non-Poor HH
HH Head’s age 45.0 42.99 45.81 42.71 43.35 44.28 46.35HH’s GenderFemale 12.59% 9.61% 13.65% 9.61% 9.61% 9.43% 15.13%Male 87.41% 90.39% 86.35% 90.39% 90.39% 90.57% 84.87%HH Head’s EducationNo Formal 46.39% 58.44% 41.12% 60.92% 55.26% 50.36% 39.29%Class 1-5 25.95% 25.27% 26.19% 24.29% 26.53% 27.78% 25.81%Class 6-SSC 22.87% 14.73% 25.76% 13.39% 16.45% 19.71% 27.87%HSC and above 4.68% 1.48% 5.81% 1.35% 1.65% 2.55% 6.95%Informal/Madrasa 0.09% 0.07% 0.09% 0.04% 0.11% 0.07% 0.10%
Land Assets (decimals)
81.36 71.48 84.86 64.63 80.26 67.44 90.96
Non-Land Asset Score (1-100)
17.10 13.23 18.47 12.37 14.33 15.53 19.50
Mobile 86.98% 81.17% 89.04% 79.25% 83.63% 86.44% 89.94%Microcredit access 33.10% 32.71% 33.24% 32.21% 33.34% 34.55% 32.78%
Bank account 7.72% 2.99% 9.40% 2.75% 3.30% 4.99% 10.94%Financial Asset 48.20% 35.74% 52.60% 31.67% 40.95% 46.22% 54.84%Mechanized Service
31.71% 28.07% 33.00% 25.62% 31.20% 34.04% 32.63%
Safety Net 28.58% 35.48% 26.14% 33.75% 35.13% 31.11% 24.41%Primary Stipend 12.35% 16.78% 10.78% 16.85% 16.70% 13.82% 9.71%Secondary Stipend 3.86% 3.82% 3.87% 3.41% 4.34% 4.13% 3.78%
HHClassificationJobTypePure Farm 36.58% 45.55% 33.40% 46.05% 44.91% 41.94% 30.42%Pure Non-Farm 37.23% 33.54% 38.54% 33.30% 33.84% 34.73% 39.87%Mixed 6.75% 7.71% 6.41% 8.03% 7.31% 7.86% 5.91%Unemployed 19.44% 13.20% 21.65% 12.62% 13.95% 15.47% 23.81%
Labor StatusSelf Employed 32.22% 26.27% 34.33% 24.51% 28.54% 31.74% 35.24%Employer 0.79% 0.25% 0.98% 0.19% 0.33% 0.54% 1.13%Employee (salaried)
8.16% 5.72% 9.02% 6.18% 5.14% 7.16% 10.74%
Employee (casual) 40.12% 54.05% 35.19% 55.26% 52.51% 47.17% 31.00%
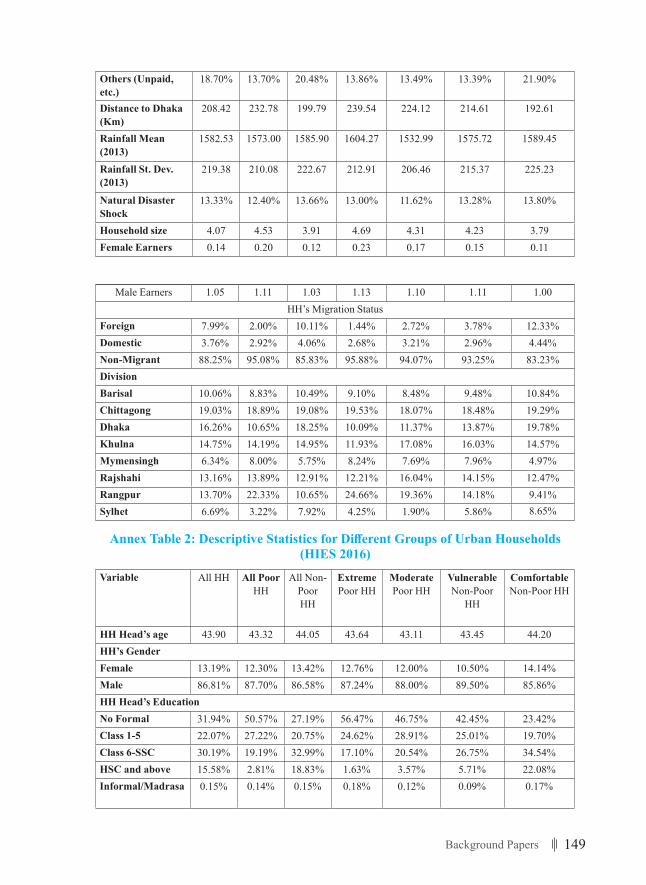
149Background Papers
Others (Unpaid, etc.)
18.70% 13.70% 20.48% 13.86% 13.49% 13.39% 21.90%
Distance to Dhaka (Km)
208.42 232.78 199.79 239.54 224.12 214.61 192.61
Rainfall Mean (2013)
1582.53 1573.00 1585.90 1604.27 1532.99 1575.72 1589.45
Rainfall St. Dev. (2013)
219.38 210.08 222.67 212.91 206.46 215.37 225.23
Natural Disaster Shock
13.33% 12.40% 13.66% 13.00% 11.62% 13.28% 13.80%
Household size 4.07 4.53 3.91 4.69 4.31 4.23 3.79Female Earners 0.14 0.20 0.12 0.23 0.17 0.15 0.11
Male Earners 1.05 1.11 1.03 1.13 1.10 1.11 1.00HH’s Migration Status
Foreign 7.99% 2.00% 10.11% 1.44% 2.72% 3.78% 12.33%Domestic 3.76% 2.92% 4.06% 2.68% 3.21% 2.96% 4.44%Non-Migrant 88.25% 95.08% 85.83% 95.88% 94.07% 93.25% 83.23%DivisionBarisal 10.06% 8.83% 10.49% 9.10% 8.48% 9.48% 10.84%Chittagong 19.03% 18.89% 19.08% 19.53% 18.07% 18.48% 19.29%Dhaka 16.26% 10.65% 18.25% 10.09% 11.37% 13.87% 19.78%Khulna 14.75% 14.19% 14.95% 11.93% 17.08% 16.03% 14.57%Mymensingh 6.34% 8.00% 5.75% 8.24% 7.69% 7.96% 4.97%Rajshahi 13.16% 13.89% 12.91% 12.21% 16.04% 14.15% 12.47%Rangpur 13.70% 22.33% 10.65% 24.66% 19.36% 14.18% 9.41%Sylhet 6.69% 3.22% 7.92% 4.25% 1.90% 5.86% 8.65%
AnnexTable2:DescriptiveStatisticsforDifferentGroupsofUrbanHouseholds(HIES 2016)
Variable All HH All Poor HH
All Non- Poor HH
ExtremePoor HH
ModeratePoor HH
VulnerableNon-Poor
HH
Comfortable Non-Poor HH
HH Head’s age 43.90 43.32 44.05 43.64 43.11 43.45 44.20HH’s GenderFemale 13.19% 12.30% 13.42% 12.76% 12.00% 10.50% 14.14%Male 86.81% 87.70% 86.58% 87.24% 88.00% 89.50% 85.86%HH Head’s EducationNo Formal 31.94% 50.57% 27.19% 56.47% 46.75% 42.45% 23.42%Class 1-5 22.07% 27.22% 20.75% 24.62% 28.91% 25.01% 19.70%Class 6-SSC 30.19% 19.19% 32.99% 17.10% 20.54% 26.75% 34.54%HSC and above 15.58% 2.81% 18.83% 1.63% 3.57% 5.71% 22.08%Informal/Madrasa 0.15% 0.14% 0.15% 0.18% 0.12% 0.09% 0.17%
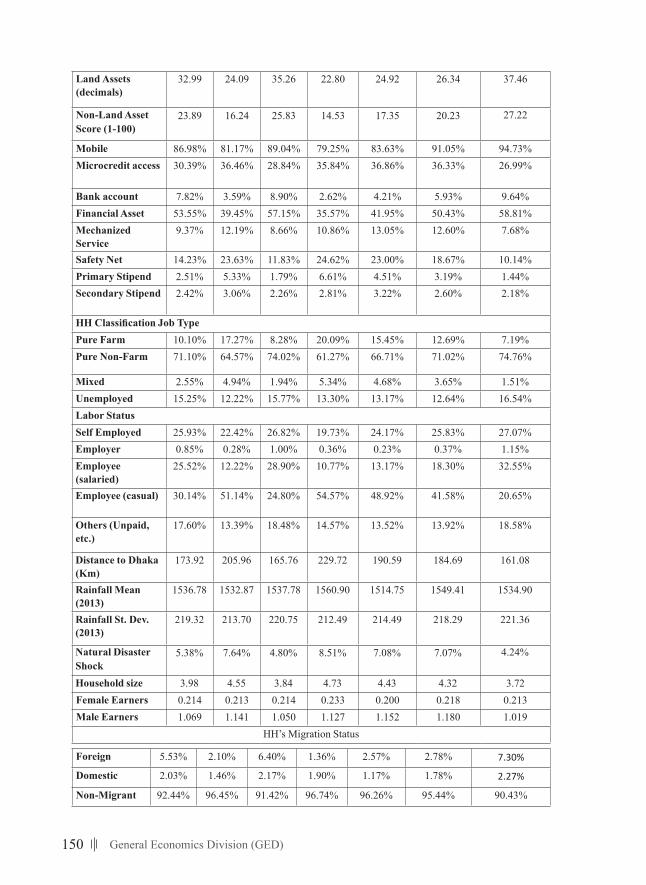
150 General Economics Division (GED)
Land Assets (decimals)
32.99 24.09 35.26 22.80 24.92 26.34 37.46
Non-Land Asset Score (1-100)
23.89 16.24 25.83 14.53 17.35 20.23 27.22
Mobile 86.98% 81.17% 89.04% 79.25% 83.63% 91.05% 94.73%Microcredit access 30.39% 36.46% 28.84% 35.84% 36.86% 36.33% 26.99%
Bank account 7.82% 3.59% 8.90% 2.62% 4.21% 5.93% 9.64%Financial Asset 53.55% 39.45% 57.15% 35.57% 41.95% 50.43% 58.81%Mechanized Service
9.37% 12.19% 8.66% 10.86% 13.05% 12.60% 7.68%
Safety Net 14.23% 23.63% 11.83% 24.62% 23.00% 18.67% 10.14%Primary Stipend 2.51% 5.33% 1.79% 6.61% 4.51% 3.19% 1.44%Secondary Stipend 2.42% 3.06% 2.26% 2.81% 3.22% 2.60% 2.18%
HHClassificationJobTypePure Farm 10.10% 17.27% 8.28% 20.09% 15.45% 12.69% 7.19%Pure Non-Farm 71.10% 64.57% 74.02% 61.27% 66.71% 71.02% 74.76%
Mixed 2.55% 4.94% 1.94% 5.34% 4.68% 3.65% 1.51%Unemployed 15.25% 12.22% 15.77% 13.30% 13.17% 12.64% 16.54%Labor StatusSelf Employed 25.93% 22.42% 26.82% 19.73% 24.17% 25.83% 27.07%Employer 0.85% 0.28% 1.00% 0.36% 0.23% 0.37% 1.15%Employee (salaried)
25.52% 12.22% 28.90% 10.77% 13.17% 18.30% 32.55%
Employee (casual) 30.14% 51.14% 24.80% 54.57% 48.92% 41.58% 20.65%
Others (Unpaid, etc.)
17.60% 13.39% 18.48% 14.57% 13.52% 13.92% 18.58%
Distance to Dhaka (Km)
173.92 205.96 165.76 229.72 190.59 184.69 161.08
Rainfall Mean (2013)
1536.78 1532.87 1537.78 1560.90 1514.75 1549.41 1534.90
Rainfall St. Dev. (2013)
219.32 213.70 220.75 212.49 214.49 218.29 221.36
Natural Disaster Shock
5.38% 7.64% 4.80% 8.51% 7.08% 7.07% 4.24%
Household size 3.98 4.55 3.84 4.73 4.43 4.32 3.72Female Earners 0.214 0.213 0.214 0.233 0.200 0.218 0.213Male Earners 1.069 1.141 1.050 1.127 1.152 1.180 1.019
HH’s Migration Status
Foreign 5.53% 2.10% 6.40% 1.36% 2.57% 2.78% 7.30%
Domestic 2.03% 1.46% 2.17% 1.90% 1.17% 1.78% 2.27%
Non-Migrant 92.44% 96.45% 91.42% 96.74% 96.26% 95.44% 90.43%
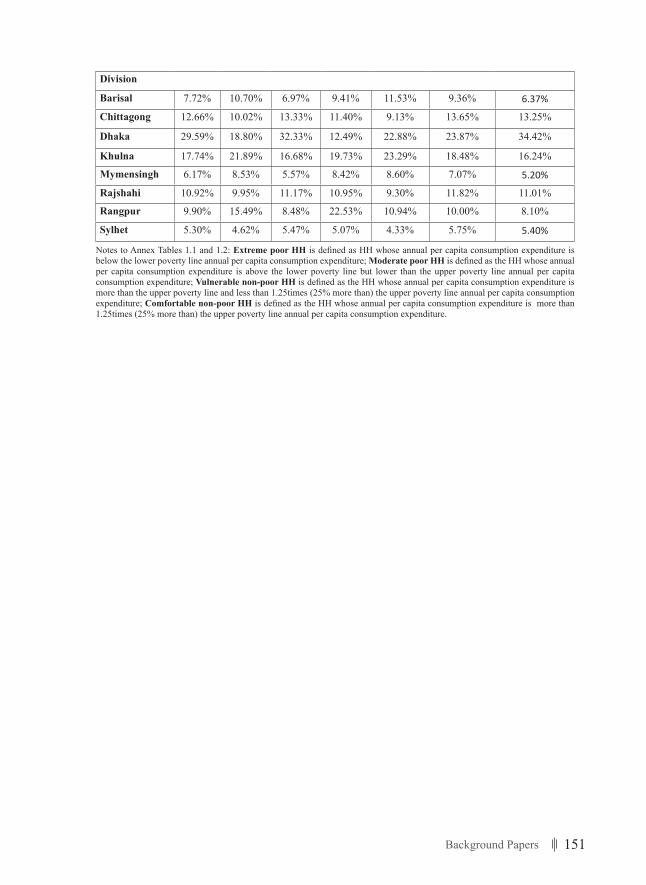
151Background Papers
Division
Barisal 7.72% 10.70% 6.97% 9.41% 11.53% 9.36% 6.37%
Chittagong 12.66% 10.02% 13.33% 11.40% 9.13% 13.65% 13.25%
Dhaka 29.59% 18.80% 32.33% 12.49% 22.88% 23.87% 34.42%
Khulna 17.74% 21.89% 16.68% 19.73% 23.29% 18.48% 16.24%
Mymensingh 6.17% 8.53% 5.57% 8.42% 8.60% 7.07% 5.20%
Rajshahi 10.92% 9.95% 11.17% 10.95% 9.30% 11.82% 11.01%
Rangpur 9.90% 15.49% 8.48% 22.53% 10.94% 10.00% 8.10%
Sylhet 5.30% 4.62% 5.47% 5.07% 4.33% 5.75% 5.40%
Notes to Annex Tables 1.1 and 1.2: Extreme poor HH is defined as HH whose annual per capita consumption expenditure is below the lower poverty line annual per capita consumption expenditure; Moderate poor HH is defined as the HH whose annual per capita consumption expenditure is above the lower poverty line but lower than the upper poverty line annual per capita consumption expenditure; Vulnerable non-poor HH is defined as the HH whose annual per capita consumption expenditure is more than the upper poverty line and less than 1.25times (25% more than) the upper poverty line annual per capita consumption expenditure; Comfortable non-poor HH is defined as the HH whose annual per capita consumption expenditure is more than 1.25times (25% more than) the upper poverty line annual per capita consumption expenditure.
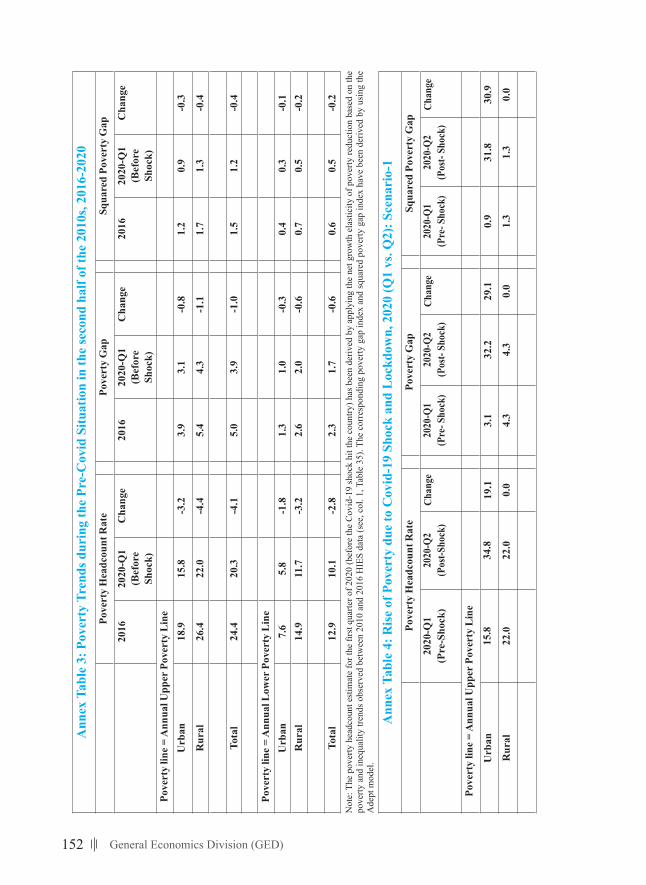
152 General Economics Division (GED)
Ann
ex T
able
3: P
over
ty T
rend
s dur
ing
the
Pre-
Cov
id S
ituat
ion
in th
e se
cond
hal
f of t
he 2
010s
, 201
6-20
20Po
vert
y H
eadc
ount
Rat
ePo
vert
y G
apSq
uare
d Po
vert
y G
ap
2016
2020
-Q1
(Bef
ore
Shoc
k)
Cha
nge
2016
2020
-Q1
(Bef
ore
Shoc
k)
Cha
nge
2016
2020
-Q1
(Bef
ore
Shoc
k)
Cha
nge
Pove
rty
line
= A
nnua
l Upp
er P
over
ty L
ine
Urb
an18
.915
.8-3
.23.
93.
1-0
.81.
20.
9-0
.3
Rur
al26
.422
.0-4
.45.
44.
3-1
.11.
71.
3-0
.4
Tota
l24
.420
.3-4
.15.
03.
9-1
.01.
51.
2-0
.4
Pove
rty
line
= A
nnua
l Low
er P
over
ty L
ine
Urb
an7.
65.
8-1
.81.
31.
0-0
.30.
40.
3-0
.1R
ural
14.9
11.7
-3.2
2.6
2.0
-0.6
0.7
0.5
-0.2
Tota
l12
.910
.1-2
.82.
31.
7-0
.60.
60.
5-0
.2N
ote:
The
pov
erty
hea
dcou
nt e
stim
ate
for t
he fi
rst q
uarte
r of 2
020
(bef
ore
the
Cov
id-1
9 sh
ock
hit t
he c
ount
ry) h
as b
een
deriv
ed b
y ap
plyi
ng th
e ne
t gro
wth
ela
stic
ity o
f pov
erty
redu
ctio
n ba
sed
on th
e po
verty
and
ineq
ualit
y tre
nds o
bser
ved
betw
een
2010
and
201
6 H
IES
data
(see
, col
. 1, T
able
35)
. The
cor
resp
ondi
ng p
over
ty g
ap in
dex
and
squa
red
pove
rty g
ap in
dex
have
bee
n de
rived
by
usin
g th
e A
dept
mod
el.
Ann
ex T
able
4: R
ise
of P
over
ty d
ue to
Cov
id-1
9 Sh
ock
and
Loc
kdow
n, 2
020
(Q1
vs. Q
2): S
cena
rio-
1Po
vert
y H
eadc
ount
Rat
ePo
vert
y G
apSq
uare
d Po
vert
y G
ap
2020
-Q1
(Pre
-Sho
ck)
2020
-Q2
(Pos
t-Sho
ck)
Chan
ge20
20-Q
1(P
re- S
hock
)20
20-Q
2(P
ost-
Shoc
k)Ch
ange
2020
-Q1
(Pre
- Sho
ck)
2020
-Q2
(Pos
t- Sh
ock)
Chan
ge
Pove
rty
line
= A
nnua
l Upp
er P
over
ty L
ine
Urb
an15
.834
.819
.13.
132
.229
.10.
931
.830
.9
Rur
al22
.022
.00.
04.
34.
30.
01.
31.
30.
0
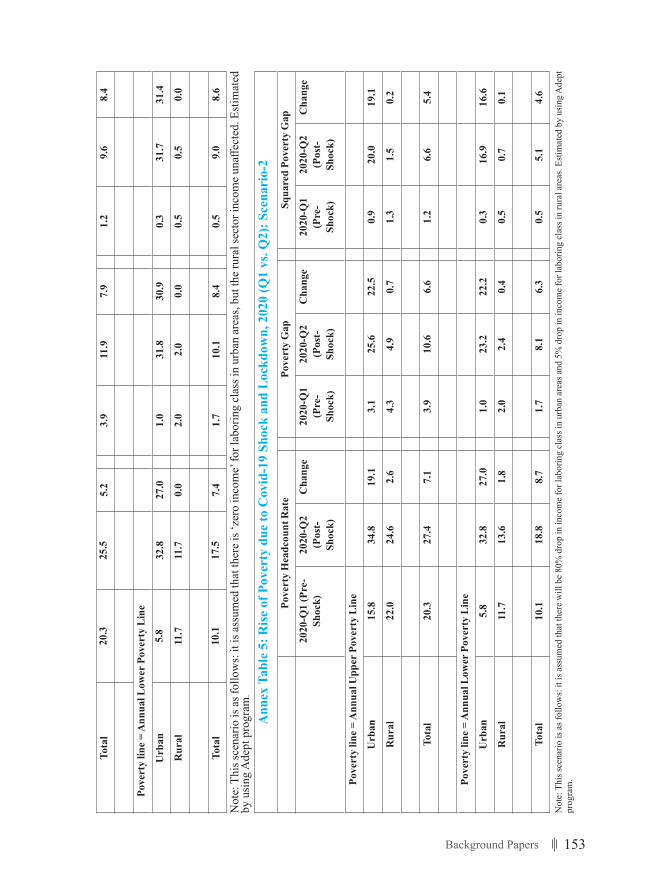
153Background Papers
Tota
l20
.325
.55.
23.
911
.97.
91.
29.
68.
4
Pove
rty
line
= A
nnua
l Low
er P
over
ty L
ine
Urb
an5.
832
.827
.01.
031
.830
.90.
331
.731
.4
Rur
al11
.711
.70.
02.
02.
00.
00.
50.
50.
0
Tota
l10
.117
.57.
41.
710
.18.
40.
59.
08.
6
Not
e: T
his s
cena
rio is
as f
ollo
ws:
it is
ass
umed
that
ther
e is
‘zer
o in
com
e’ fo
r lab
orin
g cl
ass i
n ur
ban
area
s, bu
t the
rura
l sec
tor i
ncom
e un
affec
ted.
Est
imat
ed
by u
sing
Ade
pt p
rogr
am.
Ann
ex T
able
5: R
ise
of P
over
ty d
ue to
Cov
id-1
9 Sh
ock
and
Loc
kdow
n, 2
020
(Q1
vs. Q
2): S
cena
rio-
2Po
vert
y H
eadc
ount
Rat
ePo
vert
y G
apSq
uare
d Po
vert
y G
ap
2020
-Q1
(Pre
- Sh
ock)
2020
-Q2
(Pos
t-
Shoc
k)
Cha
nge
2020
-Q1
(Pre
- Sh
ock)
2020
-Q2
(Pos
t-
Shoc
k)
Cha
nge
2020
-Q1
(Pre
- Sh
ock)
2020
-Q2
(Pos
t-
Shoc
k)
Cha
nge
Pove
rty
line
= A
nnua
l Upp
er P
over
ty L
ine
Urb
an15
.834
.819
.13.
125
.622
.50.
920
.019
.1
Rur
al22
.024
.62.
64.
34.
90.
71.
31.
50.
2
Tota
l20
.327
.47.
13.
910
.66.
61.
26.
65.
4
Pove
rty
line
= A
nnua
l Low
er P
over
ty L
ine
Urb
an5.
832
.827
.01.
023
.222
.20.
316
.916
.6
Rur
al11
.713
.61.
82.
02.
40.
40.
50.
70.
1
Tota
l10
.118
.88.
71.
78.
16.
30.
55.
14.
6
Not
e: T
his s
cena
rio is
as f
ollo
ws:
it is
ass
umed
that
ther
e w
ill b
e 80
% d
rop
in in
com
e fo
r lab
orin
g cl
ass i
n ur
ban
area
s and
5%
dro
p in
inco
me
for l
abor
ing
clas
s in
rura
l are
as. E
stim
ated
by
usin
g A
dept
pr
ogra
m.
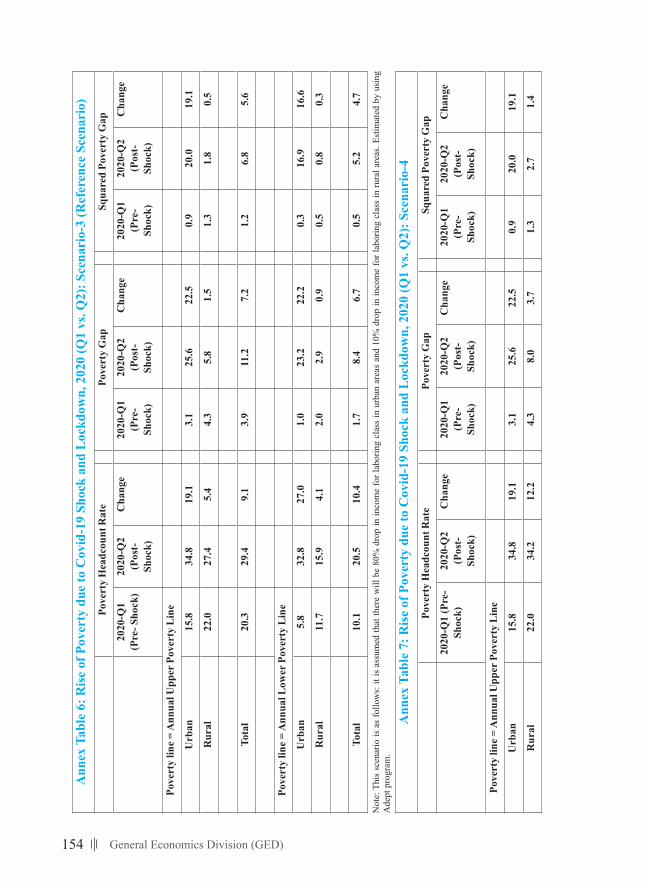
154 General Economics Division (GED)
Ann
ex T
able
6: R
ise
of P
over
ty d
ue to
Cov
id-1
9 Sh
ock
and
Loc
kdow
n, 2
020
(Q1
vs. Q
2): S
cena
rio-
3 (R
efer
ence
Sce
nari
o)Po
vert
y H
eadc
ount
Rat
ePo
vert
y G
apSq
uare
d Po
vert
y G
ap
2020
-Q1
(Pre
- Sho
ck)
2020
-Q2
(Pos
t-
Shoc
k)
Cha
nge
2020
-Q1
(Pre
- Sh
ock)
2020
-Q2
(Pos
t-
Shoc
k)
Cha
nge
2020
-Q1
(Pre
- Sh
ock)
2020
-Q2
(Pos
t-
Shoc
k)
Cha
nge
Pove
rty
line
= A
nnua
l Upp
er P
over
ty L
ine
Urb
an15
.834
.819
.13.
125
.622
.50.
920
.019
.1
Rur
al22
.027
.45.
44.
35.
81.
51.
31.
80.
5
Tota
l20
.329
.49.
13.
911
.27.
21.
26.
85.
6
Pove
rty
line
= A
nnua
l Low
er P
over
ty L
ine
Urb
an5.
832
.827
.01.
023
.222
.20.
316
.916
.6
Rur
al11
.715
.94.
12.
02.
90.
90.
50.
80.
3
Tota
l10
.120
.510
.41.
78.
46.
70.
55.
24.
7
Not
e: T
his
scen
ario
is a
s fo
llow
s: it
is a
ssum
ed th
at th
ere
will
be
80%
dro
p in
inco
me
for l
abor
ing
clas
s in
urb
an a
reas
and
10%
dro
p in
inco
me
for l
abor
ing
clas
s in
rura
l are
as. E
stim
ated
by
usin
g A
dept
pro
gram
.
Ann
ex T
able
7: R
ise
of P
over
ty d
ue to
Cov
id-1
9 Sh
ock
and
Loc
kdow
n, 2
020
(Q1
vs. Q
2): S
cena
rio-
4Po
vert
y H
eadc
ount
Rat
ePo
vert
y G
apSq
uare
d Po
vert
y G
ap
2020
-Q1
(Pre
- Sh
ock)
2020
-Q2
(Pos
t-
Shoc
k)
Cha
nge
2020
-Q1
(Pre
- Sh
ock)
2020
-Q2
(Pos
t-
Shoc
k)
Cha
nge
2020
-Q1
(Pre
- Sh
ock)
2020
-Q2
(Pos
t-
Shoc
k)
Cha
nge
Pove
rty
line
= A
nnua
l Upp
er P
over
ty L
ine
Urb
an15
.834
.819
.13.
125
.622
.50.
920
.019
.1
Rur
al22
.034
.212
.24.
38.
03.
71.
32.
71.
4
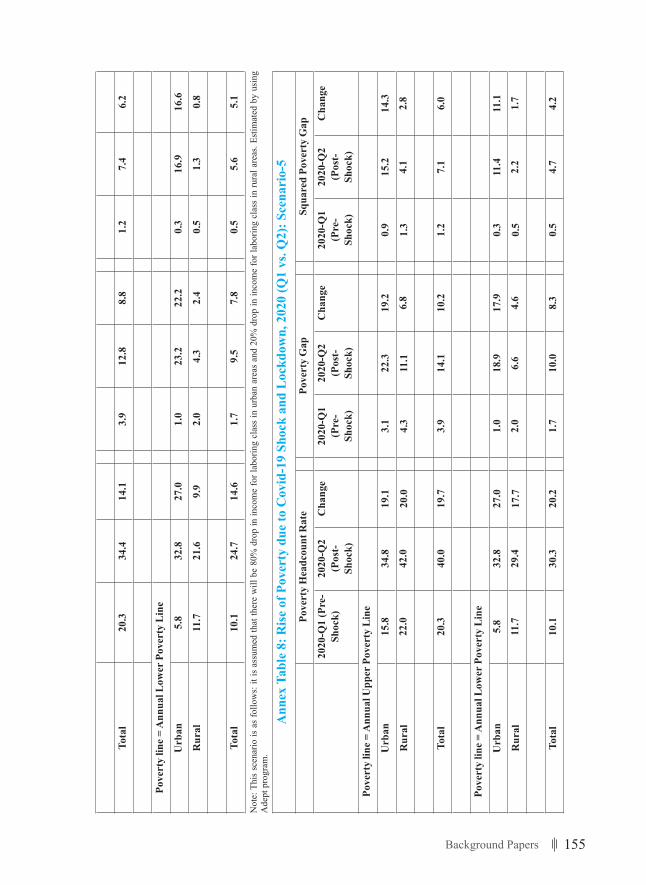
155Background Papers
Tota
l20
.334
.414
.13.
912
.88.
81.
27.
46.
2
Pove
rty
line
= A
nnua
l Low
er P
over
ty L
ine
Urb
an5.
832
.827
.01.
023
.222
.20.
316
.916
.6
Rur
al11
.721
.69.
92.
04.
32.
40.
51.
30.
8
Tota
l10
.124
.714
.61.
79.
57.
80.
55.
65.
1
Not
e: T
his
scen
ario
is a
s fo
llow
s: it
is a
ssum
ed th
at th
ere
will
be
80%
dro
p in
inco
me
for l
abor
ing
clas
s in
urb
an a
reas
and
20%
dro
p in
inco
me
for l
abor
ing
clas
s in
rura
l are
as. E
stim
ated
by
usin
g A
dept
pro
gram
.
Ann
ex T
able
8: R
ise
of P
over
ty d
ue to
Cov
id-1
9 Sh
ock
and
Loc
kdow
n, 2
020
(Q1
vs. Q
2): S
cena
rio-
5Po
vert
y H
eadc
ount
Rat
ePo
vert
y G
apSq
uare
d Po
vert
y G
ap
2020
-Q1
(Pre
- Sh
ock)
2020
-Q2
(Pos
t-
Shoc
k)
Cha
nge
2020
-Q1
(Pre
- Sh
ock)
2020
-Q2
(Pos
t-
Shoc
k)
Cha
nge
2020
-Q1
(Pre
- Sh
ock)
2020
-Q2
(Pos
t-
Shoc
k)
Cha
nge
Pove
rty
line
= A
nnua
l Upp
er P
over
ty L
ine
Urb
an15
.834
.819
.13.
122
.319
.20.
915
.214
.3
Rur
al22
.042
.020
.04.
311
.16.
81.
34.
12.
8
Tota
l20
.340
.019
.73.
914
.110
.21.
27.
16.
0
Pove
rty
line
= A
nnua
l Low
er P
over
ty L
ine
Urb
an5.
832
.827
.01.
018
.917
.90.
311
.411
.1
Rur
al11
.729
.417
.72.
06.
64.
60.
52.
21.
7
Tota
l10
.130
.320
.21.
710
.08.
30.
54.
74.
2
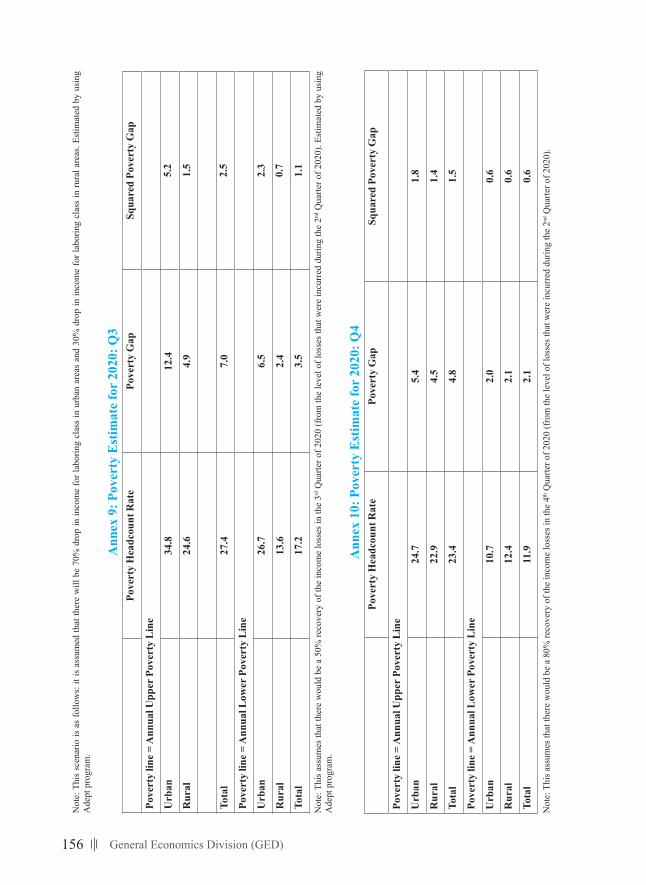
156 General Economics Division (GED)
Not
e: T
his
scen
ario
is a
s fo
llow
s: it
is a
ssum
ed th
at th
ere
will
be
70%
dro
p in
inco
me
for l
abor
ing
clas
s in
urb
an a
reas
and
30%
dro
p in
inco
me
for l
abor
ing
clas
s in
rura
l are
as. E
stim
ated
by
usin
g A
dept
pro
gram
.
Ann
ex 9
: Pov
erty
Est
imat
e fo
r 20
20: Q
3Po
vert
y H
eadc
ount
Rat
ePo
vert
y G
apSq
uare
d Po
vert
y G
ap
Pove
rty
line
= A
nnua
l Upp
er P
over
ty L
ine
Urb
an34
.812
.45.
2
Rur
al24
.64.
91.
5
Tota
l27
.47.
02.
5
Pove
rty
line
= A
nnua
l Low
er P
over
ty L
ine
Urb
an26
.76.
52.
3
Rur
al13
.62.
40.
7
Tota
l17
.23.
51.
1
Not
e: T
his a
ssum
es th
at th
ere
wou
ld b
e a
50%
reco
very
of t
he in
com
e lo
sses
in th
e 3rd
Qua
rter o
f 202
0 (f
rom
the
leve
l of l
osse
s tha
t wer
e in
curr
ed d
urin
g th
e 2nd
Qua
rter o
f 202
0). E
stim
ated
by
usin
g A
dept
pro
gram
.
Ann
ex 1
0: P
over
ty E
stim
ate
for
2020
: Q4
Pove
rty
Hea
dcou
nt R
ate
Pove
rty
Gap
Squa
red
Pove
rty
Gap
Pove
rty
line
= A
nnua
l Upp
er P
over
ty L
ine
Urb
an24
.75.
41.
8
Rur
al22
.94.
51.
4
Tota
l23
.44.
81.
5
Pove
rty
line
= A
nnua
l Low
er P
over
ty L
ine
Urb
an10
.72.
00.
6
Rur
al12
.42.
10.
6
Tota
l11
.92.
10.
6
Not
e: T
his a
ssum
es th
at th
ere
wou
ld b
e a
80%
reco
very
of t
he in
com
e lo
sses
in th
e 4th
Qua
rter o
f 202
0 (f
rom
the
leve
l of l
osse
s tha
t wer
e in
curr
ed d
urin
g th
e 2nd
Qua
rter o
f 202
0).
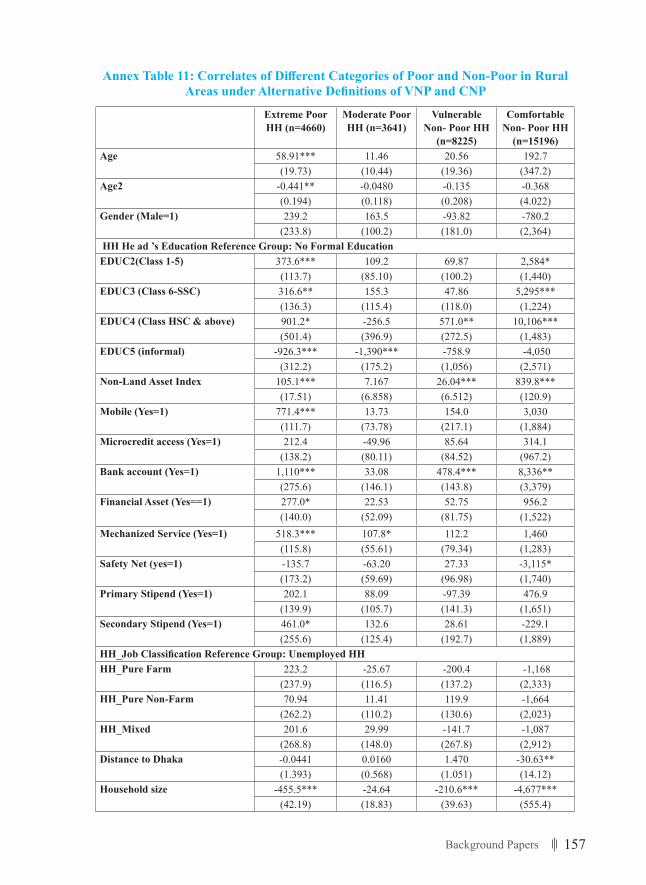
157Background Papers
AnnexTable11:CorrelatesofDifferentCategoriesofPoorandNon-PoorinRuralAreasunderAlternativeDefinitionsofVNPandCNP
Extreme Poor HH (n=4660)
Moderate Poor HH (n=3641)
Vulnerable Non- Poor HH
(n=8225)
Comfortable Non- Poor HH
(n=15196)Age 58.91*** 11.46 20.56 192.7
(19.73) (10.44) (19.36) (347.2)Age2 -0.441** -0.0480 -0.135 -0.368
(0.194) (0.118) (0.208) (4.022)Gender (Male=1) 239.2 163.5 -93.82 -780.2
(233.8) (100.2) (181.0) (2,364) HH He ad ’s Education Reference Group: No Formal EducationEDUC2(Class 1-5) 373.6*** 109.2 69.87 2,584*
(113.7) (85.10) (100.2) (1,440)EDUC3 (Class 6-SSC) 316.6** 155.3 47.86 5,295***
(136.3) (115.4) (118.0) (1,224)EDUC4(ClassHSC&above) 901.2* -256.5 571.0** 10,106***
(501.4) (396.9) (272.5) (1,483)EDUC5 (informal) -926.3*** -1,390*** -758.9 -4,050
(312.2) (175.2) (1,056) (2,571)Non-Land Asset Index 105.1*** 7.167 26.04*** 839.8***
(17.51) (6.858) (6.512) (120.9)Mobile (Yes=1) 771.4*** 13.73 154.0 3,030
(111.7) (73.78) (217.1) (1,884)Microcredit access (Yes=1) 212.4 -49.96 85.64 314.1
(138.2) (80.11) (84.52) (967.2)Bank account (Yes=1) 1,110*** 33.08 478.4*** 8,336**
(275.6) (146.1) (143.8) (3,379)Financial Asset (Yes==1) 277.0* 22.53 52.75 956.2
(140.0) (52.09) (81.75) (1,522)Mechanized Service (Yes=1) 518.3*** 107.8* 112.2 1,460
(115.8) (55.61) (79.34) (1,283)Safety Net (yes=1) -135.7 -63.20 27.33 -3,115*
(173.2) (59.69) (96.98) (1,740)Primary Stipend (Yes=1) 202.1 88.09 -97.39 476.9
(139.9) (105.7) (141.3) (1,651)Secondary Stipend (Yes=1) 461.0* 132.6 28.61 -229.1
(255.6) (125.4) (192.7) (1,889)HH_JobClassificationReferenceGroup:UnemployedHHHH_Pure Farm 223.2 -25.67 -200.4 -1,168
(237.9) (116.5) (137.2) (2,333)HH_Pure Non-Farm 70.94 11.41 119.9 -1,664
(262.2) (110.2) (130.6) (2,023)HH_Mixed 201.6 29.99 -141.7 -1,087
(268.8) (148.0) (267.8) (2,912)Distance to Dhaka -0.0441 0.0160 1.470 -30.63**
(1.393) (0.568) (1.051) (14.12)Household size -455.5*** -24.64 -210.6*** -4,677***
(42.19) (18.83) (39.63) (555.4)
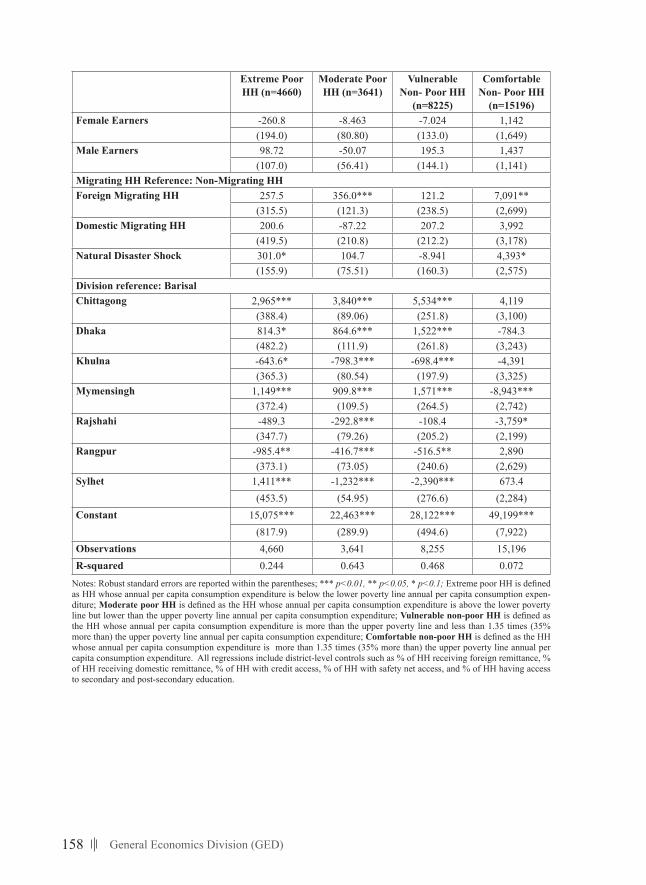
158 General Economics Division (GED)
Extreme Poor HH (n=4660)
Moderate Poor HH (n=3641)
Vulnerable Non- Poor HH
(n=8225)
Comfortable Non- Poor HH
(n=15196)Female Earners -260.8 -8.463 -7.024 1,142
(194.0) (80.80) (133.0) (1,649)Male Earners 98.72 -50.07 195.3 1,437
(107.0) (56.41) (144.1) (1,141)Migrating HH Reference: Non-Migrating HHForeign Migrating HH 257.5 356.0*** 121.2 7,091**
(315.5) (121.3) (238.5) (2,699)Domestic Migrating HH 200.6 -87.22 207.2 3,992
(419.5) (210.8) (212.2) (3,178)Natural Disaster Shock 301.0* 104.7 -8.941 4,393*
(155.9) (75.51) (160.3) (2,575)Division reference: BarisalChittagong 2,965*** 3,840*** 5,534*** 4,119
(388.4) (89.06) (251.8) (3,100)Dhaka 814.3* 864.6*** 1,522*** -784.3
(482.2) (111.9) (261.8) (3,243)Khulna -643.6* -798.3*** -698.4*** -4,391
(365.3) (80.54) (197.9) (3,325)Mymensingh 1,149*** 909.8*** 1,571*** -8,943***
(372.4) (109.5) (264.5) (2,742)Rajshahi -489.3 -292.8*** -108.4 -3,759*
(347.7) (79.26) (205.2) (2,199)Rangpur -985.4** -416.7*** -516.5** 2,890
(373.1) (73.05) (240.6) (2,629)Sylhet 1,411*** -1,232*** -2,390*** 673.4
(453.5) (54.95) (276.6) (2,284)Constant 15,075*** 22,463*** 28,122*** 49,199***
(817.9) (289.9) (494.6) (7,922)Observations 4,660 3,641 8,255 15,196R-squared 0.244 0.643 0.468 0.072
Notes: Robust standard errors are reported within the parentheses; *** p<0.01, ** p<0.05, * p<0.1; Extreme poor HH is defined as HH whose annual per capita consumption expenditure is below the lower poverty line annual per capita consumption expen-diture; Moderate poor HH is defined as the HH whose annual per capita consumption expenditure is above the lower poverty line but lower than the upper poverty line annual per capita consumption expenditure; Vulnerable non-poor HH is defined as the HH whose annual per capita consumption expenditure is more than the upper poverty line and less than 1.35 times (35% more than) the upper poverty line annual per capita consumption expenditure; Comfortable non-poor HH is defined as the HH whose annual per capita consumption expenditure is more than 1.35 times (35% more than) the upper poverty line annual per capita consumption expenditure. All regressions include district-level controls such as % of HH receiving foreign remittance, % of HH receiving domestic remittance, % of HH with credit access, % of HH with safety net access, and % of HH having access to secondary and post-secondary education.
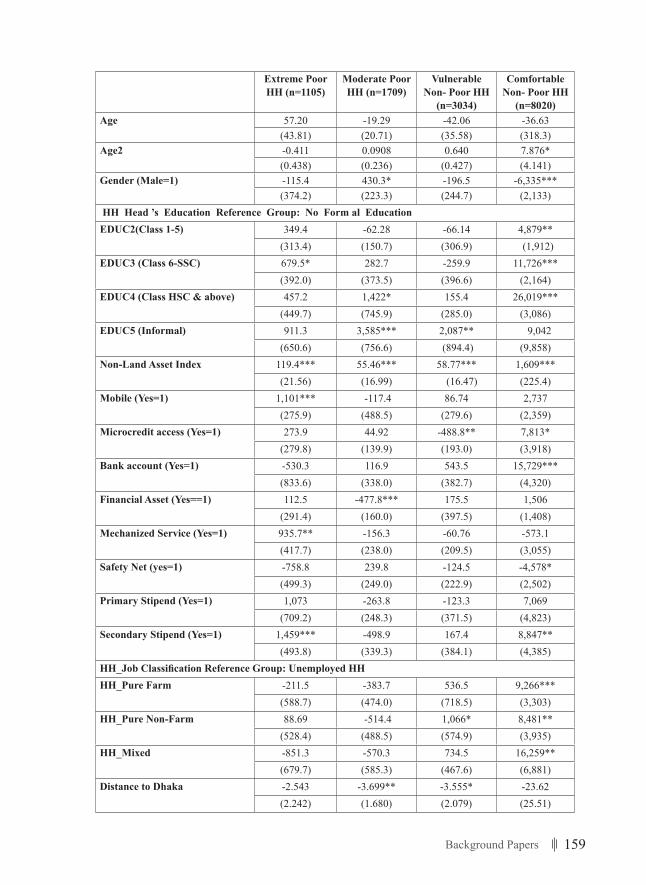
159Background Papers
Extreme Poor HH (n=1105)
Moderate Poor HH (n=1709)
Vulnerable Non- Poor HH
(n=3034)
Comfortable Non- Poor HH
(n=8020)Age 57.20 -19.29 -42.06 -36.63
(43.81) (20.71) (35.58) (318.3)Age2 -0.411 0.0908 0.640 7.876*
(0.438) (0.236) (0.427) (4.141)Gender (Male=1) -115.4 430.3* -196.5 -6,335***
(374.2) (223.3) (244.7) (2,133) HH Head ’s Education Reference Group: No Form al EducationEDUC2(Class 1-5) 349.4 -62.28 -66.14 4,879**
(313.4) (150.7) (306.9) (1,912)EDUC3 (Class 6-SSC) 679.5* 282.7 -259.9 11,726***
(392.0) (373.5) (396.6) (2,164)EDUC4(ClassHSC&above) 457.2 1,422* 155.4 26,019***
(449.7) (745.9) (285.0) (3,086)EDUC5 (Informal) 911.3 3,585*** 2,087** 9,042
(650.6) (756.6) (894.4) (9,858)Non-Land Asset Index 119.4*** 55.46*** 58.77*** 1,609***
(21.56) (16.99) (16.47) (225.4)Mobile (Yes=1) 1,101*** -117.4 86.74 2,737
(275.9) (488.5) (279.6) (2,359)Microcredit access (Yes=1) 273.9 44.92 -488.8** 7,813*
(279.8) (139.9) (193.0) (3,918)Bank account (Yes=1) -530.3 116.9 543.5 15,729***
(833.6) (338.0) (382.7) (4,320)Financial Asset (Yes==1) 112.5 -477.8*** 175.5 1,506
(291.4) (160.0) (397.5) (1,408)Mechanized Service (Yes=1) 935.7** -156.3 -60.76 -573.1
(417.7) (238.0) (209.5) (3,055)Safety Net (yes=1) -758.8 239.8 -124.5 -4,578*
(499.3) (249.0) (222.9) (2,502)Primary Stipend (Yes=1) 1,073 -263.8 -123.3 7,069
(709.2) (248.3) (371.5) (4,823)Secondary Stipend (Yes=1) 1,459*** -498.9 167.4 8,847**
(493.8) (339.3) (384.1) (4,385)HH_JobClassificationReferenceGroup:UnemployedHHHH_Pure Farm -211.5 -383.7 536.5 9,266***
(588.7) (474.0) (718.5) (3,303)HH_Pure Non-Farm 88.69 -514.4 1,066* 8,481**
(528.4) (488.5) (574.9) (3,935)HH_Mixed -851.3 -570.3 734.5 16,259**
(679.7) (585.3) (467.6) (6,881)Distance to Dhaka -2.543 -3.699** -3.555* -23.62
(2.242) (1.680) (2.079) (25.51)
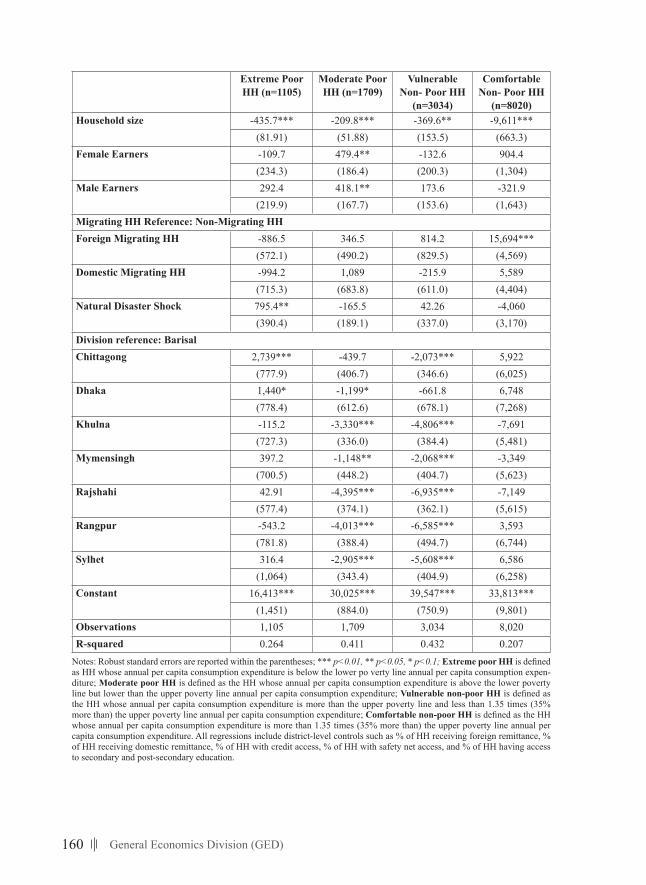
160 General Economics Division (GED)
Extreme Poor HH (n=1105)
Moderate Poor HH (n=1709)
Vulnerable Non- Poor HH
(n=3034)
Comfortable Non- Poor HH
(n=8020)Household size -435.7*** -209.8*** -369.6** -9,611***
(81.91) (51.88) (153.5) (663.3)Female Earners -109.7 479.4** -132.6 904.4
(234.3) (186.4) (200.3) (1,304)Male Earners 292.4 418.1** 173.6 -321.9
(219.9) (167.7) (153.6) (1,643)Migrating HH Reference: Non-Migrating HHForeign Migrating HH -886.5 346.5 814.2 15,694***
(572.1) (490.2) (829.5) (4,569)Domestic Migrating HH -994.2 1,089 -215.9 5,589
(715.3) (683.8) (611.0) (4,404)Natural Disaster Shock 795.4** -165.5 42.26 -4,060
(390.4) (189.1) (337.0) (3,170)Division reference: BarisalChittagong 2,739*** -439.7 -2,073*** 5,922
(777.9) (406.7) (346.6) (6,025)Dhaka 1,440* -1,199* -661.8 6,748
(778.4) (612.6) (678.1) (7,268)Khulna -115.2 -3,330*** -4,806*** -7,691
(727.3) (336.0) (384.4) (5,481)Mymensingh 397.2 -1,148** -2,068*** -3,349
(700.5) (448.2) (404.7) (5,623)Rajshahi 42.91 -4,395*** -6,935*** -7,149
(577.4) (374.1) (362.1) (5,615)Rangpur -543.2 -4,013*** -6,585*** 3,593
(781.8) (388.4) (494.7) (6,744)Sylhet 316.4 -2,905*** -5,608*** 6,586
(1,064) (343.4) (404.9) (6,258)Constant 16,413*** 30,025*** 39,547*** 33,813***
(1,451) (884.0) (750.9) (9,801)Observations 1,105 1,709 3,034 8,020R-squared 0.264 0.411 0.432 0.207
Notes: Robust standard errors are reported within the parentheses; *** p<0.01, ** p<0.05, * p<0.1; Extreme poor HH is defined as HH whose annual per capita consumption expenditure is below the lower po verty line annual per capita consumption expen-diture; Moderate poor HH is defined as the HH whose annual per capita consumption expenditure is above the lower poverty line but lower than the upper poverty line annual per capita consumption expenditure; Vulnerable non-poor HH is defined as the HH whose annual per capita consumption expenditure is more than the upper poverty line and less than 1.35 times (35% more than) the upper poverty line annual per capita consumption expenditure; Comfortable non-poor HH is defined as the HH whose annual per capita consumption expenditure is more than 1.35 times (35% more than) the upper poverty line annual per capita consumption expenditure. All regressions include district-level controls such as % of HH receiving foreign remittance, % of HH receiving domestic remittance, % of HH with credit access, % of HH with safety net access, and % of HH having access to secondary and post-secondary education.
161Background Papers
Study 14:Excluded and Marginalized Communities of
Bangladesh
Philip Gain*
* Director, Society for Environment and Human Development (SEHD)

162 General Economics Division (GED)
163Background Papers
1. Background to social exclusion and marginalization in Bangladesh
Excluded communities constitute a significant percentage in the hugely Bangalee-majority Bangladesh, a country of 162.7 million people in 2017 (BBS 2018). Those excluded, socially and economically in particular, and discriminated against, for their identity, captive situation, occupations, casteism, culture, geographical locations, and various other reasons, come from among both religious and ethnic minorities and the majority communities. Many of them live on the fringes of the country deprived of equal opportunities and facing wide-ranging social, economic and political problems.
These communities are diverse in ethnic, religious and occupational identities and fulfil many of the criteria of being ‘socially excluded’ spoken and initiated by René Lenoir and Silver (1995). According to René in France “Mentally and physically handicapped, suicidal people, aged invalids, abused children, substance abusers, delinquents, single parents, multi-problem households, marginal, asocial persons, and other social ‘misfits’ are ‘socially excluded’’’ who include 10 per cent of the French population (Sen 2004: 1). We get a broader sense of exclusion from Silver (1995). His contention is the excluded must include those who are deprived of
‘a livelihood; secure, permanent employment; earnings; property, credit, or land; housing; minimal or prevailing consumption levels; education, skills, and cultural capital; the welfare state; citizenship and legal equality; democratic participation; public goods; the nation or dominant race; family and sociability; humanity; respect, fulfilment and understanding.’ (Sen, 2004: 1)
If we see through these features of exclusion that may not yet be comprehensive in the context of Bangladesh, we get a good map of the excluded groups discussed in this paper. Exclusion has serious effects in the lives of those excluded, as illustrated by Amartya Sen in his paper on social exclusion:
‘being excluded from social relations can lead to other deprivations as well, thereby further limiting our living conditions. For example, being excluded from the opportunity to be employed or to receive credit may lead to economic impoverishment that may, in turn, lead to other deprivations (such as malnourishment or homelessness). Social exclusion can, thus, be constitutively a part of capability deprivation as well as instrumentally a cause of diverse capability failures. (Sen 2004: 6)’
Bangladesh has made commendable achievements in addressing the challenges of poverty, which has declined to 20.5% in 2018-19 and extreme poverty, which has declined to 10.5% during the same period (Poverty and Extreme Poverty Rate of Bangladesh, BBS 2018-19). The size of poor and extreme poor is still quite large. Poverty and extreme poverty, therefore, remain to be a big challenge for the society, the state, and the development actors. Such level of impoverishment and also disadvantages and marginalization that are multi-dimensional reality, can somewhat be linked to exclusion and political alienation.
The marginal and excluded people among the citizens of Bangladesh include different communities who are victims of casteism, ethnic minority groups, tea plantation workers and their communities, Bede, Bihari, sex workers, bisexual or transgenders (Hijra), Kaiputra (Kawra), Jaladas (a seafaring fishing community living in the coasts of Cox’s Bazar and Chattogram) and other smaller excluded communities.1 The people of all these
164 General Economics Division (GED)
ethnic identities and occupational groups are at risks of being excluded because they do not equally enjoy their legitimate rights that other citizens do. The people who are excluded and marginalized face triple challenges of poverty, vulnerability and exclusion in terms of leading normal life, secure permanent jobs, income, resources, access to loans, housing, education, skills, cultural capital, welfare state, citizenship and equal rights in the eyes of law, democratic participation, human treatment and dignity.
It is in this context that the excluded groups of Bangladesh can be clustered in two broad lines—one in terms of ethnicity and religion; and the other in terms of disadvantages and alienation from social relations. There are groups that fall in both categories; examples of such groups are Harijans, Rishi (cobblers), tea plantation workers in captive or ‘tied’ situation, and the Hijra. Distinction also exists among disadvantaged groups in terms of social and political space. For example, the ethnic communities in the Chittagong Hill Tracts (CHT) and ethnic groups such as the Garos in the north-central plains are not at least socially excluded in the areas of their concentration. However, among the ethnic minorities, the smaller ones (Mru, Chak, Khumi, Khyang, etc., in the CHT; Koch, Hajong, Mahle, Buna, Cora, Koda, Kol, Paharia, etc., in the plains; and those in the tea estates) find themselves deprived and socially excluded among their own ethnic and religious communities.
This paper aims at providing a map of these excluded groups and examine the factors leading to exclusion and its effects, which are basically the discriminations, deprivation, and poverty they face. It also looks into actions the government has taken so far and can take to resolve the difficulties and problems that the excluded groups face, progress made so far and what the government and development partners can do to include the excluded in development, political and democratic processes.
True, these people are poor, deprived and many are social outcasts or ‘untouchables’ but what should not be forgotten is that they are our fellow human beings who also have skills, strengths, culture, languages and lots of fun in their lives. So I have deliberately avoided using the term ‘Dalit’, which means people crushed. This background paper would also try to analyse and offer insights into the identities of these deprived people, state of their social dignity, the political protection they require and how their rights and access to Social Safety Net Programmes (SSNPs) and other opportunities can be guaranteed.
2. Who are the excluded, social outcasts and marginalized communities of Bangladesh?
The following communities are considered excluded, outcasts, marginalized and disadvantaged for their ethnic identity, caste, occupations, allegiance and dislocation. The list of these communities seen in table 1 has been prepared in consultations with the state and non-state actors and organizations including BBS for nearly two decades and reviewing all available literature.
2.1 Khudra Nri-goshthi or small ethnic groups of the plains
Khudra Nri-goshthi or small ethnic groups or ethnic minorities can be categorized as distinct and merged ethno-occupational groups. Examples of distinct [with clear identi-fication] ethnic communities are 11 communities that inhabit the Chittagong Hill Tracts (CHT)—Chakma, Marma, Tripura, Lushai, Bawm, Pangkho [also spelled as Pangkhua
165Background Papers
or Pangkhu], Mro, Khumi, Chak, Khyang, Tangchangya, and Rakhine in Cox’s Bazar. Examples of distinct ethnic communities of the plains are: Santal, Oraon, Khasi, Garo, Ha-jong, and Monipuri. The constitution of Bangladesh identifies them as tribals, small ethnic groups, and ethnic groups or communities.
According to the Khudra Nri-gosthi Sangskritik Pratisthan Ain, 2010 (The Small Ethnic Groups Cultural Institution Act 2010), their number was 27 (including three duplications—Marma and Mong who are the same people, Tripura, Usai or Usui belonging to the same group and Malpahari and Pahari are also the same group). The act last updated through a gazette notification published on 23 March 2019 has refreshed the list of the small ethnic groups (Nri-goshthi) and according to the new list, the number stands at 50 (11 in the CHT and 39 in the plains. According to the revised list, the small ethnic groups in the government list are: Bormon, Dalu, Garo, Hajong, Khasi, Koch, Kol, Monipuri, Munda, Oraon, Pahari/Malpahari (Paharia), Rakhine, Santal, Bagdi/Bakti, Banai, Baraik/Boraik, Bhuimali, Kharia (only in tea gardens), Bhumij, Ganju, Gorait, Hodi, Kondo (only in tea gardens), Kora, Lohar (only in tea gardens), Mahali/Mahle, Mahato/Kurmi Mahato/Bedia Mahato, Malo/Ghashi Malo, Mushohor, Patro, Rajwar, Shabor, Teli, Turi, Gurkha, Bedia, Ho, Bhil and Kharwar/Kherwar.
According to independent research findings there are a good number of small ethnic groups in the plains not included in the government list. These groups are: Bhuiya, Bindumondol, Buna, Chowhan, Ghatual/Ghatuar, Hajra, Hari, Kadar, Kairi, Kalwar, Karmokar, Koda, Modok, Noonia, Pal (also known as Kumar), Rajbhar, Rajbongshi, Robidas, and Tanti. Besides, there is a community that identified itself as Kshatriya. There is a strong indication that one-third of around 650,000 Kshatriyas in nine districts in the Northwest—Bogura, Lalmonirhat, Panchagarh, Nilphamari, Thakurgaon, Kurigram, Joypurhat, Dinajpur and Sirajganj—are Koch.2
According to 2011 population census the population of 27 ethnic communities stood at 1,586,141 which was 1.1% of the population back then. Of them ethnic population of the CHT was 845,541 and the ethnic population in the plains land was 740,600 (Moral, 31 August 2013, Prothom Alo). The revised list has listed 50 ethnic communities with no change in number in the CHT, which means the number of the ethnic communities has more than doubled. There is no government statistics on communities added to the official list.
2.2 Tea workers and their communities
There are 162 tea gardens in Bangladesh (excluding those in Panchagarh where tea cultivation started only recently). These tea gardens are located on 113,663.87 ha of government land granted for production of tea (Bangladesh Tea Board, 2015). The tea industry is very different from other industries. The production process of tea involves agriculture and industry. The majority of around 122,000 tea plantation workers and their total population of around 450,000 are non-Bangalee. The British companies brought them from Bihar, Madras, Orissa, Andhra Pradesh, Madhya Pradesh, West Bengal, Uttar Pradesh and other places in India to work in the tea gardens in Sylhet region. The misfortune of these indentured labourers started with their journey to the tea gardens. To the majority people of Bangladesh, they remain elusive. Deprived, exploited and alienated, the majority of the tea workers live an inferior life.
166 General Economics Division (GED)
What is unique about the tea workers and their communities is that their occupation and alienation from the Bangalee majority give them a common identity as tea workers. During the British period and subsequently they were also known as coolies, which indicates they are social outcasts. But the reality is that they belong to many ethnic and caste identities—as many as 80—as has been mapped by Society for Environment and Human Development (SEHD). SEHD found these 80 communities in 156 tea gardens [operational at the time of the survey during the period from 2014 to 2016] in Sylhet, Habiganj, Moulvibazar, Chattogram, and Rangamati districts.3 The government list of ethnic communities includes 23 of these communities.
The communities in the tea gardens are: Almik, Bagdi/Bakti, Baraik/Boraik, Barma, Bashphor, Bauri, Been, Bhar, Bhokta, Bhuiya, Bhumij, Bihari, Bunerjee, Chasha, Chatri, Dusad, Garo, Ghatuar, Giri, Goala, Ganju, Gorait, Goswami, Gour, Goyashur (They are also known as Ashur), Hajra, Jhora, Kahar, Kairi, Kalindi, Kalwar, Kanu, Karmokar, Keot, Kharia, Khodal, Kol, Kondo, Kora, Kumar, Kurmi, Lohar, Mandraji, Mahle/Mahali, Majhi, Mal, Marma, Monipuri, Mridha, Munda, Mushohor, Naidu, Nayek, Nepali, Noonia, Oraon (also spelt Orang), Painka, Pashi, Jainta Patro, Phulmali, Pandit, Pradhan, Rajballobh, Rajbhar, Rajbongshi, Rajgor, Rajwar, Rautia, Reli, Robidas, Sadhu, Santal, Shabor, Sheel, Suklaboiddyo, Shobdokar, Tanti, Teli (also known as Pal), Tongla, Tripura, Patro (also outside of tea gardens) and Shobdokar (also outside tea gardens). One may be confused about such a great number of communities in the tea gardens. An interpretation is therefore required here. For instance, the one who bears the identity, Kairi, is neither Almik nor Bangalee. The Kairi community people claim that they have a distinct ethnic identity.
2.3 Harijan
Harijan is an occupational group or community. They are traditionally known as sweepers and many of them consider themselves as social outcasts or ‘Dalit’. The term, ‘Dalit’ is used to define the status of those who are outside the four varnas, which means they belong to the so-called fifth category in the Hindu casteism. They are untouchables even to the Shudras. They are the most neglected in society and they are the most deprived of all social privileges. The members of the Harijan community work as cleaners in the cities and pourashavas (municipalities) all over the country except for three districts of Chittagong Hill Tracts (CHT). According to Bangladesh Horijan Yokkha Parishad, an organization of the community the Harijan population is estimated between one and 1.5 million, which, according to Asaduzzaman, A. (2001) in his book, The ‘Pariah’ People–An Ethnography of the Urban Sweepers in Bangladesh is around one hundred thousand (Asaduzzaman 2001). Power and Participation Research Centre (PPRC) took lead in a study of the Harijan in 46 of the most populous and well-known Harijan or ‘sweeper’ colonies in 37 districts of the country. A total 39,017 Harijans occupy these colonies, who belong to 6,103 families. What appears from the PPRC study, field investigations and different sources is that the Harijan population working as sweepers in cities and living in colonies will be around one hundred thousand, which supports Asaduzzaman’s estimate.
The members of the Harijan communities were brought to what is now Bangladesh from India’s Odisha, Bihar and Uttar Pradesh regions during the British colonial period. They were enticed to come to a prosperous region (the then East Bengal or current Bangladesh) to be provided with good jobs, better living space and healthcare services. But, instead, they were engaged in removing household wastes and cleaning activities. It has been
167Background Papers
their main occupation for more than 200 years now. There are similarities between the arrival history of the Harijan community and tea plantation workers in Bangladesh. The British brought the tea plantation workers to this country to engage them in work in tea gardens. The Harijans are one of the most marginal communities who are afflicted with a variety of social and economic problems. They are considered untouchables not only to upper class Hindus but also to others. Although they remain engaged in cleaning the cities from the morning till the evening, their own shelters are the unhygienic sweeper colonies. There is hardly any Harijan family that owns land. They live on government land. Due to poverty and social stigma, they cannot buy land, even if they want to. They have worked as cleaners in cities for generations but they are deprived of many basic rights guaranteed by the constitution.
There are mainly eight gotros or sub-groups among the Harijans—Hela, Domar, Hari, Bashfore, Rauth, Balmiki, Lalbegi, and Dom (who traditionally cremate dead bodies and work in morgues). They also use the names of their gotros as their surnames. Some other titles used by Harijans are Robidas, Pashi, Goala, Rao, Bowali and Telku.
2.4 Bede (water gypsy)
The Bede is a Muslim gypsy (floating) community of Bangladesh. They travel from one place to another to earn a living for 10 to 11 months of the year and gather in 75 locations of the country to meet their families and other community members for one to two months. The estimated Bede population in Bangladesh is around 500,000 and around 5,000 caravans (groups) of Bede move from one place to another. However, the government estimate of the Bede population is much lower—75,702 (DSS 2020).
There are different occupational sub-groups or gotro among the Bedes. Such sub-groups include Mirshikari or traditional quakes (the ones who are engaged in exorcism and sell amulet), Sapure (who catch and sell snake), kurindar or jhai (who search lost items or gold from rivers and canals), bajigar (magicians), sandar (hawkers who sell bracelet, necklace, and cosmetic items from door to door), tela or toila (who perform games with animals), borial (fishermen), dhawa (lock pickers) and Gyne (who fix umbrellas, sells spices, etc.).
The Bedes in general are very poor and the rate of literacy among them is very low as well. Most of them are landless and many live on khas (public) land and in tents. They hardly have access to healthcare services and other government benefits including Social Safety Net Programmes (SSNPs). Due to lack of education, there is a trend of early marriage among the Bedes and superstition is common among them. It was only in 2007 that the Bedes who live on boats or keep roaming around the country got the right to vote in places of their choice.
An unique feature of the Bede community has been exposed in a research finds of PPRC—71.64% of the Bede population are female and minors (children 41.99%) and 28.36% male. A shocking 70.05% of the Bede are completely illiterate. The research also finds that most of the Bede families (62.54 per cent) live in tents. However, nowadays, about 27.29% of them live in houses made up of corrugated iron sheet. When only one percent of people in Bangladesh defecate in the open spaces (WHO/UNICEF 2016), 62.27% Bede families have no access to latrines; they defecate in drains, open spaces or water bodies.
168 General Economics Division (GED)
2.5 Sex workers and transgenders
The sex workers are foremost among the social outcasts in Bangladesh and socially most marginal community cut off from social relations. They are identified in many derogatory terms and their work is not recognized as an occupation and therefore they are deprived of many citizen’s rights and social protection. It is for their occupation that they cannot move freely in society and they face social oppression of various kinds.
A survey that SEHD carried out in 2018 found 3,721 female sex workers (FSWs) working in 11 brothels in Tangail, Jamalpur, Mymensingh, Faridpur, Rajbari, Jashore, Bagerhat and Patuakhali districts. However, the total number of FSWs is much bigger in the country—around 93,000. According to Ministry of Health and Family Welfare of Government of Bangladesh (2016) of these FSWs, 36,593 are based in the streets, 36,539 in residences and 15,960 in hotels. There is also an estimated 119,869 MSM (men who have sex with men) including transgender (TG)/Hijra (approximately 10,000). In a survey of the Ministry of Health and Family Welfare, Save the Children, and Joint United Nations Programme on HIV and AIDS on HIV and AIDS (UNAIDS) Bangladesh (2016) the large percentage of the TG/hijra (77.7%) identified themselves as sex workers.
The behavioural survey (2016) among the FSWs conducted by the Ministry of Health and Family Welfare, Save The Children and UNAIDS Bangladesh reveals that about 17.4% of the FSWs are aged 10-19 years, 35.4% are aged 20-24 years and the rest 47.2% are aged 25 years and above.
Another survey conducted by Society for Environment and Human Development (SEHD) in 2017-2018 reveals that 73.33% of the respondents had been sold or dragged into this occupation by touts or intermediaries (dalal), 24.44% entered voluntarily and only 2.22% were born in the brothels. The same survey finds that 94.07% of the respondents have faced various kinds of torture such as rape, gang rape, abduction, and physical torture of various types.
Abortion and other diseases pose serious health risks for the sex workers. The survey of Ministry of Health and Family Welfare, Save the Children, and UNAIDS Bangladesh finds that half (48.0%) of the FSWs have contracted vaginal discharge in the last 12 months. About 43.7% of them also reported abdominal discharge with bad smell and another 19.6% reported genital ulcer/sore.
Economic and living conditions are among two major concerns of the brothel-based sex workers. The SEHD survey finds 422 houses in 11 brothels with 4,386 rooms. The sex workers pay room rent every day. Except for the case of Mymensingh, the daily rent of a 100 square-feet room ranges between Taka 100 and 300. In Mymensingh, the daily rent of such a room is Taka 1,000 or more. A sex worker has to serve many clients, which means she undergoes severe physical stress to earn the money required to pay rent and meeting other expenses. Another feature of the Mymensingh brothel is that it has 72 liquor shops. In all 11 brothels there are 124 liquor shops.
In Mymensingh, a sex worker earns between Taka 30,000 and Taka 60,000 a month, the highest level of income by a sex worker in brothels. The lowest level of income was found in Bagerhat where a sex worker earns between Taka 15,000 and Taka 20,000 a month. Whatever may be their income level, the sex workers hardly have savings at the end of the month.
169Background Papers
Once a girl or a woman enters a brothel or sex work she has no way out in general and she becomes a modern day slave. Although the income of the sex workers looks better than industrial workers, their spending is so high that they have no savings. Importantly, their living condition is appalling.
2.6 Kaiputra/Kawra (pig-rearing community)
Also known as Kawra, this community with a guesstimated population of 12,000 are despised in the society because they rear pigs, an animal ‘filthy’ to the Muslim majority. To most other people in society, they are considered untouchables. The Kaiputras, belonging to Hindu religion, live mostly in southwestern districts of Jashore, Satkhira and Khulna.
SEHD carried out a detailed survey on the Kaiputra in 2017-2018. The survey finds that living in 41 southwestern villages, these people are engaged in traditional occupation, i.e. rearing pigs in the open fields. There are another 29 villages with Kaiputra concentration but they changed their occupation and stopped rearing pigs in the open. Such villages in Satkhira have turned into fishing villages. Because the neighbours neglect the Kaiputra, they try to hide their identity.
Those who rear pigs in the open fields are known as rakhals (shepherds) and they certainly belong to the Kaiputra community, no matter wherever in Bangladesh they are seen with herds of pigs and whether owners are inhabitants of Kaiputra villages or not. The rakhals are engaged in feeding the herds of pigs, an occupation that poses very challenging work condition. They must live with rains and cold weather, under the scorching sun and in the open fields to feed the pigs. The pigs normally eat wild grasses, roots of plants, gerh (roots of a sort of arum) and insects. The pigs feed on these wildly grown foods from dawn to dusk (12 to 14 hours). But the rakhals get time to eat once every 12 hours. They walk all day along with their herd of pigs [with a population from 200 to 500 or even more] and at night they set up tents for sleeping. To look after the pigs so that none is lost, the rakhals guard their herd all night by rotation. The rakhals face many other difficulties when keeping their herd of pigs. Almost all rakhals have reported falling victims to robbery, harassment by local musclemen and insult by the land owners, more than once during their lifetime.
In order to run the pig rearing business, the herd owners need a lot of cash but they are deprived of access to bank loans.
2.7 Rishi
Historically the Rishis of Bengal are cobblers, leather workers and instrumentalists for generations. They are identified as Muchi, Chamar and Charmokar. These words are derogatory to the Rishis. In Bangla language, the words Muchi, Chamar and Charmokar mean the persons engaged in preparing hides and making and repairing shoes. The people of this ‘untouchable’ community mostly live in India’s Uttar Pradesh, Maddhya Pradesh and Bihar regions. They are one of the repressed or ‘Dalit’ communities among the Hindus in India. The key message of the caste-based labour or division-based caste system is that the Brahmins are the purest ones while ‘Dalits’ are profane or polluted (Cosimo Zene 2002).
However, many people including Rishis identify themselves with an extreme political word ‘Dalit’, which actually means exploited, downtrodden or crushed. The word ‘Dalit’ also
170 General Economics Division (GED)
means social exploitation, subjugation, poverty and all kinds of discrimination. This word is used to present the ‘untouchable’ people with a different and self-imposed identity for bringing changes in their conditions. Many of the Rishis have left their ancestral occupation. Even then, they are treated as social outcasts and face deprivation and discrimination on social, economic and political fronts.
According to Cosimo Zene (2002), the Rishi population in Bangladesh was estimated to be 234,315 who were concentrated in the districts of Dhaka (30,159), Mymensingh (35,622), Khustia (44,739), Khulna (30,668), and Jashore (58,588) in 1975. In 1980s, there were around 38,219 Rishis in 307 Rishi para of 14 upazilas in Khulna and Satkhira districts with their biggest concentrations in Tala, Dumuria, Satkhira and Kolaroa and an estimated 8,000 Rishi residing in Bagherat district (Zene 2002). He estimated Rishi population to be 120,000 in Khulna and Jashore district during his research, which constituted 1.43% of the total population in the districts (Zene 2002).
Currently, the Rishi people live in almost every district of Bangladesh. Their number is, however, higher in Jashore, Satkhira, Khulna and Bagerhat districts. Parittran, a rights-based organization of the Rishis in Bangladesh, Rishi population in the Khulna division alone is around 186,797. Power and Participation Research Centre (PPRC), with assistance and guidance of Parittran, carried out a research in 53 paras (clusters) or villages in Satkhira, Jashore, Khulna and Bagerhat districts of Khulna division and found 51,745 Rishis in 9,088 families.
2.8 Jaladas
Occupationally marginalized and suffering from a degree of social untouchability, Jaladas are a traditional fisherfolk community—mainly seafaring but also engaged in riverine fishing in the coastal districts of Chattogram and Cox’s Bazar districts.
According to Dr. Harishankar Jaladas, educationist, novelist and leading personality from the Jaladas community in Chattogram, these fisherfolk communities live along the coastline in around 60 spots from Teknaf in the southern Cox’s Bazar district to Mirsarai in northern Chattogram district with an approximate population of 150,000. Some Jaladas families also live in island areas of Maheshkhali, Kutubdia and Sandwip. Some of the Jaladas people live around the rivers of Sangu, Matamuhuri and Karnaphuli. However, many of them have migrated to Chattogram city because they have lost opportunities of livelihoods in areas they have lived in for generations. Jaladas people belong to Hindu religion and they are treated as one of the lowest castes in society.
Life and livelihoods of the Jaladas people are directly influenced by natural calamities. Sardars (leader) are the top tier leaders in their social structure and sardars’ advisers are called makkhya. In every Jaladas village, there are five sardars, who through their makkhyas, take decisions in resolving conflicts, approving marriage and allotting zones for catching fish. The children of the Jaladas families hardly give importance to education. They consider learning the skills of catching fish as more important than institutional education. Therefore education is low among the Jaladas. Debt and landlessness are high among the Jaladas community.
171Background Papers
2.9 Bihari
Approximately 300,000 Urdu-speaking Biharis live in 70 camps in 13 districts of Bangladesh. The Indian state of Bihar is the original home of most of the Biharis in Bangladesh. During the partition of the Indian subcontinent in 1947, these Biharis migrated to the then East Pakistan (presently Bangladesh). Of the Muslim Biharis, many still live in India and Pakistan. The Biharis sided with Pakistan during Bangladesh’s liberation war in 1971. After the war, a portion of them went to Pakistan and the rest remained stranded in Bangladesh. Naturally, these people had to face adverse situation since they were stranded.
Neither Pakistan nor Bangladesh agreed to offer citizenship to this group of people for many years. The High Court of Bangladesh, in a 2008 judgement, gave a ruling in favour of giving citizenship to around 150,000 Biharis who were minors in 1971 or born afterwards. However, they still live inferior lives in the camps without a permanent address and basic facilities. They are continuously deprived of most of their political, economic, social, and cultural rights.
The Biharis living in the camps, constructed right after Bangladesh’s independence, was 735,180 in 1972 (Whitaker et al, 1982). Between 1973 and 1993, 178,069 Biharis were repatriated to Pakistan that brought down the number of Biharis. Some of the Biharis have also hidden their identity and merged with the Bangalees. Currently, most of the 70 camps in 13 districts are located in Dhaka city (SPGRC survey, 1992).
There are debates over the actual number of Biharis in Bangladesh. The estimated number of Biharis living in the camps is 300,000 (Gain 2015:10 and MRG 2017).
Power and Participation Research Centre (PPRC) carried out a study [in 2017] covering 30 well-known camps and areas of Bihari concentration in 13 districts. It found their number to be 265,531 in these camps. Most of the camps are in Dhaka and 156,250 Biharis live in 10 camps in Dhaka, according to the research. One of these camps is Geneva Camp in Mohammadpur, Dhaka, which is the largest of the Bihari camps. The smallest Bihari camp is located in Rajbari, with 1,035 Biharis living there.
Illiteracy is very high among the Biharis in camps, sanitation is very poor, and most do not own land and most are burdened with loans. Their access to SSNPs is also low.
2.10 Other excluded and special communities
There are a number of smaller groups that are considered social outcasts. These groups are: Teli (oil presser), Napit (barber), Dhopas (washer-man), Tati (weavers who speak Urdu), Darji (tailor), Hajam (unqualified doctors for circumcision), Mazi/Khottra (boatmen), Behara (carrier of bridal carriage), Kasai (butcher), and so on. Some of these groups such as Teli, Napit, Dhopas, Tati, Darji, and Hijra are also found among the Hindus.
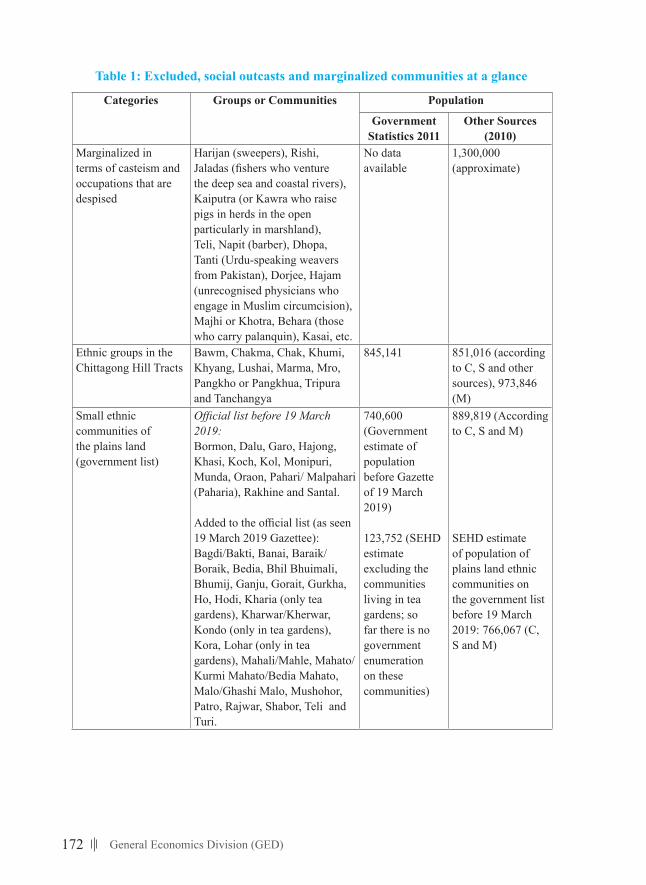
172 General Economics Division (GED)
Table 1: Excluded, social outcasts and marginalized communities at a glance
Categories Groups or Communities Population
Government Statistics 2011
Other Sources (2010)
Marginalized in terms of casteism and occupations that are despised
Harijan (sweepers), Rishi, Jaladas (fishers who venture the deep sea and coastal rivers), Kaiputra (or Kawra who raise pigs in herds in the open particularly in marshland), Teli, Napit (barber), Dhopa, Tanti (Urdu-speaking weavers from Pakistan), Dorjee, Hajam (unrecognised physicians who engage in Muslim circumcision), Majhi or Khotra, Behara (those who carry palanquin), Kasai, etc.
No data available
1,300,000 (approximate)
Ethnic groups in the Chittagong Hill Tracts
Bawm, Chakma, Chak, Khumi, Khyang, Lushai, Marma, Mro, Pangkho or Pangkhua, Tripura and Tanchangya
845,141 851,016 (according to C, S and other sources), 973,846 (M)
Small ethnic communities of the plains land (government list)
Official list before 19 March 2019: Bormon, Dalu, Garo, Hajong, Khasi, Koch, Kol, Monipuri, Munda, Oraon, Pahari/ Malpahari (Paharia), Rakhine and Santal.
Added to the official list (as seen 19 March 2019 Gazettee): Bagdi/Bakti, Banai, Baraik/Boraik, Bedia, Bhil Bhuimali, Bhumij, Ganju, Gorait, Gurkha, Ho, Hodi, Kharia (only tea gardens), Kharwar/Kherwar, Kondo (only in tea gardens), Kora, Lohar (only in tea gardens), Mahali/Mahle, Mahato/Kurmi Mahato/Bedia Mahato, Malo/Ghashi Malo, Mushohor, Patro, Rajwar, Shabor, Teli and Turi.
740,600 (Government estimate of population before Gazette of 19 March 2019)
123,752 (SEHD estimate excluding the communities living in tea gardens; so far there is no government enumeration on these communities)
889,819 (According to C, S and M)
SEHD estimate of population of plains land ethnic communities on the government list before 19 March 2019: 766,067 (C, S and M)
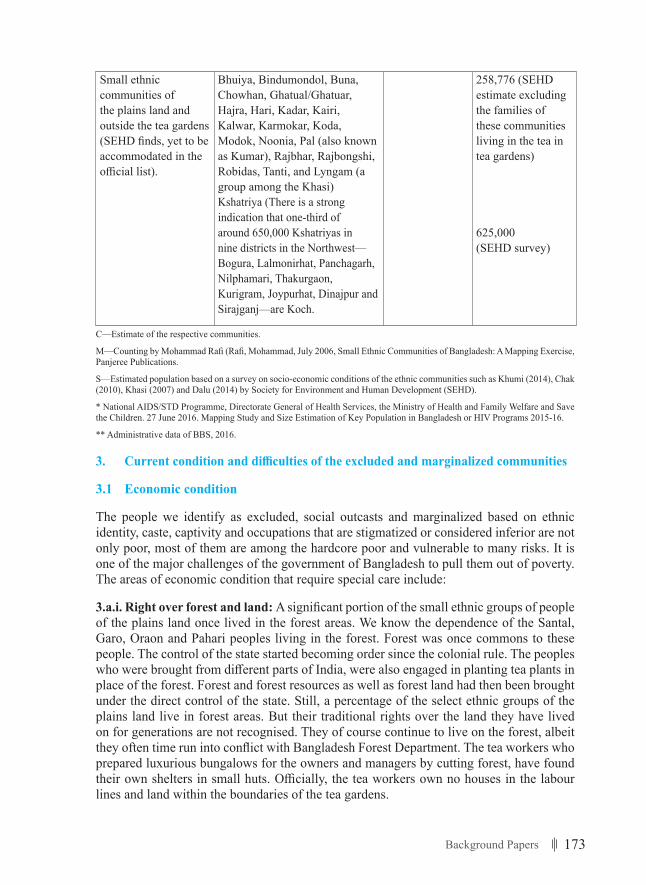
173Background Papers
Small ethnic communities of the plains land and outside the tea gardens (SEHD finds, yet to be accommodated in the official list).
Bhuiya, Bindumondol, Buna, Chowhan, Ghatual/Ghatuar, Hajra, Hari, Kadar, Kairi, Kalwar, Karmokar, Koda, Modok, Noonia, Pal (also known as Kumar), Rajbhar, Rajbongshi, Robidas, Tanti, and Lyngam (a group among the Khasi) Kshatriya (There is a strong indication that one-third of around 650,000 Kshatriyas in nine districts in the Northwest—Bogura, Lalmonirhat, Panchagarh, Nilphamari, Thakurgaon, Kurigram, Joypurhat, Dinajpur and Sirajganj—are Koch.
258,776 (SEHD estimate excluding the families of these communities living in the tea in tea gardens)
625,000(SEHD survey)
C—Estimate of the respective communities.
M—Counting by Mohammad Rafi (Rafi, Mohammad, July 2006, Small Ethnic Communities of Bangladesh: A Mapping Exercise, Panjeree Publications.
S—Estimated population based on a survey on socio-economic conditions of the ethnic communities such as Khumi (2014), Chak (2010), Khasi (2007) and Dalu (2014) by Society for Environment and Human Development (SEHD).
* National AIDS/STD Programme, Directorate General of Health Services, the Ministry of Health and Family Welfare and Save the Children. 27 June 2016. Mapping Study and Size Estimation of Key Population in Bangladesh or HIV Programs 2015-16.
** Administrative data of BBS, 2016.
3. Currentconditionanddifficultiesoftheexcludedandmarginalizedcommunities
3.1 Economic condition
The people we identify as excluded, social outcasts and marginalized based on ethnic identity, caste, captivity and occupations that are stigmatized or considered inferior are not only poor, most of them are among the hardcore poor and vulnerable to many risks. It is one of the major challenges of the government of Bangladesh to pull them out of poverty. The areas of economic condition that require special care include:
3.a.i. Right over forest and land: A significant portion of the small ethnic groups of people of the plains land once lived in the forest areas. We know the dependence of the Santal, Garo, Oraon and Pahari peoples living in the forest. Forest was once commons to these people. The control of the state started becoming order since the colonial rule. The peoples who were brought from different parts of India, were also engaged in planting tea plants in place of the forest. Forest and forest resources as well as forest land had then been brought under the direct control of the state. Still, a percentage of the select ethnic groups of the plains land live in forest areas. But their traditional rights over the land they have lived on for generations are not recognised. They of course continue to live on the forest, albeit they often time run into conflict with Bangladesh Forest Department. The tea workers who prepared luxurious bungalows for the owners and managers by cutting forest, have found their own shelters in small huts. Officially, the tea workers own no houses in the labour lines and land within the boundaries of the tea gardens.
174 General Economics Division (GED)
Other marginal communities who have little or no right over land are Harijan, Jaladas, Bihari, Rishi, Bede, and Kaiputra. Of these communities, the Harijans are entirely landless. Like the tea garden workers, the Harijans were also brought in by the British colonial rulers from different parts of the then India. They were non-Bangalees. They had found their shelters in different places of the cities, especially in dirty and inhospitable areas. The land they live on, is owned by the state. The Bedes also have very little land. They were once the people who lived on boats and considered as water gypsies. Nowadays they are trying to settle on land. In some places, they are trying to build houses, quite densely, taking lease of khas land or buying small plots. However, the majority of them are landless and live in tents.
For the Jaladas community, natural disasters, apart from landlessness, is another factor that makes them more vulnerable. They live along the coastline of Chattogram and Cox’s Bazar and storm and tidal surge damage their houses. If the concerns over the climate changes turn into reality one day, they will be the most affected people. The Biharis who live in 70 camps across the country have no land either. They often face social pressure and even panic. Among the Kaiputra and Rishi, the rates of landlessness are also very high.
Landlessness and violence including killing over land disputes and harassment are common experience of the peoples of marginal and the small ethnic groups. Many are demanding that the government forms a commission to look into land issues for the small ethnic groups of the plains land.
3.a.ii. Wage deprivation and income disparity: It is a common problem for the workers of the tea gardens, members of the Harijan community and other marginal peoples. These communities cannot come out of the vicious cycle of poverty mainly due to their low income. The tea workers’ wage deprivation is obvious. A tea worker’s daily cash pay of Taka 102 a day in 2019 is no way justifiable. They demand fair wages in the light of wages of workers in other trades in the country and comparing the wages paid to tea workers in the neighbouring countries. The Minimum Wage Board was instituted for the third time in 2019 to fix the minimum wages for the tea workers. The tea workers are also deprived of five percent of the profit of the companies that is guaranteed by the Labour Act, 2006 (article 234). This share of profit is supposed to be deposited to the workers’ participatory fund and workers’ welfare fund, which the workers shall be able to spend based on collective decision. The tea gardens had this provision even before framing of the current labour act, but the workers have remained deprived of company’s profit-sharing at all times in the past and now.
The Harijans (cleaning workers in the cities) face almost similar wage discrimination like the tea plantation workers. There is a huge gap between the wages given to sweepers depending on whether they are hired on a short-term basis or as permanent workers. Although the average monthly income of the Harijan cleaners is Taka 10,301, their monthly income ranges between Taka 1,020 and Taka 20,000 [in different districts]. The average expenditure of the Harijan families is Taka 16,157, which is significantly higher than their average monthly income of Taka 10,301. In many instances, the income of the cleaners is appallingly low. Until recently (2019) the daily wage of a sweeper in Jashore municipality was Taka 37, which has now (2019) been revised to Taka 50 for sweepers and Taka 100 waste collectors (Rahman and Gain 2019). The conditions of sweepers in other cities can be assumed in the light of the Jashore experience. There are allegations that the Harijans
175Background Papers
do not get permanent jobs as per 80% quota reserved for them. The Bangalees are taking away their permanent jobs.
The Bede, Rishi, Bihari, Jaladas, Kaiputra and smaller ethnic communities are no better off economically. The income of the agricultural labourers among them is low and most of them are in debt. Among these communities the Kaiputras (a pig rearing community) crave bank loans. Pig rearing commercially indeed needs a large sum of cash capital. They report that they do not get any loans they require from the public or private banks. The amount of loans they get from NGOs is insufficient. Even though there are different types of credit allocated for the agricultural sector, the Kaiputras are deprived of such loans because pig rearing is not considered to be any formal sector and agriculture. With no option left, they take loans from local moneylenders (mahajans) with very high interest rates. Similarly the Jaladas and Rishi who need credit do not get it from banks. They take loans or dadan at a very high interest rate from the traditional money lenders and in many cases sell their catch or produces in advance.
The monthly income of the brothel-based sex workers (nearly 4,000) is relatively better—between Taka 15,000 in Bagerhat and Taka 50,000 in Mymensingh. But their daily expenses are so high that they can hardly save anything. Their biggest expenditure goes into house rent, which they pay daily. In Mymensingh brothel a sex worker pays Taka 1,000 on average every day for a 100 square-feet room! No matter what a sex worker earns, at the end of the day her debt burden increases. (Gain et al 2019: 2)
3.a.iii. Employment: Unemployment is a common concern in Bangladesh, which among the excluded and marginalised communities, is very high. Job opportunities are limited in the tea gardens. So, with the rise in population the number of unemployed people also rises. The 163 tea gardens employ up 130,000 workers at the garden levels. Generally, a tea worker’s family has one worker earning a daily cash pay of Tk 102, plus some ration. This is not sufficient for a family of five to survive on. At least one person from each tea worker’s family goes out of the tea garden every day to work as day labourer in agriculture, brick kilns, orchards, houses and so on. They do not always get work they desperately need.
he condition of the Harijan community is similar to those of the tea workers. Like in the tea gardens, those from among the Harijans that are not registered workers work in government and non-government offices and respond to calls for cleaning. The Harijans also face additional pressure of losing jobs reserved for them. And only for being Harijan, many of their educated persons are not provided with other jobs.
Members of the Bede community are Bangalees but isolated from other groups in society and are considered as social outcasts. Since their trade and occupation are completely different from those of others, it is hard to create alternative jobs specifically for them. Some of them are trying to manage jobs like driving and working at readymade garments. In crisis time like during the Coronavirus lockdown, the tea workers, Harijans, Bede, Bihairs, etc groups had very difficult times without work.
3.a.iv. Work environment: Working environment for none of the tea workers, Harijans and sex workers is decent enough. Of these three groups, the tea plantation workers, especially female workers, are engaged in plucking tea leaves in the open field throughout the day. They have to work under the scorching sun, sometimes braving rains, and work constantly standing and walking. They have no toilet facilities, in accordance with labour
176 General Economics Division (GED)
law, in the places where they remain busy collecting tea leaves. They defecate in the open space during the working hours. Most of the tea plantation workers take lunch of lower standard sitting in the open space. One of the proofs for their ill-health is that the maternal mortality rate is much higher in the tea garden areas compared to the rates in other parts of the country.
The Harijans, caste-based labourers and ‘untouchables’ work in unhygienic and indecent work conditions in most part. The houses they live in, are unhealthy and indecent as well.
In the brothels, there is nothing called work environment. Around 4,000 sex workers in 11 brothels work and live in sub-human conditions. They are used as sex slaves, a phenomenon, which is beyond the knowledge of the mainstream society. Most members of the Bede community spend their entire life roaming around. They live their entire life in indecent condition in boats or tents.
The conditions of the members of the Kaiputra community who spend day and night in the open space live and work in very indecent condition. They spend night in flimsy tents set up in the open space, no matter what comes their way—scorching sun, storm, rains or robbers.
The members of the Jaladas community venture out into the deep sea to catch fish risking their lives. Pains and sufferings in their lives know no bounds. Many of them lose lives due to storm.
3.a.v. Health: The people of the excluded and marginalized communities face various troubles in accessing healthcare services. Their barriers and problems are also different in view of their ethnic group identities. For example, opportunity of taking healthcare services is completely different for the tea plantation workers. First, the houses in the labour lines provided by the companies are generally poor and their sanitation is not good either. Even today, around 40% of them defecate in the open space. Arrangement for providing pure drinking water is inadequate. Income of the tea plantation workers is poor (daily cash pay of Taka 102 even in 2020) and malnutrition is a chronic problem for them. For healthcare services, they are dependent on the companies’ dispensaries or hospitals that are not in good shape. Although there is scope to take services from the government hospital, upazila health complexes and community clinics, they hardly go there.
In most cases, the mothers give birth to children in their own houses and in unhealthy conditions. The proof for poor health of the tea workers is the higher rate of maternal death. The rate of death of mothers while giving birth in Moulvibazar District, a major concentration of tea estates, is much higher than the national average rate. In Moulvibazar district, out of 120 such deaths in 2014, 47 were recorded in tea gardens (according to the Directorate General of Health Services).
There is no doubt the members of the Bede community who live in boats or in tents in the open space round the year have inadequate access to healthcare services. Each of the marginal groups faces difficulties in a variety of ways in accessing healthcare services. All of them including the tea plantation workers run into great difficulties if some of them are attacked with acute diseases such as leprosy, cancer, tuberculosis and diabetes. Proper healthcare services require financial ability but most of the marginal groups of people do not have it.
177Background Papers
3.a.vi. Education: Children of the tea gardens in most cases become tea workers. Scope for livelihoods for them outside the tea gardens is extremely limited. The tea garden owners run around 200 schools for the children of the tea plantation workers. The boys and girls going to these schools are getting literacy but remain deprived of real education and life skills. These children eventually drop out from the schools and enlist themselves as tea workers. This process ensures uninterrupted supply chain of tea workers. However, people in the tea estates are increasingly becoming conscious about the necessity of taking education. In recent years, some non-government organisations, BRAC in particular and some missionary organisations, have been creating opportunities of education for the children of the tea workers. Yet, the government schools in the tea gardens are scanty except for Sreemangal upazila. The tea garden owners initially showed unwillingness in allowing NGO schools, but they have changed their position in recent times. However, the state of education in tea garden areas is still poor.
The Bede families living in tents or boats cannot send their children to schools. Some Bede families are trying to enrol their children in schools in the areas where they have permanent residences or are enlisted as voters. There are handful of mobile schools but their outcome is not satisfactory. The Bedes want education. But they are still struggling with their children, as they move from one place to another. The trend of child marriage among them is still very concerning because of lack of education.
Apart from lack of education opportunity for the children of the Harijan community, those educated do not get jobs only because they are Harijans.
3.2 Socio-cultural protection
The excluded groups face insurmountable difficulties in their daily life. These groups, however, should not be looked down upon as week and helpless. They, indeed, represent diverse ethnic identities, rich cultures, cultural resources, languages, and history. Aside from Bangla, there are at least 40 languages spoken by the ethnic and tea communities of Bangladesh. However, there are communities who no more speak their languages anymore and there are others who speak their languages but do not have alphabets.
Bangla language and Bangalee culture is very vibrant in the overwhelmingly Bangalee-majority Bangladesh. However, other languages spoken in Bangladesh and the speakers of these languages represent cultural heritage, traditions, literature, education, history, knowledge, arts and crafts. In addition to 50 officially listed ethnic communities there are others. Bangla language and culture have roots in the languages and cultures that these communities speak and represent. International Mother Language Institute (IMLI) is dedicated to protecting the languages spoken in Bangladesh other than Bangla. It will indeed be wise to scale up financial and legislative support to protect all other languages along with Bangla. The communities that are not adequately attended in this regard are those in the tea gardens. While there are quite a few ‘Tribal Cultural Institutes’ in the Chittagong Hill Tracts and in the plains, there is none in the tea garden areas. Even the Bedes speak a language (Thar) that needs to be nurtured.
The constitution of Bangladesh guarantees equal rights to all people irrespective of race, caste, creed and religion. However 15th amendment to the constitution as regards minority cultures is concerning to the communities that are not Bangalees. The 15th amendment of the constitution states: ‘The People of Bangladesh shall be known as Bangalees as
178 General Economics Division (GED)
a nation and the citizens of Bangladesh shall be known as Bangladeshies’ (Bangladesh Gazette, 3 July 2011, Article 6). Further to this, Article 3 of the constitution states that ‘The state language of the Republic is Bangla’. Article 23 states: ‘The state shall adopt measures to conserve the cultural traditions and heritage of the people, and so to foster and improve the national language, literature and the arts that all sections of the people are afforded the opportunity to contribute towards and to participate in the enrichment of the national culture.’ The legislators and other concerned state agencies may consider giving a pragmatic thought and attention to exploring ways and means to protect diverse languages and cultures that exist in Bangladesh from getting threatened and lost.
3.3 Political protection and human rights
3.c.i. Recognition of the ethnic and other communities: For political protection what the ethnic, excluded and marginalized communities need first is their appropriate recognition by the state and the Constitution. The government also needs to have a transparent and comprehensive policy about listing the ethnic and other communities that are occupationally unique (as seen in table 1). The rationale the national committee [under the Ministry of Cultural Affairs], assigned to prepare the list of small ethnic groups, used in listing around 50 such groups can also be applicable to many other such groups for inclusion into the list. For example, the national committee’s list does not include the ethnic group called ‘Kadar’ in Dinajpur, which is one of the oldest ethnic groups of the Indian subcontinent. Independent research has found 37 such ethnic groups, outside the Chittagong Hill Tracts and tea gardens, that have not been incorporated in the latest official list. The information provided about these communities in table 1 are based on research, not assumption.
The most bewildering findings were the existence of 80 or more groups living in the tea gardens. Twenty-three of these groups are included in the refreshed list (as of March 2019) in ‘Small Ethnic Groups Cultural Institution Act 2010’. What happens to the others? Each of more than 80 communities in the tea gardens claims its distinct ethnic characteristics. For example, an Almik is in no way a Bangalee or Kairi. No matter wherever the Kairis may have come from they belong to an ethnic community.
Bangladesh Bureau of Statistics (BBS) is preparing for the next population census in 2021. It is expected that it will take special care to ensure proper enumeration of the small ethnic groups. Apart from the BBS, new state institution(s) may be created to carry out research on small ethnic groups and other marginal groups. Anthropological Survey of India has carried out surveys on more than 4,500 out of 6,500 communities living all over India and published 44 volumes under a series, “Peoples of India”. Such a state entity may be created in Bangladesh as well. We know that International Mother Language Institute (IMLI) is working on the languages of the small ethnic groups. However, the institute’s works are not visible yet (as of January 2020). A popular demand from different sections is that our Sangsad (parliament) and law makers should work towards giving constitutional recognition to all ethnic communities of Bangladesh.
How will the state provide constitutional recognition? We can examine the situation in the Indian states of Assam, Tripura, Meghalaya and Mizoram. The sixth schedule of the Indian Constitution empowers the ‘tribal’ peoples of these four states to exercise legal and executive power through autonomous regional councils. This means, the majority of the ‘tribal’ peoples of these states have achieved the right to self-determination. The ‘tribal’ communities of the Chittagong Hill Tracts (CHT) have gained certain rights to exercise control over their region, in similar manner of the four Indian states.
179Background Papers
Although the size of the ethnic population in the plains of Bangladesh is small, they should be given the right to self-determination. The issue of fifth schedule of the Indian constitution may be mentioned here. It ensures the right of the ‘tribal’ people in each of the states where their population is sizeable to exercise their right over land and tribal autonomy, through the ‘Tribal Advisory Council’ in each state (Kazzer 2015). This sort of ‘tribal autonomy’ is there in 10 Indian states. In the Indian states where ‘tribal’ people are covered by the fifth schedule, they are now demanding that the sixth schedule be applied to them. If it is done, they would get greater autonomy and power.
When this is the situation in India, what can Bangladeshi small ethnic groups expect? They demand land commission and separate ministry for the plains land ethnic communities. If the government further refreshes the list of small ethnic groups based on authentic information and data and if it is included into the constitution as schedule, ethnic groups such as Bhuiyan, Rajbongshi, Kadar, Koda, Hajra, Noonia, Ghatual, Almik, Bhokta, Kahar and other small ethnic groups will be recognised with their mother languages and distinct cultural identity, alongside already recognised ethnic groups.
What is required first for other marginal groups is authentic statistics. We hope BBS will take special initiative to make sure that the 2021 population census will include all these groups. The BBS officials hint that special groups such as Bede, Harijan, Kaiputra, Jaladas, Rishi, Bihari, transgender, sex workers, and the disabled communities would be enumerated separately in the 2021 census.
It is widely expected that based on proper list of the small ethnic groups and other marginalized groups, the government would take special measures relating to their healthcare services, education and right over land.
3.c.ii. Pledges of the political parties: The political parties in power or in opposition all commit to protect ethnic communities and marginalized peoples, especially with elections ahead. The parties make pledges in their election manifestoes. The party in power has greater responsibility towards the ethnic, social outcasts and the marginal communities.
The constitution guarantees welfare of all people. Bangalees are the overwhelming majority in Bangladesh and have comparative advantage. But without execution of constitutional safeguards it will not be possible to protect more than 40 languages other than Bangla spoken in Bangladesh and a variety of cultures, traditions, customary laws, traditional technologies, and knowledge. Thus it has been a common demand of the ethnic communities that the political parties of the country take necessary political measures to give greater constitutional recognition through necessary amendments. It is only by means of constitutional recognition that the required legal regime for the backward people can be framed.
For improvement in labour standards and rights of some communities legal reform is necessary. For example, the Labour Act 2006 is discriminatory to the tea plantation workers in terms of their entitlement to casual leave, earned leave, eviction from the houses, right to form union etc. When workers in other industries can enjoy up to 10 days of casual leave, the tea plantation workers have no casual leave. When other workers are entitled to a day’s earned leave for working 18 days, the tea garden workers have to work 22 days for earning a day’s leave of this kind. The tea plantation workers can form union only at the national level, but not at the valley, upazila or district levels. It is essential to address the discriminatory provision in the labour law. Since the tea workers have no other place
180 General Economics Division (GED)
to live in outside the tea gardens, the provision of eviction, as stipulated in article 32 of the Labour Act, 2006, should not be applicable for them. It is said in the law, “S/he (tea worker) shall vacate the living space allotted by the owners on completion of 60 days of end of his service.”
Other excluded communities including the Bedes also urgently need protection. Most of the Bede did not attain right to franchise until 2007. The Bede, Harijan, Bihari, Jaladas, Kaiputra, sex workers—are all citizens of Bangladesh. Unless the marginal and backward groups of people are given due constitutional rights and dignity, they cannot catch up with others. The political parties must have their declarations, policies and strategies in clearest terms for these peoples. All concerned want the party that is governing the nation to take initiative to prepare policies and programmes to ensure their education, healthcare facilities, rights over assets, jobs, living space and their participation in democratic processes.
3.c.iii. National Human Rights Commission Bangladesh and other organisations: National Human Rights Commission Bangladesh and some other human rights bodies work for the rights of the excluded and marginalized peoples. But unless there are proper documentation, investigation and research on their rights and violation of rights, human rights situation would not improve. The members of the smaller ethnic groups and other marginal communities demand that the attention of the National Human Rights Commission Bangladesh to them be scaled up.
3.4 Some common disadvantages
There are common disadvantages and difficulties faced by the excluded groups irrespective of religions, ethnic identities, occupations and geography. One such disadvantage is lack of baseline data (quantitative and qualitative) on numbers, population size and socio-economic conditions of different religious, ethnic and disadvantaged groups. It is for the lack of a robust database that many poor and vulnerable people who qualify to get the benefits of SSNPs may be excluded as has been pointed out by Prof. Shamsul Alam in a press article. “In 2010, of the 24.5 percent of households who reported to have benefited from at least one of the 30 SSPs covered in the HIES (2010), 82 per cent of them belonged to the poor and vulnerable groups while some 18 per cent of them were non-poor” (Prof. Alam 25 April 2017).
The ‘untouchables’ and excluded groups in particular are generally apathetic about political participation due to centuries of exploitation they have been through. Although many of them qualify to contest the elections and run for public offices, their identity as one from sweeper or cleaner, disabled, tea communities, sex workers, Hijra, etc., restrains them from participating in political parties and to run for public offices. The minorities in general, with some exceptions, are also apathetic about political participation due to the feeling that they are not equal citizens of the country.
Many of the excluded groups and labour classes are unaware of their legitimate rights as well. The tea communities, sweepers or cleaners, smaller ethnic communities, and different other disadvantaged groups take their poverty and other limits as misfortune and feel they are not equal to their Bangalee neighbours. The labour classes from among some excluded groups, such as tea workers and Harijans [who are not Bangalee] remain largely unaware about true trade unionism. The society seems to be remaining insensitive about groups like the sex workers and Hijras at all times.
181Background Papers
Some other common disadvantages of excluded communities are low literacy rate, inability to access bank loans, poor hygiene and sanitation, social discrimination, access to medical treatment or health services, and unemployment.
The hardships faced by many of the excluded groups seem unending. However, despite all limiting factors, the democratization process that Bangladesh has got into in the recent years brings a ray of hope for the groups of people forgotten by the majority.
3.5 Groupspecifickeyconcerns
Ethnic communities
Recognition and inclusion: Inclusion of all the ethnic communities in the government list last revised in 2019 is demand of those who remain outside the list. There are indeed a significant number of smaller ethnic communities not included in the revised government list. The ethnic communities also demand constitutional recognition.
Customary land rights: Outside the CHT, one hotspot of customary land rights issue is the Modhupur sal forest. A household survey by SEHD in 44 core forest villages finds that of 11,048 households in these villages only 13% Bangalee and 4.19% Garo households have title deeds (CS or RoR) for their homestead land in the forest villages. A smaller percentage of households has title deeds for other types of land (high land and low land). This means an overwhelming majority of households have homesteads on customary land. This situation leads to conflicts between the Forest Department and the forest villagers.
Forest cases: Forest cases are a serious concern in Modhupur sal forest area. Of some 5,000 forest cases in 2019, 4,500 were in Modhupur. The victims of forest cases face insurmountable sufferings in running the forest cases for years.
Right to land: The ethnic communities, especially the smaller ones are overwhelming landless. Many live temporarily on the khas (public) land. Landlessness is big concern for the ethnic communities.
Tea workers
Wage deprivation: The unanimous single most concern of the tea workers is their low wages. The daily cash pay of a tea worker was Taka 102 even in 2019. All fringe benefits particularly from the subsidized ration added, the accumulative daily wage stands at around Taka 160, which the tea workers consider to be lot less than the just wage. This has severe negative effects on their life and livelihood.
Discrimination in the labour law: Bangladesh Labour Law, 2006 allows the tea workers to unionize only at the national level. This is a legalized discrimination. The labour law is also discriminatory for the tea workers in relation to casual leave, earned leave, gratuity, deprivation of profit-sharing, group-insurance, and eviction from the residence.
Provisions of law regarding decent work condition not implemented: The Labour Act, 2006 and Labour Rules 2015 provide some facilities to workers particularly aiming at woman workers. For example, toilets and the washing facilities at work place are provided by the labour law rules. In the tea gardens, where more than 90% of the tealeaf pickers are women, there is no toilet or washing facility at work place, viz., sections where they pluck tealeaf. There are many other provisions in the labour law and rules that are violated.
182 General Economics Division (GED)
Landlessness: The tea workers, descendants of indentured workers brought by the British tea companies to work on the tea gardens, don’t own land they live on. They also do not own houses they live in. It is only the state that can consider distribution of land to these landless. It is a top policy matter of the government.
Bede
Prejudice: The Bede in general report of being prejudiced by others and therefore socially excluded. The key factors behind are misconceptions about them and their isolation from the majority even though they are Muslims.
Decreased income in traditional occupations: Income from traditional occupations has decreased drastically. People no more want to rely on treatment and services the Bedes can offer.
No land ownership: The majority of the Bedes own no land. They move around from one place to another because of their traditional occupations, which is why they do not own land.
Education crisis: Illiteracy is the single most serious problem faced by the Bede community. 70.15% of the Bede adults are completely illiterate and the literacy rate of the Bede community is only 18.86% (Rahman and Gain 2019). They identify poverty as a key factor behind their high illiteracy rate. Another factor is most of them keep moving from one place to another and cannot send their children to schools.
Access to healthcare: Because they keep moving from one place to another, they cannot take full advantage of the public health facilities and services they offer.
Employment crisis: Lack of employment opportunities other than their traditional occupations is another major problem. They identify their Bede identity as the reason behind the employment crisis. They cannot enter mainstream informal or formal jobs because they come from the Bede community.
Other problems: Some other major problems of the Bede community are child marriage, polygamy and violence against women (VAW).
Harijans
Habitation and land-related problems: The Harijans have been living in the same colonies or quarters since the British rulers brought them. The land they live on is not their own. Furthermore, on average the Harijan families live in tiny space (150 to 200 square feet houses in general), which usually consists of one or two tiny rooms. In some districts, the size of their house is even less than 100 square feet. The Harijans, not Bangalees, have remained confined to the colonies or ghettos for generation. The quality of latrine and drainage in the colonies along with its infrastructure is very poor.
Low education rate: Half of the Harijan population above 18 years of age are either illiterate or has letters knowledge only (Rahman and Gain 2019). Less than 2% of the Harijans have completed graduation and Master’s education. Often young Harijans who are educated are forced to become cleaners either to maintain their residency in the colony or because they could not secure another job after their identity was revealed.
183Background Papers
Decreasing employment opportunities: The government has reserved 80% quota for the Harijans in all recruitments for cleaners in the municipalities and city corporations of the country. However, in reality this policy is not implemented. Bangalees are taking away their jobs. According to sources Harijans make up less than 40% of the cleaning staff employed by the Dhaka City Corporation.
Discrimination in wages: There are different pay scales for the cleaning staff in different city corporations and municipalities, which creates grounds for exploitation of the extreme poor Harijans in the less developed districts of the country. The monthly wage of the Harijans was found as low as Taka 1,020. Furthermore, often Harijans are paid less than the Bangalee cleaners.
Social discrimination: Social discrimination against the Harijans remains to be a serious issue. The Harijans are often referred to as methor or ‘sweeper’ to belittle and disrespect their occupation of cleaning garbage and dirt. It is reported from different parts of the country that the Harijans are not allowed to sit with Bangalees in restaurants and offered food and drinks in separate plates and glasses that will not be used by others. Even in schools, the Harijan students face discrimination.
Sex workers and transgenders
Harassment and physical abuse: The sex workers and transgenders (Hijra), treated as social outcasts, face harassment and physical abuse in their daily life. They are abused by the thugs (mastans), customers, shop owners and even by the police at their work place—brothels, streets and hotels. A survey conducted by Society for Environment and Human Development (SEHD) in 2017-2018 reveals that 73.33% of the sex workers had been sold or dragged into this occupation by touts or intermediaries (dalal) and 94.07% have faced various kinds of torture such as rape, gang rape, abduction, and physical torture of various types.
Inability to work independently: Many sex workers are tied to sardarnis (madams) and their income is taken by them. Besides gangsters, extortionists, regular customers (babus) and house-owners take most of their income. It is for all these exploitation that they cannot save anything from their income, rather they remain indebted. Those among the transgenders who work under gurus (like sardxarnis in brothels) face the same fate. Their condition is like the ‘tied’ sex workers; they work under tight control of the gurus who take away most of their income.
Educating and maintaining the children of the sex workers: Because they are considered social outcasts, they have very hard time educating their children in schools. Their children are looked down upon in schools. In many instances the sex workers educate their children from rented houses or with relatives outside the brothels. The sex workers also keep the children away from them. However, the problem with the girl children is even more acute. It is difficult to marry off the daughters of the sex workers.
Appalling housing condition: The sex workers in most cases spend their life in dilapidated rooms in brothels. On the other hand, they pay very high room rent in some brothels on daily basis.
Sexually transmitted diseases and treatment: SEHD survey finds that almost every sex
184 General Economics Division (GED)
worker has sought treatment for Sexually Transmitted Infection (STI). The sex workers face and fight various other diseases such as syphilis, gonorrhoea, skin disease, tuberculosis, HIV, malnutrition, gastric, cervical cancer, and mental illness.
Eviction panic and rehabilitation: Eviction panic in the backdrop of eviction of a number of brothels including the largest one in Narayanganj and demolition of Tangail brothel [which however, was rebuilt with a court verdict] keeps the sex workers in trepidation.
Kaiputra: a pig-rearing community
Want of capital: A large sum of cash capital is required to commercially raise herds of pigs. However, all pig herders (Kaiputras and non-Kaiputras) reported they do not get any loans they require from the public or private banks. The amount of loans they get from NGOs is insufficient. Even though there are different types of credit allocated for the agricultural sector, the Kaiputras are deprived of such loans because pig rearing is not considered to be any formal sector and agriculture. With no option left, they take loans from local moneylenders (mahajans) with very high interest rates. They run into serious difficulties when an epidemic such as swine flu and other diseases attack herds of pigs. There is no insurance or bail-out for them if such calamities appear. Therefore, most of herd owners and rakhals (herders) remain in debt.
Discrimination: The Kaiputras face insurmountable difficulties and discrimination in society due to their occupation. They are looked down upon and live a life of indignity. The Kaiputra villages that are still actively involved in piggeries and herding pigs in the open, live largely isolated from the Hindus including Shudras and the Muslims. They are considered social outcasts, ‘Dalit’ and untouchables.
Unemployment: It is for isolation from the majority including the upper caste Hindus, landlessness, lack of vocational training and low education rate that unemployment is high among the Kaiputras.
Insecurity and occupational hazards: Insecurity of the Kaiputras particularly of the rakhals (who rear pigs in the open field) is an major concern. The local thugs and robbers easily rob them. Because they keep floating from one field to another, they hardly go to police station and can take advantage of legal systems when they are abused or robbed. The rakhals often face verbal and physical abuse when the pigs damage crops of farmers in the areas they take their herds for feeding. Because the Kaiputras work in the open fields [that belong mostly to private owners], they are defenceless when natural calamities strike.
Lack of equal access to government stipends and services: Kaiputras are one of the most underprivileged people of the country. They get no special attention from the state. The main reason for them being socially excluded is lack of education. They know very little about government stipends and different other services to improve education. The local representatives are also not considerate enough towards the pig-rearing community.
Jaladas: a seafaring fishing community
Attacks by maritime pirates: Attacks by pirates in the ocean is a major problem for the Jaladas community who still earn a traditional living by catching fish in the Bay of Bengal.
185Background Papers
The Jaladas identify inadequate surveillance and insufficient number of coast guards as the main reasons behind the unchecked threats of maritime piracy.
Control by pirates and grabbing of fishing grounds: Pirates and people from the majority Muslim community control ocean grounds, which is a severe problem for the Jaladas community. Nearly 67% of the Jaladas community reported that maritime piracy and grabbing of fishing grounds in the ocean are major problems for them (Rahman & Gain 2019).
No fisheries loan: No one from the Jaladas community has access to fisheries loans as the government has taken no initiative to introduce this facility for them, which is especially targeted for fishermen.
Inadequate access to cyclone centres: Respondents from all of the clusters studied by PPRC stated that people from the Jaladas community who live in the coastal areas have little access to cyclone centres.
Rishis of Khulna
Poverty: Unemployment and poverty are a never-ending vicious cycle for the Rishi community. Lack of better and new job opportunities for the Rishis are seen as the main reasons behind their poverty.
Untouchability: The Rishis are labelled as the ‘untouchables’ in many districts of the country. People of the majority community do not let them enter the common temple or use the big ponds. In schools the Rishi children face discrimination from the teachers and the fellow students. In some areas of Khulna, Rishis are not allowed to enter tea stalls or restaurants because otherwise local customers will leave. They cannot sit with others to eat and they are served food in separate plates and glasses in restaurants and social programs. In some restaurants, their glasses and tea cups are marked so that drinks are not served in those glasses to other customers by mistake. Labelled also as muchi for their traditional occupation of making and sewing shoes and skinning animals they face acute social discrimination.
Debt: The Rishis are heavily indebted. They take loans from the NGOs, but they cannot access loans from the banks, which they want. Bihari community: living in camps
Horrible camp life: The Biharis live in appalling conditions in camps. The population in camps have increased since independence while the space hasn’t. As a result their tiny houses or rooms have expanded vertically for lack of space particularly in the camps in Dhaka. Up to three generations of a Bihari family live in the same space together. The Biharis in camps own no land. The conditions in camps outside Dhaka are even worse.
Crisis of citizenship: The Bangladesh government granted citizenship and consequently NID cards to Biharis in 2008 who were below 18 years old in 1971 and born after the war. However, some crucial rights associated with citizenship are not afforded to the Biharis. They are not issued passports though they have NID cards because they have no permanent address. The citizenship and NID cards do not help them to even get a job as they are discriminated for their identity. On top of that, they started to lose the so-called privileges that came with the refugee status after they received NID cards. For instance, they are now
186 General Economics Division (GED)
asked for paying pending electricity bills from the residents of Geneva Camp, which led to frequent power blackouts for months in late 2019. There is still no official consensus on how to manage the system of electricity supply in the Bihari camps.
4. Government policies, strategies and actions for protection of the excluded and marginalized communities
The government policies, strategies and actions are guided by the supreme law of the country—the Constitution of Bangladesh—that guarantees equality of all citizens and equal protection of law; protection against discrimination on grounds of only religion, race, caste, sex or place of birth; equal opportunity of employment in the public service; right to form associations and unions; freedom of thought and conscience; right to profess, practice or propagate any religion, etc. One very important aspect of the Fundamental Rights is entrenched in Article 28(4) and Articles 29(a), which award the state the authority of making special provisions in favour of women, children, and backward sections of citizens including securing their adequate representation in the service of the Republic. ‘Backward section of citizens’, understandably includes ethnic minorities, tea plantation workers, sex workers, transgender (Hijra), Harijans, Rishi, Bede, and all other disadvantaged people of Bangladesh under consideration of the Ministry of Social Welfare.
4.1 Strategies of the Government
Bangladesh government is aware that despite significant economic progress made, poverty and extreme poverty remain quite high and a big challenge. There are excluded, social outcasts and marginalized people who do not get equal benefits of economic progress. It is for their history, ethnic and religious identities, occupations, and colonial legacy that they have fallen behind. Both government and these communities believe, as evidenced in the courage, entrepreneurships and initiatives among the people of Bangladesh, poverty is not a destiny. Now the challenge is how quickly these communities, deprived of equal opportunities, true education of their children, capability, and life skills, can catch up. Some of these communities are so much cut off from social relations and excluded from equal opportunities that occasional financial and in-kind supports are not enough. They are in need of special attention and in instances they deserve positive discrimination to get out of their current situation. So to end poverty by 2030, one of the sustainable development goals, we must improve the life standard of these communities, a challenge that requires scaled up social protection programmes.
However, because these communities are not uniformly poor and because their difficulties are not uniform, there is no single solution for all of them. Each community faces some common difficulties; but they also face unique difficulties as discussed above. The solutions for their difficulties got to be strategic and unique in some instances.
After revision in 2019, the official list includes 50 ethnic communities including 11 in the CHT. As discussed above there are other ethnic communities (in the plains and in the tea gardens) that need to be attended. (for the communities on the official list and those not included in the official list see table 1). The BBS census of 2021 is expected to enumerate separately only the communities on the official list. If BBS does so, there will be no separate data for communities not officially recognised.
Disadvantaged communities under consideration of Department of Social Services
187Background Papers
(Ministry of Social Welfare) include Kamar (blacksmiths), Kumar/Mrithshilpi potters), Napit (hairdresser), people who make cane and bamboo produces, brassware producers and cobblers (shoe makers), transgenders (Hijra), Bede, Harijans and tea workers. Department of Social Services (DSS) considers them as marginalised communities. DSS provides a number of allowances targeting these groups.
4.2 Overarching strategy of the government for social protection
The history of social protection in Bangladesh dates back to pre-colonial period. Social protection has been a need ever since for people who fell victims to famines, floods, other natural calamities and wars and groups of people who lack life skills to earn sufficient income for subsistence and sometimes mere survival. Right after independence the key social protection was ‘civil service pension’ (Miyan in Mansur and Khondker 2017: 318). It is in the backdrop of famine in 1974 and floods in 1980s that new schemes were undertaken (Rahman and Chowdhury 2012 in Mansur and Khondker 2017: 318). Social protection schemes have been added to the list ever since. The poor, extreme poor, widowed and destitute women, freedom fighters, retired public servants, disabled, occupational groups, ethnic and other marginalized groups are the recipients of the benefits of the social protection programmes.
There is no denial of the fact that social protection strategy and programmes, better organized through adoption of the National Social Security Strategy (NSSS) approved by the cabinet on June 1, 2015, has brought down poverty and extreme poverty in Bangladesh. In fact poverty has come down to 20.5% in 2019 from 48.9% in 2000. Similarly extremely poverty has come down to 10.5% in 2019 from 34.3% in 2000 (Poverty and Extreme Poverty rate of Bangladesh, BBS 2018-2019). However, in the post-Coronavirus times the fear is many who migrated out of the poverty may move back to their previous condition. A nationwide joint survey of Power and Participation Research Centre (PPRC) and Brac Institute for Governance and Development (BIGD) in April 2020 ‘brought to attention the plight of a segment of those who were above the poverty line in February but fell into poverty. These vulnerable non-poor subsisting on average about 40% above the poverty line income suffered a 66% drop in income between February and early April and are suddenly a new group of what we have characterized as the ‘New poor’ with particular concentration in urban centres. They will add an additional layer of as much as 22 to 25% to the 20.5% of poor.” (Rahman, The Daily Star, 5 May 2020).
Dealing with poverty and extreme poverty in post-Cornavirus pandemic thus stands to be huge challenge. It is true that members of the excluded communities, social outcasts and marginalized communities mentioned in table 1 receive benefits from select SSNPs under social protection. But the benefits they get are meagre in many instances compared to the benefits that the recipients get from large SSNPs [such as pension for the retired government employees and honorarium for the freedom fighters]. And ‘inadequate funding, implementation-related difficulties and malpractices that result in a high degree of targeting errors’ lead to ‘exclusion of many poor and vulnerable people from the coverage of Social Security Programmes (SSPs).” (PRI, April 2019).
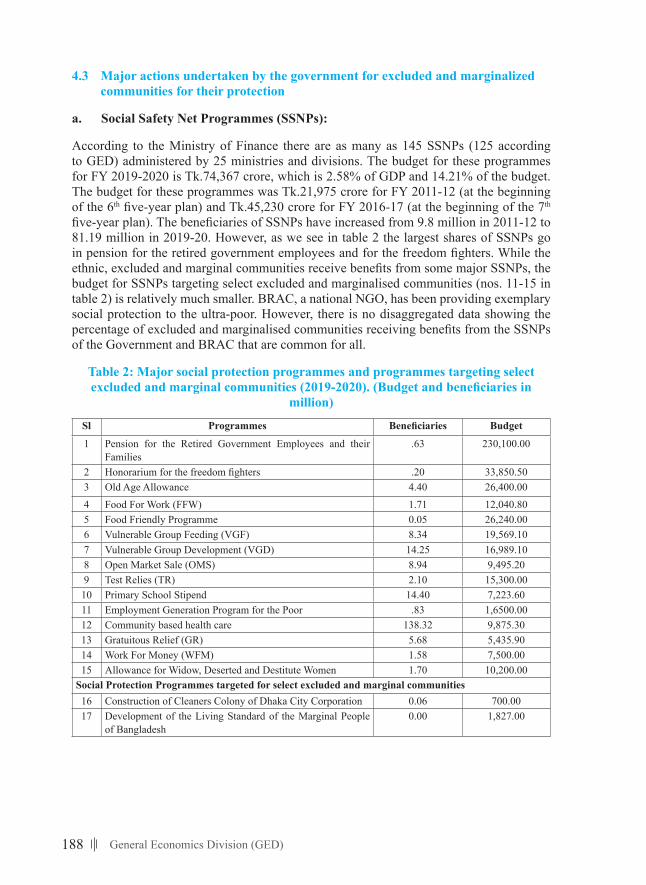
188 General Economics Division (GED)
4.3 Major actions undertaken by the government for excluded and marginalized communities for their protection
a. Social Safety Net Programmes (SSNPs):
According to the Ministry of Finance there are as many as 145 SSNPs (125 according to GED) administered by 25 ministries and divisions. The budget for these programmes for FY 2019-2020 is Tk.74,367 crore, which is 2.58% of GDP and 14.21% of the budget. The budget for these programmes was Tk.21,975 crore for FY 2011-12 (at the beginning of the 6th five-year plan) and Tk.45,230 crore for FY 2016-17 (at the beginning of the 7th five-year plan). The beneficiaries of SSNPs have increased from 9.8 million in 2011-12 to 81.19 million in 2019-20. However, as we see in table 2 the largest shares of SSNPs go in pension for the retired government employees and for the freedom fighters. While the ethnic, excluded and marginal communities receive benefits from some major SSNPs, the budget for SSNPs targeting select excluded and marginalised communities (nos. 11-15 in table 2) is relatively much smaller. BRAC, a national NGO, has been providing exemplary social protection to the ultra-poor. However, there is no disaggregated data showing the percentage of excluded and marginalised communities receiving benefits from the SSNPs of the Government and BRAC that are common for all.
Table 2: Major social protection programmes and programmes targeting select excludedandmarginalcommunities(2019-2020).(Budgetandbeneficiariesin
million)
Sl Programmes Beneficiaries Budget
1 Pension for the Retired Government Employees and their Families
.63 230,100.00
2 Honorarium for the freedom fighters .20 33,850.503 Old Age Allowance 4.40 26,400.004 Food For Work (FFW) 1.71 12,040.805 Food Friendly Programme 0.05 26,240.006 Vulnerable Group Feeding (VGF) 8.34 19,569.107 Vulnerable Group Development (VGD) 14.25 16,989.108 Open Market Sale (OMS) 8.94 9,495.209 Test Relies (TR) 2.10 15,300.0010 Primary School Stipend 14.40 7,223.6011 Employment Generation Program for the Poor .83 1,6500.0012 Community based health care 138.32 9,875.3013 Gratuitous Relief (GR) 5.68 5,435.9014 Work For Money (WFM) 1.58 7,500.0015 Allowance for Widow, Deserted and Destitute Women 1.70 10,200.00
Social Protection Programmes targeted for select excluded and marginal communities 16 Construction of Cleaners Colony of Dhaka City Corporation 0.06 700.0017 Development of the Living Standard of the Marginal People
of Bangladesh0.00 1,827.00
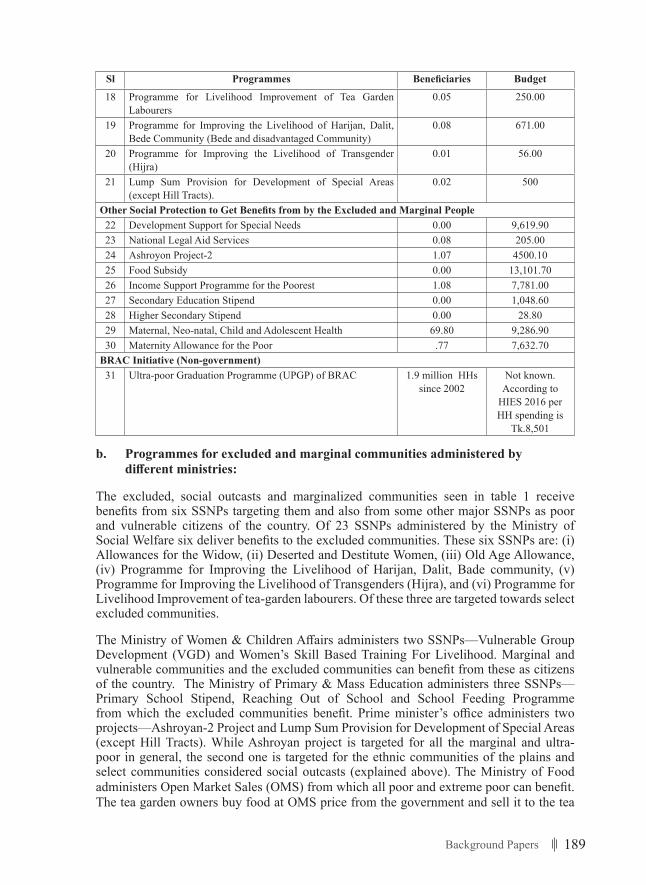
189Background Papers
Sl Programmes Beneficiaries Budget
18 Programme for Livelihood Improvement of Tea Garden Labourers
0.05 250.00
19 Programme for Improving the Livelihood of Harijan, Dalit, Bede Community (Bede and disadvantaged Community)
0.08 671.00
20 Programme for Improving the Livelihood of Transgender (Hijra)
0.01 56.00
21 Lump Sum Provision for Development of Special Areas (except Hill Tracts).
0.02 500
OtherSocialProtectiontoGetBenefitsfrombytheExcludedandMarginalPeople22 Development Support for Special Needs 0.00 9,619.9023 National Legal Aid Services 0.08 205.0024 Ashroyon Project-2 1.07 4500.1025 Food Subsidy 0.00 13,101.7026 Income Support Programme for the Poorest 1.08 7,781.0027 Secondary Education Stipend 0.00 1,048.6028 Higher Secondary Stipend 0.00 28.8029 Maternal, Neo-natal, Child and Adolescent Health 69.80 9,286.9030 Maternity Allowance for the Poor .77 7,632.70
BRAC Initiative (Non-government)31 Ultra-poor Graduation Programme (UPGP) of BRAC 1.9 million HHs
since 2002Not known.
According to HIES 2016 per HH spending is
Tk.8,501
b. Programmes for excluded and marginal communities administered by differentministries:
The excluded, social outcasts and marginalized communities seen in table 1 receive benefits from six SSNPs targeting them and also from some other major SSNPs as poor and vulnerable citizens of the country. Of 23 SSNPs administered by the Ministry of Social Welfare six deliver benefits to the excluded communities. These six SSNPs are: (i) Allowances for the Widow, (ii) Deserted and Destitute Women, (iii) Old Age Allowance, (iv) Programme for Improving the Livelihood of Harijan, Dalit, Bade community, (v) Programme for Improving the Livelihood of Transgenders (Hijra), and (vi) Programme for Livelihood Improvement of tea-garden labourers. Of these three are targeted towards select excluded communities.
The Ministry of Women & Children Affairs administers two SSNPs—Vulnerable Group Development (VGD) and Women’s Skill Based Training For Livelihood. Marginal and vulnerable communities and the excluded communities can benefit from these as citizens of the country. The Ministry of Primary & Mass Education administers three SSNPs—Primary School Stipend, Reaching Out of School and School Feeding Programme from which the excluded communities benefit. Prime minister’s office administers two projects—Ashroyan-2 Project and Lump Sum Provision for Development of Special Areas (except Hill Tracts). While Ashroyan project is targeted for all the marginal and ultra-poor in general, the second one is targeted for the ethnic communities of the plains and select communities considered social outcasts (explained above). The Ministry of Food administers Open Market Sales (OMS) from which all poor and extreme poor can benefit. The tea garden owners buy food at OMS price from the government and sell it to the tea
190 General Economics Division (GED)
workers at subsidized price [of Taka 2 per kilogram rice or wheat flour]. The Ministry of Law, Justice and Parliamentary Affairs administers National Legal Aid Services, which is supposed to provide legal aid service to the low-income citizens (SSPS, GED).
c. Initiativeoftheprimeminister’sofficefortheethniccommunities
The prime minister’s office has an initiative, ‘Development Assistance for Small Ethnic Communities Living in Plain Land’, a special initiative to provide development assistance to the plains land ethnic communities. Starting in 1996 with a budget of Taka five crore, the initiative has gradually scaled up financial support with Taka 40 crores allocated for 2018-2019 and Taka 50 crores allocated for 2019-2020. The initiative came under SSNP, ‘Lump Sum Provision for Development of Special Areas (except Hill Tracts)’ in 2013-14. The initiative provides financial support for income generating projects that come from the beneficiaries. Support is given for economic activities such as solar power, animal husbandry, computer training, sewing training, handloom training, van-rickshaw, fish cultivation, vehicle, shoe making, betel leaf cultivation, poultry, handloom handicrafts, etc. Until recently support from this initiative was awarded only to the ethnic communities. From 2016-2017 a few other marginalized groups such as ‘Dalit’ and tea workers have been included as recipients of benefits from the initiative. In 2018-2019 the beneficiaries in 220 Upazilas in 45 districts outside the CHT received benefits under the initiative.
The beneficiaries, however, have observations about the initiative. They want their views and suggestions taken into account on matters such as preparation of the budget and allocations. They also want the prime minister’s office to provide support to deal with land disputes and human rights abuses they face, which they of course can access from National Legal Aid Services organisations (NLASO). Currently, there is very little awareness about NLASO. They also want support from the initiative to facilitate their access to khas land and other opportunities.
d. Someotheraffirmativeactionsandsafeguards
d.i. ‘Tribals’ quota (5 per cent) in the government services has been annulled along with abolition of quotas in the government jobs altogether. The quota had provided significant opportunities in the government administration, police and other services. However, the quotas for the ‘tribal’ and ‘dalit’ students still exist for admission public universities (except for medical and engineering studies).
d.ii. An important safeguard for the ethnic communities of the plains is the East Bengal State Acquisition and Tenancy Act (EBSATA) of 1950, a substantive law protected by the constitution, even though the significance of the law has much decreased due to many amendments. This law restricts transfer of land of ‘aboriginal’ and ‘tribal’ people to non-aboriginal and Bangalees, at least not without consulting Tribal Welfare Association (TWA), an organization based in Greater Mymensingh district. The law stipulates that it is only for ‘serious reasons’ certified by the Deputy Commissioner (DC) that a ‘tribal’ can proceed to sell land to a non-tribal. This law is reportedly ignored and bypassed in many cases and the ethnic communities continue to lose their land. Poverty and lack of awareness on the part of the ethnic communities and manoeuvrings on the part of the Bangalees contribute to making the safeguard provided by EBSATA ineffective. The loss of property especially land is a serious issue for economic development and protection of the ethnic communities.
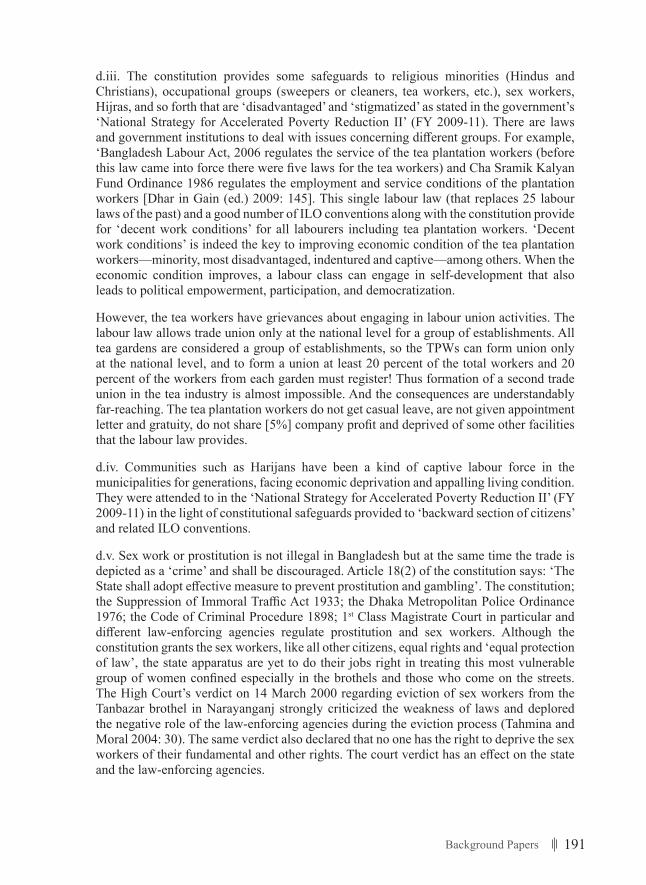
191Background Papers
d.iii. The constitution provides some safeguards to religious minorities (Hindus and Christians), occupational groups (sweepers or cleaners, tea workers, etc.), sex workers, Hijras, and so forth that are ‘disadvantaged’ and ‘stigmatized’ as stated in the government’s ‘National Strategy for Accelerated Poverty Reduction II’ (FY 2009-11). There are laws and government institutions to deal with issues concerning different groups. For example, ‘Bangladesh Labour Act, 2006 regulates the service of the tea plantation workers (before this law came into force there were five laws for the tea workers) and Cha Sramik Kalyan Fund Ordinance 1986 regulates the employment and service conditions of the plantation workers [Dhar in Gain (ed.) 2009: 145]. This single labour law (that replaces 25 labour laws of the past) and a good number of ILO conventions along with the constitution provide for ‘decent work conditions’ for all labourers including tea plantation workers. ‘Decent work conditions’ is indeed the key to improving economic condition of the tea plantation workers—minority, most disadvantaged, indentured and captive—among others. When the economic condition improves, a labour class can engage in self-development that also leads to political empowerment, participation, and democratization.
However, the tea workers have grievances about engaging in labour union activities. The labour law allows trade union only at the national level for a group of establishments. All tea gardens are considered a group of establishments, so the TPWs can form union only at the national level, and to form a union at least 20 percent of the total workers and 20 percent of the workers from each garden must register! Thus formation of a second trade union in the tea industry is almost impossible. And the consequences are understandably far-reaching. The tea plantation workers do not get casual leave, are not given appointment letter and gratuity, do not share [5%] company profit and deprived of some other facilities that the labour law provides.
d.iv. Communities such as Harijans have been a kind of captive labour force in the municipalities for generations, facing economic deprivation and appalling living condition. They were attended to in the ‘National Strategy for Accelerated Poverty Reduction II’ (FY 2009-11) in the light of constitutional safeguards provided to ‘backward section of citizens’ and related ILO conventions.
d.v. Sex work or prostitution is not illegal in Bangladesh but at the same time the trade is depicted as a ‘crime’ and shall be discouraged. Article 18(2) of the constitution says: ‘The State shall adopt effective measure to prevent prostitution and gambling’. The constitution; the Suppression of Immoral Traffic Act 1933; the Dhaka Metropolitan Police Ordinance 1976; the Code of Criminal Procedure 1898; 1st Class Magistrate Court in particular and different law-enforcing agencies regulate prostitution and sex workers. Although the constitution grants the sex workers, like all other citizens, equal rights and ‘equal protection of law’, the state apparatus are yet to do their jobs right in treating this most vulnerable group of women confined especially in the brothels and those who come on the streets. The High Court’s verdict on 14 March 2000 regarding eviction of sex workers from the Tanbazar brothel in Narayanganj strongly criticized the weakness of laws and deplored the negative role of the law-enforcing agencies during the eviction process (Tahmina and Moral 2004: 30). The same verdict also declared that no one has the right to deprive the sex workers of their fundamental and other rights. The court verdict has an effect on the state and the law-enforcing agencies.
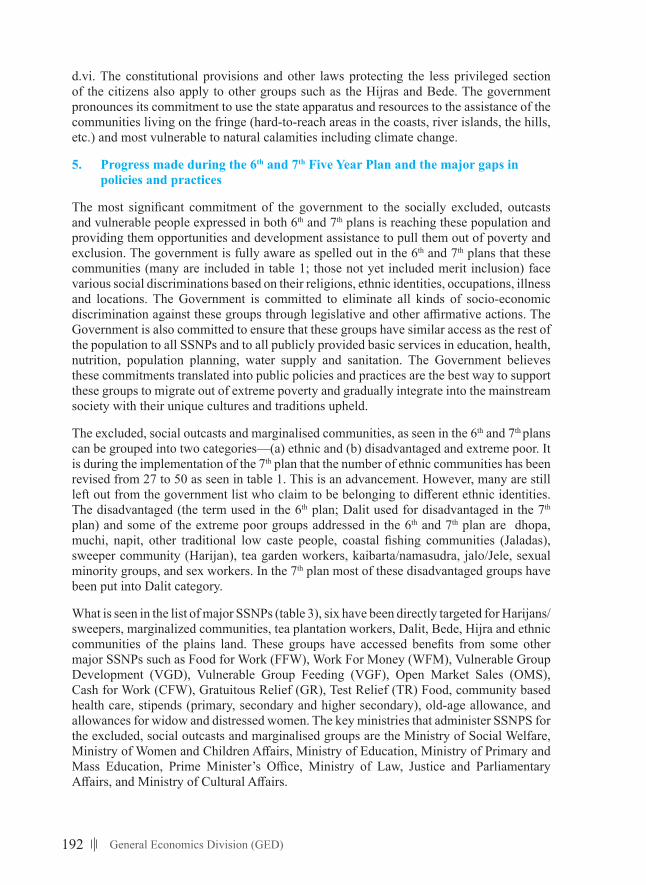
192 General Economics Division (GED)
d.vi. The constitutional provisions and other laws protecting the less privileged section of the citizens also apply to other groups such as the Hijras and Bede. The government pronounces its commitment to use the state apparatus and resources to the assistance of the communities living on the fringe (hard-to-reach areas in the coasts, river islands, the hills, etc.) and most vulnerable to natural calamities including climate change.
5. Progress made during the 6th and 7th Five Year Plan and the major gaps in policies and practices
The most significant commitment of the government to the socially excluded, outcasts and vulnerable people expressed in both 6th and 7th plans is reaching these population and providing them opportunities and development assistance to pull them out of poverty and exclusion. The government is fully aware as spelled out in the 6th and 7th plans that these communities (many are included in table 1; those not yet included merit inclusion) face various social discriminations based on their religions, ethnic identities, occupations, illness and locations. The Government is committed to eliminate all kinds of socio-economic discrimination against these groups through legislative and other affirmative actions. The Government is also committed to ensure that these groups have similar access as the rest of the population to all SSNPs and to all publicly provided basic services in education, health, nutrition, population planning, water supply and sanitation. The Government believes these commitments translated into public policies and practices are the best way to support these groups to migrate out of extreme poverty and gradually integrate into the mainstream society with their unique cultures and traditions upheld.
The excluded, social outcasts and marginalised communities, as seen in the 6th and 7th plans can be grouped into two categories—(a) ethnic and (b) disadvantaged and extreme poor. It is during the implementation of the 7th plan that the number of ethnic communities has been revised from 27 to 50 as seen in table 1. This is an advancement. However, many are still left out from the government list who claim to be belonging to different ethnic identities. The disadvantaged (the term used in the 6th plan; Dalit used for disadvantaged in the 7th
plan) and some of the extreme poor groups addressed in the 6th and 7th plan are dhopa, muchi, napit, other traditional low caste people, coastal fishing communities (Jaladas), sweeper community (Harijan), tea garden workers, kaibarta/namasudra, jalo/Jele, sexual minority groups, and sex workers. In the 7th plan most of these disadvantaged groups have been put into Dalit category.
What is seen in the list of major SSNPs (table 3), six have been directly targeted for Harijans/sweepers, marginalized communities, tea plantation workers, Dalit, Bede, Hijra and ethnic communities of the plains land. These groups have accessed benefits from some other major SSNPs such as Food for Work (FFW), Work For Money (WFM), Vulnerable Group Development (VGD), Vulnerable Group Feeding (VGF), Open Market Sales (OMS), Cash for Work (CFW), Gratuitous Relief (GR), Test Relief (TR) Food, community based health care, stipends (primary, secondary and higher secondary), old-age allowance, and allowances for widow and distressed women. The key ministries that administer SSNPS for the excluded, social outcasts and marginalised groups are the Ministry of Social Welfare, Ministry of Women and Children Affairs, Ministry of Education, Ministry of Primary and Mass Education, Prime Minister’s Office, Ministry of Law, Justice and Parliamentary Affairs, and Ministry of Cultural Affairs.
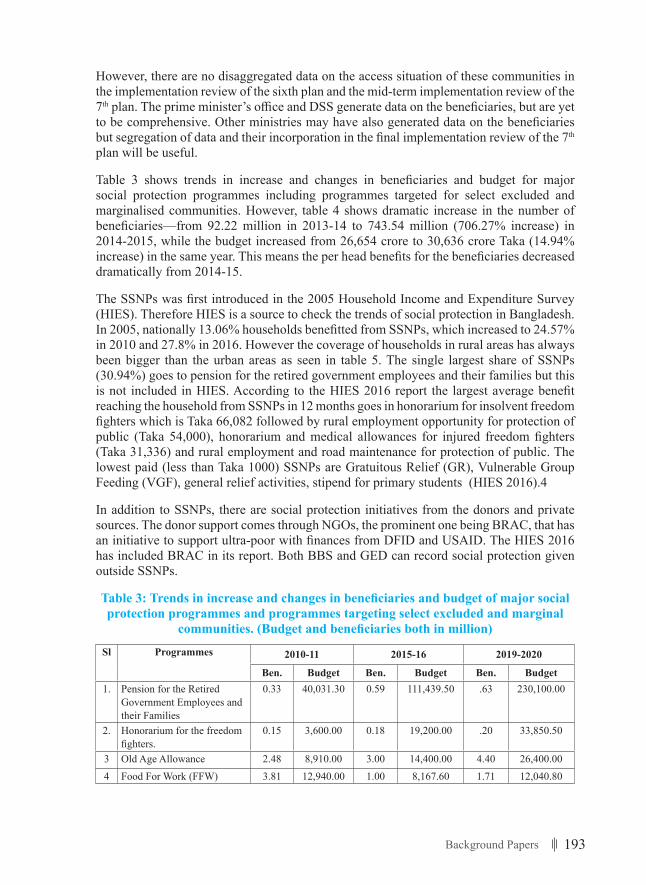
193Background Papers
However, there are no disaggregated data on the access situation of these communities in the implementation review of the sixth plan and the mid-term implementation review of the 7th plan. The prime minister’s office and DSS generate data on the beneficiaries, but are yet to be comprehensive. Other ministries may have also generated data on the beneficiaries but segregation of data and their incorporation in the final implementation review of the 7th plan will be useful.
Table 3 shows trends in increase and changes in beneficiaries and budget for major social protection programmes including programmes targeted for select excluded and marginalised communities. However, table 4 shows dramatic increase in the number of beneficiaries—from 92.22 million in 2013-14 to 743.54 million (706.27% increase) in 2014-2015, while the budget increased from 26,654 crore to 30,636 crore Taka (14.94% increase) in the same year. This means the per head benefits for the beneficiaries decreased dramatically from 2014-15.
The SSNPs was first introduced in the 2005 Household Income and Expenditure Survey (HIES). Therefore HIES is a source to check the trends of social protection in Bangladesh. In 2005, nationally 13.06% households benefitted from SSNPs, which increased to 24.57% in 2010 and 27.8% in 2016. However the coverage of households in rural areas has always been bigger than the urban areas as seen in table 5. The single largest share of SSNPs (30.94%) goes to pension for the retired government employees and their families but this is not included in HIES. According to the HIES 2016 report the largest average benefit reaching the household from SSNPs in 12 months goes in honorarium for insolvent freedom fighters which is Taka 66,082 followed by rural employment opportunity for protection of public (Taka 54,000), honorarium and medical allowances for injured freedom fighters (Taka 31,336) and rural employment and road maintenance for protection of public. The lowest paid (less than Taka 1000) SSNPs are Gratuitous Relief (GR), Vulnerable Group Feeding (VGF), general relief activities, stipend for primary students (HIES 2016).4
In addition to SSNPs, there are social protection initiatives from the donors and private sources. The donor support comes through NGOs, the prominent one being BRAC, that has an initiative to support ultra-poor with finances from DFID and USAID. The HIES 2016 has included BRAC in its report. Both BBS and GED can record social protection given outside SSNPs.
Table3:Trendsinincreaseandchangesinbeneficiariesandbudgetofmajorsocialprotection programmes and programmes targeting select excluded and marginal
communities.(Budgetandbeneficiariesbothinmillion)
Sl Programmes 2010-11 2015-16 2019-2020
Ben. Budget Ben. Budget Ben. Budget1. Pension for the Retired
Government Employees and their Families
0.33 40,031.30 0.59 111,439.50 .63 230,100.00
2. Honorarium for the freedom fighters.
0.15 3,600.00 0.18 19,200.00 .20 33,850.50
3 Old Age Allowance 2.48 8,910.00 3.00 14,400.00 4.40 26,400.004 Food For Work (FFW) 3.81 12,940.00 1.00 8,167.60 1.71 12,040.80
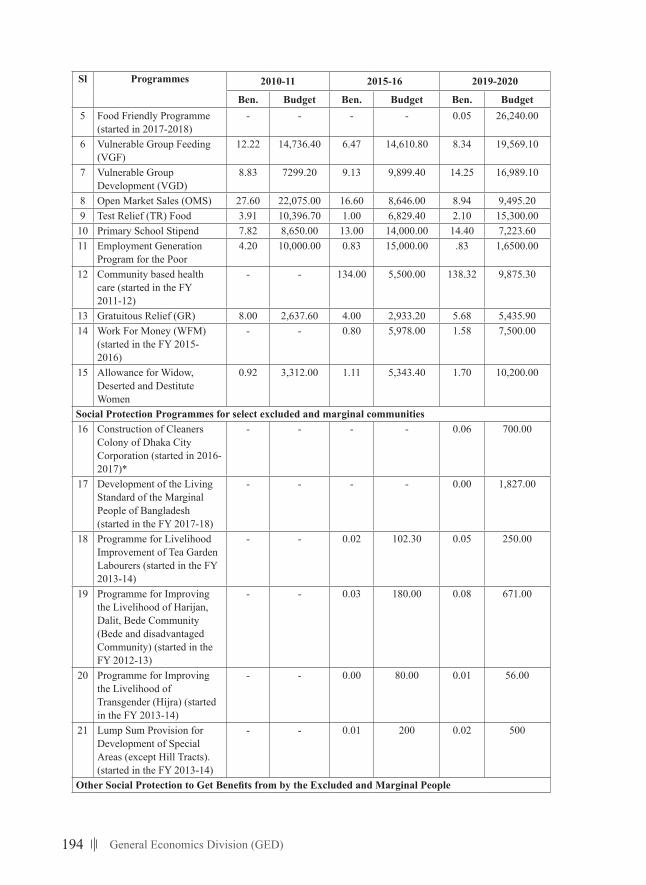
194 General Economics Division (GED)
Sl Programmes 2010-11 2015-16 2019-2020
Ben. Budget Ben. Budget Ben. Budget5 Food Friendly Programme
(started in 2017-2018)- - - - 0.05 26,240.00
6 Vulnerable Group Feeding (VGF)
12.22 14,736.40 6.47 14,610.80 8.34 19,569.10
7 Vulnerable Group Development (VGD)
8.83 7299.20 9.13 9,899.40 14.25 16,989.10
8 Open Market Sales (OMS) 27.60 22,075.00 16.60 8,646.00 8.94 9,495.209 Test Relief (TR) Food 3.91 10,396.70 1.00 6,829.40 2.10 15,300.0010 Primary School Stipend 7.82 8,650.00 13.00 14,000.00 14.40 7,223.6011 Employment Generation
Program for the Poor 4.20 10,000.00 0.83 15,000.00 .83 1,6500.00
12 Community based health care (started in the FY 2011-12)
- - 134.00 5,500.00 138.32 9,875.30
13 Gratuitous Relief (GR) 8.00 2,637.60 4.00 2,933.20 5.68 5,435.9014 Work For Money (WFM)
(started in the FY 2015-2016)
- - 0.80 5,978.00 1.58 7,500.00
15 Allowance for Widow, Deserted and Destitute Women
0.92 3,312.00 1.11 5,343.40 1.70 10,200.00
Social Protection Programmes for select excluded and marginal communities 16 Construction of Cleaners
Colony of Dhaka City Corporation (started in 2016-2017)*
- - - - 0.06 700.00
17 Development of the Living Standard of the Marginal People of Bangladesh (started in the FY 2017-18)
- - - - 0.00 1,827.00
18 Programme for Livelihood Improvement of Tea Garden Labourers (started in the FY 2013-14)
- - 0.02 102.30 0.05 250.00
19 Programme for Improving the Livelihood of Harijan, Dalit, Bede Community (Bede and disadvantaged Community) (started in the FY 2012-13)
- - 0.03 180.00 0.08 671.00
20 Programme for Improving the Livelihood of Transgender (Hijra) (started in the FY 2013-14)
- - 0.00 80.00 0.01 56.00
21 Lump Sum Provision for Development of Special Areas (except Hill Tracts). (started in the FY 2013-14)
- - 0.01 200 0.02 500
OtherSocialProtectiontoGetBenefitsfrombytheExcludedandMarginalPeople
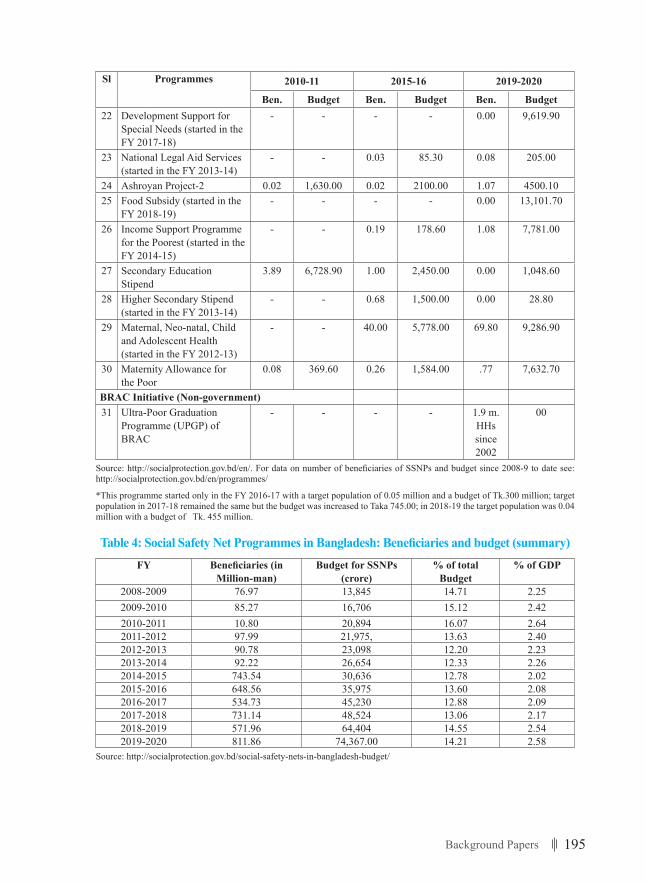
195Background Papers
Sl Programmes 2010-11 2015-16 2019-2020
Ben. Budget Ben. Budget Ben. Budget22 Development Support for
Special Needs (started in the FY 2017-18)
- - - - 0.00 9,619.90
23 National Legal Aid Services (started in the FY 2013-14)
- - 0.03 85.30 0.08 205.00
24 Ashroyan Project-2 0.02 1,630.00 0.02 2100.00 1.07 4500.1025 Food Subsidy (started in the
FY 2018-19)- - - - 0.00 13,101.70
26 Income Support Programme for the Poorest (started in the FY 2014-15)
- - 0.19 178.60 1.08 7,781.00
27 Secondary Education Stipend
3.89 6,728.90 1.00 2,450.00 0.00 1,048.60
28 Higher Secondary Stipend (started in the FY 2013-14)
- - 0.68 1,500.00 0.00 28.80
29 Maternal, Neo-natal, Child and Adolescent Health (started in the FY 2012-13)
- - 40.00 5,778.00 69.80 9,286.90
30 Maternity Allowance for the Poor
0.08 369.60 0.26 1,584.00 .77 7,632.70
BRAC Initiative (Non-government)31 Ultra-Poor Graduation
Programme (UPGP) of BRAC
- - - - 1.9 m. HHs since 2002
00
Source: http://socialprotection.gov.bd/en/. For data on number of beneficiaries of SSNPs and budget since 2008-9 to date see: http://socialprotection.gov.bd/en/programmes/
*This programme started only in the FY 2016-17 with a target population of 0.05 million and a budget of Tk.300 million; target population in 2017-18 remained the same but the budget was increased to Taka 745.00; in 2018-19 the target population was 0.04 million with a budget of Tk. 455 million.
Table4:SocialSafetyNetProgrammesinBangladesh:Beneficiariesandbudget(summary)FY Beneficiaries(in
Million-man)Budget for SSNPs
(crore)% of total
Budget % of GDP
2008-2009 76.97 13,845 14.71 2.252009-2010 85.27 16,706 15.12 2.422010-2011 10.80 20,894 16.07 2.642011-2012 97.99 21,975, 13.63 2.402012-2013 90.78 23,098 12.20 2.232013-2014 92.22 26,654 12.33 2.262014-2015 743.54 30,636 12.78 2.022015-2016 648.56 35,975 13.60 2.082016-2017 534.73 45,230 12.88 2.092017-2018 731.14 48,524 13.06 2.172018-2019 571.96 64,404 14.55 2.542019-2020 811.86 74,367.00 14.21 2.58
Source: http://socialprotection.gov.bd/social-safety-nets-in-bangladesh-budget/
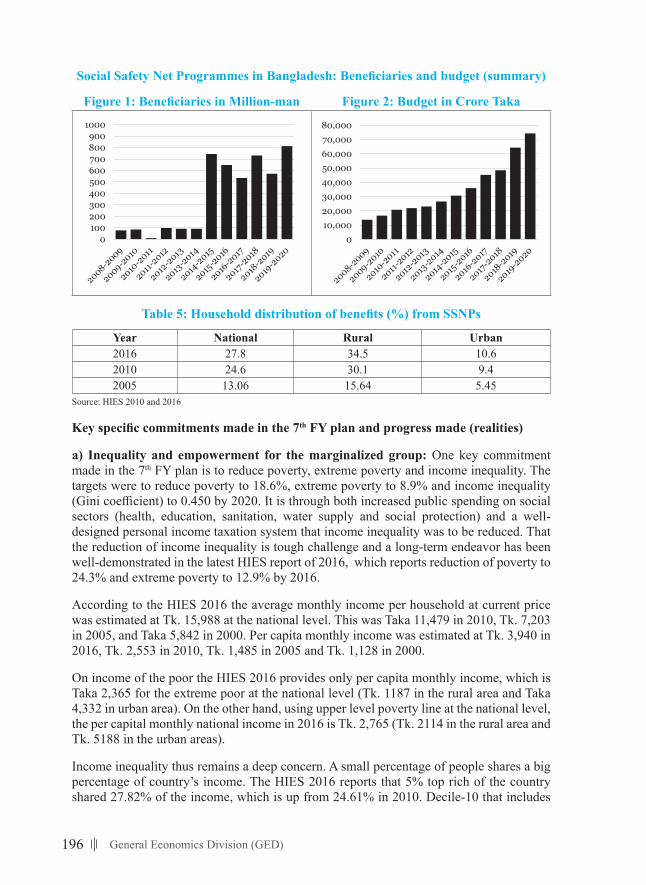
196 General Economics Division (GED)
SocialSafetyNetProgrammesinBangladesh:Beneficiariesandbudget(summary)
Figure1:BeneficiariesinMillion-man Figure 2: Budget in Crore Taka
Figure 1: Beneficiaries in Million-man Figure 2: Budget in Crore Taka
01002003004005006007008009001000
010,00020,00030,00040,00050,00060,00070,00080,000
Figure 1: Beneficiaries in Million-man Figure 2: Budget in Crore Taka
01002003004005006007008009001000
010,00020,00030,00040,00050,00060,00070,00080,000
Table5:Householddistributionofbenefits(%)fromSSNPs
Year National Rural Urban2016 27.8 34.5 10.62010 24.6 30.1 9.42005 13.06 15.64 5.45
Source: HIES 2010 and 2016
Keyspecificcommitmentsmadeinthe7th FY plan and progress made (realities)
a) Inequality and empowerment for the marginalized group: One key commitment made in the 7th FY plan is to reduce poverty, extreme poverty and income inequality. The targets were to reduce poverty to 18.6%, extreme poverty to 8.9% and income inequality (Gini coefficient) to 0.450 by 2020. It is through both increased public spending on social sectors (health, education, sanitation, water supply and social protection) and a well-designed personal income taxation system that income inequality was to be reduced. That the reduction of income inequality is tough challenge and a long-term endeavor has been well-demonstrated in the latest HIES report of 2016, which reports reduction of poverty to 24.3% and extreme poverty to 12.9% by 2016.
According to the HIES 2016 the average monthly income per household at current price was estimated at Tk. 15,988 at the national level. This was Taka 11,479 in 2010, Tk. 7,203 in 2005, and Taka 5,842 in 2000. Per capita monthly income was estimated at Tk. 3,940 in 2016, Tk. 2,553 in 2010, Tk. 1,485 in 2005 and Tk. 1,128 in 2000.
On income of the poor the HIES 2016 provides only per capita monthly income, which is Taka 2,365 for the extreme poor at the national level (Tk. 1187 in the rural area and Taka 4,332 in urban area). On the other hand, using upper level poverty line at the national level, the per capital monthly national income in 2016 is Tk. 2,765 (Tk. 2114 in the rural area and Tk. 5188 in the urban areas).
Income inequality thus remains a deep concern. A small percentage of people shares a big percentage of country’s income. The HIES 2016 reports that 5% top rich of the country shared 27.82% of the income, which is up from 24.61% in 2010. Decile-10 that includes
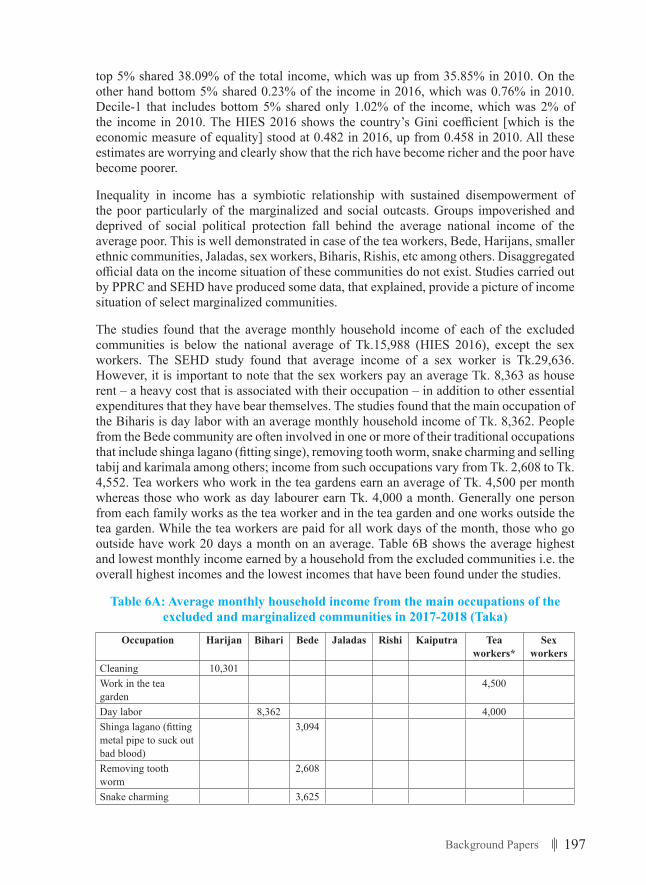
197Background Papers
top 5% shared 38.09% of the total income, which was up from 35.85% in 2010. On the other hand bottom 5% shared 0.23% of the income in 2016, which was 0.76% in 2010. Decile-1 that includes bottom 5% shared only 1.02% of the income, which was 2% of the income in 2010. The HIES 2016 shows the country’s Gini coefficient [which is the economic measure of equality] stood at 0.482 in 2016, up from 0.458 in 2010. All these estimates are worrying and clearly show that the rich have become richer and the poor have become poorer.
Inequality in income has a symbiotic relationship with sustained disempowerment of the poor particularly of the marginalized and social outcasts. Groups impoverished and deprived of social political protection fall behind the average national income of the average poor. This is well demonstrated in case of the tea workers, Bede, Harijans, smaller ethnic communities, Jaladas, sex workers, Biharis, Rishis, etc among others. Disaggregated official data on the income situation of these communities do not exist. Studies carried out by PPRC and SEHD have produced some data, that explained, provide a picture of income situation of select marginalized communities.
The studies found that the average monthly household income of each of the excluded communities is below the national average of Tk.15,988 (HIES 2016), except the sex workers. The SEHD study found that average income of a sex worker is Tk.29,636. However, it is important to note that the sex workers pay an average Tk. 8,363 as house rent – a heavy cost that is associated with their occupation – in addition to other essential expenditures that they have bear themselves. The studies found that the main occupation of the Biharis is day labor with an average monthly household income of Tk. 8,362. People from the Bede community are often involved in one or more of their traditional occupations that include shinga lagano (fitting singe), removing tooth worm, snake charming and selling tabij and karimala among others; income from such occupations vary from Tk. 2,608 to Tk. 4,552. Tea workers who work in the tea gardens earn an average of Tk. 4,500 per month whereas those who work as day labourer earn Tk. 4,000 a month. Generally one person from each family works as the tea worker and in the tea garden and one works outside the tea garden. While the tea workers are paid for all work days of the month, those who go outside have work 20 days a month on an average. Table 6B shows the average highest and lowest monthly income earned by a household from the excluded communities i.e. the overall highest incomes and the lowest incomes that have been found under the studies.
Table 6A: Average monthly household income from the main occupations of the excluded and marginalized communities in 2017-2018 (Taka)
Occupation Harijan Bihari Bede Jaladas Rishi Kaiputra Tea workers*
Sex workers
Cleaning 10,301Work in the tea garden
4,500
Day labor 8,362 4,000Shinga lagano (fitting metal pipe to suck out bad blood)
3,094
Removing tooth worm
2,608
Snake charming 3,625
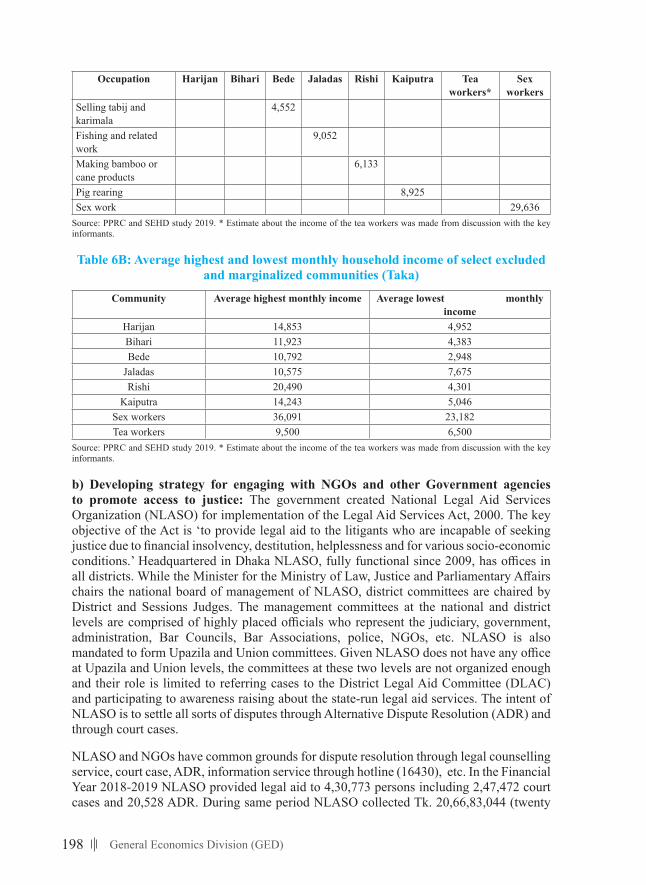
198 General Economics Division (GED)
Occupation Harijan Bihari Bede Jaladas Rishi Kaiputra Tea workers*
Sex workers
Selling tabij and karimala
4,552
Fishing and related work
9,052
Making bamboo or cane products
6,133
Pig rearing 8,925Sex work 29,636
Source: PPRC and SEHD study 2019. * Estimate about the income of the tea workers was made from discussion with the key informants.
Table 6B: Average highest and lowest monthly household income of select excluded and marginalized communities (Taka)
Community Average highest monthly income Average lowest monthly income
Harijan 14,853 4,952Bihari 11,923 4,383Bede 10,792 2,948
Jaladas 10,575 7,675Rishi 20,490 4,301
Kaiputra 14,243 5,046Sex workers 36,091 23,182Tea workers 9,500 6,500
Source: PPRC and SEHD study 2019. * Estimate about the income of the tea workers was made from discussion with the key informants.
b) Developing strategy for engaging with NGOs and other Government agencies to promote access to justice: The government created National Legal Aid Services Organization (NLASO) for implementation of the Legal Aid Services Act, 2000. The key objective of the Act is ‘to provide legal aid to the litigants who are incapable of seeking justice due to financial insolvency, destitution, helplessness and for various socio-economic conditions.’ Headquartered in Dhaka NLASO, fully functional since 2009, has offices in all districts. While the Minister for the Ministry of Law, Justice and Parliamentary Affairs chairs the national board of management of NLASO, district committees are chaired by District and Sessions Judges. The management committees at the national and district levels are comprised of highly placed officials who represent the judiciary, government, administration, Bar Councils, Bar Associations, police, NGOs, etc. NLASO is also mandated to form Upazila and Union committees. Given NLASO does not have any office at Upazila and Union levels, the committees at these two levels are not organized enough and their role is limited to referring cases to the District Legal Aid Committee (DLAC) and participating to awareness raising about the state-run legal aid services. The intent of NLASO is to settle all sorts of disputes through Alternative Dispute Resolution (ADR) and through court cases.
NLASO and NGOs have common grounds for dispute resolution through legal counselling service, court case, ADR, information service through hotline (16430), etc. In the Financial Year 2018-2019 NLASO provided legal aid to 4,30,773 persons including 2,47,472 court cases and 20,528 ADR. During same period NLASO collected Tk. 20,66,83,044 (twenty
199Background Papers
crore sixty six lac eighty three thousand and forty four Taka only) in compensation (NLASO Annual Report 2018-2019). Non-government organization BRAC has a very big legal aid program (also the biggest non-government legal aid organization in the world). It has offices in 408 Upazilas in 61 districts. It works with NLASO side by side. In 2019 BRAC filed 66,500 cases and 57,000 of them were disposed of. The compensation recovery of BRAC was Tk.46 crore and 94 lacs, more than twice the size of government recovery.
What we see in legal assistance given by NLASO, BRAC and other NGOs understandably necessitates close cooperation and working relations with state and non-state actors. The seventh FY plan delineated that NLASO develops a strategy for engaging with NGOs and other Government agencies to promote access to justice. Such engagement and partnerships aimed at setting targets for jointly providing quality legal aid, especially to the poor, women and marginalized. NLASO has a strategic plan for 2012-2022, but it not adequate to foster effective coordination among all actors including NGOs and concerned government agencies. NLASO sources confirmed in April 2020 that the organization has drafted a guideline, which is not yet used. Both NLASO and NGO officials trust that a comprehensive strategy paper should be developed with full participation of all stakeholders.
Matters to be considered, the stakeholders say, in developing the strategy paper include: coordination at national and local levels between the government and non-government organizations giving legal aid; taking advantage of skills and experiences from each other that different organizations have developed and attained; exploring funding for the non-government organizations (NLASO reports it has adequate funds while NGOs especially the small ones report they have serious funding constraint); better equipping the existing structure of NLASO and expanding its operation at upazila and union levels by setting up offices; quick disposal cases; continued capacity building of judges, panel lawyers, paralegal persons and other actors involved in legal aid services; ensuring quality legal aid services; massive campaign to make NLASO’s legal aid services known among those who need them most; correct motivation of the legal aid providers; mitigating discontents of the lawyers and litigants about the legal aid service providers; follow-up and monitoring of cases filed for legal aid; audit of quality of services provided; expanding inclusiveness of coverage with attention to all marginalized communities (in addition to smaller ethnic communities mentioned in the legal aid policy); dealing with strains that may arise between the government and non-government organizations; and dealing with Public Interest Litigation (PIL).
c) Trade Corporation of Bangladesh (TCB) market intervention in selling essential commodities to the impoverished or marginalized people at subsidized prices: TCB with limited outreach and commodities such as edible oil, sugar, onions, flour, and salt become visible in particular times such as the month of Ramadan, disasters or epidemic, or price hike. The poor people in urban areas in particular get some benefits from the subsidized open market sale of rice, wheat, pulse, sugar and a few other items from trucks. In 2020 during the month of Ramadan rice per kg was sold for Taka 10 [which previously was sold for around Taka 30] in the middle of Coronavirus pandemic. Its impact on the marginalized groups of people in the rural areas is reported to be trifle.
However, the tea workers in 163 tea gardens benefit quiet significantly from rice or flour that the owners procure at an Open Market Sale (OMS) from the Ministry of Food and sell it to workers in weekly ration for Taka 2 per kg. Without ration the under-paid tea workers cannot survive, which of course is seen to be a tacit tactic of the tea garden owners to
200 General Economics Division (GED)
keep the tea workers disciplined and submissive to the managements. There is no other marginalized groups such as tea workers who get benefit from purchase of food items.
TCB and OMS, modernized and their coverage widened throughout the year and brought to the doorstep to the marginalized communities, will certainly be useful.
d) Health service delivery system to ensure that the poor, marginalized and geographically disadvantaged population are able to access and utilize health services: The low-income groups including the marginalized and disadvantaged people get free services from the government health systems that include family planning services and care of mother and children from district hospitals, upazila health complexes, union health and family welfare centres, community clinic and satellite clinic (at ward level). Besides, family planning assistants deliver family planning services by visiting families and community-based skilled birth attendants visit families to deliver services to mothers and new-borns. In the tea gardens the tea workers get basic treatment from the dispensaries and hospitals managed by the owners. There is Tea Industry Labour Welfare Department in Sreemangal to provide health training and treatment free of cost. Additionally, there are financial packages for poor and disadvantaged people of low income if they come to the government health facilities.
Nevertheless, communities such as tea workers, Bedes, and Harijans have difficulties accessing proper treatment. The key factors behind are their low income, social condition and distance from their residence.
e) Government initiatives on creating employment opportunities for the poor and marginalized population: While unemployment rate was 4.2% in 2016-2017 (BBS), it is very high among the tea communities, Bede, Harijans, Rishis, Biharis and many small ethnic communities. The Department of Social Services (DSS) organises training programmes for the Bede, Hijra, and a few select marginalized communities [Kamar (blacksmiths), kumar/mrithshilpi potters), Napit (hairdresser/barber), makers of cane and bamboo produces, brassware producers and cobblers (shoe makers)]. In the FY year 2017-2018 DSS provided training to 1900 Hijras, 2000 Bedes and had initially identified 6,918 from among the other disadvantaged communities for training for the next two years who will get financial grants at the end of training (Ministry of Social Welfare, Annual Report 2017-2018). These numbers are really small compared to very big numbers of unemployed among these marginalized communities.
f)Proportionofsocialprotectionreceivedbydifferentgroupsofmarginalizedpeople: There are no official and disaggregated data on proportion of social protection received by different marginalized groups discussed in this paper. As mentioned earlier, in addition to the common SSNPs there are six Social Protection Programmes for the select excluded and marginalized communities ((Table 3, nos. 16-21). In their recent studies (2017-2018), Power and Participation Research Centre (PPRC) and Society for Environment and Human Development (SEHD) have generated some data on access of select marginalized communities in some SSNPs [apart from the targeted SSNPs] as seen in table 7.
The studies conducted in the most populous and well-known locations of these communities found that the Rishis of Khulna Division received assistance from relatively more types of social safety net programmes (SSNPs) compared to the other four communities. The Rishis are a lower caste Hindu community who were traditionally skinners, leather workers and musicians. The Jaladas or the sea-faring Hindu community are included in the least number of SSNPs. The percentage of Bede, Bihari and Harijan (sweeper) households under SSNPS
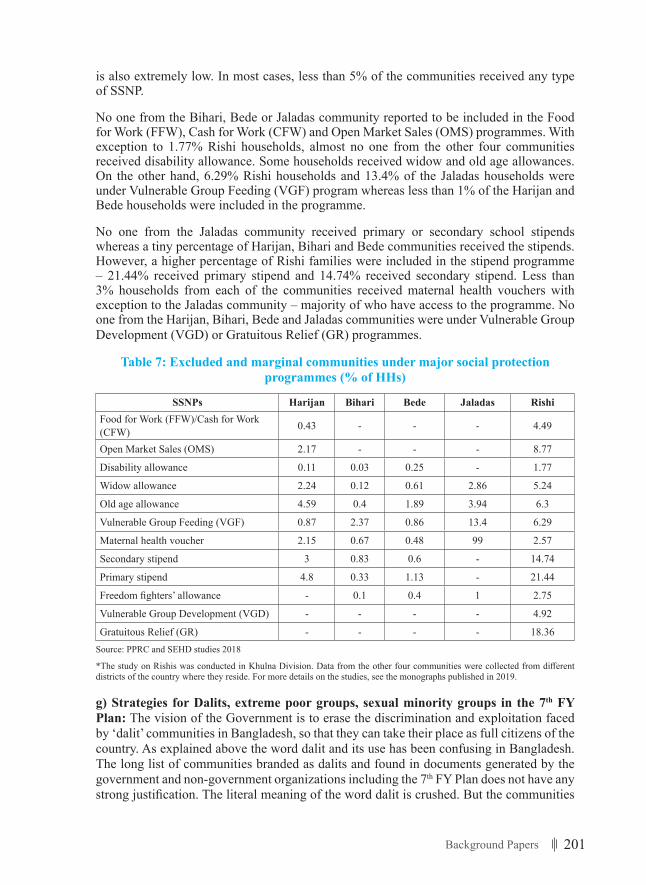
201Background Papers
is also extremely low. In most cases, less than 5% of the communities received any type of SSNP.
No one from the Bihari, Bede or Jaladas community reported to be included in the Food for Work (FFW), Cash for Work (CFW) and Open Market Sales (OMS) programmes. With exception to 1.77% Rishi households, almost no one from the other four communities received disability allowance. Some households received widow and old age allowances. On the other hand, 6.29% Rishi households and 13.4% of the Jaladas households were under Vulnerable Group Feeding (VGF) program whereas less than 1% of the Harijan and Bede households were included in the programme.
No one from the Jaladas community received primary or secondary school stipends whereas a tiny percentage of Harijan, Bihari and Bede communities received the stipends. However, a higher percentage of Rishi families were included in the stipend programme – 21.44% received primary stipend and 14.74% received secondary stipend. Less than 3% households from each of the communities received maternal health vouchers with exception to the Jaladas community – majority of who have access to the programme. No one from the Harijan, Bihari, Bede and Jaladas communities were under Vulnerable Group Development (VGD) or Gratuitous Relief (GR) programmes.
Table 7: Excluded and marginal communities under major social protection programmes (% of HHs)
SSNPs Harijan Bihari Bede Jaladas RishiFood for Work (FFW)/Cash for Work (CFW) 0.43 - - - 4.49
Open Market Sales (OMS) 2.17 - - - 8.77
Disability allowance 0.11 0.03 0.25 - 1.77
Widow allowance 2.24 0.12 0.61 2.86 5.24
Old age allowance 4.59 0.4 1.89 3.94 6.3
Vulnerable Group Feeding (VGF) 0.87 2.37 0.86 13.4 6.29
Maternal health voucher 2.15 0.67 0.48 99 2.57
Secondary stipend 3 0.83 0.6 - 14.74
Primary stipend 4.8 0.33 1.13 - 21.44
Freedom fighters’ allowance - 0.1 0.4 1 2.75
Vulnerable Group Development (VGD) - - - - 4.92
Gratuitous Relief (GR) - - - - 18.36Source: PPRC and SEHD studies 2018
*The study on Rishis was conducted in Khulna Division. Data from the other four communities were collected from different districts of the country where they reside. For more details on the studies, see the monographs published in 2019.
g) Strategies for Dalits, extreme poor groups, sexual minority groups in the 7th FY Plan: The vision of the Government is to erase the discrimination and exploitation faced by ‘dalit’ communities in Bangladesh, so that they can take their place as full citizens of the country. As explained above the word dalit and its use has been confusing in Bangladesh. The long list of communities branded as dalits and found in documents generated by the government and non-government organizations including the 7th FY Plan does not have any strong justification. The literal meaning of the word dalit is crushed. But the communities
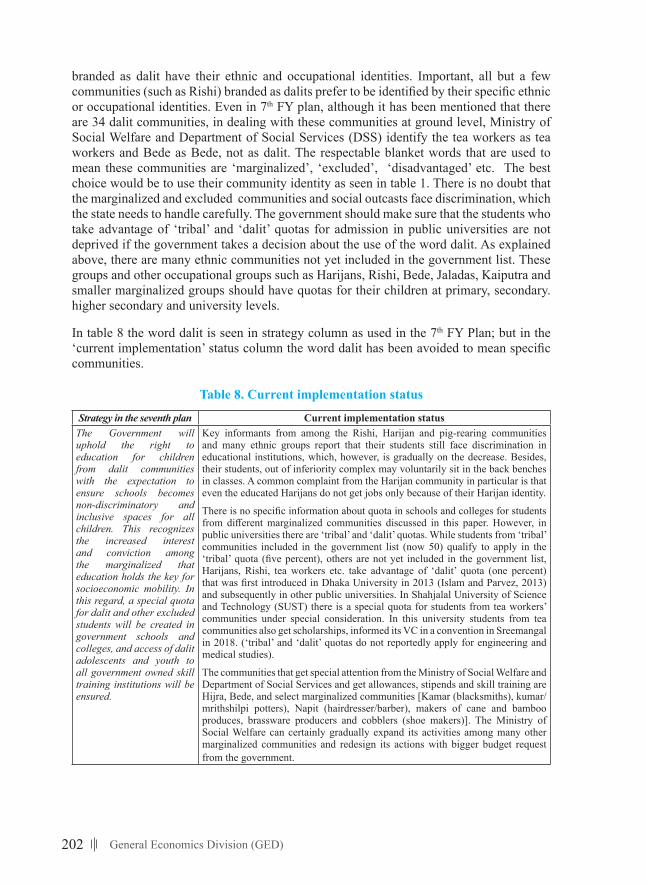
202 General Economics Division (GED)
branded as dalit have their ethnic and occupational identities. Important, all but a few communities (such as Rishi) branded as dalits prefer to be identified by their specific ethnic or occupational identities. Even in 7th FY plan, although it has been mentioned that there are 34 dalit communities, in dealing with these communities at ground level, Ministry of Social Welfare and Department of Social Services (DSS) identify the tea workers as tea workers and Bede as Bede, not as dalit. The respectable blanket words that are used to mean these communities are ‘marginalized’, ‘excluded’, ‘disadvantaged’ etc. The best choice would be to use their community identity as seen in table 1. There is no doubt that the marginalized and excluded communities and social outcasts face discrimination, which the state needs to handle carefully. The government should make sure that the students who take advantage of ‘tribal’ and ‘dalit’ quotas for admission in public universities are not deprived if the government takes a decision about the use of the word dalit. As explained above, there are many ethnic communities not yet included in the government list. These groups and other occupational groups such as Harijans, Rishi, Bede, Jaladas, Kaiputra and smaller marginalized groups should have quotas for their children at primary, secondary. higher secondary and university levels.
In table 8 the word dalit is seen in strategy column as used in the 7th FY Plan; but in the ‘current implementation’ status column the word dalit has been avoided to mean specific communities.
Table 8. Current implementation status
Strategy in the seventh plan Current implementation statusThe Government will uphold the right to education for children from dalit communities with the expectation to ensure schools becomes non-discriminatory and inclusive spaces for all children. This recognizes the increased interest and conviction among the marginalized that education holds the key for socioeconomic mobility. In this regard, a special quota for dalit and other excluded students will be created in government schools and colleges, and access of dalit adolescents and youth to all government owned skill training institutions will be ensured.
Key informants from among the Rishi, Harijan and pig-rearing communities and many ethnic groups report that their students still face discrimination in educational institutions, which, however, is gradually on the decrease. Besides, their students, out of inferiority complex may voluntarily sit in the back benches in classes. A common complaint from the Harijan community in particular is that even the educated Harijans do not get jobs only because of their Harijan identity.
There is no specific information about quota in schools and colleges for students from different marginalized communities discussed in this paper. However, in public universities there are ‘tribal’ and ‘dalit’ quotas. While students from ‘tribal’ communities included in the government list (now 50) qualify to apply in the ‘tribal’ quota (five percent), others are not yet included in the government list, Harijans, Rishi, tea workers etc. take advantage of ‘dalit’ quota (one percent) that was first introduced in Dhaka University in 2013 (Islam and Parvez, 2013) and subsequently in other public universities. In Shahjalal University of Science and Technology (SUST) there is a special quota for students from tea workers’ communities under special consideration. In this university students from tea communities also get scholarships, informed its VC in a convention in Sreemangal in 2018. (‘tribal’ and ‘dalit’ quotas do not reportedly apply for engineering and medical studies).
The communities that get special attention from the Ministry of Social Welfare and Department of Social Services and get allowances, stipends and skill training are Hijra, Bede, and select marginalized communities [Kamar (blacksmiths), kumar/mrithshilpi potters), Napit (hairdresser/barber), makers of cane and bamboo produces, brassware producers and cobblers (shoe makers)]. The Ministry of Social Welfare can certainly gradually expand its activities among many other marginalized communities and redesign its actions with bigger budget request from the government.
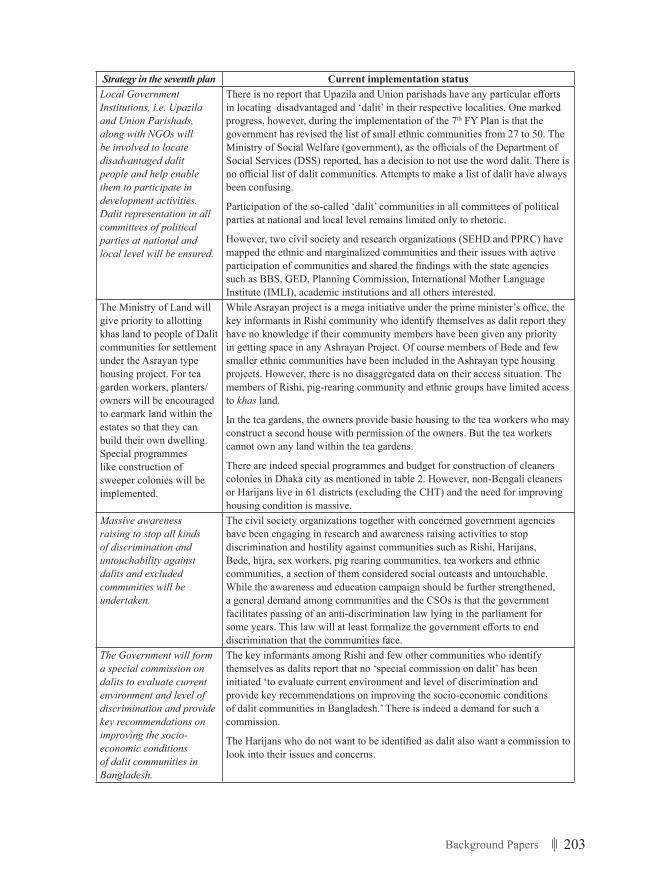
203Background Papers
Strategy in the seventh plan Current implementation statusLocal Government Institutions, i.e. Upazila and Union Parishads, along with NGOs will be involved to locate disadvantaged dalit people and help enable them to participate in development activities. Dalit representation in all committees of political parties at national and local level will be ensured.
There is no report that Upazila and Union parishads have any particular efforts in locating disadvantaged and ‘dalit’ in their respective localities. One marked progress, however, during the implementation of the 7th FY Plan is that the government has revised the list of small ethnic communities from 27 to 50. The Ministry of Social Welfare (government), as the officials of the Department of Social Services (DSS) reported, has a decision to not use the word dalit. There is no official list of dalit communities. Attempts to make a list of dalit have always been confusing.
Participation of the so-called ‘dalit’ communities in all committees of political parties at national and local level remains limited only to rhetoric.
However, two civil society and research organizations (SEHD and PPRC) have mapped the ethnic and marginalized communities and their issues with active participation of communities and shared the findings with the state agencies such as BBS, GED, Planning Commission, International Mother Language Institute (IMLI), academic institutions and all others interested.
The Ministry of Land will give priority to allotting khas land to people of Dalit communities for settlement under the Asrayan type housing project. For tea garden workers, planters/owners will be encouraged to earmark land within the estates so that they can build their own dwelling. Special programmes like construction of sweeper colonies will be implemented.
While Asrayan project is a mega initiative under the prime minister’s office, the key informants in Rishi community who identify themselves as dalit report they have no knowledge if their community members have been given any priority in getting space in any Ashrayan Project. Of course members of Bede and few smaller ethnic communities have been included in the Ashrayan type housing projects. However, there is no disaggregated data on their access situation. The members of Rishi, pig-rearing community and ethnic groups have limited access to khas land.
In the tea gardens, the owners provide basic housing to the tea workers who may construct a second house with permission of the owners. But the tea workers cannot own any land within the tea gardens.
There are indeed special programmes and budget for construction of cleaners colonies in Dhaka city as mentioned in table 2. However, non-Bengali cleaners or Harijans live in 61 districts (excluding the CHT) and the need for improving housing condition is massive.
Massive awareness raising to stop all kinds of discrimination and untouchability against dalits and excluded communities will be undertaken.
The civil society organizations together with concerned government agencies have been engaging in research and awareness raising activities to stop discrimination and hostility against communities such as Rishi, Harijans, Bede, hijra, sex workers, pig rearing communities, tea workers and ethnic communities, a section of them considered social outcasts and untouchable. While the awareness and education campaign should be further strengthened, a general demand among communities and the CSOs is that the government facilitates passing of an anti-discrimination law lying in the parliament for some years. This law will at least formalize the government efforts to end discrimination that the communities face.
The Government will form a special commission on dalits to evaluate current environment and level of discrimination and provide key recommendations on improving the socio-economic conditions of dalit communities in Bangladesh.
The key informants among Rishi and few other communities who identify themselves as dalits report that no ‘special commission on dalit’ has been initiated ‘to evaluate current environment and level of discrimination and provide key recommendations on improving the socio-economic conditions of dalit communities in Bangladesh.’ There is indeed a demand for such a commission.
The Harijans who do not want to be identified as dalit also want a commission to look into their issues and concerns.
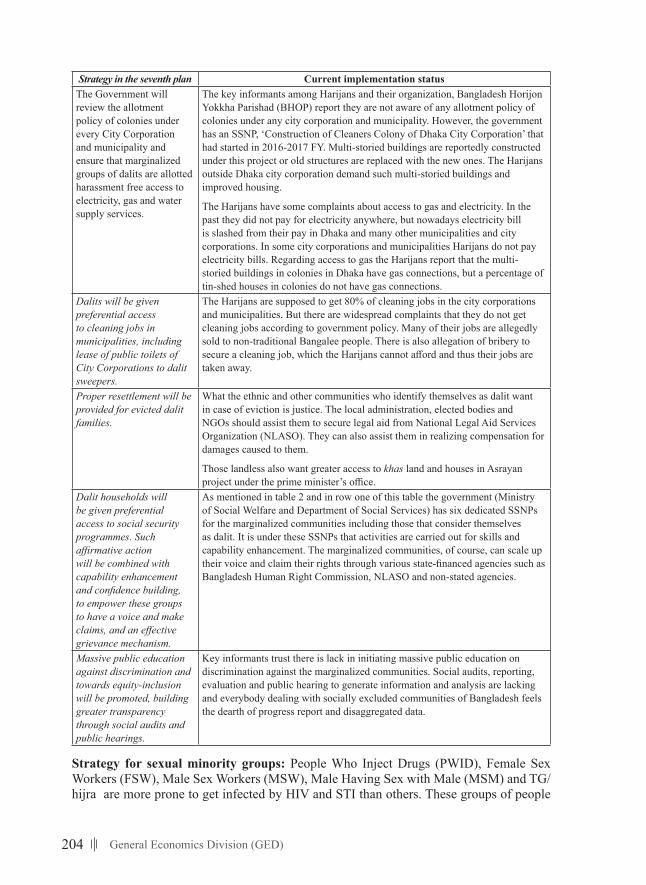
204 General Economics Division (GED)
Strategy in the seventh plan Current implementation statusThe Government will review the allotment policy of colonies under every City Corporation and municipality and ensure that marginalized groups of dalits are allotted harassment free access to electricity, gas and water supply services.
The key informants among Harijans and their organization, Bangladesh Horijon Yokkha Parishad (BHOP) report they are not aware of any allotment policy of colonies under any city corporation and municipality. However, the government has an SSNP, ‘Construction of Cleaners Colony of Dhaka City Corporation’ that had started in 2016-2017 FY. Multi-storied buildings are reportedly constructed under this project or old structures are replaced with the new ones. The Harijans outside Dhaka city corporation demand such multi-storied buildings and improved housing.
The Harijans have some complaints about access to gas and electricity. In the past they did not pay for electricity anywhere, but nowadays electricity bill is slashed from their pay in Dhaka and many other municipalities and city corporations. In some city corporations and municipalities Harijans do not pay electricity bills. Regarding access to gas the Harijans report that the multi-storied buildings in colonies in Dhaka have gas connections, but a percentage of tin-shed houses in colonies do not have gas connections.
Dalits will be given preferential access to cleaning jobs in municipalities, including lease of public toilets of City Corporations to dalit sweepers.
The Harijans are supposed to get 80% of cleaning jobs in the city corporations and municipalities. But there are widespread complaints that they do not get cleaning jobs according to government policy. Many of their jobs are allegedly sold to non-traditional Bangalee people. There is also allegation of bribery to secure a cleaning job, which the Harijans cannot afford and thus their jobs are taken away.
Proper resettlement will be provided for evicted dalit families.
What the ethnic and other communities who identify themselves as dalit want in case of eviction is justice. The local administration, elected bodies and NGOs should assist them to secure legal aid from National Legal Aid Services Organization (NLASO). They can also assist them in realizing compensation for damages caused to them.
Those landless also want greater access to khas land and houses in Asrayan project under the prime minister’s office.
Dalit households will be given preferential access to social security programmes. Such affirmative action will be combined with capability enhancement and confidence building, to empower these groups to have a voice and make claims, and an effective grievance mechanism.
As mentioned in table 2 and in row one of this table the government (Ministry of Social Welfare and Department of Social Services) has six dedicated SSNPs for the marginalized communities including those that consider themselves as dalit. It is under these SSNPs that activities are carried out for skills and capability enhancement. The marginalized communities, of course, can scale up their voice and claim their rights through various state-financed agencies such as Bangladesh Human Right Commission, NLASO and non-stated agencies.
Massive public education against discrimination and towards equity-inclusion will be promoted, building greater transparency through social audits and public hearings.
Key informants trust there is lack in initiating massive public education on discrimination against the marginalized communities. Social audits, reporting, evaluation and public hearing to generate information and analysis are lacking and everybody dealing with socially excluded communities of Bangladesh feels the dearth of progress report and disaggregated data.
Strategy for sexual minority groups: People Who Inject Drugs (PWID), Female Sex Workers (FSW), Male Sex Workers (MSW), Male Having Sex with Male (MSM) and TG/hijra are more prone to get infected by HIV and STI than others. These groups of people
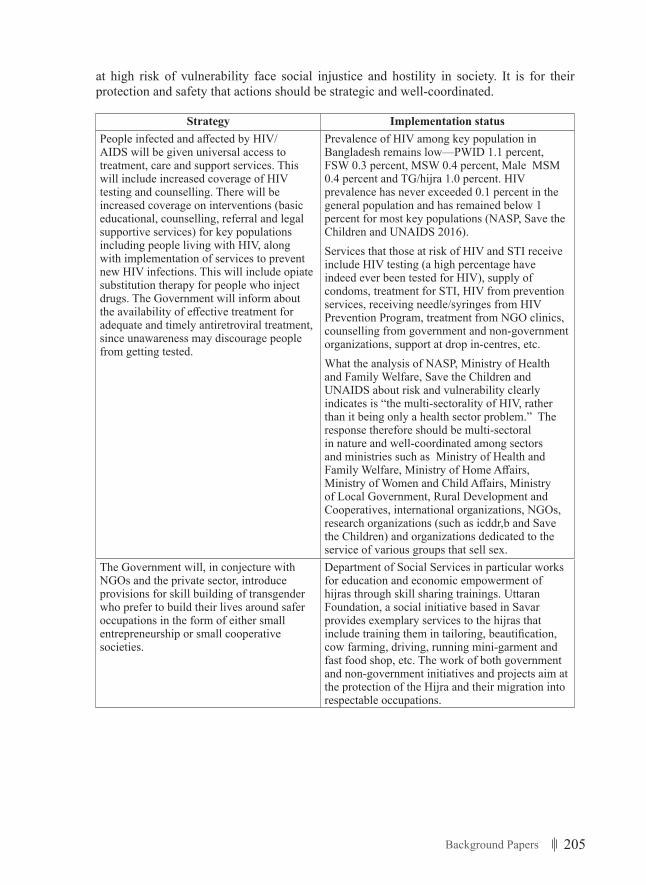
205Background Papers
at high risk of vulnerability face social injustice and hostility in society. It is for their protection and safety that actions should be strategic and well-coordinated.
Strategy Implementation statusPeople infected and affected by HIV/AIDS will be given universal access to treatment, care and support services. This will include increased coverage of HIV testing and counselling. There will be increased coverage on interventions (basic educational, counselling, referral and legal supportive services) for key populations including people living with HIV, along with implementation of services to prevent new HIV infections. This will include opiate substitution therapy for people who inject drugs. The Government will inform about the availability of effective treatment for adequate and timely antiretroviral treatment, since unawareness may discourage people from getting tested.
Prevalence of HIV among key population in Bangladesh remains low—PWID 1.1 percent, FSW 0.3 percent, MSW 0.4 percent, Male MSM 0.4 percent and TG/hijra 1.0 percent. HIV prevalence has never exceeded 0.1 percent in the general population and has remained below 1 percent for most key populations (NASP, Save the Children and UNAIDS 2016).Services that those at risk of HIV and STI receive include HIV testing (a high percentage have indeed ever been tested for HIV), supply of condoms, treatment for STI, HIV from prevention services, receiving needle/syringes from HIV Prevention Program, treatment from NGO clinics, counselling from government and non-government organizations, support at drop in-centres, etc. What the analysis of NASP, Ministry of Health and Family Welfare, Save the Children and UNAIDS about risk and vulnerability clearly indicates is “the multi-sectorality of HIV, rather than it being only a health sector problem.” The response therefore should be multi-sectoral in nature and well-coordinated among sectors and ministries such as Ministry of Health and Family Welfare, Ministry of Home Affairs, Ministry of Women and Child Affairs, Ministry of Local Government, Rural Development and Cooperatives, international organizations, NGOs, research organizations (such as icddr,b and Save the Children) and organizations dedicated to the service of various groups that sell sex.
The Government will, in conjecture with NGOs and the private sector, introduce provisions for skill building of transgender who prefer to build their lives around safer occupations in the form of either small entrepreneurship or small cooperative societies.
Department of Social Services in particular works for education and economic empowerment of hijras through skill sharing trainings. Uttaran Foundation, a social initiative based in Savar provides exemplary services to the hijras that include training them in tailoring, beautification, cow farming, driving, running mini-garment and fast food shop, etc. The work of both government and non-government initiatives and projects aim at the protection of the Hijra and their migration into respectable occupations.
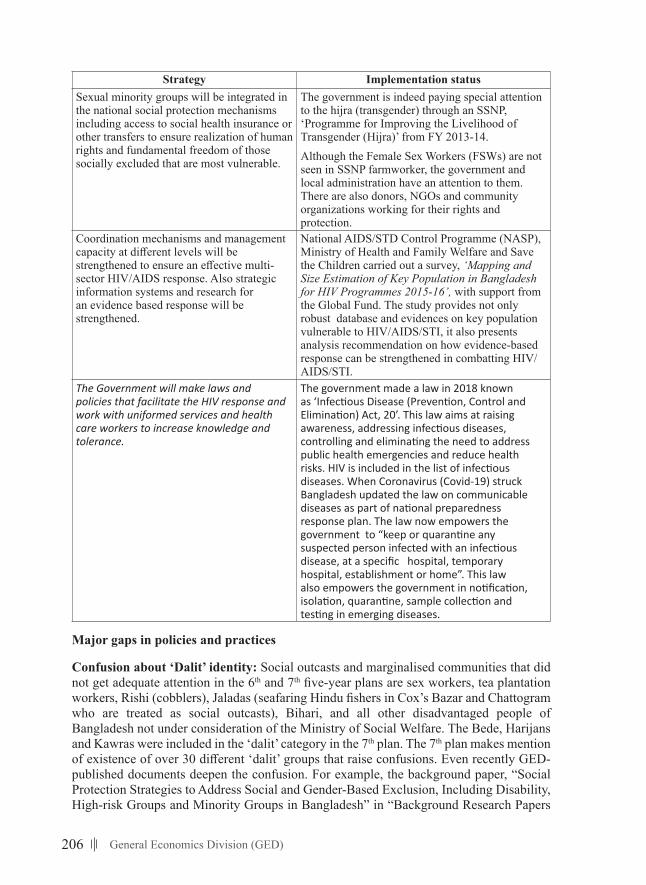
206 General Economics Division (GED)
Strategy Implementation statusSexual minority groups will be integrated in the national social protection mechanisms including access to social health insurance or other transfers to ensure realization of human rights and fundamental freedom of those socially excluded that are most vulnerable.
The government is indeed paying special attention to the hijra (transgender) through an SSNP, ‘Programme for Improving the Livelihood of Transgender (Hijra)’ from FY 2013-14. Although the Female Sex Workers (FSWs) are not seen in SSNP farmworker, the government and local administration have an attention to them. There are also donors, NGOs and community organizations working for their rights and protection.
Coordination mechanisms and management capacity at different levels will be strengthened to ensure an effective multi-sector HIV/AIDS response. Also strategic information systems and research for an evidence based response will be strengthened.
National AIDS/STD Control Programme (NASP), Ministry of Health and Family Welfare and Save the Children carried out a survey, ‘Mapping and Size Estimation of Key Population in Bangladesh for HIV Programmes 2015-16’, with support from the Global Fund. The study provides not only robust database and evidences on key population vulnerable to HIV/AIDS/STI, it also presents analysis recommendation on how evidence-based response can be strengthened in combatting HIV/AIDS/STI.
The Government will make laws and policies that facilitate the HIV response and work with uniformed services and health care workers to increase knowledge and tolerance.
The government made a law in 2018 known as ‘Infectious Disease (Prevention, Control and Elimination) Act, 20’. This law aims at raising awareness, addressing infectious diseases, controlling and eliminating the need to address public health emergencies and reduce health risks. HIV is included in the list of infectious diseases. When Coronavirus (Covid-19) struck Bangladesh updated the law on communicable diseases as part of national preparedness response plan. The law now empowers the government to “keep or quarantine any suspected person infected with an infectious disease, at a specific hospital, temporary hospital, establishment or home”. This law also empowers the government in notification, isolation, quarantine, sample collection and testing in emerging diseases.
Major gaps in policies and practices
Confusion about ‘Dalit’ identity: Social outcasts and marginalised communities that did not get adequate attention in the 6th and 7th five-year plans are sex workers, tea plantation workers, Rishi (cobblers), Jaladas (seafaring Hindu fishers in Cox’s Bazar and Chattogram who are treated as social outcasts), Bihari, and all other disadvantaged people of Bangladesh not under consideration of the Ministry of Social Welfare. The Bede, Harijans and Kawras were included in the ‘dalit’ category in the 7th plan. The 7th plan makes mention of existence of over 30 different ‘dalit’ groups that raise confusions. Even recently GED-published documents deepen the confusion. For example, the background paper, “Social Protection Strategies to Address Social and Gender-Based Exclusion, Including Disability, High-risk Groups and Minority Groups in Bangladesh” in “Background Research Papers
207Background Papers
for Preparing the National Social Security Strategy of Bangladesh” published by GED in June 2017 gives a list 34 ‘Dalit’ communities that is erroneous and confusing. Dalit is indeed a blanket word for social outcasts or untouchables in Indian context. In Bangladesh those who can be put into the ‘dalit’ category, if the word is to be used at all are Harijans and Rishis, which are their primary identities. There is no justification for indiscriminate branding of communities and their clans (gotro) as ‘dalit’.
Anti-discrimination law: Passing of the anti-discrimination law by the parliament is a long-standing issue. The Law Commission and National Human Rights Commission Bangladesh drafted the law and sent it to the Ministry of Law, Justice and Parliamentary Affairs. The organizations working with the excluded and marginalised communities were involved in the process of drafting the law. The Ministry of Law, Justice and Parliamentary Affairs is required to send the draft to the parliament for it to be passed into a law. Even if the law is passed, it is not enough to end discrimination. Setting mechanisms for its implementation and regular monitoring is essential. Even more important is to bring real change in the mindset and attitude of the common people who the victims of discrimination live with. However, passing of the law is an important first step to pave the way for social justice for the communities who are not treated with respect.
Lack in generation of disaggregated data: Disaggregated data on progress specific to the excluded and marginalized communities addressed in this paper are not found in Implementation Review of the Sixth Five Year Plan, Mid-term Implementation Review of the Seventh Five Year Plan, HIES 2010 and 2016 and Bangladesh’s first progress report (2018) on Sustainable Development Goals (SDGs). In fact, there are no disaggregated data on the access situation of the excluded and marginalized communities in other Social Protection Programmes that are not targeted for them.
Inclusion and exclusion challenges: Inclusion and exclusion of beneficiaries in SSNPs is a critical issue. Many who deserve the benefits do not get them. On the contrary, many beneficiaries included are politically connected and belong to the upper rungs in casteism or society. The aged people, widowed, and destitute persons among groups considered social outcasts (such as Harijans, Rishi, sex workers, and transgender) remain side-lined in society and cut off from social relations. Their educational attainment is also low and in many instances they are isolated from others and many get excluded from SSNPs.
Anomalies related to cash transfers: Cash transfers under a number of SSNPs for stipends, old age allowance, allowance for widow, deserted and destitute women, tea workers, transgender (Hijra), treatment, etc. is difficult. There are allegations of mismanagement of different types in handling cash. Cash transfer modernization, which itself is a SSNP, should be continued and scaled up. All options including transfers through mobile banking and bank account should be further strengthened. Cash should not be transferred in hand where it can be transferred through mobile banking and bank accounts.
Inadequate funding for the excluded and marginalized: Although the budget on social protection expenditure was 13.81% of the total national budget in 2018-19, which is around 2.5% of the GDP, the budget is deemed inadequate in general and meagre for the excluded and marginalised communities as seen in table 2 and 3. If the single SSNP, pension for retired government employees is separated, the budget for social protection becomes even smaller. Field investigations and research expose that the social protection coverage of the excluded communities is particularly inadequate. Increase in the budget is required to
208 General Economics Division (GED)
increase the coverage of the excluded communities and to introduce innovativeness for effective social protection. There are many prospective beneficiaries of tax-financed social protection programmes or SSNPs who are not aware of these programmes. There are others who lack motivation. So they are excluded. Adequate attention needs to be given that such errors are brought to the minimum.
Serious weakness and challenges in coverage: Inadequate funding, design and implementation-related difficulties, malpractices that result in a high degree of targeting errors, limited coverage, very small size of the transfers made, duplicity in interventions, targeting inefficiencies, social stigma, etc. are pointed out to be major weaknesses/challenges for improving efficiency and effectiveness of social protection strategies and programmes. These weaknesses and shortcomings lead to significant exclusion of the poorest and most vulnerable groups from the coverage of SSPs (PRI 2019). The members of the excluded and marginalized communities are affected most from these weaknesses and malpractices.
6. National and international laws, instruments and institutions providing safeguards to the marginalized communities
There are around 20 international, regional and national instruments, resolutions and national laws to provide protection and safety nets to the ethnic communities, ‘tied’ labour force in the tea gardens, and other excluded communities. These instruments and laws also define the obligations of the state parties, international bodies, and other parties such as the private sector. It will be useful for all working and interested in exclusion challenges in Bangladesh to know the key instruments in existence and what exactly are contained in those instruments on the rights, safety and opportunities of the ethnic and excluded communities and the status of their implementation in Bangladesh.
The list of international instruments and laws, not conclusive, include:
International • Forced Labour Convention, 1930 (No. 29) • Abolition of forced labour convention, 1957 (No. 105) • Contracts of Employment (Indigenous Workers) Convention, 1939 • Contracts of Employment (Indigenous Workers) Convention, 1947 • Freedom of Association and Protection of the Right to Organise Convention,
1948 (No. 87) • Discrimination convention, 1958 • Indigenous and Tribal Peoples Convention, 1989 (No. 169) • Indigenous and Tribal Populations Convention, 1957 (No. 107) • Penal Sanctions (Indigenous Workers) Convention, 1939 • Plantations Convention, 1958 • Right to Organise and Collective Bargaining Convention, 1949 (No. 98) • Minimum Age Convention, 1973 (No.138) • Equal Remuneration Convention, 1951 (No. 100)
209Background Papers
• The SAARC Social Charter (adopted on 4 January 2004) • International Convention on Civil and Political Rights (ICCPR) • Convention on the Elimination of All Forms of Discrimination against Women (CEDAW) • Convention against Torture (CAT) • Consultation (International Labour Standards) Convention, 1976 (No. 144)
National
• The Bangladesh Labour Act 2006 • The East Bengal State Acquisition and Tenancy Act of 1950
Two national laws—the Bangladesh Labour Act, 2006 and East Bengal State Acquisition and Tenancy Act 1950 (EBATA)—set significant conditions for protection of the ethnic communities and tea plantation workers. The labour law is criticized to be deficient for the tea workers in that it allows the tea workers to unionize only at national level and not at the garden, valley or district levels. The labour law is also discriminatory in that it does not grant casual leave to the tea workers as it does to the workers in other industries. There are also allegations that the owners of the tea gardens do not abide by the provisions in the labour law that provide gratuity and decency at work place. There are other loopholes in the implementation of the labour law for the tea plantation workers. What is important here most of the tea workers are not Bangalees and they live in the tea gardens isolated from their Bangalee neighbours. So occasional cash transfer and giving some benefits under SSNPs are not enough for their social protection. The government must ensure that state agencies responsible for implementation of the labour law actually implement the law, rules and policy of the government. At this moment the owner of the tea gardens enjoy immunity for not abiding by the labour law, which must come to an end.
Similarly, The East Bengal State Acquisition and Tenancy Act of 1950 (EBSATA) that restricts sale of land owned by the ethnic communities or aborigines to the non-aborigines shall be implemented. The poor people of different ethnic communities have been progressively losing their land because of illegal transfer of land to non-aborigines for various factors and influences. For the protection of the ethnic communities two important international conventions are ILO Convention No. 107 that Bangladesh has ratified and ILO Convention No. 169 that Bangladesh is yet to sign or ratify. ILO 169 is particularly important for protection of the ethnic communities. Article 14 of ILO 169 says: “The rights of ownership and possession of the peoples concerned over the lands, which they traditionally occupy shall be recognized. In addition, measures shall be taken in appropriate cases to safeguard the right of the peoples concerned to use land not exclusively occupied by them, but to which they have traditionally had access for their subsistence and traditional activities. Particular attention shall be paid to the situation of nomadic people and shifting cultivators in this respect.” To ensure social protection of the ethnic minorities it is important that the government takes appropriate measures to design SSNPs for the ethnic communities in the light of ILO Convention nos.107 and 169.
Similarly in designing the policies and programmes for social protection of the excluded, social outcasts and marginalized the spirit and commitments of the national and international laws and instruments should be considered. Proper state agencies for implementation of the national and international laws and instrument should also be in place.
210 General Economics Division (GED)
7. Recommendations and way forward
The democratic evolution in Bangladesh and the development that came along with the 2008 parliamentary elections demonstrated the commitment to political protection of all citizens of the country including the excluded, marginalized and the disadvantaged groups. The expression of political commitments is reflected in policy documents such as 6th and 7th plans and specifically in National Social Security Strategy (NSSS) and SSNPs. These policies and programmes set goals for the excluded, social outcasts, marginalized, and disadvantaged groups to be included in the development process. Now for the state to do its job properly towards its less fortunate citizens so that their political participation and democratic rights are ensured, strategic actions need to be taken at different levels and those already laid out in the SSNPs should be scaled up.
The excluded groups, social outcasts, and disadvantaged groups are highly heterogeneous; the opportunities and capabilities that exist and can be created are also diverse and challenging for the state to apply. But with sincere efforts and political prudence the state and non-state actors including the civil society and donors can now possibly act better than ever before. Any government has a special duty towards the religious and ethnic minorities, occupational groups in captive or ‘tied’ situation for generations, women and children. Actions undertaken to utilize capabilities and opportunities to increase the ability of its excluded groups and to include them in political processes in the true sense can be generic and specific to different groups.
a) Government strategic policy options and actions (programmes) to improve rights and protection of the marginalized communities
■ Recognize diverse Identities: The government has raised the number of ethnic communities from 27 to 50 in 2019 in the official list. However, there are many other smaller ethnic groups that are left out of the government list. Their inclusion is a demand that cannot be ignored. Bangladesh Bureau of Statistics (BBS) is unlikely to take into account the groups for enumeration in 2021 that are not in the official list. However, inclusion of these groups (as seen in table 1) should remain as an agendum. One particular concern: to take advantage of ‘dalit’ quota in the public universities, the students of communities from the tea gardens and the plains land that are not in the government list of ethnic communities and some occupational groups such as Harijans and Rishis take certificate of their ‘dalit’ identity from a few organizations that work for the ‘dalit’. This is an ad-hoc arrangement. The government should consider listing all ethnic and occupational groups so that no one deserving ‘quota’ and other opportunities is left out. There are some non-state sources that can always be checked to make sure that the ethnic and excluded communities that are still excluded from the government list are not excluded from accessing the SSNPs and other benefits that the state offers.
■ Include all those still excluded: The excluded communities discussed in this paper and not included in the list of Department of Social Services (DSS) under the Ministry of Social Welfare are: ethnic communities, sex workers, Kaiputra (Kawra) and Jaladas (however, the prime minister’s office has programme for the ethnic communities among these groups). These communities are truly socially excluded and many are social outcasts due to their identity and occupations, and many are considered impure. Coordination among ministries administering SSNPs and BBS is a matter of policy decision to develop a comprehensive list of excluded, social outcasts and marginalized communities. It is hoped that DSS will include the excluded communities discussed in
211Background Papers
this paper but not yet in its list of marginalized groups of people. ■ Create of robust database: For the excluded and marginalized communities not to
be excluded from SSNPs there is felt need of robust database on household income and asset situation. The government agency responsible for creating and maintaining database is Bangladesh Bureau of Statistics (BBS) that conducts population census every ten years and publishes statistical year book. It also conducts varied surveys including HIES. The accuracy and quality of data that BBS routinely produces on ethnic and excluded communities need improvement. BBS is yet to generate data on many occupational communities as seen in table 1 for them to be officially recognized so that they are included in SSNPs. With the population census ahead in 2021, BBS is expected to take into consideration suggestions it has received from the government agencies and civil society organizations. BBS can also initiate a large survey to see inclusion and exclusion situation of excluded and marginalized communities in SSNPs.
■ Ensure education: Special attention should be given to education for the children of the tea plantation workers, Harijans, sex workers, Bede, Biharis and other disadvantaged groups. Access to education is a serious concern in the tea gardens indeed. The government primary schools in the tea gardens are inadequate. The company schools [run by the owners of the tea gardens] are in very bad shape. There are schools run by NGOs. The school infrastructure is not also satisfactory; schools lack qualified teachers; high schools are very few and government schools also can be counted on the fingers. As a consequence the tea workers’ children become tea workers and gradually join the unemployed labour force; their migration out of poverty is extremely difficult. The children of the Bede, Bihari and Harijan communities are equally unfortunate in getting education. The problem of sex workers’ children in accessing education adds a new dimension. Well-coordinated policy decisions and actions among concerned ministries, government and non-government organizations are imperative to generate data on access situation of these communities in education and to set up adequate number of schools for these communities. Budget increase is also a need in this regard.
■ Provide support for health and hygiene: Support should be given for improving access of tea plantation workers, Bede, Harijans and Biharis in particular to health and hygienic facilities and services. Defecation of the Bede and tea workers in the open is still a widespread practice compared to national level of defecation in the open. While it is easier to resolve the problem with tea plantation workers with financial support and coordination, it is more challenging for the Bede because the majority of them are still not settled and they keep moving from place to another.
■ Grant bank loans for select communities: Special considerations and policy measures are highly recommended so that the Kaiputra, Jaladas, Harijans, Rishi and other excluded communities get loans from the public and private banks. The members of these communities who run their traditional businesses require loans. Conditions for them to get bank loans can be relaxed. Evidences suggest they are very unlikely to be defaulters.
■ Grant right to land: Special policy measures (short, medium and long-term) need to be considered for the tea plantation workers who live in the labour lines in the tea gardens, Harijans who live in colonies on public land, and Biharis in refugee camps also on public land. Distribution of land to the tea plantation workers and Harijans who have been living in their current locations from 150 years to 200 years and ownership of houses they live in is a demand of these communities to get out of captive situation and migrate out of poverty. Rehabilitation of the Biharis outside the camps is also a demand
212 General Economics Division (GED)
that cannot be ignored because they have been given citizenship. Other communities particularly Bede, Kaiputra, and Rishi should also get a policy attention and priority in accessing khas land. Resolving land rights issues and distribution of khas land to these communities is high level policy matter.
■ Grant customary rights and relieve the victims of forest cases: The forest villagers primarily in Modhupur sal forest villages and in some other sal forest areas in the north-centre and Northwest who do not have title deeds for their land want the state to recognize their customary land rights. Even if land issues cannot be solved by means of title deeds, it can be solved from the perspective of Sustainable Development Goals (SDG) agenda, suggest the experts. A tripartite survey on land possession among the Forest Department, Garos and Bangalees should also be considered. To end the endless harassment of the forest villagers in Modhupur, the forest cases, majority of them ‘false’ or filed for minor offenses, must be resolved. A former Chief Conservator of Forest (CCF) suggested that the forest cases filed for minor offense are compoundable. The Forest Department can settle these cases at local level if the judges hand over them under consideration that they have been pending for a long time. No one will face jail or be penalized in these cases.
■ Sign ILO Convention 169: The government may consider signing the ILO convention No. 169 to award the customary land rights to the communities who have been living on the forest land from time immemorial.
■ Implement Labour Act, 2006 and amend it to end discrimination: Full implementation of the Labour Act, 2006 and the Labour Rules 2015 is an urgent need to end discrimination particularly against the tea plantation workers. The Department of Inspection for Factories and Establishments (DIFE) needs to function freely and without any interference to implement the law and rules. Bangladesh Cha Sramik Union (BCSU), the only trade union of the tea plantation workers should work hand in hand with DIEF. Measures are also recommended for appropriate and immediate amendment of the labour law to end discrimination against the tea plantation workers and their families.
■ Monitor provisions of law regarding decent work condition: The state agencies such as Department of Inspection for Factories and Establishments (DIFE), Ministry of Labour and Employment, Department of Labour, Labour Courts, Ministry of Social Welfare, etc. and BCSU should work hand in hand to monitor and report on the violation of provisions of the labour law and rule that provide decent work condition. The decent work conditions apply mostly for the tea plantation workers and the Harijans. The human rights and civil society groups can be of help in giving a voice to the groups that are deprived of decent work.
■ Scale up resource allocations: More resource allocation for SSNPs targeting the excluded, social outcasts and marginalized is highly recommended. While the total population of these communities is approximately 5 million (3 percent of the total population), the targeted budget allocated for them in 2019-2020 is only 375.4 crore (.50% of the SSNPs budget). True they get benefits from other major SSNPs, but studies suggest they do not equally benefit from these SSNPs.5
■ Consider positive/affirmative discrimination: The excluded groups and social outcasts have fallen so much behind in the race for development due to social injustice and discrimination for generations that some positive/affirmative discrimination towards the groups is justifiable. Additional investment for these disadvantaged groups in
213Background Papers
developing life skills, employment, education, health care, sanitation, housing, etc.) will contribute to pulling them out of extreme poverty and social exclusion. The government offices and officials dealing with them need to be more considerate to these people.
■ Pass the anti-discrimination law: Passing of the anti-discrimination law by the parliament is highly recommended. A draft of the law is lying with the Ministry of Law, Justice and Parliamentary Affairs. Anti-discrimination law is the long-cherished desire of the victims who face discrimination in social, economic and political life.
■ Scale up employment generation activities: Employment generation for groups such as Bede, tea plantation workers, Harijans, Rishi, Biharis and Kaiputra can be scaled up through scaling up life skills and vocational training like what DSS does for select groups (such as potter, blacksmith, makers of cane and bamboo produces, hairdresser, shoe makers and brassware producers) and the prime minister’s office does for ethnic communities of the plains land.
■ Ensure access to justice: An everyday need of the disadvantaged groups is access to justice through ADR and formal courts. Members of the ethnic, religious and caste minorities and other disadvantaged groups who are faced with physical violence, false cases, and structural abuses require proper legal aid to access justice. National Legal Aid Services Organizations (NLASO) that has offices in all districts of the country and NGOs that provide legal aid can pay greater attention to cases of the excluded and marginal communities in ensuring legal aid to members of the excluded and marginalized communities. They can also facilitate suo moto cases. Access to justice includes economic and trade justice as well. National Human Rights Commission Bangladesh, allowed to work independently and widely with sufficient budget allocation, can contribute to strengthening the state efforts for the excluded communities to access justice.
■ Formalize consultation: The state agencies may consider formalizing consultations with excluded communities to identify their specific needs and constraints.
b) Collaboration between the government and the civil society to integrate the excluded and marginalized communities to the greater society.
■ Protect diverse cultures and languages: Integration of the communities that are not Bangalees requires special attention so that their diverse cultures and languages are protected and nurtured. The groups that have lost or are vulnerable to losing their languages and cultural identity need to be identified and assisted. There are both government and non-government initiatives for protection of languages and cultures. Introduction of multilingual education at least at the nursery and primary level is highly recommended. Integration should be thought of with diverse languages and cultures surviving. The state sponsored organizations/institutes, civil society and the cultural organizations of ethnic communities need to collaborate in this regard.
■ Strengthen cultural institutes: While the ‘Tribal Cultural Institutes’ in the CHT and in the plains need to be further strengthened, there is a need for fresh such cultural institutes, particularly in the tea gardens. The Bede speak a language (Thar) that needs to be nurtured. Celebration of cultural diversity through these cultural institutes will make the people of the majority community aware about the value that the cultural diversity adds. These cultural institutes and International Mother Language Institute
214 General Economics Division (GED)
(IMLI) can also be hubs for study of the cultural minorities, which will in fact become vehicles for raising awareness of social protection. The CSOs and CBOs can work with government in this area.
■ Avoid branding social outcasts and many ethnic communities as dalit: In dealing with social outcasts and integrating them with the greater society, branding communities indiscriminately as ‘dalit’ should be avoided. Each community branded as ‘dalit’ in the 6th and 7th plans has an identity. For example, the Harijans, Bede, Rishi, Jaladas and tea communities, branded as ‘dalit’ have their community identities and the majority want to be identified by the names of their communities. There are CSOs and prominent researchers among these communities who are arguing for not branding these communities as ‘dalit’. The government should support these CSOs and researchers in their contention.
c) Coordination among the government, community-based and civil society organizations and international community (including donors) to highlight good practices for security of the marginalized communities (institutional arrangements in particular)
■ Promote rights based approaches: There are scope for the government to work with the Civil Society Organizations (CSOs), Community Based Organization (CBOs), trade union of the tea plantation workers in particular, academic institutions and international organizations to map the needs, constraints, and abuses that take place against the excluded and marginalized communities. Promotion of rights based approaches by the state and non-state organizations will strengthen the voices of communities. Only then financial support to them will work like seeds. Ideas about rights, entitlement, human dignity and sustainable development can be revolutionized primarily though promotion of rights based approaches.
■ Document and report human rights abuses: Strengthening prompt response to human rights related issues and abuses—land grabbing, physical violence including killing, rape and arson attacks, reservation of forest, land acquisition and requisition, etc.—by the state and non-state actors such as NLASO, National Human Rights Commission Bangladesh, human rights organizations and NGOs that have presence at the grassroots level is highly recommended. It is only the government and concerned ministries that can ensure neutrality of the police, administration and justice systems when human right abuses occur.
■ Replicate BRAC model to help the ultra-poor: BRAC’s support to the ultra-poor to migrate out of poverty sets an example of collaboration among the Government, NGOs and donors. BRAC has provided commendable social protection to 1.9 million ultra-poor households from 2002 to 2019 under an initiative called, ‘Ultra Poor Graduation Programme (UPGP)’. The primary beneficiary under the initiative funded by DFID and USAID are all women. That the BRAC approach with four foundational pillars—livelihood promotion, financial inclusion, social protection, and social empowerment—is unique is indicated in its inclusion in the Household Income and Expenditure Survey (HIES 2016, report published in 2019). The BRAC initiative is exemplary in lifting the ultra-poor out of poverty in that the participants are provided with assets through grants and interest free-loans to develop productive income-generating activities and long-term investment in life skills and technical skills training, enterprise development, positive behaviour change, savings, and financial planning savings (BRAC Annual
215Background Papers
report 2018: 20). The government agencies handling SSNPs for the excluded and marginalized communities, other NGOs, community-based organizations and donors can learn from BRAC’s experience and develop collaboration models for sustainable migration out of poverty.
■ Collaborate with targeted groups: There are also precedence of effective initiatives for employment generation for targeted excluded communities such as the Bede and Hijra. Uttaran Foundation, a non-government organization, works with the Bede and Hijra communities in Savar and Munshiganj in particular to impart life skills, vocational training and education. Many Bedes in Savar are now working in the garments factories giving up their traditional work such as snake charming. Uttaran Foundation has also taken housing scheme for the Bede and Hijras on khas land. However, employment generation for these communities who are still considered social outcasts is tough because they are largely isolated and even who are skilled and educated have hard time getting jobs. For these communities, the government needs to take extra care and NGOs can collaborate with the government in this regard.
■ Carry out collaborative study on access situation to SSNPs: BBS and non-government research organizations and human rights groups with track record of work with the excluded communities can be engaged together to study and generate data on access situation of these communities to SSNPs. The government support for such collaborative studies will generate both quantitative and qualitative information useful to minimise targeting errors.
■ Associate community leaders in listing recipients of benefits of SSNPs: The community leaders from different excluded communities have strongly suggested that the community representatives be associated in the preparation of the lists of people who are to receive benefits from SSNPs. In case of the tea plantation workers, Bangladesh Cha Sramik Union (BCSU) at the central level and the panchayets at the garden level represent tea workers and their communities. The government agencies can do a better job in listing the appropriate recipients of SSNPs from among the tea communities if BCSU and panchayets are associated. Similarly, if Tribal Welfare Association (TWA) and other community-based organizations that represent the ethnic communities of the plains are associated in the process of listing the recipients of benefits from SSNPs, the lists will be comprehensive and the chances of nepotism, political bias and exclusion of eligible beneficiaries will be reduced. In case of almost all other marginalised communities there are networks and organizations and if they are associated, the government can do a better job in reaching the appropriate beneficiaries of SSNPs.
■ Build awareness about SSPs: Exclusion of eligible beneficiaries is a common concern because of lack in awareness about SSPs and Grievance Redress System (GRS). Those from among the ethnic communities, floating communities such as Bede, ‘tied’ workers and communities isolated from the mainstream population such as the tea plantation workers, sex workers, Hijra, Rishi, Kaiputra and Harijans, are even more unaware about the SSPs and the GRS. The government should scale up the association of the civil society in raising awareness about SSNPs and GRS.
■ Assist persons vulnerable to exclusion: Studies and field investigations suggest that there are eligible persons for benefits from SSPs who are excluded because their age has not been recorded properly. These people whose date of birth is miscalculated need help in amending their date of birth in NID so that they have greater chance to be
216 General Economics Division (GED)
included in Old Age Allowance in particular. Non-government organizations working with different communities can help correcting the errors made with dates of birth.
■ Institutional arrangements: To ensure effective support including positive discrimination to the excluded and marginalized communities discussed this paper (3% of the total population) a state-financed board composed of government representatives and dignitaries from communities, civil society and academia is highly recommended. The key tasks of the board with sufficient man-power will be to: generate quantitative and qualitative knowledge on communities through necessary research independently and in cooperation with BBS where necessary; liaise with all concerned ministries and their affiliate serving the marginalized communities; advise the GED and Planning Common on resource allocation in SSNPs for the excluded and marginalized communities; formalize consultations with communities, their organizations and civil society organizations; to raise resources and support from local and international organizations; advise the prime minister and state agencies that are engaged in formulation of policies for social security and economic development; initiate any other necessary activities in consultation with parties involved.
d) Monitoring and progress reporting (disaggregated data) on implementation of policies and programmes undertaken for the excluded marginalized communities.
■ Generate disaggregated data: Implementation Review of the Sixth Five Year Plan, Mid-term Implementation Review of the Seventh Five Year Plan, HIES 2010 and 2016 and Bangladesh’s first progress report (2018) on Sustainable Development Goals (SDGs) do not furnish disaggregated data on the progress made in support (government and non-government) of the excluded and marginalized communities. Teams commissioned by GED, BBS or government organization(s) or even non-government(s) can be engaged in generating separate data on recipients of benefits from each excluded community. The work can begin with collation of data already available, for example at DSS and prime minister’s office. The progress report presented in tabular form will be very helpful in understanding progress and weakness in implementation of government programmes (SSNPs in particular).
■ Commission investigation missions: In case of violation of policies the government can field investigation and special survey mission. For example, there are widespread allegations that Bangalees are taking away cleaning jobs of the Harijans who are supposed to get 80% of cleaning jobs as a government policy and instruction. The case of the tea plantation workers can be mentioned here. The provisions of the labour law relating to appointment letter, gratuity, profit-sharing and work condition are routinely violated by the managements of the tea gardens. Department of Inspection for Factories and Establishments assigned to implement the labour and factory laws is unable to implement some crucial provisions of the labour law and labour rules in the tea gardens. Non-implementation of laws and policies cause structural human rights violation and impoverishment of many excluded communities. In such cases government, in consultation with concerned ministries, can initiate investigation missions and take necessary measures for implementation of government policies and laws.
217Background Papers
■ Monitoring effects of government programmes and policies: To check quality and effects of SSNPs, other government programmes and policy implementation, the government can scale up its periodic evaluation by independent evaluators.
■ Response to emergency situation: The Coronavirus pandemic directly affecting Bangladesh from, March 2020, has shown how important it is to pay an attention to the excluded and marginalised communities who are among the extreme poor. The surplus workers in the tea gardens and Harijan communities; Bede who had been floating around country; sex workers and Hijra who lost means of their earning; Jaladas who had been restricted from fishing in the sea; Biharis confined to the camps; Rishis, Dhopas and Napit who had to shut down their work, shops and saloons; and many other smaller marginalized communities and social outcasts who had no income during Coronavirus lock-down were among the neediest. In such disaster, the government, with robust database in hand, would be better prepared to provide food aid and social security. Now the main challenge for the government will be to see that those who migrated or were in the process of migrating out poverty and extreme poverty do not slide back into their previous situation. Support from SSNPs should be scaled for them on the one hand and on the other, careful consideration should be given to all these communities that need state support most.
Conclusion
Dealing with exclusion challenges in Bangladesh involves hard work and commitments. Ensuring political, social and economic protection to the specific communities discussed in this paper and eradicating poverty by 2030 are major challenges for Bangladesh particularly in the post-Coronavirus time. Debates about the definition, identity, number and population size of different marginal and excluded communities will not come to an end any time soon. But the state and non-state organizations must play their role right to bring changes in the lives of the people who are among the extreme poor, deprived of their legitimate rights, marginalised and most vulnerable. Social safety and protection is not a matter of benevolence, these are rights of the excluded, disadvantaged and the backward people so that ‘no one is left behind’ in the race for development.
8. Notes
1 This paper deals with select communities that are socially excluded. However, the ethnic communities of the Chittagong Hill Tracts (CHT) and people with disability are not discussed in this paper. Communities considered marginalized by the Department of Social Services (DSS) include: kamar (blacksmiths), kumar/mrithshilpi potters), Napit (hairdresser), people who make cane and bamboo produces, brassware producers and cobblers (shoe makers). DSS handles a number of allowances and recipients include transgenders (Hijra), Bede, Harijns and tea plantation workers from the among excluded communities discussed in this paper.
218 General Economics Division (GED)
2 For details on how this communities merit to be considered as small ethnic group see the profile of the Kshatriya in Lower Depths: Little Known Ethnic Communities of Bangladesh (edited by Philip Gain and published by Society for Environment and Human Development, 2016, pp 86-88).
3 For details of the 80 communities in the tea gardens, see Slaves in These Times: Tea Communities of Bangladesh (edited by Philip Gain and published by Society for Environment and Human Development, 2016).
4 For the details of Social Safety Nets in HIES see Chapter-IX (pp 103-110) in Report on Household Income and Expenditure Survey 2016. Bangladesh Bureau of Statistics (BBS). June 2019.
5 See Stephen Kidd, Social Exclusion and Access to Social protection schemes, Australian Government, Department of Foreign Affairs and Trade 2014
219Background Papers
References Akhteruzzaman, Dewan Haque; ASM Tofazzal and Bashfore, Panna Lal. 2006. Poverty Alleviation and Empowerment Strategy of the Harijan Community. Published by Research Initiative, Bangladesh (RIB).
Ariquzzaman, Shudeepto. 18 September 2014. Untouchable Hearts. Published in weekend Tribune.
Asaduzzaman, A. 2001. The ‘Pariah’ People: An Ethnography of the Urban Sweepers in Bangladesh. Published by University Press Limited.
Bangladesh Bureau of Statistics (BBS). Statistical Year Book Bangladesh, 2018.
Bangladesh Bureau of Statistics. Final Report on Household Income and Expenditure Survey 2016. June 2019.
Bangladesh Bureau of Statistics. Poverty and Extreme Poverty rate of Bangladesh, 2018-2019. http://bbs.portal.gov.bd/sites/default/files/files/bbs.portal.gov.bd/page/5695ab85_1403_483a_afb4_26dfd767df18/2019-12-17-16-30-614e10bcb101bc1df5938723cc141c5d.pdf. Accessed on 8 January 2020.
BRAC Annual report 2018.
Dalton, Edward. 1978. Tribal History of Eastern India. New Dehli: Cosmo Publications.
Shamsul Alam, Challenges in implementing social protection programmes, The Financial Express, 25 April 2017.
Department of Social Services (DSS), Government of Bangladesh. http://www.dss.gov.bd/. Accessed on 5 February 2020.
Financial Express. What should be role of TCB? September 17, 2018.
Stranded Pakistanis General Repatriation Committee (SPGRC), Survey findings, 1992.
Gain, Philip (editor). 2019. State of the Excluded and Marginalized Communities. Society for Environment and Human Development (SEHD).
Gain, Philip. 2019 Modhupur: The Vanishing Forest and Her People In Agony. Society for Environment and Human Development (SEHD).
Gain, Philip and Gain, Sabrina Miti. 2019. Kaipurta: A Pig Rearing Community. Society for Environment and Human Development (SEHD).
Gain, Philip (editor). 2011. Survival on the Fringe: Adivasis of Bangladesh. Society for Environment and Human Development (SEHD).
Gain, Philip (editor). 2017. Bangladesher Khudra Jatishomuher Porichoy and Manchitrayan Bishoye Punorbhabna (Identity of Smaller Ethnic Groups of Bangladesh and Rethinking about their Mapping). Society for Environment and Human Development (SEHD).
Gain, Philip (editor). 2016. Lower Depths: Little-Known Ethnic Communities of Bangladesh. Society for Environment and Human Development (SEHD).
Gain, Philip (editor). 2016. Slaves in these Times: The Communities of Bangladesh. Society for Environment and Human Development (SEHD).
220 General Economics Division (GED)
Gain, Philip. 2015. Excluded Communities and Democratisation. Society for Environment and Human Development (SEHD).
Gain, Philp; Sujit Malo, James; Lily, Aleya Akther and Rabiullah. 2019. Bangladesher Jounapalli O Jounakarma, Halnagad Chitro 2018 (Brothels and sex workers in Bangladesh, an update 2018). Society for Environment and Human Development (SEHD).
General Economics Division (GED), Bangladesh Planning Commission, Ministry of Planning, GoB. May 2019. Implementation Review of the Sixth Five Year Plan (FY 2011-FY 2015) and its Attainments.
General Economics Division (GED), Bangladesh Planning Commission, Ministry of Planning, GoB. Sustainable Development Goals (SDGs), Bangladesh Progress Report 2018.
General Economics Division (GED), Bangladesh Planning Commission, Ministry of Planning, GoB. June 2019. Mid-term Implementation Review of the Seventh Five Year Plan (FY 2016–FY 2020) (FY 2016, FY 2017 and half of FY 2017-18).
General Economics Division (GED), Planning Commission, Ministry of Planning, GoB. SIXTH FIVE YEAR PLAN FY2011-FY2015: Accelerating Growth and Reducing Poverty Part-1, Strategic Directions and Policy Framework.
General Economics Division (GED), Planning Commission, Ministry of Planning, GoB. Social Security Policy (SSPS) Programme. http://socialprotection.gov.bd/en/2018/11/04/implementing-ministries/. Accessed on 8 January 2020.
Government of People’s Republic of Bangladesh (Ministry of Cultural Affairs). Bangladesh Gazette, 23 March 2019. S.R.O No.78-Ain/2019, Amendment to Khudra Nri-Goshthi Sangskritik Pratisthan Ain 2010.
Government of People’s Republic of Bangladesh (National Legal Aid Services Organization, Ministry of Law, Justice and Parliamentary Affairs). Bangladesh Gazette, 21 July 2014. Aingata Sahayata Prodan Nitimala (Legal Aid Policy 2014).
Government of People’s Republic of Bangladesh (Ministry of Law, Justice and Parliamentary Affairs). Bangladesh Gazette, 21 July 2014. Legal Aid Services Act, 2000, Act No. VI of 2000 [26 January, 2000].
Government of People’s Republic of Bangladesh, Ek Nojore Ashrayan Prokolpo (Ashrayan Project At a Glance). http://www.ashrayanpmo.gov.bd/site/page/5e75d465-34fa-48a6-b1af-54b983a666d7/-. Accessed 16 May 2020.
Islam, Mazharul and Parvez, Altaf. Dalit Initiatives in Bangladesh, First Edition, October 2013, published by Nagorik Uddyog & Bangladesh Dalit and Excluded Rights Movement (BDERM)
Hutton, J.H. 1961. Caste in India. Oxford University Press.
Kazzer, Anup Modi, Working Knowledge of Polity. Answers, 13 October 2014, What’s the major difference between 5th and 6th Schedule of Indian Constitution? Retrieved from https://www.quora.com/Whats-the-major-difference-between-5th-and-6th-schedule-of-Indian-Constitution.
Lenoir, René. 1974/1989. Les Exclus: Un Francais sur Dix. Paris: Editions du Seuil.
Maksud, AKM & Rasul, Imtiaj. 2006. The Nomadic Bede Community and Their Mobile School Program. Published by Grambangla Unnayan Committee.
221Background Papers
Maksud, AKM Gupta; Shanker Das and Khan, Soud, 2009. Law of the Sardar in the Bede Society and the National Laws. Published by Grambangla Unnyan Committee.
Maksud, AKM, Gupta, Shankar Das and Khan, Saud. 2009. Bede Shomaje Sarderer Ain ebong Rashtrio Ain (Laws of Sarders of Bede Society and State Laws). Published by Grambangla Unnayan Committee.
Mansur, Dr. Ahsan Mandur and Khondker, Dr. Bazlul H, A Review of Social Protection System in Alam, Shamsul, PhD (ed.), Background Research Papers for Preparing the National Social Security Strategy of Bangladesh, June 2017.
Ministry of Social Welfare. Annual Report, 2017-2018.
Minority Rights Group (MRG). 2017. Bangladesh Biharis. Retrieved from https://minorityrights.org/minorities/biharis/
Moral, Shishir. Satchallish Zilay Adivasi Komche! (Adivasis are decreasing in 47 districts), Prothom Alo, 31 August 2013. (http://archive.prothom-alo.com/detail/date/2012-08-17/news/282516.
National AIDS/STD Control Programme (NASP), Directorate General of Health Services, Ministry of Health and Family Welfare and Save the Children. 27 June 2016. Mapping and Size Estimation of Key Population in Bangladesh for HIV Programmes 2015-16.
National Legal Aid Services Organization (NLASO), Annual Report 2018-2019.
Paggi, Luigi (1990). Research on the Muchi-Rishis of Khulna and Satkhira – Bangladesh. Published by Xaverian Missionaries, Rome.
Policy Research Institute (PRI). April 2019. Barriers of Accessing Social Protection Programmes for the Poor and Marginalised.
Project Development Unit, Bangladesh Tea Board (BTB). June 2015. Statistics on Bangladesh Tea Industry-2015.
…, …. June 2020, Volume vIII. Statistical Hanbook on Bangladesh Tea Industry 2019.
Raf-Ana-Rabbi Shawon, and Mahbub-E-Rabbi. 2007. Present Social Awareness and Economic Condition of the Nomadic Bede Community at Narayanganj District in Bangladesh. Published in American Journal of Rural Development, Volume 5, No. 4, 106-109.
Rahman, Md. Mojibur. 2009. Pig Rearing for Poverty Alleviation of the Kawra Community: An Action Research. Published by Research Initiatives Bangladesh (RIB).
Rahman, Hossain Zillur and Gain, Sabrina Miti. 2019. Harijans of Bangladesh. Published by Society for Environment and Human Development (SEHD).
Rahman, Hossain Zillur and Gain, Sabrina Miti. 2019. Jaladas: A Seafaring Fishing Community. Published by Society for Environment and Human Development (SEHD).
Rahman, Hossain Zillur and Gain, Sabrina Miti. 2019. Rishis of Khulna. Published by Society for Environment and Human Development (SEHD).
Rahman, Hossain Zillur and Gain, Sabrina Miti. 2019. Bihari Community: Living in Camps. Published by Society for Environment and Human Development (SEHD).
Rahman, Hossain Zillur, Gain, Sabrina Miti and Gain, Philip. 2019. Bede: A Nomadic Existence. Published by Society for Environment and Human Development (SEHD).
222 General Economics Division (GED)
Rahman, Hossain Zillur. A Time for Truths, The Daily Sar, 5 May 2020.
Raihan, Dr. Selim and Syer Tanzim Haque. Social Protection Strategies to Address Social and Gender-Based Exclusion, Including Disability, High-risk Groups and Minority Groups in Bangladesh in Alam, Shamsul, PhD (ed.) Background Research Papers for Preparing the National Social Security Strategy of Bangladesh, June 2017, pp 74-76).
Risley, H.H. 1891. The Tribes and Castes of Bengal—Ethnographic Glossary. Volume I. Firma KLM Private Company Kolkata. PP 375-382.
Shishir Moral, Satchallish Zilay Adibashir Sangkhya Komche (Adibashi population in 47 districts is decreasing), Prothom Alo, 27-08-2012. http://archive.prothom-alo.com/detail/date/2012-08-17/news/282516. Accessed on 26 January 2020.
Silver, Hilary. 1995. Reconceptualizing Social Disadvantage: Three Paradigms of Social Exclusion in Social Exclusion: Rhetoric, Reality, Responses, edited by Gerry Rodgers, Charles Gore, and Jose Figueiredo. Geneva: International Institute for Labour Studies.
———, and Frank Wilkinson. 1995. Policies to Combat Social Exclusion: A French-British Comparison. In Social Exclusion: Rhetoric, Reality, Responses, edited by Gerry Rodgers, Charles Gore, and Jose Figueiredo. Geneva: International Institute for Labour Studies.
The Daily Star online report, March 31, 2020, last updated April 02, 2020. Govt to launch special OMS for rice; price set at Tk 10 per kg
UNB, Dhaka. 16 lakh registered as disabled in Bangladesh. Published in The Daily Star, 8 October 2018.
Whitaker, Ben, et al. 1982. The Biharis of Bangladesh. Published by Minority Rights Group (MRG), London.
Zene, Cosimo. 2002. The Rishi of Bangladesh: A History of Christian Dialogues. Routledge, London and New York.
Zene, Cosimo. 2007. Myth, Identity and Belonging: The Rishi of Bangladesh. Published in Elsevier Regional Issue 37, Page-257-281.
Wekipedia. Jalia.Kaibarta. Accessed at: https://en.wikipedia.org/wiki/Jalia.Kaibarta.
10. Individuals consulted
Aleya Akter Lily, General Secretary, Sex Worker’s Network (SWN).
Aminul Arifeen, National Project Manager, Social Security Policy Support Programme (SSPSP), UNDP.
Asha Ornal, Secretary, Shamsernagar Tea Estate, Kamalganj.
Babul Robidas, lawyer, Joypurhat Judge Court, Joypurhat.
Bijoy Bunerjee, Chairman, Rajghat Union, Sreemangal Upazila, Moulvibazar and trade union leader.
Bishnu Harijan, General Secretary, Bangladesh Horijon Yokkha Parishad (BHOP), Rail Bazar, Harijan Colony, Jashore.
Chitta Ghosh, former president, Dinajpur Press Club, Dinajpur.
Discussion and consultation with Bangladesh Harijon Yokkha Parishad (Bangladesh Harijan Unity Council).
223Background Papers
Hossain Zillur Rahman, PhD, Chairman, Power and Participation Centre (PPRC) and Former Adviser, Caretaker Government.
Eugin Nokrek, President, Joyenshahi Adivasi Unnayan Parishad (JAUP).
Farhana Yeasmin, Social Services Officer, Development program for improving the standard of Hijra, Bede and Underprivileged Communities, Department of Social Services, Ministry of Social Welfare.
Farid Ahmed Mollah, Deputy Director, Allowance Cell, Department of Social Services, Ministry of Social Welfare.
Harishankar Jaladas, PhD, Writer, Chattogram.
Harunur Rashid, Assistant Project Director-1, Development of the Living Standard of the Marginal People of Bangladesh Project, Department of Social Services, Ministry of Social Welfare.
Ivan Ahamed Katha, President, Sachetan Samajseba Hijra Sangha (SSHS).
Jalal Ahmed, Former Additional Secretary, Ministry of Finance.
Kazol Akter, President, Sex Worker’s Network (SWN).
Khan Mohammad Shaid, Chief Coordinator, Madaripur Legal Aid Association (MLAA).
Krishnalal, President, Bangladesh Horijon Yokkha Parishad (BHOP).
M Shah Alam, Chairman, Bangladesh Tea Association (BTA).
Masuda Yasmin, Senior Assistant Judge and Assistant Director (Monitoring), National Legal Aid
Services Organization (NLASO)
Mostafa Zamil, Deputy Director, Programme, Bangladesh Legal Aid Services Trust (BLAST).
Md. Alamgir Hossen, Deputy Director, Bangladesh Bureau of Statistics (BBS).
Md. Yunus Ali, Former Chief Conservator of Forest (CCF).
Md. Arifuzzaman, Assistant Project Director-2, Development of the Living Standard of the Marginal People of Bangladesh Project, Department of Social Services, Ministry of Social Welfare.
Md. Kamruzzaman, Deputy Director, Urban Community Development (UCD) and Project Director, Development of the Living Standard of the Marginal People of Bangladesh Project, Department of Social Services, Ministry of Social Welfare.
Md. Sazzadul Islam, Deputy Director, Research, Evaluation, Publication and Public Relations, Department of Social Services, Ministry of Social Welfare.
Md. Shaukat Ali, General Secretary, Stranded Pakistanis General Repatriation Committee (SPGRC), Bangladesh.
Masuda Yasmin, Senior Assistant Judge and Assistant Director (Monitoring), National Legal Aid Services Organization (NLASO)
Milon Das, Executive Director, Parittran, Luxmanpur, Subhasini, Tala, Sathkhira.
Nina Goswami, Senior Deputy Director, Ain O Shalish Kendra (ASK).
Nirmal Chandra Das, General Secretary, Bangladesh Horijon Yokkha Parishad (BHOP).
Nripen Pal, Joint General Secretary, Bangladesh Cha Sramik Union (BCSU).
224 General Economics Division (GED)
Parimal Sing Baraik, Moulvibazar Cha Janagosthi Adivasi Front (MCJAF), Bhurburia Tea Estate, Sreemangal, Moulvibazar.
Prof. Mahmudul H. Sumon, Department of Anthropology, Jahangirnagar University.
Prof. Masudul Hoque, Dinajpur Govt. College, Dinajpur.
Prof. Rehman Sobhan, Eminent Economist and Chairman, Centre for Policy Dialogue (CPD).
Prof. Rounaq Jahan, Distinguished Fellow, CPD and Visiting Scholar, Columbia University.
Prof. Tahmina Ahmed, Department of English, University of Dhaka.
Prof. Tanzimuddin Khan, Department of International Relations, University of Dhaka.
Prof. Wahiduddin Mahmud, Eminent Economist.
Prof. Zoynal Abedin, Senior Journalist, The Daily Ittefaq, Modhupur, Tangail.
Rabindranath Saren, President, Jatiyo Adivasi Parishad (JAP), Rajshahi.
Rambhajan Kairi, General Secretary, Bangladesh Tea Association (BCSU).
Ruma Sultana , Programme Coordinator, Manusher Jonno Foundation (MJF).
SK Jenefa Khanom Jabbar, Director, Human Rights and Legal Aid Services and Social
Compliance, BRAC
Sarah Marandy, Senior Program Manager, Social and Economic Development, Gram Bikash Kendra (GBK), Dinajpur.
Shahriar Sadat, Programme Head, Human Rights an d Legal Aid Services, BRAC.
Saud Khan, Munshiganj. (Village. Kharia, Upazila. Lawhajang, Dist. Munshiganj).
Tapan Datta, President, Bangladesh Trade Union Center, Chattogram.
225Background Papers
Study 15:Addressing The Poverty, Lagging Regions, And
Inequality Challenges In Bangladesh In The 8th FYP
Sadiq Ahmed*
* Vice-Chairman, Policy Research Institute (PRI)

226 General Economics Division (GED)
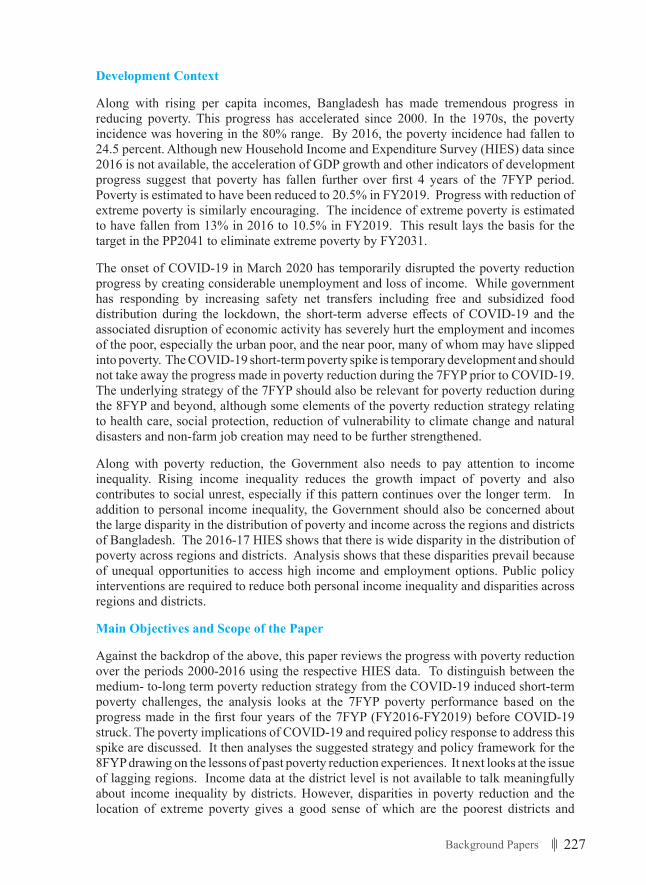
227Background Papers
Development Context
Along with rising per capita incomes, Bangladesh has made tremendous progress in reducing poverty. This progress has accelerated since 2000. In the 1970s, the poverty incidence was hovering in the 80% range. By 2016, the poverty incidence had fallen to 24.5 percent. Although new Household Income and Expenditure Survey (HIES) data since 2016 is not available, the acceleration of GDP growth and other indicators of development progress suggest that poverty has fallen further over first 4 years of the 7FYP period. Poverty is estimated to have been reduced to 20.5% in FY2019. Progress with reduction of extreme poverty is similarly encouraging. The incidence of extreme poverty is estimated to have fallen from 13% in 2016 to 10.5% in FY2019. This result lays the basis for the target in the PP2041 to eliminate extreme poverty by FY2031.
The onset of COVID-19 in March 2020 has temporarily disrupted the poverty reduction progress by creating considerable unemployment and loss of income. While government has responding by increasing safety net transfers including free and subsidized food distribution during the lockdown, the short-term adverse effects of COVID-19 and the associated disruption of economic activity has severely hurt the employment and incomes of the poor, especially the urban poor, and the near poor, many of whom may have slipped into poverty. The COVID-19 short-term poverty spike is temporary development and should not take away the progress made in poverty reduction during the 7FYP prior to COVID-19. The underlying strategy of the 7FYP should also be relevant for poverty reduction during the 8FYP and beyond, although some elements of the poverty reduction strategy relating to health care, social protection, reduction of vulnerability to climate change and natural disasters and non-farm job creation may need to be further strengthened.
Along with poverty reduction, the Government also needs to pay attention to income inequality. Rising income inequality reduces the growth impact of poverty and also contributes to social unrest, especially if this pattern continues over the longer term. In addition to personal income inequality, the Government should also be concerned about the large disparity in the distribution of poverty and income across the regions and districts of Bangladesh. The 2016-17 HIES shows that there is wide disparity in the distribution of poverty across regions and districts. Analysis shows that these disparities prevail because of unequal opportunities to access high income and employment options. Public policy interventions are required to reduce both personal income inequality and disparities across regions and districts.
Main Objectives and Scope of the Paper
Against the backdrop of the above, this paper reviews the progress with poverty reduction over the periods 2000-2016 using the respective HIES data. To distinguish between the medium- to-long term poverty reduction strategy from the COVID-19 induced short-term poverty challenges, the analysis looks at the 7FYP poverty performance based on the progress made in the first four years of the 7FYP (FY2016-FY2019) before COVID-19 struck. The poverty implications of COVID-19 and required policy response to address this spike are discussed. It then analyses the suggested strategy and policy framework for the 8FYP drawing on the lessons of past poverty reduction experiences. It next looks at the issue of lagging regions. Income data at the district level is not available to talk meaningfully about income inequality by districts. However, disparities in poverty reduction and the location of extreme poverty gives a good sense of which are the poorest districts and
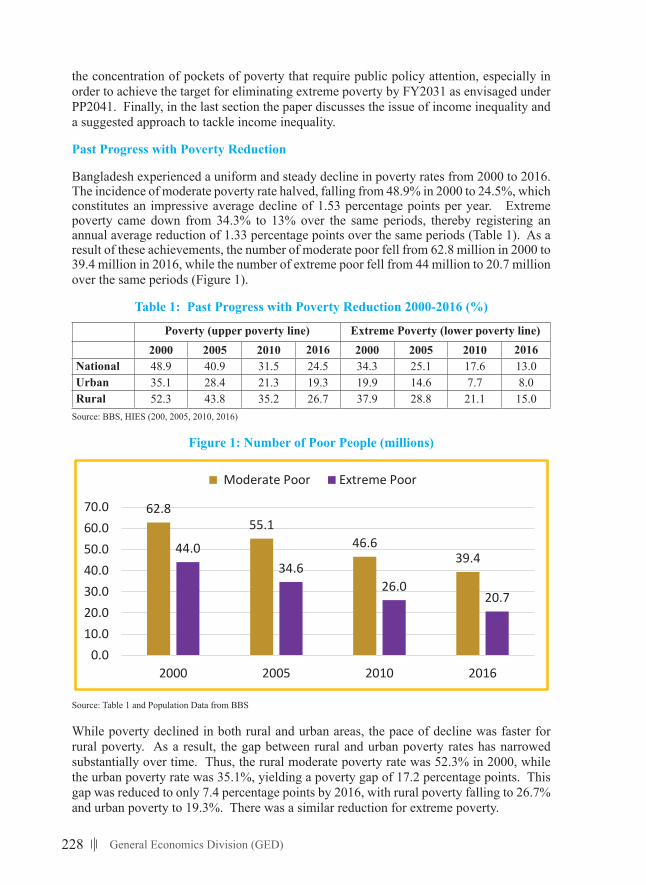
228 General Economics Division (GED)
the concentration of pockets of poverty that require public policy attention, especially in order to achieve the target for eliminating extreme poverty by FY2031 as envisaged under PP2041. Finally, in the last section the paper discusses the issue of income inequality and a suggested approach to tackle income inequality.
Past Progress with Poverty Reduction
Bangladesh experienced a uniform and steady decline in poverty rates from 2000 to 2016. The incidence of moderate poverty rate halved, falling from 48.9% in 2000 to 24.5%, which constitutes an impressive average decline of 1.53 percentage points per year. Extreme poverty came down from 34.3% to 13% over the same periods, thereby registering an annual average reduction of 1.33 percentage points over the same periods (Table 1). As a result of these achievements, the number of moderate poor fell from 62.8 million in 2000 to 39.4 million in 2016, while the number of extreme poor fell from 44 million to 20.7 million over the same periods (Figure 1).
Table 1: Past Progress with Poverty Reduction 2000-2016 (%)
Poverty (upper poverty line) Extreme Poverty (lower poverty line)2000 2005 2010 2016 2000 2005 2010 2016
National 48.9 40.9 31.5 24.5 34.3 25.1 17.6 13.0Urban 35.1 28.4 21.3 19.3 19.9 14.6 7.7 8.0Rural 52.3 43.8 35.2 26.7 37.9 28.8 21.1 15.0
Source: BBS, HIES (200, 2005, 2010, 2016)
Figure 1: Number of Poor People (millions)
3
Figure 1: Number of Poor People (millions)
Source: Table 1 and Population Data from BBS
While poverty declined in both rural and urban areas, the pace of decline was faster for rural poverty. As a result, the gap between rural and urban poverty rates has narrowed substantially over time. Thus, the rural moderate poverty rate was 52.3% in 2000, while the urban poverty rate was 35.1%, yielding a poverty gap of 17.2 percentage points. This gap was reduced to only 7.4 percentage points by 2016, with rural poverty falling to 26.7% and urban poverty to 19.3%. There was a similar reduction for extreme poverty.
Factors That Helped Achieve Poverty Results Outcome
Detailed research and analysis of the poverty outcomes over the 2000-2016 periods yields some very useful insights about the determinants of poverty reduction in Bangladesh. For analytical purposes, it is useful to break down the experience into two distinct phases: poverty reduction during 2000-2010 and poverty reduction during 2010-2016.
Growth, sectoral transformation and employment creation: First and foremost, there is consensus that GDP growth along with its composition are the two most important drivers of poverty reduction for both phases. Per capita GDP grew rapidly and the structure of the economy improved in both periods (Table 2). But there is a major difference in employment outcomes over the two periods. On average, the Bangladesh economy created many more jobs during 2000-2010 as compared with 2010-16. This was true for all sectors, including agriculture. So, even as agriculture’s GDP and employment shares were falling, agriculture continued to create new jobs during 2000-2010, whereas during 2010-2016, agriculture employment actually fell. Most importantly, industrial and services employment surged during 2000-2010, growing by an average of 2.5 million jobs as compared with only 0.9 million during 2010-16.
62.855.1
46.639.4
44.034.6
26.020.7
0.010.020.030.040.050.060.070.0
2000 2005 2010 2016
Moderate Poor Extreme Poor
Source: Table 1 and Population Data from BBS
While poverty declined in both rural and urban areas, the pace of decline was faster for rural poverty. As a result, the gap between rural and urban poverty rates has narrowed substantially over time. Thus, the rural moderate poverty rate was 52.3% in 2000, while the urban poverty rate was 35.1%, yielding a poverty gap of 17.2 percentage points. This gap was reduced to only 7.4 percentage points by 2016, with rural poverty falling to 26.7% and urban poverty to 19.3%. There was a similar reduction for extreme poverty.
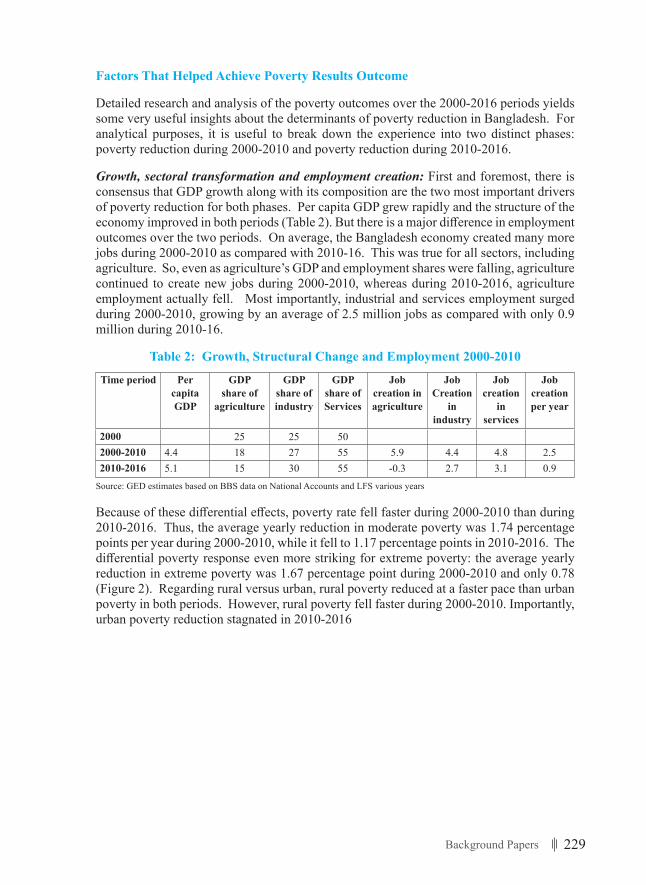
229Background Papers
Factors That Helped Achieve Poverty Results Outcome
Detailed research and analysis of the poverty outcomes over the 2000-2016 periods yields some very useful insights about the determinants of poverty reduction in Bangladesh. For analytical purposes, it is useful to break down the experience into two distinct phases: poverty reduction during 2000-2010 and poverty reduction during 2010-2016.
Growth, sectoral transformation and employment creation: First and foremost, there is consensus that GDP growth along with its composition are the two most important drivers of poverty reduction for both phases. Per capita GDP grew rapidly and the structure of the economy improved in both periods (Table 2). But there is a major difference in employment outcomes over the two periods. On average, the Bangladesh economy created many more jobs during 2000-2010 as compared with 2010-16. This was true for all sectors, including agriculture. So, even as agriculture’s GDP and employment shares were falling, agriculture continued to create new jobs during 2000-2010, whereas during 2010-2016, agriculture employment actually fell. Most importantly, industrial and services employment surged during 2000-2010, growing by an average of 2.5 million jobs as compared with only 0.9 million during 2010-16.
Table 2: Growth, Structural Change and Employment 2000-2010
Time period Per capita GDP
GDP share of
agriculture
GDP share of industry
GDP share of Services
Job creation in agriculture
Job Creation
in industry
Job creation
in services
Job creation per year
2000 25 25 502000-2010 4.4 18 27 55 5.9 4.4 4.8 2.52010-2016 5.1 15 30 55 -0.3 2.7 3.1 0.9
Source: GED estimates based on BBS data on National Accounts and LFS various years
Because of these differential effects, poverty rate fell faster during 2000-2010 than during 2010-2016. Thus, the average yearly reduction in moderate poverty was 1.74 percentage points per year during 2000-2010, while it fell to 1.17 percentage points in 2010-2016. The differential poverty response even more striking for extreme poverty: the average yearly reduction in extreme poverty was 1.67 percentage point during 2000-2010 and only 0.78 (Figure 2). Regarding rural versus urban, rural poverty reduced at a faster pace than urban poverty in both periods. However, rural poverty fell faster during 2000-2010. Importantly, urban poverty reduction stagnated in 2010-2016
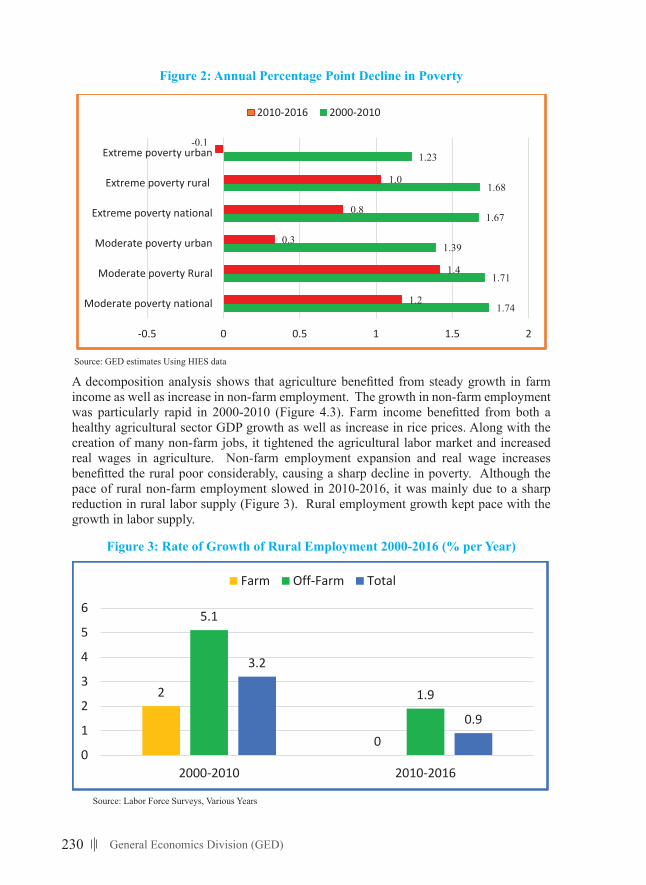
230 General Economics Division (GED)
Figure 2: Annual Percentage Point Decline in Poverty
4
Table 2: Growth, Structural Change and Employment 2000-2010
Time period Per capita GDP
GDP share of agriculture
GDP share of industry
GDP share of Services
Job creation in agriculture
Job Creation in industry
Job creation in services
Job creation per year
2000 25 25 50 2000-2010 4.4 18 27 55 5.9 4.4 4.8 2.5 2010-2016 5.1 15 30 55 -0.3 2.7 3.1 0.9
Source: GED estimates based on BBS data on National Accounts and LFS various years
Because of these differential effects, poverty rate fell faster during 2000-2010 than during 2010-2016. Thus, the average yearly reduction in moderate poverty was 1.74 percentage points per year during 2000-2010, while it fell to 1.17 percentage points in 2010-2016. The differential poverty response even more striking for extreme poverty: the average yearly reduction in extreme poverty was 1.67 percentage point during 2000-2010 and only 0.78 (Figure 2). Regarding rural versus urban, rural poverty reduced at a faster pace than urban poverty in both periods. However, rural poverty fell faster during 2000-2010. Importantly, urban poverty reduction stagnated in 2010-2016
Figure 2: Annual Percentage Point Decline in Poverty
Source: GED estimates Using HIES data
A decomposition analysis shows that agriculture benefitted from steady growth in farm income as well as increase in non-farm employment. The growth in non-farm employment was particularly rapid in 2000-2010 (Figure 4.3). Farm income benefitted from both a healthy agricultural sector GDP growth as well as increase in rice prices. Along with the creation of many non-farm jobs, it tightened the agricultural labor market and increased real wages in agriculture. Non-farm employment expansion and real wage increases benefitted the rural poor considerably, causing a sharp decline in poverty. Although the pace of rural non-farm employment slowed in 2010-2016,
1.74
1.71
1.39
1.67
1.68
1.23
1.2
1.4
0.3
0.8
1.0
-0.1
-0.5 0 0.5 1 1.5 2
Moderate poverty national
Moderate poverty Rural
Moderate poverty urban
Extreme poverty national
Extreme poverty rural
Extreme poverty urban
2010-2016 2000-2010
Source: GED estimates Using HIES data
A decomposition analysis shows that agriculture benefitted from steady growth in farm income as well as increase in non-farm employment. The growth in non-farm employment was particularly rapid in 2000-2010 (Figure 4.3). Farm income benefitted from both a healthy agricultural sector GDP growth as well as increase in rice prices. Along with the creation of many non-farm jobs, it tightened the agricultural labor market and increased real wages in agriculture. Non-farm employment expansion and real wage increases benefitted the rural poor considerably, causing a sharp decline in poverty. Although the pace of rural non-farm employment slowed in 2010-2016, it was mainly due to a sharp reduction in rural labor supply (Figure 3). Rural employment growth kept pace with the growth in labor supply.
Figure 3: Rate of Growth of Rural Employment 2000-2016 (% per Year)
5
it was mainly due to a sharp reduction in rural labor supply (Figure 3). Rural employment growth kept pace with the growth in labor supply.
Figure 3: Rate of Growth of Rural Employment 2000-2016 (% per Year)
Source: Labor Force Surveys, Various Years
Figure 4: Growth Rate of Labor Force (% per year)
Source: Labor Force Surveys Various Years
The substantial change in the employment structure of the rural economy, which also reflects the major reduction in the GDP share of agriculture, is illustrated in Figure 4. This is a major indication of the ongoing rural transformation where agriculture value-added and employment are shrinking and giving way to a growing non-farm economy. This rural transformation has played a major role in poverty reduction. Withdrawal of labor from agriculture, which is often regarded as infested with surplus labor and therefore suffering from disguised unemployment, has been a major positive development in rural transformation of Bangladesh. This has raised average labor productivity in agriculture and increased farm wages. Employment in nonfarm activities have
2
0
5.1
1.9
3.2
0.9
0
1
2
3
4
5
6
2000-2010 2010-2016
Farm Off-Farm Total
6.35.5 5.7
5.1
0.91.9
0.01.02.03.04.05.06.07.0
Urban Rural Total
2000-2010 2010-2016
Source: Labor Force Surveys, Various Years
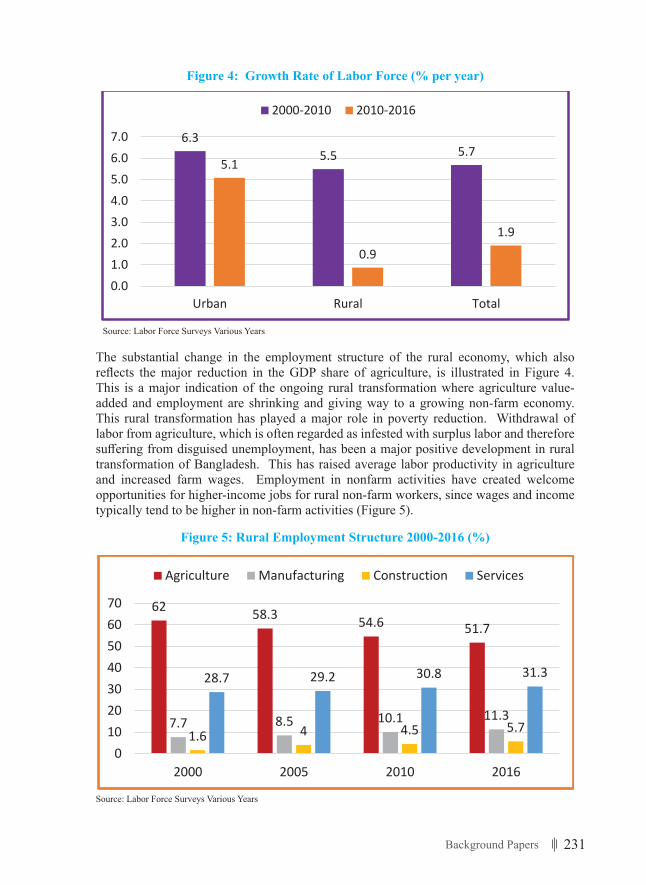
231Background Papers
Figure 4: Growth Rate of Labor Force (% per year)
5
it was mainly due to a sharp reduction in rural labor supply (Figure 3). Rural employment growth kept pace with the growth in labor supply.
Figure 3: Rate of Growth of Rural Employment 2000-2016 (% per Year)
Source: Labor Force Surveys, Various Years
Figure 4: Growth Rate of Labor Force (% per year)
Source: Labor Force Surveys Various Years
The substantial change in the employment structure of the rural economy, which also reflects the major reduction in the GDP share of agriculture, is illustrated in Figure 4. This is a major indication of the ongoing rural transformation where agriculture value-added and employment are shrinking and giving way to a growing non-farm economy. This rural transformation has played a major role in poverty reduction. Withdrawal of labor from agriculture, which is often regarded as infested with surplus labor and therefore suffering from disguised unemployment, has been a major positive development in rural transformation of Bangladesh. This has raised average labor productivity in agriculture and increased farm wages. Employment in nonfarm activities have
2
0
5.1
1.9
3.2
0.9
0
1
2
3
4
5
6
2000-2010 2010-2016
Farm Off-Farm Total
6.35.5 5.7
5.1
0.91.9
0.01.02.03.04.05.06.07.0
Urban Rural Total
2000-2010 2010-2016
Source: Labor Force Surveys Various Years
The substantial change in the employment structure of the rural economy, which also reflects the major reduction in the GDP share of agriculture, is illustrated in Figure 4. This is a major indication of the ongoing rural transformation where agriculture value-added and employment are shrinking and giving way to a growing non-farm economy. This rural transformation has played a major role in poverty reduction. Withdrawal of labor from agriculture, which is often regarded as infested with surplus labor and therefore suffering from disguised unemployment, has been a major positive development in rural transformation of Bangladesh. This has raised average labor productivity in agriculture and increased farm wages. Employment in nonfarm activities have created welcome opportunities for higher-income jobs for rural non-farm workers, since wages and income typically tend to be higher in non-farm activities (Figure 5).
Figure 5: Rural Employment Structure 2000-2016 (%)
6
created welcome opportunities for higher-income jobs for rural non-farm workers, since wages and income typically tend to be higher in non-farm activities (Figure 5).
Figure 5: Rural Employment Structure 2000-2016 (%)
Source: Labor Force Surveys Various Years
Figure 6: Real Wages in Rural Areas (Taka/day 2016 prices)
Source: HIES 2010 and 2016
The pace of job expansion in urban areas was much faster than in rural areas, which was instrumental in helping absorb the rapid increase in the urban labor force owing to internal migration. This was true for both 2000-2010 and 2010-2016. The urban poor benefitted most from the expansion of manufacturing jobs, especially in RMG, and in construction. This was the most important determinant of the reduction in urban poverty. Between 2000 and 2016, the RMG sector created some 2.4 million jobs, mostly low-skilled female workers. The construction sector also created another 1.1 million jobs, in urban areas. This rapid growth of industrial employment in the was the most important determinant of urban poverty reduction during 2000-2016. The services
62 58.3 54.6 51.7
7.7 8.5 10.1 11.31.6 4 4.5 5.7
28.7 29.2 30.8 31.3
010203040506070
2000 2005 2010 2016
Agriculture Manufacturing Construction Services
187
264219
338
0
100
200
300
400
2010 2016
Rural agriculture Rural non-farm
Source: Labor Force Surveys Various Years
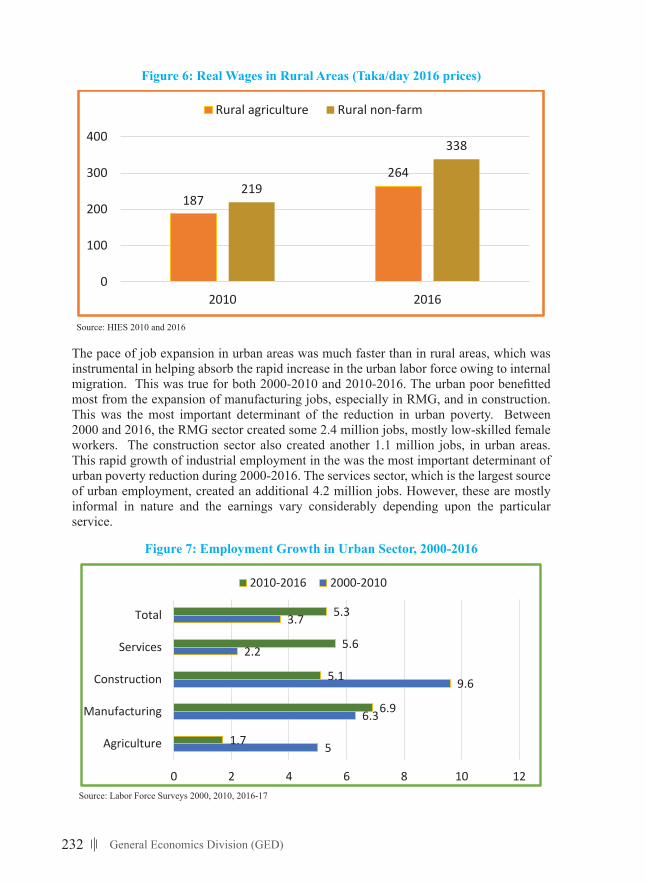
232 General Economics Division (GED)
Figure 6: Real Wages in Rural Areas (Taka/day 2016 prices)
6
created welcome opportunities for higher-income jobs for rural non-farm workers, since wages and income typically tend to be higher in non-farm activities (Figure 5).
Figure 5: Rural Employment Structure 2000-2016 (%)
Source: Labor Force Surveys Various Years
Figure 6: Real Wages in Rural Areas (Taka/day 2016 prices)
Source: HIES 2010 and 2016
The pace of job expansion in urban areas was much faster than in rural areas, which was instrumental in helping absorb the rapid increase in the urban labor force owing to internal migration. This was true for both 2000-2010 and 2010-2016. The urban poor benefitted most from the expansion of manufacturing jobs, especially in RMG, and in construction. This was the most important determinant of the reduction in urban poverty. Between 2000 and 2016, the RMG sector created some 2.4 million jobs, mostly low-skilled female workers. The construction sector also created another 1.1 million jobs, in urban areas. This rapid growth of industrial employment in the was the most important determinant of urban poverty reduction during 2000-2016. The services
62 58.3 54.6 51.7
7.7 8.5 10.1 11.31.6 4 4.5 5.7
28.7 29.2 30.8 31.3
010203040506070
2000 2005 2010 2016
Agriculture Manufacturing Construction Services
187
264219
338
0
100
200
300
400
2010 2016
Rural agriculture Rural non-farm
Source: HIES 2010 and 2016
The pace of job expansion in urban areas was much faster than in rural areas, which was instrumental in helping absorb the rapid increase in the urban labor force owing to internal migration. This was true for both 2000-2010 and 2010-2016. The urban poor benefitted most from the expansion of manufacturing jobs, especially in RMG, and in construction. This was the most important determinant of the reduction in urban poverty. Between 2000 and 2016, the RMG sector created some 2.4 million jobs, mostly low-skilled female workers. The construction sector also created another 1.1 million jobs, in urban areas. This rapid growth of industrial employment in the was the most important determinant of urban poverty reduction during 2000-2016. The services sector, which is the largest source of urban employment, created an additional 4.2 million jobs. However, these are mostly informal in nature and the earnings vary considerably depending upon the particular service.
Figure 7: Employment Growth in Urban Sector, 2000-2016
7
sector, which is the largest source of urban employment, created an additional 4.2 million jobs. However, these are mostly informal in nature and the earnings vary considerably depending upon the particular service.
Figure 7: Employment Growth in Urban Sector, 2000-2016
Source: Labor Force Surveys 2000, 2010, 2016-17
Despite the surge in urban labor force, the urban labor market generally remained favorable for most of the urban poor. This is indicated by the growth in urban wages over 2010-2016 (Figure 8). The non-agricultural average wage rate also maintained a healthy premium (18%) over rural non-agricultural wage rate to justify continued rural -urban migration.
Figure 8: Urban Sector Wage Rate (Taka/day, 2016 prices)
Source: HIES 2010, HIES 2016-17
External employment and remittances: Income transfers from internal and external migration are another important source of poverty reduction, especially in rural areas. External migration has
5
6.3
9.6
2.2
3.7
1.7
6.9
5.1
5.6
5.3
0 2 4 6 8 10 12
Agriculture
Manufacturing
Construction
Services
Total
2010-2016 2000-2010
195
259
290
399
0 100 200 300 400 500
Urban agriculture
Urban non-agriculture
2016 2010
Source: Labor Force Surveys 2000, 2010, 2016-17
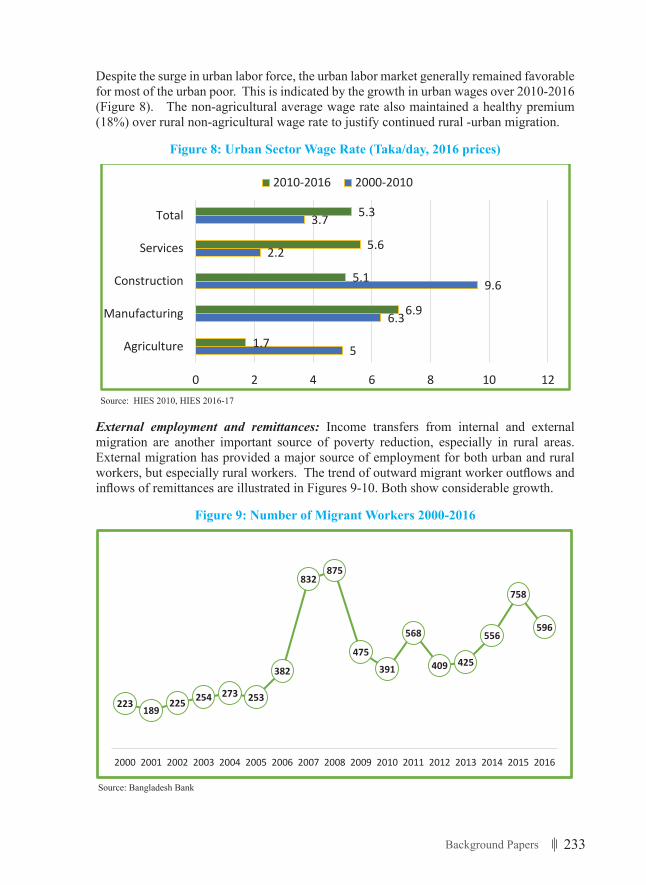
233Background Papers
Despite the surge in urban labor force, the urban labor market generally remained favorable for most of the urban poor. This is indicated by the growth in urban wages over 2010-2016 (Figure 8). The non-agricultural average wage rate also maintained a healthy premium (18%) over rural non-agricultural wage rate to justify continued rural -urban migration.
Figure 8: Urban Sector Wage Rate (Taka/day, 2016 prices)
7
sector, which is the largest source of urban employment, created an additional 4.2 million jobs. However, these are mostly informal in nature and the earnings vary considerably depending upon the particular service.
Figure 7: Employment Growth in Urban Sector, 2000-2016
Source: Labor Force Surveys 2000, 2010, 2016-17
Despite the surge in urban labor force, the urban labor market generally remained favorable for most of the urban poor. This is indicated by the growth in urban wages over 2010-2016 (Figure 8). The non-agricultural average wage rate also maintained a healthy premium (18%) over rural non-agricultural wage rate to justify continued rural -urban migration.
Figure 8: Urban Sector Wage Rate (Taka/day, 2016 prices)
Source: HIES 2010, HIES 2016-17
External employment and remittances: Income transfers from internal and external migration are another important source of poverty reduction, especially in rural areas. External migration has
5
6.3
9.6
2.2
3.7
1.7
6.9
5.1
5.6
5.3
0 2 4 6 8 10 12
Agriculture
Manufacturing
Construction
Services
Total
2010-2016 2000-2010
195
259
290
399
0 100 200 300 400 500
Urban agriculture
Urban non-agriculture
2016 2010
Source: HIES 2010, HIES 2016-17
External employment and remittances: Income transfers from internal and external migration are another important source of poverty reduction, especially in rural areas. External migration has provided a major source of employment for both urban and rural workers, but especially rural workers. The trend of outward migrant worker outflows and inflows of remittances are illustrated in Figures 9-10. Both show considerable growth.
Figure 9: Number of Migrant Workers 2000-2016
8
provided a major source of employment for both urban and rural workers, but especially rural workers. The trend of outward migrant worker outflows and inflows of remittances are illustrated in Figures 9-10. Both show considerable growth.
Figure 9: Number of Migrant Workers 2000-2016
Source: Bangladesh Bank
Figure 10: Inflow of Remittances 2000-2016 ($ billion)
Source: Bangladesh Bank
Much of the remittances flow out to rural areas that has radically changed the rural landscape through injection of large income transfers that has not only supported the growth of rural transport. health and education services. A part of the outflow of agricultural labor has fed into the migrant labor market, although the bulk has gone to non-farm employment in rural and urban areas. HIES data suggest that the distribution of remittances favor more the non-poor households. Additionally, the percentage of households in the bottom 40% benefiting from remittances has fallen from 4.1% in 2010 to 2.3% in 2010. Yet, remittance inflows have contributed substantially
223 189 225 254 273 253
382
832875
475391
568
409 425
556
758
596
2000 2001 2002 2003 2004 2005 2006 2007 2008 2009 2010 2011 2012 2013 2014 2015 2016
1.95 2.072.85 3.18 3.57
4.255.48
6.56
8.98
10.72 1112.17
14.16 13.8314.94 15.23
13.61
0
2
4
6
8
10
12
14
16
1998 2000 2002 2004 2006 2008 2010 2012 2014 2016 2018
Source: Bangladesh Bank
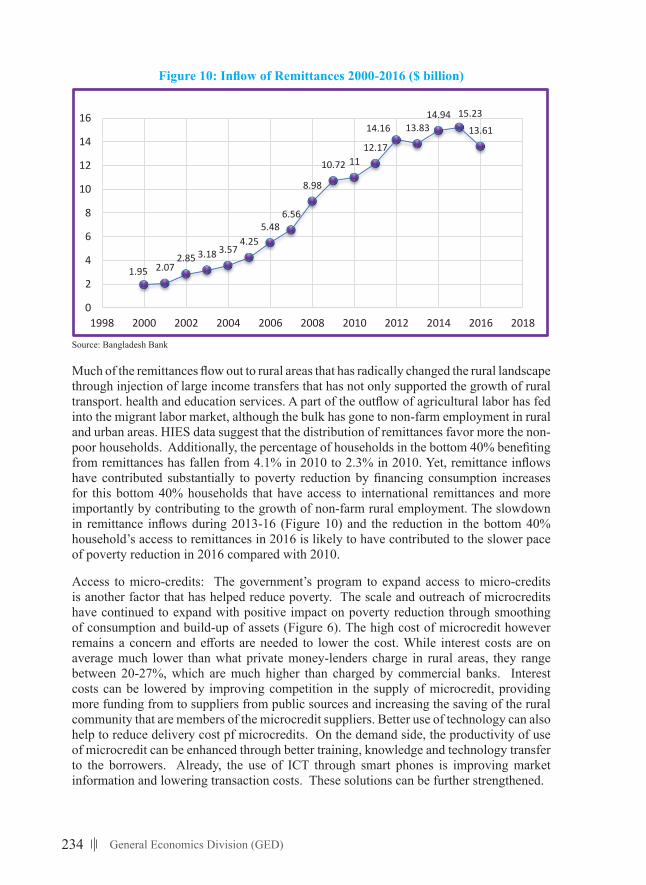
234 General Economics Division (GED)
Figure10:InflowofRemittances2000-2016($billion)
8
provided a major source of employment for both urban and rural workers, but especially rural workers. The trend of outward migrant worker outflows and inflows of remittances are illustrated in Figures 9-10. Both show considerable growth.
Figure 9: Number of Migrant Workers 2000-2016
Source: Bangladesh Bank
Figure 10: Inflow of Remittances 2000-2016 ($ billion)
Source: Bangladesh Bank
Much of the remittances flow out to rural areas that has radically changed the rural landscape through injection of large income transfers that has not only supported the growth of rural transport. health and education services. A part of the outflow of agricultural labor has fed into the migrant labor market, although the bulk has gone to non-farm employment in rural and urban areas. HIES data suggest that the distribution of remittances favor more the non-poor households. Additionally, the percentage of households in the bottom 40% benefiting from remittances has fallen from 4.1% in 2010 to 2.3% in 2010. Yet, remittance inflows have contributed substantially
223 189 225 254 273 253
382
832875
475391
568
409 425
556
758
596
2000 2001 2002 2003 2004 2005 2006 2007 2008 2009 2010 2011 2012 2013 2014 2015 2016
1.95 2.072.85 3.18 3.57
4.255.48
6.56
8.98
10.72 1112.17
14.16 13.8314.94 15.23
13.61
0
2
4
6
8
10
12
14
16
1998 2000 2002 2004 2006 2008 2010 2012 2014 2016 2018
Source: Bangladesh Bank
Much of the remittances flow out to rural areas that has radically changed the rural landscape through injection of large income transfers that has not only supported the growth of rural transport. health and education services. A part of the outflow of agricultural labor has fed into the migrant labor market, although the bulk has gone to non-farm employment in rural and urban areas. HIES data suggest that the distribution of remittances favor more the non-poor households. Additionally, the percentage of households in the bottom 40% benefiting from remittances has fallen from 4.1% in 2010 to 2.3% in 2010. Yet, remittance inflows have contributed substantially to poverty reduction by financing consumption increases for this bottom 40% households that have access to international remittances and more importantly by contributing to the growth of non-farm rural employment. The slowdown in remittance inflows during 2013-16 (Figure 10) and the reduction in the bottom 40% household’s access to remittances in 2016 is likely to have contributed to the slower pace of poverty reduction in 2016 compared with 2010.
Access to micro-credits: The government’s program to expand access to micro-credits is another factor that has helped reduce poverty. The scale and outreach of microcredits have continued to expand with positive impact on poverty reduction through smoothing of consumption and build-up of assets (Figure 6). The high cost of microcredit however remains a concern and efforts are needed to lower the cost. While interest costs are on average much lower than what private money-lenders charge in rural areas, they range between 20-27%, which are much higher than charged by commercial banks. Interest costs can be lowered by improving competition in the supply of microcredit, providing more funding from to suppliers from public sources and increasing the saving of the rural community that are members of the microcredit suppliers. Better use of technology can also help to reduce delivery cost pf microcredits. On the demand side, the productivity of use of microcredit can be enhanced through better training, knowledge and technology transfer to the borrowers. Already, the use of ICT through smart phones is improving market information and lowering transaction costs. These solutions can be further strengthened.
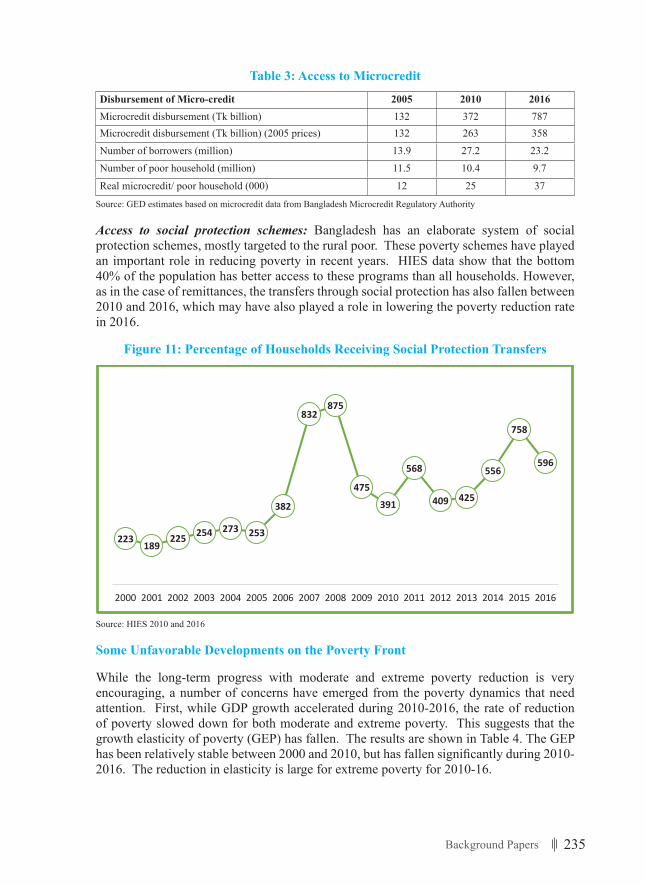
235Background Papers
Table 3: Access to Microcredit
Disbursement of Micro-credit 2005 2010 2016Microcredit disbursement (Tk billion) 132 372 787Microcredit disbursement (Tk billion) (2005 prices) 132 263 358Number of borrowers (million) 13.9 27.2 23.2Number of poor household (million) 11.5 10.4 9.7
Real microcredit/ poor household (000) 12 25 37
Source: GED estimates based on microcredit data from Bangladesh Microcredit Regulatory Authority
Access to social protection schemes: Bangladesh has an elaborate system of social protection schemes, mostly targeted to the rural poor. These poverty schemes have played an important role in reducing poverty in recent years. HIES data show that the bottom 40% of the population has better access to these programs than all households. However, as in the case of remittances, the transfers through social protection has also fallen between 2010 and 2016, which may have also played a role in lowering the poverty reduction rate in 2016.
Figure 11: Percentage of Households Receiving Social Protection Transfers
8
provided a major source of employment for both urban and rural workers, but especially rural workers. The trend of outward migrant worker outflows and inflows of remittances are illustrated in Figures 9-10. Both show considerable growth.
Figure 9: Number of Migrant Workers 2000-2016
Source: Bangladesh Bank
Figure 10: Inflow of Remittances 2000-2016 ($ billion)
Source: Bangladesh Bank
Much of the remittances flow out to rural areas that has radically changed the rural landscape through injection of large income transfers that has not only supported the growth of rural transport. health and education services. A part of the outflow of agricultural labor has fed into the migrant labor market, although the bulk has gone to non-farm employment in rural and urban areas. HIES data suggest that the distribution of remittances favor more the non-poor households. Additionally, the percentage of households in the bottom 40% benefiting from remittances has fallen from 4.1% in 2010 to 2.3% in 2010. Yet, remittance inflows have contributed substantially
223 189 225 254 273 253
382
832875
475391
568
409 425
556
758
596
2000 2001 2002 2003 2004 2005 2006 2007 2008 2009 2010 2011 2012 2013 2014 2015 2016
1.95 2.072.85 3.18 3.57
4.255.48
6.56
8.98
10.72 1112.17
14.16 13.8314.94 15.23
13.61
0
2
4
6
8
10
12
14
16
1998 2000 2002 2004 2006 2008 2010 2012 2014 2016 2018
Source: HIES 2010 and 2016
Some Unfavorable Developments on the Poverty Front
While the long-term progress with moderate and extreme poverty reduction is very encouraging, a number of concerns have emerged from the poverty dynamics that need attention. First, while GDP growth accelerated during 2010-2016, the rate of reduction of poverty slowed down for both moderate and extreme poverty. This suggests that the growth elasticity of poverty (GEP) has fallen. The results are shown in Table 4. The GEP has been relatively stable between 2000 and 2010, but has fallen significantly during 2010-2016. The reduction in elasticity is large for extreme poverty for 2010-16.
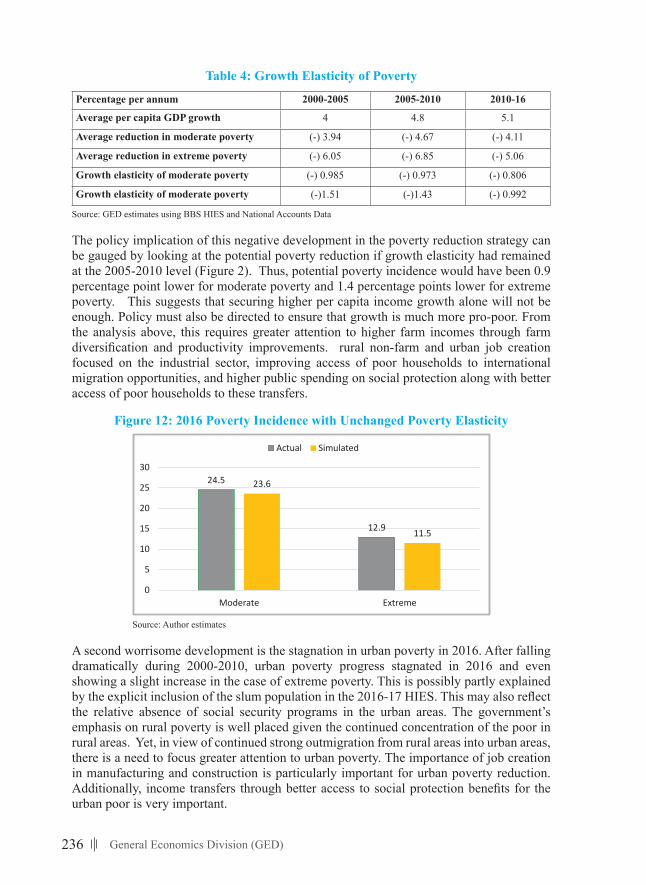
236 General Economics Division (GED)
Table 4: Growth Elasticity of Poverty
Percentage per annum 2000-2005 2005-2010 2010-16
Average per capita GDP growth 4 4.8 5.1
Average reduction in moderate poverty (-) 3.94 (-) 4.67 (-) 4.11
Average reduction in extreme poverty (-) 6.05 (-) 6.85 (-) 5.06
Growth elasticity of moderate poverty (-) 0.985 (-) 0.973 (-) 0.806
Growth elasticity of moderate poverty (-)1.51 (-)1.43 (-) 0.992
Source: GED estimates using BBS HIES and National Accounts Data
The policy implication of this negative development in the poverty reduction strategy can be gauged by looking at the potential poverty reduction if growth elasticity had remained at the 2005-2010 level (Figure 2). Thus, potential poverty incidence would have been 0.9 percentage point lower for moderate poverty and 1.4 percentage points lower for extreme poverty. This suggests that securing higher per capita income growth alone will not be enough. Policy must also be directed to ensure that growth is much more pro-poor. From the analysis above, this requires greater attention to higher farm incomes through farm diversification and productivity improvements. rural non-farm and urban job creation focused on the industrial sector, improving access of poor households to international migration opportunities, and higher public spending on social protection along with better access of poor households to these transfers.
Figure 12: 2016 Poverty Incidence with Unchanged Poverty Elasticity
11
improvements. rural non-farm and urban job creation focused on the industrial sector, improving access of poor households to international migration opportunities, and higher public spending on social protection along with better access of poor households to these transfers.
Figure 12: 2016 Poverty Incidence with Unchanged Poverty Elasticity
Source: Author estimates
A second worrisome development is the stagnation in urban poverty in 2016. After falling dramatically during 2000-2010, urban poverty progress stagnated in 2016 and even showing a slight increase in the case of extreme poverty. This is possibly partly explained by the explicit inclusion of the slum population in the 2016-17 HIES. This may also reflect the relative absence of social security programs in the urban areas. The government’s emphasis on rural poverty is well placed given the continued concentration of the poor in rural areas. Yet, in view of continued strong outmigration from rural areas into urban areas, there is a need to focus greater attention to urban poverty. The importance of job creation in manufacturing and construction is particularly important for urban poverty reduction. Additionally, income transfers through better access to social protection benefits for the urban poor is very important.
Thirdly, there has been an increasing concentration of population just above the upper poverty line suggesting an increase in vulnerability to shocks. The National Social Security Strategy (NSSS) defined vulnerable population as people whose consumption falls within 1.25 x UPL. The cumulative consumption distribution line for HIES 2016 shows that the percentage of vulnerable population increased from 40% in 2010 to 50% in 2016. This is a big and worrisome increase. This happened because consumption growth became much more unequal in 2016 (World Bank 2019). From 2005 to 2010 consumption growth was highest among poorer household. This reversed in 2016, when poorer households saw slower increase in the consumption growth compared with the richer household.
24.5
12.9
23.6
11.5
0
5
10
15
20
25
30
Moderate Extreme
Actual Simulated
Source: Author estimates
A second worrisome development is the stagnation in urban poverty in 2016. After falling dramatically during 2000-2010, urban poverty progress stagnated in 2016 and even showing a slight increase in the case of extreme poverty. This is possibly partly explained by the explicit inclusion of the slum population in the 2016-17 HIES. This may also reflect the relative absence of social security programs in the urban areas. The government’s emphasis on rural poverty is well placed given the continued concentration of the poor in rural areas. Yet, in view of continued strong outmigration from rural areas into urban areas, there is a need to focus greater attention to urban poverty. The importance of job creation in manufacturing and construction is particularly important for urban poverty reduction. Additionally, income transfers through better access to social protection benefits for the urban poor is very important.
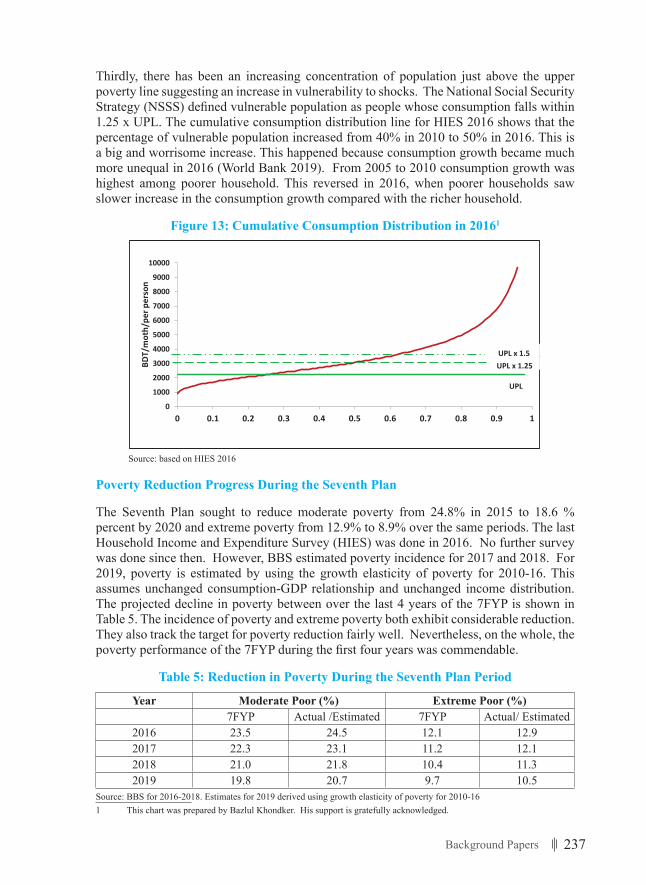
237Background Papers
Thirdly, there has been an increasing concentration of population just above the upper poverty line suggesting an increase in vulnerability to shocks. The National Social Security Strategy (NSSS) defined vulnerable population as people whose consumption falls within 1.25 x UPL. The cumulative consumption distribution line for HIES 2016 shows that the percentage of vulnerable population increased from 40% in 2010 to 50% in 2016. This is a big and worrisome increase. This happened because consumption growth became much more unequal in 2016 (World Bank 2019). From 2005 to 2010 consumption growth was highest among poorer household. This reversed in 2016, when poorer households saw slower increase in the consumption growth compared with the richer household.
Figure 13: Cumulative Consumption Distribution in 20161
12
Figure 13: Cumulative Consumption Distribution in 20161
Source: based on HIES 2016
Poverty Reduction Progress During the Seventh Plan
The Seventh Plan sought to reduce moderate poverty from 24.8% in 2015 to 18.6 % percent by 2020 and extreme poverty from 12.9% to 8.9% over the same periods. The last Household Income and Expenditure Survey (HIES) was done in 2016. No further survey was done since then. However, BBS estimated poverty incidence for 2017 and 2018. For 2019, poverty is estimated by using the growth elasticity of poverty for 2010-16. This assumes unchanged consumption-GDP relationship and unchanged income distribution. The projected decline in poverty between over the last 4 years of the 7FYP is shown in Table 5. The incidence of poverty and extreme poverty both exhibit considerable reduction. They also track the target for poverty reduction fairly well. Nevertheless, on the whole, the poverty performance of the 7FYP during the first four years was commendable.
Table 5: Reduction in Poverty During the Seventh Plan Period
Year Moderate Poor (%) Extreme Poor (%) 7FYP Actual /Estimated 7FYP Actual/ Estimated
2016 23.5 24.5 12.1 12.9 2017 22.3 23.1 11.2 12.1 2018 21.0 21.8 10.4 11.3 2019 19.8 20.7 9.7 10.5
Source: BBS for 2016-2018. Estimates for 2019 derived using growth elasticity of poverty for 2010-16
1 This chart was prepared by Bazlul Khondker. His support is gratefully acknowledged.
0100020003000400050006000700080009000
10000
0 0.1 0.2 0.3 0.4 0.5 0.6 0.7 0.8 0.9 1
BDT/
mot
h/pe
r per
son
UPL x 1.25
UPL
UPL x 1.5
Source: based on HIES 2016
Poverty Reduction Progress During the Seventh Plan
The Seventh Plan sought to reduce moderate poverty from 24.8% in 2015 to 18.6 % percent by 2020 and extreme poverty from 12.9% to 8.9% over the same periods. The last Household Income and Expenditure Survey (HIES) was done in 2016. No further survey was done since then. However, BBS estimated poverty incidence for 2017 and 2018. For 2019, poverty is estimated by using the growth elasticity of poverty for 2010-16. This assumes unchanged consumption-GDP relationship and unchanged income distribution. The projected decline in poverty between over the last 4 years of the 7FYP is shown in Table 5. The incidence of poverty and extreme poverty both exhibit considerable reduction. They also track the target for poverty reduction fairly well. Nevertheless, on the whole, the poverty performance of the 7FYP during the first four years was commendable.
Table 5: Reduction in Poverty During the Seventh Plan Period
Year Moderate Poor (%) Extreme Poor (%)7FYP Actual /Estimated 7FYP Actual/ Estimated
2016 23.5 24.5 12.1 12.92017 22.3 23.1 11.2 12.12018 21.0 21.8 10.4 11.32019 19.8 20.7 9.7 10.5
Source: BBS for 2016-2018. Estimates for 2019 derived using growth elasticity of poverty for 2010-161 This chart was prepared by Bazlul Khondker. His support is gratefully acknowledged.
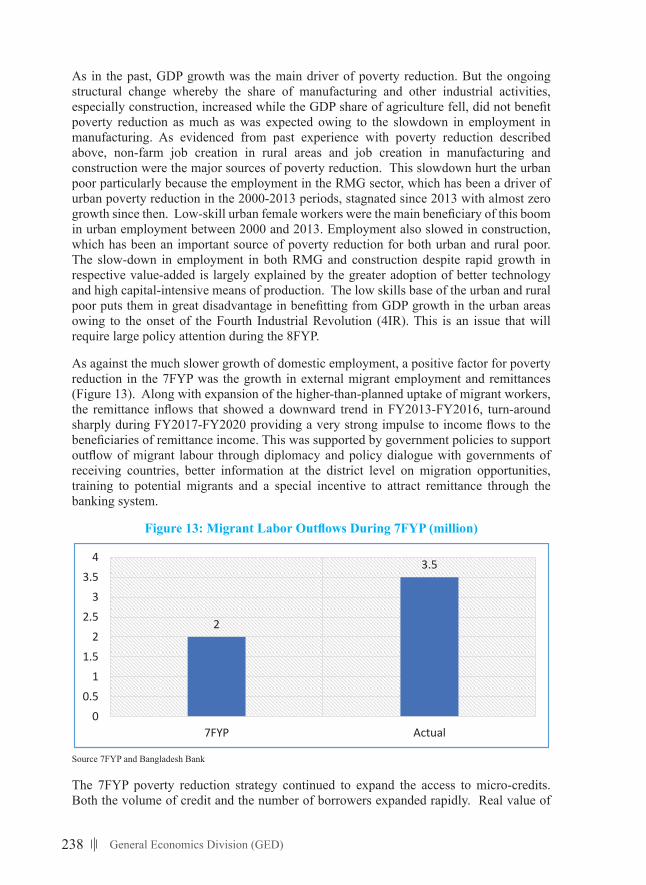
238 General Economics Division (GED)
As in the past, GDP growth was the main driver of poverty reduction. But the ongoing structural change whereby the share of manufacturing and other industrial activities, especially construction, increased while the GDP share of agriculture fell, did not benefit poverty reduction as much as was expected owing to the slowdown in employment in manufacturing. As evidenced from past experience with poverty reduction described above, non-farm job creation in rural areas and job creation in manufacturing and construction were the major sources of poverty reduction. This slowdown hurt the urban poor particularly because the employment in the RMG sector, which has been a driver of urban poverty reduction in the 2000-2013 periods, stagnated since 2013 with almost zero growth since then. Low-skill urban female workers were the main beneficiary of this boom in urban employment between 2000 and 2013. Employment also slowed in construction, which has been an important source of poverty reduction for both urban and rural poor. The slow-down in employment in both RMG and construction despite rapid growth in respective value-added is largely explained by the greater adoption of better technology and high capital-intensive means of production. The low skills base of the urban and rural poor puts them in great disadvantage in benefitting from GDP growth in the urban areas owing to the onset of the Fourth Industrial Revolution (4IR). This is an issue that will require large policy attention during the 8FYP.
As against the much slower growth of domestic employment, a positive factor for poverty reduction in the 7FYP was the growth in external migrant employment and remittances (Figure 13). Along with expansion of the higher-than-planned uptake of migrant workers, the remittance inflows that showed a downward trend in FY2013-FY2016, turn-around sharply during FY2017-FY2020 providing a very strong impulse to income flows to the beneficiaries of remittance income. This was supported by government policies to support outflow of migrant labour through diplomacy and policy dialogue with governments of receiving countries, better information at the district level on migration opportunities, training to potential migrants and a special incentive to attract remittance through the banking system.
Figure13:MigrantLaborOutflowsDuring7FYP(million)
13
As in the past, GDP growth was the main driver of poverty reduction. But the ongoing structural change whereby the share of manufacturing and other industrial activities, especially construction, increased while the GDP share of agriculture fell, did not benefit poverty reduction as much as was expected owing to the slowdown in employment in manufacturing. As evidenced from past experience with poverty reduction described above, non-farm job creation in rural areas and job creation in manufacturing and construction were the major sources of poverty reduction. This slowdown hurt the urban poor particularly because the employment in the RMG sector, which has been a driver of urban poverty reduction in the 2000-2013 periods, stagnated since 2013 with almost zero growth since then. Low-skill urban female workers were the main beneficiary of this boom in urban employment between 2000 and 2013. Employment also slowed in construction, which has been an important source of poverty reduction for both urban and rural poor. The slow-down in employment in both RMG and construction despite rapid growth in respective value-added is largely explained by the greater adoption of better technology and high capital-intensive means of production. The low skills base of the urban and rural poor puts them in great disadvantage in benefitting from GDP growth in the urban areas owing to the onset of the Fourth Industrial Revolution (4IR). This is an issue that will require large policy attention during the 8FYP.
As against the much slower growth of domestic employment, a positive factor for poverty reduction in the 7FYP was the growth in external migrant employment and remittances (Figure 13). Along with expansion of the higher-than-planned uptake of migrant workers, the remittance inflows that showed a downward trend in FY2013-FY2016, turn-around sharply during FY2017-FY2020 providing a very strong impulse to income flows to the beneficiaries of remittance income. This was supported by government policies to support outflow of migrant labour through diplomacy and policy dialogue with governments of receiving countries, better information at the district level on migration opportunities, training to potential migrants and a special incentive to attract remittance through the banking system.
Figure 13: Migrant Labor Outflows During 7FYP (million)
Source 7FYP and Bangladesh Bank
2
3.5
00.5
11.5
22.5
33.5
4
7FYP Actual
Source 7FYP and Bangladesh Bank
The 7FYP poverty reduction strategy continued to expand the access to micro-credits. Both the volume of credit and the number of borrowers expanded rapidly. Real value of
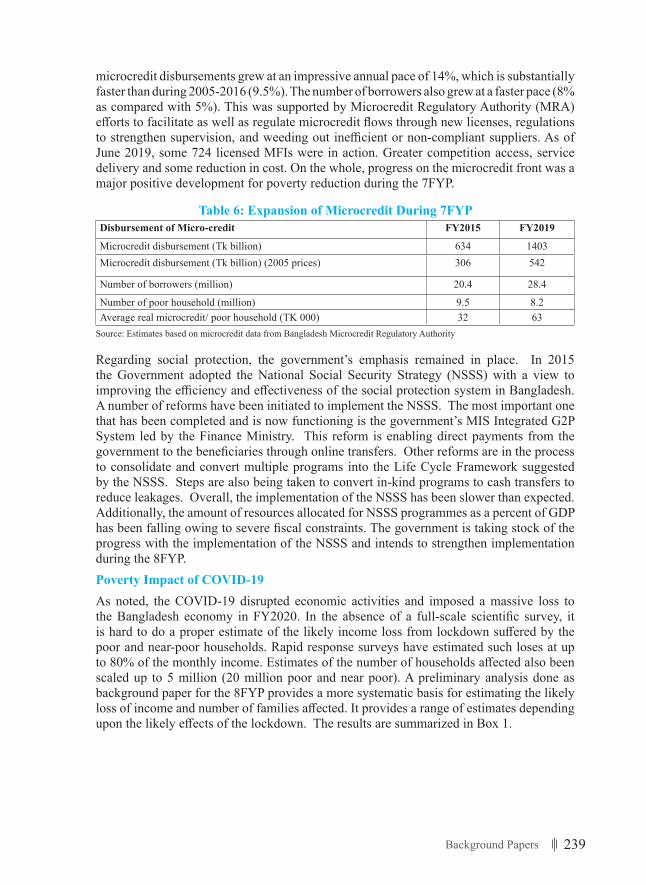
239Background Papers
microcredit disbursements grew at an impressive annual pace of 14%, which is substantially faster than during 2005-2016 (9.5%). The number of borrowers also grew at a faster pace (8% as compared with 5%). This was supported by Microcredit Regulatory Authority (MRA) efforts to facilitate as well as regulate microcredit flows through new licenses, regulations to strengthen supervision, and weeding out inefficient or non-compliant suppliers. As of June 2019, some 724 licensed MFIs were in action. Greater competition access, service delivery and some reduction in cost. On the whole, progress on the microcredit front was a major positive development for poverty reduction during the 7FYP.
Table 6: Expansion of Microcredit During 7FYPDisbursement of Micro-credit FY2015 FY2019
Microcredit disbursement (Tk billion) 634 1403Microcredit disbursement (Tk billion) (2005 prices) 306 542
Number of borrowers (million) 20.4 28.4
Number of poor household (million) 9.5 8.2Average real microcredit/ poor household (TK 000) 32 63
Source: Estimates based on microcredit data from Bangladesh Microcredit Regulatory Authority
Regarding social protection, the government’s emphasis remained in place. In 2015 the Government adopted the National Social Security Strategy (NSSS) with a view to improving the efficiency and effectiveness of the social protection system in Bangladesh. A number of reforms have been initiated to implement the NSSS. The most important one that has been completed and is now functioning is the government’s MIS Integrated G2P System led by the Finance Ministry. This reform is enabling direct payments from the government to the beneficiaries through online transfers. Other reforms are in the process to consolidate and convert multiple programs into the Life Cycle Framework suggested by the NSSS. Steps are also being taken to convert in-kind programs to cash transfers to reduce leakages. Overall, the implementation of the NSSS has been slower than expected. Additionally, the amount of resources allocated for NSSS programmes as a percent of GDP has been falling owing to severe fiscal constraints. The government is taking stock of the progress with the implementation of the NSSS and intends to strengthen implementation during the 8FYP.Poverty Impact of COVID-19As noted, the COVID-19 disrupted economic activities and imposed a massive loss to the Bangladesh economy in FY2020. In the absence of a full-scale scientific survey, it is hard to do a proper estimate of the likely income loss from lockdown suffered by the poor and near-poor households. Rapid response surveys have estimated such loses at up to 80% of the monthly income. Estimates of the number of households affected also been scaled up to 5 million (20 million poor and near poor). A preliminary analysis done as background paper for the 8FYP provides a more systematic basis for estimating the likely loss of income and number of families affected. It provides a range of estimates depending upon the likely effects of the lockdown. The results are summarized in Box 1.
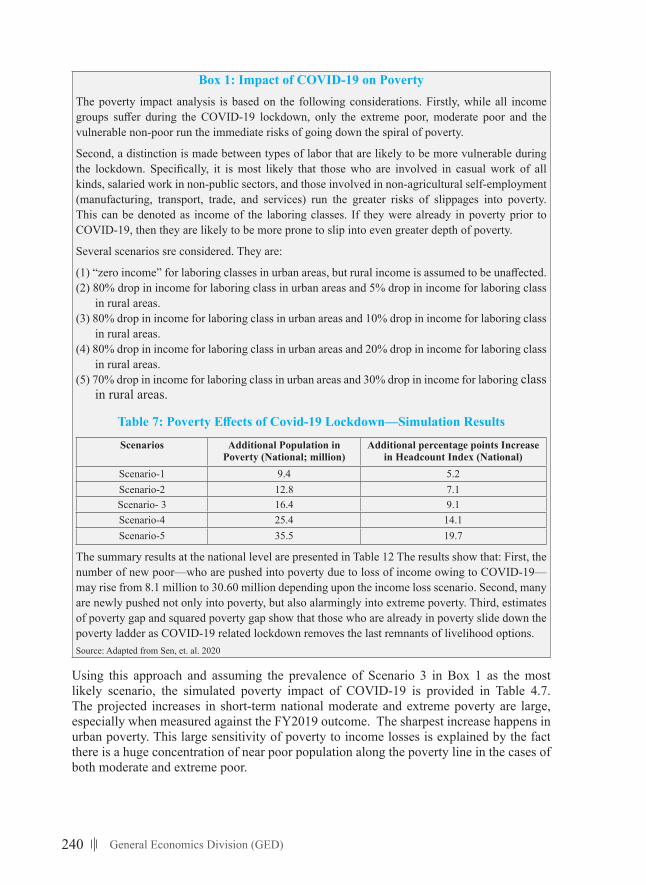
240 General Economics Division (GED)
Box 1: Impact of COVID-19 on PovertyThe poverty impact analysis is based on the following considerations. Firstly, while all income groups suffer during the COVID-19 lockdown, only the extreme poor, moderate poor and the vulnerable non-poor run the immediate risks of going down the spiral of poverty.
Second, a distinction is made between types of labor that are likely to be more vulnerable during the lockdown. Specifically, it is most likely that those who are involved in casual work of all kinds, salaried work in non-public sectors, and those involved in non-agricultural self-employment (manufacturing, transport, trade, and services) run the greater risks of slippages into poverty. This can be denoted as income of the laboring classes. If they were already in poverty prior to COVID-19, then they are likely to be more prone to slip into even greater depth of poverty.
Several scenarios sre considered. They are:
(1) “zero income” for laboring classes in urban areas, but rural income is assumed to be unaffected.(2) 80% drop in income for laboring class in urban areas and 5% drop in income for laboring class
in rural areas.(3) 80% drop in income for laboring class in urban areas and 10% drop in income for laboring class
in rural areas.(4) 80% drop in income for laboring class in urban areas and 20% drop in income for laboring class
in rural areas.(5) 70% drop in income for laboring class in urban areas and 30% drop in income for laboring class
in rural areas.
Table7:PovertyEffectsofCovid-19Lockdown—SimulationResults
Scenarios Additional Population in Poverty (National; million)
Additional percentage points Increase in Headcount Index (National)
Scenario-1 9.4 5.2Scenario-2 12.8 7.1Scenario- 3 16.4 9.1Scenario-4 25.4 14.1Scenario-5 35.5 19.7
The summary results at the national level are presented in Table 12 The results show that: First, the number of new poor—who are pushed into poverty due to loss of income owing to COVID-19—may rise from 8.1 million to 30.60 million depending upon the income loss scenario. Second, many are newly pushed not only into poverty, but also alarmingly into extreme poverty. Third, estimates of poverty gap and squared poverty gap show that those who are already in poverty slide down the poverty ladder as COVID-19 related lockdown removes the last remnants of livelihood options.Source: Adapted from Sen, et. al. 2020
Using this approach and assuming the prevalence of Scenario 3 in Box 1 as the most likely scenario, the simulated poverty impact of COVID-19 is provided in Table 4.7. The projected increases in short-term national moderate and extreme poverty are large, especially when measured against the FY2019 outcome. The sharpest increase happens in urban poverty. This large sensitivity of poverty to income losses is explained by the fact there is a huge concentration of near poor population along the poverty line in the cases of both moderate and extreme poor.
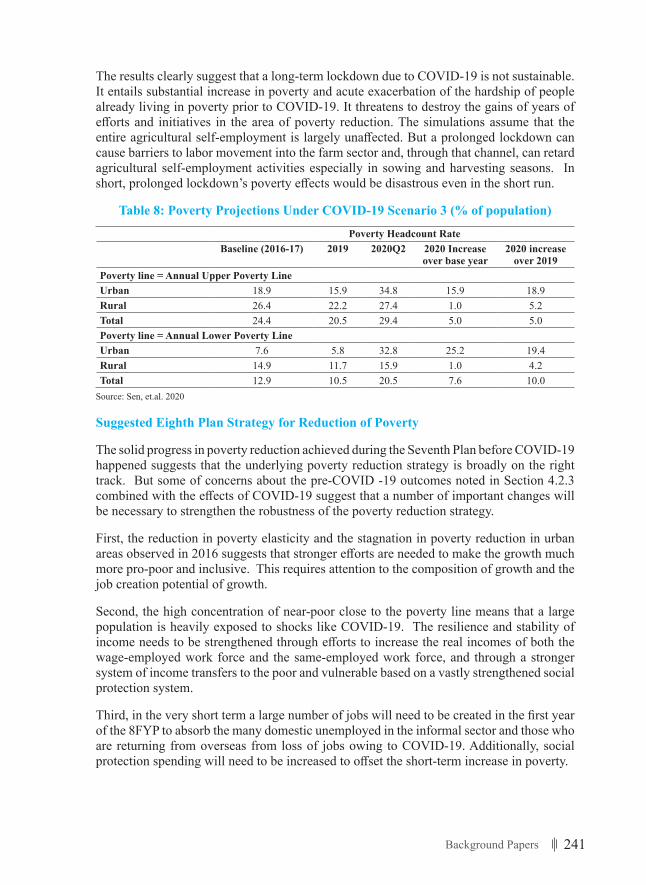
241Background Papers
The results clearly suggest that a long-term lockdown due to COVID-19 is not sustainable. It entails substantial increase in poverty and acute exacerbation of the hardship of people already living in poverty prior to COVID-19. It threatens to destroy the gains of years of efforts and initiatives in the area of poverty reduction. The simulations assume that the entire agricultural self-employment is largely unaffected. But a prolonged lockdown can cause barriers to labor movement into the farm sector and, through that channel, can retard agricultural self-employment activities especially in sowing and harvesting seasons. In short, prolonged lockdown’s poverty effects would be disastrous even in the short run.
Table 8: Poverty Projections Under COVID-19 Scenario 3 (% of population)
Poverty Headcount Rate Baseline (2016-17) 2019 2020Q2 2020 Increase
over base year2020 increase
over 2019Poverty line = Annual Upper Poverty LineUrban 18.9 15.9 34.8 15.9 18.9Rural 26.4 22.2 27.4 1.0 5.2Total 24.4 20.5 29.4 5.0 5.0Poverty line = Annual Lower Poverty LineUrban 7.6 5.8 32.8 25.2 19.4Rural 14.9 11.7 15.9 1.0 4.2Total 12.9 10.5 20.5 7.6 10.0
Source: Sen, et.al. 2020
Suggested Eighth Plan Strategy for Reduction of Poverty
The solid progress in poverty reduction achieved during the Seventh Plan before COVID-19 happened suggests that the underlying poverty reduction strategy is broadly on the right track. But some of concerns about the pre-COVID -19 outcomes noted in Section 4.2.3 combined with the effects of COVID-19 suggest that a number of important changes will be necessary to strengthen the robustness of the poverty reduction strategy.
First, the reduction in poverty elasticity and the stagnation in poverty reduction in urban areas observed in 2016 suggests that stronger efforts are needed to make the growth much more pro-poor and inclusive. This requires attention to the composition of growth and the job creation potential of growth.
Second, the high concentration of near-poor close to the poverty line means that a large population is heavily exposed to shocks like COVID-19. The resilience and stability of income needs to be strengthened through efforts to increase the real incomes of both the wage-employed work force and the same-employed work force, and through a stronger system of income transfers to the poor and vulnerable based on a vastly strengthened social protection system.
Third, in the very short term a large number of jobs will need to be created in the first year of the 8FYP to absorb the many domestic unemployed in the informal sector and those who are returning from overseas from loss of jobs owing to COVID-19. Additionally, social protection spending will need to be increased to offset the short-term increase in poverty.
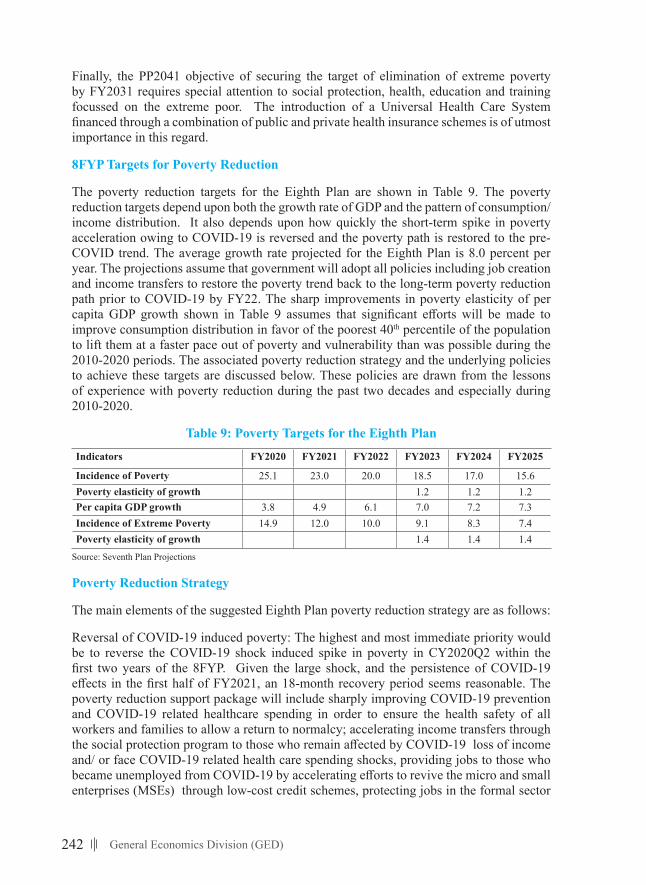
242 General Economics Division (GED)
Finally, the PP2041 objective of securing the target of elimination of extreme poverty by FY2031 requires special attention to social protection, health, education and training focussed on the extreme poor. The introduction of a Universal Health Care System financed through a combination of public and private health insurance schemes is of utmost importance in this regard.
8FYP Targets for Poverty Reduction
The poverty reduction targets for the Eighth Plan are shown in Table 9. The poverty reduction targets depend upon both the growth rate of GDP and the pattern of consumption/income distribution. It also depends upon how quickly the short-term spike in poverty acceleration owing to COVID-19 is reversed and the poverty path is restored to the pre-COVID trend. The average growth rate projected for the Eighth Plan is 8.0 percent per year. The projections assume that government will adopt all policies including job creation and income transfers to restore the poverty trend back to the long-term poverty reduction path prior to COVID-19 by FY22. The sharp improvements in poverty elasticity of per capita GDP growth shown in Table 9 assumes that significant efforts will be made to improve consumption distribution in favor of the poorest 40th percentile of the population to lift them at a faster pace out of poverty and vulnerability than was possible during the 2010-2020 periods. The associated poverty reduction strategy and the underlying policies to achieve these targets are discussed below. These policies are drawn from the lessons of experience with poverty reduction during the past two decades and especially during 2010-2020.
Table 9: Poverty Targets for the Eighth Plan
Indicators FY2020 FY2021 FY2022 FY2023 FY2024 FY2025
Incidence of Poverty 25.1 23.0 20.0 18.5 17.0 15.6Poverty elasticity of growth 1.2 1.2 1.2Per capita GDP growth 3.8 4.9 6.1 7.0 7.2 7.3Incidence of Extreme Poverty 14.9 12.0 10.0 9.1 8.3 7.4Poverty elasticity of growth 1.4 1.4 1.4
Source: Seventh Plan Projections
Poverty Reduction Strategy
The main elements of the suggested Eighth Plan poverty reduction strategy are as follows:
Reversal of COVID-19 induced poverty: The highest and most immediate priority would be to reverse the COVID-19 shock induced spike in poverty in CY2020Q2 within the first two years of the 8FYP. Given the large shock, and the persistence of COVID-19 effects in the first half of FY2021, an 18-month recovery period seems reasonable. The poverty reduction support package will include sharply improving COVID-19 prevention and COVID-19 related healthcare spending in order to ensure the health safety of all workers and families to allow a return to normalcy; accelerating income transfers through the social protection program to those who remain affected by COVID-19 loss of income and/ or face COVID-19 related health care spending shocks, providing jobs to those who became unemployed from COVID-19 by accelerating efforts to revive the micro and small enterprises (MSEs) through low-cost credit schemes, protecting jobs in the formal sector

243Background Papers
through the speedy implementation of the various stimulus packages announced by the government; supporting agriculture production and diversification through a range of policies including access to inputs including mechanized inputs, farm credit, marketing support, price support through public procurement, and implementing rural works program as needed.
Job creation through growth and structural change. The analysis of poverty progress over 2000-2016 provided strong supportive evidence that the fundamental determinant of poverty reduction over the longer term is the acceleration of GDP growth that is combined with efforts to create jobs in manufacturing, construction and services. Growth projections for the 8FYP reviewed in Chapter 2 shows that the recovery of GDP growth will be swift based on short-term stimulus-based policy responses and the implementation of the government’s long-term growth strategy of PP2041. Thus, GDP growth is projected to recover to the long-term PP2041 postulated GDP growth path of 8 percent plus, reaching 8.5% by FY2025. The GDP share of agriculture will continue to fall, while the GDP shares of industry, especially manufacturing, and services will grow. Manufacturing sector in particular is projected to grow in double digits, thereby increasing its GDP share from 25% in FY2020 to 31% in FY2025. This changing composition of production is conducive to poverty reduction through better job creation in manufacturing. However, the recent observed slow-down in employment in manufacturing in both urban and rural areas will have to be reversed during the 8FYP.
Even as the GDP and employment shares of agriculture falls, agriculture will remain important for food security and for income of self-employed farmers, many of whom are poor. However, the creation of nonfarm jobs in rural areas will be the main source of poverty reduction for rural wage workers since agriculture will continue to shed labor. Within agriculture, productivity improvements to raise yields, reduce vulnerability to climate change, and greater diversification to non-crop agriculture, fishing, livestock and dairy products will play important role in increasing income for the self-employed farmers and workers that remain in farming. Therefore, the 8FYP will undertake investments in research and extension to increase crop productivity, especially rice, to support climate resistant seed and production technology, invest in water resources to support farm production in drought-prone areas of the Barind region in the North-western Districts of Bangladesh and the CHT, ensure flood control and water-logging prevention investments, and take steps to prevent river-bank erosions and salinity inroads. These actions are all discussed in detail in the Bangladesh Delta Plan 2100 (BDP2100) and further elaborated in Chapter 5 of Part 2 dealing with agriculture and water issues. Implementation of the BDP2100 is critical for lowering the vulnerability of the poorest districts of Bangladesh noted in Section 4.4 below.
The most fundamental challenge for job creation in the 8FYP that will have a telling effect on both rural and urban poverty, but especially for urban poverty, is the pace and pattern of the manufacturing sector growth. The observed slow-down of job creation in manufacturing and the sharp fall in the short-term employment elasticity in manufacturing during 2013-2016-17 will be addressed comprehensively during the 8FYP in order to secure the poverty reduction targets. The main elements of the policy framework to spur the growth of manufacturing value-added and employment is to promote the diversification of labor-intensive export-oriented manufacturing beyond RMG. Drawing on the lessons from the RMG success, policy support for other labor intensive manufacturing exports
244 General Economics Division (GED)
include a competitive real exchange rate, reduction in trade protection to remove the anti-export bias of trade policy, improve infrastructure services, reduce the cost of trade logistics through deregulation, automation and transport links between the ports and the factory-gate. Details of the manufacturing and trade policy reforms that will be pursued during the 8FYP are provided in Chapter 2 of Part 2 of the Plan document.
Outside agriculture, the micro and small enterprises (MSEs) are the largest source of employment in a wide variety of urban and rural enterprises in manufacturing and services. Employment in MSEs are a mixed bag of self-employed, wage employed, and family labor. These enterprises are mostly informal in nature, have low capital intensity, use low-level technology and involve small scale production. The manufacturing MSEs have little or no linkage to formal medium and large-scale manufacturing. Progress was made in sub-contracting arrangement with the formal RMG sector but over the years automation and consolidation in the formal RMG have weakened this linkage. Lack of dynamism in the MSEs is a major constraint to job creation that has been further hit hard by COVID-19. A major strategic shift in the 8FYP employment strategy is to boost the MSE sector through better access to bank financing and through a one-stop support for technology, training, marketing and regulatory improvements based on converting the SME Foundation into an institution like the Small Business Association (SBA) of the USA (Ahmed, Alam and Khondker 2018).
The services sector has historically provided a strong value-added added and employment cushion as the production structure changed over the years. Initially, the workers migrating from agriculture were mostly absorbed in a range of informal rural and urban services. Over the years, the emergence of RMG and construction as major economic activities slowed this influx in low-productivity and low-income informal services. Within services, there is a visible transformation with the growth of a variety of modern services in transport, trade, finance, housing, tourism, education and health (Ahmed, 2017). Much of this transformation has happened in the urban areas but with improved transport connectivity, electricity and the spread of internet, the services activities are also getting modernized in services. The 8FYP should accelerate this transformation of the services sector through support for access to credit, through strengthening of ICT, and promotion of ICT exports and skills upgrading through training.
Among all services, the ICT holds strong prospects for facilitating economic growth, employment human development and poverty reduction, especially in this COVID-19 infected environment. The employment prospects for the educated youth is particularly bright (Ahmed and Sattar 2020). The poverty links are similarly strong through facilitating a range of services including mobile financial services that have now become critical for income transfers to the poor as well as to provide credit to the poor, market information, healthcare, government services and e-commerce. While Prime Minister Sheikh Hasina has put strong priority to the development of ICT through the Digital Bangladesh Initiative (DBI), the strategy is being undermined by high taxation of the ICT sector (Ahmed, 2017). This policy inconsistency must be addressed swiftly to enable ICT to play the dynamic role it can and should.
Implementation of the Bangladesh Delta Plan 2100 (BDP2100): It is well-known the poverty and vulnerability to natural hazards and climate change is inter-linked. So, sustainable reduction in poverty that is related to natural hazards and climate change will
245Background Papers
require addressing these vulnerabilities at source. The BDP2100 was prepared with this as one core objective, in addition to others. The adoption of BDP2100 in November 2018 is a major milestone in strategy making in Bangladesh that explicitly addresses the natural hazard and climate change risks to development prospects for Bangladesh. The 8FYP is the first phase of implementing the BDP2100.
Promote job creation and income earnings from external migration: The potential strong positive role of external migration in reducing poverty will be better harnessed in the 8FYP, learning from the experiences of the 6th and 7th Plans. The adverse effects of COVID-19 on overseas employment is expected to be temporary and global recovery is expected by the end of FY2021. The external migration strategy for poverty reduction during the 8FYP consists of a number of inter-related policy actions: (i) support outmigration from the poorest districts of the Northwest part of Bangladesh that are not well served by access to external migration through better information flow and training; (ii) find ways to reduce cost of out-migration through partnerships with job agencies that provide low-cost services; (iii) provide access to one-time credit to defray cost of migration secured against future earnings based on a government program administered by commercial banks; (iv) provide information and anti-exploitation services through the embassies; (v) ensure that the exchange rate for remittance through the banking system is competitive with the curb market rates; and (v) offer solid banking services to the migrant workers to enable use of formal banking channels for sending remittances.
Continued growth of microcredit services: As noted earlier, progress with microcredit services has been a major policy success in reducing poverty and supporting rural transformation. This progress will be strengthened in the 8FYP. Research will be done to find ways that the cost of microcredit can be brought down, especially through the use of digital technology that could help reduce the transaction cost of borrowing, supervision and repayments. Effort will also be made to bring some of the microcredit borrowers into the fold of the normal banking channel.
Towards a Universal Health Care System for Bangladesh: The onslaught of the COVID-19 Epidemic graphically brought home the importance of instituting a universal health care system (UHC) as a major policy intervention for reducing poverty, especially extreme poverty, the extreme poor are particularly prone to shocks, particularly heath shocks. Time has come for Bangladesh to start on a pilot basis some type of a health insurance scheme. The Government has already developed a long-term strategy for health financing that includes health insurance. The implementation of this health financing strategy will be a major priority during the Eighth Plan.
Strengthening the implementation of NSSS: A well thought out social protection strategy is extremely important for supporting poverty reduction based on the above strategies and policies. While Bangladesh has a strong commitment and rich experience with implementing a wide range of social safety nets, there are many concerns with the effectiveness and poverty focus of the safety net system. The experience of COVID-19 also exposed some of the inherent limitations of the present social protection system. For the 8FYP, two major initiatives will be taken. First, the implementation of the NSSS will be fact-tracked. All efforts will be made to consolidate the multiple schemes into the core Life-Cycle risk-based programs suggested in the NSSS, move away from in-kind to cash based transfers on-line transfers, establish a national list of beneficiaries based on eligibility criteria identified in
246 General Economics Division (GED)
the NSSS, and establish an on-line Grievance Redressal System. Second, the financing of a reformed social protection system will be given high priority. This is built in the Fiscal Policy Framework of the 8FYP described in chapter 5 that allows for the increase in social protection spending (excluding civil service pensions that are not poverty-targeted) as a share of GDP from 1.2% in FY2019 to 2.0% by FY2025.
Additional Measures to Address Extreme Poverty
Replication of the Micro Program Successes in Eradicating Extreme Poverty: Micro program successes have been many and they are marked by diversity in approaches. There have been quite a few targeted livelihood programmes (e.g., EEP, CLP, TUP, etc.) that have been quite effective in combating more difficult case of extreme poverty. A defining marker of many of these programmes is that they are aimed to provide consequential transfer of resources (assets or financial) to the extreme poor clients. These interventions help develop/support asset management, savings habit, organizational, financial and marketing skills, which are “non-tradable” and cannot be overnight developed by transfer of money alone. The aim should now be to replicate on a wider scale - and suitably modified where applicable - these programmes to cover most extreme poor groups in the country so as to reduce extreme poverty significantly in the 8FYP.
Taking Actions for Preventing and Mitigating Shocks: The onslaught of COVID-19 is a stark reminder of how shocks play a decisive role in shaping the pace of extreme poverty reduction. Most of the poor and near-poor population have limited assets and other forms of saving instruments to cope with shocks. A devastating and prolonged shock like COVID-19 can easily derail poverty progress. So, efforts need to be made to build up asset generation for the poor as well as preventing asset erosion. As evidenced by COVID-19, shocks make poor people poorer, and turn the extreme poor into destitute. Although COVID-19 is in the form of an unprecedented once-in-a-lifetime global shock, more regular socks through natural disasters and healthcare shocks are a regular phenomenon in Bangladesh. Indeed, had there been no slippages into poverty due to preventable shocks, Bangladesh would have experienced much faster decline in poverty and extreme poverty. So, shock prevention and risk reduction for the poor and the poorest in particular will, therefore, be given top policy priority in the Eighth Plan. As noted, two important risk mitigation strategies that will be adopted in the 8FYP to minimize the effects of anticipated shocks include the reduction in climate change and natural disaster related shocks by the implementation of the Bangladesh Delta Plan BDP2100 and the introduction of Universal Health Care.
Improving the Regional Balance in Development
The evidence from successive HIES surveys shows that the distribution of poverty is highly uneven by zillas and upazillas. There are some perennially poor zillas and upazillas that continue to suffer from poverty and deprivation over a long period of time. Addressing the poverty challenges in these backward regions will help secure the extreme poverty eradication challenge much more fruitfully than most other interventions. This is a major task for the 8FYP. The details are discussed in the following section.
Progress with Reducing Regional DisparitiesBangladesh puts strong emphasis on establishing a just and equitable society where there are opportunities for all irrespective of race, religion, culture gender or location. This is
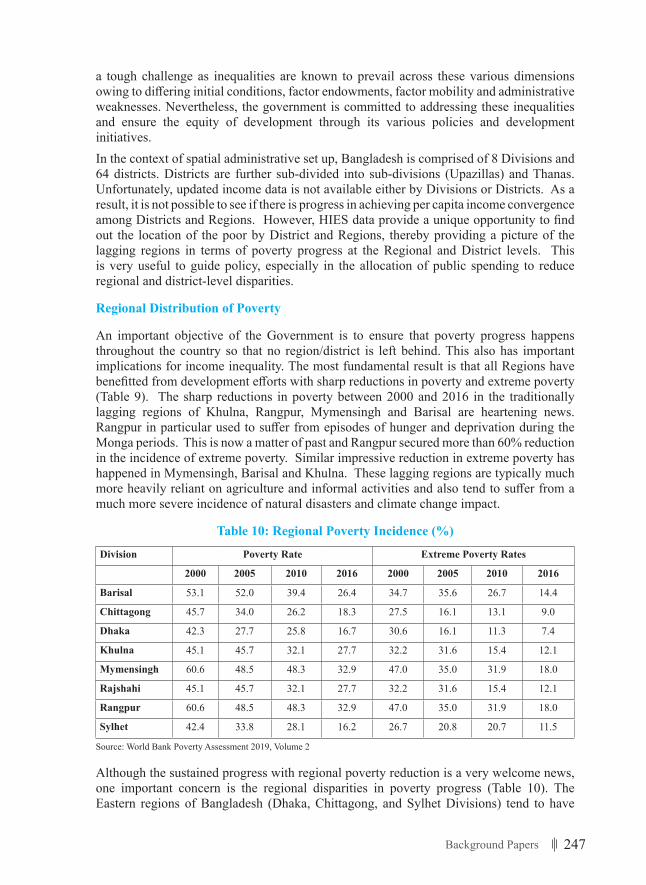
247Background Papers
a tough challenge as inequalities are known to prevail across these various dimensions owing to differing initial conditions, factor endowments, factor mobility and administrative weaknesses. Nevertheless, the government is committed to addressing these inequalities and ensure the equity of development through its various policies and development initiatives.In the context of spatial administrative set up, Bangladesh is comprised of 8 Divisions and 64 districts. Districts are further sub-divided into sub-divisions (Upazillas) and Thanas. Unfortunately, updated income data is not available either by Divisions or Districts. As a result, it is not possible to see if there is progress in achieving per capita income convergence among Districts and Regions. However, HIES data provide a unique opportunity to find out the location of the poor by District and Regions, thereby providing a picture of the lagging regions in terms of poverty progress at the Regional and District levels. This is very useful to guide policy, especially in the allocation of public spending to reduce regional and district-level disparities.
Regional Distribution of Poverty
An important objective of the Government is to ensure that poverty progress happens throughout the country so that no region/district is left behind. This also has important implications for income inequality. The most fundamental result is that all Regions have benefitted from development efforts with sharp reductions in poverty and extreme poverty (Table 9). The sharp reductions in poverty between 2000 and 2016 in the traditionally lagging regions of Khulna, Rangpur, Mymensingh and Barisal are heartening news. Rangpur in particular used to suffer from episodes of hunger and deprivation during the Monga periods. This is now a matter of past and Rangpur secured more than 60% reduction in the incidence of extreme poverty. Similar impressive reduction in extreme poverty has happened in Mymensingh, Barisal and Khulna. These lagging regions are typically much more heavily reliant on agriculture and informal activities and also tend to suffer from a much more severe incidence of natural disasters and climate change impact.
Table 10: Regional Poverty Incidence (%)
Division Poverty Rate Extreme Poverty Rates
2000 2005 2010 2016 2000 2005 2010 2016
Barisal 53.1 52.0 39.4 26.4 34.7 35.6 26.7 14.4
Chittagong 45.7 34.0 26.2 18.3 27.5 16.1 13.1 9.0
Dhaka 42.3 27.7 25.8 16.7 30.6 16.1 11.3 7.4
Khulna 45.1 45.7 32.1 27.7 32.2 31.6 15.4 12.1
Mymensingh 60.6 48.5 48.3 32.9 47.0 35.0 31.9 18.0
Rajshahi 45.1 45.7 32.1 27.7 32.2 31.6 15.4 12.1
Rangpur 60.6 48.5 48.3 32.9 47.0 35.0 31.9 18.0
Sylhet 42.4 33.8 28.1 16.2 26.7 20.8 20.7 11.5
Source: World Bank Poverty Assessment 2019, Volume 2
Although the sustained progress with regional poverty reduction is a very welcome news, one important concern is the regional disparities in poverty progress (Table 10). The Eastern regions of Bangladesh (Dhaka, Chittagong, and Sylhet Divisions) tend to have
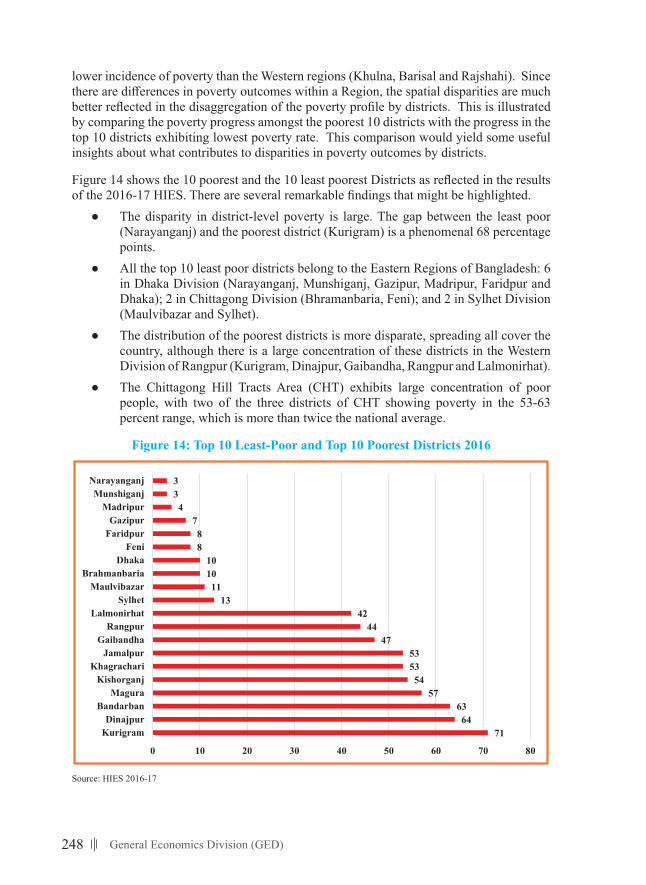
248 General Economics Division (GED)
lower incidence of poverty than the Western regions (Khulna, Barisal and Rajshahi). Since there are differences in poverty outcomes within a Region, the spatial disparities are much better reflected in the disaggregation of the poverty profile by districts. This is illustrated by comparing the poverty progress amongst the poorest 10 districts with the progress in the top 10 districts exhibiting lowest poverty rate. This comparison would yield some useful insights about what contributes to disparities in poverty outcomes by districts.
Figure 14 shows the 10 poorest and the 10 least poorest Districts as reflected in the results of the 2016-17 HIES. There are several remarkable findings that might be highlighted.
● The disparity in district-level poverty is large. The gap between the least poor (Narayanganj) and the poorest district (Kurigram) is a phenomenal 68 percentage points.
● All the top 10 least poor districts belong to the Eastern Regions of Bangladesh: 6 in Dhaka Division (Narayanganj, Munshiganj, Gazipur, Madripur, Faridpur and Dhaka); 2 in Chittagong Division (Bhramanbaria, Feni); and 2 in Sylhet Division (Maulvibazar and Sylhet).
● The distribution of the poorest districts is more disparate, spreading all cover the country, although there is a large concentration of these districts in the Western Division of Rangpur (Kurigram, Dinajpur, Gaibandha, Rangpur and Lalmonirhat).
● The Chittagong Hill Tracts Area (CHT) exhibits large concentration of poor people, with two of the three districts of CHT showing poverty in the 53-63 percent range, which is more than twice the national average.
Figure 14: Top 10 Least-Poor and Top 10 Poorest Districts 2016
24
All the top 10 least poor districts belong to the Eastern Regions of Bangladesh: 6 in Dhaka Division (Narayanganj, Munshiganj, Gazipur, Madripur, Faridpur and Dhaka); 2 in Chittagong Division (Bhramanbaria, Feni); and 2 in Sylhet Division (Maulvibazar and Sylhet).
The distribution of the poorest districts is more disparate, spreading all cover the country, although there is a large concentration of these districts in the Western Division of Rangpur (Kurigram, Dinajpur, Gaibandha, Rangpur and Lalmonirhat).
The Chittagong Hill Tracts Area (CHT) exhibits large concentration of poor people, with two of the three districts of CHT showing poverty in the 53-63 percent range, which is more than twice the national average.
Figure 14: Top 10 Least-Poor and Top 10 Poorest Districts 2016
Source: HIES 2016-17
An important policy question is why are these 10 districts so poor and substantially above the national poverty rate. This requires detailed investigation of poverty pockets at the district level. Some limited analysis done by putting together fragmented data from different sources suggest that by and large these districts have the following characteristics:
Tend to be dominated by agricultural activities with a dominance of landless labours, limited manufacturing and construction activities relative to the more prosperous districts.
7164
6357
545353
4744
4213
111010
88
74
33
0 10 20 30 40 50 60 70 80
KurigramDinajpur
BandarbanMagura
KishorganjKhagrachari
JamalpurGaibandha
RangpurLalmonirhat
SylhetMaulvibazar
BrahmanbariaDhaka
FeniFaridpurGazipur
MadripurMunshiganj
Narayanganj
Source: HIES 2016-17
249Background Papers
An important policy question is why are these 10 districts so poor and substantially above the national poverty rate. This requires detailed investigation of poverty pockets at the district level. Some limited analysis done by putting together fragmented data from different sources suggest that by and large these districts have the following characteristics:
● Tend to be dominated by agricultural activities with a dominance of landless labours, limited manufacturing and construction activities relative to the more prosperous districts. In particular, non-farm rural employment opportunities are much more limited in these districts as compared with the least poor districts.
● Suffer from more intense episodes of natural disasters and climate change, especially flooding and river bank erosions.
● Have weaker infrastructure facilities relative to the more prosperous districts. ● Have much weaker access to international migration and income transfers relative
to the more prosperous districts. ● Have weaker urban centers than in the least poor districts.
Strategy for Addressing the Poverty Problems for the Lagging Regions
The above findings provide a very important basis for policy interventions in the 8FYP to alleviate poverty in the poorest districts. The main interventions include:
● Refocusing ADP spending to improve the health, education and infrastructure needs of the lagging districts.
● Giving higher priority and greater beneficiary coverage of social protection programmes to the lagging districts.
● Prioritizing BDP2100 PIP in favor of addressing irrigation, flood control, water logging and salinity problems in the lagging districts.
● Focussing agriculture research and extension services to help farm productivity and incomes in the lagging districts.
● Supporting the growth of non-farm rural enterprises in the lagging districts through focussed support programmes including credit, technology and marketing services.
● Provide greater access to labour training to lagging districts. ● Improve access of lagging districts to international migration through better
information, training, and credit support to meet the cost of overseas employment. ● Enhance the access to ICT services through the education system and special
training programmes to the lagging districts. ● Strengthen the LGIs working in the lagging districts through a higher share of
block grants and through training. ● Strengthen partnership with NGOs and CBOs in delivering all relevant local
services including social security programmes. ● Conduct in-depth district level poverty assessments for the top 10 poorest districts to
do a more detailed and specific diagnostics of the fundamental constraints faced by these districts and tailoring public programme support to address those constraints.
● Require BBS to re-introduce district level GDP estimates to help understand the pattern of district level income paths and whether convergence is happening.
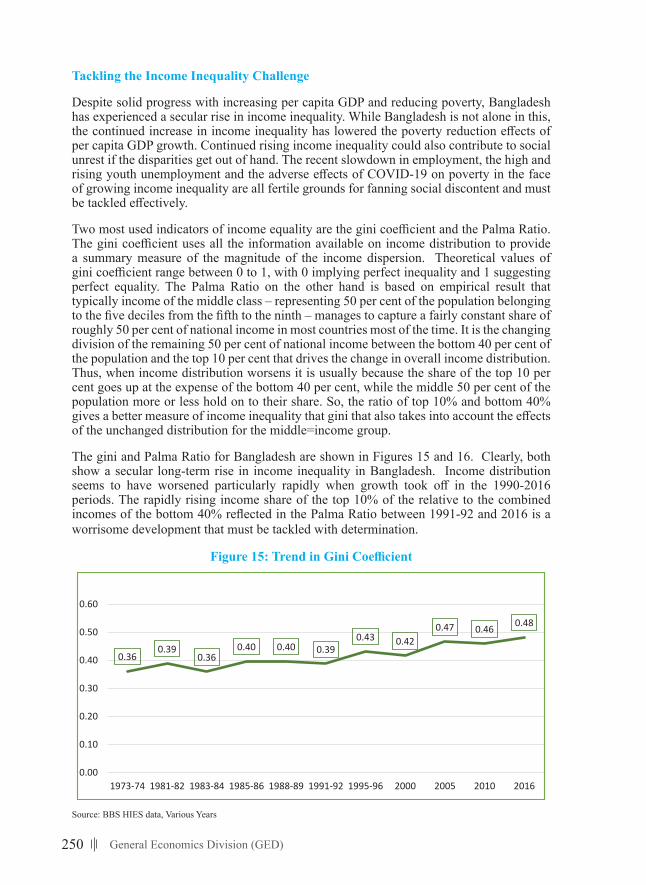
250 General Economics Division (GED)
Tackling the Income Inequality Challenge
Despite solid progress with increasing per capita GDP and reducing poverty, Bangladesh has experienced a secular rise in income inequality. While Bangladesh is not alone in this, the continued increase in income inequality has lowered the poverty reduction effects of per capita GDP growth. Continued rising income inequality could also contribute to social unrest if the disparities get out of hand. The recent slowdown in employment, the high and rising youth unemployment and the adverse effects of COVID-19 on poverty in the face of growing income inequality are all fertile grounds for fanning social discontent and must be tackled effectively.
Two most used indicators of income equality are the gini coefficient and the Palma Ratio. The gini coefficient uses all the information available on income distribution to provide a summary measure of the magnitude of the income dispersion. Theoretical values of gini coefficient range between 0 to 1, with 0 implying perfect inequality and 1 suggesting perfect equality. The Palma Ratio on the other hand is based on empirical result that typically income of the middle class – representing 50 per cent of the population belonging to the five deciles from the fifth to the ninth – manages to capture a fairly constant share of roughly 50 per cent of national income in most countries most of the time. It is the changing division of the remaining 50 per cent of national income between the bottom 40 per cent of the population and the top 10 per cent that drives the change in overall income distribution. Thus, when income distribution worsens it is usually because the share of the top 10 per cent goes up at the expense of the bottom 40 per cent, while the middle 50 per cent of the population more or less hold on to their share. So, the ratio of top 10% and bottom 40% gives a better measure of income inequality that gini that also takes into account the effects of the unchanged distribution for the middle=income group.
The gini and Palma Ratio for Bangladesh are shown in Figures 15 and 16. Clearly, both show a secular long-term rise in income inequality in Bangladesh. Income distribution seems to have worsened particularly rapidly when growth took off in the 1990-2016 periods. The rapidly rising income share of the top 10% of the relative to the combined incomes of the bottom 40% reflected in the Palma Ratio between 1991-92 and 2016 is a worrisome development that must be tackled with determination.
Figure15:TrendinGiniCoefficient
27
Figure 15: Trend in Gini Coefficient
Source: BBS HIES data, Various Years
Figure 16: Trend in the Palma Ratio
Source: BBS HIES Data, Various Years
Strategy for Better Income Distribution
(a) Strengthening Land Management
The poor usually have very little physical or financial assets. Those who are amongst the fortunate few have small land holdings in the rural areas. Land disputes and land grabbing by powerful elites often with small compensation are frequent events in Bangladesh. Land speculation is
0.360.39
0.360.40 0.40 0.39
0.43 0.420.47 0.46 0.48
0.00
0.10
0.20
0.30
0.40
0.50
0.60
1973-74 1981-82 1983-84 1985-86 1988-89 1991-92 1995-96 2000 2005 2010 2016
1.551.78
1.491.73 1.77 1.68
2.232.41
2.62 2.50
2.93
0.00
0.50
1.00
1.50
2.00
2.50
3.00
3.50
1973-74 1981-82 1983-84 1985-86 1988-89 1991-92 1995-96 2000 2005 2010 2016
Source: BBS HIES data, Various Years
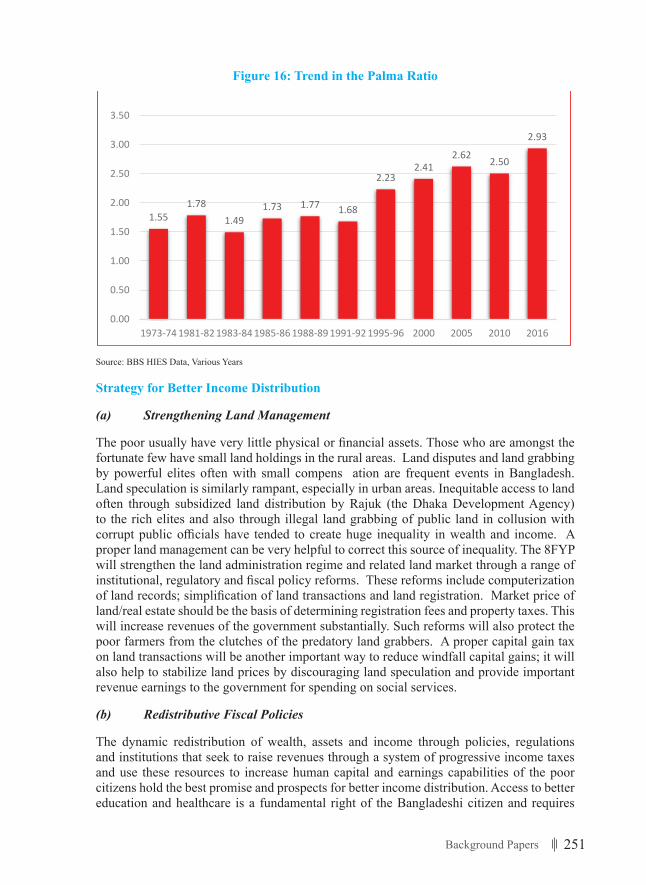
251Background Papers
Figure 16: Trend in the Palma Ratio
27
Figure 15: Trend in Gini Coefficient
Source: BBS HIES data, Various Years
Figure 16: Trend in the Palma Ratio
Source: BBS HIES Data, Various Years
Strategy for Better Income Distribution
(a) Strengthening Land Management
The poor usually have very little physical or financial assets. Those who are amongst the fortunate few have small land holdings in the rural areas. Land disputes and land grabbing by powerful elites often with small compensation are frequent events in Bangladesh. Land speculation is
0.360.39
0.360.40 0.40 0.39
0.43 0.420.47 0.46 0.48
0.00
0.10
0.20
0.30
0.40
0.50
0.60
1973-74 1981-82 1983-84 1985-86 1988-89 1991-92 1995-96 2000 2005 2010 2016
1.551.78
1.491.73 1.77 1.68
2.232.41
2.62 2.50
2.93
0.00
0.50
1.00
1.50
2.00
2.50
3.00
3.50
1973-74 1981-82 1983-84 1985-86 1988-89 1991-92 1995-96 2000 2005 2010 2016
Source: BBS HIES Data, Various Years
Strategy for Better Income Distribution
(a) Strengthening Land Management
The poor usually have very little physical or financial assets. Those who are amongst the fortunate few have small land holdings in the rural areas. Land disputes and land grabbing by powerful elites often with small compens ation are frequent events in Bangladesh. Land speculation is similarly rampant, especially in urban areas. Inequitable access to land often through subsidized land distribution by Rajuk (the Dhaka Development Agency) to the rich elites and also through illegal land grabbing of public land in collusion with corrupt public officials have tended to create huge inequality in wealth and income. A proper land management can be very helpful to correct this source of inequality. The 8FYP will strengthen the land administration regime and related land market through a range of institutional, regulatory and fiscal policy reforms. These reforms include computerization of land records; simplification of land transactions and land registration. Market price of land/real estate should be the basis of determining registration fees and property taxes. This will increase revenues of the government substantially. Such reforms will also protect the poor farmers from the clutches of the predatory land grabbers. A proper capital gain tax on land transactions will be another important way to reduce windfall capital gains; it will also help to stabilize land prices by discouraging land speculation and provide important revenue earnings to the government for spending on social services.
(b) Redistributive Fiscal Policies
The dynamic redistribution of wealth, assets and income through policies, regulations and institutions that seek to raise revenues through a system of progressive income taxes and use these resources to increase human capital and earnings capabilities of the poor citizens hold the best promise and prospects for better income distribution. Access to better education and healthcare is a fundamental right of the Bangladeshi citizen and requires
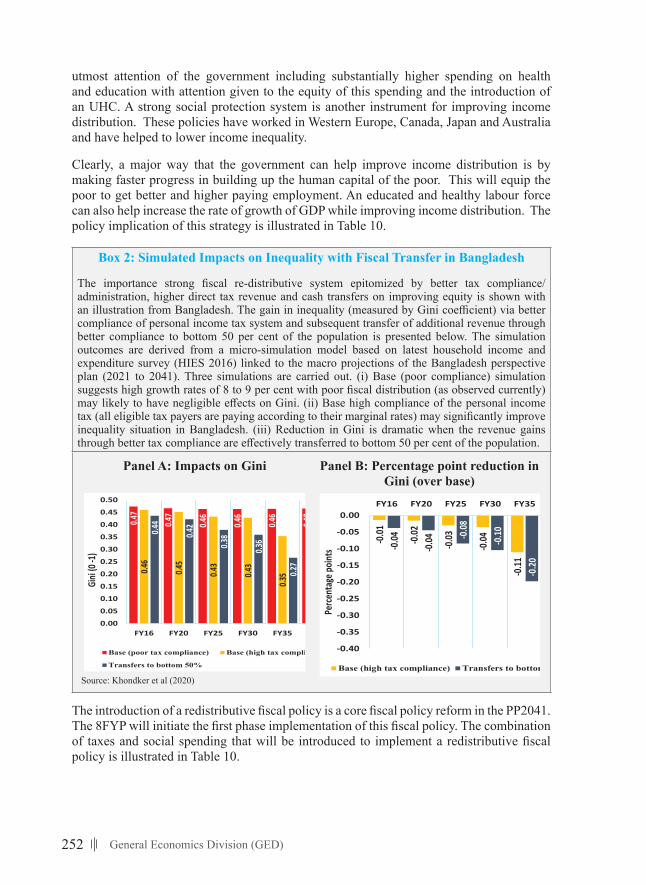
252 General Economics Division (GED)
utmost attention of the government including substantially higher spending on health and education with attention given to the equity of this spending and the introduction of an UHC. A strong social protection system is another instrument for improving income distribution. These policies have worked in Western Europe, Canada, Japan and Australia and have helped to lower income inequality.
Clearly, a major way that the government can help improve income distribution is by making faster progress in building up the human capital of the poor. This will equip the poor to get better and higher paying employment. An educated and healthy labour force can also help increase the rate of growth of GDP while improving income distribution. The policy implication of this strategy is illustrated in Table 10.
Box 2: Simulated Impacts on Inequality with Fiscal Transfer in Bangladesh
The importance strong fiscal re-distributive system epitomized by better tax compliance/administration, higher direct tax revenue and cash transfers on improving equity is shown with an illustration from Bangladesh. The gain in inequality (measured by Gini coefficient) via better compliance of personal income tax system and subsequent transfer of additional revenue through better compliance to bottom 50 per cent of the population is presented below. The simulation outcomes are derived from a micro-simulation model based on latest household income and expenditure survey (HIES 2016) linked to the macro projections of the Bangladesh perspective plan (2021 to 2041). Three simulations are carried out. (i) Base (poor compliance) simulation suggests high growth rates of 8 to 9 per cent with poor fiscal distribution (as observed currently) may likely to have negligible effects on Gini. (ii) Base high compliance of the personal income tax (all eligible tax payers are paying according to their marginal rates) may significantly improve inequality situation in Bangladesh. (iii) Reduction in Gini is dramatic when the revenue gains through better tax compliance are effectively transferred to bottom 50 per cent of the population.
Panel A: Impacts on Gini Panel B: Percentage point reduction in Gini (over base)
29
Box 2: Simulated Impacts on Inequality with Fiscal Transfer in Bangladesh The importance strong fiscal re-distributive system epitomized by better tax compliance/administration, higher direct tax revenue and cash transfers on improving equity is shown with an illustration from Bangladesh. The gain in inequality (measured by Gini coefficient) via better compliance of personal income tax system and subsequent transfer of additional revenue through better compliance to bottom 50 per cent of the population is presented below. The simulation outcomes are derived from a micro-simulation model based on latest household income and expenditure survey (HIES 2016) linked to the macro projections of the Bangladesh perspective plan (2021 to 2041). Three simulations are carried out. (i) Base (poor compliance) simulation suggests high growth rates of 8 to 9 per cent with poor fiscal distribution (as observed currently) may likely to have negligible effects on Gini. (ii) Base high compliance of the personal income tax (all eligible tax payers are paying according to their marginal rates) may significantly improve inequality situation in Bangladesh. (iii) Reduction in Gini is dramatic when the revenue gains through better tax compliance are effectively transferred to bottom 50 per cent of the population.
Panel A: Impacts on Gini Panel B: Percentage point reduction in Gini (over base)
Source: Khondker et al (2020)
The introduction of a redistributive fiscal policy is a core fiscal policy reform in the PP2041. The 8FYP will initiate the first phase implementation of this fiscal policy. The combination of taxes and social spending that will be introduced to implement a redistributive fiscal policy is illustrated in Table 10.
0.47
0.47
0.46
0.46
0.46
0.47
0.46
0.45
0.43
0.43
0.35
0.44
0.42
0.38
0.36
0.27
0.000.050.100.150.200.250.300.350.400.450.50
FY16 FY20 FY25 FY30 FY35 FY40
Gini (0
-1)
Base (poor tax compliance) Base (high tax compliance)
Transfers to bottom 50%
-0.01
-0.02
-0.03
-0.04
-0.11
-0.24
-0.04
-0.04 -0.
08
-0.10
-0.20
-0.40
-0.35
-0.30
-0.25
-0.20
-0.15
-0.10
-0.05
0.00FY16 FY20 FY25 FY30 FY35 FY40
Perce
ntage
point
s
Base (high tax compliance) Transfers to bottom 50%
Source: Khondker et al (2020)
29
Box 2: Simulated Impacts on Inequality with Fiscal Transfer in Bangladesh The importance strong fiscal re-distributive system epitomized by better tax compliance/administration, higher direct tax revenue and cash transfers on improving equity is shown with an illustration from Bangladesh. The gain in inequality (measured by Gini coefficient) via better compliance of personal income tax system and subsequent transfer of additional revenue through better compliance to bottom 50 per cent of the population is presented below. The simulation outcomes are derived from a micro-simulation model based on latest household income and expenditure survey (HIES 2016) linked to the macro projections of the Bangladesh perspective plan (2021 to 2041). Three simulations are carried out. (i) Base (poor compliance) simulation suggests high growth rates of 8 to 9 per cent with poor fiscal distribution (as observed currently) may likely to have negligible effects on Gini. (ii) Base high compliance of the personal income tax (all eligible tax payers are paying according to their marginal rates) may significantly improve inequality situation in Bangladesh. (iii) Reduction in Gini is dramatic when the revenue gains through better tax compliance are effectively transferred to bottom 50 per cent of the population.
Panel A: Impacts on Gini Panel B: Percentage point reduction in Gini (over base)
Source: Khondker et al (2020)
The introduction of a redistributive fiscal policy is a core fiscal policy reform in the PP2041. The 8FYP will initiate the first phase implementation of this fiscal policy. The combination of taxes and social spending that will be introduced to implement a redistributive fiscal policy is illustrated in Table 10.
0.47
0.47
0.46
0.46
0.46
0.47
0.46
0.45
0.43
0.43
0.35
0.44
0.42
0.38
0.36
0.27
0.000.050.100.150.200.250.300.350.400.450.50
FY16 FY20 FY25 FY30 FY35 FY40
Gini
(0 -1)
Base (poor tax compliance) Base (high tax compliance)
Transfers to bottom 50%
-0.01
-0.02
-0.03
-0.04
-0.11
-0.24
-0.04
-0.04 -0.
08
-0.10
-0.20
-0.40
-0.35
-0.30
-0.25
-0.20
-0.15
-0.10
-0.05
0.00FY16 FY20 FY25 FY30 FY35 FY40
Perce
ntag
e poin
ts
Base (high tax compliance) Transfers to bottom 50%
The introduction of a redistributive fiscal policy is a core fiscal policy reform in the PP2041. The 8FYP will initiate the first phase implementation of this fiscal policy. The combination of taxes and social spending that will be introduced to implement a redistributive fiscal policy is illustrated in Table 10.
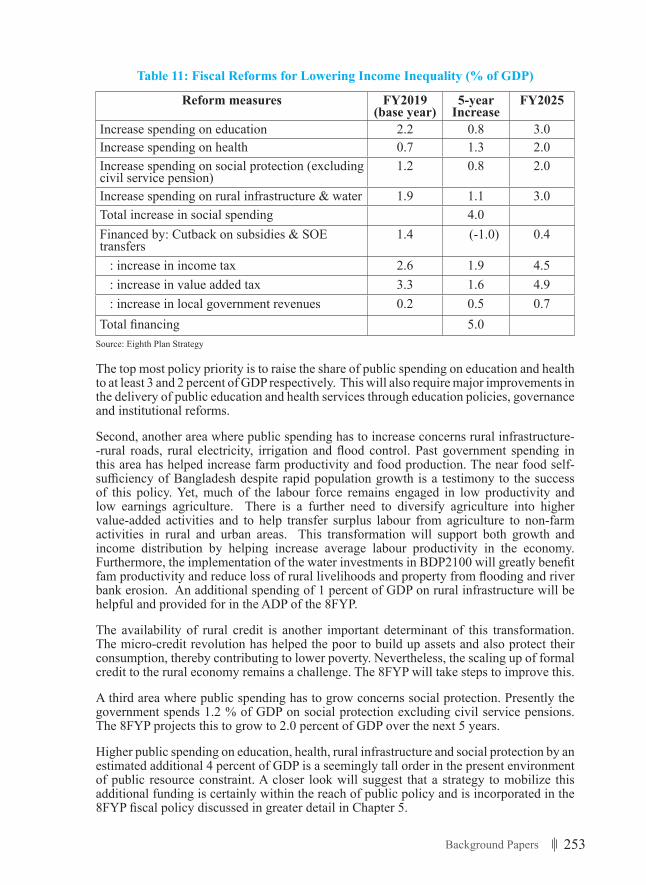
253Background Papers
Table 11: Fiscal Reforms for Lowering Income Inequality (% of GDP)
Reform measures FY2019 (base year)
5-year Increase
FY2025
Increase spending on education 2.2 0.8 3.0Increase spending on health 0.7 1.3 2.0Increase spending on social protection (excluding civil service pension)
1.2 0.8 2.0
Increase spending on rural infrastructure & water 1.9 1.1 3.0Total increase in social spending 4.0Financed by: Cutback on subsidies & SOE transfers
1.4 (-1.0) 0.4
: increase in income tax 2.6 1.9 4.5 : increase in value added tax 3.3 1.6 4.9 : increase in local government revenues 0.2 0.5 0.7Total financing 5.0
Source: Eighth Plan Strategy
The top most policy priority is to raise the share of public spending on education and health to at least 3 and 2 percent of GDP respectively. This will also require major improvements in the delivery of public education and health services through education policies, governance and institutional reforms.
Second, another area where public spending has to increase concerns rural infrastructure--rural roads, rural electricity, irrigation and flood control. Past government spending in this area has helped increase farm productivity and food production. The near food self-sufficiency of Bangladesh despite rapid population growth is a testimony to the success of this policy. Yet, much of the labour force remains engaged in low productivity and low earnings agriculture. There is a further need to diversify agriculture into higher value-added activities and to help transfer surplus labour from agriculture to non-farm activities in rural and urban areas. This transformation will support both growth and income distribution by helping increase average labour productivity in the economy. Furthermore, the implementation of the water investments in BDP2100 will greatly benefit fam productivity and reduce loss of rural livelihoods and property from flooding and river bank erosion. An additional spending of 1 percent of GDP on rural infrastructure will be helpful and provided for in the ADP of the 8FYP.
The availability of rural credit is another important determinant of this transformation. The micro-credit revolution has helped the poor to build up assets and also protect their consumption, thereby contributing to lower poverty. Nevertheless, the scaling up of formal credit to the rural economy remains a challenge. The 8FYP will take steps to improve this.
A third area where public spending has to grow concerns social protection. Presently the government spends 1.2 % of GDP on social protection excluding civil service pensions. The 8FYP projects this to grow to 2.0 percent of GDP over the next 5 years.
Higher public spending on education, health, rural infrastructure and social protection by an estimated additional 4 percent of GDP is a seemingly tall order in the present environment of public resource constraint. A closer look will suggest that a strategy to mobilize this additional funding is certainly within the reach of public policy and is incorporated in the 8FYP fiscal policy discussed in greater detail in Chapter 5.
254 General Economics Division (GED)
In the first place, the government spends some 3.4 percent of GDP on subsidies and transfers, of which 1.4 percent of GDP is on subsidies and transfers to power and other SOEs including public banks. A core fiscal reform of the 8FYP is to convert the SOEs including the power sector and public banks to profit making enterprises. These subsidies will therefore be drastically reduced and re-channelled to priority social spending as noted above.
Secondly, a major reason for the resource constraint is low tax collection, especially from personal income taxes. The effective income tax rate of at present is about only 4 percent, which is very low. Increasing the effective income tax rate to even 10 percent in the next 3-5 years to the top 10 percentile who own 35 percent of the national income will yield 3.5 percent of GDP instead of 1.4 percent of GDP now. This will require closing of loopholes that lets capital gains escape the tax net, treating all sources of personal income equally for taxation purpose, and improving tax administration and compliance. So, along with corporate income taxation, total tax on income and profit is projected to grown from 2.6% in FY2019 to 4.5% by FY2025. The modernization of VAT and improving its productivity can yield an additional 1.8% of GDP. Moreover, the introduction of a modern property tax and assigning this to the local governments can be a substantial boost for their fiscal autonomy while providing fiscal resources.
This combination of expenditure reallocation (1% of GDP) and additional tax effort focused on personal income, VAT and local government revenues (4.0% of GDP) can finance the additional 4% of GDP required to fund critical social programmes, while also leaving a surplus of 1% of GDP for additional investment in infrastructure. This fiscal policy package can be a powerful instrument for improving income distribution as the incidence of this tax and expenditure package is likely to be highly progressive. In addition to a more effective fiscal policy, the government can also help improve income distribution through better governance.
255Background Papers
ReferencesAhmed, Sadiq. (2017a). Services Sector Development to Support a High Growth in a Transforming
Economy. Background Paper Prepared for the Perspective Plan 2041, General Economics Division, Planning Commission, Dhaka, July 2017.
Ahmed, Sadiq. (2017b). “Strengthening the ICT Revolution in Bangladesh” Chapter 2, in Evidence Based Policy Making in Bangladesh: Selected Case Studies. Policy research Institute of Bangladesh, Dhaka.
Ahmed, Sadiq. (2015). Growth with Equity- Contemporary Development Challenges of Bangladesh. Bangladesh Institute of Bank Management, Dhaka
Ahmed, Sadiq and Zaidi Sattar. (2020). Bangladesh Youth Employment Policy Brief. ILO, Dhaka
Ahmed, Sadiq and Zaidi Sattar. (2019a). Bangladesh Trade Policy for Growth and Employment: Collected Essays, Policy Research Institute of Bangladesh, Dhaka.
Ahmed, Sadiq, Khurshid Alam and Bazlul Khondker. (2018). Faster Development of the Micro, Small and Medium Enterprises (MSMEs): Role of Innovative Financing Solutions. Report Prepared for the World Bank, Policy Research Institute of Bangladesh, Dhaka
Khondker, Bazlul H., Zubayer Hossen and M. Jahed Ebn Jalal. (2020). “Pathways of Reducing the Inequality in Bangladesh”, Paper Presented to the 5th SANEM Annual Economic Conference (SAEC), February 02, 2020, Dhaka.
Sen, Binayak, Zulfiqar Ali, and Muntasir Murshed. (2020). Poverty in the Time of Corona: Trends, Drivers, Vulnerability and Policy Responses in Bangladesh. Background Paper prepared for the 8FYP, General Economics Division, Planning Commission, Government of Bangladesh, Dhaka
World Bank. (2019a). Bangladesh Poverty Assessment, Volumes 1 and 2. World Bank, Washington D.C.
World Bank (2018). The Global Findex Database 2017: Measuring Financial Inclusion and the Fintech Revolution, World Bank, Washington D.C.
World Bank (2013a). Bangladesh Education Sector Review - Seeding Fertile Ground: Education that Works for Bangladesh. Report No. 80613 BD, Washington D C.
World Bank. (2013b). Bangladesh Poverty Assessment: Assessing a Decade of Progress in Reducing Poverty, 2000-2010, World Bank, Dhaka.
Zhang, Xiabo., et. al. (2012). Rising Wages and Poverty Reduction in Bangladesh, International Food Policy Research Institute Paper, IFPRI, Washington D C.
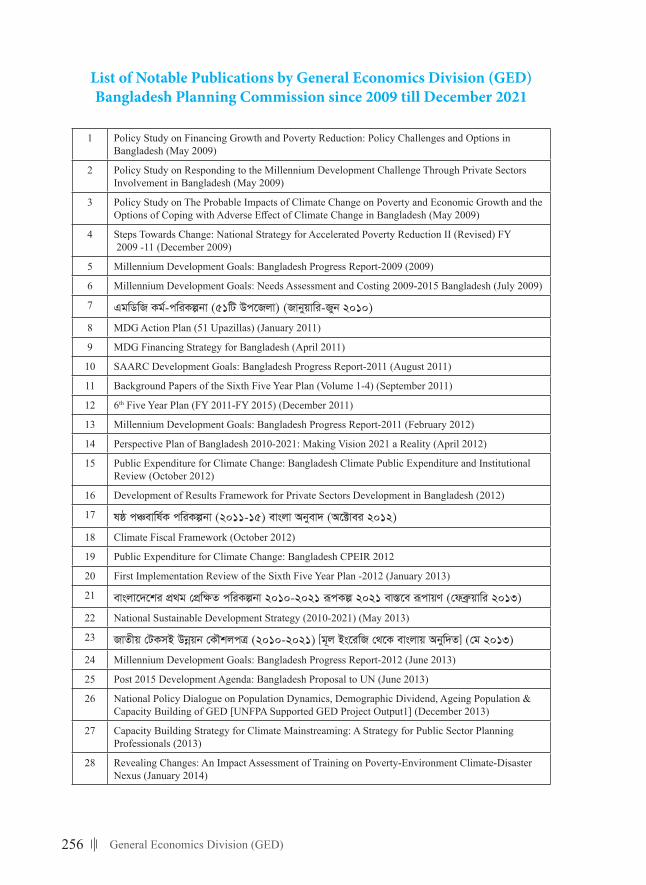
256 General Economics Division (GED)
List of Notable Publications by General Economics Division (GED)Bangladesh Planning Commission since 2009 till December 2021
1 Policy Study on Financing Growth and Poverty Reduction: Policy Challenges and Options in Bangladesh (May 2009)
2 Policy Study on Responding to the Millennium Development Challenge Through Private Sectors Involvement in Bangladesh (May 2009)
3 Policy Study on The Probable Impacts of Climate Change on Poverty and Economic Growth and the Options of Coping with Adverse Effect of Climate Change in Bangladesh (May 2009)
4 Steps Towards Change: National Strategy for Accelerated Poverty Reduction II (Revised) FY 2009 -11 (December 2009)
5 Millennium Development Goals: Bangladesh Progress Report-2009 (2009)
6 Millennium Development Goals: Needs Assessment and Costing 2009-2015 Bangladesh (July 2009)
7 GgwWwR Kg©-cwiKíbv (51wU Dc‡Rjv) (Rvbyqvwi-Ryb 2010)
8 MDG Action Plan (51 Upazillas) (January 2011)
9 MDG Financing Strategy for Bangladesh (April 2011)
10 SAARC Development Goals: Bangladesh Progress Report-2011 (August 2011)
11 Background Papers of the Sixth Five Year Plan (Volume 1-4) (September 2011)
12 6th Five Year Plan (FY 2011-FY 2015) (December 2011)
13 Millennium Development Goals: Bangladesh Progress Report-2011 (February 2012)
14 Perspective Plan of Bangladesh 2010-2021: Making Vision 2021 a Reality (April 2012)
15 Public Expenditure for Climate Change: Bangladesh Climate Public Expenditure and Institutional Review (October 2012)
16 Development of Results Framework for Private Sectors Development in Bangladesh (2012)
17 lô cÂevwl©K cwiKíbv (2011-15) evsjv Abyev` (A‡±vei 2012)
18 Climate Fiscal Framework (October 2012)
19 Public Expenditure for Climate Change: Bangladesh CPEIR 2012
20 First Implementation Review of the Sixth Five Year Plan -2012 (January 2013)
21 evsjv‡`‡ki cÖ_g †cÖwÿZ cwiKíbv 2010-2021 iƒcKí 2021 ev¯Í‡e iƒcvqY (†deªæqvwi 2013)
22 National Sustainable Development Strategy (2010-2021) (May 2013)
23 RvZxq †UKmB Dbœqb †KŠkjcÎ (2010-2021) [g~j Bs‡iwR †_‡K evsjvq Abyw`Z] (†g 2013)
24 Millennium Development Goals: Bangladesh Progress Report-2012 (June 2013)
25 Post 2015 Development Agenda: Bangladesh Proposal to UN (June 2013)
26 National Policy Dialogue on Population Dynamics, Demographic Dividend, Ageing Population & Capacity Building of GED [UNFPA Supported GED Project Output1] (December 2013)
27 Capacity Building Strategy for Climate Mainstreaming: A Strategy for Public Sector Planning Professionals (2013)
28 Revealing Changes: An Impact Assessment of Training on Poverty-Environment Climate-Disaster Nexus (January 2014)
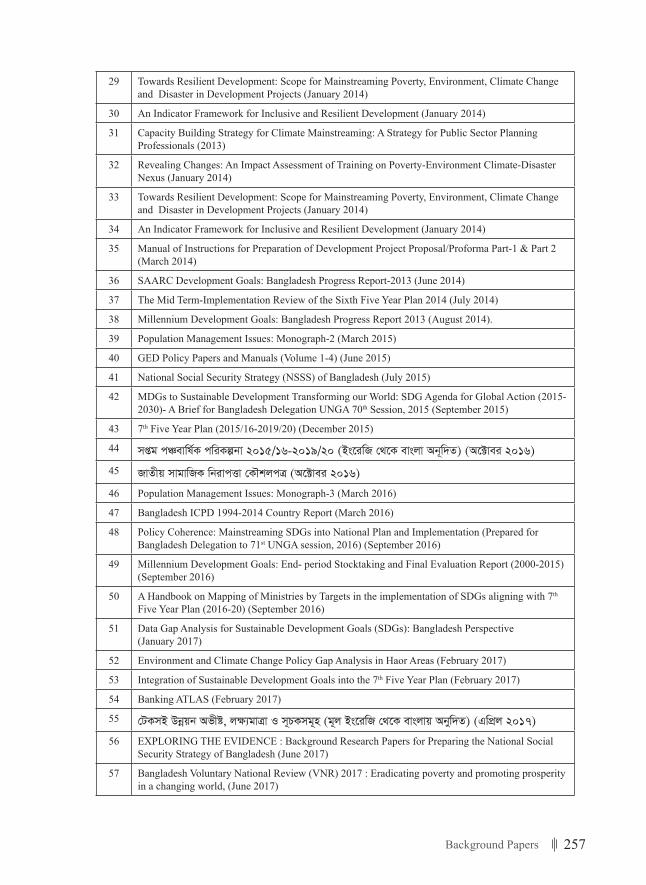
257Background Papers
29 Towards Resilient Development: Scope for Mainstreaming Poverty, Environment, Climate Change and Disaster in Development Projects (January 2014)
30 An Indicator Framework for Inclusive and Resilient Development (January 2014)
31 Capacity Building Strategy for Climate Mainstreaming: A Strategy for Public Sector Planning Professionals (2013)
32 Revealing Changes: An Impact Assessment of Training on Poverty-Environment Climate-Disaster Nexus (January 2014)
33 Towards Resilient Development: Scope for Mainstreaming Poverty, Environment, Climate Change and Disaster in Development Projects (January 2014)
34 An Indicator Framework for Inclusive and Resilient Development (January 2014)
35 Manual of Instructions for Preparation of Development Project Proposal/Proforma Part-1 & Part 2 (March 2014)
36 SAARC Development Goals: Bangladesh Progress Report-2013 (June 2014)
37 The Mid Term-Implementation Review of the Sixth Five Year Plan 2014 (July 2014)
38 Millennium Development Goals: Bangladesh Progress Report 2013 (August 2014).
39 Population Management Issues: Monograph-2 (March 2015)
40 GED Policy Papers and Manuals (Volume 1-4) (June 2015)
41 National Social Security Strategy (NSSS) of Bangladesh (July 2015)
42 MDGs to Sustainable Development Transforming our World: SDG Agenda for Global Action (2015-2030)- A Brief for Bangladesh Delegation UNGA 70th Session, 2015 (September 2015)
43 7th Five Year Plan (2015/16-2019/20) (December 2015)
44 mßg cÂevwl©K cwiKíbv 2015/16-2019/20 (Bs‡iwR †_‡K evsjv Ab~w`Z) (A‡±vei 2016)
45 RvZxq mvgvwRK wbivcËv †KŠkjcÎ (A‡±vei 2016)
46 Population Management Issues: Monograph-3 (March 2016)
47 Bangladesh ICPD 1994-2014 Country Report (March 2016)
48 Policy Coherence: Mainstreaming SDGs into National Plan and Implementation (Prepared for Bangladesh Delegation to 71st UNGA session, 2016) (September 2016)
49 Millennium Development Goals: End- period Stocktaking and Final Evaluation Report (2000-2015) (September 2016)
50 A Handbook on Mapping of Ministries by Targets in the implementation of SDGs aligning with 7th
Five Year Plan (2016-20) (September 2016)
51 Data Gap Analysis for Sustainable Development Goals (SDGs): Bangladesh Perspective(January 2017)
52 Environment and Climate Change Policy Gap Analysis in Haor Areas (February 2017)
53 Integration of Sustainable Development Goals into the 7th Five Year Plan (February 2017)
54 Banking ATLAS (February 2017)
55 †UKmB Dbœqb Afxó, jÿ¨gvÎv I m~PKmg~n (g~j Bs‡iwR †_‡K evsjvq Abyw`Z) (GwcÖj 2017)
56 EXPLORING THE EVIDENCE : Background Research Papers for Preparing the National Social Security Strategy of Bangladesh (June 2017)
57 Bangladesh Voluntary National Review (VNR) 2017 : Eradicating poverty and promoting prosperity in a changing world, (June 2017)
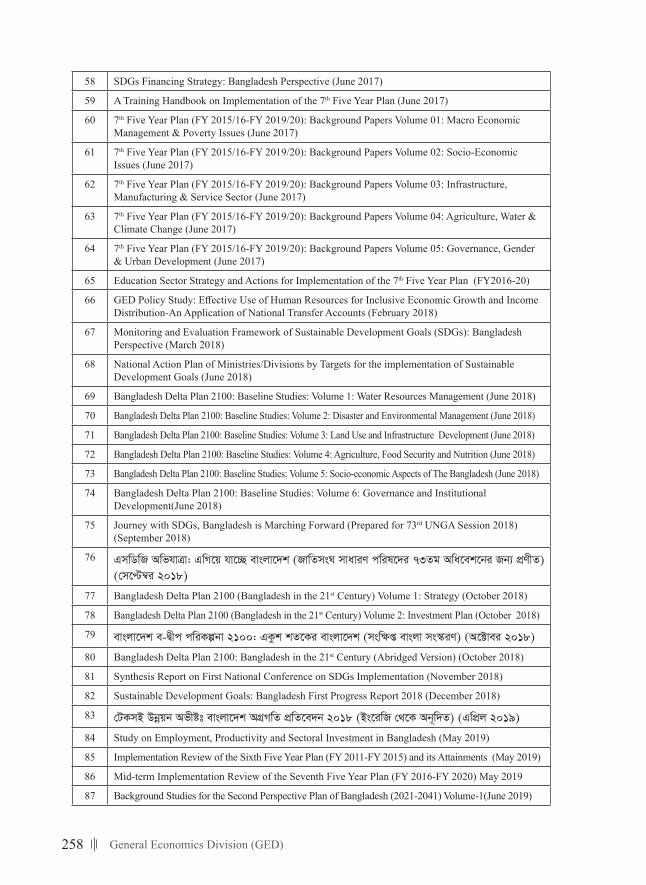
258 General Economics Division (GED)
58 SDGs Financing Strategy: Bangladesh Perspective (June 2017)
59 A Training Handbook on Implementation of the 7th Five Year Plan (June 2017)
60 7th Five Year Plan (FY 2015/16-FY 2019/20): Background Papers Volume 01: Macro Economic Management & Poverty Issues (June 2017)
61 7th Five Year Plan (FY 2015/16-FY 2019/20): Background Papers Volume 02: Socio-Economic Issues (June 2017)
62 7th Five Year Plan (FY 2015/16-FY 2019/20): Background Papers Volume 03: Infrastructure, Manufacturing & Service Sector (June 2017)
63 7th Five Year Plan (FY 2015/16-FY 2019/20): Background Papers Volume 04: Agriculture, Water & Climate Change (June 2017)
64 7th Five Year Plan (FY 2015/16-FY 2019/20): Background Papers Volume 05: Governance, Gender & Urban Development (June 2017)
65 Education Sector Strategy and Actions for Implementation of the 7th Five Year Plan (FY2016-20)
66 GED Policy Study: Effective Use of Human Resources for Inclusive Economic Growth and Income Distribution-An Application of National Transfer Accounts (February 2018)
67 Monitoring and Evaluation Framework of Sustainable Development Goals (SDGs): Bangladesh Perspective (March 2018)
68 National Action Plan of Ministries/Divisions by Targets for the implementation of Sustainable Development Goals (June 2018)
69 Bangladesh Delta Plan 2100: Baseline Studies: Volume 1: Water Resources Management (June 2018)
70 Bangladesh Delta Plan 2100: Baseline Studies: Volume 2: Disaster and Environmental Management (June 2018)
71 Bangladesh Delta Plan 2100: Baseline Studies: Volume 3: Land Use and Infrastructure Development (June 2018)
72 Bangladesh Delta Plan 2100: Baseline Studies: Volume 4: Agriculture, Food Security and Nutrition (June 2018)
73 Bangladesh Delta Plan 2100: Baseline Studies: Volume 5: Socio-economic Aspects of The Bangladesh (June 2018)
74 Bangladesh Delta Plan 2100: Baseline Studies: Volume 6: Governance and Institutional Development(June 2018)
75 Journey with SDGs, Bangladesh is Marching Forward (Prepared for 73rd UNGA Session 2018) (September 2018)
76 GmwWwR AwfhvÎv: GwM‡q hv‡”Q evsjv‡`k (RvwZmsN mvaviY cwil‡`i 73Zg Awa‡ek‡bi Rb¨ cÖYxZ) (†m‡Þ¤^i 2018)
77 Bangladesh Delta Plan 2100 (Bangladesh in the 21st Century) Volume 1: Strategy (October 2018)
78 Bangladesh Delta Plan 2100 (Bangladesh in the 21st Century) Volume 2: Investment Plan (October 2018)
79 evsjv‡`k e-Øxc cwiKíbv 2100: GKzk kZ‡Ki evsjv‡`k (mswÿß evsjv ms¯‹iY) (A‡±vei 2018)
80 Bangladesh Delta Plan 2100: Bangladesh in the 21st Century (Abridged Version) (October 2018)
81 Synthesis Report on First National Conference on SDGs Implementation (November 2018)
82 Sustainable Development Goals: Bangladesh First Progress Report 2018 (December 2018)
83 †UKmB Dbœqb Afxót evsjv‡`k AMÖMwZ cÖwZ‡e`b 2018 (Bs‡iwR †_‡K Ab~w`Z) (GwcÖj 2019)
84 Study on Employment, Productivity and Sectoral Investment in Bangladesh (May 2019)
85 Implementation Review of the Sixth Five Year Plan (FY 2011-FY 2015) and its Attainments (May 2019)
86 Mid-term Implementation Review of the Seventh Five Year Plan (FY 2016-FY 2020) May 2019
87 Background Studies for the Second Perspective Plan of Bangladesh (2021-2041) Volume-1(June 2019)
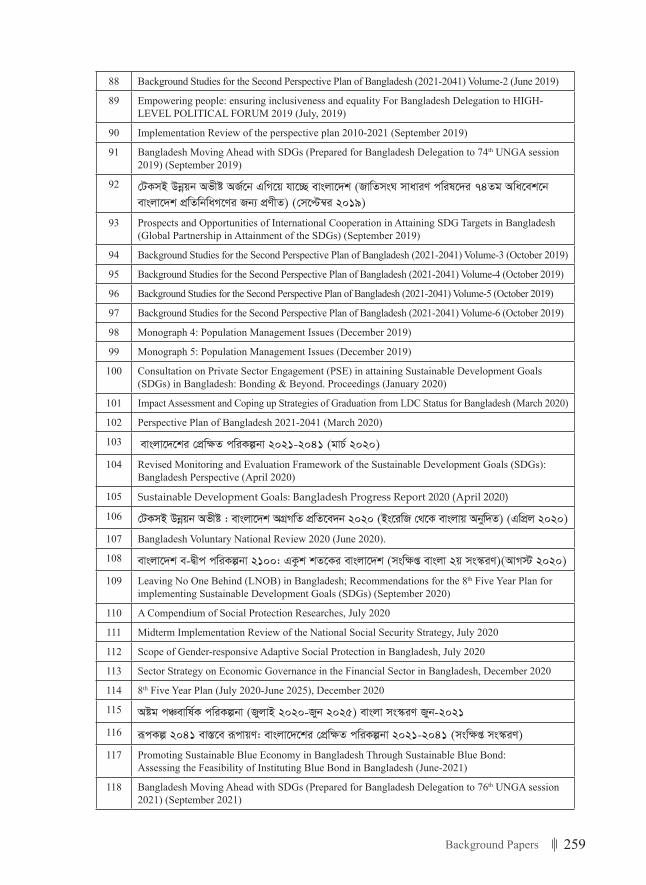
259Background Papers
88 Background Studies for the Second Perspective Plan of Bangladesh (2021-2041) Volume-2 (June 2019)
89 Empowering people: ensuring inclusiveness and equality For Bangladesh Delegation to HIGH-LEVEL POLITICAL FORUM 2019 (July, 2019)
90 Implementation Review of the perspective plan 2010-2021 (September 2019)
91 Bangladesh Moving Ahead with SDGs (Prepared for Bangladesh Delegation to 74th UNGA session 2019) (September 2019)
92 †UKmB Dbœqb Afxó AR©‡b GwM‡q hv‡”Q evsjv‡`k (RvwZmsN mvaviY cwil‡`i 74Zg Awa‡ek‡b evsjv‡`k cÖwZwbwaM‡Yi Rb¨ cÖYxZ) (†m‡Þ¤^i 2019)
93 Prospects and Opportunities of International Cooperation in Attaining SDG Targets in Bangladesh (Global Partnership in Attainment of the SDGs) (September 2019)
94 Background Studies for the Second Perspective Plan of Bangladesh (2021-2041) Volume-3 (October 2019)
95 Background Studies for the Second Perspective Plan of Bangladesh (2021-2041) Volume-4 (October 2019)
96 Background Studies for the Second Perspective Plan of Bangladesh (2021-2041) Volume-5 (October 2019)
97 Background Studies for the Second Perspective Plan of Bangladesh (2021-2041) Volume-6 (October 2019)
98 Monograph 4: Population Management Issues (December 2019)
99 Monograph 5: Population Management Issues (December 2019)
100 Consultation on Private Sector Engagement (PSE) in attaining Sustainable Development Goals (SDGs) in Bangladesh: Bonding & Beyond. Proceedings (January 2020)
101 Impact Assessment and Coping up Strategies of Graduation from LDC Status for Bangladesh (March 2020)
102 Perspective Plan of Bangladesh 2021-2041 (March 2020)
103 evsjv‡`‡ki †cÖw¶Z cwiKíbv 2021-2041 (gvP© 2020)
104 Revised Monitoring and Evaluation Framework of the Sustainable Development Goals (SDGs): Bangladesh Perspective (April 2020)
105 Sustainable Development Goals: Bangladesh Progress Report 2020 (April 2020)
106 †UKmB Dbœqb Afxó : evsjv‡`k AMÖMwZ cÖwZ‡e`b 2020 (Bs‡iwR †_‡K evsjvq Abyw`Z) (GwcÖj 2020)
107 Bangladesh Voluntary National Review 2020 (June 2020).
108 evsjv‡`k e-Øxc cwiKíbv 2100: GKzk kZ‡Ki evsjv‡`k (mswÿß evsjv 2q ms¯‹iY)(AvM÷ 2020)
109 Leaving No One Behind (LNOB) in Bangladesh; Recommendations for the 8th Five Year Plan for implementing Sustainable Development Goals (SDGs) (September 2020)
110 A Compendium of Social Protection Researches, July 2020
111 Midterm Implementation Review of the National Social Security Strategy, July 2020
112 Scope of Gender-responsive Adaptive Social Protection in Bangladesh, July 2020
113 Sector Strategy on Economic Governance in the Financial Sector in Bangladesh, December 2020
114 8th Five Year Plan (July 2020-June 2025), December 2020
115 Aóg cÂevwl©K cwiKíbv (RyjvB 2020-Ryb 2025) evsjv ms¯‹iY Ryb-2021
116 iƒcKí 2041 ev¯Í‡e iƒcvqY: evsjv‡`‡ki †cÖwÿZ cwiKíbv 2021-2041 (mswÿß ms¯‹iY)
117 Promoting Sustainable Blue Economy in Bangladesh Through Sustainable Blue Bond:Assessing the Feasibility of Instituting Blue Bond in Bangladesh (June-2021)
118 Bangladesh Moving Ahead with SDGs (Prepared for Bangladesh Delegation to 76th UNGA session 2021) (September 2021)
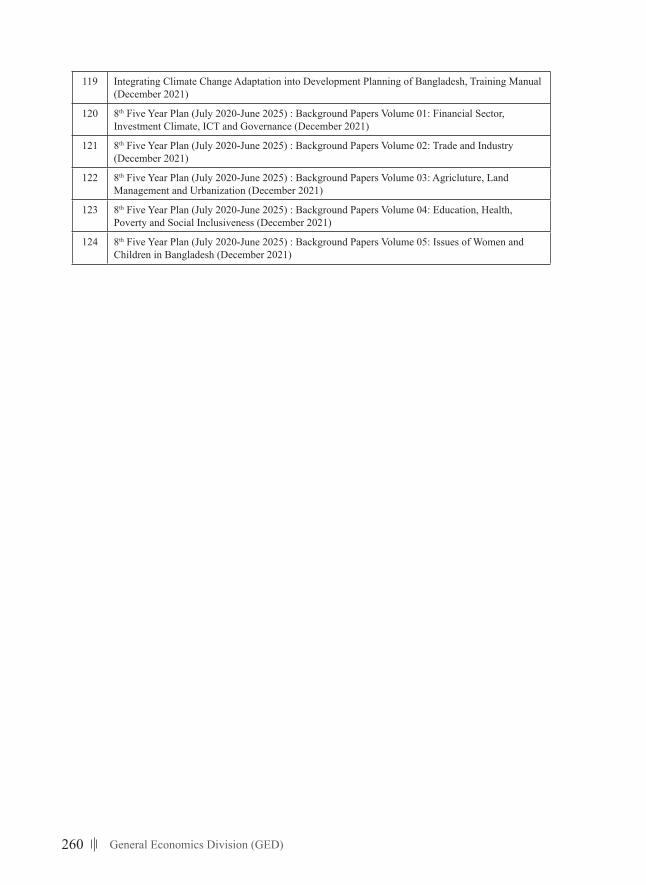
260 General Economics Division (GED)
119 Integrating Climate Change Adaptation into Development Planning of Bangladesh, Training Manual (December 2021)
120 8th Five Year Plan (July 2020-June 2025) : Background Papers Volume 01: Financial Sector, Investment Climate, ICT and Governance (December 2021)
121 8th Five Year Plan (July 2020-June 2025) : Background Papers Volume 02: Trade and Industry (December 2021)
122 8th Five Year Plan (July 2020-June 2025) : Background Papers Volume 03: Agricluture, Land Management and Urbanization (December 2021)
123 8th Five Year Plan (July 2020-June 2025) : Background Papers Volume 04: Education, Health, Poverty and Social Inclusiveness (December 2021)
124 8th Five Year Plan (July 2020-June 2025) : Background Papers Volume 05: Issues of Women and Children in Bangladesh (December 2021)
Related Documents