Lecture- 9 & 10 & 11: Unemployment & Poverty Reduction Process Presented by Abul Kalam Azad Senior Lecturer, GED Northern University Bangladesh E-mail: [email protected]

Lecture- 9 & 10 & 11: Unemployment & Poverty Reduction Process Presented by Abul Kalam Azad Senior Lecturer, GED Northern University Bangladesh E-mail:
Dec 25, 2015
Welcome message from author
This document is posted to help you gain knowledge. Please leave a comment to let me know what you think about it! Share it to your friends and learn new things together.
Transcript

Lecture- 9 & 10 & 11: Unemployment & Poverty Reduction Process
Presented by Abul Kalam Azad
Senior Lecturer, GEDNorthern University Bangladesh
E-mail: [email protected]
Introduction
Bangladesh has been stereotyped as the archetypical theatre of poverty. It is the only country which is categorized as the least developed one with over 75 million people. There is a great deal of suspicion about prospect for rapid unemployment & poverty reduction in the country without which accelerated growth is impossible. Let’s examine the poverty trends in the country critically, unearth the process of such reduction and suggest a more grounded strategy of poverty reduction in Bangladesh.

Poverty Trends in Bangladesh
There is considerable disagreement about the extent of income poverty in Bangladesh for the earlier period between 1960s and 1980s. In 1980s there was greater consensus among various studies. But discrepancies among different estimates persisted. Wodon’s figure was 13 percent higher than the official estimate of BBS. Let’s cast our glance at the poverty stats in Bangladesh.

Table 1: Poverty Trends in Bangladesh: 1983-2000
Year National Rural Urban1983-84 52.3 53.8 40.91988-89 47.8 49.7 35.91991-92 49.7 52.9 33.6
1995-96 53.1 56.7 352000 49.8 53.1 36.6
Source: Sen 2003 & BBS 2000

Table 2: Rural Poverty Trends: 1983-2000
Year All poor
Poverty gap
Squared poverty gap
1983-84 53.8 15 5.9
1988-89 49.7 13.1 4.8
1991-92 52.9 14.6 5.6
1995-96 56.7 15.5 5.7
2000 53.1 13.8 4.8
Source: Sen, 2003: 514; BBS, 2002:X.
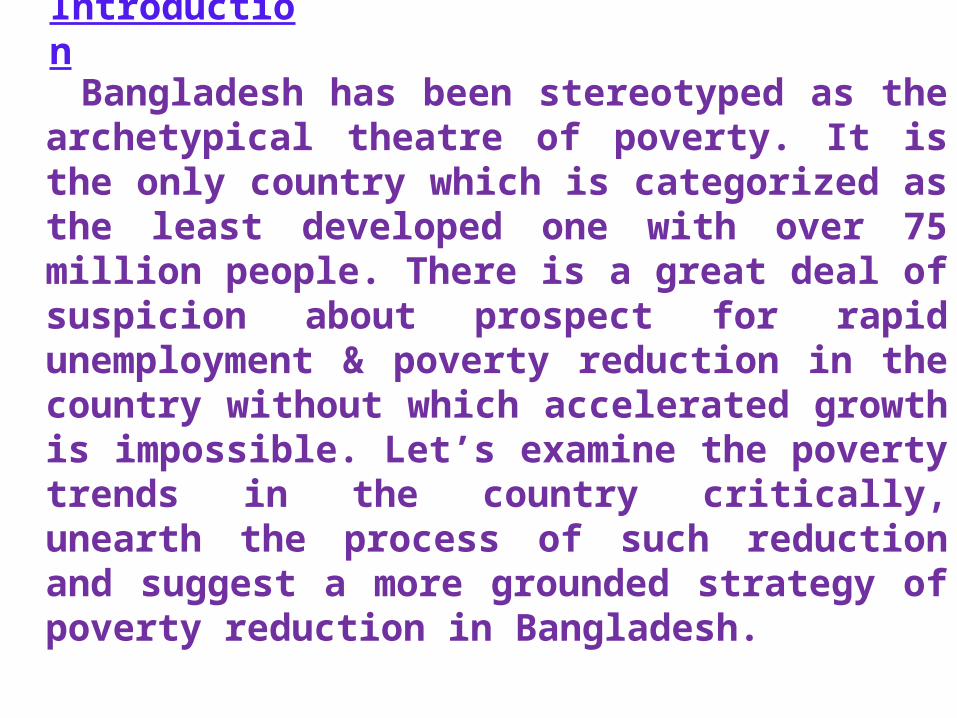
Table 3: Rural Poverty Trends 1987-84: BIDS 62 Village Survey
Indicator 1987 1989-90 1994
All Poor 57.5 59.3 51.7
Extreme Poor 25.8 30.7 22.5
Poverty Gap Ratio (%)
21.7 24.8 19.2
Distributionally Sensitive Index
10.9 13.5 9.6
Source: Sen, 2003: 514; BBS, 2002:X.

Table 4: Trends in Nutritional Status of Rural Children 6-59 Months 1990-96
Indicator Aug 90-Jul 91
Aug 91-Jul 92
Aug 92-Jul 93
Aug 93-Jul 94
Aug 94-July 94
Aug 95-Jul 96
Stunting (Prevent Growth)
69.8 70.3 67.9 63.9 63.6 62.3
Under-weight
71 71.8 71.3 67.2 68.5 66.3
Source: Sen, 2003: 514; BBS, 2002:X.

Table 5: Comparison poverty measurement {Upper (2122k.cal) Poverty Line}
Indicator 1995-96 (Percent ofPopulation)
2000(Percent of Population)
DCI Method
CBN method
DCI Method
CBN metho
d
National 47.5 53.1 44.3 49.8
Rural 47.1 56.7 42.3 53.1
Urban 49.7 35.0 52.5 36.6
Source: Sen, 2003: 514; BBS, 2002:X.

Lecture- 9 & 10 & 11: Unemployment & Poverty Reduction Process
Presented by Abul Kalam Azad
Senior Lecturer, GEDNorthern University Bangladesh
E-mail: [email protected]

Table 6: Comparison poverty measurement {Lower (1805k.cal) Poverty Line}
Indicator 1995-96 (Percent ofPopulation)
2000(Percent of Population)
DCI Method
CBN method
DCI Method
CBN metho
d
National 25.1 34.4 20.0 33.7
Rural 24.6 38.5 18.7 37.4
Urban 27.3 13.7 25.0 19.1
Source: Sen, 2003: 514; BBS, 2002:X.

Bangladesh in terms of HDI Ranking (Index)
Human Poverty Index (HPI-1) 2004
93 (40.5)
HDI value 140 (0.547)
Source: Human Development Index Report 2008
Table: Human Poverty & Development Index

Characteristics of Poverty in BD
From these studies several broad characteristics of poverty in BD have been identified (Rahman, 2002;BBS, 2001;BBS, 2002;Sen, 2003;Mujeri, 1997).
1. Declining rate of Poverty which is extremely slow improvement is from 1- 1.8 % per year during the 1990s.
2. Extreme manifestations of poverty (such as lack of minimum clothing or basic shelter or starvation) have declined.
3. Reduction of poverty is faster in urban areas.
4. An increasing concentration of poverty among the female–headed households.
5. Rajshahi has the highest rate of poverty.

5. Declining in absolute poverty accompanied by an increase in relative poverty.
6. The HPI (human poverty index) fell from 61.3 percent in 1981-83 to 40.5 percent in 2004.
7. The (HDI) human development index had nearly doubled in three decades between 1960 and 2005. It increased from 0.166 to 0.54.
8. Declining rate of stunting ranging from 54.6 in 1996/97 to 44.8 percent in 1999/2000.
11.There has been impressive progress in the reduction of infant and child mortality.
12. The life expectancy has increased. (BIDS, 2001).

How to Alleviate Poverty
World Bank prescribed Eight-Point Strategic Agenda for poverty reduction as follows:
1. Employment2. Nutrition3. Quality Education (particularly in primary,
secondary and vocational levels with strong emphasis on girls'
4. education)5. Local governance6. Maternal Health7. Sanitation and Safe Water8. Criminal Justice9. Monitoring
Related Documents