International OPPORTUNITY INSIGHTS FOR EDUFINANCE EDUCATION & LABOUR MARKET OUTCOMES Toronto, 2020 Prepared by: Shlomit Broder, Madeleine Foley, Rachel Pagdin, Mackenzie Rice, Michelle Verbeek, Sorena Zahiri

Welcome message from author
This document is posted to help you gain knowledge. Please leave a comment to let me know what you think about it! Share it to your friends and learn new things together.
Transcript

InternationalOPPORTUNITY
INSIGHTS FOR EDUFINANCE
EDUCATION
& LABOUR MARKET
OUTCOMES
Toronto, 2020
Prepared by: Shlomit Broder, Madeleine Foley, Rachel Pagdin, Mackenzie Rice, Michelle Verbeek, Sorena Zahiri
01
Education has the power to reduce poverty and
transform people’s lives. However, the benefits of
education depend, in part, on the link between
education and employment.
As EduFinance works to address the global education
crisis, it is imperative to consider how investments in
education can be used to maximize labour market
outcomes. Through a detailed analysis of education
systems, labour markets, and returns to education at
each level, this report identifies opportunities for
EduFinance to leverage investments in education to
maximize labour market outcomes in terms of
employability and earnings potential. This report also
explores the opportunity for technical and vocational
education and training (TVET) programs to address
critical skills gaps and improve employment
outcomes for young adults by developing skills that
are high in demand. The report concludes with both
general and region-specific recommendations for
EduFinance programs to achieve the goal of
maximizing labour market outcomes.
EXECUTIVESUMMARY

SUMMARY OFRECOMMENDATIONS
02
Facilitating access to quality education in the earliest years of a child’s school career
should remain a priority for EduFinance, and holistic early childhood interventions
should also be considered
Curricular reforms towards more competency-based and learner-centred models that
allow students to develop a well-rounded skillset should be encouraged and aligned
with current and future market demands
TVET programs propose a unique investment opportunity to help overcome issues of
skills mismatching and should be tailored to address region specific talent shortages
K E Y T A K E - A W A Y S
Building soft skills that
are transferable to the
labour market, such as
entrepreneurial skills
and workplace
reliability
Reducing barriers to
participation in
secondary education
Fostering inclusivity of
women and girls in
TVET programs
SUB-SAHARANAFRICA
SOUTH &SOUTHEAST ASIA
LATIN AMERICA &THE CARIBBEAN
Gender-sensitive
programming, notably
in secondary education
and TVET
Leveraging investments
to match the shift
towards knowledge-
intensive economies
Intentionally investing
in skills development in
rural areas to achieve
greater equity
Increasing access to
higher education, and
expanding participation
in TVET programs
Tailoring investments
in skills development
programs, including
TVET and secondary
education, to address
country-specific skills
gaps
R E G I O N A L P R I O R I T I E S

TA
BL
E O
F
CO
NT
EN
TS
Report Framework
Supply Side Analysis: Education Systems
Sub-Saharan Africa
South and Southeast Asia
Latin America and the Caribbean
Demand Side Analysis: Labour Markets
Sub-Saharan Africa
South and Southeast Asia
Latin America and the Caribbean
Investment Opportunities & Outcomes
Returns on Investment
Early Childhood Education
Primary Education
Secondary Education
Tertiary Education
TVET
Overview
Outcomes
Evidence
Future Considerations
Recommendations
4
6
9
13
17
21
23
27
32
35
36
38
41
44
46
48
49
50
51
52
54
03

04
REPORT FRAMEWORK
05
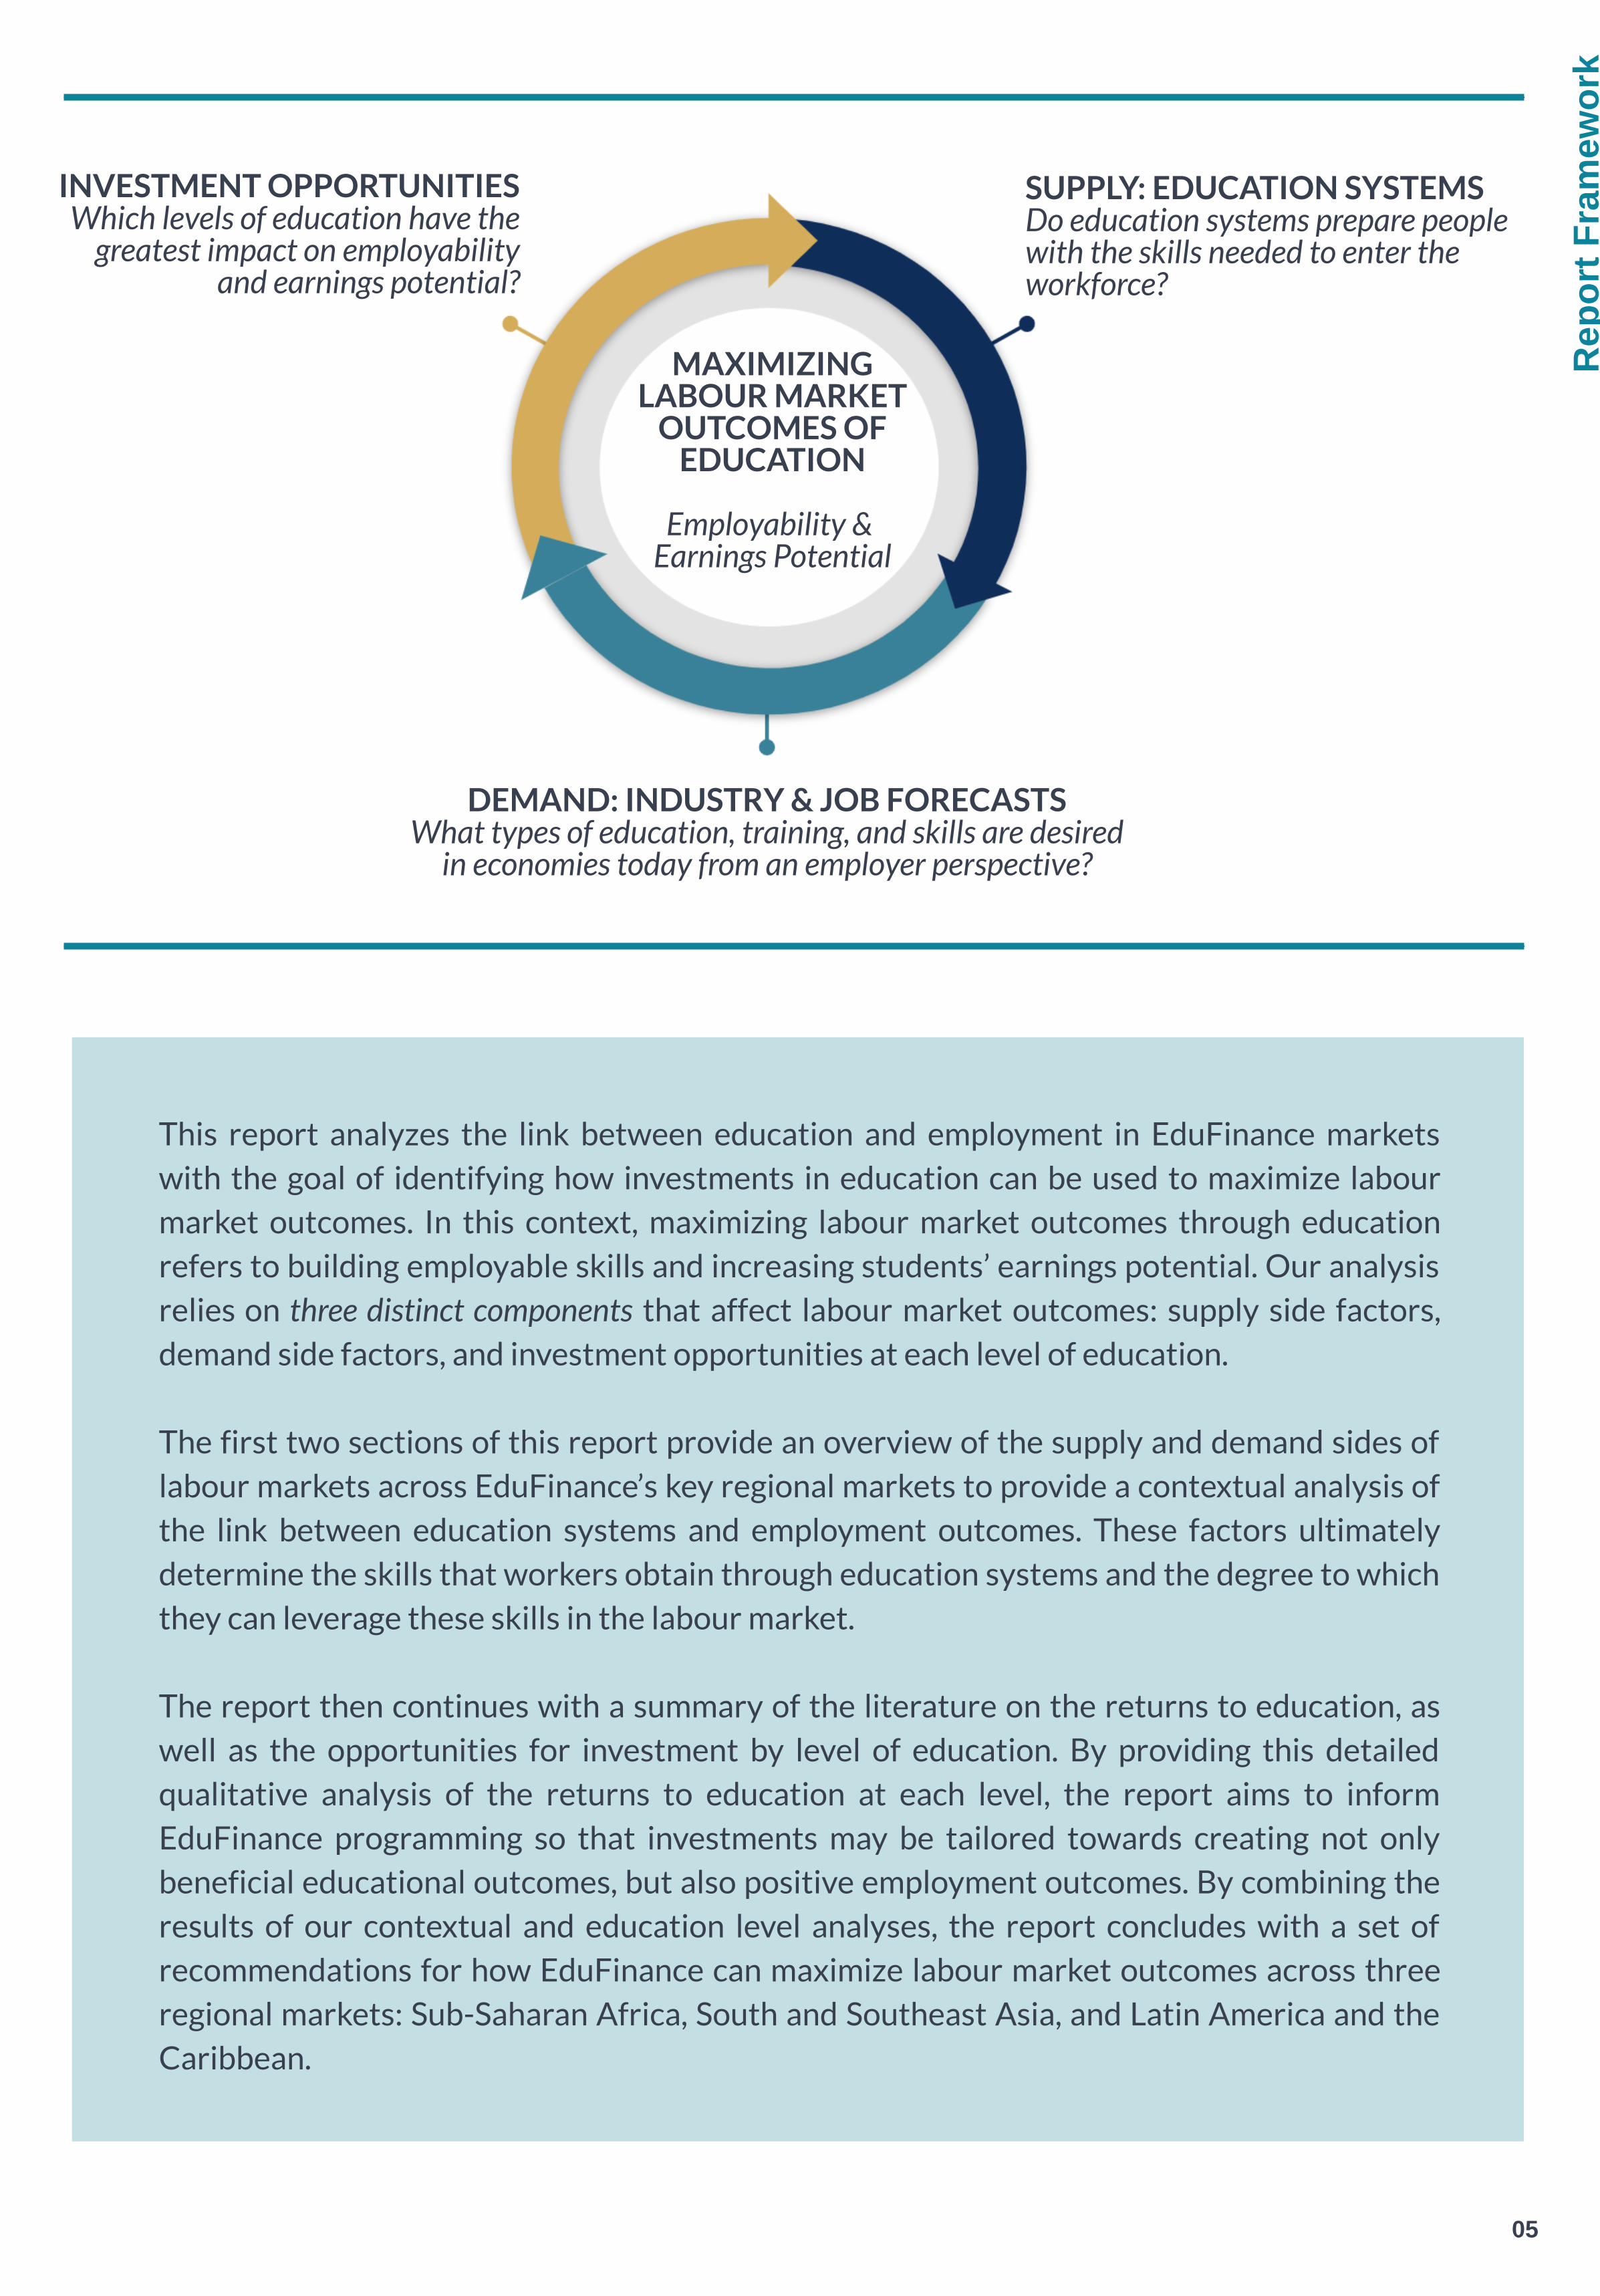
This report analyzes the link between education and employment in EduFinance markets
with the goal of identifying how investments in education can be used to maximize labour
market outcomes. In this context, maximizing labour market outcomes through education
refers to building employable skills and increasing students’ earnings potential. Our analysis
relies on three distinct components that affect labour market outcomes: supply side factors,
demand side factors, and investment opportunities at each level of education.
The first two sections of this report provide an overview of the supply and demand sides of
labour markets across EduFinance’s key regional markets to provide a contextual analysis of
the link between education systems and employment outcomes. These factors ultimately
determine the skills that workers obtain through education systems and the degree to which
they can leverage these skills in the labour market.
The report then continues with a summary of the literature on the returns to education, as
well as the opportunities for investment by level of education. By providing this detailed
qualitative analysis of the returns to education at each level, the report aims to inform
EduFinance programming so that investments may be tailored towards creating not only
beneficial educational outcomes, but also positive employment outcomes. By combining the
results of our contextual and education level analyses, the report concludes with a set of
recommendations for how EduFinance can maximize labour market outcomes across three
regional markets: Sub-Saharan Africa, South and Southeast Asia, and Latin America and the
Caribbean.
INVESTMENT OPPORTUNITIES
Which levels of education have thegreatest impact on employability
and earnings potential?
SUPPLY: EDUCATION SYSTEMS
Do education systems prepare peoplewith the skills needed to enter theworkforce?
DEMAND: INDUSTRY & JOB FORECASTS
What types of education, training, and skills are desiredin economies today from an employer perspective?
MAXIMIZING
LABOUR MARKET
OUTCOMES OF
EDUCATION
Employability & Earnings Potential
Rep
ort F
ram
ewor
k
06
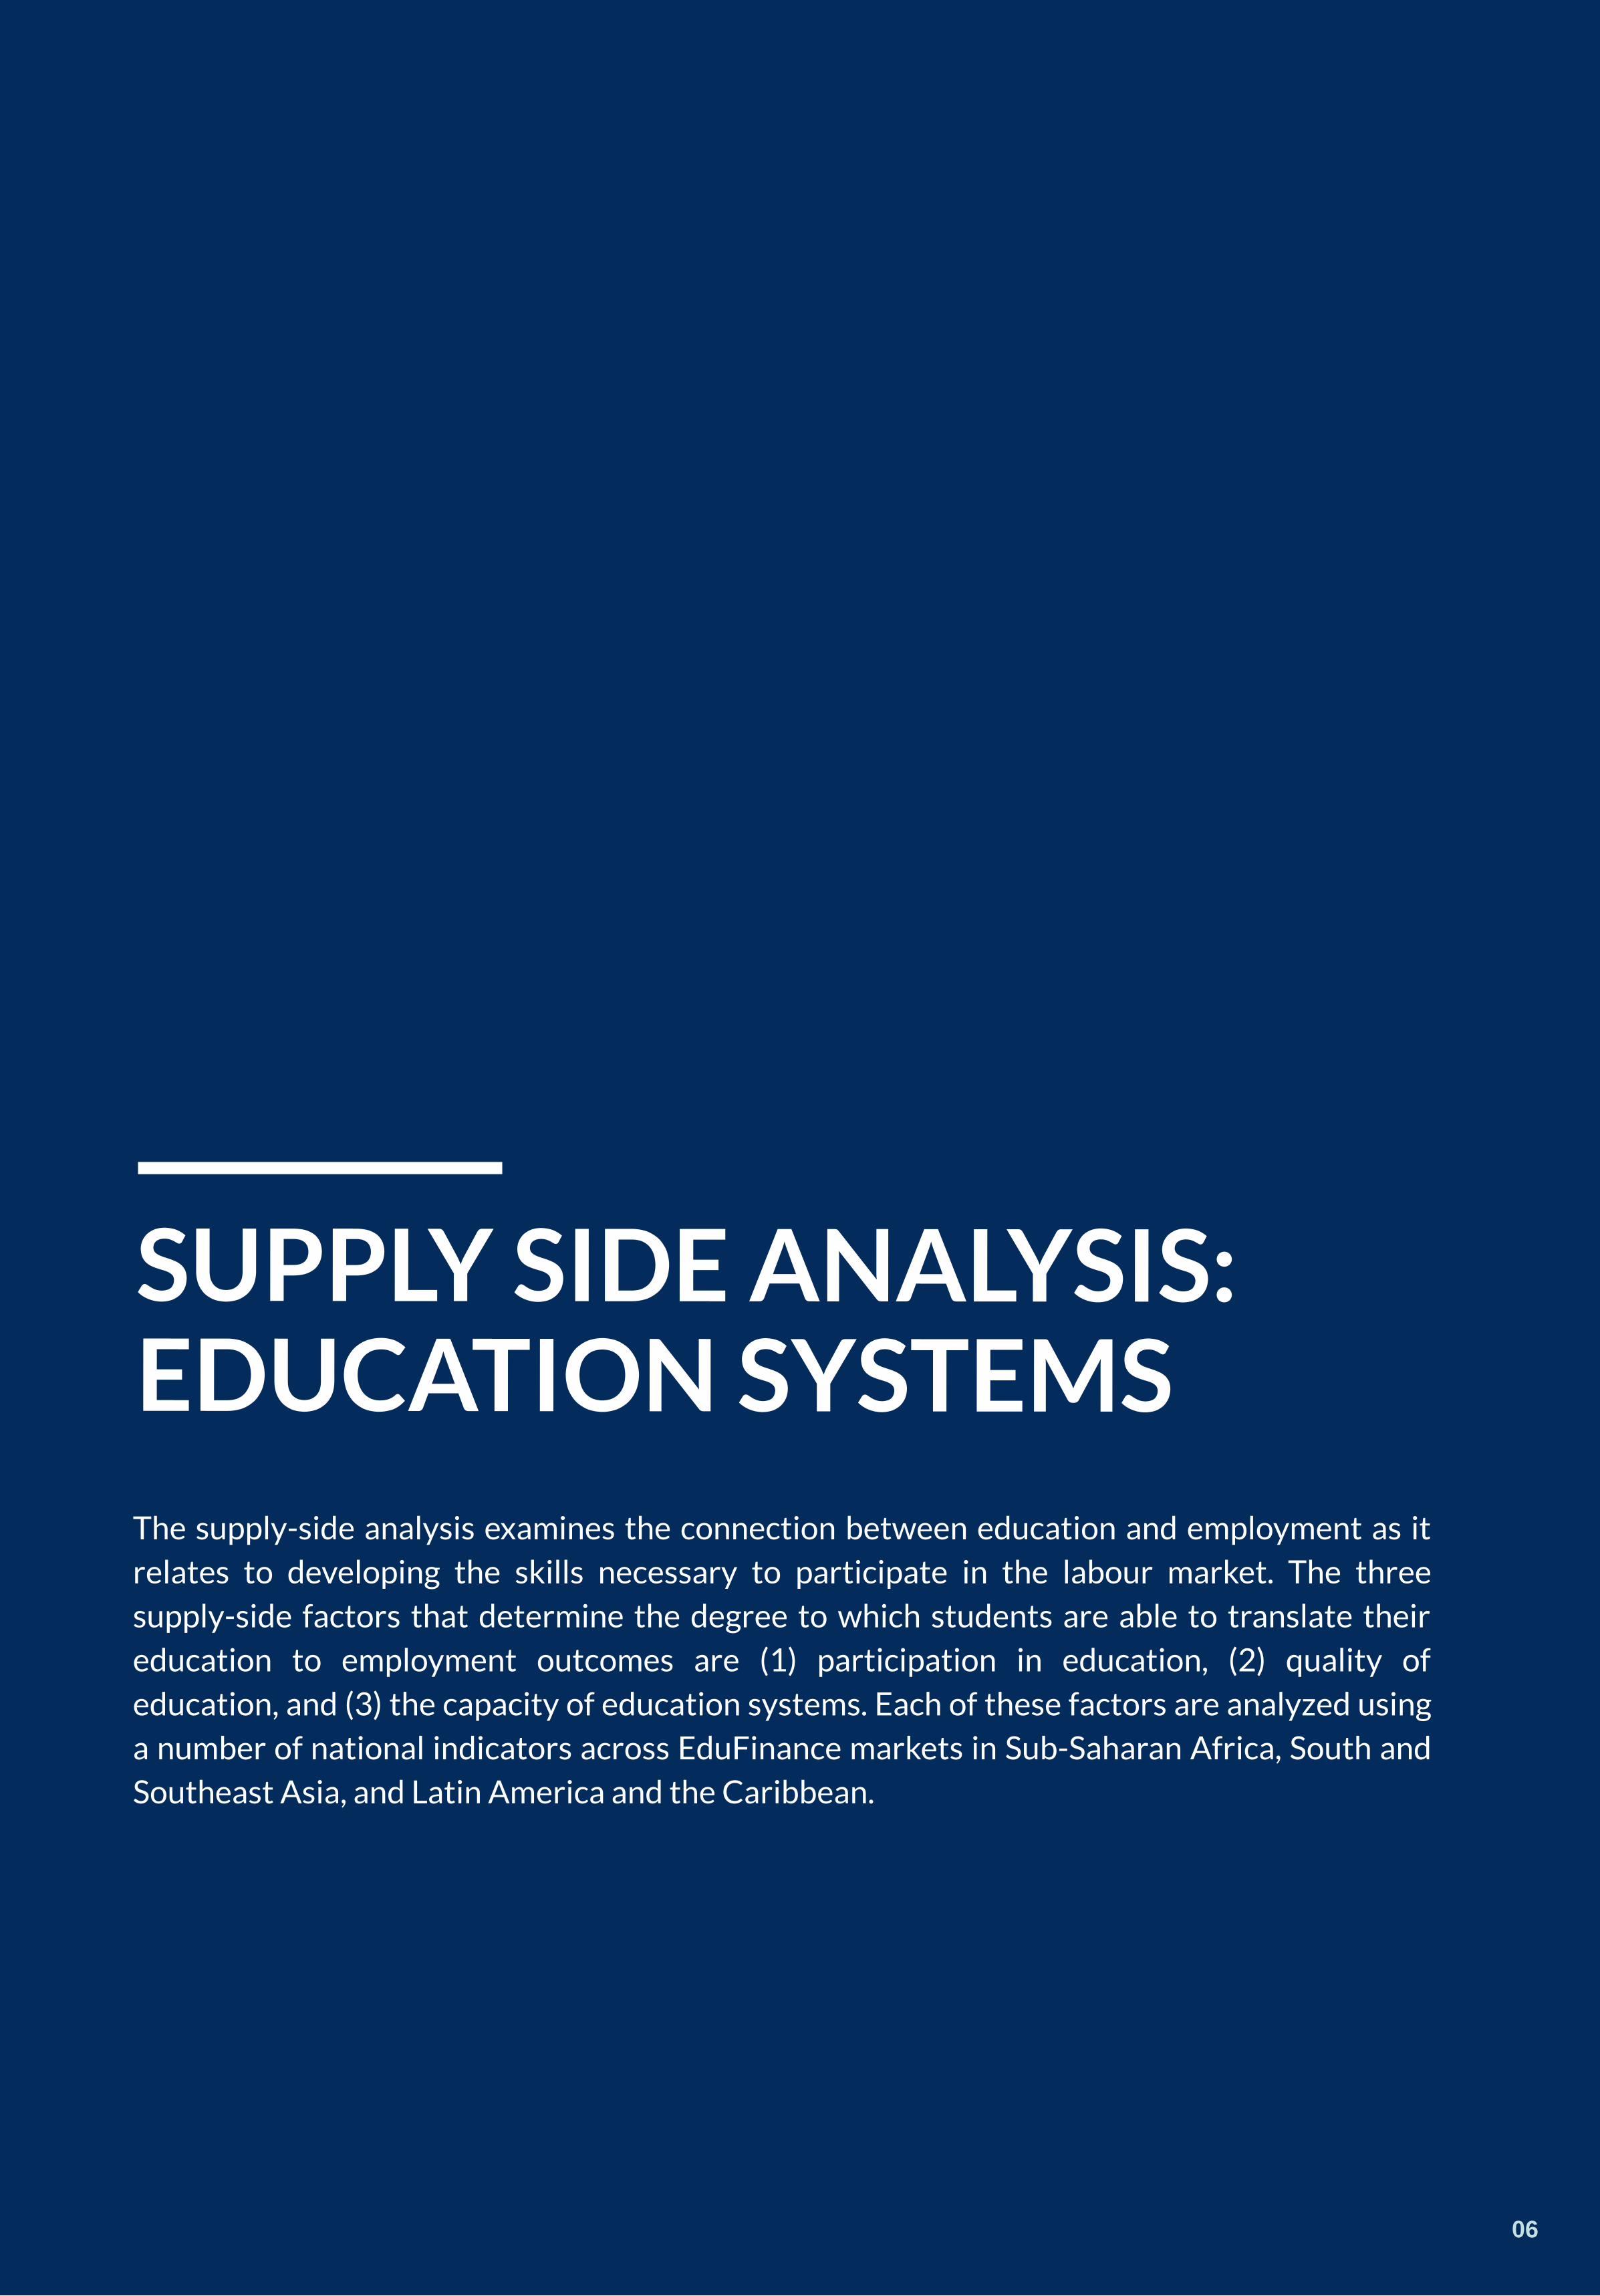
SUPPLY SIDE ANALYSIS:
EDUCATION SYSTEMS
The supply-side analysis examines the connection between education and employment as itrelates to developing the skills necessary to participate in the labour market. The threesupply-side factors that determine the degree to which students are able to translate theireducation to employment outcomes are (1) participation in education, (2) quality ofeducation, and (3) the capacity of education systems. Each of these factors are analyzed usinga number of national indicators across EduFinance markets in Sub-Saharan Africa, South andSoutheast Asia, and Latin America and the Caribbean.
07
Note: For some indicators, certain countries or levels of education were excluded
from the analysis due to a lack of data. In cases where 2018 data was unavailable,
the most recently available year after 2010 was used.
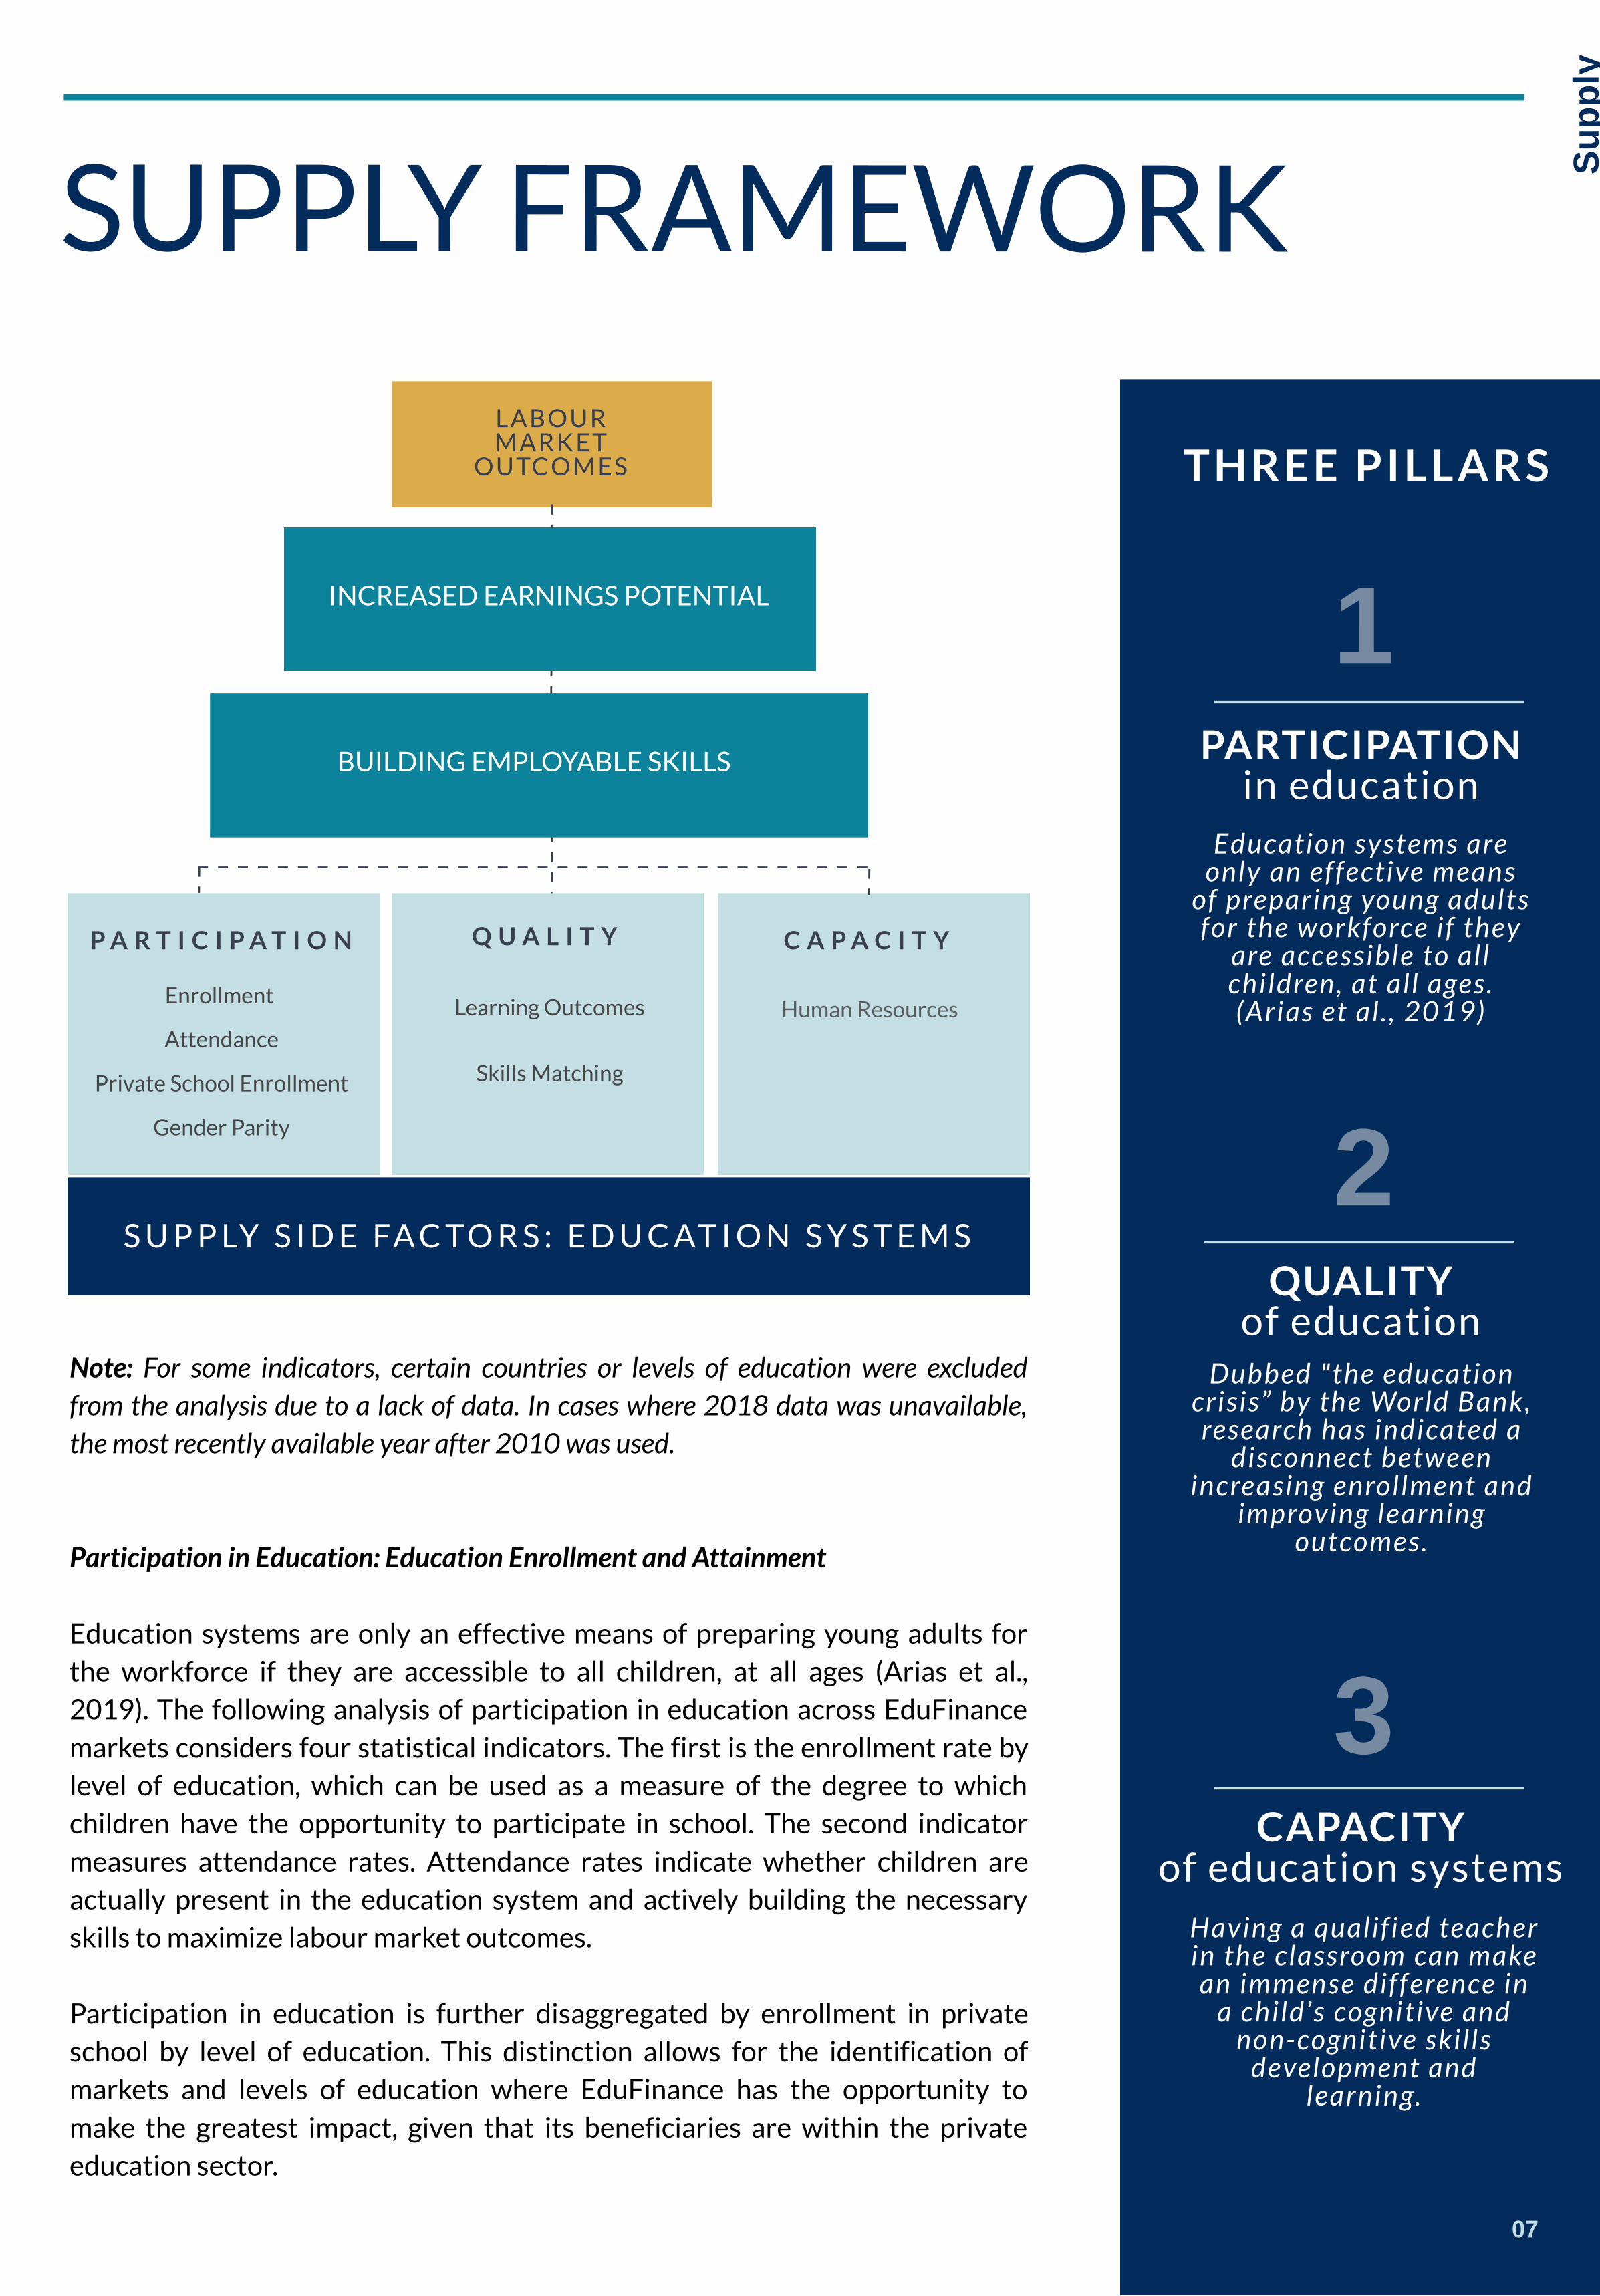
Participation in Education: Education Enrollment and Attainment
Education systems are only an effective means of preparing young adults forthe workforce if they are accessible to all children, at all ages (Arias et al.,2019). The following analysis of participation in education across EduFinancemarkets considers four statistical indicators. The first is the enrollment rate bylevel of education, which can be used as a measure of the degree to whichchildren have the opportunity to participate in school. The second indicatormeasures attendance rates. Attendance rates indicate whether children areactually present in the education system and actively building the necessaryskills to maximize labour market outcomes.
Participation in education is further disaggregated by enrollment in privateschool by level of education. This distinction allows for the identification ofmarkets and levels of education where EduFinance has the opportunity tomake the greatest impact, given that its beneficiaries are within the privateeducation sector.
Supp
ly
SUPPLY FRAMEWORK
THREE PILLARS
1
2
3
PARTICIPATIONin education
QUALITYof education
CAPACITYof education systems
Education systems are
only an effective means
of preparing young adults
for the workforce if they
are accessible to all
children, at all ages.
(Arias et al., 2019)
Dubbed "the education
crisis” by the World Bank,
research has indicated a
disconnect between
increasing enrollment and
improving learning
outcomes.
Having a qualified teacher
in the classroom can make
an immense difference in
a child’s cognitive and
non-cognitive skills
development and
learning.
P A R T I C I P A T I O N C A P A C I T YQ U A L I T Y
Enrollment
Attendance
Private School Enrollment
Gender Parity
Human ResourcesLearning Outcomes
Skills Matching
LABOURMARKET
OUTCOMES
BUILDING EMPLOYABLE SKILLS
INCREASED EARNINGS POTENTIAL
S U P P LY S I D E FA C TO R S : E D U C AT I O N S Y S T E M S
08
THREE PILLARS
Having a qualified
teacher in the classroom
can make an immense
difference in a child’s
cognitive and non-
cognitive skills
development and
learning.
Participation in Education (Continued)
The fourth and final indicator considered in our analysis of participation is the net enrollment gender parity index, whichmeasures the enrollment ratio between boys and girls. A ratio of one indicates gender parity, meaning that equal levels ofgirls and boys are enrolled in a given level of education. By contrast, a ratio less than one indicates that boys are enrolledat higher rates than girls for that level of education, and vice versa. Across the literature on returns to education, one ofthe most consistent findings is that private returns for an additional year of schooling are higher for girls than for boys(Psacharopoulos and Patrinos, 2018). Therefore, considering a gender lens is particularly valuable, given the high rates ofreturn that can be generated from increasing girls’ participation in school.
It is important to note that participation in education is often stratified along gender, religious, ethnic, and socioeconomiclines. Inequalities in education frequently carry over to the labour market, negatively affecting employment outcomesand social welfare. An analysis of the specific barriers to participation are critical to achieving universal access toeducation and maximizing labour market benefits. These factors, however, are dependent on in-depth local-level analysesthat are beyond the scope of this macro-level report.
Quality: Skills Development and Learning Outcomes
A second key component of education systems is quality, which is measured in this analysis through learning outcomesand skills matching. In recent years, research in the field of global development has indicated that there is a gap betweenincreasing participation and improving learning outcomes. In 2018, the World Bank dubbed this phenomenon “theeducation crisis” after research revealed shockingly low mathematical and reading comprehension competencies forprimary school children across many developing countries that were thought to have made significant strides towardsimproving access to education (World Bank, 2018).
Learning outcomes have substantial long-term effects on the labour market and productivity. The World Bank’s HumanCapital Index estimates that lifetime productivity for today’s children will be 56 percent lower than what it could havebeen if they had access to quality education and universal health coverage (World Bank, 2019). To overcome thechallenges of comparability in learning outcomes, this analysis uses a dataset prepared by Altinok, Angrist, and Patrinos(2018), which estimates national average harmonized learning outcomes on a 600-point scale. This dataset combinesinternational, national, and regional level test results from the disciplines of mathematics, science, and reading for bothprimary and secondary school students to provide a single score that estimates annual national-level learning outcomes(Altinok et al., 2018).
The second indicator of education quality is skills matching, which provides a picture of whether workers’ skills areapplicable in the workforce. Some of the factors considered in this analysis include employer and employee surveysmeasuring levels of over-education and skills mismatch as a barrier to employment. High levels of skills mismatch point toinefficiencies in the link between education and employment and are cause for examining how investments in educationcan better prepare young people to enter the workforce.
Capacity: Education System Inputs and Available Resources
Finally, the analysis of supply-side factors concludes with an overview of the current capacity of education systems inEduFinance markets, captured by the availability of human resources. This section compares the pupil to qualifiedteacher ratio across levels of education to assess human resource constraints, which ultimately impact the quality ofeducation. As defined by UNCESCO, a qualified teacher is one who “has at least the minimum academic qualificationsrequired for teaching their subjects at the relevant level in a given country.” Therefore, the education level necessary tobe deemed “qualified” is likely to vary between countries. Nevertheless, having a qualified teacher in the classroom canmake an immense difference in a child’s cognitive and non-cognitive skills development and learning. High pupil toqualified teacher ratios are an indication of human resource shortages, which are likely to negatively affect educationquality and learning outcomes, particularly for the youngest students.
Supp
ly
09
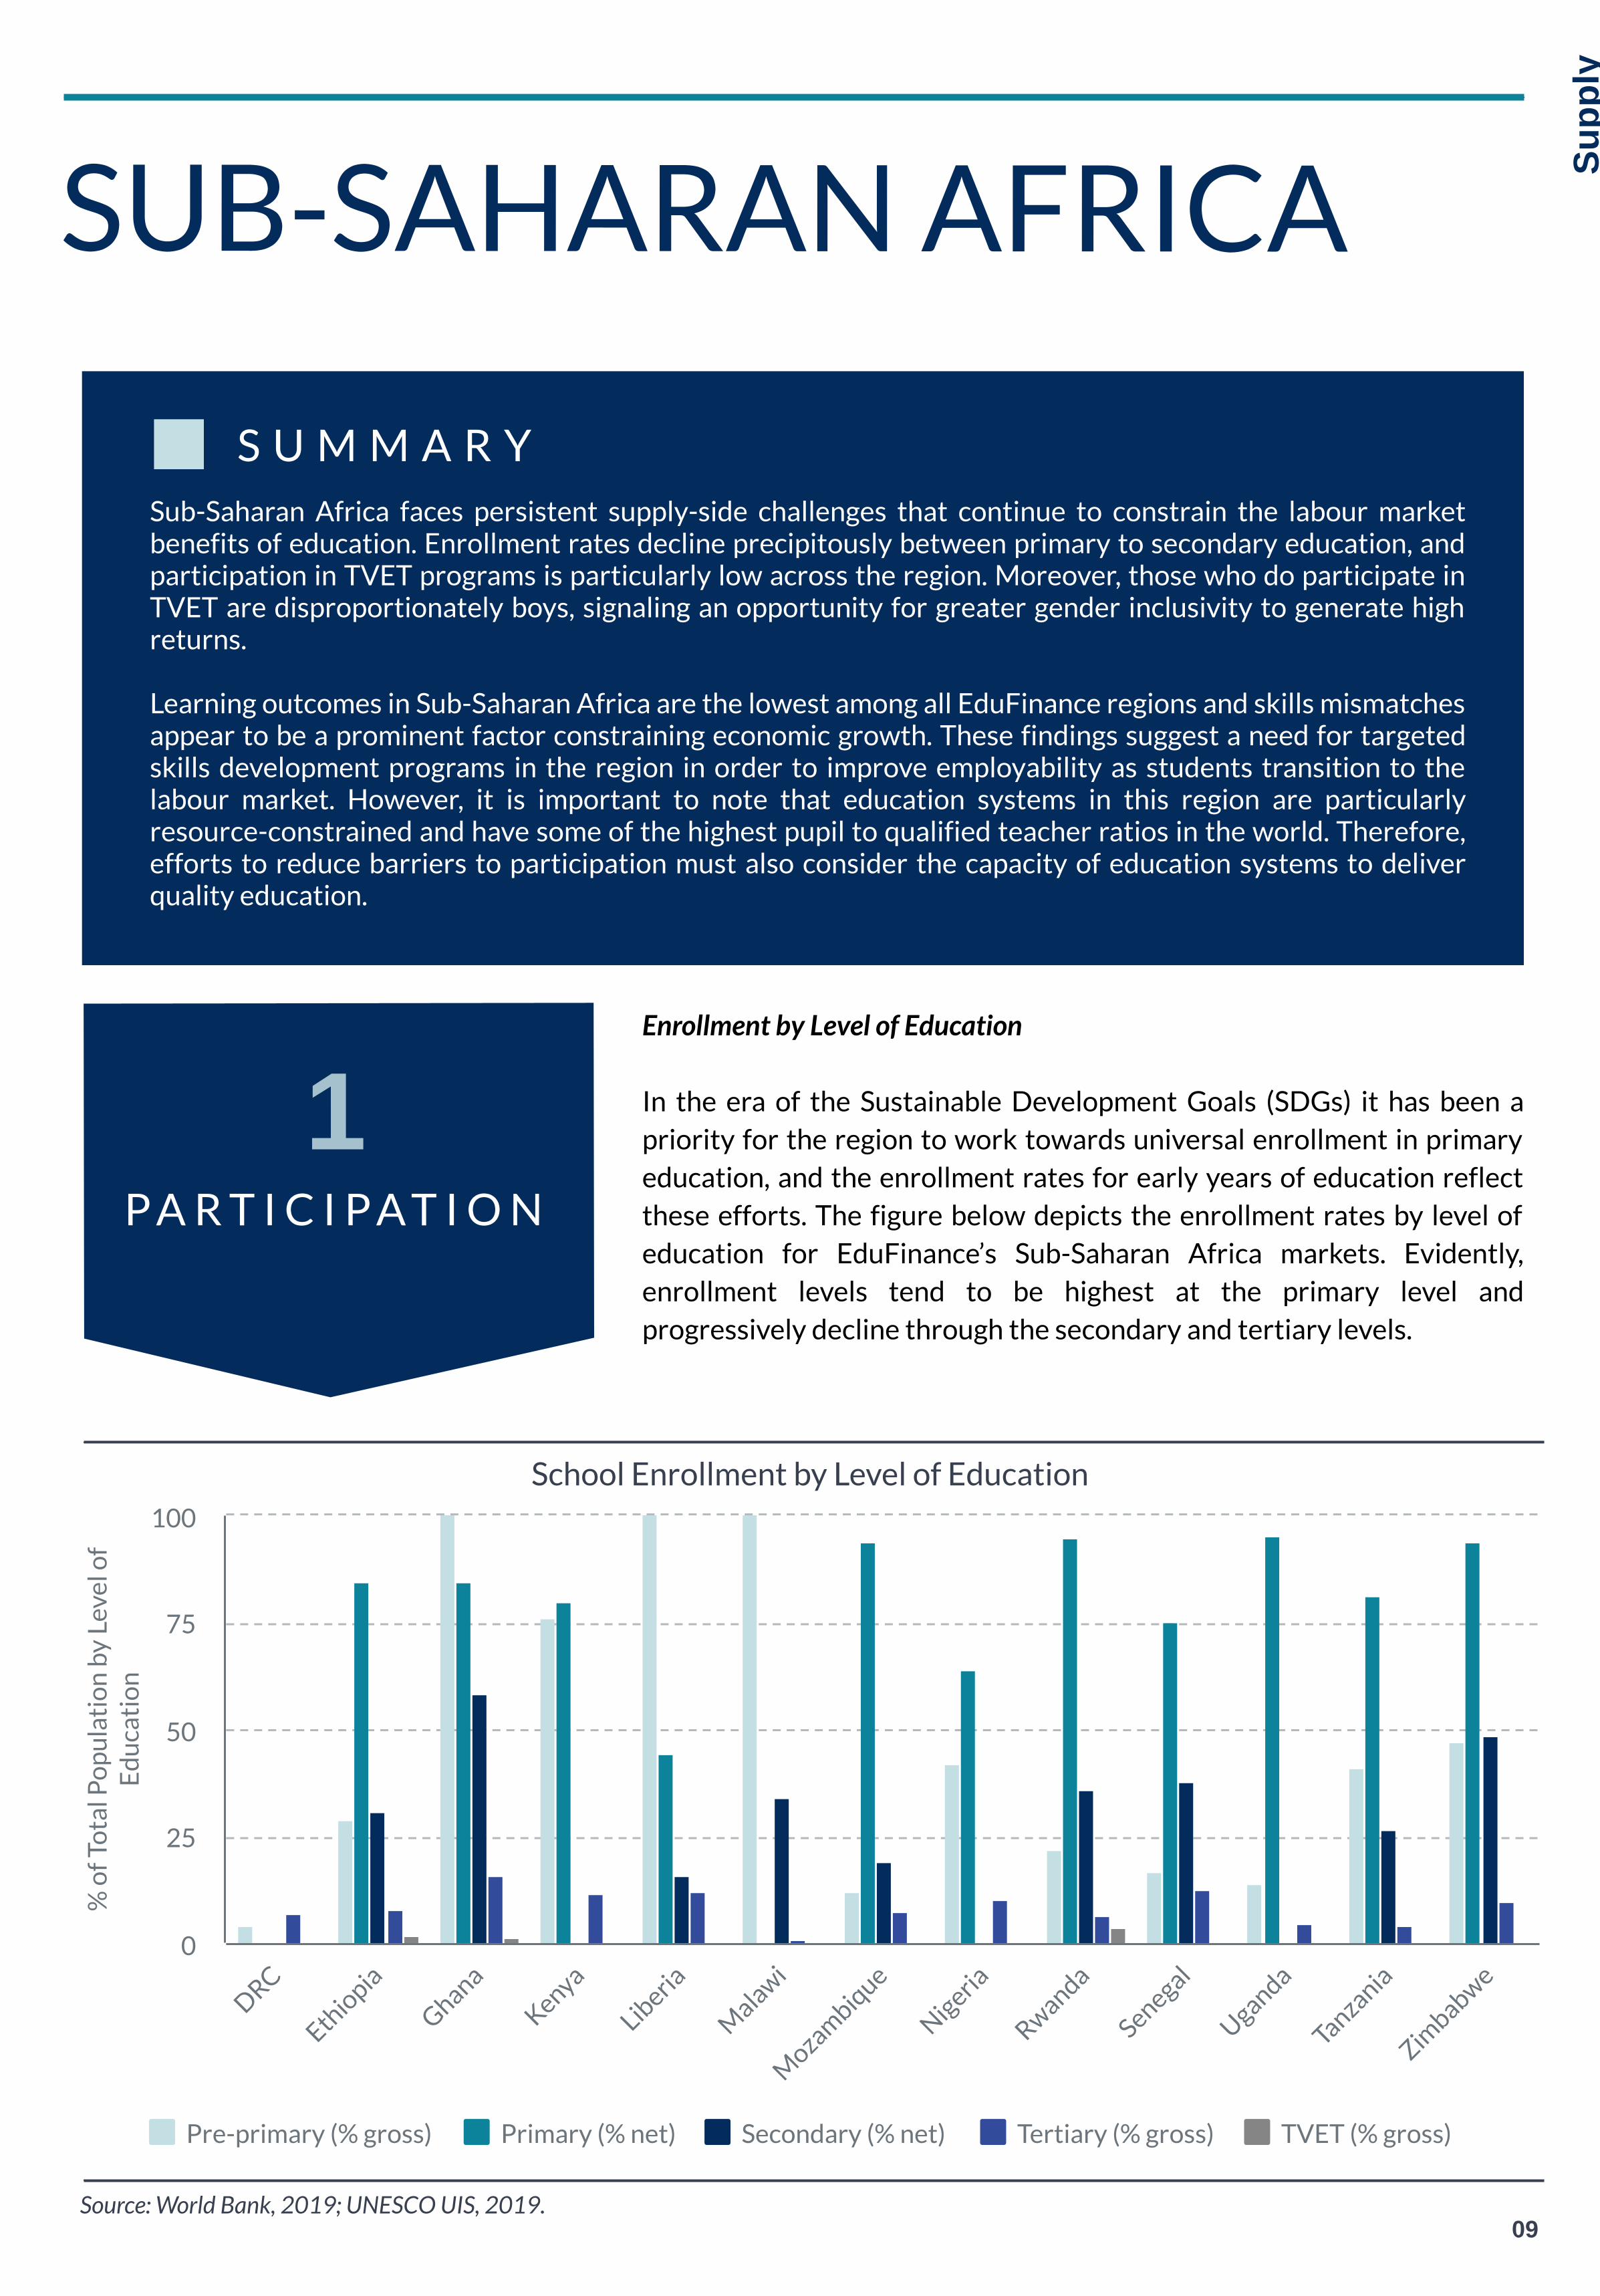
Sub-Saharan Africa faces persistent supply-side challenges that continue to constrain the labour marketbenefits of education. Enrollment rates decline precipitously between primary to secondary education, andparticipation in TVET programs is particularly low across the region. Moreover, those who do participate inTVET are disproportionately boys, signaling an opportunity for greater gender inclusivity to generate highreturns.
Learning outcomes in Sub-Saharan Africa are the lowest among all EduFinance regions and skills mismatchesappear to be a prominent factor constraining economic growth. These findings suggest a need for targetedskills development programs in the region in order to improve employability as students transition to thelabour market. However, it is important to note that education systems in this region are particularlyresource-constrained and have some of the highest pupil to qualified teacher ratios in the world. Therefore,efforts to reduce barriers to participation must also consider the capacity of education systems to deliverquality education.
S U M M A R Y
Supp
ly
SUB-SAHARAN AFRICA
Enrollment by Level of Education
In the era of the Sustainable Development Goals (SDGs) it has been apriority for the region to work towards universal enrollment in primaryeducation, and the enrollment rates for early years of education reflectthese efforts. The figure below depicts the enrollment rates by level ofeducation for EduFinance’s Sub-Saharan Africa markets. Evidently,enrollment levels tend to be highest at the primary level andprogressively decline through the secondary and tertiary levels.
% o
f To
tal P
op
ula
tio
n b
y Le
vel o
fE
du
cati
on
Pre-primary (% gross) Primary (% net) Secondary (% net) Tertiary (% gross) TVET (% gross)
DRC
Ethio
pia
Ghana
Kenya
Liberia
Malawi
Mozam
bique
Nigeria
Rwanda
Senegal
Uganda
Tanzania
Zimbabwe
0
25
50
75
100
P A R T I C I P A T I O N
1
School Enrollment by Level of Education
Source: World Bank, 2019; UNESCO UIS, 2019.
10
Supp
ly
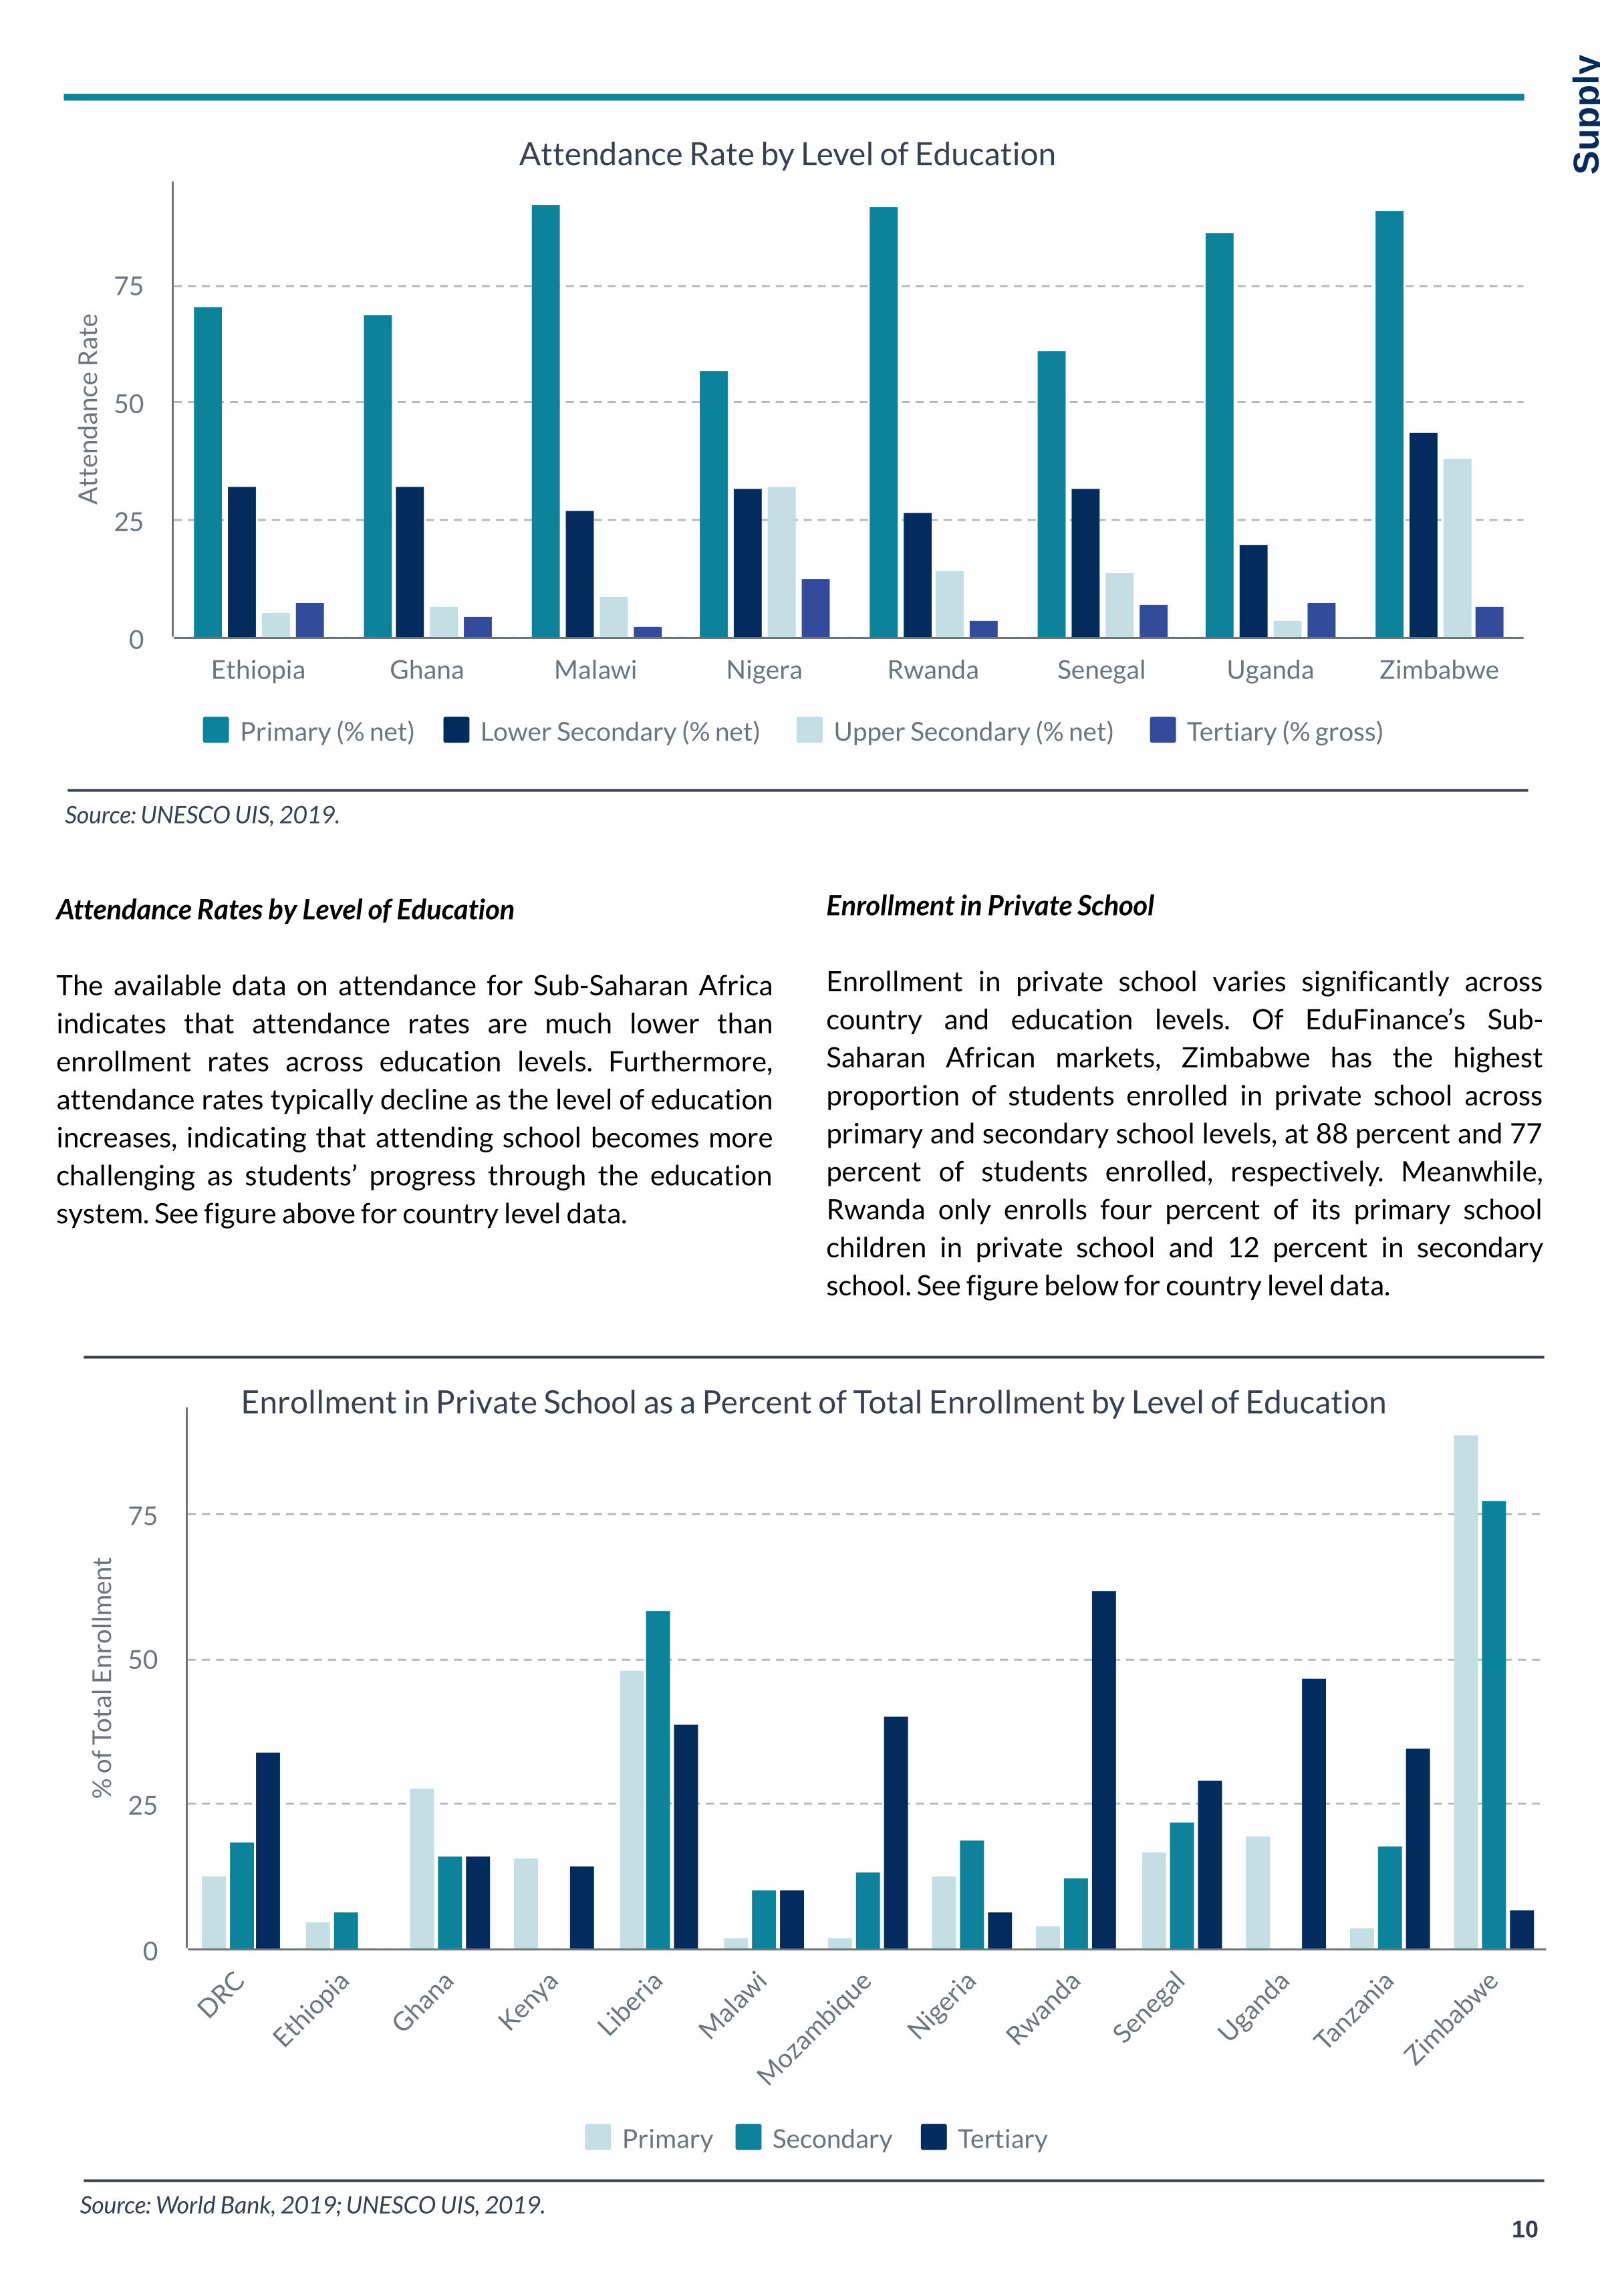
Attendance Rates by Level of Education
The available data on attendance for Sub-Saharan Africa
indicates that attendance rates are much lower than
enrollment rates across education levels. Furthermore,
attendance rates typically decline as the level of education
increases, indicating that attending school becomes more
challenging as students’ progress through the education
system. See figure above for country level data.
Attendance Rate by Level of Education
Source: UNESCO UIS, 2019.
Enrollment in Private School
Enrollment in private school varies significantly across
country and education levels. Of EduFinance’s Sub-
Saharan African markets, Zimbabwe has the highest
proportion of students enrolled in private school across
primary and secondary school levels, at 88 percent and 77
percent of students enrolled, respectively. Meanwhile,
Rwanda only enrolls four percent of its primary school
children in private school and 12 percent in secondary
school. See figure below for country level data.
Atte
nd
an
ce
Ra
te
Primary (% net) Lower Secondary (% net) Upper Secondary (% net) Tertiary (% gross)
Ethiopia Ghana Malawi Nigera Rwanda Senegal Uganda Zimbabwe
0
25
50
75
% o
f T
ota
l E
nr
oll
me
nt
Primary Secondary Tertiary
DR
C
Eth
iop
ia
Gh
ana
Kenya
Lib
eri
a
Mala
wi
Mo
zamb
iqu
e
Nig
eri
a
Rw
and
a
Sen
egal
Ugan
da
Tanzan
ia
Zim
bab
we
0
25
50
75
Enrollment in Private School as a Percent of Total Enrollment by Level of Education
Source: World Bank, 2019; UNESCO UIS, 2019.
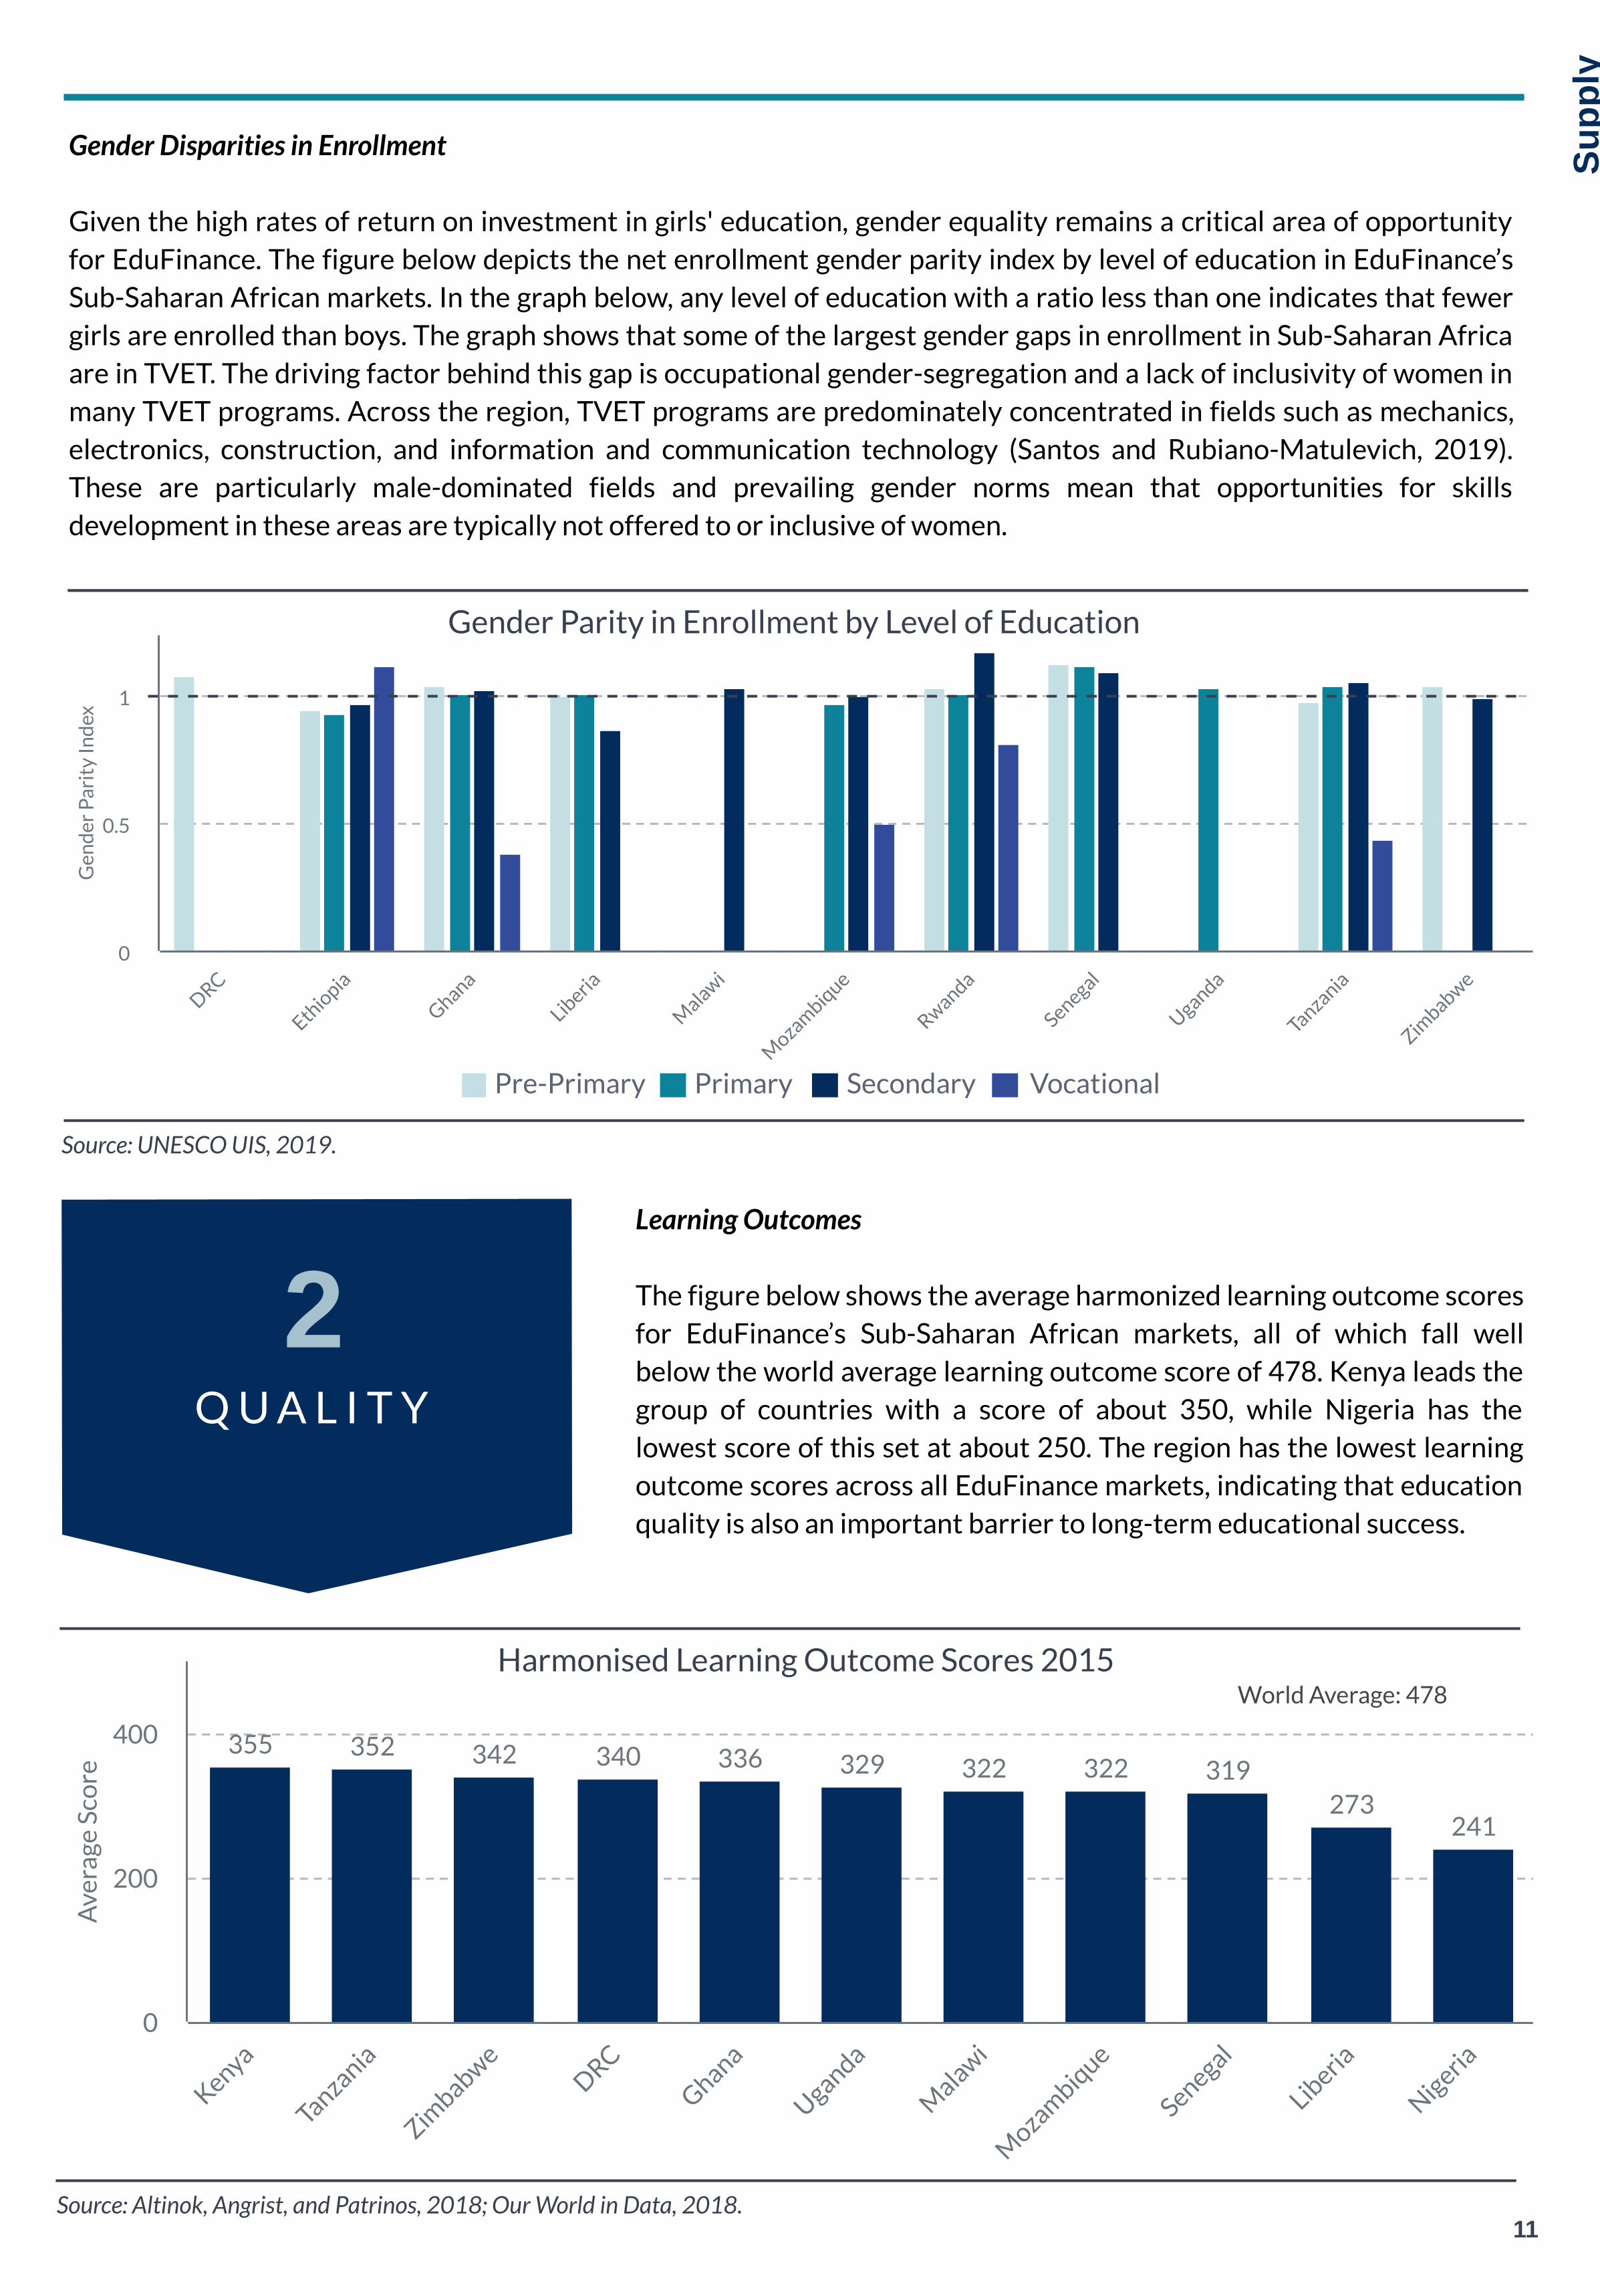
Gender Disparities in Enrollment
Given the high rates of return on investment in girls' education, gender equality remains a critical area of opportunityfor EduFinance. The figure below depicts the net enrollment gender parity index by level of education in EduFinance’sSub-Saharan African markets. In the graph below, any level of education with a ratio less than one indicates that fewergirls are enrolled than boys. The graph shows that some of the largest gender gaps in enrollment in Sub-Saharan Africaare in TVET. The driving factor behind this gap is occupational gender-segregation and a lack of inclusivity of women inmany TVET programs. Across the region, TVET programs are predominately concentrated in fields such as mechanics,electronics, construction, and information and communication technology (Santos and Rubiano-Matulevich, 2019).These are particularly male-dominated fields and prevailing gender norms mean that opportunities for skillsdevelopment in these areas are typically not offered to or inclusive of women.
Ave
rage
Sco
re
355 352 342 340 336 329 322 322 319273
241
Kenya
Tanzania
Zimbabwe
DRC
Ghana
Uganda
Malawi
Mozam
bique
Senegal
Liberia
Nigeria0
200
400
11
Supp
ly
Learning Outcomes
The figure below shows the average harmonized learning outcome scoresfor EduFinance’s Sub-Saharan African markets, all of which fall wellbelow the world average learning outcome score of 478. Kenya leads thegroup of countries with a score of about 350, while Nigeria has thelowest score of this set at about 250. The region has the lowest learningoutcome scores across all EduFinance markets, indicating that educationquality is also an important barrier to long-term educational success.
Q U A L I T Y
2
Gen
der
Par
ity
Ind
ex
DRC
Ethio
pia
Ghana
Liberia
Malawi
Mozam
bique
Rwanda
Senegal
Uganda
Tanzania
Zimbabwe
0
0.5
1
Gender Parity in Enrollment by Level of Education
Source: UNESCO UIS, 2019.
Source: Altinok, Angrist, and Patrinos, 2018; Our World in Data, 2018.
Pre-Primary Primary Secondary Vocational
Harmonised Learning Outcome Scores 2015World Average: 478

Labour Force Skills and Skills Matching
Studies examining the match between educational attainment and labour market outcomes in Sub-Saharan Africa
reveal that 56.9 percent of workers in the region have more education than required for their job, suggesting
widespread under-utilization of human capital (Morsy and Mukasa, 2019). Moreover, surveys conducted by the
International Labour Organization (ILO) reveal that almost 50 percent of young workers in Sub-Saharan Africa feel as
though their skills are inconsistent with the needs of their jobs. Approximately 17.5 percent of young workers claim to
be over-skilled for their current jobs, while 28.9 percent are under-skilled and lack access to the necessary on-the-job
training (ILO, 2019). These findings illustrate that skills mismatches are extremely prevalent across the region and
indicate a disconnect between education and employment outcomes.
In Kenya, the results of the 2016-2017 World Bank STEP employer survey found that while almost 80 percent of
workers with only primary education believed they were underqualified for their job, approximately 40 percent of
workers with secondary education identified as being overqualified. This disparity particularly reveals the disconnect
between secondary education and employment, suggesting that curriculum in secondary education may be misaligned
with the realities of the job market.
12
Supp
ly
Human Resources
The figure below shows the pupil to qualified teacher ratio by level of
education for EduFinance markets in Sub-Saharan Africa. Each ratio
depicted in the graph can be compared to the relevant global average for
each level of education, noted below. All EduFinance markets in the
region perform worse than the global average at every level of education.
In the most extreme case, Tanzania has a ratio of 218 pre-primary
students for every one qualified teacher. Although the literature does not
identify a specific recommended pupil to teacher ratio for each level of
education, there is a broad consensus that these ratios should be lower in
C A P A C I T Y
3
Pupil to Qualified Teacher Ratio by Level of Education
Source: UNESCO UIS, 2019.
earlier years of education, where children can derive the greatest benefits from individualized instruction. The results
shown below point to significant stresses on human resources within many EduFinance Markets in the region,
indicating a low capacity to accommodate any increase in demand for education without negatively impacting
education quality.
Nu
mb
er
of
Stu
de
nts
pe
r Q
ua
li�
ed
Te
ac
he
r
Pre-Primary Primary Secondary
DR
C
Gh
ana
Kenya
Lib
eri
a
Mala
wi
Mo
zamb
iqu
e
Nig
eri
a
Rw
and
a
Sen
egal
Ugan
da
Tanzan
ia
Zim
bab
we
0
25
50
75
Pre-Primary World Average: 25.73 | Primary World Average: 22.6 | Secondary World Average: 18.2
128 218 149
13
Supp
ly
SOUTH & SOUTHEAST ASIA
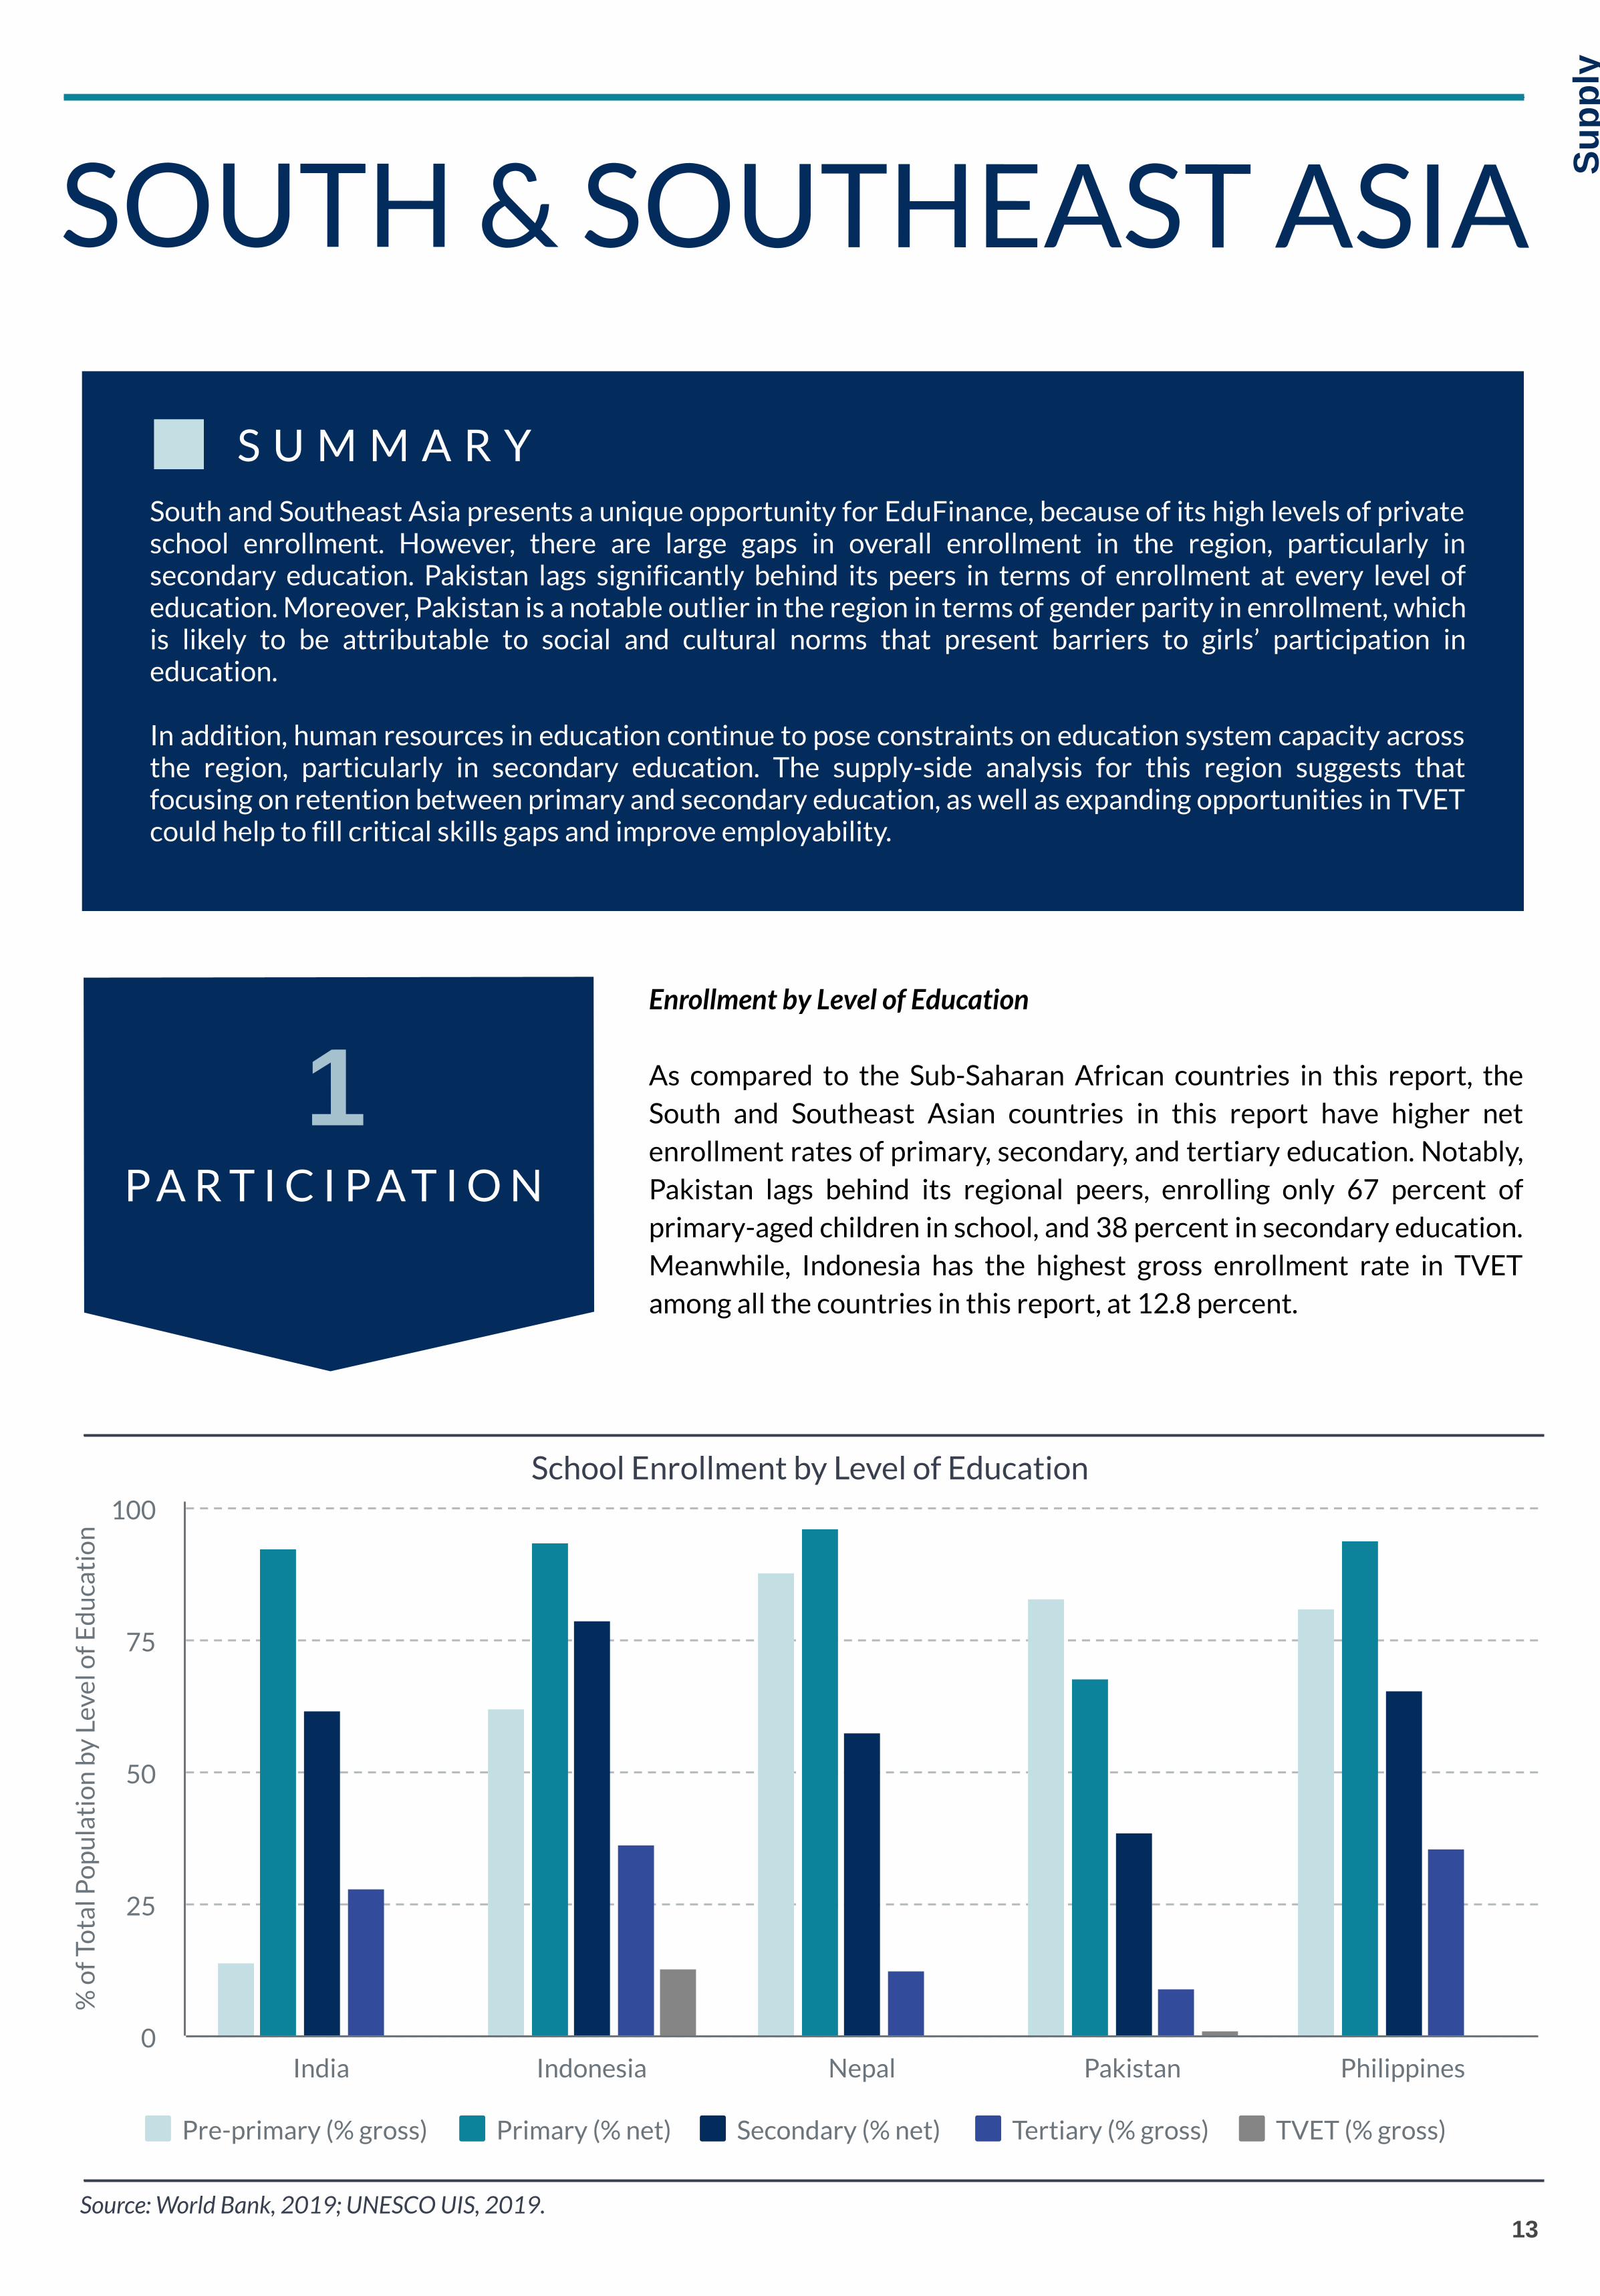
South and Southeast Asia presents a unique opportunity for EduFinance, because of its high levels of privateschool enrollment. However, there are large gaps in overall enrollment in the region, particularly insecondary education. Pakistan lags significantly behind its peers in terms of enrollment at every level ofeducation. Moreover, Pakistan is a notable outlier in the region in terms of gender parity in enrollment, whichis likely to be attributable to social and cultural norms that present barriers to girls’ participation ineducation.
In addition, human resources in education continue to pose constraints on education system capacity acrossthe region, particularly in secondary education. The supply-side analysis for this region suggests thatfocusing on retention between primary and secondary education, as well as expanding opportunities in TVETcould help to fill critical skills gaps and improve employability.
S U M M A R Y
Enrollment by Level of Education
As compared to the Sub-Saharan African countries in this report, theSouth and Southeast Asian countries in this report have higher netenrollment rates of primary, secondary, and tertiary education. Notably,Pakistan lags behind its regional peers, enrolling only 67 percent ofprimary-aged children in school, and 38 percent in secondary education.Meanwhile, Indonesia has the highest gross enrollment rate in TVETamong all the countries in this report, at 12.8 percent.
P A R T I C I P A T I O N
1
School Enrollment by Level of Education
Source: World Bank, 2019; UNESCO UIS, 2019.
% o
f To
tal P
op
ula
tio
n b
y Le
vel o
f Ed
uca
tio
n
Pre-primary (% gross) Primary (% net) Secondary (% net) Tertiary (% gross) TVET (% gross)
India Indonesia Nepal Pakistan Philippines0
25
50
75
100
Att
end
ance
Rat
e
Primary (% net) Lower Secondary (% net)
Upper Secondary (% net) Tertiary (% gross)
India Indonesia Nepal Pakistan Philippines0
25
50
75
Attendance Rate by Level of Education
Source: UNESCO Institute for Statistics, 2019.
Enrollment in Private School as a Percent of TotalEnrollment by Level of Education
% o
f To
tal E
nro
llmen
t
Primary Secondary Tertiary
India Indonesia Nepal Pakistan Philippines0
25
50
Source: World Bank, 2019.
Gender Parity in Enrollment by Level of Education
14
Supp
ly
Attendance Rates by Level of Education
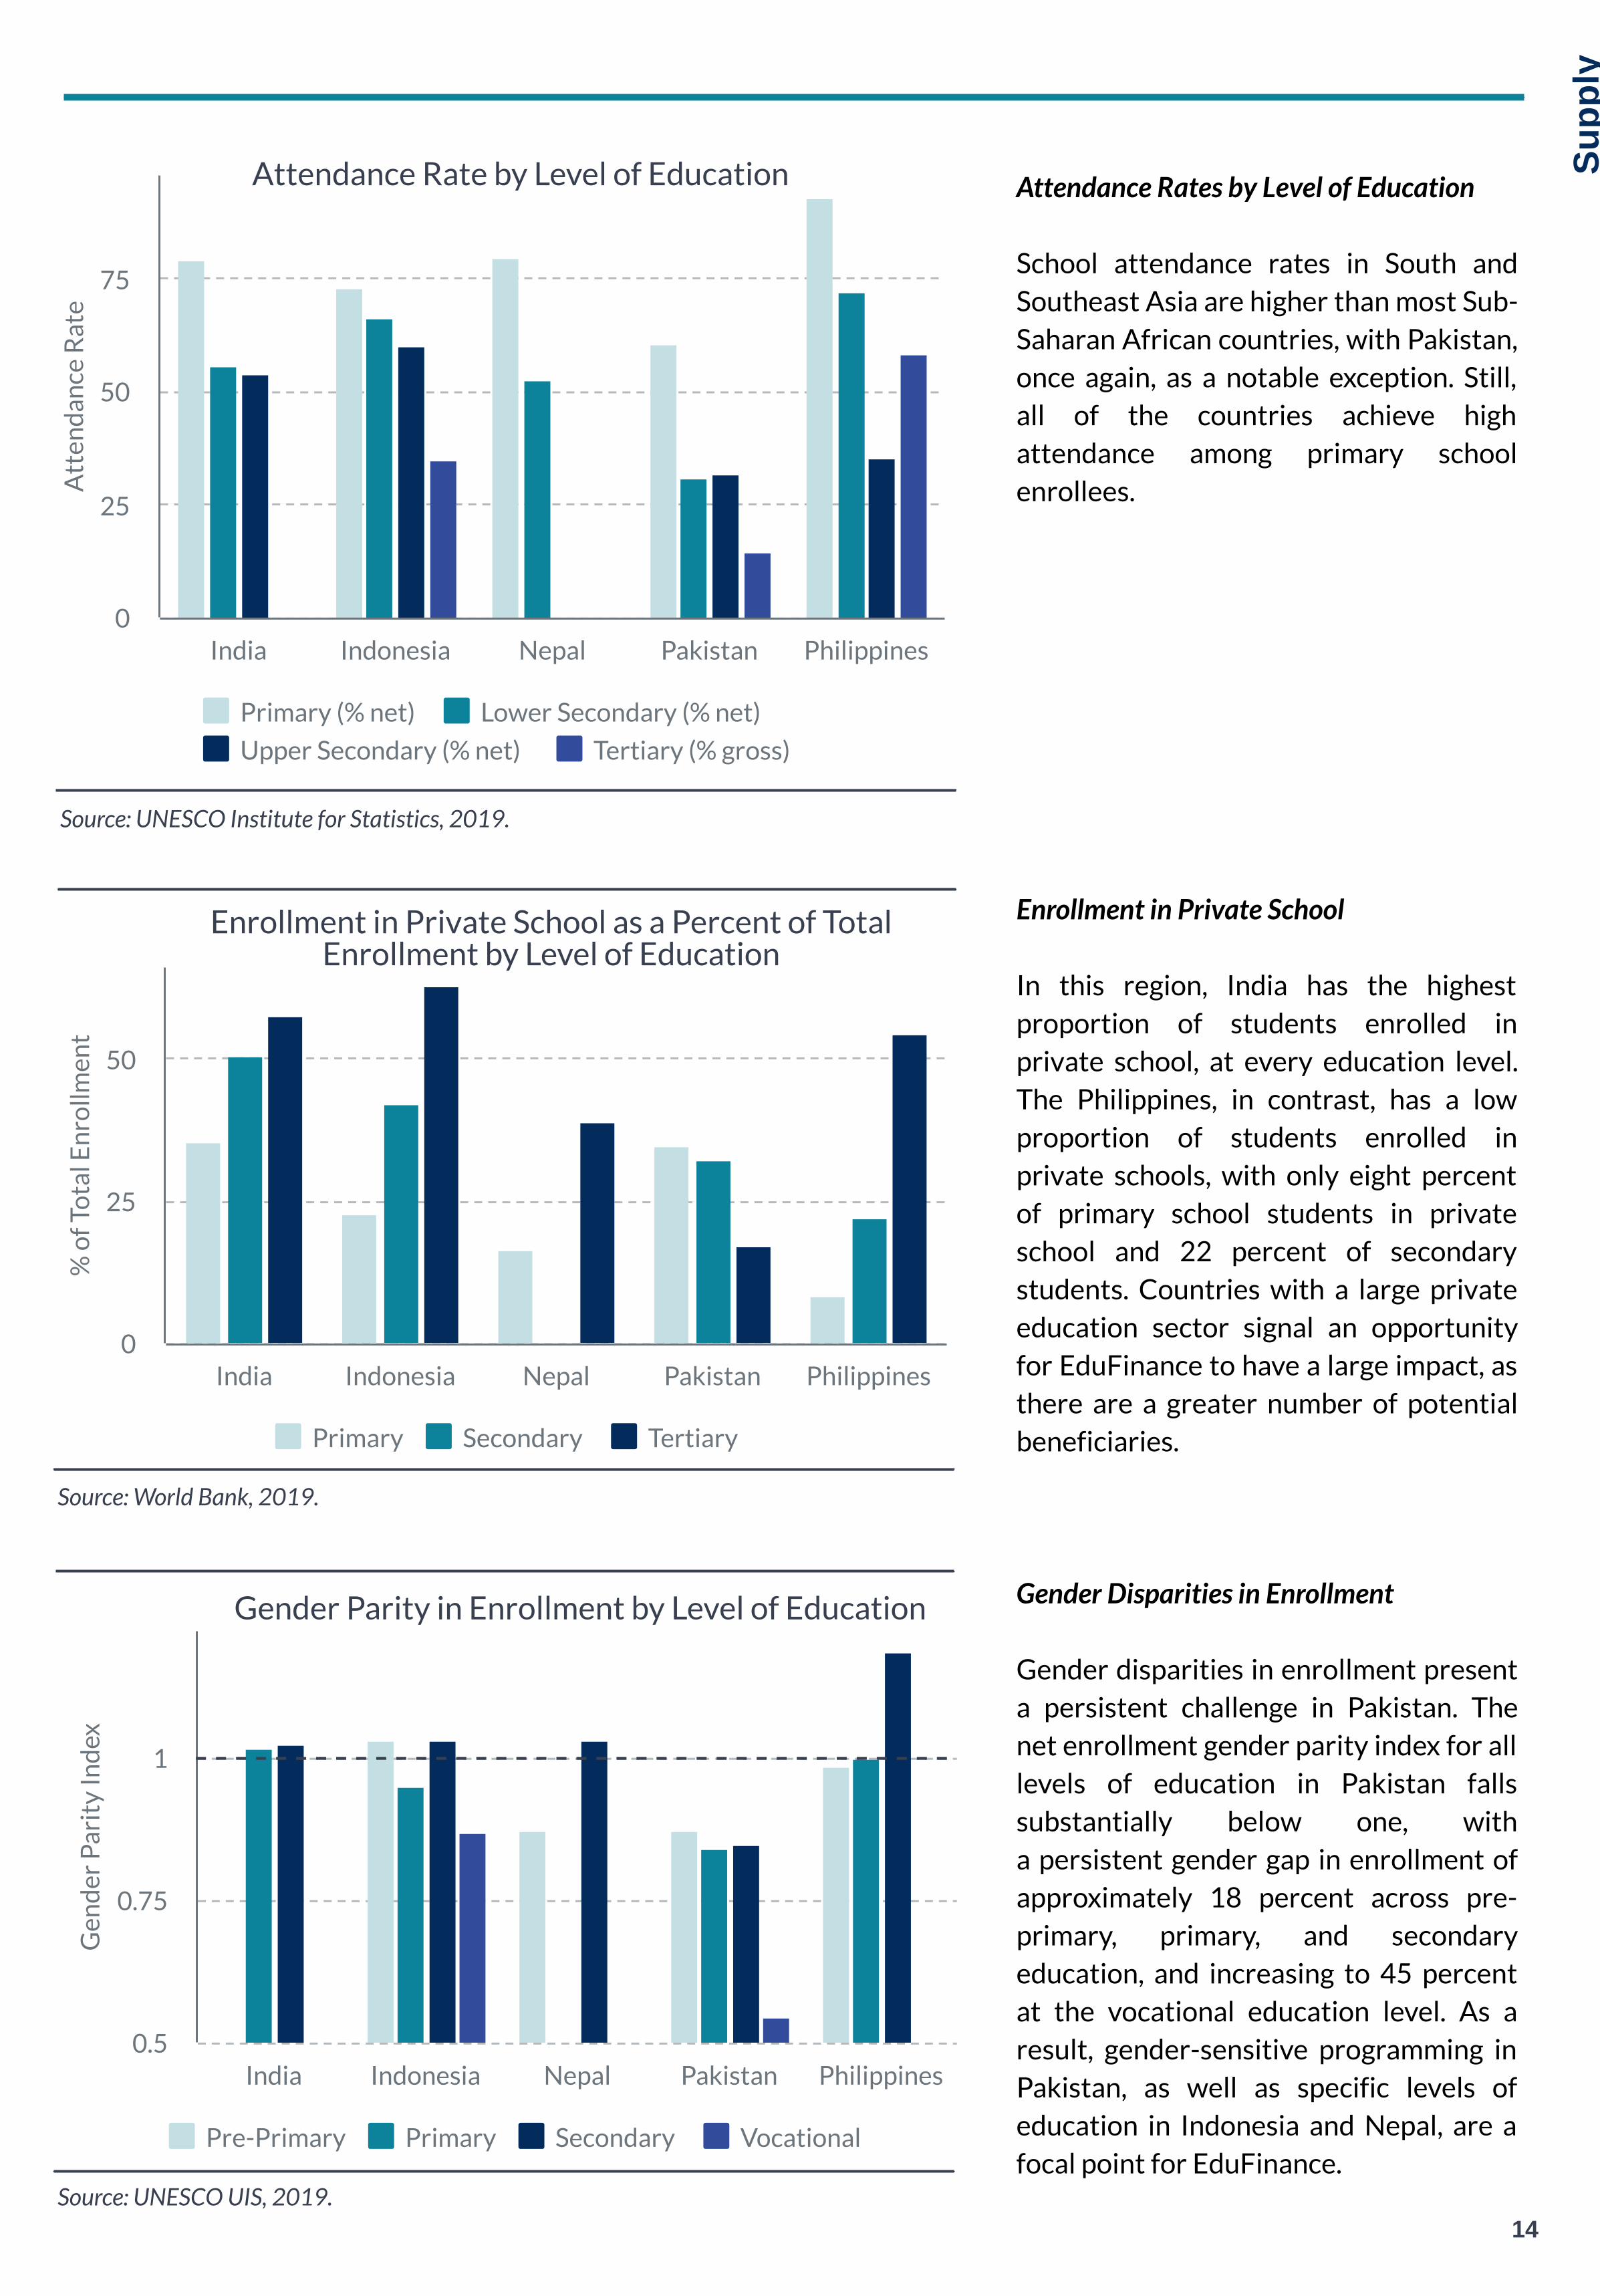
School attendance rates in South andSoutheast Asia are higher than most Sub-Saharan African countries, with Pakistan,once again, as a notable exception. Still,all of the countries achieve highattendance among primary schoolenrollees.
Enrollment in Private School
In this region, India has the highestproportion of students enrolled inprivate school, at every education level.The Philippines, in contrast, has a lowproportion of students enrolled inprivate schools, with only eight percentof primary school students in privateschool and 22 percent of secondarystudents. Countries with a large privateeducation sector signal an opportunityfor EduFinance to have a large impact, asthere are a greater number of potentialbeneficiaries.
Gender Disparities in Enrollment
Gender disparities in enrollment presenta persistent challenge in Pakistan. Thenet enrollment gender parity index for alllevels of education in Pakistan fallssubstantially below one, witha persistent gender gap in enrollment ofapproximately 18 percent across pre-primary, primary, and secondaryeducation, and increasing to 45 percentat the vocational education level. As aresult, gender-sensitive programming inPakistan, as well as specific levels ofeducation in Indonesia and Nepal, are afocal point for EduFinance.
Source: UNESCO UIS, 2019.
Gen
der
Par
ity
Ind
ex
Pre-Primary Primary Secondary Vocational
India Indonesia Nepal Pakistan Philippines0.5
0.75
1

Ave
rage
Sco
re
396378 367 367
189
Indonesia India Pakistan Philippines Nepal0
100
200
300
400
500
15
Supp
ly
Learning Outcomes
The figure to the top right shows theaverage harmonized learning outcomescores for EduFinance’s markets in Southand Southeast Asia. EduFinance’s Southand Southeast Asian markets performbetter than those in Sub-Saharan Africawith respect to learning outcome scores,but still fall below the 2015 World Averageof 478. Nepal in particular has a very lowaverage harmonized learning outcomescore of approximately 190. Scores thatfall substantially behind the global averagemay indicate weaknesses in the quality ofeducation systems and are a likelyindication of persistent poor literacy andnumeracy. These basic cognitive skills are afoundational component of education andemployability, and should remain a priorityfor EduFinance.
Q U A L I T Y
2
Source: Altinok, Angrist, and Patrinos, 2018; Our World in Data, 2018.
Source: ILO, 2016.
Education to Employment: Vertical Skills Matching
% V
erti
cal S
kills
Mat
chin
g
48 4845
34
Indonesia Pakistan Philippines India0
20
40
Harmonised Learning Outcome Scores 2015
Labour Force Skills and Skills Matching
Research from the International Labour Organization (ILO) indicates that skills mismatches are particularly prominentin South and Southeast Asia, and are further exacerbated by unequal access to skills training across gender, religious,and ethnic lines (ILO, 2017). Highlighting these findings, Matsumoto and Bhula-or (2016) estimate the degree ofvertical skills matching across South and Southeast Asia. Vertical skills matching refers to the degree to which workers’educational attainment matches the requirements for their job. Higher vertical skills matching ratios are a positiveindication of an efficient relationship between education systems and labour markets. The figure above presentsestimates of the ratio of vertical skills matching for EduFinance markets in the South and Southeast Asian markets. Asdepicted above, more than 50 percent of workers in every EduFinance market in the region have a level of educationalattainment that is inconsistent with the requirements of their job.
World Average: 478

Nu
mb
er
of
Stu
de
nts
pe
r Q
ua
li�
ed
Te
ac
he
r
Pre-Primary Primary Secondary
India Indonesia Nepal Philippines
0
10
20
30
40
16
Supp
ly
Human Resources
EduFinance markets in South and Southeast Asia fare much better than
Sub-Saharan Africa in terms of education system capacity. Indonesia
outperforms the world average ratios at every level of education, and
Nepal outperforms the world average ratios for pre-primary and
primary education. Across EduFinance markets in the region, India has
the highest pupil to qualified teacher ratio for primary education at
approximately 37 students per qualified teacher. However, EduFinance
markets in South and Southeast Asia appear to be particularly resource-
strained in secondary education. Across the countries depicted below,
only Indonesia outperforms the global average for secondary education,
while India, Nepal, and the Philippines have ratios that are significantly
higher than the global average for this level of education.
C A P A C I T Y
3
Pupil to Qualified Teacher Ratio by Level of Education
Source: UNESCO UIS, 2019.
Pre-Primary World Average: 25.73 | Primary World Average: 22.6 | Secondary World Average: 18.2
% o
f To
tal P
op
ula
tio
n b
y Le
vel o
f Ed
uca
tio
n
Pre-primary (% gross) Primary (% net) Secondary (% net) Tertiary (% gross) TVET (% gross)
Colombia Honduras Ecuador Dominican Republic Peru0
25
50
75
100
17
Supp
ly
LATIN AMERICA& THE CARIBBEAN
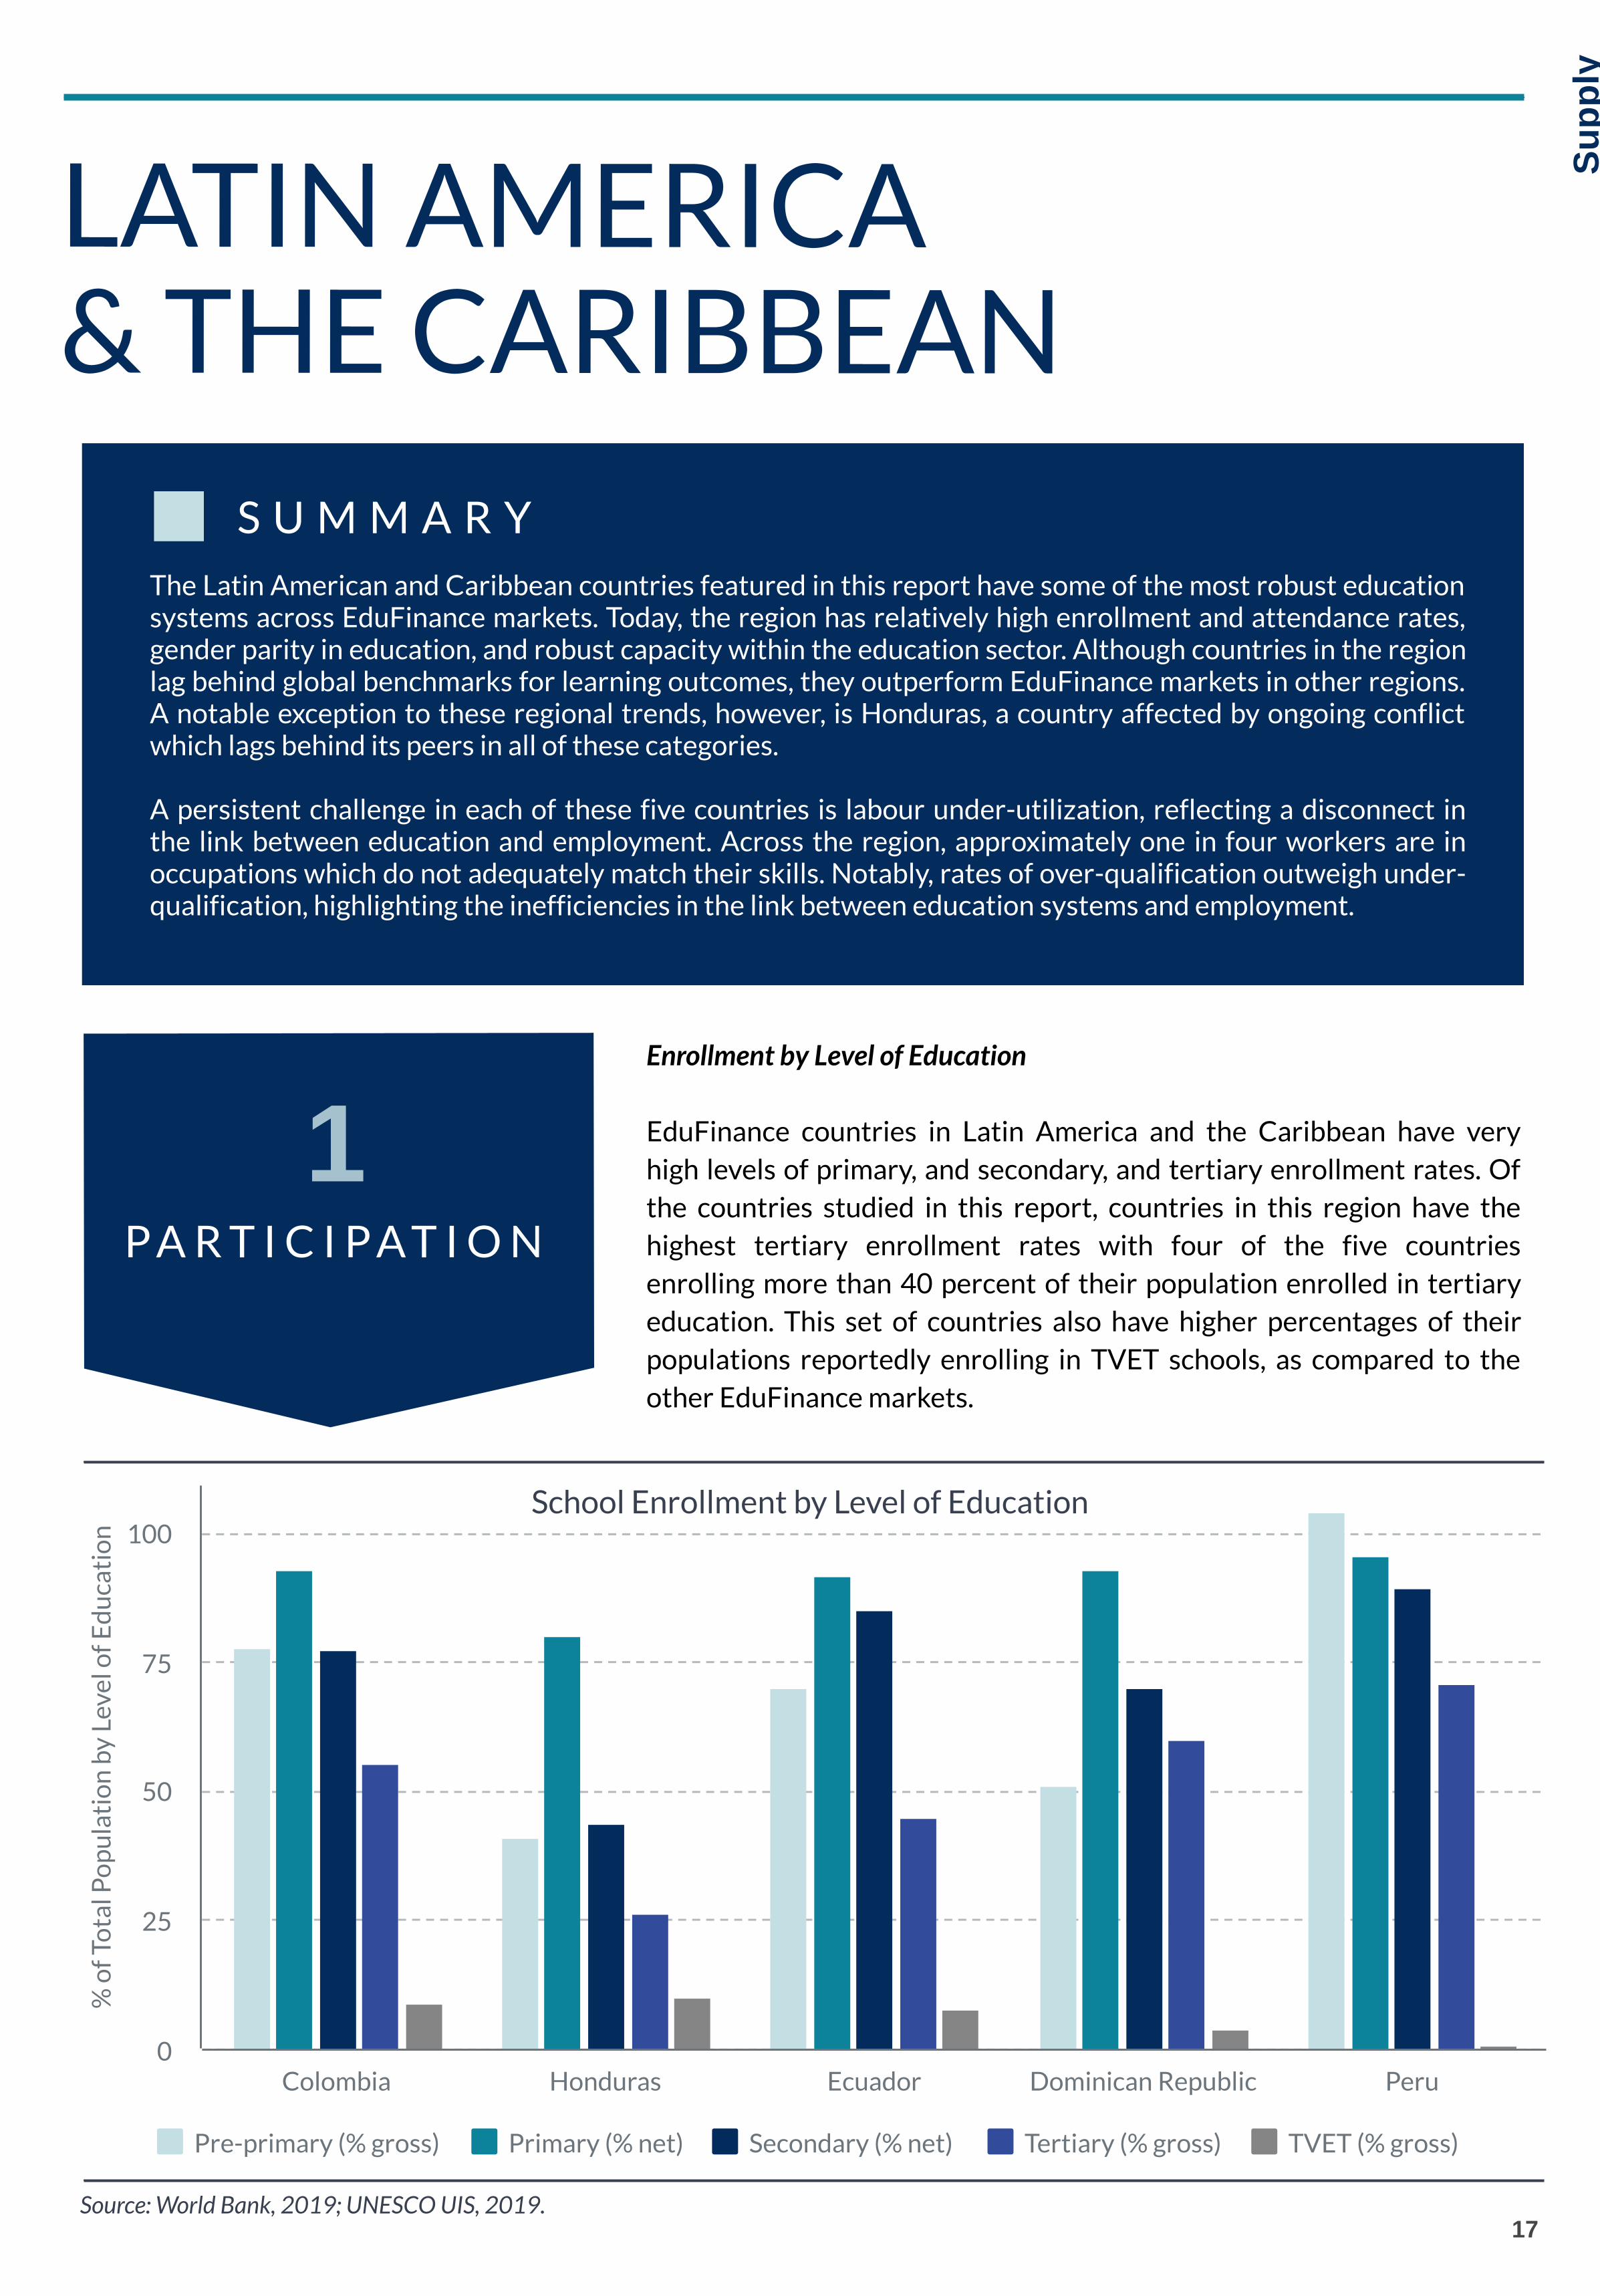
The Latin American and Caribbean countries featured in this report have some of the most robust educationsystems across EduFinance markets. Today, the region has relatively high enrollment and attendance rates,gender parity in education, and robust capacity within the education sector. Although countries in the regionlag behind global benchmarks for learning outcomes, they outperform EduFinance markets in other regions.A notable exception to these regional trends, however, is Honduras, a country affected by ongoing conflictwhich lags behind its peers in all of these categories.
A persistent challenge in each of these five countries is labour under-utilization, reflecting a disconnect inthe link between education and employment. Across the region, approximately one in four workers are inoccupations which do not adequately match their skills. Notably, rates of over-qualification outweigh under-qualification, highlighting the inefficiencies in the link between education systems and employment.
S U M M A R Y
P A R T I C I P A T I O N
1Enrollment by Level of Education
EduFinance countries in Latin America and the Caribbean have veryhigh levels of primary, and secondary, and tertiary enrollment rates. Ofthe countries studied in this report, countries in this region have thehighest tertiary enrollment rates with four of the five countriesenrolling more than 40 percent of their population enrolled in tertiaryeducation. This set of countries also have higher percentages of theirpopulations reportedly enrolling in TVET schools, as compared to theother EduFinance markets.
School Enrollment by Level of Education
Source: World Bank, 2019; UNESCO UIS, 2019.
18
Supp
ly
Attendance Rates by Level of Education
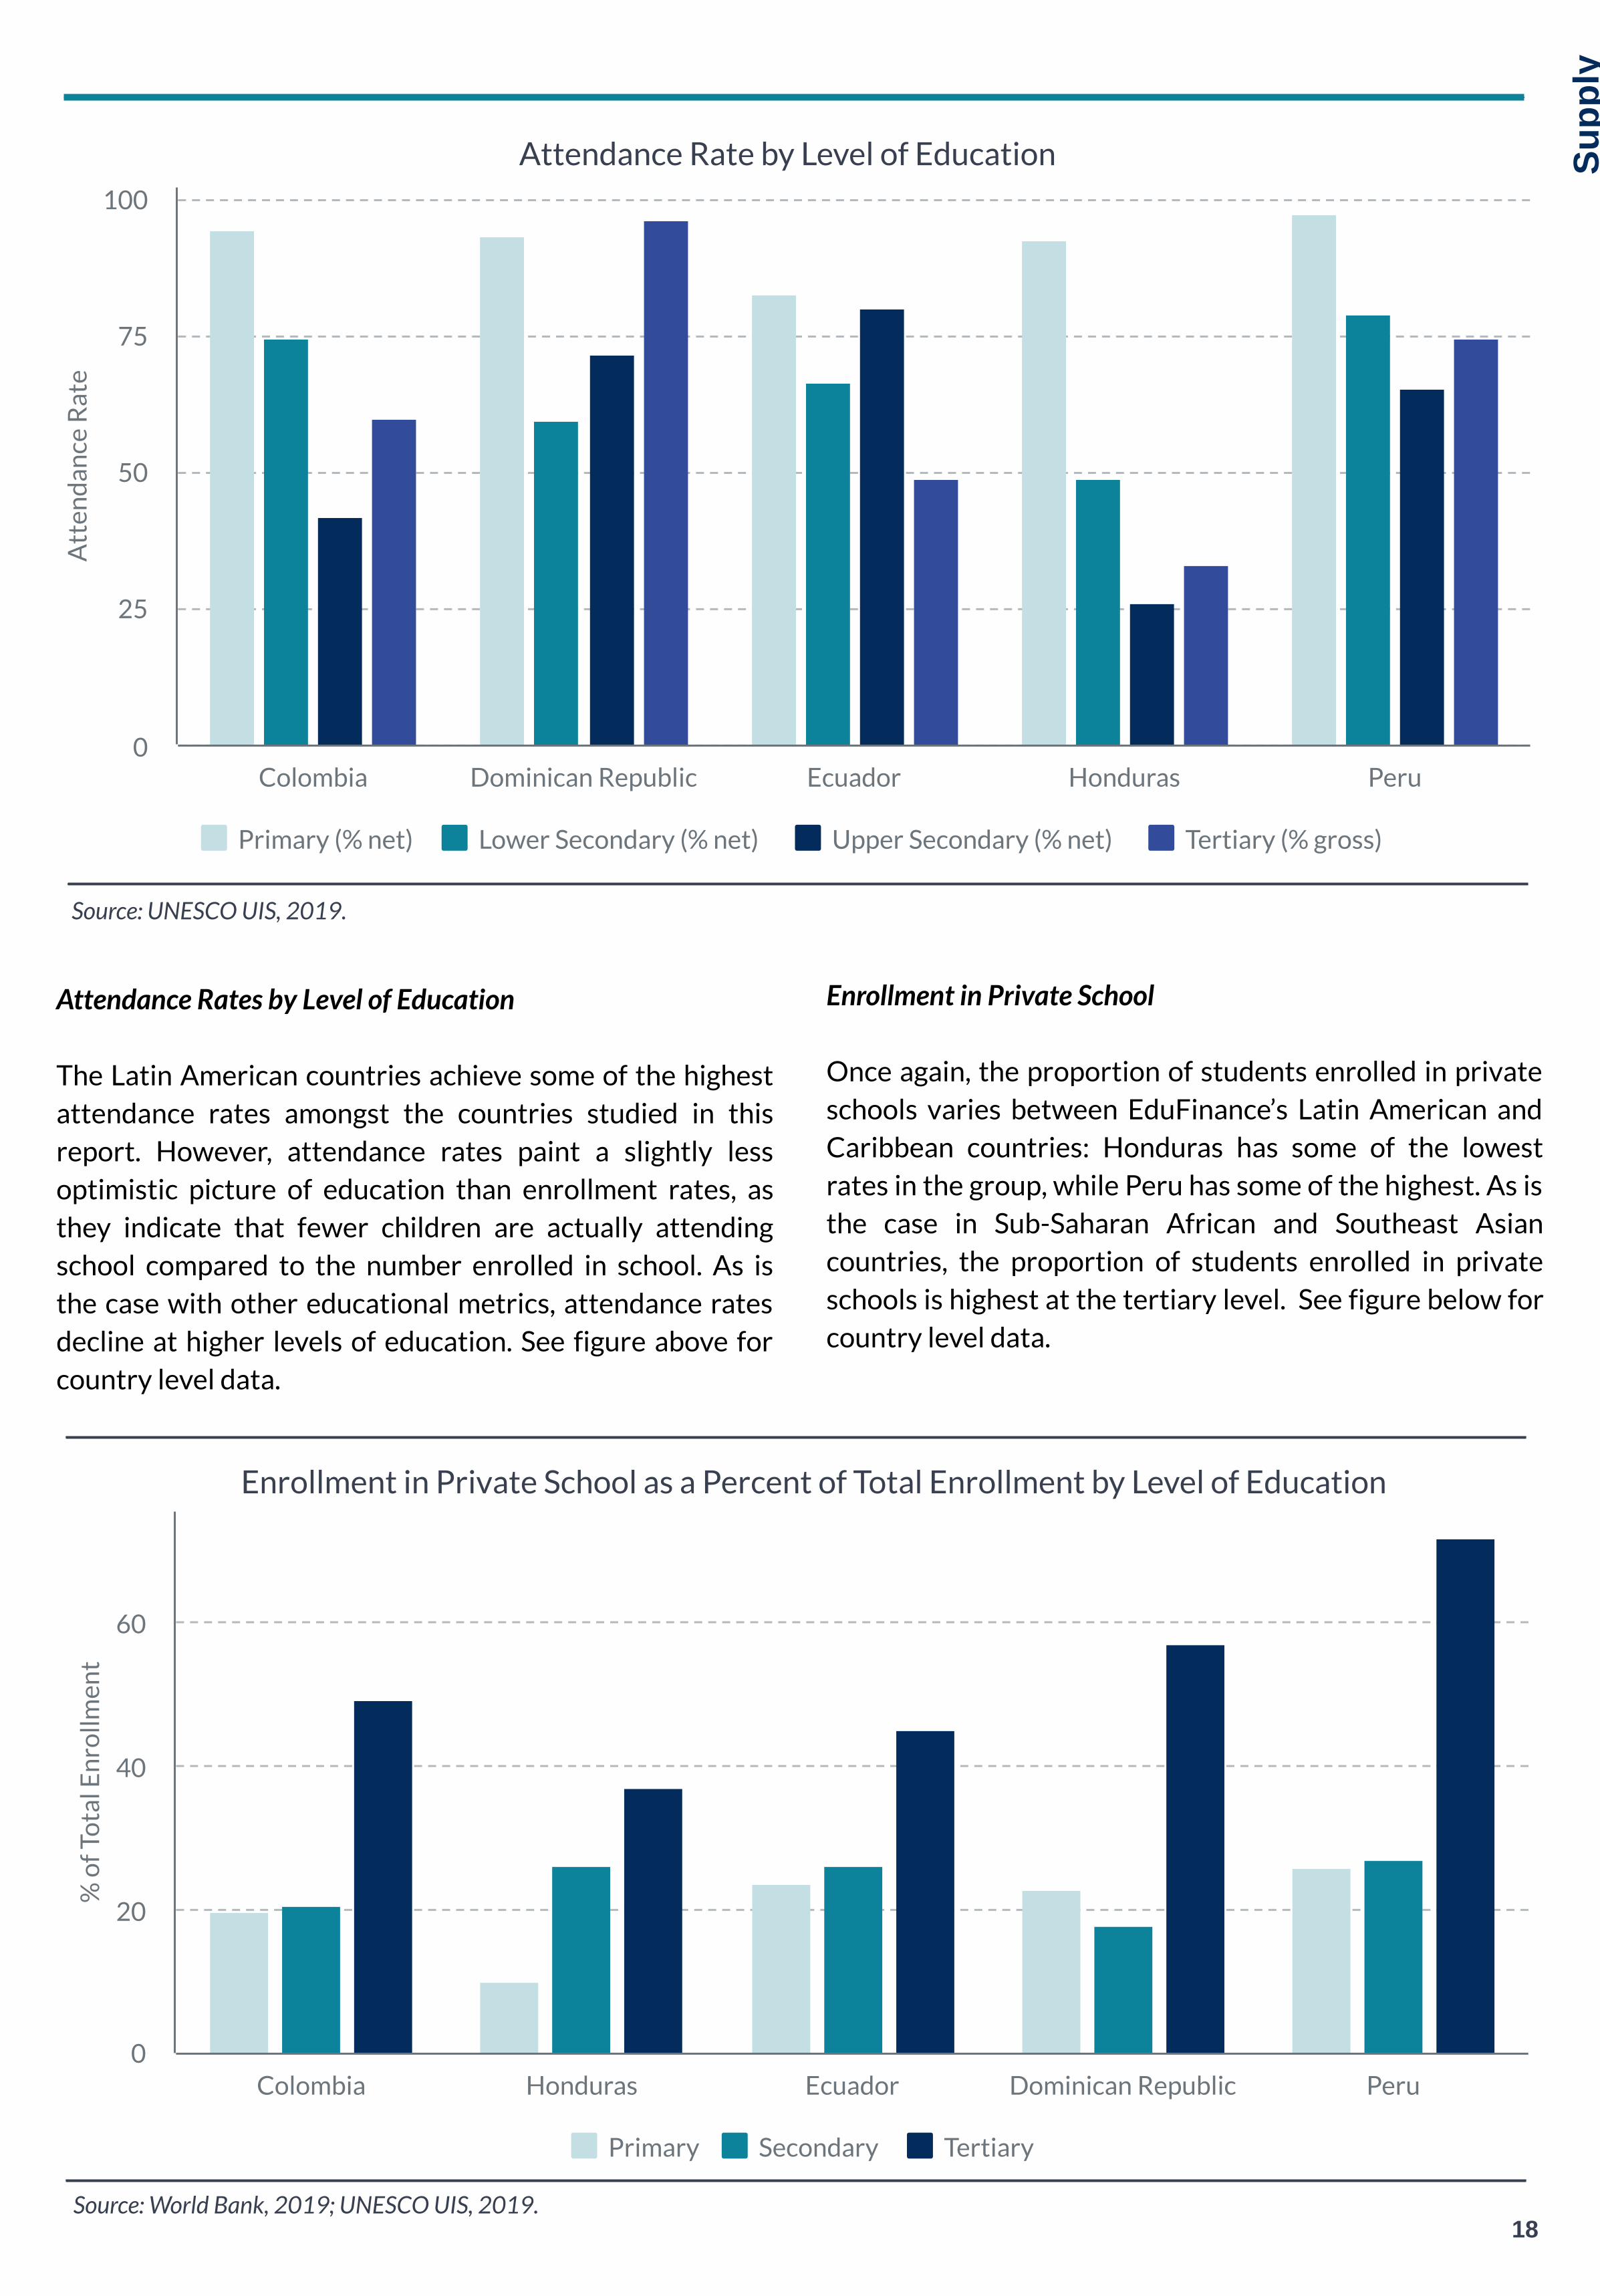
The Latin American countries achieve some of the highestattendance rates amongst the countries studied in thisreport. However, attendance rates paint a slightly lessoptimistic picture of education than enrollment rates, asthey indicate that fewer children are actually attendingschool compared to the number enrolled in school. As isthe case with other educational metrics, attendance ratesdecline at higher levels of education. See figure above forcountry level data.
Attendance Rate by Level of Education
Source: UNESCO UIS, 2019.
Enrollment in Private School
Once again, the proportion of students enrolled in privateschools varies between EduFinance’s Latin American andCaribbean countries: Honduras has some of the lowestrates in the group, while Peru has some of the highest. As isthe case in Sub-Saharan African and Southeast Asiancountries, the proportion of students enrolled in privateschools is highest at the tertiary level. See figure below forcountry level data.
Enrollment in Private School as a Percent of Total Enrollment by Level of Education
Source: World Bank, 2019; UNESCO UIS, 2019.
Att
end
ance
Rat
e
Primary (% net) Lower Secondary (% net) Upper Secondary (% net) Tertiary (% gross)
Colombia Dominican Republic Ecuador Honduras Peru0
25
50
75
100
% o
f To
tal E
nro
llmen
t
Primary Secondary Tertiary
Colombia Honduras Ecuador Dominican Republic Peru0
20
40
60
Ave
rage
Sco
re
419 414 413
363337
Peru
Ecuador
Colom
bia
Honduras
Domin
ican Rep.
0
100
200
300
400
500
19
Supp
ly
Learning Outcomes
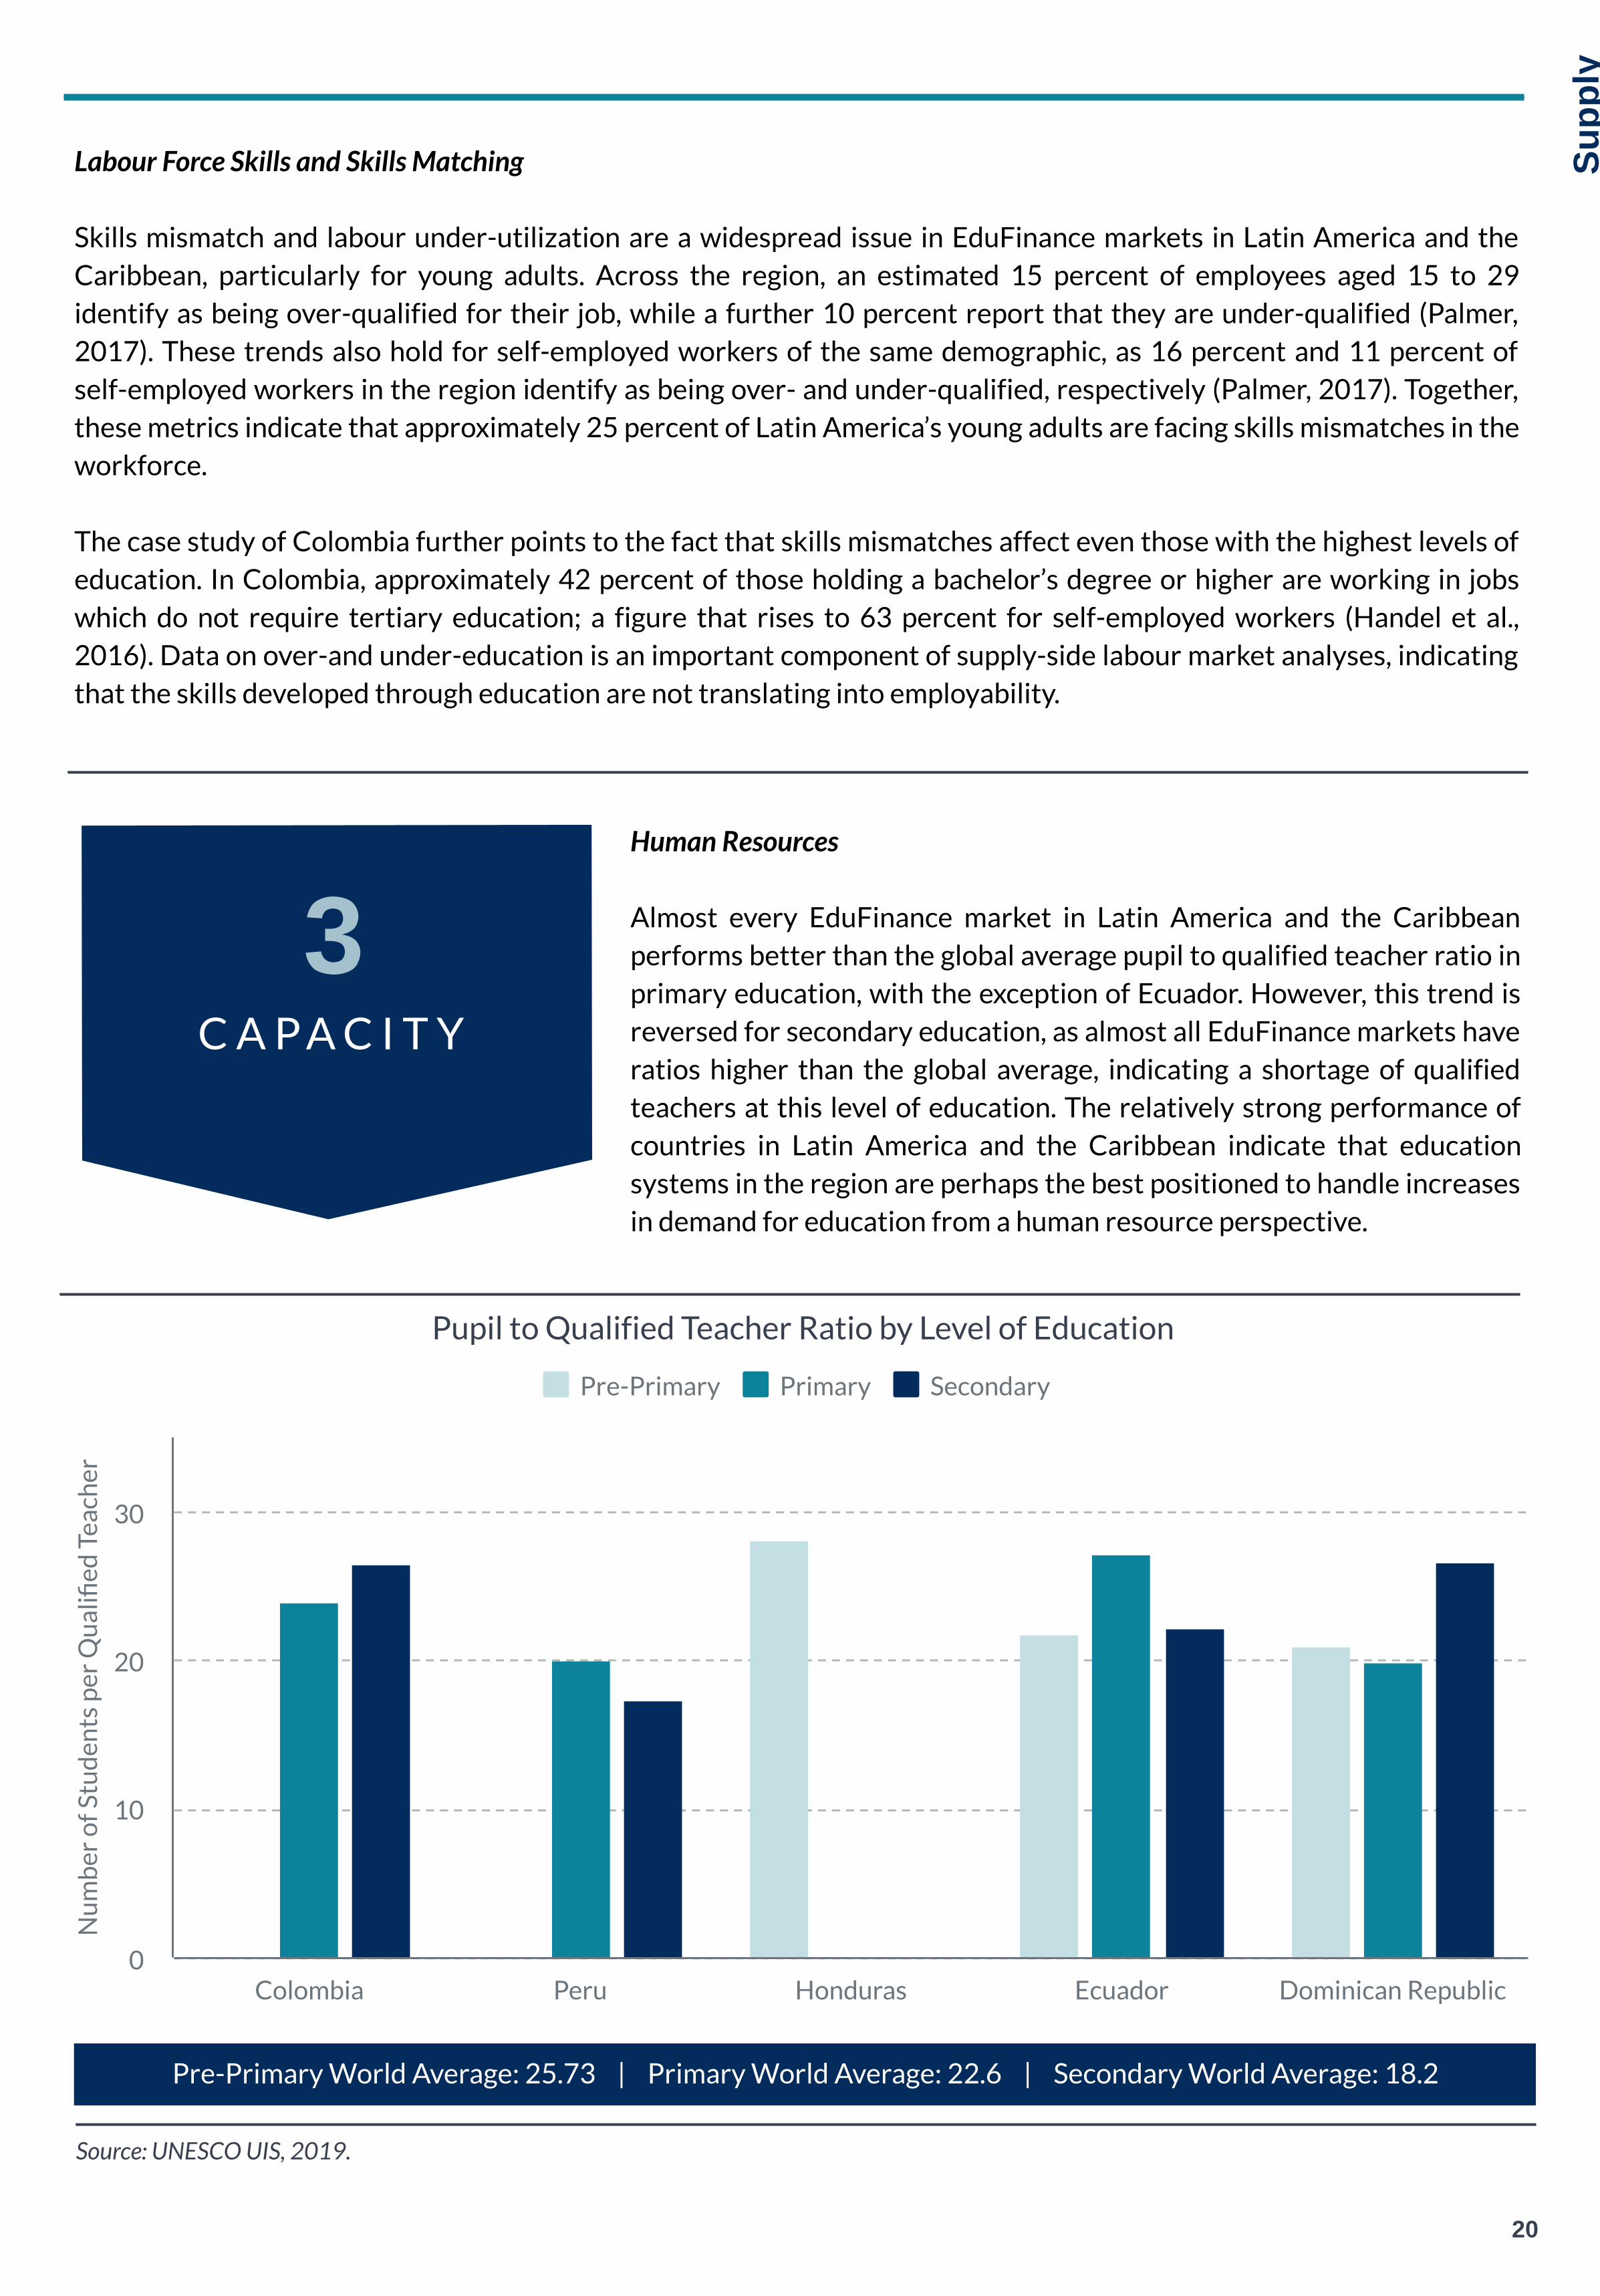
The figure to the right shows the averageharmonized learning outcome scores forEduFinance’s markets in Latin Americaand the Caribbean. The Latin Americanand the Caribbean countries in thisreport perform reasonably well inlearning outcomes relative to the worldaverage. While no countries in the regionperform
Q U A L I T Y
2
Gender Disparities in Enrollment
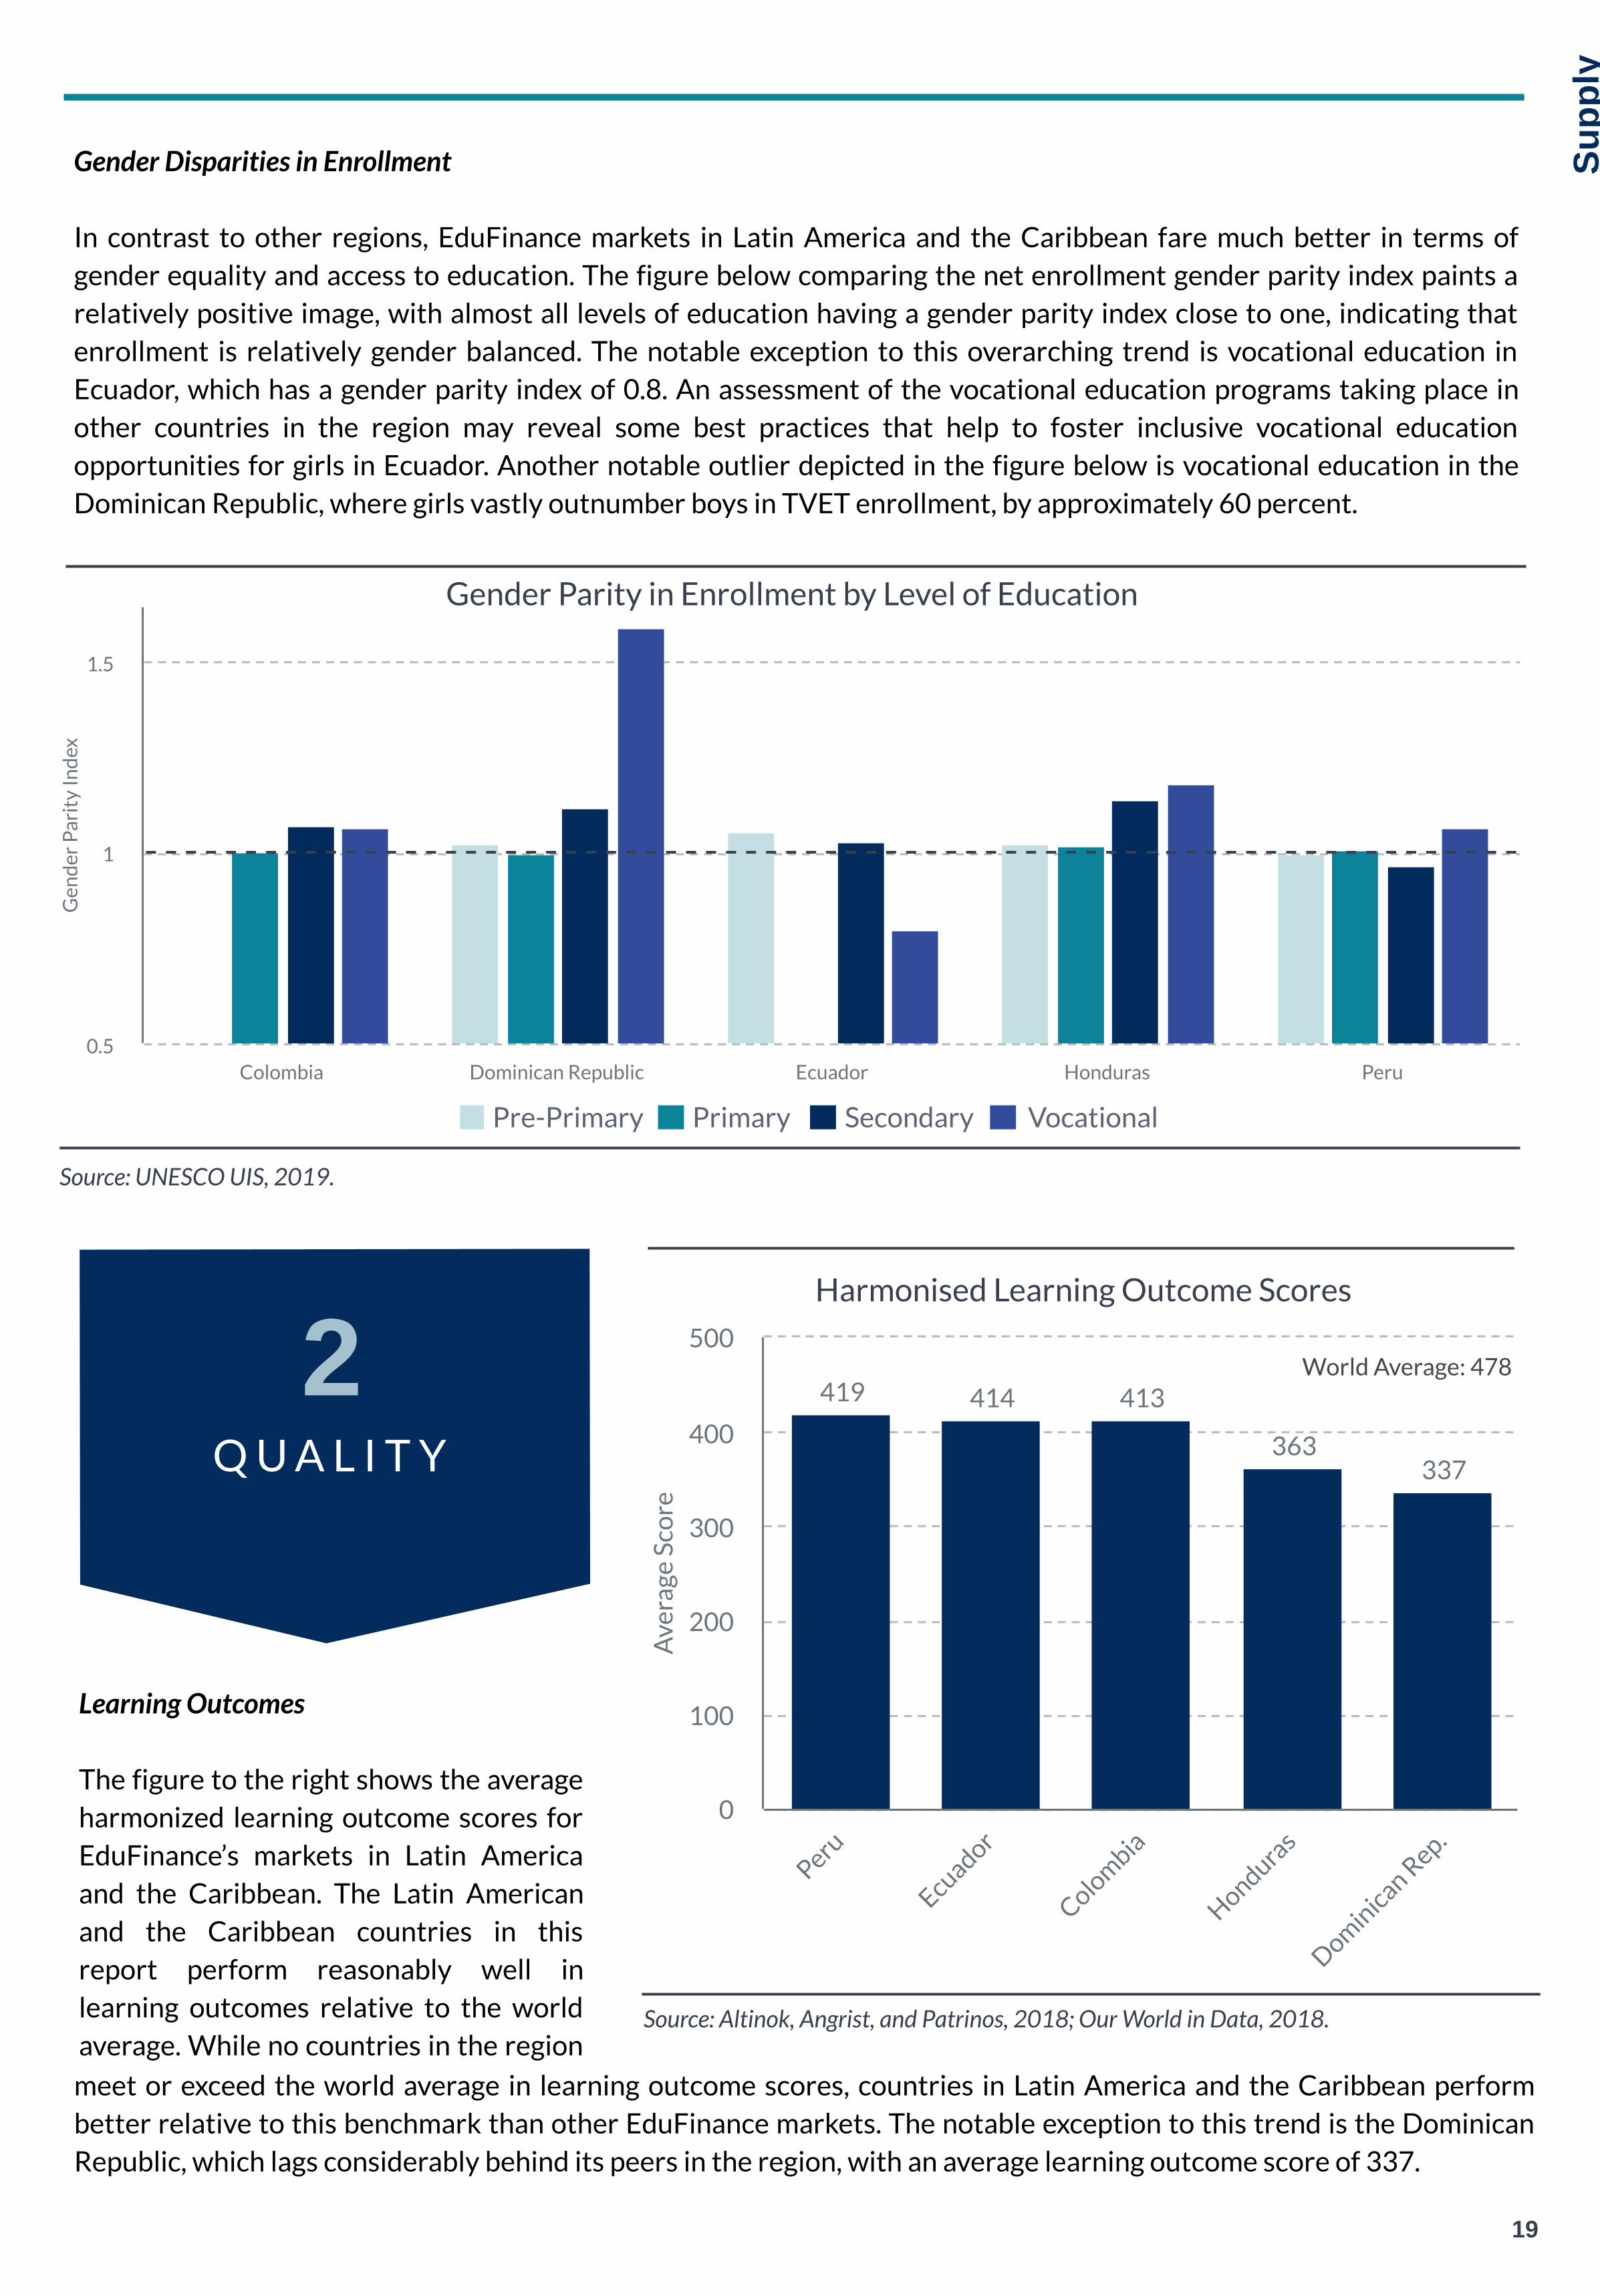
In contrast to other regions, EduFinance markets in Latin America and the Caribbean fare much better in terms ofgender equality and access to education. The figure below comparing the net enrollment gender parity index paints arelatively positive image, with almost all levels of education having a gender parity index close to one, indicating thatenrollment is relatively gender balanced. The notable exception to this overarching trend is vocational education inEcuador, which has a gender parity index of 0.8. An assessment of the vocational education programs taking place inother countries in the region may reveal some best practices that help to foster inclusive vocational educationopportunities for girls in Ecuador. Another notable outlier depicted in the figure below is vocational education in theDominican Republic, where girls vastly outnumber boys in TVET enrollment, by approximately 60 percent.
Gender Parity in Enrollment by Level of Education
Source: UNESCO UIS, 2019.
Source: Altinok, Angrist, and Patrinos, 2018; Our World in Data, 2018.
Pre-Primary Primary Secondary Vocational
Harmonised Learning Outcome Scores
Gen
der
Par
ity
Ind
ex
Colombia Dominican Republic Ecuador Honduras Peru0.5
1
1.5
meet or exceed the world average in learning outcome scores, countries in Latin America and the Caribbean performbetter relative to this benchmark than other EduFinance markets. The notable exception to this trend is the DominicanRepublic, which lags considerably behind its peers in the region, with an average learning outcome score of 337.
World Average: 478
Labour Force Skills and Skills Matching
Skills mismatch and labour under-utilization are a widespread issue in EduFinance markets in Latin America and the
Caribbean, particularly for young adults. Across the region, an estimated 15 percent of employees aged 15 to 29
identify as being over-qualified for their job, while a further 10 percent report that they are under-qualified (Palmer,
2017). These trends also hold for self-employed workers of the same demographic, as 16 percent and 11 percent of
self-employed workers in the region identify as being over- and under-qualified, respectively (Palmer, 2017). Together,
these metrics indicate that approximately 25 percent of Latin America’s young adults are facing skills mismatches in the
workforce.
The case study of Colombia further points to the fact that skills mismatches affect even those with the highest levels of
education. In Colombia, approximately 42 percent of those holding a bachelor’s degree or higher are working in jobs
which do not require tertiary education; a figure that rises to 63 percent for self-employed workers (Handel et al.,
2016). Data on over-and under-education is an important component of supply-side labour market analyses, indicating
that the skills developed through education are not translating into employability.
20
Supp
ly
Human Resources
Almost every EduFinance market in Latin America and the Caribbean
performs better than the global average pupil to qualified teacher ratio in
primary education, with the exception of Ecuador. However, this trend is
reversed for secondary education, as almost all EduFinance markets have
ratios higher than the global average, indicating a shortage of qualified
teachers at this level of education. The relatively strong performance of
countries in Latin America and the Caribbean indicate that education
systems in the region are perhaps the best positioned to handle increases
in demand for education from a human resource perspective.
C A P A C I T Y
3
Pupil to Qualified Teacher Ratio by Level of Education
Source: UNESCO UIS, 2019.
Nu
mb
er
of
Stu
de
nts
pe
r Q
ua
li�
ed
Te
ac
he
r
Pre-Primary Primary Secondary
Colombia Peru Honduras Ecuador Dominican Republic
0
10
20
30
Pre-Primary World Average: 25.73 | Primary World Average: 22.6 | Secondary World Average: 18.2
21
DEMAND SIDE ANALYSIS:
LABOUR MARKETS
The demand-side analysis approaches the labour market from the employer perspective, tohelp provide insights as to what types of education, training, and skills are desired ineconomies today. Exploring data and information from EduFinance markets, this analysis willfirst provide insights into the regional economic and employment landscapes, look intoindustry growth and job forecasts, and finally delve into the skill gaps facing these regions,highlighting specific skills desired by the regions’ prominent employers. Investing in the rightskills for today’s workforce will ultimately drive the future economy.
E M P L O Y M E N T S K I L L SI N D U S T R I E S
Economy
Underutilization
Informality
Skills Gaps
Hard vs. Soft Skills
Skill Demands
Key Industries
Notable Shifts
Future Forecasts
EMPLOYABILITYOUTCOMES
IDENTIFYING EMPLOYABLESKILLS AND KEY INDUSTRIES
ADDRESSING SKILL GAPS
D E M A N D S I D E FA C TO R S : L A B O U R M A R K E T S
22
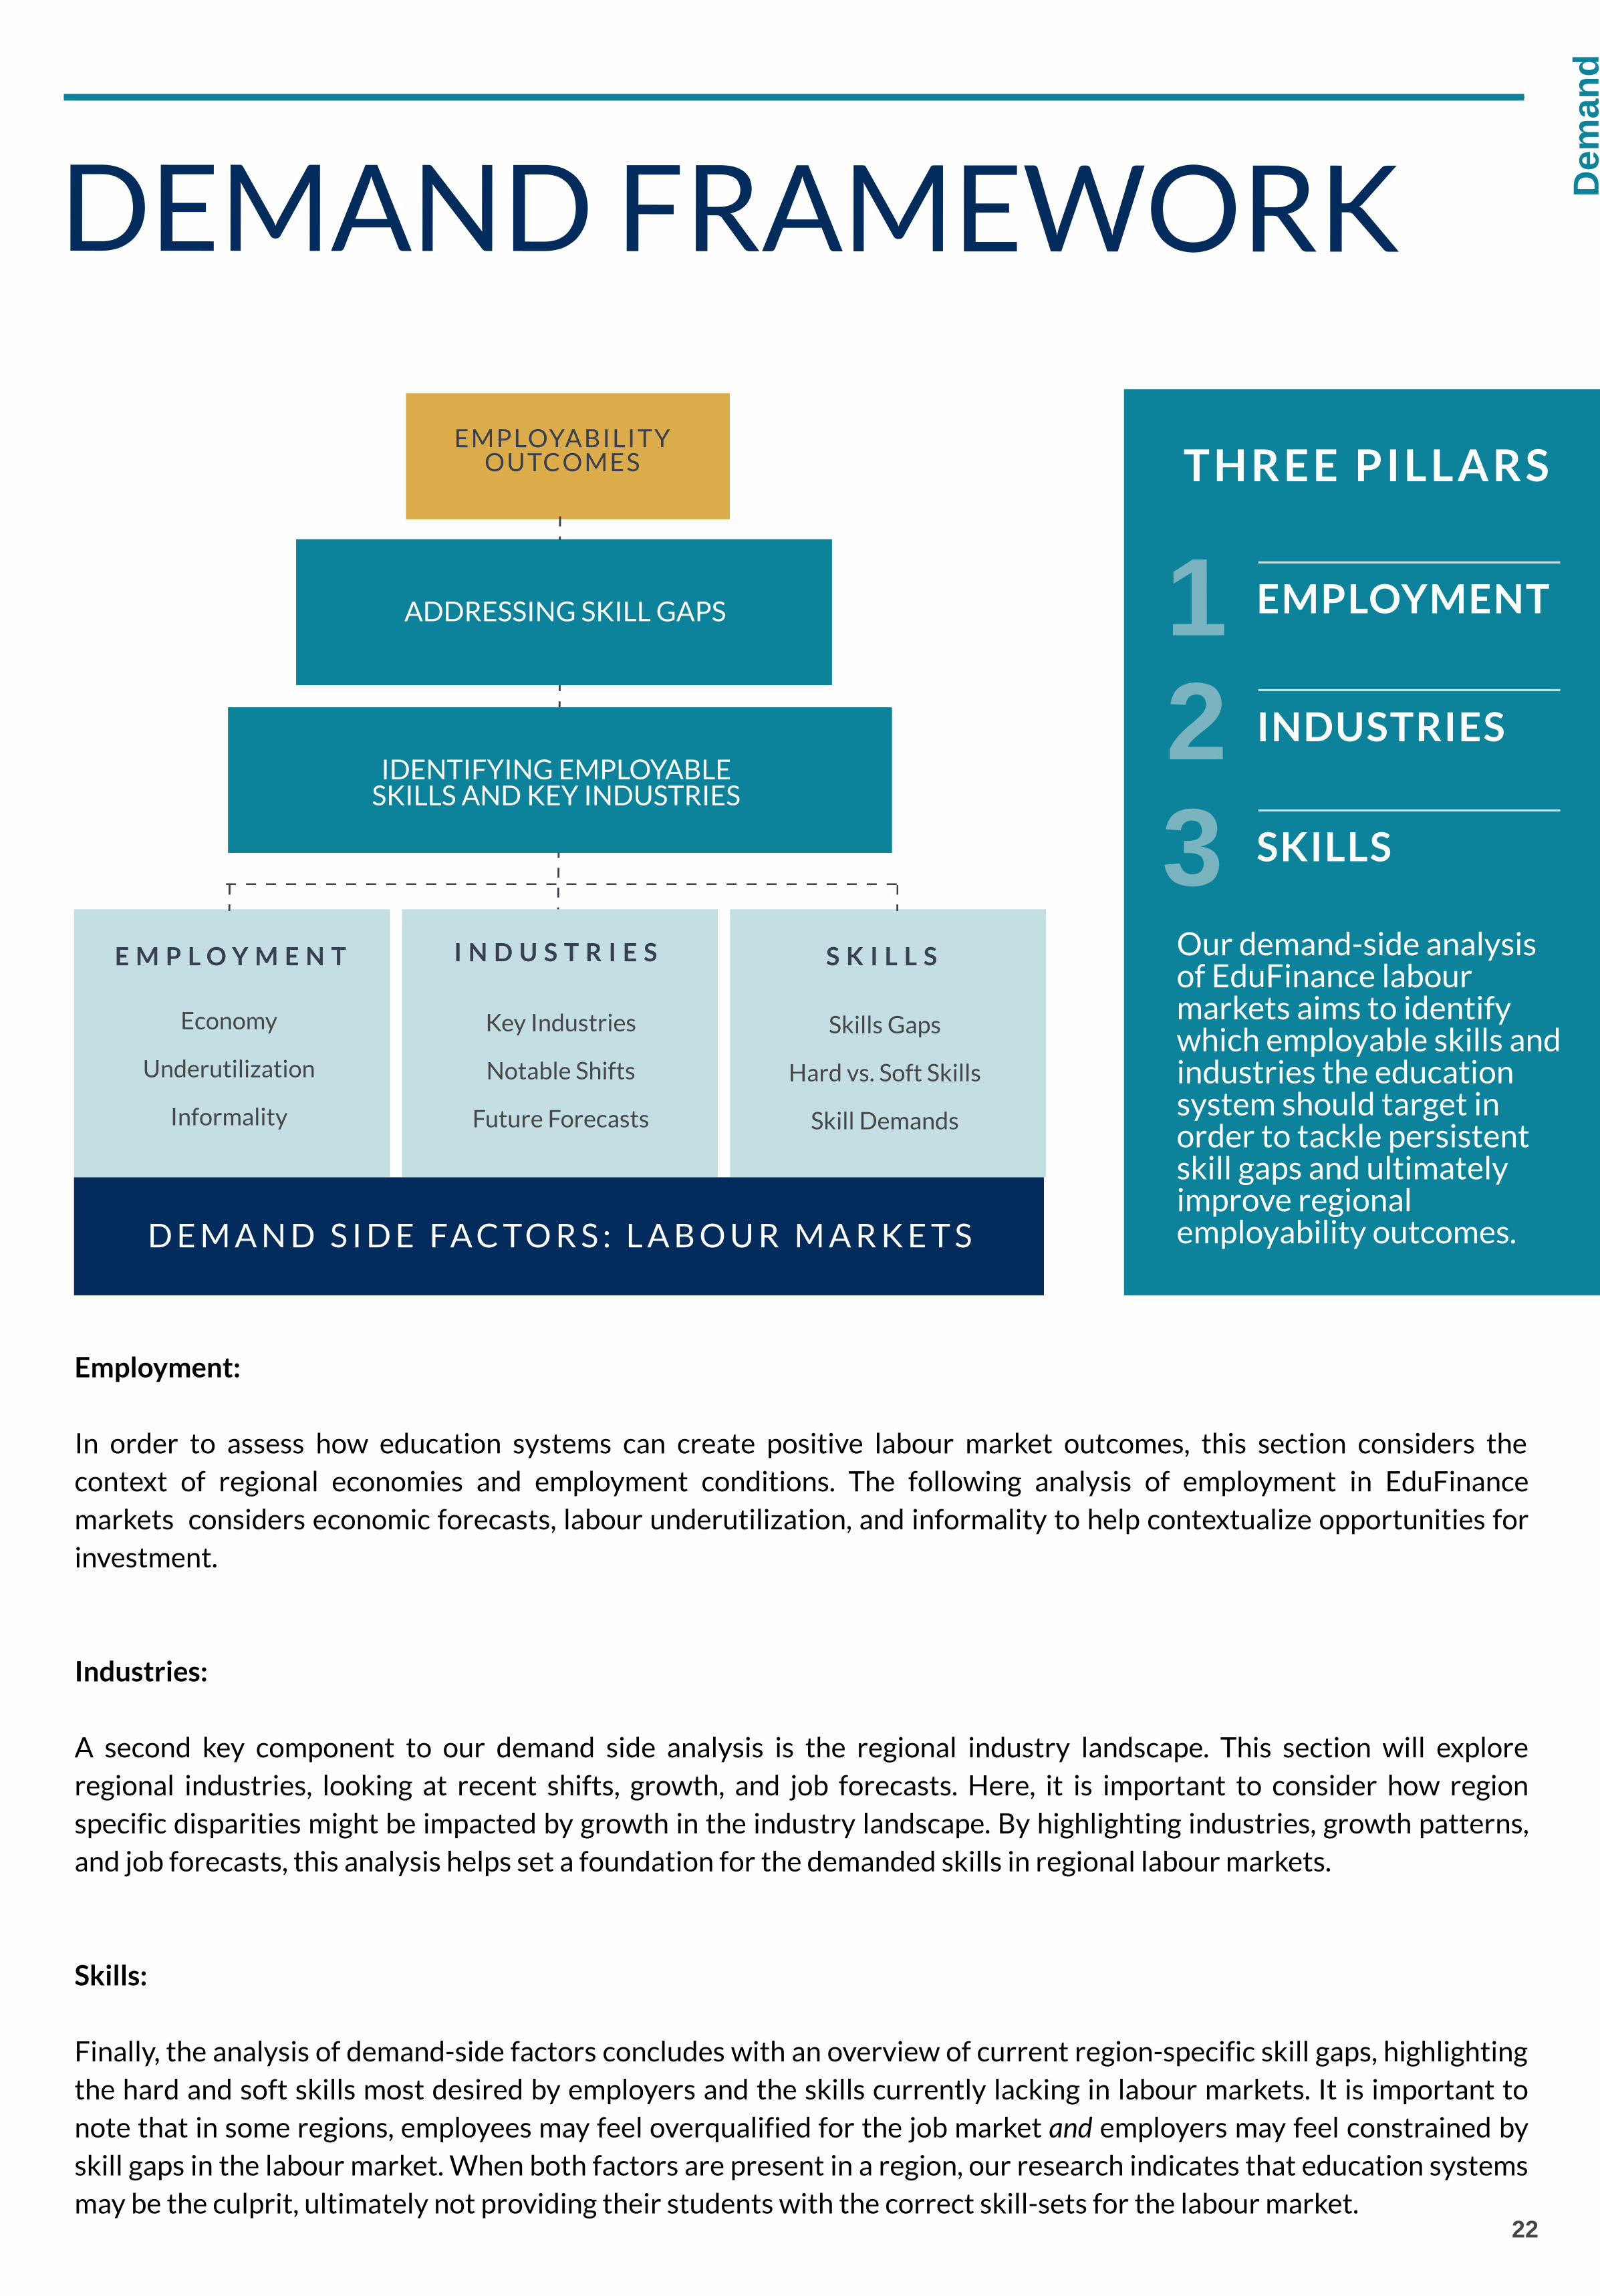
Employment:
In order to assess how education systems can create positive labour market outcomes, this section considers thecontext of regional economies and employment conditions. The following analysis of employment in EduFinancemarkets considers economic forecasts, labour underutilization, and informality to help contextualize opportunities forinvestment.
Industries:
A second key component to our demand side analysis is the regional industry landscape. This section will exploreregional industries, looking at recent shifts, growth, and job forecasts. Here, it is important to consider how regionspecific disparities might be impacted by growth in the industry landscape. By highlighting industries, growth patterns,and job forecasts, this analysis helps set a foundation for the demanded skills in regional labour markets.
Skills:
Finally, the analysis of demand-side factors concludes with an overview of current region-specific skill gaps, highlightingthe hard and soft skills most desired by employers and the skills currently lacking in labour markets. It is important tonote that in some regions, employees may feel overqualified for the job market and employers may feel constrained byskill gaps in the labour market. When both factors are present in a region, our research indicates that education systemsmay be the culprit, ultimately not providing their students with the correct skill-sets for the labour market.
Dem
and
DEMAND FRAMEWORK
THREE PILLARS
1INDUSTRIES
32
SKILLS
EMPLOYMENT
Our demand-side analysisof EduFinance labourmarkets aims to identifywhich employable skills andindustries the educationsystem should target inorder to tackle persistentskill gaps and ultimatelyimprove regionalemployability outcomes.
23
Dem
and
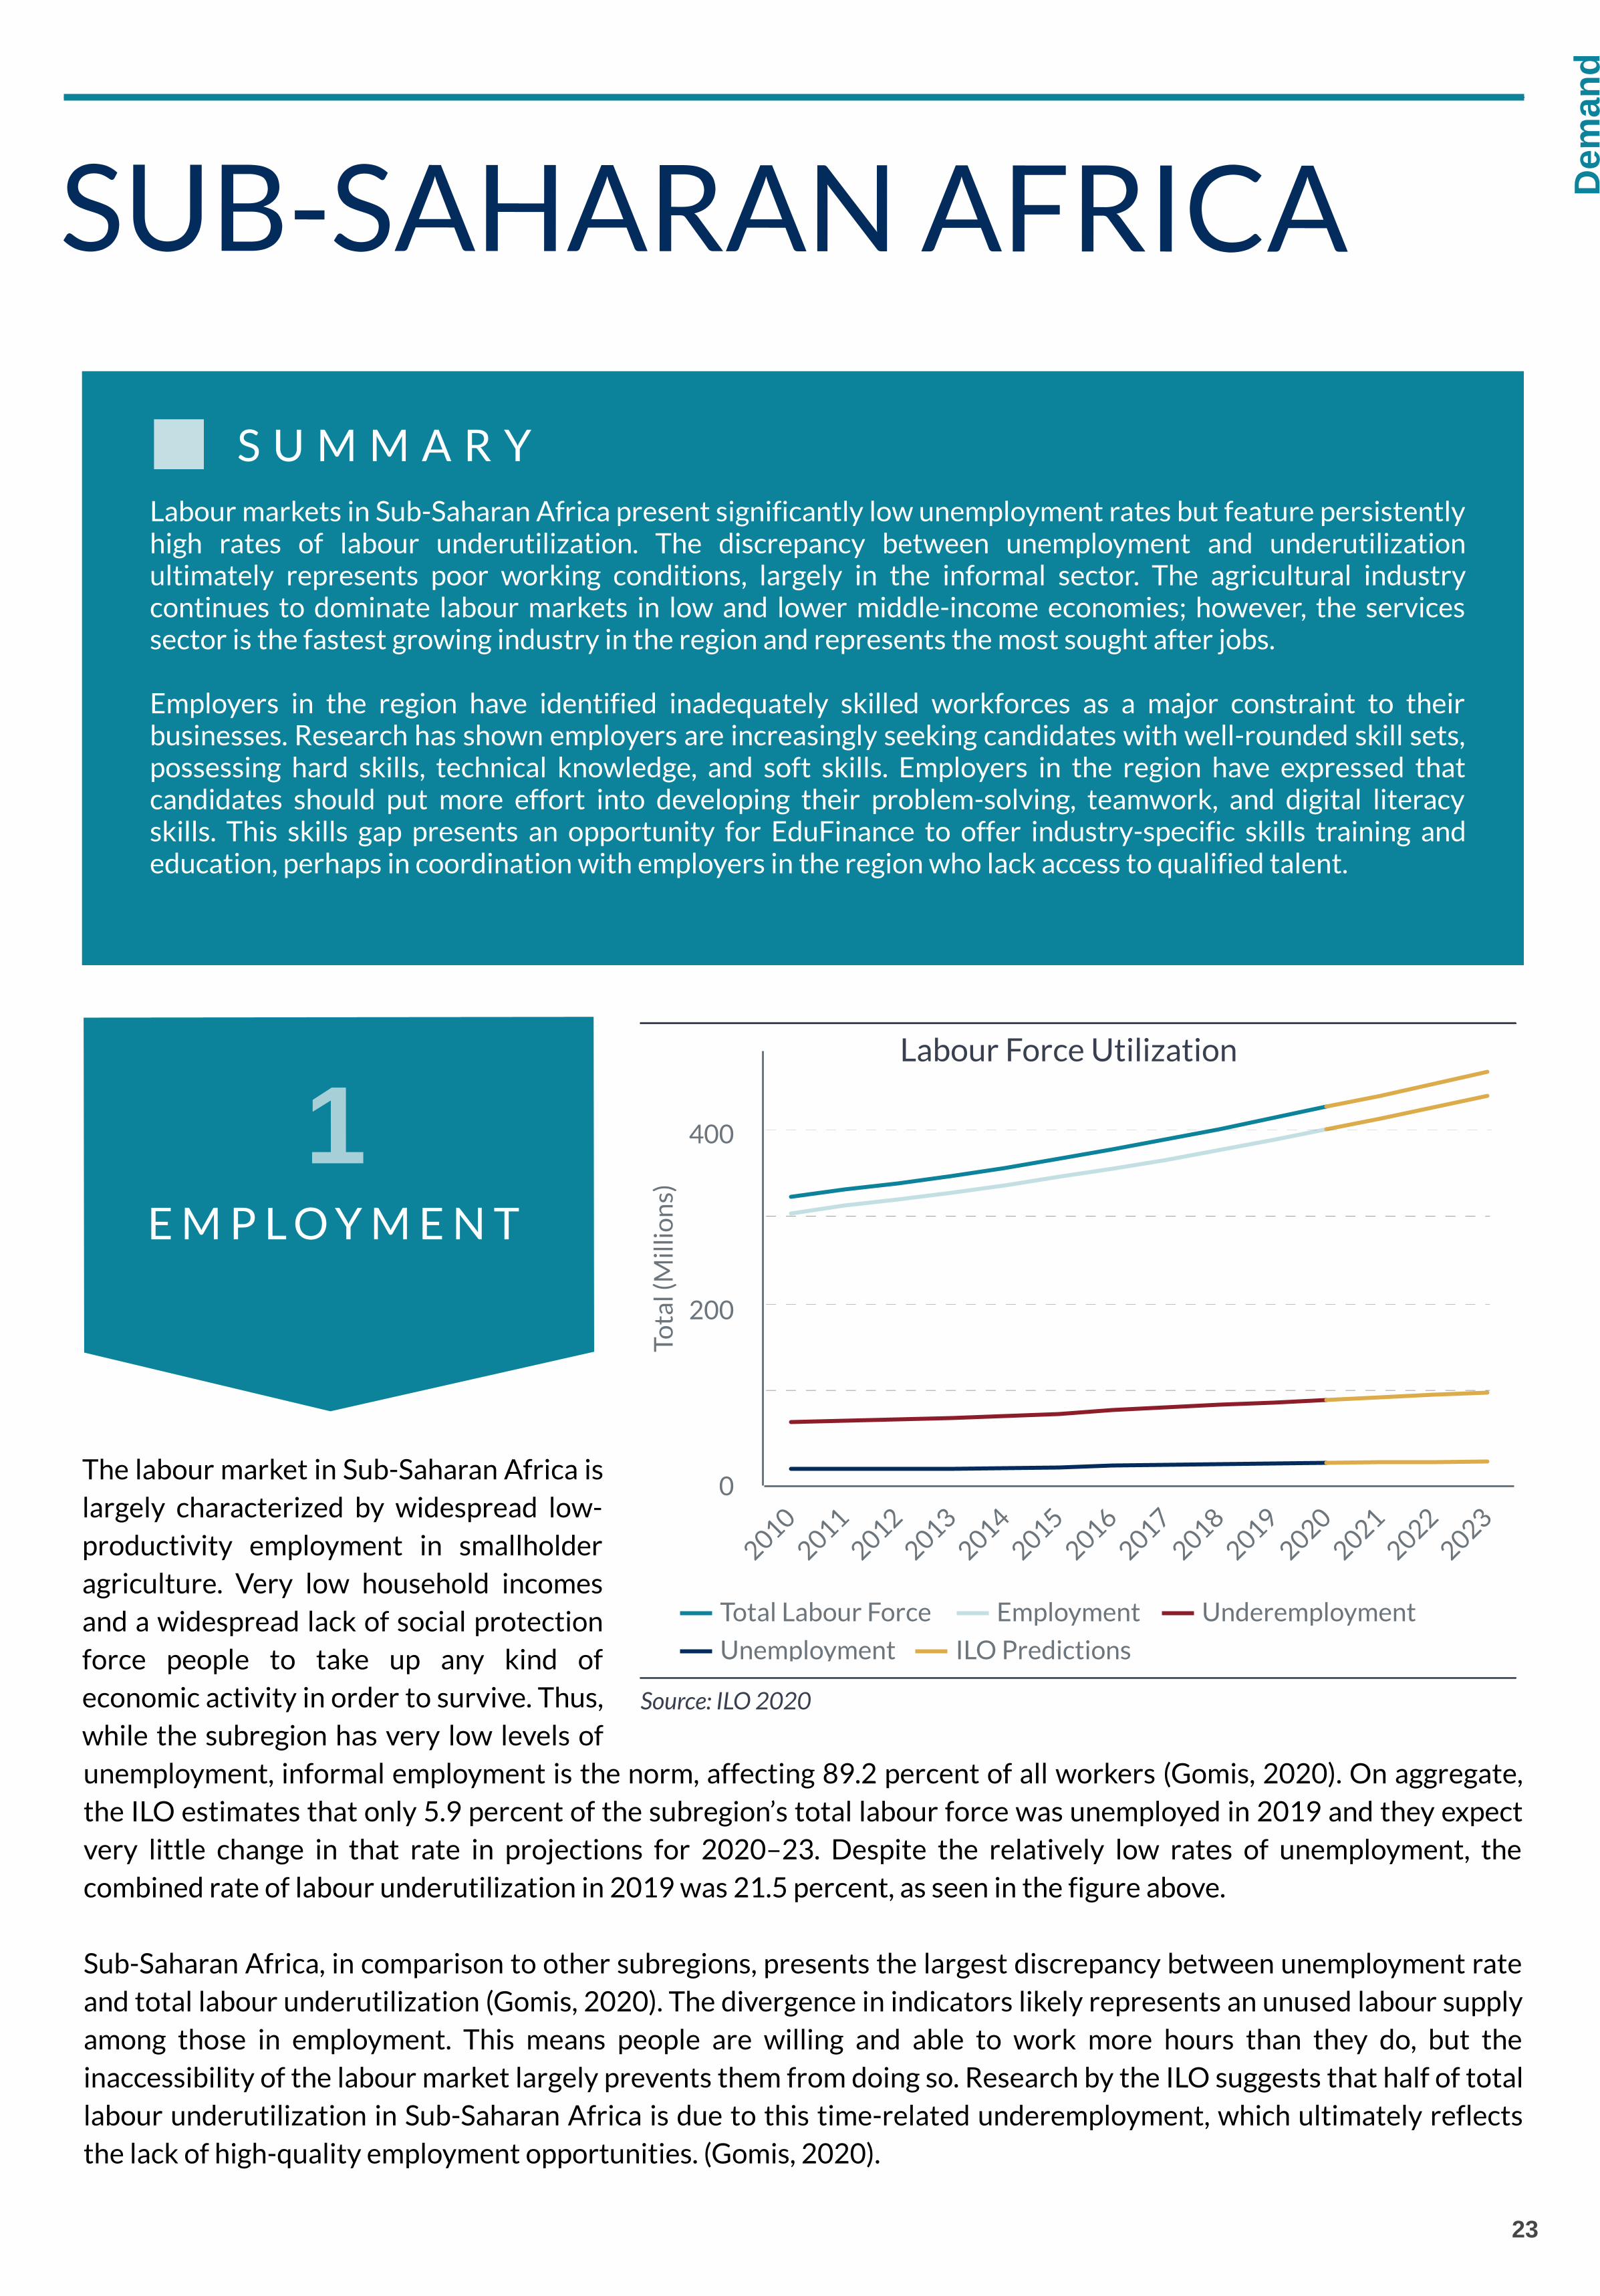
Labour markets in Sub-Saharan Africa present significantly low unemployment rates but feature persistentlyhigh rates of labour underutilization. The discrepancy between unemployment and underutilizationultimately represents poor working conditions, largely in the informal sector. The agricultural industrycontinues to dominate labour markets in low and lower middle-income economies; however, the servicessector is the fastest growing industry in the region and represents the most sought after jobs.
Employers in the region have identified inadequately skilled workforces as a major constraint to theirbusinesses. Research has shown employers are increasingly seeking candidates with well-rounded skill sets,possessing hard skills, technical knowledge, and soft skills. Employers in the region have expressed thatcandidates should put more effort into developing their problem-solving, teamwork, and digital literacyskills. This skills gap presents an opportunity for EduFinance to offer industry-specific skills training andeducation, perhaps in coordination with employers in the region who lack access to qualified talent.
S U M M A R Y
The labour market in Sub-Saharan Africa islargely characterized by widespread low-productivity employment in smallholderagriculture. Very low household incomesand a widespread lack of social protectionforce people to take up any kind ofeconomic activity in order to survive. Thus,while the subregion has very low levels ofunemployment,
E M P L O Y M E N T
1
SUB-SAHARAN AFRICA
unemployment, informal employment is the norm, affecting 89.2 percent of all workers (Gomis, 2020). On aggregate,the ILO estimates that only 5.9 percent of the subregion’s total labour force was unemployed in 2019 and they expectvery little change in that rate in projections for 2020–23. Despite the relatively low rates of unemployment, thecombined rate of labour underutilization in 2019 was 21.5 percent, as seen in the figure above.
Sub-Saharan Africa, in comparison to other subregions, presents the largest discrepancy between unemployment rateand total labour underutilization (Gomis, 2020). The divergence in indicators likely represents an unused labour supplyamong those in employment. This means people are willing and able to work more hours than they do, but theinaccessibility of the labour market largely prevents them from doing so. Research by the ILO suggests that half of totallabour underutilization in Sub-Saharan Africa is due to this time-related underemployment, which ultimately reflectsthe lack of high-quality employment opportunities. (Gomis, 2020).
Tota
l (M
illio
ns)
Total Labour Force Employment Underemployment
Unemployment ILO Predictions xxxxxxxxxxxxxxxxx
20102011
20122013
20142015
20162017
20182019
20202021
20222023
0
200
400
Labour Force Utilization
Source: ILO 2020

24
Dem
and
Looking to 2030, the agricultural industry is expected to continuemonopolize employment in low and lower middle-income economies inSub-Saharan Africa, providing about two-thirds of total jobs, while theservices sector will lead the way in upper-middle income economies.The manufacturing sector is projected to provide only 6.5 percent oftotal employment across all income categories (Brown and Slater,2018).
Agriculture is the largest employment sector in Sub-Saharan Africa,employing over 200 million people (Brown and Slater, 2018). However,the services sector is the fastest growing sector in Sub-Saharan Africa interms
I N D U S T R I E S
2
terms of job creation and value-added to GDP. It currently employs over 110 million people across the subregion and isforecast to grow by 3.8 percent on average each year through 2030 (Brown and Slater, 2018). This transition fromagriculture to the services sector appears to come at the cost of export-oriented manufacturing, which is typicallyassociated with higher-value added to the economy and increased job quality (Asmal, et al., 2020). As a result, thequality of jobs for people in the region remains low, and informal employment continues to dominate the economy. Theservices sector, while largely informal, does provide access to wage employment. As a result, the services sectorencompasses the majority of sought after jobs in the region. In addition, demand for services increases as incomes riseand urbanization continues, thus creating potential space for entrepreneurs to meet that demand.
S K I L L S
3According to research by the World Economic Forum, employers acrossSub-Saharan Africa have identified inadequately skilled workforces as amajor constraint to their business. Skills discrepancies were highlightedas a major constraint by 41 percent of firms in Tanzania, 30 percent offirms in Kenya, 9 percent in South Africa, and 6 percent in Nigeria(World Economic Forum, 2017). While the supply-side analysishighlights that employees often feel overqualified for their jobs in termsof educational attainment, the persistent skills gaps identified byemployers further sheds light on the inefficiencies in education systems.When educated graduates are not equipped with the right skill-sets,they may be pushed into the lower-skilled occupations.
The mismatch of skills likely stems from thefact that digital technologies are becomingmore prevalent in various industries acrossthe region. Looking at the employability ofgraduates in Ghana, Nigeria, Kenya andSouth Africa, McCowan (2014) found thatwhile employers are often content withgraduates’ disciplinary knowledge, theyidentify serious inadequacies in their ITskills, as well as in problem solving andteamwork.
In an attempt to better identify the skillsnecessary for educated youth to successfullyenter the job market, Wilson and colleagues(2019) interviewed educators and employersin Ethiopia, Kenya, Rwanda, and Senegal. Thefigure to the right summarizes theirfindings, highlighting essential skills requiredfor successful employability.
Essential Skills for Successful Employability
Self-confidence
Motivation & aspirations
Communication
Trustworthiness andresponsibility
Persuasion and negotiation
Presentation skills
HARD SKILLS &TECHNICAL KNOWLEDGE
Business language skills
Digital literacy
Research skills andinformation seeking (including social media)
Entrepreneurial skills: basic financial literacy resource mapping innovation marketing
VS SOFT SKILLS & TRAITS
Source: Wilson et al., 2019
25
Dem
and
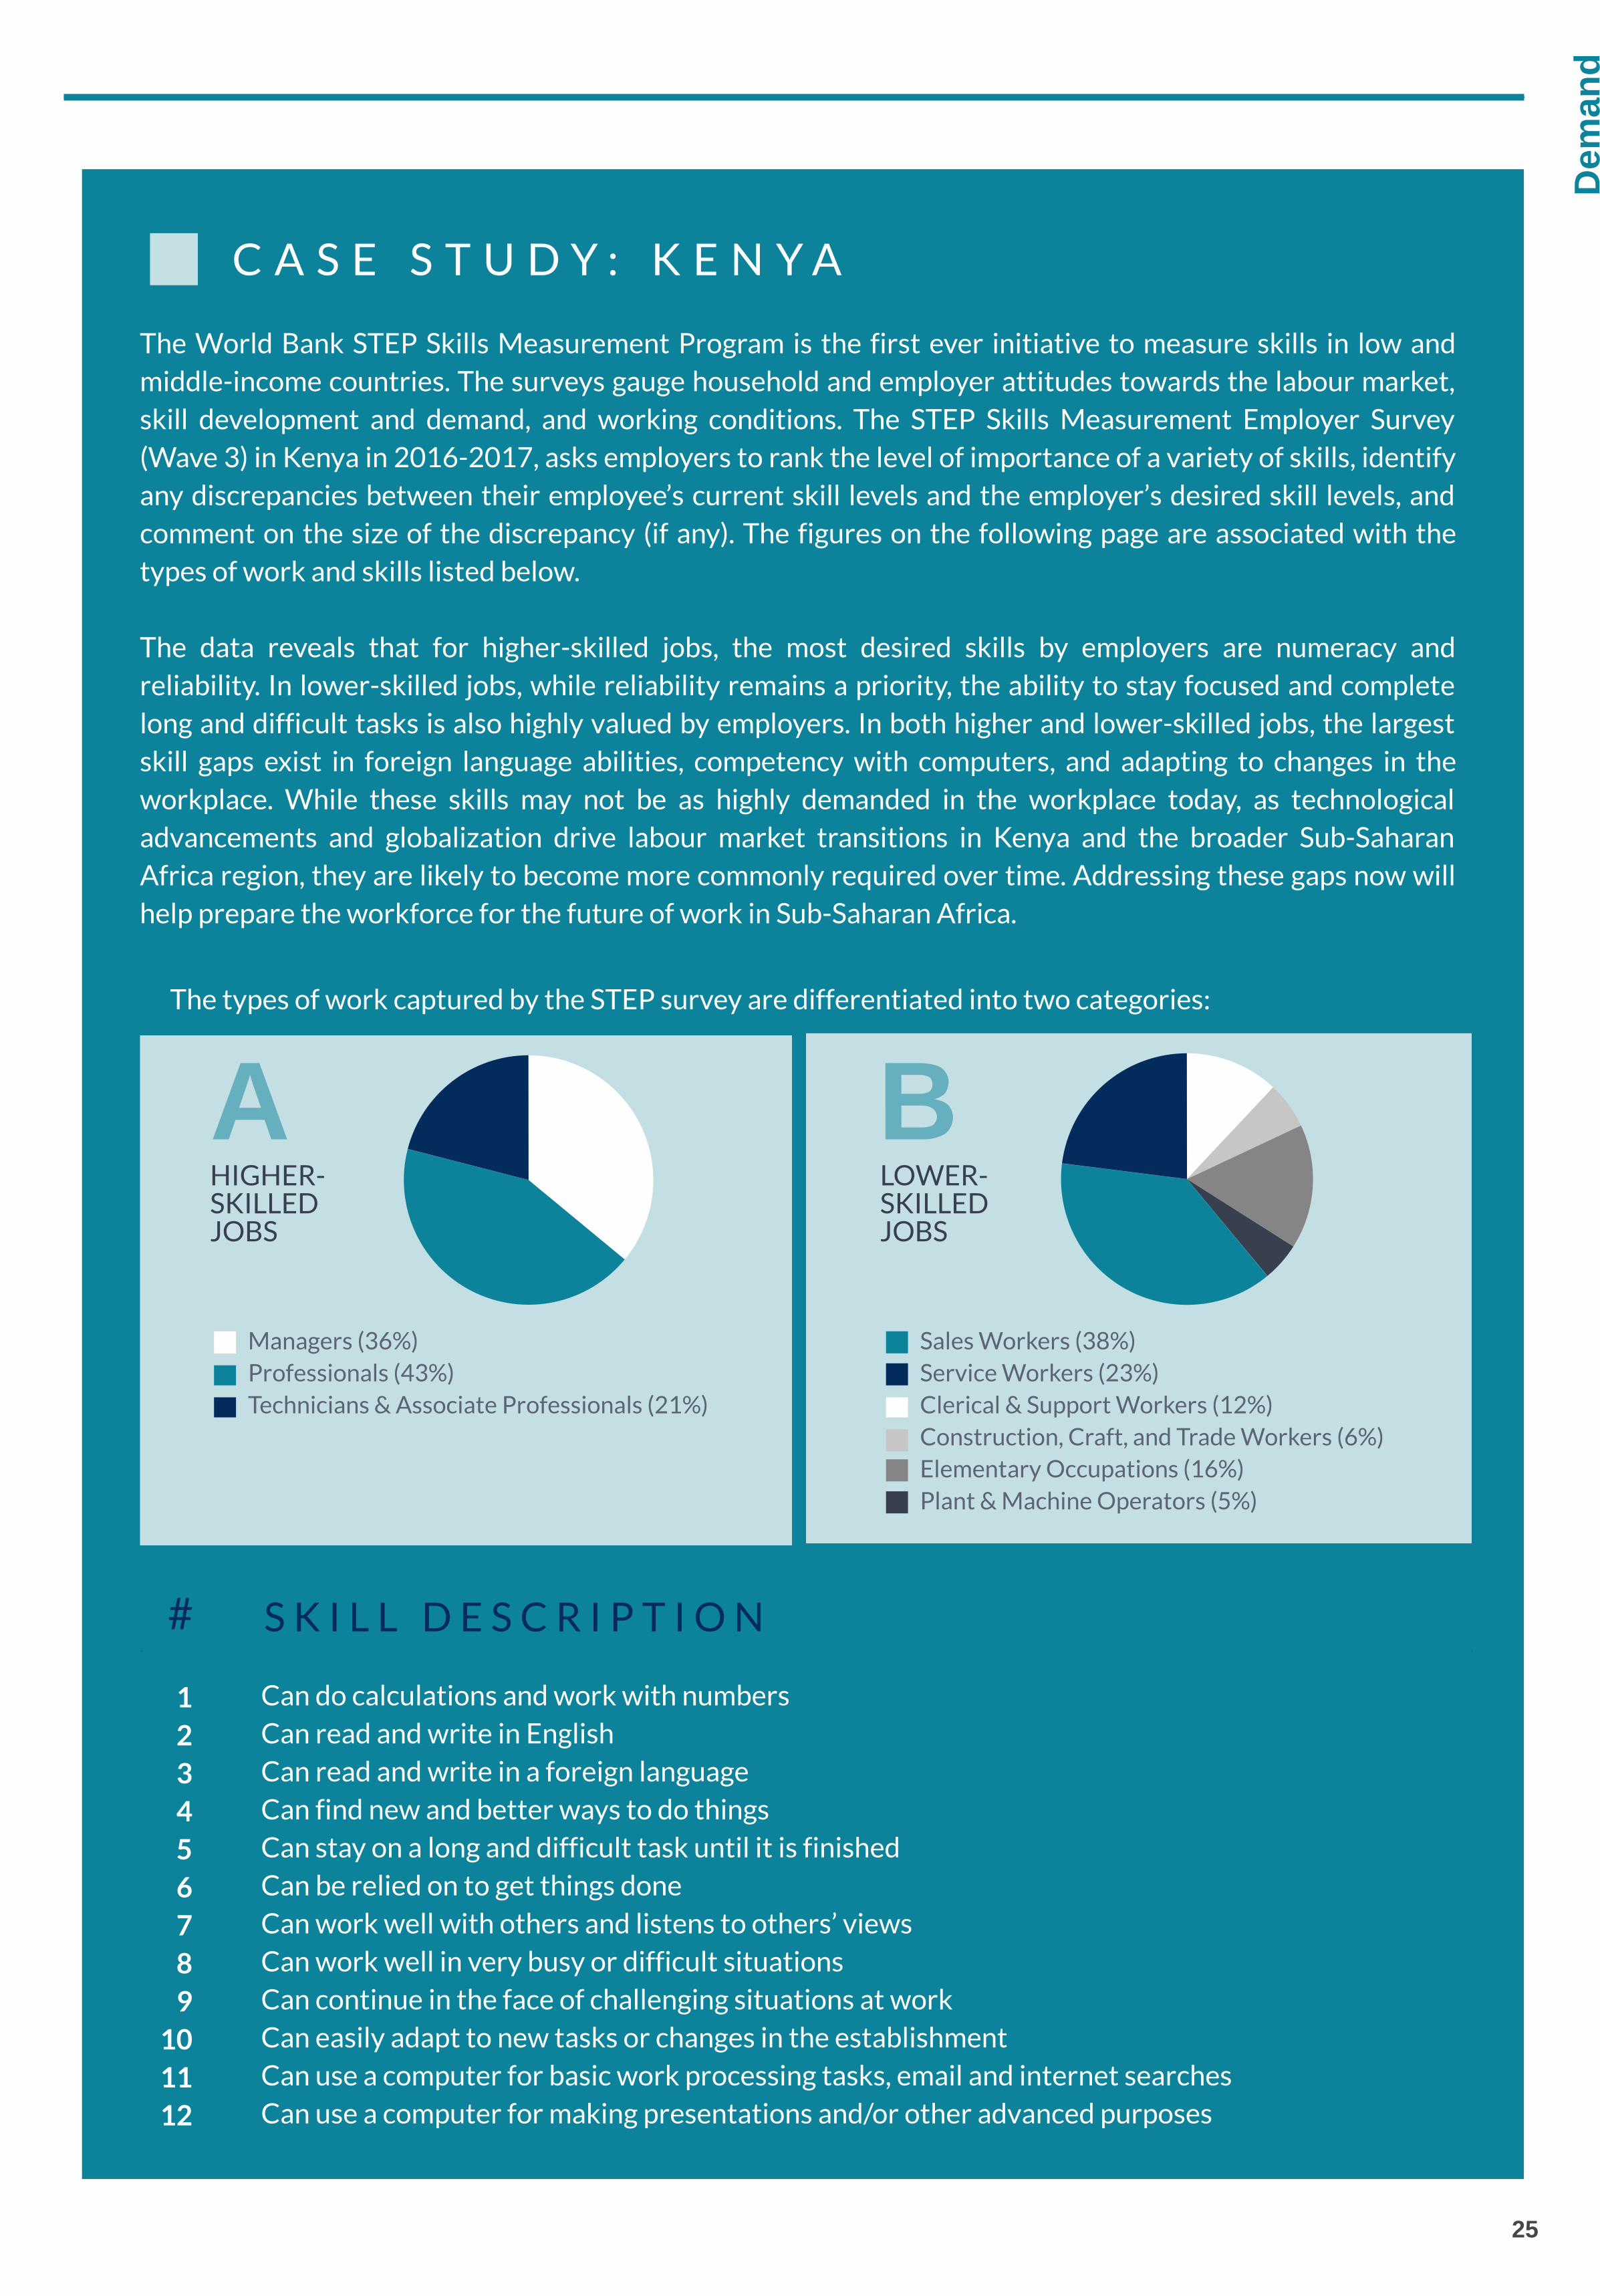
The World Bank STEP Skills Measurement Program is the first ever initiative to measure skills in low andmiddle-income countries. The surveys gauge household and employer attitudes towards the labour market,skill development and demand, and working conditions. The STEP Skills Measurement Employer Survey(Wave 3) in Kenya in 2016-2017, asks employers to rank the level of importance of a variety of skills, identifyany discrepancies between their employee’s current skill levels and the employer’s desired skill levels, andcomment on the size of the discrepancy (if any). The figures on the following page are associated with thetypes of work and skills listed below.
The data reveals that for higher-skilled jobs, the most desired skills by employers are numeracy andreliability. In lower-skilled jobs, while reliability remains a priority, the ability to stay focused and completelong and difficult tasks is also highly valued by employers. In both higher and lower-skilled jobs, the largestskill gaps exist in foreign language abilities, competency with computers, and adapting to changes in theworkplace. While these skills may not be as highly demanded in the workplace today, as technologicaladvancements and globalization drive labour market transitions in Kenya and the broader Sub-SaharanAfrica region, they are likely to become more commonly required over time. Addressing these gaps now willhelp prepare the workforce for the future of work in Sub-Saharan Africa.
C A S E S T U D Y : K E N Y A
# S K I L L D E S C R I P T I O N
Can do calculations and work with numbersCan read and write in EnglishCan read and write in a foreign languageCan find new and better ways to do thingsCan stay on a long and difficult task until it is finishedCan be relied on to get things doneCan work well with others and listens to others’ viewsCan work well in very busy or difficult situationsCan continue in the face of challenging situations at workCan easily adapt to new tasks or changes in the establishmentCan use a computer for basic work processing tasks, email and internet searchesCan use a computer for making presentations and/or other advanced purposes
123456789
101112
The types of work captured by the STEP survey are differentiated into two categories:
A B
Sales Workers (38%)Service Workers (23%)Clerical & Support Workers (12%)Construction, Craft, and Trade Workers (6%)Elementary Occupations (16%)Plant & Machine Operators (5%)
Managers (36%)Professionals (43%)Technicians & Associate Professionals (21%)
HIGHER-SKILLEDJOBS
LOWER-SKILLEDJOBS

% o
f E
mp
loy
er
s
#1 Skill In Top 3 Skills
1 2 3 4 5 6 7 8 9 10 11 12
0
20
40
% o
f E
mp
loy
er
s
Yes No Skill not Required
1 2 3 4 5 6 7 8 9 10 11 12
0
50
100
26
Dem
and
C A S E S T U D Y : K E N Y A ( C O N T I N U E D )
A BMost Important Employee Skills
Difference in Skill Level Required and
the Current Level of Employees
Most Important Employee Skills
% o
f E
mp
loy
er
s
Yes No Skill not Required
1 2 3 4 5 6 7 8 9 10 11
0
50
100
Difference in Skill Level Required and
the Current Level of Employees
% o
f E
mp
loy
er
s
#1 Skill In Top 3 Skills
1 2 3 4 5 6 7 8 9 10 11
0
25
50
Size of Difference in Skill Level (%)
78 Respondents
1119
68
13
Large Medium Small
324 60
17
102 Respondents 69 Respondents
92657
17
84 Respondents
1230
52
18
134 Respondents
1136
50
14
Size of Difference in Skill Level (%)
Large Medium Small
131 Respondents
329
43
28
67 Respondents
91864
18
SKILL SKILL
SKILL SKILL
SKILL SKILL
SKILL
% R
ate
of N
EE
T
South Asia South East Asia & the Paci�c Av. LIC
Av. HIC
20102011
20122013
20142015
20162017
20182019
202010
15
20
25
30
27
Dem
and
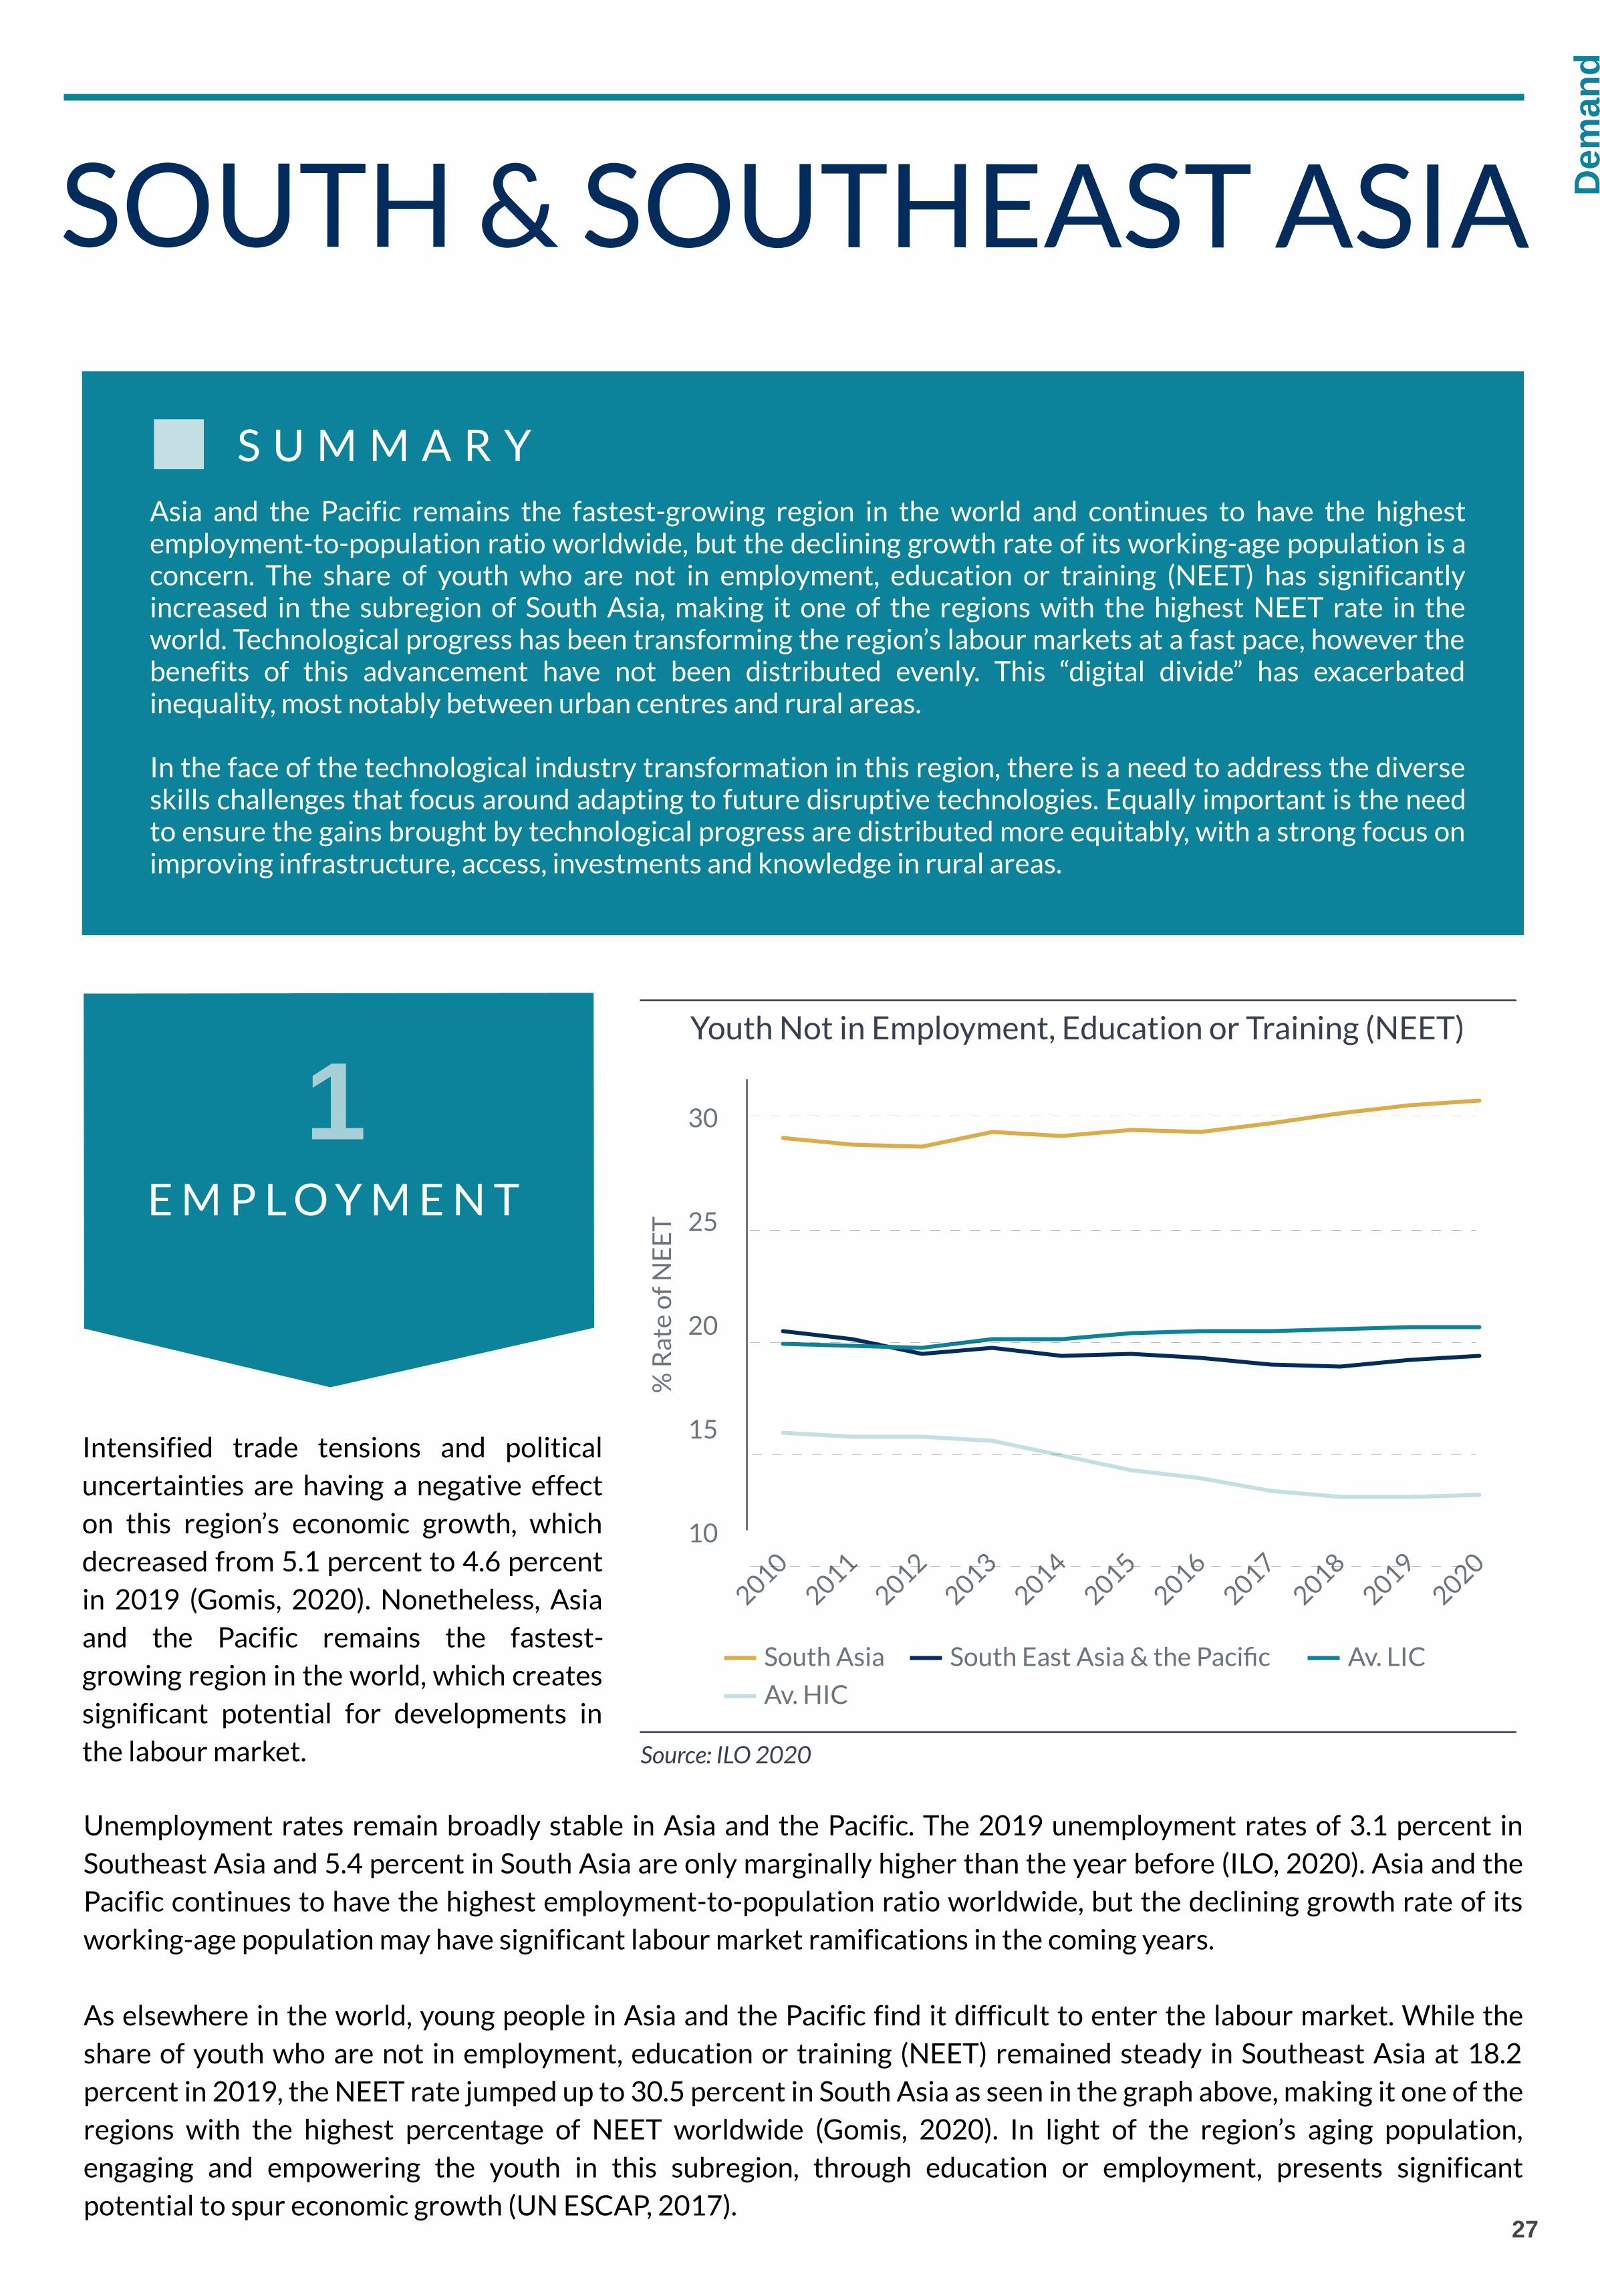
Asia and the Pacific remains the fastest-growing region in the world and continues to have the highestemployment-to-population ratio worldwide, but the declining growth rate of its working-age population is aconcern. The share of youth who are not in employment, education or training (NEET) has significantlyincreased in the subregion of South Asia, making it one of the regions with the highest NEET rate in theworld. Technological progress has been transforming the region’s labour markets at a fast pace, however thebenefits of this advancement have not been distributed evenly. This “digital divide” has exacerbatedinequality, most notably between urban centres and rural areas.
In the face of the technological industry transformation in this region, there is a need to address the diverseskills challenges that focus around adapting to future disruptive technologies. Equally important is the needto ensure the gains brought by technological progress are distributed more equitably, with a strong focus onimproving infrastructure, access, investments and knowledge in rural areas.
S U M M A R Y
Intensified trade tensions and politicaluncertainties are having a negative effecton this region’s economic growth, whichdecreased from 5.1 percent to 4.6 percentin 2019 (Gomis, 2020). Nonetheless, Asiaand the Pacific remains the fastest-growing region in the world, which createssignificant potential for developments inthe labour market.
E M P L O Y M E N T
1
Unemployment rates remain broadly stable in Asia and the Pacific. The 2019 unemployment rates of 3.1 percent inSoutheast Asia and 5.4 percent in South Asia are only marginally higher than the year before (ILO, 2020). Asia and thePacific continues to have the highest employment-to-population ratio worldwide, but the declining growth rate of itsworking-age population may have significant labour market ramifications in the coming years.
As elsewhere in the world, young people in Asia and the Pacific find it difficult to enter the labour market. While theshare of youth who are not in employment, education or training (NEET) remained steady in Southeast Asia at 18.2percent in 2019, the NEET rate jumped up to 30.5 percent in South Asia as seen in the graph above, making it one of theregions with the highest percentage of NEET worldwide (Gomis, 2020). In light of the region’s aging population,engaging and empowering the youth in this subregion, through education or employment, presents significantpotential to spur economic growth (UN ESCAP, 2017).
Youth Not in Employment, Education or Training (NEET)
Source: ILO 2020
SOUTH & SOUTHEAST ASIA
28
Dem
and
I N D U S T R I E S
2
8.258.258.25
888
7.57.57.5
6.56.56.5
2.52.52.5
222
1.751.751.75
111
-0.25-0.25-0.25
-0.75-0.75-0.75
-1.5-1.5-1.5
-5.75-5.75-5.75
-7.5-7.5-7.5
-8-8-8
-9-9-9
-14-14-14
Rubber & Plastic Products
Other Transport Equipment
Motor Vehicles
Other Machinery & Equipment
Fabricated Metal Products
Electrical Equipment
Other Manufacturing, Repair & Installation
Paper Products & Printing
Chemicals & Pharmaceutical Products
Computer, Electronic & Optical Products
Food Products
Basic Metals
Wood & Wood Products
Textiles
Other Non-Metallic Mineral Products
Coke & Refined Petroleum Products
Change in Employment Share (%)
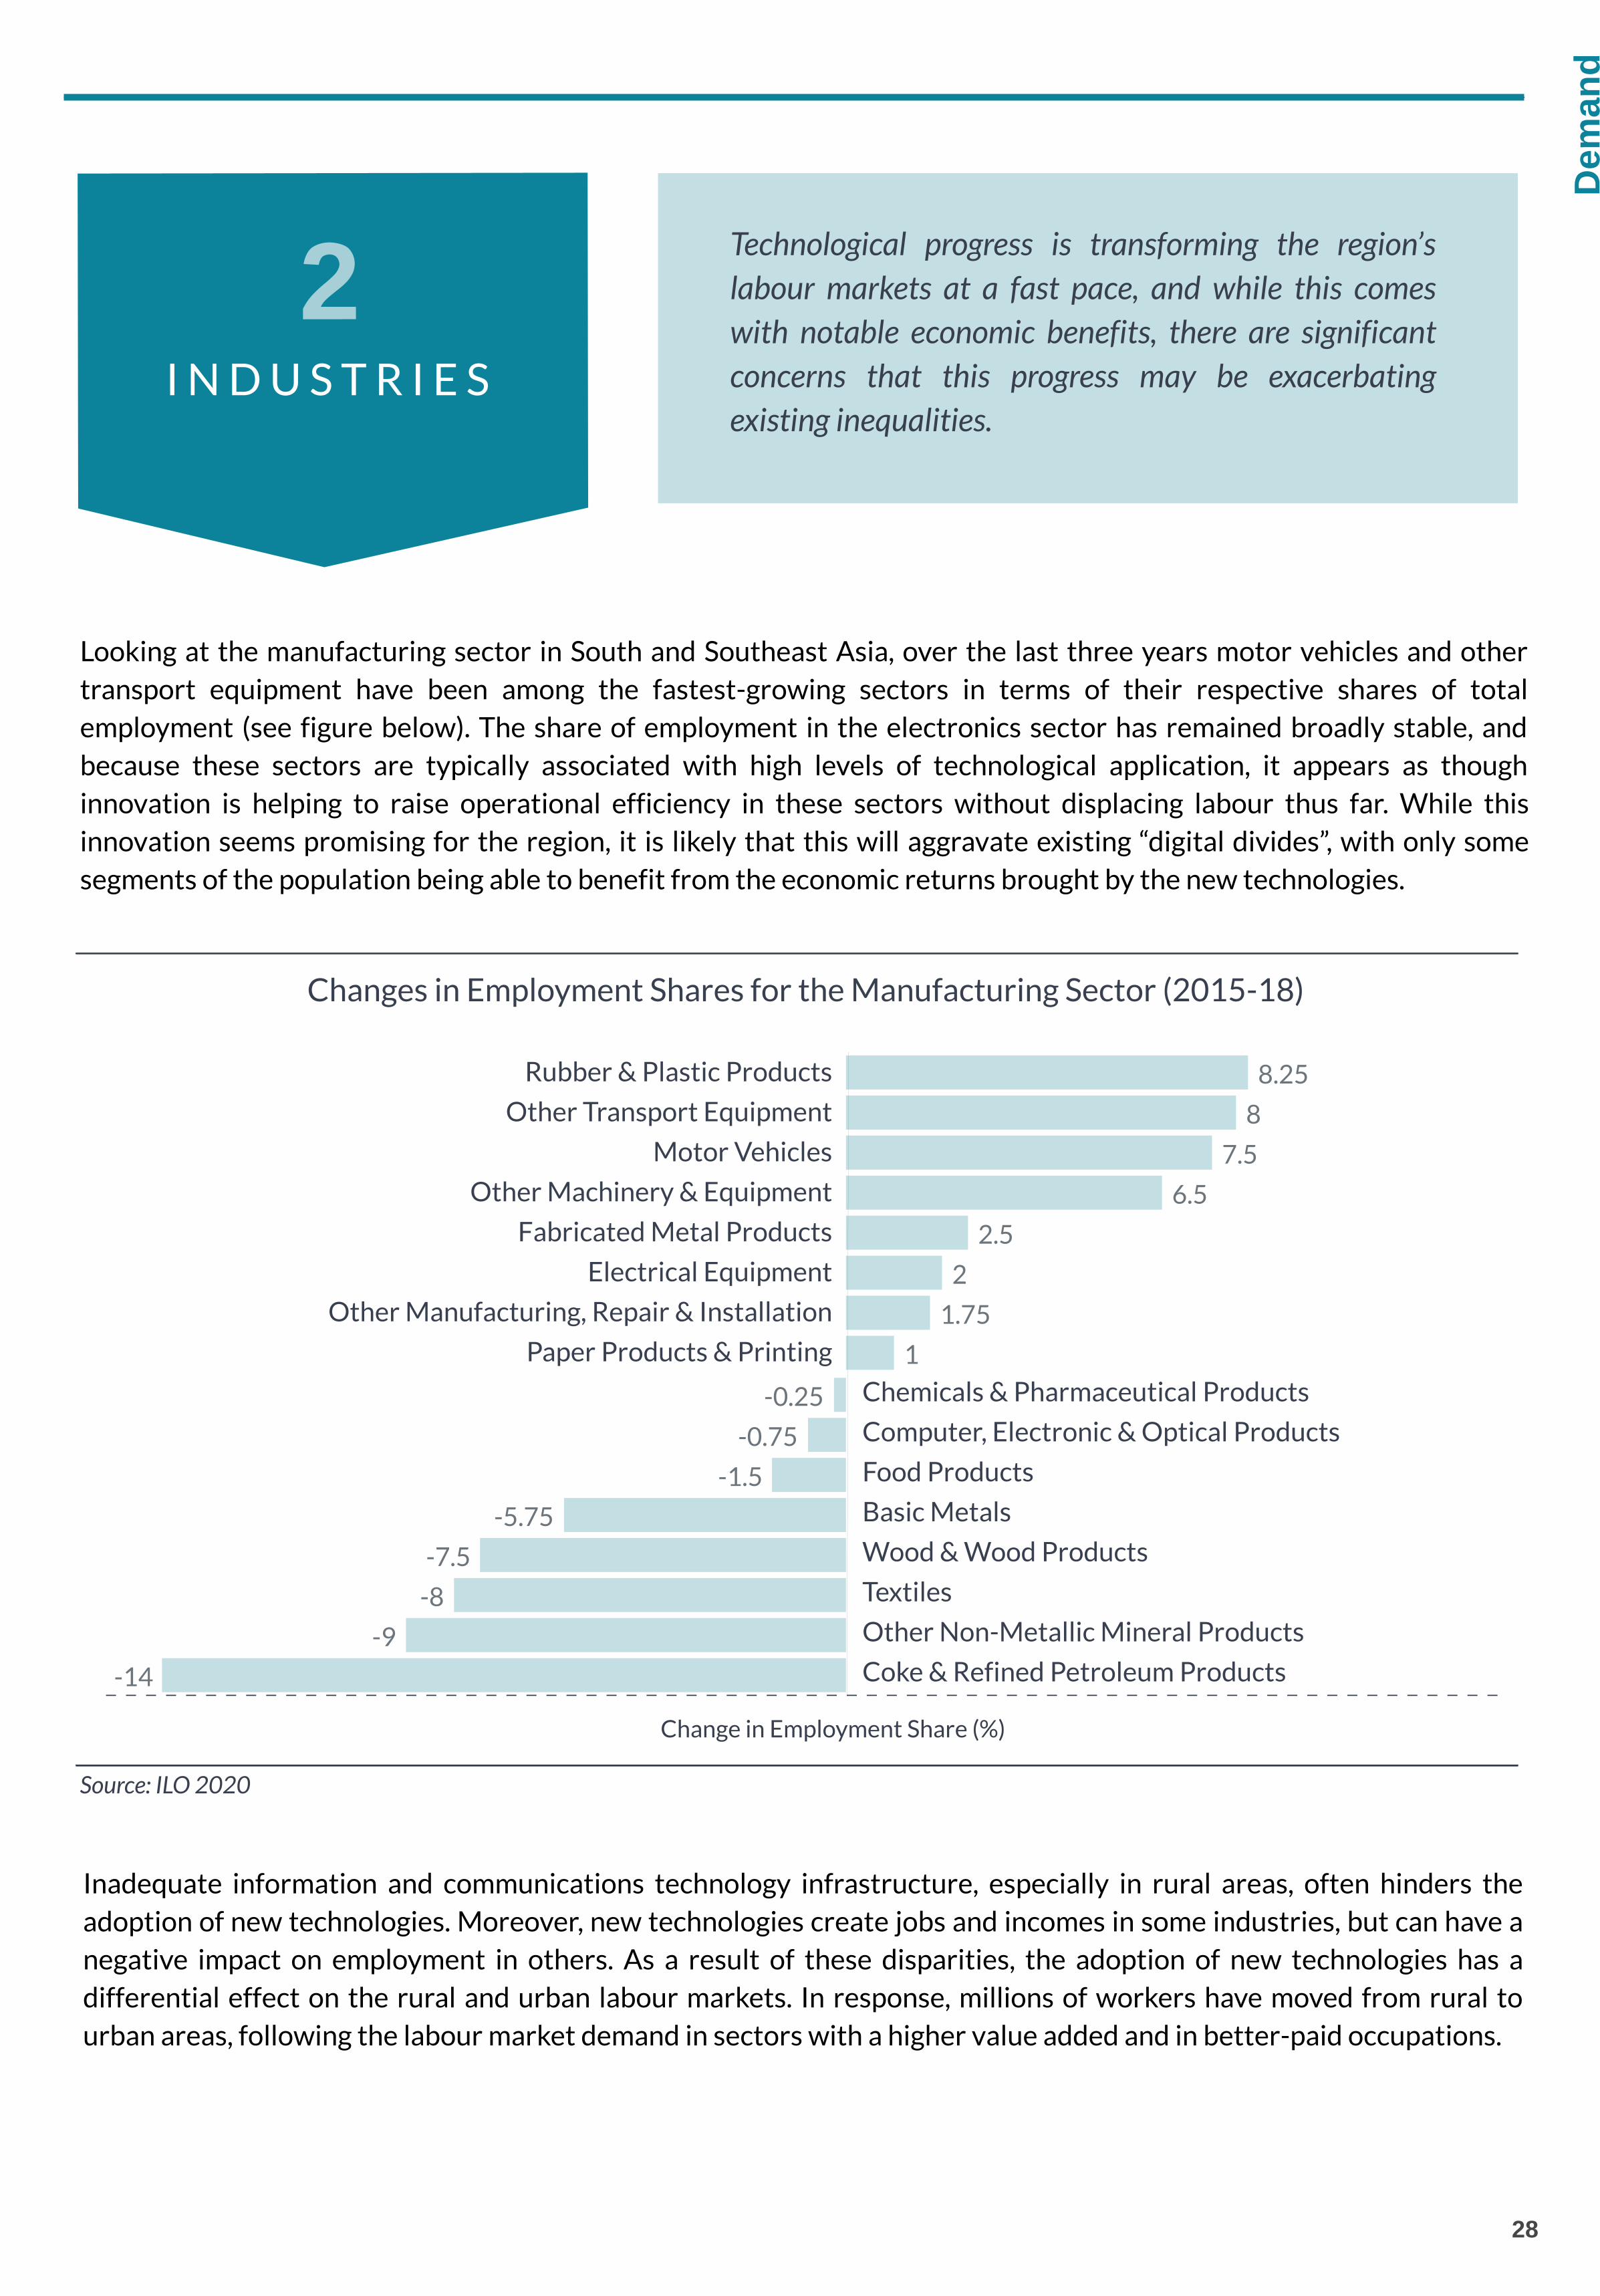
Changes in Employment Shares for the Manufacturing Sector (2015-18)
Source: ILO 2020
Inadequate information and communications technology infrastructure, especially in rural areas, often hinders the
adoption of new technologies. Moreover, new technologies create jobs and incomes in some industries, but can have a
negative impact on employment in others. As a result of these disparities, the adoption of new technologies has a
differential effect on the rural and urban labour markets. In response, millions of workers have moved from rural to
urban areas, following the labour market demand in sectors with a higher value added and in better-paid occupations.
Looking at the manufacturing sector in South and Southeast Asia, over the last three years motor vehicles and other
transport equipment have been among the fastest-growing sectors in terms of their respective shares of total
employment (see figure below). The share of employment in the electronics sector has remained broadly stable, and
because these sectors are typically associated with high levels of technological application, it appears as though
innovation is helping to raise operational efficiency in these sectors without displacing labour thus far. While this
innovation seems promising for the region, it is likely that this will aggravate existing “digital divides”, with only some
segments of the population being able to benefit from the economic returns brought by the new technologies.
Technological progress is transforming the region’s
labour markets at a fast pace, and while this comes
with notable economic benefits, there are significant
concerns that this progress may be exacerbating
existing inequalities.

29
Dem
and
20% vs. 32%
Industry
29% vs. 61%
Services
Rural Urban
Employment Sectoral Distribution
9% vs. 26%
30% vs. 55%
Medium Skill
61% vs. 19%
Low Skill
Rural Urban
High Skill
Employment Skill Level Distribution
In 2019, 47.2 percent of the labour force in the region was located in urban areas, following a steady and continuous
rise from 36.4 percent in 2005 (Gomis, 2020). Further disparities between urban and rural areas of Asia and the Pacific
can be seen in the figures above. Evidencing the increasing digital divide, the employment share of high-skilled
occupations reached 26 percent in urban areas in 2019, compared with just 8.8 percent in rural areas. With these
persistent rural–urban disparities, the workers who benefit the most from this new technological economy are
predominantly those who are already better off, thereby increasing inequality. To ensure that the gains brought by
technological progress are distributed more equitably, attention and priority should be placed on balancing technology
and innovation strategies, with a strong focus on improving infrastructure, access, investments and knowledge in rural
areas.
51% vs. 7%
Agriculture
Source: ILO 2020 Source: ILO 2020
S K I L L S
3In the face of the technological industry transformation, equipping the
workforce with the right skills is essential for economic growth.
According to research at Gartner, finding the right talent is ranked as the
second biggest challenge when it comes to disruptions in South and
Southeast Asian enterprises (TechWire Asia, 2019). The skill challenges
among the region’s countries are diverse; however, the common issue
they all face is adapting to future disruptive technologies. While
supporting STEM skills and domain expertise is integral to skill
development for the future of work in South and Southeast Asia,
research from Pakistan and India highlight the need for more well-
rounded skills development.
30
Dem
and
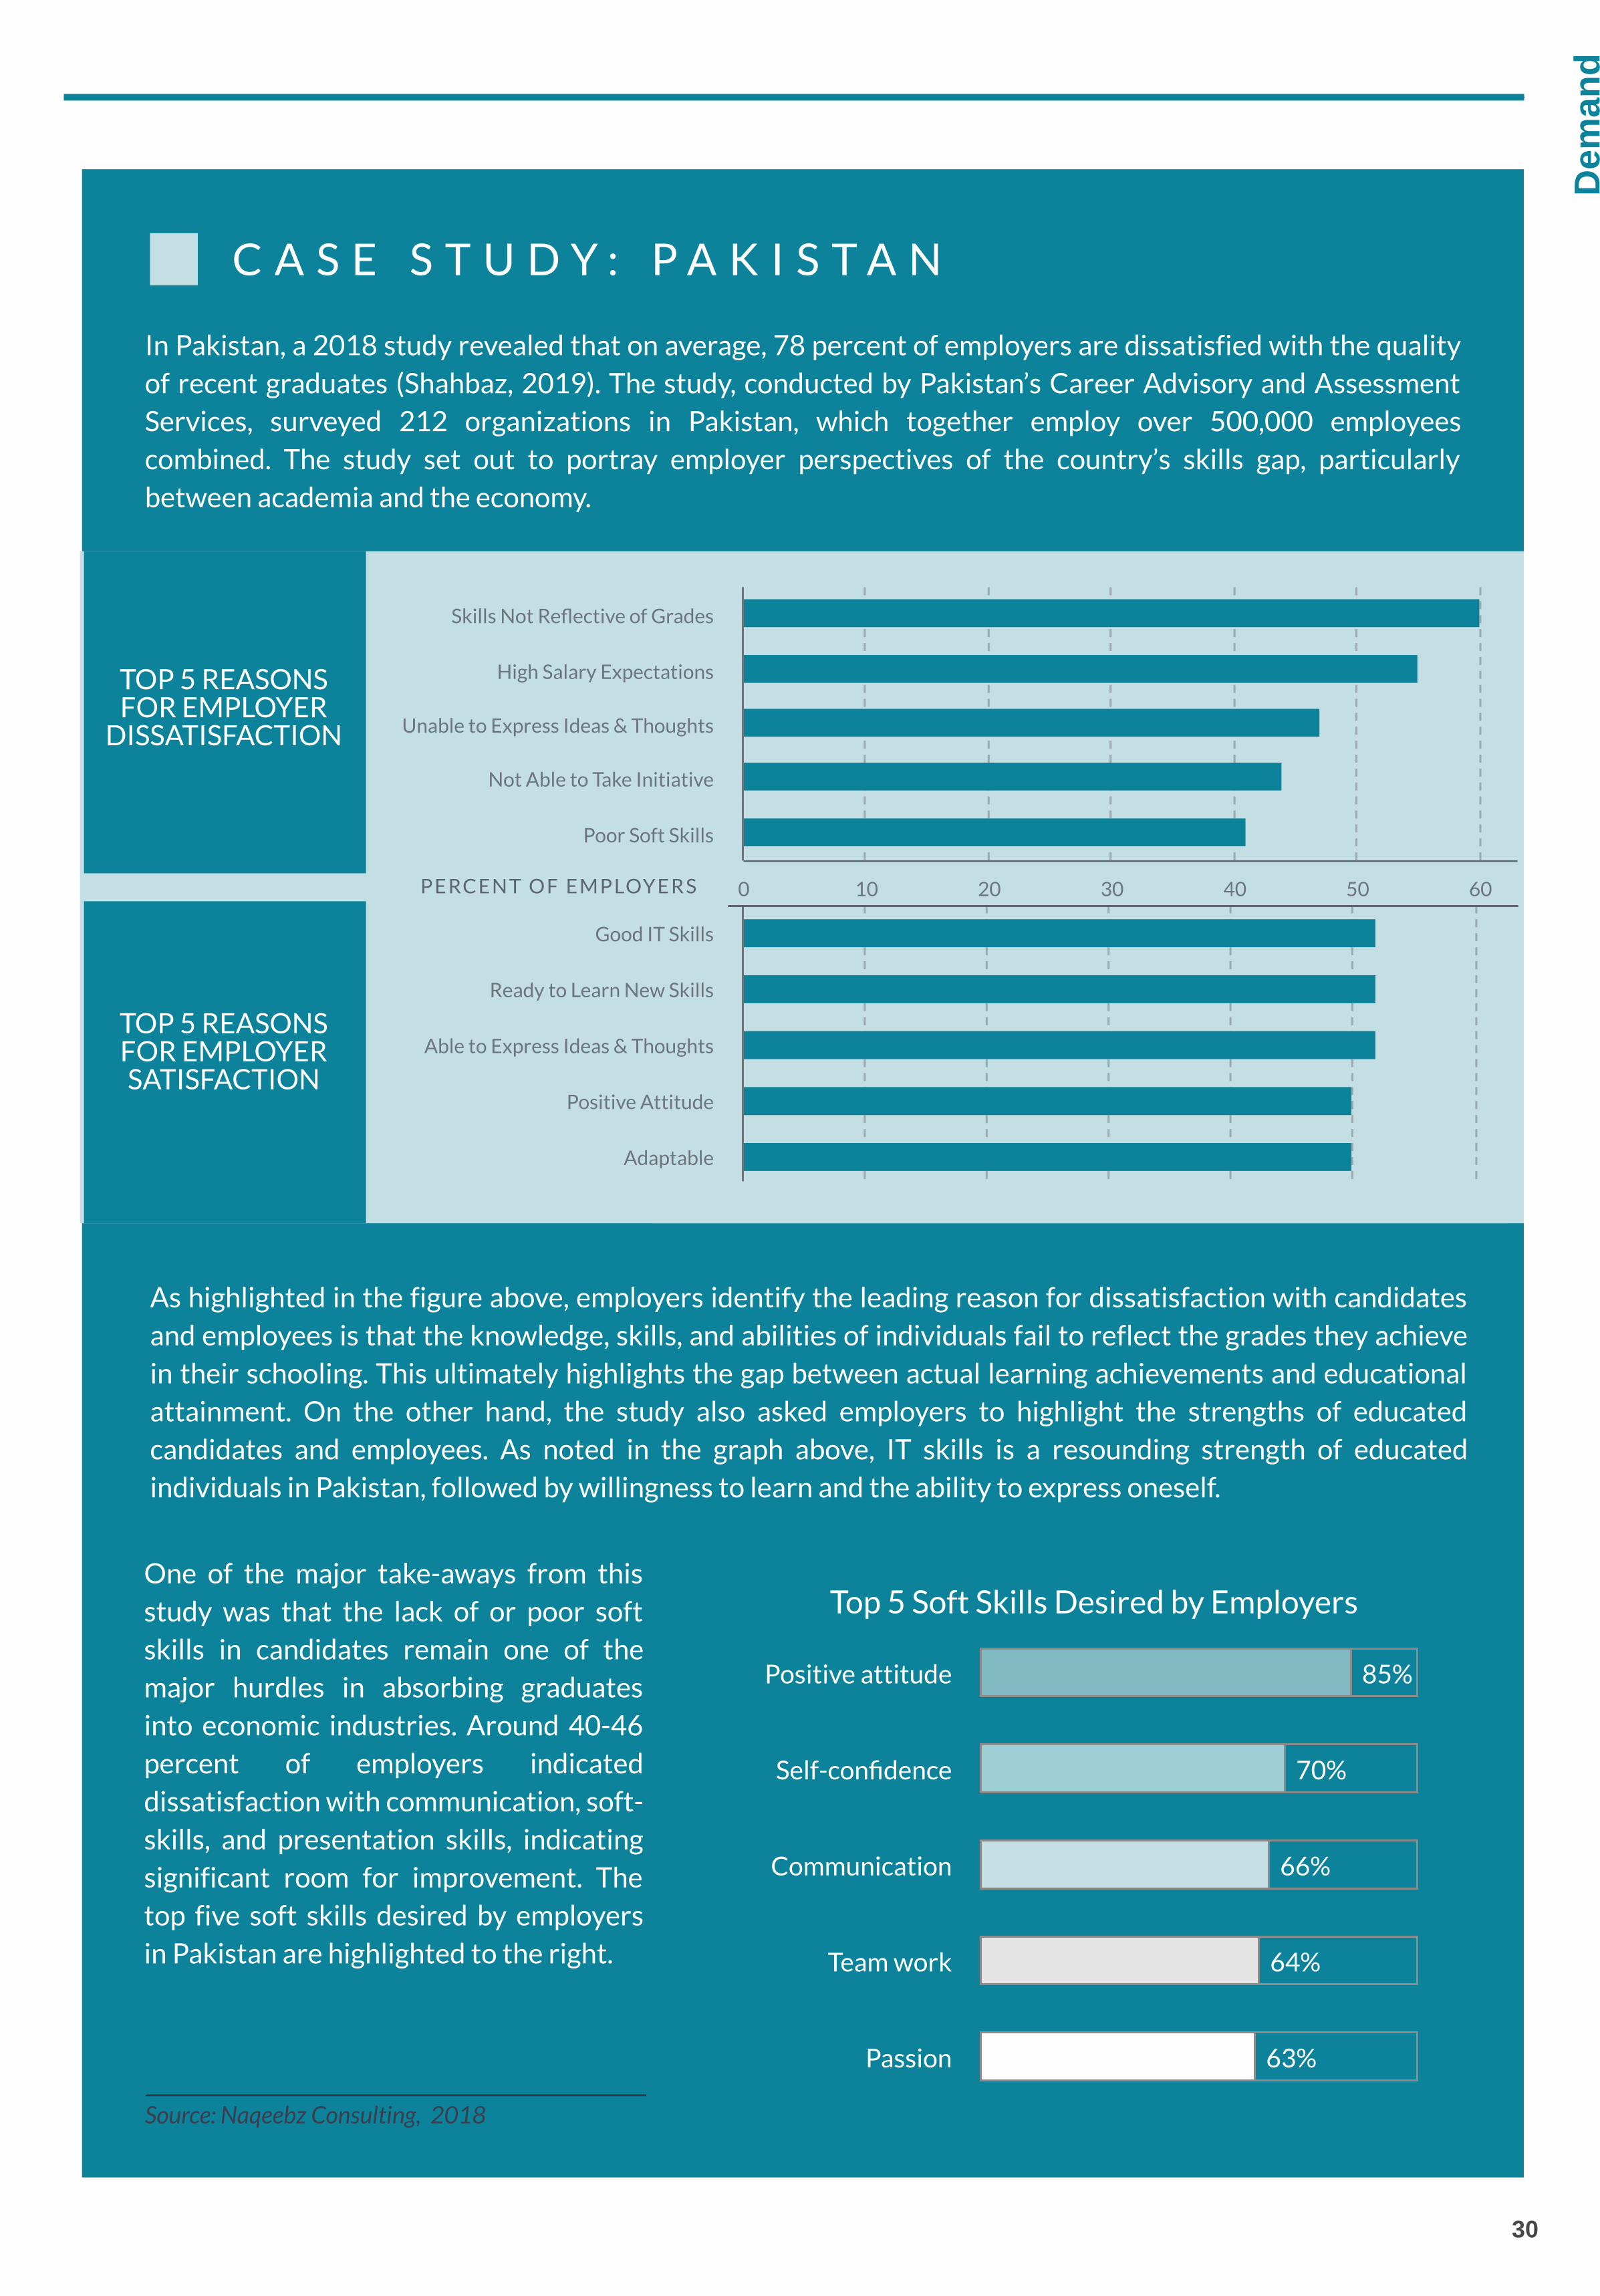
In Pakistan, a 2018 study revealed that on average, 78 percent of employers are dissatisfied with the qualityof recent graduates (Shahbaz, 2019). The study, conducted by Pakistan’s Career Advisory and AssessmentServices, surveyed 212 organizations in Pakistan, which together employ over 500,000 employeescombined. The study set out to portray employer perspectives of the country’s skills gap, particularlybetween academia and the economy.
C A S E S T U D Y : P A K I S T A N
Source: Naqeebz Consulting, 2018
As highlighted in the figure above, employers identify the leading reason for dissatisfaction with candidatesand employees is that the knowledge, skills, and abilities of individuals fail to reflect the grades they achievein their schooling. This ultimately highlights the gap between actual learning achievements and educationalattainment. On the other hand, the study also asked employers to highlight the strengths of educatedcandidates and employees. As noted in the graph above, IT skills is a resounding strength of educatedindividuals in Pakistan, followed by willingness to learn and the ability to express oneself.
Skills Not Re�ective of Grades
High Salary Expectations
Unable to Express Ideas & Thoughts
Not Able to Take Initiative
Poor Soft Skills
0 10 20 30 40 50 60
TOP 5 REASONSFOR EMPLOYER
DISSATISFACTION
Good IT Skills
Ready to Learn New Skills
Able to Express Ideas & Thoughts
Positive Attitude
Adaptable
0 10 20 30 40 50 60
P E RC E N T O F E M P LOY E R S
TOP 5 REASONSFOR EMPLOYERSATISFACTION
85%
70%
66%
64%
63%
Positive attitude
Self-con�dence
Communication
Team work
Passion
Top 5 Soft Skills Desired by EmployersOne of the major take-aways from thisstudy was that the lack of or poor softskills in candidates remain one of themajor hurdles in absorbing graduatesinto economic industries. Around 40-46percent of employers indicateddissatisfaction with communication, soft-skills, and presentation skills, indicatingsignificant room for improvement. Thetop five soft skills desired by employersin Pakistan are highlighted to the right.

31
Dem
and
Looking at the drivers of talent shortages below, lack of experience and hard skills in India is much greaterthan the global average, highlighting the need for candidates to be increasingly and more specificallyprepared for the jobs on the market.
C A S E S T U D Y : I N D I A
Source: India Skills Report, 2019
The India Hiring Intent 2020 survey asks employers to reflect on the skills demanded by their company andby the Indian Economy. When asked about the skills areas that the employers foresee as up and coming in thenext five years in their organizations, employers overwhelmingly cited the increasing role of data science andanalysis, as well as social media marketing, largely due to the increasing role of advanced technologies,impacting functions across the value chain.
29%
18%
20%
25%
19%
26%
8%
8%
12%
15%
2%
1%
10%
7%
Lack of Applicants Lack of Experience Lack of Hard Skills Lack of Soft Skills Pay Expectations
Bene�t Expectations Other
GLOBAL
Drivers of Talent Shortage
INDIA
Source: ManpowerGroup, 2018
40%
35%
25%
Learning Agility (40%)
Adaptability (35%)
English Language (25%)
Top Skills Required by Employers in IndiaHowever, while hard skills and domain expertiseare important, employers in India haveexpressed that these technical skills are notenough, and the development of soft-skillsshould not be overlooked. The India HiringIntent 2020 survey asks employers to identifythe most important skills they look for inprospective employees. The top five skills werepositive attitude, adaptability, learning agility,interpersonal skills, and domain expertise (IndiaSkills Report, 2020). While the 2019 surveyhighlighted a number of similar skills, the 2020survey revealed the unanimous desire forpositivity. All employers surveyed mentioned therequisite of a “positive attitude” in a potentialemployee, with the sense that a candidate with apositive outlook towards their job and towardslearning is more likely to perform well in theirprofessional career compared to theircounterparts.

32
Dem
and
Despite significant economic development, Latin America and the Caribbean faces high levels of labourunderutilization and informality. Low-productivity jobs that pay comparatively low wages are common, andwith automation shifting the labour market, demand for low-skilled service occupations such as cleaning andmaintenance has risen. While educational attainment is quite high across the region, the labour market hasnot been dynamic enough to absorb the highly educated professionals entering the workforce.
Latin America remains the region with the widest skills gap in the world. While each country is facing uniquechallenges, firms throughout the region struggle to hire staff with the right skills. A combination of bothtechnical and soft skills are demanded region-wide, and tailored programs to address these gaps areessential to enable the anticipated economic growth in Latin America and the Caribbean.
S U M M A R Y
While GDP growth is expected to climb to 1.8 percent according to ILOpredictions, the extent of labour underutilization in the region remainssignificant, at 19.9 percent in 2019 and affecting 66 million people(Gomis, 2020). In addition, informal employment is more common thanwould be expected, given the region's level of economic development.In 2019, 53.1 percent of all workers were employed informally anddisproportionately in low-productivity jobs that pay comparatively lowwages (Gomis, 2020). As a result, 19.5 million workers in Latin Americaand the Caribbean are not earning enough to lift themselves and theirfamilies out of poverty.
E M P L O Y M E N T
1
LATIN AMERICA& THE CARIBBEAN
Rat
e o
f Un
der
uti
lizat
ion
(%)
ILO Data ILO Predictions
2010 2011 2012 2013 2014 2015 2016 2017 2018 2019 2020 2021 2022 202316
17
18
19
20
Latin America & the Caribbean: Labour Underutilization
Source: ILO, 2020

-2.22-2.22-2.22-1.8-1.8-1.8-1.71-1.71-1.71
-1.63-1.63-1.63-0.73-0.73-0.73
-0.62-0.62-0.62-0.28-0.28-0.28
-0.15-0.15-0.15-0.14-0.14-0.14-0.14-0.14-0.14
-0.06-0.06-0.06-0.04-0.04-0.04-0.03-0.03-0.03-0.02-0.02-0.02
0.020.020.020.030.030.030.060.060.06
0.240.240.240.250.250.25
0.330.330.330.350.350.350.380.380.380.390.390.39
0.660.660.661.011.011.011.041.041.04
1.341.341.341.41.41.4
2.062.062.06
LibrarianSocial worker
Technician in media and communicationsSpecialist in social sciences
Health professionalClerk and other administrative support personnel
Construction workerPilot and air tra ffic controller
Lawyer and similarHealth technicianFood preparation
Specialist in mathematics and computer scienceSalesman
Specialist in financial operations and businessesCleaning and maintenance
ManagerMachine operatorPersonal careRepairman (includes installation)DriverTechnician in physical sciencesSpecialist in educationTechnician in life sciencesArtist, sports athleteSecurity guardCustomer serviceExtractive industry personnelTechnician in social sciencesSpecialist in life sciences
33
Dem
and
I N D U S T R I E S
2
Change in Employment Share (%)
Changes in Employment Shares by Occupation (2000-15)
Source: Inter-American Development Bank, 2019
As demonstrated in the figure below, the Inter-American Development Bank highlights that Latin America and theCaribbean have seen a significant decrease in manual occupations that are easily automated, like machine operatorsand equipment repair personnel. On the other hand, demand in low-skill service sectors has risen, as demonstrated bythe surge in employment in cleaning and maintenance occupations. Some of the highest-paid professionals, such asfinance specialists or computer technicians, have increased their participation rate; however, the labor market in LatinAmerica and the Caribbean for the most qualified people has not been dynamic enough to absorb the increasingnumber of highly educated professionals who joined the labor force in the past decade (Amaral, 2019). This contrastswith more developed countries, where the incorporation of new technologies has boosted the demand for and thewages of professionals with higher levels of education.
Automation brings many prospective opportunities to
Latin America and the Caribbean. However, this wave
of technological innovation also raises difficult
questions about the broader impact of automation on
jobs, skills, wages, and the nature of work itself.
Manual Occupation Knowledge Occupation
S K I L L S
3
34
Dem
and
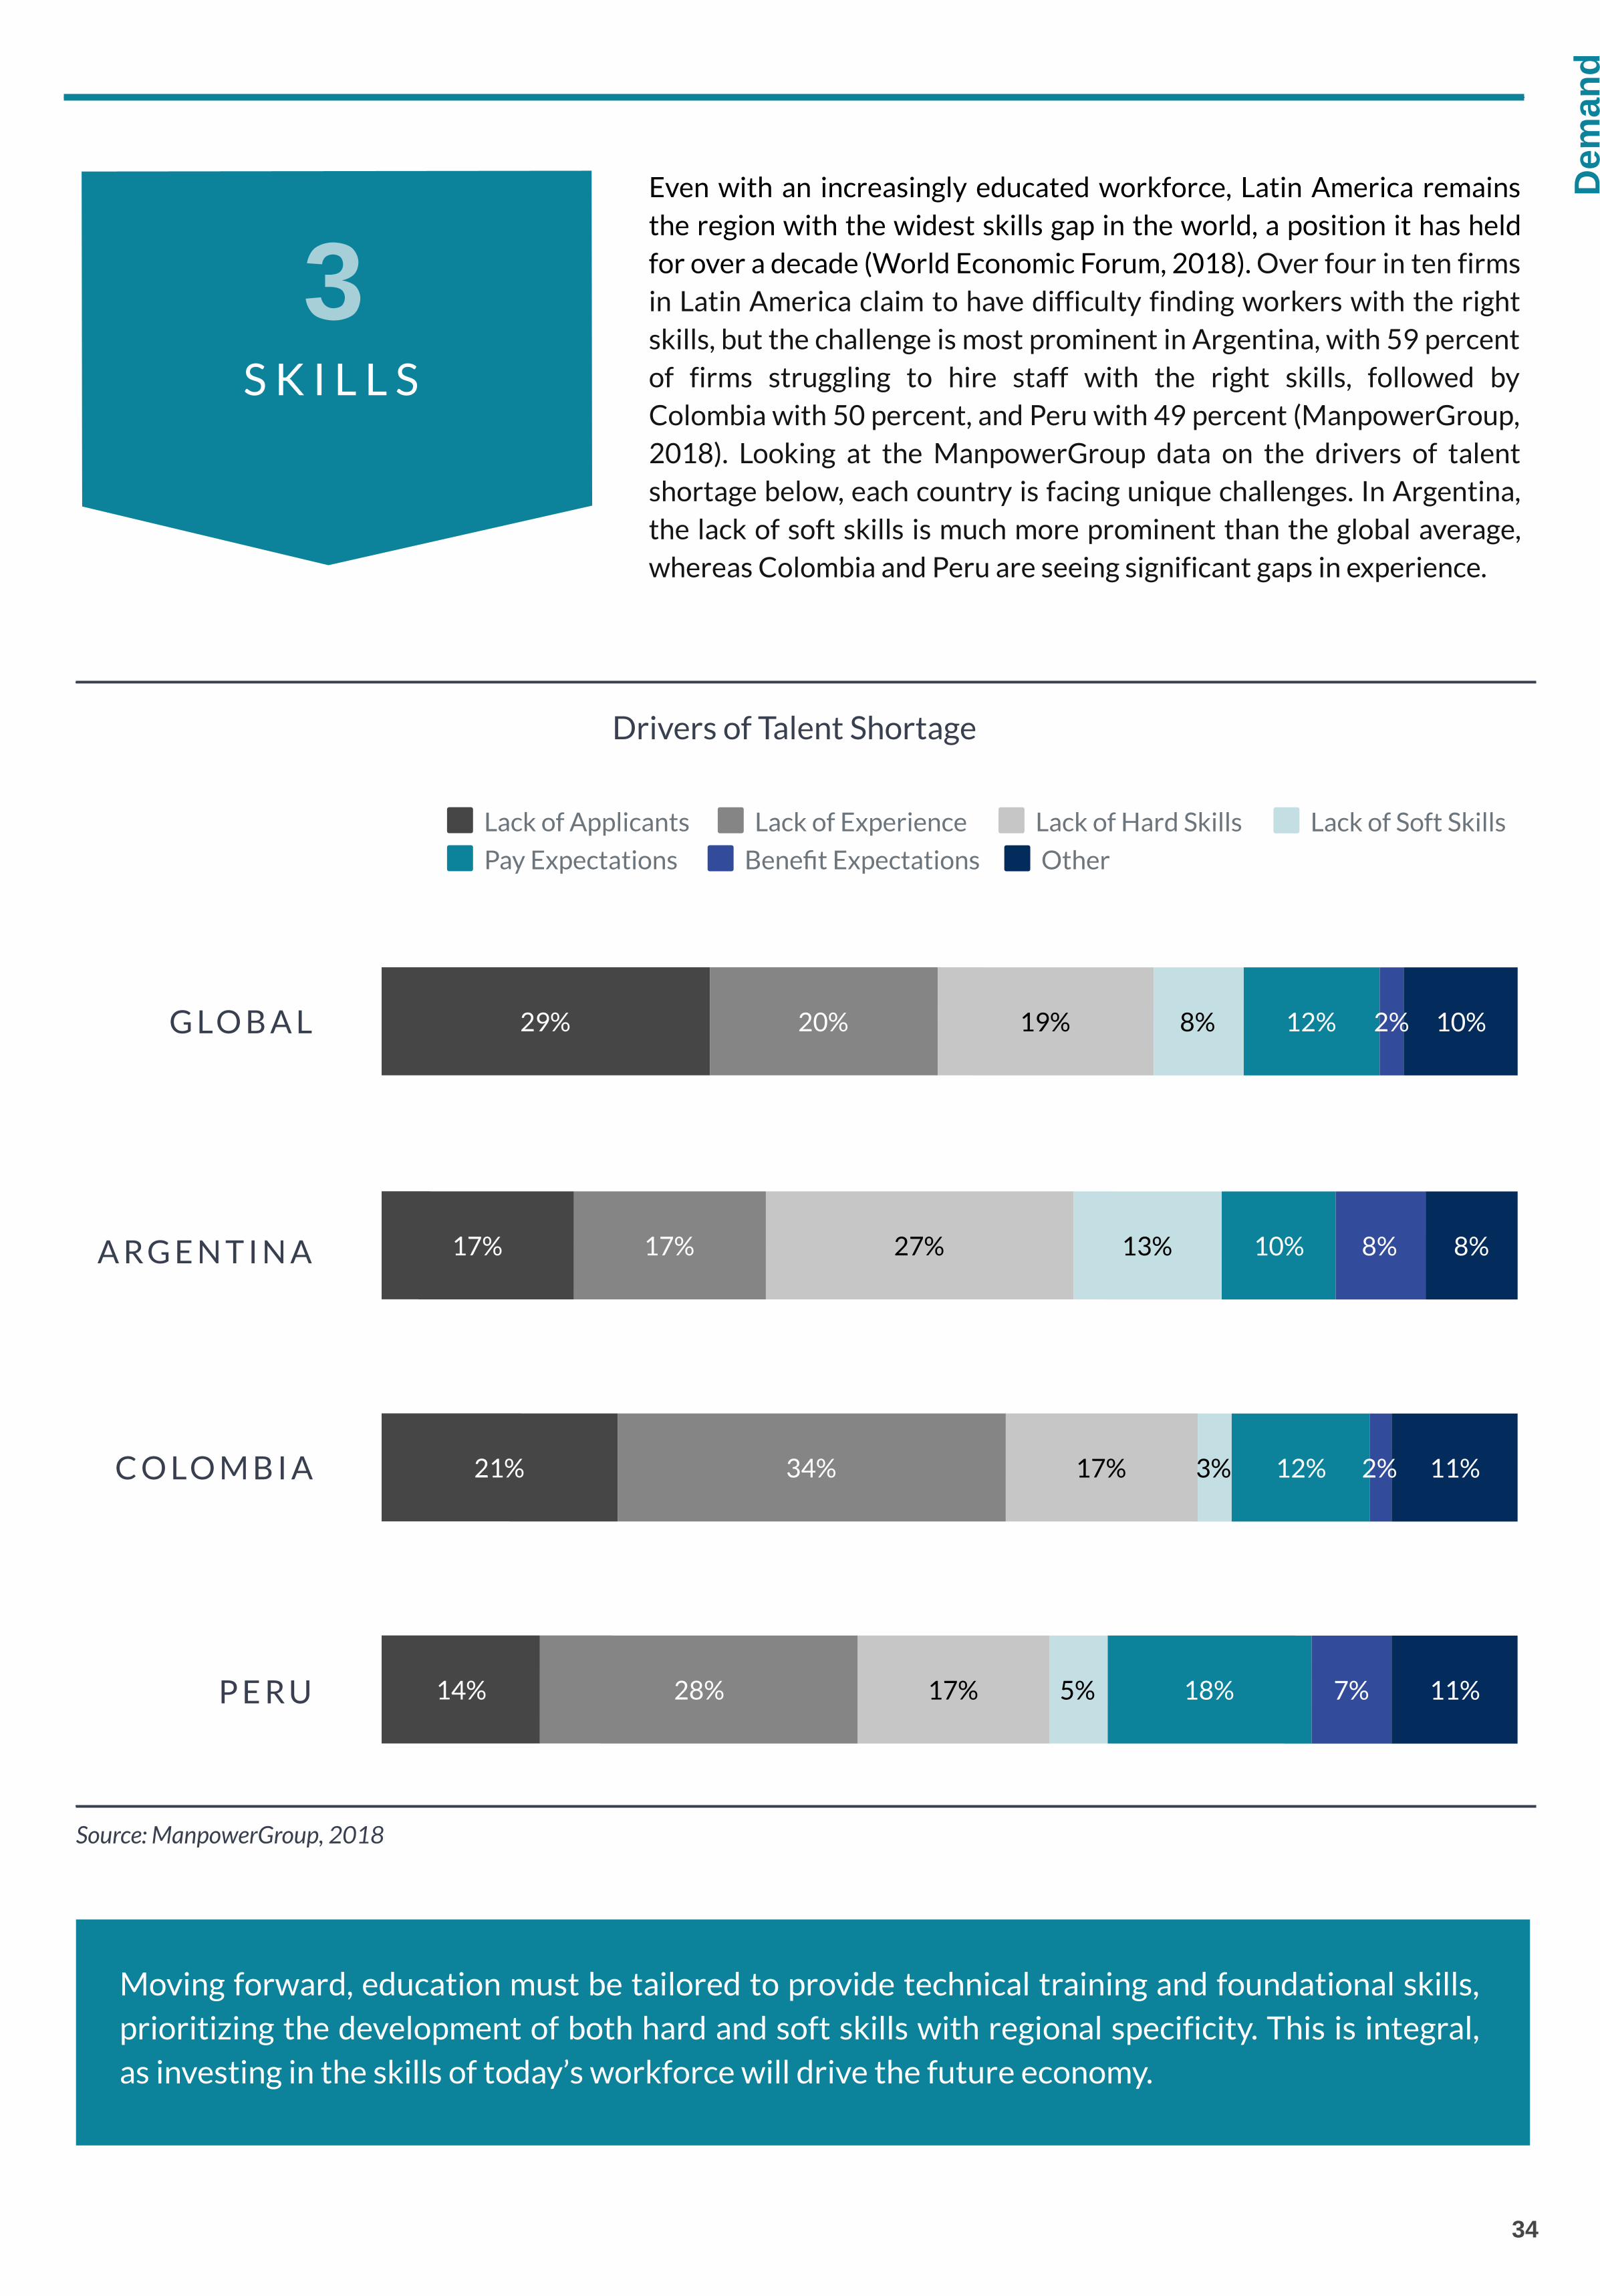
Even with an increasingly educated workforce, Latin America remainsthe region with the widest skills gap in the world, a position it has heldfor over a decade (World Economic Forum, 2018). Over four in ten firmsin Latin America claim to have difficulty finding workers with the rightskills, but the challenge is most prominent in Argentina, with 59 percentof firms struggling to hire staff with the right skills, followed byColombia with 50 percent, and Peru with 49 percent (ManpowerGroup,2018). Looking at the ManpowerGroup data on the drivers of talentshortage below, each country is facing unique challenges. In Argentina,the lack of soft skills is much more prominent than the global average,whereas Colombia and Peru are seeing significant gaps in experience.
Moving forward, education must be tailored to provide technical training and foundational skills,prioritizing the development of both hard and soft skills with regional specificity. This is integral,as investing in the skills of today’s workforce will drive the future economy.
Source: ManpowerGroup, 2018
29%
17%
21%
14%
20%
17%
34%
28%
19%
27%
17%
17%
8%
13%
3%
5%
12%
10%
12%
18%
2%
8%
2%
7%
10%
8%
11%
11%
Lack of Applicants Lack of Experience Lack of Hard Skills Lack of Soft Skills
Pay Expectations Bene�t Expectations Other
G LO B A L
A R G E N T I N A
C O LO M B I A
P E R U
Drivers of Talent Shortage
35
INVESTMENT
OPPORTUNITIES
& OUTCOMES
The Educational Investment Outcomes and Opportunities section provides an overview of
each of the following education levels: 1) early childhood education, 2) primary education, 3)
secondary education, and 4) tertiary education. Within each level, an analysis of the major
trends and level-specific challenges are presented, as they apply to lower-middle income
countries, and specifically to EduFinance markets. Various case studies and evidenced
learning interventions are cited, in an effort to provide data that is both contextually relevant
and applicable. Each chapter concludes with a forward looking section that summarizes
recommendations and future considerations for EduFinance.

% of Students Enrolled in Private Primary School
Ave
rage
Per
cen
t In
crea
se in
Ear
nin
gsp
er A
dd
itio
nal
Yea
r o
f Co
mp
leti
on
(%)
GhanaGhanaGhana
NigeriaNigeriaNigeria
TanzaniaTanzaniaTanzania
UgandaUgandaUganda
EthiopiaEthiopiaEthiopia
MalawiMalawiMalawi
EcuadorEcuadorEcuador
PeruPeruPeru
PakistanPakistanPakistan
5 10 15 20 25 30 35 40 450
5
10
15
20
36
For decades, economists have worked to estimate the private and social returns to education to illustrate thecase for investment. Peet, Fink, and Fawzi (2015) present one of the most comprehensive studies ofcomparative returns to education at the country level. This study uses national household surveys from 25developing countries between 1985 and 2012 to estimate the average increase in earnings for eachadditional year of school completed at a given level of education (Peet et al., 2015). The findings for thereturns to education in EduFinance markets are depicted in the figures below, which plot the average rate ofreturn for an additional year of completion at a given level of education against the percentage of studentsenrolled in private schools. In the figures below, the size of the bubble indicates the total population ofprimary or secondary school aged children, respectively.
O V E R V I E W
The figure above identifies key investment opportunities forEduFinance in primary education. For example, an additional year ofprimary school completion in Ethiopia generates an average increase inearnings of 17.3 percent, the highest among all EduFinance marketsrepresented. Despite having a relatively low percentage of studentsenrolled in private primary schools, at about five percent, Ethiopia hasa large primary-school aged population of approximately 16.8 millionchildren, meaning that roughly 840,000 children could potentiallybenefit from EduFinance investments. On the opposite end of thespectrum, Pakistan has one of the lowest rates of return on investmentin primary education across EduFinance markets. However, Pakistan’spopulation of approximately 24.7 million primary-school aged children,and private school enrollment rate of 35 percent present an immenseopportunity for EduFinance.
P R I M A R Y
1
RETURNS ON INVESTMENT
Return on Investment in Primary Education
Source: Peet, Fink, and Fawzi, 2015; UNESCO UIS, 2019.
OP
PO
RT
UN
ITIE
S &
OU
TC
OM
ES
Number of PrimarySchool-Aged Children
37
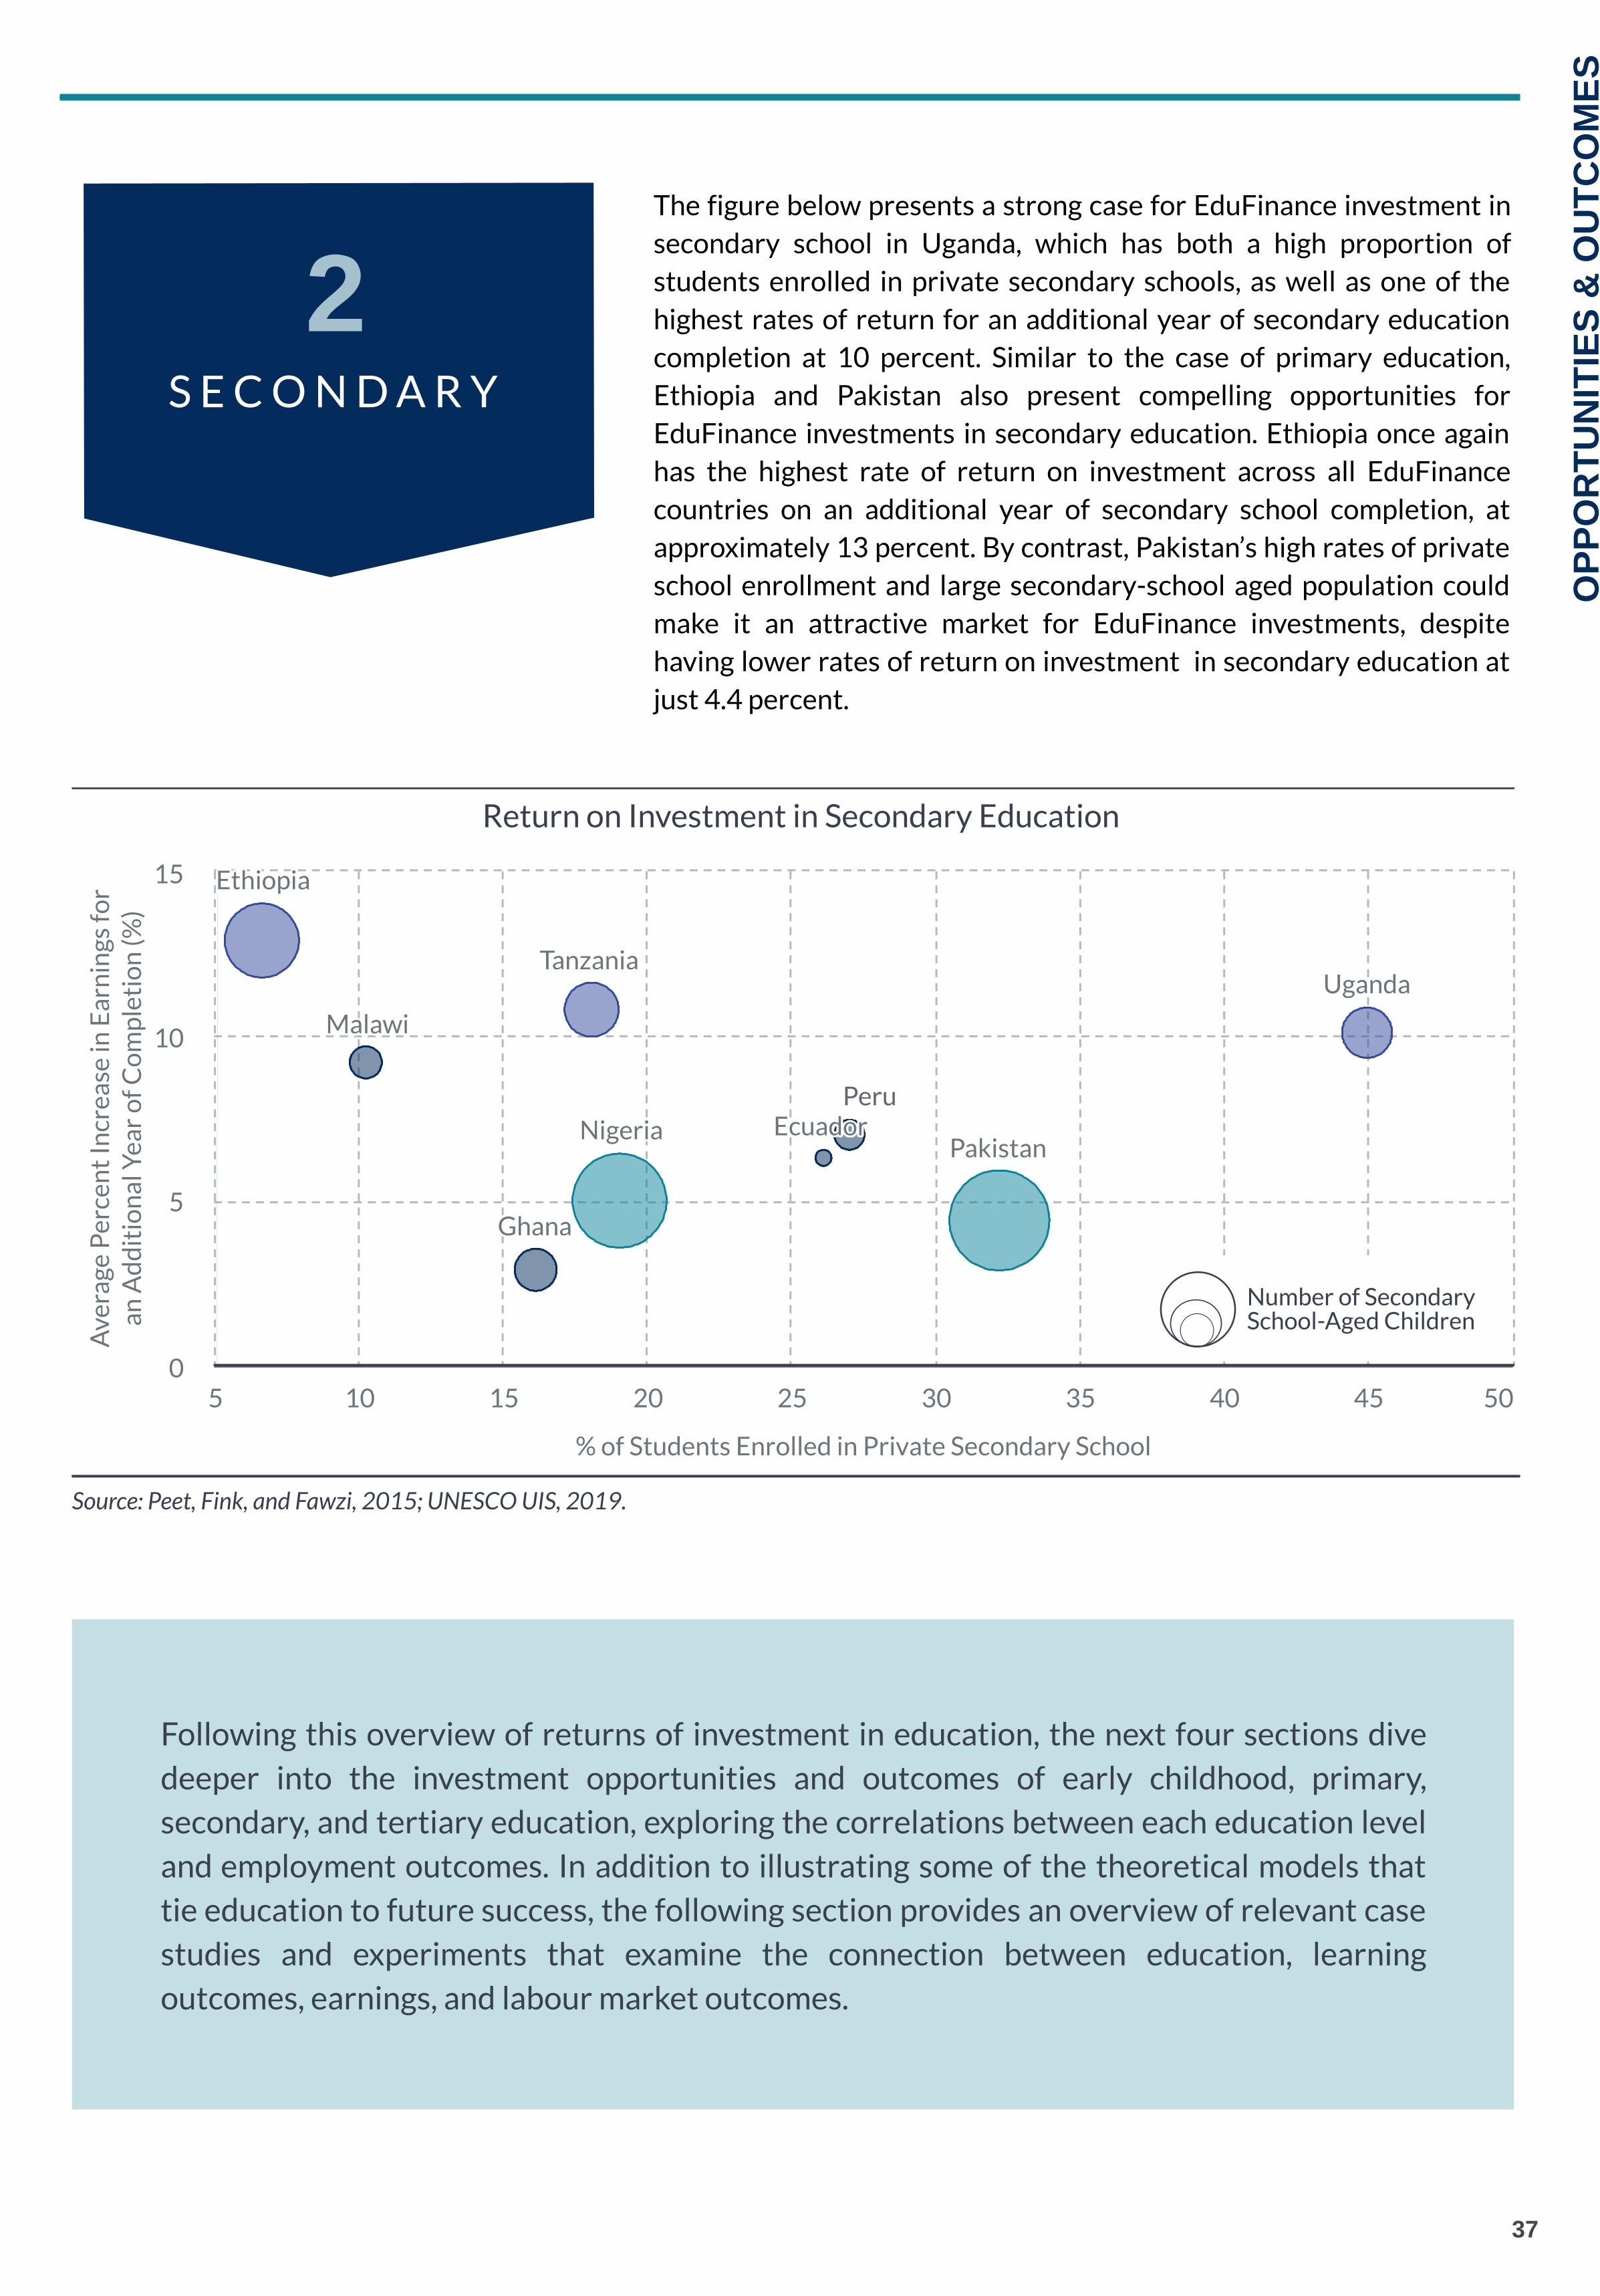
The figure below presents a strong case for EduFinance investment in
secondary school in Uganda, which has both a high proportion of
students enrolled in private secondary schools, as well as one of the
highest rates of return for an additional year of secondary education
completion at 10 percent. Similar to the case of primary education,
Ethiopia and Pakistan also present compelling opportunities for
EduFinance investments in secondary education. Ethiopia once again
has the highest rate of return on investment across all EduFinance
countries on an additional year of secondary school completion, at
approximately 13 percent. By contrast, Pakistan’s high rates of private
school enrollment and large secondary-school aged population could
make it an attractive market for EduFinance investments, despite
having lower rates of return on investment in secondary education at
just 4.4 percent.
S E C O N D A R Y
2
Return on Investment in Secondary Education
Source: Peet, Fink, and Fawzi, 2015; UNESCO UIS, 2019.
OP
PO
RT
UN
ITIE
S &
OU
TC
OM
ES
% of Students Enrolled in Private Secondary School
Av
era
ge
Pe
rc
en
t I
nc
re
as
e i
n E
ar
nin
gs
fo
r
an
Ad
dit
ion
al
Ye
ar
of
Co
mp
letio
n (
%)
GhanaGhanaGhana
NigeriaNigeriaNigeria
TanzaniaTanzaniaTanzania
UgandaUgandaUganda
EthiopiaEthiopiaEthiopia
MalawiMalawiMalawi
EcuadorEcuadorEcuadorPakistanPakistanPakistan
5 10 15 20 25 30 35 40 45 50
0
5
10
15
Number of Secondary
School-Aged Children
Peru
Following this overview of returns of investment in education, the next four sections dive
deeper into the investment opportunities and outcomes of early childhood, primary,
secondary, and tertiary education, exploring the correlations between each education level
and employment outcomes. In addition to illustrating some of the theoretical models that
tie education to future success, the following section provides an overview of relevant case
studies and experiments that examine the connection between education, learning
outcomes, earnings, and labour market outcomes.
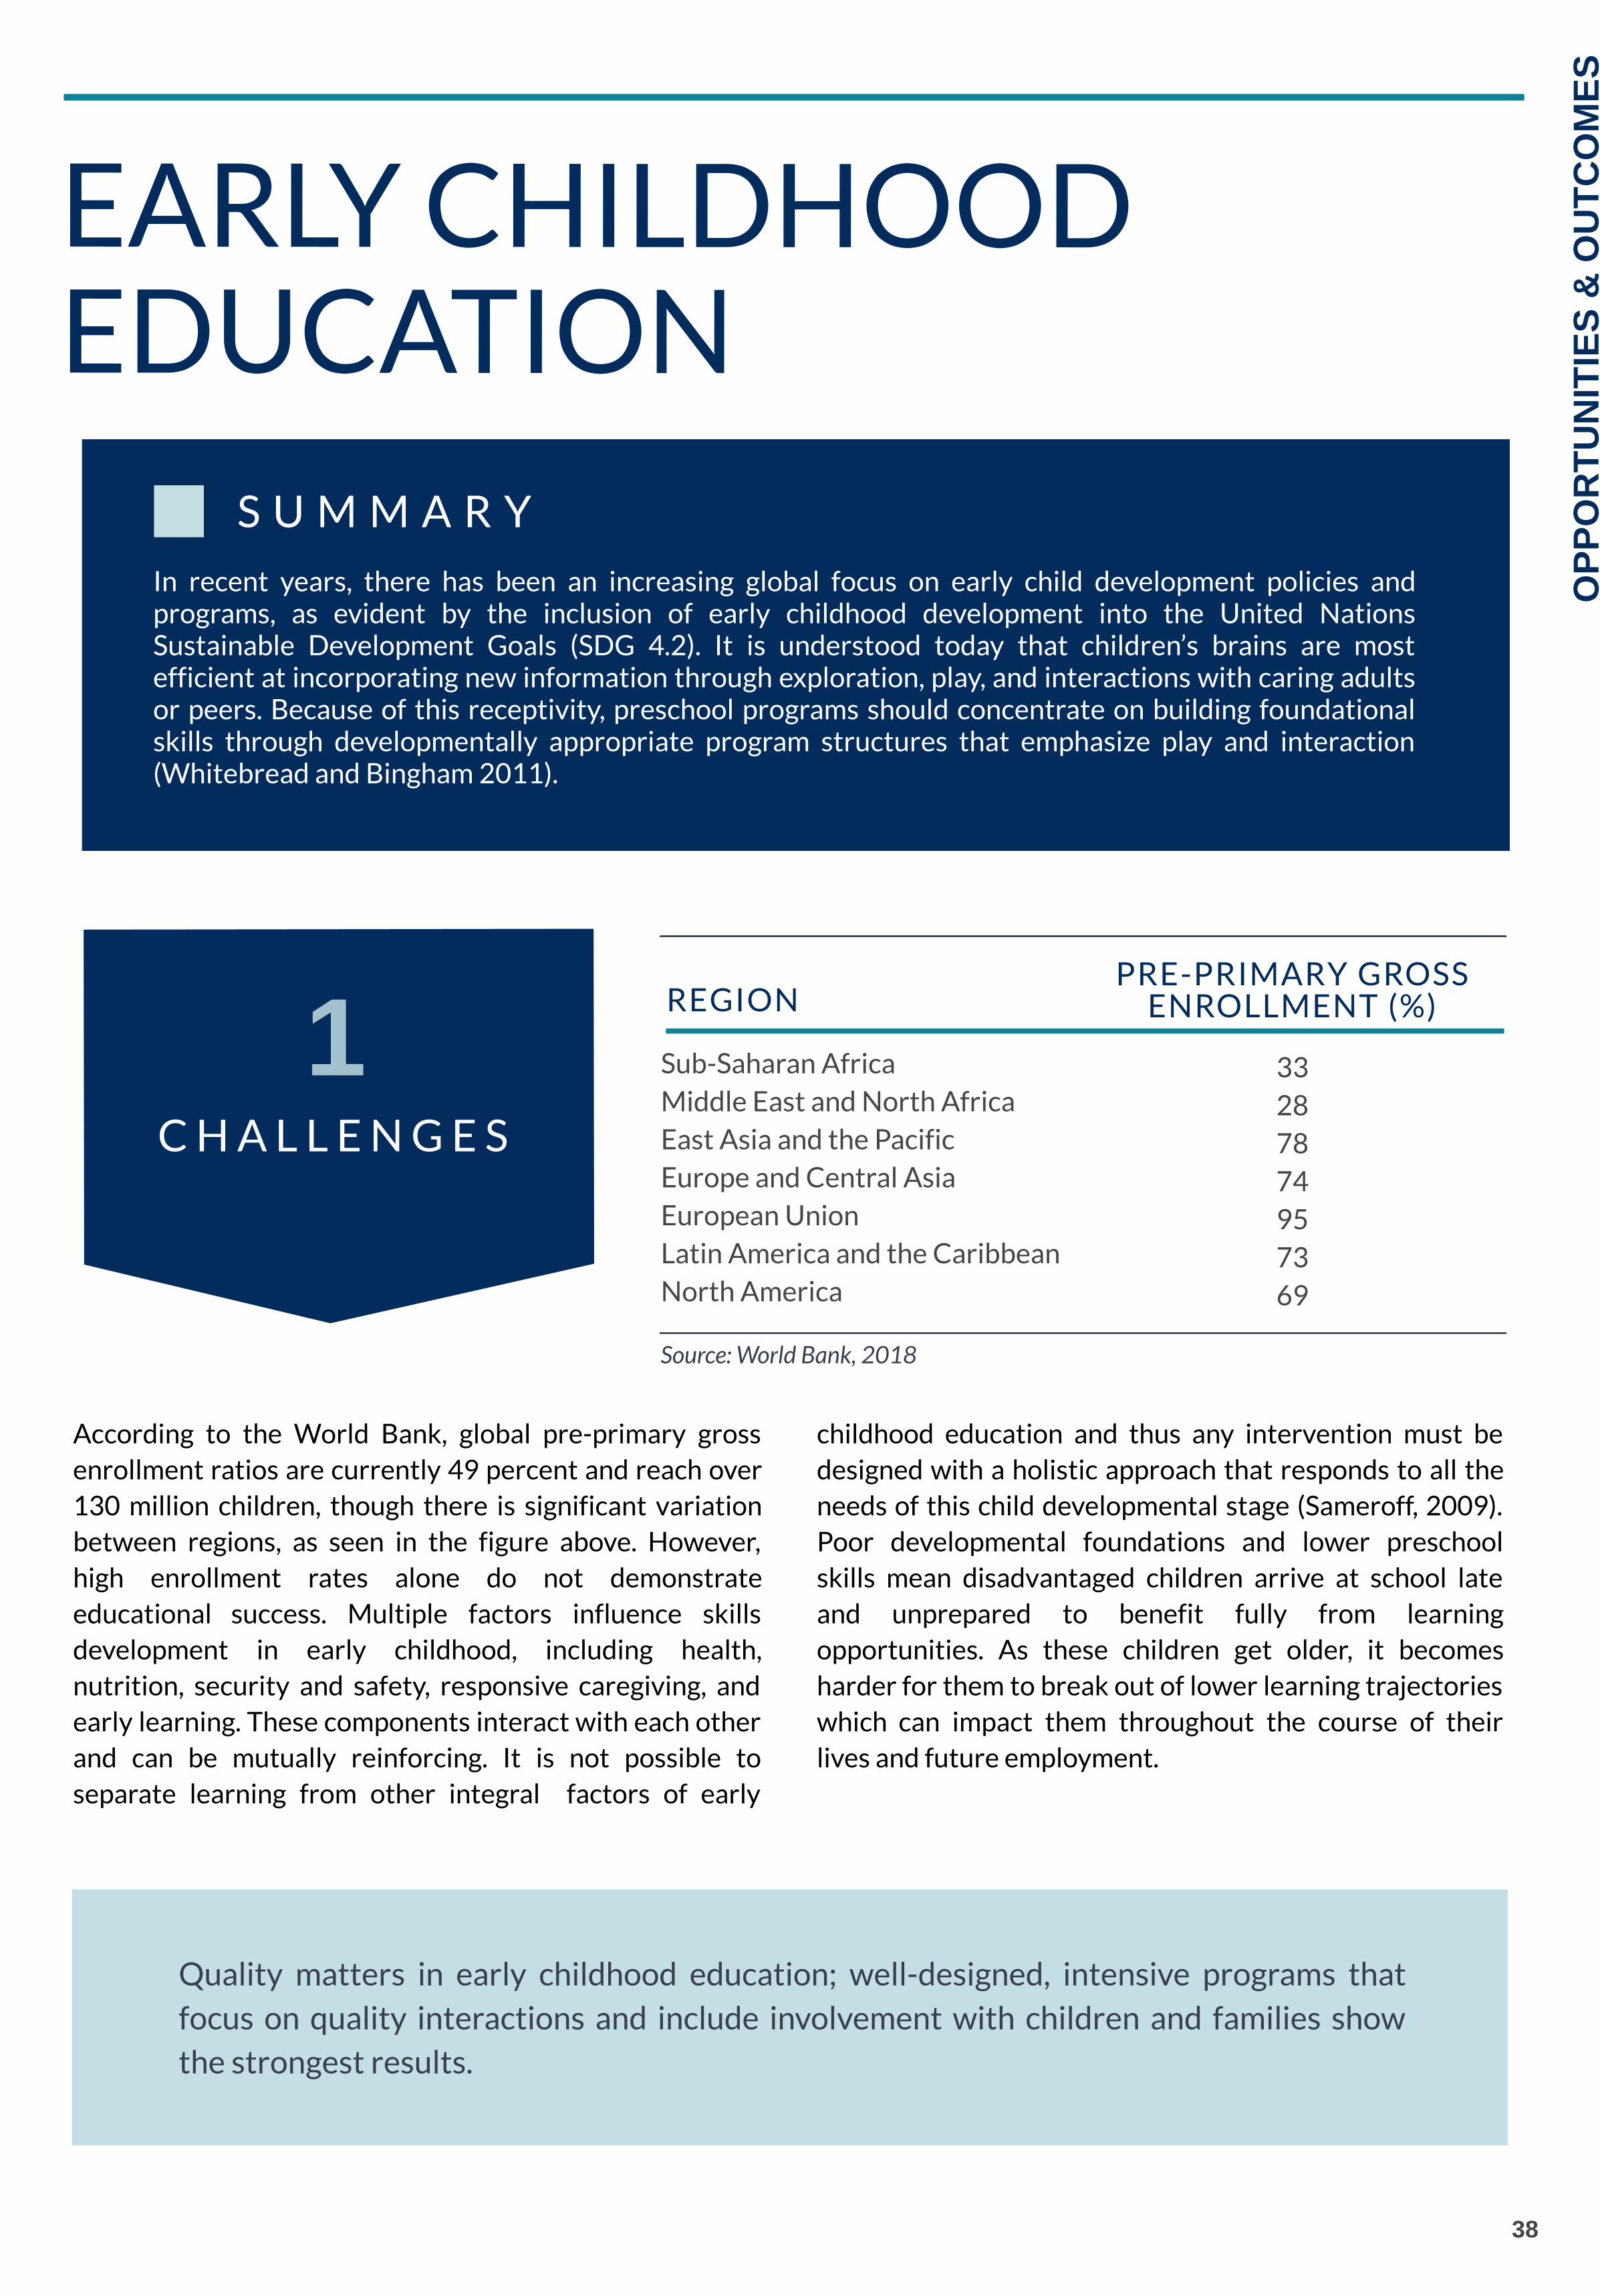
38
In recent years, there has been an increasing global focus on early child development policies andprograms, as evident by the inclusion of early childhood development into the United NationsSustainable Development Goals (SDG 4.2). It is understood today that children’s brains are mostefficient at incorporating new information through exploration, play, and interactions with caring adultsor peers. Because of this receptivity, preschool programs should concentrate on building foundationalskills through developmentally appropriate program structures that emphasize play and interaction(Whitebread and Bingham 2011).
S U M M A R Y
EARLY CHILDHOODEDUCATION
OP
PO
RT
UN
ITIE
S &
OU
TC
OM
ES
Sub-Saharan AfricaMiddle East and North AfricaEast Asia and the PacificEurope and Central AsiaEuropean UnionLatin America and the CaribbeanNorth America
33287874957369
REGIONPRE-PRIMARY GROSS
ENROLLMENT (%)
Source: World Bank, 2018
C H A L L E N G E S
1
According to the World Bank, global pre-primary grossenrollment ratios are currently 49 percent and reach over130 million children, though there is significant variationbetween regions, as seen in the figure above. However,high enrollment rates alone do not demonstrateeducational success. Multiple factors influence skillsdevelopment in early childhood, including health,nutrition, security and safety, responsive caregiving, andearly learning. These components interact with each otherand can be mutually reinforcing. It is not possible toseparate learning from other integral factors of earlychildhood
childhood education and thus any intervention must bedesigned with a holistic approach that responds to all theneeds of this child developmental stage (Sameroff, 2009).Poor developmental foundations and lower preschoolskills mean disadvantaged children arrive at school lateand unprepared to benefit fully from learningopportunities. As these children get older, it becomesharder for them to break out of lower learning trajectorieswhich can impact them throughout the course of theirlives and future employment.
Quality matters in early childhood education; well-designed, intensive programs thatfocus on quality interactions and include involvement with children and families showthe strongest results.

Early childhood interventions, development programmes and other
opportunities for early learning have shown to provide both cognitive
and non-cognitive benefits.
The cognitive and academic benefits from early childhood
interventions include greater school progression and better
performance outcomes. Studies consistently demonstrate that children
from disadvantaged backgrounds have the potential to gain the largest
cognitive benefits of early childhood education (Engle et al.,
2011). Early childhood development programmes also improve
participants' outcomes in subsequent years of schooling (Berlinski et
al., 2009). Coordination across preschools and primary schools
promotes
39
O U T C O M E S
2
promotes smooth transitions, enables children to build on their preschool skills, and facilitates a sequential strategy
for promoting early learning, providing support for children across the life course (Berlinski et al., 2015). Perhaps as
important are the significant non-cognitive benefits, especially in low and lower-middle income countries. Early
childhood development can be particularly impactful in countries that suffer from high child mortality rates, stunting,
childhood illness and hunger, and poor health and nutrition. The substantial long-term effects of these early childhood
interventions spill over into higher levels of education and have a significant effect on lifetime earnings.
C A S E S T U D Y : I N D O N E S I A
The Impact of Early Childhood Education on Early Achievement Gaps
A study completed in Indonesia set out to assess whether an Early Childhood Education and Development
project had an impact on early achievement gaps between children from different socio-economic backgrounds.
The analysis collected data in 310 villages across Indonesia, comparing the impacts of communities with
intervention, and those without. The intervention in the selected villages included a public knowledge
component along with the creation of playgroups for four to six year olds. The playgroups were offered two
hours a day and three times a week at a community centre with a qualified teacher.
In villages with the intervention, the achievement gap that previously existed between children of different
socio-economic backgrounds decreased on many dimensions, as measured by three different measures of child
development. This illustrates the idea that early childhood education is most effective when targeted to the
most vulnerable groups.
Source: Jung, 2014
C A S E S T U D Y : J A M A I C A
Long Term Impact – Labour Market Returns to Early Childhood Stimulation
The Labor Market Returns to Early Childhood Stimulation study was one of the first studies of its kind to
evaluate long-term impacts in a low-income country, conducting a 20-year follow-up survey of participants who
initially participated in a preschool program intervention in Jamaica. The original intervention provided
psychosocial stimulation and nutritional supplementation to stunted toddlers living in poverty. The 20-year
follow-up study found that the intervention increased the average earnings of participants by 42 percent
relative to the control group. Moreover, the stunted children who received the stimulation intervention caught
up to the earnings of a non-stunted comparison group. Not only do the findings show the positive connection
between early childhood interventions and labour labor market outcomes, but they also highlight
that stimulation interventions very early in life can compensate for developmental delays and thereby reduce
inequality later in life.
Source: Gertler et al., 2013
OP
PO
RT
UN
ITIE
S &
OU
TC
OM
ES
40
O P P O R T U N I T I E S
3
OP
PO
RT
UN
ITIE
S &
OU
TC
OM
ES
There are several economic arguments to support investment in early childhood
education and development. From a human capital perspective, it is an effective way of
reducing disparities and increasing individual productivity. From an equity perspective, it
increases individual welfare and reduces the probability of poverty in adulthood by
providing a pathway towards higher levels of education. Investments in early childhood
education also have the potential to increase efficiencies in the education system, reduce
social costs, and increase social welfare (Nores, 2020).
According to Berlinski and Schady (2015), while preschools are incorporated into the
educational sector in many low- and middle-income countries, almost one-third of
children who attend preschool are enrolled in private institutions. In many countries, early
childhood development services are delivered through a disjointed set of primarily non-
governmental organisations, often with few regulatory guidelines, limited attention to
quality, and little coordination with other services or sectors (Berlinski et al., 2015). The
emphasis on early childhood education has increased over the past decade and
governments are focussed on increasing access to early childhood development
programmes. Finding effective ways to leverage private sector resources to increase
access and ensure quality is critically important and could provide a significant
opportunity for investors interested in impacting lifelong outcomes for young children.

As seen in the figure below, among grade 6 students in West and Central Africa, nearly 58 percent are not sufficientlycompetent in reading or mathematics to progress in their schooling.
41
OP
PO
RT
UN
ITIE
S &
OU
TC
OM
ES
PRIMARY EDUCATION
C H A L L E N G E S
Grade Six Student Competency
Not Competent Low Competency High Competency
Reading
Niger
Chad
Togo
Congo, Rep.
Côte d'Ivoire
Cameroon
Benin
Burundi
Burkina Faso
Senegal
Mathematics
Niger
Chad
Côte d'Ivoire
Congo, Rep.
Cameroon
Benin
Togo
Senegal
Burkina Faso
Burundi
50% 50%
Source: PASEC, 2015
C H A L L E N G E S
1
Worldwide, hundreds of millions of children reach young adulthoodwithout even the most basic skillset (World Bank, 2018). The World Bankdefines this as a “learning crisis,” calling upon education and developmentprofessionals to better understand how, and why, countries around theworld have not achieved "learning for all."
An estimated125 million children are not acquiring functional literacy ornumeracy, even after spending at least four years in school (UNESCO,2015). In Malawi and Zambia in 2012, more than 89 percent of studentscould not read a single word by the end of grade two (RTI International,2015). In rural India in 2016, less than 28 percent of students in gradethree could master double-digit subtraction (ASER Centre, 2017).
According to the World Bank, investing in primary education should be the highest priority in publicexpenditure programs, particularly in low-income countries (World Bank, 1995). It is widely accepted inacademic research that social returns are the highest for investments in primary education. The purpose ofthis section is to outline the specific benefits of early childhood education as they apply to EduFinancemarkets.
S U M M A R Y
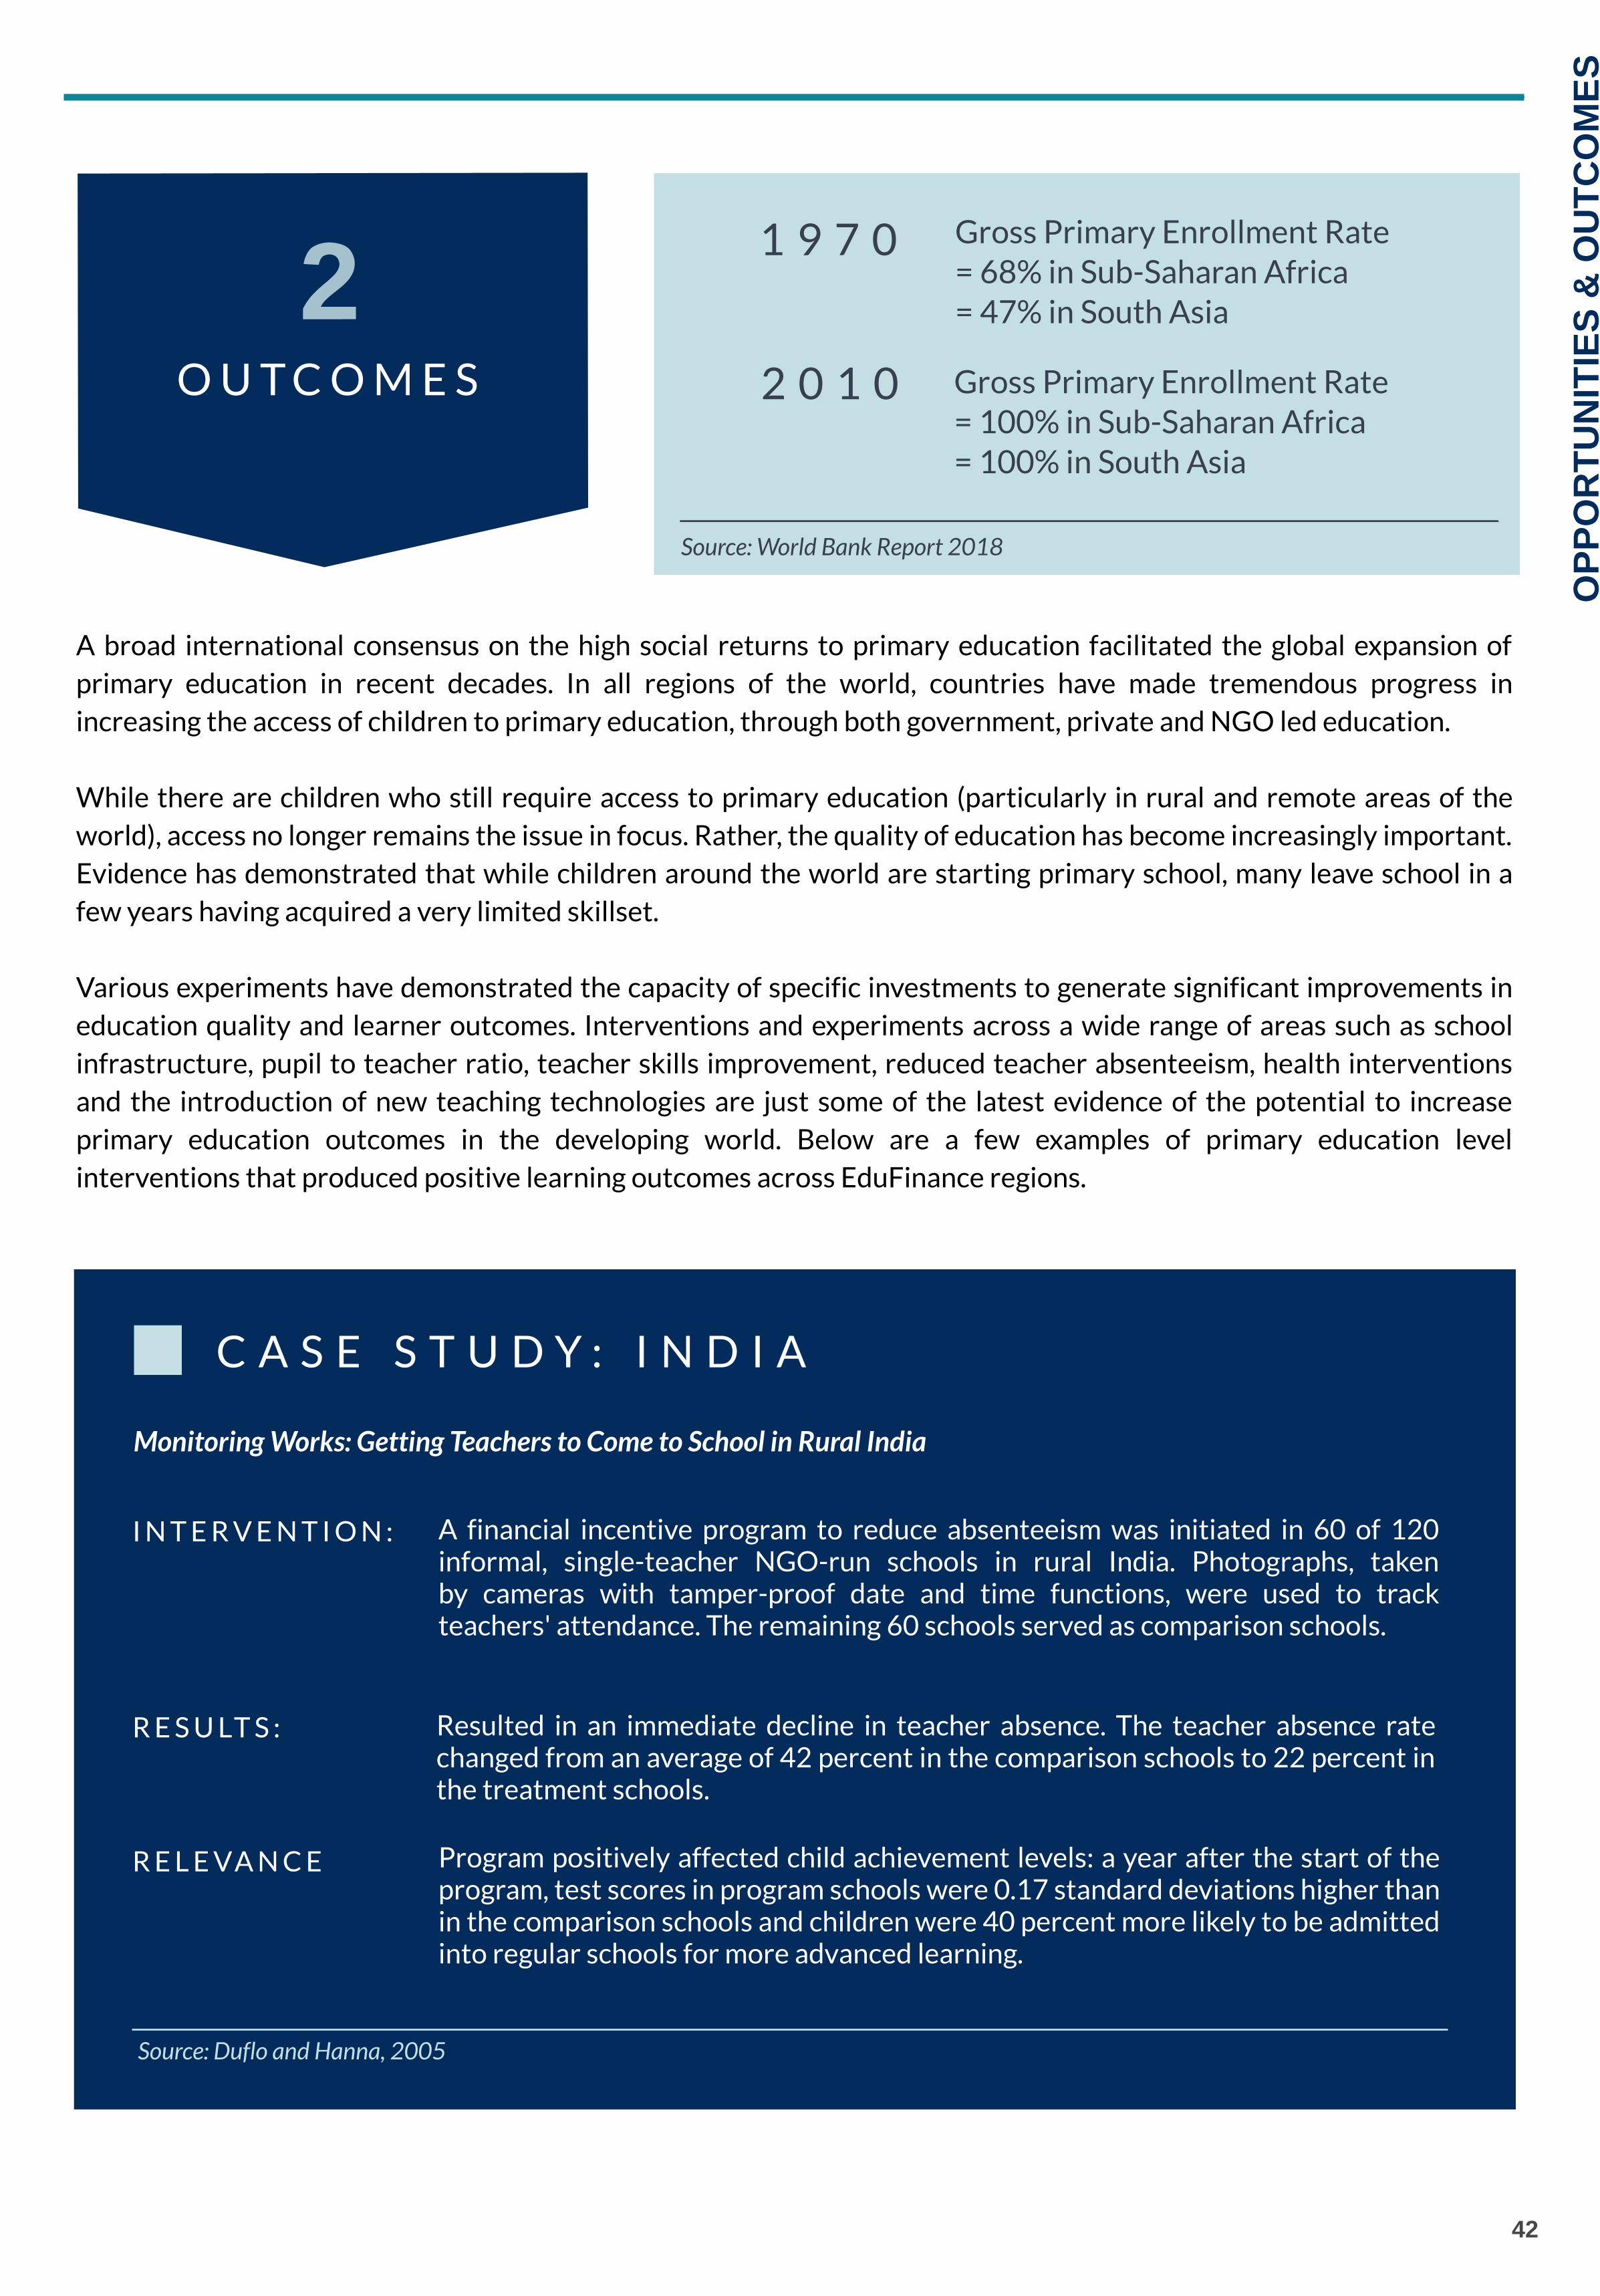
A broad international consensus on the high social returns to primary education facilitated the global expansion of
primary education in recent decades. In all regions of the world, countries have made tremendous progress in
increasing the access of children to primary education, through both government, private and NGO led education.
While there are children who still require access to primary education (particularly in rural and remote areas of the
world), access no longer remains the issue in focus. Rather, the quality of education has become increasingly important.
Evidence has demonstrated that while children around the world are starting primary school, many leave school in a
few years having acquired a very limited skillset.
Various experiments have demonstrated the capacity of specific investments to generate significant improvements in
education quality and learner outcomes. Interventions and experiments across a wide range of areas such as school
infrastructure, pupil to teacher ratio, teacher skills improvement, reduced teacher absenteeism, health interventions
and the introduction of new teaching technologies are just some of the latest evidence of the potential to increase
primary education outcomes in the developing world. Below are a few examples of primary education level
interventions that produced positive learning outcomes across EduFinance regions.
42
O U T C O M E S
2
C A S E S T U D Y : I N D I A
Monitoring Works: Getting Teachers to Come to School in Rural India
Source: Duflo and Hanna, 2005
OP
PO
RT
UN
ITIE
S &
OU
TC
OM
ES
Gross Primary Enrollment Rate
= 68% in Sub-Saharan Africa
= 47% in South Asia
1 9 7 0
2 0 1 0 Gross Primary Enrollment Rate
= 100% in Sub-Saharan Africa
= 100% in South Asia
Source: World Bank Report 2018
I N T E R V E N T I O N : A financial incentive program to reduce absenteeism was initiated in 60 of 120
informal, single-teacher NGO-run schools in rural India. Photographs, taken
by cameras with tamper-proof date and time functions, were used to track
teachers' attendance. The remaining 60 schools served as comparison schools.
R E S U LT S : Resulted in an immediate decline in teacher absence. The teacher absence rate
changed from an average of 42 percent in the comparison schools to 22 percent in
the treatment schools.
R E L E VA N C E Program positively affected child achievement levels: a year after the start of the
program, test scores in program schools were 0.17 standard deviations higher than
in the comparison schools and children were 40 percent more likely to be admitted
into regular schools for more advanced learning.

43
OP
PO
RT
UN
ITIE
S &
OU
TC
OM
ES
C A S E S T U D Y : I N D I A
School Feeding and Learning Achievement: Evidence from India's Midday Meal Program
Source: Chakraborty and Jayaraman, 2019
I N T E R V E N T I O N : Staggered implementation of a 2001 Indian Supreme Court Directive that
mandated the introduction of free school lunches in public primary schools,
enabled researchers to study the effect of the directive on different cohorts. The
researchers used this to estimate the effect of program exposure on math and
reading test scores of primary school-aged children.
R E S U LT S : The results indicated that prolonged exposure to midday meals had a robust
positive effect on learning achievement. Exposure to midday meals for the nearly
five-year duration of primary school increased test scores by 18% (0.17σ) for
reading and 9% (0.09σ) for math relative to children with less than a year of
exposure.
R E L E VA N C E By providing school lunch, this program contributed to the student's overall well-
being. This demonstrates the impact that improved nutrition can have on students'
ability to learn effectively. This is especially true for low-income students.
Acquiring foundational skills in literacy and numeracy, is essential for launching children into higher
learning trajectories. Learning is cumulative, and education systems around the world expect students to
acquire foundational skills such as reading and basic numeracy by grades one or two. By grade three,
students must be able to read, in order to access their learning curriculum. Poor developmental
foundations and skills mean disadvantaged children arrive at school late and unprepared to benefit fully
from learning opportunities. As these children get older, it becomes harder and harder for them to break
out of lower learning trajectories. This contributes significantly to the low rate of transition between
primary and secondary school, particularly in low income countries.
There has been a wide array of successful interventions in developing countries, some of which have
relatively low costs. EduFinance can utilize these case study interventions to inform investment
decisions and improve the quality of education and learning outcomes of children, whether in established
EduFinance schools or in newly established private schools. In particular, interventions that focus on
improving the quality of education in these early years can have a significant impact on earnings and
employment potential later in life.
O P P O R T U N I T I E S
3
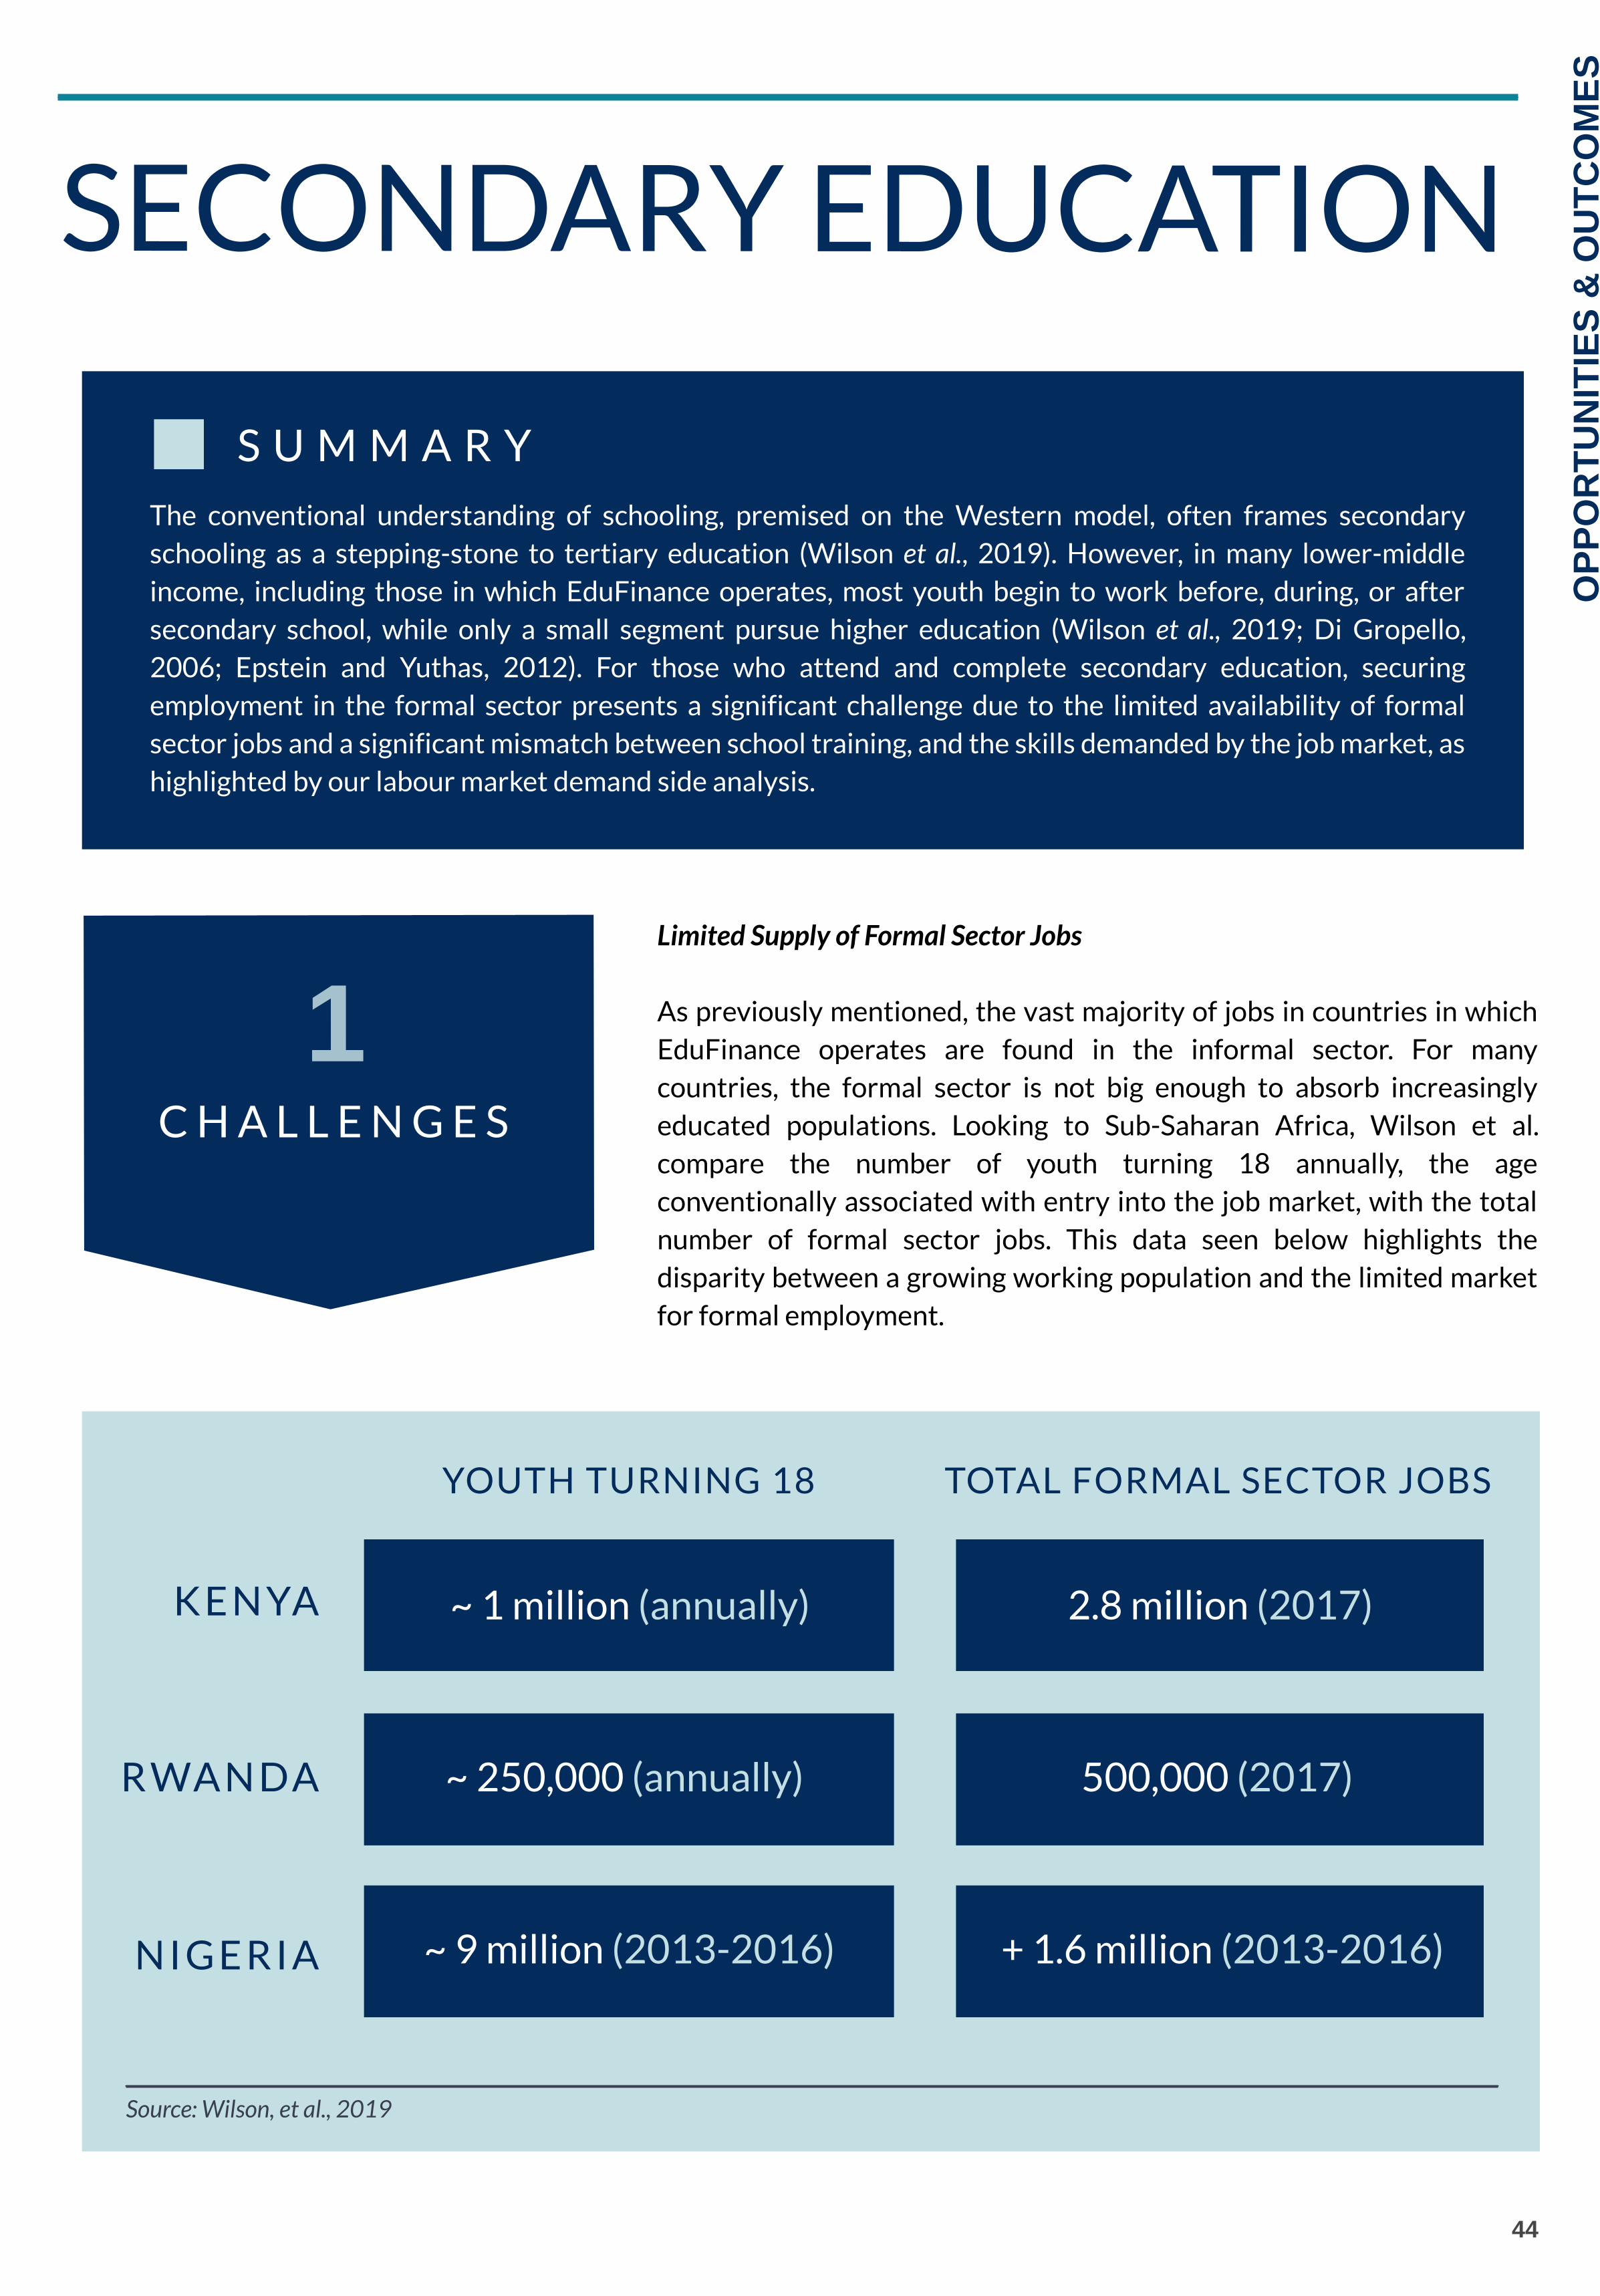
44
OP
PO
RT
UN
ITIE
S &
OU
TC
OM
ES
~ 1 million (annually)
500,000 (2017)~ 250,000 (annually)
2.8 million (2017)
~ 9 million (2013-2016) + 1.6 million (2013-2016)
YOUTH TURNING 18 TOTAL FORMAL SECTOR JOBS
K E N YA
R WA N DA
N I G E R I A
Source: Wilson, et al., 2019
SECONDARY EDUCATION
The conventional understanding of schooling, premised on the Western model, often frames secondaryschooling as a stepping-stone to tertiary education (Wilson et al., 2019). However, in many lower-middleincome, including those in which EduFinance operates, most youth begin to work before, during, or aftersecondary school, while only a small segment pursue higher education (Wilson et al., 2019; Di Gropello,2006; Epstein and Yuthas, 2012). For those who attend and complete secondary education, securingemployment in the formal sector presents a significant challenge due to the limited availability of formalsector jobs and a significant mismatch between school training, and the skills demanded by the job market, ashighlighted by our labour market demand side analysis.
S U M M A R Y
Limited Supply of Formal Sector Jobs
As previously mentioned, the vast majority of jobs in countries in whichEduFinance operates are found in the informal sector. For manycountries, the formal sector is not big enough to absorb increasinglyeducated populations. Looking to Sub-Saharan Africa, Wilson et al.compare the number of youth turning 18 annually, the ageconventionally associated with entry into the job market, with the totalnumber of formal sector jobs. This data seen below highlights thedisparity between a growing working population and the limited marketfor formal employment.
C H A L L E N G E S
1

S K I L L G A P S
2
45
OP
PO
RT
UN
ITIE
S &
OU
TC
OM
ES
Addressing Skill Gaps at the Secondary Level
Given that entry into the job market occurs at a younger age inEduFinance markets, it is essential for youth to gain the necessaryknowledge, skills, and technical training for entering and succeeding inthe job market as early as possible. Despite this understanding, a skillsgap persists across many lower-middle income countries.
Numerous lower-middle income countries have begun to makesecondary education curricula more applicable to the job market. InSub-Saharan Africa, for example, more than a dozen countries areeither in the process of introducing competency-based curricula at thesecondary
Organization: Educate!
Countries: Kenya, Uganda, andRwanda
Target Population: High-schoolstudents
Curricular Focus: Developed inpartnership with the private sector,this program prepares youth for thejob market via mentorship programson entrepreneurship (financialliteracy) and community initiatives.
Impact: Statistically significantimprovements in overall income,savings behaviour, businessownership, community projectownership, and self-efficacy inpractical and soft skills
50% increase in employment44% increase in businessownership
E D U C A T E !
Organization: International YouthFoundation
Countries: More than 50 countriesworldwide, including Kenya,Tanzania, Mozambique, Senegal,Zimbabwe, and South Africa.
Curricular Focus: Entrepreneurshiptraining for professional growth,and continued preparation for thejob market.
Impact: A 2017 quasi-experimentalimpact evaluation on Mexico’s‘Rutas and Clave’ programs, whichincorporate PTS in the first year ofhigh school, found a 3.2% increasein average GPAs, and a 32%reduction in average drop-out ratesbetween the first and secondsemesters.
Organization: EducationDevelopment Centre
Countries: More than 25 countriesworldwide, including Senegal and Rwanda
Target Population: Out-of-school youth,secondary school students, and TVETstudents
Curricular Focus: Entrepreneurship,financial literacy skills, leadership,communication, and workplacesafety. This also includes work-basedlearning that relies on internshipopportunities and on-the-job trainingprograms.
Impact: An evaluation of the program in Rwanda found statisticallysignificant positive outcomes inparticipants’ employability skills, such asjob searching, business planning, andcustomer relations.
P A S S P O R T F O RS U C C E S S
W O R K R E A D Y N O W !
Given the potential beneficial outcomes of the competency-based model illustrated in these case studies, thefollowing considerations must be incorporated into education policy as a means of furthering their applicabilityand continued success in lower-middle income countries:
secondary level or have already done so. Notable among these programs are Educate!, Work Ready Now! & Work-Based Learning, and, Passport to Success (Wilson et al., 2019). These case studies, highlighted below, illustrate thepotential learning outcomes that can be gained from curricular reforms that promote a competency-based model thatfocus on teaching youth the practical skills they need to succeed in their respective local economies.
1
2
Inclusion of a competency-based model at the primary education level since many students transition tothe workforce at an earlier age in developing countries
Address short-term risks associated with reforming curriculum→ teachers will need time and support to learn and adapt curriculum (Wilson et al., 2019)
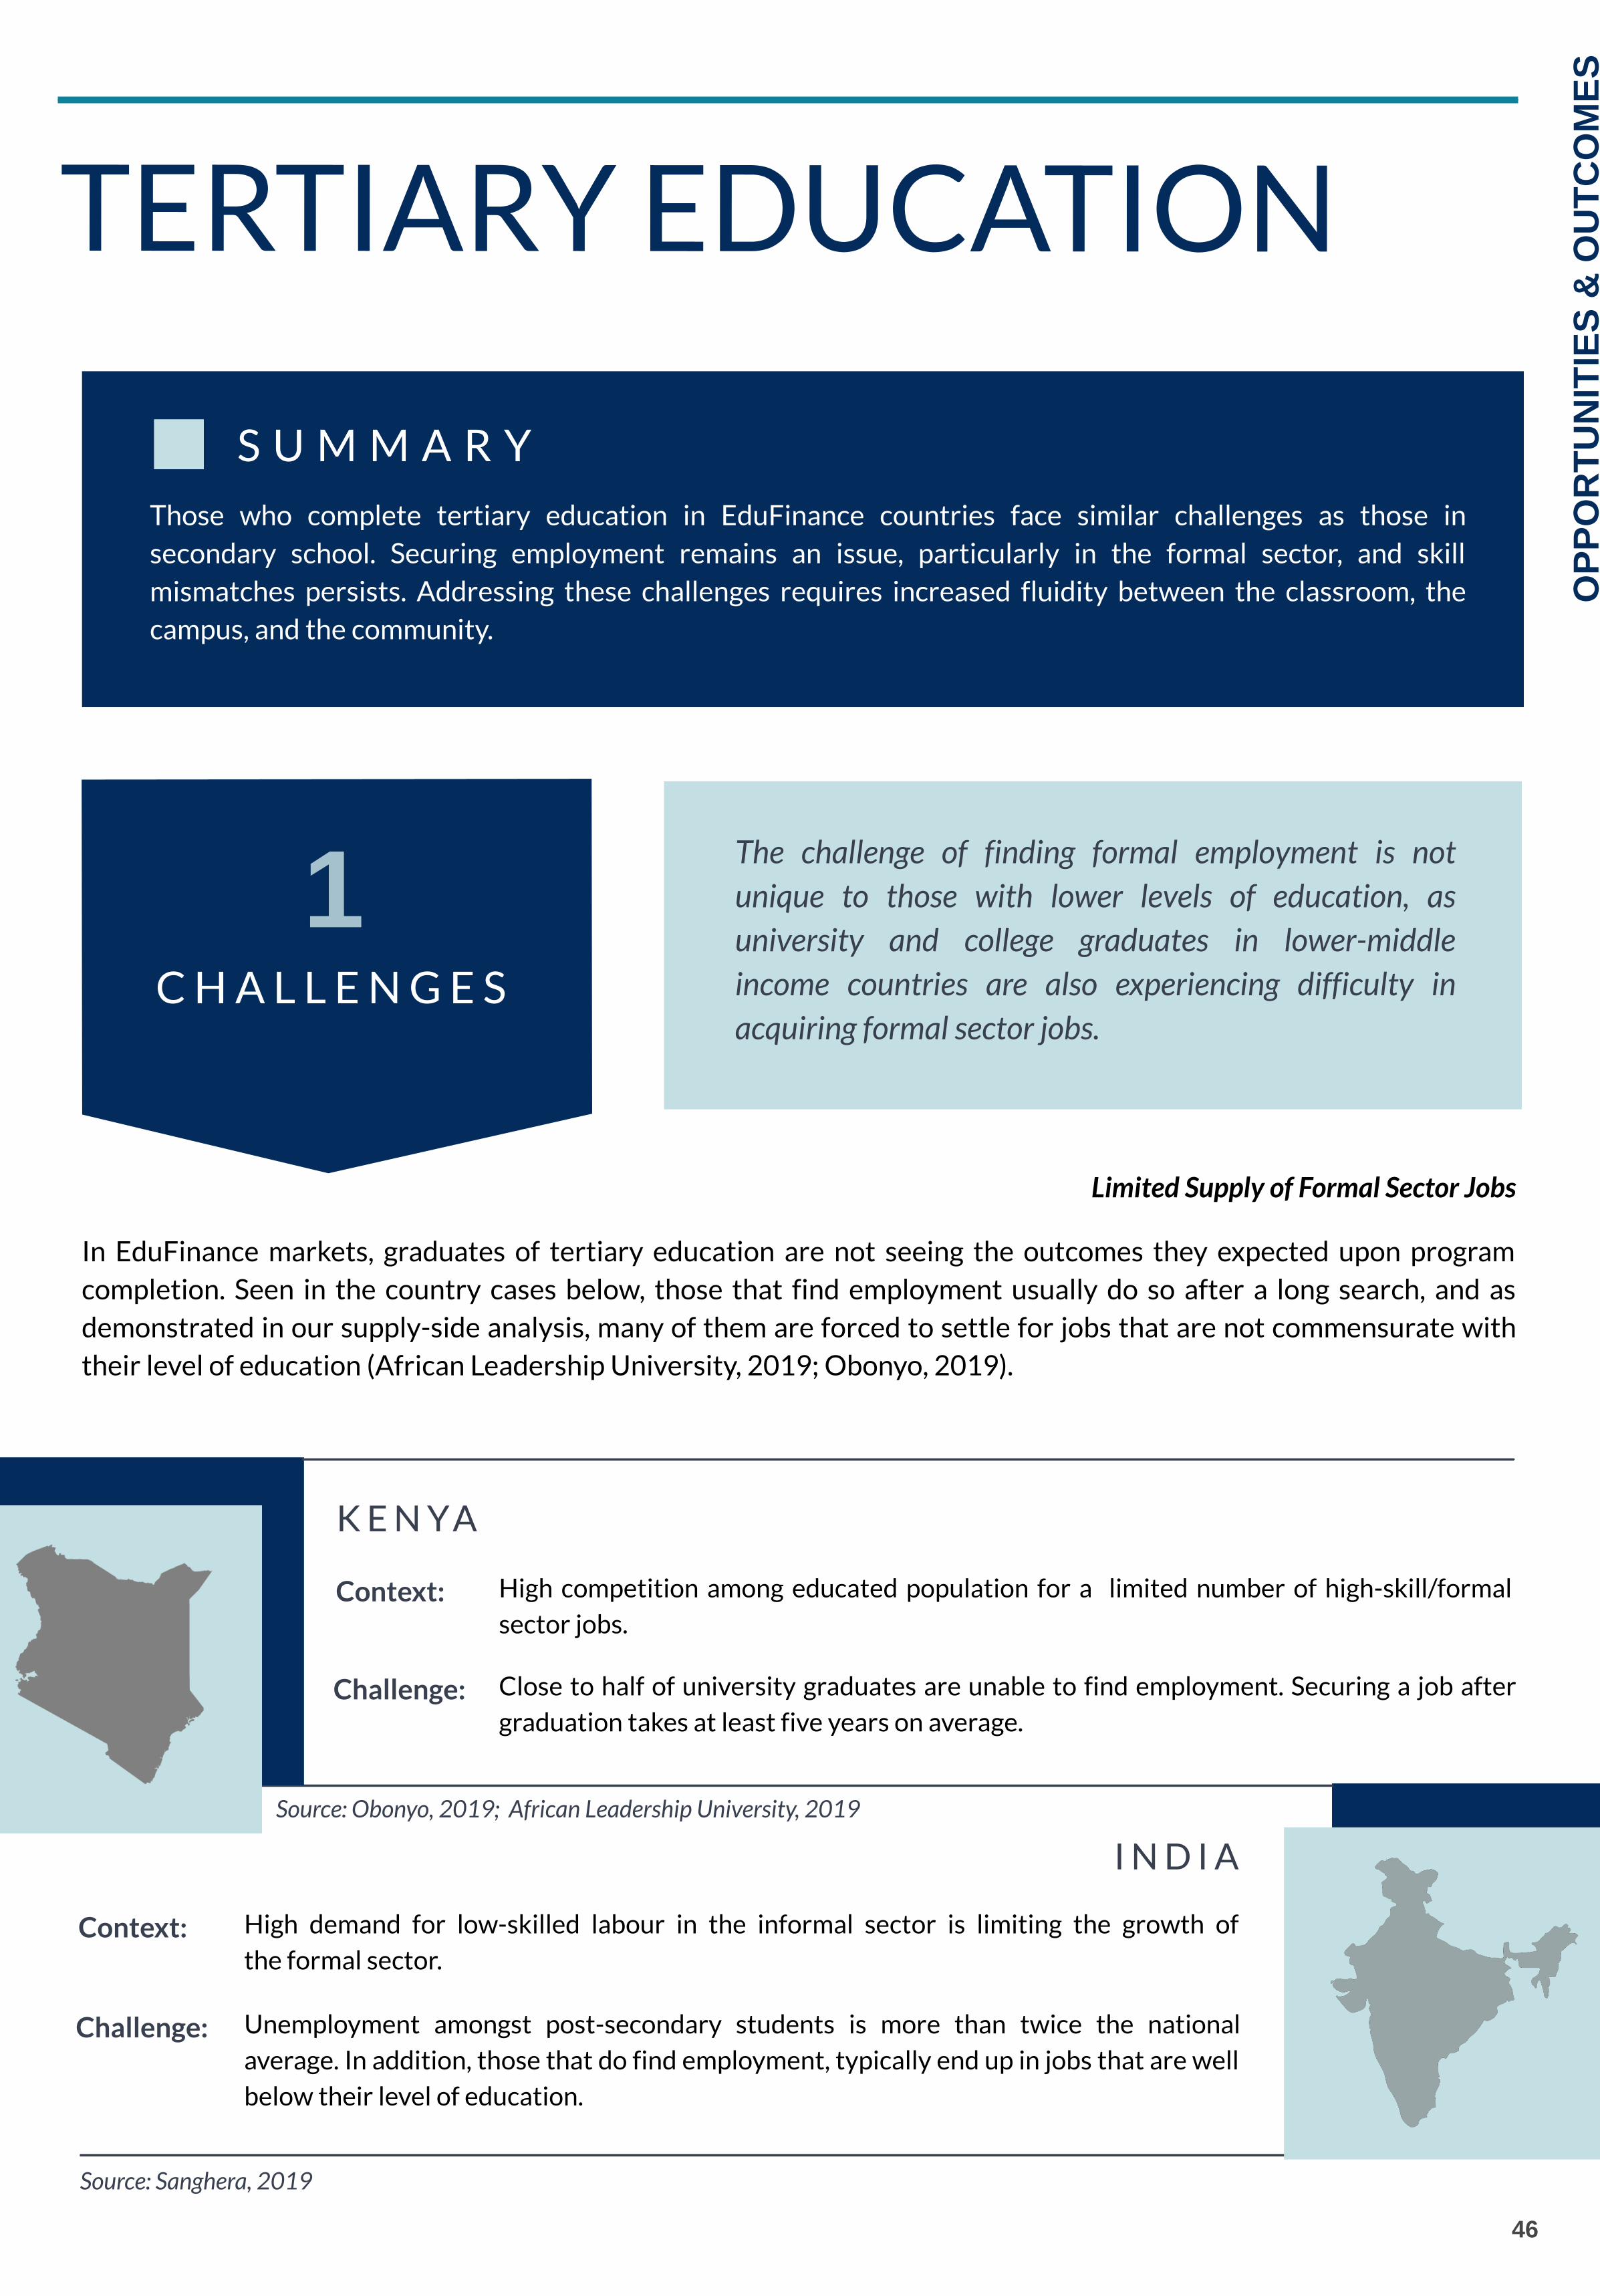
TERTIARY EDUCATION
Those who complete tertiary education in EduFinance countries face similar challenges as those insecondary school. Securing employment remains an issue, particularly in the formal sector, and skillmismatches persists. Addressing these challenges requires increased fluidity between the classroom, thecampus, and the community.
S U M M A R Y
46
K E N YA
Context: High competition among educated population for a limited number of high-skill/formal
sector jobs.
Challenge: Close to half of university graduates are unable to find employment. Securing a job after
graduation takes at least five years on average.
High demand for low-skilled labour in the informal sector is limiting the growth of
the formal sector.
Unemployment amongst post-secondary students is more than twice the national
average. In addition, those that do find employment, typically end up in jobs that are well
below their level of education.
OP
PO
RT
UN
ITIE
S &
OU
TC
OM
ES
C H A L L E N G E S
1
In EduFinance markets, graduates of tertiary education are not seeing the outcomes they expected upon programcompletion. Seen in the country cases below, those that find employment usually do so after a long search, and asdemonstrated in our supply-side analysis, many of them are forced to settle for jobs that are not commensurate withtheir level of education (African Leadership University, 2019; Obonyo, 2019).
The challenge of finding formal employment is not
unique to those with lower levels of education, as
university and college graduates in lower-middle
income countries are also experiencing difficulty in
acquiring formal sector jobs.
Limited Supply of Formal Sector Jobs
I N D I A
Source: Obonyo, 2019; African Leadership University, 2019
Context:
Challenge:
Source: Sanghera, 2019

S K I L L G A P S
2
47
OP
PO
RT
UN
ITIE
S &
OU
TC
OM
ES
Addressing Skill Gaps at the Secondary Level
Across lower-middle income countries in the last 20 years, enrollmentrates in tertiary education have steadily grown (Roser and Oritz-Ospina, 2020). However, research consistently points to a severemismatch between university training, and the skills demanded by jobmarkets in these regions (African Leadership University, 2019;Fiszbein et al., 2016; Sanghera, 2019; Talal, 2016; Salazar-Xirinachs,2015). To address the employability challenge for universitygraduates in Sub-Saharan Africa, McCowan (2014) has outlinedseveral recommendations that allow students to develop theiremployable skills.
These recommendations form the basis of a schooling model presentedin the figure to the right. This model operates through, and is facilitatedby, three interlocking learning spaces: classroom, campus, andcommunity. The optimal tertiary education model facilitates constantinteraction among all three spaces to support learning achievementsrelevant to labour market demands.
I M P R O V I N GC O U R S E
Q U A L I T Y
Misalignment of course content and relevance can be addressed throughinnovative teaching methods, retraining existing faculty and staff, and includingcommunity/student voices in curriculum reforms.
P R O M O T I N GD I V E R S E
L E A R N I N GE X P E R I E N C E S
Outside-the-classroom extracurricular experiences are highly valued byemployers as they are increasingly searching for candidates that can offerdiverse and global perspectives.
C R E A T I N GS C H O O L -
I N D U S T R YL I N K A G E S
Students need to be more informed about available career options and theskills demanded in their local job markets. This can be achieved through jobfairs and career advisory services deriving from school-industry linkages.
T A R G E T E DS K I L L
E N H A N C E M E N TP R O G R A M S
Providing these programs will allow students to develop their hard andtechnical skills (e.g. entrepreneurship, presentation skills, etc.), which are highlydesired in labour markets.
C L A S S R O O M
C A M P U S
C O M M U N I T Y
Source: McCowan, 2014
Embedded Learning Spaces
Classroom: conventional learning which relies on instructors and isdone in pursuit of completing a course or degree.
Campus: other learning opportunities within institutions, such asstudent societies, professional development workshops, and targetedskills enhancement programs.
Community: outside-the-classroom learning experiences that includework placements, volunteering, internships, and community initiatives.

48
TECHNICAL ANDVOCATIONAL EDUCATION& TRAINING (TVET)The Technical and Vocational Education & Training (TVET) section presents an overview ofthe role and applicability of TVET programs in lower-middle income countries. By breakingdown the mixed understandings of TVET outcomes, this section illustrates the embeddedchallenges presented by this form of education. This section also includes a breakdown ofevidence on TVET program performance in low and lower-middle income countries and ananalysis of the conditions necessary for successful TVET programs.
49
TVET
In the past decade, there has been a renewed international focus on the ability of individuals,
industries, and governments to meet the competitive demands of the global economy
through Technical and Vocational Education and Training (TVET). As defined by UNESCO,
TVET comprises “education, training and skills development relating to a wide range of
occupational fields, production, services and livelihoods” (UNESCO, 2015).
Often seen as part of lifelong learning, TVET may take place at the secondary, post-
secondary and tertiary levels of education as well as within work-based learning, continuing
training and professional development during employment (Olfindo, 2018). In many
countries, TVET forms an integral part of the education system by building a highly skilled
and knowledgeable workforce (Liu & Clayton, 2016). By providing students with market
specific skills, TVET can also facilitate the inclusion of vulnerable workers into the labour
market. This trend is especially apparent in lower-middle income countries, where
vulnerable workers have lower levels on average of general formal education, and/ or are
without the adequate skills necessary to effectively integrate into the labour market
(Olfindo, 2018).
Acknowledging the potential for TVET to improve workforce skills, governments around the
world had renewed their interest in investing in these programs. The purpose of this section
is to explore the opportunities and challenges associated with TVET programs within lower-
middle income countries, the mixed evidence of its effects on earnings and employability,
and considerations for future investment and implementation.
TVET OVERVIEW
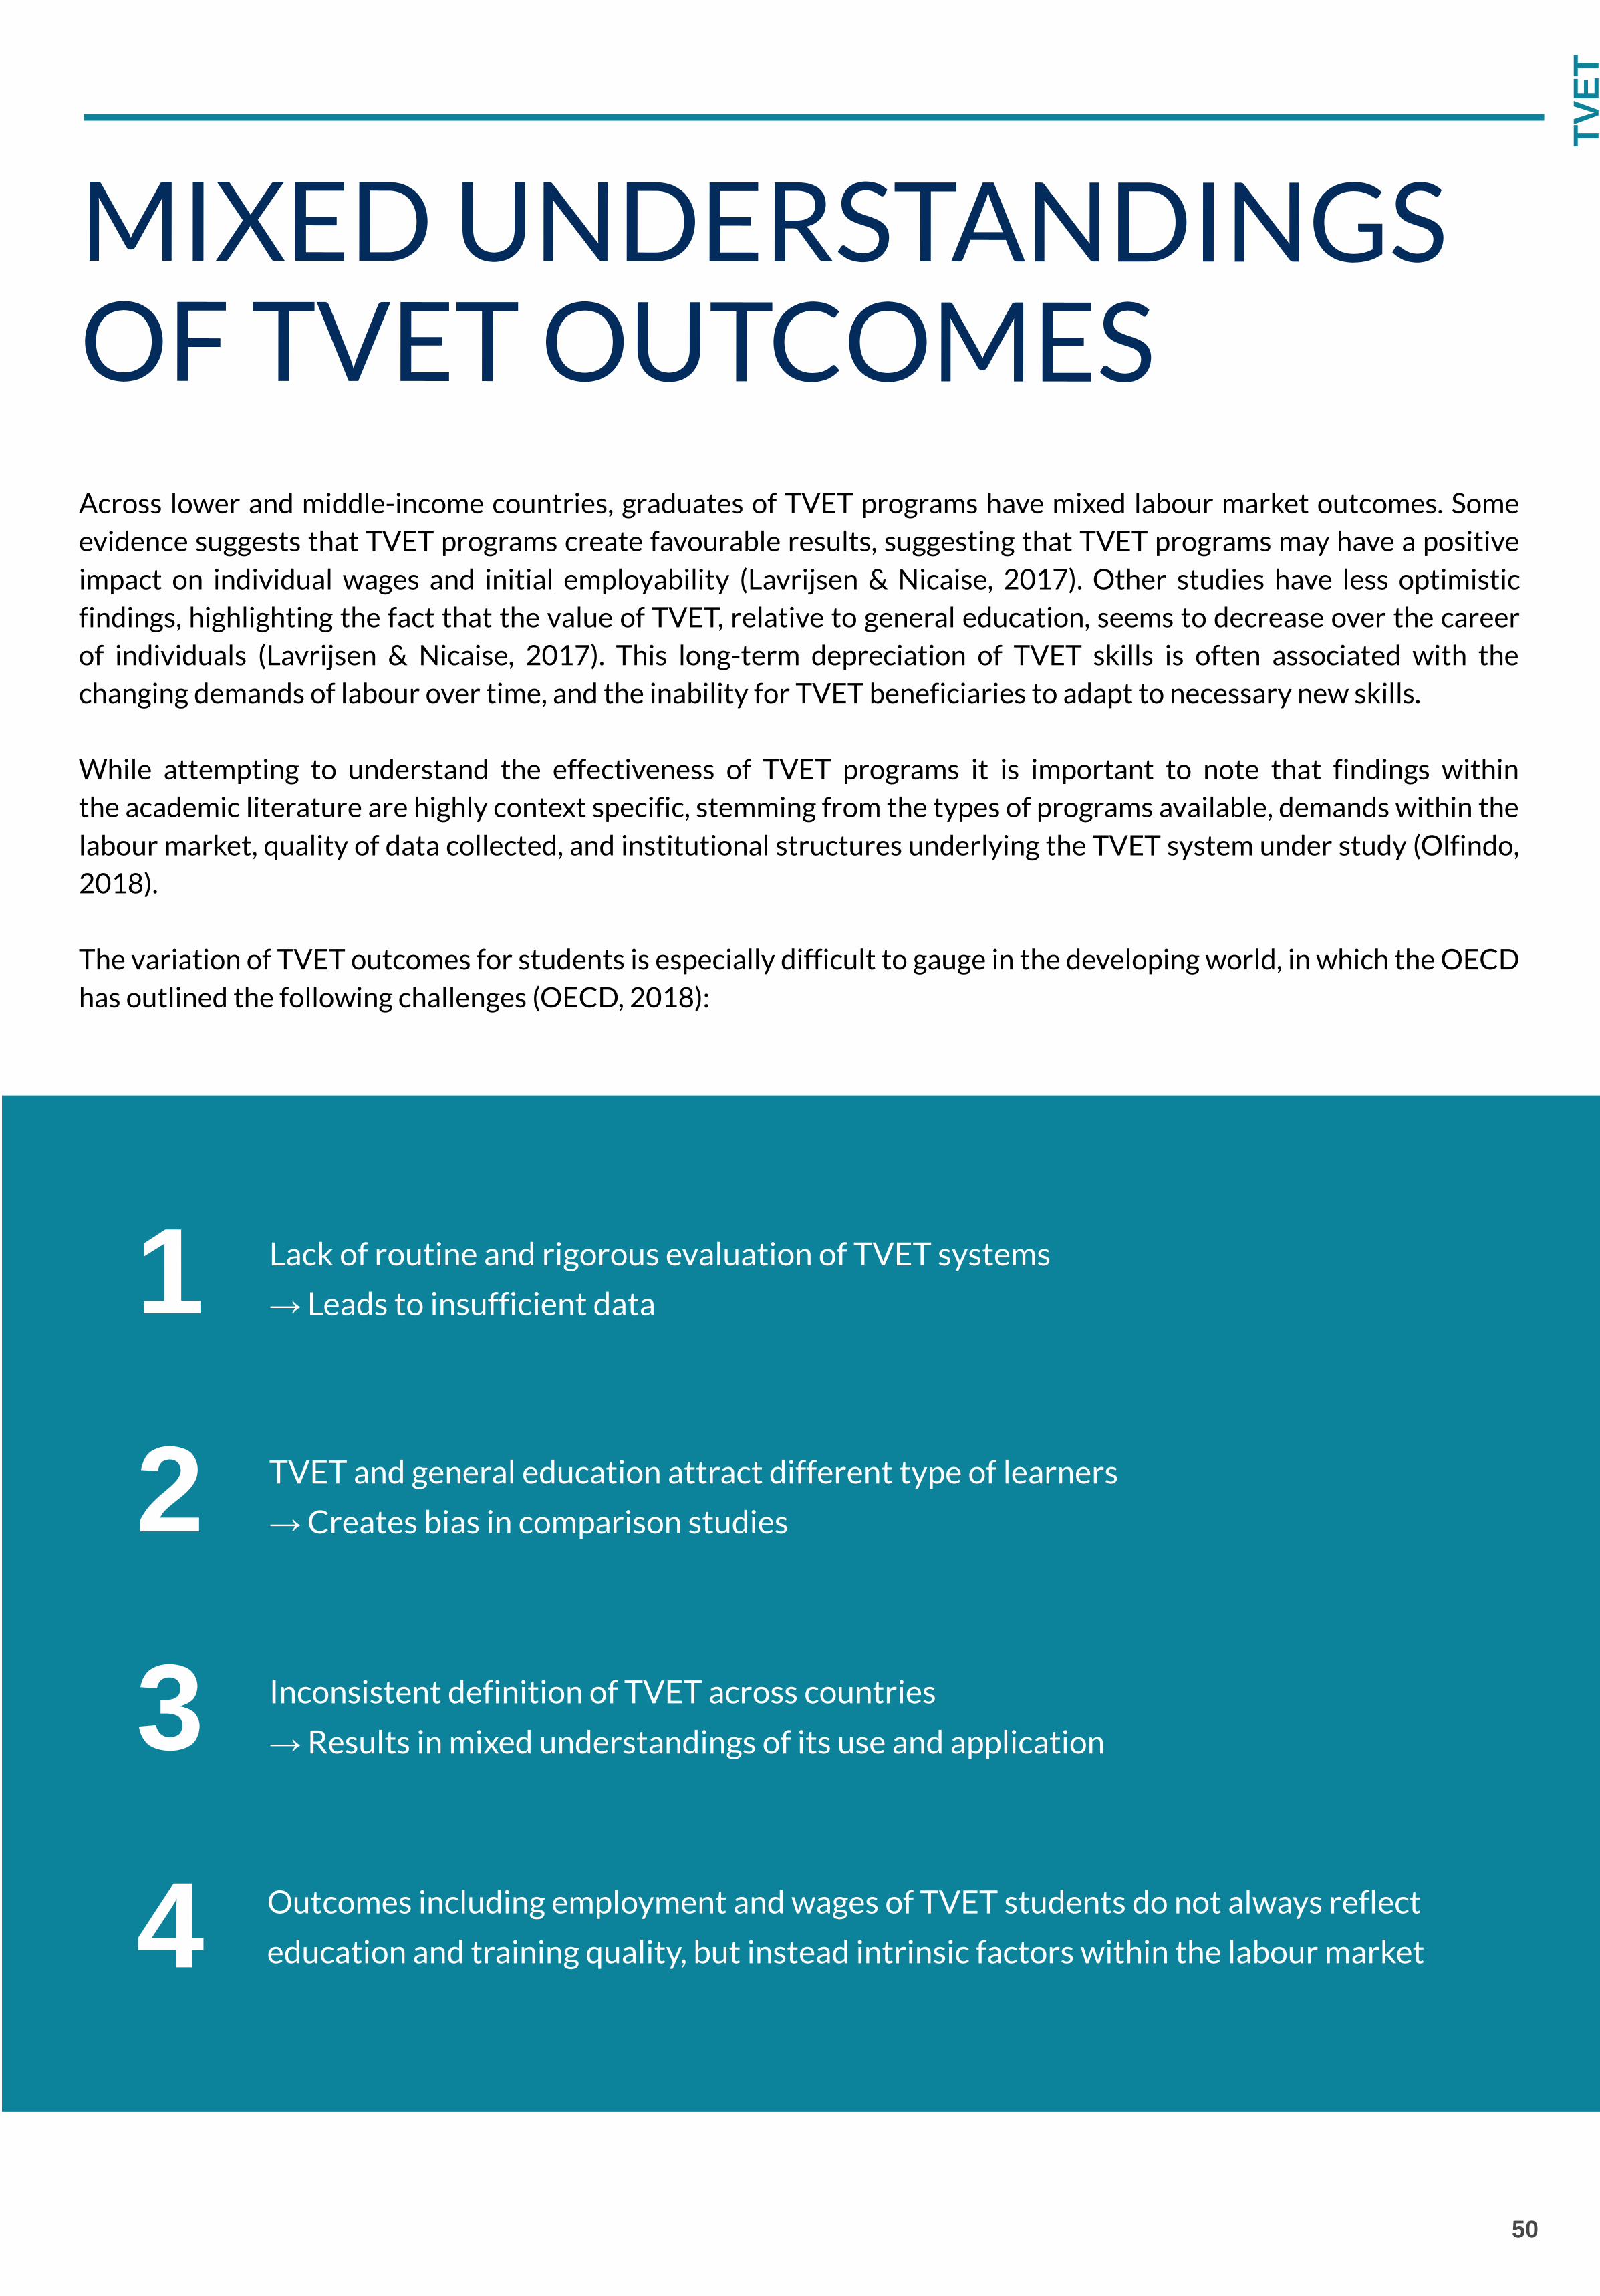
50
TVET
Across lower and middle-income countries, graduates of TVET programs have mixed labour market outcomes. Some
evidence suggests that TVET programs create favourable results, suggesting that TVET programs may have a positive
impact on individual wages and initial employability (Lavrijsen & Nicaise, 2017). Other studies have less optimistic
findings, highlighting the fact that the value of TVET, relative to general education, seems to decrease over the career
of individuals (Lavrijsen & Nicaise, 2017). This long-term depreciation of TVET skills is often associated with the
changing demands of labour over time, and the inability for TVET beneficiaries to adapt to necessary new skills.
While attempting to understand the effectiveness of TVET programs it is important to note that findings within
the academic literature are highly context specific, stemming from the types of programs available, demands within the
labour market, quality of data collected, and institutional structures underlying the TVET system under study (Olfindo,
2018).
The variation of TVET outcomes for students is especially difficult to gauge in the developing world, in which the OECD
has outlined the following challenges (OECD, 2018):
Lack of routine and rigorous evaluation of TVET systems
→ Leads to insufficient data
TVET and general education attract different type of learners
→ Creates bias in comparison studies
Inconsistent definition of TVET across countries
→ Results in mixed understandings of its use and application
Outcomes including employment and wages of TVET students do not always reflect
education and training quality, but instead intrinsic factors within the labour market
MIXED UNDERSTANDINGS
OF TVET OUTCOMES
1
2
3
4

51
TVET
The following evidence has been derived by the OECD on lower-middle income countries that have established TVETsystems (OECD, 2018). The evidence presented here may be utilized to inform best practices within developingcountries attempting to make best use of existing TVET systems.
FORMAL TVET IS NOT A WIDESPREADFORM OF SKILLSTRAINING
This is owing to the fact that a large portion of young TVETstudents in developing countries do not complete lowersecondary school and are typically exposed to skills trainingthrough the informal sector.
In most lower-middle income countries, formal job growthis slow and most employment opportunities are within theinformal sector (Kingombe, 2012). Typically when jobs dobecome available, the traditional general educationgraduates are preferred for positions.
These variations occur as a result of the following factors:qualification levels, modality of training, relevance oftraining, level of focus on and investment in TVET,and programme choice.
Self-selection by women into less lucrative TVETprogrammes, combined with gender-biased labour marketpractices in most developing countries, means that femaleTVET graduates tend to have slower school-to-worktransitions and obtain poorer-quality and lower-paid jobsthan male TVET graduates (Adams, 2007).However, possessing a TVET qualification can offerpathways to employment for women, thereby improvingtheir living conditions and reducing financial dependenceon male partners.
EVIDENCE FROM LOWER-MIDDLE INCOME COUNTRIES
1
TVET GRADUATESHAVE LIMITEDOPPORTUNITIESFOR FORMALEMPLOYMENT
2
WAGE RETURNSVARY ACROSSDIFFERENT TVETPROGRAMMES
3
GENDERSEGREGATION INTVET IS ENDEMIC
4
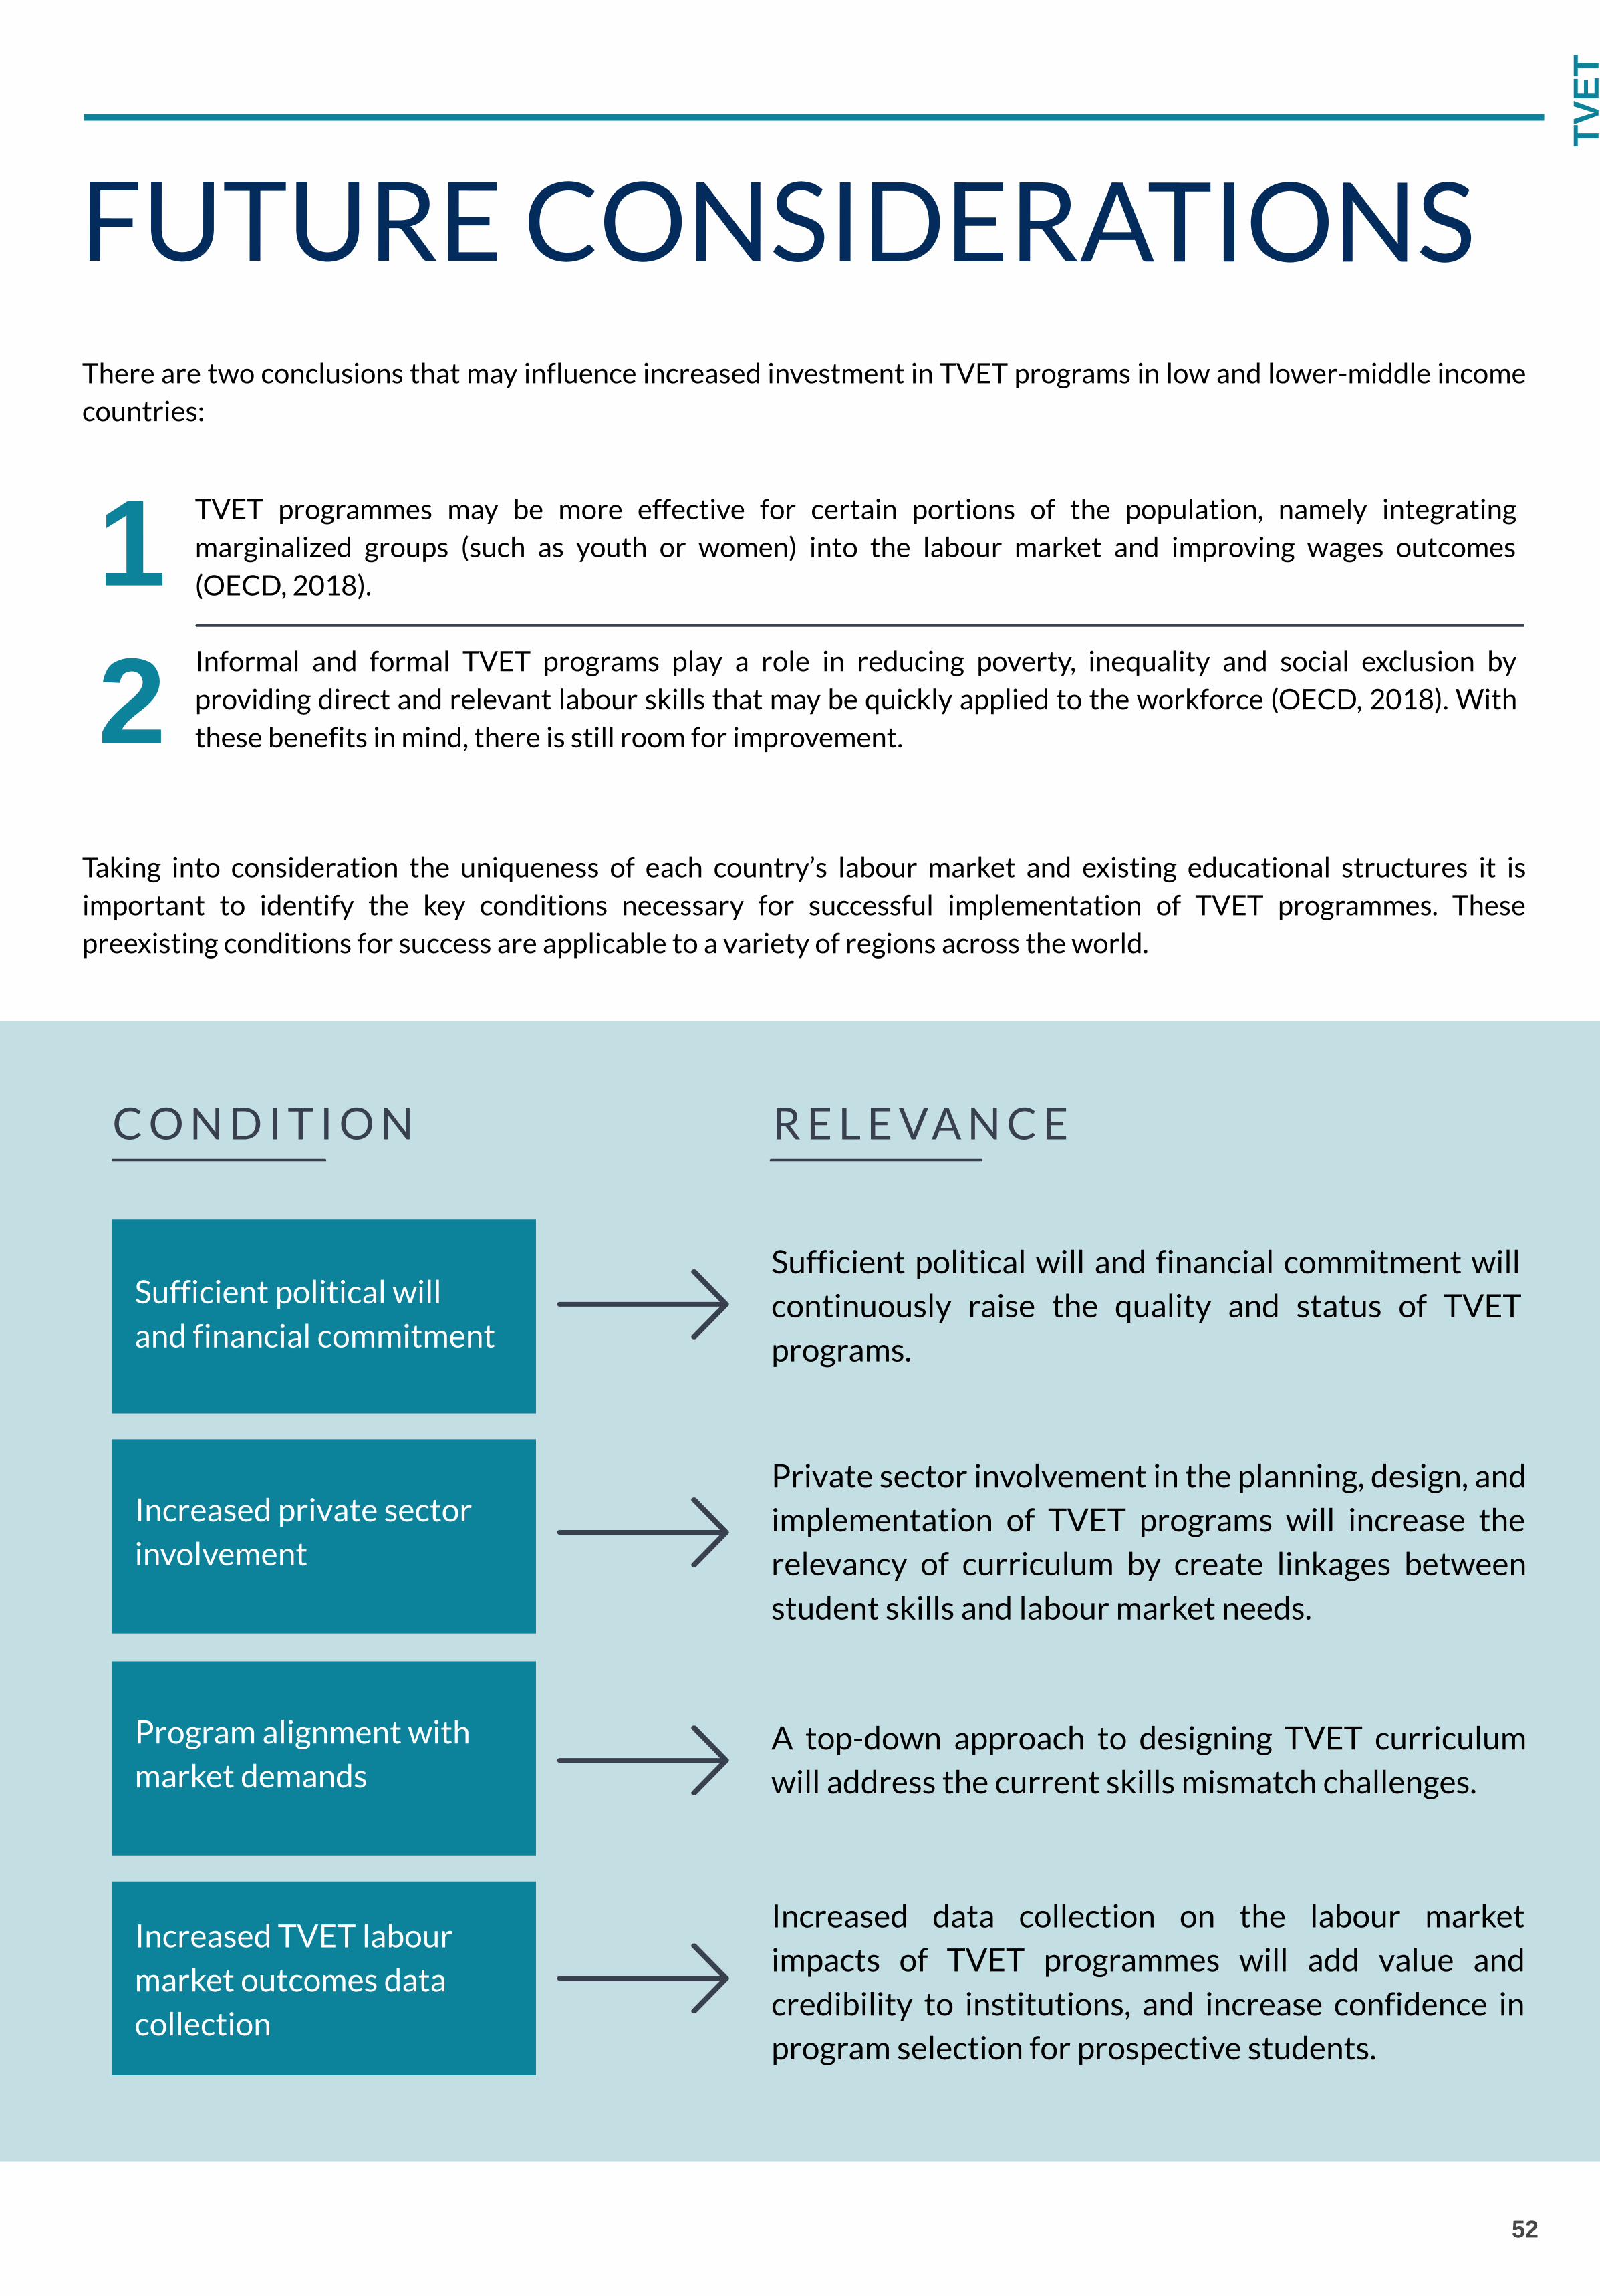
52
TVET
There are two conclusions that may influence increased investment in TVET programs in low and lower-middle income
countries:
Taking into consideration the uniqueness of each country’s labour market and existing educational structures it is
important to identify the key conditions necessary for successful implementation of TVET programmes. These
preexisting conditions for success are applicable to a variety of regions across the world.
C O N D I T I O N R E L E VA N C E
Sufficient political will
and financial commitment
Sufficient political will and financial commitment will
continuously raise the quality and status of TVET
programs.
Private sector involvement in the planning, design, and
implementation of TVET programs will increase the
relevancy of curriculum by create linkages between
student skills and labour market needs.
Increased private sector
involvement
Program alignment with
market demands
A top-down approach to designing TVET curriculum
will address the current skills mismatch challenges.
Increased TVET labour
market outcomes data
collection
Increased data collection on the labour market
impacts of TVET programmes will add value and
credibility to institutions, and increase confidence in
program selection for prospective students.
FUTURE CONSIDERATIONS
12
TVET programmes may be more effective for certain portions of the population, namely integrating
marginalized groups (such as youth or women) into the labour market and improving wages outcomes
(OECD, 2018).
Informal and formal TVET programs play a role in reducing poverty, inequality and social exclusion by
providing direct and relevant labour skills that may be quickly applied to the workforce (OECD, 2018). With
these benefits in mind, there is still room for improvement.

53
TVET
C O N D I T I O N R E L E VA N C E
Promoting and supporting the inclusion of women in
TVET programs will increase participation in the
labour force, increase qualification levels, and
diminish entrenched inequalities.
Community involvement in the design of TVET
programs will increase awareness of its benefits, and
will better align the curriculum with the needs of the
community and the local market.
Including local industries as stakeholders in program
design will create out-of-classroom opportunities for
students to receive practical experience before
graduation, alongside avenues for employment.
Continuous professional development for TVET
instructors will ensure that students are receiving
up-to-date information on current technologies that
are most applicable to the job market.
Increased quality assurance oversight of TVET
programs will provide confidence in TVET institution
services, lead to the recognition of credentials, and
enable progression of future learning.
Increased measures to
reduce gender bias
Increased community
involvement
Engage industry members
as key stakeholders
Continuous professional
development for TVET
instructors
Increased quality
assurance
F U T U R E C O N S I D E R AT I O N S ( C O N T I N U E D )
54
RECOMMENDATIONS
This report has provided an analysis of three distinct areas that affect labour marketoutcomes: supply side factors, demand side factors, and investment opportunities by levelof education. The following section presents our recommendations, based on an analysis ofthe research presented in this report. This section is intended to help guide EduFinanceinvestments with the goal of maximizing labour market outcomes of education with respectto employability and earnings potential.

1
55
RECOMMENDATIONS
A C C E S S T O P R I M A R Y E D U C A T I O N
Private and social returns to investment in education are highest for pre-primary and primary
education. Therefore, facilitating access to quality education in the earliest years of a child’s
school career remains a priority for EduFinance. Moreover, holistic early childhood
interventions that integrate health and nutrition with education have the power to generate
the greatest long-term benefits in terms of learning and skills development.
T A I L O R I N G L E A R N I N G O U T C O M E S
E N S U R I N G Q U A L I T Y E D U C A T I O N
Across all EduFinance markets, learning outcomes fall significantly below global averages,
suggesting that education systems are not providing students with the necessary skills to be
successful in the labour market. Therefore, EduFinance investments tailored towards
improving learning outcomes by focussing on education quality may help to improve students’
employability as they transition from education to employment.
Data suggests that inadequate skills matching and over-qualification constrain both workers’
earnings potential and business productivity across all EduFinance markets. TVET programs
propose a unique investment opportunity to help bridge this gap and create better labour
market outcomes by building sector-specific technical skills. Nevertheless, it is important to
note that many of the skills identified as most important by employers are foundational soft
skills, such as conscientiousness and problem solving, which are developed in the early stages
of education, including at the pre-primary and primary levels. Therefore, while there is a
growing opportunity to invest in TVET, the importance of ensuring quality education at the
earliest years cannot be overlooked.
S T R E N G T H E N I N G I N D U S T R Y L I N K A G E S
In addition to skills training, addressing skills mismatches will require strong alignment with
industry and employers in order to ensure that programming reflects the realities of local job
markets. Therefore, strengthening linkages with employers and tailoring investments in TVET
and secondary education to reflect market trends will play a critical role in maximizing the
labour market outcomes of education.
GENERAL RECOMMENDATIONS
2
3
4

56
RECOMMENDATIONS
I M P R O V I N G S C H O O L Q U A L I T Y
EduFinance markets in Sub-Saharan Africa have some of the lowest rates of enrollment in
tertiary education across the world, signalling the importance of quality secondary education
as this is likely the last time that students will be in school. Investments tailored towards
improving school quality in secondary education and building both hard and soft skills that are
transferable to the labour market are therefore priorities in this region. In particular,
entrepreneurial skills and workplace reliability are identified as some of the most important
skills by employers in this region.
R E D U C I N G E D U C A T I O N B A R R I E R S
F O S T E R I N G G E N D E R E Q U A L I T Y
Enrollment and attendance declines substantially between primary and secondary education
in the region, suggesting that investments to reduce barriers to participation in secondary
education could be a regional focal point for EduFinance.
Finally, gender parity in TVET enrollment across the region is poor, indicating an opportunity
to generate large returns on investment by fostering greater inclusivity of women and girls in
these skills training programs.
REGIONAL RECOMMENDATIONS:
2
3
S U B - S A H A R A N A F R I C A
1

1
57
RECOMMENDATIONS
G E N D E R S E N S I T I V E T R A I N I N G
Countries in South and Southeast Asia have some of the highest rates of NEET youth in the
world. Moreover, this group is disproportionately women, who face social and cultural barriers
to higher education and labour market participation. Due to the high returns on investment in
girls’ education, gender-sensitive programming in this region, particularly at the level of
secondary education and TVET, presents a unique opportunity for EduFinance to maximize
labour market outcomes.
K N O W L E D G E - I N T E N S I V E E C O N O M I E S
E Q U I T A B L E I N V E S T M E N T
Investment trends and government policy in the region are signalling a shift towards building
knowledge-intensive economies that can keep pace with rapid technological advancement and
innovation. These trends signal an opportunity for EduFinance to similarly invest in building
the skills that will carry high premiums as countries make this transition over the next several
years. In order to do so, retention in secondary education and participation in TVET programs
are focal points for EduFinance in this region.
Recognizing the unique needs of rural and urban areas, EduFinance investments designed to
increase access to knowledge and skills development in rural areas will help to ensure gains
from progress are distributed equitably. The need for equitable investment strategies in South
and Southeast Asian markets is increasingly important given that a widening "digital divide"
is significantly driving inequality in employment outcomes across the region.
REGIONAL RECOMMENDATIONS:
2
3
S O U T H & S O U T H E A S T A S I A
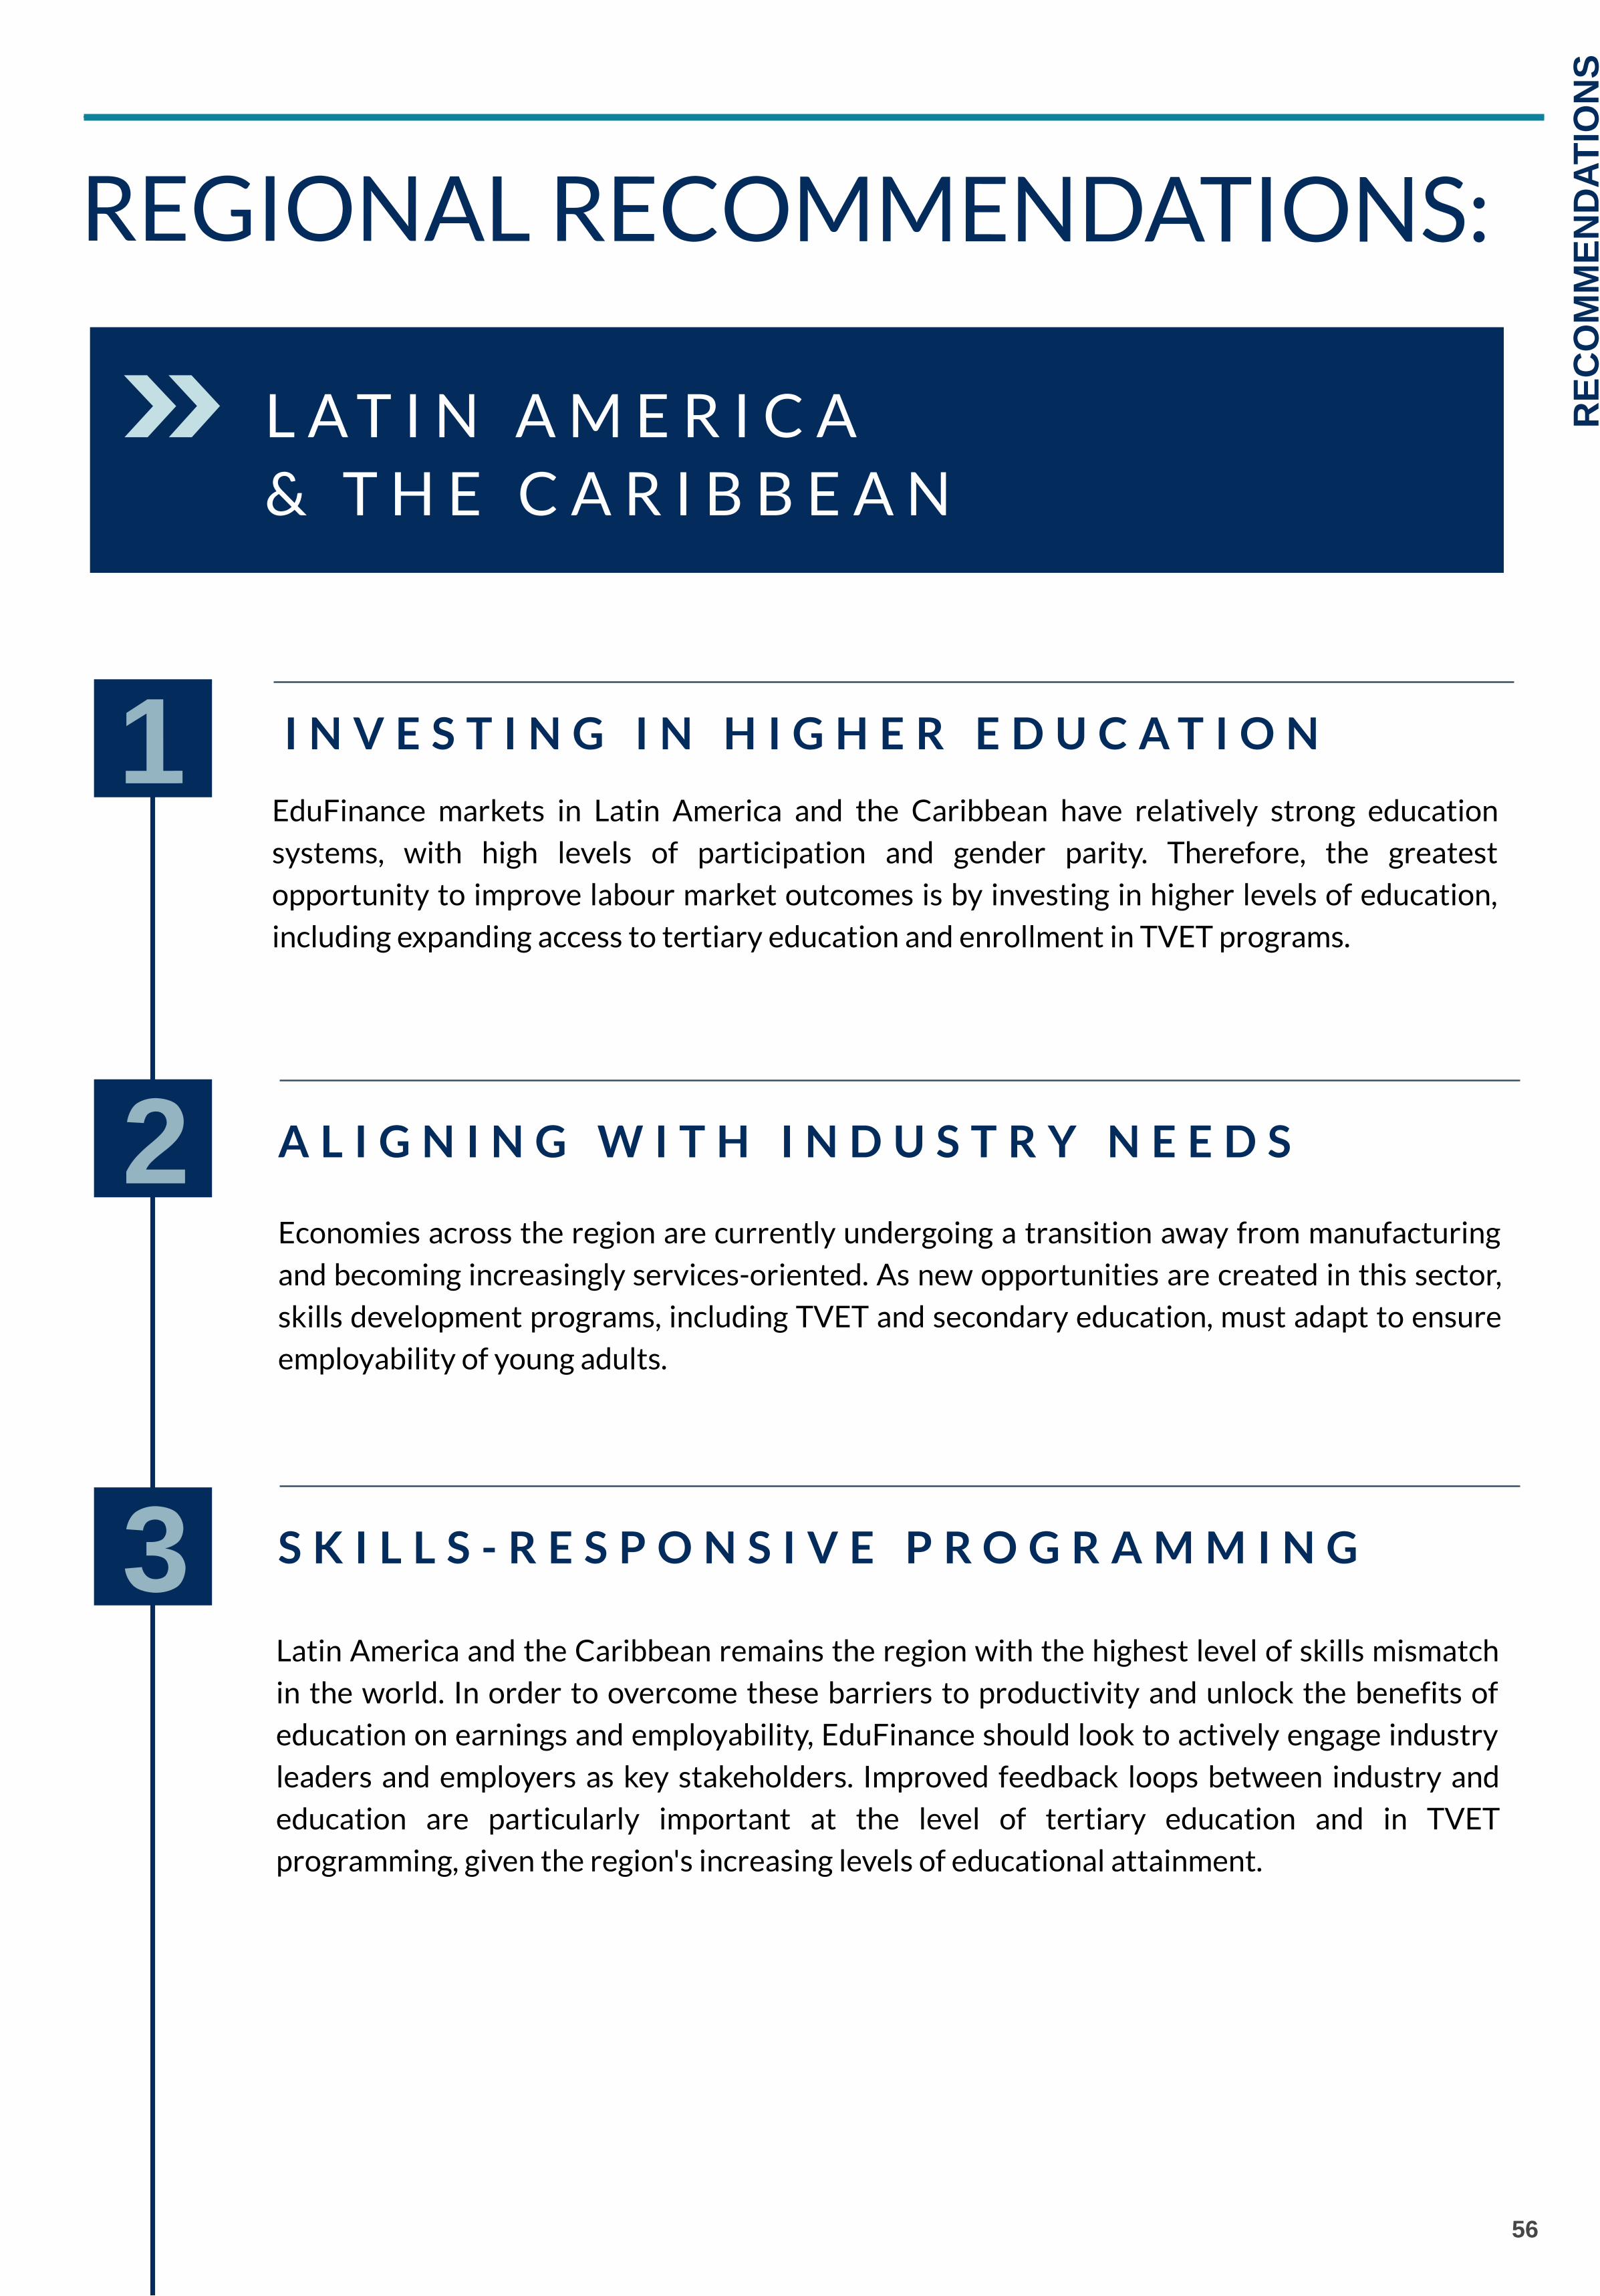
1
56
RECOMMENDATIONS
I N V E S T I N G I N H I G H E R E D U C A T I O N
EduFinance markets in Latin America and the Caribbean have relatively strong education
systems, with high levels of participation and gender parity. Therefore, the greatest
opportunity to improve labour market outcomes is by investing in higher levels of education,
including expanding access to tertiary education and enrollment in TVET programs.
A L I G N I N G W I T H I N D U S T R Y N E E D S
Economies across the region are currently undergoing a transition away from manufacturing
and becoming increasingly services-oriented. As new opportunities are created in this sector,
skills development programs, including TVET and secondary education, must adapt to ensure
employability of young adults.
REGIONAL RECOMMENDATIONS:
2
L A T I N A M E R I C A & T H E C A R I B B E A N
S K I L L S - R E S P O N S I V E P R O G R A M M I N G
Latin America and the Caribbean remains the region with the highest level of skills mismatch
in the world. In order to overcome these barriers to productivity and unlock the benefits of
education on earnings and employability, EduFinance should look to actively engage industry
leaders and employers as key stakeholders. Improved feedback loops between industry and
education are particularly important at the level of tertiary education and in TVET
programming, given the region's increasing levels of educational attainment.
3
57
Our team wishes to thank the EduFinance team,
Opportunity International, and the Munk School of
Global Affairs and Public Policy for facilitating our
Master's Capstone project. Our work with EduFinance
has been extremely rewarding. We sincerely appreciate
the EduFinance team's support throughout this project.
Under the guidance of EduFinance, our team set out to
explore how to direct education investments to drive
positive labour market outcomes. We conducted a broad
analysis of the education landscape in EduFinance’s
markets, while also investigating regional labour
markets. Finally, we analyzed the distinct ‘returns to
investment’ by levels of education. These three sections
informed our final recommendations and conclusions.
Throughout this project, we also received a great amount
of support from Dr. Rajshri Jayarman, Associate
Professor at the Munk School of Global Affairs & Public
Policy and the Department of Economics, and our
Capstone instructor this semester. Thank you Professor
Jayarman for your mentorship and unwavering support.
We look forward to following Opportunity International
and EduFinance's continued efforts to improve education
outcomes around the world.
CONCLUDING
REMARKS
SOURCES
58
Acosta, Pablo, Noel Muller, and Miguel Sarzosa. “Beyond Qualifications: Returns to Cognitive and Socio-Economic Skills in Colombia.” World Bank Group (2015). http://documents.worldbank.org/curated/en/954461468189869519/pdf/WPS7430.pdf
Adams, Arvil V. (2007), “The Role of Youth Skills Development in the Transition to Work: A Global Review.” World Bank
Group (2007).
African Development Bank Group. “African Economic Outlook 2020.” (2020). https://www.afdb.org/en/documents/african-economic-outlook-2020
African Leadership University. “Tertiary Education in Africa: The Missing Ingredient.” (2020). https://www.alueducation.com/tertiary-education-in-africa-the-missing-ingredient/
Almeida, Rita, Leandro Anazawa, Naercio Menezes Filho, and Ligia Vasconcellos. “Investing in Technical & Vocational Education and Training: Does it Yield Large Economic Returns in Brazil?” World Bank Group (2015).
Amaral, Nicole, Oliver Azuara Herrera, Carmen Pagés, Graciana Rucci, Carlos Ospina, Jesica Torres, and Stephanie González. “The Future of Work in Latin America & the Carribean: What are the most in-demand occupations and emerging skills in the region?” Inter-American Development Bank (2019). https://publications.iadb.org/publications/english/document/What_are_the_most_in-demand_occupations_and_ emerging_skills_in_the_region_print_version_en_en.pdf
Araujo, Maria Caridad, Martín Ardanaz, Edna Armendáriz, Jere R. Behrman, Samuel Berlinski, Julian P. Cristia, Luca Flabbi et al. "The Early Years: Child Well-Being and the Role of Public Policy." IDB Publications (Books) (2015).
Arias, Omar, David K. Evans, and Indhira Santos. “The Skills Balancing Act in Sub-Saharan Africa: Investing in Skills for Productivity, Inclusivity, and Adaptability.” World Bank Publications (2019).
ASER Centre. “Annual Status of Education Report (Rural).” (2017). http://img.asercentre.org/docs/Publications/ASER%20Reports/ASER%202017/aser2017fullreportfinal.pdf
Asmal, Zaakhir, Haroon Bhorat, and John Page. “Leveraging Demographic Trends for Economic Transformation: Job Creation, Skills Development, and Urbanization Policies.“ Brookings Institution Africa Growth Initiative (January 2020). https://www.brookings.edu/research/exploring-new-sources-of-large-scale-job-creation-the-potential-role-of- industries-without-smokestacks/
Atchoarena, David, and Peter Grootings. “Overview: Changing National VET Systems Through Reforms,” in Maclean, Robert and Wilson, David N. (eds) International Handbook of Education for the Changing World of Work: Bridging Academic and Vocational Education. Volume II. New York: Springer (2009).
Banerjee, Abhijit V., Shawn Cole, Esther Duflo, and Leigh Linden. "Remedying education: Evidence from two randomized experiments in India." The Quarterly Journal of Economics 122, no. 3 (2007): 1235-1264.
Barnett, W. Steven. "Effectiveness of early educational intervention." Science 333, no. 6045 (2011): 975-978.
Berlinski, Samuel, Sebastian Galiani, and Paul Gertler. “The Effect of Pre-Primary Education on Primary School Performance. Journal of Public Economics 93, no. 1-2 (2009): 219-234.
Bertoni, Eleonora, Gregory Elacqua, Luana Marotta, Matias Martínez, Sammara Soares, Humberto Santos, and Emiliana Vegas. “School Finance in Latin America: A Conceptual Framework and a Review of Policies.” Inter-American
Development Bank (August 2018). https://publications.iadb.org/publications/english/document/School-Finance-in- Latin-America-A-Conceptual-Framework-and-a-Review-of-Policies.pdf
Biavaschi, Costanza, Werner Eichhorst, Corrado Giulietti, Michael Jan Kendzia, Alexander Muravyev, Janneke Pieters, Núria Rodríguez-Planas, Ricarda Schmidl, and Klaus F. Zimmermann. "Youth Unemployment and Vocational Training." IZA Discussion Paper no. 6890 (2012).
Black, Maureen M., Susan P. Walker, Lia CH Fernald, Christopher T. Andersen, Ann M. DiGirolamo, Chunling Lu, Dana C. McCoy et al. "Early childhood development coming of age: science through the life course." The Lancet 389, no. 10064 (2017): 77-90.
Bonnal, Liliane, Sylvie Mendes, and Catherine Sofer. "School‐to‐Work Transition: Apprenticeship Versus Vocational School in France." International Journal of Manpower vol. 23, no. 5 (2002): 426-442.
Britto, Pia R., Stephen J. Lye, Kerrie Proulx, Aisha K. Yousafzai, Stephen G. Matthews, Tyler Vaivada, Rafael Perez-Escamilla et al. "Nurturing Care: Promoting Early Childhood Development." The Lancet 389, no. 10064 (2017): 91-102.
Brown, Edward K, and Helen Slater. "The Future of Work in Africa: Implications for Secondary Education and TVET Systems.” African Center for Economic Transformation (2018). https://mastercardfdn.org/wp- content/uploads/2019/05/Future-of-Work-and-Implications-for-Secondary-Education-and-TVET-FINAL.pdf
Chakraborty, Tanika, and Rajshri Jayaraman. "School Feeding and Learning Achievement: Evidence from India's Midday Meal Program." Journal of Development Economics 139 (2019): 249-265.
Colbert, Vicky. “What is Escuela Nueva?” HundrED (2020). https://hundred.org/en/innovations/fundacion-escuela-nueva

SOURCES
59
Culp, Anne McDonald. “The transactional model of development: how children and contexts shape each other.” Infant Medical Health Journal. (2009). https://onlinelibrary.wiley.com/doi/abs/10.1002/imhj.20246.
“Data for the Sustainable Development Goals.” UNESCO. Accessed March 1, 2020. http://uis.unesco.org/.
Deepa, Kurup. “Work Undone: How India Fails Its Young Job Seekers.” Aljazeera (May 2019). https://www.aljazeera.com/news/2019/05/work-undone-india-fails-young-job-seekers-190503111153484.html
Di Gropello, Emanuela. “The Future of Higher Education: Four Critical Questions for Education in Africa: Preparing Youth for the Future of Work.” The Mastercard Foundation (2019). https://mastercardfdn.org/research/secondary-education- in-africa/.
Di Gropello, Emanuela. “Meeting the Challenges of Secondary Education in Latin America and East Asia: Improving Efficiency and Resource Mobilization.” The World Bank (2006). http://documents.worldbank.org/curated/en/451411468265804054/Meeting-the-challenges-of-secondary- education-in-Latin-America-and-East-Asia-improving-efficiency-and-resource-mobilization
Di Gropello, Emanuela. “Policymakers in Developing Countries.” World Bank Independent Evaluation Group. (2018). https://ieg.worldbankgroup.org/blog/future-higher-education-four-critical-questions-policymakers-developing- countries.
Duflo, Esther, and Rema Hanna. Monitoring Works: Getting Teachers to Come to School. National Bureau of Economic Research (2005).
The Economist. “A booming population is putting strain on Africa’s universities.” (2019) . https://www.economist.com/middle-east-and-africa/2019/08/10/a-booming-population-is-putting-strain-on-africas- universities
EFA Global Monitoring Report Team. Education for All 2000-2015: Achievements and Challenges. Paris United Nations Educational, Scientific and Cultural Organization, (2015). https://unesdoc.unesco.org/ark:/48223/pf0000232205
Engle, Patrice L., Lia CH Fernald, Harold Alderman, Jere Behrman, Chloe O'Gara, Aisha Yousafzai, Meena Cabral de Mello et al. "Strategies for reducing inequalities and improving developmental outcomes for young children in low-income and middle-income countries." The Lancet 378, no. 9799 (2011): 1339-1353.
Epstein, Marc J., and Kristi Yuthas. "Redefining quality in developing world education." Innovations: Technology, Governance, Globalization 8, no. 3-4 (2013): 197-211.
Espinoza, Ricardo, and Sergio Urzúa. "The Economic Returns to Higher Education. Funding, Coverage and Quality in Latin America." Prepared for the World Bank. Second Draft (2015). http://conference.iza.org/conference_files/EcoEdu_2016/espinoza_r24401.pdf
Espiritu, Lloyd D., Kiran S. Budhrani, and Mark M. D’Amico. "Developing a Skilled Workforce Through Technical and Vocational Education and Training in the Philippines." (2018): 693-718.
Federal Ministry for Family Affairs, Senior Citizens, Women and Youth of Germany. “Pay Inequality between Women and Men in Germany.” (2009). https://www.bmfsfj.de/blob/94442/efbd528467e361882848c23486fcc8d8/pay-inequality-data.pdf
Fernald, Anne, Virginia A. Marchman, and Adriana Weisleder. "SES Differences in Language Processing Skill and Vocabulary Are Evident at 18 Months." Developmental Science 16, no. 2 (2013): 234-248.
Fiszbein, Ariel, Clemencia Cosentino, and Belén Cumsille. “The Skills Development Challenge in Latin America: Diagnosing the Problems and Identifying Public Policy Solutions.” Inter-American Dialogue and Mathematica Policy Research (October 2016). https://www.mathematica.org/our-publications-and- findings/publications/the-skills-development-challenge-in-latin-america-diagnosing-the-problems-and-identifying- public
Flores, M., & Melguizo, A. “Latin America Has the Biggest Skills Gap in the World. Here’s How to Bridge It.” In World Economic Forum. (March 2018.) https://www.weforum.org/agenda/2018/03/latin-america-has-the-biggest-skills-gap- in-the-world-here-s-how-to-bridge-it/.
Gammarano, Rosina. “Avoiding Unemployment Is Not Enough: An Analysis of Other Forms of Labour Underutilization.” International Labour Organization (August 2018). https://www.ilo.org/wcmsp5/groups/public/---dgreports/---stat/documents/publication/wcms_644467.pdf
Gertler, Paul, James Heckman, Rodrigo Pinto, Arianna Zanolini, Christel Vermeerch, Susan Walker, Susan Chang-Lopez, and Sally Grantham-McGregor. “Labor Market Returns to Early Childhood Stimulation: A 20-Year Followup to an Experimental Intervention in Jamaica.” World Bank (2013).
Ghandi, Dhruv. “Figures of the Week: Public Spending on Education in Africa,” The Brookings Institute (February 2020). https://www.brookings.edu/blog/africa-in-focus/2020/02/13/figures-of-the-week-public-spending-on-education-in- africa/
Glewwe, Paul, Sylvie Lambert, and Qihui Chen. "Education Production Functions: Updated Evidence from Developing Countries." In The Economics of Education, pp. 183-215. Academic Press (2020).
SOURCES
60
Glick, Peter J., Crystal Huang, and Nelly Mejia. "The Private Sector and Youth Skills and Employment Programs in Low and Middle-Income Countries." World Bank Group (2015).
Global Partnership for Education (February 2020).“Education in Nepal.” https://www.globalpartnership.org/where-we- work/nepal
Gomis, Roger, Steven Kapsos, Stefan Kühn, and Hannah Liepmann. “World Employment and Social Outlook: Trends 2020.” International Labour Organization (2020). https://www.ilo.org/wcmsp5/groups/public/---dgreports/---dcomm/--- publ/documents/publication/wcms_734455.pdf
Grantham-McGregor, Sally M., L. C. Fernald, R. M. Kagawa, and Susan Walker. "Effects of Integrated Child Development and Nutrition Interventions on Child Development and Nutritional Status." Ann NY Acad Sci 1308, no. 1 (2014): 11-32.
Grantham-McGregor, Sally M., Yin Bun Cheung, Santiago Cueto, Paul Glewwe, Linda Richter, Barbara Strupp, and International Child Development Steering Group. "Developmental Potential in the First 5 Years for Children in Developing Countries." The Lancet 369, no. 9555 (2007): 60-70.
Guha Majumdar, Mrittunjoy, Competency-Based Education in Indian Schools: Realities and Vision for the Future (September 17, 2019). https://papers.ssrn.com/sol3/papers.cfm?abstract_id=3455647
Handel, Michael J., Alexandria Valerio, and Maria Laura Sánchez Puerta. “Accounting for Mismatch in Low-and Middle- Income Countries: Measurement, Magnitudes, and Explanations.” World Bank (2016). https://openknowledge.worldbank.org/bitstream/handle/10986/24906/9781464809088.pdf? sequence=4&isAllowed=y
Hanushek, Eric A., Guido Schwerdt, Ludger Woessmann, and Lei Zhang. "General Education, Vocational Education, and Labor Market Outcomes over the Lifecycle." Journal of human resources 52, no. 1 (2017): 48-87.
Herranz, David. “Youth Unemployment Is a Huge Problem for Latin America. Here’s How to Solve It.” World Economic Forum. June 2016. https://www.weforum.org/agenda/2016/06/youth-unemployment-is-a- huge-problem-for-latin-america-here-s-how-to-solve-it/
International Labour Organization. “Informal Economy in Pakistan.” (2020). https://www.ilo.org/islamabad/areasofwork/informal-economy/lang--en/index.htm
International Labour Organization. “Upgrading Informal Apprenticeship: A Resource Guide for Africa.” (2011). https://www.ilo.org/wcmsp5/groups/public/---africa/---ro- abidjan/documents/publication/wcms_171393.pdf
Jung, Haeil, and Amer Hasan. “The Impact of Early Childhood Education on Early Achievement Gaps: Evidence from the Indonesia Early Childhood Education and Development (ECED) Project.” World Bank (2014).
Kingombe, Christian. "Lessons for Developing Countries from Experience with Technical and Vocational Education and Training." Economic Challenges and Policy Issues in Early Twenty-First-Century Sierra Leone (2012): 278-365.
Lavrijsen, J., & Nicaise, I. “Returns on vocational education over the life cycle: Between immediate labour market preparation and lifelong employability.” International Review of Education, 63(2). (2017): 257-280. https://link.springer.com/article/10.1007/s11159-017-9630-9.
Leopold, T. A., Ratcheva, V., Zahidi, S., & Samans, R. “The future of jobs and skills in Africa: preparing the region for the Fourth Industrial Revolution.” World Economic Forum (2017). http://www3.weforum.org/docs/WEF_EGW_FOJ_Africa.pdf.
Liu, G., & Clayton, J. “Measuring technical vocational education and training (TVET) efficiency: Developing a framework.” Journal of Open, Flexible and Distance Learning 20(2). (2018): 45-54. https://files.eric.ed.gov/fulltext/EJ1120877.pdf.
Manpower Group. "Top drivers of talent shortage." (2018). https://go.manpowergroup.com/talent-shortage- 2018#driversofshortage-explorebycountry
Matsumoto, Makiko, and Ruttiya Bhula-or. “Problem of skills mismatch in Asia and the Pacific: How useful are the existing measurement strategies?” In Skills and the Future of Work: Strategies for Inclusive Growth in Asia and the Pacific. International Labour Organization: Geneva, Switzerland. (2016). http://apskills.ilo.org/downloads/chapter-11- problem-of-skills-mismatch-in-asia-and-the-pacific-how-useful-are-the-existing-measurement-for-future-skills- strategies-1/at_download/file.
McCowan, Tristan. “Can higher education solve Africa’s job crisis? Understanding graduate employability in Sub-Saharan Africa.” British Council. (2014). https://www.britishcouncil.org/sites/default/files/graduate_employability_in_ssa_final- web.pdf.
Mingat, Alain, and Jee-Peng Tan. “The full social returns to education: Estimates based on countries' economic growth performance.” The World Bank. (1996).
National Centre for Vocational Education Research. “Women in VET 2000: At a glance.” UNESCO International Center for
Technical and Vocational Education and Training. (2000). https://unesdoc.unesco.org/ark:/48223/pf0000148004.
National Women’s Law Center. Equal opportunity in vocational and technical education: A promise still owed to the nation's
young women. Washington D.C.: National Women’s Law Center. (2002).
SOURCES
61
Neuman, S. and Ziderman, A. “Can Vocational Education Improve the Wages of Minorities and Disadvantaged Groups? The Case of Israel.” Economics of Education Review, vol. 22, no. 4. (2003): 421- 432.
Nores, Milagros. "The economics of early childhood interventions." Economics of Education Review. (2020): 229-238. https://doi.org/10.1016/B978-0-12-815391-8.00017-3.
Nores, Milagros, and W. Steven Barnett. "Benefits of early childhood interventions across the world: (Under) Investing in the very young." Economics of Education Review 29, no. 2 (2010): 271-282.
Obonyo, Raphael. “Preparing Africa’s graduates for today’s jobs.” United Nations. (2019). https://www.un.org/africarenewal/magazine/april-2019-july-2019/preparing-africa’s-graduates-today’s-jobs.
OECD (2017). “Education at a glance: OECD indicators.” (2017). http://www.oecd.org/education/eag2017indicators.htm.
OECD Local Economic and Employment Development. The role of technical and vocational education and training (TVET) in
fostering inclusive growth at the local level in southeast Asia (2018). Paris: OECD. (2018). https://doi.org/10.1787/20794797.
Olfindo, R. “Rethinking vocational education in the Philippines: Does it really lead to higher wages?” Journal of Southeast
Asian Economies, 35(1). (2018):79-100.
Palmer, Robert. “Jobs and Skills Mismatch in the Informal Economy.” International Labour Organization. (October 2017). https://www.ilo.org/wcmsp5/groups/public/---ed_emp/---ifp_skills/documents/publication/wcms_629018.pdf.
PASEC. Education System Performance in Francophone Africa, Competencies and Learning Factors in Primary Education. (2015). https://www.pasec.confemen.org/wp-content/uploads/2015/12/Rapport_Pasec2014_GB_webv2.pdf.
Patrinos, Harry Anthony, and George Psacharopoulos. "Returns to education in developing countries." The Economics of
Education. (2020): 53-64. https://harrypatrinos.files.wordpress.com/2020/01/returns-to-education-in-developing- countries-eco-of-ed-2020-elsevier.pdf.
Peet, Evan D., Günther Fink, and Wafaie Fawzi. "Returns to Education in Developing Countries: Evidence from the Living Standards and Measurement Study Surveys." Economics of Education Review 49 (2015): 69-90.
Pradhan, M., Suryadarma, D., Beatty, A., Wong, M., Alishjabana, A., Gaduh, A., & Artha, R. P. “Improving educational quality through enhancing community participation: Results from a randomized field experiment in Indonesia.” The World
Bank. (2011). https://openknowledge.worldbank.org/handle/10986/3559.
Pritchett, Lant. “The Rebirth of Education: Schooling Ain’t Learning.” Center for Global Development. (2013). https://www.cgdev.org/sites/default/files/rebirth-education-introduction_0.pdf.
Psacharopoulos, George, and Harry Anthony Patrinos. "Returns to Investment in Education: A Decennial Review of the Global Literature." World Bank Group. (2018). https://openknowledge.worldbank.org/handle/10986/29672.
Roser, Max, and Esteban Oritz-Ospina. “Tertiary Education.” Our World in Data. (2020). https://ourworldindata.org/tertiary-education
RTI International. “Status of Early Grade Reading in Sub-Saharan Africa.” U.S. Agency for International Development. (2015). https://www.globalreadingnetwork.net/sites/default/files/eddata/Status%20of%20Early%20Grade%20Reading%20 SSA%20to%20USAID.pdf.
Rucci, Graciana. “Skills Mismatches in Latin America and The Caribbean.” Inter-American Development Bank. (May 2017). https://www.ilo.org/wcmsp5/groups/public/---ed_emp/---ifp_skills/documents/presentation/wcms_554339.pdf
Ryan, P. “The School-to-Work Transition: A Cross-National Perspective.” Journal of Economic Literature. vol. 39, no. 1 (2001): 34–92.
Salazar-Xirinachs, José M. “6 ways Latin America can close its skills gap.” World Economic
Forum. (May 2015). https://www.weforum.org/agenda/2015/05/6-ways-latin-america-can-close-its-skills-gap/
Sanchez Puerta, Maria Laura, Sara Johansson de Silva, and Anam Rizvi. "Kenya: Capturing Skills Requirements and Assessing Skills Gaps in the Modern Economy." Jobs Working Paper 17. The World Bank Group. (2018). https://openknowledge.worldbank.org/bitstream/handle/10986/30169/128788-NWP-PUBLIC- STEPESKenyaWorkingPaperFinalMayFULL.pdf?sequence=5&isAllowed=y.
Sanghera, Tish. “Young, educated and jobless: The struggles of India's graduates.” Aljazeera. (May 2019). https://www.aljazeera.com/indepth/features/young-educated-jobless-struggles-indias-graduates- 190522074124672.html
Santos, Indhira, and Eliana Rubiano-Matulevich. “Minding the gender-gap in training in Sub-Saharan Africa.” The World
Bank. (August 12, 2019). https://blogs.worldbank.org/africacan/minding-gender-gap-training-sub-saharan-africa-five- things-know.
Seelke, Clare. “Overview of Education Issues and Programs in Latin America.” CRS Report for Congress. (December 2007.) https://fas.org/sgp/crs/row/RS22778.pdf

SOURCES
62
Shahbaz, Muhammad Moazam. “Graduate Employability: Employers’ Perception Survey Report 2018 - Pakistan.” Naqeebz
Consulting. (April, 2019). https://www.naqeebz.com/wp-content/uploads/2019/04/Graduate-Employability- Employers-Perception-Survey-Report-by-Naqeebz-Consulting.pdf
TechWire Asia. "In 2020, Southeast Asia must bridge the technology skills gap." (December 31, 2019). https://techwireasia.com/2019/12/in-2020-southeast-asia-must-bridge-the-technology-skills-gap/
Thakkur, Atul and Shahan Sud. “Budget 2020: How India can fix its education system and save its Demographic Dividend.” The Economic Times (January 30, 2020). https://economictimes.indiatimes.com/industry/services/education/budget-2020-how-india-can-fix-its-education- system-and-save-its-demographic-dividend/articleshow/73760310.cms?from=mdr
UNESCO. "Educational Attainment and Employment Outcomes: Evidence from 11 developing countries." in Education for
All Global Monitoring Report (2014). https://en.unesco.org/gem-report/report/2014/teaching-and-learning-achieving- quality-all.
UNESCO Institute for Statistics. “Sustainable Development Goals Database.” Accessed March 30, 2020. http://data.uis.unesco.org/.
UNESCO. “Revision of the 2011 Revised Recommendation Concerning Technical and Vocational Education.” (2015). http://portal.unesco.org/en/ev.php-URL_ID=13145&URL_DO=DO_TOPIC&URL_SECTION=201.html.
UNICEF. “The situation for children in Liberia.” (2018). https://www.unicef.org/liberia/situation-children-liberia
United Nations Development Group. Delivering the Post-2015 Development Agenda: Opportunities at the National and Local
Levels. New York: United Nations. (2015). https://unsdg.un.org/sites/default/files/Delivering-the-Post-2015- Development-Agenda_Report_web.pdf.
United Nations. The Millennium Development Goals Report. New York: United Nations. (2015). https://www.un.org/en/development/desa/publications/mdg-report-2015.html.
Urzúa Sergio and A. Sandra Bucarey. “The Economic Return to Vocational High Schools in Chile.” (2013). https://pdfs.semanticscholar.org/2390/87f229df6bbf39545442a85c8df8df3495df.pdf? _ga=2.48899686.132356276.1587138969-682792019.1587138969
Watson, L. “Where to next? Graduate outcomes from the Australian higher education and vocational education and training sectors.” Australian Journal of Career Development. (2000): 29-39. https://doi.org/10.1177/103841620401300205.
Wheebox. "India's skills report 2020." (February 2020). https://www.peoplestrong.com/wp- content/uploads/2020/02/India-Skills-Report-2020.pdf
Whitebread, David, and Sue Bingham.“School Readiness: A Critical Review of Perspectives and Evidence.” Association for
the Professional Development of Early Years Educators no. 2. (2011).
Wilson, Magdalena, Zia Khan, Panchimma Cheriyan, and Dimitri Stoelinha. “Secondary Education in Africa: Preparing Youth for the Future of Work.” Mastercard Foundation. (February 2019). https://mastercardfdn.org/wp-content/uploads/2019/03/SEA-School-to-Work-Transition-Final.pdf
World Bank. “The Education Learning Crisis: Being in School is Not the Same as Learning.” World Bank Group, January 22, 2019. https://www.worldbank.org/en/news/immersive-story/2019/01/22/pass-or-fail-how-can-the-world-do-its- homework.
World Bank. “The STEP Skills Measurement Program.” Accessed March 1, 2020. https://microdata.worldbank.org/index.php/catalog/step/about
World Bank. World Development Report 2012: Gender equality and development. Washington DC: World Bank. (2012). https://openknowledge.worldbank.org/handle/10986/4391
“World Population Prospects 2019.” UNDESA. Accessed March 1, 2019. https://population.un.org/wpp/DataQuery/
“Youth in Asia-Pacific: 2017 Factsheet.” UN ESCAP (2017). https://www.unescap.org/sites/default/files/Youth percent20factsheet percent202017 percent20- percent20Final_0.pdf

Related Documents