113 JYVÄSKYLÄ STUDIES IN BUSINESS AND ECONOMICS Personality and Labour Market Outcomes Jutta Viinikainen

Welcome message from author
This document is posted to help you gain knowledge. Please leave a comment to let me know what you think about it! Share it to your friends and learn new things together.
Transcript

113J Y V Ä S K Y L Ä S T U D I E S I N B U S I N E S S A N D E C O N O M I C S
Personality and Labour Market Outcomes
Jutta Viinikainen

JYVÄSKYLÄ STUDIES IN BUSINESS AND ECONOMICS 113
Jutta Viinikainen
UNIVERSITY OF
JYVÄSKYLÄ 2012
Esitetään Jyväskylän yliopiston kauppakorkeakoulun suostumuksellajulkisesti tarkastettavaksi yliopiston Ylistönrinteen salissa Kem1
kesäkuun 15. päivänä 2012 kello 12.
Academic dissertation to be publicly discussed, by permission of the Jyväskylä University School of Business and Economics,
in Ylistönrinne, hall Kem1, on June 15, 2012 at 12 o'clock noon.
JYVÄSKYLÄ
Personality and Labour Market Outcomes

Personality and Labour Market Outcomes

JYVÄSKYLÄ STUDIES IN BUSINESS AND ECONOMICS 113
JYVÄSKYLÄ 2012
Personality and Labour Market Outcomes
UNIVERSITY OF JYVÄSKYLÄ
Jutta Viinikainen

Copyright © , by University of Jyväskylä
URN:ISBN:978-951-39-4757-6ISBN 978-951-39-4757-6 (PDF)
ISBN 978-951-39-4756-9 (nid.)ISSN 1457-1986
2012
Jyväskylä University Printing House, Jyväskylä 2012
Editors Tuomo Takala Jyväskylä University School of Business and Economics Pekka Olsbo Publishing Unit, University Library of Jyväskylä

ABSTRACT
Viinikainen, Jutta Personality and labour market outcomes Jyväskylä: University of Jyväskylä, 2012, 141 p. (Jyväskylä Studies in Business and Economics ISSN: 1457-1986; 113) ISBN 978-951-39-4756-9 (nid.) ISBN 978-951-39-4757-6 (PDF) Finnish summary Diss. This thesis focuses on the role of personality in the labour market. The four empirical studies illustrate how individual characteristics are related to labour market outcomes, particularly earnings, employment and unemployment. The empirical studies are preceded by an introductory chapter in which the background, prior evidence and main results of the thesis are presented.
Chapter 2 analyses the connections between personality, the decision to drop out from education and labour market outcomes. With data drawn from the Jyväskylä Longitudinal Study of Personality and Social Development JYLS, we found that dropping out was associated with weaker labour market perfor-mance over a long period of time. When the model was augmented with per-sonality, the connection was reduced. Therefore dropouts seem to have or lack non-cognitive characteristics that are associated with labour market success.
Chapter 3 illustrates the connections between personality and labour mar-ket income based on JYLS. The results suggest that adulthood extraversion is positively associated with income when education, work experience and un-employment history, measured prospectively from longitudinal data, are con-trolled for.
Chapter 4 considers the relationship between personality and unemploy-ment. Utilising data drawn from JYLS, we found that Big Five openness to ex-perience was positively associated with both the duration of cumulative unem-ployment and the number of unemployment spells between ages 33 and 50. We also found that neuroticism was associated with longer durations of single un-employment spells. However, this result might be at least partly driven by re-verse causality.
Chapter 5 presents a statistical profiling system, based on micro-level data drawn from the Finnish Employment Register that aims to identify the potential long-term unemployed. The out-of-sample results suggest that compared to random and deterministic allocation methods, the statistical profiling model was clearly better at identifying those individuals with the longest durations of unemployment. Keywords: personality, employment, unemployment, dropout, profiling

Author’s address Jutta Viinikainen Jyväskylä University School of Business and Economics [email protected] Supervisor Professor Jaakko Pehkonen Jyväskylä University School of Business and Economics Reviewers Professor Tor Eriksson Aarhus Universitet Aarhus, Denmark Professor Guido Heineck University of Bamberg Bamberg, Germany Opponent Professor Tor Eriksson Aarhus Universitet

ACKNOWLEDGEMENTS
The studies reported in this PhD thesis were carried out during the years I worked as teaching assistant and researcher at the School of Business and Eco-nomics at the University of Jyväskylä. For financial support I would also like to thank Yrjö Jahnson Foundation.
I owe my greatest gratitude to my supervisor Professor Jaakko Pehkonen whose comments, support, patience and encouragement have been precious at all stages of this process. I am also grateful for the important contributions of my official pre-examiners Professor Tor Eriksson and Professor Guido Heineck. It is a great pleasure to have Professor Eriksson as my official opponent.
During my research I have benefitted from the comments and support of many people. Particularly I would like to thank my co-authors Professor Lea Pulkkinen and Katja Kokko from the Department of Psychology of University of Jyväskylä for collaboration. They have provided valuable comments and ex-pertise in the field of psychology throughout the process. I am also grateful to Professor Lea Pulkkinen and the Department of Psychology for providing the data which was used in three chapters of this thesis. At the beginning of the PhD studies it was my fortune to work at the Labour Institute of Economic Re-search with Roope Uusitalo and Ilpo Suoniemi for which I am truly grateful. I would also like to thank all my colleagues at the School of Business and Eco-nomics. The working atmosphere has been extremely warm and positive all these years.
Finally I wish to thank my family and friends for support and providing a good counterbalance to my academic work.
Jyväskylä, May 2012 Jutta Viinikainen

LIST OF ORIGINAL PUBLICATIONS
Article 3 pp. 57-81 Viinikainen, J., Kokko, K., Pulkkinen, L. & Pehkonen, J. 2010. Personality and labour market income: evidence from longitudinal data. LABOUR: Review of Labour Economics and Industrial Relations, 24(2), 201–220.

CONTENTS
1 INTRODUCTION ................................................................................................ 9 1.1 Background .................................................................................................. 9 1.2 Personality in psychology ....................................................................... 13
1.2.1 Concept of personality .................................................................... 13 1.2.2 Traits – the basic units of personality ........................................... 14 1.2.3 The development and stability of personality ............................ 17
1.3 Prior evidence on the importance of personality in the labour market ............................................................................................ 20 1.3.1 Personality and educational outcomes ........................................ 20 1.3.2 Personality and income .................................................................. 21 1.3.3 Personality and unemployment .................................................... 25
1.4 Outline of the study and main results ................................................... 26 References ............................................................................................................ 30
2 LABOUR MARKET PERFORMANCE OF EDUCATIONAL DROPOUTS: THE ROLE OF PERSONALITY ....................................................................... 38 2.1 Introduction ............................................................................................... 38 2.2 Longitudinal data on working careers, personality and dropping out
of school ..................................................................................................... 41 2.3 Labour market performance of dropouts: empirical results .............. 45 2.4 Conclusions ............................................................................................... 52 References ............................................................................................................ 54
3 PERSONALITY AND LABOUR MARKET INCOME: EVIDENCE FROM LONGITUDINAL DATA .................................................................................. 57 3.1 Introduction ............................................................................................... 57 3.2 Longitudinal data on personality, school achievement, and work
career .......................................................................................................... 60 3.2.1 Child personality characteristics ................................................... 63
3.3 Personality and labour market income: empirical results .................. 65 3.3.1 Labour market income and personality traits in adulthood ..... 66 3.3.2 Labour market income and child personality ............................. 70
3.4 Conclusions ............................................................................................... 71 References ............................................................................................................ 73 Appendix A ......................................................................................................... 77 Appendix B ......................................................................................................... 80
4 PERSONALITY TRAITS AND UNEMPLOYMENT: EVIDENCE FROM LONGITUDINAL DATA .................................................................................. 82 4.1 Introduction ............................................................................................... 82 4.2 How are personality characteristics related to unemployment? ....... 83 4.3 Longitudinal data and descriptive statistics ......................................... 87 4.4 Evidence on personality traits and subsequent unemployment ....... 92

4.4.1 Stability of personality traits and reverse causality ................... 92 4.4.2 Personality traits and unemployment: evidence from three
perspectives ...................................................................................... 95 4.5 Conclusions ............................................................................................. 102 References .......................................................................................................... 103 Appendix A ....................................................................................................... 108 Appendix B ....................................................................................................... 113 Appendix C ....................................................................................................... 114 Appendix D ....................................................................................................... 115
5 PROFILING THE UNEMPLOYED: RESULTS FROM REGISTER DATA .. 116 5.1 Introduction ............................................................................................. 116 5.2 Description of the profiling model ....................................................... 118
5.2.1 Selection of the estimation model ............................................... 119 5.2.2 Predictive performance of the model ......................................... 121 5.2.3 Performance among groups ........................................................ 123 5.2.4 Comparison of different allocation mechanisms ...................... 125
5.3 Conclusions ............................................................................................. 126 References .......................................................................................................... 128 Appendix A ....................................................................................................... 131 Appendix B ....................................................................................................... 134 Appendix C ....................................................................................................... 137
SUMMARY IN FINNISH ......................................................................................... 140

1 INTRODUCTION1
1.1 Background
The importance of cognitive ability in the labour market is well-documented (see, e.g., Becker, 1964; Griliches, 1977). Although personality is also intuitively an important determinant of economic success, traditionally is has been treated as a part of “unobserved heterogeneity” in economic models. During the past ten years, economic research on the role of personality characteristics in the la-bour market has increased significantly. For example Braakmann (2009), Bowles et al. (2001 a,b), Heckman et al. (2006), Heineck (2011), Mueller and Plug (2006), Nyhus and Pons (2005), Osborne Groves (2005), Semykina and Linz (2007), and Uysal and Pohlmeier (2011), among others, have documented significant rela-tionships between personality and various labour market outcomes, such as earnings, unemployment, occupational choice, and educational achievement. The importance of personality has been illustrated for example by Heckman et al. (2006: 412) as follows: “for a variety of dimensions of behavior and for many labor market outcomes, a change in noncognitive skills from the lowest to the highest level has an effect on behavior comparable to or greater than a corre-sponding change in cognitive skills”. As Boghans, ter Weel and Weinberg (2006) suggest, the importance of personality characteristics might increase in the fu-ture, because technological and organisational changes have increased the im-portance of people skills in the work place.
There are at least three reasons why it is important to understand the con-nections between personality characteristics and labour market outcomes. First, if we understood the role of personality characteristics in the labour market, it might be possible to improve the market’s functioning. For example, personali-ty tests are widely used in recruitment to enhance decision making about the 1 I would like to thank Katja Kokko and Jaakko Pehkonen for their helpful comments
and suggestions.
10
applicants. For such tests to be effective, it is important to understand the causal effects between personality and labour market outcomes. It might also be pos-sible to create more effective incentive schemes in the workplace when differ-ences in personality characteristics are taken into account, as the findings of, e.g., Vandenberghe, St-Onge and Robineau (2008) suggest. Understanding the causal relationships between personality and labour market outcomes can also be useful for policy purposes. For example, when referring individuals to re-employment services, knowledge of the causal relationships between personali-ty and unemployment duration could be used in service allocation.
Second, if we understood how personality characteristics affect labour market outcomes, it might become possible to improve individual well-being and the functioning of the labour market by paying attention to the develop-ment of these characteristics. It seems to be possible to influence these charac-teristics at least to some extent. The results of the Perry Preschool Program show that early interventions that promote non-cognitive skills can improve socioeconomic achievements.2 The Perry Preschool Program targeted disadvan-taged children aged 3 and 4 years with subnormal IQs and aimed to foster their ability to plan actions, execute their plans, and review their work in social groups. In addition, the intervention taught reading and mathematical skills. Although the mean IQs of the treatment group and the control group were the same, the treatment group was far more successful than the control group on a variety measures of socioeconomic achievement. For example, individuals in the treatment group were significantly less likely to become involved in illegal activities before age 40. (see e.g. Almlund et al., 2011; Cunha et al., 2006).
Third, from the econometric modelling point of view, it is important to know which background variables affect the outcome variables. For example, if personality characteristics affect labour market outcomes, ignoring this connec-tion in estimations would generally lead to omitted variables bias in the includ-ed variable estimates and their standard errors.3 In a model with two regressors, one of which is omitted, the sign of the bias depends on the sign of the omitted variable estimator and on the covariance between the included regressor and the omitted variable. In a model with multiple regressors it can be difficult to ascertain the direction of the bias because the regressors and the omitted varia-ble can all be pairwise correlated. 4 (Wooldridge 2009: 90-93) 2 Further evidence on ways to improve non-cognitive skills is presented in Almlund et
al. (2011). 3 In the case where the true model has two explanatory variables, x1 and x2, and an
error term, omitting x2 would generally induce bias to the OLS estimate of x1. There are two cases where the estimate of x1 is unbiased. First, if x2 does not appear in the true model (i.e. the coefficient is zero), then the estimate of x1 is unbiased. Second, if x1 and x2 are uncorrelated in the sample, then the estimate of x1 is unbiased even if the coefficient of x2 is different from zero. Also in the more general case, where there are multiple regressors in the estimated model, omitting one variable normally caus-es bias in regression coefficients. (see e.g. Wooldridge, 2009: 89-94.)
4 Certain econometric methods can be applied to correct for omitted variable bias. The instrumental variable approach (IV) can be used if there is an instrument z that is re-lated to the endogenous explanatory variable (instrument relevance) but uncorrelat-

11
Economists’ knowledge of the role of personality characteristics in the la-bour market has increased significantly during the past decade. However, some questions remain to be answered. In particular, the following three questions merit more attention in the future. First, why are personality characteristics re-lated to labour market outcomes? Second, what is the direction of causality: Does personality affect labour market outcomes, or the other way around? Third, how do we measure personality characteristics?
The question of why personality is related to labour market performance remains something of a black box to economists. According to recent theoretical literature, personality may affect labour market performance through different channels. Mueller and Plug (2006) hypothesise that there are three alternative ways in which personality could be related to labour market performance. The-se ways are: i) Differences in skills: personality can be seen as a set of qualities that contribute to productivity; ii) Discrimination: certain characteristics might hinder career building, although they do not affect the individual’s productivity as such; and iii) Differences in preferences: personality might be linked to pref-erences such as attitudes towards leisure and job search efforts. Recently, re-searchers have shown particular interest in the third explanation, which pre-sumes that differences in preferences can explain the connections between per-sonality and labour market outcomes. The emerging literature in this field seems promising because empirical studies have found connections for example between personality and risk preferences (e.g., Dohmen et al., 2010; Bibby and Ferguson 2011; Borghans et al., 2009; Anderson et al., 2011), time preferences (Daly et al., 2009; Dohmen et al. 2010; Anderson et al., 2011), and social prefer-ences (Ben-Ner & Kramer, 2011; Dohmen et al., 2008). Previous studies also provide evidence that preferences are likely to affect labour market perfor-mance such as earnings, occupational status and unemployment (Bonin et al., 2007; Farrel et al., 2006; Dohmen et al., 2011; Barsky et al., 1997; Constant et al., 2011, Pannenberg et al., 2010; Fortin, 2008). This literature is still in its infancy, although it could turn out to be a fruitful area for future research.
The second issue that merits more attention is causality. Although many studies have documented connections between personality characteristics and labour market outcomes, in many cases the direction of causality remains un-clear. The usual premise in the economic literature is that personality character-istics affect labour market outcomes, such as earnings and unemployment. However, it is possible that the causality goes the other way around; that is, personality may be shaped by success or failure in the labour market (reverse causality), or causality may go in both directions causing simultaneity bias. Be-
ed to the error term in the model (instrument exogeneity). In the context of omitted variables, instrument exogeneity means that z should not have a partial effect on the dependent variable (after the endogenous explanatory variable and the omitted vari-ables have been controlled for), and z should be uncorrelated with the omitted varia-bles. In panel data, if we assume that the omitted variable does not change over time, the fixed effects or first-differencing methods could be used. (Wooldridge, 2009: 507-508.)

12
cause of data limitations, reverse causality and the simultaneity bias are often untested. Yet, as noted by Almlund et al. (2011: 8), for policy purposes, it is im-portant to know the mechanisms of causation to explore the viability of alterna-tive policies.
Additionally different measures of personality characteristics might ex-pand our knowledge and perception of the connections between personality and labour market outcomes. For example, it might be interesting to consider narrower traits of personality instead of the five broad levels of the Big Five personality traits. This suggestion was illustrated by Dundley, Orvis, Lebiecki and Cortina (2006) who find evidence that subtraits subsumed under conscien-tiousness incrementally predict job performance better than global conscien-tiousness itself does. It could be also productive to determine whether configu-rations of personality traits could shed further light on the connections between personality and labour market outcomes. According to Herzberg and Roth (2006) numerous psychological studies have proposed three major personality prototypes comprising combinations of the Big Five personality traits: 1) Resili-ents (low neuroticism, high or intermediate levels of other traits); 2) Overcon-trolled (high neuroticism, low extraversion); and 3) Undercontrolled (low con-scientiousness and neuroticism). It is possible that such combinations of per-sonality traits would provide additional information about the connections be-tween personality and labour market outcomes. Finally, although empirical research has usually treated the effects of personality as linear, there is growing evidence of curvilinear and non-linear relationships between personality and job performance (Burch & Anderson, 2009: 751).
The structure of this introductory chapter is as follows. Section 1.2 dis-cusses the definition of personality and focuses on the Big Five personality traits, which are often used as indicators for personality characteristics in both psychological and economic research. This section also discusses the develop-ment and stability of personality, which is one of the central issues of both eco-nomics and personality psychology. Section 1.3 presents prior evidence on the importance of personality characteristics in the labour market. In particular, the section focuses on the connections between personality and educational out-comes, income, and unemployment. The last section provides an outline of the four empirical studies included in this thesis. The studies are summarised based on the data used, their main objectives and the results. The first study explores the labour market performance of educational dropouts by using microdata drawn from the Jyväskylä Longitudinal Study of Personality and Social Devel-opment (JYLS). The novelty of this paper rests on the fact that we analyze, how the impact of dropping out on labour market outcomes changes, when differ-ences are taken into account. The second study examines the connections be-tween personality characteristics and labour market income by using the JYLS where as the next two studies focus on unemployment. By using JYLS, the third study explores how personality traits are related to unemployment. The fourth study continues with the this theme by illustrating whether it is possible to identify the long term unemployed by using observable individual characteris-

13
tics such as education and occupation. This final study is based on microdata of unemployment spells drawn from the Finnish employment registers.
1.2 Personality in psychology
1.2.1 Concept of personality
This section presents a short introduction to some basic concepts in personality psychology. Following the scope of this thesis, this section concentrates on the Big Five personality traits. The origins of personality psychology can be traced to the 1930s, when one of the pioneers of researchers in this area, Gordon Allport (1897-1967), pub-lished his book, “Personality: a psychological interpretation”. In this book, he defined personality as follows:
Personality is the dynamic organization within the individual of those psychophysi-cal systems that determine his unique adjustment to his environment. (Allport, 1937, p. 48).
Throughout the history of scientific psychology, researchers have taken several diverse approaches to personality. 5 A frequently shared assumption among these approaches is that an individual’s personality begins with biologically innate components and that these innate tendencies are channelled by the influ-ences of many factors over the life cycle, such as family experiences, culture and other life experiences. The resulting pattern of habitual behaviours, cognitions, emotional patterns, and so on, constitutes personality. (Cloninger, 2009: 3-5). For example McAdams (2001) and McAdams and Olson (2010) suggests that there are three layers of personality. The first layer consists of dispositional traits, which describe the most basic and general dimensions upon which persons are typically perceived to differ. These traits, such as the Big Five personality traits, are broad, internal features that account for consistencies in behaviour, thought, and feelings across situations and over time. The second layer, characteristic ad-aptations, refers to an individual’s goals, plans, projects, values and other con-textualised features of personality, which capture individual differences in mo-tivation. The third level, narrative identity, is the evolving life story that a person begins to develop in late adolescence to provide life with meaning and purpose. These personality constructs – traits, adaptations and narratives - develop across the human life course.
5 The six major perspectives in personality are: biological, cognitive, humanistic, learn-
ing, psychodynamic and trait approach. See Cloninger 2009: 4 for further details.

14
1.2.2 Traits – the basic units of personality
A central concept related to personality is that of the trait, which refers to broad regularities or consistencies in behaviour that trait psychologists view as the basic units for describing individual differences. McCrae and Costa (2006: 25) defined traits as “dimensions of individual differences in tendencies to show consistent patterns of thoughts, feelings, and actions”. The more of a particular trait people have, the more likely they are to show the behaviour it predisposes them toward, although traits are not absolute determinants of behaviour. Allport was one of the first psychologist to construct a taxonomy of traits by classifying almost 18,000 terms describing personality characteristics into categories (Allport, 1937). Later, two influential trait theorists Raymond Cattell (1905-1998) and Hans J. Eysenck (1916-1997) continued Allport’s work and in-troduced factor analysis to the trait theory research. Since Allport, Cattell, and Eysenck, many factor-analytic studies were performed without reaching con-sensus on the basic trait units (Pervin, 2003: 38-47). However, at the end of the twentieth century a wide consensus supporting the Big Five personality traits, which were developed by Costa and McCrae (1985), emerged (McCrae 2009: 149).6 McCrae and Costa first defined a three factor model with the following traits: neuroticism, extraversion, and openness to experiences (NEO). Later, they increased the number of traits to five by adding agreeableness and conscientious-ness to the model. This model was published as the NEO Personality Inventory (NEO-PI) (McCrae & Costa 2006: 34-36). Each of the factors in this five-factor model (FFM) is made up of six facets or sub-traits. The Big Five personality traits are widely used in research and the model has been demonstrated to pre-dict many real-world outcomes related to, for example academic and labour market performance (for review, see Almlund et al., 2011), mental and physical disorders (see, e.g., Goodwin & Friedman, 2006), and subjective well-being (Hayes & Joseph, 2003). The five factors have been found in many studies de-spite of language and cultural differences between samples (McCrae & Costa, 2006: 87-89). Empirical evidence also suggests that individuals in different cul-tures typically show similar patterns of personality trait development. (McCrae & Costa, 2006: 84-97). The Big Five personality traits and their facets are de-scribed in Table 1.
6 For competing taxonomies of personality see Bouchard and Loehlin (2001: 246).

15
TABLE 1 The Big Five personality traits and their facets. Factor and facets American Psycholo-
gy Association dic-tionary description
Characteristics of a low-scoring individ-ual
Characteristics of a high-scoring indi-vidual
Openness to new experiences - Fantasy - Aesthetics - Feelings - Actions - Ideas - Values
The tendency to be open to new aesthet-ic, cultural, or intel-lectual experiences.
Favours conservative values. Judges in conventional terms. Uncomfortable with complexities. Moral-istic.
Values intellectual matters.
Conscientiousness - Competence - Order - Dutifulness -Achievement striv-ing - Self-discipline -Deliberation
The tendency to be organised, responsi-ble, and hardwork-ing.
Eroticises situations. Unable to delay grati-fication. Self-indulgent. Engages in fantasy and daydreams.
Behaves ethically. Dependable, respon-sible, productive. Has high aspiration level.
Extraversion - Warmth - Gregariousness - Assertiveness - Activity - Excitement seeking - Positive emotions
An orientation of one's interests and energies toward the outer world of people and things rather than the inner world of subjective experi-ence; characterised by positive affect and sociability.
Emotionally bland. Avoids close relation-ships. Overly control-ling of impulses. Submissive.
Talkative, gregarious, socially poised, be-haves assertively.
Agreeableness - Straightforwardness - Altruism - Compliance - Modesty - Tendermindedness
The tendency to act in a cooperative, unself-ish manner.
Critical, sceptical. Shows condescending behaviour. Tries to push limits. Expresses hostility directly.
Sympathetic, consid-erate, warm, compas-sionate. Arouses lik-ing, behaves in a giv-ing way.
Neuroticism - Anxiety - Angry hostility - Depression - Self-conscious - Impulsiveness - Vulnerability
A chronic level of emotional instability and proneness to psychological dis-tress.
Calm, relaxed, satis-fied with self, clear-cut personality, prides self on objec-tivity.
Thin-skinned, anx-ious, irritable, guilt-prone.
Sources: (Pervin, 2003: 48 (facets of the Big Five); Almlund et al., 2011 (Descriptions from the American Psychology Association Dictionary); McCrae & Costa, 2006: 53 (characteris-tics of individuals with low/ high scores).

16
Although the Big Five personality traits are widely used, it would be premature to state that a universal consensus of the taxonomy of traits exists. The Five Fac-tor theory has been criticised particularly for the following five reasons. First, it is not based on any underlying theory, but instead on empirical factor analytic findings. One of the weaknesses of factor analysis is that different researchers can arrive at different conclusions from the same data when they use the tech-nique differently (McCrae & Costa, 2006: 33). Second, the five factors are not fully orthogonal, which means that they are not independent. For example, negative correlations often appear between neuroticism and extraversion (Beck-er, 1999). Third, there is still disagreement about the number of traits. The three-factor model has its adherents, and some psychologists believe that a model with five factors is too broad for applied work. (McCrae, 2009: 153-154.) Fourth, some critics argue that the five factors do not cover all aspects of human per-sonality. For example, it has been proposed that such factors as religiosity, con-ventionality, manipulativeness and seductiveness should be taken into account (MacDonald, 2000; Paunonen & Jackson, 2000). Some psychologists also suggest that there are trait factors unique to particular cultures that are not acknowl-edged in the Five Factor theory (Cheung et al. 1996; Church, 2001; Yang & Bond, 1990). The fifth source of criticism arises from the way in which the Big Five per-sonality traits are usually measured, that is self-reported questionnaires. The questionnaire associated with the five-factor model is the Revised NEO Person-ality Inventory (NEO PI-R), which consists of 240 items, and individuals are asked to rate to what extent they agree with each of these statements on a five-point scale (1=strongly disagree, 5=strongly agree). The responses are then summed to yield five basic domain scores for the Big Five personality traits. (McCrae & Costa, 2006.) The short version of the questionnaire is the NEO-Five Factor Inventory (NEO-FFI) which has 60 items (12 items for each trait). Two potential problems are associated with self-reported questionnaires. First, indi-viduals might have faulty knowledge of their inner states, and some individu-als might be better self-reporters than others. Second, individuals might attempt to portray a more favourable personality than they truly possess, which is called “socially desirable responding” in psychology. Paulhus (1984) divided this socially desirable responding into conscious “impression management” and subconscious “self-deception”. However, evidence suggests that people can be reasonably accurate judges of their own personality characteristics and that self- and observer ratings can show reasonable agreement. (Pervin, 2003: 427-430.) For example there is evidence that husbands and wives show relatively good agreement on the husbands’ scores for the Big Five factors – the only ex-ception was neuroticism (Pervin & John, 2001). Further, Li and Bagger (2006) find in their meta-analysis that impression management and self-deception did not create spurious effects on the relationship between personality measures and performance or function as performance predictors. For further discussion, see, e.g., Pervin (2003: 427-431).

17
1.2.3 The development and stability of personality
The stability of personality has been one of the major questions in personality psychology and personality economics. The stability of personality can refer to two issues: longitudinal stability (stability over a lifecycle, which can be further divided into mean level stability and rank order stability), and cross-situational stability. Following the scope of this thesis, this section concentrates on the de-velopment and stability of personality over the life cycle. The end of this section includes a short discussion of cross-situational stability.
Most personality psychologists share the assumption that personality has a biological origin and that these innate tendencies are influenced by life expe-riences over the life cycle. (Cloninger, 2009: 5.) The term temperament refers to “individual differences in general mood or quality of emotional response, typi-cally assumed to be largely inherited, biologically based and fairly stable over the course of personality development” (Pervin, 2003: 56). The discussion of the extent to which personality is determined by genes, or so-called intrinsic matura-tion (nurture), versus the environment (nature) is referred to as the nature nur-ture debate (see, e.g., Pervin, 2003: 149-183). Empirical studies such as Caspi et al. (2003) and Asendorpf et al. (2008) suggest that child temperament is related to adult personality characteristics. However, genetic determinism does not seem to be the whole story. Twin studies have demonstrated that although genes con-tribute approximately 50 per cent of the variance in personality traits, non-shared environments also have a significant effect on the development of traits. (Krueger et al., 2008.)
Personality psychologists usually illustrate the longitudinal stability of personality (stability for short) using two different measures, mean level stability and rank order stability. Mean level stability refers to the change over time in ab-solute levels of a trait (absolute change) and rank order stability to the change in the ordinal ranking of a trait in the population (relative change). Both mean level and rank order stability of the Big Five personality traits have been widely explored in psychological literature (for a recent review, see Specht et al., 2011). Studies of mean level stability show either that traits stabilise by age 30 (e.g., Cos-ta & McCrae, 1994; McCrae & Costa, 2006) or that, based on a significant amount of evidence, traits change more than trivially through midlife (e.g., Sri-vastava et al. 2003; Roberts et al., 2006; Specht et al., 2011). According to the so-called “plaster hypothesis”, personality traits reach maturity by age 30. The sta-bility lasts through middle age, though personality can change again in old age because of cognitive decline (e.g. Costa & McCrae, 1994). The original plaster hypothesis stated that changes in the Big Five traits after age 30 were non-existent or trivial. Later, the theory was “softened” by stating that personality changes more slowly after age 30 than before (McCrae & Costa, 1999). However, even the “soft plaster hypothesis”, as, for instance, Srivastava et al. (2003) call it, has been challenged because considerable mean level changes in personality traits have also been reported after age 30 (see, e.g., Srivastava et al., 2003; Rob-erts et al., 2006; Specht et al., 2011).

18
According to a meta-analysis by Roberts and DelVecchio (2000), the rank order stability of the Big Five personality traits consistently increases from child-hood to age 30 and then stabilises between the ages of 50 and 70 years. Howev-er, recent research suggests that rank-order stability can also follow a quadratic function (inverted-U-form) with a peak at age 50 and a decrease afterwards (Ardelt, 2000). Specht et al. (2011) also found that, whereas conscientiousness showed continuously increasing rank-order stability across adulthood, the oth-er Big Five personality traits followed an inverted U-shaped function, reaching a peak between the ages of 40 and 60 and then decreasing afterwards. Further-more, in the JYLS, considerable rank-order stability (ranging from 0.65 to 0.97) in the Big Five traits has been observed from age 33 to 42 years (Rantanen et al., 2007).
Longitudinal stability of personality is related to two econometric issues, which are frequently mentioned, although often neglected, in personality eco-nomics. These are the potential reverse causality or simultaneity bias and the errors-in-variables problem (e.g., Almlund et al., 2011; Borghans et al., 2008). The usual premise in the economic literature is that personality characteristics affects labour market outcomes such as earnings and unemployment. However, it is possible that the causality goes the other way, that is, that personality char-acteristics are shaped by success or failure in the labour market (reverse causali-ty), or that causality goes in both directions, causing simultaneity bias. Because of data limitations, the potential reverse causality and simultaneity bias are of-ten dismissed by assuming that personality traits, particularly the Big Five per-sonality traits, are stable over the relevant time period. This assumption is con-venient because it implies that personality traits are exogenous and not driven by the outcome variable and that personality traits can be measured even after the outcome of interest (Cobb-Clark & Schurer, 2011). Another solution to re-verse causality that is applied in empirical studies is the use of personality measures, obtained before the labour market outcome of interest.
Unfortunately, both of these solutions are problematic. First, it is not obvi-ous that personality traits are stable. If personality changes are due to genetic factors (intrinsic maturation), reverse causality should not be a problem. How-ever, if the outcome variable (such as unemployment) affects personality, the reverse causality problem exists. Additionally the use of lagged personality measures is not without problems. First, early measures of traits may be poor proxies for the traits that drive measured current behaviour. Also, if personality is measured before the beginning of unemployment and, personality character-istics change between the time of measurement and the beginning of unem-ployment, a measurement error problem would be induced.7 (Almlund et al., 2011.) Another problem associated with lagged personality traits is that they do 7 It is worth noticing that measurement error can also arise at the time of measurement.
As discussed in section 1.2.2, this measurement error might arise because individuals have faulty knowledge of their inner states, because some individuals are better self-reporters than others and, because individuals might give false impression of their personality.

19
not necessarily eliminate the reverse causality problem. This is because it is possible that previous labour market experiences have already shaped personali-ty.
Measurement error in an explanatory variable and simultaneity are likely to cause biased and inconsistent estimates. In a simple linear model with one explanatory variable, classical measurement error leads to OLS estimates that underestimate the effect of personality characteristics on labour market out-comes (attenuation bias).8 The size of this inconsistency depends on the vari-ance of the true value of the explanatory variable and the variance in the meas-urement error. If the variance of the true value of the explanatory variable is large relative to the variance in the measurement error, then the inconsistency in OLS will be small. If there are more explanatory variables in the model clas-sical measurement error in one variable generally biases also the coefficients of accurately measured variables.9 Measurement error in more than one explana-tory variable, even if the measurement error was classical, does not necessarily attenuate the coefficients of the variables with error, but the error can also be positive. Furthermore, if the measurement error is non-classical, the attenuation may not hold. Overall, the results on the effect of measurement error based on linear models are often approximately true within the context of the non-linear models that have been explicitly studied and if anything, non-linearities tend to exacerbate biases introduced by measurement error. Except under special as-sumptions, simultaneity also produces biased and inconsistent estimates. In a simple model with one explanatory variable, the sign of the bias in the OLS es-timate depends on the coefficients in the structural model.10 Obtaining the di-rection of the bias is generally complicated. The conventional way of dealing with measurement error bias is to use instrumental variables estimation. Under certain circumstances, this strategy produces consistent estimates of the param-eters of interest in a linear model if measurement error is classical, but not in general otherwise.11 Correcting for bias created by errors in variables is more 8 Classical measurement error is “measurement error in a given variable, which is as-
sumed to be independent of the true level of that and all other variables in the model, measurement error in other variables, and the stochastic disturbance”. Bound et al. (2000: 1)
9 In a special case, where the true value of a mismeasured explanatory variable is un-correlated with the accurately measured explanatory variables, the estimates for the accurately measured variables are consistent. However, this is rarely the case; gener-ally, measurement error in a single variable causes inconsistency in all estimators. (Wooldridge, 2009: 302.)
10 If we consider a two-equation structural model, where 1211 uyy += α and 2122 uyy += α and u1 and u2 are uncorrelated, the asymptotic bias in the OLS esti-
mator of 1α has the same sign as ).1/( 122 ααα − (Wooldridge, 2009: 550-552.) 11 Suppose there is a bivariate regression model εβ += ** xy , where y* is measured
without error but, we have two error ridden indicators of x*, 11 * uxx += and 22 * uxx += , with u1 and u2 uncorrelated with x*. Using either x1 or x2 as proxies for
x* will lead to estimates of β that are biased towards zero. If we use x2 to instrument x1, the obtained ivβ represents a consistent estimate for β under the following cir-cumstances: x2 is exogenous i.e. not correlated with y* except through its correlation with x1, u1 is uncorrelated with x* and the measurement errors in x1 and x2 are uncor-related with each other. (Bound et al., 2000: 25-26).
20
difficult in non-linear models, and typically, instrumental variable methods work well only when errors are relatively small in magnitude. Instrumental variables estimation can also be used to obtain consistent estimators under simultaneity bias. (Bound, Brown & Mathiowetz, 2000; Wooldridge, 2009.)
Along with longitudinal stability, another central issue in the context of stability of traits is cross-situational stability. Cross-situational stability refers to the extent to which individuals express their personality traits in different situa-tions. The definition of “trait” suggests that there is consistency in behaviour across situations. However, this view was challenged by Michel (1968), who claimed that behaviour depends on the situation itself. The debate about whether personality consistently guides individual’s actions or whether behav-iour is completely situation specific is called person-situation debate in personali-ty psychology. If the behaviour was completely situation specific, and traits had no role in explaining behaviour, the use of personality traits, e.g. in economic models would not make much sense. However, nowadays there seems to be quite strong unanimity that both sides of the person-situation debate have mer-it. The situation side is correct in the sense that a typical individual’s behaviour is highly variable. However, traits predict and describe behaviour well over long stretches of time, and a trait approach is needed to explain differences be-tween people. (Fleeson, 2004; Lucas & Donnellan, 2009.)
1.3 Prior evidence on the importance of personality in the labour market
Previous studies in economics and psychology suggest that personality charac-teristics are related to a wide range of outcomes in different areas of life. Almlund et al. (2011) present an extensive survey of studies implying that per-sonality traits are related to educational attainment and achievement, labour market outcomes, health, and crime. Furthermore, Roberts et al. (2007), among others, review psychological evidence of how personality traits predict mortali-ty, divorce, and occupational attainment. This section presents a short survey on economic studies, of the relationship between personality and labour market outcomes. The literature in this field has expanded significantly during the re-cent years, so providing a comprehensive, detailed survey would be a tremen-dous task. Therefore, following the scope of the thesis, this discussion concen-trates on empirical studies that focus on education outcomes, earnings, and un-employment.
1.3.1 Personality and educational outcomes
A growing body of empirical research has provided evidence on the connec-tions between personality characteristics and educational outcomes. This sec-tion briefly summarises the central results from studies, on the connections be-tween the Big Five personality traits and the highest level of education attained.

21
Given the scope of this thesis, particular attention is paid to studies of educa-tion dropouts. There are also empirical studies that concentrate on the linkage between personality traits and school success. The end of this section briefly describes these studies.
Several studies have reported connections between personality traits and the highest level of education attained. This literature suggests that the Big Five factors openness to experience and conscientiousness, in particular, are related to increased years of educational attainment. (Goldberg, Sweeney, Merenda et al., 1998; van Eijick & de Graaf, 2004; Almlund et al., 2011: 131-132). In line with these studies Lleras (2008) finds that after controlling for cognitive ability, three indicators related to conscientiousness (completing homework, working hard, arriving promptly to class) and sociability (measured by sports and academic participation) in tenth grade predicted higher educational attainment ten years later. Carneiro et al. (2007) further report that children, who exhibited greater social adjustment at age 11 were more likely to continue in school beyond the age of 16 and were more likely to have a higher education degree at age 42 after controlling for cognitive ability and other background variables.12 Several stud-ies have also shown that facets of conscientiousness and neuroticism, locus of control, and childhood attention and aggression predict high school graduation (for review, see Almlund et al. 2011: 136-142). One line of research has focussed on high school dropouts with a GED degree, i.e., those who passed a test to cer-tify that their skills are equivalent to those of high school graduates. Heckman and Rubinstein (2001) and Heckman et al. (2006) show that after controlling for cognitive ability, GED recipients earn less than dropouts without a GED degree. They argue that this result can be explained by the lower level of non-cognitive skills of GED recipients. In other words, GED recipients are smarter than other dropouts, but they lack some non-cognitive skills that contribute to productivi-ty and thus labour market success.
Besides years of education, personality has also been found to be related to school success. In their review, Almlund et al. (2011: 145) conclude that con-scientiousness may be as predictive as cognitive ability in predicting and possi-bly causing higher course grades. Furthermore, Wong and Csikszentmihalyi (1991) found that students with more intrinsic motivation in learning took more difficult math courses whereas Lounsbury, Steel, Loveland et al. (2004) report that openness, conscientiousness, emotional stability, and agreeableness were negatively related to school absences.
1.3.2 Personality and income
Empirical research on personality and income has been inspired, in particular, by Bowles et al. (2001a), who survey the early studies on this topic and exam-ines the role of personality characteristics in earnings in terms of incentive-
12 The social skills –variable combines 12 types of social maladjustment from the Bristol
Social Adjustment Guide (BSAG) at age 11.

22
enhancing preferences. Since Bowles et al. (2001a), several studies have provid-ed evidence on the connections between personality characteristics and income with different datasets, measures for income, and measures for personality. This section provides a short overview on the following three issues that have received attention in the empirical economic literature: 1) How are different personality characteristics related to income? 2) What gender differences exist in the connections between personality and income? And 3) To what extent might differences in personality explain the gender wage gap. Finally, the re-view concentrates on studies, that provide potential explanations of why per-sonality might be related to income.
Among studies that use the Big Five personality traits as controls for per-sonality, Heineck (2011) finds wage penalties for neuroticism and agreeableness for both male and female workers in the UK. Using the same data, Nandi and Nicoletti (2009) estimate mean and quantile pay gaps between people with low and high levels of each of the Big Five personality traits. They use the Oaxaca-Blinder decomposition approach to illustrate the extent to which wage differ-ences can be attributed to differences in observable characteristics. Nandi and Nicoletti find that openness to experience and extraversion are rewarded while agreeableness and neuroticism are penalised in terms of wages. The wage gap related to openness to experience is explained by differences in observable characteristics, especially education and occupation, whereas the wage penal-ties and advantages associated with extraversion, neuroticism and agreeable-ness remained unexplained, indicating that these differences are associated with some unobservable characteristics that might, for example, be related to productivity.
Besides the Big Five personality traits, economists have used other per-sonality measures to examine the relationship between personality and earn-ings. For example, Andrisani and Nestel (1976), Andrisani (1977, 1981), Duncan and Dunifon (1998), Bowles et al. (2001b), Osborne Groves (2005), Heckman et al. (2006), Cebi (2007), and Heineck and Anger (2010) provide evidence that an external locus of control is associated with lower wages. 13, 14 Several studies have also documented a positive relationship between self-esteem and subse-quent earnings (Drago, 2008; Goldsmith et al., 1997; Murnane et al., 2001; Heckman et al., 2006; Waddell, 2006; Drago, 2008; Fortin, 2008)15
13 Locus of control refers to the extent to which individuals believe that they can control
events that affect them. Individuals with a high internal locus of control believe that events result primarily from one’s own behaviour and actions, whereas individuals with a high external locus of control believe that other people, fate, or chance primar-ily determine events. (Rotter, 1990.)
14 Duncan and Morgan (1981) replicate the model of Andrisani (1977) and find locus of control to be statistically insignificant in wage equations for three out of four samples.
15 Almlund et al. (2011:77-78) refer to psychological studies demonstrating that self-esteem and locus of control are related to the Big Five personality traits. Although they are not part of the traditional Big Five typology, locus of control, self-esteem and Big Five emotional stability (reverse of neuroticism) are indicators of a common con-struct, termed core self-evaluations.

23
There is also evidence that personality traits are rewarded somewhat dif-ferently for men and women and those differences in personality might partly explain the gender wage gap. Nyhus and Pons (2005) used Dutch data, and found that emotional stability was positively associated with wages for both genders, whereas agreeableness was significantly associated with lower wages only for women. Men were rewarded for autonomy16 as tenure increases alt-hough conscientiousness tends to be rewarded at the beginning of an employ-ment relationship. Feinstein (2000) reports evidence from Britain, showing that self-esteem predicts men’s earnings, whereas locus of control is particularly important for women. Semykina and Linz (2007) analyse Russian data and find that men are more likely to exhibit an internal locus of control and need for challenge, whereas women are more likely to exhibit an external locus of con-trol and need for affiliation. They further find that these differences in personal-ity characteristics explain as much as 8% of the gender wage gap.17 In line with these results, Semykina and Linz (2010) later find that among Russian and Ar-menian survey participants, men were more likely than women to have an in-ternal locus of control. This difference explained 5.5 per cent of the gender pay gap in Armenia and 7 per cent in Russia. Mueller and Plug (2006), using US data, found substantial earnings advantages associated with antagonism (the reverse of agreeableness), emotional stability (the reverse of neuroticism) and openness to experience among men. Women, in contrast, were rewarded for conscientiousness and openness to experiences. They further report that antag-onism had the greatest influence on gender differences in earnings of all of the Big Five traits. The decomposition results suggest that the differences in traits explain between 7 % and 16 % of the earnings gap. Likewise, Fortin (2008) pre-sents evidence from the US showing that personality, indicated by self-esteem and external locus of control, is likely to explain some of the gender wage gap. Based on German data, Braakman (2009) finds small but significant gender dif-ferences in openness, extraversion and conscientiousness and larger differences in agreeableness and neuroticism. Women, on average, had higher scores on all five traits compared to men, whereas men had higher scores on negative reci-procity and were more willing to take risks. These differences, especially in agreeableness, neuroticism and to a lesser extent conscientiousness, explain be-tween 5 % and 18 % of the gender wage gap.
Although connections between personality and earnings are interesting as such, another essential question is, why such relationships exist. Empirical evi-dence suggests at least two explanations. First, personality seems to be related
16 Autonomy indicates a person’s propensity to make his or her own decisions and degree of initiative and control (Nyhus & Pons, 2005). 17 When constructing the challenge-affiliation measure, the respondents were asked to evaluate four statements on a five-point scale. Two of the four items measured pref- erence for challenge (for example, “How important is the chance you have to ac- complish something worthwhile?”), and the other two measured preference for affiliation (for example, “How important is the friendliness of the other people you work with?”).

24
to preferences towards educational and occupational choices and therefore to earnings. Second, personality has been found to be associated with job perfor-mance and productivity. Supporting the first explanation, Almlund et al. (2011) refers to Heckman, Humphries, Urzua et al. (2010), who find that personality, measured by adolescent participation in risky behaviours, primarily affects earnings at age 30 through its effects on education. Nandi and Nicoletti (2009) also found that the pay advantage for high openness to experiences is explained mainly by education and occupation. In addition, several empirical studies, have found a connection between personality and occupational choices (e.g. Barrick & Mount, 1991; Heckman, Stixrud & Urzua, 2006; Cobb-Clark and Tan, 2009; Antecol and Cobb-Clark, 2010). For example, leadership studies suggest that extraversion in perticular is positively related to leadership (Burch & An-derson, 2009: 754-755). Additionally, different personality traits are valued in different occupations. For example, adolescent sociability leads to higher wages for managers but lower earnings among professionals (Cattan, 2010, see Almlund et al., 2011).
The empirical evidence, suggesting that personality is related to produc-tivity and job performance, provides the second explanation of the connections between personality and income. Burch and Anderson (2009) review empirical psychological evidence on associations between personality traits and various aspects of work-related performance. They report that meta-analytic studies have typically found that conscientiousness is the strongest predictor of job per-formance. In particular, a second-order meta-analysis (i.e., a meta-analysis of existing meta-analyses) by Barrick, Mount, and Judge (2001) showed conscien-tiousness to be a valid predictor for all work performance criteria (overall work performance, supervisor ratings, objective performance, training performance, and team work). Emotional stability was also shown to be a valid predictor of overall work performance across all jobs. Furthermore, based on Finnish data, Mahlamäki (2010) found that extraversion had the strongest positive relation-ship with job performance among key account managers. Conscientiousness and agreeableness also had significant positive relationships with job perfor-mance, whereas openness had a weak relationship and emotional stability had no statistically significant relationship with job performance. In addition to the Big Five personality traits, meta-analytic empirical evidence by Judge and Bono (2001) suggests that higher self-esteem, internal locus of control, generalised self-efficacy and emotional stability are positively related to job performance. There is also empirical evidence that personality is related to performance mo-tivation. Given, that motivation is an essential element of work performance, these findings may partly explain, why personality is related to earnings. Addi-tionally, there is evidence that personality is related to counter-productive be-haviours at work, such as absenteeism. (see Burch and Anderson, 2009: 753-754; Strömer & Fahr, 2010.)

25
1.3.3 Personality and unemployment
There is limited empirical evidence on the relationship between personality and unemployment. In a recent study, Uysal and Pohlmeier (2011) use German data to analyse how the Big Five personality traits relate to the duration of unem-ployment spells. Alhough the possibility of reverse causality cannot be ruled out, the results suggested that conscientiousness had a positive and neuroticism a negative association with the probability of finding a job. For women and immigrant workers openness to experience was also related to finding a job more easily. Other personality characteristics also seem to matter: using Ger-man data, Gallo, Endrass, Bradley et al. (2003) found that an internal locus of control was associated with a higher probability of reemployment following job loss. Further evidence on the connections between personality and unemploy-ment was documented by Feinstein (2000). He finds using UK data that going from the 20th to the 80th percentile of the anti-social disorder range measured at age 10, adds 6 per cent to males’ likelihood of experiencing an episode of un-employment of more than four months by age 26. On the other hand, males who scored high on extraversion were much less likely to experience unem-ployment. Among unemployed males higher self-esteem was associated with a lower probability of long-term unemployment (i.e. unemployment duration was more than 12 months). Female unemployment seemed to depend more on poor peer relations and inattentiveness measured at age 10. Surprisingly, among women who had been unemployed for more than 4 months, the proba-bility of long-term unemployment (duration of unemployment over 12 months) was higher among those with high self-esteem. Additionally, the psychological literature provides evidence on the connection between personality and unem-ployment (see e.g. Caspi et al., 1998; Ferguson et al., 1997; Kokko & Pulkkinen, 2000; Kokko et al., 2000).
Indirect empirical support for the connections between personality and unemployment was provided by Caliendo, Cobb-Clark and Uhlendorff (2010), who found that after controlling for demographic characteristics, and past un-employment history, a higher internal locus of control was associated with in-creased reservation wages and an increased number of job applications submit-ted, i.e., higher job search intensity. Similarly McGee (2010) found that individ-uals with an internal locus of control search for job more intensively and set higher reservation wages than their external peers but both of these groups spend more time unemployed than individuals with an average locus of control. According to McGee this is because “internals” hold out for excessively high wages and “externals” search too little. There is also evidence that personality is related to labour market participation (see e.g. Mohanty, 2010; Wichert & Pohlmeier, 2010). Besides providing indirect evidence supporting the potential connection between personality and unemployment, these studies provide evi-dence on the question of why personality is linked to unemployment duration. Besides reservation wages and job search intensity, another potential explana-tion for the personality-unemployment linkage is provided by studies, demon-

26
strating links between personality, job performance, and educational and occu-pational preferences. These studies were reviewed in section 1.3.2.
1.4 Outline of the study and main results
The purpose of this thesis is to illustrate how individual characteristics are re-lated to labour market outcomes, particularly earnings, employment and un-employment. In particular, this thesis focusses on the question of how personal-ity characteristics and the Big Five personality traits are related to these out-comes. To shed light on these issues, empirical studies address several im-portant interrelated questions:
• How can characteristics (such as education, age and occupation) that are usually observed by economists predict the duration of unemployment? (Chapter 5) Should we also pay attention to personality – that is: are the Big Five personality traits related to unemployment? (Chapter 4)
• How does dropping out of education associate with subsequent earnings, employment, and unemployment? How does the relationship change, when personality characteristics are taken into account? (Chapter 2)
• How are the Big Five personality traits related to labour market income? (Chapter 3)
• How stable are the Big Five personality traits over time? (Chapter 4)
A summary of the empirical studies is presented in Table 2. For each study, the focus, sample, model specification and main results are listed.
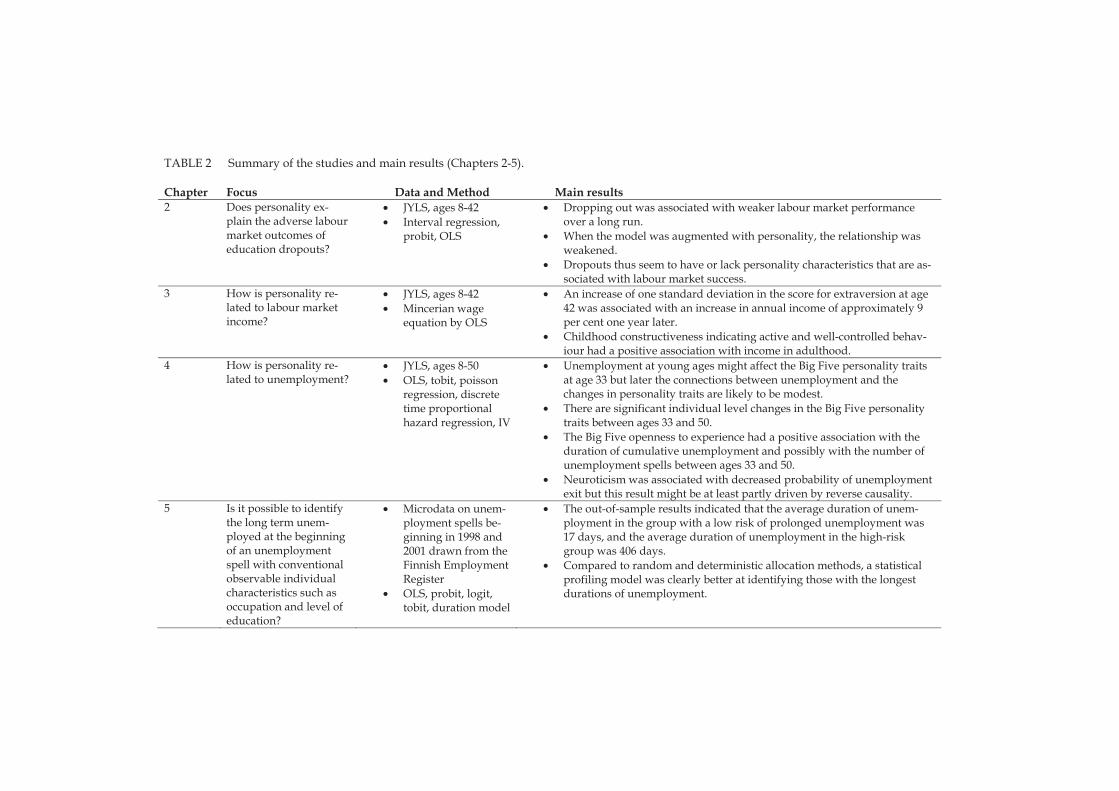
TABLE 2 Summary of the studies and main results (Chapters 2-5). Chapter Focus Data and Method Main results 2 Does personality ex-
plain the adverse labour market outcomes of education dropouts?
• JYLS, ages 8-42 • Interval regression,
probit, OLS
• Dropping out was associated with weaker labour market performance over a long run.
• When the model was augmented with personality, the relationship was weakened.
• Dropouts thus seem to have or lack personality characteristics that are as-sociated with labour market success.
3 How is personality re-lated to labour market income?
• JYLS, ages 8-42 • Mincerian wage
equation by OLS
• An increase of one standard deviation in the score for extraversion at age 42 was associated with an increase in annual income of approximately 9 per cent one year later.
• Childhood constructiveness indicating active and well-controlled behav-iour had a positive association with income in adulthood.
4 How is personality re-lated to unemployment?
• JYLS, ages 8-50 • OLS, tobit, poisson
regression, discrete time proportional hazard regression, IV
• Unemployment at young ages might affect the Big Five personality traits at age 33 but later the connections between unemployment and the changes in personality traits are likely to be modest.
• There are significant individual level changes in the Big Five personality traits between ages 33 and 50.
• The Big Five openness to experience had a positive association with the duration of cumulative unemployment and possibly with the number of unemployment spells between ages 33 and 50.
• Neuroticism was associated with decreased probability of unemployment exit but this result might be at least partly driven by reverse causality.
5 Is it possible to identify the long term unem-ployed at the beginning of an unemployment spell with conventional observable individual characteristics such as occupation and level of education?
• Microdata on unem-ployment spells be-ginning in 1998 and 2001 drawn from the Finnish Employment Register
• OLS, probit, logit, tobit, duration model
• The out-of-sample results indicated that the average duration of unem-ployment in the group with a low risk of prolonged unemployment was 17 days, and the average duration of unemployment in the high-risk group was 406 days.
• Compared to random and deterministic allocation methods, a statistical profiling model was clearly better at identifying those with the longest durations of unemployment.

28
Chapter 2 analyses the connections between personality, the decision to drop out from education and labour market outcomes. Previous studies have found that dropping out is associated with weaker labour market performance. On the other hand empirical studies suggest that personality is related to the decision to dropout and labour market performance. This paper contributes to this litera-ture by providing evidence on the earnings and labour market careers of drop-outs with various levels of education. With data drawn from JYLS, we exam-ined how dropping out is associated with earnings and unemployment proba-bility at age 42 and with years of employment and unemployment between ag-es 15 and 42. Then, we analysed how the results change when differences in personality are taken into account. We found that dropping out was associated with weaker labour market performance over a long period of time. However, when the model was augmented with personality, the connection was reduced. Therefore dropouts seem to have or lack non-cognitive characteristics that are associated with labour market success.
Chapter 3 focuses on the role of personality characteristics in the labour market by examining the connections between personality and labour market income. The empirical part of the study uses data drawn from the Jyväskylä Longitudinal Study of Personality and Social Development (JYLS), which con-tains information on the participants between ages 8 (1968) and 50 (2009). We examined the connections between personality and labour market income with a variant of Mincer’s (1974) human capital earnings function in which the log of individual income is regressed on education, work experience, personality, and other personal characteristics. The results suggest that adulthood extraversion is positively associated with income when education, work experience and un-employment history, measured prospectively from longitudinal data, are con-trolled for. An increase of one standard deviation in the score for extraversion at age 42 was associated with an increase of approximately 9 per cent in annual income one year later. Although reverse causality cannot be ruled out, the re-sults were in line with previous studies in which withdrawal, which can be con-sidered as the opposite of extraversion, was found to be negatively associated with wages (see Bowles et al., 2001a; Bowles et al., 2001b; Osborne Groves, 2005). The findings were also consistent with the results of Seibert and Kraimer (2001), who found extraversion to be positively related to salary levels. Likewise, we found that childhood constructiveness, indicating active and well-controlled behaviour, had a positive association with income in adulthood.
Chapter 4 focuses on the connections between personality and unem-ployment. This chapter also examines the stability of the Big Five personality traits in adulthood and considers the possibility that unemployment might af-fect personality. Utilising data drawn from JYLS, we found that although un-employment at young ages possibly affects personality, particularly the levels of neuroticism and extraversion, the connections between unemployment and changes in personality traits were modest after age 33. We also found signifi-cant individual-level changes in personality scores between ages 33 and 50. The connections between personality and unemployment were analysed from three

29
perspectives. First, the cumulative duration of unemployment was regressed with tobit estimation. Second, the number of unemployment spells was esti-mated by poisson regression, and third, we used a discrete time proportional hazard model to examine the durations of individual unemployment spells. The results revealed that Big Five openness to experience was positively associ-ated with both the duration of cumulative unemployment and possibly with the number of unemployment spells between ages 33 and 50. We also found that neuroticism was associated with a decreased probability of unemployment exit, that is, longer single unemployment spells. However, this result might be at least partly driven by reverse causality.
Chapter 5 presents a statistical profiling system that aims to identify the potential long-term unemployed based on observable individual characteristics, such as level of schooling and occupation. These predictions could be used to refer the potential long-term unemployed into re-employment services. Because profiling takes place at the beginning of an unemployment spell, re-employment services can start before the problems associated with prolonged unemployment, such as outdated work skills, have time to develop. The profil-ing model is based on micro-level data drawn from the Finnish Employment Register. This register contains the information on all Finns who signed on as job applicants at a local labour office. The results reveal that, of the OLS, logit, probit, tobit and duration models, the duration model best identified the poten-tial long-term unemployed. The out-of-sample results indicate that the average duration of an unemployment spell in the group with a low risk of prolonged unemployment was 17 days. In the high-risk group, the average duration of an unemployment spell was 406 days. Compared to random and deterministic al-location methods, the statistical profiling model was clearly better at identifying those individuals with the longest durations of unemployment. Although the model was successful in predicting the durations of unemployment spells, it is possible that the model could still be improved if, for example, personality indi-cators were taken into account. As the results and the literature review in Chap-ter 4 suggest, personality seems to be related to unemployment, but because of data limitations, the profiling model was not able to take these differences into account.

30
References
Allport, G. W. (1937) Personality: A psychological interpretation. New York: Holt, Rinehart and Winston.
Almlund, M., Duckworth, A. L., Heckman, J. & Kautz, T. (2011) Personality psychology in economics. IZA DP No. 5500. Also published in Handbook of the Economics of Education vol 4 (2011), 1-181.
Anderson, J., Burks, S., De Young, C. & Rustichini, A. (2011) Toward the integration of personality theory in the explanation of economic behavior. Center for Cognitive Sciences, University of Minnesota, Working paper, Version 1.2 (preliminary).
http://www.cogsci.umn.edu/colloquia/colloquia_S11/Aldo%20Rustichini.pdf
Andrisani, P. J. (1977) Internal-external attitudes, personal initiative and the labor market experience of black and white men. Journal of Human Resources 12(3), 308-328.
Andrisani, P. J. (1981) Internal-external attitudes, personal initiative, and the labor market experience: A reply to Duncan and Morgan. Journal of Human Resources, 16(4), 658-666.
Andrisani, P. J. & Nestel, G. (1976) Internal-external control as contributor to and outcome of work experience. Journal of Applied Psychology, 61(2), 156-165.
Antecol, H & Cobb-Clark, D. A. (2010) Do non-cognitive skills help explain the occupational segregation of young people?" IZA Discussion Paper, 5093.
Ardelt, M. (2000) Still stable after all these years? Personality stability theory revisited. Social Psychology Quarterly, 63, 391-405.
Asendorpf, J. B., Denissen, J. J. A., & van Aken, M. A. G. (2008) Inhibited and aggressive preschool children at 23 years of age: personality and social transition into adulthood. Developmental Psychology, 44(4), 997-1011.
Barrick, M. R., Mount, M. K. & Judge, T. A. (2001) Personality and performance at the beginning of the new millennium: What do we know and where do we go next? International Journal of Selection and Assessment, 9, 9-30.
Barrick, Murray R. & Mount, Michael K. (1991) The Big Five personality dimensions and job performance: A meta-analysis. Personnel Psychology, 44(1), 1-26.
Barsky, R. B., Juster, F. T., Kimball, M. S. & Shapiro, M. D. (1997) Preference pa- rameters and behavioral heterogeneity: An experimental approach in the health and retirement study. Quarterly Journal of Economics, 112(2), 537-579.
Becker, G, S. (1964) Human capital: A theoretical and empirical analysis with special reference to education. New York: National Bureau of Economic Research.
Becker, P. (1999) Beyond the Big Five. Personality and individual differences 26, 511-530.

31
Ben-Ner, A. & Kramer, A. (2011) Personality and altruism in the dictator game: Relationship to giving to kin, collaborators, competitors, and deutrals. Personality and individual differences, 51(3), 216-221.
Bibby, P. A. & Ferguson, E. (2011) The ability to process emotional information predicts loss aversion. Personality and Individual Differences, 51(3), 263-266.
Bonin, H., Dohmen, T., Falk, A., Huffman, D. & Sunde, U. (2007) Cross sectional earnings risk and occupational sorting: The role of risk attitudes. Labour Economics, 14(6), 926-937.
Borghans, L., Golsteyn, B., Heckman, J. & Meijers, H. (2009) Gender differences in risk aversion and ambiguity aversion. Journal of European Economic Association, 7 (2-3), 649-658.
Borghans, L., Duckworth, A. L., Heckman, J. J. & ter Weel, B. (2008) The economics and psychology of personality traits. Journal of Human Resources, 43, 972-1059.
Borghans, L., ter Weel, B. & Weinberg, B. A. (2006) People people: Social capital and the labormarket outcomes of underrepresented groups. NBER Working Papers, No 11985.
Bouchard, T. J. & Loehlin, J. C. (2001) Genes, evolution and personality, Behavior Genetics, 31(3), 243-273.
Bound, J., Brown, C. & Mathiowez, N. (2000) Measurement error in survey data. Population Studies Center Research report No. 00-450.
http://www.psc.isr.umich.edu/pubs/pdf/rr00-450.pdf Also published in Heckman, J. J., and E. E. Leamer (Eds.) Handbook of
Econometrics, chapter 59, 3705-3843. Bowles S., Gintis H. & Osborne M. (2001a) Incentive-enhancing preferences:
personality, behavior, and earnings, American Economic Review, 91(2), 155-158.
Bowles S., Gintis H. & Osborne M. (2001b) The determinants of earnings: A behavioral approach, Journal of Economic Literature, 39(4), 1137--1176.
Braakmann N. (2009) The role of psychological traits for the gender gap in full-time employment and wages: Evidence from Germany, SOEPpapers 162.
Burch G. & Anderson N. (2009) Personality at work. In P. J. Corr, & G. Matthews (Eds.) The Cambridge Handbook of Personality Psychology. Cambridge, UK: Cambridge University Press, 748-763.
Caliendo, M., Cobb-Clark, D. & Uhlendorff, A. (2010) Locus of control and job search strategies. IZA Discussion Paper No.4750.
Carneiro, P., Crawford, C. & Goodman, A. (2007) Impact of early cognitive and non-cognitive skills on later outcomes, Center for Economics and Education, Working Paper, 92.
Caspi, A., Harrington, H. L., Milne, B., Amell, J. W., Theodore, R. F. & Moffitt, T. E. (2003) Children’s behavioral styles at age 3 are linked to their adult personality traits at age 26, Journal of Personality, 71(4), 496-513.
Caspi, A., Wright, B. R. E., Moffit, T. E. & Silva, P. A. (1998) Early failure in the labor market: childhood and adolescent predictors of unemployment in the transition to adulthood, American Sociological Review, 63, 424-451.

32
Cattan, S. (2010) Heterogeneity and selection in the labor market, PhD Thesis, Economics Department, University of Chicago.
Cebi M. (2007) Locus of control and human capital investment revisited, Journal of Human Resources, 42(4), 919-932.
Cheung, R. M., Leung, K., Fan, R. M., Song, W. Z., Zhang, J. X. & Zhang, J. P. (1996) Development of the chinese personality assessment inventory, Journal of Cross-Cultural Psychology, 27, 181-199.
Church, A. T. (2001) Personality measurement in cross-cultural perspective, Journal of Personality, 69, 955-978.
Cloninger, S. (2009) Conceptual issues in personality theory. In P. J. Corr & Matthews, G. (Eds.) The Cambridge Handbook of Personality Psychology. Cambridge University Press: New York, 3-26.
Cobb-Clark, Deborah A. & Schurer, Stefanie (2011) Two economists’ musings on the stability of locus of control. IZA Discussion Papers 5630, Institute for the Study of Labor (IZA).
Cobb-Clark, D. & Tan, M. (2009) Noncognitive skills, occupational attainment, and relative wages, IZA Discussion Paper No. 4289.
Constant, A., Krause, A., Rinne, U. & Zimmermann, K. F. (2011) Economic preferences and attitudes of the unemployed: Are natives and second generation migrants alike? CEPR Discussion Paper No. DP8207.
Costa, P. T., Jr. & McCrae, R. R. (1994) “Set like a plaster”? Evidence for stability of adult personality. In T. Heatherton & J. Weinberger (Eds.), Can personality Change? Washington, DC: American Psychological Association, 21-40.
Costa Jr., P.T. & McCrae, R.R. (1988) Personality in adulthood: A six-year longitudinal study of self-reports and spouse ratings on the NEO Personality Inventory. Journal of Personality and Social Psychology, 54, 853–863.
Costa Jr., P.T. & McCrae, R.R. (1985) The NEO Personality Inventory manual. Odessa, FL: Psychological Assessment Resources.
Cunha, F., Heckman, J. J., Lochner, L. J. & Masterov, D. V. (2006) Interpreting the Evidence on Life Cycle Skill Formation. In E. A. Hanushek & F. Welch, (Eds.) Handbook of the Economics of Education. Amsterdam, North-Holland, 1, 697-812.
Daly, M. Delaney, L. & Harmon, C. P. (2009) Psychological and biological foundations of time preferences, Journal of the European Economic Association, 7(2-3), 659-669.
Dohmen, T., Falk, A., Huffman, D., Sunde, U., Schupp, J. & Wagner, G. G. (2011) Individual risk attitudes: measurement, determinants and behavioral con- sequences. Forthcoming, Journal of the European Economic Association. Dohmen, T., Falk, A., Huffman, D. & Sunde, U. (2010) Are risk aversion and
impatience related to cognitive ability? The Americal Economic Review, 100(3), 1238-1260.

33
Dohmen, T., Falk, A., Huffman, D. & Sunde, U. (2009) Homo reciprocans: survey evidence on behavioural outcomes. The Economic Journal, 119(536): 592-612.
Drago, F. (2008) Self-esteem and earnings. IZA Discussion Paper, 3577. Duncan, G. J. & Dunifon, R. (1998) “Soft-skills” and long-run labor market
success, Research in Labor Economics, 23(1), 527-588. Duncan, G. & Morgan, J. (1981) Sense of efficacy and subsequent changes in
earnings – a replication, Journal of Human resources, 16(4), 649-657. Dundley, N. M., Orvis, K. A., Lebiecki, J. E. & Cortina, J. M. (2006) A meta-
analytic investigation of conscientiousness in the prediction of job performance: Examining the intercorrelations and the incremental validity of narrow traits, Journal of Applied psychology, 91, 40-57.
Ferguson, D. M., Horwood, L. J. & Lynskey, M. T. (1997) The effects of unemployment on psychiatric illness during young adulthood, Psychological Medicine, 27, 371-381.
Farrell, L., Harris, M. N. & Sessions, J. G. (2006) Risk preference and employment contract type, Journal of the Royal Statistical Society, Series A (Statistics in Society), 169(4), 849-863.
Feinstein, L. (2000) The relative economic importance of academic, psychologycal and behavioural attributes developed in childhood. Centre for Economic Performance Discussion Paper 443. Centre for Economic Performance, London School of Economics, London, UK.
Fleeson, W. (2004) Moving personality beyond the person-situation debate: The challenge and the opportunity of within-person variability, Current Directions, 13, 83-87.
Fortin N. M. (2008) The gender wage gap among young adults in the United States, The Journal of Human Resources, 43 (4), 884-918.
Gallo, W. T., Endrass, J., Bradley, E. H., Hell, D. & Kasl, S. V. (2003) The influence of internal control on the employment status of german workers, Schmollers Jahrbuch, 123(1), 71-81.
Goldberg, L. R., Sweeney, D., Merenda, P. F. & Hughes, J. E., Jr. (1998) Demographic variables and personality: The effects of gender, age, education, and ethnic/racial status on self-descriptions of personality attributes, Personality and Individual Differences, 24(3), 393-403.
Goldsmith, A. H., Veum, J. R. & Darity, Jr, W. (1997) The impact of psychological and human capital on wages, Economic Inquiry, 25, 815-829.
Goodwin, R. D. & Friedman, H. S. (2006) Health status and the Five-Factor personality traits in a nationally representative sample, Journal of Health Psychology, 11(5), 643-654.
Griliches, Z. (1977) Estimating the returns to schooling: Some econometric problems, Econometrica, 45, 1-22.
Hayes, N. & Joseph, S. (2003) Big 5 correlated of three measures of subjective well-being, Personality and Individual Differences, 34, 723-727,

34
Heckman, J. J., Humphries, J. E., Urzua, S. & Veramendi, G. (2010) The effects of schooling on labor market and health outcomes, Unpublished manuscript. University of Chicago, Department of Economics.
Heckman, J. & Rubinstein, Y. (2001) The importance of non-cognitive skills: Lessons from the GED testing program, American Economic Review, 91, 145-149.
Heckman, J. J., Stixrud, J. & Urzua, S. (2006) The effects of cognitive and noncognitive abilities on labor market outcomes and social behavior, Journal of Labor Economics, 24(3), 411-482.
Heineck, G. (2011) Does it pay to be nice? Personality and earnings in the United Kingdom, Industrial and Labor Relations Review, 64(5), 1020-1038.
Heineck, G. & Anger, S. (2010) The returns to cognitive abilities and personality traits in Germany, Labour Economics, 17, 535-546.
Herzberg, P. Y. & Roth, M. (2006) Beyond resilients, undercontrollers, and overcontrollers? An extension of personality prototype research. European Journal of Personality, 20, 5-28.
Judge, T.A & Bono, J. E. (2001) Relationship of core self-evaluations traits -self-esteem, generalized self-efficacy, locus of control, and emotional stability - with job satisfaction and job performance: A meta-analysis, Journal of Applied Psychology, 86, 80-92.
Kokko, K. & Pulkkinen, L. (2000) Aggression in childhood and long-term unemployment in adulthood: A cycle of maladaptation and some protective factors, Developmental Psychology, 36, 463-472.
Kokko, K., Pulkkinen, L. & Puustinen, M. (2000) Selection into long-term unemployment and its psychological consequences, International Journal of Behavioral Development, 24(3), 310-320.
Krueger, R. F. & Johnson, W. (2008) Behavioral genetics and personality: A new look at the integration of nature and nurture. In John, O. P., Robins, R. W. & Pervin, L. A. (Eds.) Handbook of Personality: Theory and research. New York: Guilford, 287-310.
Lleras, C. (2008) Do skills and behaviors in high school matter? The contribution of noncognitive factors in explaining differences in educational attainment and earnings, Social Science Research, 37(3), 888-902.
Li, A. & Bagger, J. (2006) Using the BIDR to distinguish the effects of impression management and self-deception on the criterion validity of personality measures: A meta-analysis, International Journal of Selection and Assessment, 14, 131-141.
Lounsbury, J. W., Steel, R. P., Loveland, J. M. & Gibson, L. W. (2004) An investigation of personality traits in relation to adolescent school absenteeism, Journal of Youth and Adolescence, 33(5), 457-466.
Lucas, R. E. & Donnellan, M, B. (2009) If the person-situation debate is really over, why does it still generate so much negative affect, Journal of Research in Personality, 43, 146-149.
35
Mahlamäki, T. (2010) The influence of personality on the job performance of key account managers. Department of Industrial Management. Tampere University of Technology, Tampere.Dissertation. http://dspace.cc.tut.fi/dpub/bitstream/handle/123456789/6735/mahlamaki.pdf?sequence= 3
McAdams, D. P. (2001) The person. Fort Worth, TX: Harcourt College Publisher. McAdams, D. P. & Olson, B. D. (2010) Personality development: Continuity and
change over the life cource, Annual Review of Psychology, 61(5), 5.1-5.26. McCrae, R. R. (2009) The five-factor model of personality traits: Consensus and
controversy. In P. J. Corr, & G. Matthews (Eds.), The Cambridge Handbook of Personality Psychology. Cambridge, UK: Cambridge University Press, 148-161.
McCrae, R. R. & Costa, T. T., Jr. (2006) Personality in adulthood: a five-factor theory perspective. New York, NY: A Division of Guilford Publications, Inc.
McCrae, R. R. & Costa, P. T., Jr. (1999) A five-factor theory of personality. In L. A. Pervin, & O. P. John (Eds.), Handbook of personality: Theory and research (2nd ed.). New York: Guilford Press, 139-153.
McCrae, R. R. & Costa, P. T., Jr. (1996) Toward a new generation of personality theories: Theoretical context for the five-factor model. In J.S. Wiggins (Ed.) The five-factor model of personality. New York: Guilford Press, 51-87.
MacDonald, D.A. (2000) Spirituality: Description, measurement, and relation to the Five Factor Model of personality, Journal of Personality, 68, 153-197.
McGee, A. (2010) How the perception of control influences unemployed job search. In essays on the role of noncognitive skills on decision-making. Dissertation, 1-50.
Michel, W. (1968) Personality and assessment. New York: Wiley. Mincer J. (1974) Schooling, Earnings and Experience, New York: Colombia
University Press. Mohanty, M. S. (2010) Effects of positive attitude and optimism on employment:
Evidence from the US data, Journal of Socio-Economics, 39, 258-270. Mueller, G. & Plug, E. (2006) Estimating the effect of personality on male and
female earnings, Industrial and Labour Relations Review, 60(1), 3-22. Murnane R. J., Willett J. B., Braatz M. J. & Duhaldeborde, Y., (2001) Do different
dimensions of male high school students’ skills predict labor market success a decade later? Evidence from the NLSY, Economics of Education Review, 20, 311-320.
Nandi A. & Nicoletti C. (2009) Explaining personality pay gaps in the UK, ISER Working Paper No. 2009-22.
Nyhus E. K. & Pons E. (2005) The effects of personality on earnings, Journal of Economic Psychology, 26, 363-384.
Osborne Groves, M. (2005) How important is your personality? Labor market returns to personality for women in the US and UK, Journal of Economic Psychology, 26, 827-841.
Pannenberg, M. (2010) Risk attitudes and reservation wages of unemployed workers: evidence from panel data, Economic Letters, 106(3), 223-226.

36
Paulhus, D. L. (1984) Two-component models of socially desirable responding, Journal of Personality and Social Psychology, 46, 598-609.
Paunonen, S. V. & Jackson, D. N. (2000) What is beyond the Big Five? Plenty! Journal of Personality, 68, 821-835.
Pervin, L. A. (2003) The science of personality. New York: Oxford University Press. Second edition.
Pervin, L. A. & John, O. P. (2001) Personality: Theory and research. New York: Wiley.
Rantanen, J., Metsäpelto, R.-L., Feldt, T., Pulkkinen, L. & Kokko, K. (2007) Long-term stability in the Big Five personality traits in adulthood, Scandinavian Journal of Psychology, 48(6), 511-518.
Roberts, B. W., Kuncel, N. R., Shiner, R., Caspi, A. & Goldberg, L. R. (2007) The power of personality: The comparative validity of personality traits, socioeconomic status, and cognitive ability for predicting important life outcomes, Perspectives on Psychological Science, 2(4), 313-345.
Roberts, B. W., Walton, K. E. & Viechtbauer, W. (2006) Patterns of mean-level change in personality traits across the life course: A meta-analysis of longitudinal studies, Psychological Bulletin, 132(1), 1-25.
Roberts, B. W. & DelVecchio, W. F. (2000) The rank-order consistency of personality traits from childhood to old age: A qualitative review of longitudinal studies, Psychological Bulletin, 126, 3-25.
Rotter, J. B. (1990) Internal versus external control of reinforcement: A case history of a variable, American Psychologist, 45, 489-493.
Seibert S. E. & Kraimer M. L. (2001) The five-factor model of personality and career success, Journal of Vocational Behavior, 58, 1-21.
Semykina, A. & Linz, S. J. (2010) Analyzing the gender pay gap in transition economies: How much does personality matter? Human relations, 63(4), 447-469.
Semykina A. & Linz S. J. (2007) Gender differences in personality and earnings: Evidence from Russia, Journal of Economic Psychology, 28, 387-410.
Smith, R. E. & Shoda, Y. (2009) Personality as a cognitive-affective processing system. In P. J. Corr & Matthews, G. (Eds.) The Campridge Handbook of Personality Psychology. Cambridge University Press: New York, 473-487.
Specht, J., Egloff, B. & Schmukle, S. (2011) Stability and change of personality across the life course: The impact of age and major life events on mean-level and rank-order stability of the Big Five. SOEPpapers on Multidisciplinary Panel Data Research, 377. (forthcoming in Journal of Personality and Social Psychology).
Srivastava, S., John, O. P., Gosling, S. D. & Potter, J. (2003) Development of personality in early and middle adulthood: Set like a plaster or persistent change? Journal of Personality and Social Psychology, 84(5), 1041-1053.
Störmer, S. & Fahr, R. (2010) Individual determinants of work attendance: Evidence on the role of personality. IZA Discussion Paper No. 4927.
Uysal, S. D. & Pohlmeier, W. (2011) Unemployment duration and personality, Journal of Economic Psychology, 32(6), 980-992.

37
Vandenberghe, C., St-Onge, S. & Robineau, E. (2008) An analysis of the relation between personality and the attractiveness of total rewards components, Industrial Relations, 63(3), 425-453.
van Eijck, K. & de Graaf, P. M. (2004) The Big Five at school: The impact of personality on educational attainment, Netherlands' Journal of Social Sciences, 40(1), 24-40.
Waddell, G. R. (2006) Labor-market consequences of poor attitude and low self-esteem in youth, Economic Enquiry, 44, 69-97.
Wichert, L. & Pohlmeier, W. (2010) Female labour force participation and the Big Five. Centre for European Economic Research (ZEW), Mannheim, Discussion Paper No. 10-003.
Wong, M. M. & Csikszentmihalyi, M. (1991) Motivation and academic achievement: The effects of personality traits and the duality of experience, Journal of Personality, 59(3), 539-574.
Wooldridge, J. M. (2009) Introductory econometrics: A modern approach. Mason, Ohio: Thomson South-Western. 4th Edition.
Yang, K. & Bond, M. H. (1990) Exploring implicit personality theories with indigenous or important constructs: The Chinese case, Journal of Personality and Social Psychology, 58, 1087-1095.

2 LABOUR MARKET PERFORMANCE OF EDUCATIONAL DROPOUTS: THE ROLE OF PERSONALITY18
ABSTRACT. Previous studies suggest that dropping out of school is associated with weaker labour market performance and lower non-cognitive skills. This paper contributes to this literature by providing evidence on the earnings and labour market careers of dropouts with various levels of education. We find that dropping out diminishes one’s success in the labour market but the connec-tion between dropping out and labour market performance is reduced when the model is augmented with personality. Our results suggest that dropouts have or lack non-cognitive characteristics that are associated with labour mar-ket success.
2.1 Introduction
Aggregate statistics and previous studies in economics have shown that educa-tion and degree do matter in the labour market in terms of earnings, employ-ment, and labour supply (e.g. OECD, 2011: 116-157). Traditionally there have been two explanations to this phenomenon. First, education increases produc-tivity and therefore leads to higher earnings and employment. According to this explanation, education increases individuals’ human capital. (Becker, 1964.) Second, the screening theories of education suggest that education serves as a signal of greater productivity, and this signal is rewarded in the labour market. (Spence, 1973.) The screening theory also implies that individuals with a diplo-ma have better success in the labour market than their peers with the same 18 This paper was written together with Katja Kokko, Professor Lea Pulkkinen and Pro-
fessor Jaakko Pehkonen and it is in referee process. I would like to thank Professor Jukka Pirttilä and Professor Petri Böckerman for their helpful comments and sugges-tions.

39
number of years of schooling, but who do not possess the diploma (so called “sheepskin effect”). Empirical studies provide support to both of these two ex-planations. As illustrated and reviewed by Oreopoulos (2007) previous studies have found significant returns to education in terms of earnings for those, who are compelled to stay at school longer because of compulsory schooling laws. Supporting the second explanation, and particularly the sheepskin effect, for example Card and Krueger (1992), Jaeger and Page (1996), and Ferrer and Rid-dell (2002) find significant earnings advantages related to diploma. Despite of these positive effects of schooling, there are individuals who de-cide to dropout at some level of education. The reasons for dropping out can be various such as financial situation or the lack of understanding of the future ben-efits of education (Oreopolous, 2007; Jensen, 2010). It is also possible that person-ality characteristics are related to dropout decision. The potential importance of personality characteristics was illustrated by Heckman and Rubinstein (2001) who studied the earnings of GED recipients, i.e. high school dropouts, who passed a test to certify that their skills are equivalent to those of high school graduates. 19 Heckman and Rubinstein showed that after controlling for cognitive ability, GED recipients earn less than other high school dropouts, i.e., dropouts without a GED degree. They argue that this trend is the result of the lower level of non-cognitive skills of GED recipients. GED recipients are smarter than other high school dropouts, but they lack some non-cognitive skills that contribute to productivity and thus labour market success (see also Araujo et al., 2004; Heck-man et al., 2002). 20 Later, Heckman et al. (2006) confirmed this hypothesis. Previous studies have shown that personality characteristics are related to both educational and labour market outcomes. Connections have been docu-mented between personality characteristics and years of schooling (for a review, Almlund et al., 2011), the probability of obtaining degree (Almlund et al., 2011; Carneiro et al., 2007; Coleman & DeLeire, 2003) and the probability to dropout (Báron & Cobb-Clark, 2010; Coneus et al., 2008; Segal, 2006; ). 21 In terms of la-bour market outcomes, significant linkages have been found between personali-ty characteristics and earnings, occupational choices, labour force participatioin, employment and unemployment (for example, Borghans et al., 2008; Bowles et al., 2001a,b; Braakmann, 2009; Heckman et al., 2006; Heineck, 2011; Linz & Se-mykina, 2009; Mueller & Plug, 2006; Nyhus & Pons, 2005; Osborne Groves, 2005; Semykina & Linz, 2007; Uysal & Pohlmeier, 2011). 19 GED (General Educational Development) is a test high school dropouts can take to certify their equivalence with American or Canadian high school graduates. The GED credential makes it possible for an individual to obtain a college or university education. Since it was established in 1945, more than 17.3 million individuals have passed the GED test. (GED Testing Program Statistical Report 2008, 2009). 20 Cognitive ability is measured by an average of the cognitive components of the Armed Forces Qualifying Test (AFQT) or by the first principle component (g). 21 Cebi (2007) replicates the study of Coleman and DeLeire (2003) and tests the predic-
tions of their theoretical model using a different dataset. Contradicting Coleman and DeLeire (2003), she finds no evidence that locus of control predicts high school grad-uation and little evidence that it predicts college attendance once cognitive ability is controlled for.

40
This paper explores the labour market performance of educational drop-outs in terms of earnings, employment and unemployment. The novelty of this paper rests on the fact that we analyze, how the impact of dropping out on la-bour market outcomes changes, if differences in personality characteristics are taken into account. The recognition of personality characteristics might affect the results because of two reasons. First, as far as personality characteristics contribute to individual’s probability of becoming a dropout and these same characteristic contribute to the productivity, dropping out may serve as a valu-able adverse signal in the labour market. Second, it is possible that the same personality characteristics are related to both the dropout decision and individ-ual’s choices regarding his or her working career, such as occupational choices and orientation towards the labour market.
A dropout in this paper is defined as a person who for some reason de-cides to discontinue his or her studies at any level of education. Dropouts in-clude those who have permanently interrupted their studies, who have later returned to their studies, or who have changed their field of study. Some have already completed vocational training or university education before they dropped out. This broad definition enables us to investigate how dropping out in general is related to labour market success. While previous studies have usu-ally focused on high school dropouts, our focus on dropouts in general repre-sents an expansion of the research literature because it is possible that dropouts as a whole may have or lack personality characteristics that are associated with labour market success. It is possible, for example, that individuals with a high IQ but unfavourable personality characteristics manage to complete lower lev-els of education because they can compensate for their personality disad-vantages with intelligence. However, they may drop out later in their lives, for example, at the university level. Therefore this study augments the finding of Heckman and Rubinstein (2001) by providing evidence on the role of personali-ty in dropouts’ work career in general.
The empirical analysis is based on data from a longitudinal Finnish study called Jyväskylä Longitudinal Study of Personality and Social Development (JYLS) (Pulkkinen, 2006). The JYLS is exceptional by virtue of its broad scope and the more than 40-year follow-up period. The data allow us to estimate how dropping out is associated with earnings and labour market status at age 42. We also utilise the panel feature of the JYLS by examining how dropping out is as-sociated with one’s labour market career between ages 15 and 42. Personality characteristics of individuals have been assessed at several different points in time, from early school age to middle age. In this study we focus particularly on child personality characteristics, which were obtained at ages 8 and 14 and are therefore not affected by potential reverse causality.
The remainder of this paper is organised as follows. Section 2 reports the data in detail, providing descriptive statistics on earnings, socio-economic sta-tus, personality, school achievement and working careers by dropout status. Section 3 reports the estimation results, and Section 4 provides conclusions.
41
2.2 Longitudinal data on working careers, personality and dropping out of school
The longitudinal data used in the empirical part of this study are drawn from the Jyväskylä Longitudinal Study of Personality and Social Development (JYLS) conducted by Pulkkinen (see Pitkänen, 1969; Pulkkinen, 2006). This study began in 1968 when 12 entire school classes from the Jyväskylä area were randomly selected to participate in the study. The 369 children of the original sample were born in 1959; in 1968, they were in the second grade and thus 8 years old. The sample represented approximately 40 per cent of the second graders in the area. Since 1968, data have been gathered in 1974, 1980, 1986, 1992, 1995, 2001 and 2009. Our study utilises the data collected at ages 8, 14 and 42.
Teacher ratings on school achievement was available at age 8 and infor-mation on personality characteristics, also based on teacher rating, were availa-ble at ages 8 and 14. The dataset collected in adulthood, which used personal interviews and inventories, provides information on, among other things, edu-cational attainment, work experience, unemployment, and personality. Infor-mation about earnings was determined using a questionnaire given to the par-ticipants at age 42. Furthermore, at age 42, the participants, in collaboration with an interviewer, filled out a Life History Calendar that included the indi-vidual’s education and work history from ages 15 to 42.
Despite some attrition over the years, the participation rate has been high, and the representativeness of the sample has remained good. A comparison between the participants and non-participants at age 42 revealed that the partic-ipants continued to represent the original random sample with respect to socio-emotional behaviour in childhood and school achievement in adolescence (Pulkkinen, 2006). Furthermore, the participants were representative of the Finnish age-cohort born in 1959 with respect to marital status, number of chil-dren, employment, and unemployment as determined by the statistics of Statis-tics Finland. In terms of length of education, the male participants did not differ from their age cohort group; female participants, on the other hand, were slight-ly more likely to have had a vocational college education (e.g., nurse, ISCED level 5B) than females in their age-cohort group. Both in the age-cohort group and the present sample, women had a higher level of education than men: more men than women had vocational education (ISCED level 3), while more women than men had upper vocational education (ISCED level 5B). No significant gen-der difference existed in terms of higher education. As a result of a lack of in-formation for some variables, the subsamples we used were smaller than the total sample from 2001 (n = 285). We tested the randomness of this attrition by using a two-group test of proportions.22 According to the results, attrition be-
22 The two-group test of proportions in Stata 10.0 was used to determine whether the
proportions of the following variables were equal in the 2001 sample and in the sub-sample that was used: family’s socio-economic status in 1968 (3 dummy variables),

42
tween the total sample of 2001 and our sub-samples (Tables 6, 7 and 8) was random. In this section, the descriptive statistics are based on a sample where n = 243.
In total, 18.5 per cent of the participants in our sample dropped out of the educational system at least once. Table 1 shows the level of education at which the dropouts in this dataset decided to discontinue their studies. Dropouts in this study may have continued their studies later in their lives and some of the dropouts had already completed a vocational or university degree, or they might have completed such education afterwards. At 42 years of age, 67 per cent of the dropouts still had no vocational (ISCED level 3-6) education.23
TABLE 1 The level of education at which dropping out occurred. Level of education Na
Vocational course 6 Lower secondary education (ISCED level 2) 5 Upper secondary education, general programme (ISCED level 3) 18 Upper secondary education, vocational programme (ISCED level 3) 11 First stage of tertiary education, lower level (ISCED level 5B) 7 First stage of tertiary education, upper level (ISCED levels 5A and 6) 11 Total number of dropouts 45 a The column does not add up to 45 because some individuals have dropped out of more than one educational programme.
Table 2 presents the descriptive statistics based on the dropout status of the par-ticipants. According to a t-test, there were no significant differences between dropouts and non-dropouts with respect to school achievement or family socio-economic status at age eight.24 A test on the equality of proportions found no significant difference in the proportion of women or earnings between dropouts
level of education (4 dummy variables), and stability of work career (3 dummy vari-ables). These variables were used because they were available for all individuals in the 2001 sample. Rejection of the null hypothesis would indicate, e.g., that the pro-portion of females between the total sample of 2001 and our subsample differed. In other words, attrition between the 2001 sample and our subsample would not be random. According to our results, however, attrition was random.
23 It is not possible to count the number of those who had no vocational education from Table 1. Table 1 only indicates the level of education at which the dropping out oc-curred. For example, some of those who dropped out at the level “Upper secondary education, vocational programme” (ISCED 3) may not have ever continued their studies, which is why they do not have (or have completed) a vocational education.
24 School achievement at age 8 was based on a teacher’s assessment of the statement, “Line up your pupils based on school achievement”. The variable uses values be-tween 1 and 5, 1 indicating the lowest and 5 the highest value. The socioeconomic status of the family was obtained in 1968 from school archives, and it was measured on a 3-point scale (1 = blue-collar, 2 = lower white-collar, 3 = higher white-collar). The socioeconomic status of the family was coded on the basis of the father’s occupa-tion (or mother’s occupation if she was a sole provider).
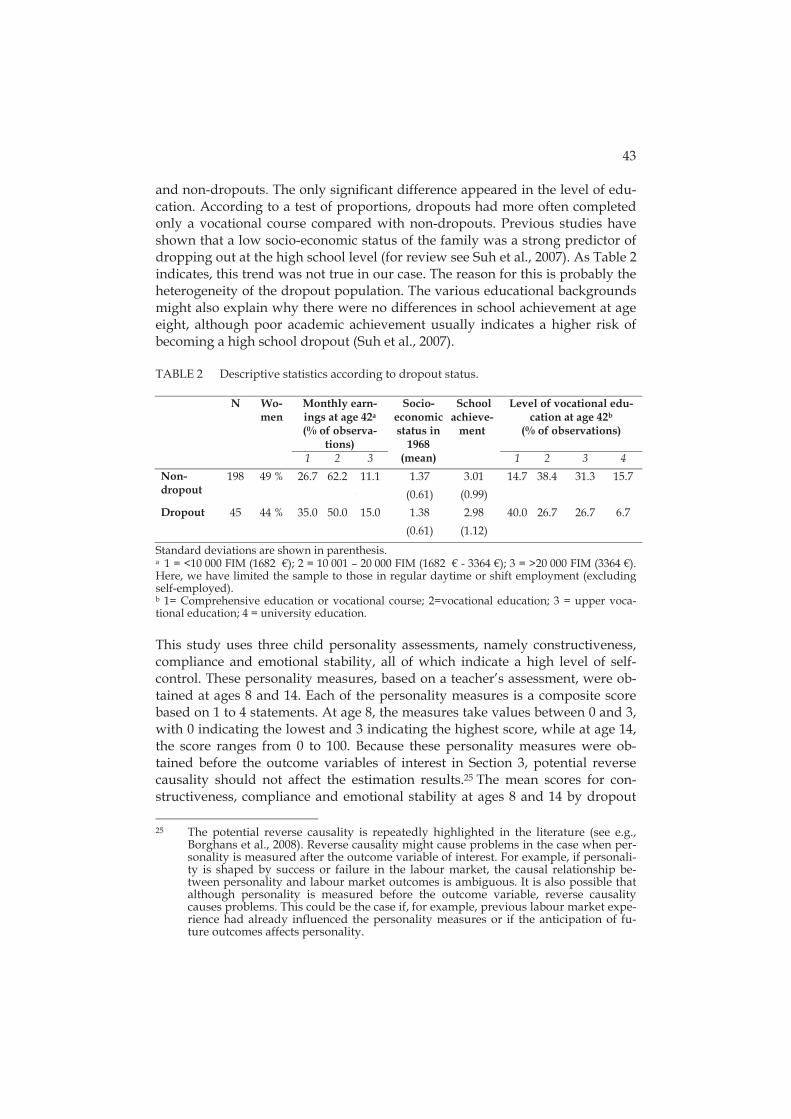
43
and non-dropouts. The only significant difference appeared in the level of edu-cation. According to a test of proportions, dropouts had more often completed only a vocational course compared with non-dropouts. Previous studies have shown that a low socio-economic status of the family was a strong predictor of dropping out at the high school level (for review see Suh et al., 2007). As Table 2 indicates, this trend was not true in our case. The reason for this is probably the heterogeneity of the dropout population. The various educational backgrounds might also explain why there were no differences in school achievement at age eight, although poor academic achievement usually indicates a higher risk of becoming a high school dropout (Suh et al., 2007). TABLE 2 Descriptive statistics according to dropout status.
N Wo-men
Monthly earn-ings at age 42a
(% of observa-tions)
Socio- economic status in
1968 (mean)
School achieve-
ment
Level of vocational edu-cation at age 42b
(% of observations)
1 2 3 1 2 3 4 Non-dropout
198 49 % 26.7 62.2 11.11
1.37 3.01 14.7 38.4 31.3 15.7 (0.61) (0.99)
Dropout 45 44 % 35.0 50.0 15.0 1.38 2.98 40.0 26.7 26.7 6.7 (0.61) (1.12)
Standard deviations are shown in parenthesis. a 1 = <10 000 FIM (1682 €); 2 = 10 001 – 20 000 FIM (1682 € - 3364 €); 3 = >20 000 FIM (3364 €). Here, we have limited the sample to those in regular daytime or shift employment (excluding self-employed). b 1= Comprehensive education or vocational course; 2=vocational education; 3 = upper voca-tional education; 4 = university education. This study uses three child personality assessments, namely constructiveness, compliance and emotional stability, all of which indicate a high level of self-control. These personality measures, based on a teacher’s assessment, were ob-tained at ages 8 and 14. Each of the personality measures is a composite score based on 1 to 4 statements. At age 8, the measures take values between 0 and 3, with 0 indicating the lowest and 3 indicating the highest score, while at age 14, the score ranges from 0 to 100. Because these personality measures were ob-tained before the outcome variables of interest in Section 3, potential reverse causality should not affect the estimation results.25 The mean scores for con-structiveness, compliance and emotional stability at ages 8 and 14 by dropout 25 The potential reverse causality is repeatedly highlighted in the literature (see e.g.,
Borghans et al., 2008). Reverse causality might cause problems in the case when per-sonality is measured after the outcome variable of interest. For example, if personali-ty is shaped by success or failure in the labour market, the causal relationship be-tween personality and labour market outcomes is ambiguous. It is also possible that although personality is measured before the outcome variable, reverse causality causes problems. This could be the case if, for example, previous labour market expe-rience had already influenced the personality measures or if the anticipation of fu-ture outcomes affects personality.

44
status are tabulated in Table 3. According to the results, non-dropouts had higher scores in constructiveness and emotional stability at age 14. Otherwise, the differences were not statistically significant. However, the results suggest that overall non-dropouts had higher levels of self-control than their dropout peers in childhood and adolescence.
TABLE 3 Personality characteristics by dropout status.
Constructiveness Compliance Emotional stability N age 8 age 14 age 8 age 14 age 8 age 14
Non-dropout 198 1.39 58.95 1.48 57.28 1.50 64.94 Dropout 45 1.31 51.64 1.36 55.09 1.47 55.96 t-statisticsa 0.624 1.732 0.879 0.486 0.259 2.149 (p-value) (0.534) (0.085) (0.380) (0.627) (0.796) (0.033)
a We performed independent group t-test to compare the means of the personality traits be-tween two groups.
Table 4 reports the average years of work experience, the total duration of un-employment between ages 15-42, information about the stability of one’s career (ages 37-42), and the average number of employment contracts (ages 15-42) by the dropout status.26 According to Table 4, dropouts had a higher level of un-employment, less work experience and greater instability in their working ca-reer than non-dropouts. Otherwise, there were no significant differences be-tween these two groups.
TABLE 4 Description of work-related variables by dropout status. N Years of
work ex-perience
Duration of unemployment
(months)
Stability of career
Number of employment
contracts Stable Changeable Unstable Non-dropout
198
19.5 11.8 79.8 % 6.6 % 13.6 % 5.4 (4.65) (26.52) (3.79)
Dropout 45 17.8 20.17 64.4 % 6.7 % 28.9 % 5.2 (5.61) (29.65) (3.82)
Standard deviations are shown in parenthesis.
26 Stability of working career (Pulkkinen, Ohranen & Tolvanen, 1999) is based on the
years 1996-2001 (ages 36-42). Stable working career: The maximum length of total un-employment in the period is approximately 6 months. Job changes are due to indi-vidual volition. Possible instabilities in the work career occur at the beginning of the period. Changeable working career: Highly family-centered working career (at home 30 months or more)/ The individual has gone back to school after being at work for several years/ Stable working career at the beginning of the period but becomes un-stable later on. Unstable working career: Unemployed with short employment spells, retired or on sick leave. Number of unemployment contracts: Number of full-time jobs between ages 15-42 excluding summer jobs while still at school.

45
2.3 Labour market performance of dropouts: empirical results
In this section, we examine the labour market performance of dropouts. Two different approaches are used. First, we illustrate how dropping out is associat-ed with subsequent earnings both before and after controlling for non-cognitive skills. The second approach estimates how dropping out is associated with the labour market status. We use the panel feature of the data to analyse labour market status at age 42 and labour market status between ages 15-42 as the de-pendent variable.
To obtain evidence on the relationship between dropping out and subse-quent earnings, we estimated a model in which monthly earnings taken at age 42 were regressed on level of education (age 42), gender, years of work experi-ence (ages 15-42) and years of work experience squared, profession (age 42), weekly working hours (age 42), an indicator for working area (age 42), school achievement (age 8), and an indicator for dropouts.27 In the second specification, we extended the model with measures of personality. Only participants who were employed in regular daytime or shift work at the time (excluding the self-employed) were considered in the analysis. Because the earnings variable is categorical, we used interval regression to estimate the model. Formally, the model is given by
(1) εββα +++= )(*)( 21 indicatordropoutXyLog [ ]2,0~ σε N ,
where y* is the unobserved, continuous dependent earnings variable and X is a vector of individual characteristics. The values of y are observed in nine catego-ries, and the observations in the lowest and the highest categories are treated as left- and right-censored, respectively. A logarithm was taken of the threshold values. The results are tabulated in Table 5.
In the baseline model (Table 5, column 1), the level of earnings was re-gressed on a dropout dummy and work-related variables. The augmented models include personality measures at ages 8 (column 2) and 14 (column 3) to the baseline model. In all specifications, the dropout variable was small and statistically insignificant. Thus, dropping out seems to not be related to earnings at age 42. The only significant personality variable in Table 5 was emotional
27 Monthly earnings at age 42: Information about earnings was acquired from the partici- pants themselves in a questionnaire completed at age 42. The 9 earnings categories are 0-8000 FIM, 8001-10 000 FIM, 10 001-12 000 FIM, 12 001- 14 000 FIM; 14 001- 16 000 FIM, 16 001- 20 000 FIM, 20 001-24 000 FIM, 24 001-28 000 FIM, and over 32 000 FIM. (One EUR is equivalent to 5.94573 FIM). Using information from the partici- pants’ current employment situation, we were able to limit the sample to those who were in employed in regular daytime or shift work. Indicator for working area: An indicator for the metropolitan area in Finland: Helsinki, Espoo, Vantaa and the nearby municipalities in the same commuting area. The group also included a participant living in Stockholm, Sweden. Profession: Three categories: blue-collar, lower white-collar, and upper white-collar.

46
stability at age 14, and even this result is doubtful: it is difficult to find an intui-tive explanation for why emotional stability would have a negative relationship to earnings. In addition, the correlation between income and emotional stability was insignificant, and when the personality measures were considered sepa-rately in the model, none were significant. The control variables in Table 5 were consistent with our prior assumptions: a higher level of education, work experi-ence, a higher professional level and a higher number of working hours were associated with higher earnings; women earned on average 25 per cent less than men. Moreover, in line with previous studies (Glaeser & Maré, 2001), we found that working in the metropolitan area increased earnings.
As a robustness check, we estimated the model without education dum-mies because of a potential correlation between the level of education and the dropout indicator. The correlation between the dropout indicator and the level of education in Table 5 was low (-0.116), and the results remained qualitatively similar without education indicators. We also estimated the model using adult personality, as measured by the Big Five personality traits at ages 33 and 42, as a control for personality.28 The dropout coefficients were small and insignificant in this case as well. The model was also estimated without variables related to work experience and profession. The reason for this is that if dropping out was associated with labour market outcomes, the use of such variables in the model could capture the effects of the dropout variable. However, the results re-mained qualitatively similar to those reported in Table 5.
In conclusion, we did not find a connection between earnings and drop-ping out of school. The dropout coefficients in the baseline model and in the models augmented with personality were small and insignificant. A possible explanation for these conclusions may be the broad definition of a dropout: we included dropouts from various educational levels, and most of them have completed some sort of vocational or university education. 28 The Big Five personality inventory (see e.g., Costa & McCrae, 1985) defines five per-
sonality traits: openness to new experiences, conscientiousness, extraversion, agreea-bleness, and neuroticism, each of which consists of several facets or subtraits. A wide consensus exists on the hierarchical structure of the personality traits and on the number of core personality traits represented in the five-factor model of personality (Goldberg, 1993; McCrae & Costa, 2003; McCrae & John, 1992). In JYLS, the Big Five personality traits were measured by the Big Five Personality Inventory (Pulver et al., 1995), which is an authorised adaptation of the NEO Personality Inventory (Costa & McCrae, 1985; Costa & McCrae, 1992) and of which approximately one-quarter are substitutes for the original American items. At both ages, 60 items were used for the study of personality traits. The traits are measured on a 5-point scale (1-5), where 1 indicates a low score and 5 a high score for the trait in question. The reliabilities, as-sessed by Cronbach’s alpha, of the personality traits at age 33 were as follows: Neu-roticism, 0.86 for men and 0.85 for women; Extraversion, 0.84 for men and 0.70 for women; Openness, 0.78 for both genders; Agree-ableness, 0.79 for men and 0.77 for women; and Conscientiousness, 0.75 for men and 0.78 for women. At age 42, the Cronbach’s alphas were Neuroticism, 0.83 for women and 0.90 for men; Extraversion, 0.76 for women and 0.83 for men; Agreeableness, 0.79 for both genders; Conscien-tiousness, 0.79 for women and 0.76 for men; and Openness, 0.81 for women and 0.75 for men.

47
TABLE 5 Dropouts and current earnings: results from an interval regression.
(1) (2) (3)
Baseline
Personality measured
at age 8 Personality measured
at age 14 Dropouta 0.016 0.013 -0.005 (0.058) (0.058) (0.058) Personality measures - Constructiveness 0.024 0.037 (0.034) (0.023) - Compliance 0.003 -0.003 (0.028) (0.022) - Emotional stability -0.016 -0.053* (0.024) (0.031) Work-related controlsb x x x McFadden's adj. R2c 0.144 0.135 0.140 N 155 155 155 This table tabulates coefficients from an earnings regression. Dependent categorical variable is the log of monthly earnings. Robust standard errors are shown in parentheses. Significant at * 10%, ** 5%, *** 1% level. a The reference group are non-dropouts. b The following work-related control variables were also included: level of education (4 catego-ries), gender, years of work experience, years of work experience squared, profession (blue–collar, lower white-collar, upper white-collar), indicator for individuals living in metropolitan area, working hours per week, and school achievement. c We report McFadden’s (1974) pseudo-R2 because it is likely the most popular pseudo-R2 measure (Veall & Zimmermann, 1996 p. 248).
Table 6 reports the marginal effects from a probit model that uses labour market status, measured at age 42, as the dependent variable. We concentrated on those respondents who were economically active (employed or unemployed) at the time of interview at age 42. The estimated model is:
(2) ,'* iii xy εβ += where )1,0(~ Nε
and =01
iy ifif
0*0*
≤>
i
i
yy
.
In equation (2) i refers to the individual, and xi is a vector of explanatory varia-bles with estimated parameters . *
iy is a latent index that captures the tenden-cy of an individual to experience unemployment. The observed binary variable y equals one if the person was unemployed at age 42 and zero if the person was employed.
Table 6 tabulates the average marginal effects from the baseline (column 1) and augmented probit models. The augmented models use personality measures obtained at ages 8 (column 2) and 14 (column 3). In all specifications, the marginal effect of the dropout variable was small and insignificant. Thus dropping out seems not to be related to labour market status at age 42 after con-
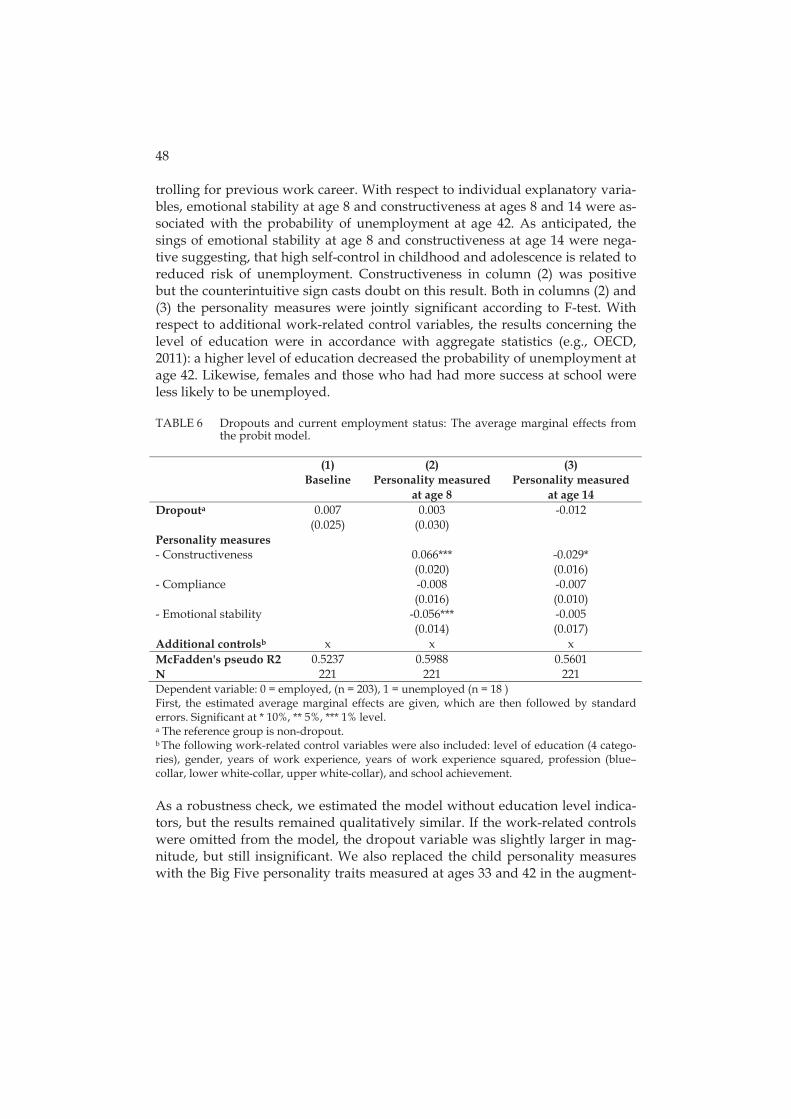
48
trolling for previous work career. With respect to individual explanatory varia-bles, emotional stability at age 8 and constructiveness at ages 8 and 14 were as-sociated with the probability of unemployment at age 42. As anticipated, the sings of emotional stability at age 8 and constructiveness at age 14 were nega-tive suggesting, that high self-control in childhood and adolescence is related to reduced risk of unemployment. Constructiveness in column (2) was positive but the counterintuitive sign casts doubt on this result. Both in columns (2) and (3) the personality measures were jointly significant according to F-test. With respect to additional work-related control variables, the results concerning the level of education were in accordance with aggregate statistics (e.g., OECD, 2011): a higher level of education decreased the probability of unemployment at age 42. Likewise, females and those who had had more success at school were less likely to be unemployed.
TABLE 6 Dropouts and current employment status: The average marginal effects from the probit model.
(1) (2) (3) Baseline Personality measured Personality measured at age 8 at age 14 Dropouta 0.007 0.003 -0.012 (0.025) (0.030) Personality measures - Constructiveness 0.066*** -0.029* (0.020) (0.016) - Compliance -0.008 -0.007 (0.016) (0.010) - Emotional stability -0.056*** -0.005 (0.014) (0.017) Additional controlsb x x x McFadden's pseudo R2 0.5237 0.5988 0.5601 N 221 221 221 Dependent variable: 0 = employed, (n = 203), 1 = unemployed (n = 18 ) First, the estimated average marginal effects are given, which are then followed by standard errors. Significant at * 10%, ** 5%, *** 1% level. a The reference group is non-dropout. b The following work-related control variables were also included: level of education (4 catego-ries), gender, years of work experience, years of work experience squared, profession (blue–collar, lower white-collar, upper white-collar), and school achievement.
As a robustness check, we estimated the model without education level indica-tors, but the results remained qualitatively similar. If the work-related controls were omitted from the model, the dropout variable was slightly larger in mag-nitude, but still insignificant. We also replaced the child personality measures with the Big Five personality traits measured at ages 33 and 42 in the augment-

49
ed model but the results remained qualitatively similar. 29 In general, the results suggest that dropping out did not have a significant relationship with employ-ment status at age 42. To examine how dropping out is associated with labour market perfor-mance over a long period of time, we performed OLS regressions in which years of employment and years of unemployment between ages 15 and 42 were used as the dependent variable. The estimated model is
(3) iii xy εβ += ´ ni ,...,2.1= ,
where yi is the dependent variable, xi is a vector of individual characteristics with estimated parameters , and i is a stochastic error term with white noise properties.
Table 7 tabulates the results of a model in which years of employment were used as the dependent variable. As before, we first report the results from the baseline model and then augment the model with personality. Here, the dropout coefficient was negative and statistically significant in all three specifi-cations. The baseline results in column (1) indicate a 2.1–year reduction in work experience for dropouts. When the model took personality characteristics into account, the dropout coefficient was reduced.30 With respect to individual per-sonality measures, a higher score in child constructiveness at age 8 was associ-ated with more years of employment in adulthood. Constructiveness in child-hood was associated with social activity and emotional control, which are valu-able qualities in one’s working life, as the results in Table 7 suggest. Otherwise, the personality measures were insignificant. Women were likely to have less work experience than men, and individuals with a university education had on average less work experience than those with lower levels of education. The gender differences may result from the fact that women spend more time out of the labour market and in education, both of which reduce the years of work experience. The effect of education on work experience is not straightforward; although education takes time, it also reduces the risk of unemployment, but by the age of 42, the former effect seems to dominate. When the models were esti-mated without education indicators, the dropout coefficient was reduced from -1.835** to -1.767** at age 8 and to -1.808** at age 14. When the Big Five personal-
29 It should be noted that at ages 33 and 42, personality was usually measured after
dropping out. If dropping out has had an impact on personality, then the results might be affected by reverse causality. The results are available from the correspond-ing author upon request.
30 The fact that personality was measured before an individual dropped out might cause measurement error problems if the personality has changed. One solution to this problem would be to use an IV estimation in which the lagged values of person-ality (age 8) were used as instruments for personality at age 14. Unfortunately, the personality measures at age 8 turned out to be weak instruments, and thus inferences based on this IV estimation would likely be biased. We also tested whether child per-sonality measures could be used as instruments for adult personality. The instru-ments were also weak in this case.

50
ity traits at ages 33 and 42 were included, the dropout coefficient was reduced from -2.104** to -1.841** and from -1.607* to -1.503, respectively.31 We tested whether the estimated effects of the dropout dummy varied depending on the level of education at which the person dropped out. Overall, the results were qualitatively similar to those in Table 7 and suggest that dropping out was as-sociated with reduced workexperience, but the coefficient is reduced when the model is augmented with personality.
TABLE 7 Dropouts and years of employment: Results from the OLS regression.
(1) (2) (3) Baseline Personality measured Personality measured at age 8 at age 14
Dropouta -2.126** -2.016** -2.085** (0.891) (0.884) (0.898) Personality measures - Constructiveness 0.954* -0.052 (0.514) (0.430) - Compliance 0.082 -0.198 (0.399) (0.342) - Emotional stability -0.457 0.203 (0.464) (0.539) Additional controlsb x x x R2 0.1404 0.1570 0.1417 N 243 243 243 The dependent variable is years of employment. Significant at * 10%, ** 5%, *** 1% level. a The reference group are not dropouts. b The following work-related controls were also included in the model: level of education, gen-der, and school achievement.
Table 8 tabulates the results of models with cumulative unemployment as the dependent variable. In all model specifications, the dropout coefficient was pos-itive, although not significant, suggesting that dropouts are unemployed more than their non-dropout counterparts. This result is in line with that of Caspi et al. (1998) and Coneus et al. (2008), who also found that dropping out is associ-ated with a higher risk of unemployment. The dropout coefficient was once again reduced when the model was augmented with personality. Personality variables were insignificant when they were collectively included in the model. However, when the personality measures were individually included in the model, constructiveness in column (2) turned out to be significant, suggesting that a higher score in child constructiveness was associated with fewer years of unemployment in adulthood. Both constructiveness and emotional stability were significant in column (3) when personality measures were separately in-cluded in the model. Regarding other explanatory variables, a higher level of
31 The results are available from the corresponding author upon request.

51
education significantly reduced the risk of high cumulative unemployment.32 School achievement was negative and significant in columns (1) and (3), but no significant gender differences appeared in the results. When the models were estimated without education indicators, the dropout coefficient decreased from 0.674* to 0.646 at age 8 and to 0.561 at age 14. When the Big Five personality traits at ages 33 and 42 were used, the dropout coefficient was reduced from 0.486 to 0.428 and from 0.319 to 0.134, respectively.33 As before, we tested whether the estimated coefficients of the dropout dummy varied depending on when the person dropped out. Surprisingly, the results suggested that dropping out at the upper secondary education level was associated with a reduced level of unemployment. Otherwise, the results were in line with those in Table 8, in-dicating that dropping out was associated with more years of unemployment in adulthood, but the coefficient is reduced when the model is augmented with personality. When the models in Table 8 excluded those who dropped out at upper secondary education level, the dropout coefficient was significant in all model specifications of Table 8, and the coefficient was reduced when the mod-el was augmented with personality.
Overall, the results in this section suggest that dropping out is linked neg-atively with the labour market career over a long period of time in the baseline model. When the models were augmented with personality, however, the con-nection was smaller. Furthermore, the results were qualitatively similar to both genders. This result suggests that dropouts have or lack personality characteris-tics that are associated with labour market success. The first explanation to this is that dropping out is an adverse signal of personality characteristics. The se-cond explanation is that personality characteristics of dropouts are related to their preferences towards work orientation and career choices.
32 This result is not just because achieving a higher degree takes more time. Although those with the highest level of education have spent many more years studying than those with the least education, the average number of years of employment were quite similar: 20.8 years (ISCED level 2) and 18 years (ISCED level 5). 33 The results are available from the corresponding author upon request.

52
TABLE 8 Dropouts and years of unemployment: Results from the OLS regression.
(1) (2) (3) Baseline Personality measured Personality measured at age 8 at age 14 Dropouta 0.420 0.363 0.307 (0.360) (0.357) (0.355) Personality measures - Constructiveness -0.211 -0.041 (0.250) (0.200) - Compliance -0.177 0.113 (0.208) (0.180) - Emotional stability 0.101 -0.327 (0.185) (0.272) Additional controlsb x x x R2 0.0968 0.1089 0.1136 N 243 243 243 The dependent variable is years of unemployment. Significant at * 10%, ** 5%, *** 1% level. a The reference group are not dropouts. b The following work-related controls were also included in the model: level of education, gen-der, and school achievement.
2.4 Conclusions
This study examined the relationship between dropping out of school and an individual’s success in the labour market. The empirical analysis was based on the Jyväskylä Longitudinal Study of Personality and Social Development (JYLS), which provides data on an individual’s schooling, work career, and personality from ages 8 to 42. This study is exceptional by virtue of its long follow-up peri-od and the assessment of personality from early school age to middle age.
In contrast with previous studies, which primarily used data from high school dropouts, JYLS has dropouts with various levels of education ranging from comprehensive school to the university. The longitudinal nature of the data enabled us to investigate how dropping out in general is related to labour market success. Over their career, 19 per cent of the participants in our sample dropped out of the educational system at least once. According to our results, dropping out is associated with weaker labour market performance over a long period of time. Dropping out had a negative linkage with years of employment and a positive linkage with years of unemployment in the baseline models. When the models were augmented with personality, the connection was weak-ened. No connection was found between dropping out and earnings or em-ployments status at age 42.
Overall, dropouts seem to have or lack certain personality characteristics that are associated with labour market success. Hence, dropping out is either an adverse signal of non-cognitive skills and, thus, work performance and produc-

53
tivity or personality characteristics are related to preferences towards career and work orientation, or both.

54
References
Almlund, M., Duckworth, A. L., Heckman, J. & Kautz, T. (2011) Personality psychology in economics, IZA DP No. 5500.
Araujo, A., Gottlieb, D. & Moreira, H. (2007) A model of mixed signals with applications to countersignaling, The RAND Journal of Economics, 38(4), 1020-1043.
Báron, J. D. & Cobb-Clark, D. A. (2010) Are young people's educational outcomes linked to their sense of control? IZA Discussion Paper No. 4907.
Becker, G. (1964). Human capital: A theoretical and empirical analysis, with special reference to education. Chicago: University of Chicago Press.
Borghans, L., Duckworth, A. L., Heckman, J. & ter Weel, B. (2008) The economics and psychology of personality traits, IZA Discussion Paper No. 3333.
Bowles, S., Gintis, H. & Osborne, M. (2001a) Incentive-enhancing preferences: Personality, behavior, and earnings, American Economic Review, 91(2), 155-158.
Bowles, S., Gintis, H. & Osborne, M. (2001b) The determinants of earnings: A behavioral approach, Journal of Economic Literature, 39(4), 1137-1176.
Braakmann, N. (2009) The role of psychological traits for the gender gap in full-time employment and wages: Evidence from Germany, SOEP papers on Multidisciplinary Panel Data Research 162.
Card, D. & Krueger, A. (1992) Does school quality matter? Returns to education and the characteristics of public schools in the United States, Journal of Political Economy, 100, 1-40.
Carneiro, P., Crawford, C. & Goodman, A. (2007) Impact of early cognitive and non-cognitive skills on later outcomes, Center for Economics and Education, Working Paper, 92.
Caspi, A., Wright, B. E. R., Moffit, T. E. & Silva, P. A. (1998) Early failure in the labor market: Childhood and adolescent predictors of unemployment in the transition to adulthood, American Sociological Review, 63, 424-451.
Cebi, M. (2007) Locus of control and human capital investment revisited, Journal of Human Resources, 42(4), 919-932.
Coleman, M. & DeLeire, T. (2003) An economic model of locus of control and the human capital investment decision, The Journal of Human Resources, 38(3), 701-721.
Coneus, K., Gernandt, J. & Saam, M. (2008) Noncognitive skills, internet use and educational dropout, ZEW Discussion Paper 08-44.
Costa, P. T. Jr. & McCrae, R. R. (1992) Revised NEO Personality Inventory (NEO-PI-R) and NEO Five-Factor Inventory (NEO-FFI) professional manual, Odessa, FL: Psychological Assessment Resources.
Costa, P. T. Jr. & McCrae, R. R. (1985) The NEO personality inventory manual, Odessa, FL: Psychological Assessment Resources.
55
Ferrer, A. & Riddell, W. C. (2002) The role of credentials in the canadian labour market, Canadian Journal of Economics, 35, 879-9056.
GED Testing Program Statistical Report 2008 (2009) American council on education.
http://www.acenet.edu/Content/NavigationMenu/ged/pubs/GED_ASR_2008.pdf
Glaeser, E. L. & Maré, D. C. (2001) Cities and skills, Journal of Labor Economics, 19(2), 316-342.
Goldberg, L. R. (1993) The structure of phenotypic personality traits, American Psychologist, 48, 26-34.
Heckman, J. & Rubinstein, Y. (2001) The importance of non-cognitive skills: Lessons from the GED testing program, American Economic Review, 91, 145-149.
Heckman, J. J., Hsse, J. & Rubinstein, Y. (2002) The GED is a “mixed signal”: The effects of cognitive and non-cognitive akills on human capital and labor market outcomes.
http://econ.tau.ac.il/papers/faculty/HHRTEXT.pdf Heckman, J. J., Stixrud, J. & Urzua, S. (2006) The effects of cognitive and
noncognitive abilities on labor market outcomes and social behavior, Journal of Labor Economics, 24(31), 411-482.
Heineck, G. (2011) Does it pay to be nice? Personality and earnings in the United Kingdom, Industrial and Labor Relations Review, 64(5), 1020-1038.
Jaeger, D. A. & Page, M. E. (1996) Degrees matter: New evidence on sheepskin effects in the returns to education, The Review of Economics and Statistics, 78(4), 733-740.
Jensen, R. (2010) The (perceived) returns to education and the demand for schooling, The Quarterly Journal of Economics, 125(2), 515-548.
Linz, S. J. & Semykina, A. (2009) Personality traits as performance enhancers? A comparative analysis of workers in Russia, Armenia, and Kazakhstan, Journal of Economic Psychology, 30, 71-91.
McCrae, R. R. & Costa, P. T., Jr. (2003) Personality in adulthood: A five-factor theory perspective, New York, NY: The Guilford Press.
McCrae, R. R. & John, O. P. (1992) An introduction to the five-factor model and its applications, Journal of Personality, 60, 175-215.
McFadden, D. (1974) Conditional logit analysis of qualitative choice behavior, in Zarembka, P. (Ed), Frontiers in econometrics. New York: Academic Press, 105-142.
Mueller, G. & Plug, E. (2006) Estimating the effect of personality on male and female earnings, Industrial and Labour Relations Review, 60(1), 3-22.
Nyhus, E. K.,and Pons, E. (2005) The effects of personality on earnings, Journal of Economic Psychology, 26, 363-384.
OECD (2001) Education at a glance 2011: OECD indicators, Paris: OECD. Oreopoulos, P. (2007) Do dropouts dropout too soon? Wealth, health and
happiness from compulsory schooling, Journal of Public Economics, 91(11-12), 2213-2229.
56
Osborne Groves, M. (2005) How important is your personality? Labor market returns to personality for women in the US and UK, Journal of Economic Psychology, 26, 827-841.
Pitkänen, L. (1969) A descriptive model of aggression and nonaggression with applications to children's behaviour. Jyväskylä Studies in Education. Psychology and Social Research, Nr. 19, University of Jyväskylä, Finland.
Pulkkinen, L. (2006) The Jyväskylä Longitudinal Study of Personality and Social Development, in L. Pulkkinen, J. Kaprio, and R. J. Rose (Eds), Socioemotional development and health from adolescence to adulthood. New York: Cambridge University Press, 29-55.
Pulkkinen, L., Ohranen, M. & Tolvanen, A. (1999) Personality antecedents of career orientation and stability among women compared to men, Journal of Vocational Behavior, 5, 37-58.
Pulver, A., Allik, J., Pulkkinen, L. & Hämäläinen, M. (1995) A Big Five personality inventory in two non-Indo-European Languages, European Journal of Personality, 9, 109-124.
Segal, C. (2006) Misbehavior, education, and labor market outcomes, Working Paper, Palo Alto: Stanford University.
http://www.econ.upf.edu/~segal/misbehavior.pdf Semykina, A. & Linz, S. J. (2007) Gender differences in personality and earnings:
evidence from Russia, Journal of Economic Psychology, 28, 387-410. Spence, M. (1973). Job market signaling. Quarterly Journal of Economics, 87(3),
355-374. Suh, S., Suh, J. & Huston, I. (2007) Predictors of categorical at-risk high school
dropouts, Journal of Counseling and Development, 85, 196-203. Uysal, S. D. & Pohlmeier, W. (2011) Unemployment duration and personality,
Journal of Economic Psychology, 32(6), 980-992. Veall, M. R. & Zimmermann, K. F (1996) Pseudo R2 measures for some common
limited dependent variable models, Journal of Economic Surveys, 10, 241-259.

3 PERSONALITY AND LABOUR MARKET INCOME: EVIDENCE FROM LONGITUDINAL DATA34
ABSTRACT. This study contributes to the literature on how personality is re-warded in the labour market by examining the relationship between personality and labour market income. Our results suggest that adulthood extraversion is positively associated with income when education, work experience and un-employment history, measured prospectively from longitudinal data, are con-trolled for. Also childhood constructiveness indicating active and well-controlled behaviour has a positive associations with income in adulthood.
3.1 Introduction
Psychological literature suggests that personality traits, known as the Big Five factors of personality (neuroticism, extraversion, openness to experiences, con-scientiousness, and agreeableness), have specific associations with different vo-cational interests. For example, extraversion correlates positively with entre-preneurial and social interests, openness with artistic and investigative interests, conscientiousness with conventional interests, and agreeableness with social interests (see Tokar et al., 1998 for a review). Studies have also revealed associ-ations between personality traits and various aspects of work-related perfor-mances as reviewed by Burch and Anderson (2009). It has been shown that con-scientiousness is associated with several work performance criteria, although there is recent evidence that the narrower subtraits of global conscientiousness,
34 This paper has been published as: Viinikainen, J., Kokko, K., Pulkkinen, L. & Pehko-
nen, J. 2010. Personality and labour market income: evidence from longitudinal data. LABOUR: Review of Labour Economics and Industrial Relations, 24(2), 201–220. I would like to thank Professor Petri Böckerman and anonymous referees for their helpful comments.

58
such as order and dependability, have specific assocations with performance (Dudley, Orvis et al., 2006). Neuroticism has generally been found to be nega-tively associated with job performance and different dimensions of career suc-cess. Extraversion is most consistently related to leadership, and it is also asso-ciated with teamworking and career success. In addition, Seibert and Kraimer (2001) report extraversion to be positively related to salary levels, promotion and satisfaction with careers. There is also some evidence (Pulkkinen et al., 2006) that adaptive child and adolescent social behavior, indicated by a combination of social activity and high self-control of behavior, precedes a high level of adult achievement, including a high level of education, high occupational status and stable employment. Personality characteristics assessed as early as early school age might thus matter when it comes to success in working life and earnings.
In economics, the importance of individual characteristics as determinants of earnings has received attention since Griliches (1977). The empirical research has focused on cognitive abilities, and earnings equations have been augmented, for example, with IQ proxies and aptitude test scores (see Blackburn and Neu-mark, 1992; Card, 1999; Uusitalo, 1999; Heckman and Vytlacil, 2001; Tobias, 2003; Heineck and Anger, 2010). Recently the importance of personality on earnings has gained more attention. Heckman et al., (2006) have made an im-portant contribution to this field by discussing and presenting evidence on how both cognitive and non-cognitive abilities are related to a number of labour market outcomes such as wages, schooling decisions, and occupational choice.35
In economics empirical research on personality characteristics and earnings has been inspired, in particular, by the article by Bowles et al. (2001a) which sur-veys the literature and examines the role of psychological characteristics on earn-ings in terms of incentive-enhancing properties. The latest work includes Nyhus and Pons (2005), using Dutch data, Osborne Groves (2005), utilizing UK and US data, Mueller and Plug (2006), Cebi (2007), and Fortin (2008), using US data, Se-mykina and Linz (2007), using Russian data, Heineck (2011), and Nandi and Ni-coletti (2009), using UK data, and Braakmann (2009) and Heineck and Anger (2010), using German data. Many different measures for personality have been used and a consensus on which characteristics are the most important for labour market success has yet to emerge. However, it seems that for example externali-ty36 (or external locus of control) is associated with lower earnings (see Bowles et al., 2001b; Osborne Groves, 2005; Heckman et al., 2006; Cebi, 2007; Heineck &
35 Other qualities might matter as well. Hamermesh and Biddle (1994) find that the ‘beauty premium’ exists even after controlling for many observable characteristics such as work experience (for recent research see e.g. Andreoni & Petrie, 2008). In other words, beautiful people seem to earn more, suggesting that employers consider beauty as an indicator of work performance and productivity. Earnings have also been found to be negatively related to obesity (see e.g. Cawley, 2007) and positively to height (see e.g. Case & Paxton, 2006). 36 Externality (or external locus of control) refers to the belief that outcomes are the result of faith or luck. The Rotter score is used to measure the degree to which indi- viduals perceive that the reward they receive follows from their own behaviour (in- ternal locus of control) or from external factors.

59
Anger, 2010), whereas high self-esteem seem (e.g. Heckman et al. 2006; Waddell, 2006; Fortin, 2008) has a positive association with earnings.
There is also evidence that personality characteristics are rewarded and penalized differently across gender and several studies have found that these differences in personality characteristics can partly explain the gender wage gap. For example Semykina and Linz (2007) found that men were more likely to exhibit an internal locus of control and need for challenge, while women were more likely to exhibit an external locus of control and need for affiliation. Over-all women’s earnings seemed to be more strongly affected by personality than men’s and the differences in personality characteristics explained as much as 8 percent of the gender wage gap. Mueller and Plug (2006), in turn, report that antagonism, emotional stability and openness to experience were positively related to men’s earnings. Among women earnings advantages were associated with conscientiousness and openness to experience. The results suggested that differences in personality may explain between 7 percent and 16 percent of the earnings gap. Also Braakmann (2009) found that gender differences especially in agreeableness, neuroticism and to lesser extent in conscientiousness contrib-ute to gender differences in wages and Fortin (2008) found that gender differ-ences in non-cognitive factors have a modest but significant role in accounting for the gender wage gap.
This paper contributes to the recent literature on earnings and personality by providing evidence from longitudinal data. The study is of particular inter-est because of two reasons. First, this paper provides evidence from a longitu-dinal data where non-cognitive qualities of individuals have been measured at three different timepoints from early school age to middle age (ages 8, 33, and 42). Compared to previous studies we pay significant attention to child charac-teristics which, unlike adult personality traits, are independent of work experi-ence. Second, due to the strong role of trade unions in wage-setting, wage dif-ferentials across different sectors of the economy are small and persistent (see Johansson, 2006; Uusitalo, 2005). Consequently, possibly productive characteris-tics, such as personality, are less likely to be fully rewarded in the Finnish la-bour market. If personality variables are associated with income in these regu-lated circumstances, the results underestimate rather than overestimate the role of personality in income. Consequently, a longitudinal data using Finnish study provides an interesting country analysis that contributes to the recent mainly cross-sectional analyses conducted in the UK, US, Netherlands, and Russia where the labour markets are also more flexible.
The remainder of this paper is organized as follows. Section 2 reports the data in detail, providing descriptive statistics on income, socioeconomic status, personality, school achievement and work careers by level of education. In ad-dition, the correlations found between personality and labour market outcomes are reported. Section 3 reports the estimation results, which indicate that extra-version, measured at age 42, and constuctiveness, measured at age 8, are posi-tively associated with labour market income when education and unemploy-ment history are controlled for. Section 4 concludes.

60
3.2 Longitudinal data on personality, school achievement, and work career
The longitudinal data used in the empirical part of this study are drawn from the Jyväskylä Longitudinal Study of Personality and Social Development (JYLS) conducted by Pulkkinen (see Pitkänen, 1969; Pulkkinen, 2006). This study began in 1968 when 12 entire school classes from the Jyväskylä area were randomly selected to the sample; the initial attrition rate was zero. The original sample of 369 children were born in 1959 and in 1968 they were in the second grade and thus 8 years old. The sample represented about 40 per cent of the second grad-ers in the area. Since 1968, data have been gathered at ages 14 (in 1974), 20 (1980), 27 (1986), 33 (1992), 36 (1995), and 42 (2001). The estimation sample size in this paper varies between 184 and 243.
At ages 8 and 14, the main methods of data collection were teacher ratings and peer nominations, whereas in adulthood questionnaires and personal in-terviews were used. Information about GPA (grade point average) at age 14 was collected from school archives, and labour market income at age 43 (in 2002) from tax authority registers.37 The dataset provides information on educational attainment, work experience, unemployment, and personality. A more detailed description of the variables is given in Appendix 1.
As for attrition over the years, comparison of the participants and non-participants at age 42 revealed that the participants continued to represent the original random sample in socioemotional behavior in childhood and school achievement in adolescence (Pulkkinen, 2006). Furthermore, when the statistics provided by Statistics Finland were used as the data source, they were repre-sentative of the Finnish age cohort born in 1959 with respect to, for example, marital status, number of children, employment, and unemployment. In length of education, the male participants did not differ from their age cohort group; female participants in turn had a vocational college education (e.g., nurse, ISCED level 5B) slightly more often than females in their age cohort group. Both in the age cohort group and the present sample, women had a higher level of education than men: although more men than women had vocational education (ISCED level 3), more women than men had upper vocational education (ISCED level 5B). No significant gender difference existed in higher education.38
Table 1 presents descriptive statistics drawn from the data by the highest level of education completed by the participants. As can be seen from the table, most participants have completed either vocational education or upper voca-tional education. Women dominated the higher levels of education: 75 per cent of those with upper vocational education were women, and among those with a 37 Labour market income (or here income for short) refers to income from work, pen- sions, and other benefits, such as unemployment benefit. No capital income is in cluded to this measure. Unfortunately the data provides no income information from earlier years. 38 For more information see Appendix 2.

61
university degree 62 per cent were women. As expected, average annual in-come increased with educational level. At age 43 the average annual income among those with only a vocational course after comprehensive school were 19,100 euros, while among those with a university degree the average was 42,800 euros. The JYLS dataset also includes information on each sample indi-vidual’s GPA at age 14. This information can be used to evaluate the impact of school achievement on labour market income. GPA tended to rise with educa-tional level, and was highest in the most educated group. At the lowest level of vocational education the average GPA was 7.0 and at the highest level 8.1.
Table 1 also reports the average number of work experience years, dura-tion of unemployment, information about the stability of the working career, the average number of employment contracts, and occupational status by level of education. There was a clear tendency towards a more stable work career as the level of education rises. Also, the average duration of unemployment de-creased from 23 to 4 months as we moved from the lowest education group to the highest. Since more educated people had less unemployment and more sta-ble work careers, differences in years of work experience were rather small at age 42, despite more years spent in school by the more educated. On average those with only a vocational course had 21 years of work experience, while the average years of work experience among university graduates was 18. As ex-pected, more educated were more likely to work in upper white-collar occupa-tions. No differences appeared in the number of employment contracts. The personality traits were measured at ages 33 and 42 by using the Big Five Personality Inventory (Pulver et al., 1995), which is an authorized adapta-tion of the NEO Personality Inventory (Costa and McCrae, 1985; Costa and McCrae, 1992), and of which about one-quarter are substitutes for the original American items. A shortened version of this inventory was presented at age 42 by selecting those items that corresponded to the items in the NEO-FF1 (Costa and McCrae, 1989, 1992). It included 60 items (12 items for each trait) such as “I like to have lot of people around me” for extraversion. Individuals were asked to rate to what extent they agreed with each statement on a five-point scale (1 = strongly disagree, 5 = strongly agree). The mean scores of all 12 statements for each trait were calculated and used as indicators of the strength of the traits in an individual. Adjectives like anxious, self-pitying, tense, and worrying de-scribe an individual high in neuroticism; active, assertive, enthusiastic, and out-going describe an individual high in extraversion; generous, kind, sympathetic, and trusting describe an individual high in agreeableness; organized, planful, reliable, and responsible describe an individual high in conscientiousness; and artistic, curious, imaginative, and wide interests describe an individual high in openness to experience (Caspi, 1998: 317). Each of these factors consists of a num-ber of more specific facets.

62
TABLE 1 Descriptive statistics by the highest level of post comprehensive education. (N = 203)
Vocational course
(ISCED level 2)
Vocational education
(ISCED level 3)
Upper vocation-al education
(ISCED level 5B)
University edu-cation (ISCED
levels 5A and 6) N 36 78 63 26 Women 30.6 % 34.6 % 74.6 % 61.5 % Average annual income (€)
19110 (10165)
20859 (10143)
24894 (14609)
42804 (34386)
GPA
7.0 (.70)
7.0 (.71)
7.5 (.77)
8.1 (.72)
Years of work experience
20.8 (5.98)
19.6 (5.41)
18.4 (3.76)
18.0 (3.84)
Duration of un employment (months)
22.8 (36.71)
17.0 (33.93)
6.5 (10.35)
3.7 (7.53)
Stability of working career
- stable 69.4 % 78.2 % 79.4 % 84.6 % - changeable 8.3 % 1.3 % 7.9 % 15.4 % - unstable 22.2 % 20.5 % 12.7 % 0 % Number of employment contracts
5.6 (5.5)
5.3 (4.1)
5.2 (2.7)
5.5 (4.0)
Occupation - blue-collar - lower white- collar - upper white- collar
55.6 % 33.3 %
11.1 %
55.1 % 38.5 %
6.4 %
3.2 %
66.7 %
30.2 %
0 %
11.5 %
88.5 %
Standard deviations are shown in parentheses. Table 2 tabulates the correlations between personality traits and different la-bour market outcomes. Some interesting points arise from the table. First, a higher score in neuroticism was positively related to an unstable working career, unemployment and thus fewer years of work experience. In addition, the corre-lation between neuroticism and annual labour market income was negative, and individuals who scored higher in neuroticism were also less likely to work in upper white-collar occupations. In contrast, extraversion was negatively re-lated to unstable work career and unemployment, and had a positive correla-tion with annual income and the probability of working in upper white-collar occupation. Significant positive correlations also existed between conscien-tiousness and a stable work career as well as between consciousness and annual income. A negative correlation, on the other hand, appeared between conscien-tiousness and duration of unemployment as well as conscientiousness and blue-collar occupation indicator. Similarly, individuals with higher scores in agreea-bleness were less likely to work in blue-collar occupations. Finally, openness to experiences correlated positively with higher occupation and was negatively associated with years of work experience.

63
TABLE 2 Correlations between personality traits (at age 42) and labour market outcomes. (N = 203) Neuroticism Extraver-
sion Agreeable-
ness Conscien-tiousness
Openness to new experi-
ences Stability of working career - stable - changeable - unstable
-0.23*** -0.03
0.28***
0.03 0.17** -0.14**
-0.06 0.15** -0.03
0.13* -0.11 -0.08
-0.08 0.08 0.04
Years of work experience
-0.23*** 0.15** -0.05 0.09 -0.13*
Cumulative duration of unemployment
0.23*** -0.16** -0.11 -0.19*** -0.06
Annual income
-0.27*** 0.22*** 0.01 0.16** 0.09
Occupation - blue-collar - lower white-collar - upper white-collar
0.16** 0.14**
-0.33***
-0.17**
0.01 0.18**
-0.14**
0.09 0.05
-0.18***
0.09 0.09
-0.26***
0.08 0.19***
Significant at * 10 %, ** 5 %, *** 1 % level.
3.2.1 Child personality characteristics
Children’s personality characteristics, usually conceptualized as temperaments, precede adult personality traits: personality traits develop out of the evolution-arily conserved temperament systems (Evans & Rothbart, 2009). When the lon-gitudinal study (JYLS) was begun in the 1960’s with 8-year-old participants, the Big Five framework was not available and there was no consensus about the number of personality or temperament traits and their measurement. However, proxies of two temperament dimensions, reactivity and self-regulation, later included into the theory on children’s temperament (Rothbart & Bates, 1998), were then assessed in terms of activity (versus passivity) and high (versus low) self-control, respectively (see Pulkkinen, 1995). Pulkkinen (Pitkänen, 1969) formed a two-dimensional framework on the basis of these dimensions and de-fined four behavioural patterns such as aggressive behaviour (high activity and low self-control), and constructiveness (high activity and high self-control). Later Rothbart and her colleagues (Rothbart et al., 2001) determined three di-mensions of child temperament, namely extraversion (surgency), effortful con-trol, and negative affectivity.39 They have associations with the Big Five person-
39 Extraversion (or surgency) covers the child’s tendencies toward high activity, approach
to other people and new things, positive anticipation, and expression of positive emo-tions; negative affectivity covers the child’s tendencies toward fear, sadness, and frus-
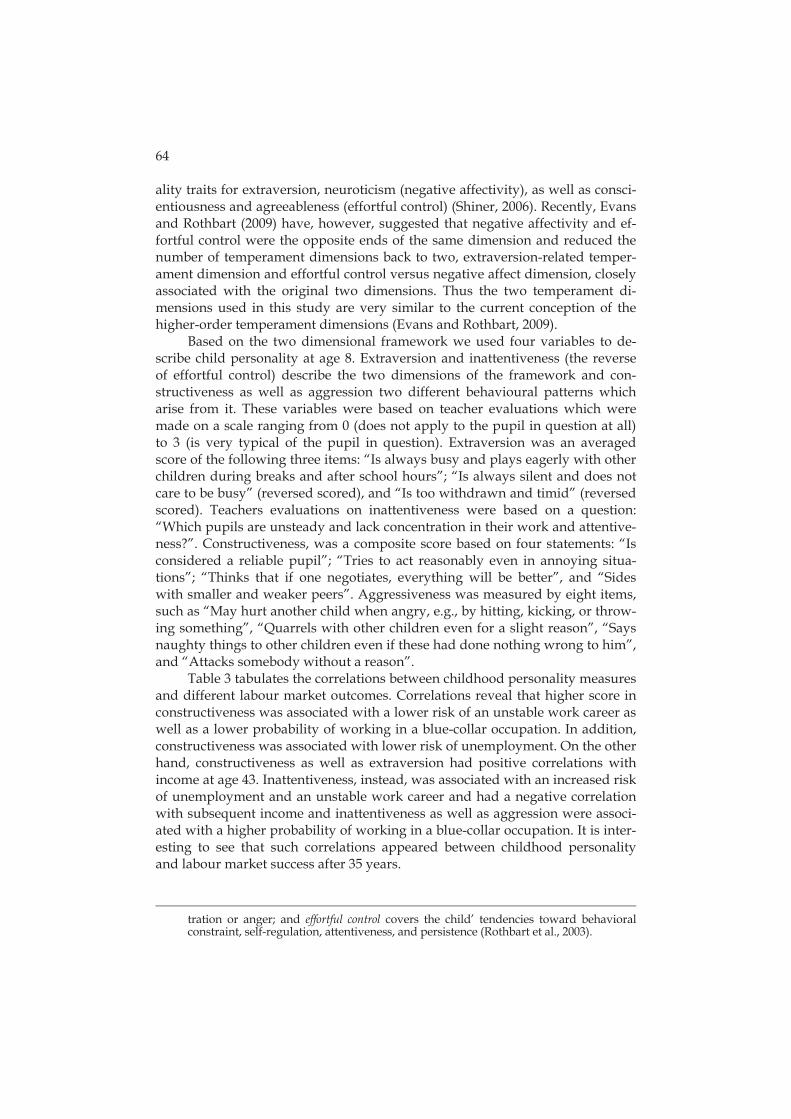
64
ality traits for extraversion, neuroticism (negative affectivity), as well as consci-entiousness and agreeableness (effortful control) (Shiner, 2006). Recently, Evans and Rothbart (2009) have, however, suggested that negative affectivity and ef-fortful control were the opposite ends of the same dimension and reduced the number of temperament dimensions back to two, extraversion-related temper-ament dimension and effortful control versus negative affect dimension, closely associated with the original two dimensions. Thus the two temperament di-mensions used in this study are very similar to the current conception of the higher-order temperament dimensions (Evans and Rothbart, 2009).
Based on the two dimensional framework we used four variables to de-scribe child personality at age 8. Extraversion and inattentiveness (the reverse of effortful control) describe the two dimensions of the framework and con-structiveness as well as aggression two different behavioural patterns which arise from it. These variables were based on teacher evaluations which were made on a scale ranging from 0 (does not apply to the pupil in question at all) to 3 (is very typical of the pupil in question). Extraversion was an averaged score of the following three items: “Is always busy and plays eagerly with other children during breaks and after school hours”; “Is always silent and does not care to be busy” (reversed scored), and “Is too withdrawn and timid” (reversed scored). Teachers evaluations on inattentiveness were based on a question: “Which pupils are unsteady and lack concentration in their work and attentive-ness?”. Constructiveness, was a composite score based on four statements: “Is considered a reliable pupil”; “Tries to act reasonably even in annoying situa-tions”; “Thinks that if one negotiates, everything will be better”, and “Sides with smaller and weaker peers”. Aggressiveness was measured by eight items, such as “May hurt another child when angry, e.g., by hitting, kicking, or throw-ing something”, “Quarrels with other children even for a slight reason”, “Says naughty things to other children even if these had done nothing wrong to him”, and “Attacks somebody without a reason”.
Table 3 tabulates the correlations between childhood personality measures and different labour market outcomes. Correlations reveal that higher score in constructiveness was associated with a lower risk of an unstable work career as well as a lower probability of working in a blue-collar occupation. In addition, constructiveness was associated with lower risk of unemployment. On the other hand, constructiveness as well as extraversion had positive correlations with income at age 43. Inattentiveness, instead, was associated with an increased risk of unemployment and an unstable work career and had a negative correlation with subsequent income and inattentiveness as well as aggression were associ-ated with a higher probability of working in a blue-collar occupation. It is inter-esting to see that such correlations appeared between childhood personality and labour market success after 35 years.
tration or anger; and effortful control covers the child’ tendencies toward behavioral constraint, self-regulation, attentiveness, and persistence (Rothbart et al., 2003).

65
TABLE 3 Correlations between personality variables at age 8 and labour market out comes. (N = 243) Extraversion Inattentive-
ness Aggression Construc-
tiveness Stability of working career - stable - changeable - unstable
-0.04 0.09 -0.02
-0.14** -0.05
0.19***
-0.05 -0.06 0.10
0.10 0.10
-0.18***
Years of work experience
0.0002 -0.05 0.04 0.10
Duration of unemployment
-0.06 0.15** 0.08 -0.20***
Annual income
0.15** -0.18*** -0.001 0.22***
Occupation - blue-collar - white-collar - upper white-collar
-0.12* -0.05
0.19***
0.32*** -0.18***-0.15**
0.27*** -0.22***
-0.04
-0.31***0.15** 0.16**
Significant at * 10 %, ** 5 %, *** 1 % level.
3.3 Personality and labour market income: empirical results
Mueller and Plug (2006) distinguished three ways which individual characteris-tics may matter for earnings. First, individual characteristics can be seen as qualities, which contribute to an individual’s productivity. Some characteristics may increase a worker’s productivity, which translates into higher earnings. Second, individual characteristics may influence the occupational and career choices of an individual, and thereby affect earnings. Third, individual charac-teristics may influence earnings via discrimination. Certain characteristics might help with career building, although they do not have effect on the indi-vidual’s productivity as such.
In this study we illustrate and examine the role of personality on labour market income by three different approaches. First, we estimate how personali-ty traits, measured at age 42, are related to subsequent income. Then we exam-ine whether the results change if we use personality traits measured at age 33. Finally, we test whether child personality, measured at age 8, is associated with income 35 years afterwards.
We examine the role of personality on labour market income using a vari-ant of Mincer’s (1974) human capital earnings function. In this model the log of individual income is regressed on education, work experience, personality, and other personal characteristics. The model is of the form
(1) ,log 2
210 εδγββαβ ++++++= ZPXXSy

66
where y refers to annual income, S refers to level of education, X is years of work experience, P is a vector of personality characteristics (the Big Five or child personality measures), and Z denotes a vector of other variables affecting earnings, including various individual and workplace characteristics. is a ran-dom error term with white noise properties.
3.3.1 Labour market income and personality traits in adulthood
We begin to illustrate the connections between personality and income by using personality traits measured at age 42. The results are tabulated in Table 4. In the first specification the log of annual income is regressed on the Big Five person-ality traits (column 1). In the second specification (column 2) we extend the earnings equation to include education and work experience variables. The third specification (column 3) reports the results of the most parsimonious spec-ification.
The results of column (1) of Table 4 indicate that before controlling for ed-ucation and work history, neuroticism was significantly associated with lower income, a one standard deviation increase in neuroticism being associated with a 16 percent decrease in income. 40 Otherwise the personality variables were insignificant. When the education and work experience variables were included in the regression (column 2), the explanatory power of the model increases sig-nificantly. In this specification none of the personality variables turned out sig-nificant and the F-test suggests that the personality trait variables as a whole were not statistically different from zero. Column 3 reports the results of the specification obtained by the general-to-simple approach (Hendry, 1995).41
The results (column 3) indicate that a higher level of education increased income. Compared to individuals with comprehensive education, those with vocational, upper vocational, and university education had 26, 46 and 77 per cent higher income, respectively.42 Individuals in upper white-collar occupa-tions had 26 per cent higher earnings compared to individuals in blue-collar and lower white-collar occupations. The gender wage gap was about 18 per cent, an unstable work career was associated with about 37 per cent reduction in annual income, and experienced unemployment, in turn, decreased income by about 21 per cent.
Extraversion entered the specification with statistically significant estimate a one standard deviation increase in the score for extraversion being associated with an increase of about 9 per cent in annual income. This result is in line with previous studies in which withdrawal, which can be considered as the opposite 40 This x-standardized coefficient has been calculated afterwards (see e.g. Long, 1997: 16-17). 41 The total list of explanatory variables is in Appendix 1. At this point the child per- sonality measures or the Big Five personality traits measured at age 33 were not included in the model. 42 For a discussion on the interpretation of the coefficients of dummy variables when the dependent variable is log-transformed see Halvorsen and Palmquist (1980) and Kennedy (1981).
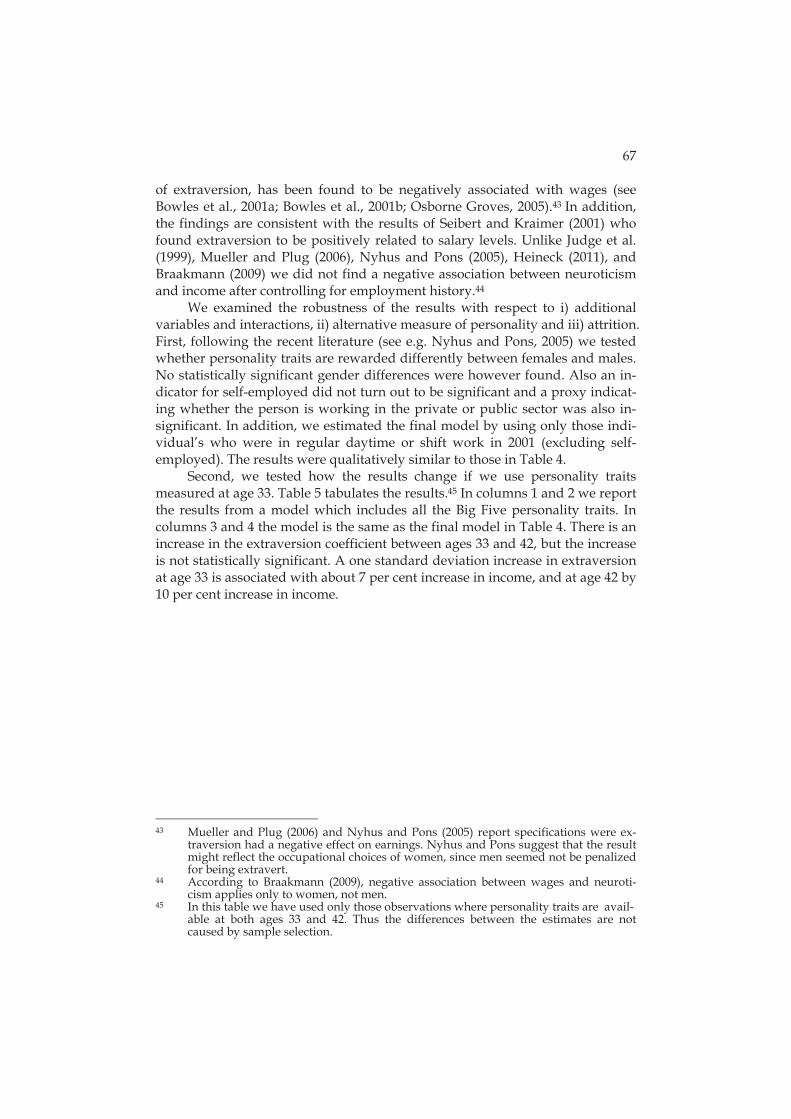
67
of extraversion, has been found to be negatively associated with wages (see Bowles et al., 2001a; Bowles et al., 2001b; Osborne Groves, 2005).43 In addition, the findings are consistent with the results of Seibert and Kraimer (2001) who found extraversion to be positively related to salary levels. Unlike Judge et al. (1999), Mueller and Plug (2006), Nyhus and Pons (2005), Heineck (2011), and Braakmann (2009) we did not find a negative association between neuroticism and income after controlling for employment history.44
We examined the robustness of the results with respect to i) additional variables and interactions, ii) alternative measure of personality and iii) attrition. First, following the recent literature (see e.g. Nyhus and Pons, 2005) we tested whether personality traits are rewarded differently between females and males. No statistically significant gender differences were however found. Also an in-dicator for self-employed did not turn out to be significant and a proxy indicat-ing whether the person is working in the private or public sector was also in-significant. In addition, we estimated the final model by using only those indi-vidual’s who were in regular daytime or shift work in 2001 (excluding self-employed). The results were qualitatively similar to those in Table 4.
Second, we tested how the results change if we use personality traits measured at age 33. Table 5 tabulates the results.45 In columns 1 and 2 we report the results from a model which includes all the Big Five personality traits. In columns 3 and 4 the model is the same as the final model in Table 4. There is an increase in the extraversion coefficient between ages 33 and 42, but the increase is not statistically significant. A one standard deviation increase in extraversion at age 33 is associated with about 7 per cent increase in income, and at age 42 by 10 per cent increase in income.
43 Mueller and Plug (2006) and Nyhus and Pons (2005) report specifications were ex-
traversion had a negative effect on earnings. Nyhus and Pons suggest that the result might reflect the occupational choices of women, since men seemed not be penalized for being extravert.
44 According to Braakmann (2009), negative association between wages and neuroti- cism applies only to women, not men. 45 In this table we have used only those observations where personality traits are avail- able at both ages 33 and 42. Thus the differences between the estimates are not caused by sample selection.

68
TABLE 4 Estimates from income regression (personality traits measured at age 42).
(1) Personality traits
(2) Employment history
(3) Final
Intercept 10.187*** (0.733)
8.549*** (0.775)
9.380*** (0.319)
Neuroticism -0.228** (0.089)
-0.100 (0.084)
Extraversion 0.112
(0.113) 0.113
(0.105) 0.158* (0.084)
Openness to experiences -0.005 (0.104)
-0.102 (0.102)
Agreeableness -0.117 (0.109)
-0.006 (0.100)
Conscientiousness 0.090 (0.103)
0.009 (0.095)
Level of education (compre-hensive)
- Vocational education 0.368*** (0.141)
0.241* (0.135)
- Upper vocational education 0.591*** (0.154)
0.389** (0.151)
- university education 1.066*** (0.188)
0.595*** (0.212)
Years of work experience 0.0784* (0.046)
Years of work experience^2 -0.001 (0.001)
Female -0.108 (0.109)
-0.191* (0.107)
Stability of working career (stable) - unstable
-0.448*** (0.119)
Unemployment spells at ages 15-42 (no unemployment spells)
-0.230** (0.105)
Occupational status: Upper white-collar
0.238* (0.142)
Adj. R-squared 0.047 0.224 0.252
N 203 203 203 The dependent variable is log annual labour market income. Standard errors are shown in parentheses. Significant at * 10 %, ** 5 %, *** 1 % level. Since the changeable and unstable work career coefficients were close to one another, we combined these two variables into a single variable indicating an unstable work career. This restriction cannot be rejected by the data.

69
TABLE 5 OLS results using personality measures at different ages. (1)
Personality measured at
age 33
(2) Personality measured at
age 42
(3) Personality measured at
age 33
(4) Personality measured at
age 42 Intercept
9.901*** (0.785)
9.766*** (0.762)
9.430*** (0.347)
9.240*** (0.344)
Neuroticism
-0.174* (0.091)
-0.191** (0.091)
Extraversion
0.117 (0.114)
0.126 (0.117)
0.127 (0.095)
0.177* (0.091)
Openness to experiences
-0.027 (0.108)
0.020 (0.100)
Agreeableness
-0.049 (0.111)
-0.090 (0.107)
Conscientiousness
0.096 (0.105)
0.118 (0.101)
Level of education (compre-hensive )
- vocational education
0.282** (0.138)
0.318** (0.139)
- upper vocational education
0.364** (0.155)
0.386** (0.155)
- university education
0.451** (0.226)
0.503** (0.227)
Female
-0.160 (0.114)
-0.161 (0.113)
Stability of working career (stable) - unstable
-0.396*** (0.126)
-0.374*** (0.125)
Unemployment spells at ages 15-42 (no unemploy-ment spells)
-0.222** (0.107)
-0.228** (0.106)
Occupational status: upper white-collar
0.377** (0.148)
0.343** (0.149)
Adj. R-squared 0.023 0.044 0.218 0.226
N 184 184 184 184 The dependent variable is log annual labour market income at age 43. Standard errors are shown in parentheses. Significant at * 10 %, ** 5 %, *** 1 % level.
Finally, we analysed how attrition affects the results. Because of missing infor-mation the sample size in Table 4 is smaller than the total sample of 2001. We tested the randomness of this attrition by using a two-sample test of propor-tions. The results support the hypothesis that attrition is random. 46
46 The two-group test of proportions in Stata 10.0 was used to test whether the pro-
portions of the following variables were equal in the 2001 sample and in the sub-sample used in Table 4: gender, family’s socioeconomic status in 1968 (3 dummy var-iables), level of education (4 dummy variables), and stability of work career (3 dum-my variables). These variables were used because they were available for all individ-uals in both the 2001 sample and the sub-sample. Rejection of the null hypothesis would indicate non random attrition.
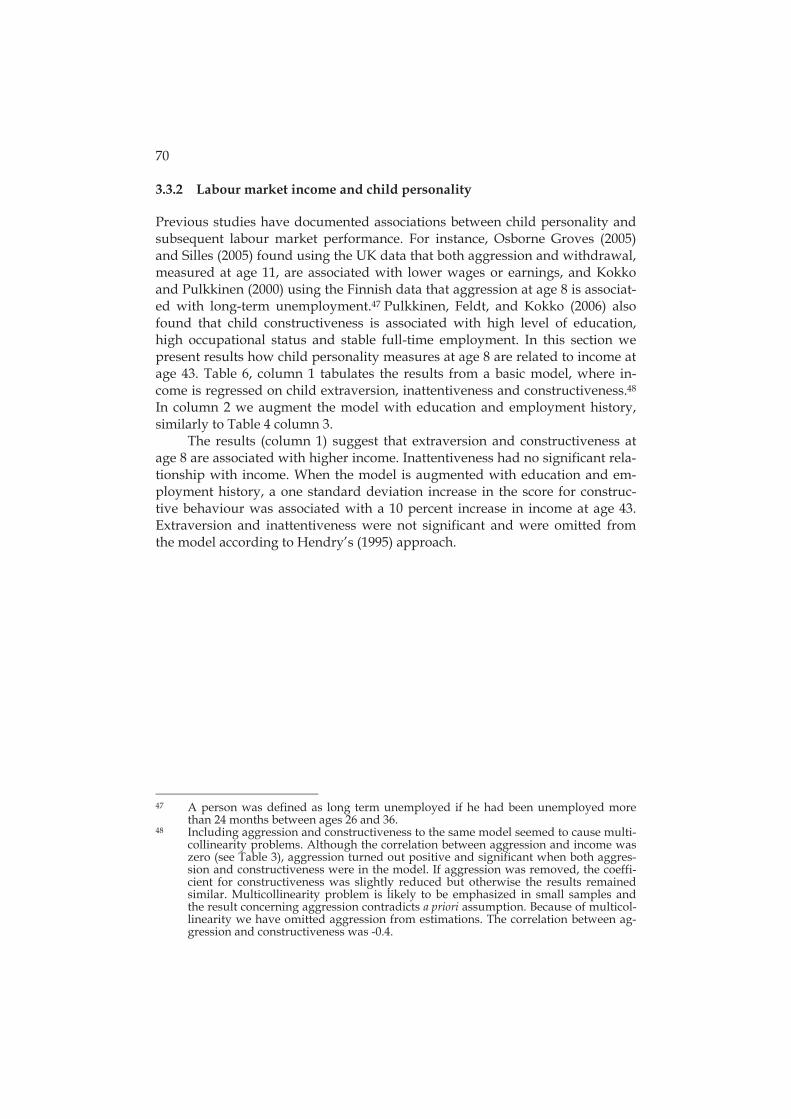
70
3.3.2 Labour market income and child personality
Previous studies have documented associations between child personality and subsequent labour market performance. For instance, Osborne Groves (2005) and Silles (2005) found using the UK data that both aggression and withdrawal, measured at age 11, are associated with lower wages or earnings, and Kokko and Pulkkinen (2000) using the Finnish data that aggression at age 8 is associat-ed with long-term unemployment.47 Pulkkinen, Feldt, and Kokko (2006) also found that child constructiveness is associated with high level of education, high occupational status and stable full-time employment. In this section we present results how child personality measures at age 8 are related to income at age 43. Table 6, column 1 tabulates the results from a basic model, where in-come is regressed on child extraversion, inattentiveness and constructiveness.48 In column 2 we augment the model with education and employment history, similarly to Table 4 column 3. The results (column 1) suggest that extraversion and constructiveness at age 8 are associated with higher income. Inattentiveness had no significant rela-tionship with income. When the model is augmented with education and em-ployment history, a one standard deviation increase in the score for construc-tive behaviour was associated with a 10 percent increase in income at age 43. Extraversion and inattentiveness were not significant and were omitted from the model according to Hendry’s (1995) approach.
47 A person was defined as long term unemployed if he had been unemployed more than 24 months between ages 26 and 36. 48 Including aggression and constructiveness to the same model seemed to cause multi-
collinearity problems. Although the correlation between aggression and income was zero (see Table 3), aggression turned out positive and significant when both aggres-sion and constructiveness were in the model. If aggression was removed, the coeffi-cient for constructiveness was slightly reduced but otherwise the results remained similar. Multicollinearity problem is likely to be emphasized in small samples and the result concerning aggression contradicts a priori assumption. Because of multicol-linearity we have omitted aggression from estimations. The correlation between ag-gression and constructiveness was -0.4.

71
TABLE 6 Estimates from income regression (personality traits measured at age 8).
(1) Personality
(2) Final
Intercept 9.538*** (0.173)
9.745*** (0.142)
Extraversion 0.114* (0.066)
Inattentiveness -0.089 (0.062)
Constructiveness 0.138* (0.073)
0.131** (0.057)
Level of education (comprehensive) - vocational education 0.211*
(0.114) - upper vocational education 0.323**
(0.131) - university education 0.451**
(0.180) Female -0.196**
(0.095) Stability of working career (stable) - unstable
-0.524*** (0.101)
Unemployment spells at ages 15-42 (no unemployment spells)
-0.182** (0.091)
Occupation: Upper white-collar
0.282** (0.125)
Adj. R-squared 0.053 0.280 N 243 243
The dependent variable is log annual labour market income at age 43. Standard errors are shown in parentheses. Significant at * 10 %, ** 5 %, *** 1 % level.
3.4 Conclusions
In this article we studied the association of personality with labour market in-come. The empirical analysis was based on the Jyväskylä Longitudinal Study of Personality and Social Development (JYLS), which provides data on individuals’ personality from ages 8, 33 and 42 as well as information on work experience from age 15 to 42. The JYLS study began in 1968 when 12 complete school clas-ses were selected to the sample. Although attrition has occurred in the sample over the years, comparison of the participants and non-participants at age 42 in 2001 indicated that the participants continued to be representative of the origi-nal random sample and the Finnish age-cohort of 1959. Compared to other studies on personality and earnings, our study is exceptional by its broad scope and the 35-year follow-up.
In line with previous studies this article showed that personality does mat-ter when it comes to success in working life. The results indicated that a one

72
standard deviation increase in extraversion at age 42 was associated with about 9 per cent increase in income after controlling for education and work related variables. This result were in line with the results of Bowles et al. (2001a, b) and Osborne Groves (2005), who report that withdrawal, the opposite of extraver-sion, has negative association with wages. Unlike Judge et al. (1999), Mueller and Plug (2006), Nyhus and Pons (2005), and Heineck (2011) we did not find a negative association between neuroticism and income after carefully controlling for employment history.
What is exceptional in the present study is that we were able to examine whether already child personality, measured before any labour market experi-ences, is associated with income. According to our results the relationship be-tween personality and income is very far-reaching since even child personality has associations with income 35 years afterwards. Active and well-controlled social behaviour, labelled as constructiveness, measured as early as at age 8, had a positive association with income so that a one standard deviation increase in constructiveness was related to a 10 per cent increase in income.
In previous economic literature there has been a great deal of discussion about potential endogeneity of personality (see e.g. Osborne Groves, 2005; Mueller and Plug, 2006; Heineck, 2011). Endogeneity in econometrical sense emerges if personality is shaped by success or failure in the labour market (see Stock and Watson, 2003). This would cause the estimated effects of personality to be overstated. Much effort has been made in psychological research to study the stability of the Big Five personality traits, and based on rank order stability measures, the personality traits seem highly stable in adulthood (Rantanen et al., 2007).49 This does not, of course, prove that the endogeneity bias is absent (for counterarguments see e.g. Sutin et al. 2009). Within the limits of this data, it is difficult to find a satisfactory solution to the endogeneity problem. However, as Mueller and Plug (2006) argue, it is appropriate to interpret the estimates, such as ours, as the upper bounds of true personality effects. In addition the links between personality in childhood and income in adulthood give support to the conclusion that personality matters for the labour market success. The mecha-nisms through which child personality exerts its influence on later income mer-its further research.
49 Rank order stability refers to the change in the ordinal ranking of a trait in popula-
tion.

73
References
Adreoni J. & Petrie R. (2008) Beauty, gender and stereotypes: Evidence from laboratory experiments, Journal of Economic Psychology, 29, 73-93.
Blackburn M. L. & Neumark D. (1992) Observed ability, efficiency wages and inter-industry wage differentials, The Quarterly Journal of Economics, 107(4), 1421-1436.
Bowles S., Gintis H. & Osborne M. (2001a) Incentive-enhancing preferences: Personality, behavior, and earnings, American Economic Review, 91(2), 155-158.
Bowles S., Gintis H. & Osborne M. (2001b) The determinants of earnings: A behavioral approach, Journal of Economic Literature, 39(4), 1137-1176.
Braakmann N. (2009) The role of psychological traits for the gender gap in full-time employment and wages: Evidence from Germany, SOEPpapers 162.
Burch G. & Anderson N. (2009) Personality at Work. In Corr P. J. & Matthews G. (Eds.) The Cambridge Handbook of Personality Psychology, Cambridge, UK: Cambridge University Press, 748-763.
Card D. (1999) The causal effect of education on earning. In Ashenfelter O. & Card, D. (Eds.) Handbook of Labor Economics 3A, Amsterdam: Elsevier, 1801-1863.
Case A. & Paxton C. (2006) Stature and status: height, ability, and labor market outcomes, NBER Working Paper No. 12466.
Caspi A. (1998) Personality development across the life course. In Damon W. (series ed.) & Eisenberg N. (vol. ed.) Handbook of Child Psychology: Vol. 3. Social, Emotional, and Personality Development (5th ed.), New York, NY: Wiley, 311-388.
Cawley J. (2007) The Labour Market Impact of Obesity. In Acs Z. J. & Lyles, A. (eds.) Obesity, Business, and Public Policy, Northampton, MA: Edward Elgar Publishers, pp. 76-87.
Cebi M. (2007) Locus of control and human capital investment revisited, Journal of Human Resources, 42(4), 919-932.
Costa P. T. Jr. & McCrae R. R. (1992) Revised NEO Personality Inventory (NEO-PI-R) and NEO Five-Factor Inventory (NEO-FFI) Professional Manual, Odessa, FL: Psychological Assessment Resources.
Costa P. T. Jr. & McCrae R. R. (1989) The NEO/NEO-FFI Manual Supplement, Odessa, FL: Psychological Assessment Resources.
Costa P. T. Jr. & McCrae R. R. (1985) The NEO Personality Inventory Manual, Odessa, FL: Psychological Assessment Resources. Dudley N. M., Orvis K. A., Lebiecki J. E. & Cortina J. M. (2006) A meta-analytic
investigation of conscientiousness in the prediction of job performance: Examining the intercorrelations and the incremental validity of narrow traits, Journal of Applied Psychology, 91(1), 40-57.
Evans D. E. & Rothbart M. K. (2009) A two-factor model of temperament, Personality and Individual Differences, 47, 565-570.
74
Fortin N. M. (2008) The gender wage gap among young adults in the United States, The Journal of Human Resources, 43(4), 884-918. Griliches Z. (1977) Estimating the returns to schooling: Some econometric
problems, Econometrica, 45, 1-22. Halvorsen R. & Palmquist P. (1980) The interpretation of dummy variables in
semi-logarithmic equations, American Economic Review, 70(3), 474-475. Hamermesh D. S. & Biddle J. E. (1994) Beauty and the labor market, The
American Economic Review, 84(5), 1174-1194. Heckman J. J., Stixrud J. & Urzua S. (2006) The effects of cognitive and non-
cognitive abilities on labor market outcomes and social behavior, Journal of Labor Economics, 24(31), 411-482.
Heckman J. & Vytlacil E. (2001) Identifying the role of cognitive ability in explaining the level of and change in the return to schooling, Review of Economics and Statistics, 83, 1-12.
Heineck, G. (2011) Does it pay to be nice? Personality and earnings in the United Kingdom. Industrial and Labor Relations Review, 64(5), 1020-1038.
Heineck, G. & Anger, S. (2010) The returns to cognitive abilities and personality traits in Germany, Labour Economics, 17, 535-546.
Hendry D. F. (1995) Dynamic Econometrics (Advanced Texts in Econometrics), Oxford: Oxford University Press.
Johansson Å. (2006) Wage setting in Finland: Increasing flexibility in centralized wage agreements, Economics Department Working Paper No. 503, Paris: OECD.
Judge T. A., Higgins C. A., Thorensen C. J. & Barrick M. R. (1999) The Big Five personality traits, general mental ability, and career success across the life span, Personnel Psychology, 52(3), 621-652.
Kennedy P. E. (1981) Estimation with correctly interpreted dummy variables in semi-logarithmic equations, American Economic Review, 71(4), 801.
Kokko K. & Pulkkinen L. (2000) Aggression in childhood and long-term unemployment in adulthood: A cycle of maladaptation and some protective factors, Developmental Psychology, 36(4), 463-472.
Long J. S. (1997) Regression Models for Categorical and Limited Dependent Variables. Advanced Quantitative Techniques in the Social Sciences Series: 7, Thousand Oaks (Calif.): SAGE.
Mincer J. (1974) Schooling, Earnings and Experience, New York: Colombia University Press.
Mueller G. & Plug E. (2006) 'Estimating the effect of personality on male and female earnings, Industrial and Labour Relations Review, 60(1), 3-22.
Nandi A. & Nicoletti C. (2009) Explaining personality pay gaps in the UK, ISER Working Paper No 2009-22.
Nyhus E. K. & Pons E. (2005) The effects of personality on earnings, Journal of Economic Psychology, 26, 363-384.
Osborne Groves M. (2005) How important is your personality? Labor market returns to personality for women in the US and UK, Journal of Economic Psychology, 26, 827-841.

75
Pitkänen L. (1969) A descriptive model of aggression and nonaggression with applications to children's behaviour, Jyväskylä Studies in Education, Psychology and Social Research, Nr. 19, University of Jyväskylä, Finland.
Pulkkinen L. (2006) The Jyväskylä Longitudinal Study of Personality and Social Development' in Pulkkinen L., Kaprio J. and Rose R. J. (Eds.) Socioemotional Development and Health from Adolescence to Adulthood, New York: Cambridge University Press, 29-55.
Pulkkinen L. (1995). Behavioral precursors to accidents and resulting physical impairment, Child Development, 66, 1660-1679.
Pulkkinen L., Feldt T. & Kokko K. (2006) Adaptive behavior in childhood as an antecedent of psychological functioning in early middle age: Linkage via career orientation, Social Indicators Research, 77, 171-195.
Pulkkinen L., Fyrstén S., Kinnunen U., Kinnunen M-L., Pitkänen T. & Kokko K. (2003) 40+ Erään ikäluokan selviytymistarina [40+ A Story of the Resilience of an Age Cohort Group], Reports from the Department of Psychology, University of Jyväskylä, No 349. (In Finnish).
Pulkkinen L., Ohranen M. & Tolvanen A. (1999) Personality antecedents of career orientation and stability among women compared to men, Journal of Vocational Behavior, 54, 37-58.
Pulver A., Allik J., Pulkkinen L. & Hämäläinen M. (1995) A Big Five personality inventory in two non-Indo-European languages, European Journal of Personality, 9, 109-124.
Rantanen J., Metsäpelto R.-L., Feldt T., Pulkkinen L. & Kokko K. (2007) Long-term stability in the Big Five personality traits in adulthood, Scandinavian Journal of Psychology, 48(6), 511-518.
Rothbart M. K., Ahadi S. A., Hershey K. L. & Fisher P. (2001) Investigations of temperament at three to seven years: The children’s behavior questionnaire, Child Development, 72, 1394-1408.
Rothbart M. K. & Bates J. E. (1998) Temperament' in Damon W. (series ed.) and Eisenberg N. (vol. ed.) Handbook of Child Psychology: Vol. 3. Social,
Emotional and Personality Development 5th ed., New York: Wiley, 105-176.
Rothbart M. K., Ellis L. K., Rueda M. R. & Posner M. I. (2003) Developing mechanisms of temperamental effortful control, Journal of Personality, 71, 1113-1144.
Seibert S. E. & Kraimer M. L. (2001) The five-factor model of personality and career success, Journal of Vocational Behavior, 58, 1-21.
Semykina A. & Linz S. J. (2007) Gender differences in personality and earnings: Evidence from Russia, Journal of Economic Psychology, 28, 387-410.
Shiner R. L. (2006) Temperament and personality in childhood. In Mroczek D. K. and Little T. D. (Eds.) Handbook of Personality Development, Mahwah, NJ: Lawrence Erlbaum, 213-230.
Silles M. (2005) Personality, education and earinings, CAM working paper 2005-06.
76
Stock J. H. & Watson M. W. (2003) Introduction to Econometrics. Boston, MA: Addison Wesley.
Sutin A. R., Costa Jr P. T., Miech R. & Eaton W. W. (2009) Personality and career success: Concurrent and longitudinal relations, European Journal of Personality, 23, 71-84.
Tobias J. L. (2003) Are returns to schooling concentrated among the most able? A semiparametric analysis of the ability-earnings relationships, Oxford Bulletin of Economics and Statistics, 62(1), 1-29.
Tokar D. M., Fischer A. R. & Subich L. M. (1998) Personality and vocational behavior: A selective review of the literature, 1993–1997, Journal of Vocational Behavior, 53, 115-153.
Uusitalo R. (2005) Do centralized bargains lead to wage moderation? Time-series evidence from finland. In Piekkola, H. and Snellman, K. (Eds.) Collective Bargaining and Wage Formation: Performance and Challenges, Heidelberg: Physica-Verlag, 121-132.
Uusitalo R. (1999) Return to Education in Finland, Labour Economics, 6(4), 569-580.
Waddell, G. R. (2006) Labor-market consequences of poor attitude and low self-esteem in youth, Economic Enquiry, 44, 69-97.

77
Appendix A
Description of variables. The number of observations is the same as in Table 4 (n = 203) unless otherwise mentioned.
Variable Description Mean/ % (standard deviation)
Annual labour mar-ket income
Annual income refers to year 2002 and is based on information from tax authority regis-ters. In this register, labour market income refers to income from work, pensions, and other benefits, such as unemployment benefit.
24611.75 € ( 17955.97)
Gender Female Male
49.8 % 50.3 %
Stability of working career (Pulkkinen et al., 1999)
Information is based on the years 1996-2001 (ages 37-42) Stable work career: Working on one’s own field without repetitive interruptions due unemployment or having a career which has become stable during the first few years of the follow-up period Changeable working career: Individuals who have moved from work to occupational training, those whose work situa-tion has suddenly become unstable, or those who have removed themselves from working life to care for children. Unstable working career: Individuals, whose jobs had varied and for the most part did not correspond to their field and those who had been unemployed. Women who have been on maternity leave, but who have returned to their jobs after the leave, are coded as having a stable career.
77.8 %
6.4 %
15.8 %
Cumulative duration of unemployment
Total duration of unemployment in months between ages 15-42. The data were collected at age 42. Where necessary, the data was checked using data collected earlier at ages 27 and 36.
13.1 (27.6)
Years of work expe-rience
Total years of work experience between ages 15-42. The data are based on Life History Cal-endar which was filled out by the participants together with the interviewer at age 42.
19.2 (4.9)
(Continues)

78
Variable Description Mean/ % (standard deviation)
Number of employ-ment contracts
Number of full-time jobs between ages 15-42 excluding summer jobs while still at school.
5.3 (4.0)
Occupational status
Blue-collar (e.g., cleaners and factory workers) Lower white-collar (e.g., nurses and technicians)Upper white-collar (e.g., managers, physicians)
32.0 % 42.9 % 25.1 %
Highest level of edu-cation completed
Vocational course (ISCED level 2): Vocational course refers to a short course after comprehensive education (ISCED level 2), which gives basic skills for vocational occupations. Compared to vocational education (ISCED level 3) these courses are much shorter, less extensive and not diploma-oriented. This group also in-cludes those with only comprehensive education (ISCED level 2) and those who have not com-pleted even comprehensive education, which is compulsory. Vocational education (ISCED level 3): Vocational education refers to upper secondary level vocational education. Upper vocational education (ISCED level 5B): Upper vocational education refers to lower first stage tertiary education, vocational programme. University education (ISCED level 5A and 6): University education to higher first stage and second stage of tertiary education.
17.7 %
38.4 %
31.0 %
12.8 %
Marital Status at age 42
Married (includes those who have been married at least once) Never married
80.3 %
19.7 %
Number of children at the age 42
Zero 1 or more
12.8 % 87.2 %
GPA Grade point average at age 14. Grades range between 4 and 10, 4 meaning failed and 10 indi-cating the highest possible grade. The data has been collected from school archives.
7.3 (0.82)
(Continues)

79
Variable Description Mean/ %
(standard deviation) Personality traits (Rantanen, Metsä-pelto, Feldt, Pulkki-nen and Kokko, 2007)
Neuroticism Extraversion Openness to new experiences Agreeableness Conscientiousness The traits are measured on a 5-point scale (1-5), where 1 indicates a low and 5 a high score in the trait in question. The reliabilities, assessed by Cronbach’s alpha, of the personality traits at age 42 were as fol-lows: Neuroticism .83 for women and .90 for men; Extraversion .76 and .83; Agreeable-ness .79 for both genders; Conscientious-ness .79 for women and .76 for men; and Openness .81 for women and .75 for men.
2.3 (.69) 3.2 (.57) 3.3 (.57) 3.6 (.52) 3.7 (.53)
Child constructi-veness (n = 243)
Constuctiveness at age 8 is based on teacher’s assessment (0 (min) – 3 (max). It is an average score of four items: 1) Is considered a reliable pupil, 2) Tries to act reasonably even in annoy-ing situations, 3) Thinks that if one negotiates, everything will go better, 4) Sides with smaller and weaker peers.
1.35 (.76)
Child inattenti-veness (n = 243)
Inattentiveness at age 8 is based on teacher’s assessment (0 (min) – 3 (max) on a question: “Which pupils are unsteady and lack concen-tration in their work and attentiveness?”
.71 (.89)
Child extraversion (n = 243)
Extraversion at age 8 is based on teacher’s assessment (0 (min) – 3 (max). It is an average score of three statements: 1) Is always busy and plays eagerly with other children during breaks and after school hours, 2) Is always silent and does not care to be busy (reversed scored), 3) Is too withdrawn and timid” (re-versed scored).
2.07 (.72)
Child aggression (n = 243)
Aggression at age 8 is based on teacher’s as-sessment (0 (min) – 3 (max). It is an average score of eight items such as “May hurt another child when angry, e.g., by hitting, kicking, or throwing something”, “Quarrels with other children even for a slight reason”, “Says naughty things to other children even if these had done nothing wrong to him”, and “At-tacks somebody without a reason”.
.45 (.54)
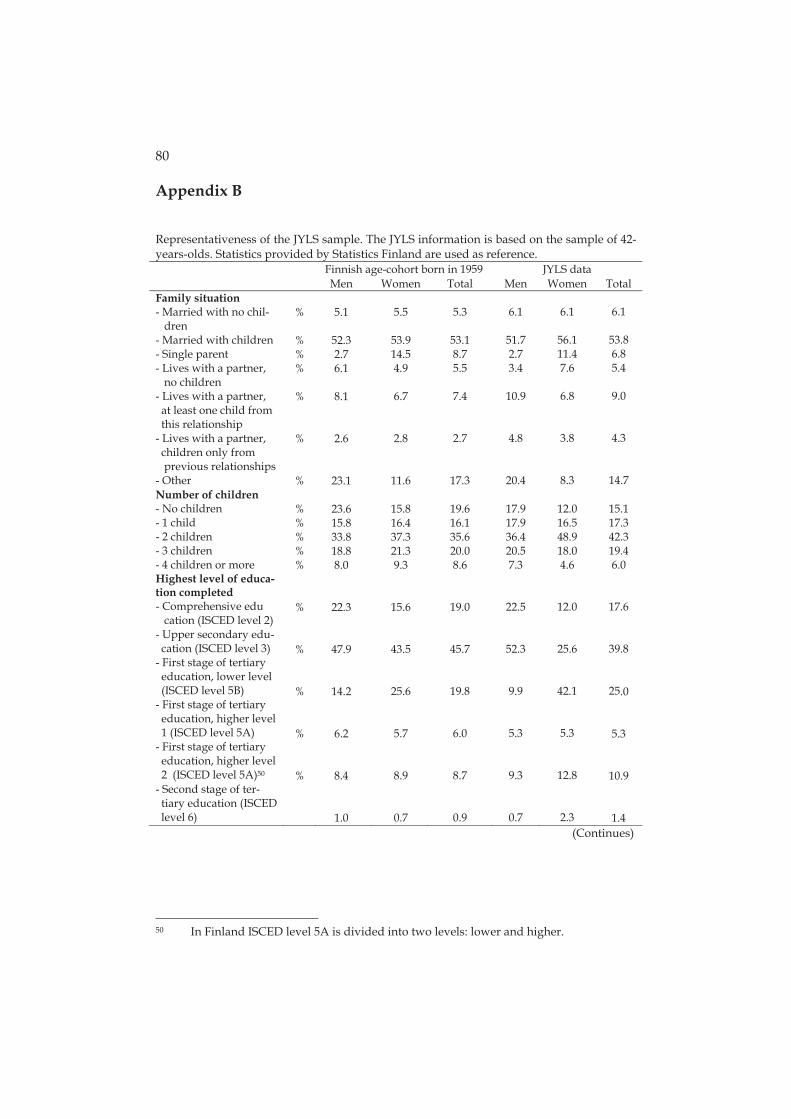
80
Appendix B
Representativeness of the JYLS sample. The JYLS information is based on the sample of 42-years-olds. Statistics provided by Statistics Finland are used as reference. Finnish age-cohort born in 1959 JYLS data Men Women Total Men Women Total Family situation - Married with no chil- dren - Married with children - Single parent - Lives with a partner, no children - Lives with a partner, at least one child from this relationship - Lives with a partner, children only from previous relationships - Other
%
% % %
%
%
%
5.1
52.3 2.7 6.1
8.1
2.6
23.1
5.5
53.9 14.5 4.9
6.7
2.8
11.6
5.3
53.1 8.7 5.5
7.4
2.7
17.3
6.1
51.7 2.7 3.4
10.9
4.8
20.4
6.1
56.1 11.4 7.6
6.8
3.8
8.3
6.1
53.8 6.8 5.4
9.0
4.3
14.7 Number of children - No children - 1 child - 2 children - 3 children - 4 children or more
% % % % %
23.6 15.8 33.8 18.8 8.0
15.8 16.4 37.3 21.3 9.3
19.6 16.1 35.6 20.0 8.6
17.9 17.9 36.4 20.5 7.3
12.0 16.5 48.9 18.0 4.6
15.1 17.3 42.3 19.4 6.0
Highest level of educa-tion completed - Comprehensive edu cation (ISCED level 2) - Upper secondary edu- cation (ISCED level 3) - First stage of tertiary education, lower level (ISCED level 5B) - First stage of tertiary education, higher level 1 (ISCED level 5A) - First stage of tertiary education, higher level 2 (ISCED level 5A)50 - Second stage of ter- tiary education (ISCED level 6)
%
%
%
%
%
22.3
47.9
14.2
6.2
8.4
1.0
15.6
43.5
25.6
5.7
8.9
0.7
19.0
45.7
19.8
6.0
8.7
0.9
22.5
52.3
9.9
5.3
9.3
0.7
12.0
25.6
42.1
5.3
12.8
2.3
17.6
39.8
25.0
5.3
10.9
1.4 (Continues)
50 In Finland ISCED level 5A is divided into two levels: lower and higher.
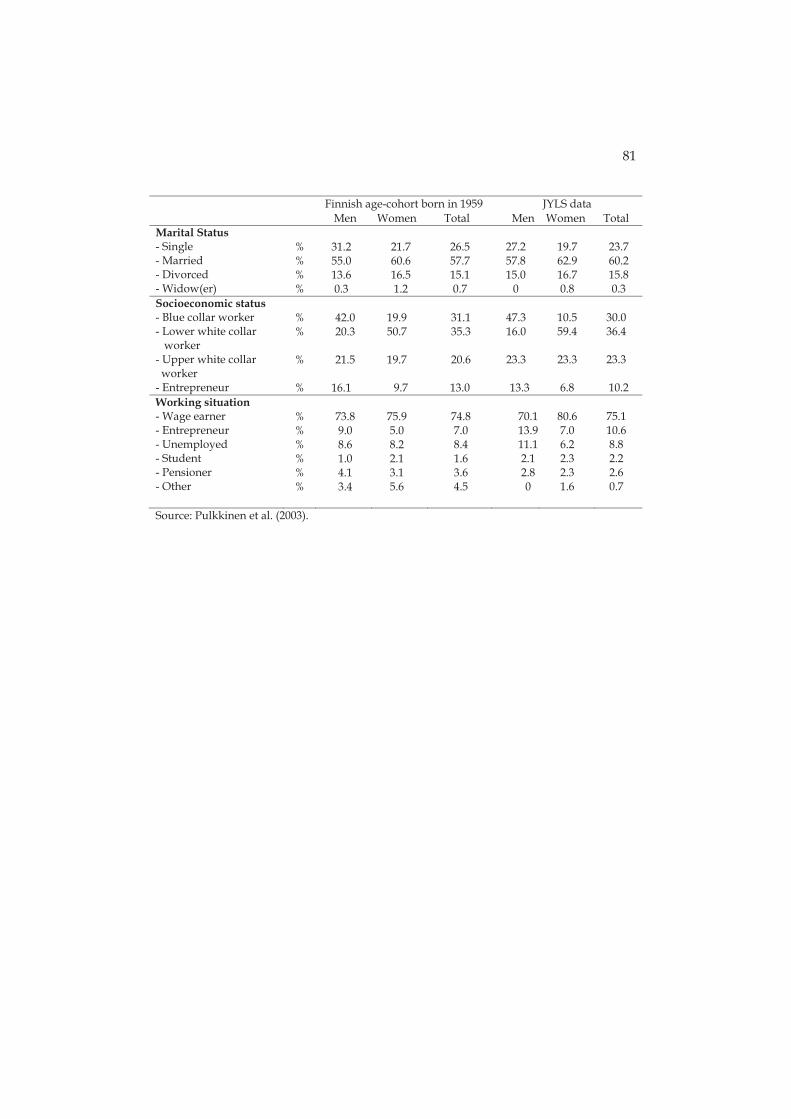
81
Finnish age-cohort born in 1959 JYLS data Men Women Total Men Women Total Marital Status - Single - Married - Divorced - Widow(er)
% % % %
31.2 55.0 13.6 0.3
21.7 60.6 16.5 1.2
26.5 57.7 15.1 0.7
27.2 57.8 15.0
0
19.7 62.9 16.7 0.8
23.7 60.2 15.8 0.3
Socioeconomic status - Blue collar worker - Lower white collar worker - Upper white collar worker - Entrepreneur
% %
%
%
42.0 20.3
21.5
16.1
19.9 50.7
19.7
9.7
31.1 35.3
20.6
13.0
47.3 16.0
23.3
13.3
10.5 59.4
23.3
6.8
30.0 36.4
23.3
10.2
Working situation - Wage earner - Entrepreneur - Unemployed - Student - Pensioner - Other
% % % % % %
73.8 9.0 8.6 1.0 4.1 3.4
75.9 5.0 8.2 2.1 3.1 5.6
74.8 7.0 8.4 1.6 3.6 4.5
70.1 13.9 11.1 2.1 2.8 0
80.6 7.0 6.2 2.3 2.3 1.6
75.1 10.6 8.8 2.2 2.6 0.7
Source: Pulkkinen et al. (2003).

4 PERSONALITY TRAITS AND UNEMPLOYMENT: EVIDENCE FROM LONGITUDINAL DATA51
ABSTRACT. This study contributes to the literature on how personality is re-lated to labour market success by providing evidence on the relationship be-tween personality traits and unemployment. Our results suggest that higher score in openness was associated with increased cumulative unemployment at the prime working age. It seems that this connection occurs because individuals with higher scores of openness enter into unemployment spells more frequently - not because their unemployment spells would be particularly long. The results also suggest that neuroticism was associated with longer durations of single unemployment spells, but this result might be at least partly driven by reverse causality.
4.1 Introduction
Previous studies in psychology have shown that personality characteristics are related to labour market performance such as earnings, vocational interests, job performance, and career success (e.g., Burch & Anderson, 2009; Seibert & Kraimer, 2001; Tokar et al., 1998). In addition, sociologists have written exten-sively about the role of noncognitive skills in predicting a worker’s occupation-al attainment and wages (for a review, e.g., Farkas, 2003). Recently, the im-portance of personality characteristics in relation to labour market success has received increasing interest in the field of economics. Empirical studies have shown that personality characteristics are related to a wide range of labour
51 This paper was written together with Katja Kokko and it is in referee process. I
would like to thank Professor Lea Pulkkinen, Professor Jaakko Pehkonen, Professor Ari Hyytinen, Professor Jari Vainiomäki and anonymous referees for their helpful comments and suggestions.

83
market outcomes, such as schooling decisions, occupational choices, labour force participation, employment, and unemployment (for a review, e.g., Almlund et al., 2011).
This paper adds to the currently scarce economic evidence on the relation-ship between personality traits and unemployment. We use unique data drawn from the Jyväskylä Longitudinal Study of Personality and Social Development (JYLS) (Pulkkinen, 2009), which provides information on sample individuals’ personalities and work careers between the ages of 15 and 50. In line with many previous economic and psychological studies, we use the well-established Big Five personality taxonomy (Costa & McCrae, 1985) to describe adult personality traits (for economic applications, e.g., Braakmann, 2009; Heineck, 2011; Mueller & Plug, 2006; Nyhus & Pons, 2005; Uysal & Pohlmeier, 2011; Wichert & Pohl-meier, 2010). What is exceptional in this study is that we use information about personality characteristics at several different time points (ages 8, 33, 42 and 50) and unemployment information between the ages of 15 and 50. This allows us to examine the potential reverse causality and errors-in-variables problems which might be related to personality measures. The links between personality traits and unemployment were analysed from three different perspectives: first, how personality traits are related to the cumulative duration of unemployment between the ages of 33 and 50; second, how personality traits are linked to the number of unemployment spells between the ages of 33 and 50; and third, how personality traits are related to the durations of single unemployment spells.
The remainder of this paper is organised as follows. Section 2 reviews some of the previous studies conducted on this topic. Section 3 describes the data we used in detail, providing descriptive statistics about the relationship between unemployment and personality traits. In section 4, we examine wheth-er reverse causality and errors-in-variables are likely to cause problems in esti-mations, and then we report the results concerning the relationship between personality traits and unemployment. Section 5 concludes the paper.
4.2 How are personality characteristics related to unemployment?
One method that can be employed to categorise the causes affecting the proba-bility and the duration of unemployment is to use the following three catego-ries: 1) institutions (e.g., unemployment insurance system, employment protec-tion legislation), 2) economic environment (e.g., the unemployment rate), and 3) individual-related factors such as educational attainment and work experience. Even though labour economists attempt to control for these factors, unobserved heterogeneity remains, and the failure to take this kind of heterogeneity into account leads to an omitted-variables bias. Recent empirical studies in econom-ics provide evidence that, as a part of this unobserved heterogeneity, personali-ty characteristics might be related to unemployment. Uysal and Pohlmeier (2011) concluded that, of the Big Five personality traits, conscientiousness had a positive impact on the probability of finding a job, while neuroticism had a con-

84
trasting negative impact. For women and workers with a personal migration background, openness also eased their job searches. Feinstein (2000) found that moving from the 20th to 80th percentile of the boys’ anti-social disorder range at age ten increased the probability of experiencing an unemployment episode of more than four months by age of twenty-six; in contrast, extrovert boys are much less likely to experience unemployment. Among unemployed males, a higher level of self-esteem was associated with a lower probability of long-term unemployment (i.e., unemployment lasting more than 12 months). Female un-employment, on the other hand, seems to depend more on poor peer relations and inattentiveness measured at age ten, and girls with a high level of self-esteem were more likely to have long periods of unemployment. In contrast, Gallo, et al. (2003) found that an internal locus of control was associated with a higher probability of reemployment following a job loss. Furthermore, psycho-logical literature provides evidence on the connection between personality characteristics and unemployment (e.g., Caspi et al., 1998; Ferguson et al., 1997; Kokko & Pulkkinen, 2000; Kokko, Pulkkinen & Puustinen, 2000).
Previous studies also suggest that personality characteristics likely have relation to job search intensity, reservation wages and therefore unemployment duration. Caliendo, Cobb-Clark and Uhlendorff (2010) found that, a higher in-ternal locus of control was associated with an increased reservation wage and an increase in the number of job applications submitted. Similarly McGee (2010) found that young men with internal locus of control search more intensively and set higher reservation wages than their external peers but both of these groups spend more time unemployed than individuals with average locus of control. According to McGee this is because “internals” hold out for excessively high wages whereas “externals” search too little. DellaVigna and Paserman (2005) further show empirical evidence, which suggests, that impatience is re-lated to lower job search efforts while the effect on reservation wages and reemployment wages was zero. Therefore, increases in impatience lead to lower unemployment exit rates.
Mueller and Plug (2006) distinguished three alternative ways in which personality might matter in the labour market, and their categorisation schema can also be applied to those who are unemployed. The categorisation of Mueller and Plug is as follows. 1) Differences in skills: personality can be seen as a set of qualities, all of which contribute to productivity. As far as these qualities can be signalled to potential employers, certain personality aspects might increase or decrease the probability of receiving a job offer. Similarly, personality-related skills might affect the probability of losing a job. 2) Differences in preferences: personality might be linked to preferences, such as attitudes towards leisure and job search efforts. It is also possible that individuals with certain personali-ty characteristics work in occupations or sectors in which the probability of un-employment is higher or lower than average. 3) Labour market discrimination: certain characteristics might affect, for instance, the frequency of job offers or the probability of dismissal, although such characteristics do not affect the indi-vidual’s actual competence or productivity.

85
Previous studies suggest that at least the first two explanations are likely to account for individuals’ differences in experienced unemployment. Tokar et al. (1998) and Burch and Anderson (2009) review articles that have found con-nections between personality, job performance and productivity, suggesting that personality characteristics can be seen as skills. Supporting the second ex-planation, studies which concentrate on personality and job searching (Calien-do et al., 2010; DellaVigna & Paserman, 2005; McGee, 2010) have commonly found that personality traits are related to both job seeking behaviour and res-ervation wages (and thus the duration of unemployment). In addition, there is evidence that personality characteristics are related to labour market participa-tion (e.g., Mohanty, 2010; Wichert & Pohlmeier, 2009). Furthermore, empirical evidence also suggests that personality traits are likely to affect occupational choices (e.g., Barrick & Mount, 1991; Heckman, Stixrud & Urzua, 2006; Cobb-Clark & Tan, 2009; Antecol and Cobb-Clark, 2010). For example, leadership studies suggest that extraversion, in particular, is positively related to leader-ship (Burch & Anderson, 2009: 754-755). Regarding the third explanation, Mo-hanty (2010) interestingly finds, using US data, that an applicant’s optimism has positive effects on employer’s hiring decision. However, whether this is due to positive discrimination or because optimism increases productivity is not dis-cussed in Mohanty’s paper.
The usual premise in economic literature is that personality characteristics affect labour market outcomes, such as earnings and unemployment. However, it is also possible that personality characteristics are shaped by success or fail-ure in the labour market; thus, the causal relationship between personality characteristics and labour market outcomes is ambiguous. The potential for re-verse causality is repeatedly highlighted in the literature (e.g., Borghans et al., 2008); unfortunately, data limitations tend to make it impossible to empirically examine or to correct for the potential reverse causality. The problem of poten-tial reverse causality or simultaneity bias is often overcome by assuming that personality characteristics, particularly the Big Five personality traits, are stable during adulthood. This assumption is convenient because it implies that per-sonality traits are exogenous and not driven by a given outcome variable, so personality traits can be measured even after the outcome variable (Cobb-Clark & Schurer, 2011). Another typical way of overcoming the problem of reverse causality in estimations is to use personality measures, which were obtained before the labour market outcome of interest (i.e., lagged personality measures). Unfortunately, both of these solutions are problematic. First, as will be dis-cussed next, we cannot assume that personality traits are stable. Second, the use of lagged personality traits does not necessarily eliminate the possibility of re-verse causality because it is possible that previous labour market experiences have already shaped personality characteristics. Furthermore, if personality traits and the outcome variable were measured at different times, changes in personality would cause an errors-in-variables bias in the estimates.
The extensive psychological literature concerning the stability of the Big Five personality traits (for a recent review, e.g., Specht et al., 2011) focuses on

86
two different stability measures: 1) mean level stability, the change over time in absolute levels of a trait; and 2) rank order stability, the change in the ordinal ranking of a trait in a population. Despite the existence of multiple studies on this topic, there is still no consensus on the stability of the Big Five personality traits. Studies concerning the mean level stability show either that the traits sta-bilise after age 30 (e.g., Costa & McCrae, 1994; McCrae & Costa, 2006) or, based on a significant amount of evidence, that the traits do change through midlife and that these changes are more than trivial (e.g., Srivastava et al. 2003; Roberts et al., 2006; Specht et al., 2011). In regards to the rank order stability of the per-sonality traits, according to a meta-analysis by Roberts and DelVecchio (2000), the stability consistently increases from childhood to age 30 and then stabilises between the ages of 50 to 70 years. It is also possible that rank-order stability follows a quadratic function (inverted U-form) with a peak at age 50 and a de-crease afterwards, as suggested by Ardelt (2000). Specht et al. (2011) also found that, whereas conscientiousness showed continuously increasing rank-order stability across adulthood, the other Big Five personality traits followed an in-verted U-shaped function reaching a peak between the ages of 40 and 60 and then decreasing afterwards. Furthermore, in the JYLS, considerable rank-order stability (ranging from 0.65 to 0.97) in the Big Five traits has been observed from the age of 33 to 42 years (Rantanen et al., 2007).
Although we would agree that personality characteristics change, this does not necessarily mean that reverse causality exists. We must determine why these changes occur and what are the major causes underlying these processes. The early related psychological studies conducted in the 1930s found that un-employed individuals, especially the long-term unemployed, reported an in-creasing level of psychological symptoms compared to their employed coun-terparts (Jahoda et al., 1933/1972; Bakke, 1933). According to the traditional view, unemployment is an agent causing these symptoms (the “exposure” or “social causation” hypothesis). Recently, also Agerbo et al. (2010) provide eco-nomic evidence that higher rate of unemployment is followed by higher inflow of first admission into psychiatric hospitals. Also their individual level analysis shows that unemployment in preceding years leads to higher probability of an individual being admitted for the first time to a psychiatric hospitals. The other explanation is that prior psychological symptoms might increase the probability of a person becoming unemployed (the “selection” or “drift” hypothesis). De-spite the existence of a number of studies on this topic, there is still no consen-sus in the psychology field on which of the two explanations is more promising in explaining the observed relationship between unemployment and psycho-logical distress. Thus far, there has been a tendency to believe that the exposure hypothesis is the more prominently accepted explanation. Quite recently how-ever, there has been increasingly more evidence supporting the selection hy-pothesis (Kokko, 2006: 307-308).
In the concept of the Big Five, the question of why the level of personality traits might change is also debatable: the essentialist perspective focuses on ge-netic factors (intrinsic maturation); the contextualist perspective focuses on en-

87
vironmental factors such as social roles and major life events; whereas the transactional perspective is a combination of the first two (Specht et al., 2011). McCrae and Costa (2008) state that life events have very little effect on personal-ity traits, while Bleidorn et al. (2009) showed in a longitudinal twin study that changes in personality can be substantially attributed to both genetic factors and environmental factors. In this study, we are particularly interested in dis-covering whether unemployment affects personality traits, which would lead to the aforementioned problem of reverse causality. According to Specht et al. (2011), the impact of unemployment on the Big Five personality traits is modest; unemployment slightly decreased the mean level of openness, but this result was significant only at the 10 % level. Unemployment also led to a decrease in the rank order stability of openness and emotional stability. Related to this lit-erature, Sutin and Costa (2010) found that personality traits shaped occupation-al experiences, but occupational experiences had minimal impact on personality traits. Furthermore, Sutin, Costa, Miech and Eaton (2009) showed that, among young individuals, a higher baseline of income predicted decreases in neuroti-cism.
4.3 Longitudinal data and descriptive statistics
The longitudinal data used in the empirical part of this study were drawn from the Jyväskylä Longitudinal Study of Personality and Social Development (JYLS), conducted by Pulkkinen (see Pitkänen, 1969; Pulkkinen, 2009). This study be-gan in 1968 when 12 entire school classes from the Jyväskylä area were random-ly selected; the initial attrition rate was zero. The 369 children of the initial sample were born in 1959, and in 1968, they were 8 years old and in the second grade. The sample represented approximately 40 percent of the second graders in the area. Since 1968, data have been gathered at ages 14 (1974), 20 (1980), 27 (1986), 33 (1992), 36 (1995), 42 (2001), and 50 (2009).
At age 8, the main methods of data collection were teacher ratings and peer nominations, whereas in adulthood, questionnaires and personal inter-views were used. The dataset provides information (among other things) on educational attainment, unemployment, and personality. The data on unem-ployment were obtained from Life History Calendars, adapted from Caspi et al. (1996), which were filled out by the participants together with their interview-ers at ages 42 and 50.52 In addition, the participants filled out Life Situation Questionnaires at ages 27, 36, 42 and 50, at which times information about un-employment was inquired. These different data sources were used to ensure the 52 The participants filled out a Life History calendar at ages 42 and 50 where different life events (rows in the calendar) such as family events, education and employ- ment/unemployment history were recorded annually. For each event, the interview- er recorded the age at which it started, its continuation (if relevant) and the age when it finished.

88
reliability of the data. The child personality characteristics were measured at age 8, and they were based on teachers’ ratings. The seven child personality characteristics measured are constructiveness, anxiety, emotional stability, ag-gression, compliance, anxiety, emotional lability and social activity, and they were measured using between 1 and 8 items. The adult personality was meas-ured at ages 33, 42 and 50 by using a shortened version (with 60 items) of the Big Five Personality Inventory (Pulver et al., 1995), which is an authorised Finn-ish adaption of Costa and McCrae’s (1985) NEO Personal Inventory (NEO-PI) and in which approximately one-tenth of the items are substitutes for the origi-nal American items. The Big Five consists of five personality traits: openness to new experienc-es, conscientiousness, extraversion, agreeableness, and neuroticism. In the shortened version, each of these traits contains 12 items such as “I like to have lot of people around me” for extraversion. Eight items are substitutes for the original American items to reflect differences in culture and society. Individuals were asked to rate the extent to which they agreed with each statement on a five-point scale (1 = strongly disagree, 5 = strongly agree). The mean scores of all 12 items for each trait were calculated and used as indicators of the strength of the traits in an individual. The reliabilities of the personality traits at age 33, assessed by Cronbach’s alpha, were as follows: Neuroticism, 0.86 for men and 0.85 for women; Extraversion, 0.84 for men and 0.70 for women; Openness, 0.78 for both genders; Agreeableness, 0.79 for men and 0.77 for women; and Consci-entiousness, 0.75 for men and 0.78 for women.53 Adjectives such as artistic, cu-rious, imaginative, and wide interests describe an individual who exhibits a high level of openness to experience; organised, planful, reliable, and responsi-ble describe an individual high in conscientiousness; active, assertive, enthusi-astic, and outgoing describe an individual high in extraversion; generous, kind, sympathetic, and trusting describe an individual high in agreeableness; and anxious, self-pitying, tense, and worrying describe an individual high in neu-roticism (Caspi, 1998: 317). Each of these factors consists of a number of more specific facets.
The participation rate of the JYLS has remained high over the years (Pulk-kinen & Kokko, 2012). At age 50, the participation rate was 84 % (n=271; calcu-lated from the initial sample of 369 children excluding those participants who had died, n=12, and declined entirely from the study, n=34). The retention rate calculated from the initial sample was 73 %. Regarding attrition over the years, a comparison of the participants and non-participants at age 42 (in 2001) and 50 (in 2009) revealed that the participants continued to represent the initial ran-
53 At age 42, the Cronbach’s alphas were as follows: Neuroticism, 0.83 for women and 0.90 for men; Extraversion, 0.76 for women and 0.83 for men; Agreeableness, 0.79 for both genders; Conscientiousness, 0.79 for women and 0.76 for men; and Openness, 0.81 for women and 0.75 for men. At age 50, the Cronbach’s alphas were as follows: Neuroticism, 0.77 for women and 0.78 for men; Extraversion, 0.78 for women and 0.80 for men; Agreeableness, 0.73 for women and 0.75 for men; Conscientiousness, 0.78 for women and 0.80 for men; and Openness, 0.77 for women and 0.72 for men.

89
dom sample in terms of socioemotional behaviour in childhood and school achievement in adolescence (Pulkkinen, 2006; Pulkkinen & Kokko, 2010). Fur-thermore, they were representative of the Finnish age-cohort born in 1959 with respect to (for example) marital status, number of children, employment, and unemployment according to the statistics provided by Statistics Finland. In terms of educational attainment, the male participants did not differ from their age cohort group; female participants in turn had a vocational college education (e.g., nurse, ISCED level 5B) in a slightly higher percentage than did females in their age cohort group within the general population. Both in the age cohort group and the present sample, women had a higher level of education than men: although more men than women had vocational education (ISCED level 3), more women than men had upper vocational education (ISCED level 5B). No significant gender difference existed in higher education. Due to missing in-formation in several core variables, the subsample we used in this study (n=151) was smaller than the total sample of 2001 (n=285) and of 2009 (n=271). For these 151 individuals, there was information regarding the Big Five personality traits at ages 33, 42, and 50 as well as information regarding all of the background variables that were used in this study. In particular, we encountered infor-mation gaps concerning the Big Five personality traits at age 33, which were obtained by mailed questionnaires; therefore, the sample size used in this paper was smaller than the participation rates in general. We tested the randomness of this attrition by using a two-group test of proportions between the total sam-ple of 2001 and our subsample. According to our results, the attrition between the sample of 2001 and our estimation sample was mostly random. The only exceptions were gender and the stability of an individual’s work career: in our estimation sample, there were more females (57 %) compared to the sample from 2001 (47 %), and there were also more individuals with a stable work ca-reer in our sample (82 %) compared to the total sample from 2001 (74 %).
Figure 1 and Table 1 illustrate the differences in personality traits at age 33 between individuals who did and did not experience unemployment between the ages of 33 and 50. Figure 1 graphs the kernel density estimates of personali-ty measures by employment status, whereas Table 1 tabulates the means and standard deviations as well as t-test p-values for the equality of means and the Kolmogorov-Smirnov p-values for the equality of distributions. According to Figure 1 and Table 1, the distributions of personality traits were mostly similar among those who did and did not experience unemployment between the ages of 33 and 50. The only exceptions were openness and conscientiousness; the mean level and standard deviation of openness were higher among those who had experienced unemployment, whereas the mean score of conscientiousness was higher while the standard deviation of conscientiousness was lower among those who had not experienced unemployment.

90
FIGURE 1 Distribution of the Big Five personality traits at age 33 in the sample by em- ployment status at ages 33-50.
TABLE 1 Means and distributions of the Big Five personality traits at age 33 by em-ployment status at ages 33-50.
Non-unemployed Unemployed t-test
p-value
Kolmogorov-Smirnov p-value
Mean SD Mean SD Openness 3.179 0.517 3.337 0.593 0.092 0.011 Conscientiousness 3.657 0.459 3.496 0.606 0.069 0.090 Extraversion 3.243 0.482 3.138 0.494 0.208 0.304 Agreeableness 3.533 0.459 3.452 0.596 0.357 0.153 Neuroticism 2.561 0.600 2.671 0.700 0.311 0.717 Number of indi-viduals 98 53
Table 2 further illustrates the relationships between the Big Five personality traits and unemployment by tabulating the correlations between them. We used three different measures for unemployment: the cumulative duration of unem-ployment between the ages of 33 and 50 (column 1), the number of unemploy-ment spells between the ages of 33 and 50 (column 2), and the durations of sin-gle unemployment spells between the ages of 33 and 50 (column 3). The cumu-lative duration of unemployment is a function of the number of unemployment

91
spells and the durations of single unemployment spells. In columns 1 and 2, personality traits were measured at age 33, while in column 3, personality traits were measured at age 33 if an unemployment spell started between the ages of 33 and 41; if the unemployment spell started later, personality traits were measured at age 42.54 An unemployment spell was considered as ended irre-spective of the reason for the unemployment exit. For example, besides re-employment, the reason for an unemployment exit may have been to pursue further education. Overall, only a few of the correlations were statistically sig-nificant. Agreeableness had negative correlations with the duration of cumula-tive unemployment and extraversion had a negative correlation while neuroti-cism a positive correlation with the durations of single unemployment spells. TABLE 2 Correlations between personality traits and unemployment between ages 33 and 50.
(1) Cumulative dura-
tion of unem-ployment
(2) Number of unem-ployment spells
(3) Durations of single
unemployment spells
Openness 0.103 0.115 0.028
Conscientiousness -0.066 -0.033 -0.084
Extraversion -0.130 -0.108 -0.168**
Agreeableness -0.196** -0.090 -0.096
Neuroticism 0.091 0.111 0.151**
N 151 170 Significant at * 10 %, ** 5 %, *** 1 % level.
The number of observations in Table 2 is the same as in Tables 4-6. Note that in column (3) one individual can have multiple unemployment spells but this was not taken into account in the correlations. In columns 1 and 2, the personality traits were measured at age 33, while in column 3, the personality traits were obtained at age 33 if the unemployment spell started between ages 33 and 41 and at age 42 if the unemployment spell started later.
54 Unemployment information was gathered at ages 42 (ages 33-42) and 50 (ages 42-50). For some individuals, however, the unemployment information was missing for one or the other time span. To increase the number of observations, we have also used the individuals with (partly) missing information in models where the durations of single unemployment spells were used as the dependent variable. In models where the dependent variable was cumulative, unemployment or the number of unem- ployment spells only for individuals with non-missing unemployment information were included in estimations. In columns (1) and (2), zero observations were also used in the analysis.
92
4.4 Evidence on personality traits and subsequent unemployment
4.4.1 Stability of personality traits and reverse causality
In section 2, we discussed the potential reverse causality problem. This section empirically examines to what extent reverse causality is likely to affect our re-sults when using JYLS. To reduce the problem of reverse causality, we used lagged measures of personality traits in this study (i.e., personality measures that were obtained at age 33), meaning before the unemployment spells we fo-cus on. However, it is possible that previous unemployment has already affect-ed the lagged Big Five personality traits at age 33, which would induce the problem of reverse causality. To test this possibility, we estimated models in which each of the Big Five personality traits at age 33 was regressed on cumula-tive unemployment or the number of unemployment spells between the ages of 15 and 33 (U), with controls for education, occupation, gender and marital sta-tus measured at age 33 (X) as well as child personality characteristics at age 8 (C):
(1) qiiqiqiqqqi UCXP ,3315,8,33,33,, εθδβα ++++= − ,
In equation (1), i refers to an individual, q refers to the different personality traits, and ε is a stochastic error term. The results are tabulated in Appendix A. Overall, in Tables A.1 and A.2, the coefficients for previous unemployment were small and insignificant; however, in some of the model specifications, conscientiousness, agreeableness and neuroticism were significant. The effects of previous employment on neuroticism and extraversion were pronounced if we slightly increased the sample size (n = 167) by including those with no in-formation regarding their personality traits at ages 42 or 50 into our estimations. When doing so, neuroticism and extraversion were significant at least at the 10 percent level in all of the model specifications from Table A2. Thus, there is some evidence that previous unemployment might have affected personality traits at the age of 33.
To further illustrate the relationship between personality traits and unem-ployment, we also estimated models in which the change in the individual level of each of the Big Five personality traits between the ages of 33 and 50 was re-gressed on exogenous variables (X) and i) a dummy variable for individuals who had experienced at least one unemployment spell between the ages of 33 and 50; ii) the duration of cumulative unemployment between the ages of 33 and 50; or iii) the number of unemployment spells between the ages of 33 and 50. The results tabulated in Appendix A (Tables A.3-A.5) show, that the unem-ployment measure was marginally significant in only one spacification, where the change in neuroticism was regressed on a dummy for unemployed. Other-wise, the coefficients for the unemployment indicators were insignificant. This

93
finding suggests that, although unemployment at young ages might affect per-sonality traits, the impact of unemployment later in life regarding a change in personality traits is likely to be modest.
Another potential problem in lagged personality trait measures is the er-rors-in-variables bias, which occurs if personality traits change during the rele-vant time period (Almlund et al., 2011). In our case, errors in variables would be induced if a given unemployment spell started after the age of 33 and if the personality trait scores obtained at this time were different than those obtained at the age of 33. Although both mean level and rank order stability hold, the errors-in-variables problem cannot be ruled out. Rank order stability can hold even if the scores of the personality traits have changed. In addition, the mean level change could be zero even if there were changes in individuals’ trait scores: subsets of individual scores may be increasing and decreasing, thus off-setting each other’s changes and resulting in no mean level change (Roberts et al., 2006). 55 Instead of focusing on changes at the aggregate level, it is also pos-sible to concentrate on changes at the individual level by using the Reliable Change Index (RCI). The RCI assesses whether the change in a personality trait is of sufficient magnitude to be confident that the change is beyond what could be attributed to a measurement error. The RCI is calculated as follows (Jacobson & Truax, 1991):
(2) 2
33,,50,,
)(2 q
qiqi
S
PPRCI
−= , where )1(33, qqq rSDS −= .
In equation (2), qP refers to different personality trait q, i refers to an individual,
33,qSD is the standard deviation of the trait q at age 33, and r is a reliability measure, which is the Cronbach’s alpha in our case. If RCI is between -1.96 and 1.96, there is no significant change in an individual’s score in trait q. Otherwise, it is unlikely that the difference between test scores at the ages of 33 and 50 is due to a random measurement error, thus the change is reliable (p < 0.05). Table 3 tabulates the means and standard deviations of the Big Five personality traits
55 There can also be a measurement error, which is present at the time of measurement.
This measurement error can be attributed to two sources. First, individuals might have faulty knowledge of their inner states, and in addition, some individuals might be better self-reporters than others. Second, individuals might give a false personality picture, which is called “socially desirable responding” in psychology. Paulhus (1984) further divided this socially desirable responding into conscious “impression man-agement” and subconscious “self-deception”. Although these are both potential sources of measurement error, there is evidence that (for instance) a husband and wife show a relatively strong agreement on the subject’s (husband) score regarding the Big Five Factors – the only exception was neuroticism (Pervin & John, 2001). Fur-thermore, Li and Bagger (2006) find in their meta-analysis that impression manage-ment and self-deception did not create spurious effects on the relationship between personality measures and performance nor did these concepts function as perfor-mance predictors. For further discussion, see e.g. Pervin, 2003: 427-431.

94
at the ages of 33 and 50 and describes the mean-level change, rank-order stabil-ity and individual level change (RCI) between these ages. TABLE 3 Changes in personality traits between ages 33 and 50.
Mea
n at
age
33
(sd)
Mea
n at
age
50
(sd)
Stan
dard
ised
mea
n
leve
l cha
ngea
Ran
k or
der s
tabi
lityb
Individual level change (RCI)c
Dec
reas
ed
Stay
ed th
e sam
e
Incr
ease
d
Openness 3.23 3.21 -0.05 0.53 42 % 26 % 32 % (0.55) (0.55) (0.05) Conscientiousness 3.60 3.68 0.14 0.48 32 % 21 % 46 % (0.52) (0.53) (0.04) Extraversion 3.21 3.16 -0.08 0.41 46 % 17 % 36 % (0.49) (0.55) (0.05) Agreeableness 3.50 3.71 0.41 0.47 18 % 23 % 59 % (0.51) (0.47) (0.05) Neuroticism 2.60 2.30 -0.44 0.45 66 % 14 % 21 % (0.64) (0.68) (0.04)
N=151 aStandardised mean level change (i.e., Cohen’s d) using standard deviation obtained from pooled measures of personality traits at ages 33 and 50. bRank order stability is measured by Kendall’s tau-a with jackknife standard errors. cPercentage of individuals who decreased, stayed the same, or increased on each personality trait, according to the Reliable Change Index.
Table 3 shows that the greatest mean level changes occurred in neuroticism and agreeableness, which decreased and increased, respectively, by about 0.4 stand-ard deviations between the ages of 33 and 50. Rank order stability, measured by Kendall’s tau, was the highest for openness and the lowest for extraversion. For our purposes, however, RCI is probably more informative. Table 3 shows which percentage of individuals decreased, increased or stayed the same in each of the personality traits based on the RCI. According to the results, it was rather the rule than an exception that the personality trait scores changed be-tween the ages of 33 and 50. For instance, only 14 percent of individuals had no significant change in their scores of neuroticism, and the score of the most sta-ble personality trait, openness, remained the same only among 26 percent of the sampled individuals. Overall, the results based on the RCI are in line with pre-vious studies, which have found that individuals generally decline in neuroti-cism, extraversion, and openness and, on the other hand, increase in agreeable-ness and conscientiousness between adolescence and old age (McCrae, 2009: 151).56 It is also worth noting that, although the RCI suggests that there are 56 In particular, openness increases until sometime in an individual’s 20s, after which it slowly declines.

95
changes in personality traits, it does not indicate the magnitude of these chang-es.
In summary, we found some evidence that unemployment at young ages might affect personality traits, but the impact of unemployment later in life on personality traits was modest. In addition, measurement error is a potential problem because there were significant individual-level changes in personality trait scores over time. We will examine in the next section, as a robustness check, whether reverse causality and errors-in-variables are likely to affect our results.
4.4.2 Personality traits and unemployment: evidence from three perspectives
In this section, we will illustrate the relationship between personality traits and unemployment using three different approaches. First, the cumulative duration of unemployment is regressed by using Tobit estimation. Second, the number of unemployment spells is estimated by Poisson regression, and finally, we use a discrete time-proportional hazard model to illustrate the durations of single unemployment spells.
We begin with a model in which the cumulative duration of unemploy-ment between the ages of 33 and 50 was regressed on personality traits, educa-tion, profession, indicators for metropolitan areas, gender, and marital status by using the Tobit model (Tobin, 1958):
(3) iii xy εβ += '* ~ N(0, 2).
In equation (3), *
iy is a latent index, which captures the tendency of an individ-ual to experience unemployment; xi is a vector of independent variables; and iε is a normally distributed error term. Let a be the lower censored limit and b the upper censored limit.57 The Tobit model can then be expressed by the following relationship:
(4) =bay
yi
i
*
if ≥≤
<<
byaybya
i
i
i
*
*
*
Table 4 tabulates the standardised average marginal effects on the expected value for y for uncensored observations.58 Column (1) tabulates the results from the basic model, which uses only the Big Five personality traits as explanatory variables; column (2) augments the model with education, occupation, gender 57 The lower censoring limit, a, was 0 months, and there were no right censored obser- vations. 58 Total results are tabulated in Appendix B.
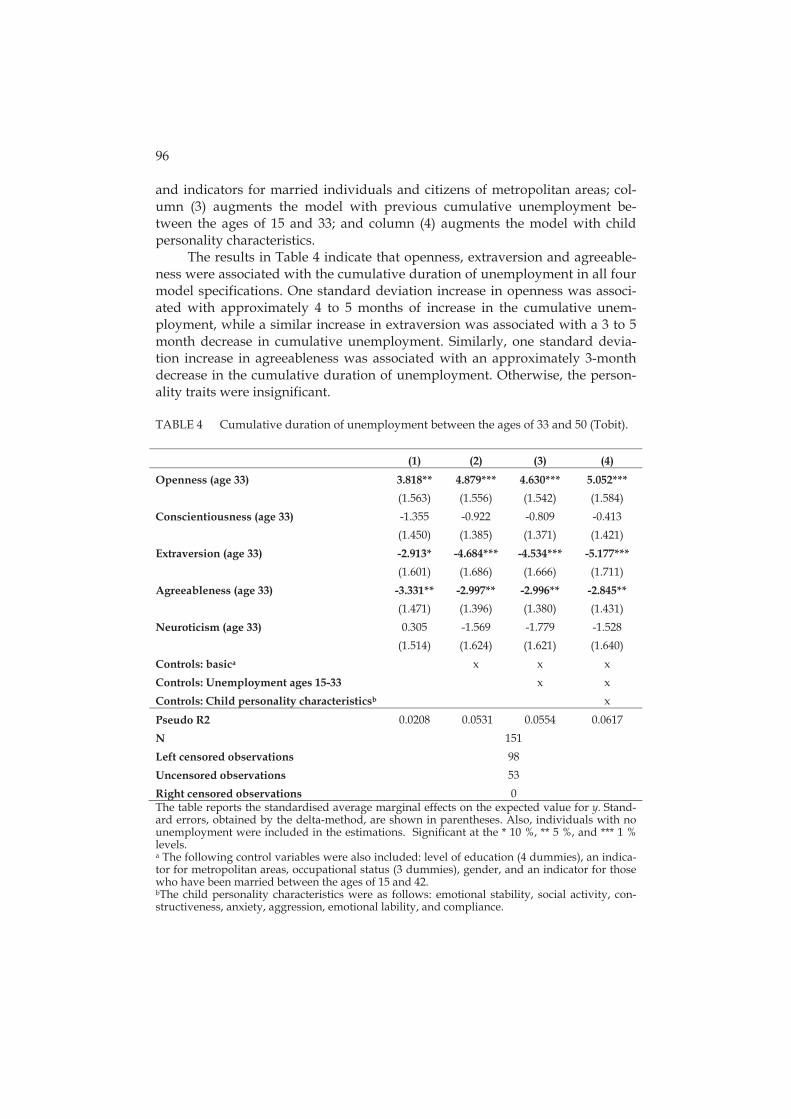
96
and indicators for married individuals and citizens of metropolitan areas; col-umn (3) augments the model with previous cumulative unemployment be-tween the ages of 15 and 33; and column (4) augments the model with child personality characteristics.
The results in Table 4 indicate that openness, extraversion and agreeable-ness were associated with the cumulative duration of unemployment in all four model specifications. One standard deviation increase in openness was associ-ated with approximately 4 to 5 months of increase in the cumulative unem-ployment, while a similar increase in extraversion was associated with a 3 to 5 month decrease in cumulative unemployment. Similarly, one standard devia-tion increase in agreeableness was associated with an approximately 3-month decrease in the cumulative duration of unemployment. Otherwise, the person-ality traits were insignificant.
TABLE 4 Cumulative duration of unemployment between the ages of 33 and 50 (Tobit). (1) (2) (3) (4) Openness (age 33) 3.818** 4.879*** 4.630*** 5.052*** (1.563) (1.556) (1.542) (1.584) Conscientiousness (age 33) -1.355 -0.922 -0.809 -0.413 (1.450) (1.385) (1.371) (1.421) Extraversion (age 33) -2.913* -4.684*** -4.534*** -5.177*** (1.601) (1.686) (1.666) (1.711) Agreeableness (age 33) -3.331** -2.997** -2.996** -2.845** (1.471) (1.396) (1.380) (1.431) Neuroticism (age 33) 0.305 -1.569 -1.779 -1.528 (1.514) (1.624) (1.621) (1.640) Controls: basica x x x Controls: Unemployment ages 15-33 x x Controls: Child personality characteristicsb x
Pseudo R2 0.0208 0.0531 0.0554 0.0617 N 151 Left censored observations 98 Uncensored observations 53 Right censored observations 0 The table reports the standardised average marginal effects on the expected value for y. Stand-ard errors, obtained by the delta-method, are shown in parentheses. Also, individuals with no unemployment were included in the estimations. Significant at the * 10 %, ** 5 %, and *** 1 % levels. a The following control variables were also included: level of education (4 dummies), an indica-tor for metropolitan areas, occupational status (3 dummies), gender, and an indicator for those who have been married between the ages of 15 and 42. bThe child personality characteristics were as follows: emotional stability, social activity, con-structiveness, anxiety, aggression, emotional lability, and compliance.

97
As a robustness check, we tackled the problem that unemployment before age 33 might have affected personality traits by creating a kind of instrument for adult personality that is independent of previous unemployment, similar to e.g., Osborne Groves (2005). The idea is to regress personality traits at age 33 on ex-ogenous variables and previous unemployment (here, cumulative unemploy-ment between the ages of 15 and 33) and to use the obtained unemployment coefficient to create an exogenous personality trait measure to be used in equa-tion (3). In the first step, each of the personality traits at age 33 (Pi,q,33) were re-gressed on exogenous variables (Xi,33) and previous unemployment between the ages of 15 and 33 (Ui,15-33):
(5) qiiqiqqqi UXP ,3315,33,33,, εδβα +++= −
The coefficient δ is then used to eliminate the effect of previous unemployment on the personality trait measures:
(6) 3315,33,,33,, −−= iqqi
exogqi UPP δ ,
These exogenous personality trait measures were then used as controls for per-sonality traits in the original model. The results obtained from this method were quite similar to those in Table 4, which suggests that reverse causality was unlikely to have a notable effect on the results. For the second robustness check, we used the IV estimation method to control for both reverse causality and er-rors-in-variables. We used the personality traits obtained at age 42 as explana-tory variables, and personality traits at age 33 as excluded instruments. Fur-thermore, a variable describing the cumulative duration of unemployment be-tween the ages of 15 and 42 was included in the model. In order to ensure that the exclusion restriction was satisfied the unemployment was measured be-tween ages 42 and 50. The results obtained by 2SLS indicated significant posi-tive relationship between openness and unemployment whereas the relation-ship between extraversion and unemployment was negative and significant.59 Since the 2SLS results are not directly comparable to those in Table 4 because of different estimation period, we also estimated the models of Table 4 by using unemployment between ages 42 and 50 as the dependent variable and personal-ity traits at age 42 as regressors. The tobit results indicated significant positive marginal effects for openness and neuroticim but the marginal effects for extra-version and agreeableness were insignificant. Hence openness was most con-sistently associated with increased cumulative unemployment and the result
59 Instead of using an instrumental variable Tobit model, we used 2SLS estimation because the former did not converge. Angrist (2001) shows that the estimation of limited dependent variable models with dummy endogenous regressors by 2SLS produces estimates that are relatively close to those obtained by Mullahy’s (1997) method, which is an IV estimation method for count data.
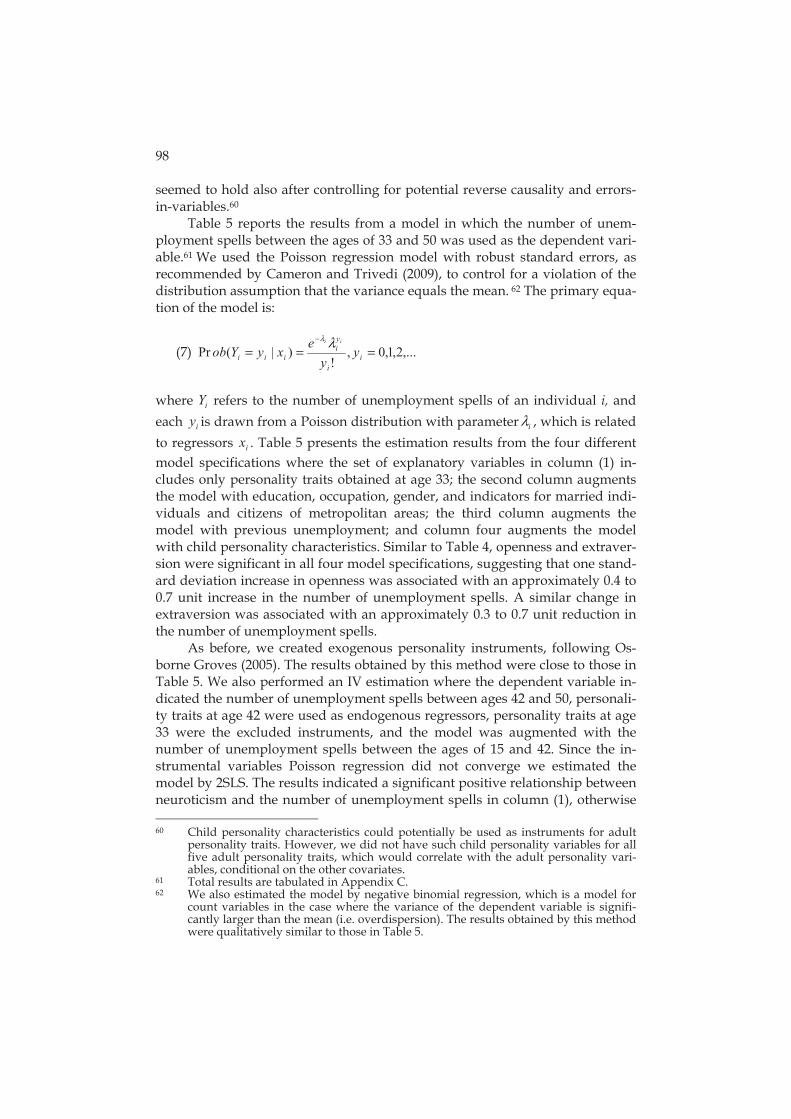
98
seemed to hold also after controlling for potential reverse causality and errors-in-variables.60
Table 5 reports the results from a model in which the number of unem-ployment spells between the ages of 33 and 50 was used as the dependent vari-able.61 We used the Poisson regression model with robust standard errors, as recommended by Cameron and Trivedi (2009), to control for a violation of the distribution assumption that the variance equals the mean. 62 The primary equa-tion of the model is:
(7) ,...2,1,0,!
)|(Pr ===−
ii
yi
iii yy
exyYob
ii λλ
where iY refers to the number of unemployment spells of an individual i, and each iy is drawn from a Poisson distribution with parameter iλ , which is related to regressors ix . Table 5 presents the estimation results from the four different model specifications where the set of explanatory variables in column (1) in-cludes only personality traits obtained at age 33; the second column augments the model with education, occupation, gender, and indicators for married indi-viduals and citizens of metropolitan areas; the third column augments the model with previous unemployment; and column four augments the model with child personality characteristics. Similar to Table 4, openness and extraver-sion were significant in all four model specifications, suggesting that one stand-ard deviation increase in openness was associated with an approximately 0.4 to 0.7 unit increase in the number of unemployment spells. A similar change in extraversion was associated with an approximately 0.3 to 0.7 unit reduction in the number of unemployment spells.
As before, we created exogenous personality instruments, following Os-borne Groves (2005). The results obtained by this method were close to those in Table 5. We also performed an IV estimation where the dependent variable in-dicated the number of unemployment spells between ages 42 and 50, personali-ty traits at age 42 were used as endogenous regressors, personality traits at age 33 were the excluded instruments, and the model was augmented with the number of unemployment spells between the ages of 15 and 42. Since the in-strumental variables Poisson regression did not converge we estimated the model by 2SLS. The results indicated a significant positive relationship between neuroticism and the number of unemployment spells in column (1), otherwise 60 Child personality characteristics could potentially be used as instruments for adult personality traits. However, we did not have such child personality variables for all five adult personality traits, which would correlate with the adult personality vari- ables, conditional on the other covariates. 61 Total results are tabulated in Appendix C. 62 We also estimated the model by negative binomial regression, which is a model for
count variables in the case where the variance of the dependent variable is signifi-cantly larger than the mean (i.e. overdispersion). The results obtained by this method were qualitatively similar to those in Table 5.
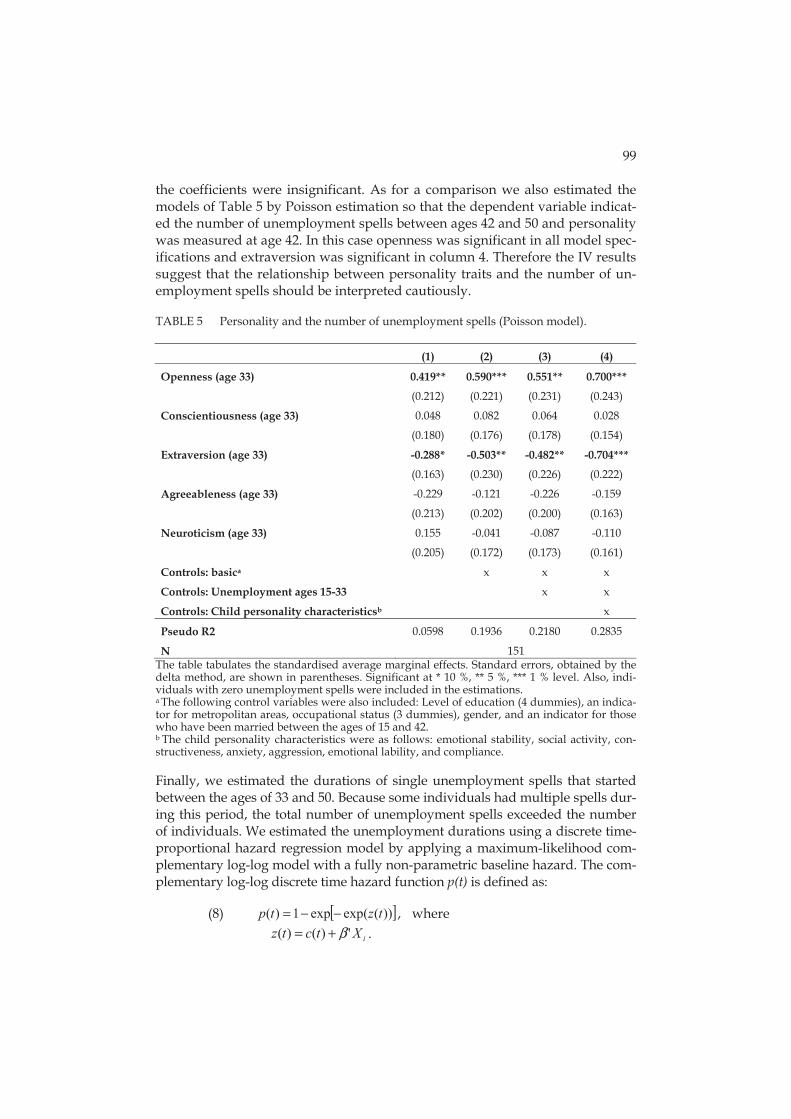
99
the coefficients were insignificant. As for a comparison we also estimated the models of Table 5 by Poisson estimation so that the dependent variable indicat-ed the number of unemployment spells between ages 42 and 50 and personality was measured at age 42. In this case openness was significant in all model spec-ifications and extraversion was significant in column 4. Therefore the IV results suggest that the relationship between personality traits and the number of un-employment spells should be interpreted cautiously. TABLE 5 Personality and the number of unemployment spells (Poisson model).
(1) (2) (3) (4)
Openness (age 33) 0.419** 0.590*** 0.551** 0.700***
(0.212) (0.221) (0.231) (0.243)
Conscientiousness (age 33) 0.048 0.082 0.064 0.028
(0.180) (0.176) (0.178) (0.154)
Extraversion (age 33) -0.288* -0.503** -0.482** -0.704***
(0.163) (0.230) (0.226) (0.222)
Agreeableness (age 33) -0.229 -0.121 -0.226 -0.159
(0.213) (0.202) (0.200) (0.163)
Neuroticism (age 33) 0.155 -0.041 -0.087 -0.110
(0.205) (0.172) (0.173) (0.161)
Controls: basica x x x
Controls: Unemployment ages 15-33 x x
Controls: Child personality characteristicsb x
Pseudo R2 0.0598 0.1936 0.2180 0.2835
N 151 The table tabulates the standardised average marginal effects. Standard errors, obtained by the delta method, are shown in parentheses. Significant at * 10 %, ** 5 %, *** 1 % level. Also, indi-viduals with zero unemployment spells were included in the estimations. a The following control variables were also included: Level of education (4 dummies), an indica-tor for metropolitan areas, occupational status (3 dummies), gender, and an indicator for those who have been married between the ages of 15 and 42. b The child personality characteristics were as follows: emotional stability, social activity, con-structiveness, anxiety, aggression, emotional lability, and compliance.
Finally, we estimated the durations of single unemployment spells that started between the ages of 33 and 50. Because some individuals had multiple spells dur-ing this period, the total number of unemployment spells exceeded the number of individuals. We estimated the unemployment durations using a discrete time-proportional hazard regression model by applying a maximum-likelihood com-plementary log-log model with a fully non-parametric baseline hazard. The com-plementary log-log discrete time hazard function p(t) is defined as:
(8) [ ]))(exp(exp1)( tztp −−= , where
iXtctz ')()( β+= .

100
In equation (8), i refers to the individual, c(t) is the baseline hazard function and X'β includes explanatory variables and an intercept term. If the unemployment
spell started between the ages of 33 and 41, we used the personality trait measures that were obtained at age 33, and if the unemployment spell started later, the personality trait measures were obtained at age 42. Table 6 tabulates the exponential coefficients from this model, which can be interpreted as hazard ratios.63 As before, column (1) tabulates the results from a model where only personality traits were used as explanatory variables. Column (2) augments the model with education, occupation, gender, marital status, and area of residence; column (3) augments the model with previous unemployment; and column (4) augments the model with child personality characteristics.
The results in Table 6 suggest that neuroticism in particular was associated with a decreased probability of unemployment exit (i.e., a longer duration of a single unemployment spell). In addition, agreeableness was significant in col-umn (4); however, the personality traits were otherwise insignificant. The re-sults concerning neuroticism were in line with Uysal and Pohlmeier (2011), who also found that the Big Five neuroticism trait decreased the probability of find-ing a job. Uysal and Pohlmeier also found conscientiousness to have a positive effect on the probability of finding a job, but our results in Table 6 did not sup-port this finding.
In line with Tables 4 and 5, we checked the robustness of the results by us-ing exogenous personality trait instruments, again following the method pro-posed by Osborne Groves (2005). In this case, neuroticism was not significant in any of the model specifications, but in column (4), agreeableness was still signif-icant and at approximately the same magnitude as in Table 6. Thus, it seems that the results concerning neuroticism in Table 6 were at least partly driven by reverse causality. Additionally, the results in section 4.1 suggested that previ-ous unemployment might affect the level of neuroticism at age 33, which sup-ports these findings.
Overall, the results in this chapter suggest that, after accounting for re-verse causality and errors-in-variables problems, openness was associated with an increased duration of cumulative unemployment at the prime working age. In some specifications, we also found that extraversion was associated with a lower number of unemployment spells, and extraversion and agreeableness were related to reduction in the cumulative length of unemployment, though the results in these two areas were more ambiguous. The results also suggested that neuroticism was related to an increased number of unemployment spells, but we believe that reverse causality affected these results. In one specification, the results also suggested that a higher score in agreeableness was associated with an increased probability of unemployment exit.
63 Total results are tabulated in Appendix D.

101
TABLE 6 Durations of single unemployment spells (discrete time proportional hazard regression model).
(1) (2) (3) (4)
Openness 0.879 0.923 0.944 0.857
(0.079) (0.119) (0.128) (0.083)
Conscientiousness 1.013 1.020 0.990 1.015
(0.138) (0.168) (0.141) (0.144)
Extraversion 1.092 1.100 1.042 0.966
(0.106) (0.110) (0.108) (0.141)
Agreeableness 1.047 1.058 1.068 1.300*
(0.149) (0.228) (0.210) (0.190)
Neuroticism 0.794 0.672* 0.614** 0.593**
(0.154) (0.141) (0.118) (0.130)
Controls: basica x x x
Controls: Unemployment ages 15-33 x x
Controls: Child personality characteristicsb x
McFadden's adj. R2 0.133 0.148 0.150 0.162
Number of unemployment spells 158 non-censored, 12 censored
Number of individuals 56 The table tabulates the standardised hazard rates followed by robust standard errors which are adjusted by clustering by individuals. If the unemployment spell started between the ages of 33 and 41, we used the personality trait measures that were obtained at age 33, and if the unem-ployment spell started later, the personality trait measures were obtained at age 42. Significant at * 10 %, ** 5 %, *** 1 % level. a) The following control variables were also included: Level of education (4 dummies), an indi-cator for metropolitan area, occupational status (3 dummies), gender, and an indicator for those who have been married between the ages of 15 and 42. b) The child personality characteristics were as follows: emotional stability, social activity, con-structiveness, anxiety, aggression, emotional lability, and compliance.
Of particular note, although openness was related to unemployment in the long run, there was either no connection between openness and the duration of a single unemployment spell. Some authors (Uysal and Pohlmeier, 2011; Kanfer et al., 2001) have found that higher scores in openness decreased the duration of an unemployment spell. Uysal and Pohlmeier propose that open people might be less choosy in their job search and more likely to apply to a variety of jobs. If their reservation wage is also lower than average, openness is likely to decrease the durations of single unemployment spells. However, our results suggest that if this interpretation holds, being less choosy in one’s job search might lead to a weaker job match quality, which results in more unemployment spells and thus to extended unemployment in the long run. It is also possible that a higher level of openness might cause individuals to seek out new experiences and new chal-lenges, and this would lead to breaks in an individual’s working career over a longer period of time. Individuals with a higher level of openness might also

102
tend to choose occupations in which the risk of unemployment is higher. These questions are, however, beyond the scope of this paper.
4.5 Conclusions
In this paper, we studied the relationship between personality traits and subse-quent unemployment. The empirical part of the paper was based on the JYLS, which provides information (among other things) on individuals' personalities at ages 8, 33, 42, and 50 as well as information on unemployment between the ages of 15 and 50. The JYLS study began in 1968 when the participants were 8 years old. Participation in the JYLS has remained high over the years, and the attrition that has occurred in the sample has been non-selective. A comparison of participants and non-participants at ages 42 and 50 in 2001 and 2009, respec-tively, indicated that the participants continued to be representative of the ini-tial random sample and of the 1959 Finnish age cohort.
We used three different measures for unemployment: cumulative dura-tion of unemployment between the ages of 33 and 50; the number of unem-ployment spells during the same period; and the durations of single unem-ployment spells during this period. The results suggested that a higher score in openness was related to a longer cumulative duration of unemployment possi-bly because openness was related to an increased number of unemployment spells. We also found that extraversion and agreeableness were associated with reduced cumulative unemployment and that extraversion was associated with a reduced number of unemployment spells but these results differed across the model specifications. Finally, the results suggested that neuroticism was associ-ated with a decreased probability of unemployment exit, meaning longer dura-tions of single unemployment spells. However, this result might be at least partly driven by reverse causality.
In this paper, we examined the connections between personality and un-employment by using the Big Five personality traits as such. This approach, however, does not take into account the configuration of the characteristics within a person. According to Herzberg and Roth (2006), numerous studies have proposed three major personality prototypes that configure the Big Five personality traits within an individual: 1) Resilients (low score in neuroticism, high or intermediate scores in other traits), 2) Overcontrolled (high neuroticism, low extraversion), and 3) Undercontrolled (low scores in conscientiousness and neuroticism). It is possible that these kinds of combinations of personality traits would provide additional information about the connections between personal-ity and unemployment, but we leave this issue for future research.
103
References
Agerbo, E., Eriksson, T., Mortensen, P. B. & Westergård-Nielsen, N. (2010) Unemployment and mental disorders: Evidence from Danish panel data, International Journal of Mental Health, 39(2), 56-74.
Almlund, M., Duckworth, A. L., Heckman, J. & Kautz, T. (2011) Personality psychology in economics. IZA Discussion Paper No. 5500.
Angrist, J. D. (2001) Estimation of limited dependent variable models with dummy endogenous regressors: simple strategies for empirical practice, Journal of Business and Economic Statistics, 19, 2-16.
Antecol, H. & Cobb-Clark, D. A. (2010) Do non-cognitive skills help explain the occupational segregation of young people? IZA Discussion Paper No. 5093.
Ardelt, M. (2000) Still stable after all these years? Personality stability theory revisited, Social Psychology Quarterly, 63, 391-405.
Bakke, E. W. (1933) The unemployed man, London: Nisbet. Barrick, M. B., & Mount, M. K. (1991) The Big Five personality dimensions and
job performance: a meta-analysis, Personnel Psychology, 44, 1-26. Bleidorn, W., Kandler, C., Riemann, R., Angleitner, A. & Spinath, F. M. (2009)
Patterns and sources of adult personality development: growth curve analyses of the NEO PI-R scales in a longitudinal twin study, Journal of Personality and Social Psychology, 97, 142-155.
Borghans, L., Duckworth, A. L., Heckman, J. J. & ter Weel, B. (2008) The economics and psychology of personality traits, Journal of Human Resources, 43, 972-1059.
Braakmann, N. (2009) The role of psychological traits for the gender gap in full-time employment and wages: Evidence from Germany. SOEP papers on Multidisciplinary Panel Data Research 162.
Burch G. & Anderson N. (2009) Personality at work. In P. J. Corr, & G. Matthews (Eds.) The Cambridge Handbook of Personality Psychology. Cambridge, UK: Cambridge University Press, 748-763.
Caliendo, M., Cobb-Clark, D. & Uhlendorff, A. (2010) Locus of control and jobsearch strategies, IZA Discussion Paper No. 4750.
Cameron, C. & Trivedi, P. (2009) Microeconometrics using Stata. College Station, TX: Stata press.
Caspi, A. (1998) Personality development across the life course. In W. Damon (Series Ed.) & N. Eisenberg (Vol. Ed.), Handbook of child psychology: Vol. 3. Social, emotional, and personality development (5th ed.). New York, NY: Wiley, 311-388.
Caspi, A., Moffitt, T. E., Thornton, A., Freedman, D., Amell, J. A., Harrington, H., Smeijers, J. & Silva, P. A. (1996) The life history calendar: a research and clinical assessment method for collecting retrospective event-history data, International Journal of Methods in Psychiatric Research, 6, 101-114.

104
Caspi, A., Wright, B. R. E., Moffit, T. E. & Silva, P. A. (1998) Early failure in the labor market: childhood and adolescent predictors of unemployment in the transition to adulthood, American Sociological Review, 63, 424-451.
Cobb-Clark, D. A. & Schurer, S. (2011) Two economists’ musings on the stability of locus of control. IZA Discussion Papers 5630.
Cobb-Clark, D. & Tan, M. (2009) Noncognitive skills, occupational attainment, and relative wages. IZA Discussion Paper No. 4289.
Costa, P. T., Jr. & McCrae, R. R. (1994) “Set like a plaster”?: Evidence for stability of adult personality. In T. Heatherton, & J. Weinberger (Eds.), Can personality Change? Washington, DC: American Psychological Association, 21-40.
Costa, P. T., Jr. & McCrae, R. R. (1985) The NEO personality inventory manual, Odessa, FL: Psychological Assessment Resources.
DellaVigna, S. & Paserman, M. D. (2005) Job search and impatience Journal of Labor Economics, 23(31), 527-588.
Farkas, G. (2003) Cognitive skills and noncognitive traits and behaviors in stratification process, Annual Review of Sociology, 29, 541-562.
Feinstein, L. (2000) The relative economic importance of academic, psychologycal, and behavioural attributes developed in childhood. CEP Discussion Paper dp0443.
Ferguson, D. M., Horwood, L. J. & Lynskey, M. T. (1997) The effects of unemployment on psychiatric illness during young adulthood, Psychological Medicine, 27, 371-381.
Gallo, W. T., Endrass, J., Bradley, E. H., Hell, D. & Kasl, S. V. (2003) The influence of internal control on the employment status of german workers, Schmollers Jahrbuch, 123(1), 71-81.
Heckman, J. J., Stixrud, J. & Urzua, S. (2006) The effects of cognitive and non-cognitive abilities on labour market outcomes and social behavior, Journal of Labor Economics, 24(31), 411-482.
Heineck, G. (2011) Does it pay to be nice? Personality and earnings in the United Kingdom, Industrial and Labor Relations Review, 64(5), 1020-1038.
Herzberg, P. Y. & Roth, M. (2006) Beyond resilients, undercontrollers, and overcontrollers? An extension of personality prototype research, European Journal of Personality, 20, 5-28.
Jacobson, N.S. & Truax, P. (1991) Clinical significance: a statistical approach to defining meaningful change in psychotherapy research, Journal of Consulting and Clinical Psychology, 59, 12–19.
Jahoda, M., Lazarsfeld, P. F. & Zeisl, H. (1972) Marienthal: the sociography of an unemployed community, London: Tavistock. (First published in German in 1933).
Kanfer, R., Wanberg, C. R. & Kantrowitz, T. M. (2001) Job search and employment: a personality-motivational analysis and meta-analytic review, Journal of Applied Psychology, 86(5), 837-855.
105
Kokko, K. (2006) Unemployment and psychological distress, and education as a resource factor for employment. In L. Pulkkinen, J. Kaprio, & R. J. Rose (Eds.), Socioemotional development and health from adolescence to adulthood. New York: Cambridge University Press, 306-327.
Kokko, K. & Pulkkinen, L. (2000) Aggression in childhood and long-term unemployment in adulthood: a cycle of maladaptation and some protective factors, Developmental Psychology, 36, 463-472.
Kokko, K., Pulkkinen, L. & Puustinen, M. (2000) Selection into long-term unemployment and its psychological consequences, International Journal of Behavioral Development, 24(3), 310-320.
Li, A. & Bagger, J. (2006) Using the BIDR to distinguish the effects of impresssion management and self-deception on the criterion validity of personality measures: a meta-analysis, International Journal of Selection & Assessment, 14, 131-141.
McCrae, R. R. (2009) The five-factor model of personality traits: consensus and controversy. In P. J. Corr, & G. Matthews (Eds.) The Cambridge Handbook of Personality Psychology. Cambridge, New York: Cambridge University Press, 148-161.
McCrae, R. R. & Costa, P. T., Jr. (2008) The five-factor theory of personality. In O. P. John, R. W. Robins & L. A. Pervin (Eds.), Handbook of personality: Theory and research (3rd ed.). New York: The Guilford Press, 159-181.
McCrae, R. R. & Costa, T. T., Jr. (2006) Personality in adulthood: a five-factor theory perspective. New York, NY: A Division of Guilford Publications, Inc.
McGee, A. (2010) How the perception of control influences unemployed job search. In Essays on the role of noncognitive skills on decisionmaking. Dissertation, 1-50. The Ohio State University.
Mohanty, M. S. (2010) Effects of positive attitude and optimism on employment: evidence from the US data, Journal of Socio-Economics, 39, 258-270.
Mueller, G. & Plug, E. (2006) Estimating the effect of personality on male and female earnings, Industrial and Labour Relations Review, 60(1), 3-22.
Mullahy, J. (1997) Instrumental-variable estimation of count data models: applications to models of cigarette smoking behavior, The Review of Economics and Statistics, 79(4), 586-593.
Nyhus, E. K. & Pons, E. (2005) The effects of personality on earnings, Journal of Economic Psychology, 26, 363-384.
Osborne Groves, M. (2005) How important is your personality? Labor market returns to personality for women in the US and UK, Journal of Economic Psychology, 26, 827-841.
Paulhus, D. L. (1984) Two-component models of socially desirable responding, Journal of Personality and Social Psychology, 46, 598-609.
Pervin, L. A. (2003) The science of personality. (2nd ed.) New York: Oxford University Press.
Pervin, L. A. & John, O. P. (2001) Personality: Theory and Research. New York: Wiley.

106
Pitkänen, L. (1969) A descriptive model of aggression and nonaggression with applications to children's behaviour. Jyväskylä Studies in Education, Psychology and Social Research, Nr. 19, University of Jyväskylä, Finland.
Pulkkinen, L. (2009) Development and aging personality: a resource or risk for successful development, Scandinavian Journal of Psychology, 50, 602-620.
Pulkkinen, L. (2006) The Jyväskylä longitudinal study of personality and social development. In L. Pulkkinen, J. Kaprio, & R. J. Rose (Eds.), Socioemotional development and health from adolescence to adulthood. New York: Cambridge University Press, 29-55.
Pulkkinen, L. & Kokko, K. (2012) Foundational issues in longitudinal data collection. In B. Laursen, T. D. Little & N. A. Card (Eds.), Handbook of developmental research methods. New York, NY, US: The Guilford Press, 129-147.
Pulkkinen, L. & Kokko, K. (2010) Keski-ikä elämänvaiheena. Reports from the Department of Psychology University of Jyväskylä, 352. (in Finnish)
Pulver, A., Allik, J., Pulkkinen, L. & Hämäläinen, M. (1995) A Big Five personality inventory in two non-Indo-European languages, European Journal of Personality, 9, 109-124.
Rantanen, J., Metsäpelto, R.-L., Feldt, T., Pulkkinen, L. & Kokko, K. (2007) Long-term stability in the Big Five personality traits in adulthood, Scandinavian Journal of Psychology, 48(6), 511-518.
Roberts, B. W. & DelVecchio, W. F. (2000) The rank-order consistency of personality traits from childhood to old age: a qualitative review of longitudinal studies, Psychological Bulletin, 126, 3-25.
Roberts, B. W., Walton, K. E. & Viechtbauer, W. (2006) Patterns of mean-level change in personality traits across the life course: a meta-analysis of longitudinal studies, Psychological Bulletin, 132(1), 1-25.
Seibert S. E. & Kraimer, M. L. (2001) The five-factor model of personality and career success, Journal of Vocational Behavior, 58, 1-21.
Specht, J., Egloff, B. & Schmukle, S. (2011) Stability and change of personality across the life course: the impact of age and major life events on mean-level and rank-order stability of the Big Five. SOEPpapers on Multidisciplinary Panel Data Research, 377. (forthcoming in Journal of Personality and Social Psychology).
Srivastava, S., John, O. P., Gosling, S. D. & Potter, J. (2003) Development of personality in early and middle adulthood: set like a plaster or persistent change? Journal of Personality and Social Psychology, 84(5), 1041-1053.
Sutin, A. R. & Costa, P. T., Jr. (2010) Reciprocal influences of personality and job characteristics across middle adulthood, Journal of Personality, 78, 257-288.
Sutin A. R., Costa Jr P. T., Miech R. & Eaton W. W. (2009) Personality and career success: concurrent and longitudinal relations, European Journal of Personality, 23, 71-84.
Tobin, J. (1958) Estimation of relationship for limited dependent variables. Econometrica, 26, 24-36.

107
Tokar D. M., Fischer A. R. & Subich L. M. (1998) Personality and vocational behavior: a selective review of the literature, 1993–1997, Journal of Vocational Behavior, 53, 115-153.
Uysal, S. D. & Pohlmeier, W. (2011) Unemployment duration and personality, Journal of Economic Psychology, 32(6), 980-992.
Wichert, L. & Pohlmeier, W. (2010) Female labour force participation and the Big Five. Centre for European Economic Research (ZEW), Mannheim, Discussion Paper No. 10-003.

108
Appendix A TABLE A.1 The effect of previous cumulative unemployment on the Big Five per- sonality traits at age 33 (OLS). Dependent variable Explanatory variables (1) (2) (3) Openness Cumulative unemployment ages 15-33 0.0001 0.003 0.003 (0.003) (0.003) (0.003) Additional controlsa x x
Controls: child personality characteristicsb x Adj. R2 -0.0067 0.1090 0.0822 Conscien-tiousness
Cumulative unemployment ages 15-33 -0.004* -0.003 -.005*
(0.002) (0.003) (0.003) Additional controlsa x x
Controls: child personality characteristicsb x Adj. R2 0.0134 -0.0065 -0.0051 Extraversion Cumulative unemployment ages 15-33 -0.003 -0.002 -0.001 (0.002) (0.002) (0.002) Additional controlsa x x
Controls: child personality characteristicsb x Adj. R2 0.0024 0.0945 0.1260 Agreeable-ness
Cumulative unemployment ages 15-33 -0.002 0.0005 -.0001
(0.002) (0.003) (0.003) Additional controlsa x x
Controls: child personality characteristicsb x Adj. R2 -0.0036 0.0551 0.0950 Neuroticism Cumulative unemployment ages 15-33 0.009*** 0.005 0.004 (0.003) (0.003) (0.003)
Additional controlsa x x
Controls: child personality characteristicsb x
Adj. R2 0.0512 0.1741 0.1382 N = 151. Standard errors are reported in parentheses. Significant at * 10 %, **5 %, *** 1 % levels. Unemployment was measured as cumulative unemployment between ages 15 and 33. a Additional controls: education, occupation, gender and marital status. The indicator for met-ropolitan area was excluded from the set of explanatory variables because unemployment might have affected this variable (i.e., individuals who become unemployed move to the met-ropolitan area to improve their reemployment possibilities). b The child personality characteristics were as follows: emotional stability, social activity, con-structiveness, anxiety, aggression, emotional lability, and compliance, and they were obtained at age 8.

109
TABLE A.2 The effect of the number of previous unemployment spells on the Big Five personality traits at age 33 (OLS). Dependent variable Explanatory variables (1) (2) (3) Openness Number of unemployment spells ages 15-
33 -0.041 -0.001 0.006
(0.032) (0.032) (0.034) Additional controlsa x x Controls: child personality characteristicsb x Adj. R2 0.0044 0.0998 0.0716 Conscien-tiousness
Number of unemployment spells ages 15-33
-0.051* -0.038 -0.045
(0.030) (0.032) (0.033) Additional controlsa x x Controls: child personality characteristicsb x Adj. R2 0.0125 -0.0058 -0.0117Extraversion Number of unemployment spells ages 15-
33 -0.035 -0.021 -0.022
(0.028) (0.028) (0.029) Additional controlsa x x Controls: child personality characteristicsb x Adj. R2 0.0033 0.0943 0.1281 Agreeableness Number of unemployment spells ages 15-
33 0.008 0.044 0.064**
(0.039) (0.030) (0.030) Additional controlsa x x Controls: child personality characteristicsb x Adj. R2 -0.0062 0.0688 0.1235 Neuroticism Number of unemployment spells ages 15-
33 0.051 0.038 0.043
(0.037) (0.036) (0.038) Additional controlsa x x Controls: child personality characteristicsb x Adj. R2 0.0062 0.1653 0.1342
N = 151. Standard errors are reported in parentheses. Significant at * 10 %, **5 %, *** 1 % levels. Unemployment was measured as cumulative duration of unemployment between ages 15 and 33. a Additional controls: education, occupation, gender and marital status. The indicator for met-ropolitan area was excluded from the set of explanatory variables because unemployment might have affected this variable (i.e., individuals who become unemployed move to the met-ropolitan area to improve their reemployment possibilities). b The child personality characteristics were as follows: emotional stability, social activity, con-structiveness, anxiety, aggression, emotional lability and compliance, and they were obtained at age 8.

110
TABLE A.3 Relationship between unemployment and change in personality traits between ages 33 and 50 (OLS).
Dependent variable Explanatory variables (1) (2) (3) Openness Unemployment indicator -0.110 -0.101 -0.107 (0.068) (0.072) (0.072)
Additional controlsa x x Controls: child personality characteristicsb x Adj. R2 0.0106 -0.0009 0.0130 Conscien-tiousness
Unemployment indicator -0.077 (0.074)
-0.088 (0.077)
-0.093 (0.079)
Additional controlsa x x Controls: child personality characteristicsb x Adj. R2 0.0005 0.0027 -0.0294 Extraversion Unemployment indicator -0.087 -0.085 -0.088 (0.082) (0.086) (0.085)
Additional controlsa x x Controls: child personality characteristicsb x Adj. R2 0.0009 0.0043 0.0257 Agreeable-ness
Unemployment indicator -0.017 (0.067)
-0.031 (0.069)
-0.030 (0.071)
Additional controlsa x x Controls: child personality characteristicsb x Adj. R2 -0.0063 0.0125 -0.0139 Neuroticism Unemployment indicator 0.118
(0.096) 0.179* (0.098)
0.155 (0.100)
Additional controlsa x x Controls: child personality characteristicsb x Adj. R2 0.0035 0.0319 0.0242
N = 151. Standard errors are reported in parentheses. Significant at * 10 %, **5 %, *** 1 % levels. Unemployment indicator equals one for those individuals who have experienced at least one unemployment spell between ages 33 and 50. a Additional controls: education, occupation, gender and marital status. The indicator for met-ropolitan area was excluded from the set of explanatory variables because unemployment might have affected this variable (i.e., individuals who become unemployed move to the met-ropolitan area to improve their reemployment possibilities). b The child personality characteristics were as follows: emotional stability, social activity, con-structiveness, anxiety, aggression, emotional lability, and compliance, and they were obtained at age 8.

111
TABLE A.4 Relationship between cumulative unemployment and change in perso- nality traits between ages 33 and 50 (OLS). Dependent variable Explanatory variables (1) (2) (3) Openness Cumulative unemployment ages 33-50 -0.002
(0.002) -0.002 (0.002)
-0.002 (0.002)
Additional controlsa x x Controls: child personality characteristicsb x Adj. R2 0.0077 0.0023 0.0132 Conscien-tiousness
Cumulative unemployment ages 33-50 -0.003 (0.002)
-0.003 (0.002)
-0.003 (0.002)
Additional controlsa x x Controls: child personality characteristicsb x Adj. R2 0.0106 0.0112 -0.0238 Extraversion Cumulative unemployment ages 33-50 -0.001
(0.002) -0.001 (0.002)
0.000 (0.002)
Additional controlsa x x Controls: child personality characteristicsb x Adj. R2 -0.0055 -0.0021 0.0180 Agreeable-ness
Cumulative unemployment ages 33-50 0.0005 (0.001)
-0.0002 (0.002)
-0.0004 (0.002)
Additional controlsa x x Controls: child personality characteristicsb x Adj. R2 -0.0060 0.0113 -0.0148 Neuroticism Cumulative unemployment ages 33-50 -0.001
(0.002) 0.001
(0.002) 0.001
(0.002)
Additional controlsa x x Controls: child personality characteristicsb x Adj. R2 -0.0050 0.0099 0.0078
N = 151. Standard errors are reported in parentheses. Significant at * 10 %, **5 %, *** 1 % levels. Unemployment was measured as cumulative unemployment between ages 33 and 50. a Additional controls: education, occupation, gender and marital status. The indicator for met-ropolitan area was excluded from the set of explanatory variables because unemployment might have affected this variable (i.e., individuals who become unemployed move to the met-ropolitan area to improve their reemployment possibilities). b The child personality characteristics were as follows: emotional stability, social activity, con-structiveness, anxiety, aggression, emotional lability, and compliance, and they were obtained at age 8.

112
TABLE A.5 Relationship between number of unemployment spells and change in personality traits between ages 33 and 50 (OLS). Dependent variable Explanatory variables (1) (2) (3) Openness Number of unemployment spells -0.020
(0.015) -0.021 (0.015)
-0.019 (0.016)
Additional controlsa x x Controls: child personality characteristicsb x Adj. R2 0.0056 -0.0023 0.0071 Conscien-tiousness
Number of unemployment spells -0.003 (0.016)
0.001 (0.017)
0.003 (0.018)
Additional controlsa x x Controls: child personality characteristicsb x Adj. R2 -0.0065 -0.0064 -0.0399 Extraversion Number of unemployment spells -0.011
(0.018) -0.011 (0.019)
-0.001 (0.019)
Additional controlsa x x Controls: child personality characteristicsb x Adj. R2 -0.0043 -0.0003 0.0180 Agreeable-ness
Number of unemployment spells -0.007 (0.014)
-0.013 (0.015)
-0.016 (0.016)
Additional controlsa x x Controls: child personality characteristicsb x Adj. R2 -0.0050 0.0163 -0.0078 Neuroticism Number of unemployment spells -0.010
(0.021) 0.006
(0.021) 0.006
(0.022)
Additional controlsa x x Controls: child personality characteristicsb x Adj. R2 -0.0052 0.0099 0.0073
N = 151. Standard errors are reported in parentheses. Significant at * 10 %, **5 %, *** 1 % levels. Unemployment was measured as number of unemployment spells between ages 33 and 50. a Additional controls: education, occupation, gender and marital status. The indicator for met-ropolitan area was excluded from the set of explanatory variables because unemployment might have affected this variable (i.e., individuals who become unemployed move to the met-ropolitan area to improve their reemployment possibilities). b The child personality characteristics were as follows: emotional stability, social activity, con-structiveness, anxiety, aggression, emotional lability, and compliance, and they were obtained at age 8.

113
Appendix B
Total results of Table 4. Cumulative duration of unemployment between the ages of 33 and 50 (Tobit). (1) (2) (3) (4) Openness (age 33) 3.818** 4.879*** 4.630*** 5.052*** Conscientiousness (age 33) -1.355 -0.922 -0.809 -0.413 Extraversion (age 33) -2.913* -4.684*** -4.534*** -5.177*** Agreeableness (age 33) -3.331** -2.997** -2.996** -2.845** Neuroticism (age 33) 0.305 -1.569 -1.779 -1.528 Level of education (comprehensive educa-tion)
- Vocational education - Upper vocational education - University education
-1.846 -9.126**
-17.252**
-1.148 -8.554**
-16.428**
-1.208 -9.821**
-18.291***
Metropolitan area -9.290* -8.739* -8.175 Occupational status (blue collar)
- Lower white-collar - Upper white-collar
1.837 10.591**
2.751 11.195**
2.108 10.833**
Gender 4.453 4.182
3.353
Married -7.840**
-7.153**
-6.013*
Unemployment ages 15-33 0.088 0.099 Child personality characteristics
- Emotional stability - Social activity - Constructiveness - Anxiety - Aggression - Emotional lability - Compliance
-2.851 1.251 3.231 2.422 -3.082 2.080 -0.138
Pseudo R2 0.0208 0.0531 0.0554 0.0617 N 151 Left censored observations 98 Uncensored observations 53 Right censored observations 0 The table reports the standardised average marginal effects on the expected value for y. Also, individuals with no unemployment were included in the estimations. Significant at the * 10 %, ** 5 %, and *** 1 % levels. The additional control variables include: level of education (4 dum-mies), an indicator for metropolitan areas, occupational status (3 dummies), gender, and an indicator for those who have been married between the ages of 15 and 42. The reference groups are indicated in parentheses. The child personality characteristics were as follows: emotional stability, social activity, constructiveness, anxiety, aggression, emotional lability, and compli-ance.

114
Appendix C
Total results of Table 5. Personality and the number of unemployment spells (Poisson model).
(1) (2) (3) (4)
Openness (age 33) 0.419** 0.590*** 0.551** 0.700***
Conscientiousness (age 33) 0.048 0.082 0.064 0.028
Extraversion (age 33) -0.288* -0.503** -0.482** -0.704***
Agreeableness (age 33) -0.229 -0.121 -0.226 -0.159
Neuroticism (age 33) 0.155 -0.041 -0.087 -0.110 Level of education (comprehensive educa-tion)
- Vocational education - Upper vocational education - University education
-0.367 -0.841 -1.409
-0.244 -0.757 -1.116
-0.237 -1.049* -1.525*
Metropolitan area -1.761***
-1.576**
-1.736***
Occupational status (blue collar) - Lower white-collar - Upper white-collar
-0.074 1.017*
0.066 0.970
-0.148 0.993
Gender 0.224
0.455
0.460
Married -1.040***
-0.893**
-0.831*
Unemployment ages 15-33 0.185***
0.127*
Child personality characteristics
- Emotional stability - Social activity - Constructiveness - Anxiety - Aggression - Emotional lability - Compliance
-0.746*** 0.303 0.483* 0.483** -0.520* 0.380* 0.111
Pseudo R2 0.0598 0.1936 0.2180 0.2835
N 151 The table tabulates the standardised average marginal effects. Significant at * 10 %, ** 5 %, *** 1 % level. Also, individuals with zero unemployment spells were included in the estimations. The additional control variables include: Level of education (4 dummies), an indicator for met-ropolitan areas, occupational status (3 dummies), gender, and an indicator for those who have been married between the ages of 15 and 42. The reference groups are indicated in parentheses. The child personality characteristics were as follows: emotional stability, social activity, con-structiveness, anxiety, aggression, emotional lability, and compliance.
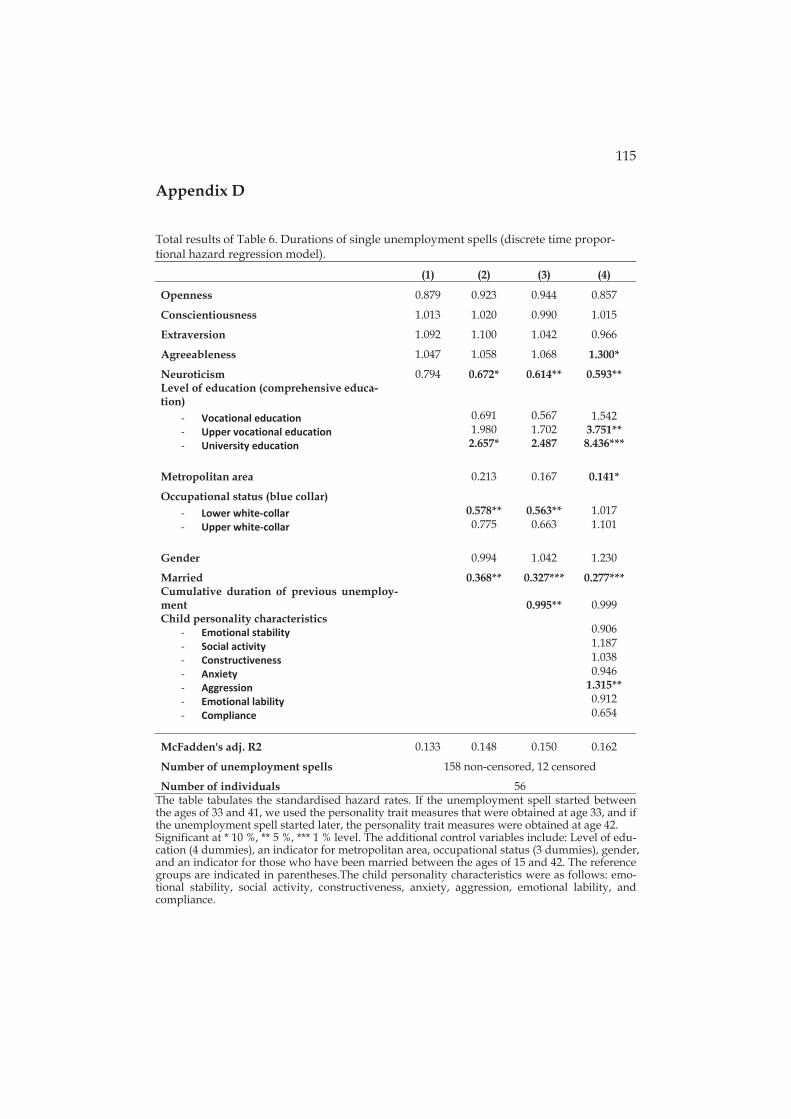
115
Appendix D
Total results of Table 6. Durations of single unemployment spells (discrete time propor-tional hazard regression model).
(1) (2) (3) (4)
Openness 0.879 0.923 0.944 0.857
Conscientiousness 1.013 1.020 0.990 1.015
Extraversion 1.092 1.100 1.042 0.966
Agreeableness 1.047 1.058 1.068 1.300*
Neuroticism 0.794 0.672* 0.614** 0.593** Level of education (comprehensive educa-tion)
- Vocational education - Upper vocational education - University education
0.691 1.980 2.657*
0.567 1.702 2.487
1.542 3.751** 8.436***
Metropolitan area 0.213 0.167 0.141*
Occupational status (blue collar) - Lower white-collar - Upper white-collar
0.578** 0.775
0.563** 0.663
1.017 1.101
Gender 0.994 1.042 1.230
Married 0.368** 0.327*** 0.277*** Cumulative duration of previous unemploy-ment 0.995** 0.999 Child personality characteristics
- Emotional stability - Social activity - Constructiveness - Anxiety - Aggression - Emotional lability - Compliance
0.906 1.187 1.038 0.946
1.315** 0.912 0.654
McFadden's adj. R2 0.133 0.148 0.150 0.162
Number of unemployment spells 158 non-censored, 12 censored
Number of individuals 56 The table tabulates the standardised hazard rates. If the unemployment spell started between the ages of 33 and 41, we used the personality trait measures that were obtained at age 33, and if the unemployment spell started later, the personality trait measures were obtained at age 42. Significant at * 10 %, ** 5 %, *** 1 % level. The additional control variables include: Level of edu-cation (4 dummies), an indicator for metropolitan area, occupational status (3 dummies), gender, and an indicator for those who have been married between the ages of 15 and 42. The reference groups are indicated in parentheses.The child personality characteristics were as follows: emo-tional stability, social activity, constructiveness, anxiety, aggression, emotional lability, and compliance.

5 PROFILING THE UNEMPLOYED: RESULTS FROM REGISTER DATA64
ABSTRACT. Active labour market policies have become a central tool for re-ducing unemployment. However, in a tight fiscal environment, it is important to define to whom these re-employment services are targeted. Among alloca-tion mechanisms, profiling has recently garnered a great deal of interest. Using Finnish data, this paper examines how well a profiling model could predict the duration of unemployment. The results were encouraging: the out-of-sample results indicated that the average duration of unemployment in the group with a low risk of prolonged unemployment was 17 days, and in the high risk group, the average duration of unemployment was 406 days.
5.1 Introduction
Ageing populations and tight fiscal conditions are challenges currently faced by many Western countries. To overcome these challenges, countries must ensure that sufficient labour resources and skills are available in the long run. This im-plies, among other things, that attention should be paid to the high and persis-tent unemployment prevalent in many Western countries (OECD, 2011). Among prescriptive policy options, active labour market policies (ALMP) such as public employment services, subsidised jobs, and labour market training have been one of the central tools aimed at getting the unemployed back to work and improving the functioning of the labour market. There are significant national differences in the amount of public expenditures on ALMPs (see e.g., Duell, Grubb & Singh, 2009: 40; Boeri & van Ours, 2008: 257). In Belgium, Den- 64 This paper further develops the paper by Moisala, Suoniemi & Uusitalo (2006). I owe
my greatest gratitude to Ilpo Suoniemi and Roope Uusitalo. The model presented in this paper does not describe the profiling model used in Finland.

117
mark, Netherlands, and Sweden the ALMP expenditure was over 1 % of the GDP in 2007, while for example in the United States and in Japan the expendi-ture was below 0.5 % of the GDP at the same time. The OECD average in ALMP expenditure was about 0.6 % of the GDP in 2007-2008 and in Finland the ex-penditure was slightly above this with about 0.8 %. (Duell, Grubb & Singh, 2009: 40.) Most of this money was spent on training and public employment ser-vices. 65 Because many countries devote significant amount of resources to ALMPs an important universal question, particularly when fiscal resources are limited, is to whom ALMPs should be targeted. As far as the selection to ALMPs is based on caseworker discretion a po-tential problem is so called “creamskimming”. Creamskimming occurs when caseworkers choose to re-employment services those who are likely to do well even without the programme’s help, usually with the aim of improving the programme’s performance statistics (Berger, Black & Smith, 2001). Although the services would seem to be effective, it would be an inefficient way of allocating the ALMP resource. A solution to the potential creamskimming problem is to use objective tools in service allocation. A simple way of constructing such a tool is to use deterministic methods, which would refer all individuals with cer-tain observable characteristics, such as a young age, to re-employment services. Although the deterministic method is easy and relatively cheap to implement, the downside is that it lacks flexibility. In order to overcome the problems of creamskimming and oversimplification some countries have introduced statis-tical profiling models to improve the service allocation. A statistical profiling system refers persons to re-employment services based on the predicted values of their profiling variables. Profiling occurs at the beginning of an unemploy-ment spell, which makes it possible to offer re-employment services before problems associated with prolonged unemployment, such as outdated work skills, have time to occur.
Statistical profiling models have been used in various forms in Australia (Australian Government, 2011), Denmark (Rosholm et al., 2006), and the United States (U.S. Department of Labor, 2011). Such models have also received a great deal of attention in other countries, with pilot projects conducted in the U.K., Switzerland (Rudolph & Kondle-Seidl, 2005) and recently also in Finland (Työllisyys nousussa, 2007; Moisala, Suoniemi & Uusitalo, 2006). In the United States, which is the pioneer of statistical profiling systems, profiling has been used since the 1990s (Worker Profiling and Reemployment Services, WPRS). In the U.S., new unemployment insurance (UI) benefit claimants whose observable characteristics indicate a high risk of benefit exhaustion must either participate in mandatory re-employment services early in their unemployment spells or forfeit their benefits. For instance, in the Kentucky model, considered to be the most sophisticated, profiling is based on information from past employment
65 Public employment services concern placement, counseling and vocational guidance, job search courses, and administration of unemployment benefits (Boeri & van Ours 2008: 255).

118
and UI benefits receipts and information on local economic conditions. Each week local employment offices assign claimants to the WPRS treatment based on their profiling scores until the number of slots available for that office are filled (see e.g., Black, Galdo & Smith, 2007). According to Black et al. (2007) and Black, Smith, Berger and Noel (2003), the Kentucky WPRS programme has ac-complished its aims of shortening the duration of UI claimants, reducing total benefits paid, and raising annual earnings. However, the results also suggest that most, but not all, of the observed effects resulted from a sharp increase in early UI exits in the treatment group relative to the control group. These exits coincided with claimants discovering their mandatory programme obligations rather than with actual receipt of re-employment services, and thus Black et al. (2003) conclude that the profiling programme appears to reduce the moral haz-ard associated with the UI programme. Additionally, Rosholm and Svarer (2008), using Danish data, find that the threat effect impacts some individuals early, causing them to find jobs before they enter the period during which pro-gramme participation is intensified. Thus, these services can be interpreted as either improving employment-related skills or as a kind of leisure tax on the UI claimant.
The aim of this study is to discover whether a statistical profiling model can identify the potential long term unemployed using data drawn from the Finnish Employment Register (Työnvälitysrekisteri). In section 2, we formulate a profiling model for Finland and examine its predictive performance. The re-sults are encouraging: the out-of-sample results indicate that the average dura-tion of unemployment in risk group 1 (the shortest duration of predicted un-employment) is 17 days, and in risk group 4 (the highest duration of predicted unemployment), the duration is 406 days. In addition, profiling clearly outper-forms the simpler random allocation and deterministic methods. Section 3 con-cludes with a discussion of our findings and possible directions for future re-search.
5.2 Description of the profiling model
Berger, Black and Smith (2001) specify two key issues that determine the effec-tiveness of a profiling system. The first is the choice of the profiling variable, which is crucially dependent on the social goal of profiling. If its goal is to serve those most in need, predicted duration of unemployment is the best choice of variable. However, if the goal of profiling is efficiency (i.e., to select those who would benefit the most from the services), then expected duration of unem-ployment is a good choice only if it varies positively with the programme’s net impacts. The second key issue is the choice of variables used to predict the pro-filing variable. Although data usually sets limitations on this issue, ultimately, profiling makes little sense if the model is unable to sort persons based on the profiling variable.

119
In this section, we construct a profiling model that predicts the risk of pro-longed unemployment. Based on these predictions, re-employment services could be targeted to those who have the highest risk of prolonged unemploy-ment and thus have the greatest need for some assistance. The data used in this study were drawn from the Finnish Employment Register provided by the for-mer Finnish Ministry of Labour.66 This register contains the information of all Finns who have signed on as job applicants in a local labour office. Two random samples were taken from this database. The first was a sample of individuals whose spell of unemployment started in 1998 (n = 131,257), and the second sample was drawn from individuals whose unemployment spell started in 2001 (n = 124,818). The 1998 sample was used to obtain the coefficients for the profil-ing model. This model was then used to predict the durations of unemployment spells in the 2001 sample. The explanatory variables (see Appendix A) were at-tached to each unemployment spell so that the value of an explanatory variable matched the person’s situation at the beginning of an unemployment spell.
5.2.1 Selection of the estimation model
As the selection of the model with the best predictive performance is an empiri-cal question, we tested several possibilities: OLS, logit, probit, tobit and dura-tion models. In the OLS, tobit and duration models, the dependent variable was the number of days unemployed. In logit and probit models, the discrete ex-planatory variable indicated whether the duration of an unemployment spell was 12 months or more.67 Unemployment spells that were still current on at the day of sampling and those that had ended because of re-employment services, training or for unknown reasons were excluded from the 1998 samples when OLS, probit and logit models were estimated. This improved the predictive per-formance of those models. In the tobit and duration models, these observations were treated as right-censored, and unemployment spells that lasted just one day were treated as left-censored in tobit. In all cases, the censored observations were excluded from the 2001 sample. The duration analysis was based on a piecewise constant proportional hazard model, where the hazard function is separately defined for each 20-day interval (Greene, 2003). The model was fitted using the exponential distribution.68 The predictions were based on the predict-ed median survival time.
The models’ predictive performance was evaluated by the Spearman’s rank correlation coefficient, which indicates the correlation between the actual
66 Now called Ministry of Employment and the Economy. 67 Unemployment lasting for longer than one year is defined as long term unem- ployment, for instance, in the European Union statistics. We also tested other (higher and lower) cut-off values, but they did not bring any significant improve- ment to the rank-correlation coefficients. 68 We also tested the predictive performance of some other survival distributions (Weibull, log logistic and Gompertz) but the predictive performance turned out to be worse.

120
and predicted duration of unemployment.69 We used the rank correlation coef-ficient because ultimately, we were only concerned about the ranking; we were not interested in the predicted duration of the unemployment as such. The Spearman’s rank correlation coefficients for each model are tabulated in Table 1. The results in Table 1 indicate that the duration model outperformed all other estimation methods. To confirm this result, we performed several robustness checks. First, similarly to Black, Smith, Plesca and Shannon (2003) and Berger et al. (2001), we examined the actual unemployment duration at various distribu-tion percentiles of the dependent variable’s predicted values. In addition, we counted the actual average duration of unemployment among the 17.5% of in-dividuals whose predicted duration of unemployment was the longest. 70 These robustness checks confirmed the result that duration model had the best predic-tive ability. We also tested the sensitivity of the results on data changes by ran-domly dividing both the 1998 data and the 2001 data into two subsamples.71 We then carried out four sensitivity tests with different subsamples. For instance, coefficients obtained from 1998 subsample 1 were used to predict the duration of unemployment in subsample 2 in 1998. Three other similar tests were also conducted. The results remained qualitatively similar, indicating that the dura-tion model had the best predictive ability. Additionally, the rank correlation coefficients were of approximately the same magnitudes as in Table 1. TABLE 1 Predictive performance of alternative estimation models.
OLS Logit Probit Tobit Duration
Rank correlation coefficient 0.656 0.621 0.610 0.650 0.788
69 To be more specific, we calculated the Spearman’s rank correlation coefficient be- tween the predicted duration of unemployment (OLS, Tobit) / the predicted risk of long-term unemployment (probit, logit) / the predicted median survival time (du- ration model) and the actual duration of unemployment. 70 This cut-off value was chosen because 17.5 % of individuals in the 2001 sample were referred to re-employment services by the time of sampling. 71 The division was carried out as follows. For each day in a year we randomly selected a number between 0 and 1. If the value of this number was at most 0.5, all the un- employment spells that began on that day were included in subsample 1. Otherwise, a spell belonged to subsample two. Black, Smith, Plesca and Shannon (2003) have argued that this kind of division into estimation and validation samples should be based on a random sample of weeks (or days) instead of persons. Unemployed workers whose unemployment spell starts at a certain time face similar local eco- nomic conditions. Hence, “randomly selecting the validation sample based on weeks [days] in which the claims are filed limits the variation across these economic variables and thus avoids potentially inflation of the predictive performance meas- ures due to variation in local economic conditions over time within the validation sample.” (Black, Smith, Plesca & Shannon, 2003: 18.)

121
5.2.2 Predictive performance of the model
Based on the predictive performance of different estimation methods, we elect-ed to use the following piecewise-constant proportional hazards model in pro-filing:
(1) ),exp()()( βλ xtth = .
In equation (1), h(t) is the hazard function, t is the duration of unemployment,
)(tλ is the baseline hazard to be estimated, x is a vector of covariates and β is a vector of parameters to be estimated. Table 2 presents selected hazard rates ob-tained from 1998 data and the complete table of results is presented in Appen-dix B. Overall the results were in line with previous studies, indicating, for ex-ample, that higher education was associated with shorter unemployment spells (see e.g., Korkeamäki, 2001; Ollikainen, 2003). Lower attachment to the labour market, indicated by such previous activities as sheltered work, sickness, re-tirement, being at home with children or on maternity leave, was related to longer duration of unemployment. The linkage between previous unemploy-ment and the duration of an unemployment spell in 1998 was twofold: a high number of unemployment spells in the past indicated a higher probability of unemployment exit, whereas a long cumulative duration of previous unem-ployment spells was associated with a longer duration of unemployment. Sig-nificant differences in the duration of unemployment also appeared, for in-stance, between occupations and fields of education.
We tested the impact of each explanatory variable on the model’s predic-tive performance by excluding them from the model one at the time and found that the impact of any single explanatory variable on the model’s predictive performance was modest. As we could at least say that none of the explanatory variables significantly decreased the model’s predictive performance, we re-solved to retain all of them in the model (see Appendix A). It is worth noting that, consistent with previous studies (Arulampalam, Gress & Gregory, 2001), past unemployment history was a good predictor of an individual’s future risk of unemployment. It is likely that previous unemployment history reflects both explanatory variables included in the model as well as other unobservable de-terminants, such as motivation. If we estimated a profiling model using only variables related to previous unemployment as explanatory variables, the Spearman’s rank correlation coefficient was 0.793.

122
TABLE 2 Selected results from duration model using the 1998 data. Hazard
rate Standard
error Main activity prior to unemployment (employed) Sheltered work Prison/other institution Sick Maternity leave At home with children Retired
0.688** 0.834*** 0.779*** 0.804*** 0.718*** 0.725***
0.130 0.045 0.020 0.019 0.016 0.077
Level of education (lower secondary education) Upper secondary education, vocational Upper secondary education, general Lower tertiary education Tertiary education Unknown
1.310*** 1.107*** 1.372*** 1.354***
1.089
0.129 0.018 0.135 0.135 0.088
Previous unemployment history Number of unemployment spells during the last year (zero) 1 spell 2-5 spells 6-10 spells 11-20 spells 21 spells or more Number of unemployment spells during the past 3 years (zero) 1 spell 2–5 spells 6–10 spells 11–30 spells 31 spells or more Duration of cumulative unemployment during the past year (1-50 days) 51-100 days 101-200 days 201 days or more Duration of cumulative unemployment during the past 3 years (1-100 days 101-300 days 301-600 days 601-900 days 901 days or more
0.881*** 1.335*** 2.596*** 3.410*** 5.529***
0.571*** 0.688*** 1.141*** 1.458*** 1.937***
0.824*** 0.753*** 0.720***
0.800** 0.646*** 0.551*** 0.475***
0.015 0.023 0.056 0.082 0.143
0.015 0.017 0.031 0.044 0.064
0.011 0.010 0.010
0.011 0.009 0.009 0.009
N = 131 257 spells The complete results are presented in Appendix B. Significant at * 10%, ** 5%, ***1 % level.
To further illustrate the predictive performance of the model, we divided the unemployed into four risk groups. In group 1, the expected duration of unem-ployment was the shortest; in group four, the expected duration was the long-est.72 The spells in the 2001 sample were divided into these four groups accord-
72 The grouping was done as follows: Group 1: the predicted median survival time is less than 50 days (48%); group 2: the predicted median survival time is between 50 and 99 days (20%); group 3: predicted median survival time is between 100 and 199 days (19%); group 4: predicted median survival time is at least 200 days (12%).

123
ing to the predicted duration of unemployment. Then, we examined the actual duration of the unemployment in each group. Because some of the unemploy-ment spells were concurrent with the day of sampling, the maximum duration of unemployment was limited to 1400 days. Figure 1 shows the distribution of the actual duration of employment in the four different risk groups. In each bar, a circle indicates the mean and the lines the 10th, 25th, 50th, 75th, and 90th percen-tiles of the distribution of the actual duration of unemployment. The average duration of unemployment clearly increased from risk group 1 to group 4. The mean duration of unemployment in group 1 was 17 days (median 5 days), whereas in group 4, it was 406 days (median 257 days). It is also noteworthy that the dispersion of the actual duration increased from group 1 to group 4.
FIGURE 1 Distribution of actual duration of unemployment in 4 risk groups.
5.2.3 Performance among groups
We tested the model’s predictive performance among subgroups with the Spearman’s rank correlation coefficients. Table 3 presents selected results of the predictive performance by tabulating the rank correlation coefficients among subgroups with the highest and lowest levels of this coefficient. The complete results are tabulated in Appendix C. Overall the model’s performance remained robust among the different subgroups. There were a few groups among which the model’s predictive performance was reduced, such as students, new gradu-ates and citizens of Nordic countries. More notably, the model’s predictive per-formance was also reduced among the unemployed in the Ahvenanmaa area

124
and individuals in health and welfare occupations, although in both of these groups, unemployment is generally less severe. 73 In 2010, the average unem-ployment rate in the Ahvenanmaa area was 3.0 %, compared to the Finnish av-erage of 10.2 % (Ministry of Employment and the Economy, 2011). Our data also indicate that the average duration of unemployment in Ahvenanmaa was just 67 days, compared to 87 days in the rest of Finland. Similarly, among health professionals, the average duration of unemployment in our data was relatively short: 33 days. TABLE 3 Predictive performance among subgroups: selected results.
Subgroup Spearman’s rank correlation coefficient All 0.7885 Highest rank correlation coefficients 50-64 years 0.8239 Entrepreneur 0.8286 Type of job severance: - Dismissal due productional reasons - Closure of the place of business
0.8320 0.8267
Occupation: a change in the choice of profession 0.8249 Lowest rank correlation coefficients Student 0.6605 Newly graduated 0.6899 Nordic Countries citizens 0.5365 Ahvenanmaa 0.6351 Healthcare practitioners 0.6346 The complete results are presented in Appendix C. To illustrate the model’s predictive performance among those with no previous unemployment history, we predicted the durations of unemployment for those individuals who had not experienced unemployment during the previous 10 years.74 This group included those who had not previously been in the labour market as well as those who had been successfully employed until the begin-ning of unemployment. As it is not possible to perfectly separate individuals into these two groups, we used the following proxies. The group of individuals who had not previously been in the labour market included those who had had no unemployment spells during the past 10 years and who were in vocational or general education, military service, maternity leave, home with children or spending time in prison or other institutions before the beginning of unem-ployment and who were under the age of 30. The group of individuals with successful working careers until the time of unemployment, included those with no unemployment spells during the past 10 years and who were employed, under a threat of unemployment or entrepreneurs before the beginning of un-employment. Among individuals in the first group, the Spearman’s rank corre-lation coefficient was 0.6771 (n = 3472) and in the second group, the coefficient 73 Ahvenanmaa is an autonomous island in southern Finland. 74 We had information about the past unemployment only from the past 10 years.

125
was 0.7926 (n = 4693). This result is encouraging because it suggests that the model also has the ability to predict the duration of unemployment for those individuals who have not experienced unemployment before.
5.2.4 Comparison of different allocation mechanisms
In this section, we compare the outcomes of different allocation mechanisms to see whether profiling could better identify those with the greatest need for ser-vices than random allocation or the deterministic method. We also compare the outcome of profiling model to the prevailing practice. Profiling makes sense only if it does better job than the simpler random or deterministic allocation methods in finding those with the highest probability of prolonged unemploy-ment. In our sample, 17.5% of unemployment spells ended because of re-employment services. Thus, we took a 17.5% random sample of the spells from our 2001 sample and compared the actual duration of unemployment in that group with the duration in 17.5% unemployment spells for which the predicted durations of unemployment were the longest. As the results presented in Table 4 show, there was a clear difference in the actual durations of unemployment in favour of the profiling model: the average actual duration of unemployment in the random sample was 86 days (median 24 days), and in the profiling sample, it was 284 days (median 185 days).
To compare profiling and the deterministic method, we defined two dif-ferent deterministic rules: According to the first rule, 17.5% of spells with the longest cumulative unemployment during the past 3 years were referred to ser-vices. This rule was based on the fact that previous unemployment history ap-peared to be a good predictor of future unemployment. According to the se-cond rule, individuals over 55, those who were dismissed due to production reasons, and individuals whose previous activity was either sheltered work or the previous activity was not reported would be referred to services. These subgroups were selected because within these groups, the average actual dura-tion of unemployment was the longest in the 1998 sample, over 600 days.75 We then used the 2001 sample to compare the average duration of unemployment among these deterministically-identified individuals to those with the longest predicted durations of unemployment according to our profiling model. The results are presented in Table 4. Again, the results favoured the profiling model: in the subgroup based on rule 1, the average duration of unemployment was 132 days (median 30 days), while in the profiling sample of the same size, the average was 284 days (median 185 days). In the subgroup defined by rule num-ber two, the average duration of unemployment was 136 days (median 21 days) and in the profiling sample of the same size (17.7% of spells), the average dura-tion was 284 days (median 185 days).
75 The correlations and averages were based on the 1998 sample after omitting spells which had ended because of re-employment services, training or unreported reasons. The maximum duration of unemployment was limited to 1400 days.

126
TABLE 4 Comparison of different allocation mechanisms. Allocation mechanism Duration of unemployment (days)
Mean Median 1. Random allocation
Profiling 86 284
24 185
2. Deterministic rule based on previous unem-ployment history Profiling
132 284
30 185
3. Deterministic rule based on age, reason for dismissal, and previous activity Profiling
136 284
21 185
The comparison of those who would have been referred to services according to this profiling model and those who actually used reemployment services re-veals that the outcomes are somewhat different. Out of those who had the long-est predicted durations of unemployment, 36% were actually referred to ser-vices in the 2001 sample. It seems that the prevailing allocation system was at least partly based on the same components as our profiling system, although it is likely that other factors also influenced the decision. It is difficult to say whether the use of profiling would have been an improvement over prevailing practice. This is because, first, we do not know the basis on which individuals were referred to services. Unlike in the profiling, in which the objective was to identify those with the longest predicted duration of unemployment, the goal might have been efficiency, for example. Second, we do not know what the ac-tual duration of unemployment would have been without the services. Because of this, it is not possible to compare the two outcomes, although the goal in both cases was the same.
5.3 Conclusions
This paper contributed to the literature of ALMPs by providing evidence of how statistical profiling could be used as an allocation mechanism for re-employment services. The paper presented a profiling model that aimed to identify those with the longest predicted duration of unemployment. Case-workers could then use these predictions when they select the individuals who should be referred to re-employment services. The model was successful in predicting unemployment. The out-of-sample results based on a piecewise con-stant proportional hazard model indicated that the average duration of unem-ployment in risk group 1 (low risk of prolonged unemployment) was 17 days, and in risk group 4 (high risk of prolonged unemployment), it was 406 days.
Although the model was successful in predicting the duration of unem-ployment, it is possible that the model could still be improved if, for example,

127
personality and motivational indicators, which have been found to be related to unemployment duration (e.g Uysal & Pohlmeier, 2011), are taken into account. Because it is difficult to take personality and motivational aspects into account in statistical profiling models, caseworker discretion is also often a necessary source of information. Another important aspect is that although the profiling model seemed to perform well in selecting those with the greatest need for ser-vices, the services themselves must be effective for ALMP to make sense as a policy prescription. Boone and van Ours (2009) review previous studies that focus on the effects of ALMPs. They conclude that the empirical work on the macroeconomic effects of ALMP (Scarpetta, 1996; Elmeskov et al., 1998; Nickell & Layard, 1999) suggests that ALMP reduces the unemployment rate, whereas microeconomic studies often find only small or no effect on labour market pro-grammes.76 Card et al. (2010) made a meta-analytic evaluation of active labour market policies in 26 countries based on studies, which were conducted be-tween 1995 and 2007. They find that job search assistance programmes have generally favourable impacts while subsidised public sector employment pro-grammes are relatively ineffective. Classroom and on-the-job training pro-grammes are not particularly effective in the short run, but have more positive impacts after two years. In the context of Finland, the microeconomic evidence based on non-experimental studies of the effectiveness of ALMPs is mixed. De-pending on the study, training services are sometimes useful, but sometimes appear to have no effect or even a negative one. The few experimental Finnish studies on this topic suggest that re-employment services do not have a signifi-cant effect on the probability of re-employment. They may, however, have other benefits, such as positive impacts on psychological distress and on the quality of re-employment. (Vuori et al. 2002, Malmberg-Heimonen & Vuori 2000; for review, see Hämäläinen & Uusitalo, 2005). As an explanation for this contradic-tion between macroeconomic and microeconomic evidence, Boone and van Ours (2009) suggest that even if the training programme does not influence the job finding rate, it may still reduce the unemployment rate due to its effects on the job separation rate by improving the quality of the match between worker and the job.
Finally, the question of to whom re-employment services should be tar-geted is normative in nature. The goal of our profiling model was to identify those who have the greatest difficulties in unemployment exit, i.e., those who would most need some kind of assistance. However, this does not necessarily mean that these individuals would have the greatest net benefits from the re-employment services. If we wanted to formulate a model that would identify those who would benefit from the services the most, more detailed information about the different re-employment programmes would be required. 76 Macroeconomic studies on the effects of ALMPs usually exploit cross-country varia-
tion in unemployment and ALMP expenditures and explain the level of unemploy-ment by the level of ALMP expenditure. Microeconomic studies focus on the ques-tion of how participation in re-employment services affects, for example, an individ-ual’s probability of re-employment.

128
References
Arulampalam, W., Gregg, P., & Gregory, M. (2001) Unemployment scarring, The Economic Journal, 111, F577-F584.
Australian Government. (2011) Job seeker classification instument (JSCI) http://www.deewr.gov.au/Employment/JSCI/Pages/JSCI.aspx#a 19.8.2011.
Berger, M. C., Black, D. & Smith, J. (2001) Evaluating profiling as a means of allocating government services. In Lechner, M. & Pfeiffer, F. (eds.), F. Wolfgang (series ed.) Econometric Evaluation of Active Labour Market Policies, Zew Economic studies. Physica-Verlag HD, 59-84.
Black, D. A., Galdo, J. & Smith, J. A. (2007) Evaluating the worker profiling and re-employment services systems using a regression discontinuity approach, American Economic Review, 97 (2), 104-107.
Black, D. A., Smith, J. A., Berger, M. C. & Noel, B. J. (2003) Is the threat of re-employment services more effective than the services themselves? Experimental evidence from the UI system, American Economic Review, 93 (4), 1313-1327.
Black, D. A., Smith, J. A., Plesca, M. & Shannon, S. (2003) Profiling UI claimants to allocate re-employment services: Evidence and recommendations for states, Final Report to the United States Department of Labour.
Boeri, T. & van Ours, J. (2008) The economics of imperfecr labor markets, Princeton, NJ: Princeton University Press.
Boone, J. & van Ours, J. (2009) Bringing unemployed back to work: Effective active labour market policies, De Economist, 157, 293-313.
Böckerman, P. & Uusitalo, R. (2006) Erosion of the ghent system and union membership decline: Lessons from Finland”, British Journal of Industrial Relations, 44 (2), 283-303.
Card, D., Kluve, J. & Weber, A. (2010) Active labour market policy evaluations: A meta-analysis. The Economic Journal, 120, F452-F477.
Duell, N., Grubb, D. & Singh, S. (2009) Activation policies in Finland, OECD Social, Employment and Migration Working Papers, No. 98, OECD Publishing. http://dx.doi.org/10.1787/220568650308
Elmeskov, J., Martin, J. P. & Scarpetta, S. (1998) Key lessons for labor market reforms: Evidence from OECD countries’ experiences, Swedish Economic Policy Review, 5, 205-252.
Greene, W. H. (2003) Econometric analysis. Upper Saddle River (NJ): Prentice Hall.
Hämäläinen, K. & Uusitalo, R. (2005) Kannattaisi kokeilla: Kokeelliset menetelmät työvoimapoliittisten toimenpiteitten vaikutusten arvioinnissa. (Using experimental studies in evaluation of reemployment servies), Työpoliittinen Tutkimus 285, Työministeriö, Helsinki. (In Finnish)
129
Korkeamäki, O. (2001) Työttömyysriskiin vaikuttavat yksilö- ja yrityskohtaiset tekijät Suomessa 1990–1996, VATT-Discussion papers 255. Government Institute for Economic Research: Helsinki. (In Finnish)
Malmberg-Heimonen, I. & Vuori, J. (2000) Työnhakuryhmätoiminnan vaikutukset työmarkkina-asemaan ja koettuun terveyteen” (The effects of job seeking group support on the labour market status and experienced health), Työpoliittinen Tutkimus 221, Työministeriö, Helsinki. (In Finnish)
Ministry of Employment and the Economy. 2011. Työttömät työnhakijat ja osuus työvoimasta kunnittain vuonna 2010. TEM Tilastotiedeote 2011: 1. (inFinnish) http://www.tem.fi/files/29076/1_Tilastotiedote_2011.pdf 15.8.2011
Moisala, J., Suoniemi, I. & Uusitalo, R. (2006) Työttömien tilastollinen profilointi, (Profiling unemployed workers in Finland), Työpoliittinen tutkimus 316. Työministeriö: Helsinki. (In Finnish)
Nickell, S. & Layard, R. (1999) Labor market instirutions and economic performance. In Ashenfelter, O. & Card, D. (Eds.) Handbook of Labor Economics, Elsevier: Amsterdam.
OECD. 2011. Employment Outlook 2011. Paris: OECD. Ollikainen, V. (2003) The determinants of unemployment duration by gender in
Finland, VATT Discussion papers 316. Government Institute for Economic Research: Helsinki.
Rosholm, M. Steghøj, J. Svarer, M. & Hammer, B. (2006) A Danish profiling system, Nationaløkonomisk tidsskrift, 14, 209-229.
Rosholm, M. & Svarer, M. (2008) Estimating the threat effects of active labour market programmes, Scandinavian journal of economics, 10, 385-401.
Rudolph, H. & Konle-Seidl, R. (2005) Profiling for better services: Report on the European profiling seminar, Nuremberg, January12-14 2005. Institut for Employment Research, Nuremberg.
http://doku.iab.de/veranstaltungen/2005/profiling2005_Report_English.pdf 18.10.2005.
Scarpetta, S. (1996) Assessing the role of labor market policies and institutional settings on unemployment: a cross-country study. OECD Economic Studies, 26, 43-98.
Työllisyys nousussa: Työllisyysohjelman loppuraportti (2006) Hallituksen politiikkaohjelmat: Työllisyys.
http://www.mol.fi/mol/fi/99_pdf/fi/06_tyoministerio/01_toiminta/tyollisyys_nousussa_arviointiraportti24461.pdf 18.8.2011 (In Finnish)
U.S. Department of Labor (2011) Worker profiling and reemployment services. http://www.doleta.gov/programs/wprs.cfm 18.8.2011
Uysal, S. D. & Pohlmeier, W. (2011) Unemployment duration and personality, Journal of Economic Psychology, Forthcoming.
Vuori, J., Silvennoinen, J., Vinokur, A. & Price, R. (2002) The työhön job search programme in Finland: Benefits for the unemployed with risk of depression or discouragement, Journal of Occupational Health Psychology, 7, 5-19.

130
Ylöstalo, P. (2006) Työolobarometri, Lokakuu 2006. Työministeriö. http://www.mol.fi/mol/fi/99_pdf/fi/06_tyoministerio/06_julkaisut/10_muut/tyoolobarometri2006.pdf 29.8.2007.

131
Appendix A
Description of variables.
Variable Description Year 1998
Year 2001
Duration of unemployment
Mean duration of unemployment in days 122 112
Gender Female Male
59 % 41 %
62 % 38 %
Type of unem-ployment ben-efit code77
Earnings-related entitlement Basic allowance entitlement Earnings-related plus basic allowance entitlement No entitlement
25 % 23 % 1 % 50 %
38 % 41 % 13 % 8 %
Level of educa-tion
Lower secondary education (ISCED 1997: levels 0, 1, 2) Upper secondary education, vocational (ISCED level 3) Upper secondary education, general programme (ISCED level 3) First stage of tertiary education (ISCED level 5B) Second stage of tertiary education (ISCED levels 5A, 6) Unknown or missing
31 % 40 %
7 % 16 % 5 % 1 %
32 % 40 %
7 % 13 % 7 % 1 %
Field of educa-tion
General programmes Education Humanities and Arts Business and Law Natural sciences Engineering Agriculture Health and Welfare Services Unknown
38 % 1 % 3 % 11 % 0.5 % 17 % 2 % 16 % 11 % 0.5 %
39 % 1 % 3 % 10 % 1 % 15 % 2 % 16 % 12 % 0.5 %
(continues)
77 In Finland, there are two types of unemployment benefits. The first of these, earn-
ings-related benefit (ansiosidonnainen päiväraha), is related to previous earnings and requires membership in an unemployment fund. In Finland, approximately 85% of wage earners are members of such unemployment funds (Böckerman & Uusitalo 2006: 291; Ylöstalo 2006: 159.). Those unemployed persons who are not members of an unemployment fund or who are not otherwise eligible for earnings-related bene-fits receive a basic daily allowance (peruspäiväraha or työmarkinatuki), which is al-most always lower than earnings-related benefits. In the case of the työmarkkinatuki, this allowance is means-tested. Unfortunately, our data do not give us exact infor-mation on which type of unemployment benefits a given person receives. We only know whether or not a local employment office has given permission to an unem-ployment fund to pay the earnings-related benefits, or for the Social Insurance Insti-tution of Finland (Kela) to pay the basic allowance. However, this does not necessari-ly mean that the person has actually received the earnings-related benefits or the basic allowance. For instance, if the person has not been a member of an unemployment fund for long enough, he or she is not eligible for earnings-related benefits. Further-more, the means-testability of the työmarkkinatuki may in some cases mean that the person is not eligible for any unemployment benefits whatsoever.

132
Variable Description Year
1998 Year 2001
Disability sta-tus
Recorded disability 6 % 8 %
Occupation Professionals Healthcare practitioners and health support occupations Administration and office occupations, IT occupations Business and financial occupations Farming, fishing, and forestry Transportation Construction and mining Manufacturing: clothing, forestry and mechanical manu-facturing Other manufacturing and related occupations Service occupations Students A change in the choice of profession Newly graduated No occupation Other
7 % 19 % 9 % 6 % 4 % 3 % 7 %
12 % 5 % 14 % 1 % 1% 2 % 10 % 0 %
8% 21 % 9 % 7 % 3 % 3 % 6 %
11 % 4 % 15 % 1 % 1 % 2 % 11 % 0 %
Nationality Finnish Nordic countries (excluding Finland) Estonia and Russia OECD (excluding Finland and the Nordic countries) Other
97 % 0,1 % 1,4 % 0,3 % 1 %
96 % 0,1 % 2 %
0,4 % 2 %
Previous activ-ity
Under a threat of unemployment Employed Sheltered work Vocational education General education Re-employment education Entrepreneur Military/alternative service Prison/other institution Sick Maternity leave At home with children Retired Other Missing information
5 % 42 %
0.03 % 11 % 2 % 6 % 1 % 3 %
0.3 % 2 % 2 % 3 %
0.1 % 13 % 11 %
5 % 44 %
0.03 % 9 % 2 % 3 % 1 % 2 %
0.4 % 2 % 2 % 3 %
0.1 % 17 % 9 %
Type of job severance
Own request Temporary employment Probation period Dismissal due productional reasons Dismissal due other reasons Closure of the place of business Other Missing information
6 % 54 % 1 % 5 % 1 % 1 % 2 % 30 %
7 % 59 % 1 % 4 % 2 % 2 % 2 % 23 %
(continues)

133
Variable Description Year 1998
Year 2001
Unemployment history
Number of days in unemployment during the past 3 years (mean) Number of days in unemployment during the past year (mean) Number of unemployment periods during the past 3 years (mean) Number of unemployment periods during the past year (mean)
396
132
10
6
365
126
12
7
Month when the unem-ployment spell started
January February March April May June July August September October November December
9 % 7 % 8 % 7 % 8 % 10 % 7 % 9 % 8 % 8 % 8 % 9 %
10 % 7 % 8 % 7 % 8 %
10 % 7 % 8 % 9 % 9 % 8 % 9 %
Month when the unem-ployment spell started
January February March April May June July August September October November December
9 % 7 % 8 % 7 % 8 % 10 % 7 % 9 % 8 % 8 % 8 % 9 %
10 % 7 % 8 % 7 % 8 %
10 % 7 % 8 % 9 % 9 % 8 % 9 %
Age 15-20 years 21-25 years 26-30 years 31-35 years 36-40 years 41-45 years 46-50 years 51-55 years 56-60 years 61-65 years
8 % 17 % 14 % 13 % 12 % 11 % 12 % 9 % 3 % 1 %
7 % 16 % 12 % 11 % 12 % 11 % 12 % 12 % 6 % 1 %
An unemployment spell might end for 11 different reasons. These are: 1) Re-employment ser-vices; 2) Training organised by the local employment office; 3) Referral to a job in the open la-bour market; 4) Finding a job in the open labour market; 5) Temporary dismissal has ended; 6) Not in the labour force; 7) Unemployment pension; 8) Start of education; 9) Seeking a job in another EEA country; 10) Other reason; 11) Missing information.

134
Appendix B
Results from hazard model using the 1998 data. Hazard
rate Standard
error Female (male) 1.013 0.009 Nationality (Finnish) Nordic countries Estonia and Russia OECD Other
0.976
0.694*** 0.862** 0.614***
0.088 0.022 0.050 0.024
Type of unemployment benefit (basic allowance entitlement) Earnings-related entitlement Earnings-related entitlement and basic allowance entitlement No entitlement
1.080*** 1.062*
1.285***
0.011 0.036 0.013
Level of education (lower secondary education) Upper secondary education, vocational Upper secondary education, general Lower tertiary education Tertiary education Unknown
1.310*** 1.107*** 1.372*** 1.354***
1.089
0.129 0.018 0.135 0.135 0.088
Field of education (engineering) General programme Education Humanities and Arts Business and law Natural sciences Agriculture Health and welfare Services Unknown
1.240** 1.275***
0.969 1.013 0.933
1.053** 1.086*** 1.037** 1.101
0.122 0.043 0.022 0.017 0.046 0.026 0.021 0.016 0.079
Level and field of education not specified 1.243 0.187 Disability status (no disability status) 0.857*** 0.012 Occupation (Healthcare practitioners and health supported oc-cupations) Professionals Administration and office occupations, IT occupations Business and financial occupations Farming, fishing, and forestry Transportation Construction and mining Manufacturing: clothing, forestry, and mechanical manufacturing Other manufacturing and related occupations Service occupations Students A change in the choice of profession Newly graduated No occupation Other
0.906*** 0.799*** 0.920***
0.975 1.074*** 1.079*** 0.894*** 0.872*** 0.926***
0.990 0.782*** 0.885*** 0.819*** 0.761**
0.019 0.016 0.018 0.023 0.025 0.022 0.017 0.019 0.016 0.043 0.035 0.029 0.016 0.091
(Continues)
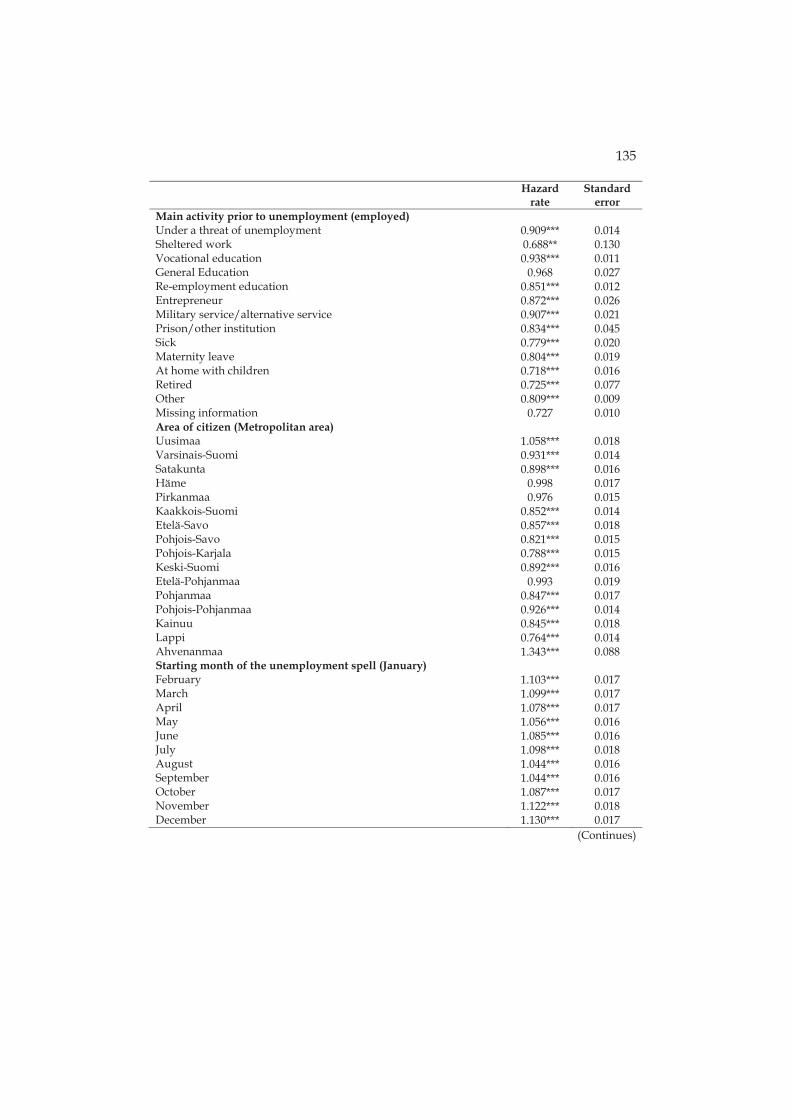
135
Hazard rate
Standard error
Main activity prior to unemployment (employed) Under a threat of unemployment Sheltered work Vocational education General Education Re-employment education Entrepreneur Military service/alternative service Prison/other institution Sick Maternity leave At home with children Retired Other Missing information
0.909*** 0.688** 0.938***
0.968 0.851*** 0.872*** 0.907*** 0.834*** 0.779*** 0.804*** 0.718*** 0.725*** 0.809***
0.727
0.014 0.130 0.011 0.027 0.012 0.026 0.021 0.045 0.020 0.019 0.016 0.077 0.009 0.010
Area of citizen (Metropolitan area) Uusimaa Varsinais-Suomi Satakunta Häme Pirkanmaa Kaakkois-Suomi Etelä-Savo Pohjois-Savo Pohjois-Karjala Keski-Suomi Etelä-Pohjanmaa Pohjanmaa Pohjois-Pohjanmaa Kainuu Lappi Ahvenanmaa
1.058*** 0.931*** 0.898***
0.998 0.976
0.852*** 0.857*** 0.821*** 0.788*** 0.892***
0.993 0.847*** 0.926*** 0.845*** 0.764*** 1.343***
0.018 0.014 0.016 0.017 0.015 0.014 0.018 0.015 0.015 0.016 0.019 0.017 0.014 0.018 0.014 0.088
Starting month of the unemployment spell (January) February March April May June July August September October November December
1.103*** 1.099*** 1.078*** 1.056*** 1.085*** 1.098*** 1.044*** 1.044*** 1.087*** 1.122*** 1.130***
0.017 0.017 0.017 0.016 0.016 0.018 0.016 0.016 0.017 0.018 0.017
(Continues)

136
Hazard rate
Standard error
Age (15-19 years) 20-24 25-29 30-34 35-39 40-44 45-49 50-54 55-59 60-64
0.930*** 0.892*** 0.868*** 0.825*** 0.777*** 0.832*** 0.758*** 0.596*** 0.616***
0.015 0.016 0.016 0.016 0.015 0.016 0.015 0.014 0.025
Previous unemployment history Number of unemployment spells during the last year (zero) 1 spell 2-5 spells 6-10 spells 11-20 spells 21 spells or more Number of unemployment spells during the past 3 years (zero) 1 spell 2–5 spells 6–10 spells 11–30 spells 31 spells or more Duration of cumulative unemployment during the past year (1-50 days) 51-100 days 101-200 days 201 days or more Duration of cumulative unemployment during the past 3 years (1-100 days 101-300 days 301-600 days 601-900 days 901 days or more
0.881*** 1.335*** 2.596*** 3.410*** 5.529***
0.571*** 0.688*** 1.141*** 1.458*** 1.937***
0.824*** 0.753*** 0.720***
0.800** 0.646*** 0.551*** 0.475***
0.015 0.023 0.056 0.082 0.143
0.015 0.017 0.031 0.044 0.064
0.011 0.010 0.010
0.011 0.009 0.009 0.009
Significant at the *** 1 % **5 % *10 % level. The reference groups are in parenthesis.

137
Appendix C
The predictive performance among different subgroups. Subgroup Spearman’s rank correla-
tion coefficient All 0.7885 Gender Male 0.7764 Female 0.7547 Nationality Finn 0.7889 Nordic Countries 0.5365 Estonia, Russia 0.7183 OECD 0.8156 Other 0.7303 Area of residence Metropolitan area 0.7067 Uusimaa 0.7725 Varsinais-Suomi 0.7561 Satakunta 0.7079 Häme 0.7967 Pirkanmaa 0.7897 Kaakkois-Suomi 0.7750 Etelä-Savo 0.7628 Pohjois-Savo 0.7605 Pohjois-Karjala 0.7810 Keski-Suomi 0.7876 Etelä-Pohjanmaa 0.7616 Pohjanmaa 0.7447 Pohjois-Pohjanmaa 0.7584 Kainuu 0.7648 Lappi 0.7838 Ahvenanmaa 0.6351 Age 15-29 years 0.7620 30-39 years 0.7793 40-49 years 0.7785 50-64 years 0.8239 Level of education Lower secondary education 0.8090 Upper secondary education, vocational 0.7727 Upper secondary education, general 0.7486 First stage of tertiary education 0.7466 Second stage of tertiary education 0.7926 Unknown 0.7761 (Continues)

138
Subgroup Spearman’s rank cor-relation coefficient
Field of education General programme 0.7999 Education 0.7043 Humanities and arts 0.8009 Business and law 0.7930 Natural sciences 0.8111 Engineering 0.7689 Agriculture 0.8107 Health and welfare 0.6107 Services 0.7450 Unknown 0.7865 Disable 0.8038 Occupation Professionals 0.7902 Healthcare practitioners and health support occupations 0.6346 Administration and office occupations, IT occupations 0.8101 Business and financial occupations 0.8155 Farming, fishing, and forestry 0.7937 Transportation 0.8011 Construction and mining 0.7118 Manufacturing: clothing, forestry, and mechanical manufac-turing 0.7816 Other manufacturing and related occupations 0.8045 Service occupations 0.7560 Student 0.6605 A change in the choice of profession 0.8249 Newly graduated 0.6899 No occupation 0.7129 Other 0.5876 Previous activity Under a threat of unemployment 0.7902 Employed 0.7816 Sheltered work 0.7248 Vocational education 0.7598 General education 0.6928 Re-employment education 0.7343 Entrepreneur 0.8286 Military service (or non-military service) 0.7392 Prison/other institution 0.6589 Sick 0.8016 Maternity leave 0.7451 At home with children 0.7774 Retired 0.6133 Other 0.7870 Missing information 0.7210
(Continues)

139
Subgroup Spearman’s rank cor-relation coefficient
Type of job severance Own request 0.7938 Temporary employment 0.7743 Probation period 0.7085 Dismissal due productional reasons 0.8320 Dismissal due other reasons 0.7614 Closure of the place of business 0.8267 Other 0.7773 Missing information 0.7741

140
SUMMARY IN FINNISH (YHTEENVETO)
Tässä väitöskirjassa tarkastellaan persoonallisuuden merkitystä työmarkkinoil-la. Väitöskirja koostuu neljästä erillistutkimuksesta, joita edeltää johdantoluku. Johdanto käsittelee lyhyesti persoonallisuuteen liittyviä käsitteitä taloustieteen ja psykologian näkökulmasta, tarkastelee väitöskirjan teemoihin liittyviä aikai-sempia tutkimuksia, ja kokoaa väitöskirjan keskeiset tulokset. Väitöskirjan kol-men ensimmäisen artikkelin tulokset perustuvat Lapsesta aikuiseksi -tutkimuksen otokseen, jossa on seurattu pääosin vuonna 1959 syntyneitä henki-löitä 8 vuoden iästä 42-vuotiaiksi. Alkuperäinen otos käsitti 12 kokonaista kou-luluokkaa, jotka oli valittu satunnaisesti Jyväskylän kouluista. Persoonallisuutta on mitattu erityisesti viiden suuren persoonallisuuspiirteen (Big Five personali-ty traits) avulla, jotka ovat avoimuus uusille kokemuksille, tunnollisuus, ulos-päin suuntautuneisuus, sovinnollisuus ja neuroottisuus. Tutkimuksissa on tar-kasteltu, miten nämä persoonallisuuden piirteet ovat yhteydessä työllisyyteen, työttömyyteen ja työmarkkinatuloon. Lisäksi väitöskirjan viimeisessä luvussa tarkastellaan tilastollista profilointimallia, joka ennustaa yksilön pitkäaikais-työttömyyden riskin työttömyysjakson alussa.
Väitöskirjan toisessa luvussa tarkastellaan, miten koulutuksen keskeyttä-neiden työurat 15 ja 42 ikävuoden välillä poikkeavat niiden henkilöiden työ-urista, jotka ovat suorittaneet aloittamansa opinnot loppuun koko koulu-tusuransa ajan. Lapsesta aikuiseksi –aineiston perusteella koulutuksen keskeyt-täminen on yhteydessä heikompaan työmarkkinauraan. Tämä ilmenee negatii-visena yhteytenä koulutuksen keskeyttämisen ja työllisyysvuosien ja toisaalta positiivisena yhteytenä keskeyttämisen ja työttömyysvuosien välillä. Kun per-soonallisuudenpiirteet huomioidaan, yhteyttä ei ole yhtä selvästi havaittavissa. Tämä viittaa siihen, että koulutuksen keskeyttäneiden persoonallisuuden piir-teet ovat yhteydessä heikompaan menestymiseen työmarkkinoilla.
Luvussa kolme tarkastellaan persoonallisuuspiirteiden ja työmarkkinatu-lon välistä yhteyttä 42-vuotiaana Lapsesta aikuiseksi –tutkimukseen perustuen. Tulosten mukaan aikuisena mitattu ulospäin suuntautuneisuus on yhteydessä korkeampaan työmarkkinatuloon, kun huomioidaan henkilön aiempi koulutus sekä työ- ja työttömyyshistoria. Tutkimuksessa havaitaan myös, että konstruk-tiivinen käyttäytyminen 8-vuotiaana, jota kuvaa aktiivinen ja hyvin kontrolloitu käyttäytyminen sosiaalisissa tilanteissa, on yhteydessä korkeampaan työmark-kinatuloon 42-vuotiaana. Tämä viittaa siihen, että yhteys persoonallisuuden ja työmarkkinatulon välillä on kauaskantoinen.
Väitöskirjan neljäs luku käsittelee persoonallisuuden piirteiden ja työttö-myyden välistä yhteyttä Lapsesta aikuiseksi -aineiston valossa. Tulosten mu-kaan avoimuus uusille kokemuksille on yhteydessä pidempään työttömyyden kokonaiskestoon ikävuosina 33 ja 50. Lisäksi havaitaan positiivinen yhteys neu-roottisuuden ja yksittäisen työttömyysjakson keston välillä. Tutkimuksen pe-rusteella neuroottisuuden ja työttömyysjakson keston välinen syy-seuraussuhde ei kuitenkaan ole selvä. Havaittu yhteys voi johtua myös siitä, että työttömyyskokemukset nostavat yksilön neuroottisuutta.

141
Väitöskirjan viimeinen luku esittelee rekisteriaineistoon perustuvan tilas-tollisen profilointimallin, joka ennustaa työttömyyden pitkittymisen riskin työt-tömyyden alussa. Profiloinnissa käytetään apuna henkilön taustatietoja, kuten tietoa koulutuksesta, iästä ja aiemmasta työttömyyshistoriasta. Tulosten perus-teella profilointimallin ennustuskyky on hyvä. Työttömyyden alussa tapahtuvat profiloinnin etuna on, että henkilö voidaan tarvittaessa ohjata toimenpiteisiin ennen työttömyyden pitkittymistä. Näin voidaan ehkäistä työttömyyden pitkit-tymisestä syntyviä ongelmia.

J Y V Ä S K Y L Ä S T U D I E S I N B U S I N E S S A N D E C O N O M I C S
1 LAINE, JUHANI, Toimialareseptin ja yrityspara-digman muutos sekä sen vaikutus strategiseenmuutokseen. Laadullinen ja historiallinencase-tutkimus perheyrityksen siirtymisestämonialayhtymän osaksi. - Change in industryrecipe and company paradigm and its impacton strategic change. A qualitative andlongitudinal case study on a one-familyowned company which moved into thecontext of a multi-business company. 252 p.Summary 12 p. 2000.
2 WAHLGRÉN, ASTA, Mastery and slavery.Triangulatory views on owner-managers’managerial work. - Isäntä ja renki.Trianguloituja näkökulmia omistajajohtajienjohtamistyöhön. 138 p. Yhteenveto 4 p. 2000.
3 SEPPÄ, MARKO, Strategy logic of the venturecapitalist. Understanding veture capitalism -the businesses within - by exploring linkagesbetween ownership and strategy of venturecapital companies, over time, in America andEurope. 321 p. Yhteenveto 9 p. 2000.
4 PEKKALA, SARI, Regional convergence andmigration in Finland, 1960-95. 121 p.Yhteenveto 1 p. 2000.
5 KORHONEN, JOUNI, Industrial ecosystem. Usingthe material and energy flow model of anecosystem in an industrian system. - Teollinenekosysteemi - Ekosysteemin materiaali- jaenergiavirtamallin soveltaminen teollisessasysteemissä.131 p. Tiivistelmä 1 p. 2000.
6 KARVONEN, MINNA-MAARI, An industry intransition. Environmental significance ofstrategic reaction and proaction mechanismsof the Finnish pulp and paper industry. 146 p.Yhteenveto 2 p. 2000.
7 RITSILÄ, JARI, Studies on the spatialconcentration of human capital. 140 p.Yhteenveto1 p. 2001.
8 LITTUNEN, HANNU, The birth and success of newfirms in a changing environment. 261 p.Yhteenveto 2 p. 2001.
9 MATTILA, MINNA, Essays on customers in thedawn of interactive banking. - Asiakkaatinteraktiivisen pankkiliiketoiminnan aamun-koitossa. 154 p. Yhteenveto 3 p. 2001.
10 HYRSKY, KIMMO, Reflections on the advent of amore enterprising culture in Finland: anexploratory study. 244 p. Tiivistelmä 4 p. 2001.
11 KUJALA, JOHANNA, Liiketoiminnan moraaliaetsimässä. Suomalaisten teollisuusjohtajiensidosryhmänäkemykset ja moraalinen päätök-senteko. - Searching for business morality.Finnish industrial managers’ stakeholderperseptions and moral decision-making. 217p. Summary 4 p. 2001.
12 LÄMSÄ, ANNA-MAIJA, Organizationaldownsizing and the Finnish manager from anethical perspective. - Organisaationkutistaminen ja suomalainen liikkeenjohtoeettisestä näkökulmasta tarkasteltuna 61 p.(115 p.) Summary 5 p. 2001.
13 GRONOW, TITO, Material flow models inenvironmental policy planning. Case: pulp
and paper industry. - Materiaalivirtamallitympäristöpolitiikan ja -toimintatapojensuunnittelussa. Case: Massa- ja paperiteolli-suus. 103 p. (144 p.) Yhteenveto 1 p. 2001.
14 MOILANEN, RAILI, A learning organization:machine or human? - Oppiva organisaatio:kone vai oppivien ihmisten yhteisö? 55 p. (162p.) Yhteenveto 7 p. 2001.
15 HOKKANEN, SIMO, Innovatiivisen oppimisyhtei-sön profiili. Ammattikorkeakoulujen tekniikanja liikenteen koulutusalan näkökulmastatarkasteltuna. - The factors contributing to theprofile of an innovative learning community.242 p. Summary 10 p. 2001.
16 PAAJANEN, PEKKA, Yrittäjyyskasvattaja.Ammattikorkeakoulun hallinnon ja kaupanalan opettajien näkemykset itsestään jatyöstään yrittäjyyskasvattajana. - Anentrepreneurship educator. Teachers´ views ofthemselves and their work as anentrepreneurship educator at the polytechniclevel, in the field of business andadministration. 276 p. Summary 9 p. 2001.
17 MANGELOJA, ESA, Nordic stock marketintegration. - Pohjoismaisten osakemarkkinoi-den integraatio. 164 p. Yhteenveto 2 p. 2001.
18 KARJALUOTO, HEIKKI, Electronic banking inFinland. Consumer beliefs, attitudes,intentions, and behaviors. - Elektroninenpankkitoiminta Suomessa. Kuluttajienuskomukset, asenteet, aikomukset ja käyttäyty-minen. 195 p. Yhteenveto 3 p. 2002.
19 VIRTANEN, AILA, Laskentatoimi ja moraali.Laskenta-ammattilaisten käsityksiä hyvästäkirjanpitotavasta, hyväksyttävästä vero-suunnittelusta ja hyvästä tilintarkastusta-vasta. 184 p. Summary 4 p. 2002.
20 TENHUNEN, MARJA-LIISA, The professionalgrowth of an accounting agency entrepreneur.- Tilitoimistoyrittäjän ammatillinen kasvu.121 p. (359) Yhteenveto 7 p. 2002.
21 ALANKO, JUHA, Siipien alla ilmaa. Liikenne-ilmailun lentotoiminnan johtaminen liikenne-lentäjien miehistönkäytön tehokkuudella jakustannuksilla mitattu. Empiirisenä kohteenaFinnair Oy 1980- ja 1990-luvuilla. - Air underwings. 240 p. Summary 2 p. 2002.
22 NIEMELÄ, TARJA, Inter-Firm Co-operationCapability. - A Processual Empirical Study onNetworking Family Firms. 204 p. Yhteenveto 1p. 2003.
23 SAJASALO, PASI, Strategies in transition - theinternationalization of Finnish forest industrycompanies. 223 p. Yhteenveto 8 p. 2003.
24 NEVANPERÄ, ERKKI, Yrittäjyys Suupohjanopiskelijanuorten ajattelussa. TutkimusSuupohjan seudun nuorisoasteen opiskelijoi-den yrittäjyysnäkemyksistä sekäyrittäjyysopetuksen opetussuunnitelmankehittämispyrkimyksistä. - How the youngresidents in Suupohja region seeentrepreneurship: study of students´ opinions

J Y V Ä S K Y L Ä S T U D I E S I N B U S I N E S S A N D E C O N O M I C S
about entrepreneurship in juvenile degreeschools and the efforts in developing thecurriculum of entrepreneurship education.210 p. Summary 2 p. 2003.
25 JOUTSEN-ONNELA, MERJA, Turvallisuutta jasopusointua vai jännitystä ja valtaa. Tutkimussairaanhoitaja- ja terveydenhoitajaopiskeli-joiden yrittäjyys- ja muista arvoista. - Securityand harmony or thrills power. 229 p.Summary 3 p. 2003.
26 RAJOTTE, ALAIN, Knowledge and decisions inenvironmental contexts. A case study of thepulp and paper industry. 190 p. 2003.
27 HAAPANEN, MIKA, Studies on the Determinantsof Migration and the Spatial Concentration ofLabour. 127 p. Yhteenveto 1 p. 2003.
28 SUORANTA, MARI, Adoption of mobile bankingin Finland. - Mobiilipankkipalveluidenadoptio Suomessa. 79 p. (167 p.) Yhteenveto3 p. 2003.
29 MATTILA, ANSSI, Understanding seamlessmobile service interface between customer andtechnology: An empirical study 62 p. (170 p.)Yhteenveto 3 p. 2003.
30 HALTTUNEN, JUSSI, Teollisten perheyritystenkasvudynamiikan systeemiteoreettinentarkastelu. - The growth dynamics ofindustrial family-owned firms – a systemstheory approach. 302 p. Summary 8 p. 2004.
35 PALOVIITA, ARI, Matrix Sustainability:Applying input-output analysis toenvironmental and economic sustainabilityindicators. Case: Finnish forest sector.- Matriisikestävyys: Panos-tuotosanalyysinsoveltaminen ekologisen ja taloudellisenkestävyyden indikaattoreihin. Case: Suomenmetsäsektori. 216 p. Yhteenveto 2 p. 2004.
36 HANZELKOVA, ALENA, Re-establishingtraditional Czech family businesses. Amultiple case study on the present challeges.306 p. Tiivistelmä 1 p. 2004.
37 TUUNANEN, MIKA, Essays on franchising inFinland – Empirical findings on franchisorsand franchisees, and their relationships.143 p. (252 p.) 2005.
38 AHLFORS, ULLA, Successful interactive business:Integration of strategy and IT. - Menestykselli-nen vuorovaikutteinen e-liiketoiminta: Strate-gian ja informaatioteknologian integrointia.353 p. Yhteenveto 2 p. 2005.
39 NIEMI, LIISA, The father, the son and therefreshed spirit. Strategic renewal after familybusiness succession in the context of thetextile, clothing, leather and footwearindustry. - Isä, poika ja yritys yhä hengissä.Perheyrityksen strateginen uudistuminensukupolvenvaihdoksen jälkeen – tapaus-tutkimus tekstiili-, vaatetus, nahka- ja kenkä-teollisuudessa. 219 p. Summary 2 p. 2005.
40 LASSILA, HILKKA, Matkailutilan sukupolven-vaihdos talonpoikaisten arvojen ohjaamanaprosessina. – Traditional values affectingsuccession in farm tourism businesses. 206 p.Summary 12 p. 2005.
41 TURJANMAA, PIRKKO, Laadun oppiminenpienissä yrityksissä. Mallin konstruointi jakehittäminen. – Learning of quality in smallcompanies. Construction and Development ofa model. 204 p. Summary 6 p. 2005.
31 MADUREIRA, RICARDO, The role of personalcontacts of foreign subsidiary managers in thecoordination of industrial multinationals: thecase of Finnish subsidiaries in Portugal.186 p. - Ulkomaisten tytäryhtiöiden johtajienhenkilökohtaisten kontaktien rooli koordi-noinnissa monikansallisissa teollisuus-yrityksissä. Case: Suomalaiset tytäryhtiötPortugalissa. Yhteenveto 1 p. 2004.
32 KOIVUNEN, MAURI, Osaamisperustaisen kilpai-lukyvyn ja yrittäjyyden edistäminen. Tutki-mustapauksena Raahen tietotekniikan muun-tokoulutusohjelma insinööreille. - Enhancingcompetence-based competitiveness andentrepreneurship. Research case: Professionaldegree upgrading in information technologyfor engineers in Raahe. 216 p. Summary 3 p.2004.
33 KANSIKAS, JUHA, Myyjiä, tuotekehittäjiä jatuotejohtajia. Tuotepäälliköiden tehtävä-rakenteen heijastuminen tuotekehitys-projektissa sisäiseen yrittäjyyteen ja intuitiivi-seen päätöksentekotyyliin kuuluviin tekijöi-hin. - Sales people, product developers andproduct champions – product managers´responsibilities and job roles in a productdevelopment project and their reflection tointrapreneurship and intuitive decisionmaking style. 258 p. Summary 6 p. 2004.
42 YLÄOUTINEN, SAMI, Development andfunctioning of fiscal frameworks in theCentral and Eastern European countries. -Finassipolitiikan kehikkojen kehittyminen jatoiminta Keski- ja Itä-Euroopan maissa. 220 p.Yhteenveto 4 p. 2005.
43 TÖRMÄKANGAS, RAILI, Perheyrittäjyyden arjenkulttuuri. Kolmen sukupolven sahatoimintaa.– The everyday culture of entrepreneurshipover three generations in a saw mill. 203 p.Summary 3 p. 2005.
44 TUNKKARI-ESKELINEN, MINNA, Mentored to feelfree. Exploring family business nextgeneration members’ experiences of non-family mentoring. - Mentoroinnilla vapauden-tunteeseen: Kartoittava tutkimus perheyritys-ten seuraajasukupolven mentoroinnistasaamistaan kokemuksista. 233 p.Yhteenveto 3 p. 2005.
34 MUNNUKKA, JUHA, Perception-based pricingstrategies for mobile services in customermarketing context. 65 p. (151 p.) Yhteenveto1 p. 2004.

J Y V Ä S K Y L Ä S T U D I E S I N B U S I N E S S A N D E C O N O M I C S
45 LINTULA, PAAVO, Maakuntalehden toimittajantoimintatila teknis-rationaalisessa ajassa. -The action scope of a journalist in a regionalnewspaper under pressure of a technical-rational discourse. 321 p. Summary 3 p. 2005.
46 HEIKKILÄ, MAURI, Minäkäsitys, itsetunto jaelämänhallinnan tunne sisäisen yrittäjyydendeterminantteina. - The self-concept, theself-esteem and the sense of life control as thedeterminants of the intrapreneurship. 209 p.Summary 5p. 2006.
47 SYRJÄLÄ, JARI, Valoon piirrettyjä kuvia. Tarinoi-ta ja tulkintoja sähköalan murroksesta hyvin-voinnin ja henkilöstöstrategian näkökulmasta.- Pictures in Light. Narratives andinterpretations of changes in the energy sectorfrom the point of view of welfare andpersonnel strategy. 333 p. 2006.
48 NIEMELÄ, MARGIT, Pitkäikäisten perheyritystenarvoprofiili. Pitkäikäisten perheyritystenarvojen ja jatkuvuuden kuvausBronfenbrennerin ekologisen teorian avulla.- The value profile of long-lived family firms.The description of the values and thecontinuity of long-lived family firms as seenthrough Bronfenbrenner's ecological theory .187 p. Summary 2 p. 2006.
49 KAKKONEN, MARJA-LIISA, Intuition andentrepreneurs. A Phenomenological Study ofmanagerial intuition of finnish familyentrepreneurs. 176 p. Tiivistelmä 2 p. 2006.
50 LAHTONEN, JUKKA, Matching heterogeneous jobseekers and vacancies. Empirical studiesusing finnish data. 110. p. Yhteenveto 2 p.2006.
51 OLLIKAINEN, VIRVE, Gender Differences inUnemployment in Finland. 157. p. Yhteenveto1 p. 2006.
52 PURONAHO, KARI, Liikuntaseurojen lasten januorten liikunnan markkinointi – Tutkimuslasten ja nuorten liikunnan tuotanto-prosessista, resursseista ja kustannuksista.- Sport marketing by sport clubs for childrenand youngsters – Exploring the productionprocess, resources and costs of children’sand youngsters’ sport activities. 236 p.Summary 3 p. 2006.
53 POIKKIMÄKI, SANNA, Look closer to see further.Exploring definitions, goals and activities ofenvironmental life cycle management 153. p.Yhteenveto 1 p. 2006.
54 SILJANEN, TUULA, Narratives of expatriates inthe Middle East. Adaptation, identity andlearning in non-profit organizations. 250 p.Tiivistelmä 2p. 2007.
55 WESTERHOLM, HELY, Tutkimusmatka pienyrit-täjän työvalmiuksien ytimeen. Kirjallisuuteenja DACUM-analyysiin perustuva kartoitus. – A journey into the core of the occupationalcompetence and attitudes of small businessentrepreneurs. 221 p. Summary 5 p. 2007.
56 HYNNINEN, SANNA-MARI, Matching in locallabour markets: Empirical studies fromFinland. 100 p. Summary 2 p. 2007.
57 TOHMO, TIMO, Regional economic structures inFinland: Analyses of location and regionaleconomic impact. 53 p. (273 p.) Tiivistelmä2 p. 2007.
58 HIIRONEN, MARJA-LIISA, Hoivayritykset kotonaasuvien ikääntyvien toimintakyvyn tukena.Ikääntyvien, kuntapäättäjien ja hoivayrittä-jien näkökulma. - Care enterprises and thefunctionality of elderly people living at home.The perspectives of aging people, municipaldecision-makers and care entrepreneurs.153 p. Summary 2 p. 2007.
59 ARHIO, KAIJA, Luova laatu ja arvoinnovaatiotoppivan verkoston tuottamina. Tapaus-tutkimus rakennuspuutuoteteollisuudenverkostosta. - Creative quality and valueinnovations created by a learning network.Case-study within a building componentsmanufacturing network. 191 p. Summary 10 p.2007.
60 HEIKKINEN, EILA, Yrittäjän persoonallisuus jasen yhteys yrityksen kasvuun BigFive-teorianmukaan tarkasteltuna. - An entrepreneur’spersonality and its impact on the firm’sgrowth: An analysis through the Big FiveTheory. 139 p. Summary 5 p. 2007.
61 ELO-PÄRSSINEN, KRISTA, Arvot ja yhteiskunta-vastuullinen toiminta suurissa suomalaisissaperheyrityksissä. Omistajan näkökulma.- Values and corporate social performance inlarge Finnish family firms. Owners view.188 p. Summary 2 p. 2007.
62 NYYSSÖLÄ, HANNU, Omistajaohjaus, sisäinenyrittäjyys ja tuloksellisuus ammatti-korkeakouluissa. - Corporate governance,intrapreneurship and effectiveness in theUniversities of Applied Sciences. 361 p.Summary 9 p. 2008.
63 KAUKO-VALLI, SOFIA, Subjective well-being as anindividually constructed phenomenon. 179 p.Summary 1 p. 2008.
6 4 SINTONEN, TEPPO, Diversiteetti ja narratiivisuus.Tutkielmia diskursiivisesta organisaatio-todellisuudesta. - Diversity and Narrative.Discursive approaches to organizationalreality. 59 p (123 p.) Summary 2 p. 2008.
65 KOOSKORA, MARI, Understanding corporatemoral development in the context of rapidand radical changes . The case of Estonia.105 p. (198 p.) Tiivistelmä 9 p. 2008.
66 TAKANEN-KÖRPERICH, PIRJO, Sama koulutus – eriurat. Tutkimus Mainzin yliopistossa sovelta-vaa kielitiedettä vuosina 1965–2001opiskelleiden suomalaisten urakehityksestäpalkkatyöhön, freelancereiksi ja yrittäjiksi.– Same Education – Different Careers. Thestudy of the Finnish nationals who havestudied applied linguistics in the Universityof Mainz, Germany, during the years 1965–
J Y V Ä S K Y L Ä S T U D I E S I N B U S I N E S S A N D E C O N O M I C S
2001, and their working development asemployees, freelancers and entrepreneurs.203 p. Summary 2 p.Zusammenfassung 3 p.2008.
67 RANKINEN, ARJA, Kulttuurinen osaaminenEtelä-ja Itä-Kiinassa toimittaessa. Illustraa-tiona eräs tulkinta suomalaisjohtajien Kiina-kokemuksista. - Cultural competence whenoperating in Southern and Eastern China. Aninterpretation of some Finnish businessmanagers’ experiences in China as anillustration. 294 p. Summary 4 p. 2008.
68 KOTAJA, SARI MAARIT SUSANNA, Keskipoh-jalaisyritykset toimintaympäristönsä ja senhyvinvoinnin rakentajina. Diskurssianalyyt-tinen näkökulma. - Central OstrobothnianSMEs as constructors of their operatingenvironment and regional welfare. Discourseanalytic research. 209 p. Summary 3 p. 2008.
69 TEITTINEN, HENRI, Näkymätön ERP. Taloudelli-sen toiminnanohjauksen rakentuminen. -Invisible ERP. Construction of enterpriseresource planning. 206 p. Summary 2 p. 2008.
70 LUOTO, JANI, Bayesian applications in dynamiceconometric models. - Bayesilaisia sovelluksiadynaamisissa ekonometrisissa malleissa.148 p. Tiivistelmä 3 p. 2009.
71 TOURUNEN, KALEVI, Perheyritykset kansanta-louden resurssina. Keskisuurten ja suurtenyritysten omistajuus, toiminnan laajuus jakannattavuus Suomessa 2000–2005. - Familybusinesses as an economic resource.Ownership, scale and profitability of middle-sized and large-sized businesses in Finlandin 2000–2005. 174 p. Summary 3 p. 2009.
72 NIEMELÄ-NYRHINEN, JENNI, Factors affectingacceptance of mobile content services amongmature consumers. - Mobiilien sisältöpal-veluiden omaksumiseen vaikuttavat tekijätikääntyvien kuluttajien keskuudessa. 148 p.Yhteenveto 3 p. 2009.
73 LAURONEN, MIRJA, Yrittäjämäinen elinkeino-politiikka. Kolmevaiheinen, diskurssiana-lyyttinen tarkastelu kunnan elinkeinopoli-tiikan roolista ja tehtävistä. - Entrepreneurialeconomic policy. A three-phase discourse-analytical study of the roles and functions ofmunicipal economic policy. 193 p. Summary4 p. 2009.
74 KOSKINEN, MARKETTA, Omistajuus erilaistenyrittäjien käsityksinä ja tulkintoina. Fenome-nografinen tutkimus. - Ownership asunderstood and interpreted by variousentrepreneur types. A phenomenographicstudy. 227 p. Summary 2 p. 2009.
75 FRANTSI, TAPANI, Ikääntyvä johtaja tienhaaras-sa. Ikääntyvien johtajien kertomukset johta-juuden ja identiteetin rakentajana. - Stories asidentity construction of ageing leaders at thecareer crossroads. 247 p. 2009.
76 ONKILA, TIINA, Environmental rhetoric inFinnish business. Environmental values andstakeholder relations in the corporate
argumentation of acceptable environmentalmanagement. 200 p. Yhteenveto 1 p. 2009.
77 HARTIKAINEN, PERTTI, “Tätä peliä ei hävitä”Abduktiivinen tutkimus Halton-konserninoppimishistoriasta 1968–2006. - “We won´tlose this game.” Abductive research onlearning history of Halton Group 1968–2006.190 p. Summary 4 p. 2009.
78 KERTTULA, KARI, Valta ja muutos. Ylimmänjohdon tulkinta vallan ilmenemisestä organi-saation strategisessa muutosprosessissa.- Power and change. Interpretation of the topmanagement about the power arising from astrategic change process: qualitative casestudy within a forest industry organization.206 p. Summary 3 p. 2009.
79 ANTTONEN, RITVA, »Manne takaraivossa».Ennakkoluulot ja syrjintä suomalaistenromaniyrittäjien kokemana. Fenomeno-grafinen tutkimus. - Experiences of prejudiceand discrimination of Roma entrepreneurs inFinland. A phenomenographic study. 199 p.Summary 3 p. 2009.
80 SALVADOR, PABLO F., Labour market dynamicsin the Nordic countries according to the chainreaction theory. 148 p. 2009.
81 PELLINEN, ANTTI, Sijoitusrahastoasiakkaidentaloudellinen kyvykkyys ja tulevat lisä-sijoituspäätökset. - Financial capability ofmutual fund clients and additionalinvestment decisions. 196 p. 2009.
82 KALLIOMAA, SAMI, Sisäinen markkinointijohtamisena. Tapaustutkimus konepajateolli-suuden projektiorganisaatiosta. - Internalmarketing as management –case study: projectorganisation within the engineering industry.232 p. Summary 8 p. 2009.
83 VON BONSDORFF, MONIKA E., Intentions of earlyretirement and continuing to work amongmiddle-aged and older employees. - Keski-ikäisten ja ikääntyneiden työntekijöideneläke- ja työssä jatkamisaikeet. 86 p. (194 p.)Yhteenveto 3 p. 2009.
84 LAAKKONEN, HELINÄ, Essays on the asymmetricnews effects on exchange rate volatility. -Esseitä makrotalouden uutisten vaikutuksistavaluuttakurssien volatiliteettiin. 124 p.Yhteenveto 4 p. 2009.
85 LAPPALAINEN, MINNA, Entrepreneurialorientation at the level of dyad relationshipsin supply chains and networks. 138 p.Yhteenveto 3 p. 2009.
86 SILTAOJA, MARJO, Discarding the mirror - Theimportance of intangible social resources toresponsibility in business in a Finnishcontext. - Peiliä hylkäämässä. Aineettomiensosiaalisten resurssien merkitys liiketoimin-nan vastuille. 204 p. Yhteenveto 3 p. 2010.

J Y V Ä S K Y L Ä S T U D I E S I N B U S I N E S S A N D E C O N O M I C S
87 OVASKAINEN, MARKO, Qualificationrequirements of SMEs in Internet-basedelectronic commerce. - Findings from Finland.- Pk-yritysten kvalifikaatiovaatimuksetInternet-pohjaisessa elektronisessa kaupan-käynnissä – löydöksiä Suomesta. 273 p.Yhteenveto 6 p. 2010.
88 KUIVANIEMI, LENI, Evaluation and reasoning inthe entrepreneurial opportunity process:Narratives from sex industry entrepreneurs. -Arviointi ja päättely liiketoiminta-mahdollisuuksien tunnistamisprosessissa.Yrittäjien tarinoita seksiteollisuudesta. 216 p.2010.
89 STORHAMMAR, ESA, Toimintaympäristö ja PK-yritykset. Havaintoja yritysten toimintaanvaikuttavista tekijöistä. - Local environmentand the small and medium sized enterprises.Observations of the factors which affect theoperations of firms. 188 p. Summary 3 p.2010.
90 KOSKINEN, HANNU, Studies on money andlabour market dynamics and goods marketimperfections. - Tutkimuksia raha- jatyömarkkinadynamiikasta ja hyödyke-markkinoiden epätäydellisyyksistä. 106 p.Yhteenveto 2 p. 2010.
91 HÄMÄLÄINEN, ILKKA, Suunnittelijat innovaatio-toiminnan ja kasvun ytimessä. - Architectsand consulting engineers in the core ofinnovation and growth. 270 p. Summary 2 p.2010.
92 KETOLA, HANNU U., Tulokkaasta tuottavaksiasiantuntijaksi. Perehdyttäminen kehittämi-sen välineenä eräissä suomalaisissa tietoalanyrityksissä. - Transformation from a recruit(newcomer) into a productive expert. The joborientation process as a tool for personneldevelopment in Finnish ICT companies. 212p. 2010.
93 RAUTIAINEN, ANTTI, Conflicting legitimationsand pressures in performance measurementadoption, use and change in Finnishmunicipalities. - Ristiriitaiset legitimaatiot japaineet suoritusmittauksen käyttöönotossa,käytössä ja muutoksessa Suomen kunnissa.52 p. (109 p.) Summary 4p. 2010.
94 JAUHIAINEN, SIGNE, Studies on human capitalflows and spatial labour markets. - Tutkimuk-sia inhimillisen pääoman virroista ja alueelli-sista työmarkkinoista Suomessa. 98 p.Summary 1p. 2010.
95 KORSUNOVA, ANGELINA, Encouraging energyconservation with ‘no hard feelings’: a two-part analysis of communication betweenenergy companies and Finnish households.213 p. 2010.
96 NOKSO-KOIVISTO, PEKKA, Verkostoaktivaattorienroolit yritysten verkostoituessa. - Roles ofNetwork Activators in Business NetworkingProcess. 262 p. Summary 6 p. 2010.
97 AALTONEN, HELI, Co-creation of value inadvertising. An interpretive study from theconsumers’ perspective. - Yhteinenarvonluonti mainonnassa. Kuluttaja-keskeinen tulkitseva tutkimus. 186 p.Yhteenveto 2 p. 2010.
98 YLINEN, AULIS, Opettajienyrittäjyyskasvatusvalmiudet Etelä-Pohjan-maan lukioissa. - Teachers’ readiness forentrepreneurship education at SouthernOstrobothnia upper secondary schools. 221 p.Summary 8 p. 2011.
99 MUKKALA, KIRSI, Essays on regionaldevelopment and labor mobility in aknowledge-based economy. - Alueellinenkehitys ja työvoiman liikkuvuus maantieteel-lisen keskittymisen ja osaamisintensiivistenalojen näkökulmasta. 127 p. Yhteenveto 2 p.2011.
100 KONTINEN, TANJA, Internationalizationpathways of family SMEs. - PK-perheyritystenkansainvälistymispolkuja. 98 p. (243 p).Yhteenveto 1 p. 2011.
101 ESKOLA, ANNE, Good learning in accounting.Phenomenographic study on experiencies ofFinnish higher education students.- Hyvä oppiminen laskentatoimessa.Fenomenografinen tutkimus suomalaistenkorkeakouluopiskelijoiden kokemuksista191 p. Yhteenveto 5 p. 2011.
102 TURUNEN, TERO, Yrittäjyys - mitä se merkitsee?”.Yrittäjyyden ja sen sukulaiskäsitteiden käyttökoulutuksessa, tutkimuksessa ja politiikassa1900-luvun loppupuolelta 2000-luvun al-kuun. - Entrepreneurship - What does itmean? The applications of entrepreneurshipand its kindred concepts in education,research and policy from the end of the 20thcentury until the beginning of the 21thcentury. 238 p. 2011.
103 PATJA, PÄIVI, Perheiden omistamisen muuttu-vat merkitykset. Diskurssianalyyttinentutkimus perheiden omistamisenmerkityksellistymisestä Suomessa vuosina1976-2005. - The Changing Meanings ofFamily Ownership. 122 p. Summary 2 p. 2011.
104 TOKILA, ANU, Econometric studies of publicsupport to entrepreneurship. - Ekonometrisiatutkimuksia yrittäjyyden julkisesta tukemises-ta. 157 p. Yhteenveto 3 p. 2011.
105 HALME, PINJA, Iästä johtamiseen - Ikä-johtaminen ja eri-ikäisyys johtajuuden tutki-muskohteena. - Moving from Concepts of Ageto Management - Age Management and AgeDiversity in Management Research. 61 p. (130p.) Summary 1 p. 2011.
106 OMAIR, KATLIN, Women’s managerial careers inthe context of the United Arab Emirates. 57 p.(120 p.) 2011.

J Y V Ä S K Y L Ä S T U D I E S I N B U S I N E S S A N D E C O N O M I C S
107 PEKKALA, AULI, Mestaruus pääomana. Huippu-urheilun tuottama pääoma yrittäjäksiryhtymisen kannalta. - Mastery as capital –How growth into the elite athlete and masterycapital advances the growth intoentrepreneurship. 184 p. Summary 7 p. 2011.
108 LAAKKONEN, ANNE, Construction of theentrepreneurial identity in the family businesscontext. A cross-cultural study. - Yrittäjä-mäisen identiteetin rakentuminen perheyri-tyskontekstissa, kulttuurienvälinen tutkimus.297 p. Yhteenveto 1 p. 2012.
109 MÄKI, KIMMO, Opetustyön ammattilaiset jamosaiikin mestarit. Työkulttuuritammattikorkeakoulu-opettajan toiminnankontekstina. - Teaching professionals andmasters of mosaic – Work cultures as thecontext of action of the teachers in universitiesof applied sciences. 150 p. 2012.
110 PIESKÄ, SAKARI, Enhancing innovationcapability and business opportunities. Casesof SME-oriented applied research. 162 p.(244 p.) Tiivistelmä 2 p. 2012.
111 LEHNER, OTHMAR MANFRED, Socialentrepreneurship perspectives. Triangulatedapproaches to hybridity. 94 p. (177 p.) Yhteen-veto 1 p. 2012.
112 MALIN, VIRPI, Johtajasta tohtoriksi – osaajastaoppijaksi? Organisaatiossa oppimisen montatodellisuutta goffmanilaisena kehysanalyy-sina. - Leaders as Learners. The multiplerealities of learning - a Goffmanian frameanalysis. 176 p. Summary 3 p. 2012.
113 VIINIKAINEN, JUTTA, Personality and labourmarket outcomes. - Persoonallisuuden merki-tys työmarkkinoilla. 141 p. Yhteenveto 2 p.2012.
Related Documents