Chapter 1 INTRODUCTION 1.1 Background of the Study: In today’s context, just the knowledge about business and management theories does not limit into the prescribing books and syllabus by colleges and universities. It is necessary to have the real- time knowledge with theoretical aspects. Getting real-time knowledge with theoretical concept nowadays is about getting practical knowledge entering into the workplace, so that we may not face problems being into the workplace after our university degree. To bridge the gap between theoretical knowledge and practical aspects, internship has been taken as a pool and has become supportive to students also. Internship is the concept where one in course of learning, can put his/her theoretical knowledge into practical aspects. The Internship was carried out at Nepal Investment Bank Ltd. for the partial fulfillment of the Bachelors of Business Administration (BBA) program. The internship is to serve the purpose of acquainting th e st udents wi th the pr ac ti ce of knowle dge of the disc ip line of ba nking administration. This internship program enables the students to transform the academic knowledge learnt through the years into the practical real world environment where the organizations are facing tough competition with the effect of globalization. The practical approach of internship enables the students to learn what the organizations face in terms of employee diversity, develop interpersonal skills, obtain hands-on experience, the pressures that every organization face, the regulatory environments they have to work in and other variables that are prominent in the real working environment. The intern had the main objective of working in the banking industry and hence internship experience proved to be a nice platform to realize what the needs and the requirements for the jobs are in the banking industry. 1.2 Introduction to Banking Industry Bank is a fina ncia l inst itut ion. Fina ncial inst itut ion pla ys an imp ort ant role in accelerating development of the country. Mobilize saving and make investments in different enterprises of 1

Welcome message from author
This document is posted to help you gain knowledge. Please leave a comment to let me know what you think about it! Share it to your friends and learn new things together.
Transcript
8/2/2019 Edited Paw An Final Report
http://slidepdf.com/reader/full/edited-paw-an-final-report 1/40
Chapter 1
INTRODUCTION
1.1 Background of the Study:
In today’s context, just the knowledge about business and management theories does not limit into
the prescribing books and syllabus by colleges and universities. It is necessary to have the real-
time knowledge with theoretical aspects. Getting real-time knowledge with theoretical concept
nowadays is about getting practical knowledge entering into the workplace, so that we may not
face problems being into the workplace after our university degree.
To bridge the gap between theoretical knowledge and practical aspects, internship has been taken
as a pool and has become supportive to students also. Internship is the concept where one in course
of learning, can put his/her theoretical knowledge into practical aspects.
The Internship was carried out at Nepal Investment Bank Ltd. for the partial fulfillment of the
Bachelors of Business Administration (BBA) program. The internship is to serve the purpose of
acquainting the students with the practice of knowledge of the discipline of banking
administration. This internship program enables the students to transform the academic knowledge
learnt through the years into the practical real world environment where the organizations are
facing tough competition with the effect of globalization. The practical approach of internship
enables the students to learn what the organizations face in terms of employee diversity, develop
interpersonal skills, obtain hands-on experience, the pressures that every organization face, the
regulatory environments they have to work in and other variables that are prominent in the real
working environment. The intern had the main objective of working in the banking industry and
hence internship experience proved to be a nice platform to realize what the needs and the
requirements for the jobs are in the banking industry.
1.2 Introduction to Banking Industry
Bank is a financial institution. Financial institution plays an important role in accelerating
development of the country. Mobilize saving and make investments in different enterprises of
1
8/2/2019 Edited Paw An Final Report
http://slidepdf.com/reader/full/edited-paw-an-final-report 2/40
the National economic that consequently help in reducing poverty, rising employment
opportunities and thereby developing the society and country as a whole.
Bank is a financial intermediary between depositors and entrepreneurs.
The intermediation takes place when they accept deposits from general public, corporate bodies
and private organization and deploys that the deposit for profitable purpose in the form of loan
and advances. Bank is a financial service institution. Therefore, in between this intermediation,
bank gets some earning.
Bank is an establishment, which Wales to individuals such as an advances of the money as may
be requested and safety made to and to which individuals entrusts money when and required by
them for use.
“Banks are among one of the most important financial institutions in the economy and essential
business in thousand of local cities. Banks are those financial instituions that after the wide range
of financial services especially credit, saving and payments services and perform the widest range
of financial functions of any business firm in the economy. This multiplicity of bank services and
functions have led to banks being labeled ‘Financial Supermarkets’ and to such familiar
advertising slogans as your bank a full service financial institution.”
1.2.1 Historical Background of Banking System
Thus, the task of the Commercial bank in an under developed countries territory are almost self-
evident. Their purpose is to provide a collection point for saving of a relatively small average
amount from a large number of individual sources. So long as the means to utilize savings safely
and profitably are not available within an economy, funds will either be diverted abroad, sterilized
in useless hoards case are precious metals or more likely still will not accumulate at all.
In our country Nepal, the history of modern Banking system is very new. This becomes explicitwhen one compares Nepalese banking system with the banking system of other countries of the
world. But this does not mean that there was the complete absence of banking activities in Nepal.
Although, the banking in the form of money lending can be traced, bank in the reign of Gun Kam
Dev towards the end of eight century. According to the historical evidence in 423 A.D. Gun Kam
Dev, the king of Kathmandu had borrowed money to rebuild and to rule Kathmandu.
2

8/2/2019 Edited Paw An Final Report
http://slidepdf.com/reader/full/edited-paw-an-final-report 3/40
Another historical example as to the pre-modern banking system is found when Rana Prime
Minister Ranoddip Singh was administering Nepal is 1880 A.D. During his reign one financial
institution name by Tejarath was established to give loans facilities to the government staff and to
afford loans facilities to the public in general in the term of 5% on interest.
There is another financial institution specially established in 1991 for the future welfare of the
government staff it was “Sainik Dravya Kosha.” Staff of that period had to face much more
economic difficulties after retirement from his office. The need to regulate financial and
monetary system increased immensely resulting the establishment of Nepal Rastra Bank in 1956
A.D. In order to cater the demand of banking system, Rastriya Banijya Bank was established in
1966 A.D with 100% government ownership. In order to provide service to the agriculture sector,
Agriculture Development Bank was established in 1968.
The government of Nepal adopted liberal economic policy to accelerate country’s growthand
development. Foreign investment and participation of private sector were encouraged. The
government then enacted “Joint Venture Banking” policy. Commercial banks should operate
under the Commercial Bank Act 2031, Nepal Rastra Act 2058 and Company Act 2053 and
Contract Act 2056. Nepal Arab Bank Ltd. (currently known as NABIL) is the first bank
established in joint investment in Nepal in 2041 B.S. A year later Nepal Indosuez Bank Ltd.
currently renamed as Nepal Investment Bank Ltd. was set up. With the passage of time several
other joint venture and private bank has been established.Nepal Industrial Development
Corporation (NIDC) and Agricultural Development Bank(ADB) was only two development
banks established before the enactment of Nepal Development Bank Act in 2052 B.S. After the
introduction of Nepal Development Act 2052 many development banks have been set up.
1.2.2 Commercial Banking in Nepal
The Nepalese financial sector is composed of banking sector and non-banking sector. Banking
sector comprises Nepal Rastra Bank (NRB) and commercial banks. The non-banking sector
includes development banks, micro development bank, finance companies, cooperative financial
institutions, non-government organization (NGO) performing limited banking activities. Other
financial institution comprise of insurance companies, employee’s provident fund, citizen
investment trust, postal saving offices and Nepal stock exchange. There is tremendous growth in
the number of financial institution in Nepal in the last two decades. At the beginning of 1980s
3
8/2/2019 Edited Paw An Final Report
http://slidepdf.com/reader/full/edited-paw-an-final-report 4/40
when financial sector was not liberalized, there were only two commercial banks and two
development banks performing banking activities in Nepal. There were no micro-credit
development banks, finance companies, cooperatives and NGOs with limited banking transactions.
After the liberalization of the financial sector, financial sector has made a hallmark progress both
in terms of the number of financial institutions and beneficiaries of financial services.
Nowadays, there are 25 commercial banks operating in Nepal, out of them 9 are joint venture with
foreign bank. On the other hand a lot of financial cooperatives are also operating. With the
increasing number of commercial banks, competition among themselves has also become more
complex. In today’s dynamic environment, the commercial banks are trying to introduce and
establish themselves differently from other banks by providing special services and attractive
schemes to its customers.
In Nepal up to now, there are 25 commercial banks in operation which is shown in ANNEXURE
I.
1.2 Introduction of company/organization
Nepal Investment Bank Ltd. (NIBL), previously Nepal Indosuez Bank Ltd., was established in
1986 as a joint venture between Nepalese and French partners. The French partner (holding 50% of
the capital of NIBL) was Credit Agricole Indosuez, a subsidiary of one the largest banking group
in the world.
With the decision of Credit Agricole Indosuez to divest, a group of companies comprising of
bankers, professionals, industrialists and businessmen, had acquired on April 2002 the 50%
shareholding of Credit Agricole Indosuez in Nepal Indosuez Bank Ltd.
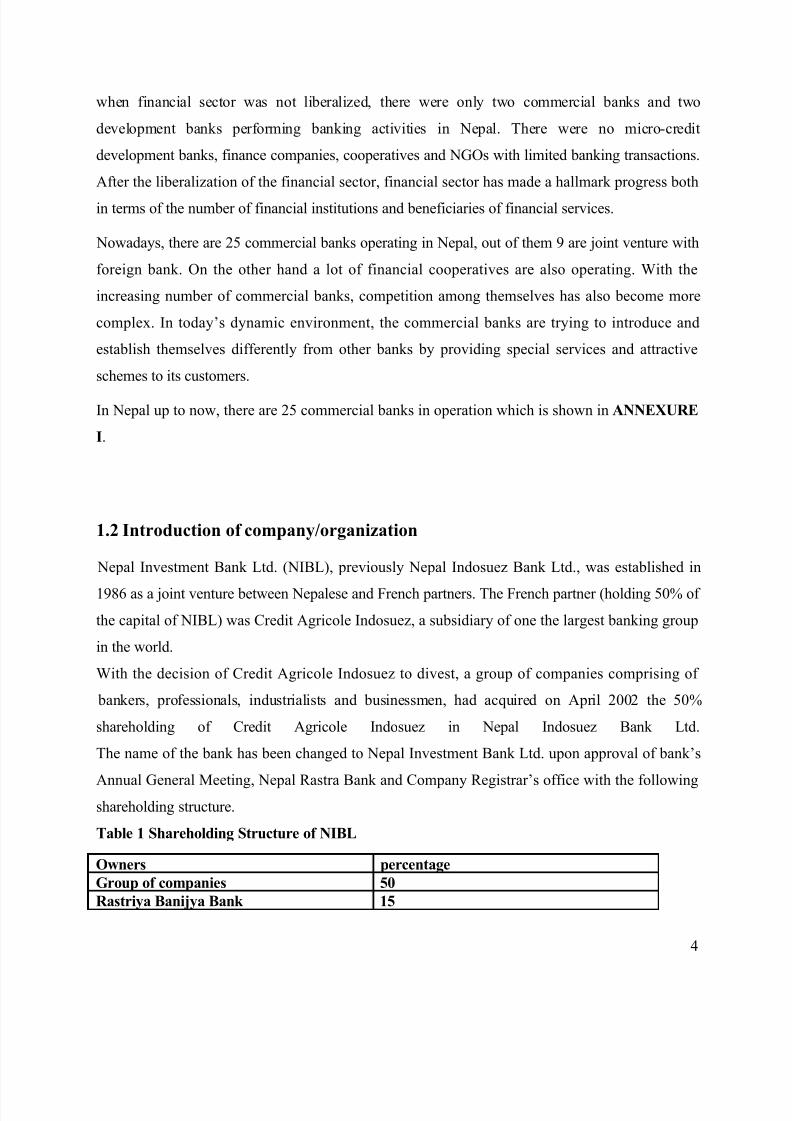
The name of the bank has been changed to Nepal Investment Bank Ltd. upon approval of bank’s
Annual General Meeting, Nepal Rastra Bank and Company Registrar’s office with the followingshareholding structure.
Table 1 Shareholding Structure of NIBL
Owners percentage
Group of companies 50
Rastriya Banijya Bank 15
4
8/2/2019 Edited Paw An Final Report
http://slidepdf.com/reader/full/edited-paw-an-final-report 5/40
Rastriya Beema Sansthan 15
General Public 20
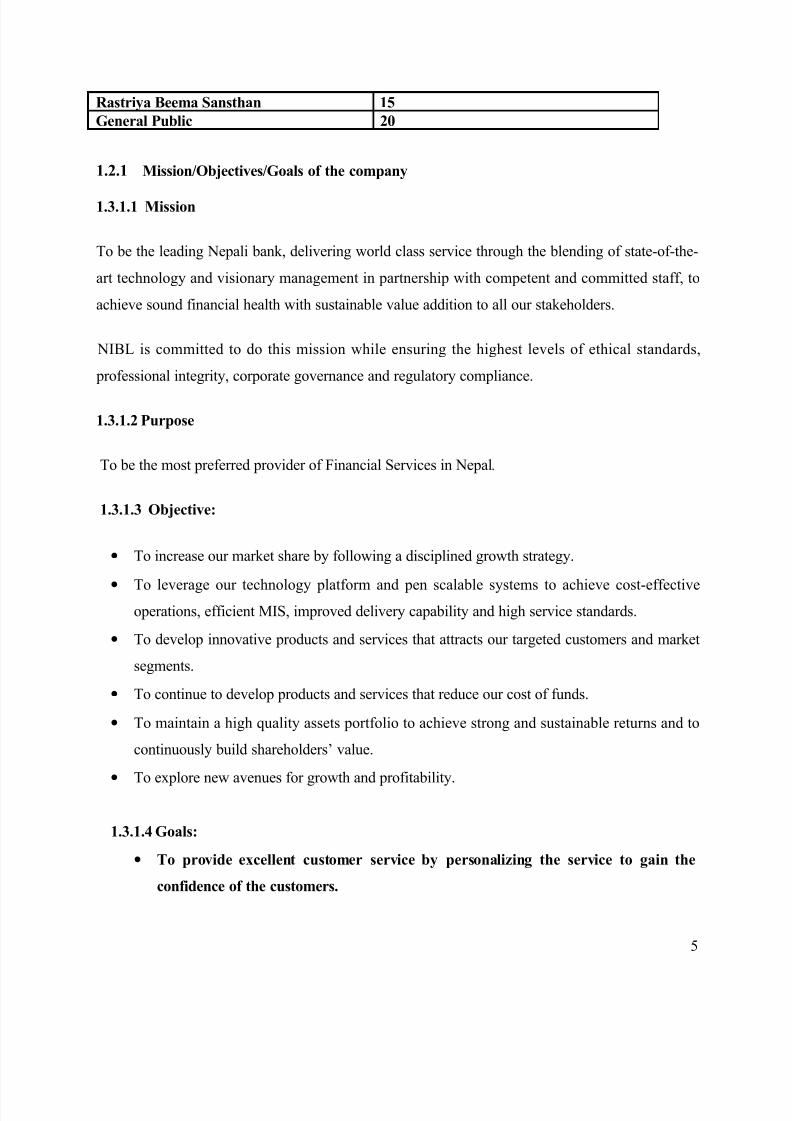
1.2.1 Mission/Objectives/Goals of the company
1.3.1.1 Mission
To be the leading Nepali bank, delivering world class service through the blending of state-of-the-
art technology and visionary management in partnership with competent and committed staff, to
achieve sound financial health with sustainable value addition to all our stakeholders.
NIBL is committed to do this mission while ensuring the highest levels of ethical standards,
professional integrity, corporate governance and regulatory compliance.
1.3.1.2 Purpose
To be the most preferred provider of Financial Services in Nepal.
1.3.1.3 Objective:
• To increase our market share by following a disciplined growth strategy.
•
To leverage our technology platform and pen scalable systems to achieve cost-effectiveoperations, efficient MIS, improved delivery capability and high service standards.
• To develop innovative products and services that attracts our targeted customers and market
segments.
• To continue to develop products and services that reduce our cost of funds.
• To maintain a high quality assets portfolio to achieve strong and sustainable returns and to
continuously build shareholders’ value.
• To explore new avenues for growth and profitability.
1.3.1.4 Goals:
• To provide excellent customer service by personalizing the service to gain the
confidence of the customers.
5
8/2/2019 Edited Paw An Final Report
http://slidepdf.com/reader/full/edited-paw-an-final-report 6/40
• To to deliver extraordinary outcome by the use of resources available through the
professional management team of the bank.
1.3.2 Analysis of Mission, Objectives and Goals
Mission, objectives and goals of NIBL are closely interlinked with each other. Objectives and
goals are set so as to acheive the mission of the bank. Moreover to acheive the above mission,
objectives and goals NIBL has certain core values and ethical principles. These core values
and ethical principles include-
• customer focus
• quality
• honesty and integrity
• belief in their people
• teamwork
• good corporate governance
• corporate social responsibility
With the matching mission, objectives and goals and with the use of these core values and
ethical principles, NIBL has been successful to make a significant position in the banking
industry of Nepal.
1.3.3Major Products of NIBL.
NIBL aims to provide comprehensive range of flexible and innovative products products
and services. To meet the changing needs of customers NIBL is making constant effort in
providing customer focused products. Major products and services provided by NIBL and
their analysis in terms of their purpose, target market, strategies and growth is as follows.
The major pproducts and services of NIBL is shown in ANNEXURE
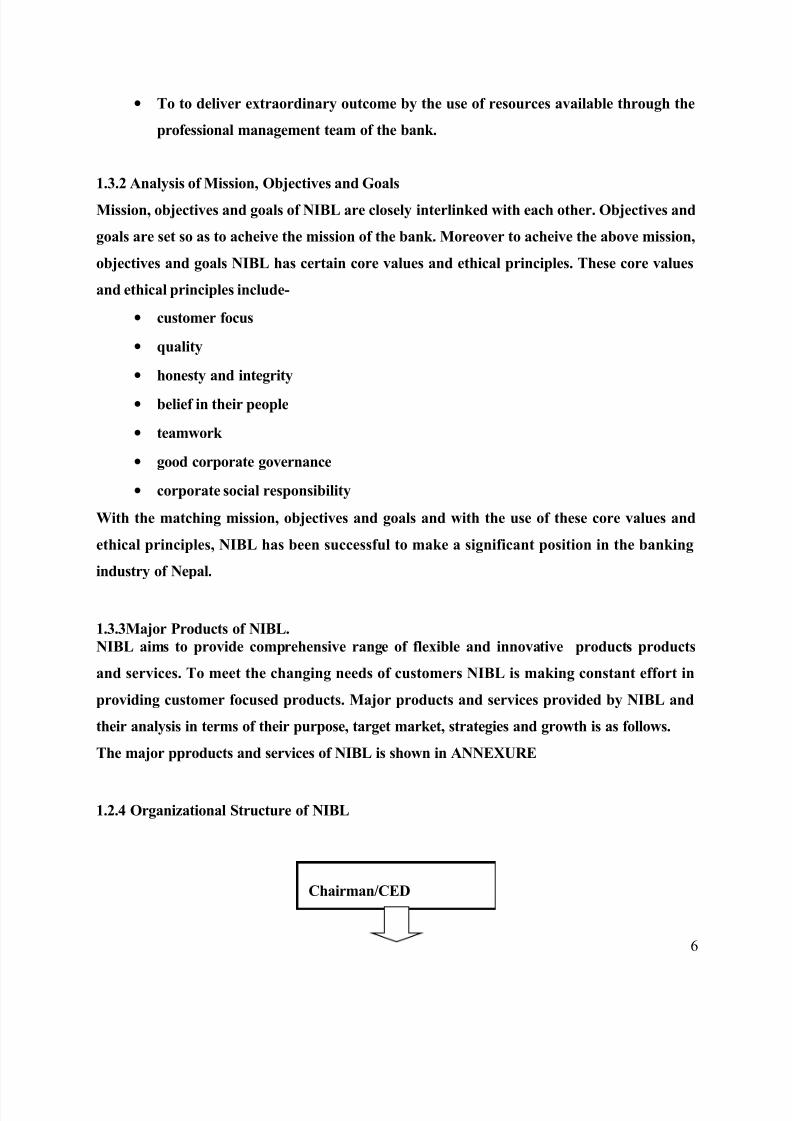
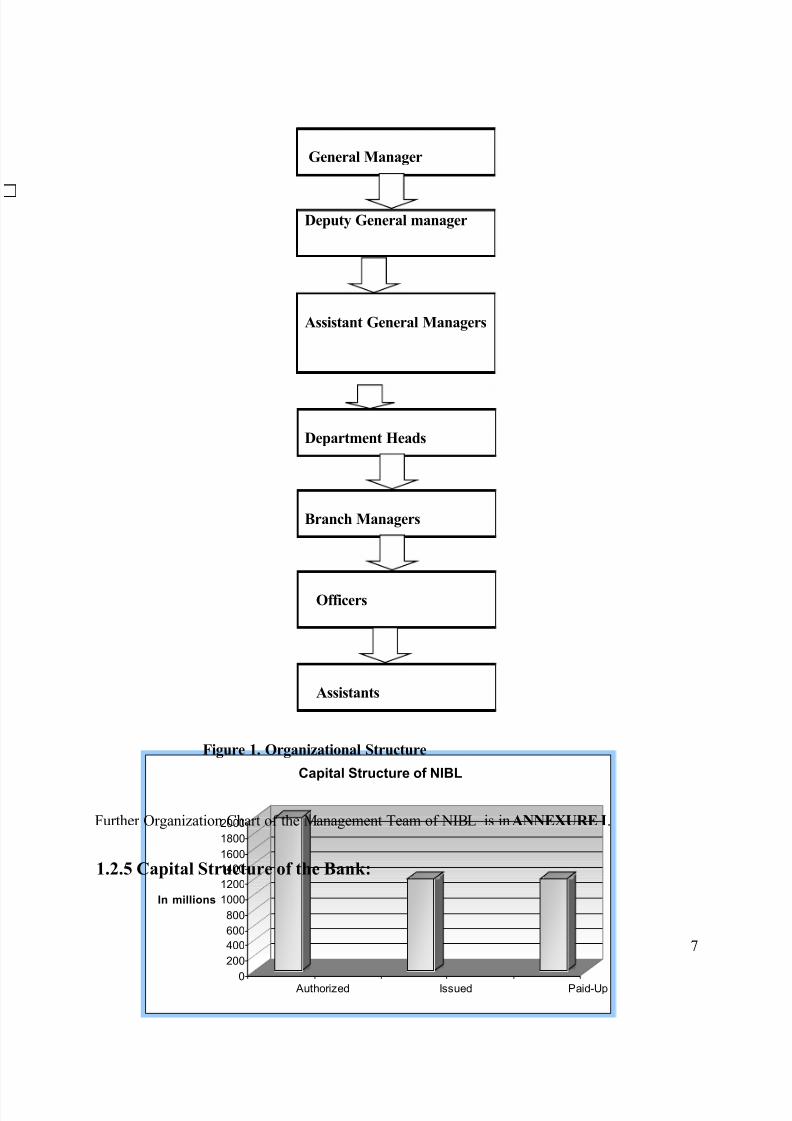
1.2.4 Organizational Structure of NIBL
6
Chairman/CED
8/2/2019 Edited Paw An Final Report
http://slidepdf.com/reader/full/edited-paw-an-final-report 7/40
0
200
400
600
800
1000
1200
1400
1600
1800
2000
In millions
Authorized Issued Paid-Up
Capital Structure of NIBL
Figure 1. Organizational Structure
Further Organization Chart of the Management Team of NIBL is in ANNEXURE I.
1.2.5 Capital Structure of the Bank:
7
General Manager
Deputy General manager
Assistant General Managers
Department Heads
Branch Managers
Officers
Assistants

8/2/2019 Edited Paw An Final Report
http://slidepdf.com/reader/full/edited-paw-an-final-report 8/40
Figure 1: Capital Structure of NIBL
The above table that the paid up capital structure of NIBL comprises of Rs.1,203,915,400 of Issued capital
and Paid up capital and Rs.2,000,000,000 of authorized capital of the Bank till the year FY 2009/2010.
1.3 Objective of the Study:
The main objective of this report is to study and examine the trend of financial status of Nepal
Investment Bank Limited; however there is some other objectives concerning with this
project.They are as follows:
• To analyze the financial performance of Nepal Investment Bank Limited in terms
of Liquidity, Earning, Asset Quality and Capital Adequacy.
• To analyse the financial statements of the corporation to it’s true financial position
by the use of ratios.
• To know about fund collection and mobilization in banking system.
• To know the market position of Nepal Investment Bank Limited.
• To identify the contribution of Nepal Investment Bank Limited in Nepalese
economy.
1.4 Methodology of data collection
8
8/2/2019 Edited Paw An Final Report
http://slidepdf.com/reader/full/edited-paw-an-final-report 9/40
The information required for the preparation of the study report was collected from various
primary and secondary sources. Since not all data collected from secondary sources (as in past
annual reports of NIBL and brochures) can be relied upon for up-to-date and reliable information
both primary, as well as secondary information has been used to prepare this report.
• Primary Source of Information:
The primary information for the report is collected through direct participation of the
intern. The major data collection is done through interview. Where the intern becomes the
interviewer and the bank’s staff or any other personnel to whom the questions are asked
become the interviewee. The questionnaire is prepared before hand for adequacy and to
avoid time loss.
• Secondary Source of Information:
Secondary data i.e. annual reports of the organization for last five years has been
taken into consideration as the main source of data for the purpose of financial
performance analysis. Various publications of Nepal Rastra Bank about banking
and financial statistics and unified directives are also taken for the study. Moreover
informal interactions and structured interviews is also done with different
professionals of accounting and finance in NIBL during the internship period.Various ratios has been calculated for last five years then they are presented by
using respective tables and bar-chart. Interpretation for the findings of each ratios
is also given at last. Also the necessary suggestions have been provided to the
organization so that they know their weakpoints and try to ensure the correction.
1.5 Scope and limitation of Financial Analysis
Scope/Extent of the Study
This report does emphasize the financial position of NIBL.Its scope can be defined as follows:
- Useful to analyze the financial growth trend of NIBL with 5 years.
- Useful to gain knowledge about parameters and techniques regarding ratio analysis.
9

8/2/2019 Edited Paw An Final Report
http://slidepdf.com/reader/full/edited-paw-an-final-report 10/40
- This study is useful in judging NIBL’s efficiency in terms of its operations and
management.
- This study is also useful in locating weakness on specific operation eventhough overall
performance may be quite good.
- Useful to analyze financial statement over last 5 years.
Limitations/Constraints of Study
- This study is based on the annual report and ratios are calculated as per balance sheet
in the annual report. So, the figures as per the blaance sheet date may not be
indicative of the year round position.
- The study is based on the comparision of ratios with past trends, but it may not give
correct picture due to the change in accounting policies.
- Financial ratio comparision with past trend does not consider the impact of inflation.
Chapter 2
10

8/2/2019 Edited Paw An Final Report
http://slidepdf.com/reader/full/edited-paw-an-final-report 11/40
Data presentation and Analysis
2.1 Introduction of Financial Analysis
There are several categories of financial service providers active in formal and informalsectors in Nepal. Apart from the commercial banks, the financial system has outgrown to
include development banks, microfinance development banks, finance companies, nongovernment
micro-credit institutions, and non-government cooperative societies.
Nepalese financial market grew largely after late 90s of 20th century. Banks and financial
institutions have been raised tremendously.Now there are commercial banks, finance
compannies and cooperatives. As all those financial institutions run mainly through deposit
collection from customers and by mobilizing the deposit to provide credit,they all are
competing with each other to make them survive and prospher.
In this scenario, I choose to analyze the financial performance of Nepal Investment Bank Limited
over past 5 years to show its effectivness over the years.
11
8/2/2019 Edited Paw An Final Report
http://slidepdf.com/reader/full/edited-paw-an-final-report 12/40
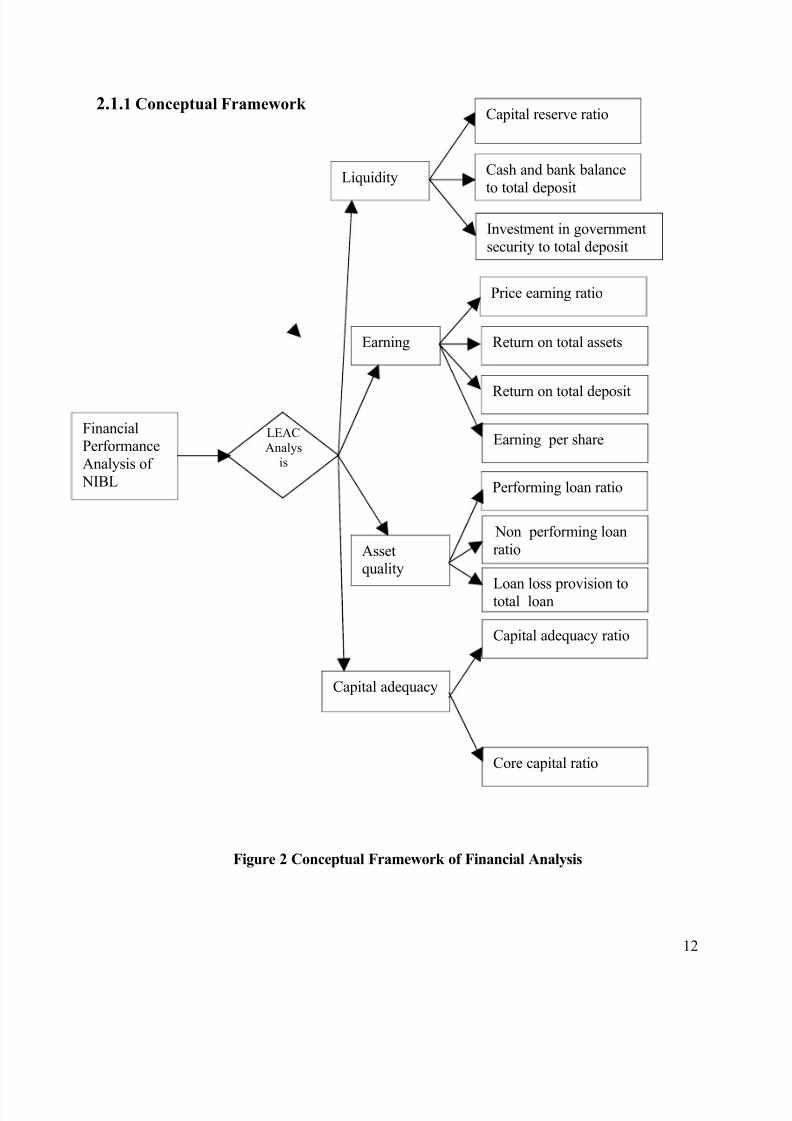
2.1.1 Conceptual Framework
Figure 2 Conceptual Framework of Financial Analysis
12
FinancialPerformance
Analysis of
NIBL
LEAC
Analysis
Liquidity
Earning
Assetquality
Capital adequacy
Cash and bank balance
to total deposit
Investment in government
security to total deposit
Price earning ratio
Return on total assets
Return on total deposit
Earning per share
Performing loan ratio
Non performing loan
ratio
Loan loss provision tototal loan
Capital adequacy ratio
Core capital ratio
Capital reserve ratio

8/2/2019 Edited Paw An Final Report
http://slidepdf.com/reader/full/edited-paw-an-final-report 13/40
Financial performance analysis of NIBL is done through LEAC analysis which means the analysis
of the degree of liquidity, earning capacity, asset quality and capital adequacy. The analysis of
these four factors is done through the calculation and interpretation of the ratios over last five years
from the respective financial statements to each of the factors.
To analyze liquidity cash reserve ratio (CRR), cash and bank balance to total deposit ratio and
investment in government security to total deposit ratio are calculated. Earning capacity of bank is
measured in terms of price earnings ratio (PE ratio), return on total assets (ROA), return on total
deposit and earning per share ( EPS). Asset quality has been analyzed through the use of
performing loan ratio and loan loss provision to total loan. The degree of capital adequacy has been
measured through capital adequacy ratio and core capital ratio. Analysis of all these ratios has
provided quite clear financial performance of NIBL.
Commercial bank management concept is helpful in preparing the main presentation part
of the project, i.e. LEAC analysis. Moreover the concept of accounting and corporate finance
are equally important for financial ratio and performance analysis.
These two important terms are discussed as follows:
• Financial ratio analysis-
Ratio primarily means the arithemetical relationship between two figures. Ratio is computed
by dividing one item of relation with another. Financial ratio analysis involves a study of the
relationship between income statement and balance sheet accounts, the change in theseratios over a period of time provides the performance of the firm within that time. Also
financial ratios calculated within corresponding years for multiple years such 5 years or 10
years suggest the trend of financial performance over those years.
• Financial performance analysis-
Financial performance analysis refers to an assessment of the viability, stability, and
profitability of a business. Financial analyst often assess the firms performance on the basis
of profitability, solvency, liquidity and stability. Past performance are used to perform the
financial performance analysis and future performance target is set on that basis and then
activities are planned to meet the target.
2.2 Presentation and analysis of data
The main analytical presentation and the major findings of report constitutes this section.
13
8/2/2019 Edited Paw An Final Report
http://slidepdf.com/reader/full/edited-paw-an-final-report 14/40
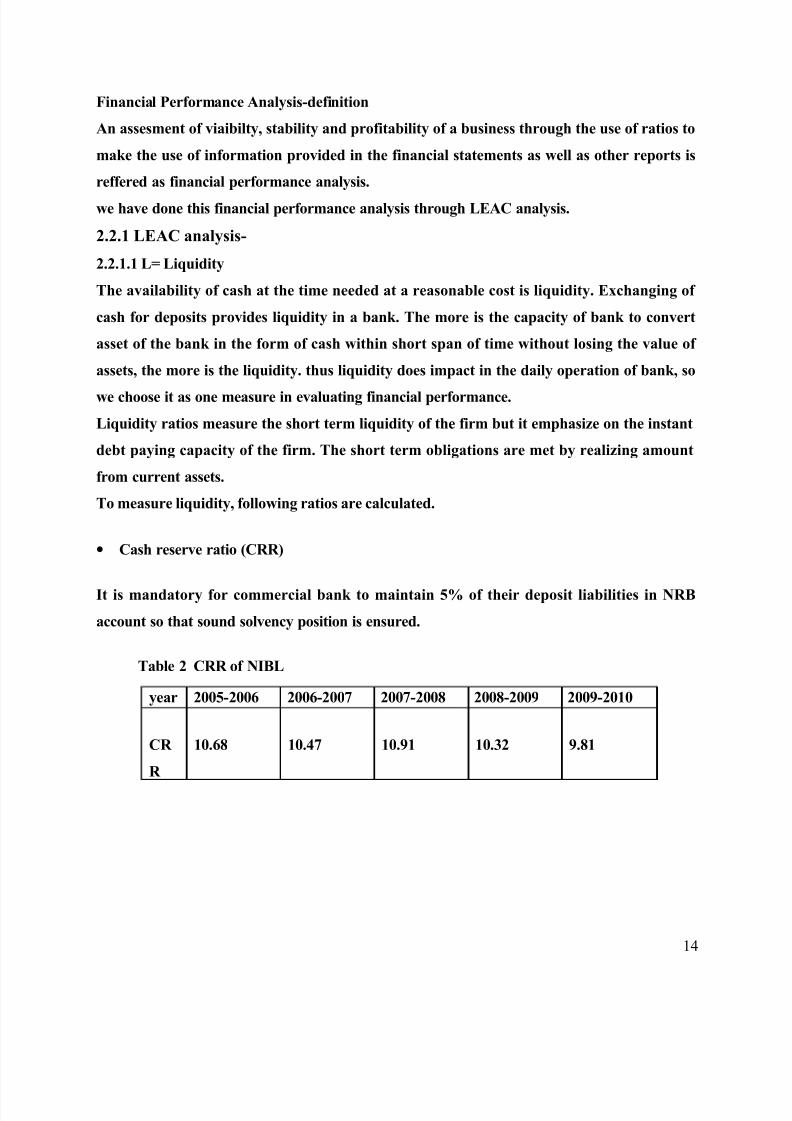
Financial Performance Analysis-definition
An assesment of viaibilty, stability and profitability of a business through the use of ratios to
make the use of information provided in the financial statements as well as other reports is
reffered as financial performance analysis.
we have done this financial performance analysis through LEAC analysis.
2.2.1 LEAC analysis-
2.2.1.1 L= Liquidity
The availability of cash at the time needed at a reasonable cost is liquidity. Exchanging of
cash for deposits provides liquidity in a bank. The more is the capacity of bank to convert
asset of the bank in the form of cash within short span of time without losing the value of
assets, the more is the liquidity. thus liquidity does impact in the daily operation of bank, so
we choose it as one measure in evaluating financial performance.
Liquidity ratios measure the short term liquidity of the firm but it emphasize on the instant
debt paying capacity of the firm. The short term obligations are met by realizing amount
from current assets.
To measure liquidity, following ratios are calculated.
• Cash reserve ratio (CRR)
It is mandatory for commercial bank to maintain 5% of their deposit liabilities in NRB
account so that sound solvency position is ensured.
Table 2 CRR of NIBL
year 2005-2006 2006-2007 2007-2008 2008-2009 2009-2010
CR
R
10.68 10.47 10.91 10.32 9.81
14

8/2/2019 Edited Paw An Final Report
http://slidepdf.com/reader/full/edited-paw-an-final-report 15/40
Figure 3 Bar-chart presenting CRR
From the above figure and table it can be seen that NIBL is able to maintain much higher
cash reserve ratio than obligated by NRB. But very higher CRR ratio has also negative effect,
like, cash remain idle and the bank may not be able to grab the opportunity from the
potential profitable sector.
• Cash and Bank Balance to Total Deposit
- shows the percent of deposit maintained as liquid assets.
- maintained to meet any unexpected demand of depositors.
- higher ratio means greater ability to meet an unexpected demand of
depositors.
- but keeping idle cash is not desirable so very high ratio can produce negative
results.
- so this ratio is only maintained to measure the banks ability to meet the
immediate obligation.
cash and bank balance to total deposit of NIBL=cash and bank balance/total deposit
15
8/2/2019 Edited Paw An Final Report
http://slidepdf.com/reader/full/edited-paw-an-final-report 16/40
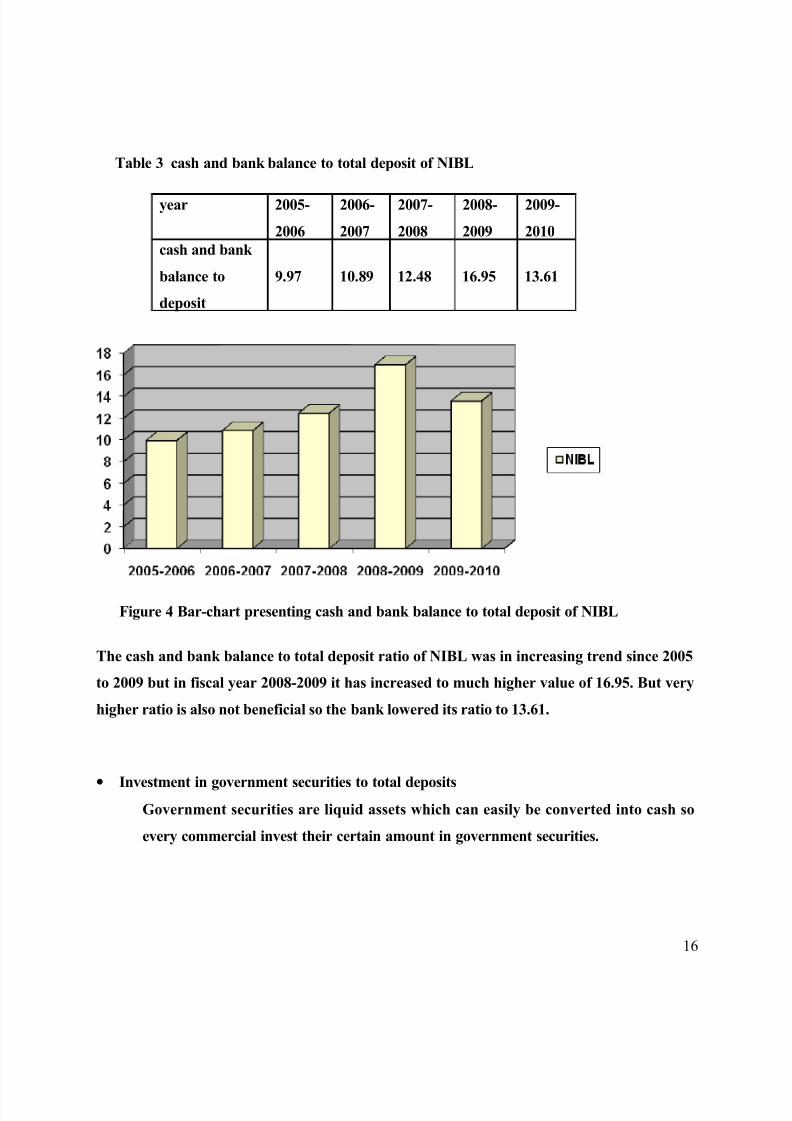
Table 3 cash and bank balance to total deposit of NIBL
Figure 4 Bar-chart presenting cash and bank balance to total deposit of NIBL
The cash and bank balance to total deposit ratio of NIBL was in increasing trend since 2005
to 2009 but in fiscal year 2008-2009 it has increased to much higher value of 16.95. But very
higher ratio is also not beneficial so the bank lowered its ratio to 13.61.
•Investment in government securities to total deposits
Government securities are liquid assets which can easily be converted into cash so
every commercial invest their certain amount in government securities.
16
year 2005-
2006
2006-
2007
2007-
2008
2008-
2009
2009-
2010
cash and bank
balance to
deposit
9.97 10.89 12.48 16.95 13.61

8/2/2019 Edited Paw An Final Report
http://slidepdf.com/reader/full/edited-paw-an-final-report 17/40
Table 4 Investment in government securities to total deposits
year 2005-2006 2006-2007 2007-2008 2008-2009 2009-2010NIBL 13.35 10.35 7.87 5.42 6.12
Figure 5 Investment in government securities to total deposits
This shows that investment in government securities to total deposit is in decreasing trend.
2.2.1.2 E=Earning
Earning is what considered to be the ultimate goal of commercial bank. Everyone’s focus is
at earning at the year end. Interest on loan, return on income, charges on different service
provided to the customers etc are the major constituent of earning of a bank.
Financial statements are viewed to know about earning of any institution. Retaining a certain
portion of earning every year helps gradually to grow capital fund of the institution.Following ratios are calculated to test earning capacity of NIBL.
•Price earning ratio
- It presents the investor judgement on expectation about the growth in banks
earning.
17
8/2/2019 Edited Paw An Final Report
http://slidepdf.com/reader/full/edited-paw-an-final-report 18/40
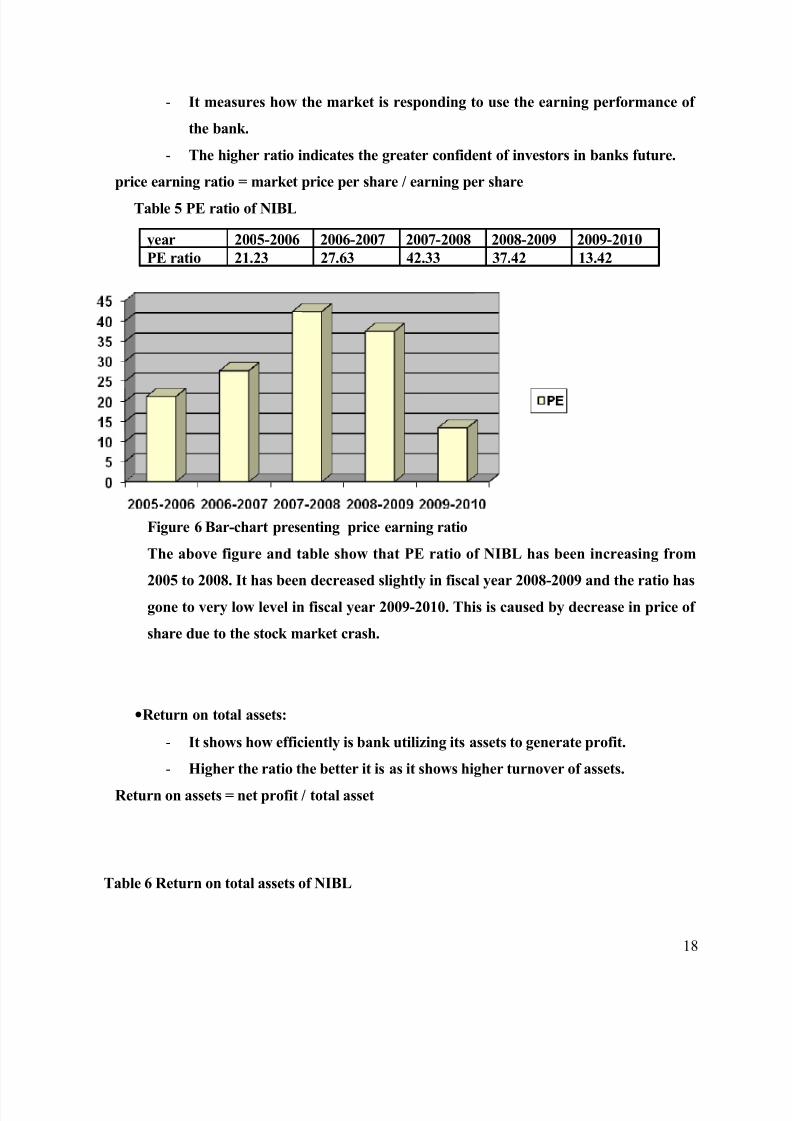
- It measures how the market is responding to use the earning performance of
the bank.
- The higher ratio indicates the greater confident of investors in banks future.
price earning ratio = market price per share / earning per share
Table 5 PE ratio of NIBL
year 2005-2006 2006-2007 2007-2008 2008-2009 2009-2010
PE ratio 21.23 27.63 42.33 37.42 13.42
Figure 6 Bar-chart presenting price earning ratio
The above figure and table show that PE ratio of NIBL has been increasing from
2005 to 2008. It has been decreased slightly in fiscal year 2008-2009 and the ratio has
gone to very low level in fiscal year 2009-2010. This is caused by decrease in price of
share due to the stock market crash.
•Return on total assets:
- It shows how efficiently is bank utilizing its assets to generate profit.
- Higher the ratio the better it is as it shows higher turnover of assets.
Return on assets = net profit / total asset
Table 6 Return on total assets of NIBL
18
8/2/2019 Edited Paw An Final Report
http://slidepdf.com/reader/full/edited-paw-an-final-report 19/40
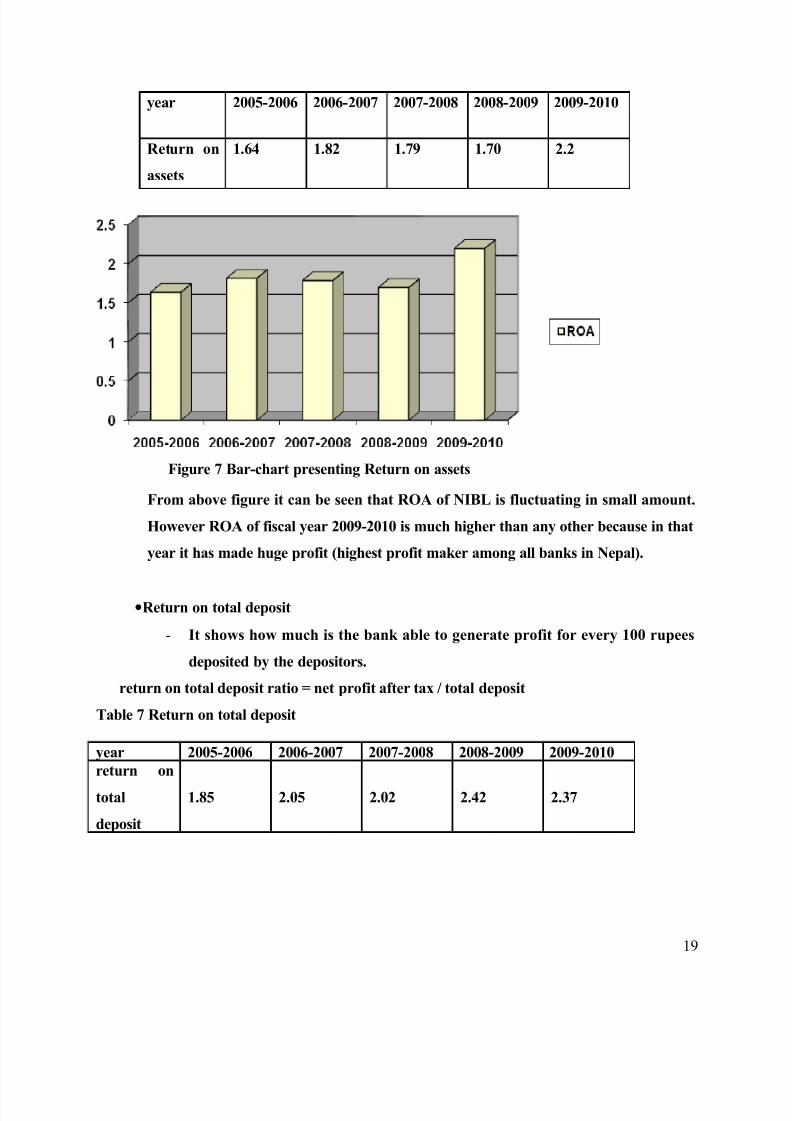
year 2005-2006 2006-2007 2007-2008 2008-2009 2009-2010
Return on
assets
1.64 1.82 1.79 1.70 2.2
Figure 7 Bar-chart presenting Return on assets
From above figure it can be seen that ROA of NIBL is fluctuating in small amount.
However ROA of fiscal year 2009-2010 is much higher than any other because in that
year it has made huge profit (highest profit maker among all banks in Nepal).
•Return on total deposit
- It shows how much is the bank able to generate profit for every 100 rupees
deposited by the depositors.
return on total deposit ratio = net profit after tax / total deposit
Table 7 Return on total deposit
19
year 2005-2006 2006-2007 2007-2008 2008-2009 2009-2010
return on
total
deposit
1.85 2.05 2.02 2.42 2.37
8/2/2019 Edited Paw An Final Report
http://slidepdf.com/reader/full/edited-paw-an-final-report 20/40
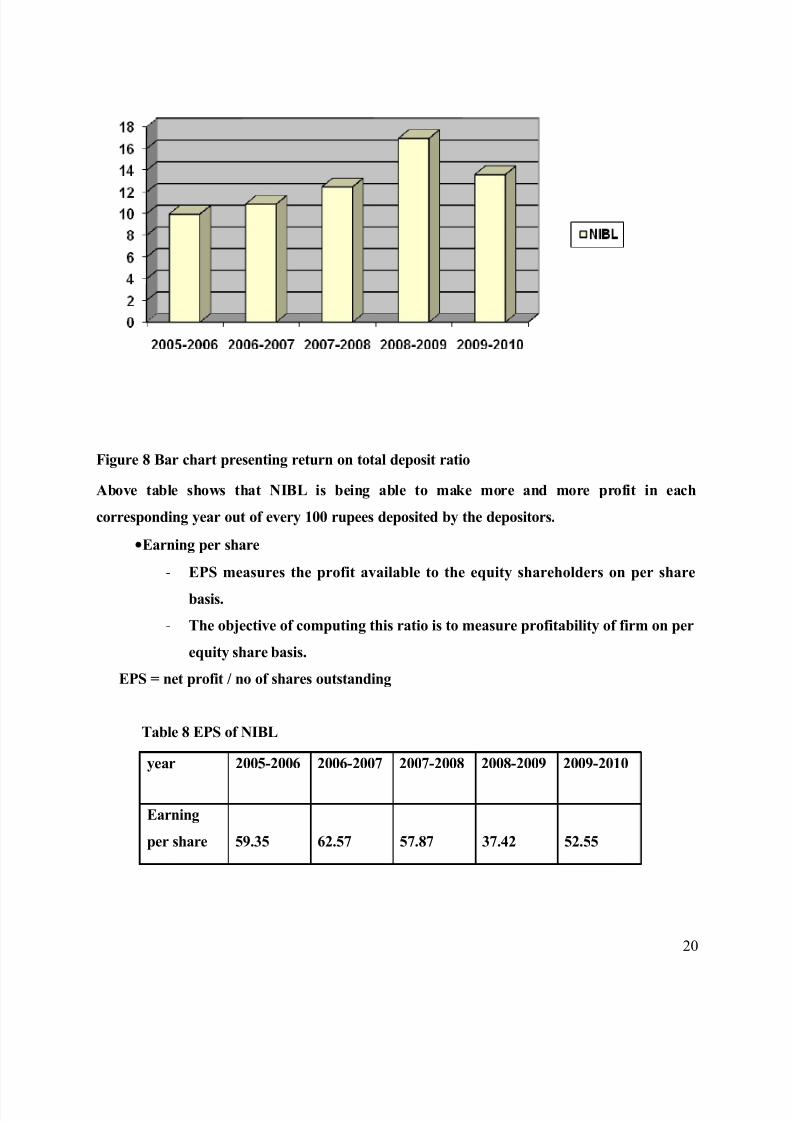
Figure 8 Bar chart presenting return on total deposit ratio
Above table shows that NIBL is being able to make more and more profit in each
corresponding year out of every 100 rupees deposited by the depositors.
•Earning per share
- EPS measures the profit available to the equity shareholders on per share
basis.
- The objective of computing this ratio is to measure profitability of firm on per
equity share basis.
EPS = net profit / no of shares outstanding
Table 8 EPS of NIBL
year 2005-2006 2006-2007 2007-2008 2008-2009 2009-2010
Earning
per share 59.35 62.57 57.87 37.42 52.55
20
8/2/2019 Edited Paw An Final Report
http://slidepdf.com/reader/full/edited-paw-an-final-report 21/40
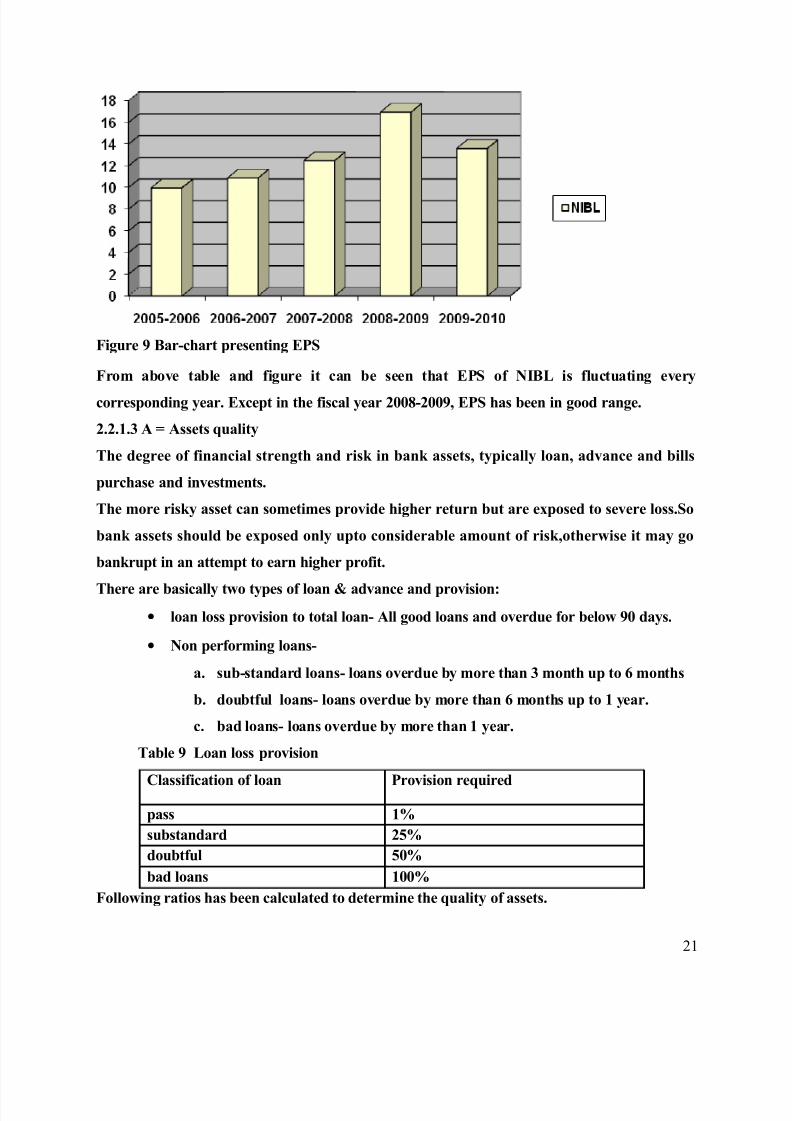
Figure 9 Bar-chart presenting EPS
From above table and figure it can be seen that EPS of NIBL is fluctuating every
corresponding year. Except in the fiscal year 2008-2009, EPS has been in good range.
2.2.1.3 A = Assets quality
The degree of financial strength and risk in bank assets, typically loan, advance and bills
purchase and investments.
The more risky asset can sometimes provide higher return but are exposed to severe loss.So
bank assets should be exposed only upto considerable amount of risk,otherwise it may go
bankrupt in an attempt to earn higher profit.
There are basically two types of loan & advance and provision:
• loan loss provision to total loan- All good loans and overdue for below 90 days.
• Non performing loans-
a. sub-standard loans- loans overdue by more than 3 month up to 6 months
b. doubtful loans- loans overdue by more than 6 months up to 1 year.
c. bad loans- loans overdue by more than 1 year.
Table 9 Loan loss provision
Classification of loan Provision required
pass 1%
substandard 25%
doubtful 50%
bad loans 100%
Following ratios has been calculated to determine the quality of assets.
21
8/2/2019 Edited Paw An Final Report
http://slidepdf.com/reader/full/edited-paw-an-final-report 22/40
• performing loan ratio.
- good and overdue loans for below 90 days are performing loans
- this ratio shows how much bank is successful in utilizing their
assets for generating profit.
- higher the ratio higher is the efficiency in utilizing good loans
performing loan ratio= performing loan / total loan
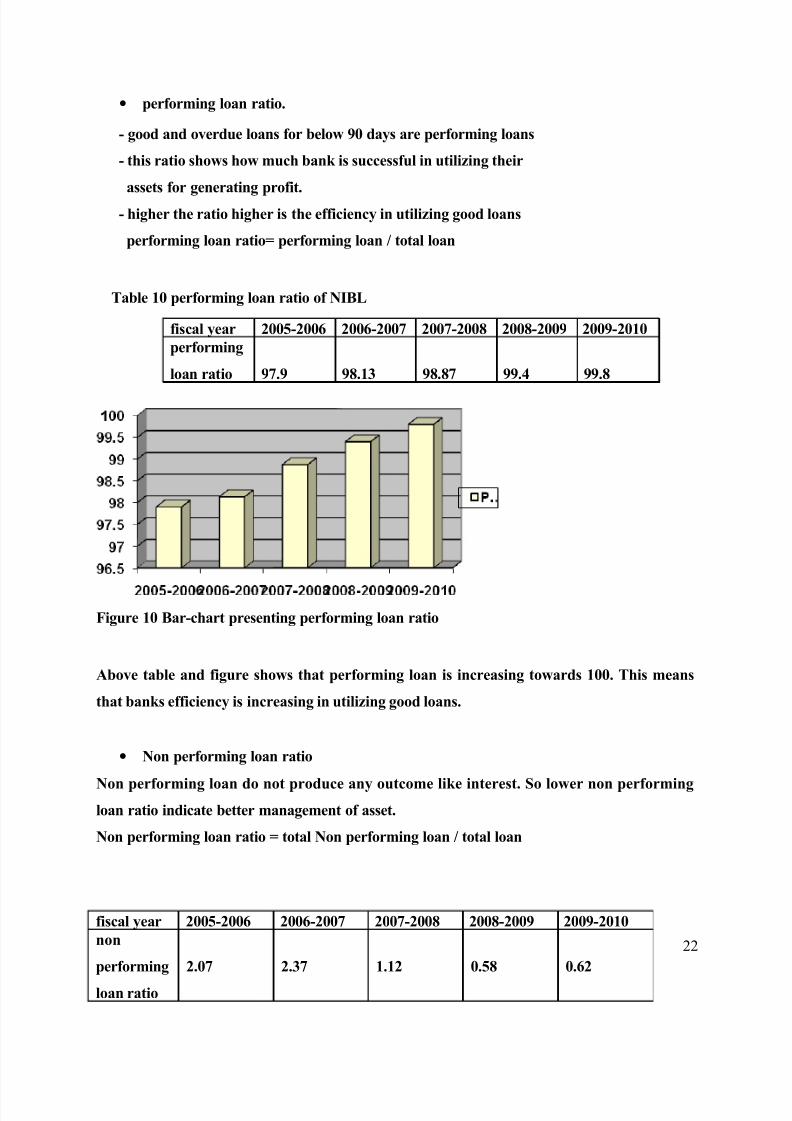
Table 10 performing loan ratio of NIBL
fiscal year 2005-2006 2006-2007 2007-2008 2008-2009 2009-2010
performing
loan ratio 97.9 98.13 98.87 99.4 99.8
Figure 10 Bar-chart presenting performing loan ratio
Above table and figure shows that performing loan is increasing towards 100. This means
that banks efficiency is increasing in utilizing good loans.
• Non performing loan ratio
Non performing loan do not produce any outcome like interest. So lower non performing
loan ratio indicate better management of asset.
Non performing loan ratio = total Non performing loan / total loan
22
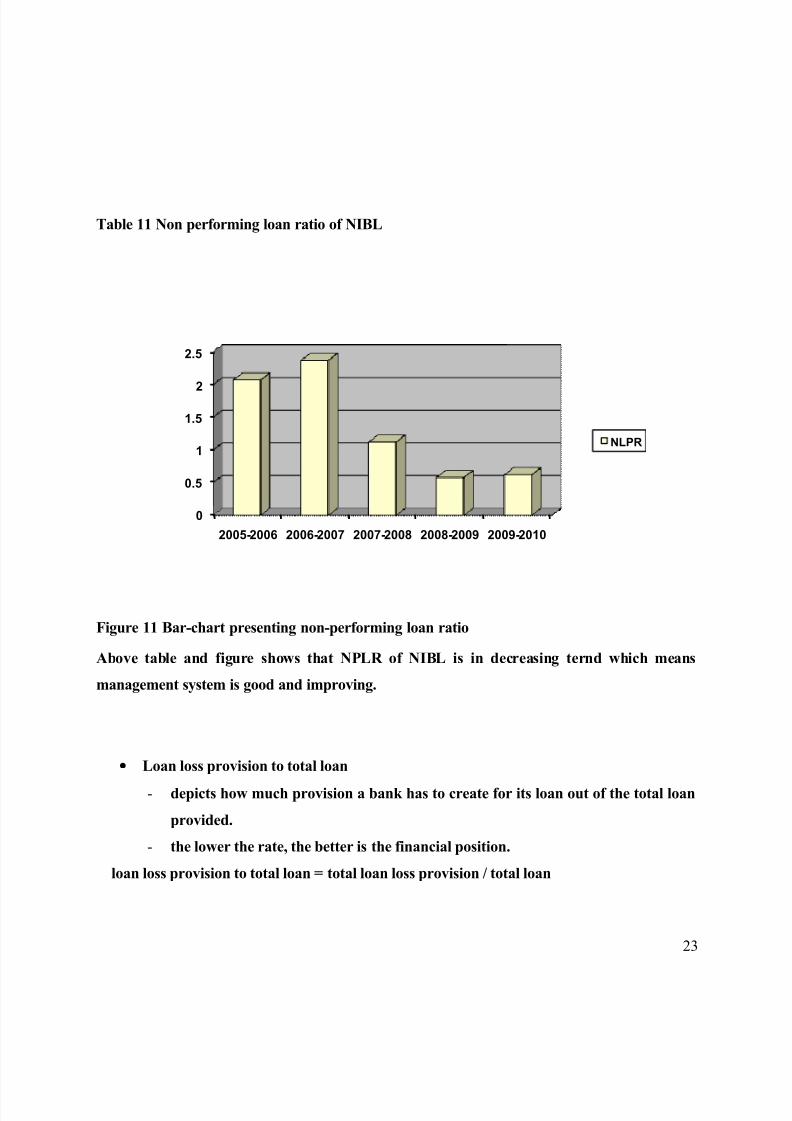
fiscal year 2005-2006 2006-2007 2007-2008 2008-2009 2009-2010
non
performing
loan ratio
2.07 2.37 1.12 0.58 0.62
8/2/2019 Edited Paw An Final Report
http://slidepdf.com/reader/full/edited-paw-an-final-report 23/40
Table 11 Non performing loan ratio of NIBL
0
0.5
1
1.5
2
2.5
2005-2006 2006-2007 2007-2008 2008-2009 2009-2010
NLPR
Figure 11 Bar-chart presenting non-performing loan ratio
Above table and figure shows that NPLR of NIBL is in decreasing ternd which means
management system is good and improving.
• Loan loss provision to total loan
- depicts how much provision a bank has to create for its loan out of the total loan
provided.
- the lower the rate, the better is the financial position.
loan loss provision to total loan = total loan loss provision / total loan
23
8/2/2019 Edited Paw An Final Report
http://slidepdf.com/reader/full/edited-paw-an-final-report 24/40
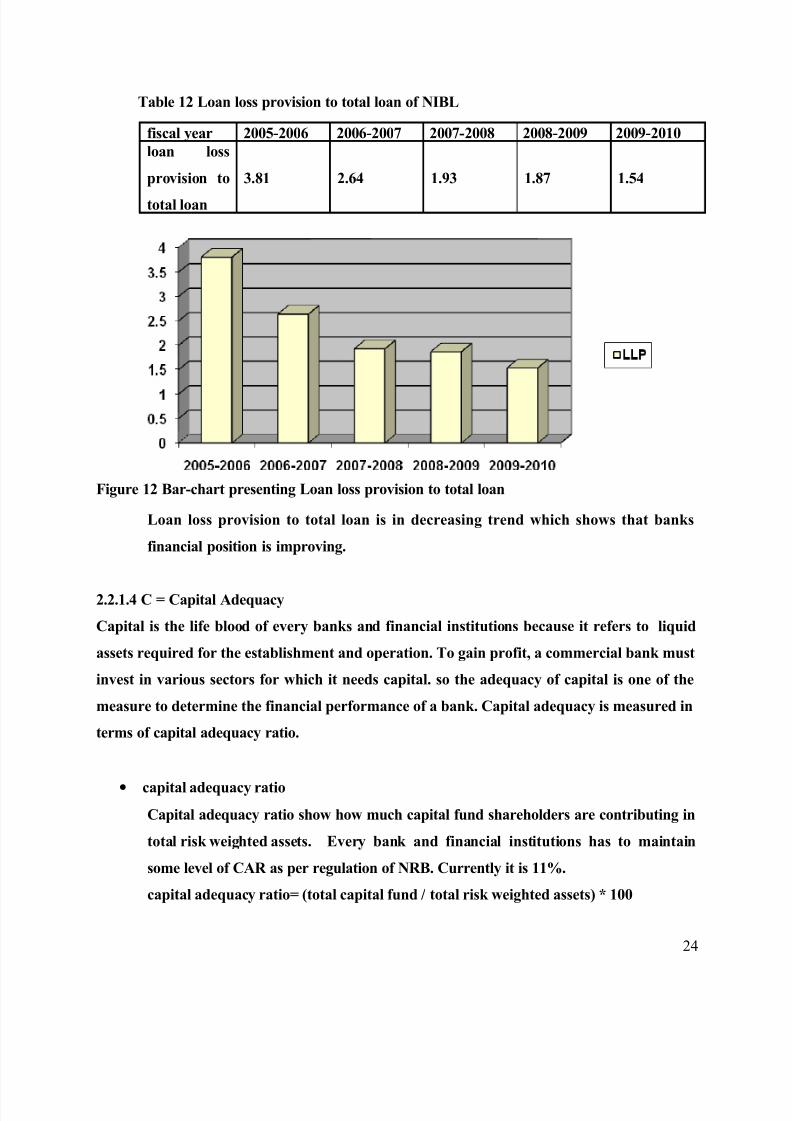
Table 12 Loan loss provision to total loan of NIBL
fiscal year 2005-2006 2006-2007 2007-2008 2008-2009 2009-2010
loan loss
provision to
total loan
3.81 2.64 1.93 1.87 1.54
Figure 12 Bar-chart presenting Loan loss provision to total loan
Loan loss provision to total loan is in decreasing trend which shows that banks
financial position is improving.
2.2.1.4 C = Capital Adequacy
Capital is the life blood of every banks and financial institutions because it refers to liquid
assets required for the establishment and operation. To gain profit, a commercial bank must
invest in various sectors for which it needs capital. so the adequacy of capital is one of the
measure to determine the financial performance of a bank. Capital adequacy is measured in
terms of capital adequacy ratio.
• capital adequacy ratio
Capital adequacy ratio show how much capital fund shareholders are contributing in
total risk weighted assets. Every bank and financial institutions has to maintain
some level of CAR as per regulation of NRB. Currently it is 11%.
capital adequacy ratio= (total capital fund / total risk weighted assets) * 100
24
8/2/2019 Edited Paw An Final Report
http://slidepdf.com/reader/full/edited-paw-an-final-report 25/40
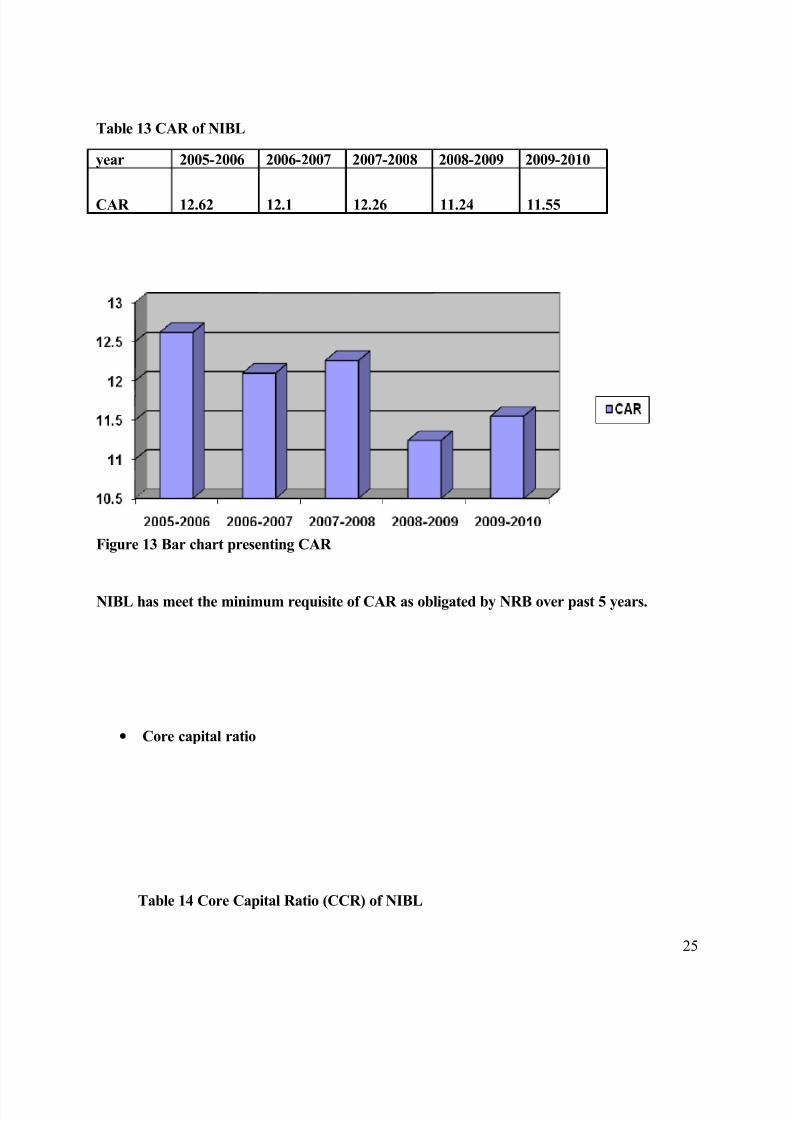
Table 13 CAR of NIBL
year 2005-2006 2006-2007 2007-2008 2008-2009 2009-2010
CAR 12.62 12.1 12.26 11.24 11.55
Figure 13 Bar chart presenting CAR
NIBL has meet the minimum requisite of CAR as obligated by NRB over past 5 years.
• Core capital ratio
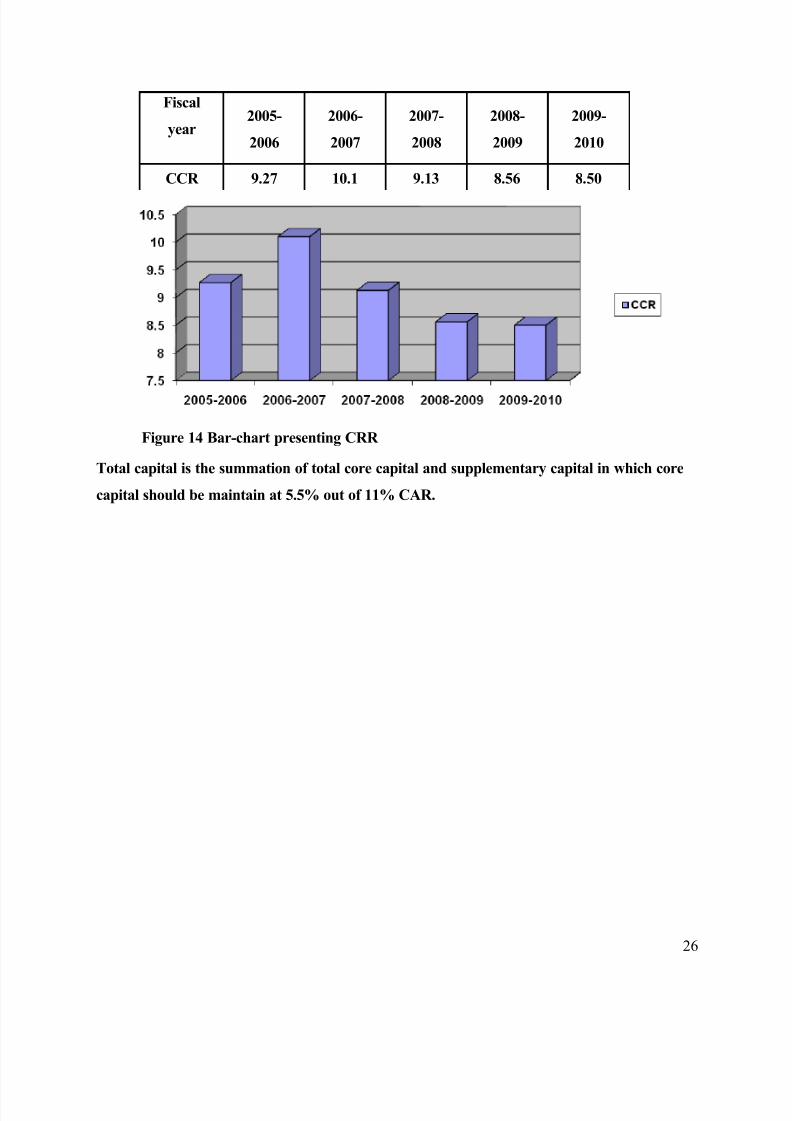
Table 14 Core Capital Ratio (CCR) of NIBL
25
8/2/2019 Edited Paw An Final Report
http://slidepdf.com/reader/full/edited-paw-an-final-report 26/40
Fiscal
year2005-
2006
2006-
2007
2007-
2008
2008-
2009
2009-
2010
CCR 9.27 10.1 9.13 8.56 8.50
Figure 14 Bar-chart presenting CRR
Total capital is the summation of total core capital and supplementary capital in which core
capital should be maintain at 5.5% out of 11% CAR.
26

8/2/2019 Edited Paw An Final Report
http://slidepdf.com/reader/full/edited-paw-an-final-report 27/40
Chapter 3
SUMMARY, CONCLUSION AND RECOMMENDATION
3.1 Summary:
The basic purpose of this internship is to get practical knowledge, so that we can utilize our
theoretical knowledge the real-time situation. The main objective of this internship is to get better
understanding of the operations of Customer Service Department and Marketing Department of
Nepal Investment Bank Ltd.
The internee approached Nepal Investment Bank Ltd. Nepal Investment Bank Ltd. (NIBL),
previously Nepal Indosuez Bank Ltd. From the establishment period Nepal Investment Bank has
done its best to prove itself as a best bank in the country.
This intern report is done by the internee for the partial fulfillment of Bachelor of Business
Administration (BBA) and the report is on “Financial Analysis Of NIBL”.
Financial performance analysis of NIBL is done through LEAC analysis which means the analysis
of the degree of liquidity, earning capacity, asset quality and capital adequacy. The analysis of
these four factors is done through the calculation and interpretation of the ratios over last five years
from the respective financial statements to each of the factors.To analyze liquidity cash reserve ratio(CRR), cash and bank balance to total deposit ratio and
investment in government security to total deposit ratio are calculated. Earning capacity of bank is
measured in terms of price earning ratio(PE ratio), return on total assets(ROA), return on total
deposit and earning per share( EPS). Asset quality has been analyzed through the use of
performing loan ratio and loan loss provision to total loan. The degree of capital adequacy has been
measured through capital adequacy ratio and core capital ratio. Analysis of all these ratios has
provided quite clear financial performance of NIBL.
3.2 Conclusions
The banking sector is regarded as fastest growing and leading sector in economy. It provides all
kind of financial and banking solutions to the people. NIBL is one of the leading commercial bank
27
8/2/2019 Edited Paw An Final Report
http://slidepdf.com/reader/full/edited-paw-an-final-report 28/40
serving the nation since 24 years. The has altogether 40 banking branches all over the Nepal. It has
tried to target international customer through the ATM and remittance service. Since its
establishment in 1986, NIBL has been able to successfully operate providing efficient service to its
customers. By being awarded as " Bank of the Year " in 2003, 2005 and 2008; the bank has gained
a reputation in the market.
From the analysis of the financial performance of NIBL we reach to the following
conclusions:
• NIBL has been seen very efficient in the collection of funds and in its mobilization to
earn profit.
• NIBL has excess amount of cash reserve to cope with the liquidity problem seen in
Nepalese financial market in recent years, which is shown by the higher CRR ratio of about 10% in every year of last 5 years.
• NIBL is constantly earning huge amount of profit in last 5 years but recently its share
price has been decreased due to share market crash.
• NIBL has been very successful in utilizing good loans for generating profit. Last year
its performing loan ratio has been reached nearly 100%
NIBL has always meet the NRB’s requirement of capital adequacy ratio i.e.11%, core capital
i.e.5.5% and cash reserve ratio i.e.5%
3.3 Recommendation
From this whole analysis of performance and from the experience of working in the
organization as interns we would like to give following suggestions to NIBL:
• NIBL should focus in its operational cost to reduce it, so that it can reach to the
international top standard.
• NIBL should focus in providing more allowances and benefit to the employees to
increase their productivity to optimum level.
• NIBL should invest in developmental sectors such as- hydropower, road construction,
industrial sector etc. to contribute to the nation.
• NIBL should focus in succession planning.
28

8/2/2019 Edited Paw An Final Report
http://slidepdf.com/reader/full/edited-paw-an-final-report 29/40
BIBLIOGRAPHY
1. Management Textbooks:
• Bhandari, Dilli Raj, (2003), Principle and Practice of Banking and Insurance, Kathmandu:
Ayush Publications
• Peter S. Rose, 2003, (Fourth Edition), Commercial Bank Management
• Irwin-McGraw Hill Lawrence J. Gilman, 2006 (Ninth Edition), Principle of Managerial
Finance, Androson Welsley Longman (Singapore)
2. Websites:
• Nepal Investment Bank Ltd. http://www.nibl.com.np
• Nepal Rastra Bank www.nrb.org.np
• Google Search Engine www.google.com
3. Others:
• Nepal Rastra Bank, Banking and Financial Statistics (July 2009).
• Nepal Rastra Bank, Bank And Financial Institution Ordinance (2004).
• Annual Report (2008/2009), Nepal Investment Bank Ltd., Kathmandu.
• Nepal Rastra Bank Collection of Directives for Import/Export.
29

8/2/2019 Edited Paw An Final Report
http://slidepdf.com/reader/full/edited-paw-an-final-report 30/40
APPENDIXES
BALANCE SHEET OF 2005-2006
Capital & Liabilities Schedule Amount
1. Share Capital 590,586,000
2. Reserve & Fund 824,853,7153. Debentures and Bonds 550,000,000
4. Borrowings -
5. Deposits Liabilities 18,927,305,974
6. Bills Payable 18,820,120
7. Proposed Dividend 121,626,997
8. Income Tax Liabilities 9,318,522
9. Other Liabilities 287,626,214
Total Capital & Liabilities 21,330,137,542
Assets Schedule
1. Cash Balance 562,560,620
2. Balance with NRB 1,526,066,660
3. Balance with Banks/ Financial Institution 247,894,116
4. Money at Call and Short Notice 11 70,000,0005. Investments 5,602,868,649
6. Loan, Advances & Bills Purchased 12,776,208,037
7. Fixed Assets 343,449,635
8. Non-Banking Assets -
9. Other Assets 201,089,825
Total Assets 21,330,137,542
BALANCE SHEET OF 2006-2007
Capital & Liabilities Schedule Amount
1. Share Capital 801,352,600
2. Reserve & Fund 1,076,770,938
30
8/2/2019 Edited Paw An Final Report
http://slidepdf.com/reader/full/edited-paw-an-final-report 31/40
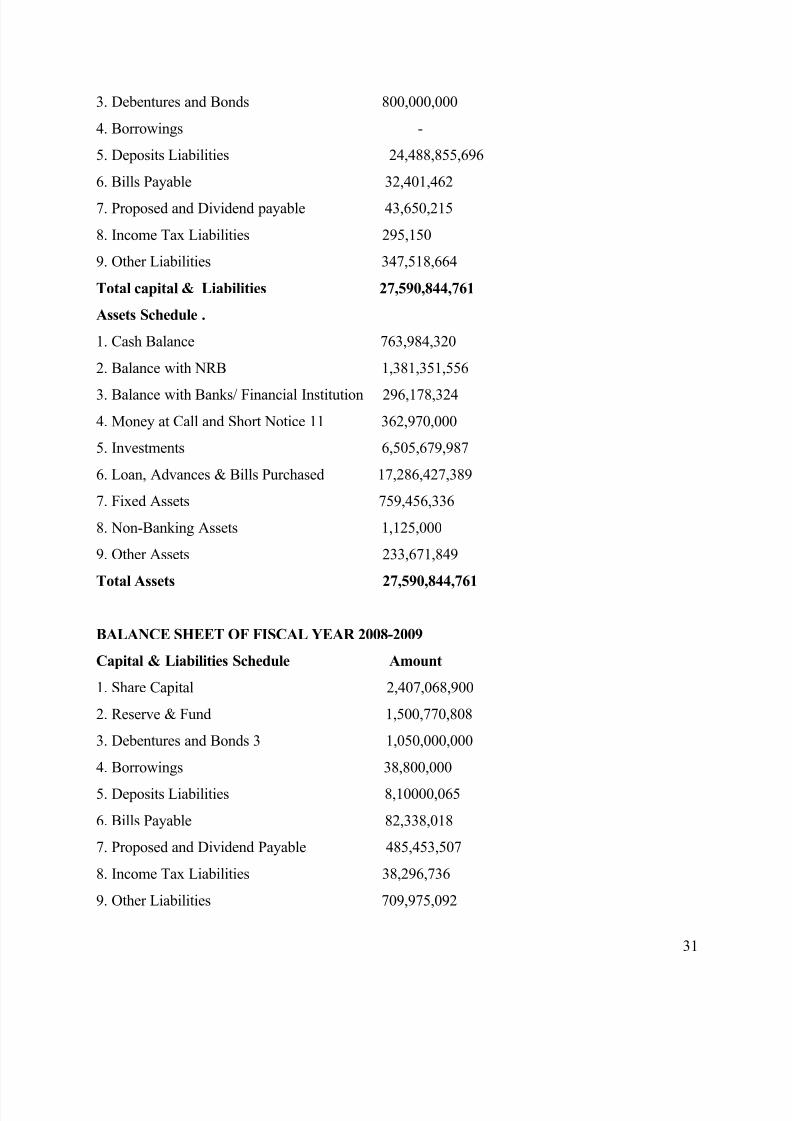
3. Debentures and Bonds 800,000,000
4. Borrowings -
5. Deposits Liabilities 24,488,855,696
6. Bills Payable 32,401,462
7. Proposed and Dividend payable 43,650,215
8. Income Tax Liabilities 295,150
9. Other Liabilities 347,518,664
Total capital & Liabilities 27,590,844,761
Assets Schedule .
1. Cash Balance 763,984,320
2. Balance with NRB 1,381,351,556
3. Balance with Banks/ Financial Institution 296,178,324
4. Money at Call and Short Notice 11 362,970,000
5. Investments 6,505,679,987
6. Loan, Advances & Bills Purchased 17,286,427,389
7. Fixed Assets 759,456,336
8. Non-Banking Assets 1,125,000
9. Other Assets 233,671,849
Total Assets 27,590,844,761
BALANCE SHEET OF FISCAL YEAR 2008-2009
Capital & Liabilities Schedule Amount
1. Share Capital 2,407,068,900
2. Reserve & Fund 1,500,770,808
3. Debentures and Bonds 3 1,050,000,000
4. Borrowings 38,800,000
5. Deposits Liabilities 8,10000,065
6. Bills Payable 82,338,018
7. Proposed and Dividend Payable 485,453,507
8. Income Tax Liabilities 38,296,736
9. Other Liabilities 709,975,092
31
8/2/2019 Edited Paw An Final Report
http://slidepdf.com/reader/full/edited-paw-an-final-report 32/40
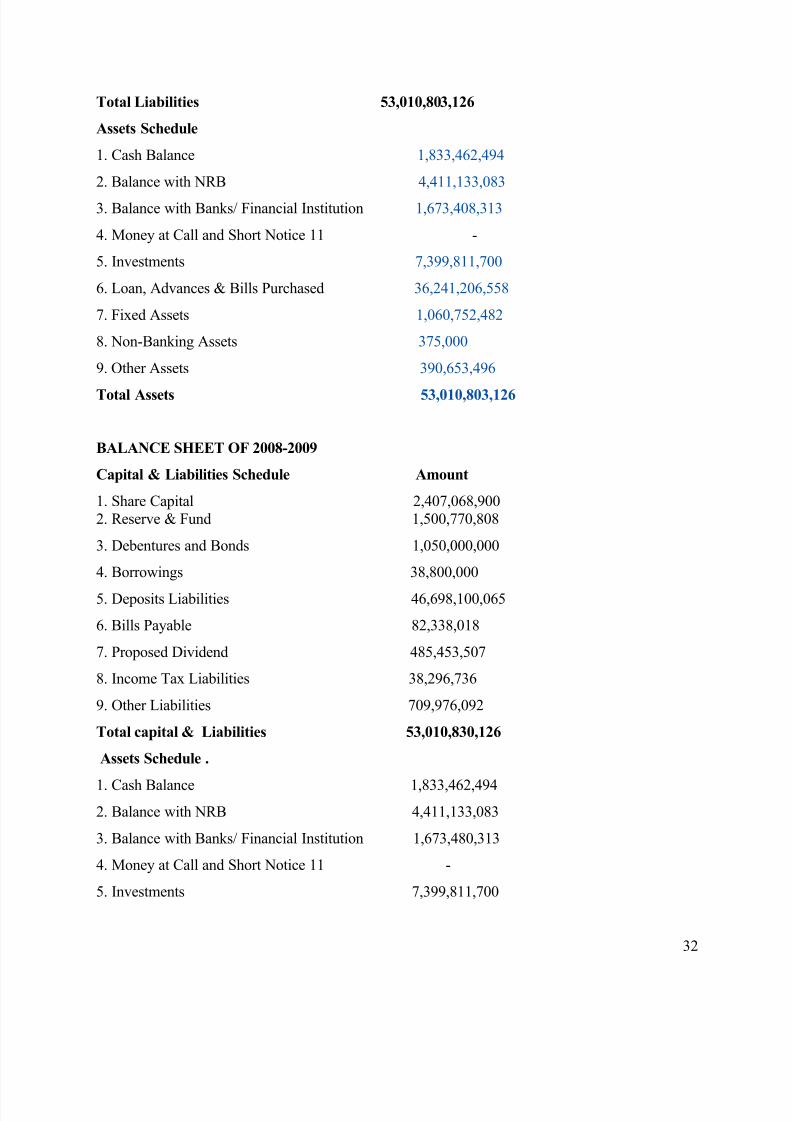
Total Liabilities 53,010,803,126
Assets Schedule
1. Cash Balance 1,833,462,494
2. Balance with NRB 4,411,133,083
3. Balance with Banks/ Financial Institution 1,673,408,313
4. Money at Call and Short Notice 11 -
5. Investments 7,399,811,700
6. Loan, Advances & Bills Purchased 36,241,206,558
7. Fixed Assets 1,060,752,482
8. Non-Banking Assets 375,000
9. Other Assets 390,653,496
Total Assets 53,010,803,126
BALANCE SHEET OF 2008-2009
Capital & Liabilities Schedule Amount
1. Share Capital 2,407,068,900
2. Reserve & Fund 1,500,770,808
3. Debentures and Bonds 1,050,000,000
4. Borrowings 38,800,000
5. Deposits Liabilities 46,698,100,065
6. Bills Payable 82,338,018
7. Proposed Dividend 485,453,507
8. Income Tax Liabilities 38,296,736
9. Other Liabilities 709,976,092
Total capital & Liabilities 53,010,830,126
Assets Schedule .
1. Cash Balance 1,833,462,494
2. Balance with NRB 4,411,133,083
3. Balance with Banks/ Financial Institution 1,673,480,313
4. Money at Call and Short Notice 11 -
5. Investments 7,399,811,700
32
8/2/2019 Edited Paw An Final Report
http://slidepdf.com/reader/full/edited-paw-an-final-report 33/40
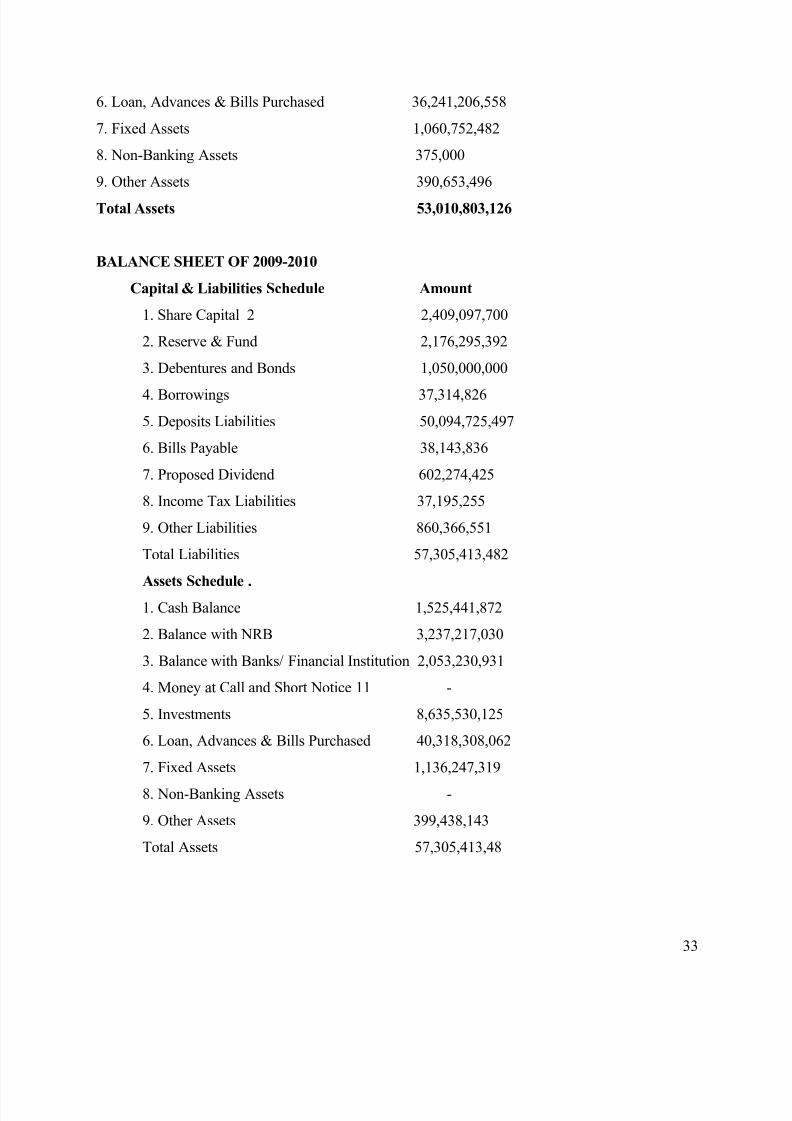
6. Loan, Advances & Bills Purchased 36,241,206,558
7. Fixed Assets 1,060,752,482
8. Non-Banking Assets 375,000
9. Other Assets 390,653,496
Total Assets 53,010,803,126
BALANCE SHEET OF 2009-2010
Capital & Liabilities Schedule Amount
1. Share Capital 2 2,409,097,700
2. Reserve & Fund 2,176,295,392
3. Debentures and Bonds 1,050,000,000
4. Borrowings 37,314,826
5. Deposits Liabilities 50,094,725,497
6. Bills Payable 38,143,836
7. Proposed Dividend 602,274,425
8. Income Tax Liabilities 37,195,255
9. Other Liabilities 860,366,551
Total Liabilities 57,305,413,482
Assets Schedule .
1. Cash Balance 1,525,441,872
2. Balance with NRB 3,237,217,030
3. Balance with Banks/ Financial Institution 2,053,230,931
4. Money at Call and Short Notice 11 -
5. Investments 8,635,530,125
6. Loan, Advances & Bills Purchased 40,318,308,062
7. Fixed Assets 1,136,247,319
8. Non-Banking Assets -
9. Other Assets 399,438,143
Total Assets 57,305,413,48
33
8/2/2019 Edited Paw An Final Report
http://slidepdf.com/reader/full/edited-paw-an-final-report 34/40
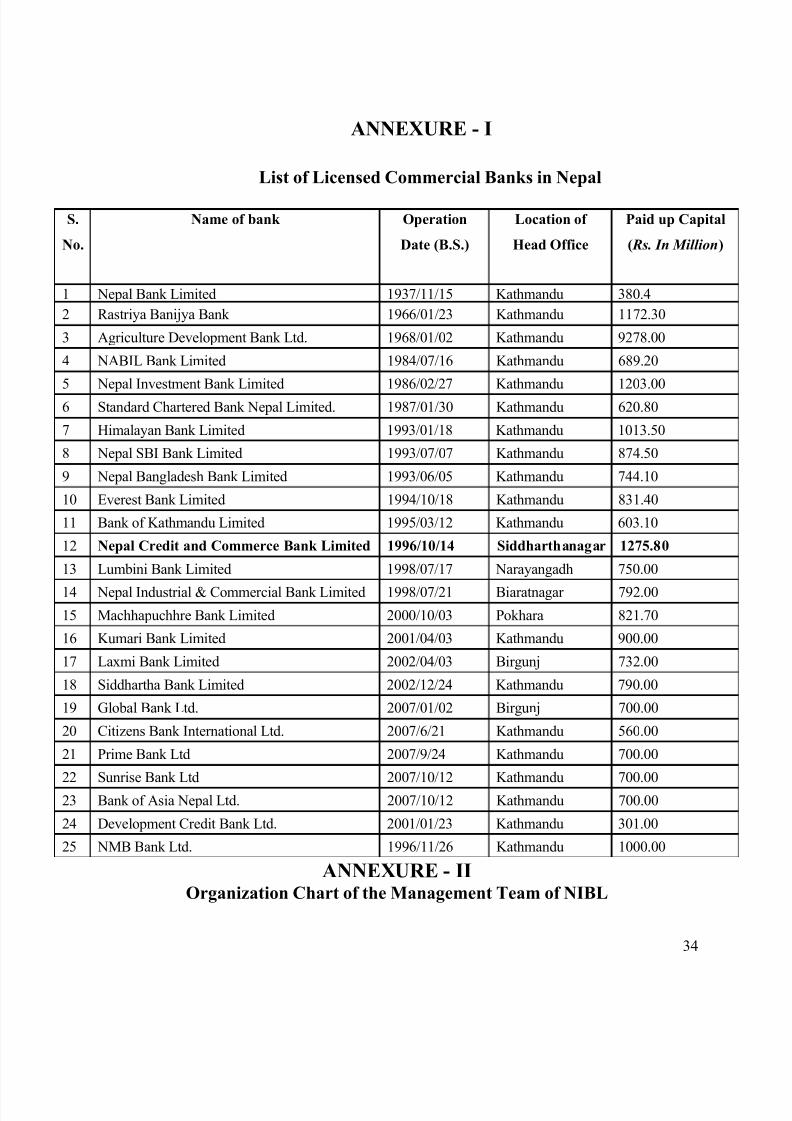
ANNEXURE - I
List of Licensed Commercial Banks in Nepal
ANNEXURE - IIOrganization Chart of the Management Team of NIBL
34
S.
No.
Name of bank Operation
Date (B.S.)
Location of
Head Office
Paid up Capital
( Rs. In Million)
1 Nepal Bank Limited 1937/11/15 Kathmandu 380.4
2 Rastriya Banijya Bank 1966/01/23 Kathmandu 1172.30
3 Agriculture Development Bank Ltd. 1968/01/02 Kathmandu 9278.00
4 NABIL Bank Limited 1984/07/16 Kathmandu 689.20
5 Nepal Investment Bank Limited 1986/02/27 Kathmandu 1203.00
6 Standard Chartered Bank Nepal Limited. 1987/01/30 Kathmandu 620.80
7 Himalayan Bank Limited 1993/01/18 Kathmandu 1013.50
8 Nepal SBI Bank Limited 1993/07/07 Kathmandu 874.50
9 Nepal Bangladesh Bank Limited 1993/06/05 Kathmandu 744.10
10 Everest Bank Limited 1994/10/18 Kathmandu 831.40
11 Bank of Kathmandu Limited 1995/03/12 Kathmandu 603.10
12 Nepal Credit and Commerce Bank Limited 1996/10/14 Siddharthanagar 1275.80
13 Lumbini Bank Limited 1998/07/17 Narayangadh 750.00
14 Nepal Industrial & Commercial Bank Limited 1998/07/21 Biaratnagar 792.00
15 Machhapuchhre Bank Limited 2000/10/03 Pokhara 821.70
16 Kumari Bank Limited 2001/04/03 Kathmandu 900.00
17 Laxmi Bank Limited 2002/04/03 Birgunj 732.00
18 Siddhartha Bank Limited 2002/12/24 Kathmandu 790.00
19 Global Bank Ltd. 2007/01/02 Birgunj 700.00
20 Citizens Bank International Ltd. 2007/6/21 Kathmandu 560.00
21 Prime Bank Ltd 2007/9/24 Kathmandu 700.00
22 Sunrise Bank Ltd 2007/10/12 Kathmandu 700.00
23 Bank of Asia Nepal Ltd. 2007/10/12 Kathmandu 700.00
24 Development Credit Bank Ltd. 2001/01/23 Kathmandu 301.00
25 NMB Bank Ltd. 1996/11/26 Kathmandu 1000.00

8/2/2019 Edited Paw An Final Report
http://slidepdf.com/reader/full/edited-paw-an-final-report 35/40
Chairman &
Chief Executive DirectorAudit Committee
Senior General Manager
Company SecretarySenior General Manager
Company Secretary
General Manager Deputy General
Manager
Credit/Retail
HeadInternal Audit
Audit Committee
Deputy GeneralManager
Operations
HeadHuman
Resource
Head
Legal
Shares &Company
Affairs
Assistant GeneralManager
Credit Quality
HeadLoan Admin
HeadForex/Treasury
HeadCash &
Transfer
BRANCHES
Operations
Head
General
Service
Head
R&D
Head
Remittance/
Card
Head
IT
Head
Accounts/Budgets
HeadCorporate Bank
HeadTrade Finance
HeadCredit Admin
BranchCo-ordination
HeadRetail Bank
Customer Service
Customer Finance
DepositMarketing
BRANCHES
Credit/Retail
ANNEXURE - III
Branches of NIBL
35

8/2/2019 Edited Paw An Final Report
http://slidepdf.com/reader/full/edited-paw-an-final-report 36/40
1. KATHMANDU HEAD OFFICE
Durbar Marg, P.O. Box 3412
Tel: 4228229, 4242530 (DISA)
Fax: 977-1-4226349, 4228927
Swift: NIBL NP KT
2. SEEPADOLE BRANCHSuryabinayak, Bhaktapur Tel: 6615617, 6612832
Fax: 6616617
3. BIRGUNJ BRANCHAdarshanagar, P.O. Box 101Tel (051) 523327, 525277
Fax: (051) 525297
4. PULCHOWK BRANCH
Pulchowk, Lalitpur
Tel: 5010188, 5010042Fax: 5010142
5. BANEPA BRANCH
Banepa, Kavre
Tel: (011) 664315,662401Fax: (011) 662402
6. JEETPUR BRANCH
Jeetpur, BaraTel: (053) 520297
Fax: (053) 520877
7. NEWROAD BRANCH
Newroad, KathmanduTel: 4242858, 4230374
Fax: 42270508. BIRATNAGAR BRANCH
Golcha Chowk, Biratnagar
Tel: (021) 534523, 534524, 534525Fax: (021) 534526
9. BUTWAL BRANCH
Traffic Chowk, Butwal
Tel: (071) 549991, 549992, 549993Fax: (071) 549888
10. BHAIRAHAWA BRANCH
Maitri Road, Bhairahawa
Tel: (071) 526991, 526992
Fax: (071) 526990
11. POKHARA BRANCH
Chiple Dunga,Pokhara
Tel: (061) 538919, 539276
Fax: (061) 538920
12. PUTALISADAK BRANCH
Putalisadak, Kathmandu
Tel: 4445302, 4445303Fax: 4445304
13. NARAYANGARH BRANCH
Pulchowk, Narayangarh
Tel: (056) 571921,571922,Fax: (056) 571925
14. JANAKPUR BRANCH
Mills Area, Janakpur
Tel: (041) 527331
Fax: (041) 527332
15. NEPALGUNJ BRANCH
Dhamboji, Nepalgunj
Tel: (081) 525978,525682
Fax: (081) 521664
16. THAMEL BRANCH
Chaksibari, Thamel
Tel: 4218431,4218434,Fax: 4218434
17. KALIMATI BRANCH
Kalimati Chowk, Kalimati
Tel: 4672493,4672494Fax: 4272612
18. BIRTAMOD BRANCH
Traffic Chowk, BirtamodTel:(023) 543810,543811
Fax: (023)543815
19. BATTISPUTALI BRANCH
Battisputali, KathmanduTel: 4471690,4471790
Fax: 4470202
20. DHANGADI BRANCH
Main Road, Dhangadi
Tel:(091) 523620,523706Fax: (091) 524090
21. GONGABU BRANCH
Gongabu Chowk, Kathmandu
Tel: 4365318,4365077Fax: 4365302
22. SURKHET BRANCH 23. JUMLA BRANCH
36

8/2/2019 Edited Paw An Final Report
http://slidepdf.com/reader/full/edited-paw-an-final-report 37/40
Neta Chowk, SurkhetTel: (083) 524330, 524331
Fax: 524332
Khalang Bazaar, JumlaTel: (087) 520132
Fax: 520304
24. BOUDHA BRANCH
Boudha, Kathmandu
Tel: 4480121,4480122Fax: 4480123
25. HETAUDA BRANCH
Bank Road, Hetauda
Tel: (057) 526001, 525946Fax: (057) 526005
26. PALPA BRANCH
Tansen,PalpaTel: (075) 520832,520833
Fax:(075)-520891
27. LUKLA BRANCH
Chaurikharka, LuklaTel:(038) 550120
Fax: (038) 550220
28. NAYA BANESHWOR BRANCH
Naya Baneshwor, Kathmandu
Tel:4785529,4782289,4782520
Fax: 4785537
29. DHUMBARAHI BRANCH
Pipalbot Chowk, Kathmandu
Tel: 4009006, 4009007
Fax: 4009009
30. BHOTAHITI BRANCH
Bhotahiti, KathmanduTel: 4230797, 4230788
Fax: 4230771
31. TULSIPUR BRANCH
Tulsipur, DangTel:(082)521613,521614
Fax: 521615
32. TRIPURESHWOR BRANCH
Tripureshwor, Kathmandu
Tel: 4259780, 4259980Fax: 4260324
33. DAMAULI BRANCH
Safasadak, Damouli
Tel:(065) 562500,562600Fax: (065) 562700
34. KRISHNANAGAR BRANCH
Krishnanagar, KapilvastuTel: (076) 520764, 520765, 520766
Fax: (076) 520354
35. GAIGHAT BRANCH
Gaighat, Udayapur Tel: (035) 420952, 420953
Fax: (035) 420954
36. LAZIMPAT BRANCHLazimpat, Kathmandu
Tel:4005058, 4005069, 4005068Fax:4005065
37. PARSA BRANCHParsa, Chitwan
Tel: (056) 583623, 583624Fax: (056) 583625
38. MAHARAJGUNJ BRANCH
Maharajgunj, KathmanduTel:4016151, 4016152
Fax:4016155
39. LALBANDHI BRANCH
Lalbandhi, SarlahiTel: (046) 501583, 501584
Fax:(046) 501585
40. LAGANKHEL BRANCH
Lagankhel, Lalitpur
Tel: 5552980
Fax: 5552990
ANNEXURE IVProducts and Services of NIBL
Products and
services PurposeTarget market
Strategies Growth
37

8/2/2019 Edited Paw An Final Report
http://slidepdf.com/reader/full/edited-paw-an-final-report 38/40

8/2/2019 Edited Paw An Final Report
http://slidepdf.com/reader/full/edited-paw-an-final-report 39/40
10. NTC
mobile bill
payment
to provide
customers
varieties of
services
all account
holders using
NTC mobile
service.
promotion of
this service to
every account
holders
medium
growth
11. ATM
services
cash withdrawl
and balanceinquiry, also has
facility of
depositing
money through
ATM machines
in some places
all account
holders
increasing
efficiency
medium
growth
12. Tele-
banking
service
to make inquiry
of account
balance and to
order statement
of account
all account
holders
focus on
reliability and
secrecy
through the
use of password
n/a
39

8/2/2019 Edited Paw An Final Report
http://slidepdf.com/reader/full/edited-paw-an-final-report 40/40
Related Documents