Economic Growth and Income Inequality Simon Kuznets The American Economic Review, Vol. 45, No. 1. (Mar., 1955), pp. 1-28. Stable URL: http://links.jstor.org/sici?sici=0002-8282%28195503%2945%3A1%3C1%3AEGAII%3E2.0.CO%3B2-Y The American Economic Review is currently published by American Economic Association. Your use of the JSTOR archive indicates your acceptance of JSTOR's Terms and Conditions of Use, available at http://www.jstor.org/about/terms.html . JSTOR's Terms and Conditions of Use provides, in part, that unless you have obtained prior permission, you may not download an entire issue of a journal or multiple copies of articles, and you may use content in the JSTOR archive only for your personal, non-commercial use. Please contact the publisher regarding any further use of this work. Publisher contact information may be obtained at http://www.jstor.org/journals/aea.html . Each copy of any part of a JSTOR transmission must contain the same copyright notice that appears on the screen or printed page of such transmission. The JSTOR Archive is a trusted digital repository providing for long-term preservation and access to leading academic journals and scholarly literature from around the world. The Archive is supported by libraries, scholarly societies, publishers, and foundations. It is an initiative of JSTOR, a not-for-profit organization with a mission to help the scholarly community take advantage of advances in technology. For more information regarding JSTOR, please contact [email protected]. http://www.jstor.org Fri Jan 11 10:33:50 2008

Welcome message from author
This document is posted to help you gain knowledge. Please leave a comment to let me know what you think about it! Share it to your friends and learn new things together.
Transcript
8/3/2019 Economics Growth and Income Inequality_Kuznets_AER55
http://slidepdf.com/reader/full/economics-growth-and-income-inequalitykuznetsaer55 1/31
Economic Growth and Income Inequality
Simon Kuznets
The American Economic Review, Vol. 45, No. 1. (Mar., 1955), pp. 1-28.
Stable URL:
http://links.jstor.org/sici?sici=0002-8282%28195503%2945%3A1%3C1%3AEGAII%3E2.0.CO%3B2-Y
The American Economic Review is currently published by American Economic Association.
Your use of the JSTOR archive indicates your acceptance of JSTOR's Terms and Conditions of Use, available athttp://www.jstor.org/about/terms.html. JSTOR's Terms and Conditions of Use provides, in part, that unless you have obtainedprior permission, you may not download an entire issue of a journal or multiple copies of articles, and you may use content inthe JSTOR archive only for your personal, non-commercial use.
Please contact the publisher regarding any further use of this work. Publisher contact information may be obtained athttp://www.jstor.org/journals/aea.html.
Each copy of any part of a JSTOR transmission must contain the same copyright notice that appears on the screen or printedpage of such transmission.
The JSTOR Archive is a trusted digital repository providing for long-term preservation and access to leading academic journals and scholarly literature from around the world. The Archive is supported by libraries, scholarly societies, publishers,and foundations. It is an initiative of JSTOR, a not-for-profit organization with a mission to help the scholarly community takeadvantage of advances in technology. For more information regarding JSTOR, please contact [email protected].
http://www.jstor.orgFri Jan 11 10:33:50 2008
8/3/2019 Economics Growth and Income Inequality_Kuznets_AER55
http://slidepdf.com/reader/full/economics-growth-and-income-inequalitykuznetsaer55 2/31
The American Economic ReviewVOLUME XLV MARCH, 1955 NUMBER ONE
E C O N O M I C G R O W T H AND I N C O M E I N E Q U A L I T Y *
By SIMONKUZN ET S
T he cen tral theme of this pap er is the chara cte r an d causes of long-term changes in the personal distribution of income. Does inequalityin the d istribution of income increase or decrease in th e course of acountry's economic growth? What factors determine the secular leveland tre nd s of income inequa lities?
These are broad questions in a field of stu dy th at h as been plaguedby looseness in definitions, unusu al scarcity of data , and p ressures of
strongly held opinions. While we ca nnot com pletely avoid th e resultingdifficulties, it m ay help to specify the ch arac teristic s of the size-of-income distributions that we want to examine and the movements ofwhich we want to explain.
Five specifications may be listed. First, the units for which incomesare recorded and grouped should be family-expenditure units, properlyadjusted for th e num ber of persons in each-rather than income re-cipients for whom the relations between receipt and use of income canbe widely diverse. Second, the distribution should be complete, i.e.,
should cover all units in a country rather than a segment either at theupper or lower tail. Third, if possible we should segregate the unitswhose main income earn ers are either still in the lea rning or alrea dy inthe retired stages of the ir life cycle-to avoid com plicating the pic tu reby including incomes not associated w ith full-time, full-fledged parti cipa -tion in economic activity. F ou rth , income should be defined a s it is nowfor national income in this country, i.e., received by individuals, in-cluding income in kind, be fore an d af te r direct taxes, excluding cap italgains. Fifth, the units should be grouped by secular levels of income,free of cyclical and other transient disturbances.
Fo r such a distribution of m atur e expen diture units by s ecular levels
* Presidential address delivered a t the Sixty-seventh An nual Meeting of th e AmericanEconomic Association, Detro it, Michigan, December 29, 1954.

8/3/2019 Economics Growth and Income Inequality_Kuznets_AER55
http://slidepdf.com/reader/full/economics-growth-and-income-inequalitykuznetsaer55 3/31
8/3/2019 Economics Growth and Income Inequality_Kuznets_AER55
http://slidepdf.com/reader/full/economics-growth-and-income-inequalitykuznetsaer55 4/31
8/3/2019 Economics Growth and Income Inequality_Kuznets_AER55
http://slidepdf.com/reader/full/economics-growth-and-income-inequalitykuznetsaer55 5/31
2 THE AMERICAN ECONOMIC REVIEW
of income per cap ita, we should m easure sh are s of some fixed ordinalgroups-percentiles, deciles, quintiles, etc. I n the und erlying ar ra y th eunits should be classified by ave rage income levels for a sufficiently longspan so tha t they form income-status groups-say a generation orabout 25 years. Within such a period, even when classified by secularincome levels, units m ay shift from one ordinal group to anoth er. I twould, therefore, be necessary and useful to study separately the rela-tive sha re of u nits tha t, through out the generation period of re ference,were continuou sly within a specific ordinal gro up, and th e sh are of the
units that moved into that specific group; and this should be done forthe shares of "residents" and "n ~ig ran ts" within all ordinal groups.
Without such a long period of reference and the resulting separationbetween "resident" an d "migrant" units a t different relative incomelevels, the very distinction between "low" an d "high" income classesloses its meaning, par ticula rly in a stu dy of long-term changes in sharesand in inequalities in the distribution. To say, for example, that the"lower" income classes gained or lost during the last twen ty yea rs intha t their sha re of tota l income increased o r decreased h as m eaning onlyif the units have been classified as members of the "lower" classes
throughout those 20 years-and for those who have moved into or ou tof those classes recently such a s tatem ent ha s no significance.
Furthe rmo re, if one may a dd a final touch to wh at is beginning tolook like a statistic al economist's pipe d ream , we should be able to tracesecular income levels no t only throug h a single generation bu t a t leastthroug h two-connecting the incomes of a given genera tion with thoseof its immediate descendants. We could then distinguish units that.
throughout a given generation, remain within one ordinal group andwhose children-through their generation-are also within th at group ,
from units that remain within a group through their generation butwhose children move up or down on the relative economic scale in theirtime. T he numb er of possible combinations an d perm utations becomes
large; b ut it should not obscure the main design of the income struc turecalled for-the classification by long-term incom e st at us of a givengeneration an d of its imm ediate descen dants. If living members ofsociety-as produ cers, consu me rs, savers, decision-makers on secularproblems-react to long-term changes in income levels an d sha res, da taon such a n income struc ture a re essential. An economic society can thenbe judged by t he secular level of the income sh are th at i t provides for
a given generation and for its children. T h e imp ortant corollary is thatthe stud y of long-term changes in the income distribution m ust d istin-guish between changes in the sha res of resid ent groups-resident withineither one or two generations-and changes in the income sha res of
8/3/2019 Economics Growth and Income Inequality_Kuznets_AER55
http://slidepdf.com/reader/full/economics-growth-and-income-inequalitykuznetsaer55 6/31
3UZNETS: ECONOMIC GROWTH AND I NCOM E INEQUALITY
groups that, judged by their secular levels, migrate upward or down-ward on the income scale.
Eve n if we had d ata to approxim ate the income structu re just o ut-lined, the broad question posed a t the start-how income ineq ualitychanges in th e process of a co un try 's economic growth-could beanswered only for grow th unde r defined economic and social conditions.And, in fact , we shall deal with this qu estion in terms of the ex perienceof the now developed countries which grew under the aegis of the busi-ness enterprise. But even with this limitation, there are no statistics
that can be used directly for the purpose of measuring the secularincome structure. Indeed, I have difficulty in visualizing how suchinfo rm atio n could practicably be collected-a difhculty th at m ay bedu e to lack of familiarity with th e studie s of our colleagues in de-
mography and sociology who have concerned themselves with prob-lems of generation or intergeneration mobility and status. But althoughwe now lack data directly relevant to the secular income structure,the se tting up of reasona bly clear an d ye t difficult specifications isnot merely an exercise in perfectionism. For if these specifications doapproximate, an d I trus t th at they do, the real core of our interest when
we talk ab ou t shares of economic classes or long-term changes in theseshares, then prop er disclosure of our meaning a nd intentions is vitallyuseful. I t forces us to examine and evaluate cri tically the data tha t areavailable; it prevents us from jumping to conclusions based on theseinadequate data; it reduces the loss and waste of time involved inmechanical manipulations of the type represented by Pareto-curve-fitting to groups of da ta whose meaning , in term s of income concep t,un it of observ ation, an d proportion of th e tota l universe cove red, re-mains distressingly vague; and most important of all, it propels us
toward a deliberate construction of testable bridges between the avail-able data a nd the income struckure that is the real focus of our interest.
I . Trends in Income Inequal i ty
Forewarned of the difficulties, we turn now to the available data.
These data, even when relating to complete populations, invariablyclassify units by income for a given year. From our standpoint, this is
their major limitation. Because the data often do not permit manysize-groupings, and because the dilference between annual incomeincidence and longer-term incom e statu s has less effect if the n um ber of
classes is small a nd th e limits of each class ar e wide, we use a few wideclasses. T hi s does not resolve the difficulty; an d the re a re others d ue tothe scantiness of da ta for long periods, inadeq uacy of th e un it used-which is, a t best, a fam ily and very often a reporting unit-errors in th e
8/3/2019 Economics Growth and Income Inequality_Kuznets_AER55
http://slidepdf.com/reader/full/economics-growth-and-income-inequalitykuznetsaer55 7/31
4 THE AMERICAN ECONOMIC REVIEW
data, and so on through a long list. Consequently, the trends in theincome structur e can be discerned b ut dimly, and th e results consideredas preliminary informed guesses.
T he da ta are for the United States, England, and Germany-a scan tsample, but at least a starting point for some inferences concerninglong-term changes in the presently developed countries. The generalconclusion suggested is tha t the relative distribution of income, asmeasured by annual income incidence in rather broad classes, has beenmoving tow ard equality-with these tren ds particularly noticeable
since the 1920's but beginning perhaps in the period before the firstworld war.
Let me cite some figures, all for income before direct taxes, in sup-port of this impression. I n the Un ited States, in the distribu tion of in-come among families (excluding single individu als), th e shares of th etwo lowest quintiles rise from 13 % p er cent in 1929 to 18 per cen t in theyears af ter the second world war (av era ge of 1944, 1946, 1947, an d1950) ; whereas th e sha re of the to p quintile declines from 55 to 44 percent, and tha t of the top 5 per cent f rom 31 to 20 per cent. I n theUn ited Kingdom , the sha re of the to p 5 per c ent of u nits declines from46 per cen t in 1880 to 43 per cent in 1910 or 1913, to 33 per cent in1929, to 31 per cent in 1938, and to 24 per cent in 1947; t he sh are ofthe lower 85 per cent remains fairly constant between 1880 and 1913,between 41 an d 43 per cent, bu t then rises to 46 per cent in 1929 and55 per cent in 1947. In Prussia income inequality increases slightlybetween 18 75 and 1913-the shares of th e to p quintile rising from 48to 50 per cent, of the top 5 per cent from 26 to 30 per cen t; the shareof the lower 60 per cent, however, remains abou t the same. I n Saxony,the change between 1880 an d 1913 is minor: the sh are of the two
lowest quintiles declines from 15 to 14% per cen t; th at of the thirdquintile rises from 12 to 13 per cen t, o f- he fo urth quintile from 16%to about 18 per cen t; t ha t of the top quintile declines from 56% to54% per cent, an d of the top 5 per cent f rom 34 to 33 per cent. I nGermany as a whole, relative income inequality drops fairly sharplyfrom 1913 to the 192 03, app arently d ue to decimation of large for -tunes and property incomes during the war and inflation; but thenbegins to retu rn to prew ar levels duri ng the depression of the 1930's.'
'The following sources were used in calculating the figures cited:
United States. For recent years we used Income Dis tr ibution b y Size, 1944-1950 (Wash-
ington, 1953) and Selma Goldsmith and others, "Size Distribution of Income Since the
Mid-Thirties," Rev. Econ. Stat. , Feb. 1954, XXXVI, 1-32; for 1929, the Brookings Institu-
tion data as adjusted in Simon Kuznets, Shares of Upper Groups in Income and Savings(New York, 1953), p. 220.
United Kingdom. For 1938 and 1947, Dudley Seen, The Levelling of Income Since 1038
8/3/2019 Economics Growth and Income Inequality_Kuznets_AER55
http://slidepdf.com/reader/full/economics-growth-and-income-inequalitykuznetsaer55 8/31
5UZNETS: ECONOMIC GROWTH AND INCO ME INEQUALITY
Even for what they a re assumed to represent, let alone as approxima-
tions to shares in distributions by secular income levels, the data aresuch that differences of two or three percentage points cannot be as-signed significance. One must judge by the general weight and consen-sus of the evidence-which un for tun ate ly is limited to a few cou ntries.I t justifies a ten tative impression of constancy in th e relative distribu-tion of income before taxes , followed by so me narrow ing of relativeincome inequ ality af ter the first world war-or earlier.
Three aspects of this finding should be stressed. First, the data are
for income before direct taxes and exclude contributions by govern-ment (e.g., relief and free assistance). I t is fair to argue th at both th eproportion an d progressivity of direct taxes and th e proportion of totalincome of individuals accounted for by government assistance to the
less privileged economic grou ps have grown d urin g recen t decades. Th isis certainly true of the United States and the United Kingdom, but inthe case of Germ any is subject to furth er examination. I t follows th atthe distribution of income after direct taxes an d including free contribu-tions by government would show an even greater narrowing of in-equality in developed countries with size distributions of pretax, ex-
government-benefits income similar to those for the United States andthe United Kingdom.
Second, such stab ility or reduction in the inequality of the percen tageshares was accompanied by significant rises in real income per capita.T h e countries now classified as developed h ave enjoyed rising percapita incomes except during catastrophic periods such as years ofactive world conflict. Hence, if the shares of groups classified by theirannual income position can be viewed as approximations to shares ofgroups classified by their secular income levels, a constant percentage
share of a given group means that its per capita real income is risingat the same rate as the average for all units in the country; and a re-duction in inequality of the shares means that the per capita incomeof the lower-income groups is rising a t a more rapid ra te tha n the percapita income of the upper-income groups.
T he third point can be put in the form of a question. Do th e distribu-
(Oxford, 1951) p. 39; for 1929, Colin Clark, National Income and Outlay (Lond on, 1937)Table 47, p. 109; fo r 1880, 1910, and 1913, A. Bowley, The Change in the Distribution ofthe National Income, 1880-1913 (Oxford, 1920).
Germany. For the consti tuent areas (Prussia, Saxony and others) for years before the
first world war, based on S. Prokopovich, iVational Income of We ste rn Europea n Co untries(published in M oscow in the 1920's). Some summa ry results are given in Prokopo vich,"The Distribution of National Income," Econ. Jour., March 1926, XXXVI, 69-82. See also,"Das Deutsche Volkseinkommen vor und nach dem Kriege," Einzelschrift zur Sta t. desDeutschen Reichs, no. 24 (Berlin, 1932) , an d W. S. an d E. S. Woytinsky, WorId Popula-tion and Production (New York, 1953) Table 192, p. 709.

8/3/2019 Economics Growth and Income Inequality_Kuznets_AER55
http://slidepdf.com/reader/full/economics-growth-and-income-inequalitykuznetsaer55 9/31
6 T H E AMERICAN ECONOMIC REVIEW
tions by annual incomes properly reflect trends in distribution bysecular incomes? As technology and economic performance rise tohigher levels, incomes are less subject to transient disturbances, not
necessarily of the cyclical order th at ca n be recognized a nd allowedfor by reference to business cycle chronology, but of a more irregulartype. If in the earlier years the economic fortunes of units were sub-
ject to greater vicissitudes-poor crops for some farm ers , na tur alcalam ity losses for some non farm business units-if the over-all pro por -tion of individual entr epr ene urs whose incomes were subject to such
calamities, more yesterday but some even today, was larger in earlierdecades, these earlier distributions of income would be more affectedby transient disturbances. I n these earlier distributions th e temporarilyunfortunate might crowd the lower quintiles and depress their sharesunduly, and th e temporarily fortunate might dominate the top quintileand raise its share unduly-proportionately more than in th e distribu-tions for later years. If so, distributions by longer-term average in-comes might show less reduction in inequality th an do the distribution s
by annual incomes; they might even show an opposite trend.One may doubt whether this qualification would upset a narrowing
of inequality as marked as th at for the United States, and in as shorta period as twenty-five years. Nor is it likely to affect the persistentdownw ard drif t in th e spread of the distributions in the Un ited King-dom. But I must admit a strong element of judgment in deciding howf a r this qualification modifies the finding of long-term stab ility followedby reduction in income inequality in the few developed countries forwhich it is observed or is likely to be revealed by existing data. Theimp ortant point is that the qualification is relev ant; it suggests need forfurther study if we are to learn much from the available d at a con-
cerning the secular income structure; and such study is likely to yieldresults of interest in themselves in their bearing upon the problemof trend s in temporal in stability of income flows to individual unit sor to econom ically significant groups of units in different sectors ofthe national economy.
11. An Attempt at Explanation
If the above summ ary of trends in the secular income struc ture ofdeveloped co~~ntriesomes perilously close to pure guesswork, anattempt to explain these dimly discernible trends may surely seem
foolhardy. Yet it is necessary to do so if only to bring to th e sur fac esome factors that m ay have been a t play; induce a search fo r databearing upon these factors; and thu s confirm or revise our impressionsof the tre nds themselves. Such preliminary speculations a re useful
8/3/2019 Economics Growth and Income Inequality_Kuznets_AER55
http://slidepdf.com/reader/full/economics-growth-and-income-inequalitykuznetsaer55 10/31
7UZNETS: EC O N O MIC G R O W TH A N D IN C O M E IN EQ U A LITY
provided it is recognized that we are at a relatively early stage in along process of interpla y am ong tenta tive summ aries of evidence,preliminary hypotheses, and search for additional evidence that mightlead to reform ulation an d revisions-as bases for new analy sis an dfurther search.
The present instalment of initial speculation may be introduced bysaying th at a long-term constancy , let alone reduction, of inequality inthe secular income structure is a puzzle. F or there ar e a t least twogroups of forces in the long-term opera tion of developed countries th at
make for increasing inequality in the distribution of income beforetaxes and excluding contributions by governments. The first grouprelates to the concentration of savings in the upper-income brackets.According to all recen t studies of t he app ortionm ent of income betweenconsumption and savings, only the upper-income groups save; the
total savings of groups below the top decile ar e fair ly close to zero. F orexample, the top 5 per cent of units in the United States appear toaccount for alm ost two-thirds of individuals7 savings; an d the topdecile comes close to acco unting for all of it. Wh at is pa rticu larly im-porta nt is tha t the inequality in distribution of savings is grea ter tha nth at in the distribution of pro pe rty incom es, an d hence of assets.'Granted t ha t this finding is based on distribution of ann ual income,
and that a distribution by secular levels would show less inequality inincome and correspondingly less conc entration of savings, the in-equality in savings would still remain fair ly sha rp, perhaps more sothan in holdings of assets. Other conditions being equal, the cumulativeeffect of such in equa lity in savings would be the con centratio n of a nincreasing prop ortion of incom e-yielding assets in the ha nd s of the
upp er groups-a basis fo r larger incom e share s of these gro cp s an d
their descendants.Th e second source of the puzzle lies in t he ind ustrial stru ctu re of
the income distribution. An invariable accompaniment of growth in
developed co untries is the s hi ft aw ay f ro m agriculture, a process usu-ally referred to as industrialization and urbanization. The income dis-
tribution of the total po pulation, in th e simplest model, m ay th erefo rebe viewed as a combination of the income distributions of the ruralan d of th e urba n populations. Wh at little we know of the structures
of these two comp onent income distributions reveals tha t: ( a ) theaverage per cap ita income of the ru ral popu lation is usually lower th an
that of the urban; ' ( b ) inequality in the percentage shares within th e
a See Kuznets, op . cit., particularly Chapters 2 and 6.
'Th e lower level of per capita incom e of the agricultural or rural population comparedwith th at of ur ban is fairly ulell established, fo r this country by states, and for m any
8/3/2019 Economics Growth and Income Inequality_Kuznets_AER55
http://slidepdf.com/reader/full/economics-growth-and-income-inequalitykuznetsaer55 11/31
8 T H E AMERICAN ECONOMIC REVIEW
distribution for the rural population is somewhat narrower than inthat for the urban po pu lat ion -ev en when based on annual income; andthis difference would probably be wider for distributions by secularincome le v e k 4 Operating with th is simple m odel, wh at conclusions dowe reach? First, all other conditions being equal, the increasing weightof urban population m eans an increasing sha re for the more unequal ofthe two component distributions. Second, the relative difference in percapita income between the rural and urban populations does notnecessarily drif t dow nward in the process of economic growth: indeed,
there is some evidence to suggest that it is stable at best, and tends towiden because per cap ita productivity in urb an pu rsuits increases morerapidly than in agriculture. If this is so, inequality in the total in-come distribution should increase.
Two questions then arise: First, why does the share of the top-income groups show no rise over time if the concentration of savingshas a cumulative eff ec t? Second, why does income inequ ality declinean d particu larly why d oes the sha re of the lower-income group s rise ifboth th e weight of the more unequal urb an income distribution a nd therelative difference between per capita urban and per capita rural in-
comes increase?The first question has been discussed elsewhere, although the re-
sul ts ar e still prelim inary hypotheses,' an d it would be impossible todo more here th an summarize the m briefly.
Factors Counteracting t he C oncentratio n of Saving
One group of factors co unte racting the cum ulative effect of con-
other countries (see, e.g., a summary table of closely related measures of product andworkers engaged, for var ious divisions of the productive system , in Colin Clark, Conditions
of Economic Progress, 2nd ed. [Lon don 19511, pp. 316-18). T he same table suggests, forthe countries with sufficiently long records, a stable or increasing relative difference betweenper-worker product in agriculture and per-worker product in other sectors of the economy.
'Thi s i s true of the U. S. distributions prior to the second world war (see sources citedin footnote 1) ; in the years after the second world war the difference seems to have disap-peared. It is true of the distributions for Prussia, ci ted b y Prokopo vich; and most conspicu-ous for India today as shown in the rough distributions by M . Mukherjee and A. K. Ghoshin "The Pattern of Income and Expenditures in the Indian Union: A Tentative Study,"International Statistical Conferences, December 1951, Calcutta, India, Part 111, pp. 49-68.
"ome elements of th e discussion appeared in "Prop ortion of Capital Fo rm atio n to Na -tional Product," a paper su bmitted to the an nu al meeting of the American Eco nomic Associ-ation in 1951 and published in Am. Econ. Rev., Proceedings, M ay 1952, X L II , 507-26. A
more elaborate statement is presented in "International Differences in Capital Formationand Financing" (particu larly Appendix C, Levels and Tren ds in Inco me Shares of UpperIncome Groups), a paper submitted to a Conference on Capital Formation and EconomicGrowth held in 1953 under the auspices of the Universities-National Bureau Committecfor Economic Research. It is now in press as pa rt of the volume of proceedings of th atconference.
8/3/2019 Economics Growth and Income Inequality_Kuznets_AER55
http://slidepdf.com/reader/full/economics-growth-and-income-inequalitykuznetsaer55 12/31
9UZNETS: ECONOMIC GROWTH AND INCOME INEQUALITY
centration of savings upon upper-income shares is legislative interfer-ence an d "political" decisions. The se may b e aimed a t limiting th ecumulation of property directly through inheritance taxes and otherexplicit capital levies. They may produce similar effects indirectly,e.g., by government-permitted or -induced inflation which reduces theeconomic value of accumulated wealth stored in fixed-price securitiesor other properties not fully responsive to price changes; or by legalrestriction of the yieZd on accumu lated property, a s happened recentlyin th e form of re nt co ntrols or of artificially low long-term in terest rat es
maintained by the government to protect the m arke t for its own bonds.To discuss this complex of processes is beyond the competence ofthis paper, but its existence and possible wide effect should be notedand one point emphasized. All these interventions, even when notdirectly aimed a t limiting the effects of accum ulation of pa st savingsin the ha nd s of the few, do reflect the view of society on th e long-termutility of wide income inequalities. Th is view is a vita l force th at w ouldope rate in democratic societies even if the re were no o ther cou nterac t-ing factors. This should be borne in mind in connection with changes inthis view even in developed countries, which result from the process of
growth and constitute a re-evaluation of the need for income in-equalities as a source of savings for economic growth. T h e result o fsuch changes would be a n increas ing press ure of legal an d politicaldecisions on upper-income shares-increasing as a co un try mov es tohigher economic levels.
We tur n to three othe r, less obvious grou ps of factors cou nterva ilingthe cum ulative effects of con cen tration of savings. T h e first is demo-graphic. I n the presen tly developed countries there have been dif-ferential rate s of increase between the rich an d the poor-family con-trol having first spread to the former. Hence, even disregarding mi-
gration, one can argue th at the top 5 per cen t of 1870 an d its descend-ants would account for a significantly smaller percen tage of th e popu-lation in 1920. This is even more likely in a country like the UnitedStates with its su bsta ntia l immigration-usually enterin g the incomedistribution at the lower-income levels; and may be less likely in acountry fro m which the poor have emigrated. T h e top 5 per cent ofpopulation in 1920 is, therefo re, comp rised only pa rtl y of the de-scendants of the top 5 per cent of 1870; perhaps half or a largerfraction must have originated in the lower-income bra ck ets of 1870.
Th is means th at the period during which effects of concentration ofsavings can be assumed to have cumulated to raise the income shareof an y given fixed ordinal group (whether it be the top 1, 5, or 10 percent of the population) is much shorter than the fifty years in thespan ; and hence these effects are much w eaker than they would have
8/3/2019 Economics Growth and Income Inequality_Kuznets_AER55
http://slidepdf.com/reader/full/economics-growth-and-income-inequalitykuznetsaer55 13/31
10 T H E A MERIC AN EC O N OMIC R EV IEW
been if the top 5 per cent of 1870 ha d, through their descen dants, filledcompletely the ra nk s of the top 5 per ce nt of th e pop ulation of 1920.
Although th e cum ulative effect of savings may be to raise the relativeincome of a progressively diminishing top proportion of total popula-tion, their effect on th e relative sha re of a fixed top pro portion of thepopulation is much reduced.
T h e second grou p of forces resides in the very na tu re of a d ynam iceconomy with relative freedom of individual opportunity. I n such asociety technological change is rampant and property assets that
originated in older industries almost inevitably have a diminishingprop ortiona l weight in th e tota l because of th e mo re rapid growth ofyounge r industries. Unless the descen dan ts of a high-income g roupmanage to shift their accumulating assets into new fields and partici-pate with new entrepreneu rs in th e growing s hare of the new and moreprofitable industries, the long-range returns on their property holdingsar e likely to be significantly lower th an th ose of the mo re recenten tran ts into the class of sub stantial asset holders. "Fro m shirt-sleevesto shirt-sleeves in three generations" probably exaggerates the effectsof this dynam ism of a growing economy: there ar e, among the up per-
income groups of today, m any descend ants of the upper-income group sof more than three or even four generations ago. But the adage isrealistic in the sense that a long unbrok en sequence of co nnec tion withrising indu stries and hence with m ajor sou rces of continued largeproperty incomes is exceedingly rare; that the successful great entre-preneurs of toda y ar e rarely sons of the great an d successful entrep re-
neurs of yesterday.The third group of factors is suggested by the importance, even in
th e upper-income bra ck ets, of service income. At an y given tim e, only
a limited pa rt of the income differen tial of a top group is accounted forby the concentration of property yields: much of it comes from thehigh level of service income (profe ssiona l an d entre pre ne uria l earnin gsand the l ike). T h e secular r ise in the upper incomes due to this source islikely to be less mark ed than in th e service incomes of lower brack ets,
an d for two som ewh at differen t reasons. Fir st, in so far a s high levelsof service incomes of given up per units ar e du e to individu al excellence(as is t rue of m any profess ional and entrepreneur ia l pursui ts) , thereis mu ch less incen tive for an d possibility of keeping su ch incomes a tcon tinued high relative levels. He nc e, th e service incomes of the d e-
scendants of an initially high level unit are no t l ikely to show as strongan upward trend as the incomes for the large body of population a t
lower-income levels. Second, a su bsta ntia l p ar t of th e rising tren d inper capita income is due to interindustry shift, i.e., a shift of workersfrom lower-incom e to higher-income indus tries. T h e possibilities of rise
8/3/2019 Economics Growth and Income Inequality_Kuznets_AER55
http://slidepdf.com/reader/full/economics-growth-and-income-inequalitykuznetsaer55 14/31
KUZNE'I'S: E C O N O M I C G R O W T H A N D I N C O M E I N EQ U A LI TY 11
due to such interin dus try sh ifts in the service incomes of the initiallyhigh-income groups a re much m ore limited than fo r the population a s awhole: they are already in high-income occupations and industries andthe range for them toward higher paid occupations is more narrowlycircumscribed.
Th es e three groups of facto rs, even disregarding such legislative andpolitical interve ntion a s is indicated ab ove, are a ll characteristics of adynamic growing economy. T h e differentials in rat e of na tur al increase
between th e upper- an d the lower-income groups ar e true only of a
rapid ly growing population-with or with out immigration-but ac-companied by declining death rates and declining birth rates, a demo-graphic pattern associated in the past only with the growing Westerneconomies. T h e imp act of new indu stries o n obsolescence of a lre ad yestablished wealth a s a source of p rope rty income is clearly a functionof ra pid grow th, an d the more rapid th e growth the greate r the impactwill be. T h e effect of i nte rind us try s hifts on the rise of p er c apitaincome , pa rtic ula rly of lower-incom e grou ps, is also a fu nction ofgrowth since only in a growing economy is there much shift in therelative importanc e of the several industr ial sectors. One can then s ay ,
in general, that the basic factor militating against the rise in upper-income shares that would be produced by the cumulative effects of
conc entra tion of savin gs, is the dyn am ism of a growing an d freeeconomic society.
Yet while the discussion answers the original question, it yieldsno determinate answer as to whether the trend in income shares ofupper groups is upward, downward, or constant. Even for the specificquestion discussed. a determinate answer depends upon the relativeba lance of factors-continuous con centra tion of savings mak ing foran increasing share, and the offsetting forces tending to cancel thiseffect. T o tell wh at the tr end of upper-income shares is likely to be , meneed to know much m ore ab ou t the weights of these conflicting pres-sures. Moreover. the discussion has brought to th e surface fa ctors tha t,in an d of themselves, m ay cause either an upward o r a downward trendin the sha re of upp er-income group s and hence in income inequality-in distributions of ann ual or o f secular income. Fo r example, the newen tra nts into the uppe r groups-the upw ard "migrants"-who riseeither because of esceptional ability or attach me nt to new industries orfor a varie ty of other reasons-may be enter ing th e fixed uppe r grou p
of say th e top5
per cent with an income differential-either ann ual orlong-term-that ma y be relatively grea ter than tha t of en tra nts in thepreceding generation. Nothing in the argument so far excludes this
possibility-which would mean a rise in the sh are of upper-incomegroups, even if the sh are of the old "resident" pa rt rem ains consta nt or
8/3/2019 Economics Growth and Income Inequality_Kuznets_AER55
http://slidepdf.com/reader/full/economics-growth-and-income-inequalitykuznetsaer55 15/31
12 THE AMERICAN ECONOMIC REVIEW
even declines. Even disregarding other factors th at w ill be noted in thenext section, no firm conclusion as to tre nds of upper-income sha rescan be derived from the ba re m odel discussed. Search for further da tamight yield evidence that would permit a reasonably rough but deter-minate conclusion; but I have no such evidence a t hand.
T h e Sh ift from Agricultural to Nonagricultural Sectors
What about the trend toward greater inequality due to the shiftfrom the agricu ltural to the nonag ricultural sectors? In view of the im-por tance of industrialization a nd urbanization in the process of eco-nomic growth, their implications for trends in the income distributionshould be explored-even though we have neither the necessary datanor a reasonably complete theoretical model.
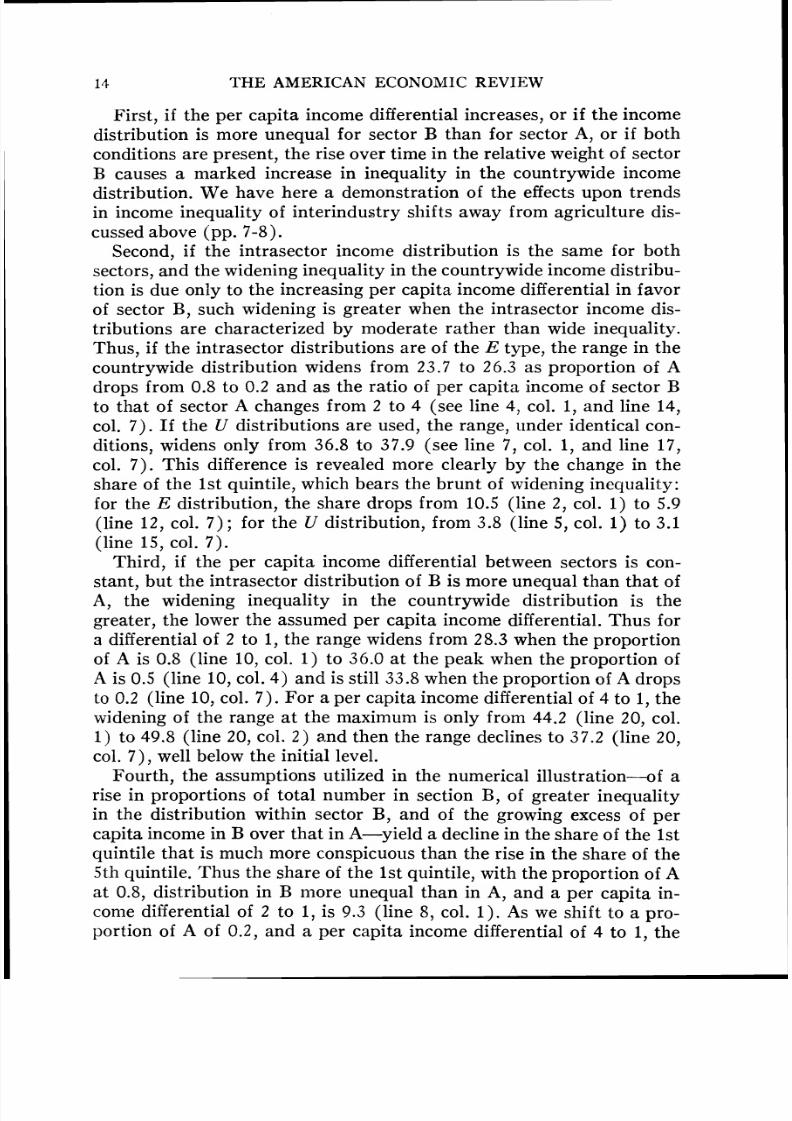
T h e implications can be b rough t out m ost clearly w ith the help of a
numerical illustration (see Table I). In this illustration we deal withtwo sectors: agriculture (A) and all others (B). For each sector weassum e percentage d istribu tions of tota l sector income among sectordeciles: one distribution (E) is of mo dera te inequality, with the share s
sta rtin g a t 5.5 p er ce nt for th e lowest decile and rising 1 percentagepoint from decile to decile to reach 14.5 per cen t for the top decile; theother distribution ( U ) is much more unequal, the shares starting at 1per c ent fo r th e lowest decile, and rising 2 percentage po ints from decileto decile to reach 19 per cent for the top decile. We assign per capitaincomes to each sector: 50 units to A an d 100 units to B in case I (lines1-10 in th e illustration) ; 50 to A and 200 to B in case I1 (lines 11-20).Finally, we allow the proportion of the num bers in sector A in the totalnumber to decline from 0.8 to 0.2.
T h e numerical illustration is only a pa rtial sum mary of the calcula-
tions, showing the sh ares of the lowest and highest quintiles in th e in-come distribution for the total population under different assumption^.^
The basic assumptions used throughout are that the per capita incomeof sector B (nonagricultural) is always higher than that of sector A;that the proportion of sector A in the total number declines; and thatthe inequality of the income distribution within sector A m ay be aswide as that within sector B but not wider. With the assumptions con-
'The underlying calculations are quite simple. F or each case we distinguish 20 cells withinthe total distribution-sets of ten deciles fo r each sector. Fo r each cell we comp ute th e
percentage shares of both number and income in the number and income of total popula-tion, and hence also the relative per capita income of each cell. The cells are then arrayedin increasing order of the ir relative per cap ita income and cumu lated. In th e resultingcumulative distributions of number and countrywide income we establish, by arithmeticinterpolation, if interpolation is needed, the percentage shares in total income of thesuccessive quintiles of the country's population.
8/3/2019 Economics Growth and Income Inequality_Kuznets_AER55
http://slidepdf.com/reader/full/economics-growth-and-income-inequalitykuznetsaer55 16/31
-------KUZNETS: ECONOMIC GROWTH AND INCOME INEQUALITY 13
I Proportion of Number in Sector A
to To ta l Number
0 . 8 0 . 7 0 . 6 0 . 5 0 .4
( 1 ) ( 2 ) ( 3 ) ( 4 ) ( 5 ) ?6? 1 ??I. Pe r Capita Income of S ector A = 5 0 ;
of S ec tor B=
100 1. Pe r capita income of tota l pop-
ulation 60 65 i 0 75 80 85 90
Distribution ( E ) for Both Sec-tors
2. Shar e of 1st quintile 1 0 .5 9 .9 9 .6 9 . 3 9 . 4 9 . 8 10.2
3 . Shar e of 5 th quintile 34.2 35.8 35.7 34.7 3 3 .2 3 1 .9 30 .4
4 . Range (3 -2 ) 23.7 25.9 26 .1 25.3 23.9 22.1 20.2
Distribution ( U ) for Both Sec-tors
5. Sh are of 1st quintile 3 .8 3 .8 3 .7 3 . 7 3 . 8 3 . 8 3 . 9
6. Sh are of 5th quintile 40.7 41.9 42.9 42 .7 4 1 .5 4 0 .2 38.7
7 . Range (6-5) 36.8 38.1 39.1 39.0 37 .8 36 .4 3 4 .8
Distribution ( E ) for Sector A ,( U ) for Sector B
8. Sh are of 1st qu intil e 9 . 3 8 . 3 7 . 4 6 .7 6 .0 5.4 4 .9
9. Sh are of 5 th quintile 37.7 41.0 42 .9 42.7 41.5 40.2 38.7
10. Range (9-8 ) 28.3 3 2 .7 3 5 .4 36 .0 35.5 34 .8 3 3 .8
11. Pe r Capita Income of S ector A = 5 0 ;of S ec tor B = 200
11. Per ca pita income of to tal pop-ulation 80 95 110 125 140 155 170
Distribution ( E ) for Both Sec- tors
12. Sh are of 1st quintile 7 . 9 6 . 8 6 . 1 5.6 5 .4 5 .4 5 .9
13. Sh are of 5 th quintile 50.0 49.1 45.5 41.6 3 8 .0 35 .0 3 2 .2
14. Range (13-12) 4 2 .1 4 2 .3 3 9 .4 36.0 32 .6 29.6 26.3Distribution ( U ) for Both Sec-tors
15. Sh are of 1st quintile 3 . 1 2 . 9 2.7 2 .6 2.6 2.7 3 . 1
16. Share of 5th quintile 52.7 56 .0 54 .5 51.2 47 .4 44.1 40.9
17. Range (16-15) 49 .6 5 3 .1 51.8 48.6 44 .8 41 .4 37.9
Distribution (E) for Sector A ,
( U ) for Sector B18. Sh are of 1st qui ntile 7 . 4 6 .2 5.4 4 .7 4 . 2 3 . 9 3 .8
19. Share of 5 th quintile 51.6 56.0 54.6 51.2 47 .4 44 .1 40 .9
20 . Range (19-18) 44.2 49.8 49.2 46 .5 43 .2 40 .2 37.2
For m ethods of ca lculating the shares of quintiles, see text (p. 12 and fn . 6 ) . Some differences
will not check because of rounding.
cerning th ree sets of factors-intersector differences in pe r ca pit a in-come, intrasecto r distributio ns, an d sector weights-varying within thelimitations just indicated , the following conclusions ar e suggested :
8/3/2019 Economics Growth and Income Inequality_Kuznets_AER55
http://slidepdf.com/reader/full/economics-growth-and-income-inequalitykuznetsaer55 17/31
14 T H E A ME R IC A N E C O N O MIC R E V I EW
Fir st, if th e per c ap ita incom e differential increases , or if t h e incomedistribution is m ore unequal for sector B th an for sector A, or if bothconditions ar e prese nt, t he rise over time in the relative weight of secto r
B causes a marked increase in inequality in the countrywide incomedistribution. W e have her e a d em onstration of the effects upon tre ndsin income inequality of interin dus try sh ifts aw ay from agriculture dis-
cussed above ( pp. 7-8).Second, if the intrasector inconie distribution is the same for both
sectors, an d th e widening inequality in the coun trywide income distribu-tion is due only to th e increa sing per capita income differential in favorof sector B, such widening is greater when the intrasector income dis-tributions are characterized by moderate rather than wide inequali ty.
Th us, if the intra sec tor distributions a re of th e E type, the range in th ecou ntryw ide distribution w idens from 23.7 to 26.3 as prop ortion of Adro ps from 0.8 to 0.2 and a s th e ratio of per ca pita income of sec tor Bto t ha t of sector A chang es from 2 to 4 (see line 4, col. 1, an d line 14,col. 7 ) . If th e U distributions ar e used, th e range, under identical con-
ditions, widens only from 36.8 to 37.9 (see line 7, col. 1, and l ine 17,col. 7). This difference is revealed more clearly by the change in thesh are of the 1s t quintile, which bears th e br un t of widening ineq uality:for the E distribution, the share drops from 10.5 (line 2 , col. 1) to 5.9
(line 12, col. 7) ; for the U distribution, from 3.8 (line 5, col. 1) to 3.1(line 15, col. 7).
Th ird , if the per cap ita income differen tial between sectors is con-sta nt, but the intrasector distribution of B is more unequal tha n tha t ofA, the widening inequality in the countrywide distribution is thegreater, the lower the assumed per capita income differential. Thus fora differential of 2 to 1 , the ra nge widens from 28.3 when t he prop ortionof A is 0.8 (line 10, col. 1 ) to 36.0 a t the peak when the proportion of
A is 0.5 (line 10, col. 4 ) an d is still 33.8 when the propo rtion of A dr op s
to 0.2 (line 10, col. 7) . Fo r a per c ap ita income differential of 4 to 1, th ewidening of th e range a t the maximum is only fr om 44.2 (line 20, col.1 ) t o 49.8 (line 20, col. 2 ) an d then the rang e declines to 37.2 (line 20,col. 7 ) , well below th e initial level.
Fo urth , th e assu mp tions utilized in the num erical illustration-of arise in prop ortion s of to ta l num ber in section B , of g rea ter ineq ualityin the distribu tion w ithin sector B , and of the growing excess of perca pita income in B over tha t in A-yield a decline in th e sh ar e of th e 1s tquintile th at is much m ore conspicuous than the rise in the sha re of the
5th quintile. Th us th e shar e of the 1st quintile, with the proportion of Aat 0.8, distribution in B illore unequal than in A, and a per capita in-come differential of 2 to 1, is 9.3 (l ine 8, col. 1 ) . As we shift to a pro-portion of A o f 0.2, and a per cap ita income differential of 4 to 1, the
8/3/2019 Economics Growth and Income Inequality_Kuznets_AER55
http://slidepdf.com/reader/full/economics-growth-and-income-inequalitykuznetsaer55 18/31
KUZNETS: ECONOMIC GROWTH AND IN C O ME IN EQ U A LITY 15
share of the 1st quintile drops to 3.8 (l ine 18, col. 7 ). Under the sam econditions, the sha re of the 5 th qu intil e changes fro m 37.7 (line 9, col.1) to 40.9 (line 19, col. 7 ).
F if th , even if the differential in per cap ita income between th e twosectors remains constant and the intrasector distributions are identicalfor the two sectors, the mere shift in the proportions of numbers pro-duces slight but significant changes in the distribution for the countryas a whole. In general, as the proportion of A drifts from 0.8 down-wards, the range tends first to widen an d then to diminish. W hen t he percapita income differential is low ( 2 to l ) , the widening of the rangereaches a peak close to middle of the series, i.e., a t a proportion o f A
equal to 0.6 (l ines 4 and 7) ; an d the movemeilts in the range tend to berather limited. When the per capita income differential is large (4 to I ) ,the range contracts as soon as the proportion of A passes the level of0.7, and th e decline in the range is quite substantial (l ines 14 and 17 ).
Sixth, of pa rticu lar bea ring upon th e share s of up per-income grou psis the finding th at the sha re of t he top qu intile declines as the propo r-tion of A falls below a certa in, rathe r high fraction of tota l num bers.Th ere is not a single case in th e illustration in which the share of the
5th quintile fails to decline, either throughout or through a substantialsegmen t of the sequence in the down ward movem ent of th e prop ortionof A from 0.8 to 0.2. In l ines 6 and 9, the sha re of the 5th quintile de-clines beyond the point at which the proportion of A is 0.6; and in allother relevant lines the downward tren d in the share of the 5th qu intilesets in earlier. Th e reason lies, of course, in the fa ct th at with increa singindus trialization, the growing weight of the nona gricultu ral sector,with its higher per capita income, raises the per capita income for thewhole economy; and yet per capita income within each sector and theintrasector distributions are kept constant. Under such conditions, the
upper share s would fail to decline only if there were either a grea terrise in per ca pita incom e of s ector B th an in th at of sector A ; or increas-ing inequality in the intrasector distribution of sector B.
Several other conjectural conclusions could be drawn with ad ditionalvariation s in assump tions, and multiplication of sectors beyond t hetwo distinguished in the numerical illustration. But even in the simpleinodel illustrated the variety of possible patterns is impressive; andone is forced to the view that much more empirical information isneeded to perm it a prop er choice of specific assump tions an d con stants.
Granted that several of the conclusions could be generalized in formalmathem atical terms, use ful inferen ces would b e within our reach only ifwe knew more abo ut the specific sector distributions an d th e levels an dtrends in per cap ita income differentials amon g the sectors.
If then we limit ourselves to what is known or can be plausibly as-
8/3/2019 Economics Growth and Income Inequality_Kuznets_AER55
http://slidepdf.com/reader/full/economics-growth-and-income-inequalitykuznetsaer55 19/31
16 T H E A ME RICA N E CO N O MIC RE V I E W
sumed, the following inferences can be suggested. We know that percapita income is greater in sector B than in sector A; tha t, a t best , theper capita income differential between s ectors A an d B has been fairlyconstant (e.g., in the United States) and has perhaps more often in-creased; th at th e proportion of sector A in total num bers has dimin-ished. The n, if we sta rt with intrase ctor distribution of B m ore unequalthan for A, we would expect results suggested by either lines 8-10 or18-20. I n th e former case, the range widens as th e proportion of A dro psfrom 0.8 to 0.5, a nd then narrows. I n th e latter case, the range declines
beyond the point a t which th e proportion of A is 0.7. B ut in both cases,the sh are of the 1st quintile declines, an d fairly app reciab ly an d con-tinuously (see lines 8 and 18) . Th e magnitude and cont inuity of thedecline are partly th e result of the specific assump tions mad e; bu t onewould b e justified in arguing th at within the b road limits suggested bythe illustration, the assumption of greater inequality in the intrasectordistribution for sector B than for sector A, yields a downward trendin the share of the lower-income groups. Yet we find no such tren d ir.the empirical evidence that we have. Can we assume that in the earlierperiods th e intern al distribution for sector B was not more unequa l tha n
for sector A, despite the more recent indications th at u rban income dis-tribution is more unequal than the ru ral?
There is, obviously, room for conjecture. It seems most plausibleto assume that in earlier periods of industrialization, even when thenonag ricultural population w as still relatively sm all in th e total, its in-come distribution was more unequal tha n tha t of th e agricultur al popu-lation. This would be particularly so du ring the periods when indu stri-alization an d urbanization were proceeding ap ace and t he urba n popula-tion was being swelled, an d fairly rapidly , by immigrants-either fr o mthe country's agricultural areas or from abroad. Under these condi-
tions, the urban population would run the full gamut from low-incomepositions of recent ent ran ts to th e economic peak s of the establishedtop-income groups. T h e urban income inequalit ies might be assumed tobe f a r wider tha n those for t he agricultural population which was or-ganized in relatively small individual enterprises (large-scale units wererarer then than now).
If we gran t the assump tion of wider inequality o f distribution in sec-tor B, the shares of th e lower-income brack ets should have shown adownward trend. Yet the earlier summary of empirical evidence indi-
cates tha t during the last 50 to 75 years there has been no widening inincome inequality in th e developed countries bu t, on the con trary, somenarrowing w ithin the last two to f ou r decades. I t follows th at th e intra-
sector distribution-either for sec tor A or fo r sec tor B-must haveshown sufficient narro wing of inequ ality to offset th e increase called
8/3/2019 Economics Growth and Income Inequality_Kuznets_AER55
http://slidepdf.com/reader/full/economics-growth-and-income-inequalitykuznetsaer55 20/31
KUZNETS: ECONOMIC GROWTH AND INCOME INEQUALITY 17
fo r by the factor s discussed, Specifically, the sh ares of th e lower incomegroups in sectors A and/or B must have increased sufficiently to offsetthe decline th at would otherwise have been produced by a com binationof the elem ents shown in the numerical illustration .
This narrowing in inequality, the offsetting rise in the shares of thelower brackets, most likely occurred in the income distribution for theurban groups, in sector B. W hile it m ay also have been present in sectorA, i t would have had a m ore limited effect on the ineq uality in th e coun-tryw ide incom e distribu tion because of the ra pidly diminishing weight
of sectorA
in the total. Nor was such a narrowing of income inequ alityin agriculture likely: with indu strializatio n, a higher level of technologypermitted larger-scale units and, in the United States for example,sharpened the contrast between the large and successful businessfarmers and the subsistence sharecroppers of the South. Furthermore,since we accept th e assumption of initially narrow er inequ ality in th einterna l distribution of income in sector A than in sector B, any signifi-cant reduction in ineq uality in the former is less likely than in t he latter .
He nce we may conc lude th a t the major offset to th e widening of in-come inequality associated with the shift from agriculture and the
countryside to industry a nd th e city mus t have been a rise in th e incomesh are of th e lower groups within the nonagricultural sector of thepopulation. This provides a lead for exploration in what seems to mea most promising direction: consideration of the pace an d chara cter ofthe economic growth of t he urb an population, with partic ula r referenceto th e relative position of lower-income groups. Mu ch is to be said forthe notion tha t once the early turb ulen t phases of industrialization an durbanization ha d passed, a varie ty of forces converged to bolster theeconomic position of the lower-income grou ps within t he ur ba n popula-tion. The very fact that after a while, an increasing proportion of the
urba n population w as "native," i.e., born in cities rat he r tha n in therural area s, an d hence more able to tak e adva ntag e of the possibilitiesof city life in prepara tion for the economic strugg le, meant a be tterchance for organization and adaptation, a better basis for securinggreater income shares than was possible for the newly "immigrant"population coming from the countryside or from abroad. The increas-ing efficiency of the older, established urban population should also betaken into account. Furthermore, in democratic societies the growingpolitical power of the u rba n lower-income g roups led to a va rie ty of
protective and supporting legislation, much of it aimed to counteractthe worst eff ec ts of ra pid industrialization and urb aniza tion and tosupport the claims of the broa d masses for more a deq uate shares of the
growing income of th e coun try. Space does not perm it th e discussion ofdemographic, political, and social considerations that could be brought
8/3/2019 Economics Growth and Income Inequality_Kuznets_AER55
http://slidepdf.com/reader/full/economics-growth-and-income-inequalitykuznetsaer55 21/31
18 THE AMERICAN ECONOMIC REVIEW
to bea r to explain the offsets to an y declines in the shar es of the lowergroups, declines otherwise deducible from the trends suggested in thenumerical illustration.
111. Other T rends Related to Those i n Inconze Inequali ty
One aspect of the conjectural conclusion just reached deserves em-phasis because of its possible interrelation with other important ele-ments in th e process a nd the ory of economic growth. T h e sca nty em-pirical evidence suggests that the narrowing of income inequality in
the developed countries is relatively recent and probably did not char-acterize the earlier stages of their growth. Likewise, th e various facto rstha t have been suggested above would explain stability and narrowingin income inequality in the later rather than in the earlier phases ofindustrialization and urbanization. Indeed, they would suggest widen-ing inequality in these e arly phases of economic grow th, especially in th eolder countries where the emergence of the new indu strial system hadsha tterin g effects on long-established pre-in dustrial economic an d socialinstitutions. T hi s timing characteristic is particularly applicable to fac-tors bearing upon the lower-income groups: the dislocating effects of
the agricultural and industrial revolutions, combined with the "swarm-ing" of population incident upon a rapid decline in death rates and themaintenance or even rise of birth rates, would be unfavorable to therelative economic position of lower-income groups. Furthermore)the re ma y also have been a prepo nderan ce in th e earlier periods of fac-tors favo ring ma intenance or increase in the share s of top-incomegroups: in so far as their position was bolstered by gains arising out ofnew industries, by an unusually rapid rate of creation of new fortunes,we would expect these forces to be relatively stronger in the earlyphases of in dustrialization th an in th e later when the pace of ind ustrial
growth slackens.One might thus assume a long swing in the inequality characterizing
th e secular income str uc tu re: widening in the early phases of economicgrowth when the transition from the pre-industrial to the industrialcivilization was most rapid; becoming stabilized for a while; and thennarrowing in the later phases. This long secular swing would be mostpronounced fo r older cou ntries where th e dislocation effects of theearlier phases of modern economic growth were most conspicuous; butit might be fou nd also in th e "younger" countries like the United States,if the period preceding ma rked in dustrialization could be compared with
the early phases of industrialization, and if the latter could be com-pared with th e subsequent phases of greater maturity.
If there is some evidence for assuming this long swing in relativeinequality in the distribution of income before direct taxes and exclud-
8/3/2019 Economics Growth and Income Inequality_Kuznets_AER55
http://slidepdf.com/reader/full/economics-growth-and-income-inequalitykuznetsaer55 22/31
KUZNETS: ECONOMIC GROWTH A N D INCOME TNEQUhLITY 19
ing free benefits from government, there is surely a stronger case forassuming a long swing in inequality of income net of direct taxes a ndincluding government benefits. Progressivity of income taxes and, in-deed, their very im portance charac terize only the more recent phases ofdevelopment of the presently developed countries; in narrowing in-come inequality they must have accentuated the downward phase ofthe long swing, contributing to t h e reversal of tren d in the secu larwidening and narrow ing of income inequality.
No adequate empirical evidence is available for checking this con-jecture of a long secular swing in income ineq ua lity ; * nor can the phases
be dated precisely. How ever, to make it more specific, I would place th eearly phase in which income inequality might hav e been widening, fromabou t 1780 to 1850 in England ; from about 1840 to 1890, and particu-larly from 1870 on in the United States; and, from the 1840's to the1890's in Germany. I would put the phase of narrow ing income in-equality somewhat later in the United States and Germany than inEngland-perhaps beginning with th e first world war in the forme r an din the last qu arter of the 19th century in th e latter.
I s there a possible relation between this secular swing in incomeinequality an d the long swing in other im portant compon ents of thegrowth process? For the older countries a long swing is observed in thera te of growth of population-the upw ard pha se repre sente d by accel-eration in the rate of growth reflecting the early reduction in the deathrate which was not offset by a decline in the birth rate (and in somecases was accompanied by a rise in the birth r ate ) ; and th e downwardphase rep resented b y a shrink ing in the ra te of growth reflecting themore pronounced downward trend in the birth rate. Again, in the oldercountries, and also perhaps in the younger, there may have been a
secular swing in th e ra te of urbanization, in the sense tha t th e propor-
tional additions to urban population an d the measures of internal mi-gration that produced this shift of population probably increased fora while-from the earlier much lower levels; bu t then tended to diminishas urban population came to dominate the country and as the ruralreservoirs of migration became proportionally much smaller. For old,and perhaps fo r young countries also, there mu st have been a secularswing in the prop ortions of savings or ca pital form ation to total eco-nomic produ ct. Pe r ca pita product in pre-industrial times was not largeenough to permit as high a nationwide rat e of saving or capital form a-tion as was attained in the course of industrial development: this is
7Prokopovich's dat a on Prussia. from th e source cited in footnote 1, indicate a sub-tantial widening in income inequality in the early period. The share of the lower 90 pe rcent of the population declines from 73 per cent in 1854 to 65 per cent in 1875; the shareof the top 5 per cent rises from 2 1 to 25 per cent. But I do not know enough about thedat a for the early years to eva luate the reliability of the finding.
8/3/2019 Economics Growth and Income Inequality_Kuznets_AER55
http://slidepdf.com/reader/full/economics-growth-and-income-inequalitykuznetsaer55 23/31
20 THE AMERICAN ECONOMIC REVIEW
suggested by present comparisons between net capital formation ratesof 3 to 5 per cent of national prod uct in underdeveloped countries andrates of 10 to 15 per cent in developed countries. If then, at least in theolder coun tries, an d perhap s even in th e younger ones-prior to initia-tion of the process of mode rn development-we begin with low secularlevels in the savings proportions, there would be a rise in the earlyphases to appreciably higher levels. We also know that during recentperiods the net capital formation proportion and even the gross, failedto rise an d perha ps even declined.
Other trends might be suggested that would possibly trace rongswings similar to those for inequality in income struc ture , rate of growthof po pulation, ra te of urban ization an d inte rna l migration, an d the pro-portion of savings or cap ital formation to nation al produ ct. Fo r ex-ample, such swings might be found in the ratio of foreign tra de todomestic activities; in the aspects, if we could only measure them prop-erly, of government activity tha t bear upon marke t forces (theremu st have been a phase of increasing freedom of m ark et forces,giving way to grea ter intervention by g overnm ent). B ut the suggestionsalre ady m ade suffice to indic ate tha t the long swing in income inequa lity
must be viewed as part of a wider process of economic grow th, andinterrelated with similar movements in other elements. T h e long alter -nation in the r ate of growth of pop ulation can be seen partly as a cause,partly as an effect of the long swing in income inequality which wasassociated with a secular rise in real per capita income levels. The longswing in income inequality is also probably closely associated with theswing in capital formation proportions-in so far as wider inequ alitymakes fo r higher, and narrower inequ ality for lower, country-wide sav-ings proportions.
IV . Com parison of Developed and Underdeveloped CountriesW ha t is the bearing of the experience of the developed cou ntries upon
the economic growth of underdeveloped countries? Let us examinebriefly th e d ata on income distribution in th e latter, an d speculate uponsome of the implications.
As might have been expected, such da ta for underdeveloped cou ntriesare scan ty. Fo r the p resent purpose distributions of family income forInd ia in 1949-50, fo r Ceylon in 1950, and for Pue rto R ico in 1948 wereused. While the coverage is narrow an d the margin of erro r wide, the
data show that income distribution in these underdeveloped countriesis somewhat more unequal than in the developed countries during theperiod aft er the second world war. Th us the shares of the lower 3 quin-tiles are 28 per cent in Ind ia, 30 per cent in Ceylon, an d 24 per cent inPuer to Rico-compared wi th 34 per cent in the United States and 36
8/3/2019 Economics Growth and Income Inequality_Kuznets_AER55
http://slidepdf.com/reader/full/economics-growth-and-income-inequalitykuznetsaer55 24/31
KUZNETS: ECONOMIC GROWTH AND INCOME INEQUALITY 21
per cent in the United Kingdom. T he shares of the t o p quintile are 55
per cent in India, 50 per cen t in Ceylon, an d 56 per cent in Puerto Rico,compared with 44 per cent in the United States and 45 per cent in theUnited Kingdom.'
This comparison is for income before direct taxes and excluding freebenefits fro m governments. Since the burden an d progressivity of directtaxes are much greater in developed countries, and since it is in thelatte r th at su bs tan tial volumes of free economic assistance are extendedto the lower-income groups, a com parison in terms of incom e ne t of
direct taxes and including government benefits would only accentuatethe wider ineq uality of income distributions in the underdeveloped co un-tries. I s this difference a re liable reflection of wider ine quality alsoin the distribu tion of secula r income levels in underdeveloped coun tries?Even disregarding the margins of error in the data, the possibilityraised earlier in this paper that transient disturbances in income levelsmay be more conspicuous under conditions of primitive material andeconomic technology would affect the comparison just made. Since thedistributions cited reflect the annual income levels, a greater allowanceshould perhaps be made for transient disturbances in the distributionsfo r the und erdeveloped than in those for the developed countries.Whether such a correction would obliterate the difference is a matteron which I have no relevan t evidence.
Another consideration might tend to support this qualification. Un-derdeveloped coun tries are ch aracterized by low av erage levels of in-come per capita, low enough to raise th e question how the po pulationsmanage to survive. Let us assume that these countries represent fairlyunified population groups, and exclude, for the moment, areas thatcombine large native populations with small enclaves of nonnative,
privileged m inorities, e.g., Ke ny a an d R hodesia, where income inequa l-ity, because of the excessively high income sha res of the privilegedminority, is appreciably wider than even in the underdeveloped coun-tries cited above.' On this assum ption, one ma y infer th at in countries
"or sou rces of these dat a see "Regional E cono mic Tre nd s an d Levels of Living," sub -mitted a t the Korm an Waite Harris Fou ndation Insti tu te of th e University of Chicago inNovember 195'4 (in press in th e volume of proceedings). T his paper, an d an earlier one,"Underdeveloped Countries an d the Pre-industrial Phases in the Advanced Co untries: AnAttempt at Comparison," prepared for the World Population Meetings in Rome held inSeptemb er 1954 (in press) discuss issues raised in this section.
' In one year since the second world war, the non-African group in Southern Rhodesia,which accounted for only 5 per cent of total population, received 57 per cent of total in-come; in Kenya, the minority of only 2.9 per cent of total population, received 51 per centof total income; in No rther n Rhodesia, the minority of only 1.4 per cent of tota l population,received 45 per cent of t ota l income. See United Natio ns, Natioturl Income and Its Dk-
trihution in Underdeveloped Countries, Statistical Paper, Ser. E, no. 3, 1951, Tab le 12, p.19.
8/3/2019 Economics Growth and Income Inequality_Kuznets_AER55
http://slidepdf.com/reader/full/economics-growth-and-income-inequalitykuznetsaer55 25/31
2 2 THE AMERICAN ECONOMIC REVIEW
with low averag e income, the se cular level of income in the lower brac-kets could no t be below a fairly sizable proportion of averag e income-otherwise, the groups could not survive. This means, to use a purelyhypoth etical figure, th at the sec ular level of the sh are of the lowestdecile could not fall far short of 6 or 7 per cen t, i.e., the lowest decilecould not have a per cap ita income less than six- or seven-ten ths of thecountrywide average. I n m ore advanced coun tries, with higher averageper cap ita incomes, even th e secula r share of the lowest bra cke t couldeasily be a smaller fraction of th e countryw ide avera ge, sa y as small as2
or3
per cent for the lowest decile, i.e., from a fifth to a third of thecountryw ide average-without implying a ma terially impossible eco-nomic position for tha t group. T o be sure, there is in all countries con-tinuous pressure to raise the re lative position of the bottom-incomegroups; but the fact remains that the lower limit of the proportionalshare in the secular income structure is higher when the real country-wide per c apit a income is low than when i t is high.
If the long-term s ha re of the lower-income groups is larger in th eunderdeveloped than in the average countries, income inequality in theformer should be narrower, not wider as we have found. However, if
the lower brackets receive larger share s, an d a t the same time the verytop bra cke ts also receive larger shares-which would me an th at theintermediate income classes would not show as gre at a progression fromthe bottom-the net effect may well be wider inequa lity. T o illus trate ,let us compare the distributions for India and the United States. Thefirst quintile in In dia receives 8 per cent of total income, more than th e 6
per cen t sha re of the first quintile in the United States. Bu t the secondquintile in India receives only 9 per cent, the third 11, and the fourth16; whereas in the United S tates, the shares of these quintiles are 12,16, and 2 2 respectively. T h is is a rough statistic al reflection of a fa irlycommon observation relating to income distributions in underdevelopedcompared with developed countries. The former have no "middle"classes: there is a sharp contrast between the preponderant proportionof population whose average income is well below the generally lowcountrywide average, and a small top group with a very large relativeincome excess. Th e developed countries, on the other ha nd, a re charac-terized by a much more grad ual rise from low to high shares, with sub-stantial groups receiving more than the high countrywide incomeaverage, an d the top groups securing smaller shares than the comp arable
ordinal groups in underdeveloped countries.I t is, therefore , possible th at even the distribution s of secula r income
levels would be more unequal in underdeveloped than in developedcountries-not in th e sense th at the shares of the lower bra cke ts wouldbe lower in the former th an in th e latter , but in the sense th at the sha res
8/3/2019 Economics Growth and Income Inequality_Kuznets_AER55
http://slidepdf.com/reader/full/economics-growth-and-income-inequalitykuznetsaer55 26/31
KUZNETS: ECONOMIC GROW TH AND INCOM E INEQUAL ITY 23
of the very top g roups would be higher a nd th at those of th e groupsbelow the top would all be significantly lower than a low countrywideincome average. Th is is even more likely to be tr ue of th e distributionof income ne t of direct taxe s and inclusive of free govern me nt ben efits.Bu t whether a high probability weight can be a ttache d to this conjectureis a m atter for further study.
I n the absence of evidence to the con trary, I assume that i t is t rue:that the secular income structure is somewhat more unequal in under-developed countries tha n in th e more advanced-particularly in those
of Western an d N orthe rn E uro pe an d their economically developeddescendants in the New W orld (th e United States, Canada, Australia,and New Zealand). This conclusion has a variety of important impli-cations and leads t o some pregnant questions, of which only a fe w canbe stated here.
I n the first place, the wider inequality in th e secular income stru ctu reof underdeveloped cou ntries is associated with a much lower level ofaverage income per cap ita. Tw o corollaries follow-and th ey wouldfollow even if the income inequalities were of the same relative rangein the two groups of countries. Firs t, the impact is far sharp er in the
underdeveloped countries, where the failure to reach an already lowcountrywide average spells much greater material and psychologicalmisery than similar proportional deviations from the average in thericher, more advanced countries. Second, positive savings a re obviouslypossible only a t much h igher relativ e income levels in th e underdevelopedcountries: if in the more adva nced co untries some savings ar e possiblein the fourth quintile, in t he underdeveloped countries savings could berealized only a t the very peak of the income pyramid, say b y the top5 or 3 per cent. If so, th e conce ntration of savin gs an d of a ssets is even
more pronounced than in th e developed countries; and the effects ofsuch concentration in the pa st m ay serve to explain the peculiar charac-teristics of th e secular income stru ct ur e in underdeveloped coun triestoday.
The second implication is that this unequal income structure pre-sumab ly coexisted w ith a low r ate of g rowth of income per cap ita. T h eunderdeveloped countries today have not always lagged behind thepresently developed areas in level of economic performance; indeed,some of th e form er ma y have been th e economic leaders of th e world inthe centuries preceding the last two. The countries of Latin America,
Africa, and particularly those of Asia, are underdeveloped today be-cause in the la st two centuries, and even in recent decades, their ra te ofeconomic growth ha s been far lower than t ha t in the Wes tern World-
and low indeed, if any growth there was, on a per capita basis. Theunderlying sh ifts in industrial structure, the oppo rtunities for internal
8/3/2019 Economics Growth and Income Inequality_Kuznets_AER55
http://slidepdf.com/reader/full/economics-growth-and-income-inequalitykuznetsaer55 27/31
24 THE AMERICAN ECONOMIC REVIEW
mobility and for economic improvement, were far more limited thanin the more rapidly growing countries now in the developed category.Th ere was no hope, within th e lifetime of a generation, of a significantlyperceptible rise in the level of real income, or even th at th e next genera-tion might fare m uch better. I t was this hope that served as an impor-tant and realistic compensation for the wide inequality in income dis-tribution that characterized the presently developed countries duringthe earlier phases of their growth.
T h e third implication follows from the preceding two. I t is quite
possible th a t income inequa lity has not narrowed in the uilderdevelopedcountries within recent decades. T he re is no empirical evidence to checkthis conjectural implication, bu t i t is suggested by the absence, in thesearea s, of the dy nam ic forces associated with rapid growth th a t in thedeveloped coun tries checked the upw ard tren d of the upper-incomeshares that was due to the cumulative effect of continuous concentra-tion of pa st sa vings ; a nd it is also indica ted by the failu re of the politi-cal and social systems of underdeveloped c oun tries to initiate the govern-mental or political practices that effectively bolster the weak positionsof th e lower-income classes. Indeed, th ere is a possibility tha t inequa lity
in th e secular income struc ture of underdeveloped countries may hav ewidened in recent decades-the only qualification being th at wherethere has been a recent shift from colonial to independent status, aprivileged, nonnative minority may have been eliminated. But the im-plication, in term s of the income distribu tion among the native popula-tion prope r, still remains plausible.
T he somber picture just presented m ay be a n oversimplified one. B utI believe that it is sufficiently realistic to lend weight to the questionsit poses--questions a s to the bearing of th e recent levels an d tren ds inincome inequality, and the factors tha t determine them, upon the future
prospect of underdeveloped cou ntries within th e orbit of the free world.The questions are difficult, but they must be faced unless we are
willing completely to disregard past experience or to extrapolate me-chanically oversimplified impressions of pa st de velopme nt. T h e first
question is: I s the pa ttern of the older developed countries likely to berepeated in the sense that in the early phases of industrialization in theunderdeveloped countries income inequalities will tend to widen beforethe leveling forces become strong enough first to stabilize and then re-duce income inequalities? While the future c annot be a n exact repetition
of the pa st, there a re a lread y certain elements in the present conditionsof underdeveloped societies, e.g., "swarming" of population due to sh arpcuts in death rates unaccompanied by declines in birth rates-thatthreate n t o widen ineq uality by de pressing the relative position of lower-income groups even fu rther. F urthe rm ore, if an d when industrialization
8/3/2019 Economics Growth and Income Inequality_Kuznets_AER55
http://slidepdf.com/reader/full/economics-growth-and-income-inequalitykuznetsaer55 28/31
KUZNETS : ECONOMIC GROWTH AND INCOME INEQUALITY 25
begins, the dislocating effects on th ese societies, in which the re is ofte nan old hardened crus t of economic an d social institutions, ar e likely totc? be qu ite sharp-so sh ar p a s to destroy the positions of some of th elower groups more rapidly th an opportunities elsewhere in the economymay be created for them.
The next question follows from an affirmative answer to the first.Can the political framework of the underdeveloped societies withstandthe s trai n which furth er w idening of income inequality is likely to gen-erate ? Th is que ry is pertinent if it is realized that the real per ca pita
income level of many underdeveloped societies today is lower than theper capi ta income level of the pre sen tly developed societies before their
initial phases of industrialization. A nd ye t the stresse s of the disloca-tions incident to early phases of indus trialization in the developed coun-tries were sufficiently acute to strain the political and social fabric ofsociety, force majo r political reforms, a nd some times result in civil war.
The answer to the second question may be negative, even grantedthat industrialization may be accompanied by a rise in real per capitaproduct. If, for ma ny groups in society, the rise is even par tly offset bya decline in their proportional sh are in total produ ct; if, consequently,
it is accomp anied by widening of income inequa lity, the re sulting pres-sure s and conflicts ma y necessitate d rastic chang es in social and politicalorganization. This gives rise to the next and crucial question: Howcan e ither the institutiona l and political framewo rk of th e unde rde-veloped societies or the processes of economic growth an d indu strializa-tion be modified to favo r a s ustain ed rise to higher levels of economicperformance an d yet avoid the fatally simple remedy of an au thorita rianregime th at would use the population as cannon-fodder in the fight foreconomic achievement? How to minimize the cost of transition and
avoid paying the heavy price-in in te rnal tensions, in long-run ineffi-ciency in providing means for satisfying wants of human beings asindividuals-which th e inflation of political power rep resen ted byauthoritarian regimes requires?
Fac ing these acu te problems, one is cognizant of t he dang ers of tak -ing a n extreme position. One extreme-particularly tem pting to us-
is to favor repetition of past patterns of the now developed countries,patte rns tha t, under the m arkedly different conditions of the presentlyunderdeveloped countries, are almost bound to put a strain on the exist-ing social and economic institutions an d eventuate in revo lutionary ex-
plosions and a utho ritarian regimes. Th ere is danger in simple analogies;in arguing that because an unequal income distribution in WesternEu rope in th e past led to accu mulation of savings and financing of basiccapital formation, the preservation or accentuation of present incomeinequalities in the underdeveloped countries is necessary to secure the

8/3/2019 Economics Growth and Income Inequality_Kuznets_AER55
http://slidepdf.com/reader/full/economics-growth-and-income-inequalitykuznetsaer55 29/31
26 THE AMERICAN ECONOMIC REVIEW
same result. Even disregarding the implications for the lower-incomegroups, we may find that in at least some of these countries today theconsumption propensities of upper-income groups are far higher andsavings prop ensities fa r lower th an we re those of the more puritanicalupper-income gro ups of the prese ntly developed countries. Because theymay have proved favorable in the past, i t is dangerous to argue thatcompletely free markets, lack of penalties implicit in progressive taxa-tion, a nd the like ar e indispensable for the economic growth of th e nowunderdeveloped countries. Under present conditions the results may bequ ite th e opposite-withdrawal of accu mu lated assets to relatively"safe" channels, either by flight abroad or into real estate; and theinability of governments to serve as basic agents in the kind of capitalformation th at is indispensable to economic growth. I t is dangerous toargue that, because in the past foreign investment provided capitalresources to spa rk satisfacto ry economic growth in some of the smallerEuropean countries or in Europe's descendants across the seas, similareffects can be expected tod ay if o nly the underdeveloped cou ntries canbe convinced of th e need of a "fa vorab le climate." Yet, it is equ allydangerous to take the opposite position and claim t ha t the prese nt prob-
lems are entirely new and that we must devise solutions that are theproduct of imagination unrestrained by knowledge of the past, andtherefore full of romantic violence. What we need, and I am afraid i tis but a truism, is a clear perception of past trends and of conditionsunder which they occu rred, as well as knowledge of the conditions th atcharacterize the underdeveloped countries today. With this as a begin-ning, we can then at tem pt to translate th e elements of a prop erly under-stood past into the conditions of an a deq uately understood present.
V. Concluding Remarks
In concluding this paper, I am ac utely conscious of the meag ernessof reliable information presented. The paper is perhaps 5 per centempirical information and 95 per cent speculation, some of it possiblytainted by wishful thinking. Th e excuse for building an elabo rate struc-
ture on such a shaky foundation is a deep interest in the subject anda wish to share it with members of the Association. T h e formal an d noless genuine excuse is tha t th e subjec t is cen tral to much of economicanalysis and thinking; that our knowledge of i t is inadequate; that amore cog ent view of th e whole field may help c han nel our inter ests an d
work in intellectually profitable directions; that speculation is an effec-tive way of presenting a broa d view of the field; an d th at so long a s itis recognized a s a collection of hun ches calling for fu rth er inve stigationrather than a set of fully tested conclusions, little ha rm a nd m uch goodmay result.
8/3/2019 Economics Growth and Income Inequality_Kuznets_AER55
http://slidepdf.com/reader/full/economics-growth-and-income-inequalitykuznetsaer55 30/31
KUZNETS : ECONOMIC GROWTH AND INCOME INEQUALITY 2 7
Le t me ad d two final comments. T h e first bears upon the importanceof additional knowledge an d a better view of the secular stru ctu re ofpersonal income distribuiion. Since this distribution is a focal point atwhich th e fun ctioning of the economic system impinges upon the hu m anbeings who ar e the living mem bers of society an d for whom and throu ghwhom the society operates, i t is an im portant datu m for understandingthe reactions and behavior patt ern s of h um an beings as producers, con-sumers, and savers. I t follows th at b etter knowledge and comprehensionof the sub ject a re indispensable, no t only in and of itself b ut also as
a step in learning more ab ou t th e functio ning of society-in bo th th elong and short run. Without better knowledge of the trends in secularincome struc ture and of the fa ctors th at determ ine them, our under-stand ing of the whole process of economic growth is lim ited ; an d an yinsight we may derive from observing changes in countrywide aggre-
gates over time will be defective if these changes a re not tran slate d intomov ements of shares of the variou s income groups.
But m ore than tha t, such knowledge will con tribute to a b etter evalua-tion of past and present theorizing on the subject of economic growth.I t was pointed out in t he opening lines of this pape r th at th e field is dis-
tinguished by looseness of concepts, extreme scarcity of relevant data,and , particularly , pressures of strongly held opinions. Th e distributionof national product amo ng the various groups is a subject of acute inter-est to many and is discussed at length in any half-articulate society.When empirical data are scanty, as they are in this f ield, the naturaltendency in such discussion is to generalize from what little experienceis available-most often the sho rt stre tch of historical experience withinthe horizon of the interested scho lar, which is brou ght to bear upon t heparticular policy problems in the forefront. I t has repeatedly been ob-served th at t he g ran d dyn am ic economics of th e classical school of t helate 18th and ea rly 19th centuries was a gene ralization, the m ain emp iri-cal co nte nts of w hich were th e observed developmen ts du ring half t othree quarte rs of a century in Eng land, the mother co untry of thatschool; and that it bore many of the limitations which the brevity andexceptional character of that period and that place naturally imposedupon th e theoretical structure . I t is also possible th at much of M arxianeconomics may be an overgeneralization of imperfectly understoodtrends in En gland durin g the first half of the 19th centu ry when incomeinequality may have widened; and that extrapolations of these trends
(e.g., increa sing misery of th e working classes, polariza tion of society,etc.) proved wrong because due regard was not given to the possibleeffects upo n th e economic and social stru ct ur e of technological changes,extension of th e economic system t o much of th e the n unoccupied w orld,and the very stru ctu re of h uma n w ants. W ider empirical foundations,
8/3/2019 Economics Growth and Income Inequality_Kuznets_AER55
http://slidepdf.com/reader/full/economics-growth-and-income-inequalitykuznetsaer55 31/31
28 THE AMERICAN ECONOMIC REVIEW
observation of a greater variety of historical experience, and a recogni-tion tha t an y body of generalizations tend s to reflect some limitedstre tch of historical experience mu st force us to evalua te an y theory-
pa st or present-in term s of its empirical conte nts an d th e consequentlimits of its applicability-a pre cep t which na tur al ly should also beapplied to the oversimplified generalizations contained in the presentpaper.
M y final comment relates to the directions in which fu rthe r explora-tion of the s ubjec t is likely to lead us. Ev en in this simple initial sketch,findings in the field of dem ograp hy were used and references to politicalaspe cts of social life were m ade. Uncom fortable as ar e such ventu resinto unfamiliar an d perha ps trea chero us fields, they can not an d should
not be avoided. If we ar e to deal ade quate ly with processes of economicgrow th, processes of long-term chang e in which the very technological,demog raphic, an d social fram ew orks ar e also changing-and in waysth at decided ly affect th e operation of economic forces proper-it isinevitable t h at we venture into fields beyond those recognized in recentdecades a s the province of economics prop er. F or th e stud y of th e eco-nomic growth of nations, it is imp erative th a t we become more fam iliarwith findings in those related social disciplines that can help us under-stan d population growth pa ttern s, the natur e an d forces in technological
change, the factors that determine the characteristics and trends inpolitical institutions, and generally patterns of behavior of humanbeings-partly a s a biological species, pa rtly a s social anim als. Effectivework in this field necessarily calls for a shift from market economicsto political and social economy.
Related Documents