http://www.spandancareers.org/ 1 A few words with A few words with A few words with A few words with students.......... students.......... students.......... students.......... • These are the topic wise class notes of Economics for UPSC Civil and These are the topic wise class notes of Economics for UPSC Civil and These are the topic wise class notes of Economics for UPSC Civil and These are the topic wise class notes of Economics for UPSC Civil and Rajyaseva Rajyaseva Rajyaseva Rajyaseva. • All the data and concepts given here are updated up to March 2020. All the data and concepts given here are updated up to March 2020. All the data and concepts given here are updated up to March 2020. All the data and concepts given here are updated up to March 2020. • I encourage you all to use this as I encourage you all to use this as I encourage you all to use this as I encourage you all to use this as a reference for your study. reference for your study. reference for your study. reference for your study. • Suggestion, advises, que Suggestion, advises, que Suggestion, advises, que Suggestion, advises, queries and feedback are most welcome in order to ries and feedback are most welcome in order to ries and feedback are most welcome in order to ries and feedback are most welcome in order to improve content further. improve content further. improve content further. improve content further. • Practice and previous questions based on this topic will be uploaded Practice and previous questions based on this topic will be uploaded Practice and previous questions based on this topic will be uploaded Practice and previous questions based on this topic will be uploaded soon. soon. soon. soon. National Income 1) Definitions and its features 2) Variants of National Income 3) Measurement of National Income 4) Recent Data 5) References ECONOMICS ECONOMICS ECONOMICS ECONOMICS -NATIONAL INCOME NATIONAL INCOME NATIONAL INCOME NATIONAL INCOME By By By By- Mr. S. Wasnik (Faculty) Mr. S. Wasnik (Faculty) Mr. S. Wasnik (Faculty) Mr. S. Wasnik (Faculty)

Welcome message from author
This document is posted to help you gain knowledge. Please leave a comment to let me know what you think about it! Share it to your friends and learn new things together.
Transcript
http://www.spandancareers.org/ 1
A few words with A few words with A few words with A few words with students..........students..........students..........students..........
• These are the topic wise class notes of Economics for UPSC Civil and These are the topic wise class notes of Economics for UPSC Civil and These are the topic wise class notes of Economics for UPSC Civil and These are the topic wise class notes of Economics for UPSC Civil and
RajyasevaRajyasevaRajyasevaRajyaseva....
• All the data and concepts given here are updated up to March 2020.All the data and concepts given here are updated up to March 2020.All the data and concepts given here are updated up to March 2020.All the data and concepts given here are updated up to March 2020.
• I encourage you all to use this asI encourage you all to use this asI encourage you all to use this asI encourage you all to use this as aaaa reference for your study. reference for your study. reference for your study. reference for your study.
• Suggestion, advises, queSuggestion, advises, queSuggestion, advises, queSuggestion, advises, queries and feedback are most welcome in order to ries and feedback are most welcome in order to ries and feedback are most welcome in order to ries and feedback are most welcome in order to
improve content further.improve content further.improve content further.improve content further.
• Practice and previous questions based on this topic will be uploaded Practice and previous questions based on this topic will be uploaded Practice and previous questions based on this topic will be uploaded Practice and previous questions based on this topic will be uploaded
soon.soon.soon.soon.
National Income
1) Definitions and its features
2) Variants of National Income
3) Measurement of National Income
4) Recent Data
5) References
ECONOMICS ECONOMICS ECONOMICS ECONOMICS ----NATIONAL INCOME NATIONAL INCOME NATIONAL INCOME NATIONAL INCOME
ByByByBy---- Mr. S. Wasnik (Faculty)Mr. S. Wasnik (Faculty)Mr. S. Wasnik (Faculty)Mr. S. Wasnik (Faculty)
http://www.spandancareers.org/ 2
Definitions and it’s Feature’s
“The value of commodities and services produced in an economy in a given period,
counted without duplication”- National Income Committee (1948)
Or
Market value of all final goods & services produced within country for a given time
period.
Features
1) National Income is a macroeconomic aggregate.
2) National Income is Flow concept- measured over a period of time.
3) Value in National Income is expressed in terms of national currency.
4) National income is calculated based on the assumption of ‘Circular Flow of
Income’.
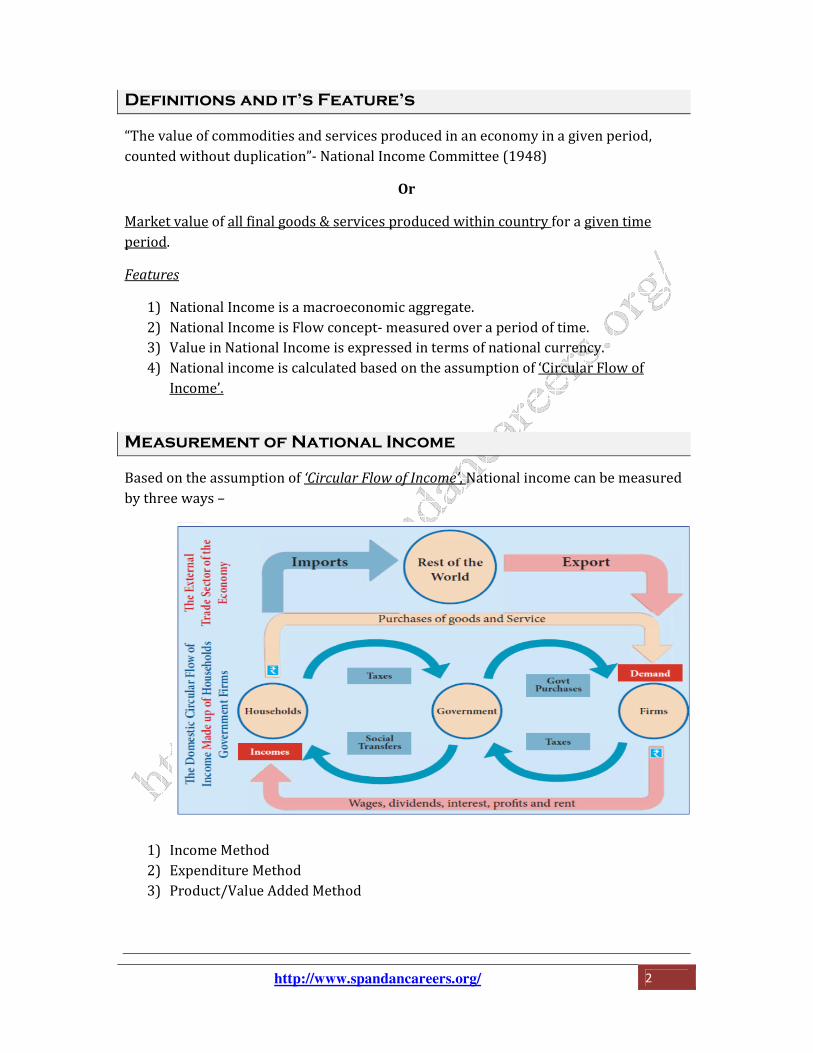
Measurement of National Income
Based on the assumption of ‘Circular Flow of Income’, National income can be measured
by three ways –
1) Income Method
2) Expenditure Method
3) Product/Value Added Method
http://www.spandancareers.org/ 3
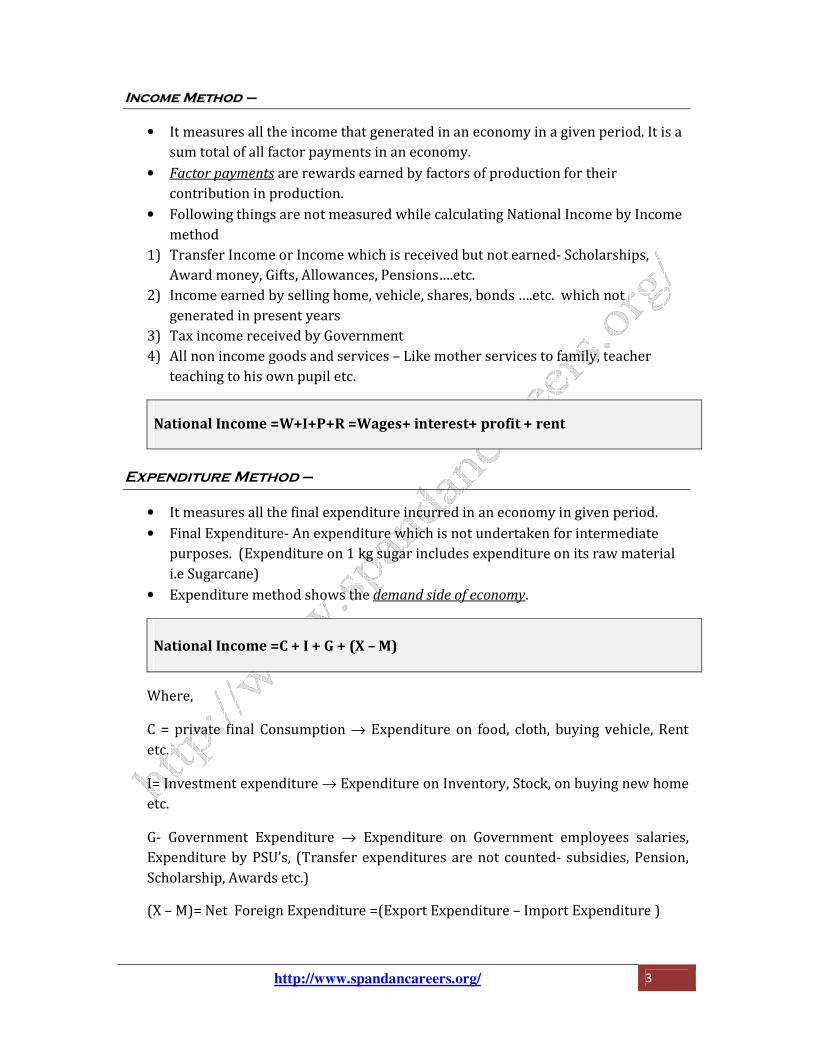
IInnccoommee MMeetthhoodd ––
• It measures all the income that generated in an economy in a given period. It is a
sum total of all factor payments in an economy.
• Factor payments are rewards earned by factors of production for their
contribution in production.
• Following things are not measured while calculating National Income by Income
method
1) Transfer Income or Income which is received but not earned- Scholarships,
Award money, Gifts, Allowances, Pensions….etc.
2) Income earned by selling home, vehicle, shares, bonds ….etc. which not
generated in present years
3) Tax income received by Government
4) All non income goods and services – Like mother services to family, teacher
teaching to his own pupil etc.
National Income =W+I+P+R =Wages+ interest+ profit + rent
Expenditure Method –
• It measures all the final expenditure incurred in an economy in given period.
• Final Expenditure- An expenditure which is not undertaken for intermediate
purposes. (Expenditure on 1 kg sugar includes expenditure on its raw material
i.e Sugarcane)
• Expenditure method shows the demand side of economy.
National Income =C + I + G + (X – M)
Where,
C = private final Consumption → Expenditure on food, cloth, buying vehicle, Rent
etc.
I= Investment expenditure → Expenditure on Inventory, Stock, on buying new home
etc.
G- Government Expenditure → Expenditure on Government employees salaries,
Expenditure by PSU’s, (Transfer expenditures are not counted- subsidies, Pension,
Scholarship, Awards etc.)
(X – M)= Net Foreign Expenditure =(Export Expenditure – Import Expenditure )

http://www.spandancareers.org/ 4
Product/Value Added Method
• It measures all the value of all final goods and services produced in an economy
in a given period.
• Double counting must be avoided.(By counting only end product or value
addition at each stage of production)
• Product/Value Added Method shows the Supply side of economy.
National Income= Value of Production – Value of Intermediate goods
Variants of National Income
Following the System of National Accounts 2008 (SNA2008) given by the United Nations in partnership with some other agencies, countries are now switching to new aggregates. India shifted to these aggregates in 2015.
1) Gross Domestic Product , Net Domestic Product
2) Gross National Product, Net National Product
3) National Income calculated at- Market Price ,Constant Price, Factor Cost, Basic
Price
Gross Domestic Product
• Market value of all final goods & services produced within country for a given
time period.
• The most important variable of National Income which shows relatively bigger
picture of economy.
• It can be calculated by three ways- Income, Expenditure, Product.
Gross Domestic Product( GDP)
• GDP by Product Method= Value of Production – Value of Intermediate
goods
• GDP by Expenditure Method =C + I + G + (X – M)
• GDP by Income Method =W+I+P+R =Wages+ interest+ profit + rent
GDP at - Market Price , Constant Price, Factor Cost,
Market prices
• The prices as paid by the consumers.
• Market prices also include product taxes and subsides • It measures inflation.
http://www.spandancareers.org/ 5
GDP at Market Price =GDP at Factor Cost + Taxes- Subsidies
Taxes- Subsidies= Net Indirect Taxes
Factor Cost
• The term factor cost refers to the prices of products as received by the producers.
• Thus, factor cost is equal to market prices, minus net indirect taxes. • GDP at factor cost measures money value of output produced by the firms within
the domestic boundaries of a country in a year.
GDP at Factor Cost = GDP at Market Price – Taxes + Subsidies
(Taxes- Subsidies) = Net Indirect Taxes
Constant Price
• If Price changes, then there may be difficulties in comparing GDPs.
• For example – GDP at market price for the year 2015 is say Rs 1 Cr and that of
2016 is 2Cr.The increase in GDP in two successive years is attributed to either
growth in production or hike in prices.
• Hence real comparison between the GDP of two years will be arrived by
eliminating the price effect. For that we calculated GDP of the given year at some
constant set of prices called as Constant Prices derived from Base Year.
• Constant price is the price taken from Base year. And GDP calculated at constant
price is called Real GDP(R-GDP) and that of current year price is called Nominal
GDP(N-GDP)
• Ratio of Real GDP to that of Nominal GDP is called as ‘GDP Deflator ’
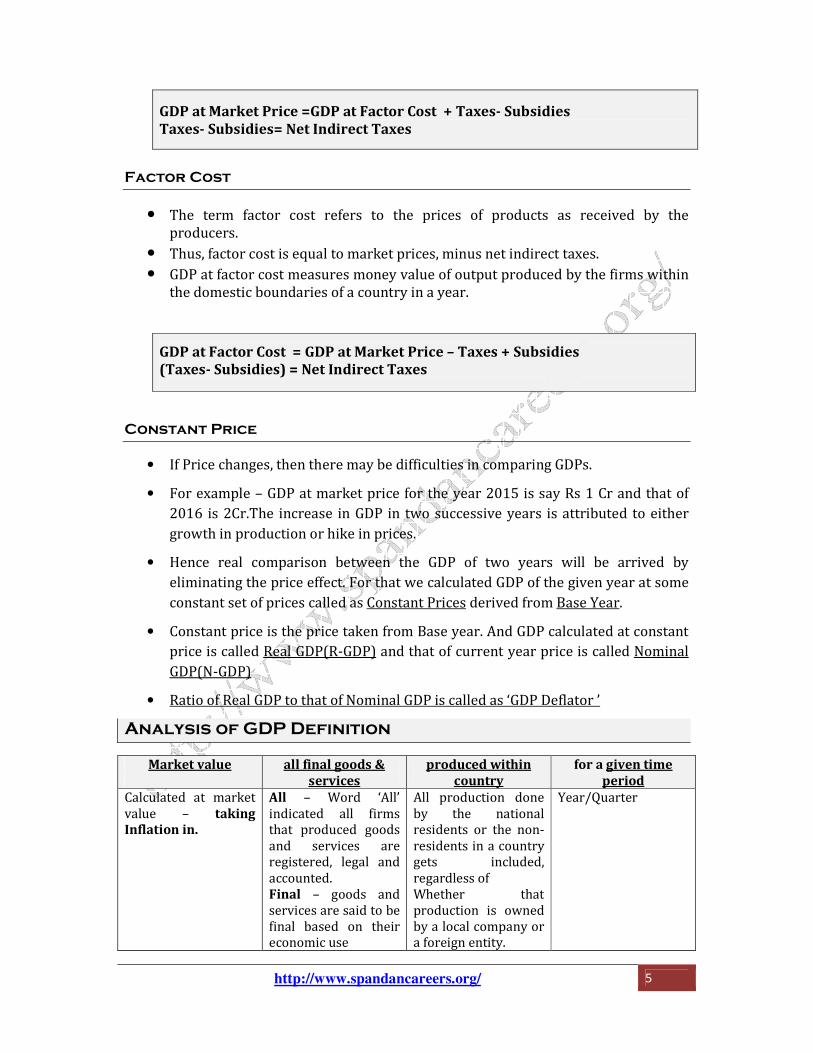
Analysis of GDP Definition
Market value
all final goods &
services
produced within
country
for a given time
period
Calculated at market value – taking
Inflation in.
All – Word ‘All’ indicated all firms that produced goods and services are registered, legal and accounted. Final – goods and services are said to be final based on their economic use
All production done by the national residents or the non-residents in a country gets included, regardless of Whether that production is owned by a local company or a foreign entity.
Year/Quarter

http://www.spandancareers.org/ 6
Net Domestic Product
• It accounts for the loss due wear and tear while undergoing production.
• Depreciation loss shows the level of technology at which production is taking
place. If depreciation loss is more production technology is understood be poor
and vice –versa.
NDP=GDP- Depreciation
Importance /History /Drawback of GDP
• GDP in modern times measured for the first time in USA in 1933 based on the
recommendation of National Income Committee chaired by economist Simon
Kuznets.
• GDP is an indicator economic growth rather than economic development.
• GDP shows the strength of Economy of any country.
• GDP forms the base for imposing tax.
• It is generally believed that higher the GDP of any country higher is per capita
income and better living standard.
• Ideally GDP calculated by three methods shows same result. But in practice any
deviation in the result shows discrepancies. If economy is dominated by informal
sector like India , the discrepancies are wide.
• Following things are not taken into consideration while calculating GDO-
• Underground Economy , Non-Marketed Activities ,Barter Exchanges , Negative
Externality , Opportunity cost , Income Inequality
• Therefore, GDP is not taken as a welfare index.
Gross National Product (GNP)
GNP = GDP + Net Income from abroad
• Net Income from abroad = (Indian Citizen working abroad – Foreign Citizen
working India )
Net Income from abroad (NFIA) Component
1) Trade Balance=Export Income -Import Income
2) Net Interest Payment
3) Pvt. Remittance

http://www.spandancareers.org/ 7
• For India =>GNP = GDP - Net Income from abroad (due higher trade deficit and
high Interest payment liabilities )
• GNP is bigger concept than GDP as it take into consideration goods and services
made by Indian nationals all over the world rather than in India.
• Therefore it shows 1) Internal and External strength of the economy, 2)
Quantitative & Qualitative aspect of economy , 3) degree of dependence on
world
• GNP indicator is use to compare economies of different countries mainly by IMF,
World Bank.
Net National Product (NNP)
NNP = GNP- Depreciation
National Income
NNP at MP – Taxes + Subsidies =National Income (NI)
• This aggregate is called National Income-denoted by ‘NI’.
• All other aggregate (GDP/NDP/GNP/NNP)also indicates national income but they
are denoted as ‘ni’
Per Capita Income
• NI divided by population is called Per Capita Income
• It shows the shareholders in income and nor the distribution of Income.
Personal Income-PI
• PI ≠ NI
• National Income measures only Earned Income
• IRBNE(Income Received but not earned )-Subsidy, Scholarship,
• IEBNR(Income Earned but not received )- PF, Pension, Undistributed profit
• PI= GDP+IRBNE-IEBNR
Disposable Income-DI
• DI= PI-(PT+S) where Personal Tax- PT , Saving-S

http://www.spandancareers.org/ 8
National Income Measurement in India
• National Statistical Office (NSO) under the Ministry of Statistics and
Proagramme Implementation measures the aggregates of National Income and
released the data annually, half yearly and quarterly.
• NSO was formed in 2019 by merging erstwhile two institutions – CSO and NSSO.
• This office also brings out (CPI – Consumer Price Index),(IIP – Index of Industrial
Production), Annual Survey of Industries(ASI) , Family health survey(FHS),
Unemployment and employment survey(E-US), household survey.
New method of Calculating GDP
• In 2015 CSO (now NSO) has changed the method of calculating GDP.
• These changes are in line with System of National Accounts (SNA).
• System of National Accounts (SNA) is the standard use by leading economies to
calculate National Income.
• CSO calculates the GDP at market price now – earlier factor cost.
• It changed the base year from 2004 to 2011-12
• It divided the economy into 8 fields-
Primary- 1) Agri and Allied activities
Secondary - 2) Mining and Quarrying, 3) Manufacturing
Tertiary - 4) Supply and Utility- Electricity, Gas, Water,
5) Construction, 6) Trade, Hotel, Transport, Communication& Broadcasting, 7)
Financial, Real estate, Professional Services
8) Public Administration, Defense, Others
• It gives new income method of calculating GDP
• GDP =Compensation +Consumption of Fixed Capital +Mixed income/ Operating
Surplus
Before 2015 From 2015
GDP at FC+ Taxes-Subsidies =GDP at MP Gross Value added at FC + Production
Taxes -Production Subsidies = GVA at
Basic Price
GDP at MP divided by GDP deflator
=GDP at Constant Price
GVA at Basic Price + Product Taxes -
Product Subsidies =GDP at Market
Price(MP)
Official GDP of India
GDP at Factor Cost = GDP at Constant
Price -Taxes-Subsidies
Official GDP of India
GDP at MP divided by GDP deflator =GDP
at Constant Price-

http://www.spandancareers.org/ 9

http://www.spandancareers.org/ 10
GDP of 2019-20
1) India and the world
• In 2019-20(Estimated)India was 5th largest economy with GDP of $ 2.99 trillion
on Nominal basis.(As per the world economic outlook Oct.2019 database)
• If GDP compares on purchasing power parity basis, India stands 3rd largest
economy after China and United States.
2) India in 2019-20
Growth rate
• Q1 FY-20 => Achieved 5.6 % growth rate against the projection of 8%.
• Q2 FY-20 =>Achieved 5.1% growth rate against the projection of 5.3%.
• Q3 FY-20 =>Achieved 4.7% growth rate.
• GDP (Apr- Dec) FY 20 =>5.1%
• Reason =>Recession
Projection
• Real GDP FY 20 => 5%, INR Rs.146.84 Lakh Cr
• Q4 FY-20 => 4.7%
Indian Economy is in Recession!
• In an economy, a recession happens when output declines for two successive
quarters (that is, six months).
• Output as measured by –GDP, Index of Industrial Production(IIP) etc
• Over the past seven consecutive quarters, economic growth in India has
decelerated with every quarter.

http://www.spandancareers.org/ 11
• It has both internal and external factors (Impact of Global Slowdown) that caused
this recession.
• GDP =>FY 20=> Q1- 5.6%, Q2 – 5.1% , Q3 – 4.7%
• Apr to Dec FY20 => 5.1%
• Apr to Dec FY19 => 6.3%
Other symptoms of recession
• Fall in demand => Low sales growth => Consumer durables , Automobiles, FMCG
• Increase in unemployment-
• 1) As per Periodic Labour Force Survey (PLFS) 2017-18 unemployment in India
was at a 45-year high
• Low Inflation

http://www.spandancareers.org/ 12
GDP Data for the Year 2018-19
1) India and the world
• In 2018-19 India was 6th largest economy with GDP of $ 2.59 trillion on nominal
basis.
• If GDP compares on purchasing power parity basis, India stands 3rd largest
economy after China and United States.
• According to IMF India continues to be Fastest growing economy since 2014.
2) India in 2018-19
• GDP →Rs 14077586 Cr (Constant Price ) => Now revised to RS 13,981,426 Cr
• Rate → 6.6% (Lower than 2017- 18) => Now revised to 6.1%
• Why?
1) Low growth in some sector =>‘Agriculture & allied’, ‘Trade, hotel, transport,
storage, communication and services related to broadcasting’ ‘Public
administration & defence’ sectors.
2) Low Demand
Table 0.1 : key Indicator
Data Categories Unit 2015-16 2016-17 2017-18 2018-19
GDP and Related
Indicator
GDP at current market
Prices
Rs. Crore 13771874 15362386 17095005 19010164a
GDP at constant Market
Prices
Rs. Crore 11369493 12298324 13179857 14077586a
Growth Rate (Per Cent) 8.0 8.2 7.2 6.8a
GVA at constant basic
prices
Rs. Crore 10491870 11318972 12104165 12906936a
Growth Rate (Per Cent) 8.0 7.9 6.9 6.6a
Goss Savings % of GDP 31.1 30.3 30.5 NA
Gross Capital Formation % of GDP 32.1 30.9 32.3 NA
Per Capital Net National
Income (at current
Prices)
Rs. 94797 104659 114958 126406a
(Source : Economic Survey of India 2018-19)
http://www.spandancareers.org/ 13
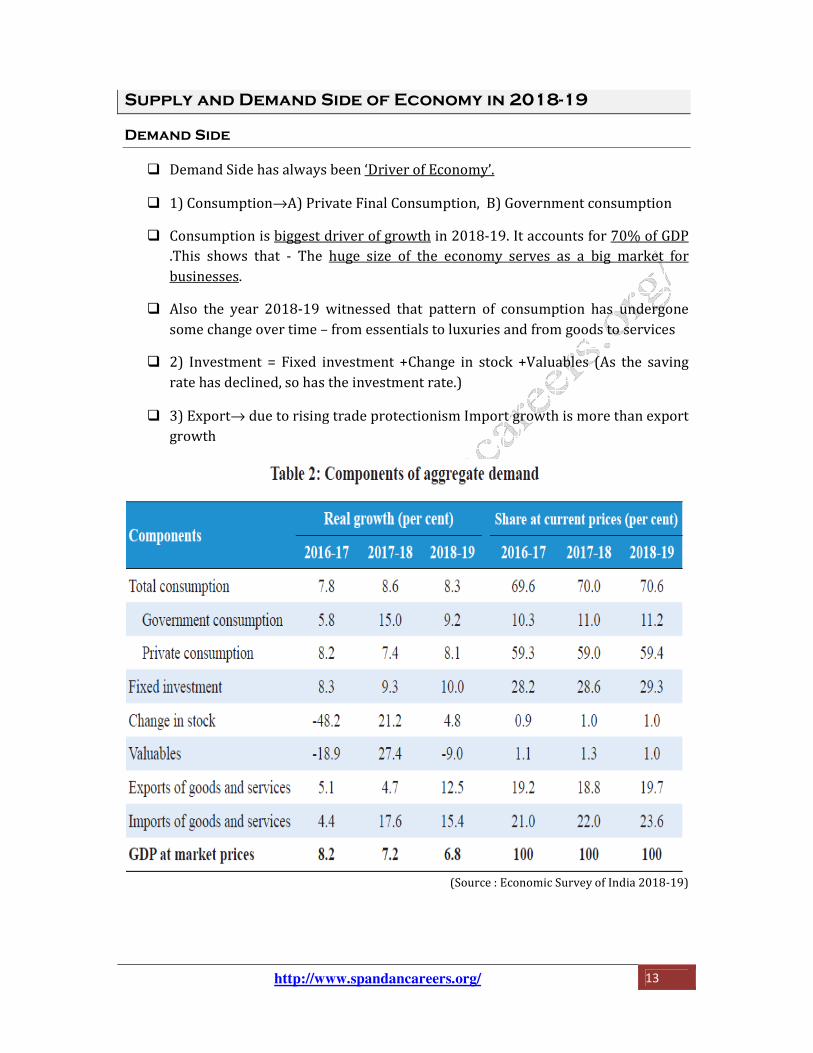
Supply and Demand Side of Economy in 2018-19
Demand Side
� Demand Side has always been ‘Driver of Economy’.
� 1) Consumption→A) Private Final Consumption, B) Government consumption
� Consumption is biggest driver of growth in 2018-19. It accounts for 70% of GDP
.This shows that - The huge size of the economy serves as a big market for
businesses.
� Also the year 2018-19 witnessed that pattern of consumption has undergone
some change over time – from essentials to luxuries and from goods to services
� 2) Investment = Fixed investment +Change in stock +Valuables (As the saving
rate has declined, so has the investment rate.)
� 3) Export→ due to rising trade protectionism Import growth is more than export
growth
(Source : Economic Survey of India 2018-19)
http://www.spandancareers.org/ 14
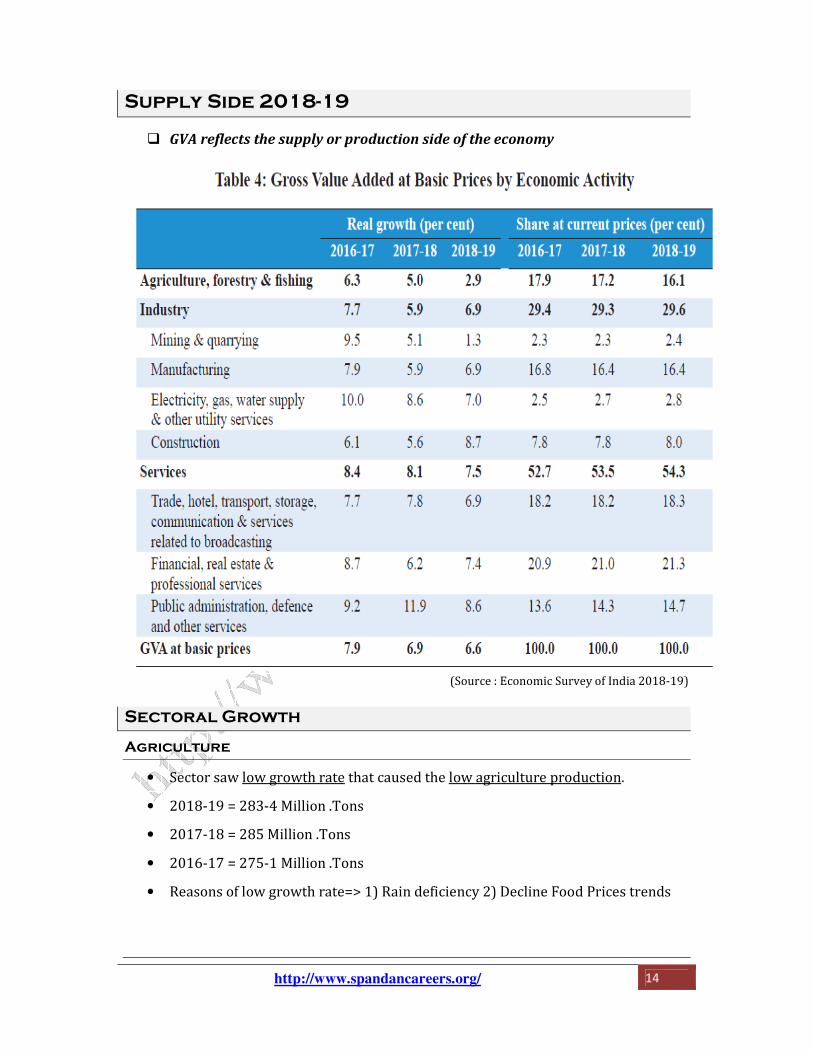
Supply Side 2018-19
� GVA reflects the supply or production side of the economy
(Source : Economic Survey of India 2018-19)
Sectoral Growth
Agriculture
• Sector saw low growth rate that caused the low agriculture production.
• 2018-19 = 283-4 Million .Tons
• 2017-18 = 285 Million .Tons
• 2016-17 = 275-1 Million .Tons
• Reasons of low growth rate=> 1) Rain deficiency 2) Decline Food Prices trends

http://www.spandancareers.org/ 15
Industry
• Growth in industry accelerated during 2018-19 on the strength of improving
manufacturing & construction activity
Services
• key driver of economic growth .GDP => 54%
• Share of service in total exports => 38.4 % and world service exports =>3.5
per cent
3) For the Last 5 years
(Source : RBI Statistical Book 2018-19)

http://www.spandancareers.org/
The table shows
• India’s growth of real GDP has been high with average growth of 7.5 per cent in the last 5
• According to IMF from 2014
the world
http://www.spandancareers.org/
(Source : RBI Statistical Book 2018
India’s growth of real GDP has been high with average growth of 7.5 per cent in the last 5 years (2014-15 onwards). According to IMF from 2014-2018 , India was fastest growing economy in
(Source : Economic Survey of India 2018
16
(Source : RBI Statistical Book 2018-19)
India’s growth of real GDP has been high with average growth of 7.5
2018 , India was fastest growing economy in
(Source : Economic Survey of India 2018-19)

http://www.spandancareers.org/ 17
Major steps in India’s growth story
Year
1950--90 ~ 3.71% Hindu Growth rate
After 1991 Rapid Growth rate Reason- LPG
2008-09 3.1%- Recession 2008
2010-11 8.5% - Highest Ever
2016-17 8.1 %
2017-18 7.2%
2018-19 6.8%
2014-15 onwards 7.5 %
References
1. National income – Chapter 2 – 12th Std. Economics NCERT.
2. Economics survey Vol. 2, Chapter – 1
3. NSO data (Second Advance Estimates of National Income and Expenditures on
GDP, 2019-20)
4. National Income Chapter – Indian Economy Ramesh Singh
Related Documents