ECONOMIC LIBERALIZATION, ELECTORAL COALITIONS AND PRIVATE INVESTMENT IN INDIA Kanta Murali A DISSERTATION PRESENTED TO THE FACULTY OF PRINCETON UNIVERSITY IN CANDIDACY FOR THE DEGREE OF DOCTOR OF PHILOSOPHY RECOMMENDED FOR ACCEPTANCE BY THE DEPARTMENT OF POLITICS Advisor: Atul Kohli September 2013

Welcome message from author
This document is posted to help you gain knowledge. Please leave a comment to let me know what you think about it! Share it to your friends and learn new things together.
Transcript
ECONOMIC LIBERALIZATION, ELECTORAL COALITIONS
AND PRIVATE INVESTMENT IN INDIA
Kanta Murali
A DISSERTATION
PRESENTED TO THE FACULTY
OF PRINCETON UNIVERSITY
IN CANDIDACY FOR THE DEGREE
OF DOCTOR OF PHILOSOPHY
RECOMMENDED FOR ACCEPTANCE
BY THE DEPARTMENT OF POLITICS
Advisor: Atul Kohli
September 2013

© Copyright by Kanta Murali
All rights reserved
i
Abstract
What are the political conditions conducive to growth-oriented policies in poor democracies?
An extensive literature on redistribution suggests that poor democracies are unlikely to focus on
growth-oriented policies. Yet, as a largely poor and highly-competitive democracy that has
witnessed a notable growth transformation, India challenges this hypothesis. To address the
broader question of political conditions conducive to growth-oriented policies in poor
democracies, my dissertation focuses on a specific empirical puzzle – subnational policy
variation in the competition for private investment in India, which ensued after the adoption of
extensive market reforms in 1991. Despite being bound by similar institutional conditions and
being subject to a common shock, some subnational governments have been far more proactive
and business-friendly in the competition for investment than their counterparts; both speed and
scope of policies has varied. I examine this variation and ask why some subnational governments
have been more proactive and investor-friendly than others.
My dissertation makes two main claims. First, I focus on the social base of voters backing
governments, which I refer to as electoral coalitions, and argue that certain configurations of
electoral coalitions with a confined class basis are more favorable to growth-oriented policies
than others. Specifically, narrow-right coalitions, characterized by the joint presence of core
groups with similar economically-advanced profiles and substantial representation of business
interests, are most conductive to growth-oriented issues. How do such narrow class coalitions
emerge in the midst of a poor electorate? The second claim of my dissertation is that narrow
growth-oriented coalitions can arise in poor democracies when the primary logic of electoral
politics is non-economic and rests instead on symbolic concerns such as identity, ethnicity or
nationalism. In such cases, both party strategies of mobilization and voter attachments are driven
ii
by social factors rather than economic interests. Where social attachments cut across economic
interests, class-based electoral collaboration is impeded and narrow coalitions can emerge, even
in the midst of poor electorates.
In the Indian case, I focus on the influence of identity politics, specifically on caste
politics, on both party strategies and voter motivations. The primacy of identity politics has
meant that underlying social cleavage patterns critically affect party strategies of coalition
construction. The association between social cleavage patterns and party strategies is
complemented from below by the effect of identity on voter attachments. Both these factors
allow for the emergence of narrow, growth-friendly coalitions in a poor electorate.
I use a nested research design, which combines both qualitative and quantitative analysis.
Specifically, four in-depth case studies are combined with a time-series cross-section analysis of
14 states between 1992 and 2010.

iii
Contents
Abstract i
Table of Contents iii
List of Figures iv
List of Tables iv
List of Abbreviations v
Acknowledgments vi
1. Chapter 1: Introduction and argument 1
2. Chapter 2: Varied Policy Responses in the Competition for Investment 60
3. Chapter 3: Contrasting coalitions and outcomes: Gujarat and Punjab 109
4. Chapter 4: Fluctuating coalitions and commitments: Andhra Pradesh and Bihar 189
5. Chapter 5: Expanding the scope of analysis 255
6. Chapter 6: Conclusion 302
7. References 317
iv
List of figures
Fig 1.1: Total Investment Proposals across Indian States 13 Fig 1.2: Temporal Variation in investment proposals (select states) 13 Fig 1.3: An overview of the argument 18 Fig 1.4: Applying the argument across Indian states 18 Fig 1.5: Classification of coalitions 20 Fig 1.6: Emergence and influence of narrow-right coalitions 35 Fig 1.7: Emergence and influence of narrow-left coalitions 35 Fig 1.8: Emergence and influence of wide coalitions 36 Fig 2.1: Major and severe obstacles to business operation 100 Fig 2.2: Single largest constraint to operations 100 Fig 2.3: Policy constraints across states 101 Fig 3.1: Applying the argument to Gujarat 114 Fig 3.2: Applying the argument to Punjab 114 Fig 3.3: Predicted Probability of Voting for BJP by Social Group & Class (Guj) 155 Fig 5.1: Per Capital Expenditure on Industry, 1992-2010 260 Fig 5.2: Expenditure on Industry as Proportion of Total Expenditure, 1992-2010 261 List of tables Table 2.1: Policy Variation across States 106 Table 3.1: Vote Choice by Social Group in Gujarat (2002) 143 Table 3.2: Vote Choice by Social Group in Gujarat (2009) 143 Table 3.3: Vote Choice by Social Group in Gujarat (2002) 144 Table 3.4: Social Identity and Vote Choice in Gujarat (2002) 154 Table 3.5: Vote Choice by Social Group in Punjab (2009) 186 Table 3.6: Social Identity and Vote Choice in Punjab (2002) 186 Table 4.1: Vote Choice by Social Group in AP (1999) 214 Table 4.2: Social Bases of Congress and TDP (2009) 214 Table 4.3: Social Identity and Vote Choice in AP (1999) 227 Table 4.4: Vote shares of parties in Bihar Assembly Elections (1990s) 244 Table 4.5: Vote Choice by Social Group in Bihar (2000) 244 Table 4.6: Social Identity and Voter Attachments in Bihar in the 1990s 245 Table 4.7: Vote Choice and Social Identity in Bihar (2000) 252 Table 5.1: Regression results: OLS with PCSE (state-election cycle) 274 Table 5.2: Regression results: Random Effects (state-election cycle) 275 Table 5.3: Regression Results: Fixed Effects Vector Decomposition (state-election cycle) 276 Table 5.4: Regression results: OLS with PCSE (state-year) 277 Table 5.5: Regression results: Random Effects (state-year) 278 Table 5.6: Regression results: Fixed Effects Vector Decomposition (state-year) 279 Table: 5.7: Variables and Sources 280 Table 5.8: Summary statistics 280 Table 5.9: Correlation matrix 281 Table 5.10: Coding of Coalition Types by State and Year 282

v
List of abbreviations and terminology
Adivasis Scheduled Tribes; also referred to as STs
AP Andhra Pradesh
BJP Bharatiya Janata Party
CPI Communist Party of India
CPI (M) Communist Party of India –Marxist
Dalits Scheduled Castes; also referred to as SCs or Harijans
FDI Foreign Direct Investment
FPTP First-Past-the-Post
GSDP Gross State Domestic Product
INC Indian National Congress
IPE International Political Economy
JD Janata Dal
JD(U) Janata Dal (United)
KHAM acronym for Kshatriya Harijan Adivasi Muslim; electoral strategy used in Gujarat
MLA Member of the Legislative Assembly
OBC Other Backward Castes
PRP Praja Rajyam Party
NTR N.T. Rama Rao
RJD Rashtriya Janata Dal
SAD Shiromani Akali Dal
SC Scheduled Castes; also referred to as Dalits
ST Scheduled Tribes; also referred to as Adivasis
TDP Telugu Desam Party
TRS Telangana Rashtra Samiti
UP Uttar Pradesh
YSR Y.S. Rajasekhar Reddy

vi
Acknowledgements
It certainly takes a village to complete a dissertation. In my case, I am absolutely certain
that I would not have reached this point without the advice, support and goodwill of several
people and institutions across multiple cities in three continents. The fact that this journey has
occurred relatively late and been circuitous has only meant that the debt I owe to others is
ridiculously embarrassing. I feel tremendously privileged to have had this opportunity.
Despite its proclivity to inspire numerous episodes of self-doubt, I enjoyed every bit of
my graduate school experience and felt continuously excited, challenged and incredibly fortunate
to be at Princeton. I am grateful for the financial support that I received from the Graduate
School at Princeton and the Princeton Institute of International and Regional Studies (PIIRS).
PIIRS funded my sixth year and also provided a congenial interdisciplinary environment, replete
with excellent office space and a constant supply of food and coffee (in Princeton, there is such a
thing as a free lunch!).
My biggest debt of gratitude in writing this dissertation is to my exemplary committee of
Atul Kohli, Evan Lieberman and Grigore Pop-Eleches. As a friend in my cohort once remarked,
the relationship between graduate students and their advisors is so embarrassingly one-sided –
you constantly make demands while giving back almost nothing in return. I cannot thank Atul,
Evan and Grigo enough for their advice, suggestions and support.
Every time I had a conversation with him, I was struck by Grigo’s incredibly perceptive
comments. His questions and extremely useful suggestions led me to revise both the theory and
the empirical analysis at several critical stages. His advice was also timely; I was struggling with
improving the empirical analysis even as I was leaving Princeton in the summer of 2012 and a
vii
chance discussion with Grigo on a train to NYC provided the much-needed clarity that was
required to finish the dissertation. Through his high standards, insightful advice, tireless work
ethic and his own scholarship, Evan has influenced this dissertation and my socialization as an
academic in more ways than he knows. This dissertation, particularly the framing of the puzzle
and the theoretical framework, would have been infinitely poorer if not for his advice. Over the
years, Evan constantly challenged me to think like a comparativist rather than an area studies
person. Though I am still well short on that front, Evan’s questions were absolutely critical in
forcing me to think about the type of academic I wanted to be.
Atul has had a profound influence on this dissertation, my overall education and
professional development. He has been a fantastic role model, offered invaluable advice and
provided unflagging support over the last seven years in the most gracious, sensitive and
collegial manner possible. His own work has not only shaped so much of this dissertation but my
general understanding of politics and development. Every bit of Atul’s contributions has been
critical but I am especially grateful for the confidence he had in me. I will never understand
what prompted that confidence but I will always remain very thankful for it. Atul has been the
best mentor that I could have hoped for – brilliant, engaging, supportive, generous and gracious.
I only hope that I am capable of producing scholarship worthy of his support.
I am also very grateful for advice and suggestions from several other Princeton faculty
members including Mark Beissinger, Dani Campello, Rafaela Dancygier, Amaney Jamal, Jonas
Pontusson and Deborah Yashar. The department’s graduate seminar was an invaluable source of
high-quality feedback. Over the years, I benefitted significantly from the comments,
encouragement and friendship of several fellow graduate students in the Politics department
including Loubna El Amine, Peter Buisseret, Sarah Bush, Will Bullock, Lauren Davenport,
viii
Michael Donnelly, Sandra Field, David Hsu, Vinay Jawahar, Kris Johnson, Mike McKoy, Mike
Miller, Dinsha Mistree, Prerna Singh, Vinay Sitapati and Teppei Yamamoto. I feel very lucky to
have learned from and interacted with them.
Two friends in my graduate cohort, Gwyneth McClendon and Noam Lupu, deserve
special mention. Their wise counsel and steadfast support have been critical to this dissertation
and to my graduate education, more generally. My understanding of the field and the profession
would have been that much poorer without their patient answers to my numerous questions. The
fact that I can still rely on them to answer even the most trivial questions, long after we have all
left Princeton, is a very comforting thought. They are brilliant, generous scholars whose advice
and friendship I value greatly. I hope to continue learning from them for a long time.
Conversations with friends from other departments including Sare Aricanli, Rohit De,
Radha Kumar, Rohit Lamba, Arijeet Pal, Fadzilah Yahaya and Alden Young were always a
pleasure. The last year of this dissertation was completed in Toronto. I was fortunate to have the
sympathetic ear of Carolina de Miguel and Ben Goldman while navigating the stresses of first-
year teaching. I was also the frequent beneficiary of their excellent culinary skills. Cameron
Johnson kept my tennis going from the time I moved to Toronto and has been a wonderful guide
to the city, local politics, wine, documentaries and all things Canadian.
Fieldwork was made easier with the help and hospitality of several people. I owe thanks
to numerous interviewees who generously gave their time. Inevitably, as is the case in India, one
interview led to several others prompted by introductions and suggestions. I must acknowledge
the help of a few people in particular. In Hyderabad, V.K. Srinivasan spent several hours on
multiple occasions explaining the working of AP’s politics and bureaucracy and also arranged
ix
several interviews for me. I am grateful to D. Rajagopalan in Gandhinagar for arranging
meetings with his colleagues in the Gujarat government. The Chandigarh CII office provided
introductions to businesspersons in Ludhiana. Ranga Reddy in Hyderabad, Venkatesh Iyer in
Ahmedabad and S. Ramanujam in Delhi graciously helped with logistics. The chance to catch up
with friends in Delhi and Chandigarh made fieldwork in those places particularly enjoyable.
Renu Kocchar’s incredible hospitality made my time in Chandigarh extremely memorable and
gave me a chance to reestablish family connections that now span four generations. In Delhi,
time with Meghna and the rest of the Prasad family was much appreciated.
This dissertation might have been completed sooner if I had chosen to spend fewer hours
playing tennis but I would have been far less happy had I done so. Tennis acted as my main form
of escapism, let me get out of the grad school bubble regularly and live in constant denial of
middle age. Thanks are due to numerous hitting partners and league teammates in NJ, Philly,
NYC and Toronto for allowing me to readily indulge in this passion. I am particularly grateful to
two people. Long battles with Steve Mackey over four years on Princeton’s beautiful Lenz
courts, many on punishing 90 degree summer afternoons, were extremely memorable. Kei
Imanishi was a truly gracious and generous hitting partner whose love of the game was
infectious.
Finally, I owe special thanks to some close friends and family members. Though they do
not know it, their indirect contributions were important in completing this dissertation. Since our
time as undergraduates at Smith, Anne Booker, Meghna Prasad and Daisy Wynn have been
among my closest friends and confidants. I first met Anu Lakshman on a tennis court more than
30 years ago and she remains a significant part of my links to Madras. For putting up with me
x
through the years and for simultaneously keeping me honest while indulging me in countless
ways, I am indebted to all of them. They have helped me in more ways than I can remember.
Being at Princeton gave me the opportunity to make regular excursions to NYC to visit
my cousins, Raghu and Urmilla Sundaram, and their daughter, Aditi. Ever since I moved to the
US to attend Smith, I depended significantly on Raghu, Urmilla and Aditi’s support and
friendship. I have fond memories of time spent with them. Raghu and Urmilla’s own Ph.D.
experiences also meant that we often bonded over shared grad school journeys. Sadly, Urmilla
passed away last year. She was a truly special human being – strong, courageous, intelligent,
engaging, relentlessly practical, dignified and always cheerful – who I miss greatly. Two other
remarkable women – my grandmothers – did not live to see me finish the dissertation either. But
they would have been very happy to know that I did so.
Last but not least, none of this would have been possible without the support of my
parents, Tara and Murali, and my brother, Krishna. They are my moral compass and source of
stability. They have always been my biggest supporters even though they have watched me try
numerous pursuits, fail in some and change my mind on several occasions. Encouragement aside,
my interest in politics is largely due to my family. Growing up, politics was the most discussed
and debated topic in our house after cricket. My parents remain avid news junkies and visits
home are always useful in catching up with the nitty-gritty of Indian politics. The fact that my
mother still calls frequently to rail about some ill-conceived government policy is a major source
of comfort. Over the years, she has viewed the role of Indian business with a high (if
unwarranted) degree of skepticism and we have had countless debates on the subject. If she ever
reads it, I know parts of this dissertation would prompt an “I told you so.” I guess some battles
have to be lost! This dissertation is dedicated to my parents and my brother.

1
1. Chapter 1: Introduction and argument
1.1. Motivation and overview
Cases of rapid growth in the developing world are rare. If examples of high growth in poor
countries are few and far between, rarer still are those that have occurred in a democratic setting.
From the point of view of an extensive literature on redistribution, these trends are not
surprising. Starting with the classic models of Romer (1975) and Meltzer and Richard (1981),
scholars have posited an inverse relationship between income and individual preferences for
redistribution – individuals with lower incomes are likely to favor greater redistribution. While
recent theories have emphasized other variables in explaining redistributive preferences such as
structure of inequality, skill types, prospects for mobility, risk aversion, values and beliefs, even
those that highlight alternative mechanisms empirically confirm an inverse relationship between
income and preferences for redistribution (e.g., Alesina and Angeletos 2005; Alesina and Ferrara
2005; Iversen and Soskice 2001; Scheve and Stasavage 2006).
A related set of studies link democracies to redistributive outcomes at a macro-level (e.g.,
Acemoglu and Robinson 2005; Boix 2003). Though these authors focus on the conditions under
which democracies emerge and consolidate, they too assume that the poor prefer higher
redistribution than the rich. Authoritarian governments privilege elite interests while
democracies are responsive to the poor and, as a result, should redistribute more. Some authors
also broadly suggest that democracies are better for the welfare of the poor as they provide more
social spending or public goods than non-democracies (e.g., Brown and Hunter 1999; Lake and
Baum 2001; Stasavage 2005).1
1 Ross (2006) challenges the claim that democracies have a better record on the welfare of the poor. In addition, levels of redistribution vary within democracies (e.g., Iversen and Soskice 2006, 2009).
2
If the poor generally prefer greater redistribution and democracies have a proclivity to
redistribute, we should see poor democracies focusing predominantly on redistributive policies.
Given the nature of resource constraints in developing democracies, policymakers often face a
trade-off between growth-related policies and redistributive measures.2 It is therefore unlikely
that policymakers will focus on growth in such circumstances. Yet as a largely poor and highly-
competitive democracy that has witnessed a notable growth transformation, India poses a puzzle
to this hypothesis. Catalyzed by a major shift in its policy framework, India has been among the
world’s fastest growing economies over the last two decades. Between 1991-92, when it adopted
extensive market reforms, and 2010-11, India’s GDP grew at an annual average rate of over 6.5
per cent.3
India’s growth experience stands in stark contrast to those of other successful late developers.
Not only did well-established democratic politics precede India’s shift to a high-growth path,
economic change has taken place in a polity where the poor constitute a near majority of the
electorate and are more likely to participate in the electoral process than economically-privileged
sections (Yadav 1999, 2002). According to the World Bank, 41.6 per cent of India’s population
lived below the $1.25 a day poverty line in 2005 and 76.5 per cent lived below $2 a day (Chen
and Ravallion 2008).4
2 There are several reasons why a trade-off between growth-related goals and redistribution may exist in developing countries. The extent to which there is a trade-off is ultimately an empirical question. In Indian states, as discussed later in the chapter, there is considerable evidence of a tension between growth-oriented and redistributive goals in the post-reforms period. 3Calculations based on data from the World Bank (databank.worldbank.org); accessed March 26, 2013. 4 Poverty measures are highly controversial in India and a variety of estimates exist. Official estimates of the Indian government peg the poverty headcount ratio at 37.2 per cent in 2004-05 (Tendulkar Report). This translates to 301.7 million people below the poverty line. Another government-appointed taskforce using a different methodology, the Saxena Committee, estimated the poverty ratio at 50 per cent in its report while a third, the Sengupta Committee, put the figure of “poor and vulnerable” at 77 per cent of India’s population or 836 million people.
3
The puzzle posed by India’s experience – of rapid growth in the midst of largely poor
electorate – leads to a broader question that forms the main motivation of this dissertation. What
are the political conditions conducive to growth-oriented policies in poor democracies? To gain
traction on this large question, this dissertation analyzes a specific empirical puzzle – subnational
policy variation across Indian states in the competition for private industrial investment in India,
which ensued after market reforms in 1991.5
In response to a balance of payments crisis in 1991, India adopted extensive market reforms.
Among other major ramifications, economic liberalization led to the onset of competition for
private investment between states. Despite being bound by similar institutional conditions and
despite being subject to a common shock in the form of market reforms, Indian states have
reacted very differently to the competition for investment. In particular, some subnational
governments have been more proactive in the competition for investment than their counterparts;
both the speed and scope of investment promotion policies have varied across states. I examine
this policy variation and ask why some Indian states have been far more proactive in the
competition for investment than others. As explained later in this chapter, investment is widely
recognized as an important determinant of the growth process and I therefore focus on policies
designed to attract investment.
Through the analysis of subnational policies in the competition for investment in India,
my dissertation makes two main claims. First, I argue that under certain circumstances in poor
democracies, redistributive pressures are more contained and policymakers can prioritize
growth-related concerns. I focus on the social base of voters, which I refer to as electoral
5 Investment throughout this dissertation is meant to refer to private industrial investment – domestic and foreign direct investment by the corporate sector. It does not include portfolio investment or agricultural investment, except for agro-based or agro-processing industry.
4
coalitions, and suggest that certain configurations of electoral coalitions with a narrow class basis
are more favorable to growth-oriented policies than others. 6 Specifically, narrow-right
coalitions, characterized by the joint presence of core groups with similar economically-
advanced profiles and substantial representation of business interests, are most conducive to a
growth-friendly policy agenda. Such coalitions represent a congruence of political and economic
power and this overlap tends to be most favorable for the formulation and implementation of a
growth-oriented framework.
If such narrow class coalitions are most favorable to growth-oriented policies, how do
they emerge in the midst of a predominantly poor electorate? The second claim of my
dissertation is that narrow growth-oriented coalitions can arise in poor democracies when the
primary logic of electoral politics is non-economic and instead rests on symbolic factors. In
several poor democracies, symbolic concerns such as identity, ethnicity or nationalism form the
primary basis of electoral contestation; both party strategies of mobilization and voter
attachments are driven by social factors rather than economic interests. Where social attachments
cut across economic interests, class-based electoral collaboration is impeded and narrow
coalitions can emerge even in the midst of poor electorates.
In the Indian case, I focus on the role of identity politics and specifically on caste politics.
Identity politics forms the main mode of electoral mobilization by parties in India and also
influences voter motivations. The effect of social factors on both party strategies and voter
attachments prevent large lower class coalitions from forming in some cases, which we might
have otherwise expected given the broader income distribution of the electorate. Instead, I find 6 Throughout this dissertation, the nature of electoral coalitions refers to the social base of voters who support a particular government and not to a coalition of parties in government. However, governments comprising a coalition of parties have often come to power in India. In such cases, the socio-economic vote base of all parties that comprise the government is taken into account.

5
that underlying social cleavage patterns critically affect the party strategies of coalition
construction. In particular, certain cleavage structures allow for the emergence of narrow class
coalitions, even though the electorate is largely poor. The link between social cleavage patterns
and party strategies is complemented from below by the effect of identity on voter attachments.
By pointing to the link between social factors and economic policy, my argument emphasizes
an association that is often overlooked in the political economy literature, which typically
focuses on advanced industrial countries. At the most general level, I suggest that a confluence
of political and economic power is conducive to the prioritization of growth-related policies in
poor countries. The possibility of this overlap in developing democracies is often mediated by
social factors and I attempt to explore the conditions under which the intersection of political and
economic power can occur in the presence of poor electorates. In doing so, the dissertation
highlights the marked difference in the political dynamics of policymaking in cases where social
attachments cut across economic interests compared with those where class politics is well-
developed.
The dissertation also engages with other key scholarly debates. In its emphasis on policies
undertaken by governments, this dissertation shares an affinity with the developmental state
literature. Unlike the case of classic developmental states in East Asia, which were supported by
authoritarian political regimes, examining the state’s economic role in the Indian context
provides insights into the constraints and challenges engendered by democratic contestation. By
focusing on the competition for investment, the dissertation speaks to a debate in international
political economy on the influence of mobile capital on policymaking. In analyzing the links
between caste, entrepreneurship and policymaking, it contributes to the literature on ethnicity
and economic outcomes. Finally, my dissertation joins a growing body of subnational studies on
6
India, which highlight the impact of diverse historical, social and political trajectories across
states on varied outcomes within the country.
The remainder of this chapter focuses on the central argument, the empirical puzzle and the
research design in more detail. Before elaborating on these aspects, I first outline the motivation
behind a study of investment policies below.
1.2. Why a study of investment policies?
Understanding the factors leading to economic growth has been a long-standing concern in
both academic and policy circles. Growth is one of the most vital facets of economic
development; it is critical to reducing poverty and tends to be strongly correlated with a variety
of outcomes that citizens care about such as health and education. In turn, investment is a key
input into the growth process. The sheer magnitude of poverty in India and the indirect impact of
investment through the growth process make a study of investment policies worthwhile.
The significance of investment to economic growth has been highlighted by theoretical,
empirical and policy-oriented studies, At a theoretical level, neoclassical growth models clearly
emphasize the role of capital accumulation (e.g., Barro and Sala-i-Martin 2004). At an empirical
level, several studies in the economics literature have found a positive relationship between
investment and growth (e.g., Barro 1997; Levine and Renelt 1992; Mankiw et al. 1992). The
developmental state literature in political science highlights the crucial role that the state played
in East Asia’s dramatic transformation (e.g., Amsden 1989; Evans 1995; Kohli 2004; Wade
1990). In particular, the state expressed its authority through the key avenues of savings and
investment. For statists such as Amsden, Evans, Kohli and Wade, close ties between the state
and private capital allowed the former to influence levels of private domestic investment and also
7
channel investment into high-growth sectors of the economy. The ability of the state to mold the
key variable of investment was at the heart of East Asia’s growth miracle for these scholars.
The importance of investment and policies related to it has similarly been highlighted in
policy circles. The World Bank, for example, claims that “as populations get larger, economic
growth provides the only sustainable way of improving living standards. A good investment
climate drives growth by encouraging investment and higher productivity. Investment underpins
growth by bringing more inputs into the production process” (WorldBank 2005b: 5). Though
central to the growth process, this dissertation does not claim that investment is the sole
determinant of growth. As a voluminous literature in economics suggests, growth is multi-causal
and a plethora of factors have been found to affect growth.7 Nevertheless, investment has been
identified as one of the primary factors that drive growth at a proximate level of causation.
While it is widely accepted that investment matters for growth, the nature of investment in
the developing world has markedly changed in character with the onset of neoliberal policies and
the current era of globalization. A shift in the dominant development paradigm from statist to
market models in much of the developing world in the 1980s meant that private investment
began to assume far greater importance than public investment as a driver of economic growth.
At the same time, increasing cross-border flows of capital has led governments to compete with
each other to attract capital to their jurisdictions. To attract mobile capital, governments face
pressure to create investor-friendly policy frameworks.
The Indian economic context after 1991 acts as a microcosm of the some of these broader
trends. Like other parts of the developing world, market reforms in India led to a decline in the
importance of public investment in India as a driver of growth and a concomitant increase in that
7 Useful reviews on the determinants of growth can be found in Barro and Sala-i-Martin (2004), Bosworth and Collins (2004) and Durlauf and Quah (1999).
8
of private investment. As section 1.3 below will outline, economic liberalization in India brought
about open competition between Indian states for private investment, albeit with very mixed
results.
Other aspects specific to the Indian context also justify a focus on investment policies. While
India’s overall performance has been impressive, growth has been extremely uneven. Healthy
national averages mask extremely varied outcomes below. For several scholars, the discernible
existence of “two Indias” has been clearly evident in the post-liberalization period (e.g.,
Ahluwalia 2000; Chatterjee 2008; Corbridge and Harriss 2000; Frankel 2005; Kohli 2006, 2012;
Subramanian 2008). While states in the south and the west have driven the country’s economic
resurgence, those in the populous north have fallen behind. Yet a disproportionate number of
India’s poor continue to be concentrated in populous, slow-growing Hindi-belt states. At a
proximate level of causation, many commentators have suggested that such regional growth
differentials are themselves products of diverging investment (e.g., Ahluwalia 2000; Besley et al.
2007; Kohli 2006, 2012; Subramanian 2008).
Regional inequalities can be deeply consequential for federal polities such as India as they
can act as sources of potential political tensions. More importantly, diverging economic
outcomes have repercussions for the nature and quality of Indian democracy (e.g., Chatterjee
2008; Frankel 2005; Kohli 2006, 2012). For Kohli (2006), the spatial disparity of economic gains
in conjunction with the “pro-business” nature of India’s current economic paradigm threatens to
heighten the “two-track” nature of Indian democracy where policy-making is in the hands of a
pro-business elite while the poor are strictly confined to the electoral process.
In addition to all these tangible reasons, a strong interest in the role of the state in
development. State activism has been crucial to investment outcomes across regions in India, as
9
chapter 2 discusses, but the nature of tasks undertaken by the state has changed in the era of
globalization compared with the case of classic developmental states in East Asia (e.g., Amsden
1989; Evans 1995; Johnson 1982; Kohli 2004; Wade 1990; Woo 1991). In particular, economic
policymaking is now affected by the advent of mobile capital. A study of investment policies in
India after 1991 allows for closer examination of the state’s role in an era of mobile capital.
Finally, the central claims of this dissertation focus on the impact of political factors on
investment policies. To those familiar with India, the stress on the political determinants of
policymaking will come as no surprise. In many ways, India exemplifies the claim that politics
drives policymaking; it is a deeply political society and high levels of contestation inform every
aspect of Indian democracy. The effect of politics is evident even in more seemingly technocratic
areas such as investment promotion. Yet, the mechanics through which political factors operate
in economic policymaking in India remains under-analyzed and this dissertation attempts to
partially fill that gap.
For all these reasons, a focus on investment policies is worthwhile and of practical
importance. The next section provides a background of economic liberalization, the ensuing
competition for investment and divergent subnational policy responses.
1.3. The empirical puzzle: economic liberalization, subnational competition for
investment and divergent policy responses
In response to a balance of payments crisis in the summer of 1991, India embarked on a path
of market reforms. Socialist planning, an inward orientation and an interventionist state gave
way to a more external outlook and decentralized structure that involved a very different role for
the market and the state. The centerpiece of India’s post-independence policy regime – the
10
industrial licensing system – was virtually eliminated, drastically reducing state control of the
private sector. Private investment supplanted public investment as the main engine of growth and
this in turn had major consequences for the nature and content of policy-making in the country
(e.g., Ahluwalia 2000; Jenkins 1999; Kohli 2004, 2006; Rudolph and Rudolph 2001; Singh and
Srinivasan 2006; Sinha 2005). India also changed its external sector strategy considerably, easing
regulations on foreign investment and gradually liberalizing its trade regime.
India’s economic reforms in 1991 were unexpected, extensive and represented a sea change
in the economic policy framework of the country. In its quintessential style, the Economist
suggested at the time: “For years the pace of economic reforms in India has been sedate, if not
glacial. Yet in about as much time as it takes to say ‘International Monetary Fund’, Indians now
face a flurry of reform intended to transform its inward-looking, control-bound economy into one
favoring free markets and foreign trade. The Fabian founders of modern India will shudder in
their graves” (Economist 1991: 36).
In all likelihood, India’s Fabian founders would have balked at the changes that occurred in
1991. More importantly, the process of economic liberalization had significant political and
economic ramifications. Among the key changes, the 1991 reforms elevated the role of private
corporate investment and engendered a major reconfiguration in the role of the central and state
governments in the policy process. Prior to 1991, New Delhi enjoyed dominant control of
economic policy but the onset of reforms led to a sharp decentralization in economic decision-
making and brought state governments to the forefront of policy-making. Under India’s federal
system, states have jurisdictional authority over several aspects of economic policy.8 Until 1991,
8 By the provisions of the Indian constitution, state governments have jurisdiction in the area of industries, except those declared by parliament to be necessary for defense purposes or expedient to public interest. States also have

11
the central government played a dominant role in economic decision-making but, with the virtual
abolition of the industrial licensing system, New Delhi’s role in influencing the geographic
distribution of investment has been effectively eliminated. This meant that private investment is
no longer subject to geographical constraints by the federal government and one of the most
salient aspects of liberalization is that states now compete to attract domestic and foreign private
investment. According to Rudolph and Rudolph, “by the end of the 1990s, state chief ministers
became the marquee players in India’s federal market economy. What has attracted media and
policy attention in recent years is the competition among the states for international attention and
for domestic and foreign private investment” (2001: 1541).
Growing subnational economic authority was at the same time politically reinforced by
parallel transformations occurring in India’s vibrant democracy. The decline of the Congress, the
onset of coalition governments at the center, the marked regionalization of Indian politics and
major surges in the participation of lower castes in the populous northern states– processes that
had their origins in the 1960s but reached their peak in the early 1990s – all led to a vastly
different environment where the states began to enjoy new-found political leverage. In short, the
era of reforms has seen a discernible shift in the locus of economic and political power from
New Delhi to the states.
The new development framework altered India’s growth trajectory considerably. In contrast
to the infamous “Hindu rate of growth” of 3.2 per cent between 1965-66 and 1980-81, India
grew at a little over 6.5 per cent between 1991-92 and 2010-11. These robust national growth
rates, however, have masked considerable regional differences below. It should be noted that
significant responsibility in most policy areas relevant to investment promotion such as land, electricity, roads (excluding national highways), labor laws, certain taxes, special economic zones and law and order. However, the presence of the industrial licensing system until 1991 allowed the center to control the location of investment.
12
subnational disparities in economic performance are not purely artifacts of the liberalization era;
dissimilarities across states have always characterized economic outcomes in India.
Nevertheless, authors point out that inter-state growth disparities were not as pronounced in the
first four decades after independence as they have been in the last two decades (e.g., Ahluwalia
2000; Kochhar et al. 2006b; Nagaraj 2006; Purfield 2006). In turn, several studies specifically
point to diverging private investment levels across states as the proximate cause of regional
growth differentials after 1991 (e.g., Ahluwalia 2000; Besley et al. 2007; Kohli 2006;
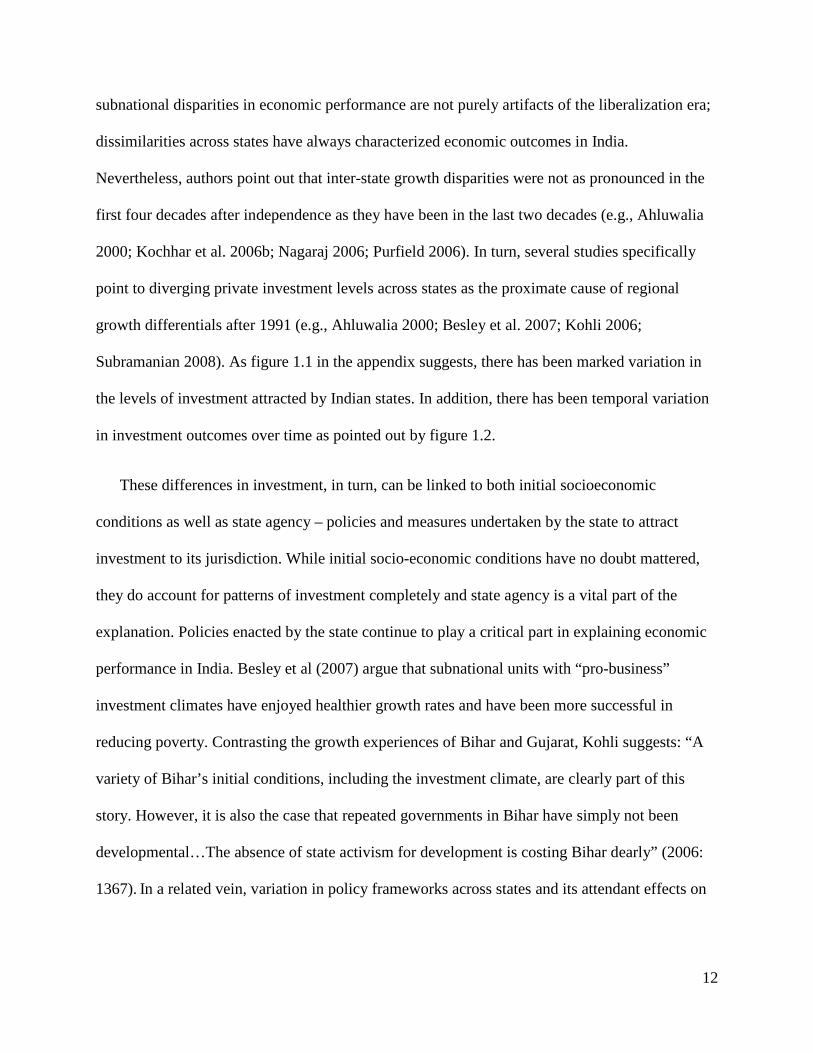
Subramanian 2008). As figure 1.1 in the appendix suggests, there has been marked variation in
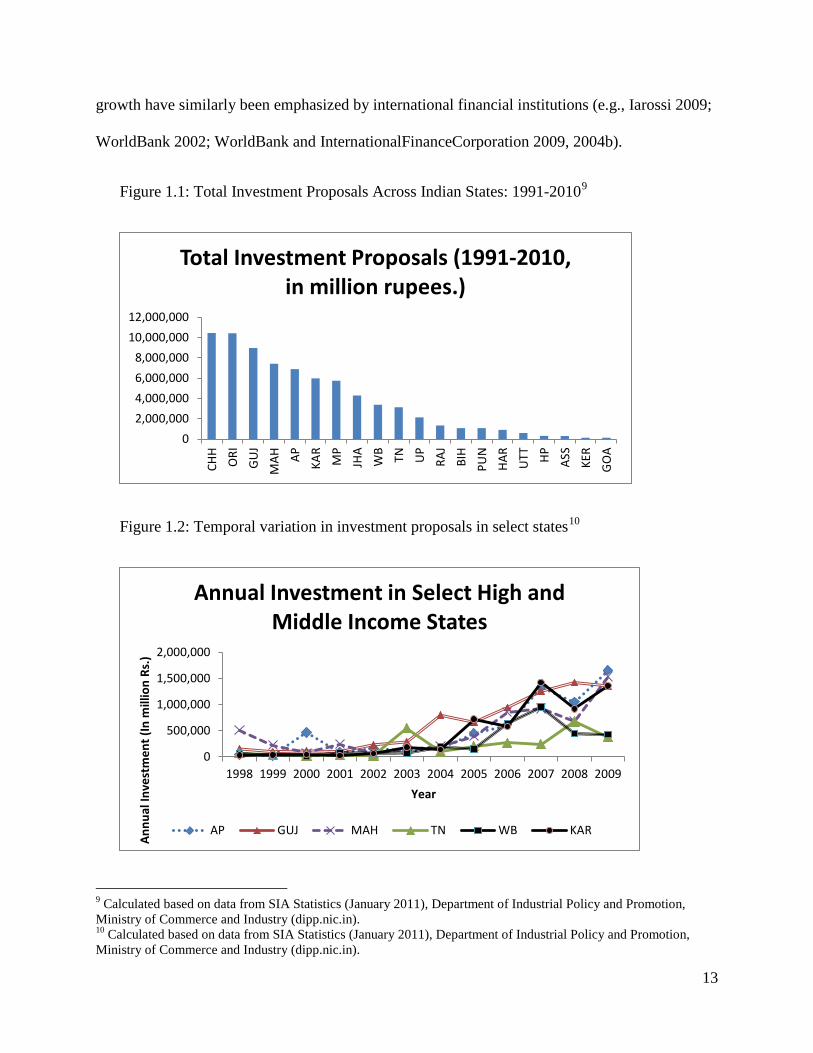
the levels of investment attracted by Indian states. In addition, there has been temporal variation
in investment outcomes over time as pointed out by figure 1.2.
These differences in investment, in turn, can be linked to both initial socioeconomic
conditions as well as state agency – policies and measures undertaken by the state to attract
investment to its jurisdiction. While initial socio-economic conditions have no doubt mattered,
they do account for patterns of investment completely and state agency is a vital part of the
explanation. Policies enacted by the state continue to play a critical part in explaining economic
performance in India. Besley et al (2007) argue that subnational units with “pro-business”
investment climates have enjoyed healthier growth rates and have been more successful in
reducing poverty. Contrasting the growth experiences of Bihar and Gujarat, Kohli suggests: “A
variety of Bihar’s initial conditions, including the investment climate, are clearly part of this
story. However, it is also the case that repeated governments in Bihar have simply not been
developmental…The absence of state activism for development is costing Bihar dearly” (2006:
1367). In a related vein, variation in policy frameworks across states and its attendant effects on
13
growth have similarly been emphasized by international financial institutions (e.g., Iarossi 2009;
WorldBank 2002; WorldBank and InternationalFinanceCorporation 2009, 2004b).
Figure 1.1: Total Investment Proposals Across Indian States: 1991-20109
Figure 1.2: Temporal variation in investment proposals in select states10
9 Calculated based on data from SIA Statistics (January 2011), Department of Industrial Policy and Promotion, Ministry of Commerce and Industry (dipp.nic.in). 10 Calculated based on data from SIA Statistics (January 2011), Department of Industrial Policy and Promotion, Ministry of Commerce and Industry (dipp.nic.in).
02,000,0004,000,0006,000,0008,000,000
10,000,00012,000,000
CHH
ORI
GU
JM
AH AP KAR
MP
JHA
WB TN UP
RAJ
BIH
PUN
HAR
UTT HP AS
SKE
RG
OA
Total Investment Proposals (1991-2010, in million rupees.)
0
500,000
1,000,000
1,500,000
2,000,000
1998 1999 2000 2001 2002 2003 2004 2005 2006 2007 2008 2009
Annu
al In
vest
men
t (In
mill
ion
Rs.)
Year
Annual Investment in Select High and Middle Income States
AP GUJ MAH TN WB KAR
14
Despite such observations on differences in state agency and policy frameworks related
to investment across subnational governments in India, these aspects have not been extensively
examined. Indian states were subject to a common, unexpected shock in the form of the 1991
reforms and are bound by similar constitutional, legal and financial provisions. Yet, there are
considerable differences in the way subnational governments have reacted to the competition for
investment. As chapter 2 lays out in extensive detail, some states in India have been far more
proactive and aggressive in their attempts to attract capital to their jurisdictions. This has meant
that both the speed and scope of policies formulated and implemented have differed across
states. In some cases, policies have varied within states over time. The variation contravenes the
expectations of the “convergence” hypotheses, which suggests that units competing for capital
are likely to adopt similar business-friendly policies (e.g., Andrews 1994; Cerny 1993).
I try to understand these varied policy responses across Indian states in the competition
for investment and ask the following question. Why have some states been more proactive and
investor-friendly in policy terms than their counterparts?
1.4. The argument
1.4.1. An overview
In explaining subnational policy variation in the competition for investment, I advance a
two-stage argument in this dissertation. Each stage of the argument is elaborated in detail in the
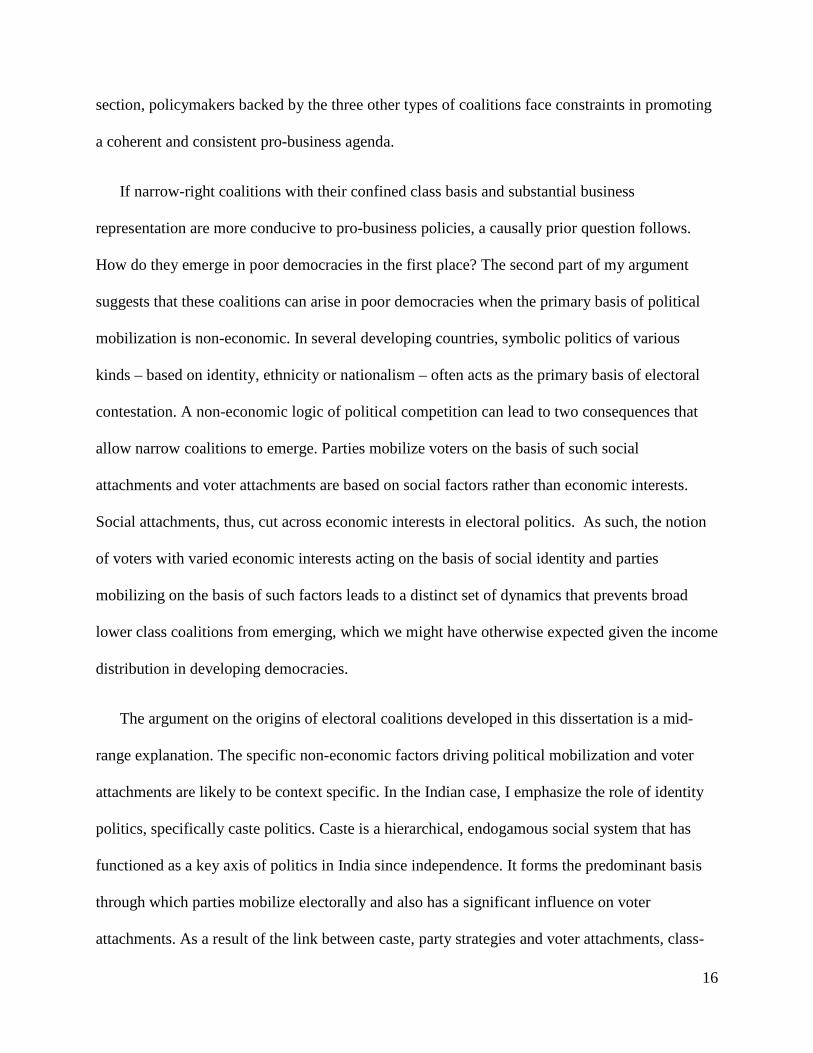
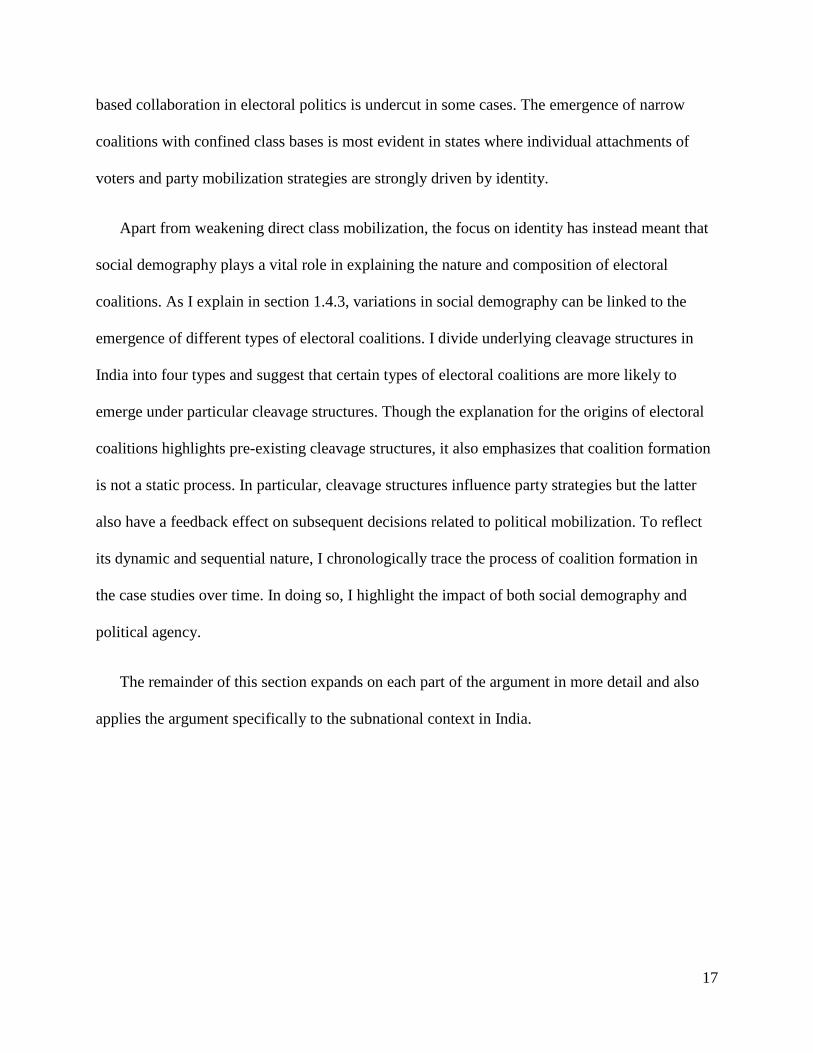
next two sections but I first provide a brief overview of the argument here. Figures 1.3 and 1.4
provide a schematic representation of the argument.
I begin by suggesting that, at a proximate level, state activism in relation to investment
promotion is dependent on the nature of electoral coalitions, the social base of voters, backing
15
governments. Typically, policymakers in units competing for mobile capital face two sets of
incentives – pressures to undertake business-friendly policies and demands arising from the
electorate that are often more redistributive. In developing countries, where decisions involve the
use of limited resources or growth has not been inclusive, the two sets of pressures tend to be at
odds with one another. In turn, the class profile of core voters who comprise electoral coalitions
determine what goals governments prioritize and how they balance multiple aims in the context
of limited resources. As a result, certain configurations of electoral coalitions are more
conducive to pro-business policies than others.
Based on two dimensions – similarity of socioeconomic profile of core groups and the
incorporation of business interests – coalitions are conceptualized as four types, narrow-right,
narrow-left, wide-right and wide-left. I argue that states that have been more proactive and
investor-friendly are backed by narrow-right electoral coalitions. Core groups of voters share a
similar economically-advanced profile and business groups are also substantially incorporated in
this type of coalition. The joint presence of these factors has two consequences. First, the class
profile of the core groups allows policymakers to prioritize pro-business goals. There tends to be
a coincidence between the interests of the core groups in narrow-right coalitions and the
imperatives of the state to attract investment. The economically-advanced nature of core groups
has meant that redistributive pressures exerted by narrow-right coalitions on policymakers are
more muted than those arising from other types of coalitions. Second, the confined class profile
of core groups also leads to fewer contradictory incentives for policymakers backed by narrow-
right coalitions. As a result, states backed by narrow-right coalitions can prioritize investor-
friendly policies in a consistent and coherent fashion. In contrast, as pointed out in the next
16
section, policymakers backed by the three other types of coalitions face constraints in promoting
a coherent and consistent pro-business agenda.
If narrow-right coalitions with their confined class basis and substantial business
representation are more conducive to pro-business policies, a causally prior question follows.
How do they emerge in poor democracies in the first place? The second part of my argument
suggests that these coalitions can arise in poor democracies when the primary basis of political
mobilization is non-economic. In several developing countries, symbolic politics of various
kinds – based on identity, ethnicity or nationalism – often acts as the primary basis of electoral
contestation. A non-economic logic of political competition can lead to two consequences that
allow narrow coalitions to emerge. Parties mobilize voters on the basis of such social
attachments and voter attachments are based on social factors rather than economic interests.
Social attachments, thus, cut across economic interests in electoral politics. As such, the notion
of voters with varied economic interests acting on the basis of social identity and parties
mobilizing on the basis of such factors leads to a distinct set of dynamics that prevents broad
lower class coalitions from emerging, which we might have otherwise expected given the income
distribution in developing democracies.
The argument on the origins of electoral coalitions developed in this dissertation is a mid-
range explanation. The specific non-economic factors driving political mobilization and voter
attachments are likely to be context specific. In the Indian case, I emphasize the role of identity
politics, specifically caste politics. Caste is a hierarchical, endogamous social system that has
functioned as a key axis of politics in India since independence. It forms the predominant basis
through which parties mobilize electorally and also has a significant influence on voter
attachments. As a result of the link between caste, party strategies and voter attachments, class-
17
based collaboration in electoral politics is undercut in some cases. The emergence of narrow
coalitions with confined class bases is most evident in states where individual attachments of
voters and party mobilization strategies are strongly driven by identity.
Apart from weakening direct class mobilization, the focus on identity has instead meant that
social demography plays a vital role in explaining the nature and composition of electoral
coalitions. As I explain in section 1.4.3, variations in social demography can be linked to the
emergence of different types of electoral coalitions. I divide underlying cleavage structures in
India into four types and suggest that certain types of electoral coalitions are more likely to
emerge under particular cleavage structures. Though the explanation for the origins of electoral
coalitions highlights pre-existing cleavage structures, it also emphasizes that coalition formation
is not a static process. In particular, cleavage structures influence party strategies but the latter
also have a feedback effect on subsequent decisions related to political mobilization. To reflect
its dynamic and sequential nature, I chronologically trace the process of coalition formation in
the case studies over time. In doing so, I highlight the impact of both social demography and
political agency.
The remainder of this section expands on each part of the argument in more detail and also
applies the argument specifically to the subnational context in India.
18
Figure 1.3: An overview of the argument
Figure 1.4: Applying the argument across Indian states
19
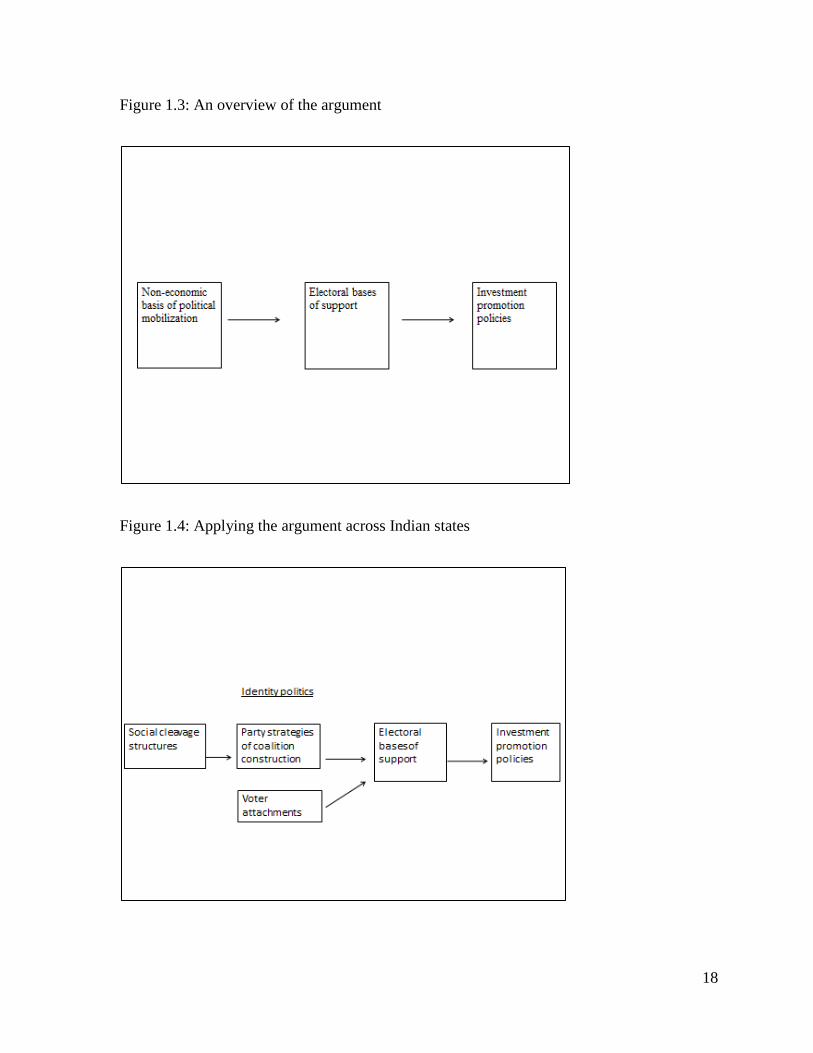
1.4.2. From electoral coalitions to investment policies
At a proximate level, the argument laid out in this dissertation suggests that certain
configurations of electoral coalitions are more likely to be conducive to the formulation and
implementation of an investor-friendly agenda than others. In particular, narrow-right electoral
coalitions, characterized by the joint presence of similar economically-advanced core groups as
well as substantial representation of business, are most likely to support a policy environment
favorable to capital. By core voters, I refer to those who have a strong preference or attachment
for a particular party and on whom the party depends significantly for its support. In advanced
democracies, the grounds for such attachment are typically partisan or programmatic. In
developing democracies, other considerations such as identity often form the basis for such
predisposition to a particular party.
Based on the similarity of socio-economic profiles of core groups and the extent of
business incorporation, electoral coalitions can be classified into four ideal types – narrow-right,
narrow-left, wide-left and wide-right. The classification can be represented as a 2 x 2 (figure
1.5). Core groups can range from poor to economically-advanced and the first dimension tries to
capture the extent to which these sections are similar in terms of their socioeconomic standing. In
other words, this dimension assesses whether class bases of core voters are confined or diverse.
The second dimension focuses on the level of business representation in coalitions, which can
range from minimal to substantial. The category of business is assumed to include capitalists
controlling large-scale industry as well as small entrepreneurs in the formal sector.
The core groups of narrow-right coalitions share a confined economically-advanced
profile. Such coalitions also incorporate business interests substantially. Narrow-left coalitions

20
consist of similarly placed poor groups and there is minimal incorporation of business interests.
Finally, both types of wide coalitions consist of mixture of poor and wealthy groups. However,
business incorporation is minimal in wide-left coalitions and more significant in wide-right ones.
For a coalition to be classified as narrow-right, both factors (similarity of socio-economic
profile of core groups and substantial incorporation of business) must be jointly present. Neither
is individually sufficient. For example, a coalition of extremes with substantial business presence
on one end and poor agricultural workers on the other, which would be classified as wide-right,
is likely to place conflicting pressures on politicians. On the other hand, a coalition consisting of
similarly placed poor groups may have congruent interests but these are likely to be purely
redistributive and not supportive of a pro-business policy regime.
Figure 1.5: The classification of coalitions
21
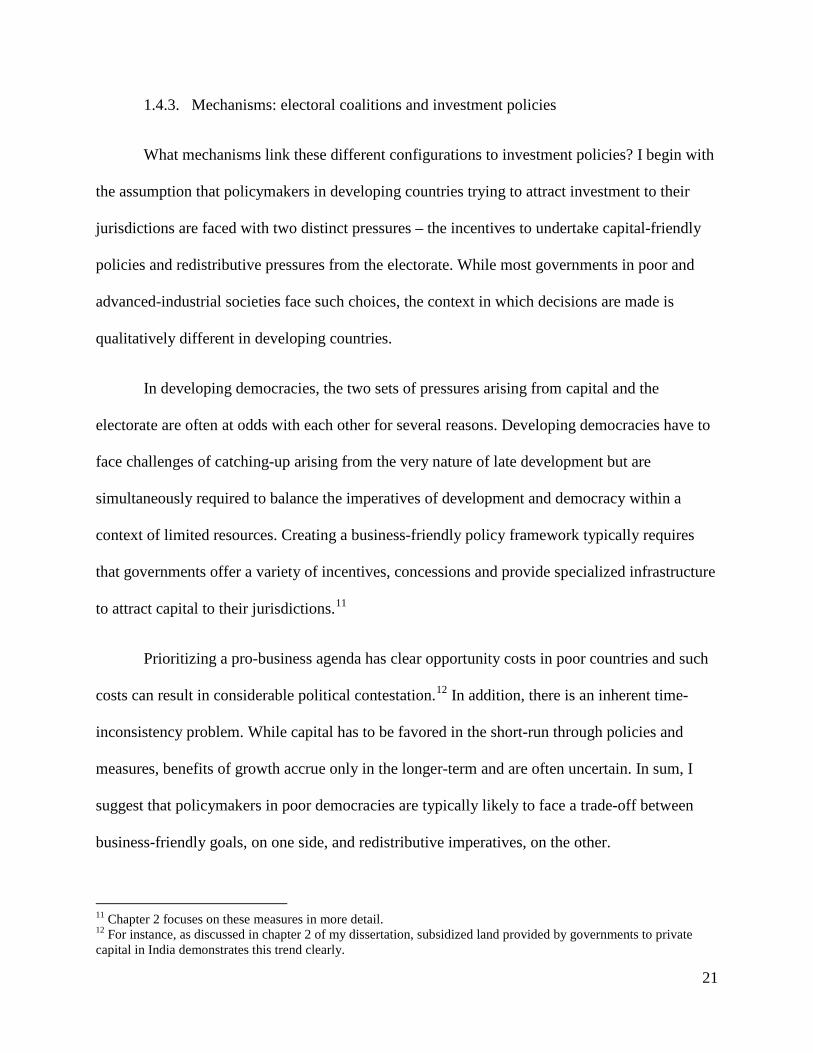
1.4.3. Mechanisms: electoral coalitions and investment policies
What mechanisms link these different configurations to investment policies? I begin with
the assumption that policymakers in developing countries trying to attract investment to their
jurisdictions are faced with two distinct pressures – the incentives to undertake capital-friendly
policies and redistributive pressures from the electorate. While most governments in poor and
advanced-industrial societies face such choices, the context in which decisions are made is
qualitatively different in developing countries.
In developing democracies, the two sets of pressures arising from capital and the
electorate are often at odds with each other for several reasons. Developing democracies have to
face challenges of catching-up arising from the very nature of late development but are
simultaneously required to balance the imperatives of development and democracy within a
context of limited resources. Creating a business-friendly policy framework typically requires
that governments offer a variety of incentives, concessions and provide specialized infrastructure
to attract capital to their jurisdictions.11
Prioritizing a pro-business agenda has clear opportunity costs in poor countries and such
costs can result in considerable political contestation.12 In addition, there is an inherent time-
inconsistency problem. While capital has to be favored in the short-run through policies and
measures, benefits of growth accrue only in the longer-term and are often uncertain. In sum, I
suggest that policymakers in poor democracies are typically likely to face a trade-off between
business-friendly goals, on one side, and redistributive imperatives, on the other.
11 Chapter 2 focuses on these measures in more detail. 12 For instance, as discussed in chapter 2 of my dissertation, subsidized land provided by governments to private capital in India demonstrates this trend clearly.
22
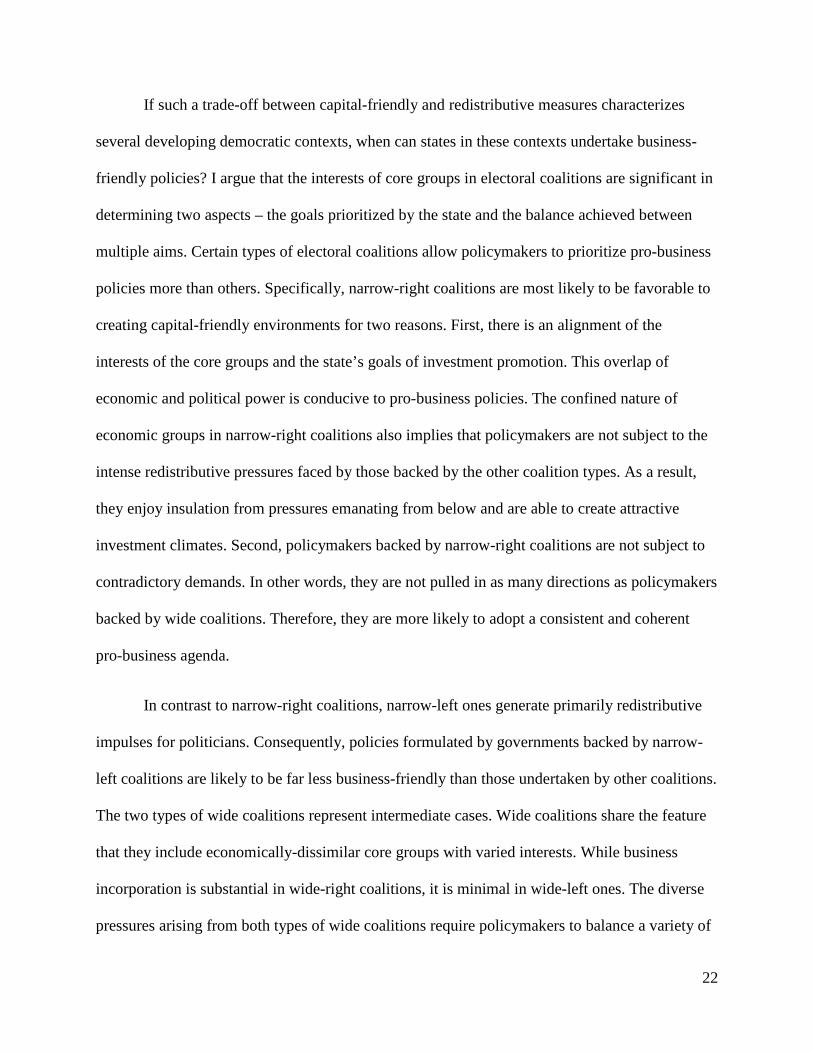
If such a trade-off between capital-friendly and redistributive measures characterizes
several developing democratic contexts, when can states in these contexts undertake business-
friendly policies? I argue that the interests of core groups in electoral coalitions are significant in
determining two aspects – the goals prioritized by the state and the balance achieved between
multiple aims. Certain types of electoral coalitions allow policymakers to prioritize pro-business
policies more than others. Specifically, narrow-right coalitions are most likely to be favorable to
creating capital-friendly environments for two reasons. First, there is an alignment of the
interests of the core groups and the state’s goals of investment promotion. This overlap of
economic and political power is conducive to pro-business policies. The confined nature of
economic groups in narrow-right coalitions also implies that policymakers are not subject to the
intense redistributive pressures faced by those backed by the other coalition types. As a result,
they enjoy insulation from pressures emanating from below and are able to create attractive
investment climates. Second, policymakers backed by narrow-right coalitions are not subject to
contradictory demands. In other words, they are not pulled in as many directions as policymakers
backed by wide coalitions. Therefore, they are more likely to adopt a consistent and coherent
pro-business agenda.
In contrast to narrow-right coalitions, narrow-left ones generate primarily redistributive
impulses for politicians. Consequently, policies formulated by governments backed by narrow-
left coalitions are likely to be far less business-friendly than those undertaken by other coalitions.
The two types of wide coalitions represent intermediate cases. Wide coalitions share the feature
that they include economically-dissimilar core groups with varied interests. While business
incorporation is substantial in wide-right coalitions, it is minimal in wide-left ones. The diverse
pressures arising from both types of wide coalitions require policymakers to balance a variety of

23
contrasting goals simultaneously and they are unlikely to prioritize growth-related policies to the
extent that those backed by narrow-right coalitions can. These coalitions are also not driven by
purely distributive motives as is the case with narrow-left coalitions. The record of governments
supported by wide coalitions on growth-related outcomes tends to be mixed, though wide-right
coalitions are more likely to be conducive to pro-business policies than wide-left ones.
1.4.4. The social origins of electoral coalitions
Narrow-right coalitions reflect a close alignment of political and economic power. How
do such coalitions with a confined class basis emerge in the midst of poor electorates? Politicians
in poor democracies, like those in advanced industrial countries, seek to construct electorally-
successful coalitions. However, the logic of electoral competition and participation often differs
in developing countries and rests on non-economic factors such as identity, ethnicity or
nationalism rather than programmatic factors.13 This dynamic affects the choice of groups that
parties choose to mobilize for electoral purposes. It also conditions voter attachments and
motivations. When parties mobilize on non-economic factors and voters vote on the basis of such
factors, class-based electoral collaboration is impeded. I argue that this can allow the emergence
of narrow-right coalitions, even in the midst of poor electorates.
While non-economic modes of politics are prevalent in several developing countries,
context matters significantly in explaining the origins of electoral coalitions. The specific non-
13 One clarification is in order here. I treat the existence of politics based on non-economic factors such as identity or nationalism in developing democracies such as India as an empirical given. I do not attempt in the dissertation to address why politics follows a non-economic logic in the first place. Existing explanations throw light on this issue. Two different types of explanations exist for the prevalence of caste politics in India. Chandra (2004) offers a rational choice explanation and suggests that in patronage democracies, information constraints make it rational for voters to vote on the basis of caste and politicians to mobilize on the basis of caste. A more sociological explanation is offered by Kothari (1970b), who suggests that democracy in India was overlaid on a well-entrenched social structure of caste. Politicians found that caste was already embedded in social consciousness and, at the same time, was flexible enough to manipulate for electoral ends. As a result, it formed the main axis of political competition.
24
electoral modes and cleavage dimensions that are likely to affect political competition vary
across different settings. In the case of India, I focus on the role of identity politics, specifically,
caste politics and argue that such a dynamic has two related effects. I argue that such a focus has
heightened the importance of social demography in electoral coalition construction by political
parties. Specifically, I find that pre-existing social cleavage patterns determine the choice of
groups that parties seek to target electorally and, therefore, the nature and composition of
electoral coalitions. In focusing on the role of social cleavages in conditioning political
competition, I follow a long literature in political science. Beginning with the classic work of
Lipset and Rokkan (1967), the impact of social cleavages in influencing political competition,
especially the nature of party systems, has been highlighted. In the case of Indian states, the
targeting of groups on the basis of identity by parties is complemented from below by the
influence of social attachments on voter behavior. These two complementary trends can result in
coalitions that are not representative of the broader class profile of the electorate.
The sub-section below applies the two-stage explanation to Indian states. An illustration
of how the explanation works across Indian states may make the general framework above
clearer.
1.4.5. Applying the argument to Indian states
The trade-off between capital-friendly and redistributive measures is particularly evident
in India. Growth since 1991 has not been inclusive, employment generation has been weak and
benefits have not been equally distributed. Despite its recent growth success, India remains a
largely poor and rural country.14 Moreover, the unorganized sector accounts for 92 per cent of
14 According to the 2001 Census, over 72 per cent of the Indian population lived in rural areas.

25
the total workforce and over 65 per cent of this group are engaged in agriculture (Sengupta
2007). There is a marked disconnect between the country’s occupation structure and India’s
growth patterns. For a developing country, the composition of India’s GDP is idiosyncratic.
Services accounted for almost 65 per cent of the country’s GDP in 2009-10 while agriculture and
allied services accounted for 14.6 per cent.15 Economic growth in in the post-1991 period has
also been driven by capital-intensive industries and the service sector (e.g., Kochhar et al. 2006b;
Subramanian 2008). Employment generation in the organized sector has also been extremely
poor (for e.g., Anant et al. 2006; Nagaraj 2006). In such a context, various governments have
also chosen to offer a plethora of concessions including subsidized land, inputs and tax breaks to
industry. Not surprisingly, privileging industry under these conditions has led to considerable
political contestation.
Within this larger context though, some subnational governments have managed to
prioritize investor-friendly policies in a consistent and coherent fashion. As the case studies in
the dissertation show, Gujarat has consistently adopted a pro-business agenda in the post-
liberalization period. Similarly, Andhra Pradesh (AP) has, in certain periods, been aggressive in
attempting to attract investors. In contrast, Punjab has been consistently apathetic to the
competition for investment. Like AP, Bihar exhibits temporal variation in policy performance.
For most of the post-reforms period, it undertook no development initiatives of note. Since 2005,
the state’s policy framework has undergone a sea change and a variety of policies have attempted
to bring industry to Bihar.
As chapters 3 and 4 lay out, I associate these policy differences to the nature of electoral
coalitions backing governments in these states. Narrow-right coalitions in Gujarat can be linked
15 Calculated from RBI (2010b), Table 3: Components of Gross Domestic Product (At Factor Cost)

26
to the state’s superior performance in the competition for investment while wide-right coalitions
explain Punjab’s sluggish response. In addition, I argue that the shifts between narrow-right and
wide-right coalitions in AP and narrow-left and wide-left ones in Bihar explain the temporal
policy shifts in these states.
What explains the emergence of narrow-right coalitions in states such as Gujarat and AP?
I offer a social origins explanation for the emergence of electoral coalitions in India. Like many
other poor democracies, the logic of electoral politics in India has largely revolved around social
identity. In particular, caste has played a major role in Indian politics since independence. This
has been particularly true at the state-level (Chhibber 1999; Jaffrelot 2009b). There are a variety
of avenues through which caste plays a prominent role in Indian politics – voters are primarily
mobilized on the basis of caste, it plays a crucial role in candidate selection and poll promises
often target specific caste groups. Several ethnic parties also exist at the regional level to
represent interests of one or more specific castes (Chandra 2004). Chhibber and Petrocik (1989)
show that even at the height of its national dominance, the Congress had very distinct caste bases
across states.
Some scholars point to the clear and active use of social demography in the strategic
calculations of political parties. In describing the use of caste surveys for electoral purposes by
the Janata Dal in Karnataka in the mid-1990s, Gould suggests: “since caste has been a
fundamental ingredient of political maneuvering in grass roots political arenas since modern
Indian politics began, the decision of the Janata Dal leadership to employ scientific techniques to
refine the process of identifying its ethnic nuances is perfectly understandable, and undoubtedly
will be increasingly undertaken by all political groups in future elections. In principle, there is
27
nothing new about this. The UP Congress, the pioneers of caste manipulation, attempted a crude
version of objectification as early as the second general election in 1957” (1997: 2338).
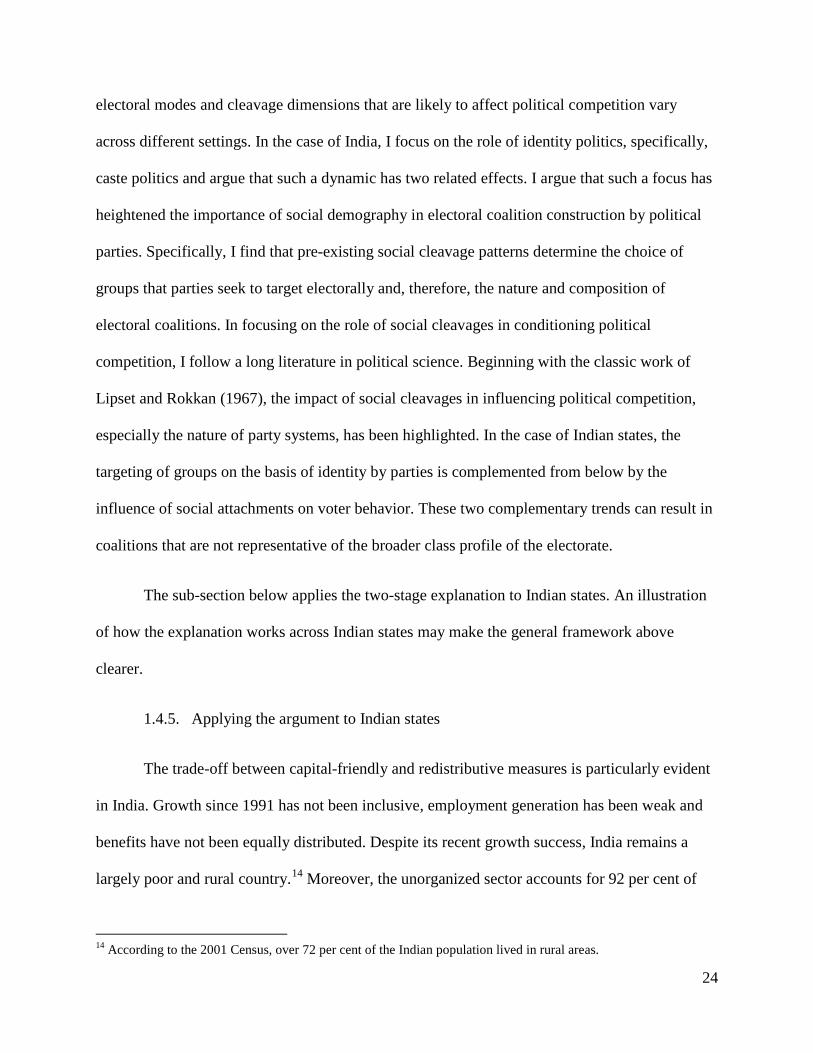
I highlight two avenues through which caste plays a key role – on party strategies and voter
behavior. While caste remains the primary mode and idiom of political mobilization in India,
caste cleavages tend to be localized and territorially contained within state boundaries (e.g.,
Brass 1990; Chhibber and Petrocik 1989; Chhibber 1999; Frankel 1989b; Kothari 1970b; Yadav
1999, 2004). As Yadav suggests, “there is very little that is common to all states in terms of
patterns of social cleavages activated by politics. Not only are specific combinations unique to
each state due to its social demography, but the nature of cleavage varies from state to state”
(1999: 2398). Placing emphasis on these varied subnational social environments, I focus on two
dimensions – numerical size of social groups and economic resource control – and suggest that
social cleavages within Indian states can be divided into four basic patterns (described in the next
sub-section). 16 As such, I argue that the variations in social demography have affected the
nature and composition of electoral bases of support. Importantly, narrow-right coalitions have
occurred in those cases where numerical size has coincided with economic resource control.
These patterns have led to different modes of competition and divergent part strategies of
political mobilization. The targeting of social groups by political parties in some states has been
complemented from below by voter attachments. In some states, identity politics has a strong
influence on voter decisions (Brass 1990; Shah 2004; Yadav 1999). This strengthens party
strategies to target groups on the basis of caste. Figure 1.6 thematically traces the origins of
narrow-right coalitions.
16 I borrowed the idea of a four-fold caste structure from Atul Kohli. For details on regional patterns of caste, I drew substantially on Frankel and Rao(1989), Kothari (1970b), Jaffrelot (2003) , Shah (2004) and Srinivas (1994).

28
I detail the basic cleavage patterns and their influence on party strategies in the next
section. These links are further explained for each case study in chapters 3 and 4.
1.4.5.1. Four cleavage patterns across Indian states
The first dimension of social cleavages that matters for coalition construction is group
size. Group size influences party strategies in that it determines whether parties can rely on a few
groups to construct electoral majorities or have to depend on a more diverse base. Both Posner
(2004) and Chandra (2004) point to the effect of group size on political competition. As Chandra
suggests, large social groups that can be collectively mobilized have been electorally efficacious
across institutional contexts. This has been particularly true in first-past-the-post (FPTP) systems
such as India’s, where the presence of large groups opens the possibility that parties will depend
disproportionately on such sections to construct electoral majorities. Conversely, where groups
are small, parties have incentives to employ a more catch-all strategy. This ability of parties to
rely on a few specific groups is strongly reinforced by the fact that voter attachments occur on
the basis of social identity.
While group size influences the likelihood of parties relying on confined or diverse
electoral bases, the inclusion of business interests is linked to a second dimension – the nature of
resource control embodied by certain social cleavages. In several developing countries, business
interests tend to be concentrated within specific social and ethnic groups (e.g., Fafchamps 2000).
Other scholars have highlighted historical examples of the dominance of certain ethnic groups
over commerce (e.g., Greif 1993). In particular, in ranked or other hierarchical social institutions,
there is often a relationship between social and economic status.
29
In India, certain groups have historically enjoyed access to resources, either capital or
land, by virtue of their position in the social hierarchy. Access to resources, in turn, has resulted
in those groups forming the main business sections in particular states. The association between
ethnicity and capital is particularly evident in the fact that the social origins of entrepreneurship
in India can be divided into two major strands. Entrepreneurs in the first and older strand have
typically emerged from traditional merchant and trading communities within the social system.
This includes groups such as Banias, Marwaris, Parsis, Chettiars, Gounders, Khatris, Aroras,
Sindhis, Khojas and a variety of other regional variants (Damodaran 2008; Tripathi and Jumani
2007). Most of these groups occupied the position of merchants and traders within the traditional
social hierarchy. As a result, they enjoyed access to capital and business networks and emerged
as the country’s earliest industrialists.
A second, more recent, strand of entrepreneurs in India has arisen from certain
landowning castes, that have moved from commercial agriculture to industry (e.g., Baru 2000;
Damodaran 2008; Sinha 2005). This shift has been particularly true of “dominant castes” such as
the Patidars in Gujarat and the Kammas and Reddys in Andhra Pradesh. The groups that form
the bulk of capitalists in the country have, thus, historically enjoyed control over economic
resources, whether capital in the case of the trading communities or land in the case of the
dominant castes. This access to resources arose as a result of the location of these groups within
social hierarchy, creating a significant link between caste and capital.
Based on the two dimensions of group size and resource control, I divide pre-existing
cleavage structures into four patterns. The first pattern includes states with “dominant caste”
patterns; a well-known concept in Indian sociology developed by Srinivas (1959). In these states,
certain castes, typically non-Brahmin, share two features – they are numerically preponderant
30
relative to other castes and enjoy considerable economic power arising of out of landownership.
Typically, dominant caste states include two or more rival groups. States such as Gujarat,
Andhra Pradesh, Karnataka and Maharashtra tend to follow this pattern. In Gujarat and Andhra
Pradesh, the traditional access to land of dominant castes enabled the transfer of surpluses from
commercial agriculture into industry. As a result, these groups came to form a major part of the
entrepreneurial base in those states.
The second pattern, which is found mostly in the populous Hindi-heartland states of the
north, is one where the caste system conforms to the traditional four varna structure.17 These
states have representation of castes (jatis) from all four varnas; lower castes form the vast
majority of the population but upper castes dominated all aspects of social and political life until
the 1990s. Importantly, certain large castes exist such as the Yadavs in Bihar (nearly 12 per cent
of Bihar’s population) and the Jats in UP. Unlike dominant caste states, these large castes did not
control economic resources and were socially marginalized. The entrepreneurial base in these
states is thin and the few producer groups that exist are small in size. One other aspect of the
cleavage structure in the Hindi-heartland has been emphasized by authors such as Jaffrelot
(2003, 2009b). Upper castes form a greater proportion of the population in these states than in
other parts of India.
The third variation, which is referred to in this dissertation as the southern pattern, exists
in states such as Tamil Nadu and Kerala. The structure under the southern pattern has some
similarities to the traditional varna structure found in the Hindi-heartland in that upper castes
17 At the most basic level, the caste system can be conceived of a four-fold ritual hierarchy. The four main macro-groupings or varnas are the Brahmins, Kshatriyas, Vaishyas and Shudras. Outside these four broad groupings of the caste system are the Dalits or scheduled castes, who are considered to be at the bottom of the pyramid in terms of ritual status. Within these varnas lie a multitude of horizontal or segmental categories known as jatis. As scholars have pointed out, the actual political operationalization of caste tends to be as jati (e.g., Brass 1990; Chhibber 1999; Kothari 1970b; Yadav 1999). Jatis are largely localized.
31
were historically powerful, both politically and socially. However, most castes tend to be small
and none is numerically preponderant. The apex of the structure tends to be much narrower with
upper castes forming a much smaller proportion of the population than their counterparts in the
Hindi-heartland, facilitating the emergence of lower caste social movements in the south even in
the colonial era (Jaffrelot 2003). Moreover, the southern pattern includes a more notable
entrepreneurial base than the Hindi-heartland configuration. A variety of landowning groups,
smaller merchant castes and some upper castes came to form an entrepreneurial base but these
capitalist groups tend to be small and fragmented by caste. Thus, entrepreneurial groups exist
but, in contrast to the dominant caste pattern, these groups are numerically weak.
Finally, there is a fourth group of states such as Punjab and West Bengal where other
dimensions such as religion have acted in conjunction with caste (Kohli 1989). The cross-cutting
nature of cleavage patterns in these states has resulted in politically-relevant social groups being
small size. As in the southern pattern, entrepreneurial groups exist and are small. The cross-
cutting nature of cleavages and small group size implies that parties cannot rely
disproportionately on a single social group to create electoral majorities.
1.4.5.2. From cleavage patterns to coalition types in India
These different patterns with their attendant mix of numerical size and resource control of
social groups have affected party competition and coalition formation in dissimilar ways. Under
India’s simple plurality system, large social groups have enjoyed considerable electoral salience
and parties have been able to rely on a confined base of support where such sections are present.
In short, narrow coalitions tend to occur where numerically sizeable sections are present. This
has been the case in dominant caste states such as Gujarat and Andhra Pradesh or Hindi-

32
heartland states such as Bihar. 18 In such states, certain parties have been able to rely on the
support of relatively few large groups to construct winning electoral coalitions. The construction
of successful narrow coalitions in dominant caste states is predicated on the fact that voter
attachments amongst large caste groups have been strongly driven by social factors. In particular,
the ability of parties to win with narrow coalitions in dominant caste states has been supported by
a high degree of correlation in the vote choice of individuals within large caste blocs in these
regions.
Wide coalitions, in contrast, have been constructed in states where numerous small
groups exist but no group is large enough to dominate electorally. Wide coalitions have typically
occurred under the southern and cross-cutting patterns in states such as Tamil Nadu, Kerala,
West Bengal and Punjab. In such circumstances, parties have had to rely on a relatively diverse
base of voters. The effect of identity on vote choice under these cleavage patterns also tends to
be weaker; votes within a specific social group are typically more dispersed across party lines
than dominant caste states.
If group size has driven how narrow or wide coalitions have been, the extent of business
representation has been determined by the caste-capital link, which remains significant in India.
Certain social groups are disproportionately represented in business by virtue of resource control
embodied in certain cleavage structures in Indian states. Though the caste-capital association
exists under all four cleavage patterns described earlier, the numerical strength of business
groups varies under different cleavage structures and results in dissimilar levels of political
leverage for capital across Indian states. If groups that control economic resources are also
18 Narrow coalitions are not necessarily comprised of a single caste. In most cases, no single caste can provide sufficient electoral support and multi-caste coalitions are a necessity (Chhibber 1999). However, multi-caste coalitions in India do not always include a large number of groups.
33
numerically sizeable, this allows parties in poor democracies to construct electoral majorities
around these economically-advanced sections. It is only under dominant caste structures that the
two factors of size and resource control coincide. As a result, the political leverage of business
groups has been significant under dominant caste patterns and narrow-right coalitions have been
more likely to emerge under these structures.
A robust base of capital also exists under the southern Indian and cross-cutting cleavage
patterns. However, producer groups in these cleavage patterns are small. The lack of numerical
strength of single caste groups has meant that parties have resorted to catch-all strategies and
targeted diverse bases of support to construct winning electoral coalitions. As a result, wide-right
coalitions have arisen in these states. The core vote base of these wide-right coalitions includes
business representation but also a variety of other groups with varied class profiles. Finally, the
Hindi-heartland, over the last two decades, has seen configurations that are on the opposite end
of the spectrum from narrow-right coalitions. Large caste groups exist in these states but these
groups are also the most economically-marginalized sections of society. As a result, narrow-left
coalitions have been more likely to arise in these states and the potential to create business-
friendly coalitions has been limited. Figure 1.6, 1.7 and 1.8 thematically trace the origins of each
of the four coalition types.
The ability of narrow-right coalitions to win elections has been assisted by the nature of
India’s competitive FPTP system, where parties have formed governments with a plurality of
vote. The vote share required to form governments at the state level in in India in the last two
decades has typically fluctuated between 35 and 40 per cent. In states where electoral
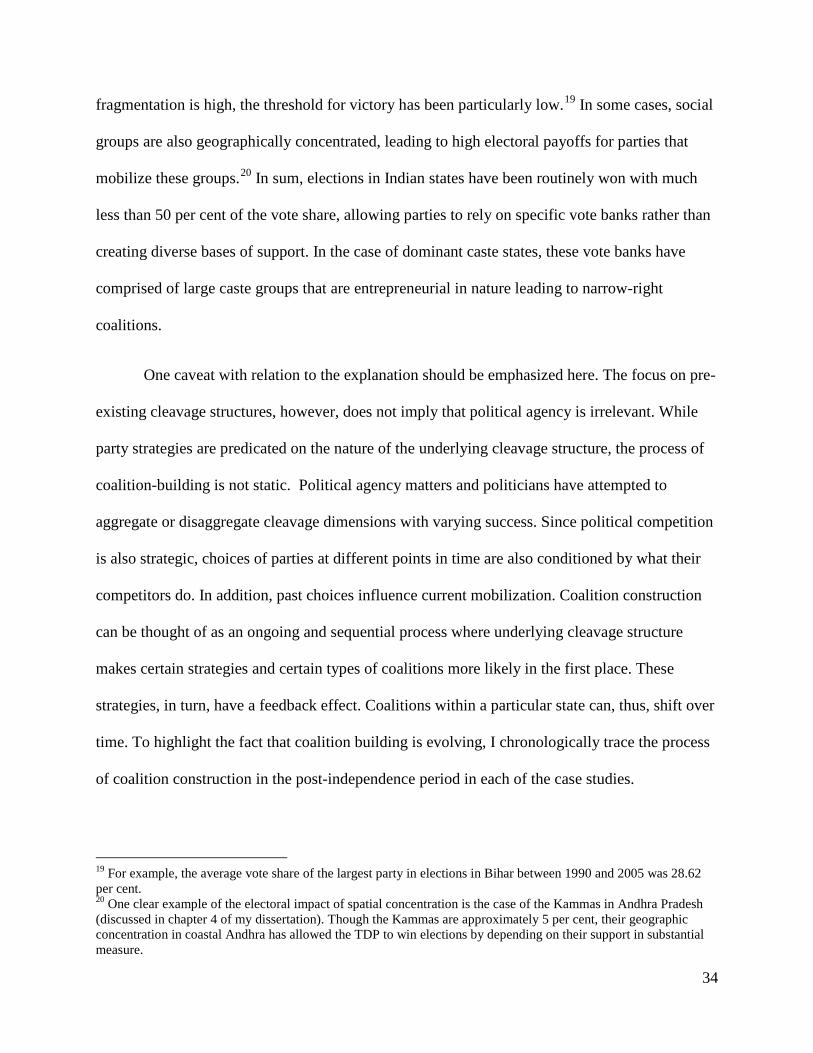
34
fragmentation is high, the threshold for victory has been particularly low.19 In some cases, social
groups are also geographically concentrated, leading to high electoral payoffs for parties that
mobilize these groups.20 In sum, elections in Indian states have been routinely won with much
less than 50 per cent of the vote share, allowing parties to rely on specific vote banks rather than
creating diverse bases of support. In the case of dominant caste states, these vote banks have
comprised of large caste groups that are entrepreneurial in nature leading to narrow-right
coalitions.
One caveat with relation to the explanation should be emphasized here. The focus on pre-
existing cleavage structures, however, does not imply that political agency is irrelevant. While
party strategies are predicated on the nature of the underlying cleavage structure, the process of
coalition-building is not static. Political agency matters and politicians have attempted to
aggregate or disaggregate cleavage dimensions with varying success. Since political competition
is also strategic, choices of parties at different points in time are also conditioned by what their
competitors do. In addition, past choices influence current mobilization. Coalition construction
can be thought of as an ongoing and sequential process where underlying cleavage structure
makes certain strategies and certain types of coalitions more likely in the first place. These
strategies, in turn, have a feedback effect. Coalitions within a particular state can, thus, shift over
time. To highlight the fact that coalition building is evolving, I chronologically trace the process
of coalition construction in the post-independence period in each of the case studies.
19 For example, the average vote share of the largest party in elections in Bihar between 1990 and 2005 was 28.62 per cent. 20 One clear example of the electoral impact of spatial concentration is the case of the Kammas in Andhra Pradesh (discussed in chapter 4 of my dissertation). Though the Kammas are approximately 5 per cent, their geographic concentration in coastal Andhra has allowed the TDP to win elections by depending on their support in substantial measure.

35
Figure 1.6: Tracing the emergence and influence of narrow-right coalitions
Figure 1.7: Tracing the emergence and influence of narrow-left coalitions
36
Figure 1.8: Tracing the emergence and influence of wide-right and wide-left coalitions
1.5 Additional and alternative explanations
The argument advanced above differs from a variety of existing explanations on the politics of
policymaking, economic growth and public goods provision. Studies in these areas offer
additional hypotheses and insights that are relevant to an analysis of varied policy responses in
the competition for investment. In the section below, I evaluate the relevance of each of these
theories in explaining patterns of investment in the Indian case and juxtapose my argument
against them. In doing so, I try to assess the explanatory power of my argument against other. In
addition to outlining other arguments here, I also test for a variety of alternative and additional
explanations in the quantitative analysis in chapter 5.
The existing scholarship relevant to this dissertation can be divided into two broad categories
– studies pertaining specifically to investment outcomes and those on the politics of
37
policymaking, growth and public goods, which offer insights at a more general level. Each of
these sets of explanations is examined below.
1.5.1 Explanations specific to a study of investment
1.5.1.1 Neoclassical economics, economic geography and expectations on patterns of
investment
Theories arising out of neoclassical economics and economic geography focus on the role
of socioeconomic determinants in explaining investment location. Though the focus of these
explanations is not on policies but investment location itself, they are relevant to this dissertation.
Neoclassical growth theories such as the Solow model suggest that economies with lower capital
per worker tend to have higher rates of return. As a result, capital is expected to flow from
capital-rich to capital-scarce areas (e.g., Barro and Sala-i-Martin 2004). Empirical challenges to
this view led scholars to include additional factors such as human capital to standard neoclassical
models as well as variables such as political instability, regime type, property rights and
constitutional checks and balances (e.g., Alesina and Perotti 1996; Barro 1991, 1996, 1997;
Lucas 1990; Stasavage 2002).
In contrast to neoclassical theories, the economic geography literature suggests that
geographical concentration of economic activity, more generally, and firm location, more
specifically, tends to occur because there are factors that can lead to increasing returns to scale
for individual firms and result in agglomeration economies (e.g., Krugman 1991, 1998).
Krugman (1998) suggests that there are a set of centripetal factors that promote geographical
concentration such as market size, thick labor markets and information spillovers but also a set of
centrifugal forces such as land, natural resources and pollution that oppose agglomeration.
38
Both sets of theories emphasize the role of socioeconomic variables in affecting
investment location. Despite the expectations of these theories, socioeconomic determinants do
not provide a complete explanation for subnational patterns of investment observed in India after
economic liberalization. Figure 1.9 plots actual values of cumulative investment from 1991-2008
against values of investment that are predicted by initial socioeconomic conditions in 1991,
specifically per capita income (as a proxy for level of economic development), state domestic
product (as a proxy for market size), literacy (as a proxy for human capital) and road density (as
a proxy for infrastructure). As figure 1.9 shows, several states lie above and below the line.
[Figure 1.9 here]
The fact that investment patterns do not fit expectations from neoclassical economics and
economic geography and some states lie off the line is informative in itself. A bald focus on
socioeconomic determinants does not provide a complete story and other factors matter. As
Rudolph and Rudolph suggest, since 1991, “whether they [state governments] do well or badly
economically depends on what they do for themselves. States can act in ways that transform their
initial economic situation; agency can modify structure” (2001: 1541). As this dissertation
suggests policies have varied across states and, in turn, it lays the emphasis squarely on the role
of politics in explaining policy differences.
1.5.1.2 The political economy of foreign direct investment
Unlike theories from economics, a variety of political variables have been central to studies
in international political economy (IPE) on the patterns of foreign direct investment. Political
variables highlighted in the IPE literature include regime type (e.g., Jensen 2003, 2006; Feng
2001), various types of political institutions (e.g., Henisz 2000, 2002; Knack and Keefer 1995;

39
Stasavage 2002), political uncertainty (e.g., Brunetti et al. 1998) and participation in
international trade agreements and preferential trade agreements (e.g., Büthe and Milner 2008).
Despite the focus on political factors, which is more in line with this dissertation, varied
subnational policy responses in India pose a puzzle for these theories as well. The subnational
research design employed in this dissertation automatically controls for several political and
institutional factors such as regime type, property rights, participation in trade agreements,
electoral rules and formal constitutional checks and balances. As such it is not clear what type of
institutions and what sources of political instability affect investment policies in a subnational
context. The larger aim of this dissertation is to explore these factors.
1.5.2 Politics of policy and public goods
While existing literature on investment outcomes is broadly relevant, it does not offer direct
analytical leverage in explaining the central empirical puzzle examined – policy variation across
Indian states in the competition for investment. It is therefore worthwhile turning to studies of
the politics of policymaking and economic growth, which offer more general hypotheses on
policymaking. Explanations privileging political leadership, colonial inheritance, partisan
preferences and ideology, political competition and ethnic diversity offer pertinent insights to a
study of investment policies and are discussed below.
1.5.2.1 Leadership
When asked about the strengths and weaknesses of investing in particular states,
businesspersons and other informed sources often cited political leadership as a defining feature.
Chief ministers such as Narendra Modi in Gujarat, Chandrababu Naidu in AP, S.M. Krishna in
Karnataka and Nitish Kumar in Bihar have been celebrated in the media at various times as being
responsible for economic transformations in their states. This sole focus on individual agency is
40
not restricted to journalists alone. Rudolph and Rudolph (2001) too highlight the role of reform-
friendly chief ministers as one of the key features of India’s post-1991 ‘federal market
economy’. In describing the efforts of India’s reform-friendly chief ministers, they suggest:
“From Dallas to Davos, he [Andhra Pradesh chief minister, Chandrababu Naidu] promoted his
ambitious plans to transform Andhra Pradesh from a middle rank into a top rank state…Earlier,
counter-intuitively, it had been Jyoti Basu, the long serving Communist chief minister of Bengal,
who took the lead in aggressively wooing job and revenue-generating capital. By mid-2000, it
was S.M. Krishna, Karnataka’s Congress chief minister, who appeared to be showing India its
economic future” (2001: 1542).
To be certain, political leadership matters. But leadership cannot be examined in a vacuum
nor can it be treated as an exogenous variable. In particular, I suggest that leaders need to be
viewed as an intermediate part of the chain that links coalitions to policies. Arguments that treat
leadership as an exogenous factor neglect the question of where and how preferences and
constraints on individual leaders originate in the first place. In contrast, I argue that electoral
coalitions mold leadership preferences as well as constraints. As the case studies outline, the fact
that certain leaders have played a major role in creating a pro-business environment is reflective
of broader interests of the electoral coalition backing them as well as the space offered to them
by these coalitions to undertake investor-friendly policies. Policy agendas of leaders, therefore,
need to be viewed as a product of broader coalition interests and pressures and not as individual
predilections.
Empirically, strength and tenure of political leaders in India has neither been a necessary nor
sufficient condition in creating favorable investment climates in India. Leaders such as Mayawati
in Uttar Pradesh or Laloo Yadav in Bihar have enjoyed relatively long stints in power but their
41
policy agendas have lacked developmental focus. In contrast, Sinha (2004) points out that
Gujarat performed exceedingly well after 1991 despite having considerable instability at the top;
the state saw seven different chief ministers in the first decade after liberalization. As such, I try
to demonstrate in the case studies that leadership is best viewed as a mediating factor influenced
by the social base of voters and not as an exogenous variable.
1.5.2.2 Colonial inheritance
In contrast to political leadership, colonial inheritance is clearly an exogenous factor in
explaining economic policies. The role of colonialism in affecting patterns of economic
outcomes over time has been highlighted by a growing interdisciplinary literature (e.g.,
Acemoglu et al. 2001; Engerman and Sokoloff 2000; Kohli 2004; La Porta et al. 1999). In the
Indian case, studies have focused on two sets of colonial institutions as having a significant
impact on regional economic outcomes – nature of land tenure systems and direct vs. indirect
British rule. British India fell under one of three land tenure systems – zamindari, ryotwari and
mahalwari. Zamindari was a landlord-based system where intermediaries (zamindars) collected
revenue from peasants. Revenue settlement in the ryotwari system occurred directly between the
government and the cultivator. Finally, in a few parts of India, a village-based land tenure system
(mahalwari) existed. Banerjee and Iyer (2005) find that areas previously under the zamindari
system exhibit significantly lower levels of investments and productivity in agriculture as well as
inferior outcomes in health and education when compared with non-zamindari regions.
Others focus on a second channel of colonial rule – direct vs. indirect rule. India witnessed
British control for almost two centuries, first through the East India Company and then as a
colony under the British crown. When the Crown formally took over administration of India in
42
1858, Queen Victoria’s proclamation included a provision that allowed princes and rulers in
parts of the country that had remained unconquered to retain their titles and rights over their
territory. Except for external affairs and defense, which were controlled by the British, these
‘princely states’ enjoyed considerable autonomy in internal administration. Approximately one-
third of the Indian population was under indirect rule of more than 560 princes from 1858 until
independence in 1947 (Metcalf and Metcalf 2001).
Banerjee et al. (2005) and Iyer (2010) find that areas previously under direct British control
had lower access to public goods in the post-independence period than areas under princely
states. Iyer however suggests that the effects of land tenure (zamindari vs. non-zamindari areas),
described earlier, can be seen only in areas under direct rule. Studies such as Banerjee et al.
(2005) and Iyer (2010) do not focus on the theoretical mechanisms that lead to the superior
performance of areas previously under indirect rule. This is particularly relevant since Kohli
(2004) emphasizes the role that direct colonial rule had in late development, specifically
industrialization. Kohli argues that Japanese colonial rule in Korea was deep and penetrative and,
in turn, was instrumental in creating the framework for the cohesive-capitalist state that oversaw
the country’s miraculous growth transformation after World War II. In contrast, Kohli traces
how indirect British rule in Nigeria resulted in the creation of a neo-patrimonial state with few
developmental inclinations. In contrast to Banerjee et al. and Iyer, this logic suggests that
indirect rule, through its influence on later patterns of state authority, may in fact lead to inferior
economic outcomes.
Despite these contradictory arguments, two broad hypotheses on the impact of colonial rule
can be generated. Extending the logic that economic performance is likely to be worse in
zamindari areas than non-zamindari ones, it might be the case that the latter can be associated
43
more proactive investment policies. A second hypothesis would suggest that indirect rule affects
future policy trajectories. However, studies differ with respect to the direction of the effect;
Banerjee et al and Iyer’s findings would suggest areas previously under indirect rule should fare
better while the underlying logic from Kohli’s study points to an opposite effect.
Whatever the direction of these expectations, an emphasis on colonial institutions falls short
in explaining varied subnational investment policy responses for several reasons. The four case
studies of Gujarat, Punjab, Andhra Pradesh and Bihar clearly demonstrate that there is no clear
association between colonial institutions and government responses in the competition for
investment. For a start, the nature of colonial institutions provides analytical purchase only for a
cross-section of cases and cannot account for changes over time within units. Andhra Pradesh
and Bihar have been more proactive at some points than others and the static variable of colonial
institutions cannot account for temporal changes within these states. Even if we were to focus
only on the cross-sectional element, there is no clear association between colonial institutions
and subnational policy outcomes after 1991. The boundaries of Indian states, which were drawn
on a linguistic basis, do not correspond to those of colonial institutions.
In the regression analysis in chapter 5, I include a control for the proportion of non-zamindari
areas in each state. As the results consistently show, this variable does not have a significant
influence on proxies for investment policy. In contrast, there is strong evidence linking electoral
coalition types to investment policies. In addition, the case studies do not suggest a clear
association between land tenure systems and policy outcomes. Zamindari areas were present in
both Bihar and Andhra Pradesh; the latter also had several ryotwari districts. Despite the
presence of large zamindari areas in both states, their performance differed for much of the post-
1991 period. The focus on zamindari institutions also fails to explain why Punjab, which was

44
mainly under the third type of land tenure system, mahalwari, and was not subject to the
influences of zamindari or ryotwari, has been apathetic to creating an investor-friendly
framework.
As in the case of the hypothesis associated with land tenure systems, the four case studies
refute the expectation regarding direct vs. indirect rule. The four case studies contain within them
areas that were under both direct and indirect rule, though in differing proportions. Despite this,
they see varied responses to the competition for investments. For example, a considerable
portion of Gujarat was under indirect rule of numerous princely states while parts of it fell under
the Bombay Presidency under direct British rule. Gujarat has, arguably, been the most business-
friendly state in India in terms of its investment policies and studies such as Banerjee et al.
(2005) and Iyer (2010) might point to the positive effects of indirect rule in these states.
However, indirect rule was also similarly a significant feature in states such as Kerala, Rajasthan,
Madhya Pradesh, Andhra Pradesh, Karnataka and Punjab (these states also had areas under direct
rule). However, these states perform very differently than Gujarat despite similarly containing
large areas previously under indirect rule. In short, these examples do not suggest a pattern of
association between colonial institutions and subnational investment policy responses after 1991,
as the literature would lead us to expect.
1.5.2.3 Partisan preferences and ideology
Evidence from advanced-industrial countries suggests that parties on the left and right have
distinct economic objectives and these preferences affect the choice of economic strategies
pursued (e.g., Alvarez et al. 1991; Boix 1997a, 1997b, 1998; Garrett and Lange 1985). For
example, Boix (1997a) finds variation in supply-side growth policies in OECD countries
45
between left-wing and right-wing governments during the 1960-90 period – the former spent
heavily on human and physical capital while the latter relied primarily on creating incentives for
private agents. Alvarez et al (1991) and Garrett and Lange (1985) argue that either leftist
governments backed by encompassing labor movements or right-wing governments in
combination with weak unions are most successful in pursuing partisan preferences while
simultaneously achieving favorable macroeconomic outcomes. Away from advanced-industrial
economies, studies of market reforms in Latin America and Eastern Europe also point to the role
of ideology and partisan preferences in affecting economic policy choice and implementation
(for e.g., Murillo 2005, 2002; Murillo and Martinez-Gallardo 2007).
Explanations that emphasize partisan preferences and ideology in explaining policy choices
have limited applicability across Indian states for several reasons. For a start, in contrast to
advanced-industrial countries, the ideological positions of Indian parties tend to be far more
fluid. Indeed, they often shift dramatically over time. There are instances where the same party
has taken contradictory stands on a particular issue at the state and national levels or where the
same party has taken different positions in different states. Second, it is difficult to make a clear
left-right distinction between parties in the economic realm in India, especially at the regional
level. Policies undertaken by governments have often deviated considerably from their espoused
ideological positions on the left-right scale. Third, arguments in studies such as Alvarez et al
(1991) and Garrett and Lang (1985) assume an organizational link between the labor movement
and leftist parties but the union-party association in India tends to be very different. India is
somewhat distinct in that almost all major parties have affiliated unions and this is not restricted
to the communist parties alone. Examples on these three broader trends linked to parties are
discussed below.

46
Party positions on economic issues such as labor reforms and FDI point clearly to shifting
and contradictory stances. At the federal level, both the BJP and the Congress have attempted to
implement market-friendly labor reforms during their time in office but have blocked the very
same measures they prescribed when in opposition (Jenkins 2004a; Venkata Ratnam 2004).
Other cases offer a similar picture. As an opposition party in the early to mid-1990s, the BJP
opposed foreign investment openly and advocated a “swadeshi” (national self-sufficiency)
agenda but abandoned the theme and actively liberalized the FDI regime when it headed a
coalition government between 1999 and 2004.
At the regional level, ideological moorings fluctuate even more. As the Andhra Pradesh case
study in chapter 4 shows, the TDP under N.T. Rama Rao (NTR) openly opposed liberalization in
its 1994 electoral campaign. Yet, Chandrababu Naidu, who replaced NTR as TDP party
president and chief minister the very same year, shifted the party’s economic position firmly to
the right. Indeed, Naidu was one of the most ardent proponents of the neo-liberal agenda in India
(Kennedy 2004; Rudolph and Rudolph 2001).
Perhaps the most interesting case in terms of ideological ambiguity was the attempted re-
invention of the Communist Party of India –Marxist, the CPI (M), in West Bengal as a business-
friendly government since the mid-1990s. In an effort to reverse the state’s industrial decline,
West Bengal, particularly during Buddhadeb Bhattacharjee’s tenure as chief minister, attempted
to create a pro-business environment and attract investment. Its strategy included several
concessions to capital. Ironically for a Communist government, these concessions included
measures offering highly-subsidized agricultural land to industry.

47
Commenting on the disconnect between the party’s espoused ideology and its policies on the
ground in West Bengal, the Economist pointed out: “India's two Communist parties are more
powerful and more contradictory. Both use communist symbolism, but in practice support the
mixed economy and rule of law… They also run three states: Kerala, Tripura and West Bengal.
This latter state has been ruled by the Communist Party of India (Marxist) for 29 years, with a
remarkable mixture of strong party discipline and ruthless electoral tactics. Traditional left-wing
policies such as land reform have now been supplemented under the state's chief minister,
Buddhadeb Bhattacharjee, by a keen search for foreign investment, and support for privatization
– ideas that the party shuns at a national level” (2006b: 83). The communists’ attempted pro-
business transformation in West Bengal was, however, cut short when the CPI (M)-led front lost
power in 2011, the first time since 1977.
The case of the CPI (M) in West Bengal demonstrates the difficulty of placing Indian parties
along a standard left-right scale but it also highlights another aspect. Parties behave very
differently across regions and this is in part due to the fact that they have very different support
bases across states (e.g., Chhibber and Petrocik 1989; Hasan 2002). While the CPI (M) was
reinventing itself as a business-friendly government in West Bengal, the party did not adopt
similar policies in Kerala. Moreover, the party opposed the broader neo-liberal agenda and the
entry of foreign investment at the national level while being active in the search for FDI in West
Bengal.
Finally one other distinction with advanced-industrial economies as well as Latin America
needs to be noted. A formal link between leftist parties and labor unions forms a part of the
partisanship story in studies such as Alvarez et al (1991), Garrett and Lange (1985) and Murillo
(2005). India offer a very different environment with 92 per cent of the total workforce employed
48
by the unorganized sector (Sengupta 2007). Organized labor constitutes only 8 per cent of the
total workforce but is also highly fragmented with a range of partisan affiliations. Estimates
suggest that there are over 50,000 trade unions in India, which are split between 10 major trade
union federations affiliated to different political parties ranging from the communist parties on
the left to the BJP on the right (Teitelbaum 2006).
Given the nature and functioning of Indian parties, a focus on partisan preferences along the
standard left-right dimension offers little analytical leverage. In contrast, my argument points to
the influence of electoral coalitions. Moreover it suggests that the fluidity of partisan economic
positions itself stems from the fact that the nature of electoral coalitions differ across states as
well as within states over time.
1.5.2.4 Political competition
Dimensions of political competition have been linked to both policy adoption as well as
economic performance (e.g., Besley et al. 2010; Bueno de Mesquita et al. 2001; Chhibber and
Nooruddin 2004; Frye 2002; Murillo and Martinez-Gallardo 2007; Pinto and Timmons 2005).
Bueno de Mesquita et al. (2001) argue that regimes characterized by smaller winning coalitions
are more likely to deliver private goods while those backed by larger winning coalitions are more
likely to provide public goods. Building on this insight, Chhibber and Nooruddin (2004) find that
states in India with two-party competition require the support of a greater number of social
groups and, as a result, provide more public goods than multi-party states.
Other studies of political competition focus on growth-related policies and outcomes.
Looking at US states, Besley et al. (2010) find that the lack of political competition (measured as
the difference between the Democratic vote share in a state from 0.5) is associated with “anti-

49
growth” policies (higher taxes, lower capital spending and reduced likelihood of using right-to-
work laws). Pinto and Timmons (2005) find that an increase in competitiveness of political
participation has varying effects on different components of growth – it decreases the rate of
physical capital accumulation and labor mobilization but increases that of human capital
accumulation.
In a related vein, Murillo and Martinez-Gallardo (2007) argue that political competition,
particularly legislative advantage of the incumbent and ideological positions relative to the
challenger, can explain adoption of reforms in telecom and electricity in eighteen Latin
American countries between 1985 and 2000. Kitschelt and Wilkinson (2007), however, pose a
caveat in relation to the effects of political competition. They suggest that the effects of political
competition are contingent on the level of economic development.
Studies emphasizing the influence of political competition offer a variety of mechanisms in
support. One hypothesis that emerges is that higher fragmentation is likely to be associated with
lower public goods provision. If this hypothesis is extended to the subnational context in India
and investment is assumed to be a public good, we might expect an inverse relationship between
party system fragmentation and policies. A second hypothesis from Besley et al (2010) suggests
low political competition should be associated with “anti-growth” policies. In other words, states
with low political competition are more likely to be less proactive in the competition for
investment.
Empirical evidence does not support either hypothesis. I include controls for party system
fragmentation and vote share margins in the regression analysis and find no significant
relationship between these variables and policies. Moreover, the case studies point to variation in
50
investment outcomes even within states that have similar levels of political competition,
particularly on the metric of party fragmentation. Gujarat and Andhra Pradesh are both two-party
states and have differed considerably in terms of investment attracted. Punjab is bipolar, with the
Congress and SAD acting as the two main political players, but performs considerably worse
than these states. Second, I find that there is temporal variation in policies and this occurs even
when levels of party system fragmentation remains broadly the same within a state. This is the
case in Andhra Pradesh and Bihar.
This dissertation shares the overall thrust of the studies cited earlier that political competition
matters for policymaking. However, the mechanisms emphasized by this dissertation are
significantly different. I suggest that the crucial factor is the social base of electoral coalitions.
Political competition affects investment policies through the make-up of electoral coalitions but I
find that variables such as party fragmentation or vote share differences have limited explanatory
power. Moreover, different social cleavages across Indian states engender varying modes of
political competition. As such, my dissertation differs from existing studies in emphasizing very
different dynamics. Crucially, it emphasizes alternate links between political competition and
policies at both a proximate and more distant level.
1.5.2.5 Ethnic fractionalization
In the context of the history of development, India’s growth transformation since 1991 is
intriguing at two levels. As highlighted in the introduction to this chapter, India is a rare case of
sustained high growth in a poor democracy. India’s story is also surprising at another level –
growth has not only taken place in the midst of a poor electorate but an ethnically diverse one. A
large body of literature in economics has found a negative link between ethno-linguistic

51
fractionalization and various economic outcomes including growth, public goods provision and
government. Easterly and Levine (1997) find that high levels of ethnic diversity have a strong
indirect effect on growth as they adversely affect policies such as schooling, political instability,
exchange rate premiums, government deficits and infrastructure. Other studies link higher ethnic
heterogeneity to poor provision of public goods or inferior government performance (e.g.,
Alesina et al. 1999; Alesina and La Ferrara 2005; Miguel and Gugerty 2005b; La Porta et al.
1999).
Ethnicity does play a consequential role in the explanation offered in this dissertation.
Indeed, the dynamics of caste politics in India are central to my explanation. At a deeper level of
causation, social cleavages, defined in terms of group size and resource control, influence party
strategies of coalition construction. I do not dismiss explanations linked to ethnic fragmentation
but my approach varies significantly from existing studies of ethnic heterogeneity described
above. In particular, my explanation questions the specific mechanisms related to ethnicity
implied by earlier studies. The sole focus on fragmentation is insufficient and a link between
class and ethnicity is missing in these explanations. At a proximate level, I argue that the key
factor driving economic policies is the class profile of electoral coalitions. It is the overlap of
class interests of electoral coalitions and government imperatives of investment promotion that
crucially results in pro-business policies. A disjuncture between class interests of coalitions and
state incentives, in contrast, can be linked to weak policy responses.
To be certain, ethnic diversity enters my explanation but it does so at a more distant level of
causation and through very different mechanisms. Critically, it is the focus on caste politics that
allows narrow class coalitions to emerge. More broadly, certain types of social cleavages are
likely to engender particular types of electoral coalitions through their effects on party strategies.
52
Unlike these other studies, I also focus on two dimensions related to social cleavages – the size
of social groups and the nature of resource control. The studies cited earlier differ in that they do
not make the link between ethnicity and economic endowments. Rather, they imply that ethnic
fragmentation can be automatically associated with polarization and, in turn, corruption, rent-
seeking and weak economic policy outcomes (e.g.,Easterly and Levine 1997). In contrast to the
sole focus on ethnic fragmentation and polarization, I take a broader view of how and why
identity and ethnicity mattes for policy outcomes.
1.6 Research design
This dissertation employs a nested research design (Lieberman 2005). In particular, it utilizes
both qualitative and quantitative analysis. Four in-depth case studies are combined with time-
series cross-section analysis of 14 major Indian states. Though primarily qualitative, the case
studies also utilize quantitative analysis to highlight mechanisms related to voter attachments.
Before outlining the specific research design in detail, the next section describes the decision to
use a subnational level of analysis.
1.6.1 The choice of a subnational research design
A subnational research design was employed in this dissertation for its ability to minimize
certain types of institutional variation as well as for reasons specific to the Indian context. As
Snyder (2001) suggests, subnational research designs make it easier to construct controlled
comparisons that increase the probability of obtaining valid causal inference from small-N
research. Kohli argues that a comparative study of Indian states can “approximate the ceteris
paribus assumption, often made, and necessary for comparative studies, better than most
independent countries” (1987: 4). Snyder also points out that a subnational analysis can highlight
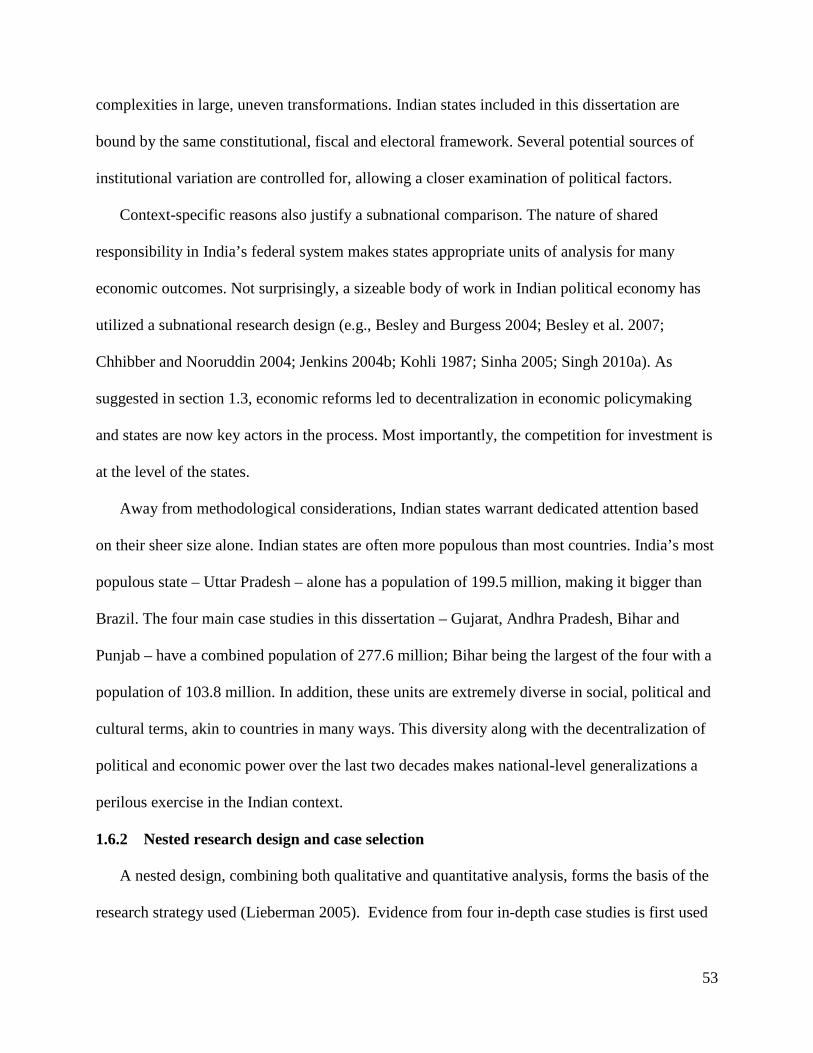
53
complexities in large, uneven transformations. Indian states included in this dissertation are
bound by the same constitutional, fiscal and electoral framework. Several potential sources of
institutional variation are controlled for, allowing a closer examination of political factors.
Context-specific reasons also justify a subnational comparison. The nature of shared
responsibility in India’s federal system makes states appropriate units of analysis for many
economic outcomes. Not surprisingly, a sizeable body of work in Indian political economy has
utilized a subnational research design (e.g., Besley and Burgess 2004; Besley et al. 2007;
Chhibber and Nooruddin 2004; Jenkins 2004b; Kohli 1987; Sinha 2005; Singh 2010a). As
suggested in section 1.3, economic reforms led to decentralization in economic policymaking
and states are now key actors in the process. Most importantly, the competition for investment is
at the level of the states.
Away from methodological considerations, Indian states warrant dedicated attention based
on their sheer size alone. Indian states are often more populous than most countries. India’s most
populous state – Uttar Pradesh – alone has a population of 199.5 million, making it bigger than
Brazil. The four main case studies in this dissertation – Gujarat, Andhra Pradesh, Bihar and
Punjab – have a combined population of 277.6 million; Bihar being the largest of the four with a
population of 103.8 million. In addition, these units are extremely diverse in social, political and
cultural terms, akin to countries in many ways. This diversity along with the decentralization of
political and economic power over the last two decades makes national-level generalizations a
perilous exercise in the Indian context.
1.6.2 Nested research design and case selection
A nested design, combining both qualitative and quantitative analysis, forms the basis of the
research strategy used (Lieberman 2005). Evidence from four in-depth case studies is first used

54
to develop the mechanisms of the core argument. The applicability of the argument is then tested
on a broader group of 14 states through a quantitative, time-series cross-section framework.
While the case studies are largely qualitative, they do include a measure of quantitative analysis
within them as well. In particular, I analyze voter attachments using electoral survey data in
chapters 3 and 4.
Four states (Gujarat, Punjab, Andhra Pradesh and Bihar) were treated as “model-building”
cases and the basic argument was developed through these cases. The case studies are backed by
10 months of fieldwork. The case studies combine 110 interviews with businesspersons,
bureaucrats, politicians and other informed observers with analysis of various policy and
government documents, investor surveys, electoral survey data, macroeconomic data and
numerous secondary sources.
I relied on the method suggested by Lieberman (2005) to pick the four “model-building”
cases. At the outset, case selection was driven by two factors. As other scholars have observed,
policies and measures undertaken by states varied across Indian states. However, the nature of
policy differences across states was not well documented when I started this dissertation. This
policy variation had to be documented systematically. I relied on fieldwork particularly the
examination of government documents as well as interviews with investors and bureaucrats to
lay out the nature of policy variation in the four case study states. To some extent, the devil was
certainly in the details but these details had to be established first.
Given the lack of existing data on policy variation, I selected the cases on the basis of
investment outcomes. To be certain, policies need not be perfectly correlated with outcomes.
However, given the lack of data on policies, I treated outcomes as a broad approximation of
policy. Using levels of proposed investment as a broad indicator of investment policies, I chose

55
the four “model-building” cases of this dissertation as follows. Following Lieberman, I began
with preliminary quantitative analysis to examine the explanatory leverage of existing theories in
accounting for the variation in outcomes observed across states in India after 1991. Existing
studies from neoclassical economics and economic geography offer clear expectations in relation
to spatial distribution of investment. In particular, they suggest that socioeconomic factors are
likely to drive investment location. Most frequently, the variables identified as driving
investment location include market size, level of economic development, infrastructure and
human development.
To determine the adequacy of socioeconomic variables in explaining varied investment
outcomes observed across Indian states, a simple cross-section OLS regression was first run.
Cumulative investment across Indian states was regressed on proxies of four socio-economic
variables identified in the literature (level of economic development, market size, human capital
and infrastructure). Using values from this preliminary regression, figure 1.9 plots actual
investment values against values predicted by socioeconomic variables identified in existing
theories. As can be seen in figure 1.9, existing theories offer only a partial explanation for
outcomes observed. Several states lie above and below the line, suggesting that additional factors
matter in explaining investment patterns across Indian states.21
Based on the fact that existing theories had limited leverage, I then chose four “model-
building” cases. Employing an “off- the-line” strategy, four cases – Gujarat, Andhra Pradesh,
Punjab and Bihar – that are not well predicted by socioeconomic factors were chosen (indicated
by the labels GUJ, AP, PUN and BIH in figure 1.9). Importantly, socioeconomic variables would
have predicted broadly similar levels of investment in Gujarat, AP and Punjab but the actual
outcomes in these states vary considerably from predicted ones, making the comparison a 21 The regression on which figure 1.9 is based is included in the appendix to this chapter.
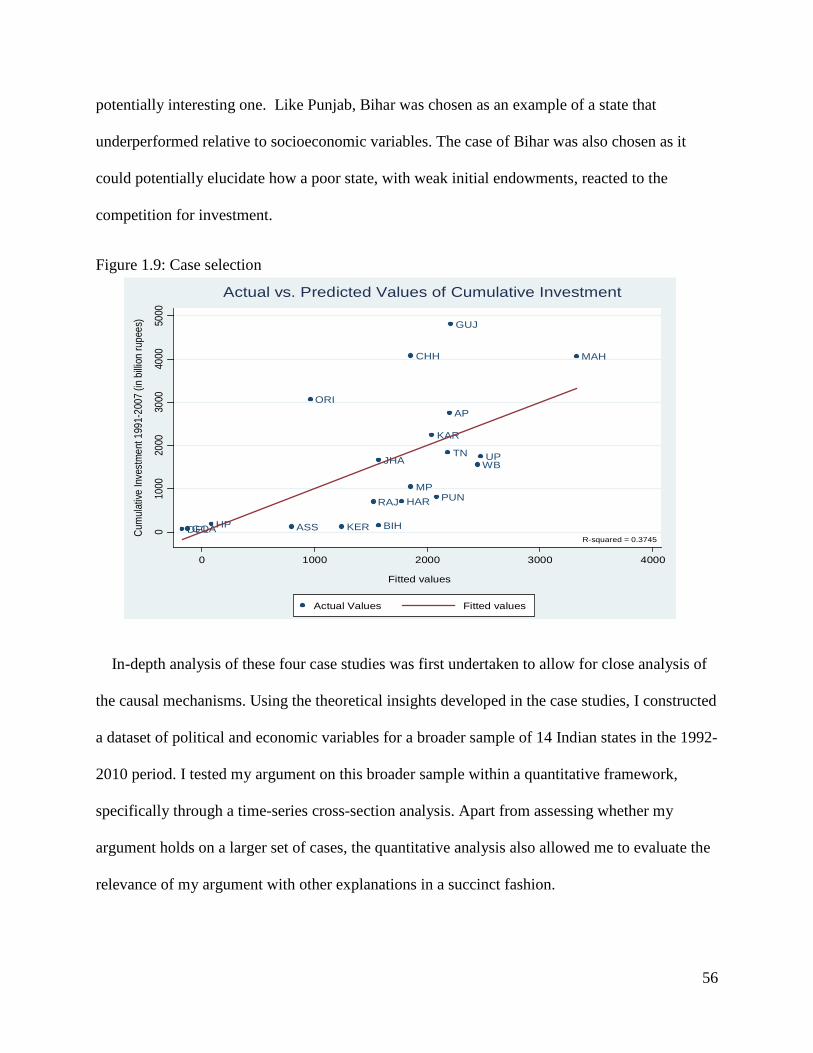
56
potentially interesting one. Like Punjab, Bihar was chosen as an example of a state that
underperformed relative to socioeconomic variables. The case of Bihar was also chosen as it
could potentially elucidate how a poor state, with weak initial endowments, reacted to the
competition for investment.
Figure 1.9: Case selection
In-depth analysis of these four case studies was first undertaken to allow for close analysis of
the causal mechanisms. Using the theoretical insights developed in the case studies, I constructed
a dataset of political and economic variables for a broader sample of 14 Indian states in the 1992-
2010 period. I tested my argument on this broader sample within a quantitative framework,
specifically through a time-series cross-section analysis. Apart from assessing whether my
argument holds on a larger set of cases, the quantitative analysis also allowed me to evaluate the
relevance of my argument with other explanations in a succinct fashion.
AP
ASS BIH
CHH
DELGOA
GUJ
HAR
HP
JHA
KAR
KER
MAH
MP
ORI
PUNRAJ
TN UPWB
R-squared = 0.3745
010
0020
0030
0040
0050
00
Cum
ulat
ive In
vest
men
t 199
1-20
07 (i
n bi
llion
rupe
es)
0 1000 2000 3000 4000
Fitted values
Actual Values Fitted values
Actual vs. Predicted Values of Cumulative Investment
57
1.7 Roadmap of the dissertation
Asking why government responses varied in response in the competition for investment
involves analyzing two components. What have more proactive states done in comparison to less
proactive ones? In other words, how has the content of policies differed across states? Second,
why have policies differed? The rest of the chapters in this dissertation respond to those two
questions and are organized as follows.
Chapter 2 focuses on the policies and tasks undertaken by states in the context of investment
promotion. Drawing on government policy documents, documents of business associations,
newspaper reports, interviews with businesspersons and investor surveys, the chapter focuses on
eight policy dimensions and compares variation in the four cases along these dimensions.
Chapter 2 shows that the speed and scope of policies between states have varied and it expands
on these differences. Data from investor surveys conducted by the World Bank in India are also
used to suggest that investors care about state policies. It concludes by asking how the nature of
tasks undertaken by the state in relation to economic development has changed in the neoliberal
era compared with those highlighted in the case of classic developmental states in East Asia.
The four main case studies are included in chapters 3 and 4. Chapter 3 argues that narrow-
right coalitions in Gujarat and wide-right coalitions in Punjab have affected policymaking and
led to contrasting outcomes in the competition for investment in each of these states. In addition,
the chapter traces how these particular types of coalitions emerged in these states in the first
place. In doing so it emphasizes both the role of underlying ethnic cleavage structures as well as
political agency. The chapter also includes evidence from survey data to examine the link
between social identity and voter attachments, which is part of the main argument.

58
Chapter 4 includes case studies of Andhra Pradesh and Bihar. Though these states performed
very differently for most of the post-reforms period, they exhibit temporal variation in levels of
investment attracted. I show that these shifting outcomes can, in turn, be explained by the
changing nature of nature of electoral coalitions over time – from narrow-right to wide right in
the case of AP and from narrow-left to wide-left in Bihar. As in chapter 3, I also provide an
explanation for how coalitions emerged in these states and analyze survey data on voter
attachments to support my argument.
Chapter 5 expands the scope of analysis by testing the applicability of the core argument on a
broader set of 14 Indian states. In particular, I use a time-series cross-section analysis on these
states between 1992 and 2010. The chapter provides overall support to the main argument and
the insights developed in chapters 3 and 4. Chapter 6 concludes by outlining the scholarly
contributions and implications of the study.

59
Appendix to Chapter 1
Regression results used in Figure 1.9
VARIABLES State Per Capita Income
0.217 (0.368)
Road Density -0.201 (0.139)
Literacy Rate 1,347 (2,886)
GSDP 961.8** (375.7)
Constant -10,268* (5,054) Observations 20 R-squared 0.375
Standard errors in parentheses; *** p<0.01, ** p<0.05, * p<0.1

60
2. Chapter 2: Varied policy responses in the competition for investment
In 2006, the Tatas, one of India’s largest conglomerates and perhaps its most iconic one,
announced that it would produce the world’s cheapest car, the Nano. Celebrated as an “icon of
Indian ingenuity and entrepreneurialism”, the Nano was to be priced at $2,500 and the project
aimed to bring car ownership within the reach of a class of consumers who would have otherwise
never had access to it (Economist 2008: 85).22 Surprisingly, in 2006, the Tatas chose the
communist-run state of West Bengal as the site of the production unit for this high-profile
project. This was considered a major coup for West Bengal, which since the mid-1990s, was
attempting to reinvent itself as a business-friendly state.
West Bengal managed to attract the Tatas through a generous package of concessions that
included 997 acres of highly-subsidized farmland as well as other substantial but undisclosed
sops, including tax breaks. The project, however, soon ran into trouble. Land acquisition by the
government for the Tatas, some of it by forcible means, proved extremely contentious, drawing
strong protests from local farmers, activists and the main opposition party. After two years of
sustained, often violent, protests, the Tatas announced in 2008 that they would move out of West
Bengal. Immediately, several other state governments went into overdrive, offering competing
packages of concessions, hoping to bring the Nano project to their jurisdictions. In the end,
Gujarat beat out rival offers from states such as Andhra Pradesh, Karnataka, and Maharashtra.
22 At the time of the project’s inception, the Nano was to be priced at Rs. 100,000, which at the time of the announcement was approximately $2,500.

61
While the Gujarat government has chosen not to disclose details of the package offered to the
Tatas, newspaper reports offer some broad hints on the nature of concessions involved.
According to some press reports, among the more substantial benefits were 1,100 acres of
highly-subsidized government land and a soft loan of Rs. 95,700 million at an interest rate of 0.1
per cent interest rate payable after 20 years (EconomicTimes 2008; IndianExpress 2008a). Other
benefits are said to include exemptions from electricity duty, registration and transfer of land
charges and free water supply (IndianExpress 2009).
Whatever the exact package of concessions, Gujarat’s proactive approach won over the
Tatas. Commenting on the factors that influenced the decision of Tata Motors to relocate to
Gujarat, a senior management official, who was directly involved with the negotiations, offered
the following explanation. “When we announced the decision to move out [of West Bengal], we
started having meetings with chief ministers of Gujarat, Maharashtra, Andhra Pradesh and
Karnataka. We had offers from other states but when we had the meeting with the Gujarat Chief
Minister, Narendra Modi, he was very keen… The three factors that influenced our decision in
the end were location, commercial terms [concessions and subsidies] and political execution. It
was in this third aspect that Gujarat stood out, way ahead of others in this respect…Many would
suggest this was an exception for Nano but, even if it is 75 per cent of the treatment that we got,
it is far superior to other states.”23
In many ways, the Tata Nano episode epitomizes several key dynamics in relation to the
competition for investment. For a start, it is amply clear that states actively court private
investment and compete for it. As a result, capital, particularly big business, enjoys considerable
leverage and bargaining power. The episode also suggests that policy differences exist across
23 Interview with a senior management official of Tata Motors; Mumbai, June 3rd, 2010.
62
states. Gujarat’s success clearly epitomizes its aggressive approach to attracting investment to
the state. Moreover, even among the more proactive states, policy differences exist.
The broader aim of this dissertation is to understand the political determinants of this policy
variation. Examining why state activism varies across subnational units involves asking a prior
related question. How have policies differed across states? In this chapter, I address that
question and examine the content of policies and measures undertaken in response to the
competition for investment. In particular, I focus on the four case study states – Gujarat, Punjab,
Andhra Pradesh and Bihar – and show how some have been more aggressive in the competition
for investment than others.
In comparing policies across states in this chapter, I also engage in two additional tasks. I
first identify the various policy dimensions that are important in investment promotion. To do
this, I draw on policy reports from international financial institutions (IFIs) as well as interviews
conducted during fieldwork. In the conclusion to this chapter, I also relate policies across states
in India to the broader developmental state literature. The focus on policies undertaken by
governments places the state squarely at the forefront of the analysis. In that sense, this
dissertation shares an affinity with the developmental state literature. However, with increasing
globalization and the spread of democracy, state intervention in the economy must now take
place in a markedly different context than the one that characterized the experience of classic
developmental states in East Asia. I end this chapter by juxtaposing the nature of state activism
across Indian states against that of classic developmental states in East Asia. In doing so, I
attempt to ask if the nature of state activism has changed and what we might learn from the
Indian case in this regard.
63
The remainder of this chapter is organized as follows. The next section briefly summarizes
the policy dimensions that are relevant in the competition for investment. A comparison of
policies across the four case studies follows in section 2.2. Having established the nature of
subnational policy differences, section 2.3 addresses a related issue. It draws on evidence from
investor surveys to demonstrate that policies matter to micro-level investment decisions. The
chapter concludes by comparing state activism across Indian states to the classic developmental
states of East Asia.
2.1. Identifying relevant policy dimensions
Triggered by the debt crisis and subsequent pressure from Washington Consensus
institutions, several developing countries shifted from a statist to a market model of development
in the 1980s, resulting in greater emphasis on private investment. At the same time, growing
levels of globalization led to increased competition for private capital, both across and within
countries in the developed and developing world. As a major proponent of the shift away from
statist models, international financial institutions such as the World Bank have strongly
emphasized private sector development over the last decade.
In conjunction with this view, the World Bank in particular, through several policy reports,
has stressed the benefits of a favorable investment climate (e.g., WorldBank 2002, 2005b,
2007A, 2007B, 2009; WorldBank and InternationalFinanceCorporation 2012, 2004a, 2009,
2004b). To facilitate comparison of policy responses across states, I examine these policy reports
in order to identify key policy dimensions that affect investment decisions and to understand
what IFIs consider as best practices in investment promotion. I should note here that I do not
make any normative evaluations but simply treat recommendations of IFIs as a yardstick against
64
which to compare the actions of Indian states and to understand what constitutes investor-
friendly measures. In addition to IFI reports, interviews conducted during fieldwork also allowed
me develop a broader understanding of the policy dimensions that mattered to individual
investors.
The investment climate is defined as a “set of location-specific factors shaping the
opportunities and incentives for firms to invest productively, create jobs and expand.
Government policies and behaviors exert a strong influence through their impact on costs, risks,
and barriers to competition” (WorldBank 2005b: 20). This, in turn, affects the profitability of
firms and consequently the decision to invest. Under the components of costs, risks, and barriers
to competition, reports and investor surveys highlight a host of policy factors such as
infrastructure, taxes, regulatory environment, labor laws, provision of public goods and security
and enforcement of property rights that drive investment decisions. Policies identified as being
favorable to firm activity include creating infrastructure, improving access to credit, easing
regulation for firms to start and operate a business, curbing discretionary policies, streamlining
tax systems, reducing disproportionate tax burdens on business, improving education and worker
training, strengthening property rights and contract enforcement, and aiding information flows.
These policy reports also identify certain best practices. The 2004 Doing Business Report
suggests that in terms of business regulation “one size can fit all” (WorldBank and
InternationalFinanceCorporation 2004a: xvi). Apropos to this line of thinking, the annual Doing
Business reports on business regulation spend considerable amount of time identifying “good
practices” from cases around the world. For instance, the 2004 Doing Business argues that
countries that perform well have a similar approach in that they simplify and deregulate in
65
competitive markets, focus on enhancing property rights, expand the use of technology and
reduce court involvement in business matters.
Drawing on insights from the reports of these international financial institutions as well as
interviews with investors conducted during fieldwork, this dissertation identifies eight policy
areas across which subnational responses are compared – infrastructure, incentives and subsidies,
regulatory environment for starting and conducting a business, labor laws, land acquisition,
special economic zones, organizational framework and information, and branding and promotion
activities. These eight policy areas broadly lie within the three dimensions of costs, risks, and
barriers to competition identified by the World Bank as being central to the investment climate
(e.g.,WorldBank 2005b). While a more complete set of policies can be identified as relevant to
the investment climate, these eight policy areas are those where government action has a direct
and palpable effect. In addition, these are also contextual reasons for choosing these eight
dimensions; subnational governments in India have considerable policy autonomy in these areas.
2.2. Comparing policies across the four case studies
Sections 2.2.1 to 2.2.8 below detail policy differences across the four case study states in
each of the eight dimensions listed above. The comparison of policies is based on information
collected through an analysis of state industrial policies, other government documents, and
interviews with investors and bureaucrats conducted during fieldwork. The section suggests that
some states have been considerably more proactive in the competition for investment; their
policy responses have been more pro-business in scope or have been formulated at an earlier
period of time.

66
Among the four case studies, Gujarat has been considerably more aggressive in attempting to
attract investment. Indeed, Gujarat has, arguably, been India’s most investor-friendly state over
the last two decades. The state’s rhetoric in its industrial policy documents matches its pro-
business ambitions. For instance, its 2009 industrial policy suggests that the aim is to make
“Gujarat the most attractive investment destination of not only in [sic] India but also that of the
world” (Gujarat 2009: 9). Gujarat models itself after the developmental states of East Asia and ,
indeed, in many of its industrial policy documents, the state benchmarks itself against fast-
growing economies in East Asia ( e.g., Gujarat 2003). Gujarat’s industrial policy documents are
also informative with regard to how the government views its overall role. Policy documents
repeatedly emphasize that the state’s role in the post-liberalization environment is that of a
“facilitator” to the private sector helping reduce transaction costs and not that of a “regulator and
controller” (e.g., Gujarat 2000, 2003).
Punjab’s efforts stand in sharp contrast to Gujarat’s. At the time of economic liberalization in
1991, Punjab was India’s richest state in per capita income terms and possessed a variety of
initial endowments that were potentially favorable to success in the competition for investment,
particularly sound infrastructure and a healthy entrepreneurial base. Despite its initial
advantages, Punjab has been simply too slow to come to terms with the needs of the post-
liberalization environment (Ahluwalia et al. 2008). As chapter 3 will trace, competitive populism
has had disastrous consequences for the state’s finances. The extremely tenuous nature of
finances has meant that the state has not been able to offer substantial incentives or create quality
infrastructure to attract investment.
Andhra Pradesh (AP) has been one of the more successful performers in the post-
liberalization environment. However, its commitment to an investor-friendly agenda has neither

67
been as consistent nor as strong as Gujarat’s. The state’s pro-business commitment has also
fluctuated over time. Under Chief Minister Chandrababu Naidu, AP articulated an ambitious
overall plan for economic development. Naidu’s own affinity towards Washington Consensus
policies led to the articulation of a vision for development that was significantly pro-business.
This pro-business orientation, however, cost Naidu at the polls and his successor, Y.S.
Rajasekhar Reddy, was considerably more reticent in adopting an overtly capital-friendly
strategy. Since Reddy’s death in 2009, the state has also been in the midst of considerable
political turmoil, which has adversely detracted from its policy commitments to business.
Economic development was firmly relegated to the back seat in Bihar in the first fifteen years
after liberalization. Under the governments of Laloo Prasad Yadav and his wife, Rabri Devi,
between 1990 and 2005, the state essentially abrogated its development functions. Even strong
rhetorical commitment to social justice in this period translated into few substantial development
improvements for lower castes.
Perhaps, the lack of commitment to industrial development is best exemplified by the
circumstances surrounding Bihar’s 2002 industrial policy. The state’s 1995 Industrial Policy
lapsed in August 2000 and the state subsequently went without an industrial policy for almost
two years (Dayal 2002). Belatedly in 2002, the state extended the old industrial policy with
retrospective effect from August 2000. However, with the stipulated time period for most
incentives and concessions offered in the 1995 policy already expiring, this was essentially a
fruitless exercise.
Bihar’s focus has, however, been dramatically different since 2005. A new regime has led to
a sea-change in commitments to human development and investment promotion. Through a
68
multi-pronged focus on incentives, infrastructure creation, capital-friendly regulations and
institutional development, the state has been actively trying to catch-up, though results are not
yet evident in terms of actual investment.
Differences between the four states along each policy dimension identified earlier are
discussed in detail below. Table 2.1 in the appendix summarizes these differences.
[Table 2.1 here]
2.2.1. Infrastructure24
A sizeable literature in economics points to the positive effect of infrastructure on
productivity and growth (Aschauer 1989; Calderon and Serven 2004; Canning 1999; Easterly
and Rebelo 1993; Esfahani and Ramirez 2003; Röller and Waverman 2001). While initial
infrastructure endowments of the four states varied, so too have their efforts in creating new
infrastructure after 1991. By international standards, infrastructure in India is grossly inadequate.
It has frequently been described as the main bottleneck to India’s growth. In a survey of Indian
business, the Economist suggested: “For many investors in India, infrastructure determines
where to build, and is the biggest operational challenge…Late last year a study by Morgan
Stanley, an American investment bank, concluded, like many before it, that ‘the single most
important macro constraint on the Indian economy, holding back its average growth, is the low
spending on infrastructure.’ Foreign and local businesses, analysts and politicians alike have long
recognized this truth, especially if they have visited China” (Economist 2006a).
24 Under the Indian constitution, the primary responsibility for most areas of infrastructure such as roads (excluding national highways) and electricity lie with subnational governments.
69
Within this broad picture of mediocrity, there are major regional differences and states
have varied in their policy efforts to create new infrastructure. I highlight these differences by
looking first at variation in the legal and institutional framework for infrastructure created by the
states and then at specific policies related to roads and electricity.
2.2.1.1. Institutional and legal framework for infrastructure creation
Over the last decade, Gujarat has made infrastructure creation one of the main planks of
its investment promotion strategy. It has also been noticeably more aggressive in attempting to
attract private sector participation in infrastructure through public-private partnerships. It was
among the first states in the country to pass an act, the Gujarat Infrastructure Development Act in
1999, to create a formal institutional framework for infrastructure development. Even prior to the
passage of the act, the state created the Gujarat Infrastructure Development Board (GIDB) in
1995 dedicated to identifying new infrastructure projects, reviewing existing infrastructure and
assisting with implementation. The state has also undertaken a review of its existing
infrastructure and set targets through its Vision 2010 and Vision 2020 plans.
Gujarat has also been more innovative in its approach to infrastructure. To take full
advantage of its extensive coastline and spur industrialization away from the developed
Ahmedabad-Vadodara belt, the state through the Gujarat Maritime Board (GMB) put in place a
port policy in 1995. Among other initiatives, Gujarat’s port policy allowed private sector to set
up captive jetties, encouraged joint sector initiatives and also allowed private players to
completely own and operate certain greenfield ports.25
25 Captive ports are those where a particular company or companies has exclusive use of the facilities.
70
There are suggestions that Gujarat’s port policies in areas such as Hazira, Dahej, Sikka,
Mundra and Pipavav have reaped considerable rewards in terms of investment (e.g., Aiyar 2008).
Two prominent examples – that of Reliance Industries’ oil refinery in Jamnagar and Essar Steel’s
plant in Hazira – lend some credence to this view. It is unlikely that either project would have
been located in Gujarat if not for benefits arising from well-developed infrastructure facilities. In
the case of Essar Steel’s factory, the choice is interesting since steel plants typically tend to be
located near iron ore sources. Gujarat has no iron ore deposits but Essar has been able to take
advantage of the state’s port policy and easy availability of electricity and natural gas to be
competitive.26 The entire supply of crude oil refined by Reliance in Jamnagar is imported and the
existence of captive port facilities is similarly central to the viability of the refinery. Both
projects have also spurned the development of ancillary units in the area around Jamnagar and
Hazira. In the case of Reliance, Gujarat has also reaped the benefits of vertical integration; the
company manufactures a variety of petrochemical products derived from the by-products from
its Jamnagar refinery. All this is done primarily through the use of ports.27
Other states have been slower than Gujarat in putting in place a strong infrastructure
framework. They have also not been as comprehensive in their efforts. AP’s commitment to
developing infrastructure has been variable, aggressive at some times more than others. In the
mid-1990s, the state made a major effort in trying to reinvent itself as a business-friendly
destination. The Andhra Pradesh Infrastructure Development Enabling Act was passed in 2001,
two years after Gujarat’s legislative effort, and the Infrastructure Corporation of Andhra Pradesh
(INCAP) came into existence in 2005. The Andhra Pradesh Industrial Investment Corporation
26 Interview with Resident Director, Essar Steel; Ahmedabad, September 2nd, 2009. 27 Interview with a senior bureaucrat, Gujarat Maritime Board, Gandhinagar, August 27, 2009
71
(APIIC), formed in 1973, has been active since the mid-1990s in developing industrial parks and
acquiring land for industry.
Punjab’s infrastructure in 1991, particularly its road network, was significantly superior
to many other states but failure to supplement this initial base substantially has hurt the state in
attracting new investment. The Punjab Infrastructure Development and Regulation Act was
passed in 2002 and the Punjab Infrastructure Development Board was created the same year. A
pattern of competitive populism between the main political parties has adversely affected the
state’s financial health since the mid-1990s, providing little scope for new infrastructure
development. Moreover, this has also translated into poor maintenance of existing infrastructure.
Bihar’s story is one of two parts. Endowed with an extremely poor infrastructure base,
the state made virtually no efforts for fifteen years between 1990 and 2005. A change of
government in 2005 led to a major change in the state’s approach to infrastructure development,
particularly in road and bridge construction. As part of a larger strategy to put in place an
institutional structure for development, the Bihar State Infrastructure Development Act was
passed in 2006 and an infrastructure development authority was also constituted.
2.2.1.2. Roads and electricity
If there are noticeable differences in overall approaches to infrastructure development
across states, dissimilarities are even more evident when specific areas such as electricity and
roads are examined. Out of 2,286 firms surveyed in the 2005 Firm Analysis and Competitiveness
Survey conducted by the World Bank and Confederation of Indian Industry, 35.2 per cent of
firms identified electricity as the biggest obstacle to their business, making it the single most
frequently identified constraint by far (WorldBank 2005a).

72
Electricity is a concurrent subject under India’s federal system where both the center and
regions enjoy responsibilities but the states have sole jurisdiction over state electricity boards,
which are responsible for generation, transmission and distribution of electricity. By the early
1990s, most Indian states were saddled with dysfunctional state electricity boards. Growing
demand, inadequate investment in generation facilities, major transmission and distribution
losses due to theft and provision of free power to politically-vital interest groups resulted in an
adverse situation. At the time, various international agencies as well as the central government
actively recommended comprehensive state-level electricity reforms, most notably the
unbundling of state electricity boards into separate transmission, generation and distribution
companies. Authors such as Kochhar et al. (2005) suggest that electricity reforms are a good
indicator of the reformist credentials of individual subnational governments.
An examination of electricity reforms suggests considerable differences in enthusiasm.
AP was one of the forerunners, carrying out comprehensive electricity reforms through the
Andhra Pradesh Electricity Reforms Bill in 1998. Other states have been more reluctant to
undertake reforms or have been more half-hearted in their efforts. Gujarat was equally proactive
but took a different approach from AP. Since the early 1990s, Gujarat encouraged captive (self)
generation by industry, putting in place a captive power policy in 1998, which some observers
suggest has enhanced the state’s generation capacity (Hansen 2008). In 2003, it followed AP in
passing the Gujarat Electricity Industry (Reorganization and Regulation) Act. This led to the
unbundling of the Gujarat Electricity Board into separate companies for transmission,
distribution and generation.
Both Punjab and Bihar have been reluctant in overhauling their electricity sector. Despite
the federal government’s recommendations that the process of electricity restructuring take place
73
by 2003, neither state did so. The Punjab cabinet finally approved unbundling of the state
electricity board in April 2010. Bihar, on the other hand, has taken even fewer steps in improving
its electricity situation; generation capacity remains extremely poor.
A comparison of expenditures on electricity also points to different priorities across these
states. The average annual expenditure on energy (as a percentage of total state expenditure)
between 1991-92 and 2009-10 was 10.4 per cent in Gujarat, 7.44 per cent in AP, 8.5 per cent in
Punjab and 6.53 per cent in Bihar (calculated from RBI 2010a). Importantly, Gujarat also stands
out in another aspect. Electricity subsidies and free electricity to farmers and other rural groups
has been a frequent electoral sop offered by political parties in India. Unlike many other states,
Gujarat has tended to eschew the use of electricity subsidies. This stands in strong contrast to
Punjab as well as AP. Electricity subsidies have been extensively given to farmers in Punjab
through the post-1991 period. In 2004, Y.S. Rajasekhar Reddy brought the Congress back to
power in AP after a decade out of office on the back of several populist schemes, including the
promise of free electricity to the state’s farmers (EconomicTimes 2004).
An examination of roads offers more evidence of differential state efforts. A quick glance
at expenditures reveals differences in relative efforts. The average proportion of total expenditure
spent on roads and bridges in Punjab between 1991-92 and 2009-10 was 1.86 per cent compared
to 3.9 per cent compared in Gujarat and 2.9 per cent in AP.
Perhaps no state in India neglected developmental functions as much as Bihar did in the
first fifteen years after liberalization. Equally, no state has seen as rapid a shift in its priorities as
Bihar has after 2005. Though Bihar’s Chief Minister Lalu Prasad Yadav once famously declared
that he would build roads in the state as smooth as the cheeks of prominent Bollywood actress

74
Hema Malini, there were virtually no substantive efforts under the regime that he, and
subsequently his wife, presided over.28 In contrast, Bihar has been in overdrive in terms of road
and bridge construction after the current regime headed by Nitish Kumar came to power in 2005.
Through schemes such as the Mukhya Mantri Sadak Yojana (Chief Minister’s Road Scheme)
and Mukhya Mantri Setu Nirman Yojana (Chief Minister’s Bridge Development Scheme), major
emphasis has been accorded to road and bridge construction. This shift can be seen through the
expenditures on road and bridge construction. The annual average expenditure of Bihar on road
and bridges (as a percentage of total expenditure) was 2.98 per cent between 1991-92 and 2005-
06 while it grew to 7.82 per cent between 2005-06 and 2009-10. The road density per 1000 km
increased from 836.32 km in 2003 to 1275.73 km in 2008.
2.2.2 Regulatory environment related to starting and operating a business
The need for business-friendly regulations have been emphasized by several IFIs (e.g.,
WorldBank 2005b; WorldBank and InternationalFinanceCorporation 2004a). These reports also
suggest that India remains among the more regulated economies in the world. For instance, in the
World Bank and International Finance Corporation’s 2012 Doing Business report, India ranks
132 of 183 countries in terms of the ease of conducting business (WorldBank and
InternationalFinanceCorporation 2012). Since the onset of the competition for capital in 1991,
subnational units have undertaken several regulatory changes. Two aspects of the regulatory
structure – easing bureaucratic procedures required to start a business and rationalizing the
system of inspections by allowing self-certification – have received attention. Yet there tends to
be variation in the scope and implementation of these changes.
28 A variety of media reports have highlighted Lalu Prasad Yadav’s promise to build roads as “smooth as Hema Mailini’s cheeks” (e.g.,Joshi 1996).

75
In terms of easing procedures to start a business, several Indian states have adopted a
“single window system” that, in theory, allows investors to obtain all governmental clearances
required to start a business from a single point. In practice, however, the concept of obtaining all
clearances from one single government node has not worked. In most states, investors continue
to require clearances from multiple agencies in order to start and conduct a business. In the
words of one bureaucrat in Gujarat: “Most states will tell you, they have a single point clearance
system. If you go inside a little, a single point clearance system does not exist anywhere…Single
point clearance is possible up to a point. It is possible in principle…Beyond that, it is not
possible because everything has to be physically acquired. Land has to be acquired, planning has
to be done, water has to be acquired and a power connection has to be given.”29
Despite the overall failure of single window clearance systems to act as a one-stop-shop
for approvals, some states have been more active in undertaking measures to ease regulations.
The scope of the provisions of the single window system also varies across states. For instance,
some states specify time limits that departments can take in giving clearances and include
provisions for ‘deemed clearances’, where permission is assumed to be granted if government
agencies exceed the specified time limit.
Gujarat has been a forerunner in easing regulations to start a business. Formally, its single
window system was put in place in 2000. However, Sinha (2005) clearly outlines that Indextb, a
government agency, has acted as a facilitator and initial point of contact for investors since 1978.
Under Chandrababu Naidu’s government, AP was similarly proactive and undertook a variety of
governance measures aimed at improving the ease of operating businesses. It was the first state
29 Interviews with an official from the Industrial Extension Bureau (Indextb), Government of Gujarat; Gandhinagar, August 27, 2009.
76
in the country to enact formal legislation for the single window system and passed the Single
Window Clearance Act in 2002. The Punjab Industrial Facilitation Act was passed in 2005 and a
special cell in the Industries Department was designated to act as the single window facilitator.
Bihar’s Single Window Act was passed in 2006.
Apart from differences in timing, the scope of these systems and the activities of
investment facilitation agencies in AP and Gujarat stand out clearly from Punjab and Bihar. The
Act in AP designates different committees to act as clearance points based on the level of
investment. From its inception, AP’s single window legislation makes provisions for time-bound
clearances and “deemed” approvals (where the committee in charge automatically gives approval
if an individual department fails to meet time limits for clearances). Like AP, Gujarat’s single
window system includes provisions for time-bound approvals and deemed clearances. Even prior
to 1991, Indextb undertook a range of facilitation and information dissemination tasks (Sinha
2005). It continues to be extremely active, particularly with large projects, serving as an initial
point of contact for prospective investors, setting up interviews with different government
departments and providing a variety of other services related to promotion and information
dissemination.
In contrast, Punjab’s agencies have been very slow to adapt to the needs to the post-
liberalization environments and this is evident in many areas including regulatory measures. The
scope of Punjab’s single window system is more limited than Gujarat’s or AP’s. For instance,
until 2008, Punjab’s single window system did not have any provisions for time bound
clearances or deemed approvals as the other two states did. One study describes the general
failure of Punjab’s single window system thus: “The single window clearance system for
multiple approvals from the state government has not worked. The Udyog Sahayak [Punjab’s

77
single window facilitation cell] is the 17th stop on the train of approvals rather than the one and
only one it is supposed to be” (Ahluwalia et al. 2008: 11).
Unlike single window systems, attempts at easing some regulatory requirements in terms
of inspections of business operations has met with more success. Businesses in India are subject
to variety of state and central laws that require inspections including a plethora of labor laws,
social security laws and workplace safety acts. The four states all adopted self-certification
norms and rationalized inspections but did so at different times. AP one of the first states to
institute self-certification for industries and allows common annual returns to be filed under
various laws. It was also a forerunner in its e-governance initiatives and has set up an on-line
system for most registration and clearance processes. Gujarat has allowed self-certification with
respect to numerous labor and workplace laws for small and medium enterprises since 2000.
Punjab adopted similar measures of self-certification a few years later in 2005 while Bihar did so
in 2006.
2.2.3 Concessions, subsidies and incentives
In the first decade after liberalization, sales tax concessions were one of the main
instruments used by state governments to attract investment. 30 To stem a race to the bottom that
was ensuing and as part of a larger attempt at overall tax reforms, the central government pushed
for the implementation of a value-added tax (VAT) to replace the archaic sales tax system in
2000. Coordination problems and opposition from the states led to delays in implementation and
30 Under the India’s system of fiscal federalism, tax powers are exclusively assigned to the center or to the states. Prior to 2003, the tax on the sale and purchase of goods (“sales tax”) was the main source of revenue for the states. States had complete power over the sales tax and used concessions as the primary tool of investment promotion.

78
the system finally came into force in 2003.31 The introduction of the value-added tax (VAT)
system meant that sales tax concessions could no longer be used as the primary policy tool to
attract investment. Nevertheless, states continue to use a variety of concessions and incentives to
attract business to their jurisdictions including exemptions from stamp duty and registration fees,
electricity duties and concessions on other types of taxes.
The four case studies states, however, have differed in their reliance and ability to offer
concessions. Since 2000, Gujarat has moved towards a more broad-based approach that includes
a focus on infrastructure creation and business-friendly regulatory measures (Gujarat 2000, 2003,
2009). Though its approach is now more broad-based, Gujarat continues to use a variety of non-
sales tax subsidies liberally as can be seen in its discretionary packages to “mega investments.”
The Tata Nano episode, described in the introduction, in many ways epitomizes a dynamic that
has often characterized subnational competition for investment since 1991 – states in India have
liberally used concessions and subsidies to attract large projects. At the same time, large
investors have demonstrated considerable ability to bargain with state governments to obtain
favorable terms.
The leverage that business enjoys tends to be magnified by the fact that concessions to
large investors have typically been offered on a discretionary basis. Over the last two decades,
most state industrial policies openly include provisions that allow for incentives to “mega
investments” on a discretionary, case by case basis (e.g., Andhra Pradesh 1995, 2000, 2005;
Gujarat 1995, 2003). In almost all cases, state governments have chosen not to make the contents
31 The center initially imposed a 2003 deadline for states to switch over to the value-added tax system. However, political wrangling meant that only one state switched over to the new system in 2003. A subsequent 2005 deadline saw most states switch to the system with a few exceptions; importantly those states where the opposition BJP was in power did not switch to the new system. By 2006, even these states had relented. Despite these different dates of adoption, the use of sales tax concessions by states effectively ended in 2003.
79
of these discretionary packages public. Discretionary concessions have been most starkly evident
in certain sectors such as mining and telecom in India, which continue to be substantially
regulated by the central government. In some cases, this has led to the government favoring
certain corporate interests through the allocation of licenses and has involved considerable
corruption, amply demonstrated by the “2G” telecom scandal as well as several episodes in the
mining sector.
States have also offered a variety of subsidies to a broader group of investors besides
large-scale ones. Though the use of sales tax concessions has been eliminated since 2000, states
continue to offer a variety of other concessions and subsidies. These include other types of tax
breaks as well as concessions on land, interest, stamp duty, electricity, and technology. While
concessions and subsidies by themselves are not always sufficient in determining location
decisions, they are often crucial in swinging decisions between two otherwise comparable
locations. Equally, states unable to offer competitive concessions have lost out significantly on
new investments, particularly large-scale projects.
Interviews also indicated that certain sectors appear to be more sensitive to concessions
than others; sectors with low fixed capital investment and where products are easier to transport
tend to be more sensitive to concessions and subsidies. An interesting case is the development of
the pharmaceutical sector in the hill states of Himachal Pradesh and Uttaranchal. These states are
designated as “special category” under India’s system of fiscal federalism. Accorded, special
status for a 10 year period after 2000, these “hill” states were granted an exemption by the center
and allowed by to offer generous tax and excise concessions to attract investment. These policies
bore fruit in some sectors; in particular, these states saw the rapid development of a
80
pharmaceutical industry after the subsidies came in to place, which did not exist prior to the tax
breaks.
Within this broader context, states have differed in their reliance on concessions. Since
the elimination of the sales tax regime, Gujarat has continued to offer concessions but has
adopted a more broad-based approach to investment promotion. Subsidies, however, continue to
be used widely as the Nano case suggests. Media reports point to the continued use of subsidies
as well. For example, in March 2012, a report of the Comptroller and Auditor General of India
(CAG), tabled in the Gujarat Legislative Assembly, alleged that the government had passed on
undue favors to the tune of Rs. 705.4 million (approximately $14 million) to Adani Energy and
Rs. 122 million (roughly $2 million) to Essar Steel, both private corporations, through
concessions on natural gas (IndianExpress 2012).32
AP has been more aggressive in basing its strategy on concessions than most other states.
As a mid-range performer prior to 1991, AP officials suggested that they felt the need to be
extremely aggressive in terms of concessions to industry to be competitive with states such as
Maharashtra, Gujarat and Tamil Nadu, which had established industrial bases.33 In the early
years of liberalization, AP was active in offering discretionary subsidies in terms of land, water
supply and electricity, particularly to large investment projects. The scope of incentives offered
continues to be wide and includes capital investment subsidies, commercial tax concessions,
stamp duty reimbursement, interest subsidies for upgrading technology, concessional power
32 The CAG report was critical of the Gujarat State Petroleum Corporation (GSPC), a government firm, for undue benefits given to two private firms through its oil and gas business. In the case of Adani Energy, the report alleged that the GSPC bought natural gas from the open market and sold it to Adani Energy for a price lower than the market price. In the case of Essar Steel, GSPC waived capacity charges. 33 This was highlighted in interviews with senior bureaucrats, Industries Commissionerate, Government of Andhra Pradesh, November 10 and November 11, 2009, Hyderabad.

81
tariffs, concessions on raw material, reimbursement of expenses incurred in obtaining quality
certification and patents, loan rebates and special concessions for thrust sectors such as
information technology and tourism.
Unlike Gujarat, AP offers many of its incentives in the form of reimbursements. For
example, it offers 100 per cent reimbursement of stamp and transfer duty paid by industry on the
sale of land. Gujarat, on the other hand, offers the same subsidy in the form of an exemption.
Interviews with investors and business association representatives in AP indicate that the
reimbursement system tends to run into problems, particularly when the state’s finances are not
buoyant. Since 2004, a weakening of state finances has led to a backlog of reimbursements owed
to industry.34
Punjab’s finances have affected its ability to offer concessions even more drastically. A
comparison of industrial policies before 2009 showed that Punjab offered fewer subsidies than
either Gujarat or AP. Moreover, its precarious finances have meant that even promises made in
industrial policies often remain unfulfilled. Both interviews as well as studies such as Ahluwalia
et al. (2008) highlighted the fact that these unfulfilled promises meant that the credibility of the
government with investors was low.
Since 2005, Bihar has been trying to actively catch-up with other states. Its 2006
industrial policy offers stamp duty exemptions, VAT subsidies, electricity duty exemptions,
financial assistance for quality certifications, part reimbursement on expenses incurred in
acquiring technical know-how and project reports and exemption of market fees. In addition,
34 Interviews with AP businessmen, November 2009. This was also highlighted in a meeting of the Federation of Andhra Pradesh Chambers of Commerce and Industry (FAPCCI) Hyderabad, November 24, 2009. The meeting was called to deliberate AP’s 2010-2015 industrial policy and the system of reimbursements was identified as one of the major problems by businesspersons at the meeting.
82
Bihar’s government has made repeated pleas to the central government to classify it as a special
category state. This in part would allow it to offer additional excise and other tax incentives as
has been the case with hill states such as Himachal Pradesh and Uttaranchal.
2.2.4 Land acquisition for industrial use
Closely related to the broader aspect of concessions to industry is the issue of land
acquisition by governments for private industrial use. This has, arguably, been the most volatile
and emotional issue surrounding industrialization since 1991. In a country where land holding is
highly fragmented, the matter has resulted in considerable political contestation, pitted
marginalized groups against private capital, and stalled numerous projects. As the previous
section described, one of the most prominent examples that highlighted the problem of land
acquisition by governments was the Tata Nano case. Sustained, often violent protests, against
acquisition led to the Tatas to exit West Bengal and eventually set up the Nano plant in Sanand,
Gujarat in 2008. A year before the Tatas decided to leave West Bengal, the state had been the
site of another controversial episode involving the acquisition of 14,000 acres in Nandigram for
the building of a special economic zone to be developed by the Indonesia-based Salim group in
conjunction with the West Bengal Industrial Development Corporation. The Nandigram agitation
included a particularly violent turn in March 2007, when clashes between protesting villagers
and the West Bengal police resulted in police firing and deaths of 11 villagers (Dam 2007).
The case of West Bengal is hardly unique. Land acquisition problems continue to plague
the single largest foreign direct investment project proposed in India till date – South Korean
steel major Posco’s $12 billion steel plant in Orissa. Though the initial memorandum of
understanding between Posco and the Orissa government was signed in 2005, the project was yet
83
to start in 2013 on account of difficulties in acquiring the 4,004 acres that was part of the
agreement. Most notably, the Posco project met with protests from tribal groups, whose land is
formally protected by provisions in the Indian constitution. The political tensions involved in
land acquisition in the post-liberalization era have often stemmed from the fact that marginalized
groups have viewed the process in zero-sum terms.
Perhaps, no episode emphasized this zero-sum view more starkly than the highly-
publicized case of the bauxite mine proposed by Vedanta, a British firm, in the Niyamgiri Hills
of Orissa. The mine was proposed on an area regarded by the socially and economically-
marginalized Dongria Kondh tribe as sacred and over which they claimed customary rights. The
initial memorandum of understanding (MoU) for the project was signed with the Orissa
government in 2003 but protests from the Dongria Kondh over land acquisition drew support
from a wide transnational network of Indian and international NGOs, including Amnesty
International, social activists, environmentalists and several international celebrities. The issue
also received considerable coverage in both the Indian and international press, particularly in
Great Britain where Vedanta is listed. Subsequently, the Norwegian government, the Church of
England and several European investment companies made decisions to sell shares held in
Vedanta on ethical grounds. 35 After five years of protests, legal battles in India’s Supreme
Court, and extensive media coverage, the Government of India’s Ministry of Environment
denied permission for the project in 2010, though the refusal was based on technical violations of
various environmental laws (Hindu 2010). 35 Aside from NGOs such as Amnesty International and Survival International, the Dongria Kondh’s cause drew support in Britain from public figures including the Archbishop of Canterbury. Activists undertook a major publicity campaign in Britain and frequently disrupted Vedanta shareholder meetings. Media coverage often portrayed the issue in David vs. Goliath terms and frequently characterized it as a real life version of the Hollywood blockbuster film, Avatar, which came out at a time when there were active protests against the Vedanta project (e.g., CNN 2010). The activism paid dividends in Europe with several investment companies, the Church of England and the Norwegian government selling Vedanta shares that they held.
84
These examples are not uncommon and a sizeable list of projects facing land acquisition
problems across Indian states can be drawn up. States have had different approaches to land
acquisition but five broader problems are common to land acquisition throughout India and are
worth noting here. First, land holdings in India are relatively small and highly-fragmented. A
little more than 50 per cent of the population in rural India has land holdings of 0.4 hectares or
less and 18.47 per cent has holdings less than 0.01 hectares (India 2007). Problems of
fragmentation stemming from multiple veto points are compounded by the fact that title to land
is often not clearly assigned in India, making acquisition more difficult and lengthening the legal
process in India’s notoriously slow judicial system.
The second major issue pertains to the actual laws governing acquisition. Acquisition has
largely occurred under the provisions of the Land Acquisition Act of 1894, which permits
governments to acquire for “public purpose.” Under the Act, land can be compulsorily purchased
at prices set by the administration in conjunction with market prices. A landowner whose land is
notified has no choice but to sell (Mody 2010). The Act also does not recognize customary rights
of those who have settled or are cultivating “revenue land.” Multiple levels of government also
have jurisdictional rights over land acquisition. In addition to the Land Acquisition Act, which is
a central act, several states such as Gujarat, Karnataka and Maharashtra have separate laws that
permit land acquisition specifically for industry and are aimed making acquisition even easier
than it is under the Land Acquisition Act. The Gujarat Industrial Development Corporation
(GIDC) Act for instance allows the GIDC to notify land for acquisition and gives landowners no
options but to sell (Mody 2010). One highly-contested issue surrounds the interpretation of what
constitutes “public purpose” in these laws and whether acquiring land for private industrial use
constitutes public purpose (Srinivasan and Sundaram 2008).
85
A third issue central to the politics of land acquisition throughout India is the conversion
of land from agricultural to industrial use. Agricultural land falls under the sole jurisdiction of
subnational governments in India. Most states typically have legal provisions that prevent
automatic conversion to industrial use and require governments to amend or circumvent
provisions to allow such a change. Not surprisingly, the act of democratically-elected
governments taking over agricultural land in a largely rural country and turning it over to private
industry has attracted considerable political protest. This problem has been heightened by the
idiosyncratic nature of India’s economy; growth has been service-sector driven and even
manufacturing tends to capital-intensive (e.g., Subramanian 2008). As such, the promise of
future benefits in terms of employment tends to enjoy little credibility as local populations from
whom land is acquired typically have few skills that can be transferred to capital-intensive or
service industries.
A fourth issue that has been controversial has been the question of relief and
rehabilitation. Given that the Land Acquisition Act forces landowners to sell once acquisition has
been notified and at prices set by the administration, the question of fair remuneration is
particularly salient. The number of litigations over land acquisition has been steadily increasing
in India over time (Srinivasan and Sundaram 2008). Finally, as highlighted in the Vedanta and
Posco cases, acquisition in some states has involved tribal land. Scheduled Tribes typically own
small holdings located in forest and mineral-rich areas, most notably in Orissa, Chhattisgarh,
Jharkhand and Madhya Pradesh.36 With the onset of liberalization and the opening of the mining
sector, tribal land has come under increasing pressure from the private sector. The issue has 36 The economic marginalization of scheduled tribes is evident when household asset size across social groups is examined. In 2002, the average asset value of scheduled tribes was Rs. 136,640 in rural areas and Rs. 240,295 in urban areas, well below the average value across all social groups of Rs. 265,606 in rural areas and Rs. 417,158 in urban areas. In rural areas, 23.5 per cent of scheduled tribe households fell into the lowest asset class of Rs. 30,000 or less compared with 15.9 per cent for all social groups (India 2006).

86
assumed particular importance in light of the violent Maoist movement in these states. The
Maoists, who claim to represent the interests of the larger tribal population, have suggested that
collusion between the state and business has resulted in the illegal expropriation of tribal land
and have demanded the suspension of mining activity (Lamont 2010).
While these issues have been common to the dynamics of land acquisition throughout
India, some states have been marginally more successful at acquiring land for private industrial
use. Arguably, Gujarat has witnessed less turmoil and contestation over land acquisition than
most other Indian states. This was most notably highlighted in the case of the Tata Nano project,
the government was able to identify almost 1100 acres of (government-owned) land for the
project within a 48-hour span. 37 It has been one of the states that has been active in acquiring
land for purposes such as the creation of special economic zones (e.g., Fernandes 2007). Part of
Gujarat’s strategy has been to acquire land first for a land bank from which allocations are then
made to private players at a later time. This was the general strategy used by the Gujarat
Maritime Board (GMB) to develop greenfield private ports, which formed a key part of its
successful port-led industrialization activities. The GMB initially acquired land and then turned
it over on a lease basis to private players.38 The Gujarat government over time has also actively
facilitated acquisition by making necessary legal changes such as easing conversion of
agricultural land to industrial use without prior approval. Similarly, it has amended procedures
for industry to acquire land immediately adjacent to highways.
Bureaucrats in Gujarat suggested that land acquisition in Gujarat was relatively less
controversial than other states for two reasons – large amounts of government-owned and waste
37 Interviews with various bureaucrats in Gujarat, July-September 2009. 38 Interview with senior bureaucrat, Gujarat Maritime Board, Gandhinagar, August 27, 2009.
87
land was available in the state and that the government has typically encouraged buyers and
sellers to negotiate directly.39 While the Gujarat government has not been involved in direct
negotiations as frequently as those in in other states, it nevertheless has often been actively
involved, particularly in the case of large projects. By and large, Gujarat’s strategy of acquiring
land and transferring it first to a land bank seems to be more successful than cases where
governments have stepped into acquire for specific projects.
Like its counterparts in Gujarat, AP’s government agencies such as APIIC have been
active in acquiring and developing land for industrial use. Unlike Gujarat, land acquisition has
been considerably more contentious. The state has tended to be directly involved in negotiating
with landowners on behalf of industry. APIIC has also been active in building land banks to turn
over for future industrial use. AP has also made the land conversion from agricultural to
industrial use automatic on the payment of necessary fees. It also provides reimbursement on
stamp and transfer duty on the sale and transfer of land to industry. Both AP and Gujarat provide
concessional land to thrust sectors such as agro-processing (in Gujarat) and IT in Andhra
Pradesh.
One of the main constraints to the growth of manufacturing sector in Punjab has been the
prohibitive cost of land. Given the importance of agriculture in the state and high fertility of land,
this is not surprising. Further, land holdings in Punjab are extremely small, making it more
difficult for industry to acquire large tracts of private land. The political and economic leverage
that agriculture enjoys in the state has meant that the Punjab government has been almost
entirely reluctant to get involved in land acquisition. It has been much less proactive in
39 Interviews with various bureaucrats in Gujarat, July-September 2009.
88
developing land banks. In 2005, Punjab introduced a scheme for concessional allocation of land
within industrial areas to industry.
However, unlike AP and Gujarat, the number of industrial areas and estates remain
stagnant due to the high price of land. Bihar’s low industrialization has meant that land is not a
major issue in the state. The government however has actively stayed away from creating SEZs
or industrial areas. The 2006 industrial policy makes provisions for the establishment of land
bank by the state to turn over for future industrial use.
2.2.5 Labor laws
Indian labor laws are among the most stringent in the world particularly with regard to
employers’ ability to hire and fire (e.g., WorldBank 2006). Reform in this area has been a long-
standing policy demand of business in India. Authors such as Panagariya also suggest that “the
key barrier to the emergence of large-scale, unskilled-labor-intensive firms is the complex set of
labor laws they face” (2008: 288). Besley and Burgess (2004) examine labor regulation across
Indian states and find that pro-worker regulations resulted in lower output, employment,
investment and productivity in the formal manufacturing sector.
Labor is a concurrent subject according to the Indian constitution with the center and
states sharing jurisdictional authority. States are allowed to make amendments to both central
and state laws. More importantly, the primary responsibility for enforcement of labor laws lies
with state governments. Both these factors offer scope for differing regulatory environments
across states, particularly in the area of labor market flexibility. Various governments at the
national and state levels have demonstrated an inclination to reform labor laws in a pro-business
direction but have abandoned such plans in the face of political opposition, mainly from unions
89
affiliated with various political parties spanning the range of the ideological spectrum.
Nevertheless, labor reform has been taking place by “stealth” in India (Jenkins 2004a). This has
partially occurred through the lax enforcement of existing labor laws, which is the sole
responsibility of subnational governments, in the reforms era. This has, in turn, provided de facto
flexibility to firms (e.g., Anant et al. 2006; Bhattacharjea 2006; Jenkins 2004a).
There extent to which de facto liberalization of labor laws has been occurring across
states is difficult to measure. Formal legislative changes to labor laws have been few and far
between due to political opposition but a few states have managed to make small inroads. One of
the most contentious pieces of labor legislation in India has been the Industrial Disputes Act
(IDA), in particular, section V of this law. This section mandates that firms employing more than
100 workers obtain state government permission before closure, lay-offs or retrenchment. Even a
single lay-off requires state government authorization. Some states, however, have managed to
make some changes to the IDA or allow firms to circumvent the rules lawfully. In Gujarat, for
instance, firms in special economic zones (SEZs) enjoy considerable flexibility with respect to
several provisions of section V of the IDA. The state has also reduced the number of labor
inspections and allows self-certification for most labor laws.
Under Chandrababu Naidu, AP made headlines by amending another contentious labor
law – the Contract Labor Act. The Contract Labor Act includes strong regulations against the use
of contract labor in core activities of the firm and mandates that such labor be absorbed as
permanent employees after a specified time. Along with the flexibility to hire and fire, business
has been demanding the right to use contract labor since the start of the liberalization process.
AP liberalized its contract labor laws in 2003 by amending the definition of core and non-core
activities, making it easier for firms in the state to use contract labor. AP also allows flexibility

90
under section V of the IDA, the Minimum Wages Act, Shops and Labor Act and the Trade
Union Act for firms in SEZs. AP also treats export-oriented units as public utilities. By this
provision, the right of workers to strike is severely restricted. Gujarat and AP both allow
information technology (IT) and some other sectors to operate three shifts, employ women
workers at night and work for all days in the year, which required exemptions from several
existing laws.
Punjab allows similar privileges to the IT sector in terms of shifts and work hours but has
not carried out the legislative amendments to the Contract Labor Act or Section V of the IDA as
Gujarat and AP have. Bihar’s labor regime is more stringent. Other than allowing flexibility to
the IT sector in terms of hours, closure and women workers, it has taken very few formal steps to
amend its labor laws.
Though it is not solely tied to state policy measures, the nature of labor relations varies
across states in India. This can be seen through industrial dispute statistics. In 2007, there were
3,19,850 mandays lost in Andhra Pradesh due to industrial disputes (in the state sphere). The
comparable numbers for Gujarat, Punjab and Bihar are 86,952, 49,015 and 44,971 respectively
(India 2009 and 2010). These numbers are still significantly lower than the state with highest
number of mandays lost in 2007 – West Bengal with 23,707,156.
2.2.6 Special Economic Zones (SEZs)
High levels of regulation and low quality infrastructure have typically impeded the ability
of Indian states and the country as whole in attracting investment (e.g., Panagariya 2008). In a
bid to circumvent stringent regulations in areas such as labor while simultaneously creating
pockets of high quality infrastructure, the central government formulated a Special Economic
91
Zones (SEZ) Policy in 2000. Subsequently, an SEZ Act was passed (India 2009). SEZs
essentially function as duty-free enclaves and units in these areas are entitled to a host of fiscal
concessions and other subsidies. In many ways, SEZs are similar to export processing zones
created by other developing countries. Along with receiving a variety of concessions and having
access to duty free imports, firms in SEZs are subject to fewer clearance procedures and
regulations, particularly labor laws. For example, the contentious section V-B of the Industrial
Disputes Act is not applicable to firms located in SEZs in Gujarat and AP. In addition,
compliance of laws in SEZs is typically done on the basis of self-certification and not through
inspections.
Though touted as vital instruments to attract investment, states have varied in both their
intent and capacity to create SEZs. Both AP and Gujarat have been among the most aggressive in
promoting the concept of SEZs. AP passed its SEZ policy in 2002 while Gujarat passed a SEZ
Act in 2004. Both states provide flexibility in labor laws to units within SEZs including greater
flexibility in hiring and firing workers. Punjab brought out an SEZ Policy in 2005 but the state
has been sluggish in its efforts to create SEZs. Bihar on the other hand has completely eschewed
the concept.
The number of SEZs approved and created in each of these states provides a clear
contrast. As of March 2013, forty seven SEZs have been approved in Gujarat (formal and in-
principle approvals) while 32 have been notified. AP has 115 approvals and 76 notifications, the
highest number in the country. Punjab in contrast has 8 approvals and only 2 notifications. Bihar
is yet to approve a single SEZ. 40
40 Calculations of the number of SEZs (formal and in-principle approvals) based on the list of functional special economic zones, Ministry of Commerce and Industry (www. sezindia.nic.in); accessed March 31st, 2013.
92
2.2.7 Formal organizational framework for industrialization and investment
Sinha (2005) points to differences in the organizational structure of states industrial
apparatuses in explaining divergent patterns of investment witnessed in the pre-1991 period.
State institutional structures have responded in varied ways to economic liberalization. In
relation to investment promotion and industrialization, this is evident in two different areas –
overall approach of the bureaucracy towards business and, at a more specific level, the
functioning of state industrial development corporations and state finance corporations. These
industrial and finance corporations were key players in the industrial apparatus of states prior to
1991. The original mandate of these organizations lost relevance with market reforms but some
industrial and finance corporations managed to find a new role in the changed environment
whereas others did not.
Similarly the onset of liberalization necessitated an attitudinal change in most state
bureaucracies. Inured by years of dirigistic policies, most state bureaucracies had to adapt to an
environment where they were required to become responsive to business needs. Bureaucracies
in some states were able to make the transition more easily than others. In Gujarat’s case, the
liberalization era did not involve a major transformation. As Sinha (2005) chronicles, Gujarat’s
bureaucracy was always supportive of the private sector, even in the license-permit era. The
nature of the state-business collaboration in Gujarat has, in many ways, been reminiscent of
some of the classic developmental states of East Asia. Gujarat has built on this base after 1991,
creating an even more investor-friendly climate after economic reforms.
In contrast, AP saw considerable change in the post-1991 period. AP was firmly a
middle-rung state along most parameters of economic and social development before 1991. It

93
emerged as a strong performer in the post-1991 environment. In part, this involved building a
stronger organizational framework and making bureaucratic institutions more responsive to
industry. The impetus for this change began during Chandrababu Naidu’s regime between 1994
and 2004. In his autobiography, Naidu describes attempts to change the attitude of the
bureaucracy in AP when he took over. “When I started interacting directly with industry, they
would tell me: ‘your officials look down upon industry. They treat us as the starting point of all
ills in society’… With the exception of Gujarat most states in the country are run by politicians
and bureaucracies which have traditionally treated industry with suspicion…In Gujarat, the
bureaucracy is entrepreneurial…they are investment-friendly, investor-friendly, corporate-
friendly. Today in Andhra Pradesh, we are trying to create a similar environment in which
industry and government can be partners in driving the state’s economic growth. But again, the
mindset has to change all the way down” (Naidu 2000: 149).
Such attempts at increasing bureaucratic responsiveness to business has not occurred in
Punjab. Ahluwalia et al (2008) suggest the state’s apathy to industry stems from experience with
militancy in the 1980s when administrative functions took a back seat and a general tendency
toward an “inspector-raj” was strongly institutionalized in the state.
Bihar’s story saw a major shift after 2005. Prior to 2005, the state’s Chief Minister Lalu
Yadav viewed the process of economic development as an upper caste project and sought to put
a brake on initiatives. Not surprisingly, bureaucrats had little power to function but this occurred
in a context of a virtual breakdown of state authority. Since 2005, the state has seen major
recovery under Nitish Kumar. One of the central planks of his broader strategy has been to
rebuild the state’s institutional capacity. This has involved passing numerous laws, setting up
94
organizations, reviving existing corporations, and creating a credible environment to attract
investment.
In addition to an attitudinal shift on the part of the bureaucracy, economic reforms have
also required state agencies to adapt to the new environment. Certain state-run industrial
corporations have managed to do so while others have become defunct. Prior to liberalization, all
Indian states had set up industrial development and finance corporations. The main
responsibilities of industrial development corporation included developing industrial areas,
building industrial infrastructure, helping entrepreneurs obtain licenses from the central
government, undertaking project financing and sharing risk in industrial projects through equity
participation and joint-ventures. State finance corporations were set up primarily to provide low-
interest loans to industry and often acted in conjunction with central government-owned banks,
such as the Industrial Credit and Investment Corporation of India (ICICI) and Industrial
Development Bank of India (IDBI), which were set up with the sole purpose of providing
industrial finance.
Liberalization led to a major change in the context within which state industrial and
finance corporations operated. Banks such as ICICI were privatized and subsequently began
focusing on commercial banking rather than development finance for industry. Access to the
country’s growing capital markets as well as foreign markets also offered new sources of finance
for industry. As a result, the role of state finance corporations in providing capital to industry
became far less relevant. In many states, state finance corporations have become defunct while in
others, they lead a skeletal existence.
95
Liberalization similarly required industrial corporations to adapt to the new environment.
Corporations in some states managed to adapt themselves faster to the post-1991 environment,
performing different tasks than before, while they have not done so in other states. The Gujarat
Industrial Development Corporation (GIDC) remains active; since 1991, it has primarily been
involved in acquiring land, building industrial estates, developing industrial infrastructure, and
allotting land to the private sector. Aspects such as project financing and risk sharing are,
however, no longer priorities for GIDC. It also plays a less significant role in the regular
maintenance of industrial estates and has devolved some of these responsibilities to business
associations.
Unlike the GIDC, which found a new role in the post-1991 environment and remains
viable, industrial development corporations in AP and Punjab are virtually defunct. Set up in
1960, Andhra Pradesh Industrial Corporation (APIDC) was the oldest industrial corporation in
the country. Unlike its counterpart in Gujarat, APIDC has not been able to adapt to the changing
business environment. The corporation was set up to perform four main functions – helping
industry obtain licenses from the central government to set up in AP, starting joint ventures with
the private sector, project financing, risk sharing through equity participation and industrial
promotion through road shows and information events.41 With the elimination of the licensing
system, decline of development finance and growing size of projects which have made equity
participation unviable, APIDC has struggled to adapt. In 2006, the state government decided to
shut down APIDC. However, the government did not implement this decision and APIDC
continues to exist, albeit in a minimal form. In contrast to APIDC, the Andhra Pradesh Industrial
Investment Corporation (APIIC) has managed to reorient its tasks successfully after 1991. With a
41 Interview with senior bureaucrat, APIDC; Hyderabad, November 12, 2009.

96
focus on land acquisition and development (similar to GIDC’s post-1991 activities), APIIC has
remained active and financially successful. Some interviewees suggested that the APIIC has
survived as it has acted primarily as a developer at a time when the real estate market has grown
exponentially in India.
The experience of the Punjab State Industrial Development Corporation (PSIDC) mirrors
that of the APIDC. Its overall decline in the post-1991 environment led the government in 2006
to consider its closure. Bihar’s industrial apparatus, like other state institutions, was virtually
dormant in the 1990s. Since 2005, the state has made a concerted effort to build its
organizational and institutional framework for industrialization. This has included passing
several major pieces of legislation, setting up organizations such as the Bihar Industrial Area
Development Authority (BIADA) and the State Investment Promotion Board. In addition, some
state-run infrastructure corporations such as the Road Construction Corporation and the Bridge
Construction Corporation have been highly successful in recent times.
2.2.8 Branding and information dissemination
Through the 1990s, a handful of chief ministers acquired reputations for aggressively
marketing their states to investors at various forums. For Rudolph and Rudolph (2001), this
aspect of chief ministers acting as “entrepreneurs” is one of the aspects that distinguish India’s
pre and post-1991 economic environment. Along with the initiatives of individual chief
ministers, some state agencies have been more aggressive in their branding and promotion
activities than others.
Gujarat, over the last decade, has institutionalized the promotional aspect better than any
other state. Among numerous promotion activities, the state conducts a biannual investor summit
97
– the Vibrant Gujarat summit – aimed at showcasing the state. Whatever its actual impact,
Gujarat’s investor summits have garnered considerable attention in the Indian media. Gujarat has
managed to attract some of the biggest names in Indian business and strengthen its credibility
through their support of these events. One of most publicized episodes was in the 2007 Vibrant
Gujarat summit when Ratan Tata, Chairman of the Tata Group, made the oft-quoted statement:
“You are stupid if you are not in Gujarat” (Pandit 2008).
While the actual impact of such marketing and publicity is difficult to ascertain, other states
have replicated Gujarat’s model by conducting their own summits. Given that investment is often
driven by perceptions of businesspersons, these publicity drives appear may have some effect on
the margins. Gujarat’s main investment facilitation agency, Indextb, also undertakes various
other promotion activities such as road shows, participation in trade fairs and summits. It should
be noted that Indextb was involved promotion and marketing activities, even in the pre-1991
environment (Sinha 2005).
AP has also been active in promotional and branding tasks. However, those marketing
efforts were never institutionalized as they have been in Gujarat. Moreover, Chandrababu
Naidu’s openly pro-business policies and rhetoric ultimately contributed to his electoral defeat in
2004, resulting in his sucessors considerably toning down the pro-business tone of the state.
Unlike Gujarat and AP, Punjab government carries out few promotional activities. Since 2005,
Bihar has been actively marketing itself through road shows and highlighting its changing
business environment. Like Gujarat, it has also organized “Global Bihar” summits, aimed at
showcasing changes in the state and attracting investment from domestic investors and overseas
Biharis.
98
2.3 Policies and investor perceptions
As the previous section detailed, states have responded very differently to the competition
for investment. While it is clear that policy differences exist, one peripheral issue needs to be
addressed. Are investors affected by such policy differences? In this dissertation, I try to
emphasize that policies matter in investment decisions in several ways. Chapter 1 briefly
outlined claims from several existing studies that suggest that policies affect growth-related
outcomes, including investment (e.g., Besley et al. 2007; Kochhar et al. 2006b; Purfield 2006). I
draw on two other sources at the micro-level to suggest that investors respond to policies.
Interviews conducted with investors during fieldwork strongly support the view that policies
affect business prospects, and I utilize evidence from interviews throughout the case studies. In
this section, I briefly draw on evidence from the 2005 Firm Analysis and Competitiveness
Survey42 conducted by the World Bank and Confederation of Indian Industry to show that
policies affect investor perceptions. The survey includes 2,286 organized sector firms of various
sizes in 15 Indian states on several variables related to operation and profitability of businesses
(WorldBank 2005a).
This survey data is useful in highlighting two aspects. First, the data clearly highlights that
several policy dimensions under the jurisdiction of subnational governments are perceived as
major or severe constraints to business operations and profitability. As figures 2.1 and 2.2 show,
the policy dimension most commonly identified as a major or very severe constraint by
respondents was electricity, which primarily falls under the jurisdiction of subnational
governments in India. Thirty-six per cent of respondents identified electricity as a major or very
42 This survey is part of the Enterprise Surveys conducted by the Enterprise Analysis Group of the World Bank. The 2005 survey was conducted face-to-face and undertaken in partnership with the Confederation of Indian Industry. The data and associated information can be found at www.enterprisesurveys.org .
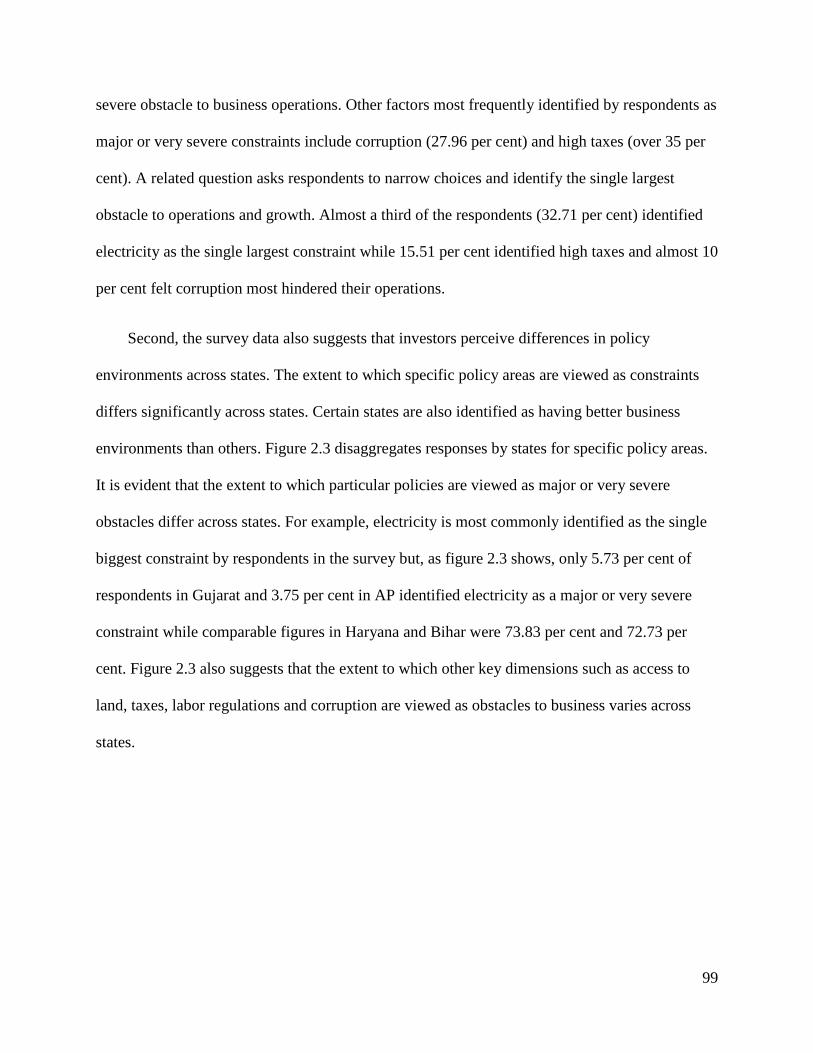
99
severe obstacle to business operations. Other factors most frequently identified by respondents as
major or very severe constraints include corruption (27.96 per cent) and high taxes (over 35 per
cent). A related question asks respondents to narrow choices and identify the single largest
obstacle to operations and growth. Almost a third of the respondents (32.71 per cent) identified
electricity as the single largest constraint while 15.51 per cent identified high taxes and almost 10
per cent felt corruption most hindered their operations.
Second, the survey data also suggests that investors perceive differences in policy
environments across states. The extent to which specific policy areas are viewed as constraints
differs significantly across states. Certain states are also identified as having better business
environments than others. Figure 2.3 disaggregates responses by states for specific policy areas.
It is evident that the extent to which particular policies are viewed as major or very severe
obstacles differ across states. For example, electricity is most commonly identified as the single
biggest constraint by respondents in the survey but, as figure 2.3 shows, only 5.73 per cent of
respondents in Gujarat and 3.75 per cent in AP identified electricity as a major or very severe
constraint while comparable figures in Haryana and Bihar were 73.83 per cent and 72.73 per
cent. Figure 2.3 also suggests that the extent to which other key dimensions such as access to
land, taxes, labor regulations and corruption are viewed as obstacles to business varies across
states.
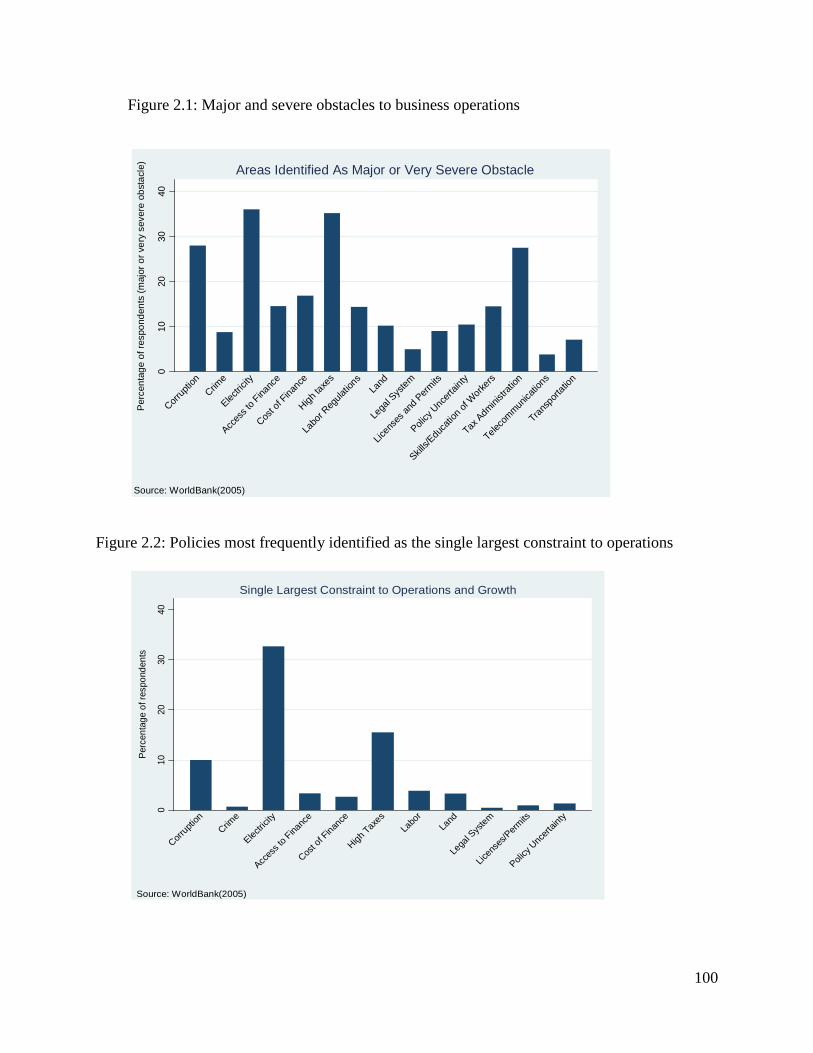
100
Figure 2.1: Major and severe obstacles to business operations
Figure 2.2: Policies most frequently identified as the single largest constraint to operations
010
2030
40
Per
cent
age
of re
spon
dent
s (m
ajor
or v
ery
seve
re o
bsta
cle)
Corrup
tion
Crime
Electric
ity
Acces
s to F
inanc
e
Cost o
f Fina
nce
High ta
xes
Labo
r Reg
ulatio
nsLa
nd
Lega
l Sys
tem
Licen
ses a
nd Perm
its
Policy
Unc
ertain
ty
Skills/E
duca
tion o
f Work
ers
Tax Adm
inistr
ation
Teleco
mmunica
tions
Transp
ortati
on
Source: WorldBank(2005)
Areas Identified As Major or Very Severe Obstacle0
1020
3040
Perc
enta
ge o
f res
pond
ents
Corrup
tion
Crime
Electric
ity
Acces
s to F
inanc
e
Cost o
f Fina
nce
High Tax
esLa
bor
Land
Lega
l Sys
tem
Licen
ses/P
ermits
Policy
Unc
ertain
ty
Source: WorldBank(2005)
Single Largest Constraint to Operations and Growth

101
Figure 2.3: Policy constraints across states
Investors view some states as having a better business environment than others. When asked
to identify the state with the best business environment, respondents most frequently chose
Maharashtra (23.42 per cent) and Gujarat (22.35 per cent). On average, respondents suggested
that their cost of production would decrease by 11.34 per cent if there were located in the state
which they considered to have the best business environment in the country.
Finally, the data is generally suggestive of policy factors directly affecting location
decisions. Since respondents were allowed to identify more than one factor as affecting
investment decisions and were not asked to rank these factors, it is difficult to gauge the relative
importance of these different dimensions. Nevertheless, the data offer some insights on location
decisions. A home bias exists with a majority of firms suggesting that they were located in a
020
4060
80
APBIH
GUJHAR
JHA
KARKER
MAH MPORI
PUNRAJ TN UP WB AP
BIHGUJ
HARJH
AKAR
KERMAH MP
ORIPUN
RAJ TN UP WB APBIH
GUJHAR
JHA
KARKER
MAH MPORI
PUNRAJ TN UP WB
Corruption Electricity Taxes
Contraints Across States0
1020
30
APBIH
GUJHAR
JHA
KARKER
MAH MPORI
PUNRAJ TN UP WB AP
BIHGUJ
HARJH
AKAR
KERMAH MP
ORIPUN
RAJ TN UP WB APBIH
GUJHAR
JHA
KARKER
MAH MPORI
PUNRAJ TN UP WB
Labor Regulations Access to Land Transportation
Perc
enta
ge o
f res
pond
ents
(maj
or o
r ver
y se
vere
obs
tacl
e)
Source: WorldBank(2005)
102
particular state because the owners or major shareholders belonged to the state. Nevertheless, a
sizeable portion – 30.39 per cent of respondents – suggested that concessions and benefits given
by the state government drove location decisions. Almost 53 per cent suggested that natural
resource availability was a factor in location decisions. These aspects lend some support to the
view that both initial conditions as well as policy variables affect location decisions.
2.4 Conclusion: the changing role of the state in industrialization
In this chapter, I detailed the varied policy differences in the four case study states along a
variety of dimensions. Based on a detailed examination of policies in the four case study states –
Gujarat, Andhra Pradesh, Punjab and Bihar – I suggest some states have been more aggressive in
the competition for investment than others. This has meant that policies have differed in speed
and scope; aggressive states have formulated policies more investor-friendly in scope and have
also adopted these measures at an earlier time.
Among the four main cases, Gujarat has been consistently more aggressive in the
competition for investment than other states. In contrast, Punjab has been largely apathetic to the
competition for investment throughout the post-1991 period. Like Gujarat, Andhra Pradesh has
been one of the more business-friendly states in the country. However, its pro-business
commitments have not been as consistent as Gujarat’s and have varied over time. For most of
post-1991 period, Bihar’s government largely neglected development tasks. A change of
government in 2005 led to a major transformation in governance and it has been active in
undertaking a variety of policy measures aimed to attract investment since then. Having
suggested that policies differ considerably across Indian states, the chapter also used data from
the 2005 Firm Analysis and Competitiveness Survey, conducted by the World Bank and
103
Confederation of Indian Industry, to show that several policy factors under the purview of
subnational governments are viewed as major obstacles to business operations and growth.
Conceptually, in its emphasis on the economic role of the state, this dissertation shares an
affinity with the developmental state literature (e.g., Johnson 1982; Amsden 1989; Wade 1990;
Evans 1995; Kohli 2004). Based largely on East Asia’s rapid industrialization after World War
II, the developmental state literature argued that successful late developers have been backed by
effective activist states. An analysis of investment promotion in India suggests that the economic
role of the state in development remains as relevant today as it was during East Asia’s dramatic
transformation. States perform vital tasks that affect investor decisions. However, the context
within which the state has to operate is now qualitatively different. Increased capital mobility
and electoral pressures have placed major constraints on the ability of states to effect successful
economic change, a trend that did not exist earlier.
The effect of electoral pressures on the state’s ability to formulate economic policy forms the
central theme of my argument and is elaborated through the four cases in chapters 3 and 4. The
comparison of policies undertaken by more and less proactive states in this chapter speaks to
another point on state involvement. In particular, it suggests that the type of policy tools across
Indian states differs from those utilized by the classic developmental states of East Asia. As
Kohli (2012) suggests, state intervention in India has always been largely facilitative rather than
transformative. Such a focus on facilitation rather than direct involvement has been even more
evident in the Indian context after 1991. States such as Gujarat see their primary role as creating
a supporting environment where transactions costs for business are lowered. Unlike the classic
developmental states, there are few attempts to manufacture comparative advantage or “pick
winners.”

104
While the nature of state involvement appears to be less direct than the East Asian case, it is
nevertheless substantial. More proactive states have developed sound infrastructure, created a
favorable regulatory environment for capital and offered a range of concessions and subsidies to
encourage business to locate in their jurisdictions. They have developed bureaucratic apparatuses
that are more responsive to the needs of capital. States that have been more aggressive in
undertaking such tasks have reaped rewards in terms of investment. This is particularly true of
infrastructure and special economic zones, where states that have moved first have benefitted
considerably.
Certain policy tools are clearly less prevalent in today’s globalized context. One prominent
example is that of concessional finance. In the case of success stories such as South Korea, firms
relied heavily on state-owned banks for finance requirements. Governments, in turn, extracted
performance from firms through their control of finance. In the Indian case, state-owned banks
and development corporations were major sources of finance prior to 1991. Financial
liberalization since 1991 has led to a markedly different scenario. The growth of the Indian stock
market, private banks and the ability to raise capital abroad has meant more diverse sources of
finance for firms. In turn, this has limited the use of a policy tool previously available to the
state.
The shift in the type of policy tools used also demonstrates the considerable leverage that
mobile capital enjoys. Successful state involvement in the Indian context has involved more
carrots than sticks. Widespread use of concessions and subsidies, particularly in areas such as
land, continues to be prevalent. Such sops to business are clearly suggestive of business’ growing
power after 1991. Large investors, in particular, are able to bargain between competing states to
extract favorable terms.
105
Subnational policy responses also speak to a second broader debate. Proponents of the
convergence hypothesis have argued that units competing for mobile capital are likely to adopt
similar capital-friendly policies (Andrews 1994; Cerny 1993). At the extreme, this view suggests
a race to the bottom in several policy areas. An examination of policies in the competition for
investment in India does indeed suggest that mobile capital possesses considerable leverage.
However, this does not automatically lead to similar policy responses across competing units. As
section 2.2 outlined in considerable detail, the speed and scope of policies has differed across
units. As the next two chapters will try to suggest, these differences are due to the varying nature
of political constraints placed on subnational governments. In particular, I argue that certain
types of electoral coalitions allow governments to create more business-friendly environments
than others. In that sense, viewpoints that predict policy convergence largely neglect the power
of political constraints, particularly in a democracy that is largely poor.
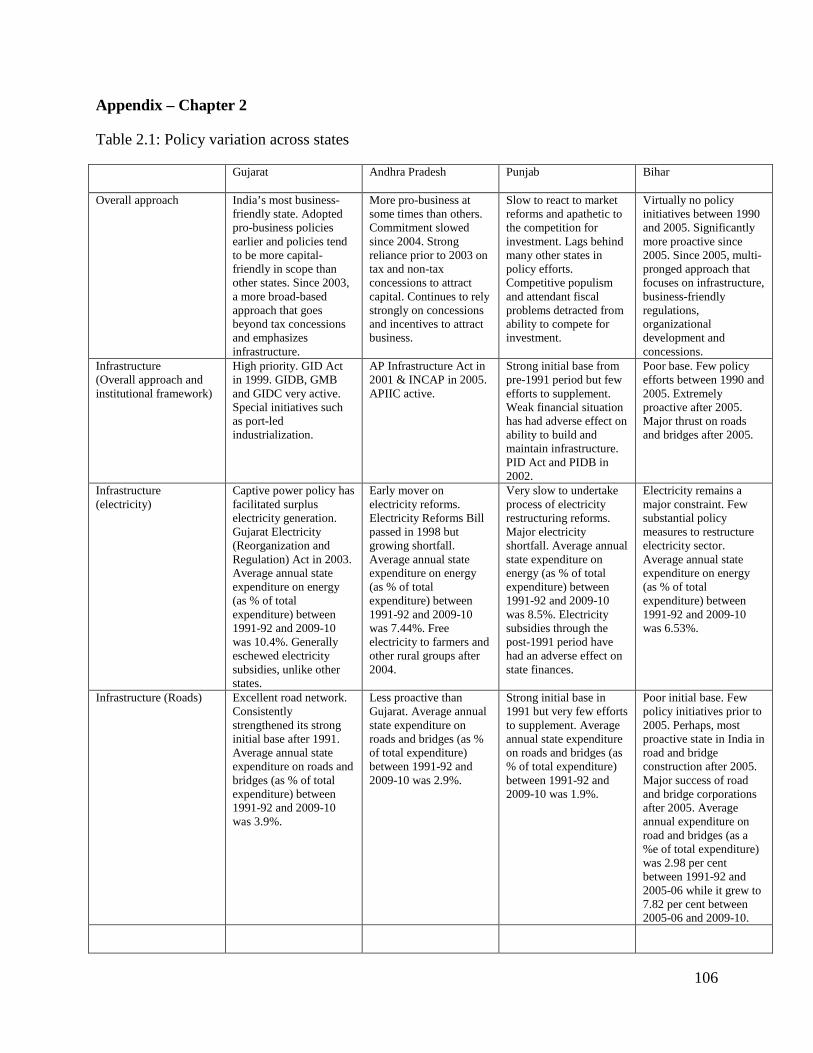
106
Appendix – Chapter 2
Table 2.1: Policy variation across states
Gujarat Andhra Pradesh
Punjab Bihar
Overall approach India’s most business-friendly state. Adopted pro-business policies earlier and policies tend to be more capital-friendly in scope than other states. Since 2003, a more broad-based approach that goes beyond tax concessions and emphasizes infrastructure.
More pro-business at some times than others. Commitment slowed since 2004. Strong reliance prior to 2003 on tax and non-tax concessions to attract capital. Continues to rely strongly on concessions and incentives to attract business.
Slow to react to market reforms and apathetic to the competition for investment. Lags behind many other states in policy efforts. Competitive populism and attendant fiscal problems detracted from ability to compete for investment.
Virtually no policy initiatives between 1990 and 2005. Significantly more proactive since 2005. Since 2005, multi-pronged approach that focuses on infrastructure, business-friendly regulations, organizational development and concessions.
Infrastructure (Overall approach and institutional framework)
High priority. GID Act in 1999. GIDB, GMB and GIDC very active. Special initiatives such as port-led industrialization.
AP Infrastructure Act in 2001 & INCAP in 2005. APIIC active.
Strong initial base from pre-1991 period but few efforts to supplement. Weak financial situation has had adverse effect on ability to build and maintain infrastructure. PID Act and PIDB in 2002.
Poor base. Few policy efforts between 1990 and 2005. Extremely proactive after 2005. Major thrust on roads and bridges after 2005.
Infrastructure (electricity)
Captive power policy has facilitated surplus electricity generation. Gujarat Electricity (Reorganization and Regulation) Act in 2003. Average annual state expenditure on energy (as % of total expenditure) between 1991-92 and 2009-10 was 10.4%. Generally eschewed electricity subsidies, unlike other states.
Early mover on electricity reforms. Electricity Reforms Bill passed in 1998 but growing shortfall. Average annual state expenditure on energy (as % of total expenditure) between 1991-92 and 2009-10 was 7.44%. Free electricity to farmers and other rural groups after 2004.
Very slow to undertake process of electricity restructuring reforms. Major electricity shortfall. Average annual state expenditure on energy (as % of total expenditure) between 1991-92 and 2009-10 was 8.5%. Electricity subsidies through the post-1991 period have had an adverse effect on state finances.
Electricity remains a major constraint. Few substantial policy measures to restructure electricity sector. Average annual state expenditure on energy (as % of total expenditure) between 1991-92 and 2009-10 was 6.53%.
Infrastructure (Roads) Excellent road network. Consistently strengthened its strong initial base after 1991. Average annual state expenditure on roads and bridges (as % of total expenditure) between 1991-92 and 2009-10 was 3.9%.
Less proactive than Gujarat. Average annual state expenditure on roads and bridges (as % of total expenditure) between 1991-92 and 2009-10 was 2.9%.
Strong initial base in 1991 but very few efforts to supplement. Average annual state expenditure on roads and bridges (as % of total expenditure) between 1991-92 and 2009-10 was 1.9%.
Poor initial base. Few policy initiatives prior to 2005. Perhaps, most proactive state in India in road and bridge construction after 2005. Major success of road and bridge corporations after 2005. Average annual expenditure on road and bridges (as a %e of total expenditure) was 2.98 per cent between 1991-92 and 2005-06 while it grew to 7.82 per cent between 2005-06 and 2009-10.
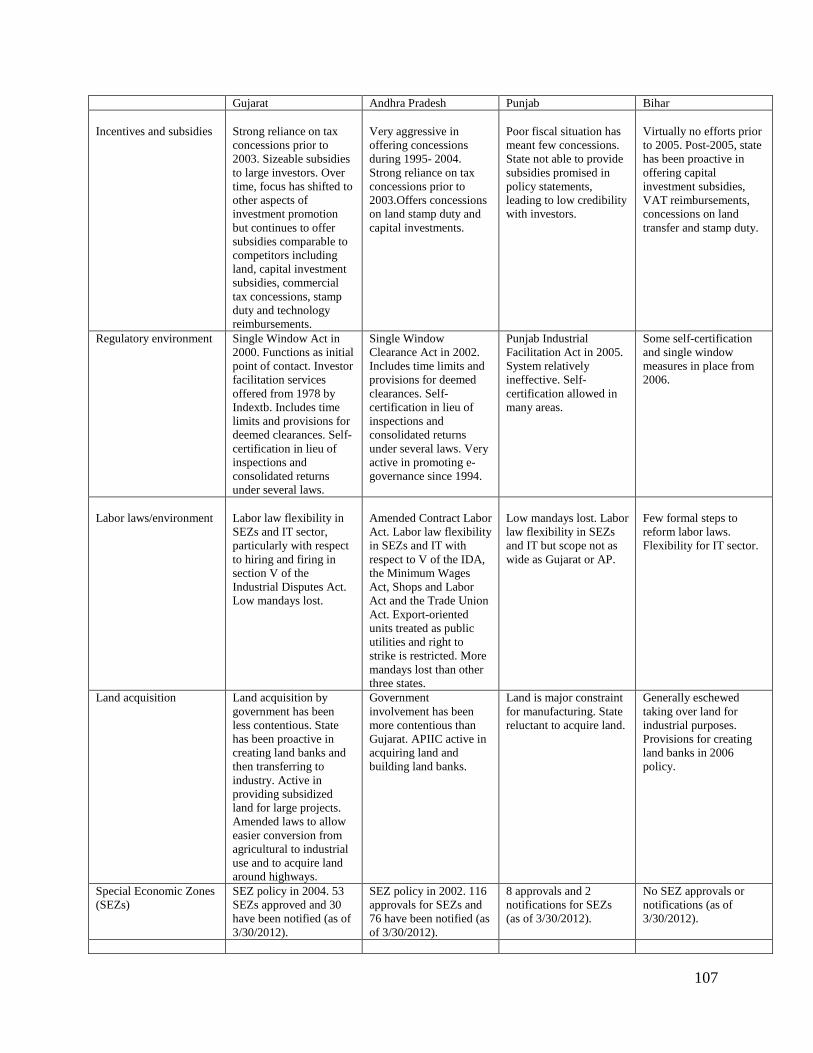
107
Gujarat Andhra Pradesh Punjab Bihar Incentives and subsidies
Strong reliance on tax concessions prior to 2003. Sizeable subsidies to large investors. Over time, focus has shifted to other aspects of investment promotion but continues to offer subsidies comparable to competitors including land, capital investment subsidies, commercial tax concessions, stamp duty and technology reimbursements.
Very aggressive in offering concessions during 1995- 2004. Strong reliance on tax concessions prior to 2003.Offers concessions on land stamp duty and capital investments.
Poor fiscal situation has meant few concessions. State not able to provide subsidies promised in policy statements, leading to low credibility with investors.
Virtually no efforts prior to 2005. Post-2005, state has been proactive in offering capital investment subsidies, VAT reimbursements, concessions on land transfer and stamp duty.
Regulatory environment Single Window Act in 2000. Functions as initial point of contact. Investor facilitation services offered from 1978 by Indextb. Includes time limits and provisions for deemed clearances. Self-certification in lieu of inspections and consolidated returns under several laws.
Single Window Clearance Act in 2002. Includes time limits and provisions for deemed clearances. Self-certification in lieu of inspections and consolidated returns under several laws. Very active in promoting e-governance since 1994.
Punjab Industrial Facilitation Act in 2005. System relatively ineffective. Self-certification allowed in many areas.
Some self-certification and single window measures in place from 2006.
Labor laws/environment
Labor law flexibility in SEZs and IT sector, particularly with respect to hiring and firing in section V of the Industrial Disputes Act. Low mandays lost.
Amended Contract Labor Act. Labor law flexibility in SEZs and IT with respect to V of the IDA, the Minimum Wages Act, Shops and Labor Act and the Trade Union Act. Export-oriented units treated as public utilities and right to strike is restricted. More mandays lost than other three states.
Low mandays lost. Labor law flexibility in SEZs and IT but scope not as wide as Gujarat or AP.
Few formal steps to reform labor laws. Flexibility for IT sector.
Land acquisition Land acquisition by government has been less contentious. State has been proactive in creating land banks and then transferring to industry. Active in providing subsidized land for large projects. Amended laws to allow easier conversion from agricultural to industrial use and to acquire land around highways.
Government involvement has been more contentious than Gujarat. APIIC active in acquiring land and building land banks.
Land is major constraint for manufacturing. State reluctant to acquire land.
Generally eschewed taking over land for industrial purposes. Provisions for creating land banks in 2006 policy.
Special Economic Zones (SEZs)
SEZ policy in 2004. 53 SEZs approved and 30 have been notified (as of 3/30/2012).
SEZ policy in 2002. 116 approvals for SEZs and 76 have been notified (as of 3/30/2012).
8 approvals and 2 notifications for SEZs (as of 3/30/2012).
No SEZ approvals or notifications (as of 3/30/2012).
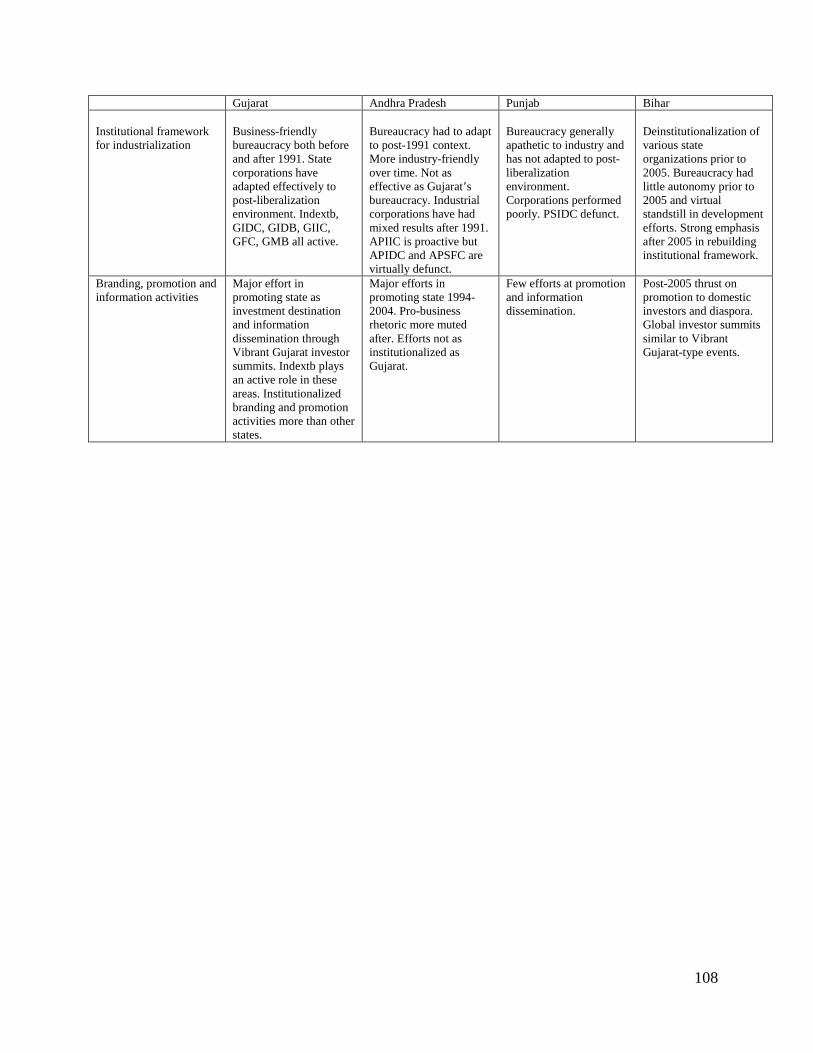
108
Gujarat Andhra Pradesh Punjab Bihar Institutional framework for industrialization
Business-friendly bureaucracy both before and after 1991. State corporations have adapted effectively to post-liberalization environment. Indextb, GIDC, GIDB, GIIC, GFC, GMB all active.
Bureaucracy had to adapt to post-1991 context. More industry-friendly over time. Not as effective as Gujarat’s bureaucracy. Industrial corporations have had mixed results after 1991. APIIC is proactive but APIDC and APSFC are virtually defunct.
Bureaucracy generally apathetic to industry and has not adapted to post-liberalization environment. Corporations performed poorly. PSIDC defunct.
Deinstitutionalization of various state organizations prior to 2005. Bureaucracy had little autonomy prior to 2005 and virtual standstill in development efforts. Strong emphasis after 2005 in rebuilding institutional framework.
Branding, promotion and information activities
Major effort in promoting state as investment destination and information dissemination through Vibrant Gujarat investor summits. Indextb plays an active role in these areas. Institutionalized branding and promotion activities more than other states.
Major efforts in promoting state 1994-2004. Pro-business rhetoric more muted after. Efforts not as institutionalized as Gujarat.
Few efforts at promotion and information dissemination.
Post-2005 thrust on promotion to domestic investors and diaspora. Global investor summits similar to Vibrant Gujarat-type events.

109
3. Chapter 3: Contrasting coalitions and outcomes: Gujarat and Punjab
“It is stupid if you are not in Gujarat”
– Ratan Tata, former Chairman, Tata Group (quoted in Fontanella-Khan 2012)
“Frankly, why would you invest in Punjab in manufacturing if you are sane? We have roots here. We are part of the SME [small and medium enterprise] sector and SME guys cannot move. Large firms can. Hero has moved out of Punjab. Mittal has moved out. Only the SME firms stay here.”43
– Interview with a Ludhiana businessperson, May 6, 2010
When viewed along several indicators at the start of the reforms process in 1991, Gujarat and
Punjab appear broadly similar. The two states were among the richest in the country, though
Punjab’s per capita income of Rs. 3825 was a little higher than Gujarat’s (Rs. 2381).44 Like most
regions in India, a majority of the population in both states was rural; nearly 63 per cent in
Gujarat and a little over 66 per cent in Punjab. Both states were middling performers in terms of
education with Gujarat’s literacy rate of 58.5 per cent being lower than Punjab’s 61.3 per cent.45
The levels of rural and urban inequality in the two states were almost identical – Gujarat’s rural
GINI coefficient was 0.26 to Punjab’s 0.24 while its urban GINI was 0.29 to Punjab’s 0.28.46
Compared with the poor overall quality of infrastructure in most Indian states, Gujarat and
Punjab were also relatively well-endowed and both possessed a sound infrastructure base.
While industry enjoyed a more prominent place in Gujarat’s economy in 1991, accounting
for 36.7 per cent of the state’s domestic product, it also had a notable presence in Punjab,
representing almost a quarter of the domestic product in a state that has historically been India’s
44 Per capita income in constant 1980-81 prices. Data from the Central Statistics Office, Ministry of Statistics and Program Implementation, Government of India (mospi.nic.in) 45 Data from the Census of India (1991). 46 Data from the Planning Commission of India (planningcommission.nic.in)
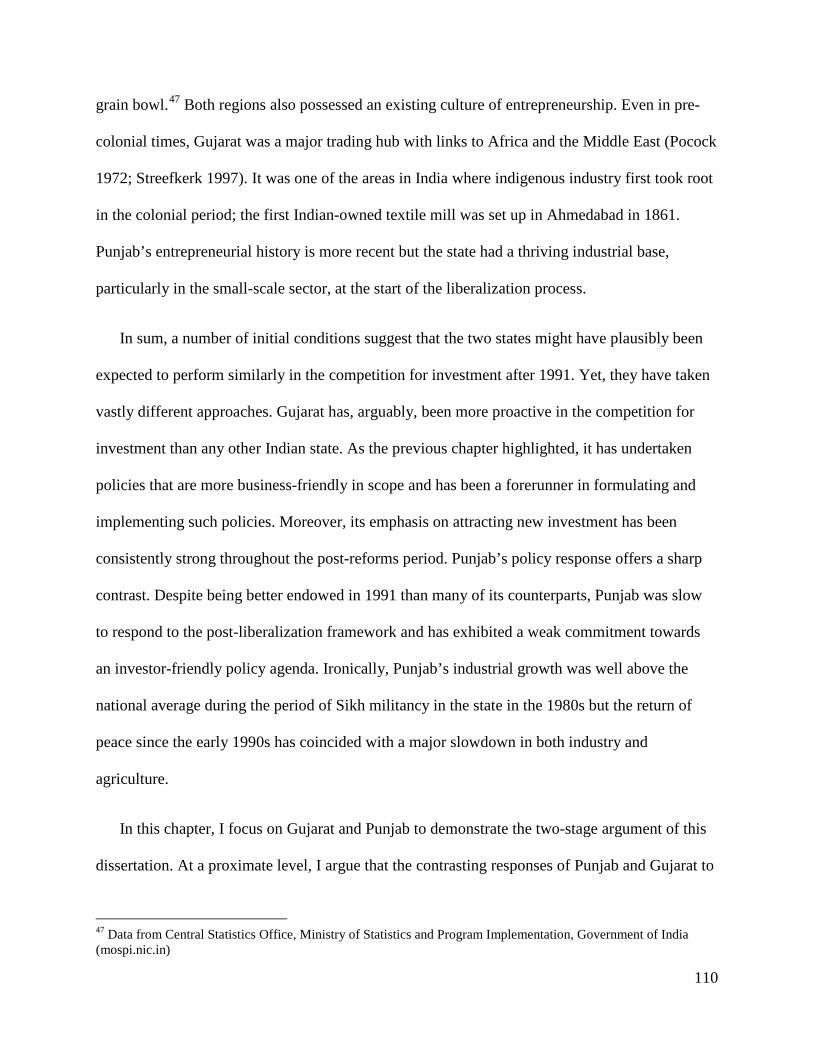
110
grain bowl.47 Both regions also possessed an existing culture of entrepreneurship. Even in pre-
colonial times, Gujarat was a major trading hub with links to Africa and the Middle East (Pocock
1972; Streefkerk 1997). It was one of the areas in India where indigenous industry first took root
in the colonial period; the first Indian-owned textile mill was set up in Ahmedabad in 1861.
Punjab’s entrepreneurial history is more recent but the state had a thriving industrial base,
particularly in the small-scale sector, at the start of the liberalization process.
In sum, a number of initial conditions suggest that the two states might have plausibly been
expected to perform similarly in the competition for investment after 1991. Yet, they have taken
vastly different approaches. Gujarat has, arguably, been more proactive in the competition for
investment than any other Indian state. As the previous chapter highlighted, it has undertaken
policies that are more business-friendly in scope and has been a forerunner in formulating and
implementing such policies. Moreover, its emphasis on attracting new investment has been
consistently strong throughout the post-reforms period. Punjab’s policy response offers a sharp
contrast. Despite being better endowed in 1991 than many of its counterparts, Punjab was slow
to respond to the post-liberalization framework and has exhibited a weak commitment towards
an investor-friendly policy agenda. Ironically, Punjab’s industrial growth was well above the
national average during the period of Sikh militancy in the state in the 1980s but the return of
peace since the early 1990s has coincided with a major slowdown in both industry and
agriculture.
In this chapter, I focus on Gujarat and Punjab to demonstrate the two-stage argument of this
dissertation. At a proximate level, I argue that the contrasting responses of Punjab and Gujarat to
47 Data from Central Statistics Office, Ministry of Statistics and Program Implementation, Government of India (mospi.nic.in)
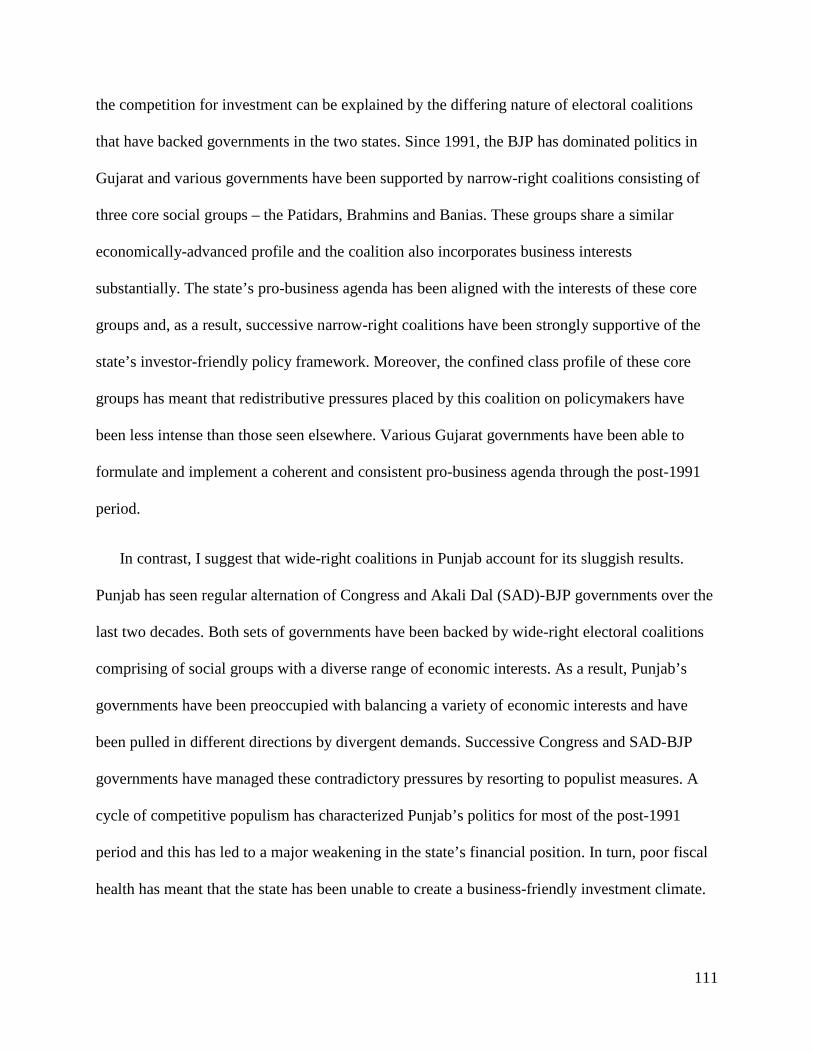
111
the competition for investment can be explained by the differing nature of electoral coalitions
that have backed governments in the two states. Since 1991, the BJP has dominated politics in
Gujarat and various governments have been supported by narrow-right coalitions consisting of
three core social groups – the Patidars, Brahmins and Banias. These groups share a similar
economically-advanced profile and the coalition also incorporates business interests
substantially. The state’s pro-business agenda has been aligned with the interests of these core
groups and, as a result, successive narrow-right coalitions have been strongly supportive of the
state’s investor-friendly policy framework. Moreover, the confined class profile of these core
groups has meant that redistributive pressures placed by this coalition on policymakers have
been less intense than those seen elsewhere. Various Gujarat governments have been able to
formulate and implement a coherent and consistent pro-business agenda through the post-1991
period.
In contrast, I suggest that wide-right coalitions in Punjab account for its sluggish results.
Punjab has seen regular alternation of Congress and Akali Dal (SAD)-BJP governments over the
last two decades. Both sets of governments have been backed by wide-right electoral coalitions
comprising of social groups with a diverse range of economic interests. As a result, Punjab’s
governments have been preoccupied with balancing a variety of economic interests and have
been pulled in different directions by divergent demands. Successive Congress and SAD-BJP
governments have managed these contradictory pressures by resorting to populist measures. A
cycle of competitive populism has characterized Punjab’s politics for most of the post-1991
period and this has led to a major weakening in the state’s financial position. In turn, poor fiscal
health has meant that the state has been unable to create a business-friendly investment climate.

112
Having suggested that narrow-right coalitions in Gujarat and wide-right coalitions in Punjab
explain varied responses to the competition for investment, I go a step back in this chapter and
trace the social origins of these coalitions. Identity politics has been the primary mode of
electoral mobilization in India and this has affected both party strategies of coalition construction
and voter attachments.
Dominant caste patterns in Gujarat, which involve an overlap of group size and resource
control, have laid the foundation for the emergence of narrow-right coalitions. Since the mid-
1990s, the BJP has essentially had a stranglehold on the state’s electoral scene and has won with
narrow-right coalitions comprising of three core groups – the Patidars, Banias and Brahmins.
The numerical size of the Patidars has allowed the BJP to rely primarily on this group along with
the Banias and Brahmins to construct electoral majorities. Moreover, these three groups
constitute the bulk of entrepreneurial interests in Gujarat. As demonstrated through survey data
later in the chapter, the BJP’s disproportionate reliance on these sections is complemented by the
fact that voters from the Patidar, Brahmin and Banias castes overwhelmingly support the BJP
over the rival Congress, limiting its incentive to construct broad bases of support and reinforcing
its strategy of targeting these economically-powerful castes.
Punjab’s cross-cutting cleavage structure is inherently conducive to building wide coalitions.
It is a Sikh-majority state where caste acts in conjunction with other cleavage dimensions, most
notably religion and a rural-urban divide. This has created considerable fragmentation in the
social structure. Entrepreneurial interests exist but, unlike Gujarat, are not numerically sizeable.
The nature of Punjab’s cross-cutting cleavages has meant that parties cannot win elections by
disproportionately relying on a small set of social groups.

113
Party strategies have adapted to this reality. The Congress since the 1950s has built a catch-
all base of support. The main rival to the Congress in the state has been the SAD. As a party that
has historically represented Sikh interests, the SAD’s ability to win elections on its own is
limited. To overcome this, the party has allied with the Hindu-nationalist BJP over the last two
decades. SAD-BJP governments have combined the rural and Sikh vote base of the former with
the urban and Hindu base of the latter.
While caste structures have been crucial, coalition formation is a sequential process and the
history of mobilization matters in explaining the timing of particular coalitions. To reflect the
fact that the construction of social bases of support is a process, I trace coalition formation
through the post-independence period in both states. I also use survey data of individuals from
the 2002 assembly elections in both states to demonstrate the relationship between social identity
and voter attachments. In Gujarat, social identity is strongly significant in determining vote
choice and certain social groups are very closely attached to either the BJP or the Congress. This
complements the strategy of these parties to target a narrow range of social groups. Though
present to some degree, the link between social identity and vote choice is not as prevalent in
Punjab.
Figures 3.1 and 3.2 apply the two-stage argument of the dissertation to Gujarat and Punjab.
In the rest of this chapter, I delineate the central explanation with respect to Gujarat and Punjab
in more detail.
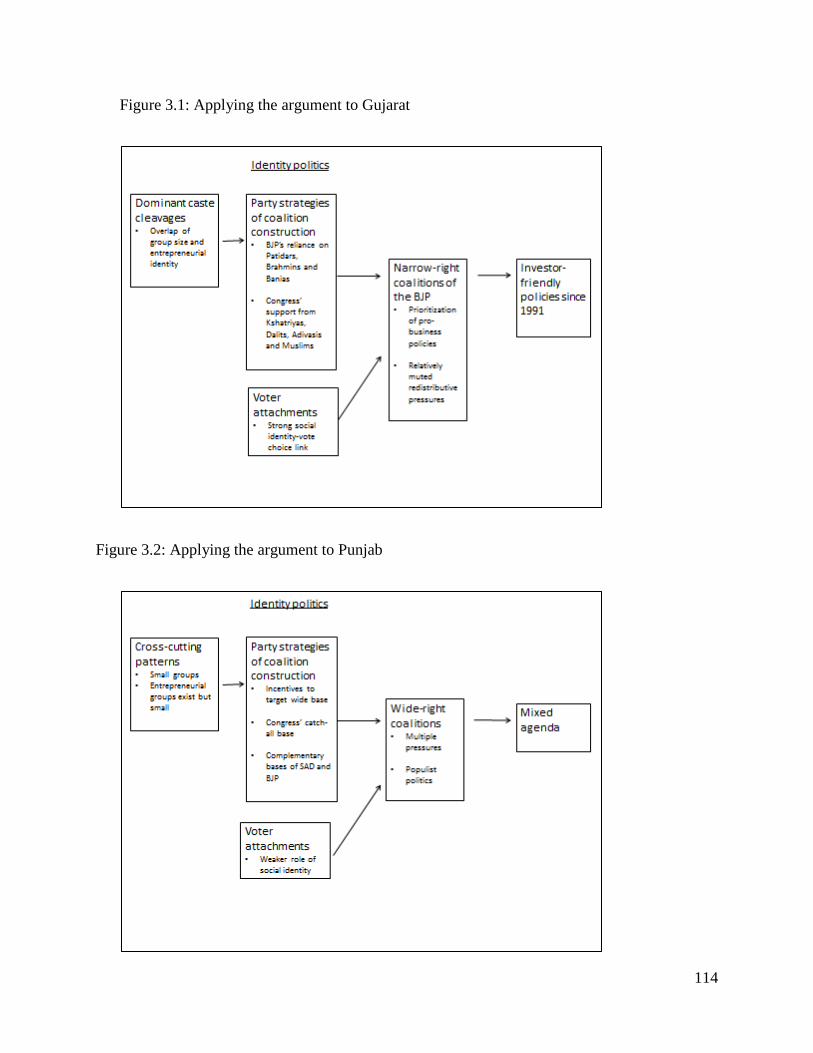
114
Figure 3.1: Applying the argument to Gujarat
Figure 3.2: Applying the argument to Punjab
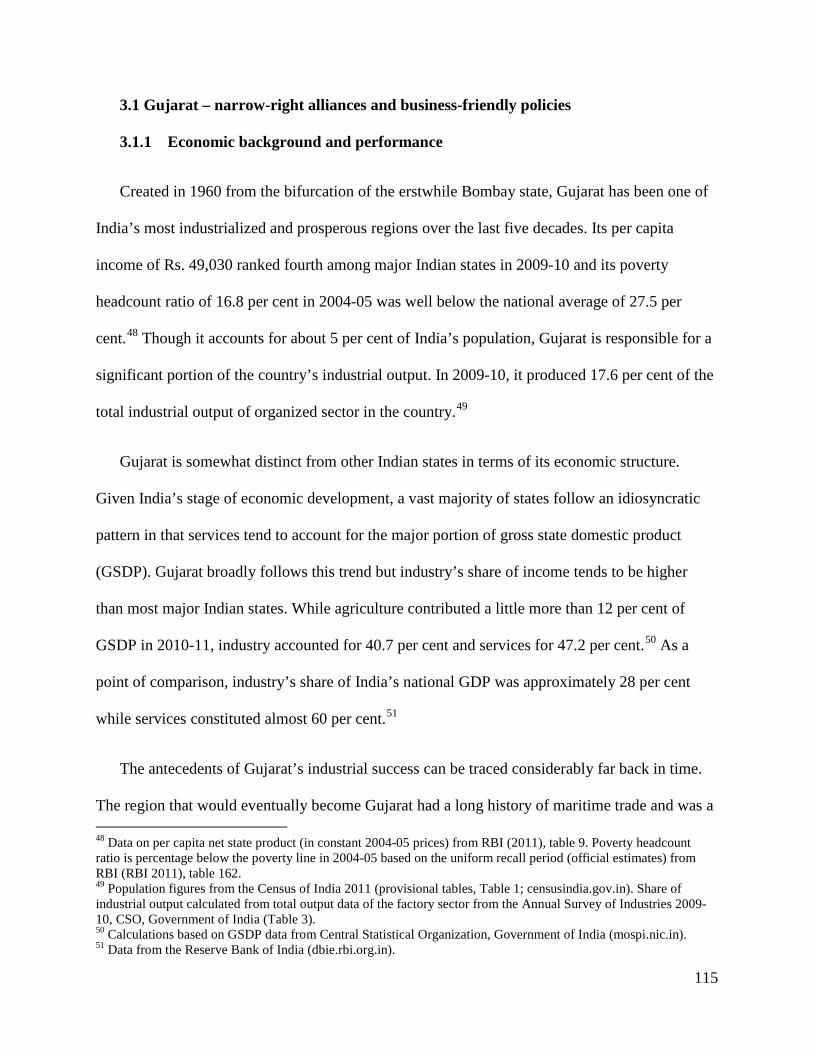
115
3.1 Gujarat – narrow-right alliances and business-friendly policies
3.1.1 Economic background and performance
Created in 1960 from the bifurcation of the erstwhile Bombay state, Gujarat has been one of
India’s most industrialized and prosperous regions over the last five decades. Its per capita
income of Rs. 49,030 ranked fourth among major Indian states in 2009-10 and its poverty
headcount ratio of 16.8 per cent in 2004-05 was well below the national average of 27.5 per
cent.48 Though it accounts for about 5 per cent of India’s population, Gujarat is responsible for a
significant portion of the country’s industrial output. In 2009-10, it produced 17.6 per cent of the
total industrial output of organized sector in the country.49
Gujarat is somewhat distinct from other Indian states in terms of its economic structure.
Given India’s stage of economic development, a vast majority of states follow an idiosyncratic
pattern in that services tend to account for the major portion of gross state domestic product
(GSDP). Gujarat broadly follows this trend but industry’s share of income tends to be higher
than most major Indian states. While agriculture contributed a little more than 12 per cent of
GSDP in 2010-11, industry accounted for 40.7 per cent and services for 47.2 per cent.50 As a
point of comparison, industry’s share of India’s national GDP was approximately 28 per cent
while services constituted almost 60 per cent.51
The antecedents of Gujarat’s industrial success can be traced considerably far back in time.
The region that would eventually become Gujarat had a long history of maritime trade and was a 48 Data on per capita net state product (in constant 2004-05 prices) from RBI (2011), table 9. Poverty headcount ratio is percentage below the poverty line in 2004-05 based on the uniform recall period (official estimates) from RBI (RBI 2011), table 162. 49 Population figures from the Census of India 2011 (provisional tables, Table 1; censusindia.gov.in). Share of industrial output calculated from total output data of the factory sector from the Annual Survey of Industries 2009-10, CSO, Government of India (Table 3). 50 Calculations based on GSDP data from Central Statistical Organization, Government of India (mospi.nic.in). 51 Data from the Reserve Bank of India (dbie.rbi.org.in).

116
thriving commercial center even in medieval times (e.g., Pocock 1972; Tripathi and Jumani
2007). Gujarat, along with Bombay, was also a forerunner in terms of machine-age
manufacturing in colonial India; the first textile mill financed by Indian capital was set up in
Ahmedabad in 1861 (e.g., Damodaran 2008). By the turn of the 20th century, Ahmedabad
became a key industrial hub. Unlike other parts of India, where foreign capital had a major
presence, Ahmedabad did not have a single textile mill in the 1890s under the control of non-
Indians (Tripathi and Jumani 2007). Some industrial development financed by indigenous capital
also occurred away from the directly British-ruled areas of present day Gujarat, specifically in
the princely state of Baroda (Streefkerk 1997).
Gujarat built on these advantages after independence. After the formation of the state in
1960, the state put in place a strong framework for industrialization and growth (Sinha 2005).
Despite the constraining effects of the license-permit raj, Sinha suggests that Gujarat’s
“bureaucratic developmentalism” ensured high investment flows. In particular, the state’s
bureaucracy managed to mitigate the constraining effects of central rules through bureaucratic
pressure, lobbying and monitoring; a strategy she terms “bureaucratic infiltration.”
Gujarat’s growth acceleration in the post-reforms period has been even more rapid. Between
1991-92 and 2009-10, the state’s gross state domestic product (GSDP) grew at an average annual
rate of over 8.1 per cent compared to a national average of 6.5 per cent. The state’s aggressive
policy response to the competition for investment has reaped considerable dividends. Between
1991 and 2010, Gujarat received 11.8 per cent of investment in the country by total value and
12.4 per cent in terms of total number of investment proposals.52
52 Data from SIA Statistics (January 2011), Department of Industrial Policy and Promotion, Ministry of Commerce and Industry (dipp.nic.in).
117
On the surface, Gujarat’s proactive response in the competition for investment after 1991 is
not entirely surprising given its long history of entrepreneurship and industrial development. In
many ways, since its formation in 1960, Gujarat has been a classic developmental state (Kohli
2009, 2012; Sinha 2005). For a start, the state has been central to industrial development in
Gujarat. As was the case with classic developmental states, Gujarat has prioritized growth more
than other development objectives. Relative to its per capita income levels, the state
underperforms in terms of human development. For example, it has a sex ratio of 918 females
per 1000 males, a figure that is both below the national average of 940 and a long distance away
from the best performing state, Kerala at 1084.53 Illiberal political trends have also accompanied
Gujarat’s high-growth phase. Notably, the state’s politics has been characterized by strongly
majoritarian trends and certain groups, chiefly Muslims, have been socially, economically and
politically excluded (e.g., Hirway 2000).
While pre-1991 factors have no doubt shaped Gujarat’s response to the competition for
private investment in the post-1991 period, a sole focus on continuity leaves several issues
unaddressed. First, how and why has Gujarat maintained its economic dominance in the post-
1991 period when some other states have managed to squander their pre-1991 advantages? As
the case study of Punjab will show, favorable initial conditions are not sufficient for success in
the competition for investment. Second, Gujarat has been more proactive and has outperformed
other high and middle income states in attracting investment after 1991. How and why did
Gujarat adapt more effectively to the new framework than similarly placed states? These
questions merit further explanation and sections 3.1.2 to 3.1.6 attempt to provide that. Section
3.1.2 begins by providing an introduction to Gujarat’s social structure.
53 Data from the Census of India, 2011 (censusindia.net)
118
3.1.2 A brief overview of Gujarat’s social structures : dominant caste patterns and a
history of entrepreneurship
In this section, I offer a brief overview of Gujarat’s social structure. In the description that
follows, I emphasize two key aspects. First, large social groups exist in Gujarat. Second, the
history of entrepreneurship in the state is closely associated with the social structure. Both these
factors facilitate the emergence of narrow-right coalitions in the state, which represent an overlap
between economic and political power.
Gujarat’s social structure is characterized by what M.N. Srinivas, defined in his seminal 1959
study as “dominant caste” patterns. According to Srinivas, “a caste maybe said to be ‘dominant’
when it preponderates numerically over the other castes, and when it also wields preponderant
economic and political power. A large and powerful caste group can be more easily dominant if
its position in the local caste hierarchy is not too low” (1959: 1). In this dissertation, I argue that
this very coincidence of size and economic power, embedded within dominant caste patterns,
acts as an enabling factor in allowing the emergence of narrow-right coalitions in some Indian
states.
In Gujarat, the Patidars constitute the main dominant caste. By Indian standards, they are
numerically sizeable, accounting for over 12 per cent of the state’s population (e.g., Shah
1989).54 The Patidars have enjoyed considerable economic clout arising from their ownership of
land in the countryside (Kohli 1990; Kothari and Maru 1970; Shah 1989; Sheth 1976a, 1998). As
the next sub-section will outline in more detail, this access to land allowed the Patidars to accrue
54 The 1931 census in India was the last one to collect information on individual castes other than scheduled castes and scheduled tribes. Scheduled caste and scheduled tribe populations have since been counted in each Indian census. Despite the short-coming of not having current details on individual castes, most studies on Indian politics, including the ones cited in this paragraph, use the 1931 data and extrapolate from it.

119
surpluses from commercial agriculture, which were in turn transferred to industry. As is the case
with most caste groups in India, there is an element of economic differentiation within the
Patidars. Studying the Patidars in the 1970s, Pocock (1972) found that members within the
Patidar community range from wealthy landowners to emigrants in other parts of the world to
agricultural labor who work on the fields of fellow-caste landowners. Kohli (1990) and Sinha
(2005) also point to a class distinction between two Patidar sub-castes – Leuva and Kadwa
Patels. Kohli suggests that the Leuvas occupied a higher position in terms of income and social
status and controlled important positions in commerce, trading, education and producer
cooperatives (1990: 254). The Kadwas, on the other hand, were largely dependent on cash-crop
agriculture.
The historic control of land of the Patidars also afforded a degree of political clout. Frankel
(1989) suggests that power relations in parts of western India, including Gujarat, historically
rested on military skills and the control of land. As a result, groups such as the Patidars also
became politically powerful. The political leverage of the Patidars was reinforced by the fact that
they were mobilized in large numbers into the nationalist movement before independence. Their
leader, Sardar Patel, was the most powerful Congressman after Nehru in the early post-
independence period and this gave the Patidars a powerful voice within the Gujarat Congress
(Kohli 1990).
The Brahmins (approximately 4 per cent of the population) and Banias (almost 3 per cent)
form the two major upper caste groups in Gujarat. Along with the Patidars, these groups are the
state’s most economically-advanced. Historically a trading and merchant caste, the Banias
constituted the earliest wave of indigenous industrial entrepreneurs in the colonial period in
Gujarat as well as other parts of India. They continue to form a major section of Gujarat’s
120
entrepreneurial base. Brahmins in Gujarat are mainly found in white-collar professions but a
section (the Anavils) owned land and subsequently entered industry. Unlike the case in some
other parts of India, Brahminical hegemony was weaker in Gujarat and social and political
prestige was not tied directly to ritual values and religious knowledge (Frankel 1989c). This
offered space for groups such as the Patidars to garner political leverage. In the first few years
after independence, the Brahmins and Banias were overrepresented within the Congress party in
Gujarat. However, the larger and economically-powerful Patidars, who had been vital within the
nationalist movement, soon gained a firm foothold in the Congress’ power structure. In turn, this
trifecta of economically-advanced castes – the Patidars, Brahmins and Banias – has largely
controlled Gujarati politics for most of its fifty-two year history since the state’s formation in
1960.
The main lines of political conflict in Gujarat have been between the Patidars, Brahmins and
Banias, on one hand, and another large group, the Kshatriyas, on the other. The Kshatriyas, who
constitute a little more than 29 per cent of Gujarat’s population have represented the main
challenge to the Patidar political dominance (Kohli 1990; Kothari and Maru 1970). The
Kshatriyas exhibit considerable economic diversity and include some wealthy sub-castes such as
the Rajputs as well as several poorer sections such as the Bariyas within their ranks. Since the
1970s, the Kshatriyas have formed the bulwark of the Congress’ social base in Gujarat.
The most economically and socially-marginalized groups in Gujarat include Dalits
(Scheduled Castes) and Adivasis (Scheduled Tribes), who form 7.1 per cent and 14.8 per cent of
the population respectively, and Muslims who are approximately 9.1 per cent of the population.55
55Data from Census of India 2001 (censusindia.gov.in).
121
3.1.2.1 The social origins of entrepreneurship in Gujarat
Two aspects of Gujarat’s caste structure are central to the explanation for the emergence of
narrow-right coalitions in the state. First, as the sub-section above highlighted, Gujarat’s social
structure includes relatively large caste groups. Second, the history of entrepreneurship in
Gujarat has been closely tied to the social structure. Certain social groups account for the bulk of
the business base in the state. This has been aided by the control of economic resources that these
groups enjoyed due to their historical position in the caste structure.
In particular, there have been two main routes to industrial entrepreneurship in Gujarat. The
first and older strand of industrial entrepreneurship was dominated by merchant and trading
groups such as the Banias and Parsis, who used their access to capital and social networks to
enter industry. In medieval times, Gujarat was the site of long distance trade with Africa, Europe
and other parts of Asia. This legacy meant that Gujarat was the most commercialized region
prior to the arrival of the British. Not surprisingly, groups such as the Banias, who occupied the
position of merchants and traders within the social system’s division of labor, were at the heart
of this commercial system (Streefkerk 1997).
With the arrival of the British and the Dutch East India Companies, the Banias, along with
other indigenous mercantile groups such as the Parsis lost out on overseas trade. Realizing that
they could not compete with the colonial powers, the Banias increasingly looked domestically
for business opportunities (Streefkerk 1997). In the 17th century, they provided mercantile,
financial and other services for expanding British interests. When modern industry appeared in
India around 1850, these merchant and trading groups were best placed to enter industry and
became the first indigenous industrial entrepreneurs in the country. Of the twenty six textile mills
122
that existed in Gujarat in 1898, Banias controlled twenty-two, Brahmins two and Parsis and
Patidars one each (Shah 1989: 69). The centrality of the Banias to Gujarat’s economic life
continued through the independence period and even today, they remain one of the key
entrepreneurial groups in Gujarat.
While mercantile and trading groups were part of the first wave of industrial entrepreneurs in
Gujarat, a second, and later, strand was dominated by the Patidars. While access to capital and
social networks aided the entry of the merchant and trading groups to industry, it was the access
to land that facilitated the entry of the Patidars. The Patidars became economically powerful
through the control of land, which increased between the 17th and 19th centuries, first under
Gujarat’s Mughal and Maratha rulers and later under the British (Pocock 1972; Shah 1989). With
the development of transportation facilities under the British in the early 19th century, the
economic position of the Patidars was strengthened even further. The caste turned to
commercial agriculture and began to cultivate cash crops such as cotton, tobacco and indigo
(Rutten 1986; Shah 1989). Subsequently, since the early 20th century, the Patidars began shifting
investible surpluses from agriculture to industry. The transfer of surpluses to industry occurred in
greater scale after 1960 was catalyzed by the state’s efforts to spur industrialization. Sinha
(2005) suggests that Patidar farmers and landholders in Gujarat formed the “vanguard” of an
industrial revolution when the state government came forward with credit and infrastructural
facilities.
Two other factors also aided Patidar entry into industry. From the late 1800s, the Patidars
would invest significantly in education and dramatic improvements in literacy rates occurred in
the period between 1900 and 1930 (Shah 1989). Affected by a famine and plague, which hit
Gujarat between 1899 and 1902, landowning Patidars also began to migrate overseas. Migration
123
has remained a constant feature since. The standard pattern in Patidar families after the 1960s
was for one child within each family to go abroad while others remained behind in Gujarat
looking after land (Sinha 2005). Overseas migration added to the investible surpluses that were
generated through commercial agriculture, further easing entry into industry. Patidar dominance
of business began with investment in agro-industry, particularly rural agricultural cooperatives.
With a foothold in these sectors, the Patidars rapidly diversified into other segments of industry
in the 1970s and 1980s (Damodaran 2008).
There remain key long term continuities in terms of the social make-up of industrial
entrepreneurship in Gujarat. Shinoda (2000) examines the composition of entrepreneurs in the
small-scale industrial sector in Gujarat and finds that Patidars have a dominant presence. His
data also shows that Patidar, Brahmin and Bania entrepreneurs tend to be more involved in
capital intensive and hi-tech sectors while entrepreneurs from artisanal castes tend to be
concentrated in sectors such as wood and metal products to which they were traditionally linked
by the caste system. The case of the Banias exhibits even greater long-term continuity. The
Banias were part of the earliest wave of entrepreneurship in Gujarat and continue to maintain a
significant presence. In his analysis of the history of industrial development in South Gujarat,
Streefkerk (2006), finds that Banias have been prominent, constituting a large proportion of
entrepreneurs, from the pre-machine age in the 16th century into the last decade of the 20th
century.
To sum up, this section tried to provide an introduction to Gujarat’s social structure. It tried
to emphasize two aspects of Gujarat’s dominant caste structure – the numerical size of certain
caste groups in Gujarat and the link between the social structure and entrepreneurship. Both
these factors in turn have engendered a type of political dynamics that has allowed governments
124
backed by narrow-right coalitions to come to power after 1990. These coalitions have remained a
regular feature in Gujarat’s political landscape over the last two decades. This political landscape
is introduced in more detail in the next section.
3.1.3 Politics prior to economic liberalization: Congress dominance and decline
While Gujarat’s economic prosperity has a long lineage, its political history is more recent.
Prior to independence, Gujarat consisted of numerous independent units that had never been
ruled as a distinct entity by a single political authority (Shah 1989). During the colonial period,
approximately one-fifth of the state, mostly in mainland Gujarat, fell under direct British rule.
The remaining four-fifths was under indirect British rule and controlled by more than three
hundred princely states (Wood 1984). After independence, Gujarat fell under the jurisdiction of
the state of Bombay. As part of the broader reorganization of Indian states on a linguistic basis,
Bombay was divided and the state of Gujarat came into existence in 1960.
Gujarat’s politics has seen considerable change since the state’s formation in 1960 and these
shifting dynamics have had a cumulative effect in explaining the emergence of narrow-right
coalitions in the post-liberalization period. For the purposes of this case study, the contours of
Gujarat’s politics from its formation to the present can be divided broadly into four different
periods – politics prior to 1967, politics between 1967 and 1980, the decade of the 1980s and
politics in the post-liberalization era.
Through these different eras, two aspects have remained a continuing thread in Gujarat’s
political history. First, as Sanghavi (2011) points out, bipolar competition has generally
characterized the electoral sphere in the state with the Congress forming one pole and varying
parties, most notably the BJP since the 1990s, forming the other pole. Second, Gujarat’s politics
125
has largely been a story of the continuing dominance of three castes – the Patidars, Brahmins and
Banias. Except for the decade of the 1980s, when they were excluded from the highest rungs of
power, these three castes have controlled politics in the state. However, the political modes
through which they have exerted power have differed over time. Most notably, these groups
shifted their allegiances away from the Congress and began to back the BJP in substantial
measure since 1990.
3.1.3.1 Politics before 1967: One party hegemony, intra-elite harmony and low mobilization
In the immediate aftermath of the formation of Gujarat in 1960, the Congress towered over
the political scene, winning assembly elections in 1962, 1967 and 1972. The state’s
economically-advanced castes, namely the Patidars, Brahmins and Banias tightly controlled
Gujarati politics in this period and the Congress’ internal dynamics reflected their supremacy.
Unlike these three groups, the sizeable Kshatriyas remained outside the Congress’ power
structure in Gujarat until the late 1960s.
Low levels of mobilization of marginalized groups and intra-elite harmony meant that the
state’s politics in these early years appeared “gentle and peaceful in tradition and commercial in
style and technique” (Sheth 1976b: 68). In a similar vein, Kohli suggests that “the gentlemen
elite of Gujarat ruled relatively peacefully because they tended to agree with each other on
significant issues and because they enjoyed unquestioned dominance in the social structure”
(1990: 245). Though politically uneventful when compared with subsequent decades, Gujarat put
in place the institutional framework for subsequent industrialization at this time. The framework
was backed by a pro-development coalition consisting of upper castes, agriculturalists-turned
capitalists (the Patidars) as well as some disenfranchised social groups, all of whom acquired

126
stakes in the industrialization of the state (Sinha 2005). Lack of competition to the Congress
meant that potential opposition to this growth-framework never found a political voice.
3.1.3.2 Politics between 1967 and 1980: conflict, instability and a realignment of social bases
The general placidity of Gujarat’s politics would be jolted by events at the end of the 1960s.
As in several other parts of India, the 1967 Lok Sabha elections was a key marker in the politics
of Gujarat. It was the first time after independence that the Congress lost power in several states
and was seriously challenged in others, marking the decline of one-party dominance in India.
Though it held on to power in Gujarat, the Congress faced a notable challenge from several
opposition parties, chiefly the Swatantra.
While the 1967 elections signaled the end of Congress hegemony, the character of Gujarat’s
politics would be indelibly altered two years later when the party split at the national-level. After
Prime Minister Lal Bahadur Shastri’s death in 1966, a coterie of regional leaders within the
Congress – “the Syndicate” – engineered the succession that elevated Indira Gandhi to the
position of prime minister. Expecting Indira Gandhi to be a pliable figurehead, the Syndicate
hoped to control the levers of power.
However, they were in for a rude shock. With no intention of remaining under the clutches of
the Syndicate, Indira Gandhi started to carve out her own power base. The internal battles within
the Congress came to a head in 1969 and the party split into two – the Congress (R) led by Indira
Gandhi and the Congress (O) headed by members of the Syndicate. One of the most prominent
leaders of the Syndicate, Morarji Desai, enjoyed considerable appeal in Gujarat and his influence
meant that the majority of party members in the state supported the Congress (O), rather than
Indira Gandhi’s wing, at the time of the split in 1969. The Congress (O)’s time at the helm of

127
Gujarat’s politics would, however, be short-lived and Indira Gandhi’s wing of the party wrested
control in Gujarat in the early 1970s.
Crucially, the split in the Congress in 1969 led to a major realignment in the social base of
the party in Gujarat and paved the way for considerable political instability and violence over the
next two decades. At the heart of the turmoil was conflict between the Patidar-Brahmin-Bania
alliance and the Kshatriyas. While the state’s two numerically large castes – the Patidars and
Kshatriyas – long opposed each other, particularly in rural areas, their rivalry took on greater
proportions in the political arena after the late 1960s (e.g., Kohli 1990; Shah 2007). Since the
early 20th century, various sub-groups within the Kshatriyas began to organize themselves
through a federation – the Kshatriya Sabha – to counter Patidar political dominance (Kothari and
Maru 1970). In the first two decades after independence, the Congress leadership in Gujarat was
heavily dominated by the Patidars, Brahmins and Banias and this led to considerable alienation
on the part of the Kshatriyas.
The split in the Congress in 1969 led the way for a decisive change. By 1971, the battle lines
in Gujarat were clearly drawn between Indira Gandhi’s Congress (R) and a right-leaning
coalition of the Congress (O), Swatantra and Jan Sangh. This was accompanied by a clear
division in the social bases of the two opposing camps; Kshatriyas and other excluded groups
moved towards Indira Gandhi’s party while the established Patidar-Brahmin-Bania elite backed
the Congress (O)-Swatantra-Jan Sangh coalition. Throughout the country, Indira Gandhi’s
broader strategy was to mobilize weaker socio-economic sections. In Gujarat, the sizeable
Kshatriyas were ripe for mobilization as an independent political force and this was substantially
exploited by Indira Gandhi. Her party, which eventually came to be recognized as the official
wing of the Congress, targeted the Kshatriyas as well as Dalits and Adivasis through a strong
128
rhetoric of populism and a variety of redistributive promises. The strategy paid off handsomely
in the 1972 Gujarat assembly elections, which her Congress won with a huge majority – 140
seats in a house of 168. Kshatriya representation in the legislature as well as the leadership of the
Congress increased significantly. Sheth (1976b) shows that the proportion of Kshatriyas in the
Gujarat legislative assembly increased from 9.8 per cent in 1960 to 25 per cent in 1972.
The ascendancy of the Kshatriyas and other marginalized groups elicited a sharp response
from the Brahmin-Bania-Patidar alliance. This response took the form of the mass Navnirman
(“social regeneration”) movement, which resulted in more than two months of civil disorder and
violence in Gujarat in 1974. The reaction of the upper castes occurred within a broader backdrop
of general social and political churning throughout India in the early 1970s. An inflationary
climate prevailed in the country at the time and, in Gujarat, internal party conflicts heightened
popular unrest. Despite its sizeable majority, the Congress (R)’s government was wracked by
infighting, with rival groups supposedly offering large sums of money to buy the support of
legislators. This heightened urban middle class anger against what they perceived as corrupt
politics in the midst of a difficult economic environment (Shah 1974).
In this uncertain climate, what started as an urban student-led protest against rising food costs
morphed into a major upheaval with the stated aim of overturning Gujarat’s corrupt politics.
Strongly supported by the upper caste base of the Congress (O) and Jan Sangh, who had been
excluded from power, the Navnirman protests resulted in a 73 day cycle of violent street protests
and government repression, leaving 103 dead and resulting in over 8200 arrests (Wood 1975).
The Navnirman protesters succeeded in bringing down the government of Indira Gandhi’s
wing of the Congress but the next five years witnessed continuing political instability. In the

129
1975 assembly elections, a coalition of the Congress (O), Jan Sangh and others, defeated Indira
Gandhi’s Congress. The electoral defeat in Gujarat acted, in part, as a trigger for Indira Gandhi’s
proclamation of a national emergency in 1975. The proclamation suspended elections, the
judicial enforcement of fundamental rights and, essentially, allowed Indira Gandhi to rule by
decree for two years.
The Emergency ended in 1977 but Gujarat’s political turmoil continued unabated. Between
1975 and 1980, the state saw four different governments – two formed by Indira Gandhi’s
Congress and two by the Janata coalition. The two sets of governments (Congress and Janata)
had distinctly different social bases and this social polarization would remain a feature in
Gujarat’s politics since. The Janata depended on the established elite – the Patidar-Brahmin-
Bania coalition. The Congress, on the other hand, aligned with the more marginalized groups in
the state – the Kshatriyas, Harijans (Scheduled Castes), Adivasis (Scheduled Tribes) and
Muslims.
3.1.3.3 The 1980s: Social conflict, political turmoil and the emergence of the BJP
The Congress’ attempts to consolidate its base among the Kshatriyas, Dalits, Adivasis
and Muslims would take the form of an electoral strategy known as KHAM, an acronym for
these four groups. The Congress successfully employed the KHAM strategy to come back to
power in 1980. Over the next decade, it reestablished electoral dominance in Gujarat, albeit
through a markedly different social base than the one it relied on in the 1960s. Paradoxically,
electoral dominance would not be accompanied by political stability and conflict between the
state’s main social groups set the stage for another tumultuous decade (Kohli 1990). Members of
the KHAM alliance were rewarded with considerable representation in the Madhavsinh Solanki-
130
led government in 1980; Solanki himself was the first Chief Minister of the state who did not
belong to the Patidar, Bania or Brahmin castes. Almost seventy percent of Solanki’s cabinet was
filled with legislators with a KHAM background, a clear signal to the upper castes of the
changing power dynamics (Wood 1987). Though displaced from the state apparatus, the Patidars
continued to control a significant portion of trade, commerce, agriculture and other sources of
economic power (Kohli 1990).
A few months into the Solanki government’s tenure, Gujarat once again witnessed riots
in 1981. The riots were triggered when a group of upper caste and Patidar medical students
protested the government’s reservation (affirmative action) policies, which reserved seats in
colleges for the Scheduled Castes, Scheduled Tribes and Other Backward Classes. The protests
developed into a full-blown caste conflict with Scheduled Castes being the main target of the
anti-reservation protesters (Wood 1987). Despite this, the Solanki government managed to
survive the unrest and finished its full term in 1985, the first government in Gujarat in almost
two decades to do so.
Drawing on its successful KHAM strategy as well as the broader sympathy wave
following Indira Gandhi’s assassination in 1984, Solanki and the Congress returned to power in
1985 with a handsome majority. But the victory came under controversial circumstances. Two
months before the state elections in March 1985, Solanki, in a move aimed at consolidating his
core support base, announced that the reserved quota for backward class candidates in colleges
and government employment would be raised from 10 to 28 per cent (Kohli 1990; Wood
1987).56 This was in addition to the 21 per cent already reserved for Dalits and Adivasis.
56 Sections of the Kshatriyas constitute a major portion of the backward classes in Gujarat

131
Demonstrations became particularly violent after the Congress’ electoral victory in
March 1985. Violence intensified and over a six month period, 275 people would be killed,
thousands injured and considerable damage to property occurred (Wood 1987). Solanki was
replaced by another Congress leader, Amarsinh Chaudhary. Chaudhary gave into the demands of
the protesting elite castes, by dropping several KHAM members from his cabinet and then
putting reservations on hold, measures which effectively ended the protests.
The 1981 and 1985 riots were largely led by the urban middle class. Shah (1987) suggests
that these riots were a struggle within the middle classes – between the established Patidar,
Brahmin and Bania castes, on one hand, against entrants from lower castes. Importantly, both
sets of anti-reservation riots allowed the dominant Patidar-Brahmin-Bania alliance to regain their
political hold on the state and this dominance continues till today (Patel 1999; Shah 1987, 1991,
1996, 2007; Sud 2007). However, this would occur in the 1990s through a new political vehicle
– the Hindu-nationalist BJP. What began as anti-reservation protests against the Solanki
government in 1985 was taken over by the BJP and its affiliates and was soon transformed into
riots against the state’s Muslims and lower castes (e.g., Patel 1985). For Shah (1996, 2007), the
anti-reservation riots of 1985 was the crucial point at which the BJP established its hold in
Gujarat and reaped the rewards of a strategy that attempted to cut the electoral pie across
religious lines.
As the next section will suggest, the BJP grew in strength after gaining ground through
the anti-reservation riots in 1985. Before proceeding to detail the party’s consolidation of power
in the 1990s, a broader point on the BJP’s rise needs to be noted here. The party’s upward
trajectory in Gujarat cannot be conceived of as a sudden occurrence precipitated by the 1985
riots. In fact, the BJP’s ascendancy is directly related to the spread of the Hindu nationalist
132
movement in Gujarat since the 1960s. Since the 1960s, various components of the Sangh Parivar
attempted to spread the ideology of Hindutva (Hindu nationalism) in a bid to cut across caste
divisions by appealing to a notion of Hindu unity.57 In the late 1950s and early 1960s, the Jan
Sangh, which would reemerge as the BJP in 1980, laid the foundation in Gujarat through its anti-
Muslim propaganda in cultural events and public meetings. By the mid-1960s, the Jan Sangh
adopted more militant tactics and was actively involved in Hindu.-Muslim riots in 1969 by
“provoking people, taking the initiative in leading mobs or simply by providing money or
materials to the rioters” (Shah 2002: 155).
The major turning point for the Hindu nationalists in Gujarat came in the form of the
1974 Navnirman movement. The Jan Sangh capitalized on the alienation of the Patidar-Bania-
Brahmin alliance from the Congress and expanded its support among these groups through active
participation in the Navnirman movement (Shah 1998). The BJP came into existence in 1980 as
the new avatar of the Jan Sangh and consolidated its base among the three elite castes. By the
early 1980s the support bases of the two main parties were clearly polarized; the Congress
enjoyed support primarily from lower caste sections while the Patidar-Brahmin-Bania castes
supported opposition parties including the BJP (Kohli 1990).
At the same time that these state-level changes were taking place, national-level shifts
complemented the BJP’s growing power in Gujarat. By the late 1980s, the BJP intensified its
mobilization campaign throughout India and relied strongly on the militant side of repertoire. It
upped the ante after the 1989 parliamentary elections, focusing on the Ayodhya issue; a
campaign which would change the course of the BJP’s political fortunes in India. The
57 The Sangh Parivar is the umbrella Hindu nationalist organization, which includes among its affiliates the BJP, RSS and VHP among others.

133
polarization created by the Ayodhya issue as well as the implementation of the Mandal
Commission recommendations at the national level by the V.P. Singh government in 1990
allowed the BJP to tighten its grip on the support of upper castes in much of north and west
India. Gujarat proved to be one of the BJP’s strongholds and the party would enjoy considerable
success in the state in the 1990s.
3.1.4 The post-1991 period: from political instability to majoritarian politics and a
pro-business model
With the foothold it gained in Gujarat from the anti-reservation riots in 1985 as well as the
fallout of the Ayodhya and Mandal issues, the BJP began to dominate electoral politics in
Gujarat. In the first decade after 1991, electoral dominance was, however, accompanied by
considerable leadership instability. Since 2001, Gujarat has been led by the controversial
Narendra Modi and has put in place a model that has combined pro-business policies with
majoritarian politics.
The rest of this section details politics in Gujarat in the 1990s and three general points are
emphasized in the account that follows. First, despite the instability in BJP’s leadership in
Gujarat in the 1990s, the party remained successful at the polls. Second, even in the midst of its
leadership problems prior to 2001, the BJP has been continuously backed by a narrow-right
coalition that includes three core groups – Patidars, Banias and Brahmins – over the last two
decades. The polarization of social bases of political parties that began in the 1970s continued.
Third, Gujarat’s politics since the 1990s has been reminiscent of some broader trends generally
associated with classic developmental states in that pro-business attitudes have been
accompanied by exclusionary politics. While classic developmental states in East Asia typically
134
excluded groups such as labor, politics in Gujarat has played out along identity lines in the form
of Hindu majoritarianism with the exclusion of certain social groups, most notably of Muslims.
The BJP first came to power in Gujarat as part of a coalition government from 1990 to 1994
with the socialist Janata Dal (JD) and Chimanbhai Patel as chief minister. The JD-BJP victory
unseated the Congress from the helm of Gujarat’s politics for the first time in a decade.
However, the 1990s would be marked by considerable leadership instability in Gujarat. Patel’s
tenure as chief minister of the JD-BJP coalition government exemplified the chaotic situation
that prevailed at the time. In his four year term as chief minister between 1990 and 1994, Patel
would represent three different parties – the JD, the JD(G) and the Congress. Patel, who had
been with the Congress and had been the chief minister of Gujarat at the time of the Navnirman
riots in 1974, defected from the Congress to the JD in the late 1980s. He subsequently broke
away from the JD to form the JD (G). Subsequently, he re-entered the Congress when the JD (G)
merged with it and remained in the Congress until his death in 1994.
Patel’s defection from the JD made it non-competitive by the time the 1995 elections came
around. With Patel out of the party, the JD collapsed in Gujarat and the 1995 elections was a
straight fight between the BJP and the Congress. Combining Hindu nationalist appeals with a
promise of ridding Gujarat of fear, hunger and corruption, the BJP won 42.5 per cent of the vote
share and 121 of 182 seats (Shah 1996). For the first time in the state’s history, the BJP formed
the government in Gujarat by itself. Since then, the BJP has almost continuously headed
governments in the state by itself.58
58 The sole exception was a brief period between 1996 and 1998 when a group of defectors led by Shankarsinh Vaghela broke away from the BJP to form a new party, the RJP, which briefly headed the government with the outside support of the Congress. Vaghela lasted a year in power before being replaced by Dilip Parikh, who had a similarly short term in office.
135
Despite its comfortable majority, the BJP had considerable difficulty managing power and
was beset by intense factional rivalry and leadership struggles. The main lines of conflict were
between a group led by Shankarsinh Vaghela, an OBC leader credited with expanding the BJP’s
support base to include marginalized social groups, and a rival group headed by the Keshubhai
Patel and Narendra Modi, the BJP state-wing’s general secretary at the time. The two factions
warred openly for the leadership of the party. Keshubhai Patel became chief minister after the
1995 elections but lasted less than a year in office. He was replaced by Suresh Mehta, who
similarly enjoyed a short tenure in office. Ironically, the Congress could not take advantage of
this internal dissension.
The BJP, however, suffered the consequences of the alienation of the Vaghela group. In the
1996 parliamentary elections, it saw reduced support from OBC, Dalit and Adivasi voters;
groups whose support Vaghela was credited in bringing to the BJP. Crucially, Vaghela, along
with 44 legislators loyal to him, split from the BJP to form the Rashtriya Janata Party (RJP) in
1996. The split brought down the BJP government and the RJP would come to form the
government with Vaghela as chief minister and outside support from the Congress in 1996. A
year later in 1997, Vaghela’s capricious leadership and attempts to cut into the Congress’ core
support base resulted in the latter withdrawing support and installing another chief minister of its
own choice, Dilip Parikh. Parikh would be Gujarat’s fourth chief minister in three years but his
government too did not last long and the state faced another round of assembly elections in 1998.
A three-way fight between the BJP, RJP and Congress ensued for the 1998 elections. With
the Congress and RJP cutting into each other’s core support bases, the BJP recorded a
comfortable victory. Even a second electoral victory in the state in three years did not stem the
intense internal rivalry within the BJP, creating increasing disenchantment with the party in the

136
general population (Shah 2002). This prompted the party’s national executive in 2001 to replace
Keshubhai Patel as chief minister with Narendra Modi, setting the stage for the tenure of a
controversial figure.
Before discussing Modi’s tenure in more detail, one point needs to be highlighted. Despite
the frequent changes in leadership in the 1990s, the BJP’s electoral victories were largely based
on the strong support that it continually received from the Patidars, Brahmins and Banias in this
period (the social bases of electoral coalitions in analyzed in greater detail in the next section).
Consistent with the party’s efforts throughout the country in the 1990s, the BJP attempted to
expand it support beyond the upper castes to the OBCs, SCs and STs. However, its attempts had
mixed, and in some cases, temporary support. By and large, more marginalized groups continued
to support the Congress. Voter attachments are analyzed in greater detail later in the chapter. For
now, it is sufficient to emphasize that despite numerous leadership changes, there was a strong
element of continuity in the BJP’s social bases of support.
In the 2000s, the BJP would not witness the leadership struggles of the previous decade.
Since 2001, Narendra Modi has been the chief minister of the state and his tenure has been the
longest one till date in Gujarat’s history. Once described as a “classic, clinical case of a fascist”
by social psychologist Ashis Nandy, few figures have been as controversial in India’s political
scene as Modi.59 Celebrated in business circles for leading an efficient, investor-friendly and
relatively clean administration, he is equally vilified outside these circles for his role in the 2002
Godhra pogrom, where over 3000 people, mainly Muslims, were killed. Though he is yet to be
personally convicted, Modi has been implicated in a variety of court cases and it is increasingly
clear that these riots occurred with state patronage (e.g., Shah 2007).
59 Nandy (2002).
137
For some authors, the Godhra massacre was symptomatic of a larger model put in place by
Modi, which inherently relies on a narrow majoritarian politics built around the exclusion of
certain groups, chiefly Muslims (e.g., Mehta 2011). Others similarly suggest that Godhra was the
continuation of the Sangh Parivar’s tactics of building militant Hindu nationalism with
considerable planning and state patronage (e.g., Shah 2007). They point out that communal
polarization has always been one of the tools used by the BJP to make electoral inroads. In
Modi’s case, the imperative to use the militant tactics might have been compounded by the fact
that he did have an existing personal support base when he came to head the government.
Modi’s political beginnings were with the hardline RSS and, until he became chief minister,
he was largely known as an organization man who had controlled the internal levers of power
within the BJP (Mehta 2011; Shah 2007). He was central to the BJP’s organization in Gujarat
since the late 1980s and gained visibility when arranging the Gujarat leg of L.K. Advani’s
controversial rath yatra as part of the Ayodhya campaign in 1990. Though a prime mover within
the party, Modi had never contested a state election till he took over as chief minister. When he
finally did in 2001, he barely managed to sneak through with a margin of 1,400 votes in the
Rajkot by-election.
Whatever the motivation, the Godhra killings created considerable polarization between
Hindus and Muslims. In the 2002 elections that followed the riots, Modi and the BJP won with
over 50 per cent of the vote; a rarity given levels of fragmentation typically seen in state
elections in India over the last two decades. In social terms, as the next section will analyze in
greater detail, the economically-advanced Patidar-Bania-Brahmin trifecta has remained at the
heart of the BJP’s support base in Gujarat.

138
Under Modi, Gujarat has consolidated a model that is strongly reminiscent of the classic
developmental states of East Asia. As authors have long suggested, Gujarat has exemplified
characteristics of developmental states since its formation in 1960 (e.g., Sinha 2005). However,
the state’s pro-business inclinations, its pace of growth and the political formula complementing
this model shows some differences under Modi when compared with past trends. In a pattern
similar to other developmental states and its own past, Gujarat has prioritized growth and
investment to the exclusion of other development metrics. In line with its focus, the state has
generally outperformed its counterparts on growth-related indicators. Gujarat has been one of the
fastest growing states and its net state domestic product has grown at average rate of over 11.1
per cent during the period 2002-03 to 2009-10.60 Its business-friendly state apparatus has been
particularly successful in attracting investment.
Performance on other measures of economic development has, however, been much less
impressive. Gujarat’s human development record has historically failed to match its growth
record and it remains an underperformer in this realm relative to its per capita income. The state
has, in the recent past, focused more on aspects such as education and has seen some
improvements in indicators such as literacy, agricultural growth, electrification of villages and
water supply but it remains a nascent trend. As with developmental states of the past, close state-
business relations are a primary component of Gujarat’s model. The state enjoys strong
credibility with big business. As chapter 2 outlined in greater detail, the state has formulated
policies that are more business-friendly in scope than its counterparts and has implemented many
of these policies earlier than its rivals.
60 RBI (2011).
139
The developmental states of East Asia were built around a narrow politics that involved close
state-business relations at the apex, the exclusion of certain classes and a degree of
authoritarianism. Gujarat typifies some of these trends, particularly exclusion and a degree of
authoritarianism. As some authors have described, Gujarat’s model reflects a brand of
authoritarian developmentalism, implicitly involving a bargain of economic development for the
“end of dissent and an intolerance for any questioning of a moral order where individual
freedoms, and indeed minority freedoms, would always seem hostage to the pulls and pressures
of a certain kind of muscular majoritarianism” (Mehta 2011: 113).
Certain social groups, most notably Muslims, Dalits and Adivasis, have not benefited from
Gujarat’s development gains as much as other sections. Bhalla (2012) finds that Muslims have
performed considerably worse than other social groups in Gujarat. They also fare worse than
Muslims in many other states on certain metrics of equity. Between 1999-00 and 2009-10, he
finds that Gujarat ranked 16 out of 17 major states in terms of improvements in female youth
education among Muslims. Similarly, decline in poverty appears to be uneven across social
groups. On the whole, poverty declined in Gujarat in this period among all socioeconomic
groups. However, when the extent of the decline in poverty among the upper caste non-minority
is compared to the decline in poverty of marginalized groups such as Muslims and Dalits,
Gujarat ranks 11th among 17 major states (Bhalla 2012).
The exclusion of certain social groups has been even more evident in the political sphere.
While Gujarat’s developmental bent has long been a feature since its formation in 1960, the
political strategy that has complemented its economic model has varied over time. Under Modi,
the BJP’s political strategy has revolved around three main components. In keeping with the
larger ideological platform of the BJP, Hindu nationalism has formed the core of Modi’s political
140
strategy. A strident anti-Muslim platform has continued to be a key piece of Modi’s political
strategy. The Godhra riots in 2002, where over 3000 people, largely Muslim, were killed is a
stark reminder of this platform.
The BJP under Modi has increasingly combined the theme of Hindu nationalism with a
second component – Gujarati “asmita” (pride) (Mehta 2011). The emphasis on asmita itself has
been a central element of several political mobilization and electoral campaigns. Over the last
decade, the BJP and Sangh Parivar in Gujarat has consciously organized numerous events and
coined slogans with the aim of building Gujarati subnationalism; a theme that has resonated
strongly with the party’s core constituency (Shah 2002). Finally, the BJP has highlighted the
state’s development achievements and its role in providing governance and political stability.
The rhetoric of development and good governance has been repeatedly used as a foil to
deflect criticisms of the state’s involvement in the post-Godhra riots. Modi has frequently
responded to questions of his role in the riots by suggesting that the criticism comes from those
who are jealous of Gujarat’s development achievements and seeking to slow its progress (Mehta
2011; Shah 2011). Politically, the rhetoric of development and governance has been combined in
substantial measure with identity politics themes over the last two decades in Gujarat.
In sum, two key points surrounding Gujarat’s model over the last two decades stands out.
The state has been unambiguously pro-business in its policy framework. This, in turn, has seen it
attract high levels of investment and achieve high growth rates. But this model has been
accompanied by majoritarian and illiberal politics.
141
3.1.5 Tracing the mechanism – coalitions, interests and policies
The previous section offered an introduction to Gujarat’s politics over time. In part, it tried to
chronicle the evolution of the social bases of various parties in the state over time. In this section,
I focus on linking the nature of electoral coalitions to Gujarat’s proactive response to the
competition for investment after 1991.
At a proximate level, I argue that Gujarat’s ability to prioritize investment promotion and
advance a pro-business agenda can be explained by the nature of electoral coalitions backing
governments. Narrow-right coalitions have almost continuously backed Gujarat governments
over the last two decades and this has had two consequences. First, the core groups in the
coalition are strongly supportive of a pro-business agenda, allowing the state to prioritize the
goals of investment promotion, specifically, and growth, more generally. Second, these priorities
have been reinforced by the fact that redistributive pressures placed on Gujarat governments
have been less intense than those seen elsewhere in India. As a result of both these factors, the
state in Gujarat has been able to formulate a coherent and consistent investor-friendly agenda
over two decades. Below, I first describe the composition of Gujarat’s electoral coalitions and
then trace the two mechanisms through which these coalitions allow the state to adopt a pro-
business agenda.
The BJP’s electoral strength in Gujarat over the last two decades has been derived primarily
from its mobilization of three groups – the Patidars, Banias and Patidars. These groups form the
core support of the BJP – the party relies disproportionately on their support when compared to
other social groups. The party’s strategy has been complemented strongly by the fact that these
groups have voted resoundingly for the BJP over the last two decades. Since the 1980s, the BJP
142
began to take advantage of the disaffection of the Patidar-Brahmin-Bania alliance with the
Congress. By the 1990s, the polarization in the social bases of the BJP and Congress was
markedly evident with the established Patidar, Bania and Brahmins supporting the former and
the more marginalized sections in Gujarat rallying behind the latter.
The polarization of the social bases of the two parties is clearly evident through a simple
examination of electoral survey data. Table 3.1 is based on calculations from Center for the
Study of Developing Societies (CSDS) survey data of the 2002 Gujarat Assembly elections. As
table 3.1 suggests, the BJP receives substantial support from the Patidars and upper castes (the
grouping includes Brahmins, Banias and other smaller upper caste groups). Over 81 per cent of
Patidars and 67 per cent of the upper castes voted for the BJP in 2002. In contrast, the Muslims,
Dalits and Adivasis strongly support the Congress.
This data points to two trends that have been a key feature of Gujarat politics over the last
two decades. First, there is a high degree of correlation in the vote choice of members of certain
social groups for each of the two parties. Despite economic differentiation among them, there is
a high degree of correlation in the vote choice of individuals within the same social group.
Second, the Congress and the BJP attract support from opposite ends of the social hierarchy.
Data from secondary sources (table 3.2 and 3.3) of other elections in the 1990s and 2000s show
very similar trends. Both parties are able to count on the support of entire social groups and the
core supporters of the BJP and Congress have remained stable over time with the Patidar – upper
caste grouping exhibiting a strong preference for the BJP and more marginalized groups equally
robust in their affinity for the Congress.
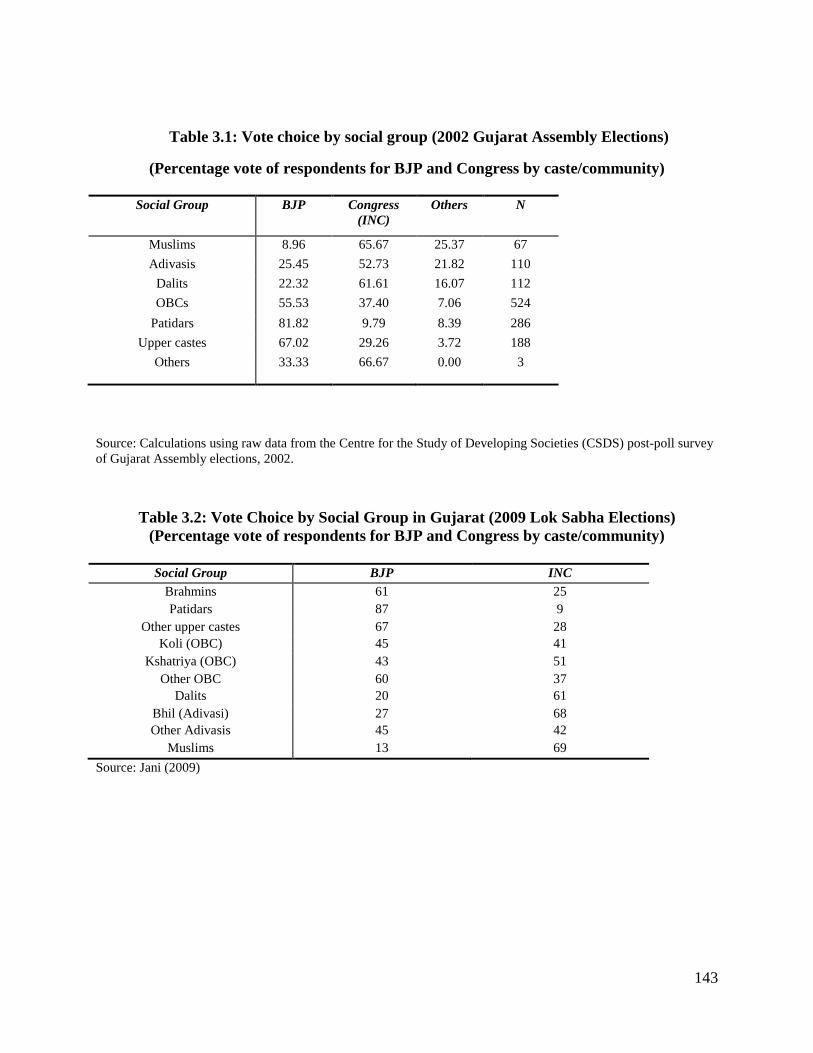
143
Table 3.1: Vote choice by social group (2002 Gujarat Assembly Elections)
(Percentage vote of respondents for BJP and Congress by caste/community)
Source: Calculations using raw data from the Centre for the Study of Developing Societies (CSDS) post-poll survey of Gujarat Assembly elections, 2002.
Table 3.2: Vote Choice by Social Group in Gujarat (2009 Lok Sabha Elections) (Percentage vote of respondents for BJP and Congress by caste/community)
Social Group BJP INC
Brahmins 61 25 Patidars 87 9
Other upper castes 67 28 Koli (OBC) 45 41
Kshatriya (OBC) 43 51 Other OBC 60 37
Dalits 20 61 Bhil (Adivasi) 27 68 Other Adivasis 45 42
Muslims 13 69 Source: Jani (2009)
Social Group BJP Congress (INC)
Others N
Muslims 8.96 65.67 25.37 67 Adivasis 25.45 52.73 21.82 110
Dalits 22.32 61.61 16.07 112 OBCs 55.53 37.40 7.06 524
Patidars 81.82 9.79 8.39 286 Upper castes 67.02 29.26 3.72 188
Others 33.33 66.67 0.00 3
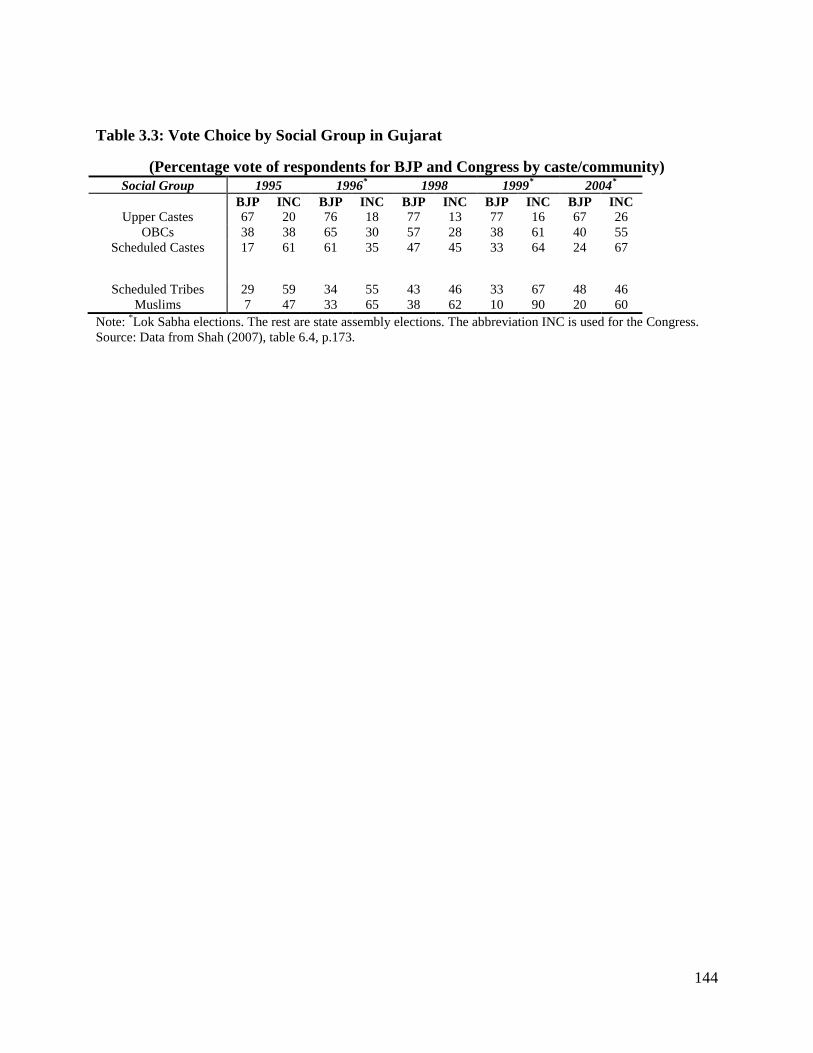
144
Table 3.3: Vote Choice by Social Group in Gujarat
(Percentage vote of respondents for BJP and Congress by caste/community) Social Group 1995 1996* 1998 1999* 2004*
BJP INC BJP INC BJP INC BJP INC BJP INC Upper Castes 67 20 76 18 77 13 77 16 67 26
OBCs 38 38 65 30 57 28 38 61 40 55 Scheduled Castes 17 61 61 35 47 45 33 64 24 67
Scheduled Tribes 29 59 34 55 43 46 33 67 48 46 Muslims 7 47 33 65 38 62 10 90 20 60
Note: *Lok Sabha elections. The rest are state assembly elections. The abbreviation INC is used for the Congress. Source: Data from Shah (2007), table 6.4, p.173.

145
The electoral data also demonstrate another key trend. While the Patidars, Banias and
Brahmins have firmly been in the BJP’s fold since the 1980s, the party attempted to widen its
base to include sections of the OBCs, Dalits and Adivasis, through a combination of Hindu unity
appeals, Gujarati subnationalism and welfare programs since the mid-1990s (e.g., Heath 1999;
Patel 1999; Shah 2007; Sud 2007). These attempts at expansion, however, have seen mixed and,
in some cases, temporary results. Though the BJP did see some success in attracting support
from the Dalits, Adivasis and OBCs in the mid-1990s. However, a sizeable portion of Dalits and
OBCs moved back to the Congress in recent times.
For several authors, the BJP’s inability to hold onto the support of more marginalized groups
is not surprising. Sud suggests: “Despite symbolic gestures like the Ekatmata Yatras, or Hindu
unity processions, of 1983 and 1995, and more concrete actions like the use of BJP government’s
development resources to woo the lower caste constituency, Gujarati-Hindu unity is proving
elusive for the Hindu right. The latter’s own cadres continue to show tremendous bias against the
lower and backward castes and the Adivasi tribals” (2007: 144). Shah similarly stresses the caste
bias within the BJP and suggests that “the upper and middle-caste members of the BJP still
dominate its apparatus and constitutes a hard core that resists the late comers from the Dalit and
OBC communities” (1998: 265-266).
I classify the electoral coalitions comprising of the Patidars, Banias and Brahmins, which
have backed successive Gujarat governments since the 1990s, as narrow-right. These three core
groups are among the most economically-advanced in the state and share a similar class profile.
The representation of economically-marginalized groups in this electoral coalition is limited. As
such, this electoral coalition has a confined class basis. This coalition also satisfies the second
criterion for narrow-right coalitions. As explained earlier, Patidars, Banias and Brahmins
146
comprise the bulk of the capitalists in Gujarat. Business presence in the BJP’s coalitions has
therefore been substantial.
The Banias were a merchant and trading caste in the traditional social structure. When
modern industry first appeared under the British in the late 19th century, access to finance and
business networks allowed the Banias to constitute the first stream of indigenous industrialists in
India. A second wave of entrepreneurship in Gujarat was dominated by the Patidars. Their
control of land and transfer of surpluses from commercial agriculture resulted in a shift to
industrial entrepreneurship. Importantly, there remain long-term continuities in terms of the
social composition of entrepreneurs in Gujarat and the three established castes continue to be
overrepresented in industry (e.g., Shinoda 2000; Streefkerk 2006).
Gujarat’s pro-business agenda is firmly in line with the interests of the Patidars, Brahmins
and Banias. Essentially, there is a coincidence between the interests of these groups and the
state’s goals of attracting investment. This overlap of interests has allowed the prioritization of
investment promotion over other tasks. It is only more recently that the state has begun to
belatedly focus on other development indicators such as education. Gujarat not only adopted
policies that are business-friendly but has typically undertaken these policies at an earlier time
period that its counterparts.
The prioritization of investment and growth has been strongly reinforced by the fact that
redistributive pressures arising from the BJP’s electoral coalition are relatively muted. The class
profile of the core groups backing BJP governments in Gujarat has meant that redistributive
pressures have been less intense than those seen elsewhere. This is highlighted for example in the
case of the acquisition of land by governments for private industry. Land acquisition has been a
147
highly volatile issue in several states but Gujarat has seen fewer problems in this area than other
states.
As such, these muted pressures for redistribution have meant that successive Gujarat
governments have not been forced to adopt contradictory policies that might otherwise have
diluted its business-friendly agenda. In particular, Gujarat has been relatively distinct in terms of
Indian states in that populism has not dominated the policy agenda. The government has tended
not to reward electoral support through large populist schemes such as free electricity. The
finances of the state have remained buoyant, letting the state focus on improving its business
environment and building infrastructure. These trends stand in sharp contrast to Punjab,
discussed later in this chapter.
3.1.6 Explaining the emergence of narrow-right coalitions in Gujarat
If the overlap of interests of narrow-right coalitions and the state has driven Gujarat’s
business-friendly agenda, how did such coalitions in the state? What explains the timing of this
emergence in Gujarat since the 1990s? I suggest that the answer lies in the prevalence of a non-
economic logic of politics. This logic, through its effect on both party strategies and voter
attachments, can cause narrow coalitions to emerge even in the presence of largely poor
electorates. In the case of Indian states, I focus specifically on identity politics, which has been
the key basis of political mobilization in India over time. I argue that the focus on identity
politics has had two significant effects – first on party strategies of electoral coalition
construction and mobilization and, second, on voter decisions.
In terms of party strategies, I highlight the role of social demography and suggest that
variation in underlying social cleavages has affected the type of electoral coalitions that parties
148
have chosen to construct. Identity politics has also had an effect on voters. In Gujarat, there is a
high degree of correlation in the vote choice of individual members within a particular social
group. As a result, the BJP can disproportionately rely on a relatively small number of groups.
The role of identity in both party and voter decisions has importantly impeded the development
of class politics in many Indian states.
The two avenues through which social identity affects the emergence of electoral coalitions –
party strategies and voter attachments – are analyzed with particular reference to Gujarat in turn
below.
3.1.6.1 Social cleavages and party strategies of coalition construction in Gujarat
The first effect on identity politics is on party strategies. In Gujarat, the emergence of
narrow-right coalitions can be traced to the state’s dominant caste patterns. Under dominant caste
patterns, certain groups are numerically preponderant and have also enjoyed control over
economic resources by virtue of their social position. Critically, the coincidence of resource
control and numerical preponderance inherent in dominant caste patterns has allowed for a
subsequent overlap of economic and political power.
Dominant caste patterns have influenced party strategies in two ways. First, large social
groups are present under dominant caste patterns. Numerically sizeable groups possess
considerable electoral leverage and are attractive targets for political parties (e.g., Chandra 2004;
Posner 2004). This is particularly true of first-past-the-post (FPTP) systems such as India. When
voters, in turn, act on the basis of social attachments and there is considerable correlation in the
vote choice of individuals within a large social group, the necessity of having to build broad-
based coalitions to win electoral majorities is limited. The weak incentive to build broad-based
149
coalitions has been amplified by the fact that state politics in India has been highly-fragmented
and regionalized over the last two decades. Fragmentation has meant that thresholds for victory
are typically well below 50 per cent. Diminishing thresholds for victory reinforce the impetus for
parties to target specific vote banks and makes the pay-offs to attracting large caste groups even
greater.
In Gujarat, the BJP derives its core support from the Patidars, Banias and Brahmins. In
particular, support from the dominant Patidar caste is a crucial factor in the emergence of
narrow-right coalitions. Patidars constitute almost 12 per cent of the state’s population, a sizeable
share by Indian standards, and also tend to constitute a major portion of Gujarat’s entrepreneurs.
The BJP has chosen to depend on the Patidars, along with the Banias and Brahmins, for its core
electoral support in Gujarat. Through its primary reliance on these groups, it has managed to
dominate the electoral space over the last two decades. As such, the ability to achieve
comfortable electoral victories while relying on the support of these three groups limits the
necessity to construct broad bases of support. This is not to suggest that the BJP does not receive
any support from other groups. While it does receive support from a section of the OBCs as well
as Adivasis and Dalits, these groups overwhelmingly support the rival Congress party. Their
support for the BJP has also varied over time, unlike the three established castes, which have
continuously allied with the BJP in large proportions over the last two decades.
The overlap between numerical strength and economic preponderance inherent in dominant
caste patterns also explains a second characteristic associated with narrow-right coalitions – the
substantial levels of business representation. In particular when numerically-sizeable groups
targeted by parties are also entrepreneurial, this can lead to substantial business presence in

150
electoral coalitions. It is this exact conjunction of size and entrepreneurial identity that has
facilitated narrow-right coalitions in Gujarat.
The Patidars have a history of landownership and this allowed their entry in large numbers
into industrial entrepreneurship. Since the early 20th century, and particularly after 1960, the
Patidars came to transfer surpluses from commercial agriculture and overseas migration into
industry, subsequently dominating the entrepreneurial scene in Gujarat (Shinoda 2000; Sinha
2005; Streefkerk 1997). Like the Patidars, the Banias made use of their access to capital and
financial networks and are similarly overrepresented among Gujarat’s entrepreneurial class.
Together, the presence of these social groups has ensured sizeable entrepreneurial representation
in electoral coalitions backing governments over the last two decades.
While the underlying caste structure has limited the BJP’s need to construct broad bases of
electoral support, a longer historical lens is, however, necessary to understand the specific timing
behind the emergence of narrow-right coalitions in Gujarat since the 1990s. In particular, the
sequence of political mobilization, also examined in the overview of Gujarat’s political history
earlier, matters in explaining why narrow-right coalitions came to specifically support the BJP in
the 1990s. More extensive details of the twists and turns of Gujarat’s politics are included in
section 3.1.3. It is worth reiterating some of those trends briefly here in explaining the timing of
the emergence of electoral coalitions.
Historically, the main lines of party competition in Gujarat have been structured around the
Patidars and Kshatriyas; the latter are also numerically large and form a major part of the OBC
category. Until the 1970s, Gujarat witnessed one-party dominance of the Congress and control of
party politics lay in the hands of a set of Patidar, Brahmin and Bania elite. Though numerically

151
sizeable, the Kshatriyas had been excluded from the top rungs of power of the Congress, leading
to considerable disenchantment.
The emergence of Indira Gandhi and the split in the Congress in 1969 would provide the
avenue for Kshatriya political expression. As part of her battles with the Syndicate, Indira
Gandhi mobilized the poor throughout the country. In Gujarat, this would result in a realignment
of the support base of the party. From the mid-1970s, under Indira Gandhi’s direction, the
Congress would put in place a strategy of nominating backward castes, tribals and Muslim
candidates on the party’s tickets (Sud 2007). From a party that was once dominated by the
Patidars, Brahmins and Banias, the Congress in the 1970s shifted its base to the Kshatriyas,
Dalits, Adivasis and Muslims (this electoral strategy known by the acronym KHAM would prove
fruitful for the Congress in the 1980s). This realignment of the Congress’s base in the 1970s
would be crucial in setting the stage for the trajectories of Gujarat’s politics over the next three
decades.
The rise of these more marginalized castes within the Congress meant a relatively sudden
exclusion of the three established castes from the highest rungs of power both within the
Congress as well as the government. The Patidar-Bania-Brahmin alliance reacted violently to
their exclusion. This was first expressed through the Navnirman movement in 1974. These
groups also importantly switched their allegiance away from the Congress, first helping the
Janata coalition win the 1977 assembly elections and subsequently backing the BJP from the
1980s.
Attempts by the Congress to increase reservations in 1985 for the OBCs brought out a second
wave of violent agitations in the form of anti-reservations protests headed by the Patidar-
152
Brahmin-Bania group. It was these protests in 1985 that proved to be decisive for the BJP’s
fortunes in Gujarat. Throwing its weight and organization behind the three established castes,
the BJP managed to channel their discontent into riots against Muslims and lower castes. The
BJP’s Hindu-nationalist appeals played strongly to the Patidar-Bania-Brahmin trifecta and this
alliance helped the BJP come to power and has since helped it remain almost continuously at the
helm of Gujarat’s affairs (Patel 1999; Shah 1987, 1991, 1996, 2007; Sud 2007).
In the 1990s, the BJP attempted to expand its base to OBCs, Adivasis and SCs. On the whole
it has seen mixed results; while the BJP has made some inroads into some sections of the OBCs
and Adivasis, the Congress continues to receive a plurality of votes from OBCs, Dalits and
Adivasis. These general patterns of polarization – the Patidar, Brahmins and Banias backing one
party and the OBCs, Adivasis, Dalits and Muslims supporting the other – had their roots in the
realignment that took place in the early 1970s and remain clearly evident even today.
3.1.6.2 The role of identity in voter attachments in Gujarat
In the previous section, I argued that the nature of Gujarat’s caste cleavages has affected the
incentives of political parties. The BJP’s disproportionate reliance on these three core groups has
been complemented by the nature of voter attachments. In particular, there is considerable
similarity in the voting decisions of individuals belonging to the Patidars, Banias and Brahmins.
Even though there is an element of economic differentiation within these social groups,
individuals typically vote en masse for the BJP. Such social affinity is not exclusive to the BJP;
the more socially-marginalized Dalits, Adivasis and Muslims show equally strong support for the
Congress. The Congress and BJP rely substantially on groups at the opposite end of the socio-
economic spectrum in Gujarat.

153
Survey data from the 2002 Assembly elections in Gujarat confirms the link between social
identity and voter attachments.61 Social identity is strongly significant in determining vote choice
in Gujarat as seen earlier in tables 3.1, 3.2 and 3.3. Table 3.4 includes results of a basic
multinomial logit analysis of the determinants of vote choice in the 2002 Gujarat assembly
elections. A regression of vote choice as the dependent variable and social group, locality,
gender and class (education level is used as proxy for class) was run. Vote choice for the
Congress was used as the reference category. Social group is a categorical variable that was
constructed based on caste and religion of the individual respondent and consists of 7 categories
– Muslims, Adivasis, Dalits, OBCs, Patidars, upper castes and a residual category of others.
Broadly, the categorical variable of social group was constructed in such a way that higher
values correspond to a higher position on the traditional social hierarchy.
The results in table 3.4 show that controlling for gender, locality and education (treated as
proxy for class), social group is strongly significant in predicting vote choice for the BJP when
compared with the Congress. In particular, the log odds of voting for the BJP compared with the
Congress are much greater for groups that are higher on the traditional social hierarchy. While
table 3.4 analyzes survey data from the 2002 assembly elections, tables 3.2 and 3.3, drawn from
the secondary literature, shows that the correlation between social identity and vote choice
remains high throughout the last two decades.
61 Data from the Centre for the Study of Developing Societies (CSDS) survey of the 2002 Gujarat Assembly elections.

154
Table 3.4: Social identity and vote choice in Gujarat (2002 Assembly elections)
Vote choice for Congress is reference category
BJP Others Constant -2.84
(0.38)*** -2.22
(0.55)***
Social Group 0.61 (0.06)***
-0.10 (0.07)
Gender -0.05
(0.13) 0.12
(0.21)
Education 0.17 (0.06)**
0.093 (0.092)
Locality 0.38
(0.17)** 0.74
(0.24)**
Pseudo R-squared 0.093 0.093 Log likelihood -1080.60 -1080.60 Observations 1290 1290
Multinomial logit estimates with standard errors in parentheses ** p<0.05; *** p<0.01(two-tailed)
Source: Calculated using data from the Centre for the Study of Developing Societies (CSDS) post-poll survey of Gujarat Assembly elections, 2002.

155
Figure 3.3: Predicted Probability of Voting for the BJP by Social Group and Class
Source: Calculated using data from the Centre for the Study of Developing Societies (CSDS) post-poll survey of Gujarat Assembly elections, 2002.
0
.2
.4
.6
.8
1
Pr (
Vote
= B
JP)
Muslims Dalits Adivasis OBCs Patidars Upper castes Others
Rural Male with Schooling Upto the Primary Level
0.2
.4.6
.81
Muslims Dalits Adivasis OBCs Patidars Upper castes Others
Predicted probabilities with 95 per cent confidence intervals
Rural Male With College Degree or Higher
0.2
.4.6
.81
Pr(
Vote
=BJP
)
Muslims Dalits Adivasis OBCs Patidars Upper castes Others
Urban Male with Schooling Upto the Primary Level
0.2
.4.6
.81
Muslims Dalits Adivasis OBCs Patidars Upper castes Others
Urban Male with College Degree or Higher
Predicted probabilities with 95 per cent confidence intervals
Predicted Probability of Voting for the BJP by Social Group

156
A comparison of the impact of social identity and class can be seen in figure 3.1 above.
Figure 3.1 compares the predicted probabilities for rural males with primary education, rural
males with a college degree or higher, urban males with primary education and urban males with
a college degree or higher. The figure clearly shows that the predicted probability of voting for
the BJP increases substantially among upper castes and Patidars compared with Dalits, Adivasis
and Muslims even within the same class. Whether the individual has low or high educational
attainments, the predicted probability of voting for the BJP compared with the Congress
increases from more marginalized social groups to those traditionally higher in the social
hierarchy.
In this section, I argued that Gujarat’s proactive response in the competition for
investment can be traced to narrow-right coalitions. These coalitions have allowed the state to
prioritize a coherent investor-friendly policy framework. Identity politics forms a crucial part of
the story. The impact of identity politics on both party strategies and voter attachments helps
explain the emergence of narrow-right coalitions in Gujarat.
3.2 Punjab – Wide-right coalitions and competitive populism
Despite possessing sound infrastructure and a relatively well-developed industrial base prior
to reforms, Punjab has been slow to react to the post-1991 environment. As chapter 2 suggested,
its policies have not been as investor-friendly as Gujarat or AP. I argue that the state’s sluggish
response to the competition for investment can be traced to wide-right coalitions that have
backed governments in Punjab since the 1990s. The diverse groups in Punjab’s wide-right
coalitions have contradictory interests. This has, in turn, necessitated a complex balancing act on
the part of successive governments and various governments have chosen to employ a populist

157
strategy to placate different groups. This has resulted in a vicious cycle of competitive populism
that has drained the state’s finances and adversely affected its ability to undertake business-
friendly policies. Resources aside, the strong leverage of agricultural interests in these coalitions
has also meant that policy-makers, by and large, do not have strong electoral incentives to be
industry-friendly.
As in the case of Gujarat, these coalitions have social origins. Like other parts of India,
identity has played an important role in Punjab’s politics. However, unlike Gujarat’s dominant
caste patterns, the cross-cutting nature of cleavages in Punjab has structured electoral
competition very differently. In particular, cross-cutting cleavages have meant that parties have
to target a broad range of social groups to come to power. In addition, voter loyalties are also
more dispersed. Unlike Gujarat, where specific social groups were strongly tied to particular
parties, attachments within social groups tend to be divided across parties in Punjab.
3.2.1 Background: economic structure and performance
For most of India’s post-independence history, the state has been one of the richest in the
country. At the start of the economic liberalization process, Punjab’s per capital income was
higher than all other Indian states except Goa.62 By 2009-10, its rank slipped and the state’s per
capita income of Rs. 43,539 was seventh among all Indian states.63 Poverty has tended to be
lower in Punjab than most other Indian states and it currently has a poverty ratio of 15.9 per cent,
well below the national average. In addition, income inequality has historically been low.
62 Delhi also had a higher per capita than Punjab but was classified as a union territory. Union territories tend to be extremely small administrative units in population and area when compared with states in India. 63 RBI (2011). Punjab ranks seventh in terms of per capita income among all Indian states in 2009-10. This does not include union territories.
158
Backed by high levels of public investment in irrigation during the colonial era as well as the
early years of independence, agriculture has been the mainstay of Punjab over time. The state
was at the forefront of the Green Revolution in the 1960s and 1970s. Though it is relatively small
in terms of total population (2.3 per cent of India’s population), Punjab produces a considerable
portion of the country’s agricultural output. In 2009-10, it accounted for 12.5 per cent of the total
food grain production in India.64 As is the case in most Indian states, there is a mismatch
between the sectoral composition of GSDP and employment patterns. While almost 70 per cent
of the state is rural, agriculture contributes only a quarter of the state’s GSDP. Both industry and
services account for a greater portion of the state’s gross domestic product; the share of industry
is nearly 32 per cent while that of services is 44 per cent.65
Though Punjab does not have as long an entrepreneurial lineage as Gujarat, it nevertheless
had a vibrant business sector prior to liberalization. In fact, the origins of industrial
entrepreneurship in Punjab can be traced to the pre-independence period – social groups such as
Banias and Khatris had a business presence in northwest India. The influx of migrants from
Pakistan after partition in 1947 catalyzed industrial entrepreneurship in the state, resulting in the
development of a thriving small-scale industrial sector. With manufacturing hubs such as
Ludhiana, Amritsar and Jalandhar, the state emerged as a strong industrial performer in the
1960s and 1970s, most notably in sectors such as automobile components, bicycles and woolen
textiles.
While the state has enjoyed higher levels of prosperity than most of the country in the post-
independence period, the history of Punjab has been “marked by endemic conflict, with repeated
64 Population figures from the Census of India 2011 (provisional tables, Table 1; censusindia.gov.in; accessed May 30, 2011).Food grain production from RBI (2010), Table 23. 65 GSDP data from Central Statistical Organization, Government of India (mospi.nic.in).
159
outbursts of violence, among the various groups settled in the region” (Nayar 1968: 435). The
most traumatic of those episodes of violence occurred at the time of independence in 1947, when
Punjab was partitioned between Indian and Pakistan. Two-thirds of undivided Punjab and half its
population went to Pakistan (Anand 1976; Kumar and Sharma 2009). More consequentially, the
state witnessed tremendous levels of displacement, turmoil and violence as a result of partition.
The state managed to recover and was the key site of the Green Revolution in the country in the
1960s and 1970s. Political troubles once again surfaced in the form of a Sikh separatist
movement in the late 1970s and 1980s.
The period of militancy came to an end in the early 1990s and the state has remained
peaceful since. Ironically, Punjab has regressed in terms of agricultural and industrial growth
since the early 1990s. Despite being in the throes of militancy for most of the 1980s, the state’s
industrial growth performance was well above the national average. However, the return of
peace in Punjab coincided with slow industrial growth and the state recorded rates that were
considerably below the national average in the 1990s. While Punjab’s manufacturing growth
between 1980 and 1990 was 9.32 per cent, it decelerated to 5.74 per cent between 1991 and
2001.
The state’s economic slowdown over the last two decades is evident in its performance in the
competition for investment. Punjab’s inability to compete effectively in the competition for
investment has been a central feature of its economic regression in the post-1991 period. With its
rich agricultural base, good infrastructure and entrepreneurial culture, Punjab had sound initial
conditions to attract investment in 1991. Yet, the state has simply been too slow to adjust to the
needs of economic liberalization (e.g., Ahluwalia et al. 2008; Singh 2005).
160
The sections below will examine the roots of this apathy. I begin by describing Punjab’s
cross-cutting social cleavage patterns. These cleavages have resulted in a particular pattern of
political competition, which is outlined in 3.2.3 and 3.2.4. These political dynamics have
fostered wide-right coalitions in Punjab. The link between these coalitions account and the
state’s weak response to the competition for investment is discussed in 3.2.5. The emergence of
wide-right coalitions in Punjab is explained in 3.2.6.
3.2.2 Punjab’s social structure: cross-cutting influences and history of
entrepreneurship
Since 1966, when the current borders of the state came into existence, Punjab has been
India’s only Sikh majority state. Sikhs account for nearly 60 per cent of the state’s population
while Hindus are the next largest religious group, constituting almost 37 per cent of the
population.66 The egalitarian challenge posed to Hinduism from other religions in Punjab meant
that the social system was historically less rigid than the one seen in the Hindi-heartland or parts
of the south (Frankel 1989c).
Unlike other Indian states where one dimension of identity has often dominated, Punjab’s
social structure has been subject to multifold influences. Wallace suggests: “piaz, the ever-
present onion in Indian cooking, provides an apt metaphor in an examination of class, caste,
status, ethnicity and dominance patterns in Punjab. Peel away the layer of economic position
within a class and uncover the stratum of izzat¸ honor or status, which binds particular groups,
often irrespective of economic position. Further layers reveal admixtures of social and political
characteristics such as tribe-like values, caste and kinship considerations, language, region and
66 Data from the 2001 Census of India; available at indiastat.com.

161
religion” (1989: 416). Among these multiple influences, religion, caste and class have all
interacted to create a social structure that exhibits a considerable degree of complexity. I term
this cleavage pattern as “cross-cutting” as these multiple identity dimensions have had a cross-
cutting effect and have resulted in a structure that is characterized by social groups of a small
size.
Since the reign of the Mughals, religion has historically acted as one of the main lines of
conflict in Punjab and this divide has often manifested itself in violent terms (Nayar 1968). Prior
to independence, Muslims, Sikhs and Hindus all had a sizeable presence in Punjab but partition
and the transfer of Muslim-majority districts to Pakistan left the state with a negligible Muslim
population. Since then, the Hindu-Sikh cleavage has constituted a major axis of the social
structure in Punjab. Historically, a mapping between the religious and rural-urban dimensions
existed in Punjab. Sikhs were largely rural while Hindus were primarily involved in trade and
commerce and identified as an urban group (e.g., Kumar 2006; Wallace 1989). Urbanization,
however, has blurred these boundaries considerably over time. Between 1947 and 1966, the
Hindu-Sikh divide also manifested itself in the form of a linguistic conflict over the creation of a
Punjabi-speaking state, which the former opposed and latter supported.
Both Sikhs and Hindus are divided internally by caste and sects. In terms of social practices,
the caste structure in Punjab has tended to be less rigid that many other states. Unlike patterns in
many other Indian states, caste has not been the sole axis of political mobilization in Punjab.
Nevertheless, it has been a major factor that has operated politically in conjunction with other
cleavages, primarily religion (e.g., Kumar 2009a; Nayar 1966; Wallace 1989). Castes and sects
have created internal divisions and have been particularly crucial in preventing the Sikhs “from
acting in politics as a single entity on a sustained basis and have made for competing groups

162
within Sikhism” (Nayar 1968: 437). Nayar also suggests that internecine conflict between Sikh
sub-groups has occurred from time to time in the state.
Among the Sikh castes, the Jat Sikhs have been a key political player in the state, particularly
since the 1960s. The Jats, a predominantly landowning agricultural caste, comprised around 16
per cent and 35 per cent of the state’s pre-partition Hindu and Sikh populations respectively
(Wallace 1989). In general, the cross-cutting nature of Punjab’s cleavage structure has meant that
few groups enjoy numerical strength but the Jat Sikhs carry relatively more numerical weight
than other social groups in Punjab. Historically, Jat Sikhs were a peasant caste who enjoyed the
control of land and they were the prime beneficiaries of the Green Revolution. As late as the
1980s, Singh (1984) suggests that Jat Sikhs controlled more than 60 per cent of land in rural
areas in Punjab.
A sharp social and political divide exists between Jat Sikhs and lower caste Sikhs,
particularly Dalit Sikhs, who are often landless and employed as agricultural labor (e.g., Kumar
2006; Wallace 1986, 1989). Dalits in Punjab comprise a sizeable 28.9 per cent of the state’s
population, the highest proportion in all Indian states.67 Dalits are present among both Hindus
and Sikhs in Punjab and constitute approximately 20 per cent of the latter (Wallace 1986). In
addition to Dalit Sikhs, a variety of artisanal castes exist among the Sikhs, most notably Lohars
and Tarkhans. Punjab is also home to several economically-powerful merchant and trading
castes such as Khatris, Aroras and Agarwals, who have had a significant entrepreneurial
presence in the state and are also present among both Hindus and Sikhs. These entrepreneurial
groups, however, enjoy little numerical weight. Like the conflict between Jat and Dalit Sikhs, a
67 Data from Census of India 2001 (censusindia.gov.in)
163
division between the high caste urban Khatris and Aroras on one side and the rural land-owning
Jats on the other has also existed (Nayar 1968).
These internal divisions have affected political dynamics considerably, acting in particular to
segment the Sikhs in the electoral arena. The SAD has historically been a party that has
represented the Sikhs but has not been able to gain support from all Sikh sub-groups in the
electoral arena, except on a rare occasion at the height of militancy in the mid-1980s. Though Jat
Sikhs are closely tied to the Akali Dal (SAD), the party has not been able to rely solely on this
group to construct electoral majorities. Prior to the 1960s, the SAD was controlled by merchant
and trading Khatris and Aroras. These upper caste groups lost out to the Jat Sikhs, who have
dominated the SAD since. This dominance has driven Dalit Sikhs and the artisanal Sikh castes,
who have historically opposed the Jats, to support the rival Congress in large measure.
Similar caste divisions exist among Hindus in Punjab. Among the twice-born Hindu castes,
Brahmins tended to have a small presence in Punjab (3.7 per cent) while Rajputs are more
sizeable (8.3 per cent). Other notable upper caste groups, found both among Hindus and Sikhs,
include the Khatris and Aroras. The merchant and trading Banias are also present in the state.
Like many other parts of India, certain social groups are tied to particular economic activities.
The historical pattern in Punjab has been that Sikhs, especially Jat Sikhs, have controlled land
while upper caste Hindu groups such as the Khatris, Aroras, Agarwals and Banias have
dominated trade, commerce, money lending and the service sector. These trading and financial
groups have also been urban compared to the more rural Sikh groups. In the past, conflict within
Punjab’s Hindus, between adherents of the reformist Arya Samaj and the orthodox Sanatan
Dharm sects, has existed on occasion (Nayar 1968).
164
As in Gujarat, entrepreneurship has been closely linked to the social structure. From the
1920s onwards, a number of trading and merchant groups formed the core of Punjab’s
entrepreneurial base. Like most parts of the country, merchant and trading groups such as the
Banias, with their access to financial resources and networks, became the earliest entrepreneurs
in Punjab. In the pre-independence era, other upper caste Hindu groups with access to financial
resources, primarily Khatris and Aroras, also had a strong association with business, particularly
in cities such as Amritsar, Lahore, Rawalpindi and Multan in undivided Punjab (Pandit 1978).
Their entrepreneurial presence, however, was mainly in small-scale industry and there were few
large-scale Khatri entrepreneurs prior to independence (Damodaran 2008). In general,
entrepreneurial presence was smaller in both scale and spread when compared with western and
eastern India.
Partition in 1947 changed the entrepreneurial dynamics in Punjab and the influx of Hindu
refugees from Pakistan catalyzed the development of small-scale industrial entrepreneurship in
the state. Punjab’s industrial growth in the 1970s and 1980s was rapid. The state produced the
lion’s share of the country’s output in sectors such as hosiery, woolen textiles, metal goods,
rubber goods and sporting equipment. A considerable portion of this industrial growth was
driven by Khatri businessmen as well as from other Hindu groups such as Aroras and Agarwals
who had migrated from Pakistan (Damodaran 2008; Pandit 1978). Apart from the Khatris and
Aroras, some artisanal Sikh castes such as Tarkhans and Lohars have also moved into industry,
particularly bicycle and automobile components.
One aspect of Punjab’s entrepreneurial history stands in contrast to Gujarat as well as Andhra
Pradesh and is of vital consequence. Unlike the Patidars and Kammas in AP , who used surpluses
from commercial agriculture to enter industry, Punjab’s primary class of capitalist farmers – the
165
Jat Sikhs – failed to make a similar transition (Damodaran 2008). This failure to transition,
despite considerable commercial success in agriculture, is surprising. Damodaran points out that
the paradox of the incomplete transition to industry is characteristic of both Jat Sikhs in Punjab
and Jat Hindus in neighboring Haryana. He speculates that the likely reason for the failure to
transition to industry is a result of the social structure in various parts of India. Unlike south
India and parts of western India, entry into industry was more difficult in the north due to the
existing influence of traditional merchant communities. The social structure in the south included
few Vaishya (merchant and trading) groups. This afforded opportunities for agrarian capitalists
and others to move into industry. In contrast, Damodaran suggests: “in the north conditions have
been altogether different. The Banias, Marwaris and Khatris [traditional merchant and trading
groups] have been ubiquitous in commodity and money markets; this has made the entry point
for affluent capitalist farmers not terribly inviting even in areas such as agro-processing” (2008:
275).
Whatever the reasons for the failure of Jats to transition to industry in a large-scale manner,
the dynamic is of considerable importance. Notably, the failure of the Jat Sikhs to transition to
industry has meant that business groups in Punjab carry little numerical weight in general to be
politically significant. As such, this has limited the potential for an overlap between political and
economic power in Punjab of the type that has been seen in Gujarat and, to a lesser extent, AP.
To sum up this discussion of Punjab’s social structure, two key points are worth reiterating.
First, multiple cleavage dimensions have interacted in a cross-cutting manner to create a complex
social structure in which few social groups are numerically significant. In particular, caste has
internally divided both Sikhs and Hindus into numerous segments. The Jat Sikhs are relatively
sizeable when compared with other social groups but do not possess sufficient numerical
166
strength to dominate the electoral arena. Second, entrepreneurial groups exist in Punjab but, like
other social groups in the state, tend to be small. Even though the state possesses a history of
industrial entrepreneurship dating to the pre-independence period, the lack of numerical strength
has circumscribed the political impact of business. Punjab’s cleavage structure does not
demonstrate the overlap between group size and entrepreneurial identity that Gujarat’s does. As a
result, this limits the possibility of a confluence of political and economic power. Instead, the
cleavage structure has been more amenable to wide-right coalitions, which have been the norm
in Punjab.
3.2.3 An overview of politics in Punjab before 1991
Punjab’s complex social structure has had a major role in shaping the trajectories of the
state’s politics over time. These political trajectories can be divided into four major periods – the
early post-independence period from 1947 to 1966, the period from 1966 to 1980, the height of
Sikh extremism during the 1980s, and finally the post-militancy period after the early 1990s.
While specific issues have varied in these periods, some commonalities in all four eras
are emphasized in the overview of Punjab’s political history below. First, Punjab’s party system
has remained bipolar over time. Since independence, the Congress and the Shiromani Akali Dal
(SAD) have been the two main poles in the state. Other parties such as the BJP (as well as its
predecessor, the Jan Sangh), the CPI and CPI (M) have been alliance partners at various times
with both the Congress and SAD. As was the case with the communist parties in previous
decades, the BJP currently enjoys support from certain sections of Punjabi voters but lacks the
capacity to win elections independently. Second, as mentioned earlier, a variety of different
cleavage dimensions – religion, class, caste and, to a lesser extent, language and region – have all

167
mattered in Punjab’s politics since 1947 (e.g., Kumar 2006, 2009b; Wallace 1989). No single
cleavage dimension has completely dominated politics for any lengthy period of time.
Third, this interaction of cleavage dimensions has meant that parties have had to target a
broad range of social groups to construct electoral majorities. Since independence, the Congress
has chosen to adopt the middle ground and has attracted support from a wide range of social
groups. In contrast, the cleavage structure and its own history as a Sikh nationalist party, has led
to a degree of ambivalence in the type of politics that the SAD has chosen to pursue. On one
hand, the SAD has attempted to focus on Sikh-specific demands in line with its own history as
the main representative vehicle of Sikh political interests. Its primary base also relies strongly on
the Jat Sikhs. On the other hand, electoral imperatives have forced the SAD at various times after
1947 to enter into coalitions with Hindu-nationalist parties, first the Jan Sangh and, more
recently, the BJP. The Jat Sikhs are loyal SAD supporters but the Congress attracts sizeable
support from other Sikh castes. As a result, the SAD’s ability to win elections on its own is
limited and it has had to enter into alliances with the Hindu nationalists to come to power. These
coalitions have combined the complementary rural and Sikh base of the SAD with the urban and
Hindu base of the BJP.
3.2.3.1 Politics in the aftermath of independence – 1947 to 1966
Prior to independence, the Congress never enjoyed unified social support in Punjab as it
did in many other parts of India. Political support was divided along religious lines with the
Congress, SAD and Muslim League enjoying the support of Hindus, Sikhs and Muslims
respectively. Since independence, the SAD and Congress have been the two major political
168
parties in Punjab with other parties such as the BJP, the Jan Sangh and the two communist
parties, enjoying a small degree of electoral success at different times.
The SAD was formed to represent Sikh interests and came into existence in the 1920 as
an outgrowth of a broader Sikh nationalist movement. Since the 1870s, Sikhs began to politically
organize themselves through various Singh Sabhas (e.g., Puri 1983; Telford 1992). A major step
in the institutionalization of Sikh politics occurred in 1920, first with the formation of the
Shiromani Gurudwara Parbhandhak Committee (SGPC), an elected committee of Sikhs
responsible for the operation of gurudwaras (Sikh temples) and other religious assets. This was
followed by the establishment of the SAD itself, which would replace the Singh Sabhas as an
organized vehicle of Sikh interests (Wallace 1988). Throughout the history of Sikh political
representation, there has been a close link between political organizations and key religious
institutions. In the case of the SAD, it has had direct links with the SGPC since its inception.
Committed to protecting Sikh interests, the SAD threw in its lot behind the Congress and
India at the time of independence, rejecting Jinnah’s overtures aimed at drawing Sikh support for
Pakistan. In the immediate post-independence period, the Hindu-Sikh alliance that formed prior
to partition continued to have an effect; the SAD supported the Congress government and its
candidates even ran on Congress tickets in the first elections (Wallace 1989).
The Congress-SAD collaboration, however, began to fray by the mid-1950s. Despite this,
communal conciliation and accommodation essentially characterized politics in the state until the
mid-1960s due to a leader of considerable strength within the Congress – Pratap Singh Kairon,
who was Chief Minister of Punjab from 1956 to 1964. As a Jat Sikh with a strong Nehruvian
nationalist bent, Kairon was able to bridge Hindu and Sikh concerns. Kairon also reformulated
169
the Congress’ electoral base to create a coalition that was more fully representative of religious,
class, caste, rural-urban and regional dimensions of Punjab’s polity. By including a variety of
elector profiles within its fold, the Congress’s strategy in Punjab was to appropriate the political
middle ground (Wallace 1989). Given the presence of a Sikh nationalist party (the SAD), a
Hindu right-wing party (the Jan Sangh) and the Communists, the middle ground proved effective
for the Congress. The Congress has continued to adopt the same strategy since.
By the early 1960s, the SAD’s strategy would see major changes that crucially affected
the trajectory of the party as well as Punjab’s politics. As mentioned earlier, the SAD was
formed to represent Sikh interests. In the 1950s, with the fraying of the Congress-SAD pre-
independence alliance, the SAD began to voice greater demands for Sikh autonomy. These
demands would take on a more secular mode from the early 1960s. In 1962, a split occurred in
the SAD and this resulted in a major change in the social composition of its leadership. Until the
early 1960s, the SAD was dominated by members of the urbanized, upper Khatri and Arora
castes led by Master Tara Singh. In 1962, the party split and the leadership of the main wing
would come under the control of Sant Fateh Singh and well-to-do rural Jat Sikhs (Telford 1992;
Wallace 1988). Jat Sikhs control of the SAD, which began in 1962, continues till today.
Sant Fateh Singh shifted the party’s platform from focusing purely on Sikh-specific
issues to a more secular one. This dialectic between a secular strategy and a Sikh-oriented one
divided moderates and extremists within the party. It continued to be theme that characterized
politics within the SAD until the 1990s. Realizing that the central government was not
amendable to demands for autonomy made on the basis of religion, the SAD under Sant Fateh
Singh resorted to linguistic appeals and called instead for a separate Punjabi-speaking state
(“Punjabi Saba”). The States Reorganization Commission, formed to examine linguistic claims

170
and oversee the redrawing of state boundaries on a linguistic basis, initially rejected the SAD’s
claim for a separate Punjabi Saba. Nevertheless, the SAD’s agitation for a separate Punjabi-
speaking state continued and the central government eventually changed its stance in 1965. With
mounting pressure for a separate state on the eve of the Indo-Pakistan war in 1965, the Congress
high command in New Delhi, keen to avoid diversions, agreed to the creation of a separate
Punjabi-speaking state. This resulted in the borders of Punjab being redrawn and three different
states emerged in the process in 1966 – a Sikh-majority Punjab, a Hindu Jat-dominated Haryana
and Himachal Pradesh.
3.2.3.2 Reconfigured boundaries and a changed political environment – 1966 to 1980
Though it was successful in achieving its demand for a separate state, the post-1966
political situation would pose a major political dilemma for the SAD; one that the party has
continued to grapple with ever since (e.g., Telford 1992; Wallace 1986, 1989). As the main voice
and party of Sikh nationalism, its demands until then had been primarily confined to Sikh-
specific issues. With the changed borders in 1966, the Sikhs became a majority in Punjab. From
constituting approximately 33 per cent of Punjab’s pre-1966 population, the Sikh share of the
state’s population increased to 60 per cent of the state (Puri 1983). Given its identity as a Sikh
party, this changed demography might have appeared to be seemingly advantageous to the SAD.
However, it faced a difficult route to political power in the state. In particular, the Congress
attracted a sizeable portion of the Sikh vote and Puri suggests that the SAD typically attracted
only about half of the Sikh vote at that time. The SAD, thus, entered a political situation after
1966 where a Sikh-specific platform was insufficient to construct electoral majorities.

171
The SAD temporarily solved this dilemma after the Assembly elections in 1967 and 1969
by entering into an alliance with an unlikely bedfellow, the Jan Sangh, the predecessor of the
Hindu-nationalist BJP. Interestingly, the Jan Sangh had strongly opposed the SAD’s demand for
the creation of a separate Punjabi-speaking state. Ideological differences aside, the SAD-Jan
Sangh alliance was electorally effective in combining the predominantly rural Jat Sikh vote base
of the SAD with the urban Hindu base of the Jan Sangh (Kumar 2006). This alliance would also
be the precursor for a similar collaboration between the SAD and BJP in the post-1990 period.
The SAD-Jan Sangh alliance in the 1960s would however be short-lived; a series of defections in
1969 led the SAD to dispense with coalition politics. However, this would be a temporary
phenomenon.
The SAD’s coalition with the Jan Sangh served to create a schism between more
moderate members, who were amenable to the party’s secular strategy, and more extreme Sikh
nationalist elements (Puri 1983). These divisions would be played out with substantial effect
after 1971. Poor performance in the 1971 parliamentary elections and a significant loss at the
hands of the Congress in the 1972 state assembly elections led the SAD to attempt to consolidate
Sikh support. It reverted to a strategy of emphasizing Sikh-specific issues, as it had done prior to
1966. This reversion to a Sikh-specific orientation was most notably expressed through the
party’s Anandpur Sahib resolution of 1973, which defined the Sikhs as a nation and demanded
considerable devolution of power from the central government in New Delhi (Kumar 2006; Puri
1983; Telford 1992). Considerable controversy surrounds the interpretation of the Anandpur
Sahib resolution. One view portrays it as a call for a separate Sikh homeland while others
suggest it was a more benign political manifesto (Puri 1983).
172
Whatever the case, the period from the mid-1970s would see a rise in Sikh separatism.
Rising extremism would be temporarily subsumed by India’s brief tryst with authoritarianism in
the form of Indira Gandhi’s declaration of Emergency in 1975. During the Emergency, Indira
Gandhi tried to make overtures to the SAD in Punjab but the party was highly critical of her
methods and supported the opposition Janata coalition. On the back of popular discontent in light
of the Emergency, the Janata unseated the Congress at the national level for the first time in
India’s history in 1977. In the Punjab assembly elections that occurred at the same time, the SAD
was successful but fell one seat short of an electoral majority of its own. It once again resorted to
coalition politics, entering into an alliance with the Janata. This government however lasted only
two years.
3.2.3.3 The 1980s – Sikh militancy and Punjab in crisis
The fall of the coalition government in Punjab in 1979 saw the extremist wing gain
ground within the SAD. Concurrently, as the SAD moved to a more extremist position, policies
of Indira Gandhi’s government ironically aided the foundations of a Sikh secessionist movement.
Both these factors would pave the way for particularly violent period in the 1980s when Sikh
militancy came to the fore.
Indira Gandhi and the Congress stormed back to power in the 1980 Lok Sabha elections
in much of India and this was the case in Punjab as well. In a bid to undercut the SAD’s
influence with Sikhs, the Congress propped up an extremist preacher, Jarnail Singh
Bhindranwale, in the late 1970s (Wallace 1988). Over the next few years, in the face of central
government’s intransigence and ineptness, Bhindranwale would lead a violent secessionist

173
movement that demanded the creation of a separate Sikh state, Khalistan, independent from
India.
As militancy grew, backed by resources and support from the large overseas Sikh
diaspora, there was a marked deterioration in the law and order situation after 1980.
Bhindranwale’s group carried out assassinations of prominent Hindu and Sikh opponents and
targeted security forces and government officials throughout the state. A series of failed
negotiations between the national Congress government and the SAD and growing demands for
Khalistan led the central government to impose President’s rule in the state in 1983.68 By 1984,
Wallace (1989) suggests that there was a complete breakdown of social and political structures
and neither President’s rule supported by a strong presence of paramilitary forces nor Sikh or
Hindu institutions could contain the growing violence.
The situation would come to a head in the summer of 1984 when Operation Bluestar was
mounted by the Indian army in an attempt to remove Bhindranwale and his group from the
Golden Temple in Amritsar, Sikhism’s holiest place of worship where the militants had set up
camp. Though successful in killing Bhindranwale and his followers, the heavy-handed approach
of the Indian army, replete with the use of tanks and artillery in the most sacred areas of the
shrine, served to exacerbate the situation and create sharp polarization between Hindus and
Sikhs. Operation Bluestar would also end up claiming Indira Gandhi’s life – she was
assassinated in October 1984 by her Sikh bodyguards in retaliation. In turn, her killing would
spark major riots in New Delhi and surrounding areas and almost 3000 Sikhs killed in the five-
68 President’s rule is a provision in the Indian constitution that allows the central government to dissolve elected state legislatures in the event of a deteriorating situation of law and order and declare a state of emergency. Under such an event, the state is administered directly by the central government and fundamental rights are suspended.
174
day period following her assassination (Wallace 1989). The prospects for a political solution
looked distant in the aftermath of the events of 1984.
Surprisingly, Rajiv Gandhi, who succeeded his mother as Prime Minister, attempted a
different approach to the secessionist crisis in Punjab. With the Congress winning a huge
majority in the 1984 parliamentary elections, Rajiv Gandhi adopted a more conciliatory approach
to the Punjab problem that stood in sharp contrast to his mother’s. Several steps were taken
towards a solution, including a peace accord in 1985 with the moderate leader of the SAD, Sant
Longowal. However, extremist elements within the SAD and other Sikh organizations opposed
the accord and, in August 1985, Longowal was assassinated by militants. The assassination,
however, would lead to the beginning of a decline in public sympathy for Sikh extremism.
Despite the victory of Surjit Singh Barnala and the moderate faction of the SAD in the
1985 elections, violence continued over the next few years. In 1987, the central government
chose the military option once again to clear the Golden Temple of Sikh militants. A successful
surgical strike under full public scrutiny, however, enhanced the government’s credibility on this
occasion (Wallace 1989). At the same time, Sikh militancy turned excessively violent in the late
1980s, which led to rapidly declining popularity for the Khalistan movement (Jodhka 2005; Van
Dyke 2009).
Through considerable military force and some carrots over the next few years, the Indian
government managed to regain its hold on the state. Punjab saw a return to peace and the
Khalistan movement virtually ended by the early 1990s (Kumar 2006; Kumar 2003; Singh
1998). As Jodhka (2005) points out, Sikhs had been well integrated into India before the period
of militancy and the call for an independent Sikh state of Khalistan had never been a major part
175
of the popular imagination of Sikhs in Punjab. He suggests that the appeal that Bhindranwale’s
religious revival and the SAD’s autonomy demands had in the 1980s were rapidly lost due to the
excessively violent character of the Sikh separatist movement.
3.2.4 The post-1991 scenario – alternation of power and interaction of cleavage
dimensions
With a return to peace, a clear bipolar configuration emerged in the early 1990s with the
SAD and Congress as the main parties. In addition, the BJP has proven to be a third party with
considerable clout among certain social groups. Reminiscent of ties that it had with the Jan
Sangh in the late 1960s, the SAD has allied with the BJP since 1997. High levels of anti-
incumbency prevailed in Punjab; the Congress won state assembly elections in 1992 and 2002
while the SAD-BJP combine came to power in 1997, 2007 and 2012. Despite coming to power
regularly since 1997, the SAD has been plagued by factionalism. It was also only in the mid-
1990s that the moderate wing of the party triumphed over the extremist wing (e.g., Kumar 2006;
Singh 1998).
With the end of separatism in Punjab, political articulation along religious lines also
began to subside. Jodhka (2005) suggests that the return to “normal politics” has meant that state,
caste, class and regional interests have come back to the forefront. Moreover, he suggests that
each of the two parties had to establish credibility with two different sets of audiences in the
1990s. The SAD had to prove that it was a mainstream political party, which believed in the
sanctity of the Indian constitution and democracy. The Congress, on the other hand, had to gain
ground with Sikh sections that held it responsible for Operation Bluestar.
176
This return to “normal” politics has meant that parties have once again been forced to
balance a variety of different pressures. This is particularly evident in the approaches of the two
main parties to political mobilization and coalition-building. Outflanked on one side by the
predominantly Sikh SAD and on the other, by the Hindu-nationalist BJP, the Congress since the
mid-1950s has sought to capture the middle ground and build a diverse social base that cuts
across religion, caste, class and region. This approach continues until today and the Congress in
Punjab is a catch-all party. Its base consists of a range of socio-economic profiles including
agricultural, industrial, upper caste and scheduled caste groups. The Congress is also marginally
less rural than the SAD. Most Punjab governments have, first and foremost, to cater to the state’s
powerful agricultural sector.
The SAD’s strategy has been somewhat distinct from the Congress. To a large extent, the
end of militancy meant that the moderate wing of the SAD gained the upper hand and the party
no longer had to accommodate extremist demands. However, as in the earlier periods, the SAD’s
ability to win electoral majorities on its own is circumscribed by its history and core base. As a
largely Sikh party, and even more specifically as one dominated by the agricultural Jat Sikhs,
electoral alliances are a necessity for the SAD (Kumar 2006). Moreover, the Congress has
managed to attract more votes among certain Sikh sections, such as Dalit Sikhs, than the SAD.
The SAD by itself typically receives around 30 to 35 per cent of the vote share in Punjab. Since
the mid-1990s, the SAD has worked to enlarge its predominantly Sikh vote base through a
formal coalition with the Hindu-nationalist BJP. The alliance won state assembly elections in
1997, 2007 and 2012.
The SAD-BJP alliance has succeeded electorally because of the complementary nature of
the core social bases of the SAD and the BJP – the former’s core support is predominantly
177
agricultural and Sikh while the latter’s mainly urban and Hindu. As in the case of the Congress,
the coalition backing SAD-BJP governments includes a diverse range of socio-economic profiles
as well as representation of business interests. Since the late 1990s, the BSP, whose main base
has been among scheduled castes in Uttar Pradesh, has attempted to mobilize the state’s large
Dalit population. However, the BSP been largely unsuccessful.
3.2.5 Tracing the mechanism – wide-right coalitions and competitive populism
Given the interaction between various cleavage dimensions, support from a broad range
of voters has been vital to electoral success in Punjab. Both Congress and SAD-BJP have relied
on support from voters with a diverse range of social profiles – rural and urban, Hindu and Sikh,
upper and lower caste. The wide-ranging support of both parties can be seen in table 3.5. Unlike
the Congress, the SAD does rely heavily on one group – the Jat Sikhs. But Jat Sikh support alone
is insufficient to ensure electoral majorities. The Congress does receive a sizeable share of
support from other Sikh castes. As a party formed to represent Sikh interests, the SAD faces a
problem in appealing to voters across the religious divide. It has solved this problem by allying
with the Hindu nationalists. The SAD relies on combining its predominantly rural and Sikh vote
base with the BJP’s urban Hindu base to come to power. The Congress, unlike the SAD, is
capable of constructing electoral majorities on its own due to its ability to appeal to a wide range
of voters.
I classify the electoral coalitions of both the Congress and SAD-BJP as wide-right for
two reasons. First, both sets of electoral coalitions include a range of voter profiles that span the
entire socio-economic spectrum. Both coalitions include rich and poor, rural and urban,
agricultural and business, and Hindu and Sikh voters. As such, this base of voters is not confined
178
in class terms as in the case of Gujarat. Second, both sets of coalitions include business interests
and incorporate key social groups such as Khatris and Aroras who have a strong entrepreneurial
presence. Business groups are not numerically sizeable as in Gujarat and are significantly weaker
than agricultural interests.
These wide-right coalitions, in turn, have crucially affected Punjab’s responses in the
competition for investment. In particular, the incorporation of groups with a diversity of socio-
economic profiles has pulled various Punjab governments in different directions. Both sets of
governments receive support from rural, urban, agricultural, business, Hindu and Sikh voters.
Importantly, the interests of these voters are often conflicting. This has meant that both Congress
and SAD-BJP governments have had to walk a fine line in balancing these varied interests. Both
sets of governments have responded to conflicting demands by pursuing a strategy of populism
(for e.g., Kumar 2006; Kumar 2003; Singh 1998). Punjab has a long tradition, dating back to the
Green Revolution in the 1960s, of placating groups through subsidies of various kinds such as
fertilizer concessions and free electricity. Such populism has taken a more intense form since the
1990s.
In many ways, competitive populism has been the dominant pattern of politics in Punjab
since the mid-1990s. The question of who receives free electricity is one such issue that has been
contested vigorously and provides insight into the type of politics prevailing in the state. “The
politics of populism introduced new competition among various sections of the population. It
was alleged that Mr. Badal’s [the chief minister of the SAD-BJP government] populism is pro-Jat
peasantry and it discriminates against other sections of society. For instance, the Bahujan Samaj
Morcha, an ally of the Akali Dal (Badal), asserted that the Punjab Chief Minister’s decision to
give free electricity to farmers created a wide gap between the farming community, those living
179
in urban areas and Dalits…In response to these assertions, the state government decided to give
free domestic power up to 30 units each per month to those Scheduled Caste consumers who had
a sanctioned load of not more than 300 watts. The effort of the state government to appease the
Scheduled Castes and Backward Castes did not succeed. The Badal government was accused of
betraying the weaker sections by fixing the 300 watt limit, whereas no limit was fixed in case of
farmers” (Kumar 2003: 386).
Such complex balancing through populism has detracted from investment promotion in
several ways. Populist schemes have meant that there is little money left for industrial
infrastructure. Punjab has the highest per capita consumption of electricity in the country and
free electricity to certain groups has automatically strained the state’s weak generation capacity.
Since agriculture represents a particularly powerful vote base, the solution of various
governments to the electricity problem has been to enforce several mandatory cuts every week
for industry.
One retired senior IAS officer explained the situation: “The most short-sighted decision of
the government has been to give free power and water. Since political leaders were from the
rural sector, they advocated a better deal for farmers. This should not be through free power
[electricity] and water but politicians did that and made the farmers dependent on
government…this has brought the state down. Instead of demanding that free power be
discontinued rurally, BJP is now arguing for free urban power. The government kitty is going to
be empty. The state is heavily indebted. Punjab is economically progressive but financially
backward…Irrespective of whether it is the Congress or the Akali Dal, government has failed

180
citizens. Despite being displaced every five years, public finances have been badly handled.”69
As with electricity, land is another major constraint in attracting new investment to the state.
Unlike, other states, the Punjab government has chosen not to get involved in land acquisition for
industrial purposes because of the fear of loss of agricultural support.
Populism and the financial strain it places have meant that the state is also unable to deliver
on concessions promised in industrial policy statements. As a result, it enjoys low credibility
among business. This was made amply clear in interviews with investors in the state. According
to an investor in the state: “The Punjab government’s interest in industrialization is zero. All the
government is interested in is working on its vote bank. The vote bank is agriculture... The main
interest of the government is in buying these votes.”70 These views were reiterated by many
others. One senior executive of a large-scale firm that had moved many of its operations out of
the state suggested: “With electoral benefits mainly from agriculture, the incentive [to give free
electricity] will be there. There is no revenue at the state level and it is difficult to be industry-
friendly with that… Politically, no party can neglect or not favor agriculture in Punjab.”71
Low credibility of the state with capital is compounded by the fact that agricultural income in
India is not taxed. In Punjab, this has meant that the industrial and trading section, which are
mostly urban, are disproportionately taxed but see very little benefit as most revenue ends up as
subsidies to rural groups. Industry in Punjab has considerably different demands from the rural
sections. It is opposed to subsidies and measures such as free electricity to farmers, which they
see as adversely affecting industrial infrastructure and delivery of public goods because of the
69 Interview, January 18, 2010; Chandigarh. 70 Interview, April 20, 2010; Ludhiana. 71 Interview, April 21, 2010; Ludhiana.

181
drain it places on the state’s finances. Further, Punjab has been forced to use local taxes such as
octroi and entry taxes on inputs, which are paid by industry, to raise revenue. These taxes have
been virtually abolished in most other states due to their adverse effect on industrial growth.
Unable to tax agriculture in any form because of its political clout, the state has chosen to impose
levies on industry instead.
3.2.6 Explaining the emergence of wide-right coalitions in Punjab
As the previous section argued, wide-right coalitions have placed conflicting pressures on
Punjab governments and governments have chosen to use populism to manage the varied
interests of groups in their electoral coalitions. Why did these wide-right coalitions emerge over
the last two decades in Punjab in the first place? In this section, I suggest that Punjab’s cross-
cutting cleavage structure has affected party strategies of coalition-building significantly. In
addition, voter attachments tend to be more dispersed. In contrast, the link between vote choice
and social identity is weaker. Both party strategies and voter attachments are detailed below.
3.2.6.1 Identity politics, cleavage structures and party strategies
Punjab’s cleavage structure has involved the interaction of multiple dimensions. Religion,
caste and class have all had cross-cutting effects and have interacted to create a complex social
structure characterized by small group size. Among the main cleavages in the state, religion has,
at times, been particularly significant. Punjab is India’s only Sikh majority state. However, caste,
class, rural –urban divisions and region have divided Sikhs and Hindus internally. Such
segmentation has found political expression.
Relative to Punjab’s other groups, Jat Sikhs constitute a sizeable group. The SAD’s
leadership has been predominantly from this group and Jat Sikhs also constitute the core of the

182
party’s vote base. However, the support of Jat Sikhs alone cannot ensure electoral majorities. In
addition, the SAD has not been able to mobilize the Sikhs as a single group due to internal caste
and other differences. For example, Dalit Sikhs, who are largely landless agricultural laborers, do
not identify with the landowning Jat Sikhs. As a result, they vote largely for the Congress rather
than the SAD.
In addition to this general cross-cutting effect of social cleavages, certain social groups with
ties to entrepreneurship exist in Punjab, particularly merchant and trading castes such as the
Banias and Khatris with historical access to financial capital and networks. These groups have
been part of electoral coalitions of both Congress and SAD-BJP. However, as with other social
groups, these entrepreneurial groups are small in size. Unlike dominant caste states, the lack of
numerical strength does not allow entrepreneurial groups to command electoral leverage. This is
dissimilar to the case of the Patidars in Gujarat and the Kammas in Andhra Pradesh. As such,
there is no overlap between group size and entrepreneurial identity as was the case in Gujarat.
The cross-cutting nature of Punjab’s cleavages has structured the types of strategies available
to political parties. In particular, the cleavage structure in Punjab is such that parties cannot
depend on a few social groups disproportionately to win electoral majorities. Wallace points out
that accommodation of multiple identity and issue dimensions remains essential to political
success in Punjab as “no one group is sufficiently large, no issue is so encompassing, no sub-
region so significant to provide the necessary support base” (1989: 464). Thus, parties have to
depend on a range of social groups and wide coalitions have been an electoral necessity in
Punjab.
183
The two main parties have, however, arrived at wide-right coalitions through different routes.
The Congress, since Pratap Singh Kairon’s time in the 1950s, recognized that it was likely to be
outflanked by the largely rural and Sikh SAD as well as Hindu-nationalist parties such as the Jan
Sangh and the BJP. As a result, the Congress has appealed to a cross-religious, cross-regional,
cross-caste and cross-class base. It has essentially been a catch-all party in Punjab.
Inasmuch as parties can rely disproportionately on one social group, the SAD depends on the
Jat Sikhs as part of its core base. Knowing, however, that Jat Sikhs are not large enough to
ensure an electoral majority and recognizing that its ability to expand its base is limited, the SAD
has instead relied on electoral alliances with the BJP since 1997. The complementary nature of
the SAD’s and BJP’s core support – the largely rural Sikh base of the former and the urban
Hindu base of the latter – has proved electorally effective; resulting in victories for the SAD-BJP
coalition in 1997, 2007 and 2012. In addition, the alliance with the BJP was also symbolic and
added to the SAD’s legitimacy in the 1990s. In the aftermath of Sikh militancy, the SAD was
keen to throw of its “anti-national” tag (Jodhka 2005).
Unlike the Congress, one aspect of the SAD’s political strategy should be noted. Over the
last two decades, the SAD has consistently relied on coalition politics and formed alliances with
the BJP. However, the timing of this strategy requires additional explanation. Prior to the last
two decades, the SAD’s political strategy was not stable and fluctuated between Sikh-specific
demands and adopting a more secular approach. As the main vehicle of Sikh political
representation, it emphasized demands specific to the Sikhs before the reconfiguration of
Punjab’s boundaries in 1966.
184
The reconfiguration of boundaries in 1966, however, led to a strategic dilemma for the SAD;
one which was not resolved until the end of militancy in the 1990s. Given its history, the SAD’s
raison d'être was to represent Sikh interests. Sikhs formed 60 per cent of Punjab’s population
after 1966 but political support of the community was split between the Congress and SAD. The
SAD, thus, could not win elections after 1966 by relying on a platform that exclusively
emphasized Sikh interests.
Subsequently, the SAD struggled in establishing a clear strategy. It first experimented with
coalition politics in the late 1960s, forming alliances with the BJP’s predecessor, the Jan Sangh.
However, ideological divisions within the party and the need to accommodate more extremist
elements within the party, who favored a Sikh nationalist plank, made it difficult for the party to
consistently adopt the coalition strategy. With the rise of Sikh militancy in the 1980s and the
strength of the extremist wing, the coalition strategy was jettisoned. The end of Sikh militancy in
the early 1990s would see the SAD return to a strategy of electoral alliances with the BJP. Since
1997, it has consistently allied with the BJP in both national and state elections.
3.2.6.2 The nature of voter attachments in Punjab
The cross-cutting influence of various cleavage dimensions in Punjab has required parties to
build electoral coalitions that include a wide range of social groups. In the case of Gujarat, we
saw that social identity had a strong influence in determining voter attachments of certain social
groups to particular political parties. In particular, certain social groups voted en masse for either
the BJP or the Congress in Gujarat. While identity is a factor in electoral politics in Punjab, its
influence is not as strong. Voter support within social groups is split more evenly between the
185
Congress and SAD-BJP. Table 3.5 shows that the Congress and the SAD-BJP alliance received
support from a range of social groups in the 2009 Lok Sabha elections.
Closer analysis of survey data from the 2002 Punjab Assembly elections also points to this.
While certain social groups show strong inclinations over time towards particular parties, the link
between identity and vote choice tends to be weaker in Punjab than in Gujarat. In a similar
approach to the Gujarat case, a multinomial logit regression of vote choice as the dependent
variable and social group, locality, gender, age and class (education level is used as proxy for
class) as explanatory variables was run. Vote choice for the Congress was used as the reference
category. In the case of Punjab, the variable social group was constructed using caste and
religion of the respondent. It consists of 10 categories – Adivasi, Dalit Sikh, Dalit Hindu, OBC
Sikh, OBC Hindu, Jat Sikh, Jat Hindu, Upper caste Sikh, Upper caste Hindu and Others.
The regression results in table 3.6 suggest that social identity is not a significant predictor of
vote choice for the SAD-BJP coalition compared to the Congress controlling for age, gender,
locality and class (measured by education level). Social group is a significant predictor of vote
choice of other parties when compared with the Congress. Punjab, however, is a bipolar state and
parties other the Congress, SAD and BJP are more marginal players. The lack of a durable link
between voter attachments and social identity reinforces the need for parties to construct wide
coalitions.
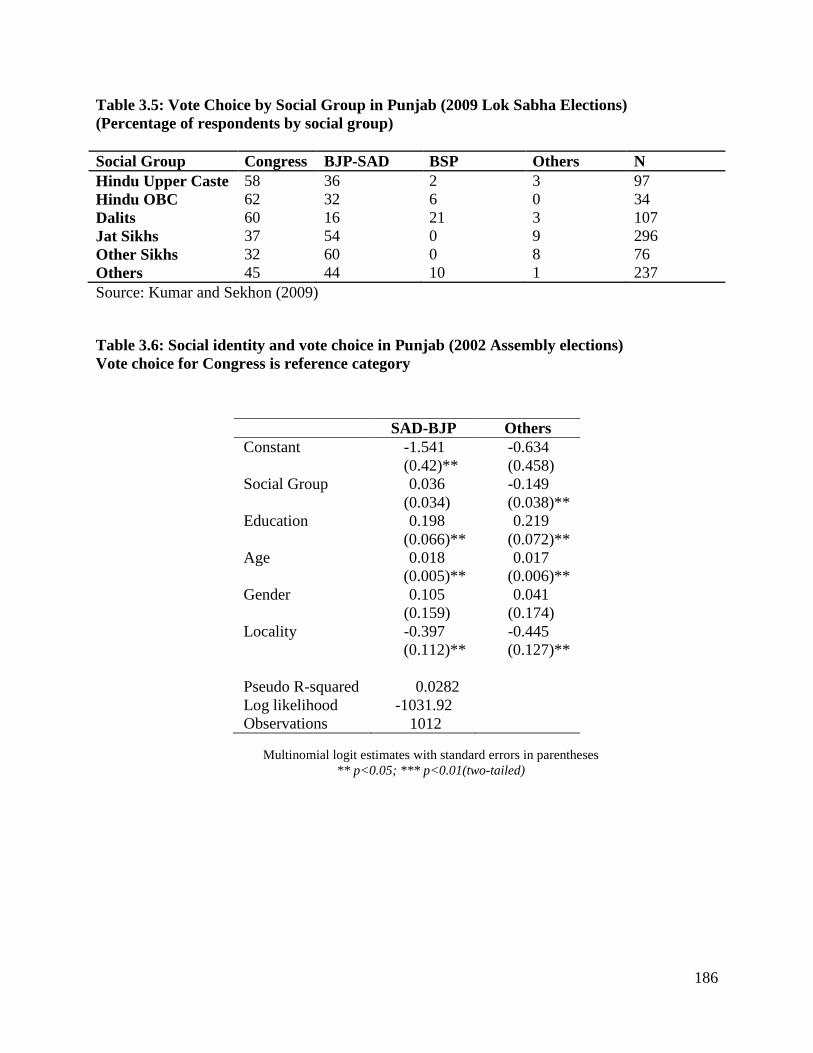
186
Table 3.5: Vote Choice by Social Group in Punjab (2009 Lok Sabha Elections) (Percentage of respondents by social group) Social Group Congress BJP-SAD BSP Others N Hindu Upper Caste 58 36 2 3 97 Hindu OBC 62 32 6 0 34 Dalits 60 16 21 3 107 Jat Sikhs 37 54 0 9 296 Other Sikhs 32 60 0 8 76 Others 45 44 10 1 237 Source: Kumar and Sekhon (2009)
Table 3.6: Social identity and vote choice in Punjab (2002 Assembly elections) Vote choice for Congress is reference category
Multinomial logit estimates with standard errors in parentheses ** p<0.05; *** p<0.01(two-tailed)
SAD-BJP Others Constant -1.541 -0.634 (0.42)** (0.458) Social Group 0.036 -0.149 (0.034) (0.038)** Education 0.198 0.219 (0.066)** (0.072)** Age 0.018 0.017 (0.005)** (0.006)** Gender 0.105 0.041 (0.159) (0.174) Locality -0.397 -0.445 (0.112)** (0.127)** Pseudo R-squared 0.0282 Log likelihood -1031.92 Observations 1012

187
3.3 Conclusion
In this chapter, I argued that the different policy outcomes in Gujarat and Punjab can be
traced to the nature of their electoral coalitions over the last two decades. Since 1991, Gujarat
governments have been consistently backed by narrow-right coalitions. The economically-
advanced profile and strong business connections of the core groups in these narrow-right
coalitions have allowed various governments in Gujarat to formulate and implement an investor-
friendly policy agenda. Redistributive pressures have also been more muted than in many other
states and the government has been able to implement a consistent and coherent pro-business
strategy.
In contrast, wide-right coalitions in Punjab consisting of core groups with diverse economic
profiles have backed successive governments since the mid-1990s. The diverse interests of these
varied groups have meant that governments have had to balance demands that are often
conflicting. The solution of various Punjab governments has been to resort to competitive
populism, which has placed major pressures on the state’s finances. Poor fiscal health has acted
as a major constraint on the ability of Punjab to create an industry-friendly climate in the state.
I also emphasized the role of identity politics in explaining why narrow-right coalitions
emerged in Gujarat and wide-right ones in Punjab. Dominant caste patterns in Gujarat, which
involve an overlap between group size and entrepreneurial identity, have structured party
strategies and allowed the emergence of narrow-right coalitions. Unlike Gujarat, the nature of
Punjab’s cleavage structure has not favored the confluence of political and economic power.
Various cleavage dimensions have interacted to create a cross-cutting effect in Punjab. As a
result, no single dimension of identity has structured party strategies or dominated politics for
188
long periods. Policy outcomes have remained consistent since 1991 in these two states since the
type of electoral coalitions that have backed governments has remained constant.
In the next chapter, I offer evidence from two states – Andhra Pradesh and Bihar – where
policies exhibit temporal variation over the last two decades. I argue that such variation can be
explained by the changing nature of electoral coalitions within these states over time.
189
4. Chapter 4: Fluctuating coalitions and commitments – Andhra Pradesh and Bihar
“When I became chief minister and set out to revive the state’s economy, I ran quite quickly into two major hurdles. The first was that the national economy was heading for a recession. Nobody was investing. The second was that even if they were, Andhra Pradesh was simply not a state they would have thought of investing in. As I have said before, in the year 1995 our ranking in terms of investor perception was 22…the only course at that point was to go out and market the state. This is what I set out to do. By going to every investor’s forum, domestic and foreign, and making Power Point presentations on what Andhra Pradesh had to offer. By being open to the media. By inviting ambassadors to visit Hyderabad. Everywhere I emphasized our commitment to transforming the infrastructure in the state….By 1998, with the changes in the investment climate that had taken place in the state, we had climbed to third position in terms of investor perceptions”
– Chandrababu Naidu, Former Chief Minister of AP (Naidu 2000: 134-135)
“Bihar, the third most populous state in the country with 83m people, has become a byword for the worst of India: of widespread and inescapable poverty; of corrupt politicians indistinguishable from the mafia dons they patronize; of a caste-ridden social order that has retained the worst feudal cruelties; of terrorist attacks by groups of ‘Naxalite’ Maoists; of chronic misrule that has allowed infrastructure to crumble, the education and health systems to collapse, and law and order to evaporate.”
– The Economist (2004: 18)
“India’s most notorious state [Bihar] is failing to live up to its reputation…for rarely has a failed state escaped political bankruptcy so fast.”
– The Economist (2010: 12)
The previous chapter traced the divergent performances of two of India’s richer states –
Gujarat and Punjab – in the competition for investment since 1991. In this chapter, I focus on
two states – Andhra Pradesh (AP) and Bihar – that have exhibited variation in their policy
commitments to investment promotion over time. As a middling performer in terms of
industrialization as well as human development in the pre-1991 period, AP’s performance is
surprising. Overall, it has been one of the more successful performers in the competition for
investment since 1991. But its policies have been considerably more investor-friendly in some
periods than others. In particular, its staunch neoliberal commitment between 1994 and 2004
190
was accompanied by investor-friendly policies. Though its policy framework has not been
altered dramatically, its pro-business commitment has waned since 2004.
On the other hand, Bihar was mired in caste and class conflicts since the 1970s. For most of
the post-liberalization period, the state abrogated its development responsibilities and Bihar’s
failure in the competition for investment followed this broader trend. However, a change in
government in 2005 resulted in a marked shift in the state’s developmental focus and Bihar has
been considerably more proactive in attempting to attract investment to its jurisdiction. While it
remains unclear whether this recent transformation can reverse decades of economic decline, the
policy shift itself is a major change in light of the state’s own history.
This chapter will argue that the temporal shifts in the investment promotion policies of AP
and Bihar can be linked to the different types of electoral coalitions that have emerged in these
states over time. In the case of AP, I argue that the state’s waning pro-business policy focus can
be explained by a shift from narrow-right to wide-right coalitions. Backed by a narrow-right
coalition, based primarily on the support of the entrepreneurial Kammas, the Telugu Desam
(TDP) government under chief minister Chandrababu Naidu put in place a strongly neoliberal
framework between 1994 and 2004. In that period, AP was one of the most proactive states in
terms of investment policies, attracting considerable attention from international financial
institutions and the press for its policy outlook. This focus on business-friendly initiatives was
accompanied by a clear neglect of AP’s large rural sector, a trade-off that would cost the TDP at
the polls.
The Congress, backed by a wide-right coalition consisting of core groups at opposite ends of
the socioeconomic spectrum, most notably the Reddys and Dalits, replaced the TDP in 2004 and
191
has been in power since. Though the Congress has not disturbed the general framework for
investment promotion, the strength of AP’s pro-business commitments has weakened. Having
come to power on the back of rural discontent, the Congress shifted the development focus to the
rural sector and several populist schemes were put in place. Along with the shift in development
priorities, the upsurge in the Telangana movement, a major leadership crisis, and internal
dissension in the Congress have led to high levels of political instability in recent times and have
put a brake on the state’s ability to attract investment.72
In contrast to the other cases in this dissertation, Bihar entered the post-1991 environment
with few economic advantages to speak of. It was India’s second poorest state and had exhibited
a rapid economic decline accompanied by major governance failures since the 1970s. These
trends accelerated in the 1990s. For almost 15 years after economic liberalization, Bihar was
characterized by a breakdown in law and order. Not surprisingly, the state completely neglected
its developmental responsibilities. The era was, however, politically significant in that it marked
the culmination of the rise of the other backward castes and the end of upper caste domination in
a state characterized by a long history of oppression. Bihar’s lower caste upsurge was led by the
charismatic and controversial Lalu Yadav, who essentially controlled the reins of the state for
fifteen years. Rashtriya Janata Dal (RJD) governments focused solely on the politics of dignity
with few substantive development measures undertaken. A change in government in 2005 led to
a major shift in Bihar’s policy framework. Under the JD(U)-BJP coalition led by Nitish Kumar,
Bihar has demonstrated an increased commitment to investment promotion and economic
development, more generally.
72 Telangana is an area within Andhra Pradesh, which was formerly part of the princely state of Hyderabad. Telangana was merged with Andhra state in 1956 to create the current boundaries of Andhra Pradesh. A long-standing movement for the creation of a separate Telangana state from the existing boundaries of AP has existed since the 1960s but gained considerable momentum in 2009.

192
This chapter will argue that the outcomes prior to 2005 and the shift in the Bihar’s policy
focus after can be explained by the fact that the underlying electoral coalition changed from a
narrow-left to wide-left one. Narrow-left coalitions are primarily characterized by the presence
of largely poor groups with little representation of business interests. These coalitions are likely
to focus primarily on redistributive initiatives rather than growth-related measures.
In the case of Bihar, politics between 1990 and 2005 took on a modified form in that
substantive redistributive efforts were absent. Instead, a politics of dignity emerged in the 1990s
where the focus was overwhelmingly on symbolic aspects rather than substantive measures. In
fact, as the chapter will outline in more detail, Yadav’s modus operandi weakened the state
considerably. His sole focus was on undoing upper caste control and he viewed state institutions
and the very process of development itself as a vehicle for upper caste power. As a result, he
actively weakened the state framework in Bihar and put a brake on economic development.
Despite this, Lalu Yadav’s rhetoric of social justice as well as his personal charisma ensured
victories at the polls.
In contrast, JD(U)-BJP governments headed by Nitish Kumar since 2005 have been backed
by wide-left coalitions. The change in government has been accompanied by a decisive change
in policy focus; economic development and governance have occupied center stage in the state’s
plans. I suggest that Bihar’s marked shift in its policy framework after 2005 can be explained by
the fact that wide-left coalitions support a more diverse set of economic goals than the narrow-
left coalitions that preceded them. The broader range of economic interests represented in wide-
left coalitions are likely to lead to a more mixed set of policy outcomes. Specifically, wide-left
coalitions are likely to be more relatively more inclined towards business-friendly policies than
narrow-left coalitions.
193
Having linked policy outcomes to the nature of coalitions, this chapter, as in the previous
ones, also traces the influence on caste politics to the type of coalitions that emerged. The
dominant caste structure in AP and the Hindi-heartland pattern in Bihar have conditioned party
strategies of mobilization and coalition construction. As in Gujarat, the overlap between
numerical strength and entrepreneurial interests of dominant castes in AP has allowed narrow-
right coalitions to arise at certain points in time. Certain aspects of AP’s social demography and
politics, however, make narrow-right coalitions less stable than those in Gujarat. As a result,
wide-right coalitions have been a feature more recently. Social identity also acts a crucial factor
in vote choice. In particular, certain dominant castes in AP are tied very closely to one of the two
main parties – the Congress and the TDP.
Bihar has seen both narrow-left and wide-left coalitions in the post-liberalization period. The
state’s pattern of social cleavages, which I term as the Hindi-heartland pattern, comprises of
certain sizeable castes but these large castes tend to be the economically-marginalized. The
numerical strength of the upper castes under Hindi-heartland patterns are also relatively greater
than in most other parts of India, allowing these groups to control the levers of power longer than
elsewhere (Jaffrelot 2009a). However, it is the large base of socially-marginalized groups that
stands out as a decisive factor in political patterns in the Hindi-heartland. The entrepreneurial
base of the state itself is very small for a variety of historical reasons. As such, the Hindi-
heartland pattern is at the opposite end of the spectrum from dominant caste patterns; large social
groups exist but they tend to be socially and economically-weak. The size of groups has
influenced party strategies in Bihar over time. Since the 1990s, the state has seen high levels of
party fragmentation. Three and four-cornered contests have been the norm. High party
fragmentation itself has been supported by the fact that parties can rely on specific vote banks;

194
there is a high degree of similarity in the vote choice of individual members of several social
groups. The rest of the chapter lays out the cases of AP and Bihar in turn.
4.1 Andhra Pradesh – shifting coalitions and variable success
4.1.1 Background: AP’s economic structure and its unexpected performance after 1991
The largest south Indian state, both in terms of population and area, Andhra Pradesh has been
among the more proactive states in the competition for investment after 1991. The state’s
policies have, however, not been as business-friendly as Gujarat’s. AP’s pro-business policy
commitments have fluctuated over time. Nevertheless, AP’s rise in the first fifteen years after
liberalization is surprising. In 1991, AP did not possess a tradition of a business-friendly state
apparatus. Nor was it was not as well-endowed in terms of industrial infrastructure as more
developed counterparts such as Gujarat or Maharashtra. For most of the pre-1991 period, AP also
remained firmly in the middle of the pack in terms of income, human development and levels of
industrialization.
The state’s per capita income at the start of the reforms process in 1991 (Rs.2134 in 1980-81
prices) was lower than both Gujarat’s (Rs. 2381) and Punjab’s (Rs. 3825) but considerably
higher than Bihar’s (Rs. 1105).73 AP also had a higher poverty headcount (44.6 per cent in 1993-
94) than both Punjab (22.4 per cent) and Gujarat (37.8 per cent) but well-below that of Bihar
(60.5 per cent).74 AP’s literacy rate (44.08 per cent) similarly lagged behind those of Punjab
(61.3 per cent) and Gujarat (58.5 per cent), but remained ahead of Bihar’s (37.5 per cent) in
1991.
73 Data from the Central Statistics Office, Ministry of Statistics and Program Implementation, Government of India (mospi.nic.in). 74 Data from the Planning Commission of India (planningcommission.nic.in).
195
In addition to its economic endowment, trends in AP politics in the 1980s did not offer much
hope for the creation of a business-friendly environment after liberalization; a strident
subnational rhetoric was complemented by cycles of competitive populism. Despite the fact that
initial conditions in 1991 might not have predicted success in the competition for investment, AP
has been one of the more proactive states. It ranks fifth among all states in terms of investment
attracted between 1991-92 and 2009-10 (9.1 per cent of total investment in the country in this
period).75
Like many other Indian states, AP’s economic structure has, however, been characterized by
considerable dualism in the post-liberalization period. Driven by growth in the service sector, AP
was successful in reinventing itself as a pro-business state in the mid-1990s. AP’s capital
Hyderabad is one of the main hubs of the informational technology (IT) sector in India. While
the high-tech sector in AP has received attention, the state’s pro-business policies in the mid-
1990s and early 2000s were accompanied by considerable neglect of the rural sector. A
significant portion of AP’s population lives in rural areas (almost 73 per cent) and employed in
the agricultural sector (62.1 per cent of total workers in the state are either agricultural laborers
or cultivators). 76
Despite the employment patterns, agriculture accounts for only 22 per cent of AP’s gross
state domestic product while industry and services make up 25 per cent and 53 per cent
respectively. From the mid-1990s, AP witnessed an agrarian crisis characterized by farmers’
suicides, declining crop prices, marked slowdown in agricultural growth, and a widening gap
between agricultural and non-agricultural sectors; a crisis that has also characterized several parts
75 Data from SIA Statistics (January 2011), Department of Industrial Policy and Promotion, Ministry of Commerce and Industry (dipp.nic.in). 76 Data from the Census of India (2001).
196
of rural India. A bleak indicator of this crisis is the phenomenon of farmer suicides and AP has
been one of the five states in the country with high rates of farmer suicides (Vaidyanathan 2006).
This sharp dualism has meant that the benefits of post-reforms growth have not widely
dispersed. In turn, this has had political repercussions and these repercussions have taken
different forms. Rural discontent led to the defeat of the TDP at the polls in 2004 after a 10 year
spell in power. AP has also witnessed periodic Maoist violence in rural areas but the problem has
largely been under control since the late 1990s. Subnationalism has been a running theme in
AP’s politics for the last six decades. Demands for the creation of a separate Telugu-speaking
province from the erstwhile Madras state led to the formation of the state of Andhra in 1953.
Subsequently, nine Telangana districts, the Telugu-speaking areas of the erstwhile princely state
of Hyderabad, were merged with Andhra in 1956, giving shape to the present boundaries of AP.
Though it was created through a demand for a Telugu-speaking state, AP has been witness to
periodic demands over the last six decades for a separate state of Telangana. The agitation gained
considerable momentum in 2009 and, since then, the state has witnessed frequent riots and
considerable polarization on the issue.
This section will attempt to analyze AP’s performance in the post-1991 era in light of three
broader issues. First, it will examine the state’s role in transforming AP from a middling
performer to one of the more attractive investment destinations in the country in the post-1991
period. Second, it will link AP’s fluctuating pro-business commitments over to the changing
nature of electoral coalitions that have supported governments in the state over the last two
decades. Finally, the section will discuss the impact of the state’s economic dualism, which
places limits on the extent to which AP can prioritize pro-business policies. This dualism has
197
resulted in uneven distribution of growth benefits, sharply highlighting the trade-offs between
investor-friendly policies and other goals.
4.1.2 AP’s social structure and entrepreneurial history
Like Gujarat, AP conforms to dominant caste patterns. As Elliott (1970) suggests, two
castes in the state, the Reddys and Kammas, are excellent examples of Srinivas’ classification of
dominant castes in that these groups are numerically sizeable and have historically enjoyed high
levels of economic and political power. As detailed in the next section, competition between the
Kammas and Reddys has been a constant and overarching theme in AP’s political history. The
Reddys form approximately 8 to 10 per cent of AP’s population while the Kammas constitute 4.8
per cent (Reddy 1989; Suri 2002).77 Though they are not as large as the Reddys, the Kammas are
heavily concentrated in AP’s coastal belt and this geographical clustering has given them
disproportionate political clout under the first-past-the-post system. Reddys, on the other hand,
are spread throughout the state (Reddy 1976). Since independence, Reddys have enjoyed
considerable political power, dominating the leadership of the Congress as well as forming the
core of its support base in the state. As explained later in this section, the Kammas and, to a
lesser extent, the Reddys also constitute the two main entrepreneurial groups in the state.
Among the twice-born castes, Brahmins constitute about 3 per cent of the state’s
population and have largely been marginal players in AP’s political scene since independence.
Like other states in south India, Brahminical hegemony was displaced early in AP. Even prior to
independence, growing economic power saw the Reddys and Kammas challenge Brahminical
hegemony in the erstwhile Madras Presidency. After independence, the apex of power has been
77 An exact figure for the share of Reddys in AP’s population is not available. The 1931 Census counted Reddys and Kapus under a single category.
198
controlled by the two dominant castes, particularly the Reddys. Other twice-born castes include
the Kapus, Komatis, Rajus and Velamas and these groups have a notable presence in industry
(Reddy 1989; Suri 2002). Apart from the Kapus, who are approximately 5 per cent of the
population, these groups are, however, are very small in size.
Other backward castes (OBCs) and Dalits comprise a sizeable proportion of AP’s
population but have never controlled the apex of power in the state. The OBCs constitute 44 to
46 per cent of the state’s population but are divided into as many as fifty sub-castes. Their
internal heterogeneity has meant that they have rarely been mobilized politically as a single
entity (e.g., Kohli 1988; Reddy 1989). This group is also extremely diverse in economic terms;
some sub-castes such as Yadavas and Gowdas have relatively high education levels and enjoy a
degree of economic power while others are considerably marginal (Suri 2002). Though they have
never controlled the helm of power in AP, the mobilization of the OBCs has been a key sub-text
in political changes in AP since the 1980s.
In addition to the OBCs, AP has a sizeable Dalit and Adivasi population (16.2 per cent
and 6.6 per cent). 78 Like the OBCs, the Dalits too are internally fragmented. Two main sub-
castes, the Malas and Madigas, account for almost 90 per cent of the Dalit population in the state
and rivalry between these groups over time has resulted in fragmentation and competition.
Muslims have a sizeable presence in AP, constituting a little more than 9 per cent of the state’s
population.79
The presence of dominant castes in AP offers several parallels with the Gujarat case.
Apart from the presence of castes that enjoy numerical weight, there are some broad similarities
78 Data from the 2001 census (available at censusindia.gov.in). 79 Data from the 2001 census (available at indiastat.com).
199
in the entrepreneurial history of both states. Like the Patidars in Gujarat, the economic and
political power of the Reddys and Kammas arose due to their historical control of land
(e.g.,Elliott 1970; Harrison 1960; Kohli 1990). As major landholders, Reddys and Kammas
enjoyed control of village political life; they employed farm servants, had ready capital to loan
and possessed resources to represent cases to the administration (Elliott 1970). The political
leverage of these local landholders was significantly enhanced in the colonial period with the
introduction of revenue collection powers, improvements in irrigation and the development of
markets (Frankel 1989b).
In the case of Madras Presidency, under which most areas of AP fell, British investments
in irrigation in the mid-1800s led to a marked economic transformation of the region. Most
notably, the construction of anicuts [type of dam used to divert water] on the Krishna and
Godavari rivers dramatically increased agricultural productivity between the 1850s and 1870s
(Damodaran 2008). This, in turn, translated into a major rise in the standards of living for the
main landholding groups in the region.
In particular, the Kammas, who owned most of the land in the fertile delta region and
took to growing high-value cash crops in large numbers, were the biggest beneficiaries of these
improvements in irrigation. 80 Damodaran suggests: “ Cotton’s anicuts had, simply put, produced
an agrarian revolution embracing a large section of coastal Andhra’s Kamma middle peasantry”
(2008: 95).81 The effects of the irrigation projects would be felt well into the 20th century.
80 Harrison (1960) suggests that Kammas owned 80 per cent of land in the delta region at the time. 81 The reference is to Arthur Cotton, a captain in the Madras Engineers Corps, who was instrumental in the irrigation projects undertaken on the Godavari and Krishna rivers between 1847 and 1855. It was Cotton’s recommendation that led to anicuts on these rivers and these projects would dramatically transform agricultural productivity in Andhra’s delta regions. Cotton’s status in AP is legendary; busts of the engineer exist in numerous delta villages in AP. A Cotton museum was opened in 1988 and Cotton finds a place among the statues of AP’s historical luminaries along the Hussain Sagar lake in the state’s capital, Hyderabad (Damodaran 2008).
200
Harrison (1960) suggests that World War II and the immediate postwar years proved to be an
even bigger boom period as high prices for food and cash crops added greatly to the wealth of
the landowning groups.
The agrarian transformation in the latter half of the 19th century had two long-term
consequences of note. First, an agrarian middle class emerged among the landowning Kammas
and Reddys by the turn of the 20th century. With their increasing wealth, Kammas and Reddys
subsequently began investing in education and, by the end of the 19th century, the Brahmin
monopoly on education and government jobs in Madras Presidency was challenged (Frankel
1989b).
A second consequence is even more significant in the context of this dissertation.
Growing agricultural surpluses allowed the Kammas, and to a lesser extent the Reddys, to enter
industry. The shift of agricultural surpluses to industry would occur in two waves. By the early
twentieth century, a section of Kamma agriculturalists in AP’s delta region were looking for new
avenues to invest surpluses acquired through the production of high-value cash crops such as
rice, tobacco, cotton and oilseeds. An immediate impetus to enter industry was provided by
falling commodity prices that occurred as a result of the Great Depression (Damodaran 2008).
Large Kamma landholders, who formed the first wave of entrepreneurs, came to invest in
industry at the time of the Great Depression; primarily in agro-processing industries but also in
construction, transport, and textiles. In addition, investments would occur in the film industry, a
sector for which Kamma capital has had special affinity since the 1940s.
A second major wave of Kamma industrial entrepreneurship would occur almost five
decades later in the 1980s, catalyzed by the rise of the TDP. The effects of the Green Revolution
201
in the 1970s would once again lead to economic improvements for the Kammas. In the 1980s,
the presence of agricultural surpluses coupled with the TDP’s ascent to power would provide an
avenue for further Kamma investments in industry (Damodaran 2008; Kohli 1990).
As explained later in the chapter, the TDP itself was formed largely as an outgrowth of
Kamma dissatisfaction with the Congress and as the group’s means of translating economic
leverage into political power. Subsequently, the TDP’s stint in power in the 1980s would see a
marked rise in the entry of new Kamma entrepreneurs into industry. In particular, the TDP
undertook numerous large-scale public sector infrastructure projects in the early 1980s and this
provided considerable opportunities in the construction sector. AP companies account for a large
share of India’s infrastructure and construction sector today and many of the prominent players
had their start through public sector projects in the early 1980s. Apart from construction, another
major area of investment since the 1980s has been the pharmaceutical industry; a sector in which
AP is also responsible for a large share of the national production.
AP’s social structure and history of industrial entrepreneurship suggests parallels with the
Gujarat case. Both states have dominant caste patterns, characterized by the presence of large,
entrepreneurial groups. The Kammas occupy a relatively similar position to the Patidars. Though
they form a smaller proportion of AP’s population than the Patidars do in Gujarat, the Kammas
embody a similar combination of numerical and economic strength. As the next section will
show, this overlap has enabled the emergence of narrow-right coalitions in AP in certain periods.
However, there are some key differences between the two groups. Most notably, the Kammas are
not large enough to control the electoral space and this leads to greater instability of narrow-right
coalitions in AP. As a result, the type of coalition backing AP governments has shifted over time.
202
The details of this shift are discussed in the rest of the section. For now, the key point to
take away is that AP’s social structure offers the enabling conditions for narrow-right coalitions
to emerge. The next two sections offer a brief background to the history of electoral competition
in AP and trace the nature of electoral coalitions backing governments in the state over time.
4.1.3 A brief overview of AP’s political history
Three distinct periods characterize AP’s electoral history since the formation of the state.
Congress domination and factional politics characterized the electoral scene until the 1970s.
Though Congress’ control of the electoral space continued through the 1970s, a variety of
socioeconomic changes set the stage for two-party competition, which would emerge in the
1980s in the form of the TDP. Two-party competition and shifting policy alignments have
characterized the last two decades. Each of these phases has contributed to the nature of electoral
coalitions that have emerged in the post-economic reforms period. I discuss each period below.
4.1.3.1 Politics in the 1950s and 1960s
For some scholars, one of Nehru’s most successful political achievements was the
linguistic reorganization of Indian states (e.g., Brass 1990). Andhra Pradesh’s link to linguistic
reorganization is particularly significant. It was the demand for the creation of a separate Telugu-
speaking province of Andhra from the erstwhile Madras state that catalyzed the process of
linguistic reorganization in the first place. Andhra state was formed in 1953. The current
boundaries of Andhra Pradesh came into existence three years later when nine districts of
Telangana were merged with Andhra state.
Since its inception, the stereotypical view of AP politics has been that it is essentially a
conflict between two dominant castes – the Kammas and the Reddys. While this is too simplistic,
203
there is a grain of truth in the characterization. Though other social groups matter, as the rest of
this section will outline, these two dominant castes have largely controlled the trajectory of AP
politics since the 1950s. Their social rivalry has spilled into the political arena throughout AP’s
history and has found expression through support for rival political parties in the state.
Along with the Kamma-Reddy rivalry, three other broad trends characterized AP politics
from the 1950s to the mid-1960s. First, the Congress dominated the electoral space but was
wracked by factional rivalry. One-party Congress dominance and factional rivalries were trends
that characterized politics in many Indian states until the mid-1960s. However, the shift from a
dominant party system to two-party competition occurred much later in AP than most other
Indian states; the Congress lost power in the state for the first time only in 1983. Factional
politics within the AP Congress led to considerable internal competition as rival groups jockeyed
for power and resources that arose from control of the party.
The effects of factional politics in AP were pronounced. For example, Reddy (1976)
points out that two rival groups within the Congress both fielded candidates in the 1967
elections; each group fielded their own supporters as independents to defeat official candidates
belonging to the other group. Reddy suggests that through the 1960s and 1970s, the Congress
oscillated between accommodative and confrontational politics that reflected factional struggles.
Interestingly, factional rivalry, however, did not destabilize the Congress in AP. Through the
intervention of the central leadership in Delhi and the party’s control of resources, different
groups were kept within the Congress fold (Reddy 1989; Suri 2002).
A second overall trend in AP politics until the 1980s is related to Congress hegemony
described above. Until the 1980s, AP electoral politics was characterized by the general absence
204
of a coherent opposition party that could challenge the Congress. One caveat should be added to
this claim. During the 1950s and early 1960s, the Communist Party of India (CPI) posed a
notable challenge to the Congress. The Communists were particularly strong prior in the mid-
1950s in the Telangana area. Telangana was one of the few areas in south India where the
landlord-based zamindari system was in place during the colonial period. In turn, the zamindari
system bequeathed a feudal agrarian structure that attracted Communist political activity.
But even more than the feudal structure, it was interestingly the support of the powerful
Kammas that accounted in large measure for the success of the Communists (Harrison 1960).
From the time of the state’s formation, the leadership of the Congress was dominated by the
Reddys while the economically-powerful Kammas were largely excluded from the top echelons
of the party. In the 1950s and early 1960s, Kamma disenchantment was expressed as support for
the Communist Party. This alliance would end a decade later. By the mid-1960s, the Communist
Party weakened significantly. The Congress’ pursuit of a reformist agenda that included the
abolition of the zamindari and jagirdari land tenure systems weakened the appeal of the
Communists (Srinivasulu 2002). Further weakening occurred due to a split of the Communist
party at the national level into two different outfits, the CPI and CPI(M). Finally, the inherent
contradiction of a Communist party being backed primarily by a wealthy landowning group, the
Kammas, both played a role in the party’s rapid decline in AP.
A third important feature of AP politics prior to the 1970s is related the nature of the
Congress’ social base and its modes of political mobilization. The Congress’s tight grip on AP
politics was supported by a “politics of accommodation.” Dominant caste control of the Reddys
was essentially consolidated while pressures from below were kept at bay through the
distribution of patronage and rewards (Reddy 1989). Though the Congress did exhibit some
205
characteristics of a catch-all party, its social base relied primarily on the powerful Reddys at one
end and, the socially and economically-marginalized, Dalits at the other. These two groups
continue to be strong supporters of the Congress’ even today.
Political participation of Dalits and OBCs was not autonomous. Instead dominant castes,
who were typically landowners, mobilized support from marginalized groups, who tended to
work as agricultural labor, through vertical chains of patronage. The early mobilization of
marginalized groups into the Congress’ support base, albeit through a clientelistic structure, was
in part a result of factional politics in the Congress. Kohli (1990) suggests that factional politics
led rival leaders within the AP Congress to incorporate excluded social groups in order to
broaden their power base.
4.1.3.2 Politics in the 1970s and 1980s: from one-party dominance to two-party competition
These general patterns of AP electoral politics would start to shift by the 1970s. With the
Communists out of the picture, there was no viable opposition to the Congress by the early 1970s
and the party maintained clear control of electoral politics over the next decade. Even when the
Janata coalition won a resounding victory in most parts of India in the 1977 elections following
the Emergency, AP was one of the few states where the Congress managed to retain power.
But the Congress’ electoral strength masked deeper changes beneath that would
eventually set the stage for the emergence of the Telugu Desam Party (TDP) and two-party
competition in the 1980s. One major change that occurred was an increasing sense of alienation
of the Kammas from the Congress. For long, the Kammas had perceived the Congress to be
controlled by the Reddys and acting in their interests. Though the Kammas commanded
considerable economic power, they had also been underrepresented at the highest levels of the
206
Congress. Vaugier-Chatterjee (2009) shows that in AP legislative assemblies between 1955 and
1983, the proportion of Reddys among Congress legislators ranged from 58 per cent to 84.2 per
cent. Pingle (2010) similarly points out that in the 11 cabinets between 1956 and 1980, Reddy
representation (26 per cent) far outstripped that of the Kammas (8 per cent). Of the nine chief
ministers in AP between 1956 and 1983, six had been Reddys and none had been Kamma (Kohli
1990).
In the 1970s, Kamma disenchantment with the Congress would increase further. In
particular, the Kammas saw further increases in their economic standing as a result of the Green
Revolution. This catalyzed a second wave of Kamma industrial entrepreneurship. Growing
economic power of the Kammas, however, was not matched by a commensurate increase in
political power within the Congress, amplifying their sense of perceived neglect (Baru 2000;
Kohli 1990; Srinivasulu 2003; Suri 2002). The economic prosperity of the Kammas was also
increasingly at odds with the populist direction the Congress was taking in the 1970s (Reddy
1989). As part of a larger strategy, Indira Gandhi focused on mobilizing poor and socially-
marginalized sections in many parts of India and the effects of her broader agenda would
reverberate strongly in AP. She initiated a number of socioeconomic programs in AP with the
aim of destabilizing the dominant castes, who she viewed as a challenge to the Center’s control,
and increasing support from marginalized groups such as Dalits, Adivasis, women and marginal
farmers. Increasingly, the business classes, of which the Kammas formed a large component,
was looking for a government that could protect their interests (Reddy 1989).
Aside from increasing Kamma disenchantment, Indira Gandhi’s strategy also weakened
the clientelistic chains that the party relied on to draw electoral support. Her populist policies
served to weaken the hold of rich landholders over the vote banks of those below them in the

207
social and economic hierarchy (e.g., Kohli 1988). As the Congress’ focus shifted towards the
more marginalized Dalits and Adivasis in the state, another key group – the other backward
castes (OBCs) – began to move away from the party as a result. In short, the Congress’ brand of
political accommodation, which had been in place in AP for two and a half decades, began to
fray in the 1970s with the breakdown of vertical clientelistic chains (Kohli 1988, 1990; Reddy
1989; Srinivasulu and Sarangi 1999). As a result, Kohli suggests that a growing “authority
vacuum” developed in AP by the late 1970s. Reddy points out that by 1977, it was clear that
social polarization along caste and class lines was growing in AP.
Another consequential factor that catalyzed greater political competition was Indira
Gandhi’s style of autocratic governance (e.g., Kohli 1990; Reddy 1989; Suri 2002). Until the
early 1970s, regional Congress party leaders had considerable autonomy in state-level politics.
Indira Gandhi changed this pattern. Through the 1970s and early 1980s, the Congress high
command in Delhi would attempt to rule AP by remote control, installing and removing a series
of chief ministers in an arbitrary fashion; the state four different chief ministers between 1978
and 1982.
The micromanagement of state affairs by the party high command was aided
considerably by factional politics within the Congress in AP. Members of the party who did not
occupy positions of power mobilized supporters to weaken those in charge and depended on
New Delhi to sort out state-level affairs (e.g., Reddy 1976). Importantly, central interference
soon became a major rallying cry for the Congress’ opponents in AP. As a state originally
formed through linguistic demands, regional nationalism has always found a sympathetic ear in
AP politics. With growing Kamma disenchantment, the presence of an “authority vacuum” and
general disarray within the Congress, the theme of subnationalism reverberated even more

208
strongly and the stage was set for the emergence of a new political force in the in the early
1980s.
This new force would occur in the form of the Telugu Desam Party (TDP) led by a
popular Telugu film star N.T. Rama Rao (NTR) in 1983. Emerging mainly as a political vehicle
for the articulation of Kamma interests, NTR capitalized on the Congress high command’s
interference in AP politics. Through a strong rhetoric of Telugu subnationalism, portraying the
state as an aggrieved party subject to the machinations of the center, his support grew rapidly. As
a former film star with a penchant for spectacle, famous for playing the role of Hindu gods
helping the poor and weak in nearly 100 movies, NTR’s strategy was to rely on core support
from the Kammas and then blend personal charisma with high levels of populism to attract some
OBC sections (Kohli 1988; Rubinoff 1997). In the 1983 assembly elections, the TDP won a
landslide victory and the defeat represented the Congress’ first ever electoral loss in the state.
Since then AP has been a two-party states with the TDP opposing the Congress.
NTR’s first term as chief minister was short-lived. The Congress supported a splinter
group within the TDP and brought down the government in 1984, when NTR was away for a
heart surgery in the U.S. The Congress’ actions elicited major criticism within AP as well as
from national opposition parties. The TDP along with other national opposition parties launched
a “Save Democracy” movement, which led to a massive anti-Congress upsurge in AP (Suri
2002). To counter growing opposition support, the Congress central government reinstated NTR
and his government; the first such instance in India’s political history.
The anti-Congress sentiment would prevail in both the Lok Sabha elections of 1984 and
the state assembly elections in 1985. Despite a sympathy wave for the Congress across the
209
country in the aftermath of Indira Gandhi’s assassination in October 1984, the TDP retained
power in the AP assembly elections in 1985 and NTR would return as chief minister. NTR’s
populist policy promises such as rice at two rupees per kilo for the poor, a mid-day meal scheme
for school children and the sale of saris and dhotis at half price received considerable support
from the rural poor and drew them away from the ambit of the Congress (Reddy 1989;
Srinivasulu and Sarangi 1999).
Despite coming to power through a campaign centered on the Congress’ style of
governance, NTR’s decisions were arbitrary and his style of functioning was autocratic. The
TDP was, for all practical purposes, a one-man party at the time and all decisions were made by
NTR (Kohli 1990; Reddy 1989; Suri 2002). Despite announcing several populist policies,
frequently in an impulsive and arbitrary fashion, NTR rescinded or did not implement several
decisions. Kohli offers examples of NTR’s mode of functioning. For example, he points out, in
1985, NTR dismissed all village officials arguing that they represented a feudal culture but had
to reinstate them a year later due to a high court decision. He similarly offered free mid-day
meals at schools only to retract the decision a year later. His well-received subsidized rice
scheme was started and terminated several times and a ban on tuition fees was announced and
not implemented. Apart from being arbitrary, many of his decisions were autocratic. For
instance, when the AP Legislative Council, where the Congress still had a majority, blocked
NTR’s decision to reduce the retirement age of government employees from 58 to 55, the TDP
reacted by abolishing the Legislative Council (Suri 2002).
NTR’s charisma and populist policies made him popular among certain sections but his
style of functioning proved extremely damaging to the TDP. Taking advantage of NTR’s
arbitrary and capricious style of governance, the Congress regrouped and whittled away at the
210
TDP’s electoral base in the late 1980s. As a result, the Congress recorded impressive victories in
the both the state assembly and Lok Sabha elections of 1989. The Reddys, Dalits and Brahmins
continued to be the core of the party’s base. In addition, the Congress managed to regain the
support of several other groups, particularly among AP’s heterogeneous OBCs, who had moved
away from the Congress but became disillusioned with NTR’s policies (Suri 2002).
4.1.3.3 The 1990s and beyond: shifting electoral coalitions and policy realignments
Even though it was NTR’s autocratic and arbitrary governance that saw the Congress
return to power in 1989, the party’s time in office would prove tumultuous. High levels of
factionalism affected the Chenna Reddy-led Congress government. The government’s
popularity declined due to corruption and the curtailment of several welfare schemes, including
the popular subsidized rice scheme (Suri 2002). At the same time, the law and order in the state
deteriorated significantly due to a growing Maoist movement and riots over the Mandal
Commission report.
The TDP came back to the helm with a resounding victory in 1994; its electoral alliance
with the CPI and CPI (M) resulted in a three-fourths seat majority in the assembly. Despite the
TDP’s victory, NTR’s reign would come to an end in 1995. This time the challenge did not come
from the Congress but from a source much closer home. In a coup of sorts, NTR’s son in law,
Chandrababu Naidu, who was then Finance Minister of the state and had largely been known as
a backroom organizer for the TDP, took over the posts of party president and chief minister of
AP. Naidu went on to enjoy an uninterrupted stint as CM from 1995 to 2004, a rarity given anti-
incumbency levels in India in the 1990s.

211
On coming to power, Naidu ushered in an era which starkly differed from NTR’s
populism. It was during his tenure that AP became one of the most proactive states in terms of
attracting investment. Under Naidu, the TDP and the Congress witnessed realignment in policy
positions. The TDP until then had portrayed itself as a party of the poor and deprived, despite the
fact that its core support comprised of the dominant and economically-advanced Kammas.
Moreover, NTR opposed the center’s economic liberalization policies during the 1994 elections,
promising instead to reintroduce welfare programs (Suri 2004a).
Despite this background, Naidu changed the policy agenda of the party considerably and
his commitment to a neoliberal, investor-friendly, technocratic and fiscally-prudent regime
moved the TDP to the right. This position was more in line with the interests of the party’s
Kamma core. Naidu’s style of governance was also markedly different – he was the rare Indian
chief minister who openly embraced liberalization (Kennedy 2004). For his proactive stance on
economic liberalization and his image as a technologically-savvy politician, Naidu came to
represent a new breed of Indian chief ministers who were celebrated by international financial
institutions; a phenomenon that Rudolph and Rudolph (2001) have referred to as the “iconisation
of Chandrababu.”
In his early years in office, Naidu reversed some of the populist measures previously
undertaken by his own party. This included increasing electricity tariffs to farmers and reducing
subsidies on rice (Srinivasulu 2003; Srinivasulu and Sarangi 1999; Suri 2002). Naidu came to
power at a time when the state was suffering from a major financial crisis, which he saw as
arising due to his predecessor (and father-in-law) NTR’s inability to balance “welfare” and
“development” (Naidu 2000; Suri 2002, 2004b). Backed by World Bank funding, he brought out
an ambitious plan for the development of the state by 2020 (“Vision 2020”) and charted a course

212
of action that stressed the non-feasibility of government subsidies, the need for reduction of
expenditure of welfare schemes, lifting of state controls, dismantling the public sector and
opening the door for foreign private capital. Observers such as Srinivasulu (2003) view the
TDP’s shift from populism as stemming from the pressure arising from the TDP’s core Kamma
core support. As an entrepreneurial class, extreme populism that the TDP practiced under NTR
began to impinge on their interests and they favored the shift to a more business-friendly and
efficient regime.
Though he reversed many populist measures in his first few years in office, Naidu would
not be completely immune to such tactics. This was particularly true before the 1999 assembly
elections, which the TDP won by a much smaller margin than the previous one. Naidu’s new
found tryst with populism surprised both his supporters and critics but he never strayed too far
from his core commitment to economic liberalization. Naidu’s uncharacteristic focus on welfare
schemes in his second term can be largely explained by electoral imperatives. Though he could
count on strong Kamma support, the group is not numerically large enough to single-handedly
guarantee electoral victories.
In the 1980s, OBC support was vital in ensuring TDP victories. In the mid to late-1990s,
the TDP also reaped rewards in terms of upper caste votes through its coalition arrangement with
the BJP. At the same time, Naidu tried to eat away at the opposite end of Congress’ support base,
particularly the Dalits. The Dalits along with Reddys have historically been the Congress’
strongest supporters in AP. Naidu tried to break the Congress’ hold on Dalits by attempting to
internally fragment the group. Over 90% of AP’s Dalits are part of two sub-castes – the Malas
and Madigas. The former, however, have become more economically and socially-mobile
through opportunities created by reservations (affirmative action) and fissures began to grow

213
between the two groups in the 1990s. Naidu capitalized on this divide and attempted to woo
Madigas towards the TDP but with limited success. These attempts at expansion aside, the
primary support of the TDP through the 1990s and 2000s came from the Kammas, as can be seen
in tables 4.1 and 4.2.
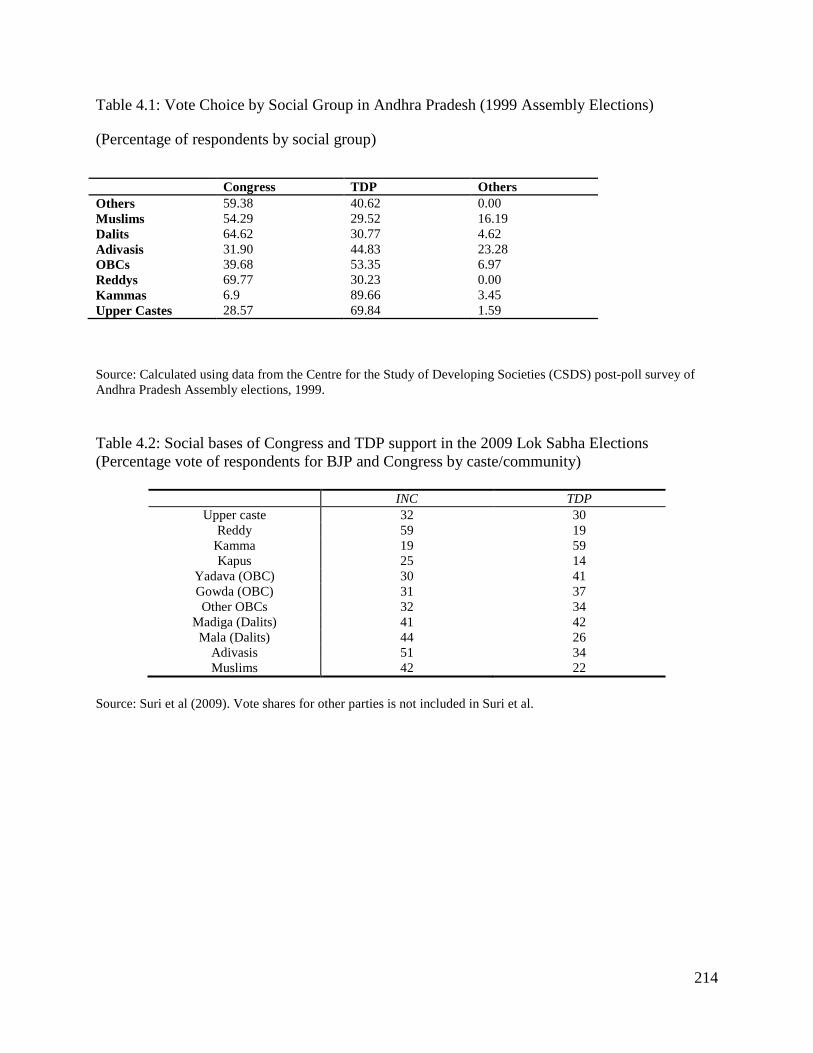
214
Table 4.1: Vote Choice by Social Group in Andhra Pradesh (1999 Assembly Elections)
(Percentage of respondents by social group)
Source: Calculated using data from the Centre for the Study of Developing Societies (CSDS) post-poll survey of Andhra Pradesh Assembly elections, 1999. Table 4.2: Social bases of Congress and TDP support in the 2009 Lok Sabha Elections (Percentage vote of respondents for BJP and Congress by caste/community)
INC TDP Upper caste 32 30
Reddy 59 19 Kamma 19 59 Kapus 25 14
Yadava (OBC) 30 41 Gowda (OBC) 31 37 Other OBCs 32 34
Madiga (Dalits) 41 42 Mala (Dalits) 44 26
Adivasis 51 34 Muslims 42 22
Source: Suri et al (2009). Vote shares for other parties is not included in Suri et al.
Congress TDP Others Others 59.38 40.62 0.00 Muslims 54.29 29.52 16.19 Dalits 64.62 30.77 4.62 Adivasis 31.90 44.83 23.28 OBCs 39.68 53.35 6.97 Reddys 69.77 30.23 0.00 Kammas 6.9 89.66 3.45 Upper Castes 28.57 69.84 1.59
215
Naidu’s strong neoliberal commitments would be responsible in large part for his
downfall in 2004. Though he had succeeded in moving AP from an industrial backwater to one
of the more business-friendly states in the country, this came at a high cost of rural neglect. AP
was one of the states to strongly affected by an agrarian crisis in the late 1990s. Among other
consequences, the state witnessed high rates of farmer suicides. In addition, poverty and Income
inequalities also grew during Naidu’s tenure (Suri 2004a). The stark contrast between the state’s
efforts to improve its business environment, particularly around the capital city of Hyderabad,
and rural neglect became increasingly visible.
For some, it was Naidu’s uncompromising neoliberal model, hailed by international
financial institutions as well as the foreign and Indian media, which was at the very root of the
rural crisis. One prominent journalist analyzing the agrarian crisis and farmers suicides in AP in
2004 suggested: “Why has this [agrarian distress] happened more in Andhra Pradesh than
anywhere else? After all, the basic economic model [the Washington Consensus model] we see
here did and does exist across the country. For one thing, Andhra Pradesh under Mr. Naidu was
far more aggressive than any other State in pushing that model. With the national – and global –
elite backing him, he acted without compunction. Most of the support systems the poor in the
State had (some put in place by N.T. Rama Rao) were ruthlessly dismantled…Also, no other
State and leader were so totally exempt from critical scrutiny. The media didn't just hail the
Emperor's New Clothes. It was so busy weaving them, it failed to see Andhra Pradesh's fabric
being torn apart” (Sainath 2004).
When asked whether he thought his model had been one-sided, Naidu suggested that it
was a misconception that he had not delivered to rural sections but rather the problem was one of
216
publicity. Commenting on this, he suggested: “Comparatively at that time, we had some
problems – we had a drought and they [the opposition] took advantage of that. Also, I had been
promoting only one side and that gave a wrong impression to the public. The opposition
exploited that. I should have balanced [the publicity] between the two. I have done everything on
welfare and rural infrastructure…schools, literacy programs, mid-day meal scheme, residential
schools, junior colleges in every mandal… primary health centers, referral hospitals…tell me
even one building that they [the opposition] have constructed.”82
On the ground, rural discontent would have major electoral consequences. After a decade
of TDP rule, the Congress under Y.S. Rajasekhar Reddy (YSR) came back to power in the 2004
elections. Backed by strong populist rhetoric and an alliance with Left parties, YSR chose to run
on a pro-poor platform highlighting the neglect of rural sections under TDP’s neoliberal agenda.
His campaign included numerous populist promises, loans to farmers and subsidized rice.
Ironically, these were measures introduced by the TDP when it came to power in the 1980s.
These poll promises were complemented by YSR’s personal charisma and mobilization efforts.
Among other efforts, his campaign included personally undertaking a 1500 kilometer ‘padayatra’
(march on foot) in the state to highlight rural neglect. The Congress’ support in the 2004
elections came from a variety of sources. Its core support came from the Reddys, Dalits,
Adivasis and Muslims as in the past. Unlike the 1994 and 1999 elections, the Congress also
managed to win over the Kapus, who have been key swing voters on occasion (Suri 2004a).
The Congress under YSR put in place an elaborate agrarian and welfare regime that included
loan waivers, free electricity, input subsidies, high levels of public investment in irrigation,
health, housing and pension schemes (Srinivasulu 2009). In addition, he also pushed through the 82 Interview with Chandrababu Naidu, Hyderabad, March 20, 2010.

217
central government-run National Rural Employment Guarantee Scheme (NREGA). YSR
consciously stayed away from publicizing initiatives relating to business, as Naidu had done.
Though he did not actively disrupt AP’s industrial commitments, interviews with investors
suggest a slowdown. The state was not as proactive in the competition for investment as it had
been previously. Most importantly, YSR’s populism affected the state’s finances. Precarious
finances, particularly at the end of his first term, meant that the state was not able to deliver on
several concessions promised in its industrial policies.
YSR’s welfare regime and focus on agriculture helped him win a second term in 2009;
opposition fragmentation allowed the Congress to retain power with a vote share of only 36.53
per cent. The PRP, which was launched in 2008 by film actor Chiranjeevi and backed primarily
by the Kapus, emerged a key third player in the 2009 elections with over 16 per cent of the vote
share. The PRP merged with the Congress after the 2009 elections. The Congress once again
came to bank on its traditional support among the Reddys and Dalits along with Adivasis and
Muslims (table 4.2). It also managed to attract as much OBC support as the TDP. AP politics
took a major unexpected turn in 2009. A helicopter crash in September 2009 claimed YSR’s life,
a few months after he won his second term in office.
Since YSR’s death, both AP and the Congress party in the state have seen considerable
turmoil. In particular, the Telangana agitation and demands for the bifurcation of AP gained
considerable momentum in 2009. The central government blinked first, announcing that it would
start the process for the creation of a separate state, and then backtracked by setting up the
Srikrishna Commission to study the issue. The Commission’s report submitted in December
2010 recommended keeping the state united but suggested various measures for the economic
development of Telangana. Since 2009, AP has seen frequent disruptions on the issue and the
218
state has become considerably polarized along pro and anti-Telangana lines. The issue has even
managed to divide the Congress and TDP internally.
The Congress in AP has also witnessed leadership problems since YSR’s death. YSR’s
son, Jagan Reddy, has been in sharp conflict with the Congress state leadership and eventually
broke away from the party, adding to the party’s problems. Though the long-term impact is
unclear, the political turmoil that has characterized AP since 2009 appears to have had some
impact on the business climate. Industry organizations, including the Confederation of Indian
Industry (CII) and the IT sector associations, have repeatedly expressed concern over a potential
slowdown of investment and growth on account of the state’s political problems
(EconomicTimes 2009, 2011a; TheHindu 2010; Patnaik 2011; Rao 2009).
4.1.4 Tracing the mechanisms: from narrow-right to wide-right coalitions and policy
shifts
In terms of alliances backing the government, AP in the post-1991 period has seen the
alternation between narrow-right coalitions, which backed the TDP, and wide-right coalitions,
which have supported the Congress. Even during the latter half of the TDP’s time in power
between 1994 and 2004, there were pressures to expand the electoral base of support. While the
two dominant castes (the Reddys and Kammas) form the core of the Congress and TDP’s
support respectively, these groups are not as large as the Patidars in Gujarat. As a result, AP’s
electoral politics has been more fluid in nature. In contrast to Gujarat, the necessity of parties to
build broader coalitions is also marginally greater. While the two dominant castes have always
played a predominant role in AP’s politics, swing votes of groups such as the OBCs have often
219
mattered. AP’s aggressiveness in investment promotion has fluctuated with the shift between
narrow-right and wide-right coalitions.
For most of the TDP’s tenure between 1995 and 2004, the electoral coalition that backed
the government was narrow-right. The TDP was formed as a vehicle to articulate Kamma
interests and its core support has always come from the entrepreneurial Kammas. As tables 4.1
and 4.2 show, the TDP continues to receive overwhelming support from the Kammas. Kammas
also internally dominate the TDP organization – 40.4 per cent of the TDP’s legislators in the
1994 assembly and 55.3 per cent in the 1999 assembly were Kamma (Vaugier-Chatterjee 2009).
Through its alliance with the BJP in the late 1990s, the TDP also enjoyed the support of upper
castes. The composition of the TDP’s electoral coalitions is confined in terms of the economic
profile of core groups. In addition, Kamma and upper caste support led to significant
representation of business interests.
As in the case of Gujarat, TDP’s narrow-right coalitions include an overlap of political
and economic power. As a group comprising a major component of entrepreneurship in AP,
Kamma interests are clearly aligned with a pro-business agenda. This allowed the TDP
government to prioritize an investor-friendly agenda, particularly in the first term (1994-1999).
However, the commitment to a pro-business agenda was more tenuous in AP than Gujarat, even
during the TDP’s regime. In large part, this was due to the fact that the numerical size of the
Kammas does not afford as much political leverage as the Patidar-Brahmin-Bania combination in
Gujarat.
As a result, the TDP has to look to other groups and the OBCs have been important swing
voters in the state. The disillusionment of OBCs with the Congress was crucial in propelling
220
NTR to power in the 1980s and the TDP attracted sizeable support of the OBCs in the 1990s
(Srinivasulu 2003). OBC support has been divided since the 1990s between the TDP and
Congress. In the late 1990s, the TDP also attempted to widen its base by reducing the Congress’
hold on the Dalits by politicizing an economic divide between the Malas and Madigas. These
attempts at expansion by the TDP were only marginally successful – the traditional party of
choice for economically weaker sections such as the Dalits remains the Congress. The TDP’s
necessity to widen its base points to a difference with narrow-right BJP coalitions in Gujarat.
Since 2004, the Congress has been in power in AP. In contrast to the more contained
nature of the TDP’s social base, the Congress in AP has historically been more of a catch-all
party and attracted a diverse range of groups. I classify the electoral coalitions that have backed
the Congress since 2004 as wide-right coalitions. Historically, the party’s most consistent
supporters have been the Reddys and the Dalits – groups at the opposite ends of the
socioeconomic spectrum. During the 1980s, when the TDP ate into the Congress’ OBC base, the
party could still rely on Reddys and Dalits as well as Brahmins, Adivasis and Muslims. With the
entry of the BJP in the 1990s and its subsequent alliance with the TDP, upper caste support also
shifted to the TDP-BJP alliance. The Congress was essentially reduced to a coalition of extremes
of the Reddys and Dalits between the mid-1990s and 2004. In both the 2004 and 2009, the
Congress appears to have regained its catch-all nature in the state and received support from a
range of groups including upper castes, Reddys, some OBC groups, Dalits, Adivasis and
Muslims (table 4.2). It was also particularly strong in rural areas.
The Congress’ social base has been considerably more diverse in terms of socioeconomic
profiles than the TDP’s. While it does have some representation of business classes through its
Reddy and upper caste support, it also depended heavily on deprived sections such as the Dalits
221
and Adivasis. These wide-right coalitions include a considerably more diverse range of
economic interests than the TDP’s social base. Moreover, rural agricultural interests are strongly
represented. In fact, the Congress regained power in 2004 emphasizing rural neglect. This meant
that rural and poorer sections had to be satisfied first and YSR’s policy agenda primarily
comprised of welfare schemes for poorer sections, particularly in rural areas.
The Congress since 2004 has also been conspicuously less pro-business in rhetoric.
While the basic policy framework of AP was not altered completely, the Congress has been less
aggressive than the TDP in creating an investor-friendly environment. This is not surprisingly
given the range of economic interests in its electoral coalitions and the strength of rural demands
arising from groups within this coalition. The contradictory economic interests of Congress’
wide coalition were most evident in the effect on state finances. The large rural and lower class
base was rewarded with numerous welfare schemes including free power to farmers, subsidized
rice and health programs. The stress on redistributive policies, in turn, strained the exchequer
leading to the state to slow its thrust on areas such as infrastructure creation and creating a
backlog in terms of incentives and concessions promised in the state’s industrial policy. In
addition, free electricity to farmers has strained the ability of the state to provide electricity to
industry and interviews with businesspersons suggested that many firms now rely on their own
generation capacity to meet their needs.
The account in this section argues that the AP’s aggressiveness in attracting investment has
fluctuated with the changing nature of electoral coalitions backing the TDP and the Congress.
Two other general points need to be emphasized in tracing the link between coalitions and
policies. First, the strong rural presence in the state is always likely to act as a check on the
extent to which the state can be investor-friendly in AP. In this aspect, AP differs from Gujarat.

222
Second, the nature of the business-state relationship in AP has veered strongly towards
cronyism at times. Rival groups of businessmen, often divided on caste lines, have benefitted
alternately from the patronage of TDP and Congress regimes. One notable recent example that
illustrates this trend was the case of illegal mining of iron ore by the Obulapuram Mining
Company, which received considerable media attention in India in 2010 and 2011. The mining
company, owned by brothers Janardhana and Karunakara Reddy (better known as the Bellary
brothers), benefitted significantly from a variety of covert benefits granted by both the
governments of Karnataka and AP. The Bellary brothers enjoyed close relations with the
governments of Karnataka and AP; one of the brothers even became a minister in Karnataka’s
BJP government in 2008. By late 2010, leadership changes saw a decline in the political
patronage of the Bellary brothers. This led to greater scrutiny into the activities of the company
and court cases being filed. In 2011, the Supreme Court ruled that the Obulapuram Mining
Company benefitted significantly from illegally mining in a reserve forest area of AP. This
infraction had occurred at a time of high world demand for iron ore due to the 2008 Beijing
Olympics (IndianExpress 2008b). The Court suggested that the company’s violation of mining
leases “could not have taken place without the active connivance of the officers concerned of the
Andhra Pradesh government” (EconomicTimes 2011b).
4.1.5 Explaining the origins of AP’s electoral coalitions
AP’s electoral coalitions are a product of both party strategies and voter attachments.
Identity politics, in turn, has influenced both these aspects. This has meant that dominant caste
cleavages have shaped party strategies in AP. At the same time, certain social groups have
complemented some of these strategies by demonstrating considerable electoral loyalty to one of
the two main parties, the Congress and the TDP. Each of these mechanisms is explained below.
223
4.1.5.1 Social cleavages and party strategies
Like Gujarat, dominant caste patterns exist in the state with the Reddys and Kammas
being the major groups. Moreover, these groups also have a considerable presence in the
entrepreneurial base of the state. Numerical strength in combination with social and economic
dominance allowed the Reddys and Kammas to become the main political players in AP. The
long-standing Kamma-Reddy conflict has been a master narrative in AP politics. These groups
have jockeyed for position since the formation of the state in 1953. The Kamma-Reddy rivalry
since the 1980s has been expressed through support and control for the TDP and the Congress.
The two parties have adopted different strategies of coalition construction. As explained
earlier, the formation of the TDP was an outgrowth of Kamma disenchantment and the party
relies disproportionately on this group. The TDP has been backed by narrow-right coalitions
comprising primarily of the Kammas. This high reliance on Kamma support is enabled by the
leverage that this group enjoys in AP’s electoral space. The Kammas are numerically sizeable
and, more importantly, are geographically concentrated in AP’s coastal belt. Geographic
concentration allows the group to electorally punch well above its demographic weight in India’s
FPTP system. As a result, the TDP has been able to build its electoral coalition around this
group.
The TDP’s strategy has been to focus on its Kamma base and add support of other groups
to this core. Though the dominant caste patterns in AP are similar to those in Gujarat, the
Kammas enjoy marginally less leverage than the Patidars since they are numerically smaller. In
the 1990s, the TDP expanded its social base to include upper castes through coalition

224
arrangements with the BJP. In addition, the TDP has also enjoyed support from the section of
OBCs and, more recently, a section of Dalits.
The numerical size and geographical concentration of the Kammas allowed the TDP to
win elections in 1994 and 1999 while relying a narrow set of social groups. In addition, the
substantial representation of business in TDP’s narrow-right coalitions is enabled by the fact that
the Kammas constitute a major portion of the entrepreneurial base in AP. As such, the
coincidence of size and entrepreneurial identity inherent in AP’s dominant caste cleavages has
contributed to the emergence of narrow-right coalitions backing the TDP.
In contrast to the TDP, the Congress’ base is more diverse. This coalition includes a
range of economic interests, with the powerful Reddys on one end and more marginalized Dalits
on the other. The Reddys, in particular, have dominated the leadership of the Congress since the
formation of the state as explained earlier. Like the Kammas, the Reddys are numerically
sizeable. They are also economically-powerful and form a notable proportion of entrepreneurship
in AP. However, unlike the Kammas, the Reddys are not geographically concentrated. To some
extent, this requires the Congress to attract support from a wide range of social groups. As
described earlier, the Congress’ mode of factional politics in the 1950s and 1960s meant that
socially-marginalized groups such as Dalits were mobilized by rival party leaders through
vertical chains of patronage. Dalits, along with Muslims, have remained strong Congress
supporters since the 1950s. Until the 1980s, the Congress also received OBC support. In many
ways, Congress has historically exhibited trends of a catch-all party in AP for most of its history.
At times, particularly in the 1980s, it was reduced to a coalition of extremes with Reddy and
Dalit support. Whatever the case, there is little doubt that the Congress’ base has depended on a
broader set of social groups than the TDP. Importantly, AP’s politics saw one-party dominance

225
until the 1980s. There was no other game in town barring the Congress until the 1980s and it was
not surprising it received support from a broad range of social groups.
The timing of the emergence of narrow-right coalitions in the 1990s can be traced to
changes in the patterns of AP politics in the 1970s. Congress dominance and its catch-all bases
of support ensured that wide coalitions were the norm in AP until the 1980s. AP’s long history of
one-party dominance meant that a viable opposition party did not emerge until the 1980s. In
part, as explained in section 4.1.3.2 in more detail, changes in the 1970s triggered the emergence
of two-party competition. Rising economic power of the Kammas, a weakening of Congress’
patronage chains and central interference in AP’s affairs drove the formation of the TDP in the
1980s. As such, the combination of these three changes in the 1970s triggered the emergence of
the TDP. In turn, the party became the primary vehicle representing Kamma interests.
Interestingly, despite the heavy reliance on the Kammas, the TDP, under NTR, adopted populist
policies in the 1980s. Subsequently, under Chandrababu Naidu in the 1990s, the TDP’s policy
focus was realigned towards a pro-business agenda. In contrast, to NTR’s populism, this policy
framework was much more in line with the economic interests of the party’s core Kamma
supporters.
In sum, AP’s cleavage structure has influenced the emergence of wide-right and narrow-
right coalitions in AP. One comment in relation to the cleavage structure and nature of electoral
coalitions is in order here. The underlying cleavage structure in AP is different from Gujarat in
one important regard. Though the existence of dominant caste patterns clearly makes narrow
coalitions a possibility in AP, as seen through the coalitions backing the TDP, the two main
castes are not large enough to ensure the stability of these types of coalitions. The fact that
neither the Kammas nor Reddys account for more than 10 per cent of the population has
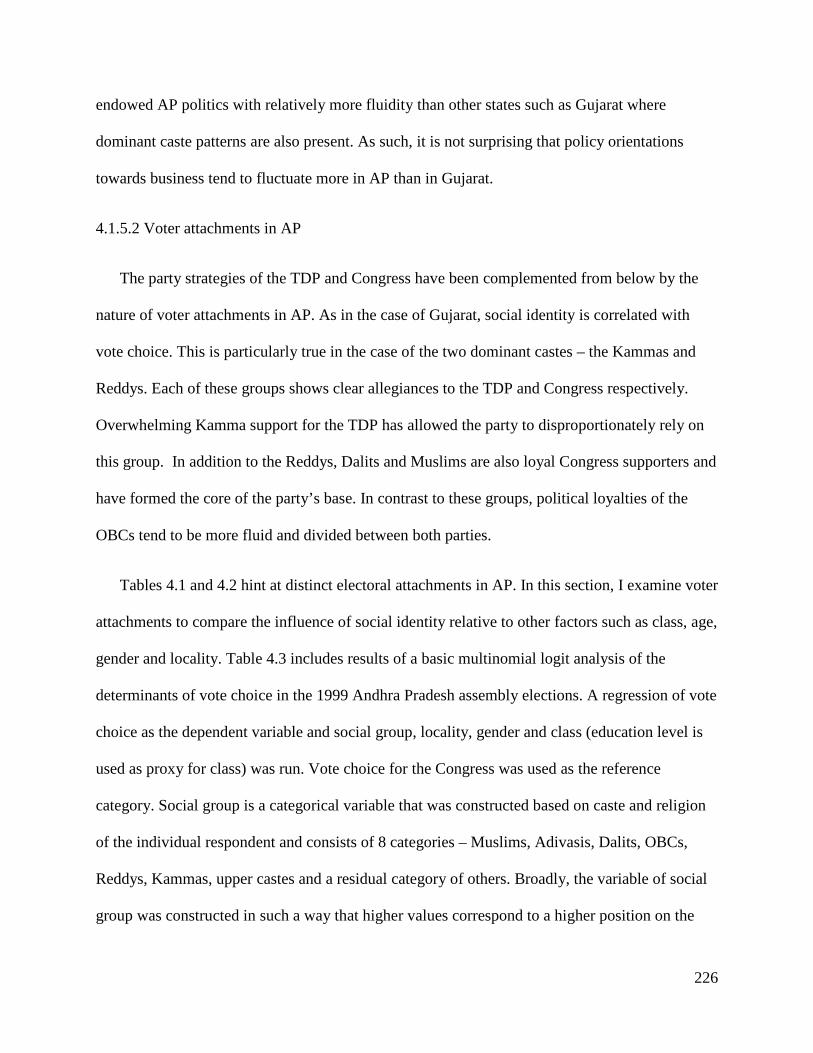
226
endowed AP politics with relatively more fluidity than other states such as Gujarat where
dominant caste patterns are also present. As such, it is not surprising that policy orientations
towards business tend to fluctuate more in AP than in Gujarat.
4.1.5.2 Voter attachments in AP
The party strategies of the TDP and Congress have been complemented from below by the
nature of voter attachments in AP. As in the case of Gujarat, social identity is correlated with
vote choice. This is particularly true in the case of the two dominant castes – the Kammas and
Reddys. Each of these groups shows clear allegiances to the TDP and Congress respectively.
Overwhelming Kamma support for the TDP has allowed the party to disproportionately rely on
this group. In addition to the Reddys, Dalits and Muslims are also loyal Congress supporters and
have formed the core of the party’s base. In contrast to these groups, political loyalties of the
OBCs tend to be more fluid and divided between both parties.
Tables 4.1 and 4.2 hint at distinct electoral attachments in AP. In this section, I examine voter
attachments to compare the influence of social identity relative to other factors such as class, age,
gender and locality. Table 4.3 includes results of a basic multinomial logit analysis of the
determinants of vote choice in the 1999 Andhra Pradesh assembly elections. A regression of vote
choice as the dependent variable and social group, locality, gender and class (education level is
used as proxy for class) was run. Vote choice for the Congress was used as the reference
category. Social group is a categorical variable that was constructed based on caste and religion
of the individual respondent and consists of 8 categories – Muslims, Adivasis, Dalits, OBCs,
Reddys, Kammas, upper castes and a residual category of others. Broadly, the variable of social
group was constructed in such a way that higher values correspond to a higher position on the
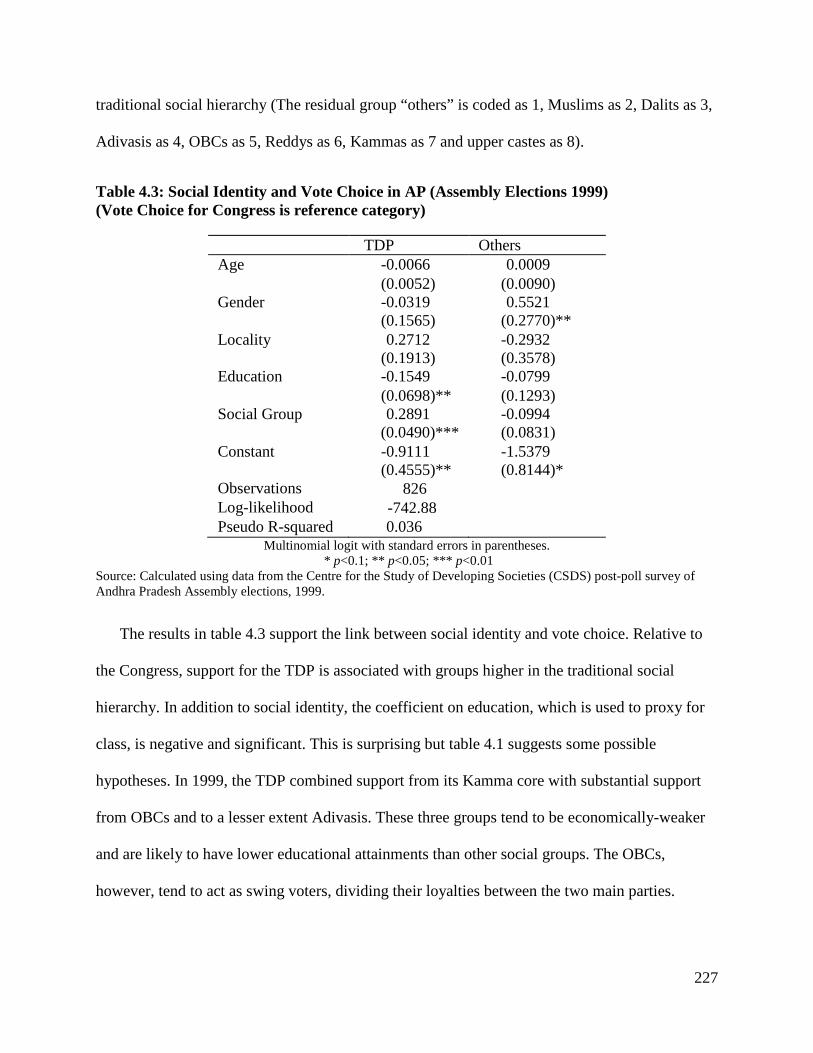
227
traditional social hierarchy (The residual group “others” is coded as 1, Muslims as 2, Dalits as 3,
Adivasis as 4, OBCs as 5, Reddys as 6, Kammas as 7 and upper castes as 8).
Table 4.3: Social Identity and Vote Choice in AP (Assembly Elections 1999) (Vote Choice for Congress is reference category)
TDP Others Age -0.0066 0.0009 (0.0052) (0.0090) Gender -0.0319 0.5521 (0.1565) (0.2770)** Locality 0.2712 -0.2932 (0.1913) (0.3578) Education -0.1549 -0.0799 (0.0698)** (0.1293) Social Group 0.2891 -0.0994 (0.0490)*** (0.0831) Constant -0.9111 -1.5379 (0.4555)** (0.8144)* Observations 826 Log-likelihood -742.88 Pseudo R-squared 0.036
Multinomial logit with standard errors in parentheses. * p<0.1; ** p<0.05; *** p<0.01
Source: Calculated using data from the Centre for the Study of Developing Societies (CSDS) post-poll survey of Andhra Pradesh Assembly elections, 1999.
The results in table 4.3 support the link between social identity and vote choice. Relative to
the Congress, support for the TDP is associated with groups higher in the traditional social
hierarchy. In addition to social identity, the coefficient on education, which is used to proxy for
class, is negative and significant. This is surprising but table 4.1 suggests some possible
hypotheses. In 1999, the TDP combined support from its Kamma core with substantial support
from OBCs and to a lesser extent Adivasis. These three groups tend to be economically-weaker
and are likely to have lower educational attainments than other social groups. The OBCs,
however, tend to act as swing voters, dividing their loyalties between the two main parties.

228
4.2 Bihar – prolonged failure and a surprising shift
Like the case of Andhra Pradesh, Bihar too exhibits temporal variation in its policy
framework. For most of the post-1991 period, Bihar was characterized by a breakdown of state
authority. In fact, by some accounts, it typified a failed state. Not surprisingly, the state achieved
little in terms of economic development. Investment promotion and industrial development were
not even on the state’s policy radar. The 1990s, however, were of immense social and political
significance in Bihar, marking the culmination of the rise of the other backward castes (OBCs) to
power after decades of marginalization. A strong rhetoric of social justice on the part of RJD
governments that governed the state was, however, accompanied by few substantive
development initiatives of note. Indeed, there was an overall failure of governance.
Bihar’s downward economic slide has taken a surprising turn for the better since 2005. A
change in government has led to a complete reorientation of its development policy framework.
The sections below explore these changes and attempt to offer an explanation for both Bihar’s
initial failure and its subsequent policy transformation.
4.2.1 The context: Bihar’s economic background
With 103.8 million people, Bihar accounts for 8.6 per cent of India’s population and is
the country’s third most populous state.83 With 41.4 per cent of its population below the poverty
line, it is also India’s second poorest state.84 The state is overwhelmingly rural (almost 90 per
cent). It is also one of India’s least industrialized states, accounting for 0.9 per cent of the total
83 Census of India 2011 (provisional tables, Table 1; censusindia.gov.in; accessed May 30, 2011). 84 Poverty headcount ratio is percentage below the poverty line in 2004-05 based on the uniform recall period (official estimates) from RBI (2010b), table 162.

229
output of the factory sector in 2008-09.85 Reflective of high levels of deprivation, 48 per cent of
its workforce is employed as agricultural labor compared to a national average of 26.5 per cent.86
Despite heavy dependence on agriculture, the sector contributes only about 22 per cent of the
state’s domestic product.
Some of the roots of Bihar’s economic problems can be traced to the colonial period. The
Permanent Settlement of 1793 resulted in a feudal economic structure, with rent-seeking
zamindars on top and a highly-marginalized peasantry below, which inhibited both agricultural
investment as well as diversification into industry (e.g., Das 1992; Dasgupta 2007; Ghosh 2007).
As Dasgupta points out, Bihar developed more along the lines of a classic enclave economy – the
state became a major producer of raw materials such as indigo but also was also the main
supplier of Indian indentured labor to British plantations in Maldives, Fiji, Guyana, Trinidad,
Surinam and elsewhere.
A sole focus on historical factors, however, does not provide a complete explanation for
Bihar’s underdevelopment. Though poorer than several other regions at the time of
independence, Bihar did not appear to be strikingly different from many other states in terms of
other indicators such as literacy or infrastructure. Some of its historical handicaps were
compounded by poorly-conceived central policies in the licensing era such as the freight
equalization scheme, which negated Bihar’s advantage in terms of sizeable mineral endowments.
This scheme led to the development of heavy industry in areas at a considerable distance from
raw material sources. A bifurcation of the state in 2000 further weakened its economic base; a
85 Annual Survey of Industries 2008-09, CSO, Government of India, Table 3 (mospi.nic.in). 86 Census of India (2001).
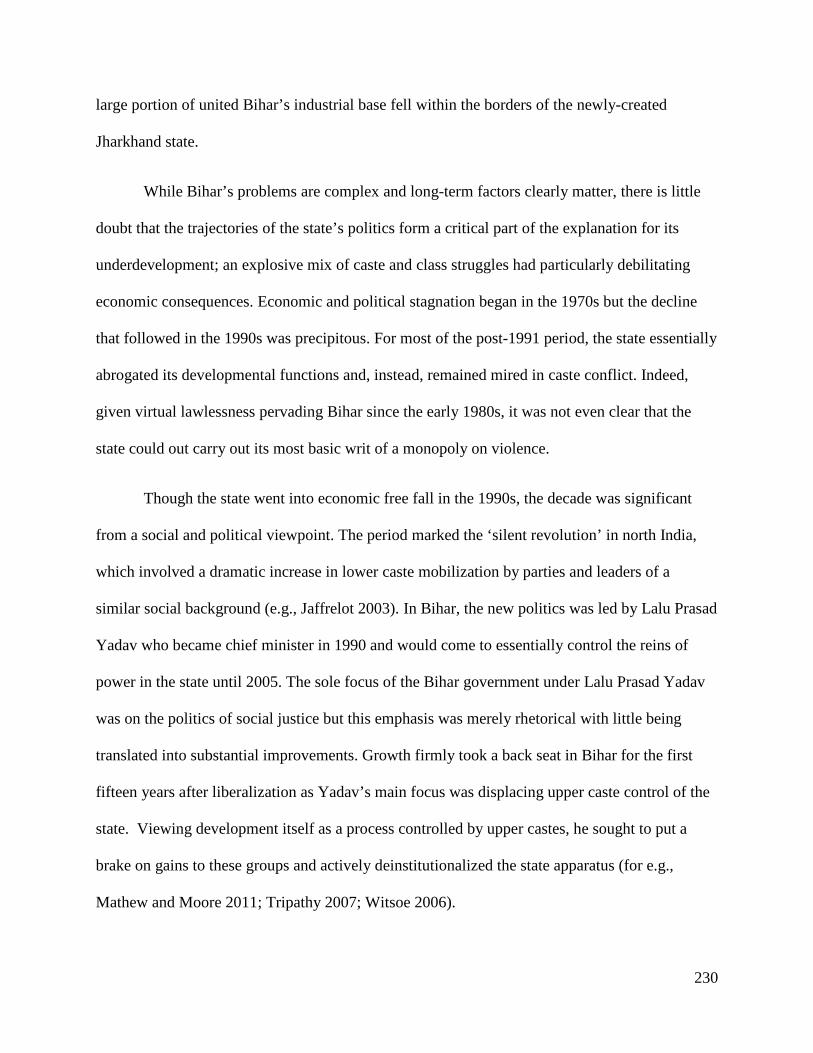
230
large portion of united Bihar’s industrial base fell within the borders of the newly-created
Jharkhand state.
While Bihar’s problems are complex and long-term factors clearly matter, there is little
doubt that the trajectories of the state’s politics form a critical part of the explanation for its
underdevelopment; an explosive mix of caste and class struggles had particularly debilitating
economic consequences. Economic and political stagnation began in the 1970s but the decline
that followed in the 1990s was precipitous. For most of the post-1991 period, the state essentially
abrogated its developmental functions and, instead, remained mired in caste conflict. Indeed,
given virtual lawlessness pervading Bihar since the early 1980s, it was not even clear that the
state could out carry out its most basic writ of a monopoly on violence.
Though the state went into economic free fall in the 1990s, the decade was significant
from a social and political viewpoint. The period marked the ‘silent revolution’ in north India,
which involved a dramatic increase in lower caste mobilization by parties and leaders of a
similar social background (e.g., Jaffrelot 2003). In Bihar, the new politics was led by Lalu Prasad
Yadav who became chief minister in 1990 and would come to essentially control the reins of
power in the state until 2005. The sole focus of the Bihar government under Lalu Prasad Yadav
was on the politics of social justice but this emphasis was merely rhetorical with little being
translated into substantial improvements. Growth firmly took a back seat in Bihar for the first
fifteen years after liberalization as Yadav’s main focus was displacing upper caste control of the
state. Viewing development itself as a process controlled by upper castes, he sought to put a
brake on gains to these groups and actively deinstitutionalized the state apparatus (for e.g.,
Mathew and Moore 2011; Tripathy 2007; Witsoe 2006).
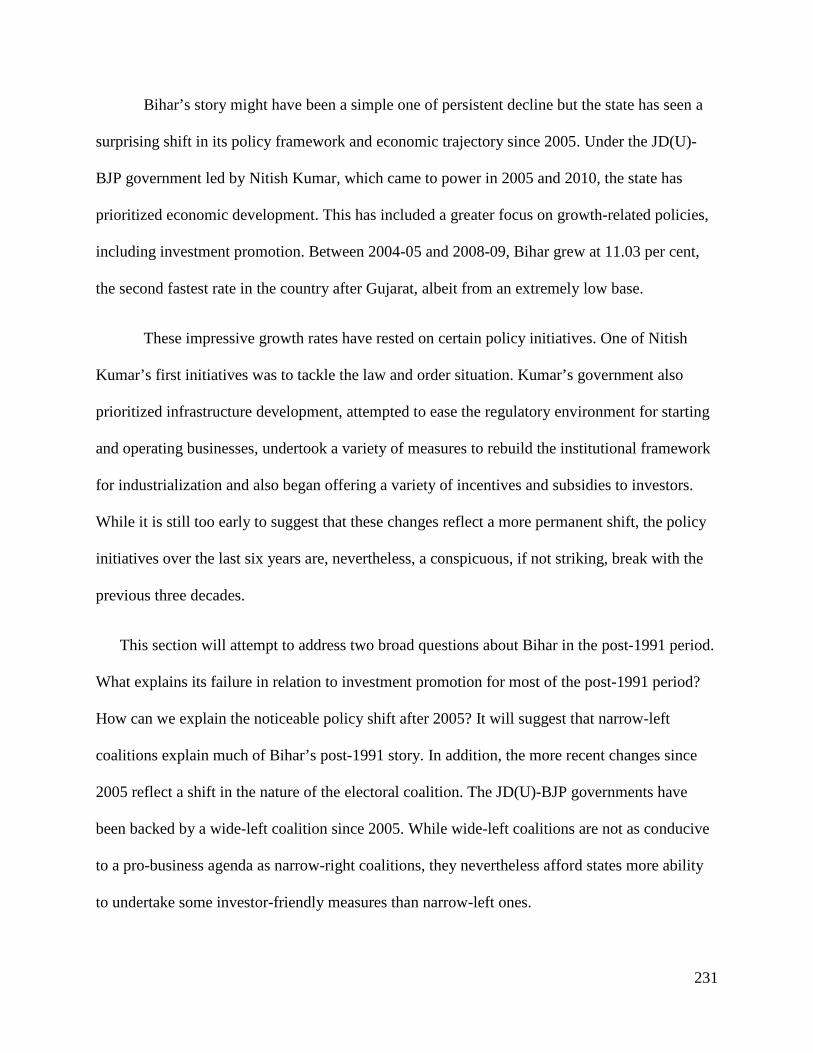
231
Bihar’s story might have been a simple one of persistent decline but the state has seen a
surprising shift in its policy framework and economic trajectory since 2005. Under the JD(U)-
BJP government led by Nitish Kumar, which came to power in 2005 and 2010, the state has
prioritized economic development. This has included a greater focus on growth-related policies,
including investment promotion. Between 2004-05 and 2008-09, Bihar grew at 11.03 per cent,
the second fastest rate in the country after Gujarat, albeit from an extremely low base.
These impressive growth rates have rested on certain policy initiatives. One of Nitish
Kumar’s first initiatives was to tackle the law and order situation. Kumar’s government also
prioritized infrastructure development, attempted to ease the regulatory environment for starting
and operating businesses, undertook a variety of measures to rebuild the institutional framework
for industrialization and also began offering a variety of incentives and subsidies to investors.
While it is still too early to suggest that these changes reflect a more permanent shift, the policy
initiatives over the last six years are, nevertheless, a conspicuous, if not striking, break with the
previous three decades.
This section will attempt to address two broad questions about Bihar in the post-1991 period.
What explains its failure in relation to investment promotion for most of the post-1991 period?
How can we explain the noticeable policy shift after 2005? It will suggest that narrow-left
coalitions explain much of Bihar’s post-1991 story. In addition, the more recent changes since
2005 reflect a shift in the nature of the electoral coalition. The JD(U)-BJP governments have
been backed by a wide-left coalition since 2005. While wide-left coalitions are not as conducive
to a pro-business agenda as narrow-right coalitions, they nevertheless afford states more ability
to undertake some investor-friendly measures than narrow-left ones.
232
4.2.2 Bihar’s social structure
For long, Bihar has had one of the most volatile political landscapes in India and much of
its post-independence history has been marked by a series of political and economic battles
between various social groups, particularly along caste lines. Bihar not only inherited a rigid
social structure but historically strong links between caste, land and political power have made
the state particularly ripe for both caste and class confrontations (Frankel 1989a; Kohli 1990).
The underlying social cleavage pattern in Bihar conforms to what I classify as the “Hindi-
heartland” pattern. For the purposes of this dissertation, two points in relation to the Hindi-
heartland pattern will be emphasized in the brief description of the social structure that follows.
First, large castes exist under the Hindi-heartland pattern. Second, these large castes have
historically been the most socially and economically-marginalized sections. In Bihar, lower
castes constitute the vast majority of the population but upper castes dominated social and
political spheres until the 1990s. As such, the Hindi-heartland pattern tends to reflect a converse
phenomenon than dominant caste patterns. Under dominant caste patterns, it was the overlap
between group size and economic resource control that acted as enabling conditions for narrow-
right coalitions. Under the Hindi-heartland pattern, certain groups enjoy numerical leverage but
they tend to be among the poorest and most socially-marginalized sections of society. This, in
turn, is conducive for the emergence of narrow-left coalitions, as described later in this section.
The cleavage patterns in Hindi-heartland states such as Bihar and Uttar Pradesh
exemplify the textbook four-fold varna hierarchy. Castes (jatis) from all four macro groupings
(varnas) tend to be represented in Bihar’s social structure. Though outnumbered by lower castes,
upper castes form a greater proportion of the population under the Hindi-heartland pattern
233
compared with states under other cleavage patterns (Jaffrelot 2003). The “twice-born” castes in
Bihar – the Brahmins, Bhumihars, Kayasthas, Rajputs and Banias – account for approximately
14 per cent of the population and constitute a notable minority (Frankel 1989a; Kohli 1990).
Below the upper castes lies a heterogeneous group of other backward castes (OBCs), who
constitute nearly 39 per cent of Bihar’s population (Frankel 1989a; Jaffrelot 2009b). The OBCs
are internally diverse, and can further be divided into upper OBCs (approximately 20 per cent of
the state’s population) and lower OBCs (about 18 per cent) based on economic distinctions.
Among the upper OBCs, the Yadavs (12 per cent of the Bihar’s total population) have
been the most politically influential and, to a lesser extent, the Kurmis (3.5 per cent) and the
Koeris (4.1 per cent). In large part, the numerical size of the Yadavs has ensured their political
rise in the post-Mandal environment. One of the main parties in the state, the RJD, is built
around a Yadav base and the JD(U), which is currently in power as part of a coalition with the
BJP, enjoys the loyalty of the Kurmis and Koeris. Bihar also has a sizeable but fragmented Dalit
population (15.7 per cent) as well as considerable Muslim presence (16.5 per cent).87 Prior to the
bifurcation of Bihar in 2000, the state’s Adivasi population was also notable.
Unlike dominant caste states, large castes such as the Yadavs in the Hindi heartland
pattern have never enjoyed control of economic resources and have historically endured high
levels of social marginalization. The Yadavs tend to be marginal landholders and did see some
socioeconomic improvements as a result of the Green Revolution. On the whole, they tend to be
a poor, agricultural group. For a variety of reasons, including adverse colonial heritage in the
form of the zamindari system, industrial entrepreneurship never really developed in Bihar. The
87 Census of India (2001).
234
local entrepreneurial base is extremely thin. As a result of this structural factor, business
representation in electoral coalitions in Bihar tends to be minimal.
Social, economic and political power has been highly correlated in Bihar and this allowed
the upper castes to monopolize control of the state for more than four decades; this dominance
has also formed the background to much of the political contestation in the state. While forward
vs. backward castes has been one master narrative in Bihar’s political history, internal cleavages
within these groups as well as class issues have provided the sub-text for other consequential
struggles.
4.2.3 A brief overview of Bihar’s politics until 1990
Politics in Bihar can be divided into three major phases – a period of upper caste
dominance between 1947 and 1967, the beginnings of the rise of the other backward castes
(OBCs) and a forward vs. backward caste struggle between 1967 and 1990 and finally, the
culmination of the rise of the OBCs after 1990. In addition, the latter half of the 1990s saw
increasing internal fragmentation within OBC politics.
By Bihar’s tumultuous standards, the 1947-1967 period was relatively stable. The twice-
born castes dominated politically and were also significantly overrepresented in various
government institutions such as the bureaucracy, police and judiciary in Bihar. As in most other
parts of the country, the Congress was dominant in Bihar for the first two decades after
independence. It was backed by a social coalition that included sizeable support from the upper
castes at one end but the socially and economically-marginalized Dalits and Muslims on the
other; the weaker groups mobilized primarily through vertical chains of patronage controlled by
upper castes (e.g., Jaffrelot 2000). The main political competition during this time was intra-elite

235
conflict between various upper castes and this was largely played out as factional politics within
the Congress (Frankel 1989a; Kohli 1990; Roy 1967). Though there were significant rivalries
among upper caste elites, they, nevertheless, effectively closed ranks when there was any
semblance of increasing lower caste power.
The next two decades after 1967 saw the emergence of the OBCs as a political force and
these castes also moved away from the Congress. The rise of the OBCs, particularly upper OBCs
such as Yadavs, Kurmis and Koeris, occurred for a variety of reasons. Socioeconomic
improvements brought about by the Green Revolution, factional politics within the Congress and
the influence of the socialists under Rammanohar Lohia, who recognized that this group could
act as a potential source of support to unseat the Congress, all played a role in greater OBC
mobilization. The growth of backward caste political power in this period was manifested by the
increased representation of OBCs in various Bihar ministries after 1967.
The period from 1967 to 1971, however, saw considerable political instability in Bihar
with nine chief ministers and three stints of President’s rule over four years. This period also
marked the beginning of growing criminalization in Bihar’s politics and the state was to witness
considerable political violence over the next three and a half decades. The 1967 election is
considered a key date in Indian politics as it marked the first time that Congress lost power in
several states. Bihar was one of the states where the Congress lost power. Opposition disunity,
however, allowed the Congress to return to power in 1969.
General uncertainty and instability would reach a critical point in the mid-1970s.
Growing disenchantment with Indira Gandhi’s autocratic rule led to a unified opposition
movement throughout India led by Jayprakash Narayan. The greatest impact of the “JP
236
movement” was in Bihar, the home state of Narayan, and Gujarat. In response to growing
opposition, Indira Gandhi would impose a state of emergency in the country in 1975, India’s
only authoritarian stint since independence. On revoking the Emergency in 1977, the Congress
would lose power at the center for the first time but the Janata government, a motley coalition of
right and left parties, lasted only two years in office.
The Janata experiment would have a lasting impact on backward caste politics. In Bihar,
Karpoori Thakur would be a key figure representing the rise of the OBCs. Unlike lower caste
representatives before him, he was the first chief minister from an OBC background who
enjoyed considerable political clout. Though controversial, Thakur’s time in office would act as
a precursor for several transformations in Bihar’s politics that would follow in the next three
decades. He constituted a cabinet where OBCs enjoyed a preeminent position and forward caste
representation was considerably reduced. He also attempted to institute reservations in
government service for backward classes, the move provoking violent protests from upper castes.
Though Thakur would not be able to carry out his policy proposals in their entirety, his time in
office served to create an irrevocable polarization between forward and backward castes in
Bihar.
Less than three years after she lost power, Indira Gandhi enjoyed a resounding win in the
1980 elections. Bucking the trend of the OBC rise in Bihar that started in the 1970s, Indira
Gandhi chose to institute a Brahmin chief minister, Jagannath Mishra, who in turn cut back on
backward caste representation considerably (Frankel 1989a). Bihar increasingly became the site
of caste wars and considerable political instability. The political instability of the late 1970s
would descend into something even worse in the next two decades. In the 1980s, Bihar would
witness a breakdown in political order and sharp increases in violence (Kohli 1990). Kohli
237
attributes the turmoil in the state to two related struggles – a political struggle for control of the
state pitting forward against backward castes and a socioeconomic struggle of landless lower
castes against landowning forward and backward castes. All this occurred in a backdrop of
economic stagnation, high levels of corruption and deinstitutionalization of the bureaucracy,
police and other government arms. By the late 1980s, Bihar would rapidly descend into turmoil.
In certain parts of the state, the state did not even enjoy a monopoly on violence and private caste
militia had a run of the land (Kohli 1990).
4.2.4 Politics after 1990: OBC dominance and fragmentation in the post-Mandal era
The 1990s would see even more social and political churning in Bihar. Politics in north India
in the 1990s was dominated by two master narratives – “Mandal” and “Masjid”. The former,
which resulted in major shifts in the trajectory of caste politics in north India, refers to the
implementation by the V.P. Singh-led Janata Dal (JD) government in 1990 of a report calling for
reservations for OBCs in central government jobs. The latter refers to the 1992 episode when the
BJP and its allies demolished the Babri Masjid (a mosque in Uttar Pradesh); the event signifying
the extent of the rise of Hindu-nationalists in the north.
Mandal, in particular, changed the face of politics in Bihar. The implementation of the report
had two immediate but significant consequences. First, it allowed for the consolidation of OBC
political power in the immediate aftermath of the implementation of the report. The
announcement of reservations for OBCs led to a violent backlash from upper castes throughout
north India in 1990 and created a sharp polarization between upper and backward castes. This, in
turn, unified the OBCs as a group (e.g., Jaffrelot 2000, 2003; Kumar 2004; Robin 2009). The
second major change was that politics surrounding the Mandal report spurred a dramatic increase
238
in the political participation of various socially and economically-marginalized sections of
society, a phenomenon that has been referred to as India’s “second democratic upsurge” (Yadav
1999, 2002). The “plebian” politics that dominated north India after Mandal stood in stark
contrast to the patterns of forward caste dominance observed in earlier periods (Jaffrelot 2009b;
Varshney 2000). Since the Mandal Commission report, lower castes have controlled electoral
politics in both Bihar and neighboring UP.
In Bihar, post-Mandal politics resulted in a variety of realignments in social bases of political
parties. This in turn led to greater party system fragmentation and Bihar has essentially seen
extremely high levels of party fragmentation since the 1990s. The OBCs, who had been moving
away from the Congress since the 1960s, first mobilized in favor of the Janata Dal (JD) in 1990
following the implementation of the Mandal report. Their representation in the Bihar assembly
had been rising over time and the 1990 elections in Bihar marked the first time that proportion of
OBC legislators surpassed that of the upper castes (Robin 2009). At the same time, the upper
castes began moving away from the Congress towards the BJP.
The consolidation of the OBCs would not, however, last for long. Perceiving the JD to be
dominated by one particular sub-caste, the Yadavs, other upper OBC groups such as the Kurmis
and Koeris moved away from the JD by the mid-1990s. This fragmentation within the OBCs led
to the JD in Bihar splintering into various new parties. Lalu Yadav’s RJD was one of the key
parties that emerged from the split. Other notable forces that came out of the break-up were the
JD(U) and the Samata. The Samata merged with the JD(U) in 2003 to give the JD(U) its current
form.
239
The OBC fragmentation saw each of these parties representing different social bases; Yadavs
and Muslims form the core support of Lalu Prasad Yadav’s RJD while the JD (U) depends on
Kurmis, other upper OBCs and a section of Dalits (Robin 2009; Witsoe 2006). These
realignments in party bases in the 1990s hurt the Congress significantly in Bihar. Historically,
the Congress relied primarily on a coalition of extremes comprising the upper castes and the
scheduled castes. In the post-Mandal era, the Congress saw both ends of this support base being
undercut by other parties and this reduced the party to a marginal player in the state.
Post-Mandal politics also brought a new set of backward caste leaders the fore in the state. In
particular, Lalu Prasad Yadav would come to dominate Bihar politics for almost 15 years. Lalu
Yadav himself headed the Bihar government from 1990 to 1997. Following his conviction in the
‘fodder scam’ in 1997, he passed the position of chief minister on to his wife, Rabri Devi, a
housewife who until her elevation to the post had exhibited no political inclinations of any sort.
Excluding two brief spells of President’s Rule, Rabri Devi would continue at the helm for eight
years until 2005 with Lalu acting as de facto chief minister from behind the scenes.
A charismatic and controversial figure, Lalu Yadav came from a poor family of cow-herders
and faced considerable discrimination as a boy from upper castes in his village (Thakur 2006;
Witsoe 2006). He worked his way up as a student leader who shot to prominence during the JP
movement in the mid-1970s. Though Bihar was already on a downward slope when Lalu Yadav
came to power, it went into complete free fall during his tenure. The criminalization of Bihari
politics, which began in the 1970s, reached its peak in the 1990s and the state descended into
virtual lawlessness with private militias controlling many areas. Not surprisingly, considerable
outmigration also occurred during this time.
240
The government abdicated most of its development responsibilities. Instead, Yadav’s focus
was on social justice and the politics of izzat [empowerment]; one of the Janata Dal’s early
campaign slogan being “vikas nahin, samaan chahiye” or “we need dignity, not development”
(Witsoe 2006). His agenda would not result in any substantial improvements for marginalized
castes. As Witsoe points out, Lalu sought to mobilize lower castes not through policy initiatives
but by appealing to a politics of dignity and identifying himself as one of the marginalized. His
main preoccupation was to undo upper caste control, an agenda that he was explicit about both
rhetorically as well in terms of actions. This was aptly demonstrated by a slogan regularly used
by the JD – “bhurabal hatao”, which can be translated as “get rid of the upper castes.”88 It was a
play on Indira Gandhi’s 1971 famous election campaign theme, “garibi hatao” (get rid of
poverty).
Yadav came to view all development initiatives and institutions of the state as synonymous
with upper caste dominance and sought to curtail their functioning (Thakur 2007; Tripathy
2007; Witsoe 2006). He centralized the entire decision-making system of the state and virtually
no policies were formulated or implemented, particularly after his conviction in the fodder scam
in 1997. As one Bihar bureaucrat suggested: “The previous government [Lalu Prasad Yadav’s]
spent 15 years in power but it was not really following a democratic system. There were hardly
any assembly sessions. The cabinet did not meet regularly. Ministers did not meet. At one point,
the assembly had 3 sessions of 5 days. The CM took all the decisions and ministers were not free
to take any decisions.”89
88 Bhurabal is an acronym for the four twice-born castes in the state 89 Interview with an IAS officer belonging to the Bihar cadre, May 21st, 2010; New Delhi.
241
In addition, bureaucrats were virtually not allowed to make any independent decisions and
even government projects of small monetary value required Yadav’s approval. Mathew and
Moore (2011) point out that in several instances government jobs were left vacant as Lalu Yadav
preferred not to fill them rather than appoint upper caste applicants. Moreover, Bihar did not
even spend amounts allocated to the state through centrally-sponsored development schemes
(CSS). Mathew and Moore claim that this was partly by political design and related to Yadav’s
agenda of restricting upper caste dominance. In essence, policymaking came to a virtual
standstill. As another state bureaucrat explained, “The 1991-2005 period under the RJD was like
a lost period. It was really a lost 15 years. This was more so after 1995 when the fodder scam
broke out and the political system was under great pressure… One generation of officers
[bureaucrats] rotted for 15 years.”90 To some extent, the only section that benefitted in very
small measure from Lalu’s regime was his own Yadav sub-caste, who received certain targeted
state benefits.
Lalu Yadav’s social message was, however, as significant as his development failures. While
backward caste political representation began rising in Bihar since the late 1960s, Lalu Yadav
represented the pinnacle of their ascent in Bihar’s politics. As Robin (2009) shows, the
percentage of OBC members of parliament from Bihar rose from 5.5 per cent in 1952 to 37.5 per
cent in 2004. The process accelerated sharply during Yadav’s tenure. The broader social message
he represented drew large support from various marginalized sections. And this occurred despite
the fact that he failed to make any substantial improvements in the lives of these groups. By
some accounts, he even actively contributed in large measure to Bihar’s political and economic
descent.
90 Interview with a Bihar IAS officer, May 25th, 2010; Patna.
242
Lalu Yadav would, however, come to lose power in the assembly elections of 2005. The
OBC unity that existed in the aftermath of Mandal began to crumble by the mid-1990s. Other
upper OBC groups, particularly the Kurmis and Koeris, viewed Lalu Yadav’s tenure as
disproportionately benefiting the Yadavs. In the 1990 and 1995 Bihar assemblies, the proportion
of Yadavs among the RJD’s MLAs was 29.8 per cent and 36.4 per cent while Kurmis
representation was 5 and 3.5 per cent respectively (Robin 2009). In addition, Lalu’s social
message appeared to run out of steam; he no longer was able to mask his major development
failures. Standing on a platform of good governance, a coalition consisting of the JD (U) and the
BJP, led by Nitish Kumar, would come to unseat Laloo Yadav’s fifteen year hold on Bihar’s
politics.
Nitish Kumar’s tenure since 2005 has resulted in major changes in Bihar. Cracking down on
the politician-criminal nexus, his government restored law and order in the state. The JD(U)-BJP
government has also successfully prioritized various welfare schemes in health and education.
The state has seen major rise in public investment in infrastructure. The state’s industrial policy
has also attempted to attract investment by easing the regulatory structure to start and operate a
business and through some incentives and concessions. It has highlighted infrastructure
improvements in its bid to attract investors.
Bihar’s growth rates, though from an extremely low base, were over 11 per cent between
2004-05 and 2009-10. The JD (U)-BJP combine are currently in their second term, managing to
win the 2010 assembly elections in Bihar. While it is too early to judge whether the state has
permanently shifted to a new growth path, it nevertheless points to the fact that Bihar has
prioritized developmental goals after several decades. As the next section will argue, both the
243
failures of Laloo Yadav’s regime as well as the recent shifts under Nitish Kumar can be traced to
the nature of the electoral coalition backing the government.
4.2.5 From narrow-left to wide-left coalitions and subsequent outcomes
I suggest that the nature of social coalitions has played a major role in influencing Bihar’s
developmental trajectory. I argue that narrow-left coalitions, which backed Bihar governments
for most of the post-1991 period, led the state to prioritize goals other than growth. The change
in government in 2005 resulted in a shift in the underlying type of electoral coalition backing the
government. Unlike RJD governments between 1990 and 2005, which were backed by narrow-
left coalitions, JD(U)-BJP governments have been backed by wide-left ones. I argue that this
shift, in turn, can explain the policy transformation that Bihar has seen since 2005.
Though Bihar’s economic decline predates the liberalization period, the state hit its nadir in
the 1990s under RJD governments, first led by Lalu Prasad Yadav and then his wife, Rabri Devi.
Yadav came to power in the immediate aftermath of the implementation of Mandal Commission
recommendations and he represented the culmination of the OBC rise to political power, which
had begun three decades earlier. The RJD built electoral coalitions primarily around two core
groups – Yadavs and Muslims. Yadavs and Muslims account for more than 28 per cent of
Bihar’s population. In addition, sizeable Dalit support added to this core strength through the
1990s. While the RJD continues to retain an overwhelming proportion of the Yadav vote, the
Muslim vote for the party has been declining since 2004 (Kumar and Ranjan 2009).
One aspect should be emphasized. The ability of parties such as the RJD to rely on a small
set of social groups to construct electoral majorities has been aided by high levels of party
fragmentation. As can be seen in table 4.4, three-cornered contests have prevailed in Bihar since

244
1990 and this has meant that the thresholds for victory have been fairly low. In fact, the average
vote share of the party forming the government in 1990, 1995 and 2000 (JD in 1990 and the RJD
subsequently) was only 27.31 per cent. High levels of party fragmentation and low thresholds for
victory, in turn, have allowed parties to depend on narrow vote banks.
Table 4.4: Vote shares of parties in Bihar Assembly elections after 1990
Election RJD/JD* BJP JD(U)/Samata*
INC
1990 25.61 11.61 24.78
1995 27.98 12.96 7.06 16.27
2000 28.34 14.64 15.12 11.06
2005 (October) 23.45 15.65 20.46 6.09
2010 18.84 16.49 22.58 8.37
Source: 1990 to 2005 data from the Election Commission of India (eci.nic.in).
*Splits in the JD in 1994 led to the formation of the RJD, JD(U) and Samata. The Samata party merged with the JD(U) in 2003 to form the current JD(U). Votes in the last column are as follows: 1995 – vote share of the Samata; 2000 - combined vote share of the JD(U) and Samata; 2005 and 2010 – vote share of the JD(U).
Table 4.5: Vote Choice By Social Group (Bihar Assembly Elections 2000)
INC BJP RJD JD(U)-Samata Others N
Others 16.67 33.33 33.33 0.00 16.67 6 Muslims 7.01 6.54 57.48 1.87 27.10 214 Dalits 9.48 31.50 32.42 7.34 19.27 327 Adivasis 37.84 12.61 6.31 0.00 43.24 111 Other OBCs 6.13 27.47 27.47 16.53 22.40 375 Yadavs 1.94 3.88 79.61 5.34 9.22 206 Kurmis-Koeris 5.88 28.43 24.02 29.90 11.76 204 Upper castes 15.14 38.29 10.29 22.86 13.43 350
Source: Calculated using data from the Centre for the Study of Developing Societies (CSDS) post-poll survey of the Bihar Assembly elections, 2000.

245
Table 4.6: Social identity and voter attachments in Bihar in Lok Sabha elections (Percentage of vote by social group)
Congress BJP-Samata JD/RJD
1991 1996 1998 1991 1996 1998 1991 1996 1998
Upper
castes 32 10 9 25 60 78 14 29 12
Yadavs 8 2 8 4 16 18 88 81 86
Kurmis and
Koeris 28 5 24 40 74 56 28 18 18
OBCs 32 3 - 26 41 23 32 50 23
Lower
OBCs 29 11 8 57 63 45 37 36 12
Dalits 19 19 14 2 25 25 32 31 24
Adivasis 27 24 70 - 34 8 8 28 -
Muslims 29 23 15 - 6 4 40 69 60
Source: Kumar (2004), table 7
The dependence of parties on specific social groups is evident in tables 4.5 and 4.6. The
upper castes vote in large numbers for the BJP while the RJD depended on Yadavs and Muslims.
In the 1990s, the RJD’s core Muslim-Yadav support was supplemented by Dalit support. These
three groups constitute the most marginalized sections of society. I classify this coalition as
narrow-left since it consists of similarly placed poor groups and business representation is
minimal. The lack of business representation can be traced to the fact that a strong indigenous
capitalist class never developed in Bihar and the only business groups that operated came from
outside the state (Gupta 1981).
246
In general, narrow-left coalitions are likely to favor a redistributive policy agenda over other
priorities. In the case of Bihar, centuries of extreme caste discrimination meant that the politics
of social justice took precedence over redistributive measures. A strong rhetoric of social justice
was utilized by RJD governments between 1990 and 2005 but there were virtually no substantive
development efforts, including redistributive ones. As Thakur (2007) suggests, Laloo Yadav
gave “social and political consciousness to a huge section that remained arrested on the fringes…
Laloo Yadav’s stunted backward revolution acted as a release valve on pent-up pressures that for
hundreds of years had been building up in Bihar’s iniquitous and exploitative social structure.”
The long history of upper caste dominance meant that message of empowerment played
strongly to the marginalized sections that comprised the narrow-left coalition. Moreover, Lalu
Yadav’s personal charisma and strategy of portraying himself as one of the marginalized against
a larger upper caste enemy was electorally effective (Mathew and Moore 2011; Witsoe 2006).
To a large extent, this overshadowed the lack of governance and rapid economic decline that
Lalu Yadav presided over. In general, growth is unlikely to be prioritized by governments
backed by narrow-left coalitions, which are more likely to be oriented towards redistributive
concerns. In the presence of extreme social exclusion that Bihar had historically witnessed, the
politics of dignity overtook all other concerns, even tangible redistributive policies.
If narrow-left coalition in Bihar between 1990 and 2005 can explain the low priority
accorded to growth in that period, the policy shifts after 2005 under JD(U)-BJP governments can
be traced to a change in the underlying electoral alliance. The alliance between Nitish Kumar’s
JD (U) and the BJP has been termed a “rainbow” coalition. Two important upper OBCs, the
Kurmis and Koeris, form the core social base of the JD (U). In addition, Nitish Kumar managed
to cut into the Dalit and Muslim base of Laloo Yadav’s RJD (Kumar and Ranjan 2009). By

247
targeting the poorest sections of the Dalits, the “Mahadalits”, through welfare schemes, Nitish
Kumar has successfully attempted to create a new cleavage and fragment the Dalit vote. The JD
(U)-BJP alliance also receives overwhelming support from the upper castes, who have been
consistent supporters of the BJP since the early 1990s.
The electoral base coalitions backing the JD (U)-BJP government exemplify wide-left
coalitions. A variety of groups with diverse socioeconomic interests are represented in this
coalition, including the poorest sections of Dalits on one end and the upper castes on the other.
The size of the local capitalist class is very small and Bihar never saw a robust development of
indigenous capital as other Indian states. Inasmuch as local business and trading interests exist,
these groups largely support the BJP. Nitish Kumar campaigned on a platform of good
governance and development. Unlike his predecessor, his government has prioritized a variety of
developmental goals reflective of the range of economic interests encompassed within his
coalition. These policy initiatives include considerable public investment in infrastructure, a
focus on health and education and easing the regulatory structure for business.
4.2.6 Explaining the emergence of electoral coalitions in Bihar
While identity has been a central feature of electoral politics in many Indian states, few
states can match Bihar in the extent of caste polarization. The centrality of caste has been a
constant feature in Bihar’s politics. As in the other case studies, caste has affected both party
strategies and voter attachments in Bihar. I first highlight the effect of social cleavages on party
strategies and then the link between caste and voter decisions.

248
4.2.6.1 Social cleavages and party strategies
Hindi-heartland patterns characterize Bihar’s social structure. As explained earlier, this
pattern is characterized by the presence of large yet economically-weak groups. The presence of
large caste groups has allowed politicians to construct coalitions around these sections. In
particular, increasing political fragmentation since the 1990s has resulted in parties depending on
specific vote banks. Till 2005, the RJD relied primarily on the Yadavs and Muslims. The JD(U)-
BJP coalition has combined the complementary Kurmi-Koeri base of the former with upper caste
support of the latter. In addition, this core support of the JD(U)-BJP has been supplemented by
Dalit and Muslim support.
In general, Bihar’s underlying caste structure makes it possible for parties to rely on
fewer social groups in constructing electoral coalitions. High levels of party fragmentation in the
1990s have intensified this trend. The RJD has targeted Yadavs and Muslims, both sizeable
groups. Despite the disproportionate reliance on these two groups, the RJD managed to win
elections through the 1990s, aided by high levels of party system fragmentation. The JD(U) and
the BJP individually depend on specific social groups. However, neither the Kurmi-Koeri base of
the JD(U) nor the upper caste base of the BJP alone is sufficient to ensure electoral majorities.
This has led to a coalition arrangement. The combination of the complementary bases of the two
parties has proved to be electorally successful. In addition, one structural feature explains low
levels of business representation in Bihar’s electoral coalitions. Bihar’s entrepreneurial base is
extremely thin. As a result, minimal business representation has been the norm.
The timing of narrow-left coalitions in the 1990s was a product of a longer history of
electoral realignments. Until 1967, Congress dominance was characterized by upper caste
249
control of politics and the main lines of competition were between factions of upper caste elites.
Lower castes were mobilized through vertical patronage chains. The initial challenge to upper
caste dominance would come from the backward castes in the 1960s. Prior to the 1960s, OBCs
had been part of vertical patronage chains within the Congress.
The numerical strength of OBCs made them an attractive target for parties. In the 1960s,
the socialists under Rammanohar Lohia would recognize that consolidated OBC support could
be effective in challenging the Congress. The socialists mobilized the group through calls for
reservations in employment, education and offering tickets to OBC and Dalit candidates
(Jaffrelot 2000). In addition, improvements in the economic status of certain upper OBC sections
due to the Green Revolution meant that these groups were ripe for independent mobilization in
the 1960s. Lohia’s message played out strongly in Bihar and a coalition of Lohia’s SSP and other
backward caste groups defeated the Congress for the first time in the 1967 elections. After 1967,
the Congress would have considerable trouble holding on to the OBCs throughout the Hindi
heartland.
Polarization between the backward and forward castes would set the stage for the next
series of major political changes. This would occur in the mid-1970s in the form of growing
opposition to Indira Gandhi’s dictatorial tendencies. The opposition would be spearheaded by
veteran Gandhian Jayaprakash Narayan, who returned to active politics to lead the movement.
The movement eventually led to the victory of the Janata in 1977, both in Bihar and at the center.
In Bihar, OBCs played a prominent role in the Janata’s victory. For the first time, in Karpoori
Thakur, Bihar would have a backward caste chief minister who enjoyed considerable political
strength. OBC representation in government increased significantly under Thakur. Though the
250
Congress managed to retain power in Bihar through the 1980s, it was clear that its hold was
weakening in the face of growing OBC political power.
The decisive moment in the upward rise of the OBCs in Bihar came in the aftermath of
the Janata Dal’s decision to implement the Mandal Commission report in 1989. Violent anti-
Mandal protests led to a sharp polarization between upper castes and OBCs in north India. This
had the effect of mobilizing OBCs as a single cohesive group under the Janata Dal. Lalu Yadav
would emerge as the leader of the “silent revolution” of subaltern groups in Bihar. For over 15
years, he was effectively at the political helm of Bihar backed by a narrow-left coalition,
comprising primarily of Yadavs and Muslims. Though this coalition would emerge in Bihar only
in the 1990s, its origins had its roots in broader political shifts that began in the 1960s.
The RJD would be defeated in 2005 and 2010 by the JD(U)-BJP coalition. JD(U)-BJP
governments have been backed by wide-left coalitions. Two political trends in the 1990s have
been central to the emergence of wide-left coalitions since 2005 – OBC fragmentation and the
consolidation of the upper castes. OBC consolidation behind the JD in the early 1990s proved
temporary. Alienated by the Yadav caste’s domination of the JD, other backward castes such as
the Kurmis and Koeris moved away from the party. At the same time that changes in OBC
politics were taking place in the aftermath of Mandal, upper castes moved away from the
Congress to the BJP.
Both OBC fragmentation and upper caste consolidation behind the BJP would play a part
in the emergence of wide-right coalitions since 2005. OBC fragmentation would lead to the
break-up of the JD into several parties in the mid-1990s, notably the RJD and the Samata Party.
The Samata would then be joined by a few other factions, leading the creation of the JD (U) in

251
2003. The JD(U) would build its base around the Kurmis and Koeris. A sole dependence on the
Kurmis and Koeris is not sufficient to construct winning majorities. As a result, the JD(U) has
entered into a coalition arrangement with the BJP. The complementary bases of the JD(U) and
BJP has, in turn, proved electorally effective.
4.2.6.2 Voter attachments in Bihar
As described in the previous section, the ability of parties to rely on specific vote banks
in Bihar has been supported from below by voter behavior. Caste has been a critical driver of
voter attachments in Bihar. As tables 4.5 and 4.6 show, there is a high degree of correlation in
the voting decisions of individuals belonging to particular social groups. Yadavs and Muslims
have supported the RJD while upper castes have been loyal to the BJP. In addition, the Kurmis
and Koeris form the core base of the JD(U).
In this section, I examine voter attachments relative to other factors using survey data
from the 2000 Bihar Assembly elections. A multinomial logit regression of vote choice on age,
gender, class (proxied by education), locality and social group was run. As in the cases of the
other three states, social group was a categorical variable that was constructed based on caste and
religion. Smaller values on this variable represent positions lower on the traditional social
hierarchy.
Table 4.7 presents the results of this regression. Vote for the BJP is used as the reference
category. As the results suggest, social identity is a significant factor in explaining vote choice
for all parties relative to the BJP. In 2000, the RJD and the Congress attracted support from more
socially-marginalized groups than the BJP. The Samata-JD(U) attracted groups that were higher
on the social scale. Relative to the BJP, all other parties also tended to attract support from rural
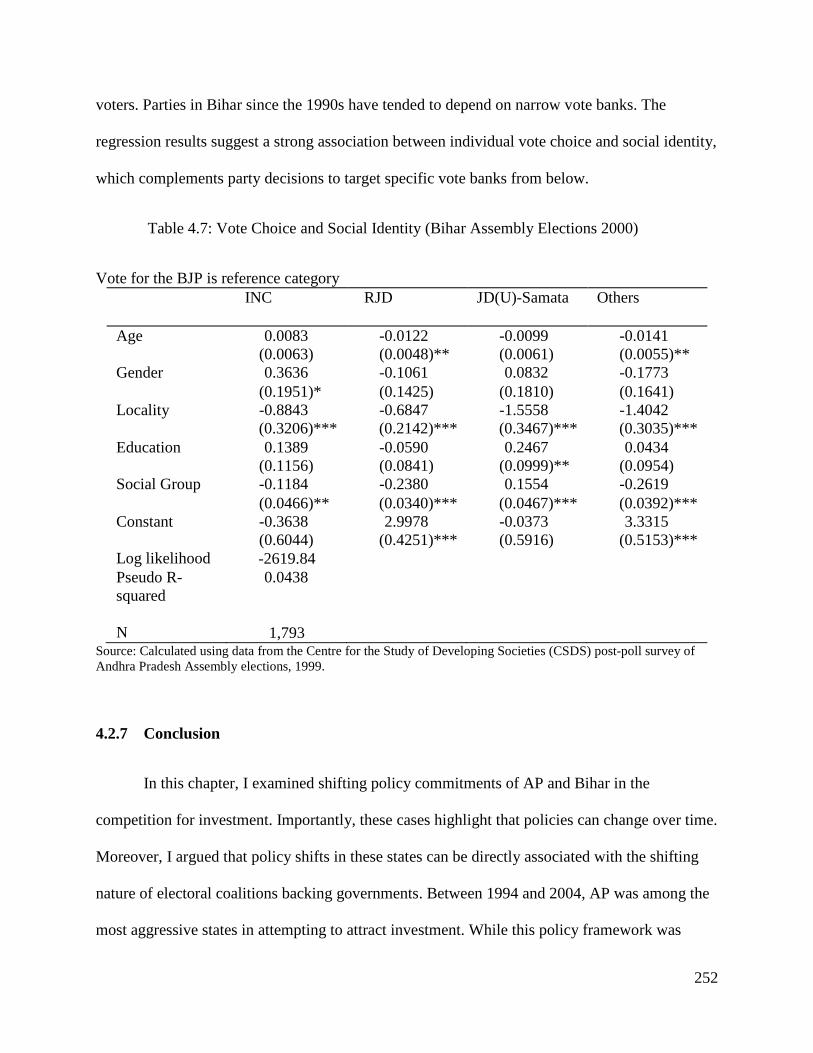
252
voters. Parties in Bihar since the 1990s have tended to depend on narrow vote banks. The
regression results suggest a strong association between individual vote choice and social identity,
which complements party decisions to target specific vote banks from below.
Table 4.7: Vote Choice and Social Identity (Bihar Assembly Elections 2000)
Vote for the BJP is reference category INC RJD JD(U)-Samata Others
Age 0.0083 -0.0122 -0.0099 -0.0141 (0.0063) (0.0048)** (0.0061) (0.0055)** Gender 0.3636 -0.1061 0.0832 -0.1773 (0.1951)* (0.1425) (0.1810) (0.1641) Locality -0.8843 -0.6847 -1.5558 -1.4042 (0.3206)*** (0.2142)*** (0.3467)*** (0.3035)*** Education 0.1389 -0.0590 0.2467 0.0434 (0.1156) (0.0841) (0.0999)** (0.0954) Social Group -0.1184 -0.2380 0.1554 -0.2619 (0.0466)** (0.0340)*** (0.0467)*** (0.0392)*** Constant -0.3638 2.9978 -0.0373 3.3315 (0.6044) (0.4251)*** (0.5916) (0.5153)*** Log likelihood -2619.84 Pseudo R-squared
0.0438
N 1,793
Source: Calculated using data from the Centre for the Study of Developing Societies (CSDS) post-poll survey of Andhra Pradesh Assembly elections, 1999.
4.2.7 Conclusion
In this chapter, I examined shifting policy commitments of AP and Bihar in the
competition for investment. Importantly, these cases highlight that policies can change over time.
Moreover, I argued that policy shifts in these states can be directly associated with the shifting
nature of electoral coalitions backing governments. Between 1994 and 2004, AP was among the
most aggressive states in attempting to attract investment. While this policy framework was

253
surprising given AP’s middling performance in the pre-1991 era, I suggested that the state’s pro-
business orientation could be linked to narrow-right coalitions that backed TDP governments. In
particular, the economic interests of the Kammas favor the prioritization of investor-friendly
policies.
Rural neglect, however, proved to be the TDP’s electoral downfall in 2004. Congress
governments that came to power in 2004 and 2009 have been backed by wide-right coalitions.
These coalitions consist of groups with a wide range of economic profiles. Rural interests are
also strongly represented. As a result of these diverse interests and greater pressure for
redistributive measures, Congress governments since 2004 have adopted a more muted approach
to investment promotion. AP’s case offers some parallels with Gujarat. Both states are
characterized by dominant caste patterns that include large, entrepreneurial social groups. These
patterns have driven the emergence of narrow-right coalitions in both states. However, I
suggested there were key differences between the two states. In particular, AP’s social structure
makes narrow-right coalitions less stable than those in Gujarat. Voter attachments also
demonstrate more fluidity. Both these factors account for the shifting nature of electoral
coalitions in AP.
Perhaps no other case in India demonstrates the possibilities of policy change better than
Bihar. For most of the post-1991 period, Bihar witnessed the break-down of state authority.
Predictably, economic development initiatives were firmly on the backburner. RJD governments
backed by narrow-left coalitions relied on a strong rhetoric of social justice. But this rhetoric was
accompanied by few substantive policy efforts of note. A change in government in 2005 has
resulted in a marked change in Bihar’s commitment to economic development in general. The
state has prioritized a variety of development goals. It has also been considerably more proactive
254
in attempting to attract investment. I suggest that this surprising transformation can be linked to
wide-right coalitions that have backed JD(U)-BJP governments since 2005. In contrast to
narrow-left coalitions that backed RJD governments, wide-right coalitions represent a broader
range of economic interests. The JD(U)-BJP’s economic agenda is representative of these
diverse interests.
The emergence of these types of electoral coalitions in Bihar can be explained by two
different factors. Hindi-heartland patterns have influenced party strategies; the presence of large
caste groups provides strong incentives for parties to rely disproportionately on the support of a
small set of social groups. This dependence on specific vote banks has been aided by high levels
of party system fragmentation. High fragmentation has meant that thresholds for electoral victory
are relatively low in Bihar. As a result, parties can come to power despite relying on narrow
coalitions. The critical influence that caste has on voter attachments in Bihar has complemented
party strategies.
255
5. Chapter 5: Expanding the scope of analysis
In an attempt to gain analytical leverage from multiple research strategies, this dissertation
follows Lieberman (2005) in employing a nested research design that combines both qualitative
and quantitative techniques. The “model-building” cases of Gujarat, Punjab, Andhra Pradesh and
Bihar in chapters 3 and 4 formed the meat of the dissertation. In-depth analyses of those four
states allowed me to inductively develop the key causal mechanisms of the main argument. The
four cases illuminated the role played by electoral coalitions in influencing policy responses. In
turn, I suggested that origins of electoral coalitions can be traced to varied social cleavage
patterns across these four states.
In this chapter, I build on the insights developed in the model-building cases and test the
main hypothesis on a broader group of Indian states using a quantitative framework. Specifically,
I assess the generalizability of the first stage of the argument – the link between electoral
coalitions and policies – using a time-series cross-section (TSCS) analysis on a broader sample
of 14 major Indian states between 1992 and 2010.91 Apart from forming the “model-testing”
portion of my analysis, the quantitative framework in this chapter allows me to juxtapose and
evaluate my argument against several alternative and additional theories in a succinct fashion.
Before outlining the details of the empirical strategy and results, it is worth reiterating the
gist of the central argument and the conclusions of the case studies in chapters 3 and 4. This
dissertation advances a two-stage argument. First, I suggest that different configurations of
electoral coalitions explain varied policy outcomes in the competition for investment across
91 The dataset used comprises 14 states. In most regressions, only 13 states are included in the analysis due to the lack of availability of the colonial heritage variable (proportion of each state under a non-zamindari tenure system) for Kerala. The data for this variable is obtained from Banerjee and Iyer (2005) and data for Kerala is not available in their dataset.
256
Indian states. Based on two dimensions – the socio-economic profile of core groups and extent of
business incorporation – I classified electoral coalitions into narrow-right, narrow-left, wide-right
and wide-left types. I argued that narrow-right coalitions, comprising social groups with a
confined, economically-advanced profile and substantial business representation, were most
conducive to business-friendly policies. Having drawn a link between electoral coalitions and
policy outcomes, the second stage of my argument offered a social origins explanation for the
emergence of different types of coalitions. Specifically, I suggested that certain types of electoral
coalitions in India were more likely to emerge under particular social cleavage patterns.
The case studies of Gujarat, Punjab, Andhra Pradesh and Bihar highlighted the specific
mechanisms of this two-stage argument. While narrow-right coalitions backing governments in
Gujarat allowed the state to prioritize and advance an investor-friendly agenda since 1991, wide-
right coalitions in Punjab can be associated with its sluggish policy response. In chapter 4, I
argued that temporal changes in the policy commitments of AP and Bihar could be linked to a
shift in the type of electoral coalitions backing state governments. The move from narrow-left to
wide-left coalitions led to improved policy outcomes in Bihar while the change from narrow-
right to wide-right coalitions resulted in AP’s declining commitment to a pro-business agenda. In
chapters 3 and 4, I also traced the origins of electoral coalitions to the distinct nature of social
cleavages in the four states.
The main testable prediction arising from the first-stage of my argument is that governments
backed by narrow-right coalitions are likely to be most conducive to pro-business policies. In
addition, I expect a rank-order in the likelihood of different types of coalitions adopting investor-
friendly policies. I expect that narrow-left coalitions to be least likely to adopt an investor-
friendly agenda followed by wide-left and then wide-right coalitions. The quantitative analysis in
257
this chapter provides overall support for these predictions. In particular, there is strong support to
suggest that narrow-left coalitions are not conducive to an investor-friendly agenda. This finding
holds across different empirical specifications, even when a variety of other factors are
controlled for. The next section provides details of the data used, section 5.2 outlines the
empirical strategy and 5.3 describes the results.
5.1. Data
I constructed a dataset of economic and political variables for fourteen Indian states between
1992 and 2010.92 These states are the most populous in India. They are also classified as
“general category” states under India’s system of fiscal federalism and are subject to an identical
set of rules with regard to financial transfers from the central government.93 The states included
in the sample are AP, Bihar, Gujarat, Haryana, Karnataka, Kerala, Madhya Pradesh,
Maharashtra, Orissa, Punjab, Rajasthan, Tamil Nadu, Uttar Pradesh and West Bengal. According
to the 2011 Census, almost 88 per cent of the Indian population (approximately 1.05 billion
people) lived in these states.
5.1.1. Dependent variable
In chapter 2, I undertook an extensive comparison of investment promotion policies
across the four case study states along mutliple dimensions. The detailed comparison in that
chapter was based in large part on data derived from fieldwork, particularly from policy
92 As mentioned later in the chapter, some regressions are run on 13 of the 14 states due to lack of data on the colonial heritage variable. 93 India’s system of fiscal federalism divides states into two categories – “general category” and “special category.” States included in the general category comprise almost 95 per cent of India’s population. Compared with general category states, special category states receive a greater proportion of fiscal transfers from the central government in the form of grants and a smaller portion in the form of loans due to reasons such as geographic location. Given the distinct nature of institutional arrangements in special category states, they are excluded on grounds of non-comparability. Typically, public finance studies in India analyze the two categories separately as incentives for policymakers are likely to differ given different fiscal arrangements.

258
documents and interviews. Though ideal, such fine-grained analysis of policy measures is not
feasible for a broader sample of states. In light of this constraint, the dependent variable is
operationalized through state expenditures on industry in the quantitative analysis presented in
this chapter. In particular, two proxies – per capita expenditure on industry and expenditure on
industry as a proportion of total expenditure – are alternately used as dependent variables in the
regressions.94
To be certain, expenditures on industry do not encompass all policy dimensions that
matter to investors. However, they act as an effective proxy of policy performance across Indian
states and I chose to rely on industrial expenditures as the dependent variable for several reasons.
Most importantly, expenditures on industry are an objective, publicly-available measure of
policy intentions towards business. Expenditures are comparable across states. A second
advantage of using expenditures on industry is related to data availability and coverage. Unlike
several other variables, expenditure data is available from the Reserve Bank of India for all states
in the dataset through the entire post-liberalization period. In some cases, state investment
promotion agendas have shifted over time and expenditures on industry offer the potential to
analyze temporal changes. In using expenditures as a proxy for policy intentions, I follow several
studies in the the comparative political economy literature (e.g.,Chhibber and Nooruddin 2004;
Lieberman 2009).
One clarification should be mentioned here. Off-the-shelf composite indicators such as
the World Bank’s Doing Business Indicators (WorldBank and InternationalFinanceCorporation
2009) or the Economic Freedom index of Indian states (Debroy et al. 2013) were not used for 94 Expenditure refers to revenue expenditure in this chapter. These relate to the revenue account of state governments. Nooruddin and Chhibber (2008) suggest that this is the portion of expenditures on which state governments in India enjoy discretion. They suggest that state governments do not have complete discretion over funds in the capital account. I use only revenue expenditures on industry for this reason.

259
several conceptual and practical reasons. For a start, most of these composite policy indices are
available only at a particular point in time and do not allow for analysis over time. More
importantly, these indices conflate state capacity with policy intentions, which is problematic in
the context of this dissertation.95 Reading policy intentions from these composite measures can
potentially lead to inaccurate inferences. Expenditures on industry, in contrast, are a closer
approximation of policy priorities towards business and are therefore used as the dependent
variable in the analysis that follows. Figures 5.1 and 5.2 show the variation across Indian states
in per capita expenditures on industry as well as the proportion of total expenditure spent on
industry.
95Composite indices such as the Economic Freedom index (Debroy et al. 2013) include numerous measures intended to capture both state capacity and policy intentions. While this poses no theoretical difficulty for their analysis, it is not suitable for use here since the dissertation aims to focus on policy intentions. For example, Debroy et al. calculate an equally-weighted index consisting of a long list of policies including property rights, labor environment and taxes. Conceptually, it is unclear whether the specific operationalization of these measures reflects state capacity or policy inclinations. For example, in lieu of the availability of data on tax rates across Indian states, Debroy et al. use the amount of taxes collected (as a proportion of total revenue) as a proxy for tax policies. Reading tax policy intentions from the amount of taxes collected is problematic for the purposes here. In particular, several states identified in some qualitative studies as having weak policy frameworks appear to be “pro-business” because of low amount of taxes collected. This is misleading since low tax collection could potentially be an outcome of either weak state capacity or low tax rates. Given broader trends, low tax collection in poorer Indian states is more likely a symptom of low state capacity than pro-business policies.

260
Figure 5.1: Per Capita Expenditure on Industry Across States, 1992-2010
0.0
005
.001
.001
50
.000
5.0
01.0
015
0.0
005
.001
.001
50
.000
5.0
01.0
015
199219
9319
9419
9519
9619
9719
9819
9920
0020
0120
0220
0320
0420
0520
0620
0720
0820
0920
1019
9219
9319
9419
9519
9619
9719
9819
9920
0020
0120
0220
0320
0420
0520
0620
0720
0820
0920
1019
9219
9319
9419
9519
9619
9719
9819
9920
0020
0120
0220
0320
0420
0520
0620
0720
0820
0920
1019
9219
9319
9419
9519
9619
9719
9819
9920
0020
0120
0220
0320
0420
0520
0620
0720
0820
0920
10
199219
9319
9419
9519
9619
9719
9819
9920
0020
0120
0220
0320
0420
0520
0620
0720
0820
0920
1019
9219
9319
9419
9519
9619
9719
9819
9920
0020
0120
0220
0320
0420
0520
0620
0720
0820
0920
10
AP Bih Guj Har
Kar Ker MP Mah
Ori Pun Raj TN
UP WB
Pe
r C
apita
Exp
endi
ture
on
Indu
stry
(in
ru
pees
)
Per Capita Expenditure on Industry
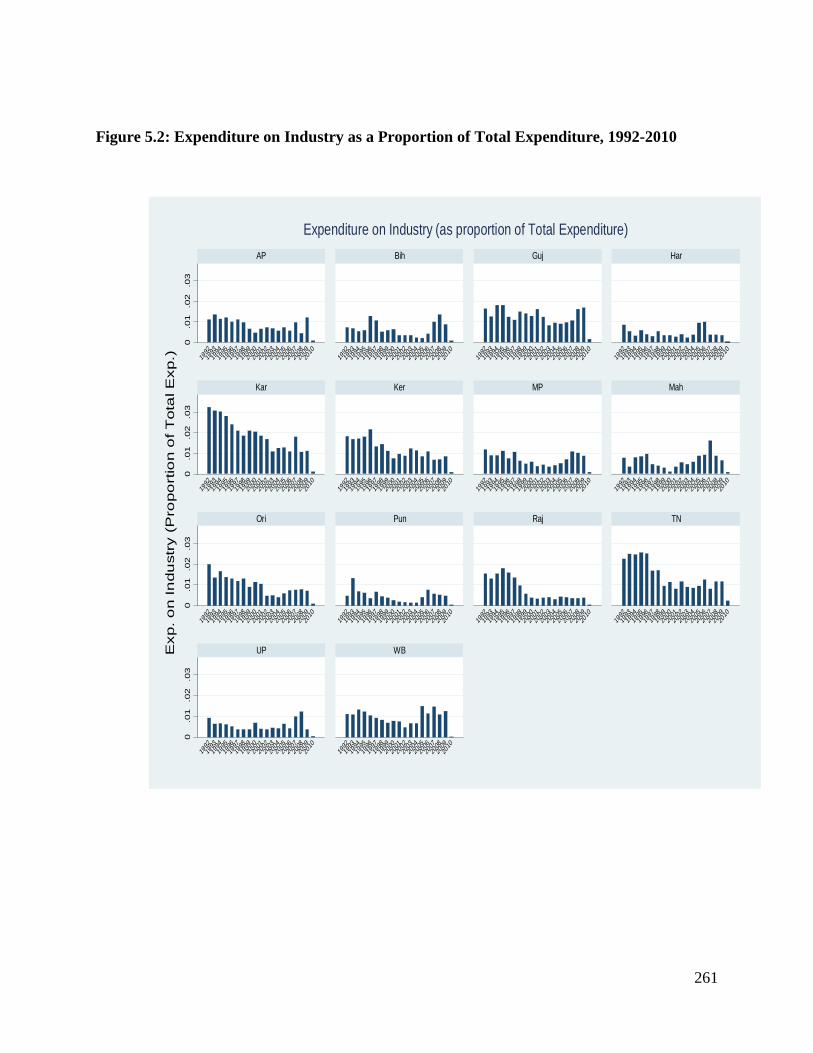
261
Figure 5.2: Expenditure on Industry as a Proportion of Total Expenditure, 1992-2010
0.0
1.0
2.0
30
.01
.02
.03
0.0
1.0
2.0
30
.01
.02
.03
199219
9319
9419
9519
9619
9719
9819
9920
0020
0120
0220
0320
0420
0520
0620
0720
0820
0920
1019
9219
9319
9419
9519
9619
9719
9819
9920
0020
0120
0220
0320
0420
0520
0620
0720
0820
0920
1019
9219
9319
9419
9519
9619
9719
9819
9920
0020
0120
0220
0320
0420
0520
0620
0720
0820
0920
1019
9219
9319
9419
9519
9619
9719
9819
9920
0020
0120
0220
0320
0420
0520
0620
0720
0820
0920
10
199219
9319
9419
9519
9619
9719
9819
9920
0020
0120
0220
0320
0420
0520
0620
0720
0820
0920
1019
9219
9319
9419
9519
9619
9719
9819
9920
0020
0120
0220
0320
0420
0520
0620
0720
0820
0920
10
AP Bih Guj Har
Kar Ker MP Mah
Ori Pun Raj TN
UP WBExp. o
n In
du
stry
(P
ropo
rtio
n o
f T
ota
l Exp.)
Expenditure on Industry (as proportion of Total Expenditure)

262
5.1.2. The key independent variables: coalition types
The main independent variables of interest are the four types of electoral coalitions –
narrow-left, narrow-right, wide-left and wide-right. In the analysis that follows, coalition types
are operationalized as dummy variables. The coding of coalition types was primarily based on
the secondary literature. In particular, I relied substantially on electoral studies in each of the
states to identify the social bases of support of political parties. The literature on business history
in India was used to identify the nature of business groups in each state. The appendix to the
chapter includes all sources used and a descriptions of political trends on which the coding was
based.
I coded electoral coalitions in the following manner. For each of the states, I first
identified various governments in office in the 1992-2010 period and ascertained the
party/parties that constituted these governments. In most cases, a new government assumed
office after assembly elections. It should be noted that there are several cases of mid-term
elections in the period under study. While most new governments came to power after elections,
there are rare instances where legislative arrangements resulted in a change in government
without elections.96 I take into account each change in government whether this occurred due to
elections or otherwise.
Having identified the party/parties that headed governments in each of the fourteen states
in the 1992-2010 period, I then proceeded to evaluate the social base of electoral support for the
ruling party/parties. For each state, core social groups are operationalized on the basis of support
96 For example, the Congress –JD(S) coalition formed the government in Karnataka after the 2004 assembly elections. In 2006, the JD(S) ended its coalition arrangement with the Congress and instead formed a coalition with the BJP. The JD(S)-BJP coalition then governed Karnataka until assembly elections in 2008. I account for both changes in government and code coalition type separately for the Congress-JD(S) government and the subsequent JD(S)-BJP one.
263
for a particular ruling party/ruling coalition in each assembly election in that state between 1991
and 2010. Core groups are identified as sections that voted substantially for the winning party/
parties in a given election. Based on two criteria – diversity of socioeconomic profile of core
groups and extent of business incorporation – coalitions were then classified into the four types
described in chapter 1. In particular, the following questions were used to code coalition types:
1) Is the socio-economic profile of social groups in the coalition confined or diverse? If confined,
the coalition is coded as narrow. If diverse, then it is coded as wide; 2) Is there substantial
business representation in the coalition? If yes, the coalition is classified as right. It is classified
as left otherwise. The coalition types are operationalized as dummy variables in the regressions.
The coding for electoral coalition type is constant through a particular government’s term. As
mentioned earlier, government terms typically coincide with election cycles.97
A detailed explanation of the coding for each state as well as a list of sources used is
presented in the appendix to this chapter. Table 5.10 in the appendix summarizes the
classification of electoral coalitions across the fourteen states in the 1992-2010 period. Notes
explaining the coding of each state accompany table 5.10.
5.1.3. Controls
To test the relevance of my argument against other theories, I include a variety of
political, economic and institutional control variables in the regressions. Poorer regions may
have to adopt a more pro-business agenda to overcome initial disadvantages. I control for any
possible effects of initial economic development by including per capita income of each state in
97 In cases where the state was under President’s Rule, the electoral coalition type immediately prior to the imposition of President’s Rule is used. Periods of President’s Rule are typically, however, brief.
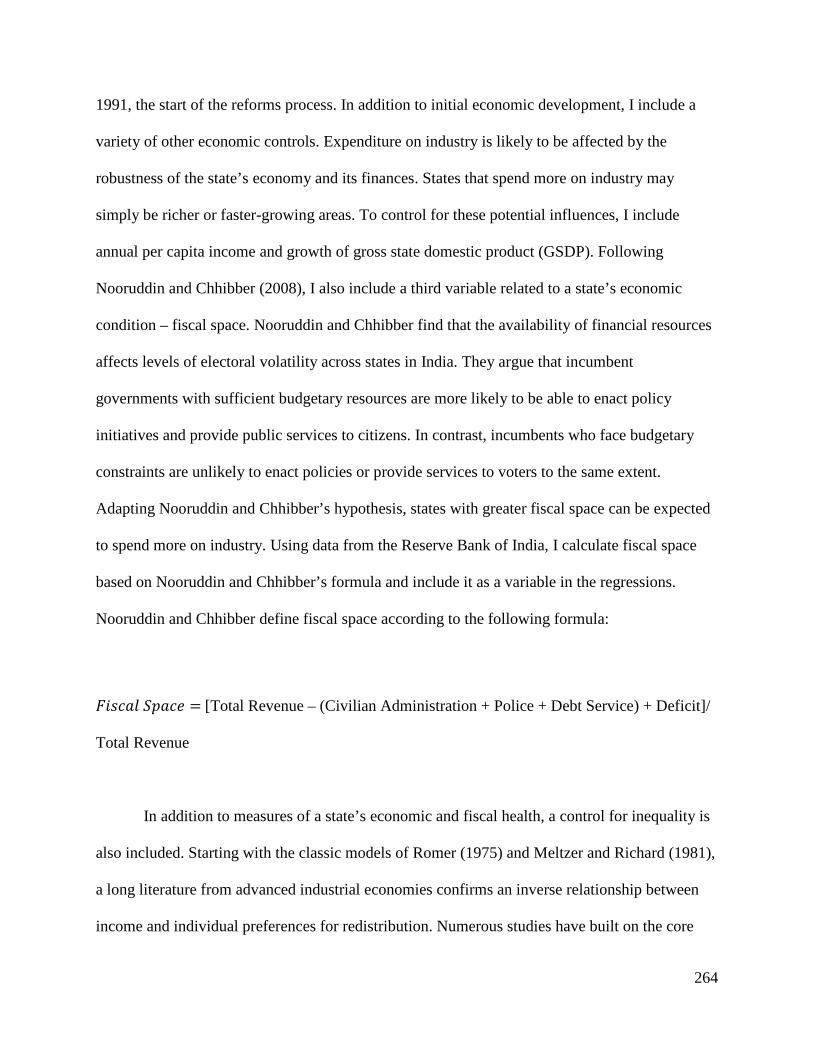
264
1991, the start of the reforms process. In addition to initial economic development, I include a
variety of other economic controls. Expenditure on industry is likely to be affected by the
robustness of the state’s economy and its finances. States that spend more on industry may
simply be richer or faster-growing areas. To control for these potential influences, I include
annual per capita income and growth of gross state domestic product (GSDP). Following
Nooruddin and Chhibber (2008), I also include a third variable related to a state’s economic
condition – fiscal space. Nooruddin and Chhibber find that the availability of financial resources
affects levels of electoral volatility across states in India. They argue that incumbent
governments with sufficient budgetary resources are more likely to be able to enact policy
initiatives and provide public services to citizens. In contrast, incumbents who face budgetary
constraints are unlikely to enact policies or provide services to voters to the same extent.
Adapting Nooruddin and Chhibber’s hypothesis, states with greater fiscal space can be expected
to spend more on industry. Using data from the Reserve Bank of India, I calculate fiscal space
based on Nooruddin and Chhibber’s formula and include it as a variable in the regressions.
Nooruddin and Chhibber define fiscal space according to the following formula:
𝐹𝑖𝑠𝑐𝑎𝑙 𝑆𝑝𝑎𝑐𝑒 = [Total Revenue – (Civilian Administration + Police + Debt Service) + Deficit]/
Total Revenue
In addition to measures of a state’s economic and fiscal health, a control for inequality is
also included. Starting with the classic models of Romer (1975) and Meltzer and Richard (1981),
a long literature from advanced industrial economies confirms an inverse relationship between
income and individual preferences for redistribution. Numerous studies have built on the core
265
Meltzer-Richards logic and tested whether higher inequality leads to greater redistribution.98 As
such, we might expect states with higher inequality in India to focus more on a redistributive
agenda and less on pro-business policies. To control for any potential effects of inequality,
consumption GINI coefficients are included in the regressions.99
A growing literature in the Indian context links colonial institutions to a variety of current
development outcomes. Banerjee and Iyer (2005) find that areas previously under the zamindari
land tenure system exhibit significantly lower levels of investment, agricultural productivity, and
health and education outcomes when compared with non-zamindari regions. To control for
colonial heritage, I use data from Banerjee and Iyer’s paper and include the proportion of non-
zamindari regions in each state.
Several studies both within and outside the Indian context argue that political competition
affects economic policies and public goods provision (e.g., Besley et al. 2010; Chhibber and
Nooruddin 2004; Murillo and Martinez-Gallardo 2007). Besley et al. examine states in the US
and find that higher political competition is associated with “pro-business and growth-
promoting” policies. Murillo and Martinez-Guillardo find that legislative majorites and
ideological polarization influenced the adoption of infrstructure policy reforms in Latin America.
In the Indian context, Chhibber and Nooruddin argue that party system fragmentation can be
linked to public goods provision across India; they find that states with two-party competition
provide more public goods than those with multi-party competition. To account for the effects of
political competition, I include two different measures. To control for the intensity of electoral
competition, I include a variable, vote margin, which is the difference in vote share of the single
98 For a review of this literature, see Lupu and Pontusson (2011) 99 Official poverty and inequality statistics in India are calculated on the basis of consumption. These are based on household surveys. The rural consumption GINI is used in the regressions.

266
largest party and the second largest party in a given state assembly election. I also control for
party system fragmentation given Chhibber and Nooruddin’s (2004) finding. I calculated the
effective number of parties (ENP) in each state election and include it in the set of independent
variables. Finally, I also included a control for length of government term since this varies in the
dataset and coalition type remains constant during a particular government term.100
Table 5.7 in the appendix to this chapter provides a list of variables and data sources. The
appendix also summary statistics (table 5.8) and a correlation matrix (table 5.9) for the variables
used in the regressions.
5.2. Empirical strategy
I employ a time-series cross-section analysis (TSCS) where the unit of analysis is state-
election/government cycle. The unit of time is each government term in a given state in the
1992-2010 period. As mentioned earlier, typically changes in government in the dataset have
followed elections. In some cases, mid-term changes in government occurred without elections
due to legislative arrangements. The dependent variable (expenditures on industry) along with
relevant economic control variables are averaged over each government term cycle in that
particular state and the averages are used in the regressions. The main independent variables –
coalition types – are coded as dummies and coalition type remain unchanged through the course
of a government term in a given state.
While the main portion of the analysis treats each state-election/government cycle as the
unit of analysis, I also ran a set of regressions with state-year as the unit analysis. Since the effect
of coalitions is likely to occur gradually through the course of a government’s term, the use of 100 As the next section describes, I use state-government term as the unit of analysis but also run the regressions for state-year. The length of government term is not relevant for the regressions using state-year as the unit of analysis.
267
state-election/government cycle as the unit of analysis is attractive for conceptual reasons.
Wilson and Butler (2007) point out that using multiple periods in TSCS analysis is legitimate
only if there is enough change in the variables and relationships to treat multiple time periods as
distinct observations. This is very relevant for the data here. In particular, the main independent
variables – coalition type dummies – remain unchanged during a government term. Since I am
concerned with the effect of coalition type on policies and coalition type remains unchanged
within a government term, it makes conceptual sense to analyze the data on a state-government
term basis rather than on a state-year basis. As a robustness check, however, I include results
using state-year in table 5.4, 5.5 and 5.6. The use of state-government term is also likely smooth
out any idiosyncratic fluctuations in expenditure that might be present in annual data.
There is debate within the literature on the appropriate method to use for TSCS analysis
(e.g., Beck and Katz 1995, 1996, 2011; Wawro 2002). Back and Katz (2011) suggest that there
is no cookbook method that should be followed and the empirical specification should take into
account the specific properties of the data in question. I broadly followed the suggestions in this
literature as well as some recent empirical studies of Indian states in deciding on the empirical
approach. To overcome overreliance on any single method, I used three different empirical
specifications in this chapter. For each of the three specifications, I alternately used per capita
expenditures on industry and industrial expenditure as a proportion of total expenditure as the
dependent variable. I regressed these two measures of expenditure on my main independent
variables – coalition types – as well as the economic and political controls described earlier.
Coalition types are divided into four types and three of the four dummies are included in the
regressions. The lagged dependent variable is used in all regressions following Beck and Katz
(1996, 1995).

268
One key point should be highlighted here. I could not include state fixed effects in the
regressions due to the nature of my data. Unit fixed effects cannot be used in conjunction with
time-invariant and slowly-moving independent variables. My key independent variables –
coalition types – are slow-moving or time-invariant for some states. Due to the fact that coalition
dummies were time-invariant in some cases and slowly-moving in others, they tended to be
highly or perfectly collinear with state fixed effects. As such, it was not possible to run a
regression with both coalition dummy types and state fixed effects.101 To account for unit
heterogeneity in the absence of state dummy variables, I include a range of explanatory
variables. It should be noted that some studies in the Indian political economy literature do not
use fixed effects either (Chhibber and Nooruddin 2004; Nooruddin and Chhibber 2008).
Chhibber and Nooruddin’s 2004 includes results from an OLS with panel corrected standard
errors (PCSE) specification and a lagged dependent variable while their 2008 paper uses random
effects. I similarly use both these specifications in my regressions.
Given these various considerations, I use three different empirical specifications in this
chapter. Following Beck and Katz (1995, 1996), the first specification used OLS with PCSE and
a lagged dependent variable. In addition to OLS with PCSE, I use two other specifications. A
second set of regressions was run using random effects. I also ran a third specification using a
fixed effects vector decomposition model (Plümper and Troeger 2007). Plumper and Troeger’s
method develops a three step process that allows for the estimation of time-invariant and slowly-
changing variables in panel data with unit effects. There is debate on the effectiveness of the
101 The problem of slowly-moving variables persisted whether I used state-government/election cycle as the unit of analysis or state-year. I also tried to run a fixed effects model using only those states which exhibited temporal variation in coalition type over time. Even among these states, coalition type is slow-moving and fixed effects could not be included due to collinearity problems.

269
fixed effects vector decomposition method (see Beck 2011; Greene 2011). Nevertheless, I
include it here as an alternate specification.
5.3. Results
Each of the three specifications described above were run using both dependent variables -
logged per capita expenditure and expenditure on industry as a total proportion of expenditure.
Coalition types are coded as dummies and the omitted category in all regressions is narrow-right.
The expectation is that the coefficients on the narrow-left, wide-left and wide-right dummies
should be negative. In addition, narrow-left coalition should spend the least on industry followed
by wide-left and wide-right coalitions. The results provide consistent support for the predictions.
In particular, there is clear evidence that narrow-left coalitions are associated with lower
spending on industry when compared with narrow-right coalitions. This result is robust to the
inclusion of a variety of controls as well as to the various specifications used.
Table 5.1 and presents results from the first specification – OLS with PCSE and a lagged
dependent variable – for each of the dependent variables. The base equation in column (1) uses
per capita expenditures and includes only the economic controls and the dummies for narrow-
left, wide-left and wide-right coalitions. Compared with narrow-right coalitions (the excluded
category), both narrow-left and wide-left coalitions have lower per capita expenditures on
industry. In addition, the base equation provides some support for the rank-order claim – while
both narrow-left and wide-left coalitions exhibit lower spending relative to narrow-right
coalitions, the coefficient on wide-left coalitions is larger. That is wide-left coalitions spend less
on industry than narrow-right coalitions but more than narrow-left ones. This conforms to
270
expectations that narrow-left coalitions should have the weakest policy commitment to business
followed by wide-left coalitions.
[Table 5.1 here]
The regression in column (1) of table 5.1 includes only a limited set of controls. In columns
(2) and (3) of table 5.1, I include a full set of controls. In addition to economic variables, I
include controls for colonial heritage, inequality and political competition. Two alternate
measures of political competition are used. I use difference in vote margin between the largest
and second largest party as the measure of political competition in column (3) and the effective
number of parties in column (2). The results are robust to the full set of controls and the
coefficient on narrow-left coalitions remains negative and significant at the 1 per cent level when
vote margin is used and the 5 per cent level when ENP is included. The coefficient on wide-left
coalitions is negative and significant at the 10 per cent level in both cases. In addition, the wide-
left coefficient is larger than the one on the narrow-left dummy. This holds whether the vote
margin difference or effective number of parties is used as the measure of competition, providing
support to the expectation that narrow-left coalitions are less business-friendly than wide-left
coalitions.
Columns (4), (5) and (6) follow the same procedure for the second dependent variable –
expenditure on industry as a proportion of total state expenditure. The results on narrow-left
coalitions remain highly robust and there is clear evidence that these coalitions spend a lower
proportion of their expenditure on industry compared with narrow-right coalitions. This result
remains significant at the 1 per cent level when the full set of controls is included in columns (5)
and (6). In addition, the coefficients on both wide-left and wide-right coalitions are negative and
271
statistically significant. While both coefficients on wide-left and wide-right are larger than the
one on narrow-left coalitions, as expected by my argument, one secondary result is somewhat
surprising. The results suggest that wide-right coalitions spend a marginally smaller proportion
of their expenditure on industry than wide-left coalitions. This was, however, not the case when
per capita expenditure is used as the dependent variable. In columns (1) to (3), the coefficient of
wide-right coalitions is larger than wide-left but is not statistically significant.
Table 5.2 contains results of the second specification – the random effects model. Table 5.2
provides results of the regressions that include the full set of controls for each of the two
dependent variables. The results on narrow-left coalitions remain robust to the use of a random
effects model. The coefficient on narrow-left coalitions is negative as expected and significant at
the 5 per cent or 1 per cent level in all specifications with either dependent variable. The
coefficient on wide-left coalitions is not significant in the random effects specification. When the
proportion of expenditure is used as the dependent variable in the random effects model, the
coefficient on wide-right coalitions is negative and significant at the 10 per cent level. It is also
marginally larger than the coefficient on the narrow-left variable, providing some support to the
rank-order claim on the types of coalitions and likelihood of industry-friendly policies. In the
random effects models, the coefficients on vote margin and length of government term are also
positive and significant. Larger electoral margins of victory and longer government terms result
in greater expenditure on industry, possibly pointing to the positive effects of government
stability and electoral autonomy on industrial expenditures.
[Table 5.2 here]

272
Table 5.3 includes results of the fixed effects vector decomposition model. The negative
coefficient on narrow-left remains statistically significant when vote margin is used as the
measure of political competition. The coefficient is not significant when ENP is included instead.
[Table 5.3 here]
As a robustness check, I ran all three specifications using state-year as a unit of analysis
rather than state-government term/election cycle. Since the effect of coalitions as well as the
other control variables is likely to occur with some delay, all independent variables are included
with one year lags. The state-year regressions continue to suggest that narrow-left coalitions
underperform relative to narrow-right ones. The random effects model (table 5.5) also provides
weak evidence that wide-left coalitions can be associated with lower spending on industry than
narrow-right ones.
[Tables 5.4, 5.5 and 5.6 here]
In sum, the results of the TSCS analysis provide consisent support for my argument. In
particular, there is strong evidence that narrow-left coalitions are less conducive to an investor-
friendly agenda than narrow-right coalitions. The results also suggested weak support for the
rank-order claim.
5.4. Conclusion
This chapter constituted the “model-testing” portion of my analysis. It aimed to test the
insights derived in the case studies in chapters 3 and 4 on a larger group of Indian states.
Specifically, it examined the link between electoral coalitions and policies highlighted in the first
stage of my argument through a time-series cross section analysis of fourteen Indian states
273
between 1992 and 2010. My argument in chapter 1 suggested that narrow-right coalitions are
most likely to adopt policies favorable to business. Moreover, I expected a rank order in the
policy performance of electoral coalitions – narrow-right coalitions followed by wide-right,
wide-left and narrow-left coalitions in that sequence.
Using expenditures on industry as a measure of policy performance, I assessed this
hypothesis using three different specifications and included a variety of controls linked to initial
conditions, economic factors and political competition in the regressions. The results support my
argument. There is strong evidence that narrow-left coaltions spend less on industry than narrow-
right ones across a range of specifications that include a variety of control variables. The
evidence also partially shows that narrow-left coalitions exhibit a weaker commitment towards
industry than wide-left coalitions. In sum, this chapter provides sufficient evidence to support the
claim of an association between electoral coalitions and policy performance on a broader group
of Indian states. The applicability of this argument to a larger sample as well as the use of a
quantitative framework should increase confidence in the mechanisms and conclusions advanced
in chapters 1, 3 and 4.
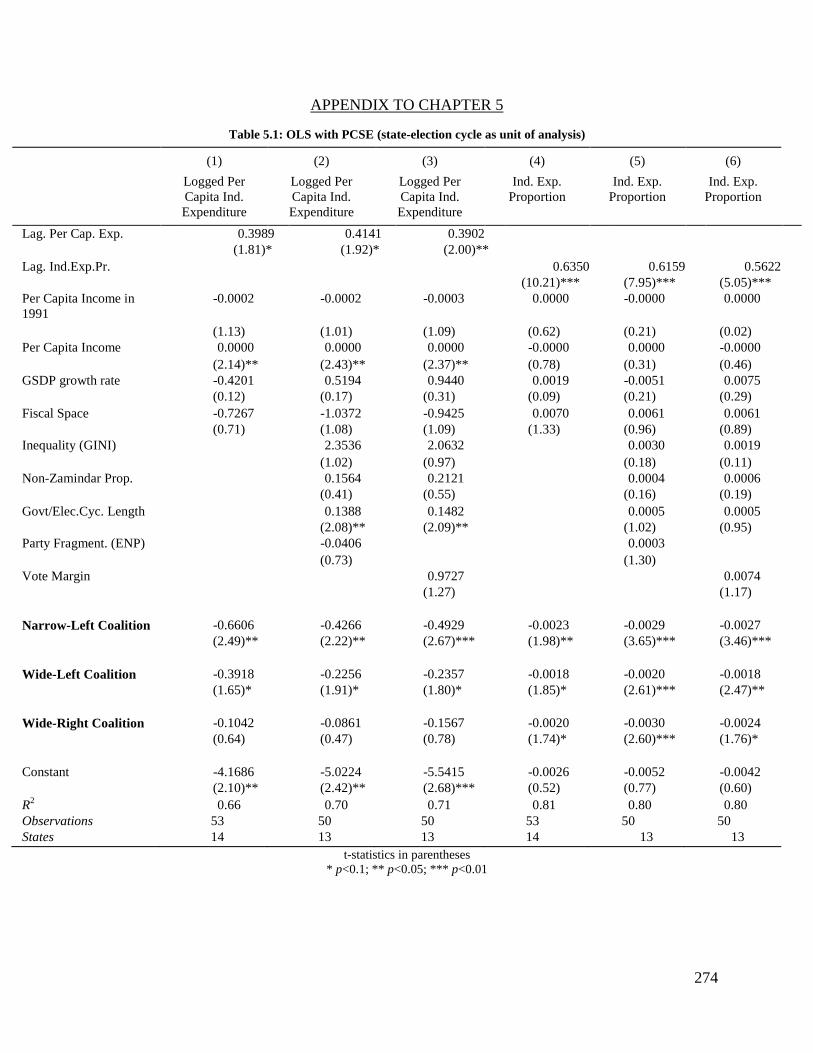
274
APPENDIX TO CHAPTER 5
Table 5.1: OLS with PCSE (state-election cycle as unit of analysis)
(1) Logged Per Capita Ind. Expenditure
(2) Logged Per Capita Ind. Expenditure
(3) Logged Per Capita Ind. Expenditure
(4) Ind. Exp.
Proportion
(5) Ind. Exp.
Proportion
(6) Ind. Exp.
Proportion
Lag. Per Cap. Exp. 0.3989 0.4141 0.3902 (1.81)* (1.92)* (2.00)** Lag. Ind.Exp.Pr. 0.6350 0.6159 0.5622 (10.21)*** (7.95)*** (5.05)*** Per Capita Income in 1991
-0.0002 -0.0002 -0.0003 0.0000 -0.0000 0.0000
(1.13) (1.01) (1.09) (0.62) (0.21) (0.02) Per Capita Income 0.0000 0.0000 0.0000 -0.0000 0.0000 -0.0000 (2.14)** (2.43)** (2.37)** (0.78) (0.31) (0.46) GSDP growth rate -0.4201 0.5194 0.9440 0.0019 -0.0051 0.0075 (0.12) (0.17) (0.31) (0.09) (0.21) (0.29) Fiscal Space -0.7267 -1.0372 -0.9425 0.0070 0.0061 0.0061 (0.71) (1.08) (1.09) (1.33) (0.96) (0.89) Inequality (GINI) 2.3536 2.0632 0.0030 0.0019 (1.02) (0.97) (0.18) (0.11) Non-Zamindar Prop. 0.1564 0.2121 0.0004 0.0006 (0.41) (0.55) (0.16) (0.19) Govt/Elec.Cyc. Length 0.1388 0.1482 0.0005 0.0005 (2.08)** (2.09)** (1.02) (0.95) Party Fragment. (ENP) -0.0406 0.0003 (0.73) (1.30) Vote Margin 0.9727 0.0074 (1.27) (1.17) Narrow-Left Coalition -0.6606 -0.4266 -0.4929 -0.0023 -0.0029 -0.0027 (2.49)** (2.22)** (2.67)*** (1.98)** (3.65)*** (3.46)*** Wide-Left Coalition -0.3918 -0.2256 -0.2357 -0.0018 -0.0020 -0.0018 (1.65)* (1.91)* (1.80)* (1.85)* (2.61)*** (2.47)** Wide-Right Coalition -0.1042 -0.0861 -0.1567 -0.0020 -0.0030 -0.0024 (0.64) (0.47) (0.78) (1.74)* (2.60)*** (1.76)* Constant -4.1686 -5.0224 -5.5415 -0.0026 -0.0052 -0.0042 (2.10)** (2.42)** (2.68)*** (0.52) (0.77) (0.60) R2 0.66 0.70 0.71 0.81 0.80 0.80 Observations 53 50 50 53 50 50 States 14 13 13 14 13 13
t-statistics in parentheses * p<0.1; ** p<0.05; *** p<0.01
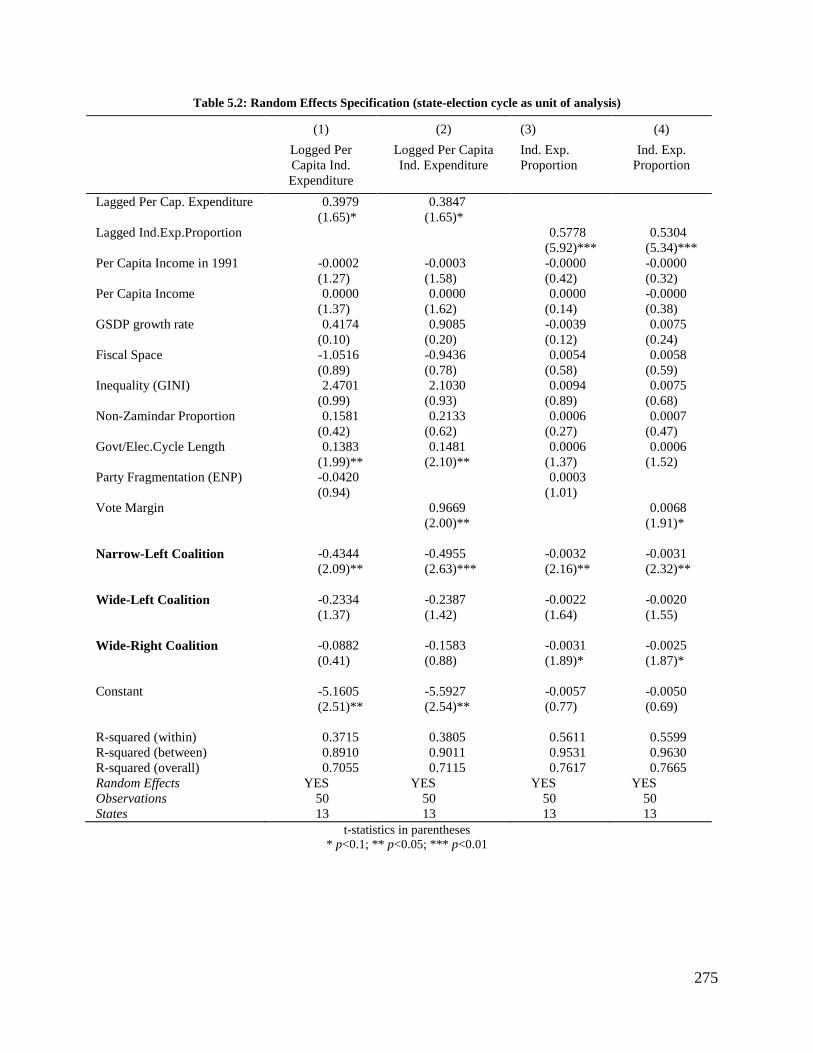
275
Table 5.2: Random Effects Specification (state-election cycle as unit of analysis)
(1) Logged Per Capita Ind. Expenditure
(2) Logged Per Capita Ind. Expenditure
(3) Ind. Exp. Proportion
(4) Ind. Exp.
Proportion
Lagged Per Cap. Expenditure 0.3979 0.3847 (1.65)* (1.65)* Lagged Ind.Exp.Proportion 0.5778 0.5304 (5.92)*** (5.34)*** Per Capita Income in 1991 -0.0002 -0.0003 -0.0000 -0.0000 (1.27) (1.58) (0.42) (0.32) Per Capita Income 0.0000 0.0000 0.0000 -0.0000 (1.37) (1.62) (0.14) (0.38) GSDP growth rate 0.4174 0.9085 -0.0039 0.0075 (0.10) (0.20) (0.12) (0.24) Fiscal Space -1.0516 -0.9436 0.0054 0.0058 (0.89) (0.78) (0.58) (0.59) Inequality (GINI) 2.4701 2.1030 0.0094 0.0075 (0.99) (0.93) (0.89) (0.68) Non-Zamindar Proportion 0.1581 0.2133 0.0006 0.0007 (0.42) (0.62) (0.27) (0.47) Govt/Elec.Cycle Length 0.1383 0.1481 0.0006 0.0006 (1.99)** (2.10)** (1.37) (1.52) Party Fragmentation (ENP) -0.0420 0.0003 (0.94) (1.01) Vote Margin 0.9669 0.0068 (2.00)** (1.91)* Narrow-Left Coalition -0.4344 -0.4955 -0.0032 -0.0031 (2.09)** (2.63)*** (2.16)** (2.32)** Wide-Left Coalition -0.2334 -0.2387 -0.0022 -0.0020 (1.37) (1.42) (1.64) (1.55) Wide-Right Coalition -0.0882 -0.1583 -0.0031 -0.0025 (0.41) (0.88) (1.89)* (1.87)* Constant -5.1605 -5.5927 -0.0057 -0.0050 (2.51)** (2.54)** (0.77) (0.69) R-squared (within) 0.3715 0.3805 0.5611 0.5599 R-squared (between) 0.8910 0.9011 0.9531 0.9630 R-squared (overall) 0.7055 0.7115 0.7617 0.7665 Random Effects YES YES YES YES Observations 50 50 50 50 States 13 13 13 13
t-statistics in parentheses * p<0.1; ** p<0.05; *** p<0.01
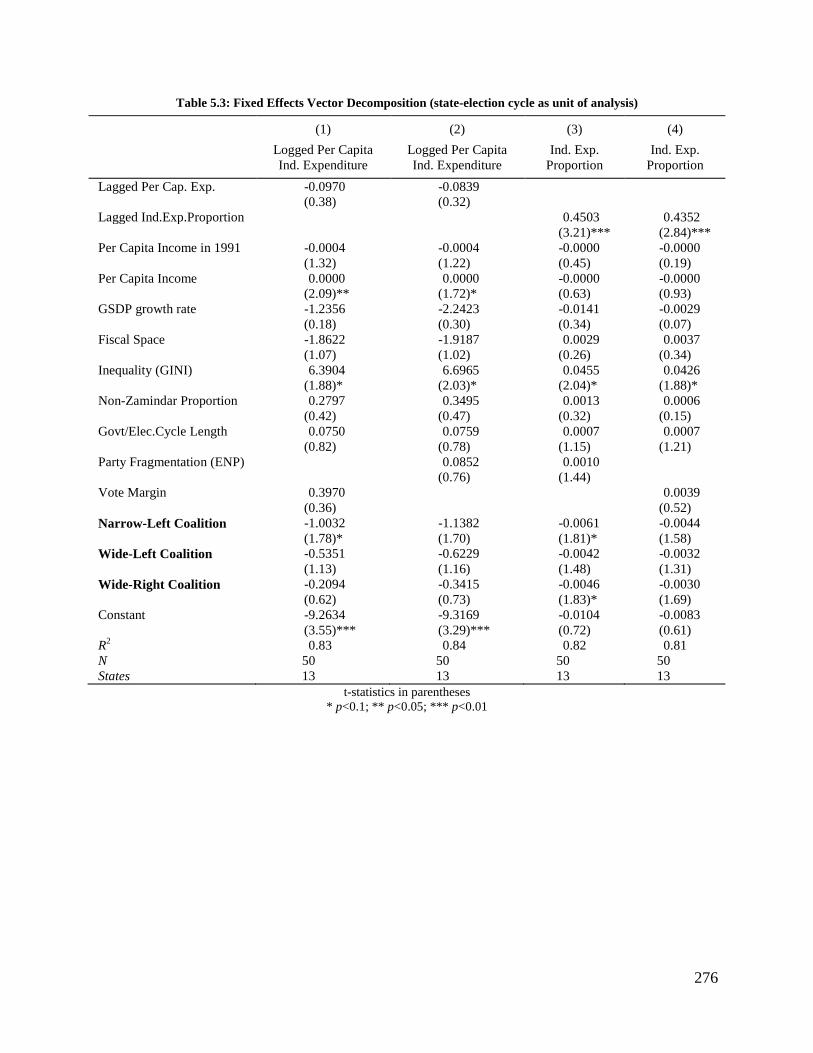
276
Table 5.3: Fixed Effects Vector Decomposition (state-election cycle as unit of analysis)
(1) Logged Per Capita Ind. Expenditure
(2) Logged Per Capita Ind. Expenditure
(3) Ind. Exp.
Proportion
(4) Ind. Exp.
Proportion Lagged Per Cap. Exp. -0.0970 -0.0839 (0.38) (0.32) Lagged Ind.Exp.Proportion 0.4503 0.4352 (3.21)*** (2.84)*** Per Capita Income in 1991 -0.0004 -0.0004 -0.0000 -0.0000 (1.32) (1.22) (0.45) (0.19) Per Capita Income 0.0000 0.0000 -0.0000 -0.0000 (2.09)** (1.72)* (0.63) (0.93) GSDP growth rate -1.2356 -2.2423 -0.0141 -0.0029 (0.18) (0.30) (0.34) (0.07) Fiscal Space -1.8622 -1.9187 0.0029 0.0037 (1.07) (1.02) (0.26) (0.34) Inequality (GINI) 6.3904 6.6965 0.0455 0.0426 (1.88)* (2.03)* (2.04)* (1.88)* Non-Zamindar Proportion 0.2797 0.3495 0.0013 0.0006 (0.42) (0.47) (0.32) (0.15) Govt/Elec.Cycle Length 0.0750 0.0759 0.0007 0.0007 (0.82) (0.78) (1.15) (1.21) Party Fragmentation (ENP) 0.0852 0.0010 (0.76) (1.44) Vote Margin 0.3970 0.0039 (0.36) (0.52) Narrow-Left Coalition -1.0032 -1.1382 -0.0061 -0.0044 (1.78)* (1.70) (1.81)* (1.58) Wide-Left Coalition -0.5351 -0.6229 -0.0042 -0.0032 (1.13) (1.16) (1.48) (1.31) Wide-Right Coalition -0.2094 -0.3415 -0.0046 -0.0030 (0.62) (0.73) (1.83)* (1.69) Constant -9.2634 -9.3169 -0.0104 -0.0083 (3.55)*** (3.29)*** (0.72) (0.61) R2 0.83 0.84 0.82 0.81 N 50 50 50 50 States 13 13 13 13
t-statistics in parentheses * p<0.1; ** p<0.05; *** p<0.01
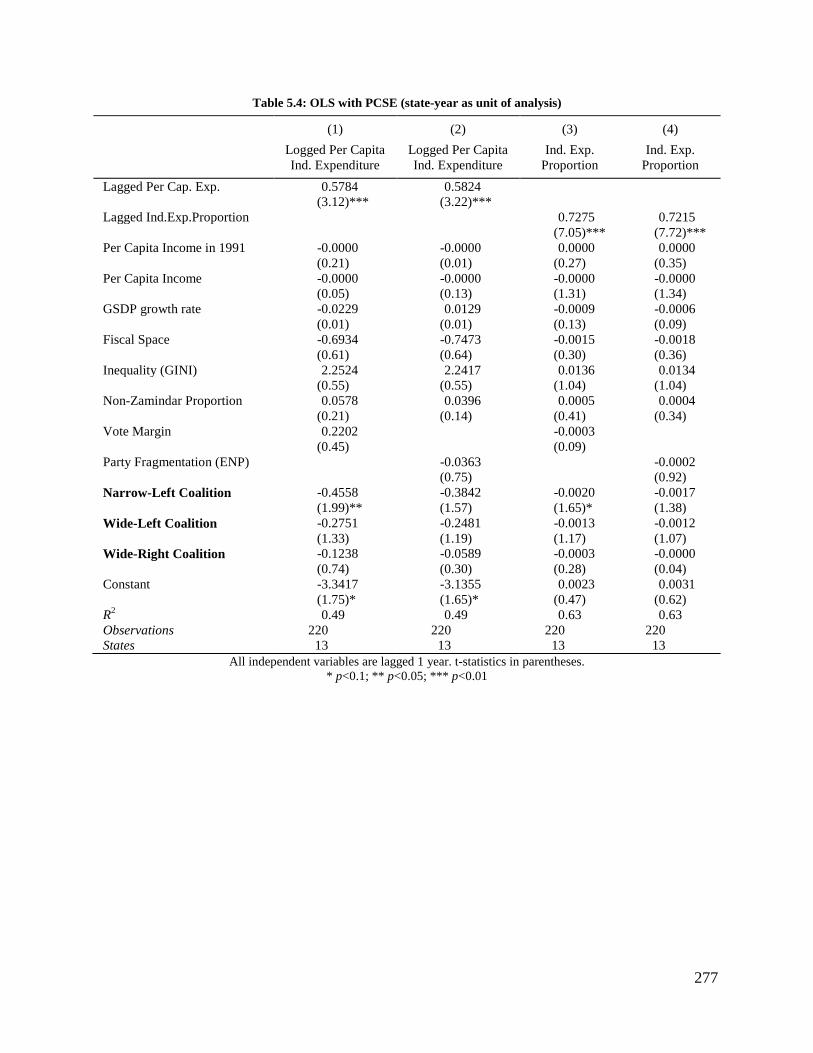
277
Table 5.4: OLS with PCSE (state-year as unit of analysis)
(1) Logged Per Capita Ind. Expenditure
(2) Logged Per Capita Ind. Expenditure
(3) Ind. Exp.
Proportion
(4) Ind. Exp.
Proportion Lagged Per Cap. Exp. 0.5784 0.5824 (3.12)*** (3.22)*** Lagged Ind.Exp.Proportion 0.7275 0.7215 (7.05)*** (7.72)*** Per Capita Income in 1991 -0.0000 -0.0000 0.0000 0.0000 (0.21) (0.01) (0.27) (0.35) Per Capita Income -0.0000 -0.0000 -0.0000 -0.0000 (0.05) (0.13) (1.31) (1.34) GSDP growth rate -0.0229 0.0129 -0.0009 -0.0006 (0.01) (0.01) (0.13) (0.09) Fiscal Space -0.6934 -0.7473 -0.0015 -0.0018 (0.61) (0.64) (0.30) (0.36) Inequality (GINI) 2.2524 2.2417 0.0136 0.0134 (0.55) (0.55) (1.04) (1.04) Non-Zamindar Proportion 0.0578 0.0396 0.0005 0.0004 (0.21) (0.14) (0.41) (0.34) Vote Margin 0.2202 -0.0003 (0.45) (0.09) Party Fragmentation (ENP) -0.0363 -0.0002 (0.75) (0.92) Narrow-Left Coalition -0.4558 -0.3842 -0.0020 -0.0017 (1.99)** (1.57) (1.65)* (1.38) Wide-Left Coalition -0.2751 -0.2481 -0.0013 -0.0012 (1.33) (1.19) (1.17) (1.07) Wide-Right Coalition -0.1238 -0.0589 -0.0003 -0.0000 (0.74) (0.30) (0.28) (0.04) Constant -3.3417 -3.1355 0.0023 0.0031 (1.75)* (1.65)* (0.47) (0.62) R2 0.49 0.49 0.63 0.63 Observations 220 220 220 220 States 13 13 13 13
All independent variables are lagged 1 year. t-statistics in parentheses. * p<0.1; ** p<0.05; *** p<0.01
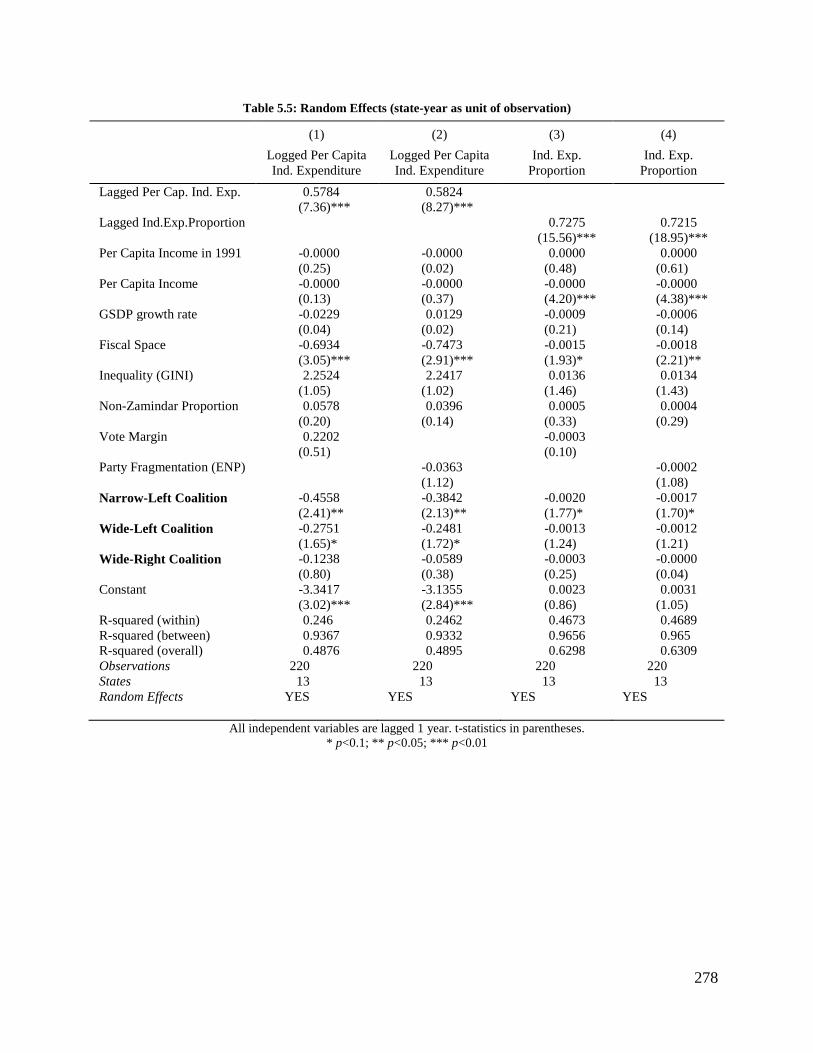
278
Table 5.5: Random Effects (state-year as unit of observation)
(1) Logged Per Capita Ind. Expenditure
(2) Logged Per Capita Ind. Expenditure
(3) Ind. Exp.
Proportion
(4) Ind. Exp.
Proportion Lagged Per Cap. Ind. Exp. 0.5784 0.5824 (7.36)*** (8.27)*** Lagged Ind.Exp.Proportion 0.7275 0.7215 (15.56)*** (18.95)*** Per Capita Income in 1991 -0.0000 -0.0000 0.0000 0.0000 (0.25) (0.02) (0.48) (0.61) Per Capita Income -0.0000 -0.0000 -0.0000 -0.0000 (0.13) (0.37) (4.20)*** (4.38)*** GSDP growth rate -0.0229 0.0129 -0.0009 -0.0006 (0.04) (0.02) (0.21) (0.14) Fiscal Space -0.6934 -0.7473 -0.0015 -0.0018 (3.05)*** (2.91)*** (1.93)* (2.21)** Inequality (GINI) 2.2524 2.2417 0.0136 0.0134 (1.05) (1.02) (1.46) (1.43) Non-Zamindar Proportion 0.0578 0.0396 0.0005 0.0004 (0.20) (0.14) (0.33) (0.29) Vote Margin 0.2202 -0.0003 (0.51) (0.10) Party Fragmentation (ENP) -0.0363 -0.0002 (1.12) (1.08) Narrow-Left Coalition -0.4558 -0.3842 -0.0020 -0.0017 (2.41)** (2.13)** (1.77)* (1.70)* Wide-Left Coalition -0.2751 -0.2481 -0.0013 -0.0012 (1.65)* (1.72)* (1.24) (1.21) Wide-Right Coalition -0.1238 -0.0589 -0.0003 -0.0000 (0.80) (0.38) (0.25) (0.04) Constant -3.3417 -3.1355 0.0023 0.0031 (3.02)*** (2.84)*** (0.86) (1.05) R-squared (within) 0.246 0.2462 0.4673 0.4689 R-squared (between) 0.9367 0.9332 0.9656 0.965 R-squared (overall) 0.4876 0.4895 0.6298 0.6309 Observations 220 220 220 220 States 13 13 13 13 Random Effects YES YES YES YES
All independent variables are lagged 1 year. t-statistics in parentheses. * p<0.1; ** p<0.05; *** p<0.01

279
Table 5.6: Fixed Effects Vector Decomposition (state-year as unit of analysis)
Logged Per Capita Ind. Expenditure
Logged Per Capita Ind. Expenditure
Ind. Exp. Proportion
Lagged Per Cap. Ind. Exp. 0.4376 0.4617 (4.28)*** (4.59)*** Lagged Ind.Exp.Proportion 0.5498 (7.77)*** Per Capita Income in 1991 -0.0000 0.0000 0.0000 (0.28) (0.04) (0.30) Per Capita Income -0.0000 -0.0000 -0.0000 (0.72) (0.86) (5.27)*** GSDP growth rate -0.2988 -0.2561 -0.0022 (0.38) (0.33) (0.50) Fiscal Space -1.1680 -1.2121 -0.0032 (2.70)*** (2.92)*** (1.38) Inequality (GINI) 3.1202 2.9787 0.0316 (1.40) (1.38) (2.54)** Non-Zamindar Proportion 0.2075 0.1383 0.0011 (0.46) (0.36) (0.45) Vote Margin -0.3316 (0.57) Party Fragmentation (ENP) 0.0920 0.0001 (0.98) (0.19) Narrow-Left Coalition -0.7929 -0.5925 -0.0038 (2.07)** (2.16)** (1.89)* Wide-Left Coalition -0.4370 -0.3545 -0.0026 (1.34) (1.31) (1.47) Wide-Right Coalition -0.2587 -0.1088 -0.0008 (0.95) (0.55) (0.56) Constant -4.4397 -3.8960 0.0030 (3.23)*** (3.12)*** (0.66) R2 0.55 0.54 0.67 Observations 220 220 220 States 13 13 13
All independent variables are lagged 1 year. t-statistics in parentheses. * p<0.1; ** p<0.05; *** p<0.01
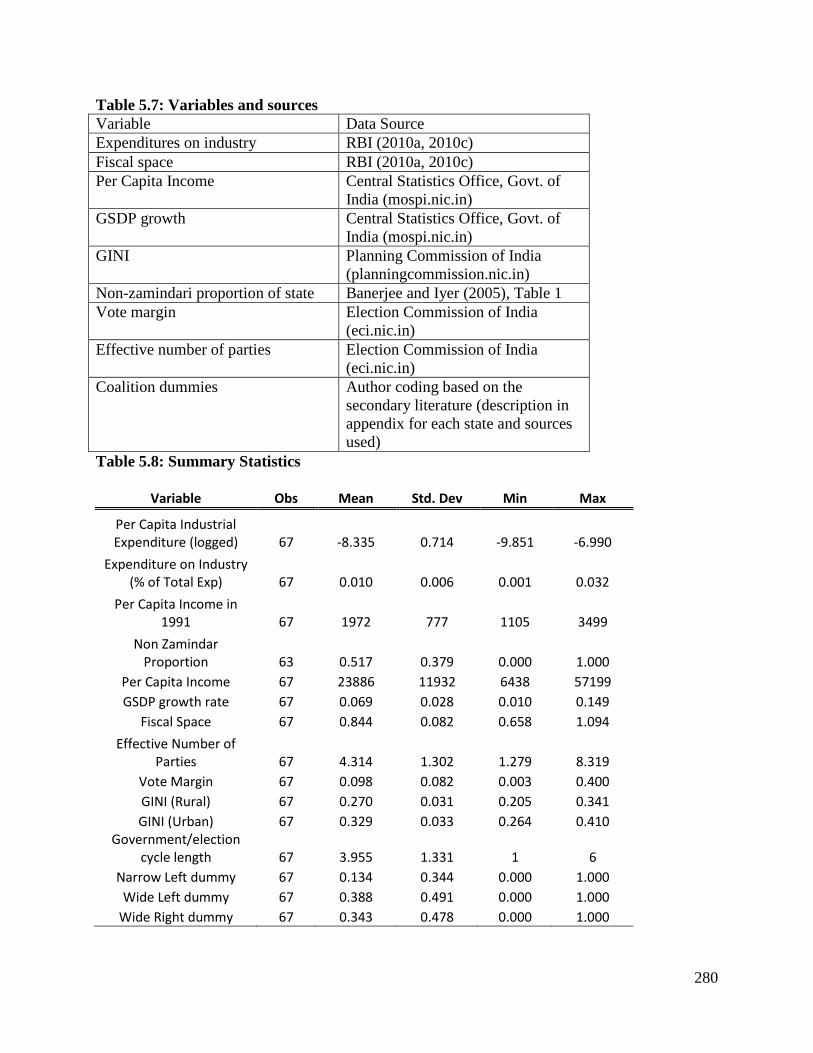
280
Table 5.7: Variables and sources Variable Data Source Expenditures on industry RBI (2010a, 2010c) Fiscal space RBI (2010a, 2010c) Per Capita Income Central Statistics Office, Govt. of
India (mospi.nic.in) GSDP growth Central Statistics Office, Govt. of
India (mospi.nic.in) GINI Planning Commission of India
(planningcommission.nic.in) Non-zamindari proportion of state Banerjee and Iyer (2005), Table 1 Vote margin Election Commission of India
(eci.nic.in) Effective number of parties Election Commission of India
(eci.nic.in) Coalition dummies Author coding based on the
secondary literature (description in appendix for each state and sources used)
Table 5.8: Summary Statistics
Variable Obs Mean Std. Dev Min Max
Per Capita Industrial Expenditure (logged) 67 -8.335 0.714 -9.851 -6.990
Expenditure on Industry (% of Total Exp) 67 0.010 0.006 0.001 0.032
Per Capita Income in 1991 67 1972 777 1105 3499
Non Zamindar Proportion 63 0.517 0.379 0.000 1.000
Per Capita Income 67 23886 11932 6438 57199 GSDP growth rate 67 0.069 0.028 0.010 0.149
Fiscal Space 67 0.844 0.082 0.658 1.094 Effective Number of
Parties 67 4.314 1.302 1.279 8.319 Vote Margin 67 0.098 0.082 0.003 0.400 GINI (Rural) 67 0.270 0.031 0.205 0.341 GINI (Urban) 67 0.329 0.033 0.264 0.410
Government/election cycle length 67 3.955 1.331 1 6
Narrow Left dummy 67 0.134 0.344 0.000 1.000 Wide Left dummy 67 0.388 0.491 0.000 1.000
Wide Right dummy 67 0.343 0.478 0.000 1.000
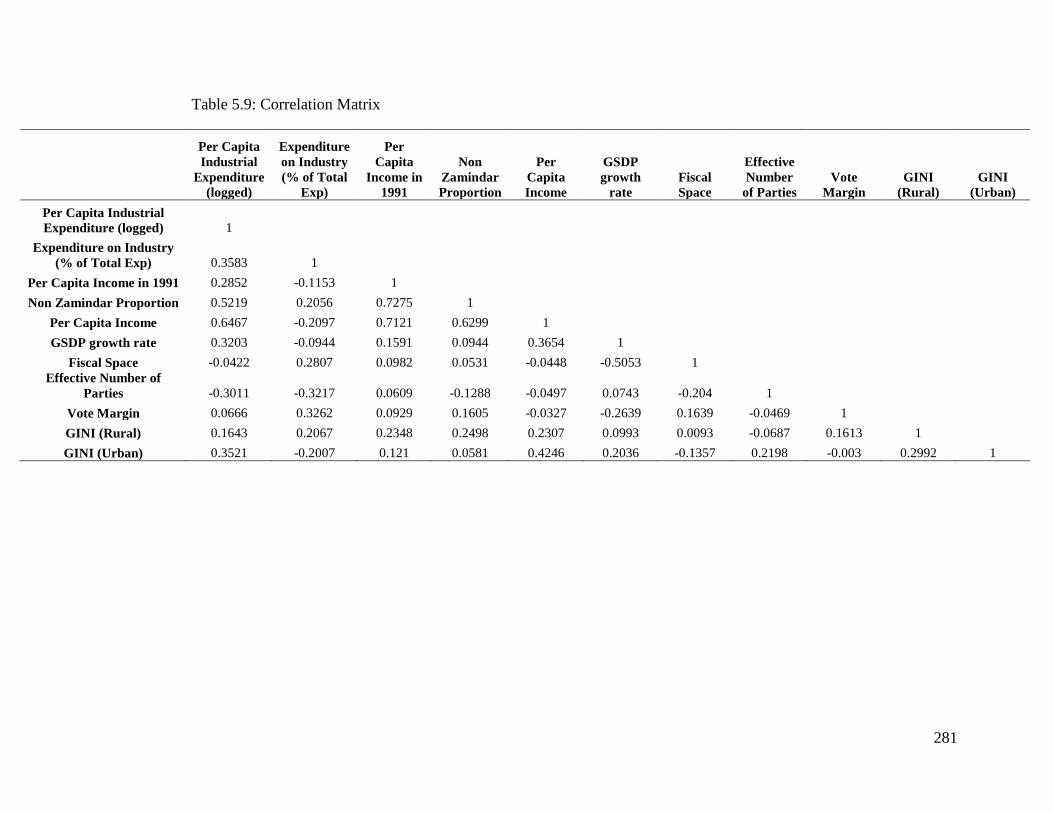
281
Table 5.9: Correlation Matrix
Per Capita Industrial
Expenditure (logged)
Expenditure on Industry (% of Total
Exp)
Per Capita
Income in 1991
Non Zamindar Proportion
Per Capita Income
GSDP growth
rate Fiscal Space
Effective Number
of Parties Vote
Margin GINI
(Rural) GINI
(Urban) Per Capita Industrial Expenditure (logged) 1
Expenditure on Industry (% of Total Exp) 0.3583 1
Per Capita Income in 1991 0.2852 -0.1153 1 Non Zamindar Proportion 0.5219 0.2056 0.7275 1
Per Capita Income 0.6467 -0.2097 0.7121 0.6299 1 GSDP growth rate 0.3203 -0.0944 0.1591 0.0944 0.3654 1
Fiscal Space -0.0422 0.2807 0.0982 0.0531 -0.0448 -0.5053 1 Effective Number of
Parties -0.3011 -0.3217 0.0609 -0.1288 -0.0497 0.0743 -0.204 1 Vote Margin 0.0666 0.3262 0.0929 0.1605 -0.0327 -0.2639 0.1639 -0.0469 1
GINI (Rural) 0.1643 0.2067 0.2348 0.2498 0.2307 0.0993 0.0093 -0.0687 0.1613 1 GINI (Urban) 0.3521 -0.2007 0.121 0.0581 0.4246 0.2036 -0.1357 0.2198 -0.003 0.2992 1
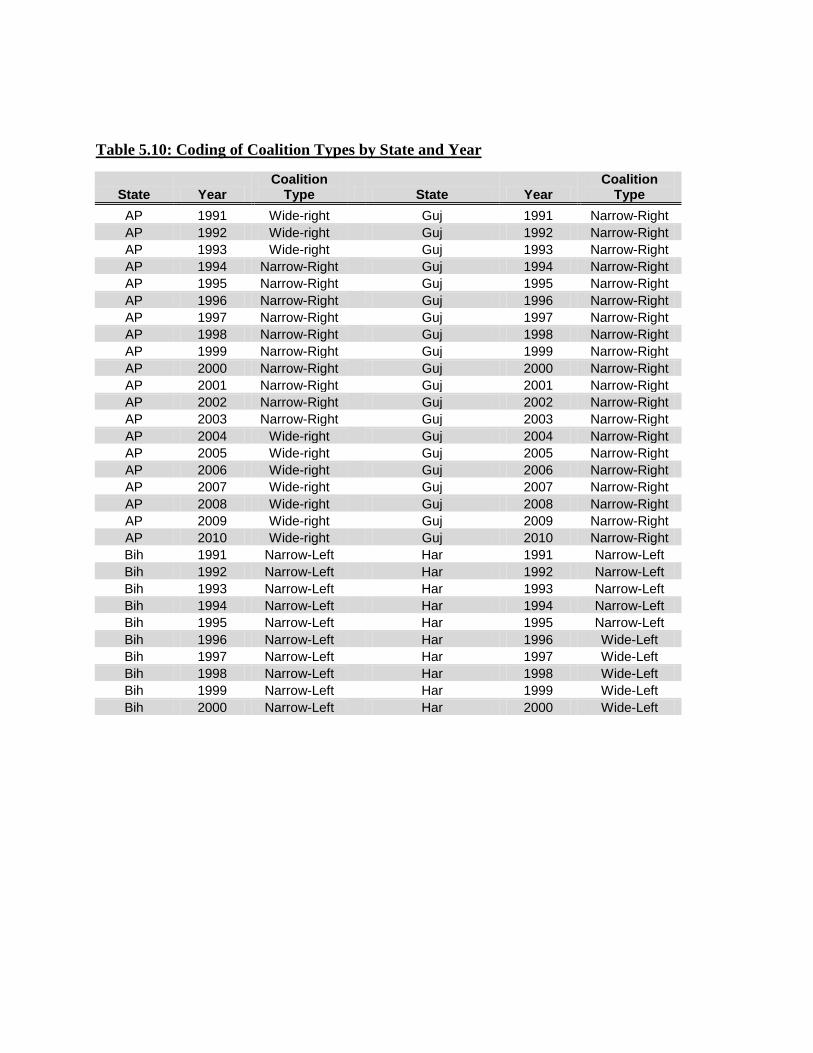
Table 5.10: Coding of Coalition Types by State and Year
State Year Coalition
Type State Year Coalition
Type AP 1991 Wide-right
Guj 1991 Narrow-Right
AP 1992 Wide-right
Guj 1992 Narrow-Right AP 1993 Wide-right
Guj 1993 Narrow-Right
AP 1994 Narrow-Right
Guj 1994 Narrow-Right AP 1995 Narrow-Right
Guj 1995 Narrow-Right
AP 1996 Narrow-Right
Guj 1996 Narrow-Right AP 1997 Narrow-Right
Guj 1997 Narrow-Right
AP 1998 Narrow-Right
Guj 1998 Narrow-Right AP 1999 Narrow-Right
Guj 1999 Narrow-Right
AP 2000 Narrow-Right
Guj 2000 Narrow-Right AP 2001 Narrow-Right
Guj 2001 Narrow-Right
AP 2002 Narrow-Right
Guj 2002 Narrow-Right AP 2003 Narrow-Right
Guj 2003 Narrow-Right
AP 2004 Wide-right
Guj 2004 Narrow-Right AP 2005 Wide-right
Guj 2005 Narrow-Right
AP 2006 Wide-right
Guj 2006 Narrow-Right AP 2007 Wide-right
Guj 2007 Narrow-Right
AP 2008 Wide-right
Guj 2008 Narrow-Right AP 2009 Wide-right
Guj 2009 Narrow-Right
AP 2010 Wide-right
Guj 2010 Narrow-Right Bih 1991 Narrow-Left
Har 1991 Narrow-Left
Bih 1992 Narrow-Left
Har 1992 Narrow-Left Bih 1993 Narrow-Left
Har 1993 Narrow-Left
Bih 1994 Narrow-Left
Har 1994 Narrow-Left Bih 1995 Narrow-Left
Har 1995 Narrow-Left
Bih 1996 Narrow-Left
Har 1996 Wide-Left Bih 1997 Narrow-Left
Har 1997 Wide-Left
Bih 1998 Narrow-Left
Har 1998 Wide-Left Bih 1999 Narrow-Left
Har 1999 Wide-Left
Bih 2000 Narrow-Left
Har 2000 Wide-Left
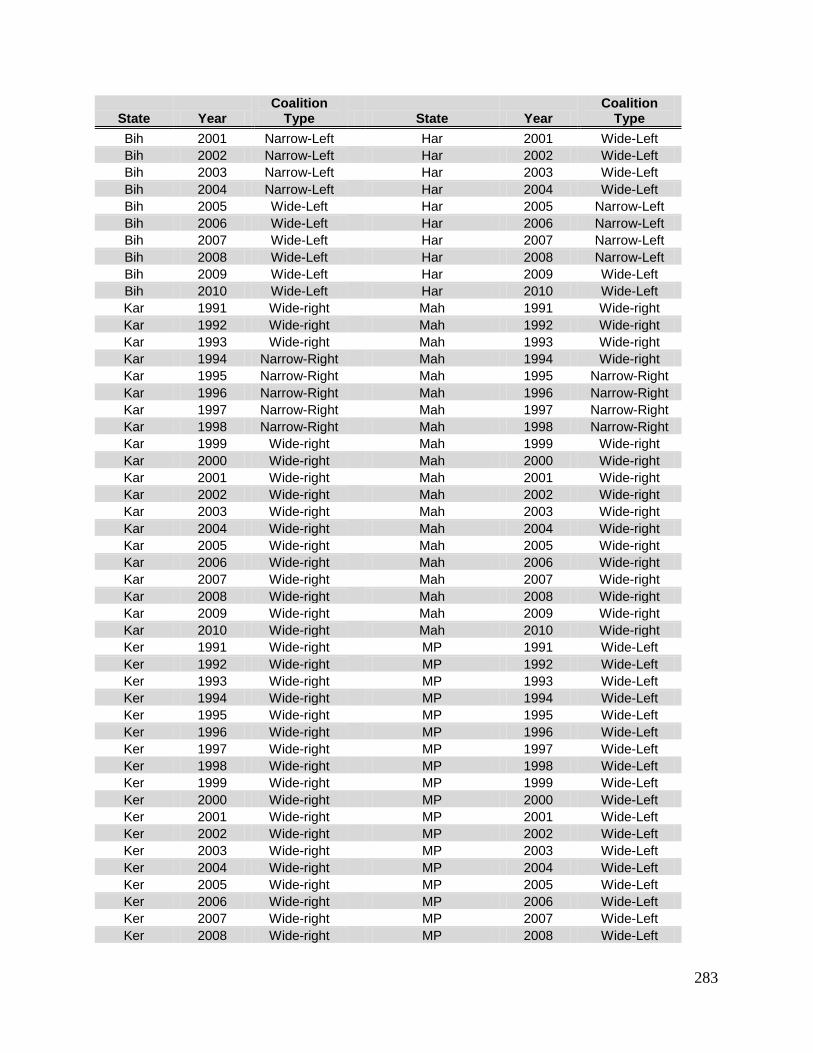
283
State Year Coalition
Type State Year Coalition
Type Bih 2001 Narrow-Left
Har 2001 Wide-Left
Bih 2002 Narrow-Left
Har 2002 Wide-Left Bih 2003 Narrow-Left
Har 2003 Wide-Left
Bih 2004 Narrow-Left
Har 2004 Wide-Left Bih 2005 Wide-Left
Har 2005 Narrow-Left
Bih 2006 Wide-Left
Har 2006 Narrow-Left Bih 2007 Wide-Left
Har 2007 Narrow-Left
Bih 2008 Wide-Left
Har 2008 Narrow-Left Bih 2009 Wide-Left
Har 2009 Wide-Left
Bih 2010 Wide-Left
Har 2010 Wide-Left Kar 1991 Wide-right
Mah 1991 Wide-right
Kar 1992 Wide-right
Mah 1992 Wide-right Kar 1993 Wide-right
Mah 1993 Wide-right
Kar 1994 Narrow-Right
Mah 1994 Wide-right Kar 1995 Narrow-Right
Mah 1995 Narrow-Right
Kar 1996 Narrow-Right
Mah 1996 Narrow-Right Kar 1997 Narrow-Right
Mah 1997 Narrow-Right
Kar 1998 Narrow-Right
Mah 1998 Narrow-Right Kar 1999 Wide-right
Mah 1999 Wide-right
Kar 2000 Wide-right
Mah 2000 Wide-right Kar 2001 Wide-right
Mah 2001 Wide-right
Kar 2002 Wide-right
Mah 2002 Wide-right Kar 2003 Wide-right
Mah 2003 Wide-right
Kar 2004 Wide-right
Mah 2004 Wide-right Kar 2005 Wide-right
Mah 2005 Wide-right
Kar 2006 Wide-right
Mah 2006 Wide-right Kar 2007 Wide-right
Mah 2007 Wide-right
Kar 2008 Wide-right
Mah 2008 Wide-right Kar 2009 Wide-right
Mah 2009 Wide-right
Kar 2010 Wide-right
Mah 2010 Wide-right Ker 1991 Wide-right
MP 1991 Wide-Left
Ker 1992 Wide-right
MP 1992 Wide-Left Ker 1993 Wide-right
MP 1993 Wide-Left
Ker 1994 Wide-right
MP 1994 Wide-Left Ker 1995 Wide-right
MP 1995 Wide-Left
Ker 1996 Wide-right
MP 1996 Wide-Left Ker 1997 Wide-right
MP 1997 Wide-Left
Ker 1998 Wide-right
MP 1998 Wide-Left Ker 1999 Wide-right
MP 1999 Wide-Left
Ker 2000 Wide-right
MP 2000 Wide-Left Ker 2001 Wide-right
MP 2001 Wide-Left
Ker 2002 Wide-right
MP 2002 Wide-Left Ker 2003 Wide-right
MP 2003 Wide-Left
Ker 2004 Wide-right
MP 2004 Wide-Left Ker 2005 Wide-right
MP 2005 Wide-Left
Ker 2006 Wide-right
MP 2006 Wide-Left Ker 2007 Wide-right
MP 2007 Wide-Left
Ker 2008 Wide-right
MP 2008 Wide-Left

284
Ker 2009 Wide-right
MP 2009 Wide-Left Ker 2010 Wide-right
MP 2010 Wide-Left
Ori 1991 Wide-Left
Raj 1991 Wide-Left Ori 1992 Wide-Left
Raj 1992 Wide-Left
Ori 1993 Wide-Left
Raj 1993 Wide-Left Ori 1994 Wide-Left
Raj 1994 Wide-Left
Ori 1995 Wide-Left
Raj 1995 Wide-Left Ori 1996 Wide-Left
Raj 1996 Wide-Left
Ori 1997 Wide-Left
Raj 1997 Wide-Left Ori 1998 Wide-Left
Raj 1998 Narrow-Left
Ori 1999 Wide-Left
Raj 1999 Narrow-Left Ori 2000 Wide-Left
Raj 2000 Narrow-Left
Ori 2001 Wide-Left
Raj 2001 Narrow-Left Ori 2002 Wide-Left
Raj 2002 Narrow-Left
Ori 2003 Wide-Left
Raj 2003 Wide-Left Ori 2004 Wide-Left
Raj 2004 Wide-Left
Ori 2005 Wide-Left
Raj 2005 Wide-Left Ori 2006 Wide-Left
Raj 2006 Wide-Left
Ori 2007 Wide-Left
Raj 2007 Wide-Left Ori 2008 Wide-Left
Raj 2008 Narrow-Left
Ori 2009 Wide-Left
Raj 2009 Narrow-Left Ori 2010 Wide-Left
Raj 2010 Narrow-Left
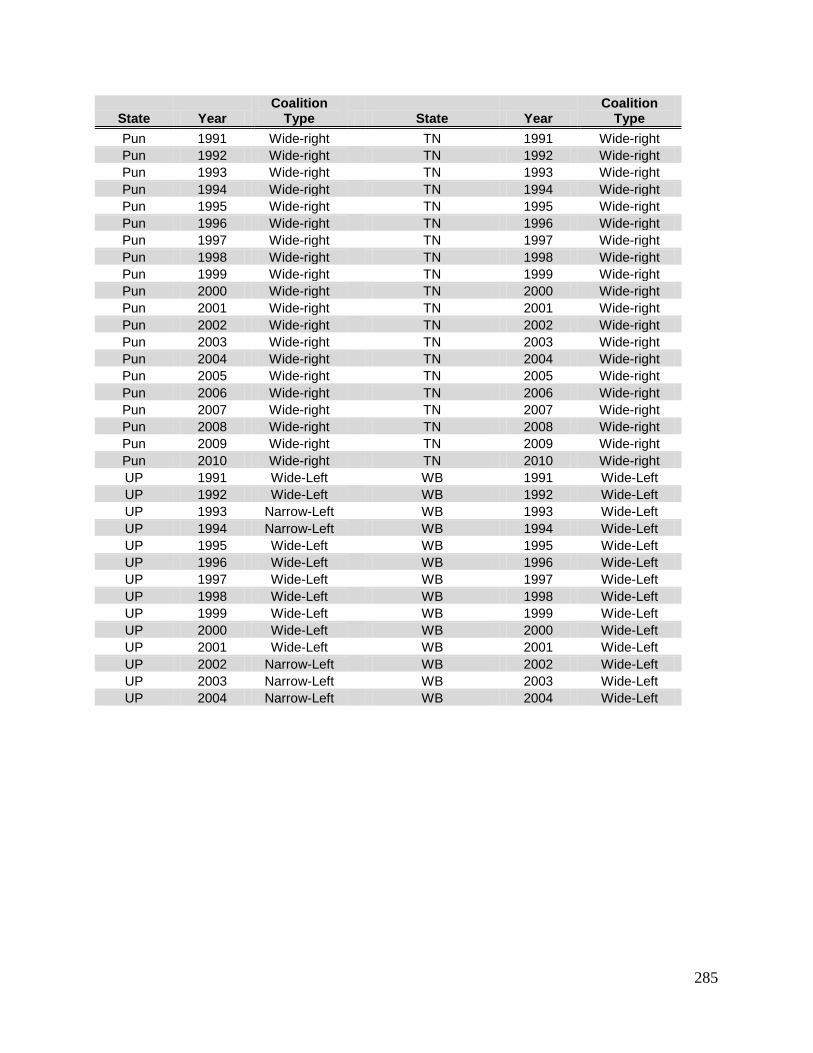
285
State Year Coalition
Type State Year Coalition
Type Pun 1991 Wide-right
TN 1991 Wide-right
Pun 1992 Wide-right
TN 1992 Wide-right Pun 1993 Wide-right
TN 1993 Wide-right
Pun 1994 Wide-right
TN 1994 Wide-right Pun 1995 Wide-right
TN 1995 Wide-right
Pun 1996 Wide-right
TN 1996 Wide-right Pun 1997 Wide-right
TN 1997 Wide-right
Pun 1998 Wide-right
TN 1998 Wide-right Pun 1999 Wide-right
TN 1999 Wide-right
Pun 2000 Wide-right
TN 2000 Wide-right Pun 2001 Wide-right
TN 2001 Wide-right
Pun 2002 Wide-right
TN 2002 Wide-right Pun 2003 Wide-right
TN 2003 Wide-right
Pun 2004 Wide-right
TN 2004 Wide-right Pun 2005 Wide-right
TN 2005 Wide-right
Pun 2006 Wide-right
TN 2006 Wide-right Pun 2007 Wide-right
TN 2007 Wide-right
Pun 2008 Wide-right
TN 2008 Wide-right Pun 2009 Wide-right
TN 2009 Wide-right
Pun 2010 Wide-right
TN 2010 Wide-right UP 1991 Wide-Left
WB 1991 Wide-Left
UP 1992 Wide-Left
WB 1992 Wide-Left UP 1993 Narrow-Left
WB 1993 Wide-Left
UP 1994 Narrow-Left
WB 1994 Wide-Left UP 1995 Wide-Left
WB 1995 Wide-Left
UP 1996 Wide-Left
WB 1996 Wide-Left UP 1997 Wide-Left
WB 1997 Wide-Left
UP 1998 Wide-Left
WB 1998 Wide-Left UP 1999 Wide-Left
WB 1999 Wide-Left
UP 2000 Wide-Left
WB 2000 Wide-Left UP 2001 Wide-Left
WB 2001 Wide-Left
UP 2002 Narrow-Left
WB 2002 Wide-Left UP 2003 Narrow-Left
WB 2003 Wide-Left
UP 2004 Narrow-Left
WB 2004 Wide-Left
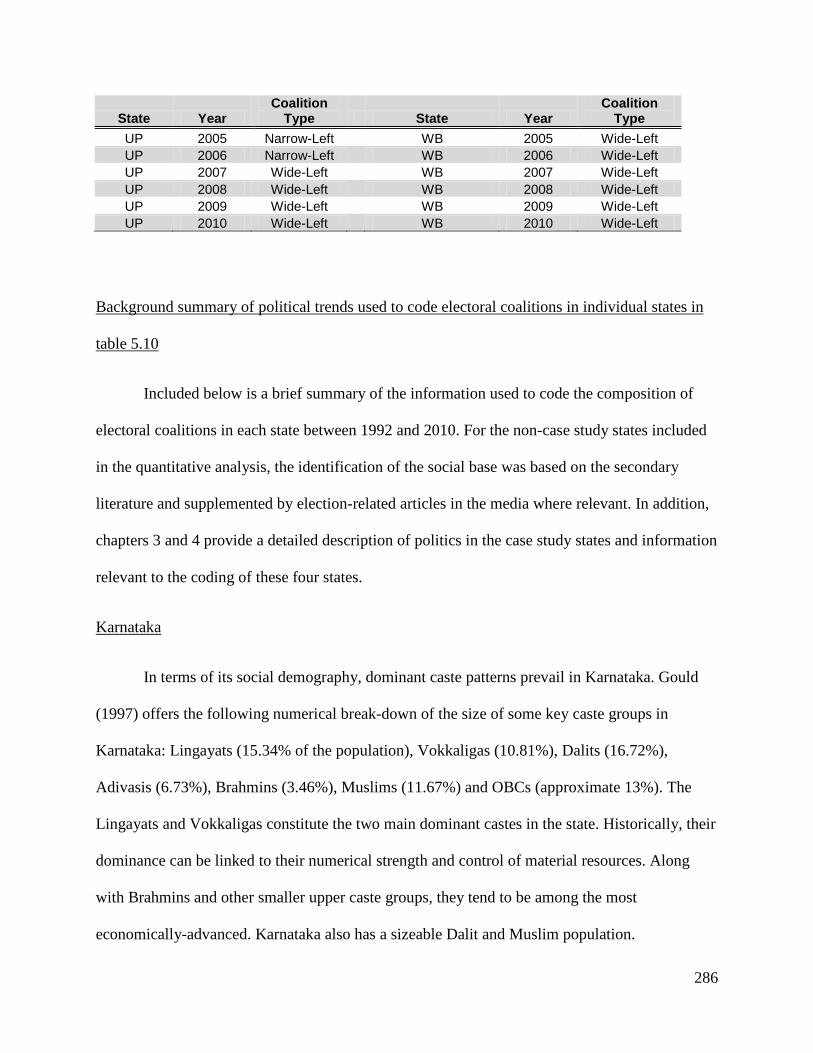
286
State Year Coalition
Type State Year Coalition
Type UP 2005 Narrow-Left
WB 2005 Wide-Left
UP 2006 Narrow-Left
WB 2006 Wide-Left UP 2007 Wide-Left
WB 2007 Wide-Left
UP 2008 Wide-Left
WB 2008 Wide-Left UP 2009 Wide-Left
WB 2009 Wide-Left
UP 2010 Wide-Left
WB 2010 Wide-Left
Background summary of political trends used to code electoral coalitions in individual states in
table 5.10
Included below is a brief summary of the information used to code the composition of
electoral coalitions in each state between 1992 and 2010. For the non-case study states included
in the quantitative analysis, the identification of the social base was based on the secondary
literature and supplemented by election-related articles in the media where relevant. In addition,
chapters 3 and 4 provide a detailed description of politics in the case study states and information
relevant to the coding of these four states.
Karnataka
In terms of its social demography, dominant caste patterns prevail in Karnataka. Gould
(1997) offers the following numerical break-down of the size of some key caste groups in
Karnataka: Lingayats (15.34% of the population), Vokkaligas (10.81%), Dalits (16.72%),
Adivasis (6.73%), Brahmins (3.46%), Muslims (11.67%) and OBCs (approximate 13%). The
Lingayats and Vokkaligas constitute the two main dominant castes in the state. Historically, their
dominance can be linked to their numerical strength and control of material resources. Along
with Brahmins and other smaller upper caste groups, they tend to be among the most
economically-advanced. Karnataka also has a sizeable Dalit and Muslim population.
287
During the first three decades after independence, the Congress dominated electoral
politics in Karnataka. Until the early 1970s, the dominant Lingayats and Vokkaligas were key
players in both the state and the party. Like many other states, Karnataka too was affected by the
split in the Congress in 1969. As part of Indira Gandhi’s leftward populism and shift in party
strategy in this direction, Congress began to target more socially and economically-marginalized
groups. In Karnataka, the Congress under Devraj Urs realigned the parties bases towards the
non-dominant OBCs and Dalits (e.g.,Hebsur 2011; Shastri 1996, 1999). Since then, the Congress
has relied on the Dalits and non-dominant OBCs for its core support, though it continued to
attract a portion of Lingayat and Vokkaliga votes. The realignment of its base and the inclusion
of OBCs and Dalits as key players in the 1970s alienated sections of the powerful dominant
castes, most notably the Lingayats.
A large section of Lingayats as well as Vokkaligas began to seek alternatives to the
Congress from the 1980s. In the early 1980s, they would throw their weight behind the Janata
Party, which under Ramakrishna Hegde formed the first non-Congress government in Karnataka
in 1983. Under Hegde, Janata capitalized on Lingayat disaffection with the Congress and relied
significantly on their support along with that of other upper castes and Muslims to come to
power in 1983. (Hebsur 2011). Hegde, in part, consolidated the Lingayat vote by promising to
include the Lingayats under the state’s OBC list, a demand rejected by a government
commission on account of the advanced economic status of the Lingayats. Nevertheless, the
Janata consolidated the Lingayat vote and subsequently retained power in 1988 but the Bommai
government was dismissed by the center. In addition to the Janata’s success, the 1980s saw the
entry of the BJP into Karnataka politics and it would subsequently make notable inroads in state
politics by the late 1990s.
288
Despite the Janata’s success in 1983 and 1988, the party was affected by high levels of
factionalism. Janata Dal (JD) factionalism would provide the Congress the avenue to regain
power and in 1989, it came back to power on the back of coalition strategy that Urs had first put
in place in the early 1970s (Hebsur 2011). This strategy relied primarily on non-dominant OBC
sub-groups as well as Dalits. It did complement this support with some dominant caste support
but it was around the OBCs in particular that the Congress constructed its base. Due to the
diverse nature of the social base of the Congress and the fact that the Congress did incorporate a
fair degree of dominant caste support, I classify the electoral coalition in Karnataka during the
1989-1994 period as wide-right.
The 1994 election saw the JD come back to power and many observers attribute this to
the decline in factionalism. In particular, the party’s three heavyweights – Hegde, Deve Gowda
and S.R. Bommai – came together to form a united front against the Congress, which proved
electorally successful. The JD’s base itself comprised of strong Lingayat, Vokkaliga and
Brahmin support. Gould (1997) and Shastri (1996, 1999) both point out that this base was a
result of Hegde’s strong following among Lingayats and Brahmins complemented by Deve
Gowda and Bommai’s hold on Vokkaligas. The primacy of the two dominant castes and
Brahmins in the social coalition meant an economically-advanced profile of the electoral
coalition, which I classify as narrow. I further classify the electoral coalition during the 1994-99
period as narrow-right because of the fact that business interests in the state are substantially
represented.
JD unity would prove to be temporary and Hegde would go on to form his own party,
which sought an alliance with the BJP in the late 1990s. In 2004 assembly elections, Karnataka
would see a three-way contest between the Congress, JD(S) led by Deve Gowda and the BJP.

289
The Congress mobilized the OBCs, Dalits and Muslims in a strategy known by its Kannada
acronym, AHIND (Hebsur 2011). The JD(S)’s primary base comprised of Vokkaligas while the
BJP’s strategy focused on the Lingayats and upper castes, who had been alienated from both the
Congress and JD(S), complemented by a measure of support from OBCs. Though the BJP
emerged as the single largest party in a fractured mandate, the Congress and JD(S) would agree
to form a post-poll coalition to keep the BJP out of power. The Congress-JD(S) coalition was at
the helm of Karnataka between 2004 and 2006 and was based on the Congress’ strength among
OBCs, Dalits and Muslims and the JD(S)’s reach among Vokkaligas and Adivasis (Shastri and
Ramaswamy 2004). I classify this coalition as wide-right.
The Congress-JD(S) arrangement was based on an agreement that the chief ministerial
position would be alternated between the two parties. When Deve Gowda, who headed the
JD(S), made certain demands to the Congress – notably, that his son, H.D. Kumarawamy, be
appointed chief ministerial position and that certain Congress ministers be dismissed and
replaced by others more amenable to him – the coalition fell apart in early 2006 (Hebsur 2011).
The JD(S) then went on to form a coalition with the BJP, in place of the Congress. A JD(S)-BJP
government came to head Karnataka between 2006-2007. The electoral coalition comprising of
Lingayats, Vokkaligas, upper castes and complemented by sizeable OBC and Adivasi support is
classified as wide-right.
The BJP-JD(S) arrangement would be short lived. In 2008, Karnataka went back to the
polls and the BJP emerged as the largest party. Thought it was shy of a majority, it formed the
government. Vasavi (2008) and Murthy (2008) point out that the Lingayats and upper castes
consolidated behind the BJP who also benefitted from a three-way split in OBC support. Other
290
groups such as the Dalits and Muslims were firmly behind the Congress while the Vokkaligas
were split between the Congress and the JD(S). The BJP’s coalition is classified as wide-right.
Maharashtra
Maharashtra’s social demography is characterized by the dominant caste pattern. The
dominant Maratha-Kunbi caste forms almost 31% of the state’s population (Palshikar and
Deshpande 1999). OBCs constitute approximately 27% of the population but are fragmented.
Dalits and Adivasis comprise 10.2% and 8.9% respectively while the Brahmins make up 4% of
the state’s population. As Palshikar and Birmal (2004) the numerical strength of the Maratha-
Kunbi group has made them the key players in state politics since independence. In addition, the
Maratha-Kunbi group enjoy considerable economic power, particularly in rural Maharashtra, a
phenomenon that can be traced back to their historical ownership of land.
Until the late 1970s, the Congress had a tight hold on Maharashtra. The first non-
Congress government in the state followed the end of the Emergency in 1977 and the next non-
Congress government came to power only in 1995. Congress dominance itself was backed by
strong support of the Maratha-Kunbi group as well as the OBCs (Palshikar and Deshpande
1999). Palshikar and Deshpande argue that the Congress adopted a rhetoric of protecting the
oppressed castes but this image was completely disjointed from the party’s primary support and
the interests it tended to favor. The Congress functioned primarily as a party dominated by the
Maratha-Kunbis and its leadership reflected that. At the same time, Congress dominance until
the 1990s involved a complex alliance that served to protect Maratha-Kunbi agrarian interests
while at the same time favoring urban capitalist interests. Palshikar and Deshpande suggest this
agrarian-industrial balance is in part explained by the pattern accommodation of Brahmins and
291
Marathas. Despite professing support of weaker socio-economic sections and constructing a
common identity between Maratha and non-Maratha groups, the Congress did not overtly
mobilize OBC groups at the height of its power in Maharashtra (Palshikar 1996).
Indira Gandhi attempted to weaken Maratha domination in the 1970s and early 1980s as
part of her broader nation-wide strategy to attract weaker socio-economic sections. This strategy
did not lead to a wholesale realignment of the Congress’ social bases in Maharashtra in the 1970s
as it did in many other states. It would, however, put considerable pressure on the Congress’
Maratha-OBC base through the 1980s and fragment the Maratha leadership within the party. The
Congress’ hold on Marathas would subsequently weaken significantly in the 1990s. The growing
fragmentation of the Maratha vote in the 1980s would, in part, lead to the emergence of the BJP
and Shiv Sena (SS) as key players in the state’s politics. The BJP was largely a Brahmin and
Bania party while the Shiv Sena’s strength primarily came from Maratha support, which it drew
away from the Congress in the latter half of the 1980s and early 1990s. Since the late 1980s, the
BJP and SS have contested as an alliance in Maharashtra elections.
Though the Congress remained electorally successful in the 1980s, its victories concealed
considerable weaknesses in the party’s hold on its key bases, notably the Maratha-Kunbi and
OBC groups. By the time the 1990 assembly election occurred, these weaknesses became
evident. The Congress did manage to win the 1990 assembly elections but saw a major decline in
its vote share. It continued to rely on a social base of the dominant Maratha-Kunbis and OBCs
supplemented by other groups such as the Dalits. Based on the inclusion of wide range of socio-
economic groups as well as the business interests, this coalition is classified as wide-right.
292
The Congress’ declining strength among key social groups was clearly evident by the mid-1990s.
Palshikar and Birmal (2009) suggest that the three main trends in Maharashtra’s politics in the
1990s was a fragmentation of the Maratha-Kunbi vote, factionalism within the Maratha
leadership of the Congress in the state and growing electoral competitiveness. Deshpande and
Birmal (2009) suggest that these trends were accompanied by a complex pattern of identity
politics in the state since the 1990s. It was under these circumstances that the BJP-SS alliance
began to consolidate its own Maratha support under the banner of Hindu nationalism. While the
two parties were strong in urban areas, they began to make clear inroads into the Congress’ rural
Maratha base by the mid-1990s.
The BJP-SS strategy would prove successful and in 1995 the alliance formed the second
non-Congress government in Maharashtra’s history. The victory was backed by strong Maratha
support for the SS combined with BJP’s strength among upper castes. In addition, the BJP-SS
combine complemented this support with that of the OBCs. Since 1995, OBC support for the
BJP in particular would increase further. Election survey data in Palshikar and Deshpande (1999)
show that though the Congress continued to receive a notable portion of the Maratha-Kunbi vote,
the group supported the BJP-SS coalition in greater numbers. OBC vote shares were split
between the Congress and BJP-SS, with latter appearing to hold a slight edge. The Congress
however continued to be the main party of choice for the marginalized Dalit and OBC sections.
The BJP-SS winning coalition’s strength was based substantially on the dominant Maratha-
Kunbi group as well as upper caste support and supplemented by partial OBC support. Palshikar
and Deshpande suggest the OBCs still remained divided between the Congress and BJP-SS in
1995 but would begin to move in sizeable measure towards the latter. In 1995, the BJP-SS did
not receive strong support from more marginalized sections. Based on its reliance of the
293
Maratha-Kunbis as its core group, I classify the electoral coalition in Maharashtra between 1995
and 1999 as narrow-right. The BJP-SS coalition would look to consolidate its Maratha –Kunbi
vote base and began to make even greater inroads into the OBCs by the late 1990s.
In a background of considerable electoral uncertainty and growing fragmentation, the
Congress, however, managed to come back to power in 1999 in coalition with the NCP. The
NCP was a break-away party formed in 1999 by one of the Congress’ heavyweights in the state,
Sharad Pawar. Pawar had been chief minister of the state in the 1980s and enjoyed extremely
strong support among his fellow Maratha caste members, particularly in rural parts of the state.
Factional struggles saw Pawar leave the Congress on a prior occasion in 1978, only to rejoin the
party soon after. His second departure from the Congress has so far proved permanent. With the
decline in its own Maratha-Kunbi support base, the Congress benefitted from the fact that the
NCP’s core base comprised of this group. At the same time, the Congress continued to be the
party of choice for Dalits, Adivasis and Muslims. Palshikar and Birmal (2009) suggest that with
the move of its core Maratha-Kunbi support to the BJP-SS, the Congress has had to build a base
around “new and temporary” supporters. The Congress-NCP main support comes from a diverse
range of groups including the Maratha-Kunbis, Dalits, Adivasis and Muslims. It does also
receive some support from OBCs, though the BJP-SS alliance enjoys an advantage in support of
this group. Given the diversity of socio-economic profiles as well as the incorporation of key
business interests, I classify this coalition as wide-right.
The Congress-NCP managed to win in both 2004 and 2009 based on a similar wide-right
coalition. In 2004, the vote bases of the Congress and NCP once again complemented each other;
the former receiving support from Dalits, Adivasis and Muslims while the latter relying primarily
on core support from the Marathas. In 2004, BJP-SS support came primarily from Maratha-

294
Kunbis and OBCs. The Congress-NCP achieved a rare third consecutive assembly election
victory in 2009 in the midst of considerable social churning. Again, the mutual strengths of the
two parties – the NCP among Marathas and the Congress among Dalits, Muslims and Adivasis –
formed the basis of the victory and I classify the electoral coalition as wide-right as in the case of
the 1999 and 2004 victories. As Palshikar, Deshpande and Birmal (2009) describe the Congress
is becoming a rainbow party receiving some support from a range of social groups and have
strengths only among the Dalits, Adivasis and Muslims. The support of Marathas and OBCs was
split between the main parties but the NCP’s core strength among the Marathas remains crucial
to the Congress. In addition, the 2009 election saw the entry of a new player – the MNS. The
MNS was a break-away group of the SS. The Congress-NCP victory in 2009 was helped by the
MNS cutting into the SS’ Maratha support. While the state appears to have settled into bipolar
competition between the INC-NCP and BJP-SS, there remains considerable fluidity in voter
support from key social groups.
Haryana
Since its formation in 1966, Jats have been the key political players in the state. Jats are a
landowning dominant caste who are primarily engaged in agriculture and constitute between 25
and 30% of Haryana’s population (Jodhka 1999). The state has a sizeable Dalit section – about
18% of the population. Jodhka suggests that other landowning groups constitute between 8 %
and 11% of the population with the Gujjars and Rajputs comprising 2 to 3% and Yadavs about 6
to 8%. Brahmins and Banias are numerically small but have been visible in state politics.
Given their numerical strength, Jats have been crucial players in state politics. Compared
to other groups, Jat political mobilization occurred early and they have historically tended to
295
view the Congress as anti-Jat (Datta 2005). Another key trend in Haryana politics has been high
levels of anti-incumbency and electoral volatility (Pal and Rai 2009). Haryana saw successive
changes in government between 1991 and the 2005 and has also tended to see swings in party
support of certain groups. In 1987, Devi Lal and the Lok Dal backed by strong Jat support won
the assembly election in the state. Four years later, it was the Congress that displaced the Lok
Dal and the party has relied on the support of Dalits, who have been loyal Congress supporters in
the state (Joshi and Rai 2004). The Congress has historically relied on a core base of Dalits,
OBCs and Muslims in Haryana and has typically not been a party of choice of the sizeable
Dalits. Based on the fact that its core groups are similarly socio-economically marginalized ones,
I classify the coalition between 1991 and 1996 as narrow-left.
In conforming to the anti-incumbency theme, the Congress lost power to the HVP-BJP
coalition in 1996. The HVP is primarily a rural Jat party and its base was complemented by the
BJP, whose strength is derived from Brahmins and Banias in urban areas (Wallace 1997). Given
that this coalition is more diverse in socio-economic terms than the Congress’ base in 1991, I
classify the coalition as wide. The HVP-BJP coalition would last only three years and, in 1999,
Haryana went back to the polls in 2000. The 2000 assembly election saw the INLD emerge as
the victor under Devi Lal’s son, Om Prakash Chautala. The INLD is primarily a party of Jats and
relies substantially on their support (Heath and Yadav 2000). Heath and Yadav’s survey data
suggests that the party’s primary strength comes from the Jats and other peasant castes and this
support is supplemented by upper castes and some OBC support, though the Congress remained
the main party of choice for these groups. As in the case of the HVP-BJP coalition, the INLD’s
base exhibits a relatively wide range of socio-economic support and this electoral coalition is
classified as wide-left.
296
The INLD subsequently lost power in 2005 to the Congress and in 2009. As in the early
1990s, the Congress’ core support Dalits, OBCs and Muslims (Heath and Yadav 2000; Joshi and
Rai 2004). As in the case of the previous Congress government between 1991 and 1996, the
coalition comprising a core of these socio-economically weaker sections falls under the narrow-
left category. In 2009, the Congress retained power; an extremely rare feat given Haryana’s
trends of anti-incumbency. In 2009, the state saw a multipolar contest between the Congress,
INLD-BJP coalition, HJC and BSP. Though it lost some Dalit support to the HJC and BSP, it
received a sizeable proportion of the Dalit vote share while retaining its hold on the OBCs and
Muslims. In contrast to 2005, the Congress’ share of the Jat vote increased significantly and this
meant that its coalition was more diverse in its economic profile than previously. As such, this
coalition is classified as wide-left.
Orissa
Since the mid-1990s, Orissa has seen bipolar competition between the Congress and
BJD-BJP coalitions. In the early 1990s, Biju Patnaik and the JD enjoyed considerable strength in
Orissa. It won the 1990 elections but was subsequently defeated by the Congress in 1995. The
BJD, an offshoot from the JD, was formed in 1997. The BJD-BJP coalition won state elections in
2000 and 2004 and, in 2009, the BJD won assembly elections on its own.
Unlike the JD ‘s experience in north India, the party was not built around an OBC base in
Orissa (Kumar 2004). Despite the size of OBCs in Orissa, they have historically played a more
marginal role in the state’s politics, which has been dominated by the Brahmins, Karnas and
Kshatriyas. These three groups have dominated party politics as well as the state bureaucracy.
Kumar points out that the political leverage of the upper castes is enhanced by the fact that they
297
are concentrated in coastal areas of Orissa. The Khandayats, who fall under the OBCs, are a
notable exception to the general weakness of OBC political mobilization in the state. Kumar also
points out that the state also has a high proportion of Adivasis (22.2%) and Dalits (16.2%).
Both the JD and BJD in Orissa depend on support from a broad range of castes. Until the
late 1990s, the Congress similarly received fairly broad support. Upper castes and Khandayats
tend to be strong BJD supporters. The OBC vote has been split. While electoral surveys indicate
a recent move towards the BJD, votes of this group is split between the BJD and Congress.
Dalits used to be core supporters of the Congress but since 1999 have moved towards the BJD
(Kumar 2004). Adivasis have been Congress loyalists but the BJP receives some Adivasi
support. In sum, Orissa’s winning parties since 1991 have received support from a broad range
of social groups. The entrepreneurial base is thin and as a result business is not represented in
these coalitions. I therefore classify Orissa’s electoral coalitions as wide-left.
Rajasthan
Rajasthan is a two-party state where the BJP and the Congress have both come to power
since the 1990s. The BJP won assembly elections in 1990, 1993 and 2003. The Congress won in
1998 and 2008. Both parties derive support from distinct sets of voters. Unlike some other north
Indian states, Rajasthan has continued to see upper caste political in the post-Mandal period
(Jaffrelot 2009a). The upper castes also form a sizeable portion of the population relative to
other Indian states – 20.5% (Lodha 2009). The BJP’s primary base consists of upper caste groups
(Brahmins, Rajputs and other upper caste groups) and this is supplemented by some intermediate
non-Jat OBC groups (Lodha 2009, 2004). Increasingly, the party has seen greater support from
Dalits and Adivasis. This coalition consists of a broad range of support and I therefore classify
298
BJP coalitions as wide. The Congress tends to derive support from a narrower base. The party’s
core support consists of Jats, Dalits and Muslims. It also receives some Adivasi support. These
groups tend to be the most marginalized in socioeconomic terms. The class profile is confined.
As a result, I categorize this coalition as narrow. In addition, like its other north Indian
counterparts, there are few entrepreneurial groups. As such, both Congress and BJP coalitions
have minimal business representation. The coalitions that have backed the BJP have been wide-
left while those backing the Congress have been narrow-left ones.
Uttar Pradesh
Uttar Pradesh’s coalitions have been coded on the basis of the following sources – Brass
(1997), Hasan (1996), Duncan (1997), Jaffrelot and Zerinini-Brotel (2004) and Pai (2002, 2004).
Since 1989, UP has seen the continuous and sustained rise of lower caste groups, most notably
the OBCs. The post-1989 period has also seen high levels of party system fragmentation and
unstable coalitions at the helm of UP politics. Since 1989, social groups have been polarized
along party lines. The BJP’s core support comes from the upper castes. It also relies on some
OBC sections. The SP depends on Yadavs and Muslims while the BSP’s main base is among the
Dalits. In 2007, this Dalit base was supplemented with upper caste support. The Congress has
weakened significantly in UP since 1989. The entrepreneurial base in the state is thin. As a
result, minimal business representation is the norm.
UP has seen BJP, BSP-SP, BJP-BSP and BSP governments since 1991. I classify BJP
and BJP-BSP governments as wide left. The BJP’s base consists of certain economically-
advanced castes and OBCs. There is considerable heterogeneity in the profile of these groups
and this coalition is classified as wide. In addition, the BJP has been in coalition with the BSP,

299
which depends on Dalit support. This coalition has similarly been wide. I classify BSP-SP
coalition as narrow-left since support is derived from three of the most socioeconomically
marginalized groups in UP – Dalits, Muslims and Yadavs. Business representation is minimal in
all UP coalitions.
Madhya Pradesh
Coalitions are classified based on Pai (2004), Sisodia and Shankar (2009), Jaffrelot and
Zerinini-Brotel (2004) and Jaffrelot (1996). MP is a two party state. Congress won elections in
1993 and 1998. The BJP has won in elections in 2003 and 2008. Unlike other parts of the Hindi
heartland, the Congress managed to retain considerable support from lower castes in the post-
Mandal era and Pai (2004) suggests that this was because Dalit and Adivasi issues were included
in the broad ambit of economic development under Digvijay Singh. The Congress relied on a
wide base including Dalits, Adivasis and OBCs. A section of upper castes support the Congress
as well. The BJP derives strong support from the upper castes but its base is broad and included
upper castes, OBCs and this has been supplemented by increasing Adivasi and Dalit support.
Business presence is weak in the state and like the case of UP, Rajasthan and Bihar, coalitions on
the “left” are the norm. I classify both Congress and BJP coalitions in MP as wide-left.
West Bengal
The Left front was in power in West Bengal between 1977 and 2011. The Left’s coalition
consisted of a wide range of groups including Dalits, Adivasis, Muslims and some upper castes.
Dalits (Chaudhuri 2007). Dalit, Adivasi and Muslim support were particularly important. Under
colonial rule, entrepreneurial groups were present in West Bengal. However, unlike western
India, West Bengal was dominated by British capital. Indigenous business development was
300
considerably weaker than in western India. Since the 1970s, West Bengal saw major
deindustrialization. Bania and Marwari groups that constituted the bulk of local entrepreneurship
started looking elsewhere. By the 1990s, the state’s local entrepreneurial base was thin. I classify
the Left Front coalitions in the 1991-2010 period as wide-left.
Kerala
Kerala has seen alternation of power between the CPI(M)-led LDF and the Congress-led
UDF coalitions. Both coalitions attract a wide range of support. The LDF tends to attract greater
support from three marginalized sections – the Ezhavas, OBCs and Dalits (Gopa Kumar 2009;
IBRAHIM 2009). The Congress is the party of choice for Muslims and Christians. Upper caste
and Nair support tends to be split between the two fronts. Kerala does have an entrepreneurial
base, though these groups are small. Due to the wide range of support for both coalitions and the
presence of business representation, I classify both LDF and UDF coalitions as wide-right.
Tamil Nadu
Tamil Nadu has seen increasing party fragmentation since the 1990s (Wyatt 2002). Groups
such as the MDMK and PMK now command sizeable support among particular social groups.
Despite this, the state has seen alternation of one of the two main Dravidian parties, the
AIADMK and the DMK. The Congress remains a distant third force in this political space. The
Dravidian parties have had to increasingly rely on smaller parties. They now have to enter into
arrangements with parties such as the PMK and MDMK to attract the support of groups such as
Vanniyars and Thevars. Despite this reliance, both the AIADMK and DMK have come to power
with diverse bases of support (Thirunavukkarasu 2001). Tamil Nadu’s entrepreneurial base is
fairly diverse in social terms. Among other groups, upper castes, Chettiars, Nadars and Gounders

301
have sizeable business presence (Damodaran 2008). These groups are small in size.
Nevertheless, due to the wide range of support as well as the inclusion of entrepreneurial groups,
I classify Tamil Nadu’s coalitions as wide-right.

302
6. Conclusion
Conventional wisdom suggests that poor democracies are unlikely to focus on growth-
oriented policies. According to a long literature on redistribution, poorer individuals prefer
greater redistribution. Others suggest that democracies have a greater proclivity to redistribute
than non-democracies. In the context of the developing world, where resources are limited yet
capital-friendly policies have to be adopted to ensure growth, a trade-off between growth-
oriented and redistributive policies typically exists. As such, developing democracies are
unlikely to prioritize growth-oriented issues. Yet, India poses a major puzzle for existing
explanations. Triggered by an extensive shift in its economic policy framework in 1991, India
has been among the fastest-growing countries in the world over the last two decades.
India’s growth transformation is surprising at many levels. By its own standards, India’s
growth after 1991 represented a major break with the past. For more than three decades after
independence, India remained mired in economic mediocrity – the infamous “Hindu rate of
growth” of 3.2 per cent characterizing its performance for the first three decades after
independence. In contrast, it has seen average annual growth rates of over 6.5 per cent between
1991 and 2010.
If India’s growth transformation is surprising in light of its own history, it is even more
puzzling when viewed in a comparative context. Like other cases of successful late development
in the post-World War II period such as China and South Korea, the scope and scale of India’s
economic transformation has been vast. But the political context under which this change has
occurred has been dramatically different. Not only did vibrant democratic politics precede
India’s move to a high growth path, economic change has occurred in a polity where the poor
303
form a majority of the electorate. More importantly, the poor are more likely to participate in
electoral politics in India than those above them on the socioeconomic ladder. Democracy aside,
India also differs from other successful late developers in another crucial respect. Unlike many
other late developers, India is extremely diverse in ethnic terms. For some economists, ethnic
diversity results in poor economic and policy outcomes (e.g., Alesina et al. 1999; Easterly and
Levine 1997; Miguel and Gugerty 2005a). Not only do high levels of ethnic heterogeneity
prevail in India but the social context is characterized by a long-entrenched, hierarchical system
– caste. For a variety of reasons, India, at first glance, was an unlikely candidate to prioritize
growth-oriented concerns.
Unlikely as it was, India’s growth transformation has occurred in a context that is now
widely shared by several developing countries. With the third wave of democracy, poor countries
have to simultaneously balance imperatives of democracy and economic development. Like
India, many developing countries, particularly in Africa and south-east Asia, have high levels of
ethnic heterogeneity. Not surprisingly, this diversity often finds expression in the electoral space
as it has in the Indian context. India, therefore, provides a useful context from which to gain
insights into a very broad but deeply consequential question. What are the political conditions
favorable to growth-oriented policies in poor democracies? To analyze this large question in a
more tractable fashion, I focused on a specific empirical puzzle in this dissertation. I examined
varied subnational policy responses to the competition for investment in India after 1991. As is
widely acknowledged both in the economic literature and in policy circles, investment is a
critical input in the growth process.
Despite being subject to similar institutional conditions and experiencing a common shock in
the form of the 1991 reforms, Indian states have reacted very differently to the competition for

304
investment. Some states have been far more proactive and investor-friendly in policy terms than
their counterparts. And these differences are not captured by a simple rich vs. poor state
dichotomy. Indeed, initial conditions in 1991 do not completely account for these patterns
observed. Nor do conventional explanations privileging colonial heritage, political competition
or ideology. Moreover, the electoral context across Indian states is broadly similar in one aspect
– the poor form the largest and most critical section of the electorate. What then explains the
divergence in policy responses across Indian states in the competition for investment? Why have
some states been far more investor-friendly than their counterparts?
6.1. Findings
Based on a comparison of Indian states, I found that there are conditions under which
redistributive pressures are muted and growth-related policies can be prioritized, even in the
presence of a predominantly poor electorate. I advanced a two-stage argument that privileged the
role of electoral coalitions. At a proximate level, my argument inherently relies on the logic that
an overlap of political and economic power provides the most favorable conditions for advancing
an investor-friendly agenda. I draw on this insight from the developmental state literature, which
highlights the critical relationship between state and capital (Amsden 1989; Evans 1995; Johnson
1982; Kohli 2004; Wade 1990). While the type of “marriage of repression and profits” that
Kohli (2004: 13) emphasized in the case of cohesive capitalist states in East Asia is not possible
in India’s well-established democratic context, there are parallels.
In particular, one of these parallels forms the background to my first main claim. At a
proximate level, I suggest that certain types of electoral coalitions with a confined class basis are
most conducive to the prioritization of a pro-business agenda. Specifically, I argue that narrow-

305
right coalitions, characterized by the joint presence of core groups with similar economically-
advanced profiles and substantial representation of business interests, are most conducive to
investor-friendly policies. Redistributive pressures on policymakers backed by such coalitions
are more muted. They are also not pulled in multiple directions by divergent demands. As a
result, policymakers backed by narrow-right coalitions can prioritize a pro-business agenda.
At the same time, narrow-right coalitions have a confined class profile that is
unrepresentative of the broader electorate in poor democracies. The key question then is how do
such coalitions arise in the midst of a poor electorate? The answer that I offer, which forms my
second main claim, is perhaps a little surprising. I suggest that such narrow class coalitions can
arise in developing democracies if the basis of electoral politics is non-economic. In a variety of
poor democracies, programmatic, class-based mobilization is absent. Instead, both party
strategies and voter attachments tend to be driven by symbolic concerns; most often these
revolve around identity, ethnicity or nationalism. Where such symbolic issues, based on social
attachments, cut across economic interests, class politics is impeded. Furthermore,
unrepresentative, narrow class coalitions can arise in such cases.
The explanation for the origins of coalitions is a mid-range one and context matters in
determining which non-economic issues drive electoral politics. In the case of Indian states,
social identity, particularly caste, has been central to electoral politics. I find that the impact of
identity politics on both party strategies and voter attachments has allowed narrow coalitions to
emerge in some Indian states. In terms of party strategies, the impact of identity politics has been
filtered through the underlying social cleavage structure. In other words, I find that social
demography affects incentives of parties in constructing electoral bases of support.
306
I find that different social cleavage patterns can be associated with particular party strategies
of electoral coalition construction. Based on the dimensions of group size and economic resource
control, I classify India’s diverse cleavage structure into four patterns. These diverse patterns
have led to different incentives for political parties. In particular, dominant caste structures,
which include large entrepreneurial groups, provide enabling conditions that have allowed the
emergence of narrow-right coalitions. In contrast, Hindi-heartland patterns with large,
economically-marginalized groups can be associated with narrow-left coalitions. Finally, two
cleavage patterns that I term “southern” and “cross-cutting” are characterized by groups with
little numerical strength. While entrepreneurial groups exist, these groups are small. As such
these coalitions provide greater incentives for parties to target a wide range of social groups in
constructing electoral coalitions. Voter attachments have, in turn, interacted with these party
strategies. I find that social identity is a key determinant of voting decisions in India. As a result,
parties in some states can rely on the en masse support of certain social groups.
The findings were based on a combination of quantitative and qualitative analysis. The
dissertation employed a nested research design. The two-step argument was first demonstrated
through four in-depth case studies of Gujarat, Punjab, Bihar and Andhra Pradesh. I then tested
the argument on a broader sample of fourteen states in the 1992 and 2010 through a time-series
cross-section analysis.
6.2. Implications for broader debates
My argument has implications for several existing debates in the comparative politics and
international political economy literatures. In particular, it engages closely with existing studies
on the politics of policymaking and growth, the economic role of the state, ethnicity and
307
development, and the effects of mobile capital on policymaking. In addition, the study is relevant
to specific issues in Indian political economy. I outline each of these below.
6.2.1. Politics of economic policymaking and growth
At the most general level, my dissertation suggests that greater scrutiny of the link between
social attachments and economic outcomes is merited in studies of policymaking and growth in
developing countries. Unlike advanced industrial countries, which have been the primary focus
of the political economy literature on growth, trends of policymaking in developing countries are
markedly different. For a start, programmatic politics is conspicuously absent in many
developing countries. Instead, symbolic factors, rather than substantive economic concerns, form
the core of electoral politics in poor democracies.
The analysis of Indian states in this dissertation highlights the non-economic basis of
electoral politics. Social identity has played a critical part in democratic politics in India. At both
the level of parties and voters, social attachments cut across economic interests. The dynamics of
policymaking in cases where social attachments cut across economic interests tends to be very
different. As was clear from the subnational context in India, the centrality of social identity
inhibits class-based electoral mobilization. It can also lead to coalitions that are unrepresentative
in terms of the socioeconomic profile of the broader electorate. Narrow-right coalitions in
Gujarat and AP exemplify this dynamic. As such, several existing hypotheses on politics and
policymaking that assume class-based electoral mobilization have limited applicability in many
poor democracies such as India.
Aside from highlighting the role of social identity on economic policymaking, my
dissertation also draws attention to another dynamic that differs between advanced industrial
308
economies and developing democracies. Policymaking in developing countries often involves
stark trade-offs, most notably between growth-related and redistributive issues. Resources are
limited in developing democracies and countries have to undertake tasks of development and
democracy simultaneously. Moreover, the benefits of growth often occur in the long-term but
costs of pro-business policies necessary to spur growth have to be borne in the short-term. Not
surprisingly, high levels of political contestation have surrounded pro-business policies in
developing countries. In the case of Indian states, chapter 2 provided several examples of such
contestation. Perhaps no economic policy issue has been as politically polarizing in India as the
acquisition of land by governments for industry. The trade-off between growth and redistribution
has also meant that politicians have actively avoided highlighting growth or economic reforms in
election campaigns.
The analysis of subnational investment policies in this dissertation points to a sobering aspect
related to the politics of growth in developing countries – the conditions most conducive for the
prioritization of growth-oriented policies are at odds with broad democratic participation. Indeed,
fostering growth involves difficult trade-offs. It also involves privileging certain societal classes,
most notably capital, over others in terms of policy. As the developmental state literature has
clearly highlighted, successful cases of late development in the post-World War II period have
been built on a base of close state-business relations. Such close relations imply a narrow apex of
policymaking and coincidence of goals between the state and private capital (Kohli 2004). I
similarly find in this analysis that governments that have been most proactive in the competition
for investment in India have been those that have derived support from narrow class coalitions.
While these narrow coalitions allow the state to prioritize growth-oriented policies, they are in no
way representative of the broader electorate. In that sense, this dissertation strongly supports
309
Kohli’s claim that India’s high growth phase is simultaneously responsible for progressive
dynamism at the apex and exclusion of certain groups in the polity and the economy (Kohli
2012).
6.2.2. The role of the state in economic development
In emphasizing policy responses of the state, my dissertation shares an affinity with the
developmental state literature. An analysis of investment promotion policies in chapter 2
suggests that the economic role of the state remains as relevant today as it was at the time when
East Asia underwent a dramatic transformation. States continue to perform vital tasks that
critically affect investor decisions. However, unlike the authoritarian developmental states of
East Asia, increased capital mobility and electoral pressures have led to a different set of
constraints on the ability of states to effect change in most developing countries today.
This changed context has led to a shift in the nature of state involvement and the types of
policy tools used. An analysis of the tasks undertaken by Indian states in the competition for
investment offers some insights into the changing economic role of the state. As Kohli (2012)
suggests, the Indian state has always played less of a transformative role than classic East Asian
developmental states. The state’s involvement in India has typically been facilitative. This focus
on facilitation, rather than direct involvement, has been clearly evident in the subnational context
after 1991. States such as Gujarat see their primary role as creating a supporting environment
where transactions costs for business are lowered. Unlike the classic developmental states, there
are few attempts to manufacture comparative advantage or ‘pick winners.’ Certain policy tools
such as concessional finance are also no longer available to states in a context where firms have
multiple sources of funds.

310
Aside from these changes, the mobility of capital has resulted in growing leverage of
business. The type of policy tools used in the Indian context reflects this power to some extent.
Successful state involvement in the Indian context has involved predominantly carrots and
almost no sticks. This is largely because of business’ ability to relocate across jurisdictions.
Concessions and subsidies tend to be widely-used policy tools used by states in India. Such sops
to business are clearly suggestive of business’ growing power after 1991. Large investors, in
particular, are able to bargain between competing units to obtain favorable terms.
In sum, my dissertation suggests that the role of the state remains crucial to economic
trajectories in the developing world. However, a context of democratic pressures and mobile
capital has resulted in changes. The Indian case suggests that the type of direct involvement
undertaken by the classic developmental states appears to be a thing of the past. Given the
growing leverage of business, engendered by greater mobility, state activism has taken on a more
facilitative bent.
6.2.3. Mobile capital and policymaking
At the start of the current era of globalization, some scholars predicted that capital
mobility would lead to a convergence of economic policy in units competing for business (e.g.,
Andrews 1994; Cerny 1993). States had to adopt similar capital-friendly policy environments or
risk losing investment to competing jurisdiction. At the extreme, this line of argument predicts a
race to the bottom along several policy dimensions. Other scholars, focusing on advanced
countries, have found that claims of policy convergence are not supported empirically (Garrett
1998; Mosley 2003). The subnational context in India offers a useful context to evaluate these
competing claims of policy convergence and divergence in the face of capital mobility. Unlike
311
the cross-national context, Indian states are bound by similar fiscal, electoral and constitutional
rules. A variety of institutional differences, which could have had confounding effects, are
controlled for in a subnational research design.
The analysis of state-level investment promotion policies in India points to two trends.
First, there is little doubt that the leverage of capital has increased in India in light of the
competition for investment. In particular, inter-state competition for large investment projects
epitomizes the growing power of business. The Tata Nano case in chapter 2 clearly highlighted
this dynamic. The second insight that can be drawn from the Indian case is that capital’s growing
power does not necessarily lead to policy convergence across competing units. In fact, there is no
empirical evidence to support the claim of policy convergence across Indian states. The evidence
in chapter 2 is in line with the “divergence” claim.
Perhaps, what is missing most notably from the convergence hypothesis is politics. As
most of this dissertation has attempted to show, social and political environments are critical in
shaping investment promotion policies. These varied environments place dissimilar constraints
on policy makers and certain conditions are more conducive to the prioritization of investor-
friendly policies. Diverse social and political environments have, thus, meant that state policy
responses have varied significantly.
6.2.4. Ethnicity and development
The second stage of my argument offers a social origins explanation for the emergence of
electoral coalitions in India. In particular, it focuses on ethnicity, specifically caste. In line with a
rapidly growing body of work in comparative politics, this dissertation associates ethnic politics
with economic outcomes (e.g., Lieberman 2009; Singh 2010b). Like many of these scholars, this

312
dissertation suggests that ethnic diversity does not automatically lead to political polarization.
Nor does it preclude positive economic outcomes; a claim that has been advanced by several
studies in the economics literature (Alesina and La Ferrara 2005; Alesina et al. 1999; Easterly
and Levine 1997; Miguel and Gugerty 2005a). Indeed, India’s growth transformation on the
whole belies such claims.
However, my argument suggests an association that has generally been overlooked in the
comparative politics literature. Drawing on the subnational context in India, I show that ethnicity
is closely linked to entrepreneurship in some contexts. In the Indian case, historical links
between caste, occupation and economic resource control have meant that entrepreneurship is
unevenly concentrated in the polity. Certain social groups tend to be overrepresented in the
entrepreneurial base in most Indian states. In this regard, my dissertation highlights an important
link between ethnicity and entrepreneurship that has not been emphasized in the comparative
politics literature. The ethnic origins of entrepreneurship has, however, been central in studies of
Indian business history (e.g., Damodaran 2008; Tripathi and Jumani 2007). Some economists
have similarly emphasized the link between ethnicity and economic activity in contexts outside
India (Greif 1993; Fafchamps 2000). As such, the analysis in this dissertation suggests that
entrepreneurship and economic power are not equally distributed in the population. Rather, they
tend to be concentrated among certain groups because of the position of these sections in the
traditional social hierarchy. The concentration of economic power among certain sections of
society has implications for the dynamics of policymaking.

313
6.2.5. Issues specific to Indian political economy
Finally, my dissertation engages with studies in Indian political economy. A growing
body of work in political science and economics has highlighted the divergence of economic and
policy outcomes across Indian states (e.g., Ahluwalia 2000; Besley et al. 2007; Kochhar et al.
2006a; Lieberman 2009; Singh 2010b; Sinha 2005). In highlighting marked policy differences
across Indian states, my dissertation joins this literature. The rising focus on a subnational level
of analysis points to the fact that making national-level generalizations on economic outcomes in
India is increasingly difficult. Economic transformation in large polities such as India is an
uneven, complex process. Aggregating outcomes at a national-level of analysis can mask
important changes underneath. This is particularly true when economic and political leverage of
the states vis-à-vis the center has grown in the post-liberalization period. My dissertation
squarely points to dissimilarities below the national level.
Aside from interacting closely with existing work in Indian political economy, this
dissertation speaks directly to a long-standing puzzle in Indian politics. Though the poor form a
majority of the electorate, lower class coalitions have been conspicuously absent in India. More
generally, class-based electoral mobilization in India has been weak. My dissertation addresses
the question of why this is the case. In answering this question, it points to the role of social
identity. Social identity, notably caste, cuts across economic interests in the electoral realm. This,
in turn, impedes the development of class politics. The claim that caste cuts across class interests
is hardly new. Indeed, in explaining the lack of lower class revolts in India in his seminal study,
Barrington Moore pointed to the segmenting role played by caste (Moore 1969). Yet, the role of
caste in limiting class-based mobilization and, in turn, affecting economic outcomes is not
314
widely analyzed in the Indian political economy literature. My dissertation suggests that this link
needs to be explored more closely.
6.3. Open questions and future avenues of research
This dissertation attempted to address a broad yet consequential question on the political
conditions conducive to growth in developing democracies. The two-stage explanation that it
provided was linked closely to the Indian context. In particular, the second stage of the argument
drew on aspects related to local social demography in India. How relevant is the study to
contexts outside India? Where are we likely to see similar political dynamics?
While I do not claim generalizability to all developing country contexts, I believe that the
broader insights of this dissertation are applicable outside India. Like Indian states in this
dissertation, states in other developing countries must interact with private capital to ensure
growth. In that sense, the imperatives of policymakers in other developing countries to foster
growth are no different from those in India. More importantly, like their Indian counterparts
today, policymakers elsewhere have to balance the need for pro-business policies with
democratic pressures. The subnational context in India clearly highlights the constraints and
difficulties arising from having to balance these two imperatives simultaneously. Policymakers
in India and other developing countries also share a common background in terms of the
sequence of democracy and industrialization; democracy has preceded industrialization in most
poor democracies. In that sense, there are clear parallels between India and other developing
countries. An analysis of the Indian context can offer lessons on the micro-dynamics of
economic policymaking in developing democracies.
315
Though the central problem faced by policymakers in other developing contexts is similar to
those in India, my argument is more likely to be applicable to parts of the developing world than
others. In particular, the second stage of my argument focuses on non-economic factors of
electoral mobilization. This, in turn, suggests that the explanation is most likely to be applicable
in developing countries where ethnicity, identity, nationalism or other symbolic factors drive
electoral politics. At first glance, most African countries as well as south-east Asian cases such
as Malaysia and Indonesia seem to be likely candidates to fit the bill. The extension to other
contexts, however, remains an open question and one that I hope to address in future work.
A second open question is linked to the pre-eminence of identity politics in India. I take the
centrality of identity politics as an empirical given in the Indian context. I do not attempt to
explain the origins of identity politics. Two broad genres of explanations exist in this regard. The
first and older strand arises from Indian political sociology. Authors such as Kothari (1970a)
suggest that democracy was overlaid on a deeply entrenched and regressive social system. As
such, pre-existing social groupings became natural cleavages around which politics was
organized. Politicians found that such groupings had a basis in societal consciousness and, at the
same time, offered enough flexibility to be moulded for political ends.
A more recent rational choice explanation has been advanced by Chandra (2004). In
attempting to explain the success of ethnic parties, Chandra asks why voters vote on the basis of
ethnicity and politicians mobilize voters on this basis. She suggests that in low information
environments, which characterize patronage democracies, it is rational for voters to vote for co-
ethnics in anticipation of benefits. Similarly, in such low information environments, it is rational
for politicians to expect loyalty of co-ethnics and target these individuals. There is, thus, no clear
consensus on the origins of identity politics in India. Its origins merit further examination.

316
Finally, Bihar’s surprising economic transformation has led commentators in the Indian
media to suggest that the hold of caste politics may be weakening and that voters are increasingly
rewarding economic performance. The example of the JD(U)-BJP’s second electoral victory in
Bihar in 2010 is often used to support this claim. It is unclear if this is a temporary phenomenon
or whether there has been a qualitative shift in the nature of voter attachments. Even if it is true
that economic performance is increasingly being rewarded, it is an extremely nascent trend.
Moreover, it may not be the case that the focus on economic performance completely
overshadows the importance of social identity in electoral politics. Nevertheless, it remains a
trend that might become more evident over time in India.
317
References
Acemoglu, Daron, Simon Johnson, and James Robinson. 2001. "The Colonial Origins of Comparative Development: An Empirical Investigation." American Economic Review 91 (5):1369-401.
Acemoglu, Daron, and James Robinson. 2005. Economic Origins of Dictatorship and Democracy. Cambridge: Cambridge University Press.
Ahluwalia, Isher Judge, Saumitra Chaudhuri, and Samrat Sidhu. 2008. "Punjab Industrial Review." UNIDO.
Ahluwalia, M.S. 2000. "Economic Performance of States in the Post-Reforms Period." Economic and Political Weekly May 6:1637-48.
Aiyar, Swaminathan S. Ankalesaria. 2008. "The Benefits of Port Liberalization: A Case Study from India." Washington D.C. : Cato Institute.
Alesina, Alberto, and George-Marios Angeletos. 2005. "Fairness and Redistribution." American Economic Review 95 (4):960-80.
Alesina, Alberto, Reza Baqir, and William Easterly. 1999. "Public Goods and Ethnic Divisions." Quarterly Journal of Economics 114 (4):1243-84.
Alesina, Alberto, and Eliana La Ferrara. 2005. "Preferences for redistribution in the land of opportunities." Journal of Public Economics 89 (5-6):897-931
———. 2005. "Ethnic Diversity and Economic Performance." Journal of Economic Literature 43 (3):762-800.
Alesina, Alberto, and R Perotti. 1996. "Income Distribution, political instability and investment." European Economic Review 40:1203-28.
Alvarez, Michael R., Geoffrey Garrett, and Peter Lange. 1991. "Government Partisanship, Labor Organization, and Macroeconomic Performance." American Political Science Review 85 (2):539-56
Amsden, A. 1989. Asia's Next Giant: South Korea and Late Industrialization. Oxford: Oxford University Press.
Anand, J.C. 1976. "Punjab: Politics of Retreating Communalism." In State Politics in India, ed. I. Narain. Delhi: Meenakshi Prakashan.
Anant, T.C.A, R Hasan, R Mohapatra, R Nagaraj, and S.K Sasikumar. 2006. "Labor Markets in India: Issues and Perspectives." In Labor Markets in Asia: Issues and Perspectives, ed. J. Felipe and R. Hasan. Basingstoke, Hampshire: Palgrave Macmillan.
Andhra Pradesh, Government of. 1995. "Andhra Pradesh Industrial Incentives: New Incentives Policy 1995." ed. C. o. Industries. Hyderabad.
———. 2000. "Incentives for Investments in Andhra Pradesh - 2000 - 2005." ed. C. o. Industries. Hyderabad.
———. 2005. " Incentives for setting up of New Industries in Andhra Pradesh- Industrial Investment Promotion Policy for 2005-2010- Orders- Issued (G.O.Ms.No.178)." ed. I. a. C. I. Department.
Andrews, D. 1994. "Capital Mobility and Structural Autonomy." International Studies Quarterly 38 (2).
Aschauer, Alan. 1989. "Is public expenditure productive? ." Journal of Monetary Economics 23 (2):177-200.
318
Banerjee, Abhijit, and Lakshmi Iyer. 2005. "History, Institutions, and Economic Performance: The Legacy of Colonial Land Tenure Systems in India." American Economic Review 95 (4):1190-213.
Banerjee, Abhijit, Lakshmi Iyer, and Rohini Somanathan. 2005. "History, Social Divisions, and Public Goods in Rural India." Journal of the European Economic Association 3 (2/3):639 - 47.
Barro, R. 1991. "Economic Growth in a Cross Section of Countries." Quarterly Journal of Economics 106.
———. 1996. "Democracy and Growth." Journal of Economic Growth 1 (1):1-27. ———. 1997. Determinants of Economic Growth: A Cross-Country Empirical Study.
Cambridge, MA: MIT Press. Barro, R, and X Sala-i-Martin. 2004. Economic Growth. Cambridge, MA: MIT Press. Baru, Sanjaya. 2000. "Economic Policy and the Development of Capitalism in India: the role of
regional capitalists and political parties." In Transforming India: Social and Political Dynamics of Democracy, ed. F. R. Frankel, Z. Hasan, R. Bhargava and B. Arora. New Delhi: Oxford University Press.
Beck, Nathaniel. 2011. "Of fixed-effects and time-invariant variables." Political Analysis 19 (2):119-22.
Beck, Nathaniel, and Jonathan N Katz. 1995. "What to do (and not to do) with time-series cross-section data." American Political Science Review:634-47.
———. 1996. "Nuisance vs. substance: Specifying and estimating time-series-cross-section models." Political analysis 6 (1):1-36.
———. 2011. "Modeling dynamics in time-series-cross-section political economy data." Annual Review of Political Science 14:331-52.
Besley, Timothy, and Robin Burgess. 2004. "Can Labor Regulation Hinder Economic Performance? Evidence from India." Quarterly Journal of Economics 119 (1):91-134.
Besley, Timothy, Robin Burgess, and Berta Esteve-Volart. 2007. "The Policy Origins of Poverty and Growth in India." In Delivering on the Promise of Pro-Poor Growth, ed. T. Besley and L. Cord: Palgrave Macmillan and World Bank.
Besley, Timothy, Torsten Persson, and Daniel Sturm. 2010. "Political Competition, Policy and Growth: Theory and Evidence from the US." Review of Economic Studies 77 (4):1329-52.
Bhalla, Surjit. 2012. "The Modi metric." Indian Express. Bhattacharjea, A. 2006. "Labor Market Regulation and Industrial Performance in India: A
Critical Review of the Empirical Evicence." Centre for Development Economics (Delhi School of Economics) Working Paper No. 141.
Boix, Carles. 1997a. "Political Parties and the Supply Side of the Economy: The Provision of Physical and Human Capital in Advanced Economies, 1960-90." American Journal of Political Science 41 (3):814-45
———. 1997b. "Privatizing the Public Business Sector in the Eighties: Economic Performance, Partisan Responses and Divided Governments." British Journal of Political Science 27 (4):473-96
———. 1998. Political Parties, Growth and Equality: Conservative and Social Democratic Economic Strategies in the World Economy. Cambridge: Cambridge University Press.
———. 2003. Democracy and Redistribution. Cambridge: Cambridge University Press.
319
Bosworth, Barry, and Susan Collins. 2004. "The Empirics of Growth: An Update." Brookings Papers on Economic Activity 2003 (2):113-79.
Brass, Paul R. 1997. "General Elections, 1996 in Uttar Pradesh: Divisive Struggles Influence Outcome." Economic and Political Weekly:2403-21.
Brass, Paul R. 1990. The Politics of India Since Independence. Cambridge: Cambridge University Press.
Brown, David S., and Wendy Hunter. 1999. "Democracy and Social Spending in Latin America, 1980-92." American Political Science Review 93 (4):779-90.
Brunetti, Aymo, Gregory Kisunko, and Beatrice Weder. 1998. "Credibility of Rules and Economic Growth: Evidence from a Worldwide Survey of the Private Sector " World Bank Economic Review 12 (3):353-84.
Bueno de Mesquita, B, J.D. Morrow, R Silversion, and A Smith. 2001. "Political Competition and Economic Growth." Journal of Democracy 12 (1):59-72.
Büthe, T., and H. V. Milner. 2008. "The Politics of Foreign Direct Investment into Developing Countries: Increasing FDI through International Trade Agreements?" American Journal of Political Science 52 (4):741-62.
Calderon, Cesar, and Luis Serven. 2004. "The Effects of Infrastructure Development on Growth and Income Distribution." World Bank Policy Research Working Paper 3400.
Canning, David. 1999. "Infrastructure's Contribution to Aggregate Output." World Bank Policy Research Working Paper 2246.
Cerny, P. 1993. "The Political Economy of International Finance." In Finance and World Politics: Markets, Regimes and States in the Post-hegemonic Era, ed. P. Cerny. Aldershot, England: Elgar.
Chandra, Kanchan. 2004. Why Ethnic Parties Succeed: Patronage and Ethnic Head Counts in India. Cambridge: Cambridge University Press
Chatterjee, P. 2008. "Democracy and Economic Transformation in India." Economic and
Political Weekly 43 (16). Chaudhuri, Amiya. 2007. "CPI(MP Dominance and 'Other' Parties in West Bengal." In India's
2004 Elections: Grass-roots and National Perspectives, ed. R. Roy and P. Wallace. New Delhi: Sage.
Chen, Shaohua, and Martin Ravallion. 2008. "The Developing World is Poorer than We Thought, But No Less Successful in the Fight Against Poverty " World Bank Policy Research Working Paper No. 4703.
Chhibber, Pradeep. 1999. Democracy without Associations: Transformation of the Party System and Social Cleavages in India. Ann Arbor: University of Michigan Press.
Chhibber, Pradeep, and Irfan Nooruddin. 2004. "Do Party Systems Count?: The Number of Parties and Government Performance in Indian States." Comparative Political Studies 37 (2).
Chhibber, Pradeep, and John Petrocik. 1989. "The Puzzle of Indian Politics: Social Cleavages and the Indian Party System." British Journal of Political Science 19 (2):191-210.
CNN. 2010. "'Avatar' a reality for Indian tribe fighting mining company." CNN February 9, 2010, accessed April 5, 2012 ( http://articles.cnn.com/2010-02-09/world/india.avatar.tribe_1_amnesty-international-mined-indian-tribe?_s=PM:WORLD).

320
Corbridge, S , and J Harriss. 2000. Reinventing India: Liberalisation, Hindu Nationalism and Popular Democracy. Cambridge: Polity.
Dam, Marcus. 2007. "11 killed in Nandigram police firing." The Hindu, March 15, 2007. Damodaran, Harish. 2008. India's New Capitalists: Caste, Business and Industry in a Modern
Nation. Houndmills, Basingstoke, Hampshire: Palgrave Macmillan. Das, Arvind N. 1992. The State of Bihar: An Economic History Without Footnotes. Amsterdam:
VU University Press. Dasgupta, Chirashree. 2007. "Can Bihar Industrialize?" Seminar India, December 2007 (No.
580). Datta, Nonica. 2005. "Resounding Verdict." Economic and Political Weekly:1014-5. Dayal, Ravi. 2002. "Bihar industrialists fear job quota in new policy." The Times of India,
August 19, 2002. Debroy, Bibek, Laveesh Bhandari, Swaminathan A. Aiyar, and Ashok Gulati. 2013. Economic
Freedom of the States of India: 2012. New Delhi: Academic Foundation. Deshpande, Rajeshwari, and Nitin Birmal. 2009. "Maharashtra: Congress-NCP Manages
Victory." Economic and Political Weekly:136-40. Duncan, Ian. 1997. "New political equations in north India: Mayawati, Mulayam, and
government instability in Uttar Pradesh." Asian Survey 37 (10):979-96. Durlauf, Steven, and Danny Quah. 1999. "The new empirics of economic growth." In Handbook
of Macroeconomics, ed. J. Taylor and M. Woodford. Amsterdam: Elsevier. Easterly, William, and Ross Levine. 1997. "Africa's Growth Tragedy: Policies and Ethnic
Divisions." Quarterly Journal of Economics 112 (4):1203-50. Easterly, William, and Sergio Rebelo. 1993. "Fiscal Policy and Economic Growth: An Empirical
Investigation." Journal of Monetary Economics 32 (3):417-58. EconomicTimes. 2004. "Manmohan Against Free Electricity." EconomicTimes, May 20, 2004. ———. 2008. "Sop opera on Nano begins in Gujarat." Economic Times, November 12, 2008. ———. 2009. "After Satyam, Telangana gives Brand Hyderabad a big jolt." Economic Times,
December 15, 2009. ———. 2011a. "Investors in wait-and-watch mode on Andhra Pradesh." Economic Times,
January 8, 2011. ———. 2011b. "Mining lease to Reddy brothers should be cancelled: SC panel." Economic
Times, January 8, 2011. Economist. 1991. "Reformer Rao." Economist, 36-41. ———. 2006a. "Building Blocks: India's creaking infrastructure still needs a lot more
investment." The Economist, June 3, 2006, 126. ———. 2006b. "Comrades, come rally." The Economist, October 28, 2006, 69-70. ———. 2008. "A new home for the Nano." Economist, October 11, 2008, 85. Economist, The. 2004. "An area of darkness." Economist, The, February 21, 2004. ———. 2010. "On the move: Bihar's remarkable recovery." Economist, The, January 30, 2010. Elliott, Carolyn. 1970. "Caste and Faction Among the Dominant Caste: The Reddis and Kammas
of Andhra." In Caste in Indian Politics, ed. R. Kothari. New Delhi: Orient Longman. Engerman, Stanley I., and Kenneth L. Sokoloff. 2000. "History Lessons: Institutions, Factors
Endowments, and Paths of Development in the New World." Journal of Economic Perspectives 14 (3):217-32.
Esfahani, Hadi Salehi, and Maria Teresa Ramirez. 2003. "Institutions, infrastructure, and economic growth." Journal of Development Economics 70 (2):443-77.
321
Evans, P. 1995. Embedded Autonomy: States and Industrial Transformation. Princeton: Princeton University Press.
Fafchamps, Marcel. 2000. "Ethnicity and Credit in African Manufacturing." Journal of Development Economics 61 (1):205-35.
Feng, Yi. 2001. "Political Freedom, Political Instability, and Policy Uncertainty." International Studies Quarterly 45 (2):271-94.
Fernandes, Walter. 2007. "Singur and the Displacement Scenario." Economic and Political Weekly 42 (3).
Fontanella-Khan, James. 2012. "Modi puts Gujarat growth on a fast track." Financial Times. Frankel, F. 2005. India's political economy, 1947-2004: The Gradual Revolution. New Delhi:
OUP. Frankel, Francine R. 1989a. "Caste, Land and Dominance in Bihar." In Dominance and State
Power in Modern India, ed. F. R. Frankel and M. S. A. Rao. Delhi: Oxford University Press.
———. 1989b. "Introduction." In Dominance and State Power in Modern India, ed. F. R. Frankel and M. S. A. Rao. Delhi: Oxford University Press.
———. 1989c. "Preface (Volume II)." In Dominance and State Power in Modern India, ed. F. R. Frankel and M. S. A. Rao. Delhi: Oxford University Press.
Frankel, Francine R., and M.S.A Rao, eds. 1989. Dominance and State Power in Modern India. 2 vols. Delhi: Oxford University Press.
Frye, Timothy. 2002. "The Perils of Polarization: Economic Performance in the Postcommunist World." World Politics 54:308-37.
Garrett, Geoffrey. 1998. Partisan Politics in the Global Economy. Cambridge: CUP. Garrett, Geoffrey, and Peter Lange. 1985. "The Politics of Growth: Strategic Interaction and
Economic Performance in the Advanced Industrial Democracies, 1974-1980." Journal of Politics 47 (3):792-827
Ghosh, Prabhat P. 2007. "Change from the Middle?" Seminar India, December 2007 (No. 580). Gopa Kumar, G. 2009. "Kerala: A Verdict Against Non-Performance and Factionalism." In
Electoral politics in Indian states: Lok Sabha elections in 2004 and beyond, ed. S. Shastri, K. Suri and Y. Yadav. New Delhi: OUP.
Gould, Harold. 1997. "General Elections, 1996: Karnataka: Rise and Fall of the Congress Machine." Economic and Political Weekly 32 (37):2335-49.
Greene, William. 2011. "Fixed effects vector decomposition: A magical solution to the problem of time-invariant variables in fixed effects models?" Political Analysis 19 (2):135-46.
Greif, Avner. 1993. "Contract Enforcement and Economic Institutions in Early Trade: The Maghribi Traders' Coalitions." American Economic Review 83 (3):525-48.
Gujarat, Government of. 1995. "Industrial Policy 1995." ed. I. a. M. Department. Gandhinagar. ———. 2000. "Industrial Policy 2000." ed. I. a. M. Department. Gandhinagar. ———. 2003. "Industrial Policy 2003." ed. I. M. Dept. Gandhinagar. ———. 2009. "Industrial Policy 2009." ed. I. M. Dept. Gandhinagar. Gupta, Shaibal. 1981. "Non-Development of Bihar: A Case of Retarded Sub-Nationalism."
Economic and Political Weekly 16 (37):1496-502. Hansen, Christopher Joshi. 2008. "Bottom-up Electricity Reform Using Industrial Captive
Generation : A Case Study of Gujarat, India." Oxford Institute for Energy Studies Harrison, Selig. 1960. India: The Most Dangerous Decades. Princeton: Princeton University
Press.
322
Hasan, Zoya. 1996. "Communal mobilization and changing majority in Uttar Pradesh." In Contesting the nation: Religion, community, and the politics of democracy in India, ed. D. Ludden. Philadelphia: University of Pennsylvania Press.
———. 2002. "Introduction: Conflict Pluralism and the Competitive Party System in India." In Parties and Party Politics in India, ed. Z. Hasan. New Delhi: OUP.
Heath, Oliver. 1999. "Anatomy of the BJP's Rise to Power: Social, Regional and Political Expansion in 1990s." Economic and Political Weekly 34 (34/35):2511-7.
Heath, Oliver, and Yogendra Yadav. 2000. "A Split Verdict in Haryana." Frontline, April 1-17. Hebsur, Raghavendra Keshavrao. 2011. "Karnataka: The Surge of Saffron: Some Genuine and
Some Imitation?" In India's 2009 Elections: Coalition Politics, Party Competition and Congress Continuity, ed. P. Wallace and R. Roy. New Delhi: Sage.
Henisz, Witold J. 2000. "The institutional environment for multinational investment." The Journal of Law, Economics, and Organization 16 (2).
———. 2002. "The institutional environment for infrastructure investment " Industrial and Corporate Change 11 (2):355-89.
Hindu, The. 2010. "It is ‘no’ to Vedanta’s mine project in Orissa." The Hindu, August 24, 2010. Hirway, I. 2000. "Dynamics of Development in Gujarat: Some Issues." Economic and Political
Weekly 35 (35-36):3106-20. Iarossi, Guiseppe. 2009. "The Investment Climate in 16 Indian States." World Bank Policy
Research Working Paper 4817. IBRAHIM, KM SAJAD. 2009. "Kerala: A Negative Verdict on LDF Government." Economic
and Political Weekly:118-21. India, Government of. 2006. "Household Assets Holding, Indebtedness, Current Borrowings and
Repayments of Socail Groups in India, NSS 59th round (January - December 2003), Report No. 503." New Delhi: National Sample Survey Organization.
———. 2007. "Household Consumer Expenditure among Socio-Economic Groups: 2004-2005." New Delhi: National Sample Survey Organization.
———. Special Economic Zones in India: Ministry of Commerce and Industry 2009 [cited 8/21/10. Available from www.sezindia.nic.in.
———. 2009 and 2010. "Indian Labor Statistics." Shimla: Labor Bureau, Ministry of Labor and Employment, Government of India (http://labourbureau.nic.in/ILS_2009_2010.pdf)
IndianExpress. 2008a. "Nano gets new home, Gujarat signs MoU with Tata." Indian Express,
October 7, 2008. ———. 2008b. "Slowdown in Beijing brings iron-ore country Bellary to a halt." Indian Express,
November 26, 2008. ———. 2009. "Each Nano Will Cost Rs.60,000 to Gujarat Exchequer: Gohil." IndianExpress,
January 16, 2009. ———. 2012. "CAG pulls up Gujarat govt firm for giving undue benefits to Adani, Essar."
Indian Express, March 30, 2012. Iversen, Torben, and David Soskice. 2001. "An Asset Theory of Social Preferences." American
Political Science Review 95 (4):875-93. ———. 2006. "Electoral Institutions and the Politics of Coalitions: Why Some Democracies
Redistribute More Than Others." American Political Science Review 100 (2):165-81. ———. 2009. "Distribution and Redistribution: The Shadow of the Nineteenth Century." World
Politics 61 (3):438-86
323
Iyer, Lakshmi. 2010. "Direct versus Indirect Colonial Rule in India: Long-Term Consequences." Review of Economics and Statistics 92 (4):693-713.
Jaffrelot, Christophe. 1996. "Interpreting Madhya Pradesh Voting Patterns." Economic and Political Weekly 31 (49):3207-8.
———. 2000. "The Rise of the Other Backward Classes in the Hindi Belt." Journal of Asian Studies 59 (1).
———. 2003. India’s silent revolution : the rise of the lower castes in North India New York: Columbia University Press.
———. 2009a. "Introduction." In Rise of the Plebians? The Changing Face of Indian Legislative Assemblies, ed. C. K. S. Jaffrelot. New Delhi: Routledge.
———. 2009b. "Introduction." In Rise of the Plebians? The Changing Face of Indian Legislative Assemblies ed. C. Jaffrelot and S. Kumar. New Delhi: Routledge.
Jaffrelot, Christophe, and Jasmine Zerinini-Brotel. 2004. "Post-Mandal Politics in Uttar Pradesh and Madhya Pradesh." In Regional Reflections: Comparing Politics Across India's States, ed. R. Jenkins. New Delhi: OUP.
Jani, Maheshwata. 2009. "Gujarat: BJP Scrapes Through." Economic and Political Weekly 44 (39):133-6.
Jenkins, Rob. 1999. Democratic Politics and Economic Reform in India. Cambridge: Cambridge University Press
———. 2004a. "Labour Policy and the Second Generation of Economic Reform in India." India
Review 3 (4):333-63. ———, ed. 2004b. Regional Reflections: Comparing Politics Across India's States. New Delhi:
OUP. Jensen, N. 2003. "Democratic Governance and Multinational Corporations: Political Regimes
and Inflows of Foreign Direct Investment." International Organization 57 (3):587–616. ———. 2006. Nation States and the Multinational Corporation: A Political Economy of Foreign
Direct Investment. Princeton: PUP. Jodhka, SS. 1999. "Haryana: Change of Government and Beyond." Economic and Political
Weekly 34:2217-8. Jodhka, Surinder S. 2005. "Return of the Regions: Identities and Electoral Politics in Punjab."
Economic and Political Weekly 40 (3):224-30. Johnson, Chalmers. 1982. MITI and the Japanese Miracle: The Growth of Industrial Policy,
1925-1975. Stanford: Stanford University Press. Joshi, Dhananjai, and Praveen Rai. 2004. "Haryana: Landslide Victory for Congress." Economic
and Political Weekly:5445-8. Joshi, Ishan. 1996. "Laloo's Very Own Amethi." Outlook. Kennedy, L 2004. "The Political Determinants of Reform Packaging: Contrasting Responses to
Economic Liberalization in Andhra Pradesh and Tamil Nadu." In Regional Reflections: Comparing Politics Across India's States, ed. R. Jenkins. New Delhi: OUP.
Kitschelt, H, and S.I Wilkinson, eds. 2007. Patrons, Clients and Policies. Cambridge: CUP. Knack, S, and P Keefer. 1995. "Institutions and Economic Performance: Cross-Country Tests
Using Alternative Institutional Measures." Economics and Politics 7 (3). Kochhar, K, U Kumar, R Rajan, A Subramanian, and I Tokatlidis. 2006a. ""India's Pattern of
Development: What Happened? What Follows?"." Journal of Monetary Economics 53 (5):981-1019.
324
———. 2006b. ""India's Pattern of Development: What Happened? What Follows?" " Journal of Monetary Economics 53 (5):981-1019.
Kohli, Atul. 1987. State and Poverty in India. Cambridge: Cambridge University Press. ———. 1988. "The NTR Phenomenon in Andhra Pradesh: Political Change in a South Indian
State." Asian Survey 28 (10):991-1017. ———. 1989. "From Elite Activism to Democratic Consolidation: The Rise of Reform
Communism in West Bengal." In Dominance and State Power in Modern India, ed. F. R. Frankel and M. S. A. Rao. Delhi: Oxford University Press.
———. 1990. Democracy and Discontent: India's Growing Crisis of Governability. Cambridge: Cambridge University Press
———. 2004. State-Directed Development: Political Power and Industrialization in the Global Periphery. Cambridge: Cambridge University Press
———. 2006. "Politics of Economic Growth in India, 1980-2005, parts I and II." Economic and Political Weekly April 1 and April 8.
———. 2009. Democracy and Development in India: From Socialism to Pro-Business. New Delhi: OUP.
———. 2012. Poverty Amid Plenty in the New India. Cambridge: Cambridge University Press. Kothari, Rajni. 1970a. Caste in Indian politics. Editor: Rajni Kothari. [New Delhi]: Orient
Longman. ———. 1970b. "Introduction." In Caste in Indian Politics, ed. R. Kothari. New Delhi: Orient
Longman. Kothari, Rajni, and Rushikesh Maru. 1970. "Federating for Political Interests: The Kshatriyas of
Gujarat." In Caste in Indian Politics, ed. R. Kothari. New Delhi: Orient Longman. Krugman, P. 1991. "Increasing Returns and Economic Geography." Journal of Political
Economy 99 (3). ———. 1998. "What's New About the New Economic Geography." Oxford Review of Economic
Policy 14 (2). Kumar, Ashutosh. 2006. "Electoral Politics in Punjab: 1966-2004." Journal of Punjab Studies 12
(1):111-27. ———. 2009a. "Punjab: Dissonance between Governance and Electoral Process." In Electoral
Politics in Indian States, ed. S. Shastri, K. C. Suri and Y. Yadav. Delhi: OUP. ———. 2009b. "Punjab: Dissonance between Governance and Electoral Processes." In Electoral
Politics in India States: Lok Sabha Elections in 2004 and Beyond, ed. S. Shastri, K. C. Suri and Y. Yadav. New Delhi: Oxford University Press.
Kumar, Ashutosh, and Jagroop Singh Sekhon. 2009. "Punjab: Resurgence of the Congress." Economic and Political Weekly 44 (39):183-6.
Kumar, Ashutosh, and T.R. Sharma. 2009. "Legislative Elite in Punjab: A Socio-political Study." In Rise of the Plebians? The Changing Face of Indian Legislative Assemblies ed. C. Jaffrelot and S. Kumar. New Delhi: Routledge.
Kumar, Pramod. 2003. "Electoral Politics in Punjab: From Autonomy to Secession." In India's 1999 Elections and 20th Century Politics, ed. R. Roy and P. Wallace. New Delhi: Sage.
Kumar, Sanjay. 2004. "Janata Regionalized: Contrasting Bases of Electoral Support in Bihar and Orissa." In Regional Reflections: comparing politics across India's states, ed. R. Jenkins. Delhi: OUP.
Kumar, Sanjay, and Rakesh Ranjan. 2009. "Bihar: Development Matters." Economic and Political Weekly 44 (39):141-4.

325
La Porta, Rafael, Florencio Lopez-de-Silanes, Andrei Shleifer, and Robert Vishny. 1999. "The quality of government." Journal of Law, Economics and Organization 15 (1):222-79.
Lake, David A., and Matthew A. Baum. 2001. "The Invisible Hand of Democracy: Political Control and the Provision of Public Services." Comparative Political Studies 34 (6):587-621.
Lamont, James. 2010. "New Delhi offers to suspend mine deals." Financial Times, February 9, 2010.
Levine, Ross, and David Renelt. 1992. "A Sensitivity Analysis of Cross-Country Growth Regressions." American Economic Review 82 (4):942-63.
Lieberman, Evan. 2005. "Nested Analysis as a Mixed-Method Strategy for Comparative Research." American Political Science Review 99 (3).
———. 2009. Boundaries of Contagion: How Ethnic Politics Have Shaped Government Responses to AIDS. Princeton: Princeton University Press.
Lipset, Seymour Martin, and Stein Rokkan. 1967. "Cleavage Structures, Party Systems and Voter Alignments." In Party Systems and Voter Alignments: Cross-National Perspectives, ed. S. M. Lipset and S. Rokkan. New York: Free Press.
Lodha, Sanjay. 2004. "Rajasthan: India Shines as BJP Trounces Congress." Economic and Political Weekly:5456-62.
———. 2009. "Rajasthan: Performance and Campaigning Pay Dividends." Economic and Political Weekly:186-90.
Lucas, R.E. 1990. "Why Doesn't Capital Flow From Rich to Poor Countries?" American Economic Review 80 (2).
Lupu, Noam, and Jonas Pontusson. 2011. "The structure of inequality and the politics of redistribution." American Political Science Review 105 (02):316-36.
Mankiw, Gregory, David Romer, and David Weil. 1992. "A Contribution to the Empirics of Economic Growth." Quarterly Journal of Economics 107 (2):407-37
Mathew, Santosh, and Mick Moore. 2011. "State Incapacity by Design: Understanding the Bihar Story." In IDS Working Paper 366. Brighton, UK: Institute of Development Studies (University of Sussex).
Mehta, Nalin. 2011. "Ashis Nandy vs. the state of Gujarat: authoritarian developmentalism, democracy and the politics of Narendra Modi." In Gujarat Beyond Gandhi: Identity, Society and Conflict, ed. N. Mehta and M. Mehta. London: Routledge.
Meltzer, Allan H., and Scott F. Richard. 1981. "A Rational Theory of the Size of Government." Journal of Political Economy 89 (5):914-27.
Metcalf, Barbara D., and Thomas R. Metcalf. 2001. A Concise History of Modern India. Cambridge: Cambridge University Press.
Miguel, Edward, and Mary Kay Gugerty. 2005a. "Ethnic diversity, social sanctions, and public goods in Kenya." Journal of Public Economics 89 (11-12):2325-68.
———. 2005b. "Ethnic diversity, social sanctions, and public goods in Kenya " Journal of Public Economics 89 (11-12):2325-68
Mody, Anjali. 2010. "Special Economic Zones: A Briefing Note ": Center de Sciences Humaines (CSH, Delhi), Center for Policy Research and Hunter College: Research Project on on the Politics of India's Special Economy Zones (http://www.indiasezpolitics.org).
Moore, Barrington. 1969. Social origins of dictatorship and democracy : lord and peasant in the making of the modern world. Harmondsworth: Penguin.
Mosley, L. 2003. Global capital and national governments. Cambridge: CUP.
326
Murillo, Maria Victoria. 2002. "Political Bias in Policy Convergence: Privatization Choices in Latin America." World Politics 54 (4):462-93.
———. 2005. "Partisanship amidst Convergence: The Politics of Labor Reform in Latin America." Comparative Politics 37 (4).
Murillo, Maria Victoria, and Cecilia Martinez-Gallardo. 2007. "Political Competition and Policy Adoption: Market Reforms in Latin American Public Utililites." American Journal of Political Science 51 (1):120-39.
Murthy, KS Dakshina. 2008. "Hegde and Gowda Paved the Way." Economic and Political Weekly:11-2.
Nagaraj, R. 2006. Economic Growth and Reforms: Selected Essays. Delhi: Academic Foundation.
Naidu, N. Chandrababu (with Sevanti Ninan). 2000. Plain Speaking. New Delhi: Viking. Nandy, Ashis. 2002. "Obituary of a Culture." Seminar 513 (May). Nayar, Baldev Raj. 1966. Minority Politics in the Punjab. Princeton: Princeton University Press. ———. 1968. "Punjab." In State Politics in India, ed. M. Weiner. Princeton: Princeton
University Press. Nooruddin, Irfan, and Pradeep Chhibber. 2008. "Unstable Politics Fiscal Space and Electoral
Volatility in the Indian States." Comparative Political Studies 41 (8):1069-91. Pai, Sudha. 2002. "Electoral Identity Politics in Uttar Pradesh: Hung Assembly Again."
Economic and Political Weekly:1334-41. ———. 2004. "Dalit Question and Political Response: Comparative Study of Uttar Pradesh and
Madhya Pradesh." Economic and Political Weekly:1141-50. Pal, Kushal, and Praveen Rai. 2009. "Haryana: Congress Retains Its Electoral Supremacy."
Economic and Political Weekly:177-9. Palshikar, Suhas. 1996. "Capturing the Moment of Realignment." Economic and Political
Weekly:174-8. Palshikar, Suhas, and Nitin Birmal. 2004. "Maharashtra: Towards a New Party System."
Economic and Political Weekly:5467-72. ———. 2009. "Maharashtra: Towards a New Party System." In Electoral Politics in India
States: Lok Sabha Elections in 2004 and Beyond, ed. S. Shastri, K. C. Suri and Y. Yadav. New Delhi: Oxford University Press.
Palshikar, Suhas, and Rajeshwari Deshpande. 1999. "Electoral Competition and Structures of Domination in Maharashtra." Economic and Political Weekly:2409-22.
Palshikar, Suhas, Rajeshwari Deshpande, and Nitin Birmal. 2009. "Maharashtra Polls: Continuity amidst Social Volatility." Economic and Political Weekly:42-7.
Panagariya, A. 2008. India: The Emerging Giant. Oxford: OUP. Pandit, M.L. 1978. "Some Less Known Factors behind Recent Industrial Change in Punjab and
Haryana." Economic and Political Weekly 13 (47):1935-40. Pandit, Virendra. 2008. "Gujarat on Tatas' radar for Nano plant?" Hindu BusinessLine, October
4, 2008. Patel, Priyavadan. 1999. "Sectarian Mobilisation, Factionalism and Voting in Gujarat."
Economic and Political Weekly 34 (34/35):2423-33. Patel, Sujata. 1985. "Debacle of Populist Politics." Economic and Political Weekly 20 (16):681-
2. Patnaik, Santosh. 2011. "Investors in jitters over Telangana tangle." The Hindu, January 4, 2011.

327
Pingle, Gautam. 2010. "The Historical Context of Andhra and Telangana, 1946-1956." Economic and Political Weekly 45 (8):57-65.
Pinto, Pablo M., and Jeffrey F. Timmons. 2005. "The Political Determinants of Economic Performance: Political Competition and the Sources of Growth." Comparative Political Studies 38 (1):26-50.
Plümper, Thomas, and Vera E Troeger. 2007. "Efficient estimation of time-invariant and rarely changing variables in finite sample panel analyses with unit fixed effects." Political Analysis 15 (2):124-39.
Pocock, David. 1972. Kanbi and Patidar: A Study of The Patidar Community of Gujarat. Oxford: Oxford University Press.
Posner, Daniel. 2004. "The Political Salience of Cultural Difference: Why Chewas and Tumbukas Are Allies in Zambia and Adversaries in Malawi." American Political Science Review 98 (4):529-45.
Purfield, C. 2006. "Mind the Gap - Is Economic Growth in India Leaving Some States Behind?" IMF Working Papers WP/06/103.
Puri, Harish. 1983. "The Akali Agitation: An Analysis of Socio-Economic Bases of Protest." Economic and Political Weekly 18 (4):113-8.
Rao, A Srinivasa. 2009. "Telangana Denting Brand Hyderabad." India Today, December 31, 2009.
RBI. 2010a. "Handbook of Statistics on State Government Finances." Mumbai: Reserve Bank of India (RBI).
———. 2010b. "Handbook of Statistics on the Indian Economy 2009-10." Mumbai: Reserve Bank of India.
———. 2010c. "State Finances: A Study of Budgets." Mumbai: Reserve Bank of India. ———. 2011. "Handbook of Statistics on the Indian Economy 2010-11." Mumbai: Reserve
Bank of India. Reddy, G. Ram. 1976. "Andhra Pradesh: The Citadel of the Congress." In State Politics in India,
ed. I. Narain. Meerut: Meenakshi Prakashan. ———. 1989. "The Politics of Accommodation: Caste, Class and Dominance in Andhra
Pradesh." In Dominance and State Power in Modern India, ed. F. R. Frankel and M. S. A. Rao. Delhi: Oxford University Press.
Robin, Cyril. 2009. "Bihar: The New Stronghold of OBC Politics." In Rise of the Plebians? The Changing Face of Indian Legislative Assembles, ed. C. Jaffrelot and S. Kumar. New Delhi: Routledge.
Romer, Thomas. 1975. "Individual welfare, majority voting and the properties of a linear income tax." Journal of Public Economics 4 (2):163-85.
Ross, M. 2006. "Is Democracy Good for the Poor?" American Journal of Political Science 50 (4):860-74.
Roy, Ramashray. 1967. "Politics of Framentation: The Case of the Congress Party in Bihar." In State Politics in India, ed. I. Narain. Meerut: Meenakshi Prakashan.
Rubinoff, Arthur G. 1997. "General Elections, 1996: Local Issues Dominate in Andhra Pradesh and Tamil Nadu." Economic and Political Weekly 32 (43):2829-35.
Rudolph, Lloyd I., and Susanne Hoeber Rudolph. 2001. "Iconisation of Chandrababu: Sharing Sovereignty in India's Federal Market Economy." Economic and Political Weekly May 5.

328
Rutten, M. 1986. "Social Profile of Agricultural Entrepreneurs: Economic Behavior and Life-Style of Middle-Large Farmers in Central Gujarat." Economic and Political Weekly 21 (13):A15-A23.
Röller, Lars-Hendrik, and Leonard Waverman. 2001. "Telecommunications Infrastructure and Economic Development: A Simultaneous Approach." American Economic Review 91 (4):909-23.
Sainath, P. 2004. "When Farmers Die." The Hindu, June 22, 2004. Sanghavi, Nagindas. 2011. "From Navnirman to the anti-Mandal riots: the political trajectory of
Gujarat (1974-1985)." In Gujarat Beyond Gandhi: Identity, Society and Conflict, ed. N. Mehta and M. Mehta. London: Routledge.
Scheve, Kenneth, and David Stasavage. 2006. "Religion and Preferences for Social Insurance." Quarterly Journal of Political Science 1 (3):255-86.
Sengupta, Arjun (National Commission for Enterprises in the Unorganized Sector). 2007. "Report on Conditions of Work and Promotion of Livelihoods in the Unorganized Sector." New Delhi.
Shah, G. 2002. "Caste, Hindutva and Hideousness." Economic and Political Weekly 37 (15):1391-3.
Shah, Ghanshyam. 1974. "The Upsurge in Gujarat." Economic and Political Weekly 9 (32/34):1429-54.
———. 1987. "Middle Class Politics: Case of Anti-Reservation Agitations in Gujarat." Economic and Political Weekly 22 (19-21):AN155-AN72.
———. 1989. "Caste Sentiments, Class Formation and Dominance in Gujarat." In Dominance and State Power in Modern India, ed. F. R. Frankel and M. S. A. Rao. Delhi: Oxford University Press.
———. 1991. "Tenth Lok Sabha Elections - BJP's Victory in Gujarat." Economic and Political Weekly:2921-4.
———. 1996. "BJP's Rise to Power." Economic and Political Weekly 31 (2/3):165-70. ———. 1998. "The BJP's Riddle in Gujarat: Caste, Factionalism and Hindutva." In The BJP and
the Compulsion of Politics in India, ed. T. B. Hansen and C. Jaffrelot. New Delhi: Oxford University Press.
———. 2004. "Introduction: Caste and Democratic Politics." In Caste and Democratic Politics in India, ed. G. Shah. London: Anthem Press.
———. 2007. "Gujarat after Godhra." In India's 2004 Elections: Grass-roots and National Perspectives, ed. R. Roy and P. Wallace. New Delhi: Sage.
———. 2011. "Goebbel's Propaganda and Governance: The 2009 Lok Sabha Elections in Gujarat." In India's 2004 Elections: Grass-roots and National Perspectives, ed. R. Roy and P. Wallace. New Delhi: Sage.
Shastri, Sandeep. 1996. "Emergence of'Third Force'." Economic and Political Weekly:153-9. ———. 1999. "Twilight of Congress Hegemony: Emergence of Bi-Polar Alliance System in
Karnataka." Economic and Political Weekly:2440-8. Shastri, Sandeep, and Harish Ramaswamy. 2004. "Karnataka: Simultaneous Polls, Different
Results." Economic and Political Weekly:5484-7. Sheth, Pravin. 1976a. Patterns of Political Behavior in Gujarat. Ahmedabad: Sahitya
Mudranalaya. ———. 1998. Political Development in Gujarat. Ahmedabad: Karnavati.

329
Sheth, Pravin 1976b. "Gujarat: The Case of Small Majority Politics." In State Politics in India, ed. I. Narain. New Delhi: Meenakshi Prakashan.
Shinoda, Takashi. 2000. "Institutional Change and Entrepreneurial Development: SSI Sector." Economic and Political Weekly 35 (35/36).
Singh, Gopal. 1984. "Socio-Economic Bases of the Punjab Crisis." Economic and Political Weekly 19 (1):42-7.
Singh, Gurharpal. 1998. "The Akalis and the BJP in Punjab: From Ayodhya to the 1997 Legislative Election." In The BJP and the Compulsions of Politics in India, ed. T. B. Hansen and C. Jaffrelot. New Delhi: Oxford University Press.
Singh, Lakhwinder. 2005. "Deceleration of Industrial and Rural Industrialization Strategy for Indian Punjab." Journal of Punjab Studies 12 (2):271-84.
Singh, N, and T.N Srinivasan. 2006. "Indian Federalism, Economic Reform and Globalization." In Federalism and Economic Reform, ed. J. Wallack and T. N. Srinivasan. Cambridge, UK: Cambridge University Press.
Singh, Prerna. 2010a. Subnationalism and Social Development: A Comparative Analysis of Indian States, Ph.D. thesis: Department of Politics, Princeton University, Princeton.
———. 2010b. Subnationalism and Social Development: A Comparative Analysis of Indian States, Department of Politics, Princeton University, Princeton, NJ.
Sinha, Aseema. 2004. "Ideas, Interests and Institutions in Policy Change: A Comparison of West Bengal and Gujarat." In Regional Reflections: Comparing Politics Across India's States, ed. R. Jenkins. New Delhi: OUP.
———. 2005. The Regional Roots of Developmental Politics in India: A Divided Leviathan. Bloomington: Indiana University Press.
Sisodia, Yatindra Singh, and RAM SHANKAR. 2009. "Madhya Pradesh: Congress Makes Unexpected Gains." Economic and Political Weekly:127-9.
Snyder, Richard. 2001. "Scaling Down: The Sub-National Comparative Method." Studies in Comparative International Development 36 (1):93-110.
Srinivas, M.N. 1959. "The Dominant Caste in Rampura." American Anthropologist 61 (1):1-16. ———. 1994. The Dominant Caste and Other Essays. New Delhi: OUP. Srinivasan, V.K., and P.S. Sundaram. 2008. Special Economic Zones: International Experience
and Indian Scenario. Hyderabad: Media India News Service Publication. Srinivasulu, K, and Prakash Sarangi. 1999. "Political Realignments in Post-NTR Andhra
Pradesh." Economic and Political Weekly 34 (34/35):2449-58. Srinivasulu, Karli. 2002. "Caste, Class and Social Articulation in Andhra Pradesh: Mapping
Differential Regional Trajectories." London: Overseas Development Institute Working Paper 179.
———. 2003. "Party Competition and Strategies of Mobilization: An Analysis of Social Coalitions in Andhra Pradesh." In India's 1999 Elections and 20th Century Politics, ed. P. Wallace and R. Ray. New Delhi: Sage.
———. 2009. "Y.S. Rajasekhara Reddy: A Political Appraisal." Economic and Political Weekly 44 (38):8-10.
Stasavage, David. 2002. "Private Investment and Political Institutions." Economics and Politics 14 (1).
———. 2005. "Democracy and Education Spending in Africa." American Journal of Political Science 49 (2):343-58.

330
Streefkerk, Hein. 1997. "Gujarati Entrepreneurship: Historical Continuity Against Changing Perspectives." Economic and Political Weekly 32 (8):M2-M10.
———. 2006. Tools and Ideas: The Beginnings of Local Industrialization in South Gujarat, 1970-2000
Delhi: Manohar. Subramanian, A. 2008. India's Turn: Understanding the Economic Transformation. New Delhi:
OUP. Sud, Nikita. 2007. "Constructing and Contesting a Gujarati-Hindu Ethno-religious Identity
Through Development Programmes in an Indian Province." Oxford Development Studies 35 (2):131-47
Suri, K.C. 2002. "Democratic Process and Electoral Politics in Andhra Pradesh, India." London:
Overseas Development Institute Working Paper 180. ———. 2004a. "Andhra Pradesh: Fall of the CEO in Arena of Democracy." Economic and
Political Weekly 39 (51):5493-7. ———. 2004b. "Telugu Desam Party: Rise and Prospects for the Future." Economic and
Political Weekly 39 (14/15):1482-90. Suri, K.C., P. Narasimha Rao, and V. Anji Reddy. 2009. "Andhra Pradesh: A Vote for Status
Quo?" Economic and Political Weekly 44 (39):108-13. Teitelbaum, Emmanuel. 2006. Mobilizing Restraint: Unions and the Politics of Economic
Development in South Asia, Ph.D Thesis: Department of Government, Cornell University.
Telford, Hamish. 1992. "The Political Economy of Punjab: Creating Space for Sikh Militancy." Asian Survey 32 (11):969-87.
Thakur, Sankarshan. 2006. Subaltern Saheb: Bihar and the making of Laloo Prasad Yadav. New Delhi: Picador.
———. 2007. "The Paradox that is Bihar: Departure and Arrival." Seminar. TheHindu. 2010. "CII wants Centre to end ‘ambiguity' on Telangana " The Hindu, May 19, 2010. Thirunavukkarasu, R. 2001. "Election 2001: Changing Equations." Economic and Political
Weekly:2486-9. Tripathi, Dwijendra, and Jyoti Jumani. 2007. The Concise Oxford History of Indian Business.
New Delhi: OUP. Tripathy, Ratnakar. 2007. "The Paradox that is Bihar: The Problem." Seminar. Vaidyanathan, A. 2006. "Farmers' Suicides and the Agrarian Crisis." Economic and Political
Weekly 41 (38):4009-13. Van Dyke, Virginia. 2009. "The Khalistan Movement in Punjab, India, and the Post-Militancy
Era: Structural Change and New Political Compulsions." Asian Survey 49 (6):975-97. Varshney, Ashutosh. 2000. "Is India Becoming More Democratic?" Journal of Asian Studies 59
(1):3-25. Vasavi, AR. 2008. "Caste, Capital and Captaincy in the Karnataka Elections." Economic and
Political Weekly:10-1. Vaugier-Chatterjee, Anne. 2009. "Two Dominant Castes: The Socio-political System in Andhra
Pradesh." In Rise of the Plebians? The Changing Face of Indian Legislative Assemblies, ed. C. Jaffrelot and S. Kumar. New Delhi: Routledge.
331
Venkata Ratnam, C.S. 2004. "The Politics of Labor Reforms in India." In India - the Political Economy of Reforms, ed. B. Debroy and R. Mukherji. New Delhi: Bookwell.
Wade, R. 1990. Governing the Market: Economic Theory and the Role of the Government in East Asian Industrialization. Princeton: Princeton University Press.
Wallace, Paul. 1986. "The Sikhs as a "Minority" in a Sikh Majority State in India." Asian Survey 26 (3):363-77.
———. 1988. "Religious and Secular Politics in Punjab: The Sikh Dilemma in Competing Political Systems." In Political Dynamics and Crisis in Punjab, ed. P. Wallace and S. Chopra. Amritsar: Guru Nanak Dev University.
———. 1989. "Religious and Ethnic Politics: Political Mobilization in Punjab." In Dominance and State Power in Modern India, ed. F. R. Frankel and M. S. A. Rao. Delhi: Oxford University Press.
———. 1997. "General Elections, 1996: Regional Parties Dominant in Punjab and Haryana." Economic and Political Weekly:2963-9.
Wawro, Gregory. 2002. "Estimating dynamic panel data models in political science." Political Analysis 10 (1):25-48.
Wilson, Sven E, and Daniel M Butler. 2007. "A lot more to do: The sensitivity of time-series cross-section analyses to simple alternative specifications." Political Analysis 15 (2):101-23.
Witsoe, Jeffrey. 2006. "Social Justice and Stalled Development: Caste Empowerment and the Breakdown of Governance in Bihar." In India in Transition: Economics and Politics of Change: Center for the Advanced Study of India, University of Pennsylvania.
Woo, Jung-en. 1991. Race to the Swift: State and Finance in Korean Industrialization. New York: Columbia University Press.
Wood, John R. 1975. "Extra-Parliamentary Opposition in India: An Analysis of Populist Agitations in Gujarat and Bihar." Pacific Affairs 48 (3):313-34.
———. 1984. "British versus Princely Legacies and the Political Integration of Gujarat." Journal of Asian Studies 44 (1):65-99.
———. 1987. "Reservations in Doubt: The Backlash Against Affirmative Action in Gujarat, India." Pacific Affairs 60 (3):408-30.
WorldBank. 2002. "Investment Climate Survey in India 2002." World Bank. ———. 2005a. "India - Firm Analysis and Competitiveness Survey 2005." ———. 2005b. World Development Report 2005: A Better Investment Climate For Everyone.
Washington, D.C: World Bank. ———. 2006. The Investment Climate in Brazil, India, and South Africa: A Contribution to the
IBSA Debate. Washington, D.C: World Bank. ———. 2007A. The Investment Climate in Brazil, India and South Africa: A Comparison of
Approaches for Sustaining Economic Growth in Emerging Economies. Washington D.C: World Bank Institute.
———. 2007B. Doing Business in South Asia in 2007. Washington D.C.: World Bank. ———. 2009. "Investment Promotion Essentials: What Sets the World's Best Investment
Facilitators Apart from the Rest." Washington D.C.: WorldBank (www.wbginvestmentclimate.org).
WorldBank, and InternationalFinanceCorporation. 2004a. "Doing Business in 2004: Understanding Regulation." Washington D.C.: WorldBank.
332
———. 2004b. "India: Investment Climate and Management Industry." Washington D.C.: WorldBank.
———. 2009. "Doing Business in India 2009." Washington D.C.: WorldBank. ———. 2012. "Doing Business 2012: Doing Business in a More Transparent World."
Washington D.C.: WorldBank. Wyatt, AKJ. 2002. "New alignments in South Indian politics: the 2001 assembly elections in
Tamil Nadu." Asian Survey 42 (5):733-53. Yadav, Yogendra. 1999. "Electoral Politics in the Time of Change: India's Third Electoral
System, 1989-1999." Economic and Political Weekly 34 (34-35):2393-9. ———. 2002. "Understanding the Second Dramatic Upsurge: trends of bahujan participation in
electoral politics in the 1990s." In Transforming India: Social and Political Dynamics of Democracy, ed. F. R. Frankel, Z. Hasan, R. Bhargava and B. Arora. New Delhi: Oxford University Press
———. 2004. "The Elusive Mandate of 2004." Economic and Political Weekly 39 (51):5383-98.
Related Documents