Technical Note Dual-energy computerized tomography in compacted soil D. BRAZ 1 , R.T. LOPES 1 and L.M.G. MOTTA 2 1 Nuclear Instrumentation Laboratory/COPPE/UFRJ, P.O. Box 68509, Zip Code 21945-970, Rio de Janeiro, Brazil (Fax 55 21 2906626); 2 Geotechnic Laboratory/COPPE/ UFRJ, P.O. Box 68506, Zip Code 21945-970, Rio de Janeiro, Brazil (Fax 55 21 2906626) (Received 23 June 1997; accepted 14 March 2000) Abstract. This paper describes an alternative nondestructive technique for bulk density and water content determination in soils using dual-energy computerized tomography. A ¢rst generation tomographic system (STAC-1) was used in the analysis of the specimens.The system used 137 Cs ( 662 keV), 192 Ir ( 316 keV) and 241 Am ( 60 keV) as radiation sources and a Sodium Iodine crystal (NaI(Tl)) with photomultiplier tube as the detector. The specimens of soil tested were from different regions, one from Sa‹ o Paulo, and the other from Rio de Janeiro.The bulk density and the water content were determined pointby point, in atransverse section ofthe soil specimens, using a computational algorithm that generated images of bulk density and water content. By utilizing the average pixel values of linear attenuation coef¢cient in these images, for each specimen, a characteristic curve could be built for each soil. The linear attenuation coef¢cient values agreed with the expected data.The compaction curves presented good agreement between the tomographic technique and the standard geotechnical method. Key words: bulk density, compacted soil, computerized tomography, nondestructive testing, water content. 1. Introduction Following the breakthrough in medical computed tomography (CAT) in the 1970s (Houns¢eld, 1972), the search has begun for possible applications of this new picture-producing nondestructive testing method in the industrial ¢eld. At the Bundesanstalt fu«r Materalpru«fung (BAM), Berlin, the ¢rst experiments with an EMI 5005 scanner were performed in 1978. In the wide ¢elds of nondestructive evaluation (NDE), several applications of the technique were found that could be scanned successfully with the soft (E W 120 keV) X-rays of a medical machine. Among these applications were impregnated wood, plastics, ceramics, light com- pound materials, and archaeological objects. After these encouraging results, studies were performed to investigate the feasibility of using computed tomography (CT) for more attenuating materials, such as concrete, steel, iron, brass, uranium, and others. Several investigators as Petrovic et al. (1982), Aylmore et al. (1983; 1986) and Geotechnical and Geological Engineering 18: 221^238, 2000. 221 # 2000 Kluwer Academic Publishers. Printed in the Netherlands.

Welcome message from author
This document is posted to help you gain knowledge. Please leave a comment to let me know what you think about it! Share it to your friends and learn new things together.
Transcript
Technical Note
Dual-energy computerized tomographyin compacted soil
D. BRAZ1, R.T. LOPES1 and L.M.G. MOTTA2
1 Nuclear Instrumentation Laboratory/COPPE/UFRJ, P.O. Box 68509, Zip Code21945-970, Rio de Janeiro, Brazil (Fax 55 21 2906626); 2 Geotechnic Laboratory/COPPE/UFRJ, P.O. Box 68506, Zip Code 21945-970, Rio de Janeiro, Brazil (Fax 55 21 2906626)
(Received 23 June 1997; accepted 14 March 2000)
Abstract. Thispaperdescribes an alternativenondestructive technique forbulkdensityandwatercontent determination in soils using dual-energy computerized tomography. A ¢rst generationtomographic system (STAC-1) was used in the analysis of the specimens. The system used 137Cs(� 662 keV), 192Ir (� 316 keV) and 241Am (� 60 keV) as radiation sources and a Sodium Iodinecrystal (NaI(Tl)) with photomultiplier tube as the detector. The specimens of soil tested werefrom different regions, one from Sa¬ o Paulo, and the other from Rio de Janeiro.The bulk densityand thewater contentwere determinedpointbypoint, in atransverse sectionofthe soil specimens,using a computational algorithm that generated images of bulk density and water content. Byutilizing the average pixel values of linear attenuation coef¢cient in these images, for eachspecimen, a characteristic curve could be built for each soil. The linear attenuation coef¢cientvalues agreedwith the expected data.The compaction curves presented good agreement betweenthe tomographic technique and the standard geotechnical method.
Key words: bulk density, compacted soil, computerized tomography, nondestructive testing,water content.
1. Introduction
Following the breakthrough in medical computed tomography (CAT) in the 1970s(Houns¢eld, 1972), the search has begun for possible applications of this newpicture-producing nondestructive testing method in the industrial ¢eld. At theBundesanstalt fu« r Materalpru« fung (BAM), Berlin, the ¢rst experiments with anEMI 5005 scanner were performed in 1978. In the wide ¢elds of nondestructiveevaluation (NDE), several applications of the technique were found that couldbe scanned successfully with the soft (EW 120 keV) X-rays of a medical machine.Among these applications were impregnated wood, plastics, ceramics, light com-pound materials, and archaeological objects. After these encouraging results, studieswere performed to investigate the feasibility of using computed tomography (CT) formore attenuating materials, such as concrete, steel, iron, brass, uranium, and others.Several investigators as Petrovic et al. (1982), Aylmore et al. (1983; 1986) and
Geotechnical and Geological Engineering 18: 221^238, 2000. 221# 2000 Kluwer Academic Publishers. Printed in the Netherlands.
Crestana (1985) have already illustrated the use of computed tomography for thenondestructive evaluation of soils.
Bulk density and water content are two basic physical properties essential forcharacterizing soil. Recent advances in X- or gamma- (g) ray technologies haveallowed development of computed tomography methods for rapid, nondestructive,three-dimensional analysis of intact biological tissue (Houns¢eld, 1972). With X-or g-ray CT, the intensity of a collimated X- or g-ray beam passing through an objectis measured by an array of detectors located opposite to the X- or g-ray source.
The mono-energetic g-ray attenuation technique has been used as anon-destructive method to determine the bulk density and water content of soils,under laboratory conditions, However, for simultaneous determination of thesetwo parameters it is necessary to use a radiation source emitting two different gray energies. Until recently, no experimental technique has been capable ofmeasuring the spatial distribution of soil water content and bulk density in a con-tinuous and non-destructive manner. Techniques with suf¢cient resolution to enabledetail of water content and bulk density distributions were destructive and hencelacked continuity; perturbed the sensitive balance being examined; were too slowin their response time, or simply lacked the dimensional resolution necessary formeaningful de¢nitions of water content and bulk density distributions (Aylmoreet al., 1983; 1986). The objective of the present work was to install a dual energycomputerized tomography technique to obtain the bulk density and water contenttomographic images in specimens of compacted soils.
2. Theory
2.1. COMPUTERIZED TOMOGRAPHY
In computed tomography, X or gamma rays from a collimated source are directed ata slice of the object from a variety of directions. A CT scanner consists of an X- org-ray source from which an X- or g-ray beam is transmitted through an object.The beam is detected, the image electronically manipulated, and then stored in acomputer. This transmitted beam has a modulated intensity dependent on the overalllinear attenuation characteristics of the intervening material. Varying intensity withrespect to distance is referred to as a pro¢le or projections. Several pro¢les or pro-jections, as a function of angle, are acquired and can be used to produce areconstructed image of an object. The reconstructed image is then displayed ona viewing monitor for evaluation and interpretation.
In a computed tomography (CT) scanner, a number of narrow-beam transmissionpro¢les are made at different angles around a subject. When a beam ofmono-energetic X- or g-rays crosses a specimen, part of the radiation is absorbedby the specimen, part is scattered and part is transmitted. Transmission tomographyis therefore based either on the study of the radiation transmitted through a
222 D. BRAZ ET AL.
specimen, or of tomographic images of the scattered radiation. A comprehensivedescription of CT has been given by Brooks and Di Chiro (1975; 1976).
2.2. IMAGE RECONSTRUCTION
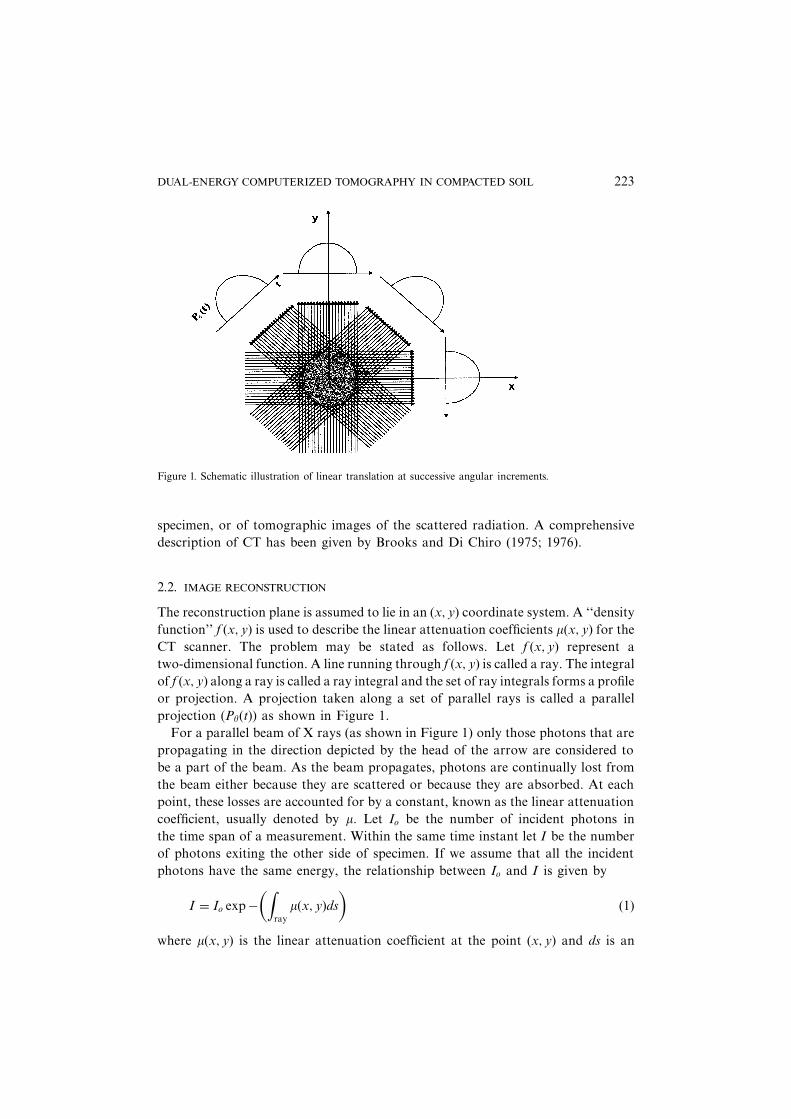
The reconstruction plane is assumed to lie in an �x; y� coordinate system. A ``densityfunction'' f �x; y� is used to describe the linear attenuation coef¢cients m�x; y� for theCT scanner. The problem may be stated as follows. Let f �x; y� represent atwo-dimensional function. A line running through f �x; y� is called a ray. The integralof f �x; y� along a ray is called a ray integral and the set of ray integrals forms a pro¢leor projection. A projection taken along a set of parallel rays is called a parallelprojection �Py�t�� as shown in Figure 1.
For a parallel beam of X rays (as shown in Figure 1) only those photons that arepropagating in the direction depicted by the head of the arrow are considered tobe a part of the beam. As the beam propagates, photons are continually lost fromthe beam either because they are scattered or because they are absorbed. At eachpoint, these losses are accounted for by a constant, known as the linear attenuationcoef¢cient, usually denoted by m. Let Io be the number of incident photons inthe time span of a measurement. Within the same time instant let I be the numberof photons exiting the other side of specimen. If we assume that all the incidentphotons have the same energy, the relationship between Io and I is given by
I � Io expÿZ
ray
m�x; y�ds� �
�1�
where m�x; y� is the linear attenuation coef¢cient at the point �x; y� and ds is an
Figure 1. Schematic illustration of linear translation at successive angular increments.
DUAL-ENERGY COMPUTERIZED TOMOGRAPHY IN COMPACTED SOIL 223
element of length along the ray. From the above equation
lnIoI
� ��Z
ray
m�x; y�ds �2�
The main mathematical problem is therefore to determine the distribution of thelinear attenuation coef¢cient m�x; y� through the section of the specimen crossedby the radiation, which is under the integral. This problem can be solved usinga tomographic image reconstruction algorithm, to obtain the tomographic imagesof a cross section of the specimen. A convolution/¢ltered backprojection (CBP)algorithm was used to reconstruct the tomographic images of the cross sectionof the specimen.
2.3. GAMMA RAYATTENUATION IN SOIL
When a narrow beam of mono-energetic photons with energy E and incident photon£ux intensity Io passed through an homogeneous X- or g-ray absorber of thickness x(in cm), then the emerging intensity �I� will be given by:
I � Io expÿ�m�r;E;Z�x� �3�
where m (in cmÿ1) is the linear attenuation coef¢cient for material of physical densityr (g/cm3) and atomic number Z.
Linear attenuation coef¢cients are convenient for engineering applications andshielding calculations, being proportional to the density and physical state of thematerial. Since molecular binding energies are smaller than the energies involvedin X-ray radiography and tomography, it is a reasonable approximation to assumethat the linear attenuation coef¢cient is directly proportional to the physical density,if the elemental composition is homogeneous, thus:
I � Io expÿ m�E;Z�r
rx� �
or I � Io expÿ� m �E;Z� rx� �4�
where m=r (or m ) (in cmÿ2/g) is the mass attenuation coef¢cient.If the absorber is a non-homogeneous material such as a chemical compound or a
mixture, its mass coef¢cients can be approximately evaluated from the coef¢cientsfor each constituent, according to the weighted sum:
m � mr�Xi
wimiri
� ��5�
where wi is the proportion by weight of the i-th constituent of the material.Soils are made up of a number of constituents and the mass and linear attenuation
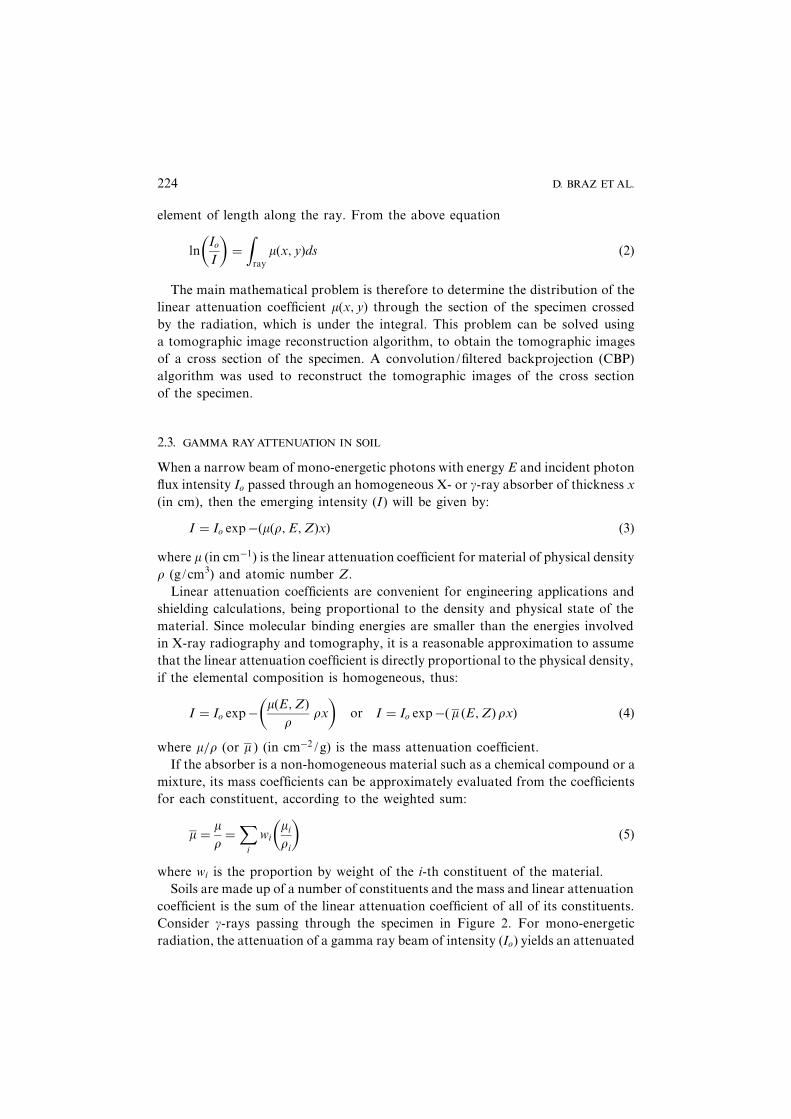
coef¢cient is the sum of the linear attenuation coef¢cient of all of its constituents.Consider g-rays passing through the specimen in Figure 2. For mono-energeticradiation, the attenuation of a gamma ray beam of intensity �Io� yields an attenuated
224 D. BRAZ ET AL.
intensity �I� behind the specimen as a result of passing through a specimen ofthickness x. I is given by:
I � Io expbmsrsxs � maraxa � mgrg�xg � xg0 � xg00 � � 2mcrcxcc �6�
where: ri and mi are density and mass attenuation coef¢cient of the constituents (s forsolid layer, a for water, g for air, c for specimen coating) and;
xt � total thickness of the specimen;xs � thickness of the solid layer;xa � water thickness;xg � thickness of air inside the specimen;xg0 � thickness of air between source and specimen;xg00 � thickness of air between detector and specimen, andxc � thickness of the specimen coating.
Equation (6) can be solved in order to obtain separately bulk density �r� and watercontent �y� equations. A comprehensive description of this procedure was given byBraz (1993).
r � m�E1� � ma�E2� ÿ m�E2� � ma�E1�ms�E1� � ma�E2� ÿ ms�E2� � ma�E1�
�7�
y � m�E2� � ms�E1� ÿ m�E1� � ms�E2�ms�E1� � ma�E2� ÿ ms�E2� � ma�E1�
�8�
Figure 2. Schematic representation of the attenuation of gamma ray beams through a specimen ofthickness x.
DUAL-ENERGY COMPUTERIZED TOMOGRAPHY IN COMPACTED SOIL 225
These equations were implemented in a computational program that producesbulk density and water content from two different energy CT images. The imagesare matrices that contain the bulk density and water content as point by point values.They can be rewritten as:
ri;j �mi;j�E1� � ma�E2� ÿ mi;j�E2� � ma�E1�msi;j �E1� � ma�E2� ÿ msi;j �E2� � ma�E1�
�9�
yi;j �mi;j�E2� � msi;j �E1� ÿ mi:j�E1� � msi;j �E2�msi;j �E1� � ma�E2� ÿ msi;j �E2� � ma�E1�
�10�
3. Materials and Methods
3.1. TOMOGRAPHY SYSTEM
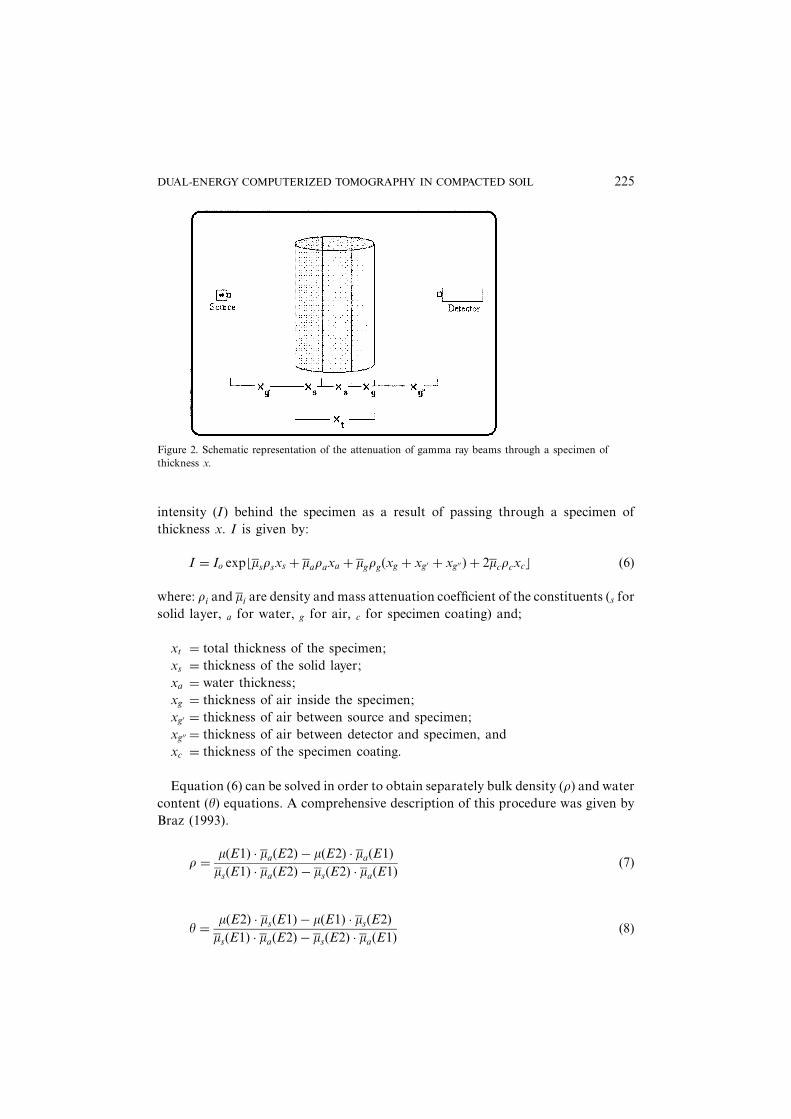
The scanner used in this study was a ¢rst-generation system with a ¢xedsource-detector arrangement in which the specimen is translated and rotated. Radio-active sources can be changed as required. The characteristics sources and the ener-gies used in this study are shown in Table 1.
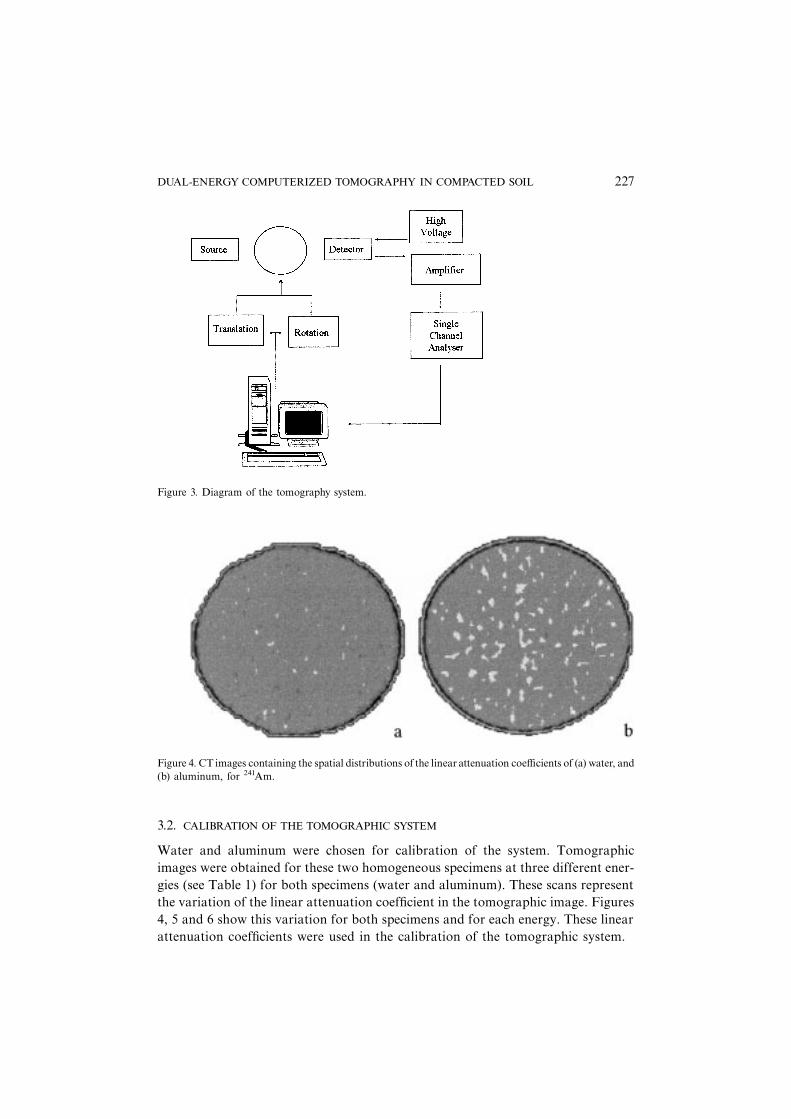
The gamma-ray CT equipment employed in this experiment was built at theNuclear Instrumentation Laboratory and has been used in a number of studies,including soil and asphalt investigations. The detection system for the gamma sourcewas a NaI (Tl) scintillation detector coupled to a photomultiplier. The collimatorsused in front of the source and the detector had an aperture with diameter of 1 mm.The translational step size was 1 mm and 60 projections were obtained over 180�.The data acquisition system as well as the movements of translation and rotationof the specimen are controlled using a microcomputer through coupling interfaces(Figure 3). The data for a given cross-section of the specimen are stored and aCBP image reconstruction algorithm is used to generate the image. The imageobtained is a matrix of points (pixels) whose values are directly related to the linearattenuation coef¢cients for a small volume element within the materials in the speci-men at the speci¢c energy of radiation used.
Table 1. Radiation sources utilized
Source Isotope Activity Energy
F1 Cs 137 1.11�1010 Bq E1 � 662 keV
F2 Ir 192 9.25�1010 Bq E2 � 316 keV
F3 Am 241 1.11�1010 Bq E3 � 60 keV
226 D. BRAZ ET AL.
3.2. CALIBRATION OF THE TOMOGRAPHIC SYSTEM
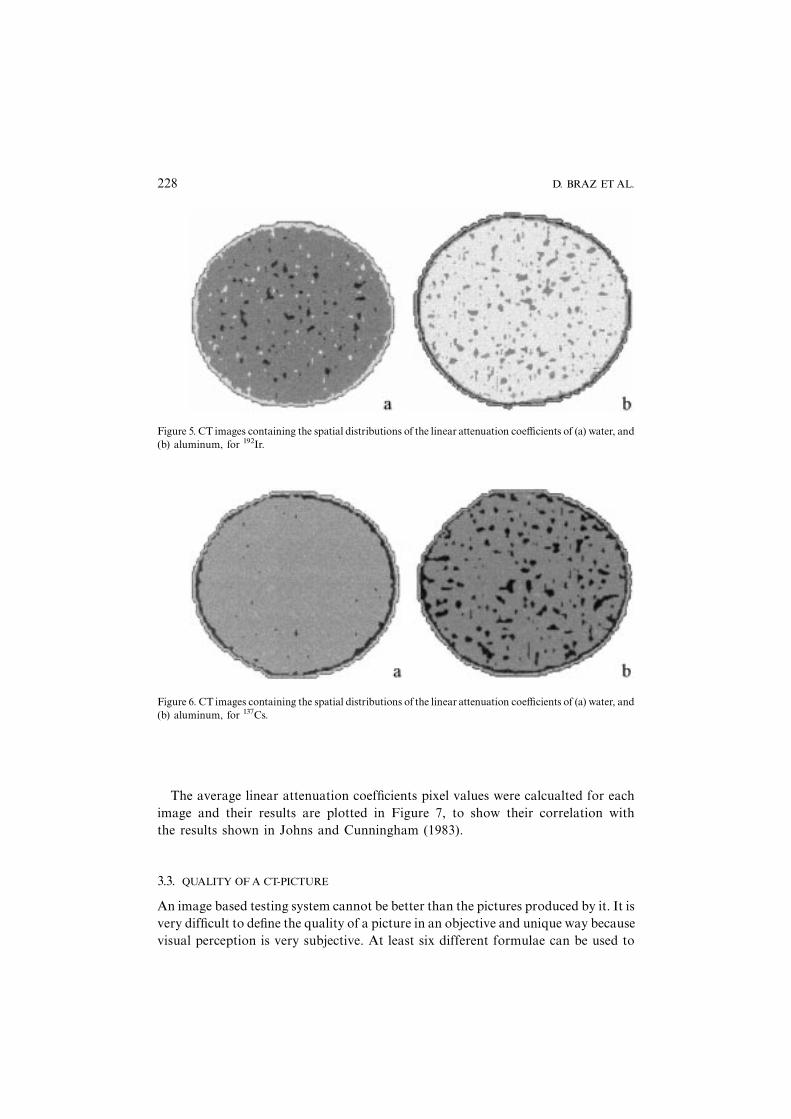
Water and aluminum were chosen for calibration of the system. Tomographicimages were obtained for these two homogeneous specimens at three different ener-gies (see Table 1) for both specimens (water and aluminum). These scans representthe variation of the linear attenuation coef¢cient in the tomographic image. Figures4, 5 and 6 show this variation for both specimens and for each energy. These linearattenuation coef¢cients were used in the calibration of the tomographic system.
Figure 3. Diagram of the tomography system.
Figure 4. CT images containing the spatial distributions of the linear attenuation coe¤cients of (a) water, and(b) aluminum, for 241Am.
DUAL-ENERGY COMPUTERIZED TOMOGRAPHY IN COMPACTED SOIL 227
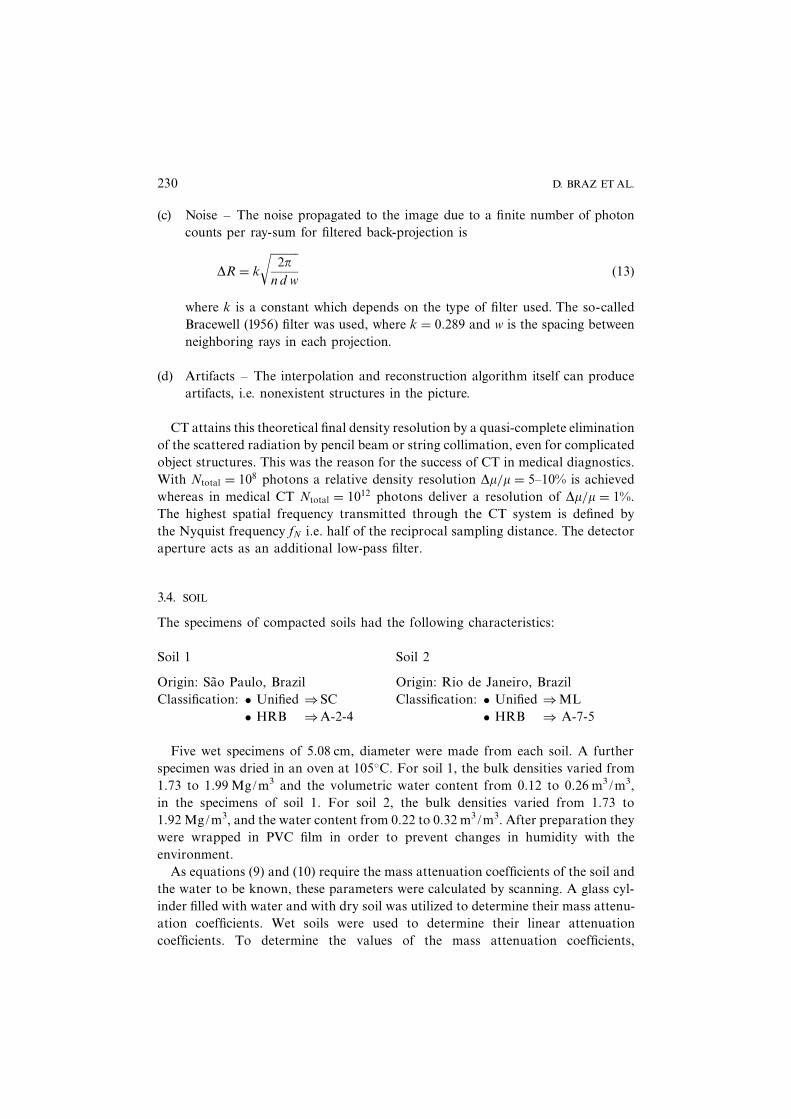
The average linear attenuation coef¢cients pixel values were calcualted for eachimage and their results are plotted in Figure 7, to show their correlation withthe results shown in Johns and Cunningham (1983).
3.3. QUALITY OFA CT-PICTURE
An image based testing system cannot be better than the pictures produced by it. It isvery dif¢cult to de¢ne the quality of a picture in an objective and unique way becausevisual perception is very subjective. At least six different formulae can be used to
Figure 5. CT images containing the spatial distributions of the linear attenuation coe¤cients of (a) water, and(b) aluminum, for 192Ir.
Figure 6. CT images containing the spatial distributions of the linear attenuation coe¤cients of (a) water, and(b) aluminum, for 137Cs.
228 D. BRAZ ET AL.
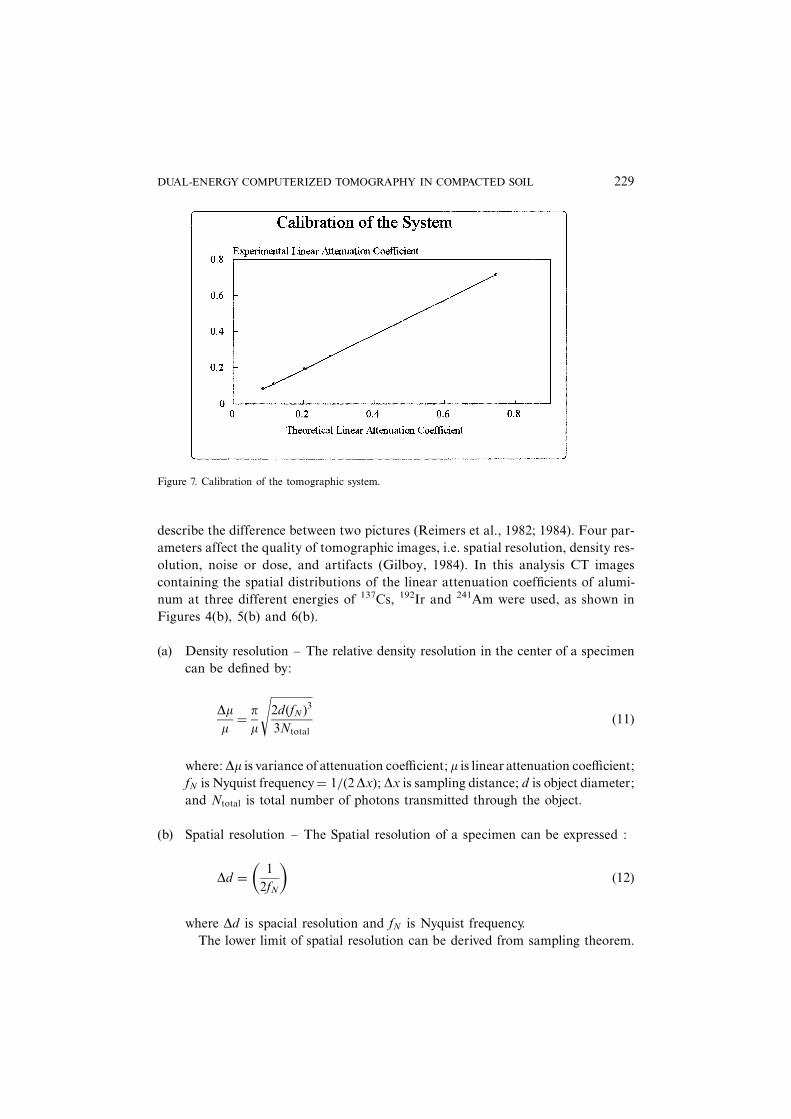
describe the difference between two pictures (Reimers et al., 1982; 1984). Four par-ameters affect the quality of tomographic images, i.e. spatial resolution, density res-olution, noise or dose, and artifacts (Gilboy, 1984). In this analysis CT imagescontaining the spatial distributions of the linear attenuation coef¢cients of alumi-num at three different energies of 137Cs, 192Ir and 241Am were used, as shown inFigures 4(b), 5(b) and 6(b).
(a) Density resolution ^ The relative density resolution in the center of a specimencan be de¢ned by:
Dmm� p
m
���������������2d�fN �33Ntotal
s�11�
where: Dm is variance of attenuation coe¤cient; m is linear attenuation coe¤cient;fN is Nyquist frequency� 1=�2Dx�; Dx is sampling distance; d is object diameter;and Ntotal is total number of photons transmitted through the object.
(b) Spatial resolution ^ The Spatial resolution of a specimen can be expressed :
Dd � 12fN
� ��12�
where Dd is spacial resolution and fN is Nyquist frequency.The lower limit of spatial resolution can be derived from sampling theorem.
Figure 7. Calibration of the tomographic system.
DUAL-ENERGY COMPUTERIZED TOMOGRAPHY IN COMPACTED SOIL 229
(c) Noise ^ The noise propagated to the image due to a ¢nite number of photoncounts per ray-sum for ¢ltered back-projection is
DR � k
����������2p
n d w
r�13�
where k is a constant which depends on the type of ¢lter used. The so-calledBracewell (1956) ¢lter was used, where k � 0:289 and w is the spacing betweenneighboring rays in each projection.
(d) Artifacts ^ The interpolation and reconstruction algorithm itself can produceartifacts, i.e. nonexistent structures in the picture.
CT attains this theoretical ¢nal density resolution by a quasi-complete eliminationof the scattered radiation by pencil beam or string collimation, even for complicatedobject structures. This was the reason for the success of CT in medical diagnostics.With Ntotal � 108 photons a relative density resolution Dm=m � 5^10% is achievedwhereas in medical CT Ntotal � 1012 photons deliver a resolution of Dm=m � 1%.The highest spatial frequency transmitted through the CT system is de¢ned bythe Nyquist frequency fN i.e. half of the reciprocal sampling distance. The detectoraperture acts as an additional low-pass ¢lter.
3.4. SOIL
The specimens of compacted soils had the following characteristics:
Soil 1 Soil 2
Origin: Sa¬ o Paulo, Brazil Origin: Rio de Janeiro, BrazilClassi¢cation: � Uni¢ed )SC Classi¢cation: � Uni¢ed )ML
� HRB )A-2-4 � HRB ) A-7-5
Five wet specimens of 5.08 cm, diameter were made from each soil. A furtherspecimen was dried in an oven at 105�C. For soil 1, the bulk densities varied from1.73 to 1.99Mg/m3 and the volumetric water content from 0.12 to 0.26 m3/m3,in the specimens of soil 1. For soil 2, the bulk densities varied from 1.73 to1.92 Mg/m3, and the water content from 0.22 to 0.32 m3/m3. After preparation theywere wrapped in PVC ¢lm in order to prevent changes in humidity with theenvironment.
As equations (9) and (10) require the mass attenuation coef¢cients of the soil andthe water to be known, these parameters were calculated by scanning. A glass cyl-inder ¢lled with water and with dry soil was utilized to determine their mass attenu-ation coef¢cients. Wet soils were used to determine their linear attenuationcoef¢cients. To determine the values of the mass attenuation coef¢cients,
230 D. BRAZ ET AL.
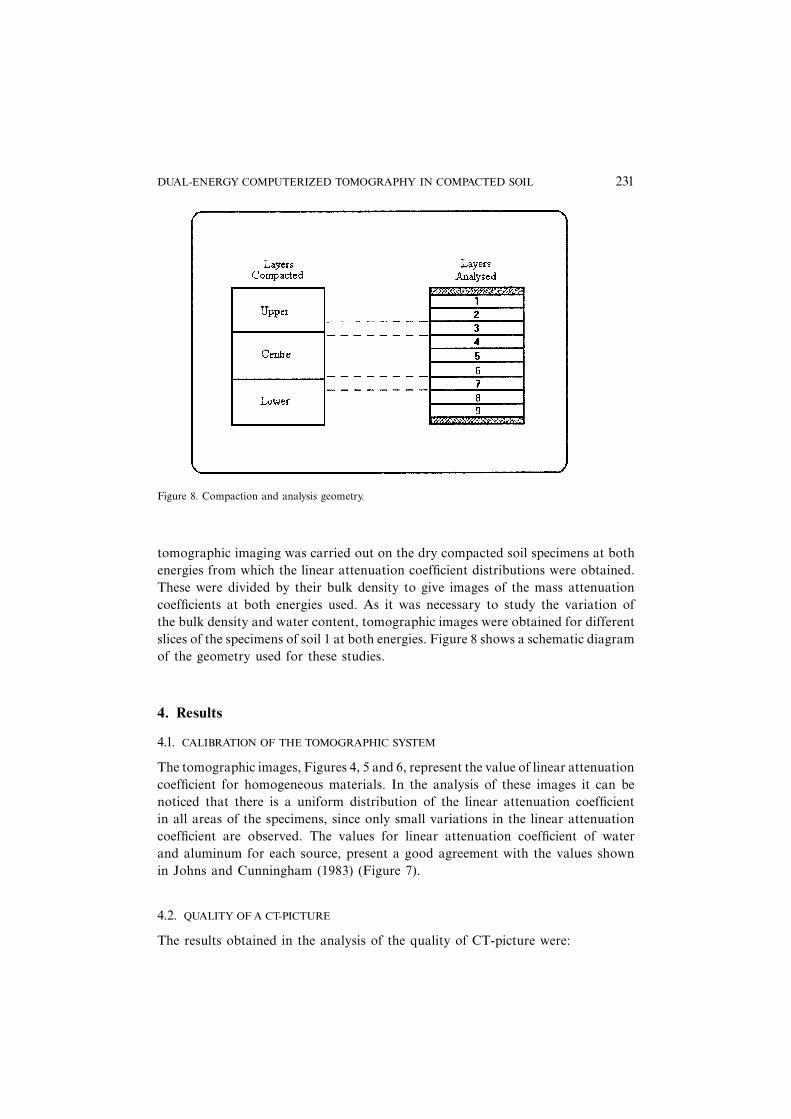
tomographic imaging was carried out on the dry compacted soil specimens at bothenergies from which the linear attenuation coef¢cient distributions were obtained.These were divided by their bulk density to give images of the mass attenuationcoef¢cients at both energies used. As it was necessary to study the variation ofthe bulk density and water content, tomographic images were obtained for differentslices of the specimens of soil 1 at both energies. Figure 8 shows a schematic diagramof the geometry used for these studies.
4. Results
4.1. CALIBRATION OF THE TOMOGRAPHIC SYSTEM
The tomographic images, Figures 4, 5 and 6, represent the value of linear attenuationcoef¢cient for homogeneous materials. In the analysis of these images it can benoticed that there is a uniform distribution of the linear attenuation coef¢cientin all areas of the specimens, since only small variations in the linear attenuationcoef¢cient are observed. The values for linear attenuation coef¢cient of waterand aluminum for each source, present a good agreement with the values shownin Johns and Cunningham (1983) (Figure 7).
4.2. QUALITY OFA CT-PICTURE
The results obtained in the analysis of the quality of CT-picture were:
Figure 8. Compaction and analysis geometry.
DUAL-ENERGY COMPUTERIZED TOMOGRAPHY IN COMPACTED SOIL 231
(a) Density resolution
Dmm�E1� � 10.28%
Dmm�E2� � 6.83%
Dmm�E3� � 13.34%
(b) Spatial resolution
Dd � 1mm
(c) Noise
Dm�E1� � 0.010 cmÿ1
Dm�E2� � 0.008 cmÿ1
Dm�E3� � 0.013 cmÿ1
(d) Artifacts ^ not observed in any tomographic images.
From the analysis of these values, the quality of the CT-picture was good. Thesevalues present good agreement with those obtained by Reimers et al. (1982).The results clearly show that the system can be used to examine spacial distributionsin soil water content and bulk density.
4.3. SOIL
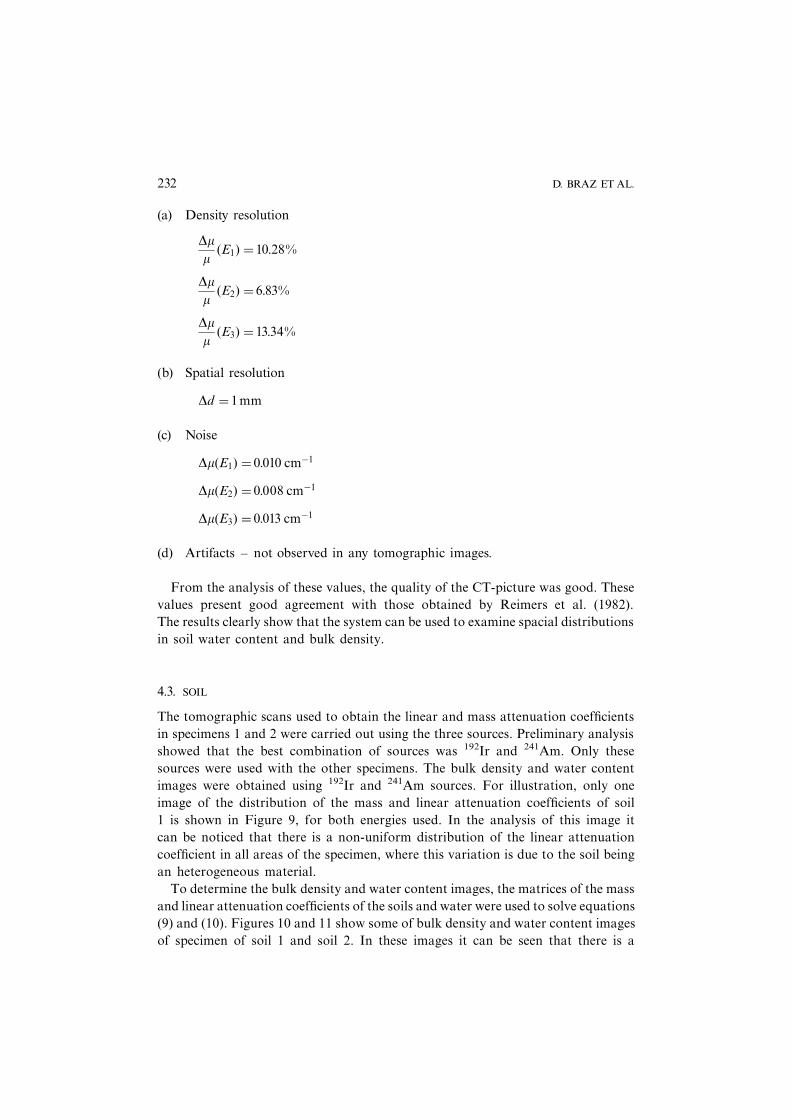
The tomographic scans used to obtain the linear and mass attenuation coef¢cientsin specimens 1 and 2 were carried out using the three sources. Preliminary analysisshowed that the best combination of sources was 192Ir and 241Am. Only thesesources were used with the other specimens. The bulk density and water contentimages were obtained using 192Ir and 241Am sources. For illustration, only oneimage of the distribution of the mass and linear attenuation coef¢cients of soil1 is shown in Figure 9, for both energies used. In the analysis of this image itcan be noticed that there is a non-uniform distribution of the linear attenuationcoef¢cient in all areas of the specimen, where this variation is due to the soil beingan heterogeneous material.
To determine the bulk density and water content images, the matrices of the massand linear attenuation coef¢cients of the soils and water were used to solve equations(9) and (10). Figures 10 and 11 show some of bulk density and water content imagesof specimen of soil 1 and soil 2. In these images it can be seen that there is a
232 D. BRAZ ET AL.
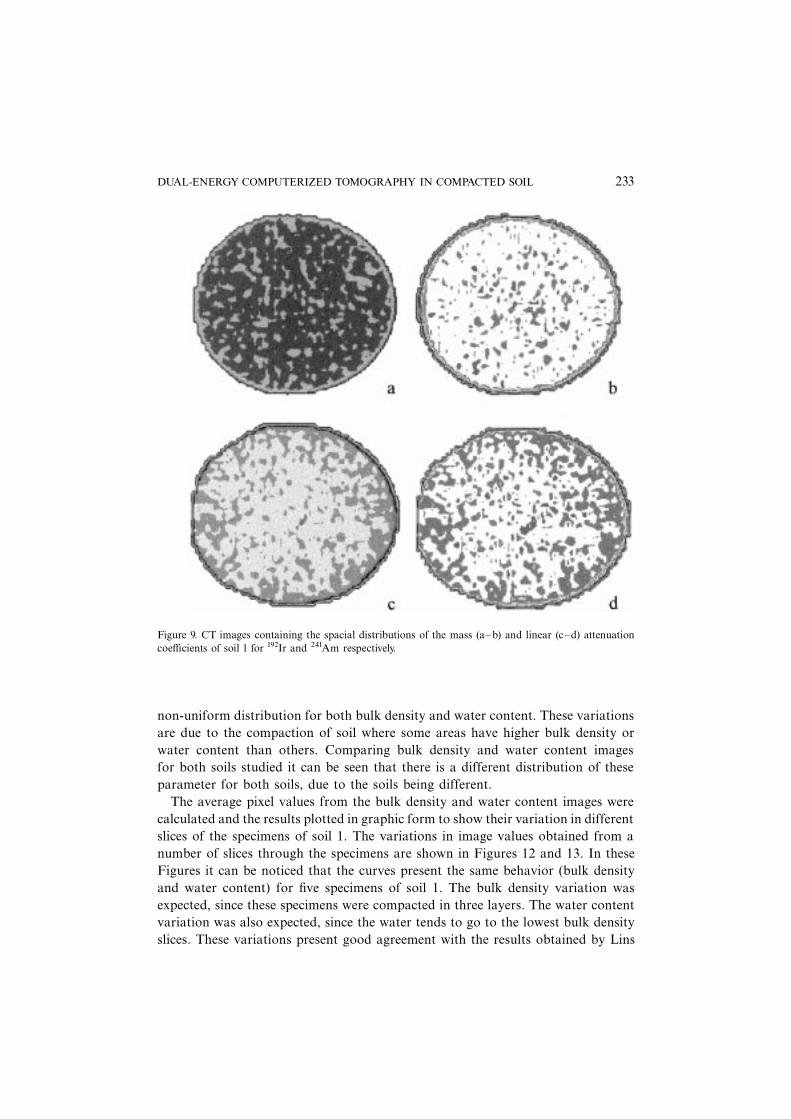
non-uniform distribution for both bulk density and water content. These variationsare due to the compaction of soil where some areas have higher bulk density orwater content than others. Comparing bulk density and water content imagesfor both soils studied it can be seen that there is a different distribution of theseparameter for both soils, due to the soils being different.
The average pixel values from the bulk density and water content images werecalculated and the results plotted in graphic form to show their variation in differentslices of the specimens of soil 1. The variations in image values obtained from anumber of slices through the specimens are shown in Figures 12 and 13. In theseFigures it can be noticed that the curves present the same behavior (bulk densityand water content) for ¢ve specimens of soil 1. The bulk density variation wasexpected, since these specimens were compacted in three layers. The water contentvariation was also expected, since the water tends to go to the lowest bulk densityslices. These variations present good agreement with the results obtained by Lins
Figure 9. CT images containing the spacial distributions of the mass (a^b) and linear (c^d) attenuationcoe¤cients of soil 1 for 192Ir and 241Am respectively.
DUAL-ENERGY COMPUTERIZED TOMOGRAPHY IN COMPACTED SOIL 233
(1991) in his studies of the bulk density variation of soil compacted in three and sixlayers using the X ray system at Oxford University.
The bulk density and the water content values were determined point by point in atransverse section of the specimen, using a computational algorithm that generatedimages of bulk density and water content. By utilizing the average values in theseimages for each specimen, a characteristic curve of compacted soil for each kindof soil utilized could be constructed.
The values obtained in all results agree with what was expected. The compactioncurves obtained using the average of the tomographic matrices of bulk densityand water content are very similar to curves obtained using the usually experimentalgeotechnical methods for both kind of soil studied. Figure 14 show the curves ofcomparison (tomographic technique versus geotechnical method) for soil 1 and soil2. As it can be seen there is a good agreement between the tomographic techniqueand the geotechnical method.
Figure10. CT images containing the spacial distributions of the bulk density and water content of specimen1(a^b) and specimen 3 (c^d), soil 1.
234 D. BRAZ ET AL.
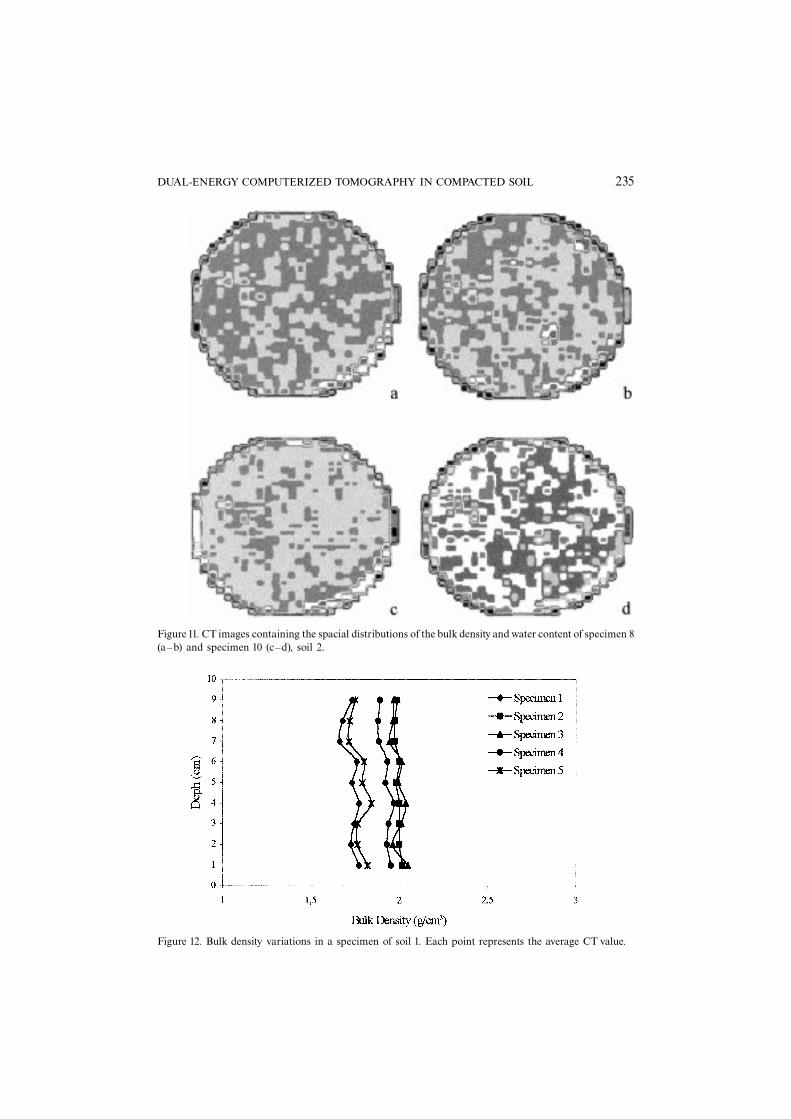
Figure 11. CT images containing the spacial distributions of the bulk density and water content of specimen 8(a^b) and specimen 10 (c^d), soil 2.
Figure 12. Bulk density variations in a specimen of soil 1. Each point represents the average CT value.
DUAL-ENERGY COMPUTERIZED TOMOGRAPHY IN COMPACTED SOIL 235
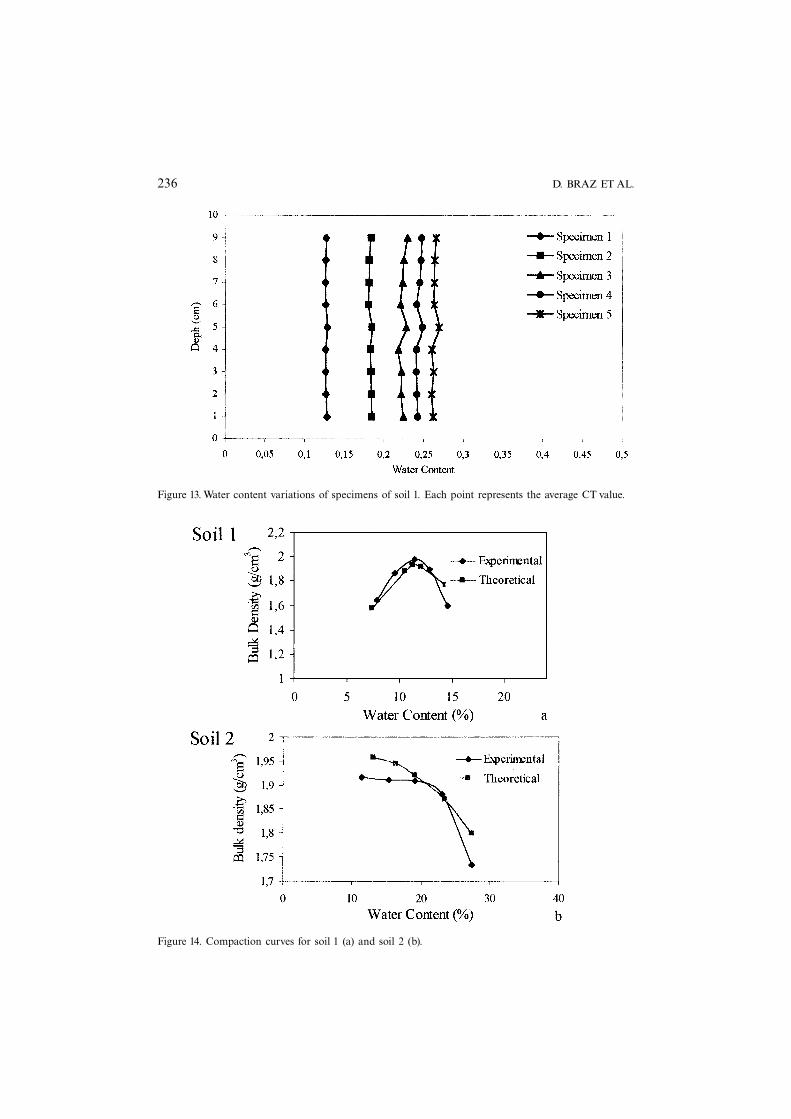
Figure 13.Water content variations of specimens of soil 1. Each point represents the average CT value.
Figure 14. Compaction curves for soil 1 (a) and soil 2 (b).
236 D. BRAZ ET AL.
5. Conclusion
From the analysis of the bulk density and water content images, it is shown that adual-energy tomography system is able to distinguish small differences in these para-meters in compacted soils. The variation of bulk density and water contentthroughout the depth of compacted specimens show similar behavior. Compactioncurves obtained from the average of the tomographic matrices of bulk densityand water content are similar to curves obtained using the usual geotechnicalmethods.
Acknowledgements
The authors thank Fundac° a¬ o de Amparo a© Pesquisa do Esdado do Rio de Janeiro(FAPERJ), Conselho Nacional de Desenvolvimento Cient|¢co e Tecnologico(CNPq) and FINEP (project RECOPE) for ¢nancial support.
References
Aylmore, L.A.G. and Hainsworth, J.M. (1983) The use of computed assisted tomography todetermine spatial distribution of soil water content, Australian Journal Soil Res, 21,435^443.
Aylmore, L.A.G. and Hainsworth, J.M. (1986) Water extraction by single plant roots, SoilScience Society American Journal, 50, 841^848.
Bracewell, R.N. (1956) The Fourier Transform and its applications, Australian JournalPhysics, 19, 198^217.
Braz, D. (1993) Computerized Tomography in Soil and Asphaltic Mixture Analyze, (inPortuguese), M.Sc. Thesis, COPPE-UFRJ, Rio de Janeiro, 88 pp.
Brooks, R.A. and Di Chiro, G. (1975) Theory of image reconstruction in computed tomo-graphy, Radiology, 117, 561^572.
Brooks, R.A. and Di Chiro, G. (1976) Principles of computer assisted tomography (CAT) inradiographic and radioisotope imaging, Physics Med. Biol., 21, 689^732.
Crestana, S. (1985) Water Physics Study on Soil Using Computerized Tomography, (inPortuguese), Ph.D. Thesis ^ USP, Sa¬ o Carlos, Sa¬ o Paulo, 151 pp.
Gilboy, W.B. (1984), X- and g-ray tomography in NDE applications, Nuclear Instrum. andMet. in Phys. Res., 221, 201^206.
Houns¢eld, G.N. (1972) Computerized trans axial scanning (Tomography) 1: Description ofSystem, Brit. Journal Radiol, 46, 1016^1022.
Johns, H.E. and Cunningham, J.R. (1983) The Physics of Radiology, 4th edition, Charles C.Thomas, Publisher.
Lins, A.H.P. (1991) Strength and Pore Pressure Developed in an Unsaturated Compacted Soilin Laboratory, (in Portuguese), Ph.D. Thesis ^ COPPE ^ UFRJ, Rio de Janeiro, 767 pp.
Petrovic, A.M., Siebert J.E. and Rieke, P.E. (1982) Soil bulk density analysis inthree-dimension by computed tomography scanning, Soil Science Society American Proc.,46(3), 445^450.
Radon, J. (1917) On the determination of function from their integrals along certainmanifolds, Ber. Saechs. Akad. Wiss. Leipsing Math. Phys., KL69, 262^277.
DUAL-ENERGY COMPUTERIZED TOMOGRAPHY IN COMPACTED SOIL 237

Reimers, P. and Goebbels, J. (1982) New possibilities of non-destructive evaluation by X-raycomputed tomography, Materials Evaluation, 41(6), 732^737.
Reimers, P., Goebbels, J, Weise W.P. and Wilding, K. (1984) Some aspects of industrialnondestructive evaluation by X- and g-ray computed tomography, Nuclear Inst. and Met.on Phys. Res., 221, 201^206.
238 D. BRAZ ET AL.
Related Documents


![[Gabor T. Herman] Fundamentals of Computerized Tomography](https://static.cupdf.com/doc/110x72/56d6be8a1a28ab3016929351/gabor-t-herman-fundamentals-of-computerized-tomography.jpg)