Journal of Naval Architecture and Marine Engineering December, 2017 http://dx.doi.org/10.3329/jname.v14i2.25894 http://www.banglajol.info 1813-8235 (Print), 2070-8998 (Online) © 2017 ANAME Publication. All rights reserved. Received on: Dec., 2015 NUMERICAL SIMULATION OF VORTEX INDUCED VIBRATIONS IN HEAT EXCHANGER TUBE BUNDLE AT LOW REYNOLDS NUMBER A. Khan 1* , S. Khushnood 1 , N. Saqib 1 , I. S. Shahid 2 1 M echanical Engineering Department, University of Engineering and Technology Taxila, Pakistan. *Email: [email protected] 2 M echanical Engineering Department, Heavy Industry Taxila Education City University Taxila, Pakistan, [email protected] Abstract: It is well known that when the tube is forced to vibrate or is naturally excited to sufficient amplitudes by flow-induced forces, vortices shedding phenomena occurs at downstream of a tube which leads to vibration in the tube. Two-dimensional numerical simulation model for the computation of flow induced vibration of heat exchanger tube bundle subjected to cross- flow is accomplished in present research. Computational Fluid Dynamics (CFD) tool, GAMBIT (grid generation) and ANSYS FLUENT (fluid flow analysis) are utilized during numerical investigations. k-epsilon model has been used to solve the Navier-Stokes equations. Lift coefficient graph derived from analysis is used to predict the vortex shedding frequency using Fast Fourier Transform (FFT). The results of flow rate, Strouhal number, Reduced velocity, Natural frequency of tube as obtained from the experimental data has been verified numerically for a Reynolds number range of 4.45 × 10 4 < Re <4.65 × 10 4 . It is concluded that experimental results are well in agreement with the numerical results. Keywords: Computational Fluid Dynamics (CFD), vortex shedding frequency, Reynolds number, Navier- Stroke, numerical Simulation NOMENCLATURE U ∞ , U, u Free stream flow velocity (m/s) F Body force (N) d o Outer diameter of tube (mm) g Acceleration due to gravity (m/s 2 ) f e Excitation frequency (Hz) k Bending stiffness (N/m) f n Natural frequency (Hz) r Radius of tube (mm) f vs Vortex shedding frequency (Hz) P Pressure (Pa) l s Span length (m) K Turbulence kinetic energy (m 2/ s 2 ) A Cross sectional area of tube (m 2 ) e Internal energy (J) D Shell diameter (mm) U avg Mean flow velocity (m/s) E Modulus of elasticity (kg/m 2 ) Y + Boundary layer region value I Moment of inertia (m 4 ) V Fluid velocity (m/s) L Tube length (m) C L Lift coefficient L/D Longitudinal pitch to diameter ratio C D Drag coefficient P/D Pitch to diameter ratio Greek symbols Q Flow rate (liters/s) ϵ Turbulence dissipation (m 2 /s 3 ) R e Reynolds number ρ tube Tube material density (kg/m 3 ) St Strouhal number ρ w Water density (kg/m 3 ) T Time period (s) γ Bending stiffness (N/m) T/D Transverse pitch to diameter ratio Φ Dissipation Term

Welcome message from author
This document is posted to help you gain knowledge. Please leave a comment to let me know what you think about it! Share it to your friends and learn new things together.
Transcript
Journal of Naval Architecture and Marine Engineering December, 2017
http://dx.doi.org/10.3329/jname.v14i2.25894 http://www.banglajol.info
1813-8235 (Print), 2070-8998 (Online) © 2017 ANAME Publication. All rights reserved. Received on: Dec., 2015
NUMERICAL SIMULATION OF VORTEX INDUCED
VIBRATIONS IN HEAT EXCHANGER TUBE BUNDLE AT LOW
REYNOLDS NUMBER
A. Khan1*, S. Khushnood1, N. Saqib1, I. S. Shahid2 1Mechanical Engineering Department, University of Engineering and Technology Taxila, Pakistan. *Email: [email protected] 2Mechanical Engineering Department, Heavy Industry Taxila Education City University Taxila, Pakistan,
Abstract: It is well known that when the tube is forced to vibrate or is naturally excited to sufficient amplitudes
by flow-induced forces, vortices shedding phenomena occurs at downstream of a tube which leads to vibration in the tube. Two-dimensional numerical simulation model for the computation of flow
induced vibration of heat exchanger tube bundle subjected to cross- flow is accomplished in present
research. Computational Fluid Dynamics (CFD) tool, GAMBIT (grid generation) and ANSYS
FLUENT (fluid flow analysis) are utilized during numerical investigations. k-epsilon model has been
used to solve the Navier-Stokes equations. Lift coefficient graph derived from analysis is used to predict the vortex shedding frequency using Fast Fourier Transform (FFT). The results of flow rate,
Strouhal number, Reduced velocity, Natural frequency of tube as obtained from the experimental data
has been verified numerically for a Reynolds number range of 4.45 × 10⁴< Re <4.65 × 10⁴ . It is
concluded that experimental results are well in agreement with the numerical results.
Keywords: Computational Fluid Dynamics (CFD), vortex shedding frequency, Reynolds number, Navier-
Stroke, numerical Simulation
NOMENCLATURE
U∞, U, u Free stream flow velocity (m/s) F Body force (N)
do
Outer diameter of tube (mm) g Acceleration due to gravity (m/s2)
fe Excitation frequency (Hz) k Bending stiffness (N/m)
fn Natural frequency (Hz) r Radius of tube (mm)
fvs Vortex shedding frequency (Hz) P Pressure (Pa)
ls Span length (m) K Turbulence kinetic energy (m2/
s2)
A Cross sectional area of tube (m2) e Internal energy (J)
D Shell diameter (mm) Uavg Mean flow velocity (m/s)
E Modulus of elasticity (kg/m2) Y
+ Boundary layer region value
I Moment of inertia (m4) V Fluid velocity (m/s)
L Tube length (m) CL Lift coefficient
L/D Longitudinal pitch to diameter ratio CD Drag coefficient
P/D Pitch to diameter ratio Greek symbols
Q Flow rate (liters/s) ϵ Turbulence dissipation (m2/s
3)
Re Reynolds number ρtube Tube material density (kg/m3)
St Strouhal number ρw Water density (kg/m3)
T Time period (s) γ Bending stiffness (N/m)
T/D Transverse pitch to diameter ratio Φ Dissipation Term
A. Khan, S. Khushnood, N. Saqib, I. S. Shahid/ Journal of Naval Architecture and Marine Engineering, 14(2017) 77-91
Numerical simulation of vortex induced vibrations in heat exchanger tube bundle at low Reynolds number
78
1. Introduction
Heat exchange between fluids is one of the important processes in engineering and in various types of
installations various types of heat exchangers are used, such as process industry, power generation, Nuclear
Power Plants etc. Fluid flowing in heat exchangers across the tubes result in vibration at large amplitudes. When
these vibrations occur, tubes may wear and fail due to oscillatory contacts with adjacent tubes or with support
plates. Fracture of the tube bundle due to Cross -Flow-Induced-Vibrations is a serious concern in the heat
exchanger generally at high Reynolds number. Flow-Induced vibrations (FIV) of the tube bundles are very
complex. For the last five decades, extensive research has been done in the field of Cross -Flow-Induced-Vibrations both experimentally as well as numerically.
According to Blevins (1977), Vortex shedding occurs normally for the range of Reynolds number 100 < Re <
5x10⁵ and > 2 x 10
6 whereas it dies out in-between. Vortex shedding can excite tube vibration when it matches
with the natural frequency of the tubes. According to Chenoweth et al. (1993), for a single cylinder Strouhal
number is a constant with a value of about 0.2. Kevlahan (2011) simulation over the single cylinder reviews the
generation of lift force over the cylinder due to vortices at higher Reynolds numbers (Re). Yu and Lin (2005)
pointed out that beyond the critical value of free steam velocity a single cylinder can show a large amplitude
response even with a small velocity change. There is a certain vibration of the cylinder in elliptical orbits
beyond the critical value. Grotz and Arnold (1956) earliest time calculated analytically the vortex shedding
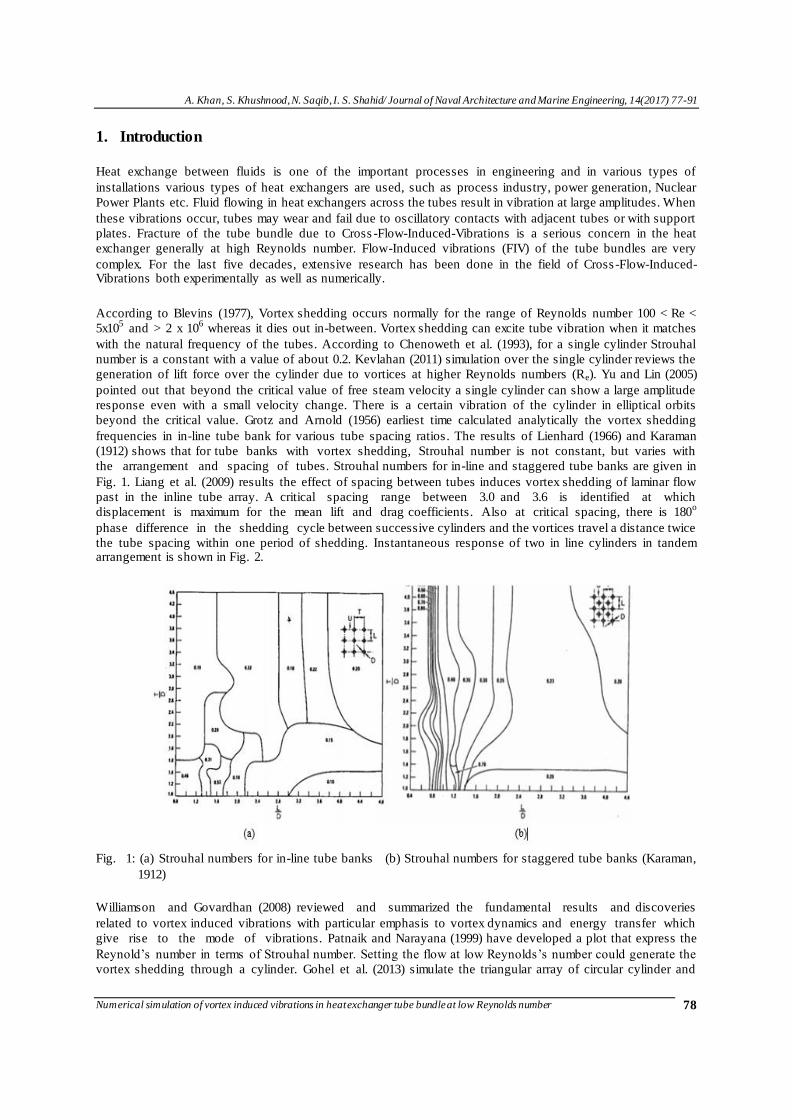
frequencies in in-line tube bank for various tube spacing ratios. The results of Lienhard (1966) and Karaman
(1912) shows that for tube banks with vortex shedding, Strouhal number is not constant, but varies with
the arrangement and spacing of tubes. Strouhal numbers for in-line and staggered tube banks are given in
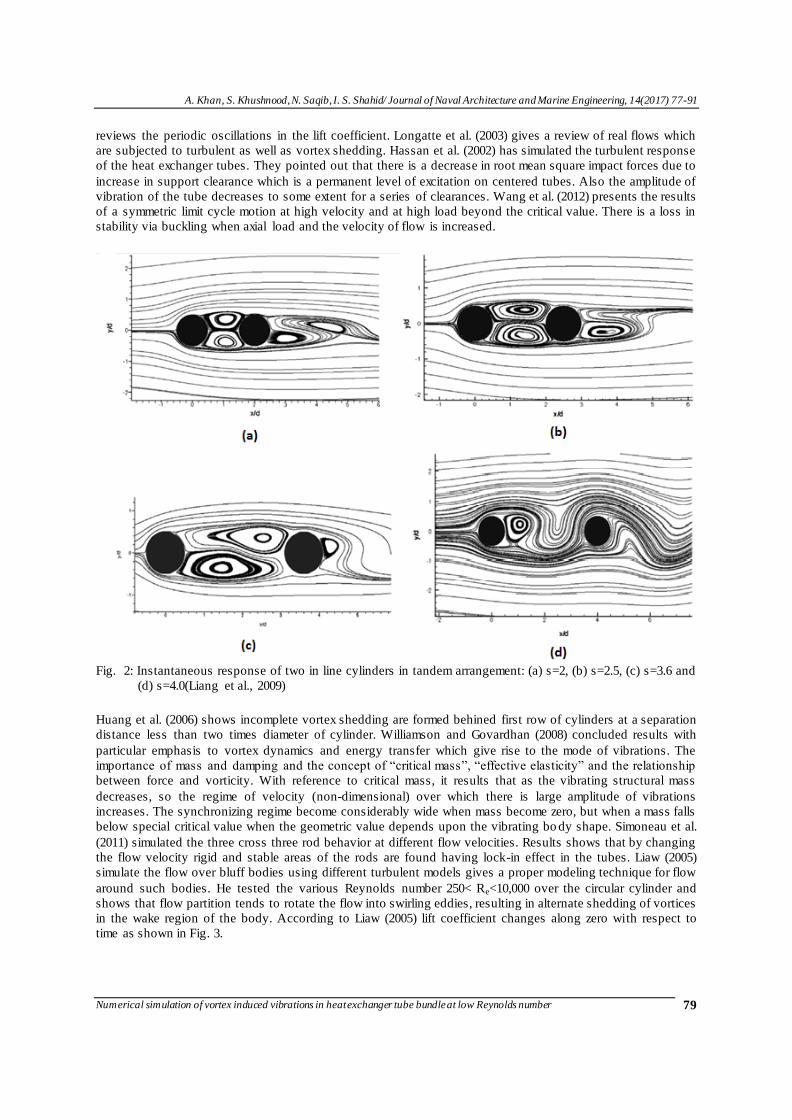
Fig. 1. Liang et al. (2009) results the effect of spacing between tubes induces vortex shedding of laminar flow
past in the inline tube array. A critical spacing range between 3.0 and 3.6 is identified at which
displacement is maximum for the mean lift and drag coefficients. Also at critical spacing, there is 180o
phase difference in the shedding cycle between successive cylinders and the vortices travel a distance twice
the tube spacing within one period of shedding. Instantaneous response of two in line cylinders in tandem arrangement is shown in Fig. 2.
Fig. 1: (a) Strouhal numbers for in-line tube banks (b) Strouhal numbers for staggered tube banks (Karaman,
1912)
Williamson and Govardhan (2008) reviewed and summarized the fundamental results and discoveries
related to vortex induced vibrations with particular emphasis to vortex dynamics and energy transfer which
give rise to the mode of vibrations. Patnaik and Narayana (1999) have developed a plot that express the
Reynold’s number in terms of Strouhal number. Setting the flow at low Reynolds’s number could generate the
vortex shedding through a cylinder. Gohel et al. (2013) simulate the triangular array of circular cylinder and
A. Khan, S. Khushnood, N. Saqib, I. S. Shahid/ Journal of Naval Architecture and Marine Engineering, 14(2017) 77-91
Numerical simulation of vortex induced vibrations in heat exchanger tube bundle at low Reynolds number
79
reviews the periodic oscillations in the lift coefficient. Longatte et al. (2003) gives a review of real flows which
are subjected to turbulent as well as vortex shedding. Hassan et al. (2002) has simulated the turbulent response
of the heat exchanger tubes. They pointed out that there is a decrease in root mean square impact forces due to
increase in support clearance which is a permanent level of excitation on centered tubes. Also the amplitude of
vibration of the tube decreases to some extent for a series of clearances. Wang et al. (2012) presents the results
of a symmetric limit cycle motion at high velocity and at high load beyond the critical value. There is a loss in
stability via buckling when axial load and the velocity of flow is increased.
Fig. 2: Instantaneous response of two in line cylinders in tandem arrangement: (a) s=2, (b) s=2.5, (c) s=3.6 and
(d) s=4.0(Liang et al., 2009)
Huang et al. (2006) shows incomplete vortex shedding are formed behined first row of cylinders at a separation
distance less than two times diameter of cylinder. Williamson and Govardhan (2008) concluded results with
particular emphasis to vortex dynamics and energy transfer which give rise to the mode of vibrations. The
importance of mass and damping and the concept of “critical mass”, “effective elasticity” and the relationship
between force and vorticity. With reference to critical mass, it results that as the vibrating structural mass
decreases, so the regime of velocity (non-dimensional) over which there is large amplitude of vibrations
increases. The synchronizing regime become considerably wide when mass become zero, but when a mass falls
below special critical value when the geometric value depends upon the vibrating bo dy shape. Simoneau et al.
(2011) simulated the three cross three rod behavior at different flow velocities. Results shows that by changing
the flow velocity rigid and stable areas of the rods are found having lock-in effect in the tubes. Liaw (2005)
simulate the flow over bluff bodies using different turbulent models gives a proper modeling technique for flow
around such bodies. He tested the various Reynolds number 250< Re<10,000 over the circular cylinder and
shows that flow partition tends to rotate the flow into swirling eddies, resulting in alternate shedding of vortices
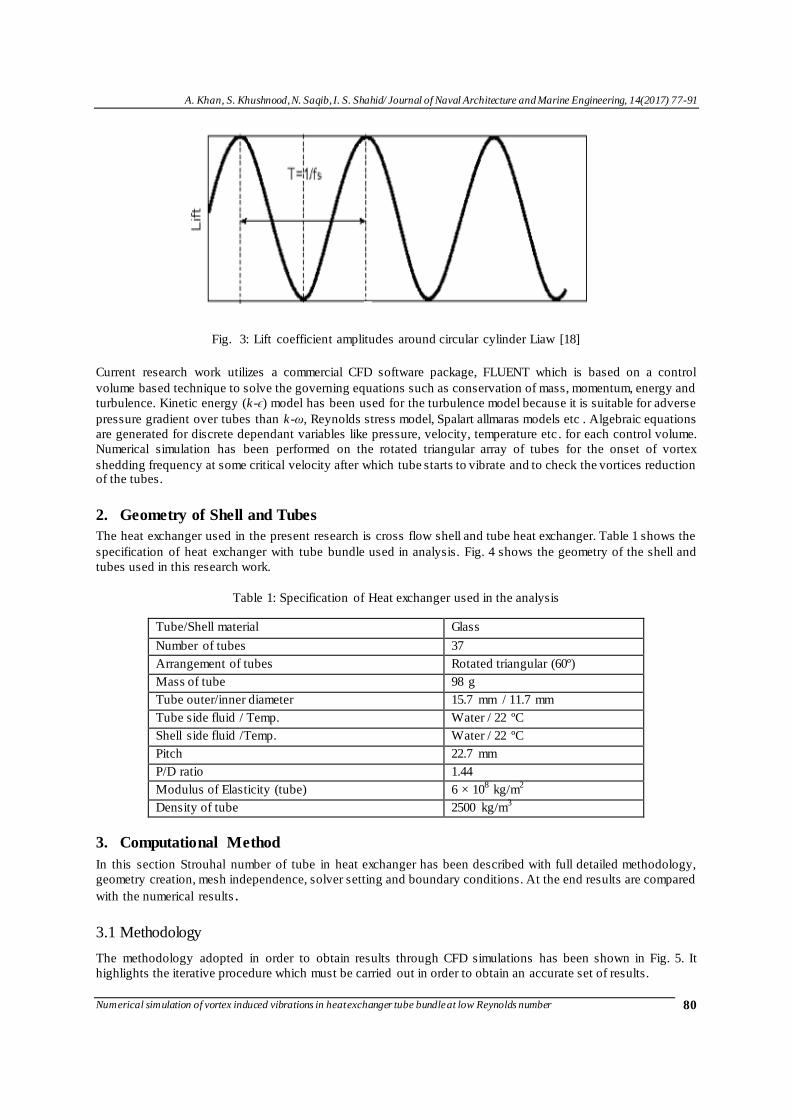
in the wake region of the body. According to Liaw (2005) lift coefficient changes along zero with respect to
time as shown in Fig. 3.
A. Khan, S. Khushnood, N. Saqib, I. S. Shahid/ Journal of Naval Architecture and Marine Engineering, 14(2017) 77-91
Numerical simulation of vortex induced vibrations in heat exchanger tube bundle at low Reynolds number
80
Fig. 3: Lift coefficient amplitudes around circular cylinder Liaw [18]
Current research work utilizes a commercial CFD software package, FLUENT which is based on a control
volume based technique to solve the governing equations such as conservation of mass, momentum, energy and
turbulence. Kinetic energy (k-ϵ) model has been used for the turbulence model because it is suitable for adverse
pressure gradient over tubes than k-ω, Reynolds stress model, Spalart allmaras models etc . Algebraic equations
are generated for discrete dependant variables like pressure, velocity, temperature etc . for each control volume.
Numerical simulation has been performed on the rotated triangular array of tubes for the onset of vortex
shedding frequency at some critical velocity after which tube starts to vibrate and to check the vortices reduction of the tubes.
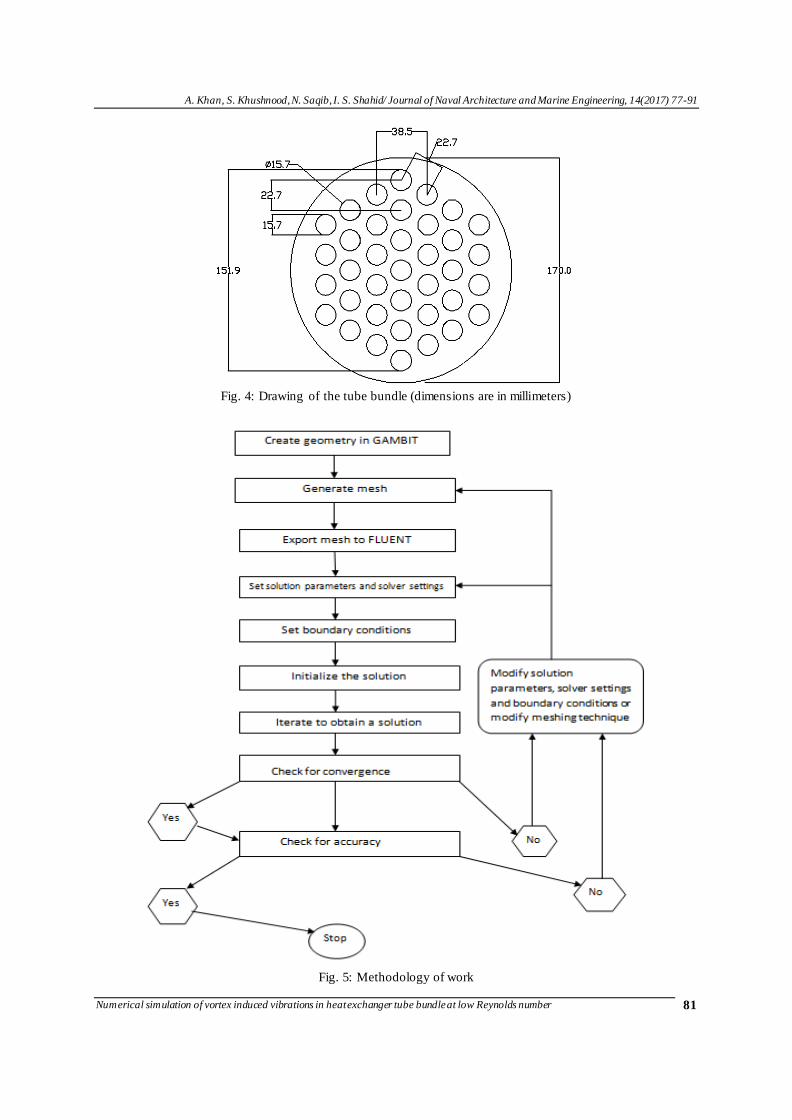
2. Geometry of Shell and Tubes
The heat exchanger used in the present research is cross flow shell and tube heat exchanger. Table 1 shows the
specification of heat exchanger with tube bundle used in analysis. Fig. 4 shows the geometry of the shell and
tubes used in this research work.
Table 1: Specification of Heat exchanger used in the analysis
Tube/Shell material Glass
Number of tubes 37
Arrangement of tubes Rotated triangular (60º)
Mass of tube 98 g
Tube outer/inner diameter 15.7 mm / 11.7 mm
Tube side fluid / Temp. Water / 22 ºC
Shell side fluid /Temp. Water / 22 ºC
Pitch 22.7 mm
P/D ratio 1.44
Modulus of Elasticity (tube) 6 × 10⁸ kg/m
2
Density of tube 2500 kg/m3
3. Computational Method
In this section Strouhal number of tube in heat exchanger has been described with full detailed methodology,
geometry creation, mesh independence, solver setting and boundary conditions. At the end results are compared
with the numerical results .
3.1 Methodology
The methodology adopted in order to obtain results through CFD simulations has been shown in Fig. 5. It
highlights the iterative procedure which must be carried out in order to obtain an accurate set of results.
A. Khan, S. Khushnood, N. Saqib, I. S. Shahid/ Journal of Naval Architecture and Marine Engineering, 14(2017) 77-91
Numerical simulation of vortex induced vibrations in heat exchanger tube bundle at low Reynolds number
81
Fig. 4: Drawing of the tube bundle (dimensions are in millimeters)
Fig. 5: Methodology of work
A. Khan, S. Khushnood, N. Saqib, I. S. Shahid/ Journal of Naval Architecture and Marine Engineering, 14(2017) 77-91
Numerical simulation of vortex induced vibrations in heat exchanger tube bundle at low Reynolds number
82
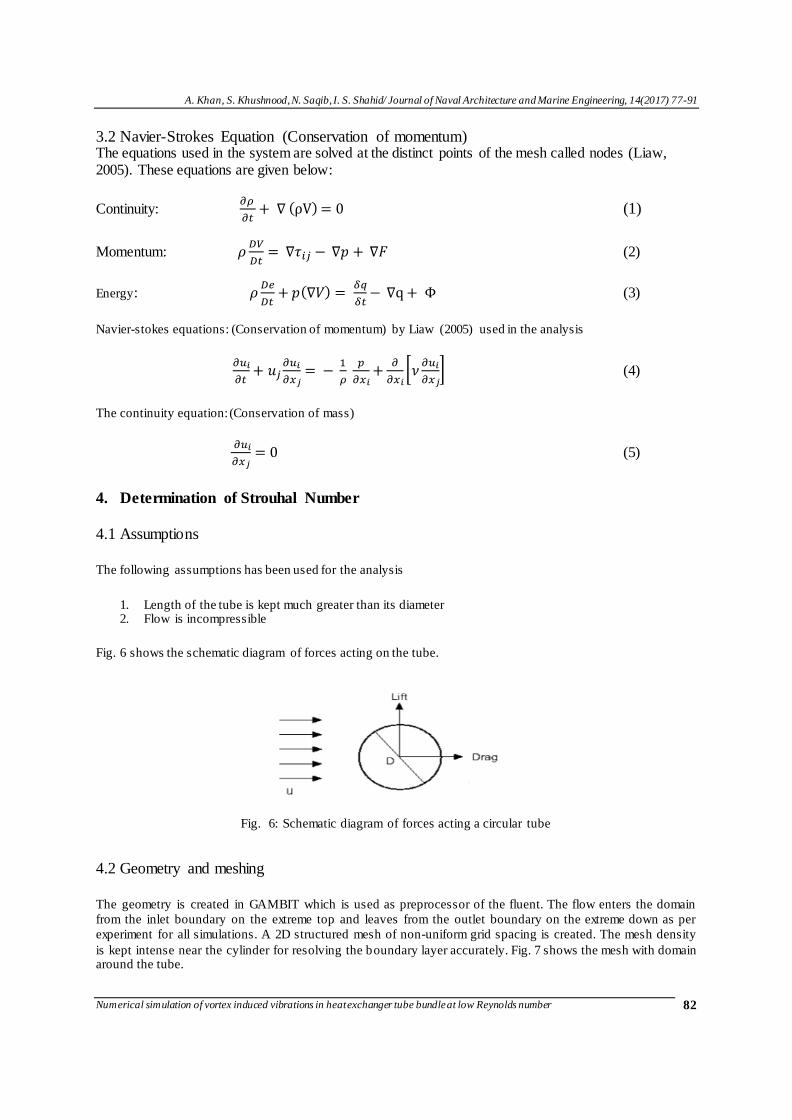
Fig. 6: Schematic diagram of forces acting a circular tube
3.2 Navier-Strokes Equation (Conservation of momentum) The equations used in the system are solved at the distinct points of the mesh called nodes (Liaw, 2005). These equations are given below:
Continuity:
( ) (1)
Momentum:
(2)
Energy:
( )
(3)
Navier-stokes equations: (Conservation of momentum) by Liaw (2005) used in the analysis
[
] (4)
The continuity equation: (Conservation of mass)
(5)
4. Determination of Strouhal Number
4.1 Assumptions
The following assumptions has been used for the analysis
1. Length of the tube is kept much greater than its diameter 2. Flow is incompressible
Fig. 6 shows the schematic diagram of forces acting on the tube.
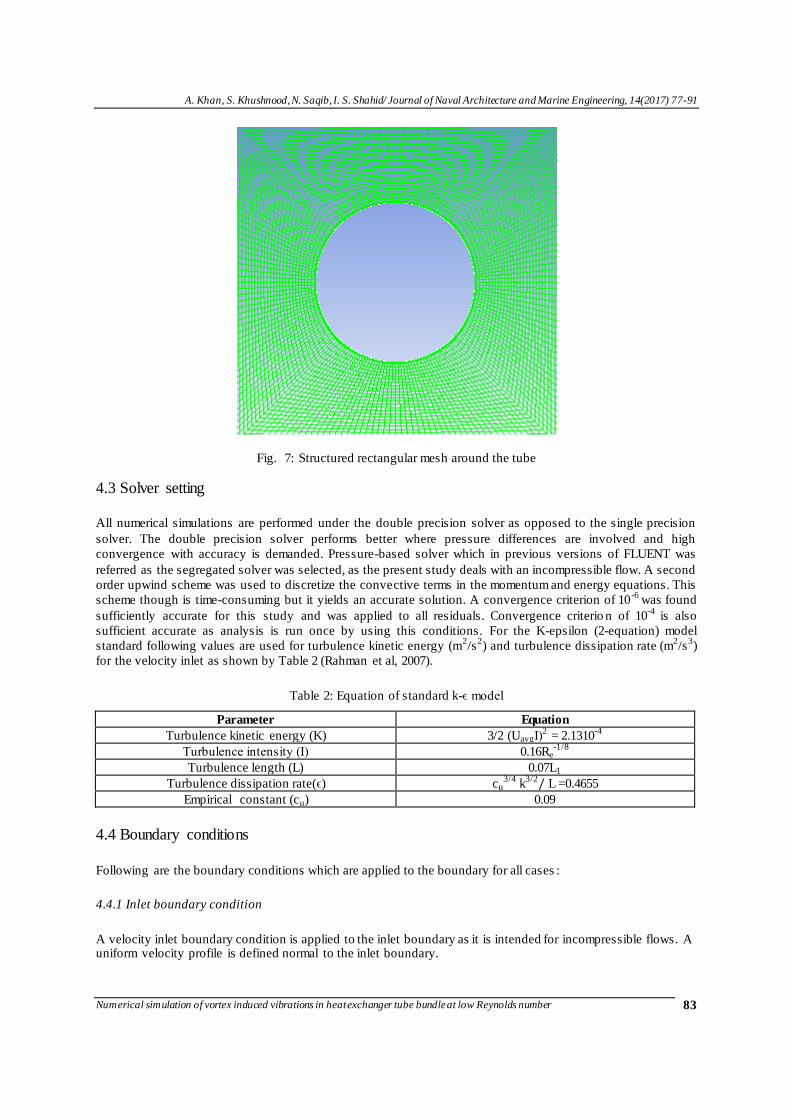
4.2 Geometry and meshing
The geometry is created in GAMBIT which is used as preprocessor of the fluent. The flow enters the domain
from the inlet boundary on the extreme top and leaves from the outlet boundary on the extreme down as per
experiment for all simulations. A 2D structured mesh of non-uniform grid spacing is created. The mesh density
is kept intense near the cylinder for resolving the boundary layer accurately. Fig. 7 shows the mesh with domain around the tube.
A. Khan, S. Khushnood, N. Saqib, I. S. Shahid/ Journal of Naval Architecture and Marine Engineering, 14(2017) 77-91
Numerical simulation of vortex induced vibrations in heat exchanger tube bundle at low Reynolds number
83
Fig. 7: Structured rectangular mesh around the tube
4.3 Solver setting
All numerical simulations are performed under the double precision solver as opposed to the single precision
solver. The double precision solver performs better where pressure differences are involved and high
convergence with accuracy is demanded. Pressure-based solver which in previous versions of FLUENT was
referred as the segregated solver was selected, as the present study deals with an incompressible flow. A second
order upwind scheme was used to discretize the convective terms in the momentum and energy equations. This
scheme though is time-consuming but it yields an accurate solution. A convergence criterion of 10-6
was found
sufficiently accurate for this study and was applied to all residuals. Convergence criterio n of 10-4
is also
sufficient accurate as analysis is run once by using this conditions. For the K-epsilon (2-equation) model
standard following values are used for turbulence kinetic energy (m2/s
2) and turbulence dissipation rate (m
2/s
3)
for the velocity inlet as shown by Table 2 (Rahman et al, 2007).
Table 2: Equation of standard k-ϵ model
Parameter Equation
Turbulence kinetic energy (K) 3/2 (UavgІ)2 = 2.1310
-4
Turbulence intensity (І) 0.16Re-1/8
Turbulence length (L) 0.07L1
Turbulence dissipation rate(ϵ) cμ3/4
k3/2 L =0.4655
Empirical constant (cμ) 0.09
4.4 Boundary conditions
Following are the boundary conditions which are applied to the boundary for all cases :
4.4.1 Inlet boundary condition
A velocity inlet boundary condition is applied to the inlet boundary as it is intended for incompressible flows. A uniform velocity profile is defined normal to the inlet boundary.
A. Khan, S. Khushnood, N. Saqib, I. S. Shahid/ Journal of Naval Architecture and Marine Engineering, 14(2017) 77-91
Numerical simulation of vortex induced vibrations in heat exchanger tube bundle at low Reynolds number
84
4.4.2 Outlet boundary condition
An outlet boundary condition is applied to outer boundary. Before get ting results or solving the problem this
outlet boundary conditions are justified. It works on the principle of zero dispersal flux normal to the outflow
boundary for all variables except pressure. It merely extrapolates given data from within the field an d applies to
the outlet without distressing the flow from upstream.
4.5 Grid independence study for tube
High importance and acceptable mesh in any flow field of interest are the main mesh design characteristics to
obtain accurate CFD result. Increases in the number of elements leads to the increase in computational time and
no gain within the CFD results accuracy and a reduced grid size results in a precise prediction of results Liaw
(2005). The Strouhal number which gives least error that grid size at a Reynolds number of 4.45 × 10⁴ is used
for final result of the Strouhal number. The results were found to be grid independent beyond the “average”
mesh size. Table 3 shows the grid independence study of the tube.
Table 3: Effect of Grid size on Strouhal Number
Mesh Size Strouhal number Per Error in
Strouhal number
No of Elements
1 Coarse 0.237 0.067 89605
2 Average 0.235 0.065 159210
3 Fine 0.231 0.061 348216
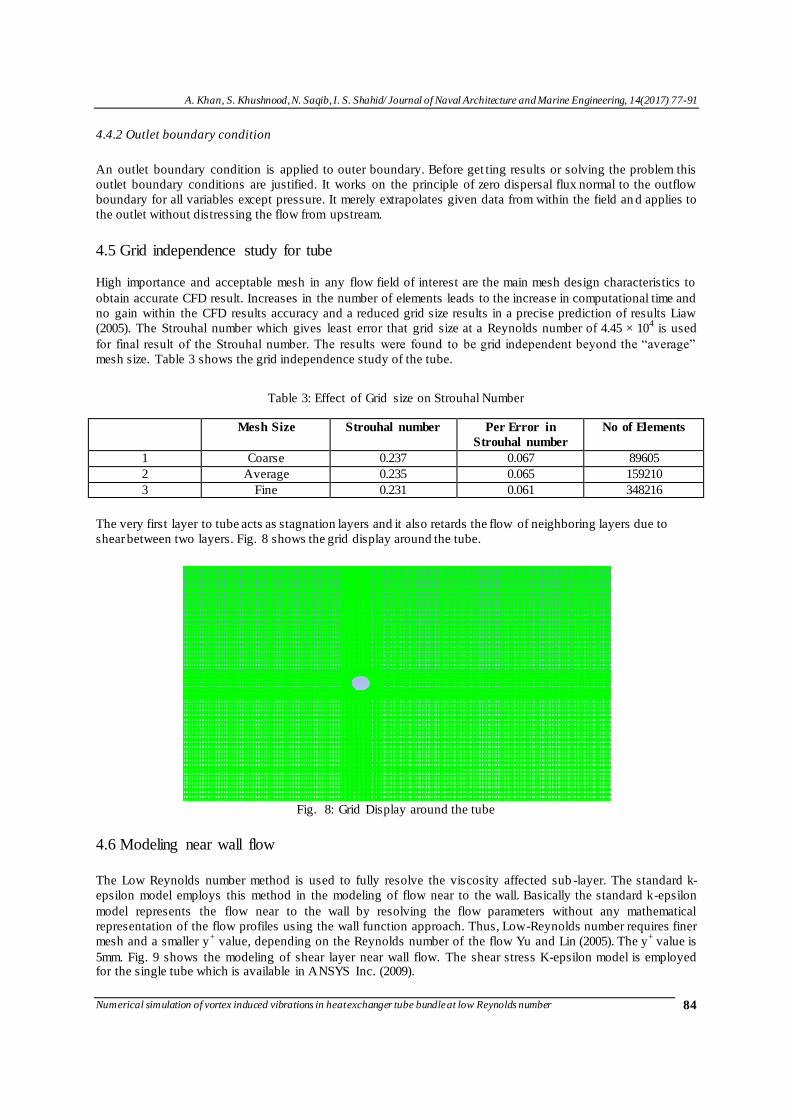
The very first layer to tube acts as stagnation layers and it also retards the flow of neighboring layers due to
shear between two layers. Fig. 8 shows the grid display around the tube.
Fig. 8: Grid Display around the tube
4.6 Modeling near wall flow
The Low Reynolds number method is used to fully resolve the viscosity affected sub -layer. The standard k-
epsilon model employs this method in the modeling of flow near to the wall. Basically the standard k-epsilon
model represents the flow near to the wall by resolving the flow parameters without any mathematical
representation of the flow profiles using the wall function approach. Thus, Low-Reynolds number requires finer
mesh and a smaller y+ value, depending on the Reynolds number of the flow Yu and Lin (2005). The y
+ value is
5mm. Fig. 9 shows the modeling of shear layer near wall flow. The shear stress K-epsilon model is employed for the single tube which is available in ANSYS Inc. (2009).
A. Khan, S. Khushnood, N. Saqib, I. S. Shahid/ Journal of Naval Architecture and Marine Engineering, 14(2017) 77-91
Numerical simulation of vortex induced vibrations in heat exchanger tube bundle at low Reynolds number
85
Fig. 9: Inflation of mesh around the tube surface
5. Results and Discussion
5.1 Strouhal number
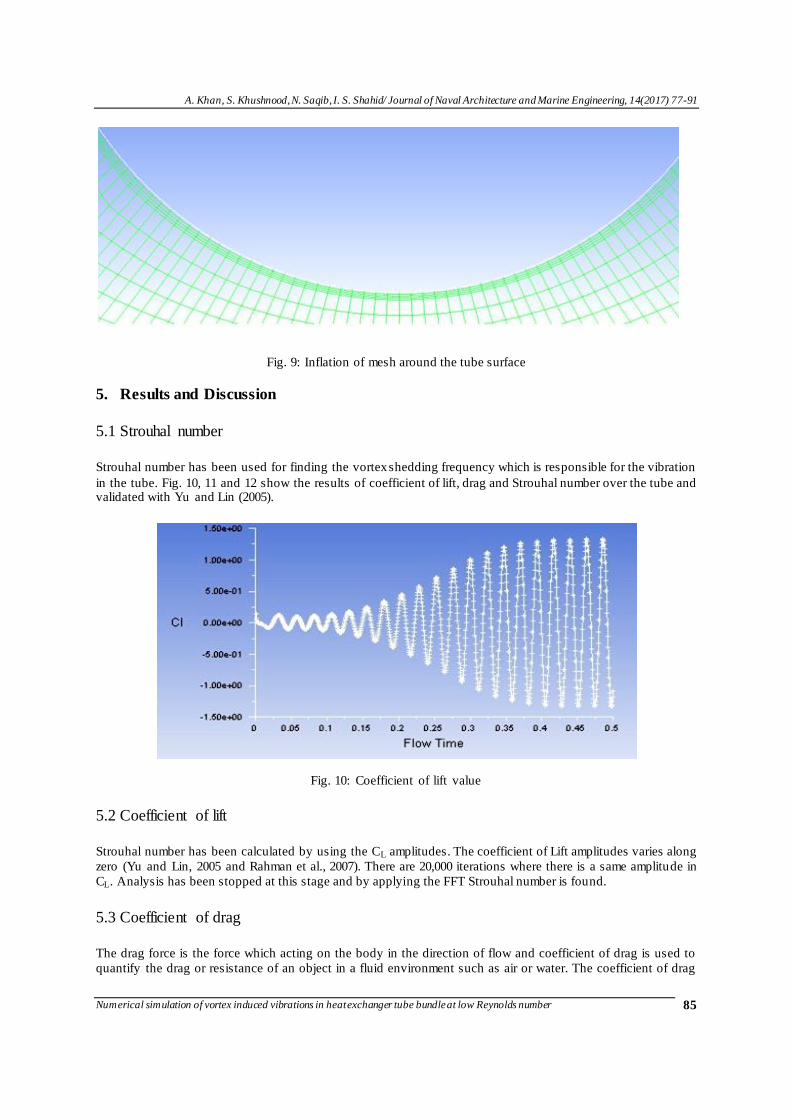
Strouhal number has been used for finding the vortex shedding frequency which is responsible for the vibration
in the tube. Fig. 10, 11 and 12 show the results of coefficient of lift, drag and Strouhal number over the tube and validated with Yu and Lin (2005).
Fig. 10: Coefficient of lift value
5.2 Coefficient of lift
Strouhal number has been calculated by using the CL amplitudes. The coefficient of Lift amplitudes varies along
zero (Yu and Lin, 2005 and Rahman et al., 2007). There are 20,000 iterations where there is a same amplitude in
CL. Analysis has been stopped at this stage and by applying the FFT Strouhal number is found.
5.3 Coefficient of drag
The drag force is the force which acting on the body in the direction of flow and coefficient of drag is used to
quantify the drag or resistance of an object in a fluid environment such as air or water. The coefficient of drag
A. Khan, S. Khushnood, N. Saqib, I. S. Shahid/ Journal of Naval Architecture and Marine Engineering, 14(2017) 77-91
Numerical simulation of vortex induced vibrations in heat exchanger tube bundle at low Reynolds number
86
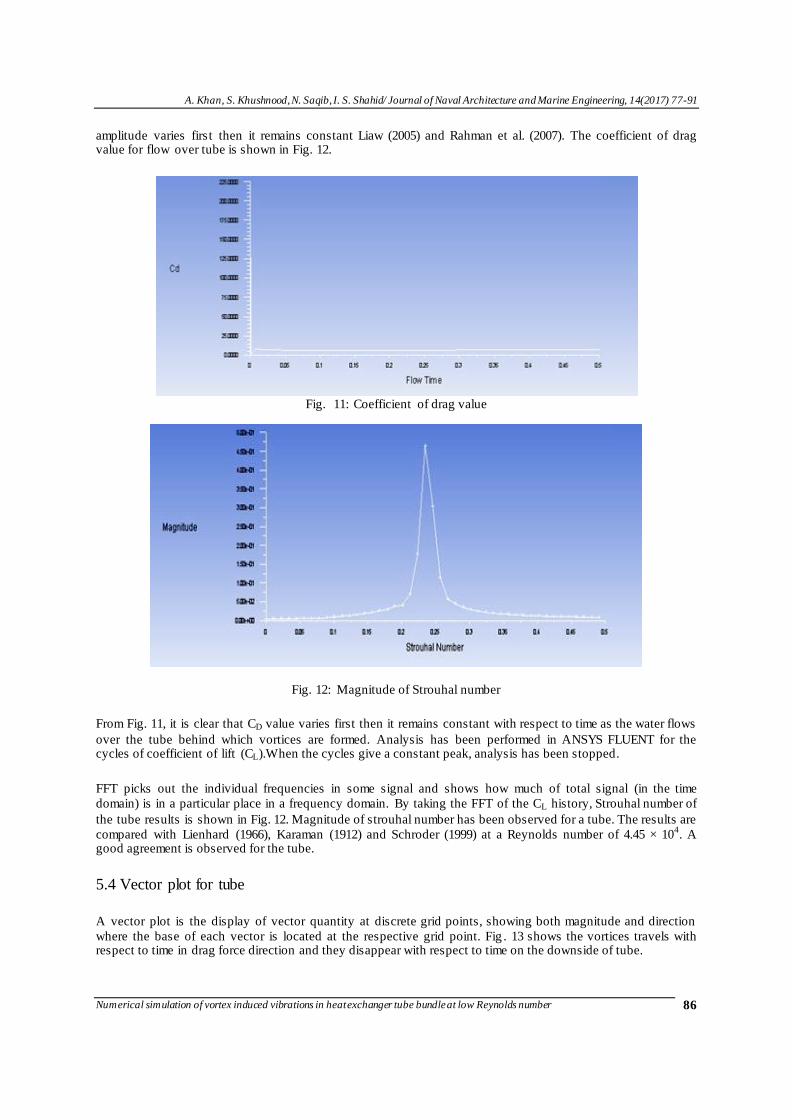
amplitude varies first then it remains constant Liaw (2005) and Rahman et al. (2007). The coefficient of drag value for flow over tube is shown in Fig. 12.
Fig. 11: Coefficient of drag value
Fig. 12: Magnitude of Strouhal number
From Fig. 11, it is clear that CD value varies first then it remains constant with respect to time as the water flows
over the tube behind which vortices are formed. Analysis has been performed in ANSYS FLUENT for the cycles of coefficient of lift (CL).When the cycles give a constant peak, analysis has been stopped.
FFT picks out the individual frequencies in some signal and shows how much of total signal (in the time
domain) is in a particular place in a frequency domain. By taking the FFT of the CL history, Strouhal number of
the tube results is shown in Fig. 12. Magnitude of strouhal number has been observed for a tube. The results are
compared with Lienhard (1966), Karaman (1912) and Schroder (1999) at a Reynolds number of 4.45 × 10⁴. A
good agreement is observed for the tube.
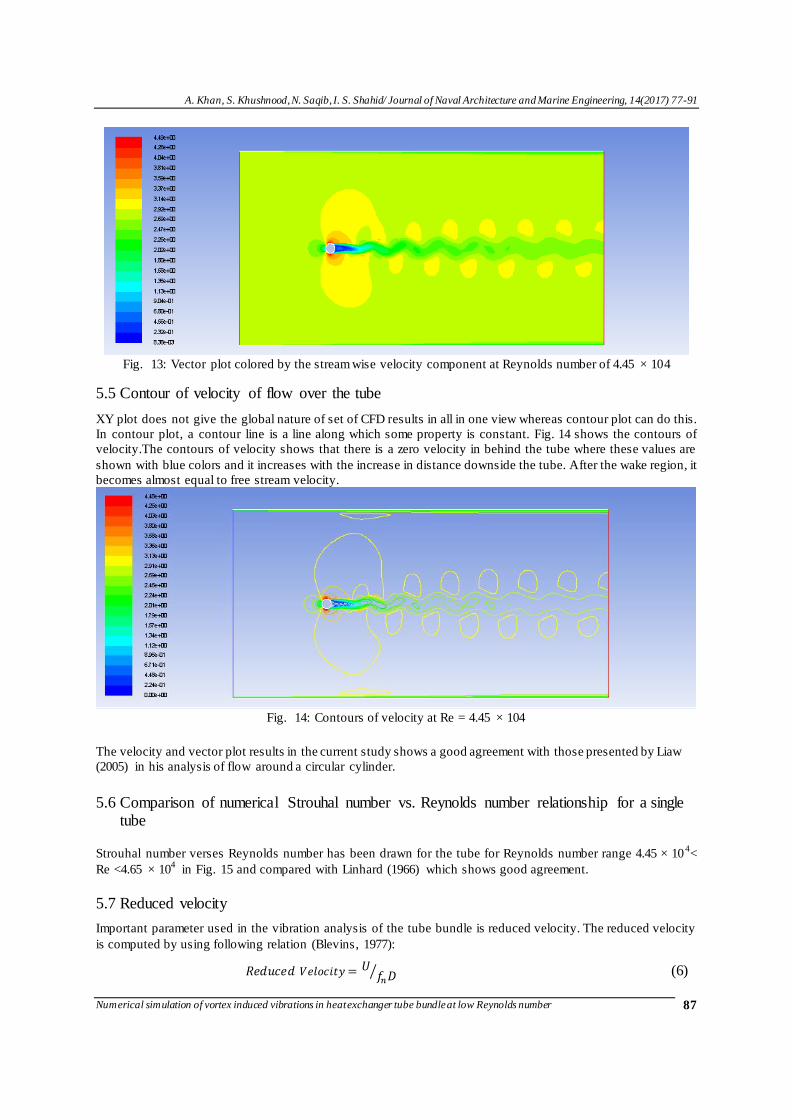
5.4 Vector plot for tube
A vector plot is the display of vector quantity at discrete grid points, showing both magnitude and direction
where the base of each vector is located at the respective grid point. Fig . 13 shows the vortices travels with respect to time in drag force direction and they disappear with respect to time on the downside of tube.
A. Khan, S. Khushnood, N. Saqib, I. S. Shahid/ Journal of Naval Architecture and Marine Engineering, 14(2017) 77-91
Numerical simulation of vortex induced vibrations in heat exchanger tube bundle at low Reynolds number
87
Fig. 13: Vector plot colored by the stream wise velocity component at Reynolds number of 4.45 × 10⁴
5.5 Contour of velocity of flow over the tube
XY plot does not give the global nature of set of CFD results in all in one view whereas contour plot can do this.
In contour plot, a contour line is a line along which some property is constant. Fig. 14 shows the contours of
velocity.The contours of velocity shows that there is a zero velocity in behind the tube where these values are
shown with blue colors and it increases with the increase in distance downside the tube. After the wake region, it
becomes almost equal to free stream velocity.
Fig. 14: Contours of velocity at Re = 4.45 × 10⁴
The velocity and vector plot results in the current study shows a good agreement with those presented by Liaw
(2005) in his analysis of flow around a circular cylinder.
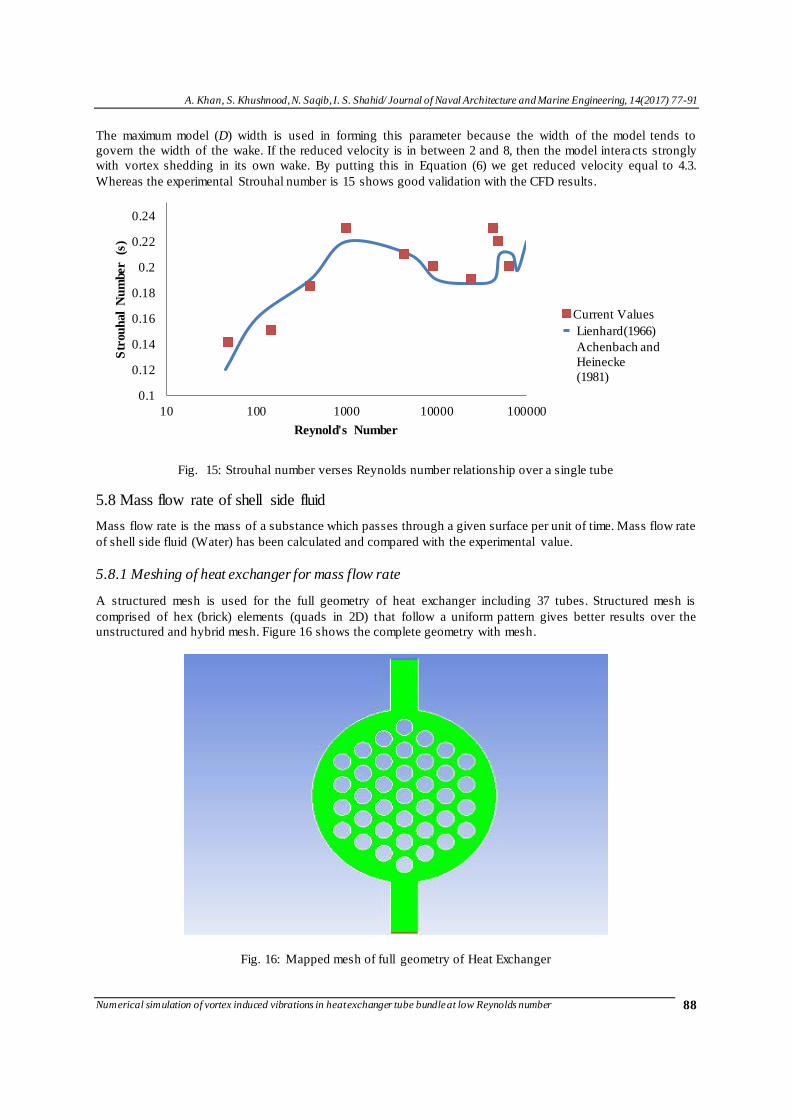
5.6 Comparison of numerical Strouhal number vs. Reynolds number relationship for a single tube
Strouhal number verses Reynolds number has been drawn for the tube for Reynolds number range 4.45 × 10⁴<
Re <4.65 × 10⁴
in Fig. 15 and compared with Linhard (1966) which shows good agreement.
5.7 Reduced velocity
Important parameter used in the vibration analysis of the tube bundle is reduced velocity. The reduced velocity
is computed by using following relation (Blevins, 1977):
⁄
(6)
A. Khan, S. Khushnood, N. Saqib, I. S. Shahid/ Journal of Naval Architecture and Marine Engineering, 14(2017) 77-91
Numerical simulation of vortex induced vibrations in heat exchanger tube bundle at low Reynolds number
88
The maximum model (D) width is used in forming this parameter because the width of the model tends to
govern the width of the wake. If the reduced velocity is in between 2 and 8, then the model intera cts strongly
with vortex shedding in its own wake. By putting this in Equation (6) we get reduced velocity equal to 4.3.
Whereas the experimental Strouhal number is 15 shows good validation with the CFD results.
Fig. 15: Strouhal number verses Reynolds number relationship over a single tube
5.8 Mass flow rate of shell side fluid
Mass flow rate is the mass of a substance which passes through a given surface per unit of time. Mass flow rate
of shell side fluid (Water) has been calculated and compared with the experimental value.
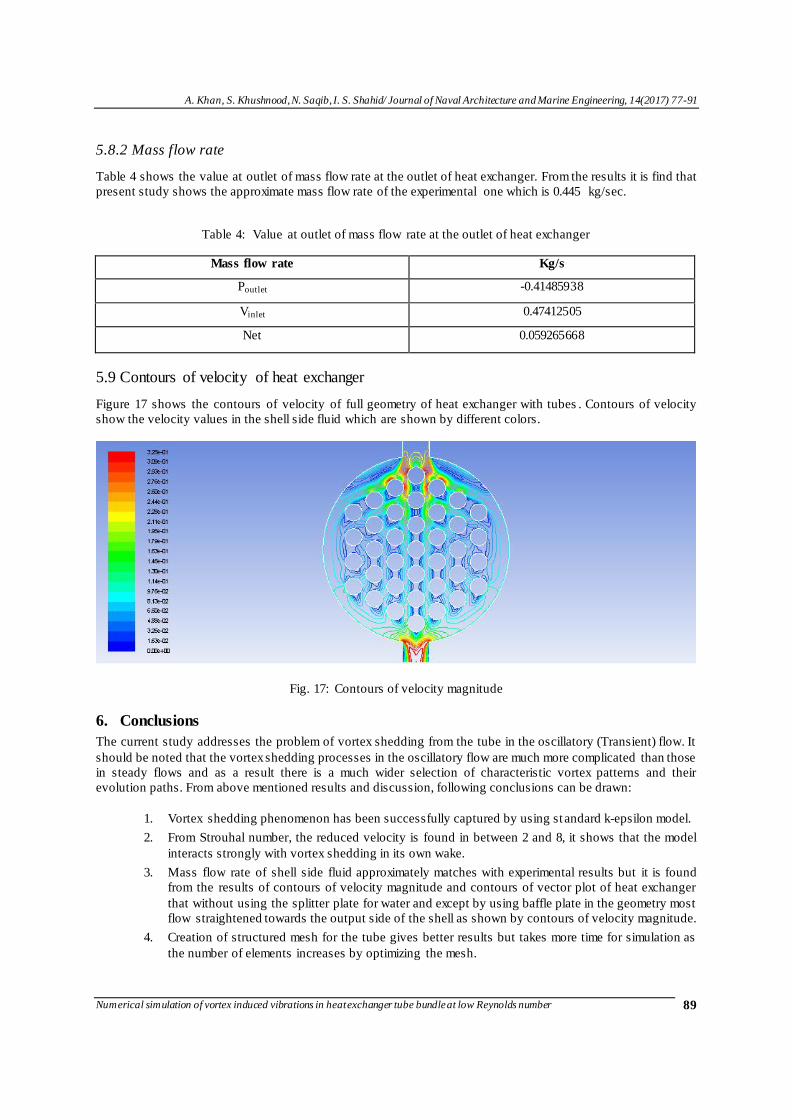
5.8.1 Meshing of heat exchanger for mass flow rate
A structured mesh is used for the full geometry of heat exchanger including 37 tubes. Structured mesh is
comprised of hex (brick) elements (quads in 2D) that follow a uniform pattern gives better results over the
unstructured and hybrid mesh. Figure 16 shows the complete geometry with mesh.
Fig. 16: Mapped mesh of full geometry of Heat Exchanger
0.1
0.12
0.14
0.16
0.18
0.2
0.22
0.24
10 100 1000 10000 100000
Str
ou
hal
Nu
mber
(s)
Reynold's Number
Current Values
Lienhard(1966)
Achenbach and
Heinecke
(1981)
A. Khan, S. Khushnood, N. Saqib, I. S. Shahid/ Journal of Naval Architecture and Marine Engineering, 14(2017) 77-91
Numerical simulation of vortex induced vibrations in heat exchanger tube bundle at low Reynolds number
89
5.8.2 Mass flow rate
Table 4 shows the value at outlet of mass flow rate at the outlet of heat exchanger. From the results it is find that
present study shows the approximate mass flow rate of the experimental one which is 0.445 kg/sec.
Table 4: Value at outlet of mass flow rate at the outlet of heat exchanger
Mass flow rate Kg/s
Poutlet -0.41485938
Vinlet 0.47412505
Net 0.059265668
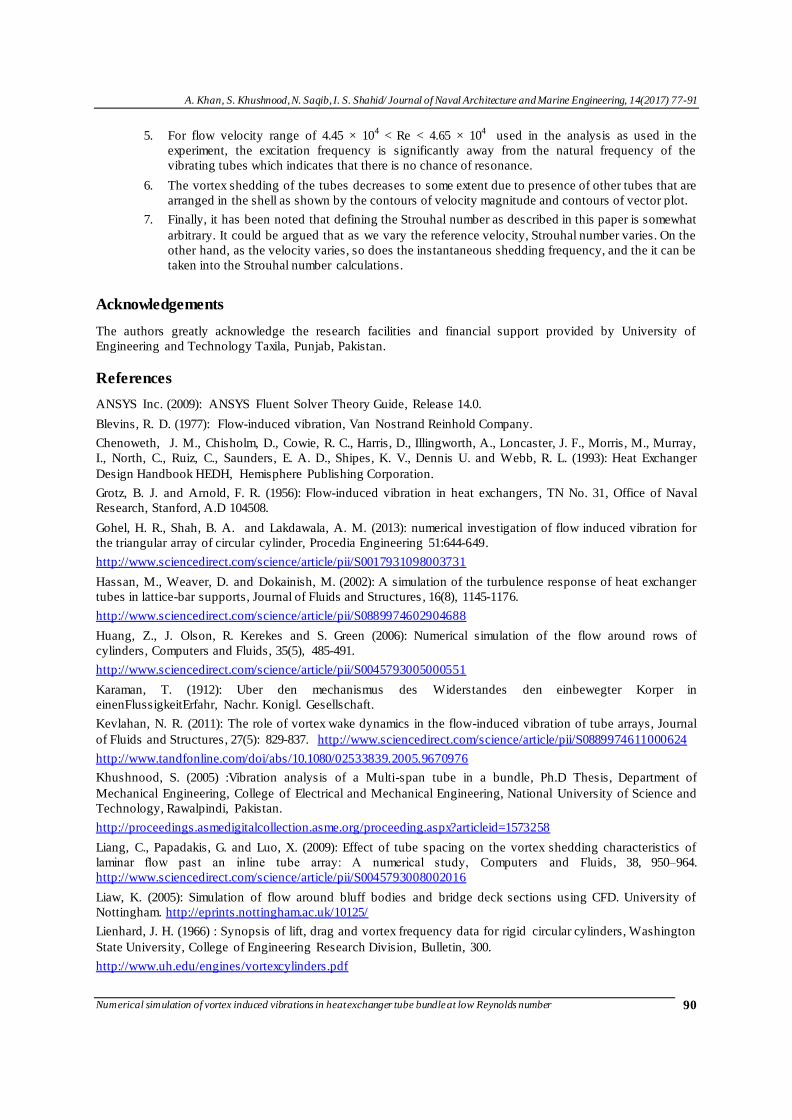
5.9 Contours of velocity of heat exchanger
Figure 17 shows the contours of velocity of full geometry of heat exchanger with tubes . Contours of velocity
show the velocity values in the shell side fluid which are shown by different colors.
Fig. 17: Contours of velocity magnitude
6. Conclusions
The current study addresses the problem of vortex shedding from the tube in the oscillatory (Transient) flow. It
should be noted that the vortex shedding processes in the oscillatory flow are much more complicated than those
in steady flows and as a result there is a much wider selection of characteristic vortex patterns and their
evolution paths. From above mentioned results and discussion, following conclusions can be drawn:
1. Vortex shedding phenomenon has been successfully captured by using st andard k-epsilon model.
2. From Strouhal number, the reduced velocity is found in between 2 and 8, it shows that the model
interacts strongly with vortex shedding in its own wake.
3. Mass flow rate of shell side fluid approximately matches with experimental results but it is found
from the results of contours of velocity magnitude and contours of vector plot of heat exchanger
that without using the splitter plate for water and except by using baffle plate in the geometry most
flow straightened towards the output side of the shell as shown by contours of velocity magnitude.
4. Creation of structured mesh for the tube gives better results but takes more time for simulation as
the number of elements increases by optimizing the mesh.
A. Khan, S. Khushnood, N. Saqib, I. S. Shahid/ Journal of Naval Architecture and Marine Engineering, 14(2017) 77-91
Numerical simulation of vortex induced vibrations in heat exchanger tube bundle at low Reynolds number
90
5. For flow velocity range of 4.45 × 10⁴
< Re < 4.65 × 10
4 used in the analysis as used in the
experiment, the excitation frequency is significantly away from the natural frequency of the
vibrating tubes which indicates that there is no chance of resonance.
6. The vortex shedding of the tubes decreases to some extent due to presence of other tubes that are
arranged in the shell as shown by the contours of velocity magnitude and contours of vector plot.
7. Finally, it has been noted that defining the Strouhal number as described in this paper is somewhat
arbitrary. It could be argued that as we vary the reference velocity, Strouhal number varies. On the
other hand, as the velocity varies, so does the instantaneous shedding frequency, and the it can be
taken into the Strouhal number calculations.
Acknowledgements
The authors greatly acknowledge the research facilities and financial support provided by University of
Engineering and Technology Taxila, Punjab, Pakistan.
References
ANSYS Inc. (2009): ANSYS Fluent Solver Theory Guide, Release 14.0.
Blevins, R. D. (1977): Flow-induced vibration, Van Nostrand Reinhold Company.
Chenoweth, J. M., Chisholm, D., Cowie, R. C., Harris, D., Illingworth, A., Loncaster, J. F., Morris, M., Murray,
I., North, C., Ruiz, C., Saunders, E. A. D., Shipes, K. V., Dennis U. and Webb, R. L. (1993): Heat Exchanger
Design Handbook HEDH, Hemisphere Publishing Corporation.
Grotz, B. J. and Arnold, F. R. (1956): Flow-induced vibration in heat exchangers, TN No. 31, Office of Naval
Research, Stanford, A.D 104508.
Gohel, H. R., Shah, B. A. and Lakdawala, A. M. (2013): numerical investigation of flow induced vibration for
the triangular array of circular cylinder, Procedia Engineering 51:644-649.
http://www.sciencedirect.com/science/article/pii/S0017931098003731
Hassan, M., Weaver, D. and Dokainish, M. (2002): A simulation of the turbulence response of heat exchanger
tubes in lattice-bar supports, Journal of Fluids and Structures , 16(8), 1145-1176.
http://www.sciencedirect.com/science/article/pii/S0889974602904688
Huang, Z., J. Olson, R. Kerekes and S. Green (2006): Numerical simulation of the flow around rows of
cylinders, Computers and Fluids, 35(5), 485-491.
http://www.sciencedirect.com/science/article/pii/S0045793005000551
Karaman, T. (1912): Uber den mechanismus des Widerstandes den einbewegter Korper in
einenFlussigkeitErfahr, Nachr. Konigl. Gesellschaft.
Kevlahan, N. R. (2011): The role of vortex wake dynamics in the flow-induced vibration of tube arrays, Journal
of Fluids and Structures, 27(5): 829-837. http://www.sciencedirect.com/science/article/pii/S0889974611000624
http://www.tandfonline.com/doi/abs/10.1080/02533839.2005.9670976
Khushnood, S. (2005) :Vibration analysis of a Multi-span tube in a bundle, Ph.D Thesis, Department of
Mechanical Engineering, College of Electrical and Mechanical Engineering, National University of Science and
Technology, Rawalpindi, Pakistan.
http://proceedings.asmedigitalcollection.asme.org/proceeding.aspx?articleid=1573258
Liang, C., Papadakis, G. and Luo, X. (2009): Effect of tube spacing on the vortex shedding characteristics of
laminar flow past an inline tube array: A numerical study, Computers and Fluids, 38, 950–964.
http://www.sciencedirect.com/science/article/pii/S0045793008002016
Liaw, K. (2005): Simulation of flow around bluff bodies and bridge deck sections using CFD. University of
Nottingham. http://eprints.nottingham.ac.uk/10125/
Lienhard, J. H. (1966) : Synopsis of lift, drag and vortex frequency data for rigid circular cylinders, Washington
State University, College of Engineering Research Division, Bulletin, 300.
http://www.uh.edu/engines/vortexcylinders.pdf
A. Khan, S. Khushnood, N. Saqib, I. S. Shahid/ Journal of Naval Architecture and Marine Engineering, 14(2017) 77-91
Numerical simulation of vortex induced vibrations in heat exchanger tube bundle at low Reynolds number
91
Longatte, E., Bendjeddou, Z. and Souli, M. (2003): Methods for numerical study of tube bundle vibrations in
cross-flows, Journal of Fluids and Structures,18(5), 513-528.
http://www.sciencedirect.com/science/article/pii/S0889974603001233
Patnaik, V. and Narayana, A. (1999): Numerical simulation of vortex shedding past a circular cylinder under the
influence of buoyancy, International Journal of Heat and Mass Transfer, 42(18): 3495-3507.
http://www.sciencedirect.com/science/article/pii/S0017931098003731
Rahman, M. M., Karim, M. M. and Alim, M. A. (2007): Numerical investigation of unsteady flow past a
circular cylinder using 2-D finite volume method, Journal of Naval Architecture and Marine Engineering, 4(1),
27-42. http://www.banglajol.info/index.php/JNAME/article/view/914
Schröder, K. and Gelbe, H. (1999): Two-and three-dimensional CFD-simulation of flow-induced vibration
excitation in tube bundles , Chemical Engineering and Processing: Process Intensification, 38(4), 621-629.
http://www.sciencedirect.com/science/article/pii/S025527019900063X
Simoneau, J.-p., Sageaux, T., Moussallam, N. and Bernard, O. (2011): Fluid structure interaction between rods
and a cross flow–Numerical approach, Nuclear Engineering and Design, 241(11), 4515-4522.
http://www.sciencedirect.com/science/article/pii/S0029549311003049
Wang, L., Dai, H. and Han, Y. (2012): Cross-flow-induced instability and nonlinear dynamics of cylinder arrays
with consideration of initial axial load, Nonlinear Dynamics, 67(2), 1043-1051.
https://link.springer.com/article/10.1007%2Fs11071-011-0047-x?LI=true
Williamson, C. H. K. and Govardhan, R. (2008): A brief review of recent results in vortex-induced vibrations,
Journal of Wind Engineering and Industrial Aerodynamics, 96, 713 – 735.
Yu, M. H. and Lin, T. K. (2005): A numerical study on fluid elastic vibrations of multiple cylinders in cross
flow. Journal of the Chinese Institute of Engineers, 28(1), 101-110.
Related Documents