Ranking Journals in Business and Management: A Statistical Analysis of the Harzing Dataset John Mingers Anne-Wil Harzing Version July 2007 Accepted for European Journal of Information Systems, vol. 16/4 Copyright © 2005-2007 John Mingers and Anne-Wil Harzing. All rights reserved. Prof. Anne-Wil Harzing Email: [email protected] University of Melbourne Web: www.harzing.com Department of Management Faculty of Economics & Commerce Parkville Campus Melbourne, VIC 3010 Australia

Welcome message from author
This document is posted to help you gain knowledge. Please leave a comment to let me know what you think about it! Share it to your friends and learn new things together.
Transcript

Ranking Journals in Business and Management: A Statistical Analysis of the Harzing Dataset John Mingers Anne-Wil Harzing Version July 2007 Accepted for European Journal of Information Systems, vol. 16/4 Copyright © 2005-2007 John Mingers and Anne-Wil Harzing. All rights reserved. Prof. Anne-Wil Harzing Email: [email protected] University of Melbourne Web: www.harzing.com Department of Management Faculty of Economics & Commerce Parkville Campus Melbourne, VIC 3010 Australia
1
Ranking Journals in Business and Management: A Statistical Analysis of the Harzing Dataset
JOHN MINGERS1 and ANNE-WIL HARZING2
1Kent Business School, University of Kent
Canterbury, Kent CT9 7PE, UK p: +1227 824008; f: +1227 761187
2 Department of Management and Marketing, University of Melbourne Parkville, VIC 3010
p: +61 3 8344 3724; f: +61 3 9349 4293 [email protected]
Abstract Creating rankings of academic journals is an important but contentious issue. It is of especial interest in the UK at this time (late 2005) as we are only two years away from the submission date for the next Research Assessment Exercise (RAE) the importance of which, for UK universities, can hardly be overstated. The purpose of this paper is to present a journal ranking for business and management based on a statistical analysis of the Harzing dataset (Harzing, 2005). The primary aim of the analysis is two-fold – to investigate relationships between the different rankings, including that between peer rankings and citation behaviour; and to develop a ranking based on four groups that could be useful for the RAE. Looking at the different rankings, the main conclusions are that there is in general a high degree of conformity between them as shown by a principal components analysis. Cluster analysis is used to create four groups of journals relevant to the RAE. The higher groups are found to correspond well with previous studies of top management journals and also gave, unlike them, equal coverage to all the management disciplines. The RAE Business and Management panel have a huge and unenviable task in trying to judge the quality of over 10,000 publications and they will inevitable have to resort to some standard mechanistic procedures to do so. This work will hopefully contribute by producing a ranking based on a statistical analysis of a variety of measures.
Key Words: Citation Indices, Cluster Analysis, Journal Rankings, Research Assessment Exercise (RAE)
2
Ranking Journals in Business and Management: A Statistical Analysis of the Harzing Dataset
Introduction Creating rankings of academic journals is an important but contentious issue. It is of especial interest in the UK at this time (2005) as we are only two years away from the submission date for the next Research Assessment Exercise (RAE) the importance of which, for UK universities, can hardly be overstated. Results in the RAE determine the allocation of government funding and also generate league tables of research reputation.
At the time of writing not all the regulations for RAE 2008 have been set but the outlines are clear. All academics submitted by a department as research active may enter up to four publications for review. It is then the task of the RAE panel to grade each output (not person) on a scale of 0, 1* to 4*. The formal descriptions are in Appendix A but the top three are all levels of international excellence. These descriptions, however, are very general and it is not yet clear how the panels will operationalise these. This is especially true of the 4*/3* boundary: will 4* be defined as so outstanding that little work will actually qualify or will it be set so that a certain proportion of UK research is judged to be of world quality?
Whatever the specifics, the RAE Business and Management panel has a formidable task: in the 2001 RAE nearly 10,000 publications were submitted by 3000 academics (Geary et al., 2004). The total could be higher this time. The panel recognises that it can only read a small proportion of this output (perhaps 15%) and so relatively mechanistic procedures will have to be adopted. These must inevitably revolve around quality rankings of journals and hence the great interest in this topic.
In general there are two approaches to ranking journals: stated preference and revealed preference. The former, also known as peer review, allows the members of some academic community to rank journals on the basis of their own judgements. These are often undertaken by particular universities or departments in order to help make decisions about, for example, library budgets, promotion or tenure, and of course RAE submission. The latter are based on actual publication behaviour and typically measure the citation rates of journals from the ISI Citation Index. An example is Tahai and Meyers’s (1999) analysis of 65 top journals based on citations in 17 key management journals. There are studies that combine both approaches such as Baden-Fuller et al’s (2000) which identified 32 top journals as part of an evaluation of business school rankings, and DuBois (2000) who used citations and a survey to rank international business journals. The method of combination tends to be ad hoc – judgement in Baden-Fuller’s case and simple averages for DuBois.
There have been other forms of quantitative analysis. Forgionne and Kohli (2001) used the Analytic Hierarchy Process (AHP) to combine citation data together with information about the journal’s practices solicited form journal editors. Tse (2001) and Horowitz (2003) have developed mathematical programming approaches to determining the weights that can then be used in a multi-criteria ranking of journals.
But perhaps most relevant to this study are analyses of the results of previous UK RAE’s. A debate was initiated by Doyle and Arthurs (1995) who argued for the importance of citation
3
impact measures which was opposed by Jones et al (1996) who favoured peer review. A flow of papers followed (Jones et al., 1996; Doyle et al., 1996; Doyle et al., 1996). After the 2001 RAE, data on all the submitted publications was available and this allowed analyses to be undertaken which compared journal submissions to the eventual ranking of the submitting institutions. From this journal rankings could be imputed on the basis of the distribution of the journal’s articles among the institutions. Easton and Easton (2003) analysed journals submitted by Marketing academics and Geary et al (2004) covered all subjects. These studies will be discussed below.
Many Business and Management journal rankings have been collected together on the Harzing database (Harzing, 2005). The latest version (v. 17, December 2005) contains in total thirteen rankings ranging from 1994 to 2005; as well as Tahai and Meyer’s (Tahai and Meyer, 1999) Strategic Management Journal list and the FT list of the top 40. It covers over 800 journals. The database was supplemented with four years of (S)SCI citation indices (2001-2004). This is a very valuable source of data but the problem with using it to evaluate the quality of particular journals is which ranking(s) to use. Whilst there is general agreement on the top journals there is considerable disagreement lower down, and each ranking reflects the views of a particular group of academics and is biased towards particular subject areas.
The primary aim of this analysis is therefore two-fold – to investigate relationships between the different rankings, and especially between peer rankings and citation behaviour; and to develop a combined ranking, based on four groups, which could be useful for the RAE. The latter objective is purely pragmatic – we do not presume that the journals split into four “natural” groups but since the RAE specifies four categories this is the most useful categorisation.
The first section of the paper describes initial preparation of the dataset, especially to deal with the very high proportion of missing data. The next section describes the specific statistical analyses then carried out, mainly principal components analysis and cluster analysis. The final section discusses the results of the analysis.
Preparing the Dataset The Harzing dataset is extensive, containing data (as at December 2005) on 859 journals. The various rankings are described in Appendix A. The first stage of the analysis was to convert all the variables into numeric ones based on the number of categories in each ranking excepting those such as the citation indices which were already numeric. They were coded in such a way that “1” always represented the lowest quality level. The majority of the variables were thus ordinal with between 4 and 7 categories, although Not95, VCU98, SMJ99, BJM04 and the CIs were interval.
There are two major problems in analysing this dataset: most variables being only ranks and the great amount of missing data. The fact that several variables were ordinal does cause a problem since most multivariate statistical techniques assume interval data. This is even more of a problem because of the missing data, to be dealt with next, which precluded the use of some techniques designed to help with non-interval data. For example, optimal scaling is a heuristic way of generating principal components for ordinal or categorical data but within SPSS the only way it can deal with missing data is either to ignore it, thus dramatically reducing the dataset, or by imputing missing values with the mode for the variable thus severely biasing the data. The strategy adopted here is to use ordinal methods where possible, e.g., Spearman’s rank correlation but otherwise to use standard methods. The justification for this is considerable. Within social science Likert scales are routinely analysed as interval data even though they are in fact ordinal. There is considerable evidence that correlational and
4
other parametric measures are robust to ordinal data (Zumbo and Zimmerman, 1993; Labovitz, 1970; Labovitz, 1967) and Kim (1975, p. 294), whilst recognising limitations in this approach, concludes with “Adoption of the parametric strategy is advocated … from a belief that parametric strategy is more compatible with the successive refinement of our measurement and theories”. In terms of cluster analysis specifically, many authors (Everitt, 1980; Aldenderfer and Blashfield, 1984; Anderberg, 1973; Gordon, 1981) recommend the treatment of ordinal data as interval especially where the data contains both types.
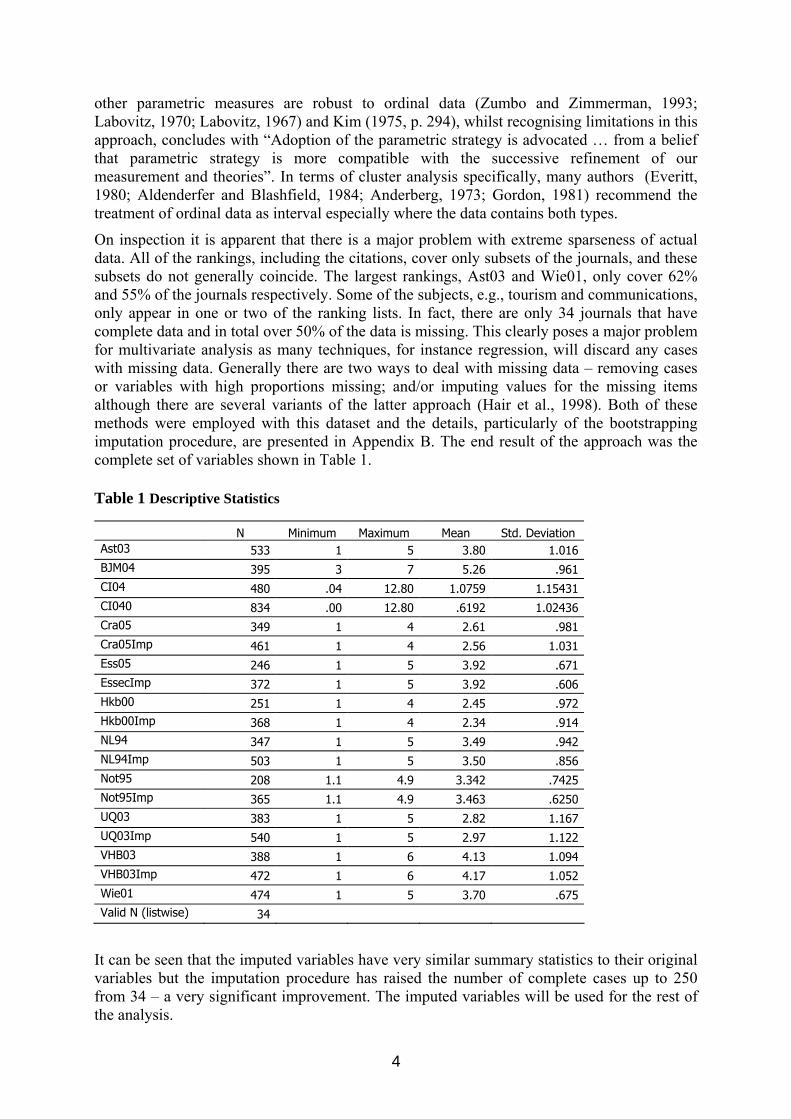
On inspection it is apparent that there is a major problem with extreme sparseness of actual data. All of the rankings, including the citations, cover only subsets of the journals, and these subsets do not generally coincide. The largest rankings, Ast03 and Wie01, only cover 62% and 55% of the journals respectively. Some of the subjects, e.g., tourism and communications, only appear in one or two of the ranking lists. In fact, there are only 34 journals that have complete data and in total over 50% of the data is missing. This clearly poses a major problem for multivariate analysis as many techniques, for instance regression, will discard any cases with missing data. Generally there are two ways to deal with missing data – removing cases or variables with high proportions missing; and/or imputing values for the missing items although there are several variants of the latter approach (Hair et al., 1998). Both of these methods were employed with this dataset and the details, particularly of the bootstrapping imputation procedure, are presented in Appendix B. The end result of the approach was the complete set of variables shown in Table 1. Table 1 Descriptive Statistics N Minimum Maximum Mean Std. Deviation Ast03 533 1 5 3.80 1.016 BJM04 395 3 7 5.26 .961 CI04 480 .04 12.80 1.0759 1.15431 CI040 834 .00 12.80 .6192 1.02436 Cra05 349 1 4 2.61 .981 Cra05Imp 461 1 4 2.56 1.031 Ess05 246 1 5 3.92 .671 EssecImp 372 1 5 3.92 .606 Hkb00 251 1 4 2.45 .972 Hkb00Imp 368 1 4 2.34 .914 NL94 347 1 5 3.49 .942 NL94Imp 503 1 5 3.50 .856 Not95 208 1.1 4.9 3.342 .7425 Not95Imp 365 1.1 4.9 3.463 .6250 UQ03 383 1 5 2.82 1.167 UQ03Imp 540 1 5 2.97 1.122 VHB03 388 1 6 4.13 1.094 VHB03Imp 472 1 6 4.17 1.052 Wie01 474 1 5 3.70 .675 Valid N (listwise) 34
It can be seen that the imputed variables have very similar summary statistics to their original variables but the imputation procedure has raised the number of complete cases up to 250 from 34 – a very significant improvement. The imputed variables will be used for the rest of the analysis.
5
Analysis of the dataset
Concordance between the Rankings
The first stage of the analysis was to compare the different rankings to see what patterns emerged. This includes a principal components analysis to see if there are dimensions underlying the variables and in order to be able to display the clusters produced later on.
In general terms this is an example of a common type of analysis known as “rater agreement”, i.e., the extent to which different raters agree over their rating of particular subjects. Very often such ratings are based in ordinal scales as is the case here and sophisticated models have been developed (Schuster and von Eye, 2001; Agresti, 1988) although they are not available in general software such as SPSS. A range of measures are available for different situations (Gibbons, 1993; Liebertrau, 1983) including: measures of association for ordinal contingency tables such as Kendall τ b, Goodman-Kruskal γ and Somers d; nonparametric correlation such as Spearman’s ρ, and measures of agreementi such as weighted kappa. These only deal with pairs of variables but there is an overall measure for groups of variables – Kendall’s coefficient of concordance (W). This was performed and the result (W = 0.721) was highly significant as would be expected (Chi-Square = 1313 with 10 df).
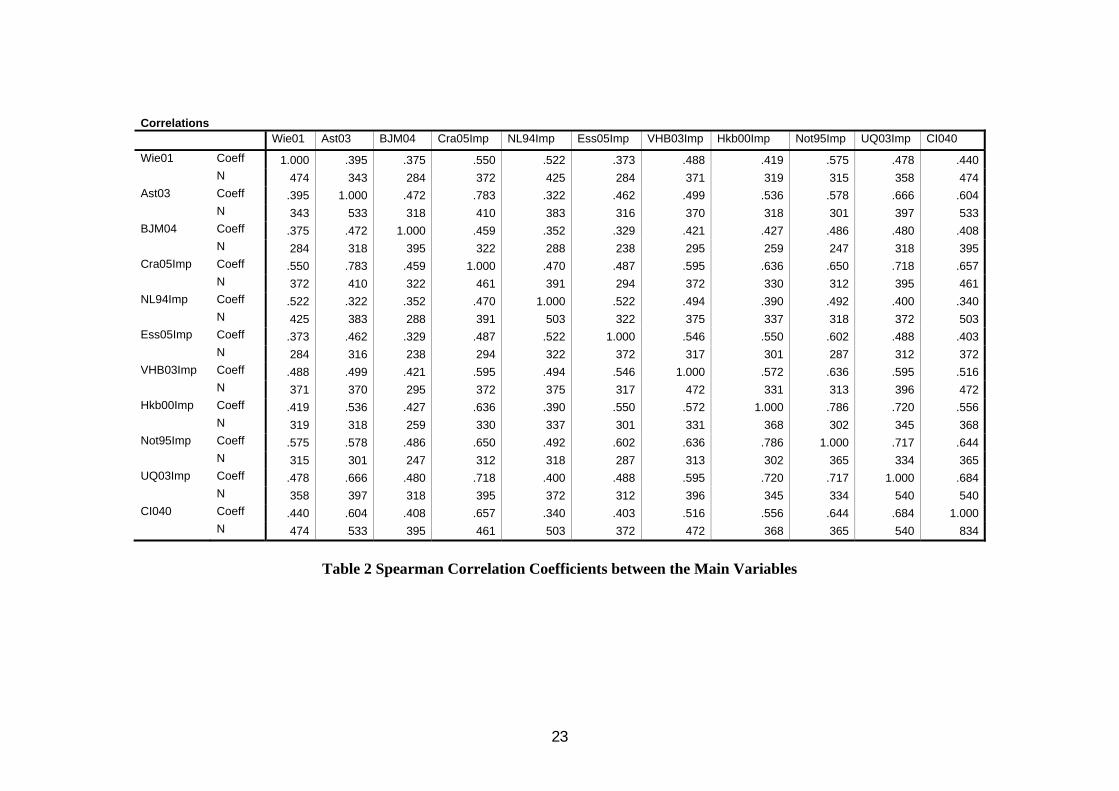
Whilst this tells us there is a high degree of general concordance we need also to look at specific correlations. Table 2 shows the Spearman’s rank correlations for the data.
-------------------------------------------
Table 2 correlation coefficients here
-------------------------------------------
In general terms we can spot several interesting patterns. These will be analysed in detail with principal components. All the bivariate correlations are highly significant given the large numbers of cases, but looking at those with the largest values (over 0.6) we see:
• Not95 has the greatest number of high correlations (6) showing that it is most concordant with the others.
• Wie01 and BJM04 have no high correlations with other rankings so they are the most discordant. They do not have a high correlation between themselves so they are not discordant in the same way. BJM04 has the lowest correlations with other rankings (none above 0.5) and so is most different. This is not unexpected because of the different basis for its construction (see discussion in Appendix B).
• The citation index (CI040) has the highest correlation with UQ03 and the lowest with NL94 and BJM04. Again the BJM04 difference is explainable given the relatively low proportion of top world journals, with high citation rates, submitted to the RAE.
• The rankings with the highest correlations are Cra05 and Ast03 (0.783), which are both UK rankings aimed for the RAE. Also high is Hkb00 and Not95 (0.786) but there is probably no specific reason for this.
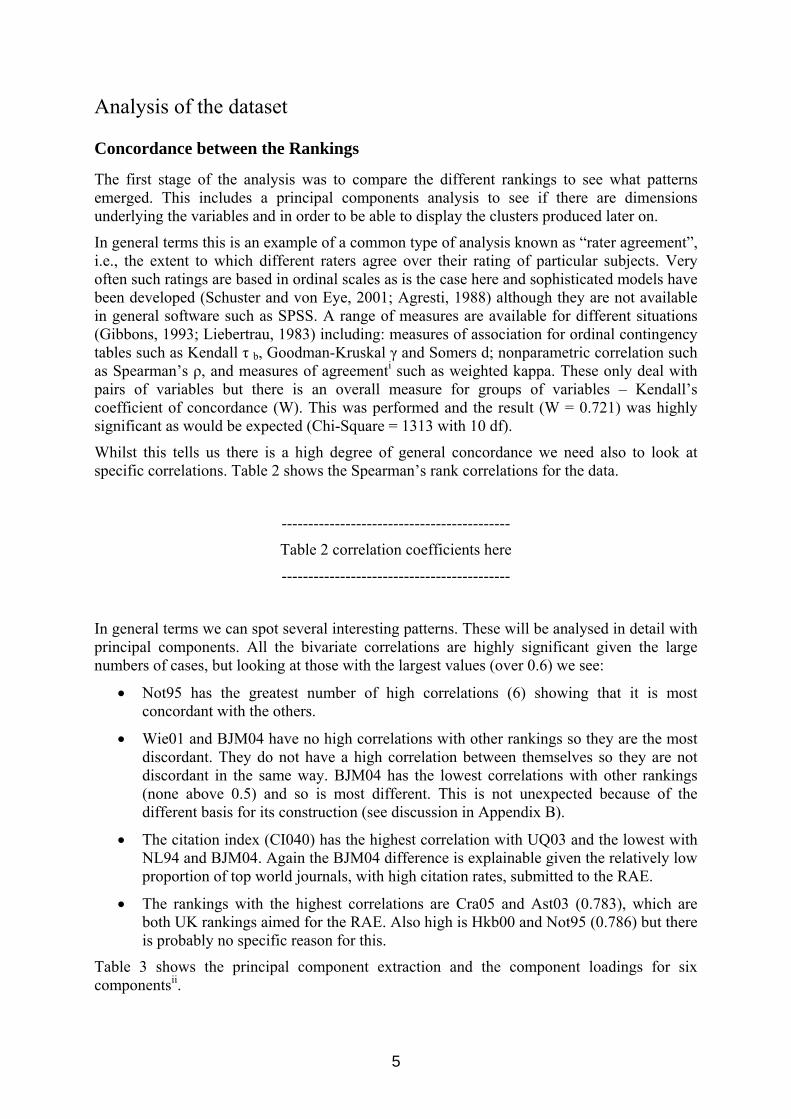
Table 3 shows the principal component extraction and the component loadings for six componentsii.
6
Table 3 Principal Components Analysis Total Variance Explained Component Extraction Sums of Squared Loadings
Total % of Variance Cumulative % 1 6.070 55.182 55.1822 .961 8.740 63.9223 .729 6.623 70.5454 .645 5.861 76.4065 .612 5.567 81.9736 .558 5.074 87.048
Component Matrixa
.670 .323 .244 -.425 .344 .017
.741 -.315 .161 -.172 -.434 .200
.609 -.112 .584 .486 .019 -.150
.841 -.183 .100 -.242 -.174 .182
.617 .603 .104 .151 .000 .297
.703 .274 -.387 .267 -.208 .173
.776 .200 -.017 -.080 -.047 -.302
.810 -.086 -.295 .074 .017 -.296
.879 .048 -.114 .002 .034 -.185
.825 -.235 -.074 -.079 .081 -.128
.638 -.409 -.158 .164 .471 .339
Wie01Ast03BJM04Cra05ImpNL94ImpEssecImpVHB03ImpHkb00ImpNot95ImpUQ03ImpCI040
1 2 3 4 5 6Component
Extraction Method: Principal Component Analysis.6 components extracted.a.
The first component with an eigenvalue of 6.07 accounts for 55% of the variance and is the only one with an eigenvalue above one. The next accounts for a further 9% of the variance. A plot of the first two components with their loadings is shown in Figure 1. For component 1 the loading of all variables are similar and quite high. This component is therefore measuring the overall quality of a journal and reflects the relatively high degree of correlation between all the variables. A high score on this component indicates high quality and vice versa. Not95 has the highest loading, reflecting its general concordance, while BJM04 and NL94 are the lowest suggesting that they do not reflect high quality so well.
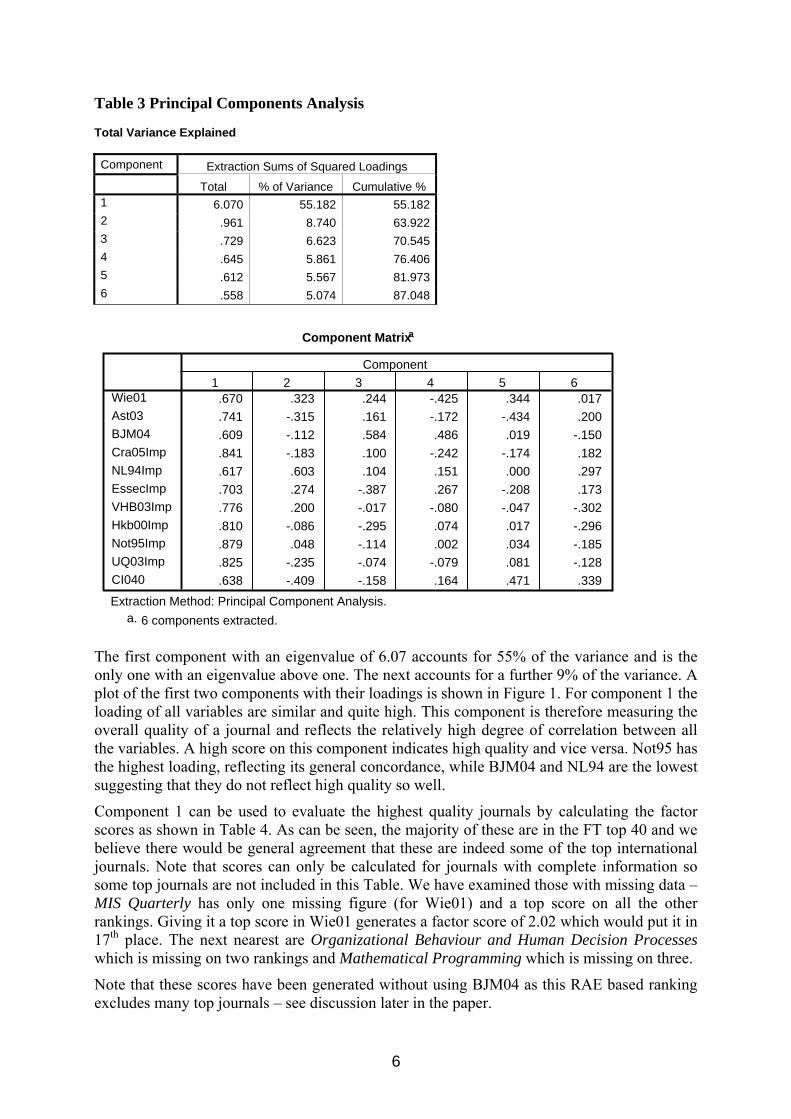
Component 1 can be used to evaluate the highest quality journals by calculating the factor scores as shown in Table 4. As can be seen, the majority of these are in the FT top 40 and we believe there would be general agreement that these are indeed some of the top international journals. Note that scores can only be calculated for journals with complete information so some top journals are not included in this Table. We have examined those with missing data – MIS Quarterly has only one missing figure (for Wie01) and a top score on all the other rankings. Giving it a top score in Wie01 generates a factor score of 2.02 which would put it in 17th place. The next nearest are Organizational Behaviour and Human Decision Processes which is missing on two rankings and Mathematical Programming which is missing on three.
Note that these scores have been generated without using BJM04 as this RAE based ranking excludes many top journals – see discussion later in the paper.

7
Figure 1 Plot of the loadings of Components 1 and 2
0.900.850.800.750.700.650.60
Component 1
0.75
0.50
0.25
0.00
-0.25
-0.50
Com
pone
nt 2 Ess05Imp
CI040
UQ03Imp
Not95Imp
Hkb00Imp
VHB03Imp
NL94Imp
Cra05ImpBJM04
Ast03
Wie01
Component Plot
Figure 2 Plot of ladings of Components 3 and 4.
0.60.40.20.0-0.2-0.4
Component 3
0.4
0.2
0.0
-0.2
-0.4
Com
pone
nt 4
Ess05Imp
CI040
UQ03Imp
Not95Imp
Hkb00Imp
VHB03Imp
NL94Imp
Cra05Imp
BJM04
Ast03
Wie01
Component Plot
8
Table 4 Top 30 Journals on Quality Factor Rank Title Factor Score 1 Psychological Bulletin 2.43 2 Quarterly Jnl of Economics 2.39 3 Jnl of Finance* 2.37 4 Administrative Science Quarterly* 2.34 5 Marketing Science 2.31 6 Jnl of Financial Economics* 2.26 7 Jnl of Political Economy* 2.25 8 Information Systems Research* 2.19 9 Econometrica* 2.18 10 Jnl of Marketing Research* 2.18 11 American Economic Review (The)* 2.17 12 Jnl of Marketing* 2.11 13 Academy of Mgmt Jnl* 2.09 14 Jnl of Economic Literature 2.07 15 American Jnl of Sociology 2.04 16 Mgmt Science* 2.03 17 Academy of Mgmt Review* 1.97 18 Jnl of the American Statistical Association* 1.94 19 Jnl of Accounting Research* 1.93 20 Jnl of Monetary Economics 1.89 21 Jnl of Consumer Research* 1.88 22 Psychological Review 1.86 23 RAND Jnl of Economics* 1.82 24 Accounting Review (The)* 1.82 25 Jnl of Economic Theory 1.80 26 American Sociological Review 1.78 27 Accounting, Organisations and Society* 1.71 28 Jnl of the Royal Statistical Society, Series A 1.68 29 Strategic Mgmt Jnl* 1.68 30 Operations Research* 1.67
Component 2 is interesting: negatively loaded are the citation index (CI04), Ast03, UQ03 and Cra05, while positively loaded are NL94, Wie01, Ess05 and VHB. This seems to suggest a UK versus European orientation with citations being more aligned with the UK rankings. Thus a journal scoring negatively on this factor (such as the J. Economic Perspectives) would be highly cited and highly ranked in the UK rankings. One scoring positively would have a low citation score and high ranking in European lists. This may well reflect the preoccupations of the RAE in the UK. An alternative interpretation, given that NL94 and CI04 have the largest and opposite loadings, is that it picks up journals that have changed significantly.
Components 3 and 4 seem related in that BJM04 is highly loaded in both. In 3 it is contrasted with Ess05 and Hkb00 while in 4 it is contrasted with Wie01 and Cra05. The result can be seen clearly in Figure 2 which is a plot of components 3 and 4. These analyses justify the comments made in Appendix B that the Geary et al data based on the UK RAE was distinctly different from more general world-oriented rankings.
Factors 5 and 6 pick out the citation index again in contrast with Ast03 and VHB03, Hkb00 respectively. Summarising the PC analysis, the main factors underlying the rankings are: the

9
general level of quality; a difference between European and UK rankings; and the UK RAE ranking and the citation index being different.
The next analysis was to look at differences in mean ranking across the different lists and the different subject areas, and to see if there is any interaction between the two. This was done using ANOVA. Because the rankings employed different number of levels they were all standardised to be in the range 0-1. The basic GLM results are shown in Table 5a.
Table 5a ANOVA for Subject vs. Ranking List General Linear Model: Score versus Subject, Ranking List Factor Type Levels Values Subject fixed 13 Economics, Entrep, F&A, Gen&Strat, Innovation, MIS, KM, Marketing, OR/MS/POM, OS/OB, HRM/IR, PSM, Psychology, Sociology, Tourism Ranking List fixed 10 1, 2, 3, 4, 5, 6, 7, 8, 9, 10 Analysis of Variance for Score, using Adjusted SS for Tests Source DF Seq SS Adj SS Adj MS F P Subject 12 17.71323 12.97526 1.08127 20.38 0.000 Ranking List 9 30.15314 10.99702 1.22189 23.03 0.000 Subject*Ranking List 108 12.69647 12.69647 0.11756 2.22 0.000 Error 4353 230.97403 230.97403 0.05306 Total 4482 291.53687 S = 0.230349 R-Sq = 20.77% R-Sq(adj) = 18.43%
We can see from this that both ranking list and subjects had an effect with very significant F-values and that there was a small interactional effect. The results have been summarised in Table 5b. The “+” and “-“ show where there are significant effects for rankings (columns), subjects (rows) and interactions. For the rankings, Ess05 and Hkb00 were the most and least generous respectively. For the disciplines, the traditional ones such as Economics, Psychology, Sociology and Finance & Accounting were seen as having the strongest quality journals whilst OB/OS, HRM/IR, Marketing, Innovation and Entrepreneurship had the weakest. Information Systems/Knowledge Management and OR/MS/POM were also seen to have better than average journals. None of the interactions were especially strong – the main ones are highlighted in grey. We cannot see any particular reasons underlying these results.
Clustering the journals
Clearly with the UK RAE coming up a main intent of this paper is to see to what extent the journals can be clustered into four quality groups based on the different rankings available. We do not believe that the journals will naturally form four clusters, indeed any underlying quality dimension(s) is likely to be continuous, but the data we are working with has already been categorised into four or five groups and we just wish to produce one four-group categorisation as a synthesis of the others. Cluster analysis is an effective heuristic method for doing this.

10
Table 5b Significant ANOVA Effects
Wie01 Ast03 BJM04 Cra05 NL94 Ess05 VHB03 Hkb00 Not95 UQ03
+ + - + -
Econ + + + -
Entrep - -
F&A + + +
Gen/Strat +
Innov -
MIS +
Market - - +
OR/MS/POM +
OB/OS/HRM/IR -
PSM -
Psych + + -
Sociol + + -
Tourism
+ - indicate effects significant at least at the 5% level.
To perform the analysis two main decisions need to be made: which measure(s) of similarityiii between cases to use, and which cluster method(s) to use. Similarity measures can be split into four main types (Sneath and Sokal, 1973): distance measures such as Euclidian or city blocks which are most suitable for interval data; association coefficients, of which there are many, such as the simple matching coefficient, Jaccards’ coefficient or Yule’s coefficient which are for binary or nominal data; correlation coefficients applied to cases; and probabilistic coefficients which are not commonly used. There are almost no measures specifically for ordinal data, the only one being Gower’s coefficient (Gower, 1971) which is applicable to all types of data but which is not included in either SPSS or Minitab. Using the association coefficients would lose the information contained in the ordinality of the categories, and so the general recommendation (Aldenderfer and Blashfield, 1984; Anderberg, 1973; Everitt, 1980; Gordon, 1981), especially in the case of data with mixed variables, is to treat ordinal data as though it were interval.
There are many methods of doing cluster analysis (Hair et al., 1998) depending both on the way that the proximity of cases is measured and the methods for forming cases into groups. There are two general approaches – hierarchical where points are linked together successively forming larger and larger clusters, and non-hierarchical (often called k-means) where only a specified number of clusters are created. We chose the latter for two reasons – we knew that we wanted to form four clusters, and the SPSS procedure allows missing values to be treated pairwise rather than listwise which the hierarchical ones do not. With k-means the recommended distance measure is squared Euclidian.
One of the main problems with the k-means approach is how to determine the initial cluster centres which in turn can have a significant effect on the clusters formed. These can be estimated automatically by SPSS or they can be supplied by the user. Initial analyses allowed centres to be generated automatically but did not produce good clusters. They tended to produce some very small clusters based on very high values of the citation index or values out of order with the nature of the groups. Thereafter the initial cluster centres were set manually
11
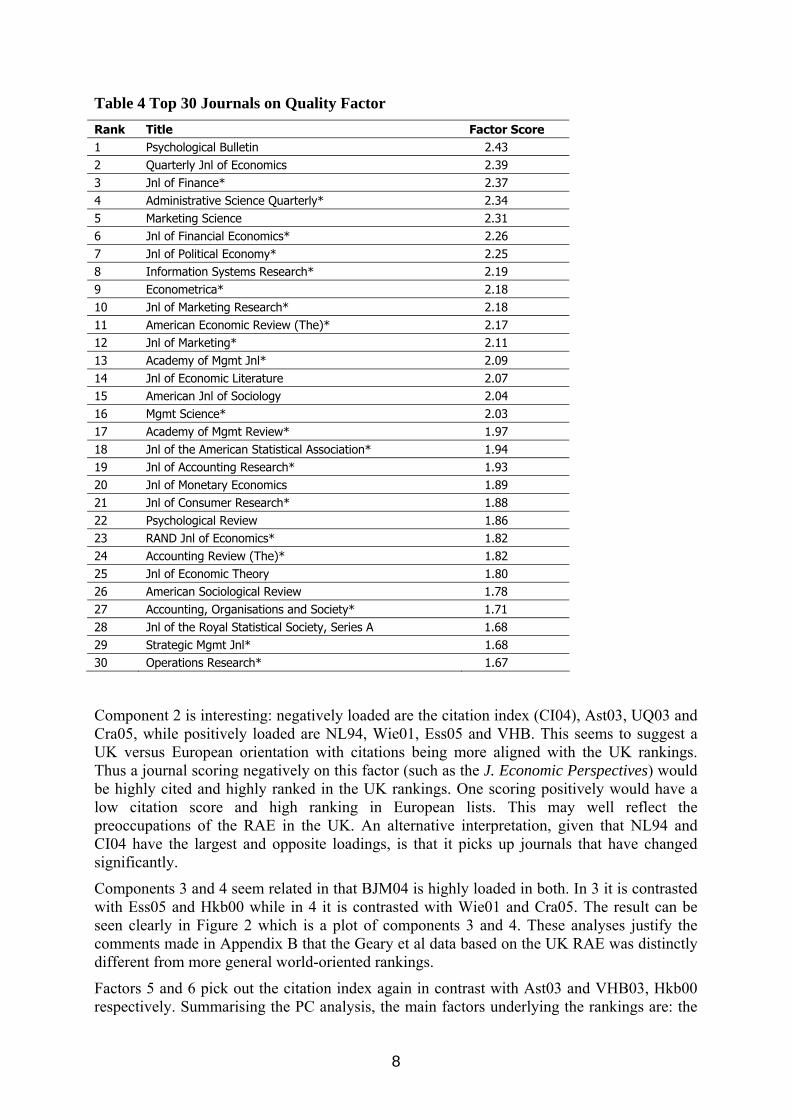
to reflect what might be compatible with the RAE classification. The initials and the finals for one of the analyses are shown in Table 6a. As can be seen the main change in the cluster centres is that the scores needed to be achieved to be in groups 1 or 2 increase. The initial centres were perturbed but the results were generally quite robust.
Table 6a Cluster Details (Including Citation Index CI04) Initial Cluster Centers
Cluster
1 2 3 4 Wie01 2 3 4 5 Ast03 2 3 4 5 Cra05Imp 1 2 3 4 NL94Imp 2 3 4 5 VHB03Imp 2 3 4 5 Hkb00Imp 1 2 3 4 Not95Imp 1.0 2.0 3.0 4.0 UQ03Imp 2 3 4 5 Ess05Imp 2 3 4 5 CI040 .13 .47 1.00 2.00
Final Cluster Centers
Cluster
1 2 3 4 Wie01 3 4 4 4 Ast03 2 4 4 5 Cra05Imp 1 2 3 4 NL94Imp 3 3 4 4 VHB03Imp 3 4 5 5 Hkb00Imp 1 2 2 4 Not95Imp 2.7 3.3 3.7 4.3 UQ03Imp 2 3 4 5 Ess05Imp 3 4 4 5 CI040 .11 .31 .81 2.76
Number of Cases in each Cluster
1 235.000 2 281.000 3 242.000
Cluster
4 76.000
Valid 834.000 Missing .000
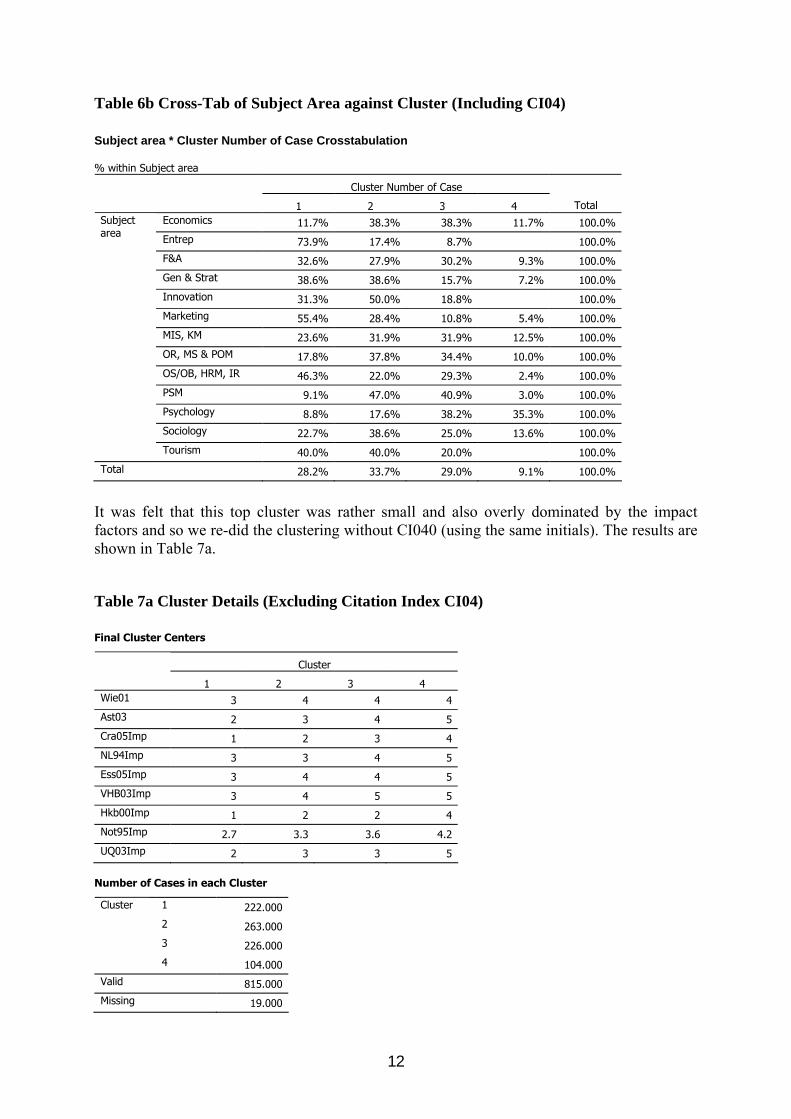
Table 6a also shows the results for the first clustering, which included the citation index (CI040). There are only 76 in cluster 4, the highest quality one, which represents 9% of the journals classified. These are all journals that are both highly ranked and have good citation scores. The centre for CI040 is 2.76 which is very high for management journals. The other three clusters split the remaining journals fairly equally. Table 6b is a cross-tab showing how the clusters are split in each subject. Those with high numbers of 4* journals are Economics, Psychology and Sociology, while Entrepreneurship, Innovation and Tourism have none. This corresponds with the results of the ANOVA above.
12
Table 6b Cross-Tab of Subject Area against Cluster (Including CI04) Subject area * Cluster Number of Case Crosstabulation % within Subject area
Cluster Number of Case
1 2 3 4 Total Economics 11.7% 38.3% 38.3% 11.7% 100.0% Entrep 73.9% 17.4% 8.7% 100.0% F&A 32.6% 27.9% 30.2% 9.3% 100.0% Gen & Strat 38.6% 38.6% 15.7% 7.2% 100.0% Innovation 31.3% 50.0% 18.8% 100.0% Marketing 55.4% 28.4% 10.8% 5.4% 100.0% MIS, KM 23.6% 31.9% 31.9% 12.5% 100.0% OR, MS & POM 17.8% 37.8% 34.4% 10.0% 100.0% OS/OB, HRM, IR 46.3% 22.0% 29.3% 2.4% 100.0% PSM 9.1% 47.0% 40.9% 3.0% 100.0% Psychology 8.8% 17.6% 38.2% 35.3% 100.0% Sociology 22.7% 38.6% 25.0% 13.6% 100.0%
Subject area
Tourism 40.0% 40.0% 20.0% 100.0% Total 28.2% 33.7% 29.0% 9.1% 100.0%
It was felt that this top cluster was rather small and also overly dominated by the impact factors and so we re-did the clustering without CI040 (using the same initials). The results are shown in Table 7a.
Table 7a Cluster Details (Excluding Citation Index CI04) Final Cluster Centers
Cluster
1 2 3 4 Wie01 3 4 4 4 Ast03 2 3 4 5 Cra05Imp 1 2 3 4 NL94Imp 3 3 4 5 Ess05Imp 3 4 4 5 VHB03Imp 3 4 5 5 Hkb00Imp 1 2 2 4 Not95Imp 2.7 3.3 3.6 4.2 UQ03Imp 2 3 3 5
Number of Cases in each Cluster
1 222.000 2 263.000 3 226.000
Cluster
4 104.000 Valid 815.000 Missing 19.000

13
This led to a general movement of journals up the groups with 104 (13%) now in group 4. A smaller total number are classified because, with the loss of CI040, some cases have insufficient data. The cross-tab (Table 7b) shows a general increase in 4* but especially in MIS, OR/MS/POM and Tourism. Those journals that have moved up will generally be those with lower scores on the citation index as that is not now included in the clustering.
Table 7b Cross-Tab of Subject Area against Cluster (Excluding CI04) Subject area * Cluster Number of Case Crosstabulation % within Subject area
Cluster Number of Case
1 2 3 4 Total Economics 10.6% 35.1% 37.1% 17.2% 100.0% Entrep 73.9% 17.4% 8.7% 100.0% F&A 32.6% 23.3% 32.6% 11.6% 100.0% Gen & Strat 38.6% 37.3% 16.9% 7.2% 100.0% Innovation 31.3% 43.8% 25.0% 100.0% Marketing 52.7% 29.7% 9.5% 8.1% 100.0% MIS, KM 24.2% 28.8% 27.3% 19.7% 100.0% OR, MS & POM 17.4% 34.9% 25.6% 22.1% 100.0% OS/OB, HRM, IR 45.7% 22.2% 28.4% 3.7% 100.0% PSM 9.4% 46.9% 34.4% 9.4% 100.0% Psychology 6.3% 15.6% 46.9% 31.3% 100.0% Sociology 14.0% 48.8% 30.2% 7.0% 100.0%
Subject area
Tourism 30.0% 30.0% 20.0% 20.0% 100.0% Total 27.2% 32.3% 27.7% 12.8% 100.0%
This clustering is portrayed on the two principal components in Figure 3. This shows clearly how the four groups are quite distinct without much overlap. They also clearly move from West to East reflecting the increase in quality along component 1 with the best group being furthest East.
It is interesting to look at some of the extreme points. At the top is 568, J. Regional Science which scores highly on the European rankings but has a relatively low CI (0.63). Moving to the East, the high quality end, 472 is the J. of Finance which is highly rated on all rankings and has a high CI score (3.1) which makes it one the highest quality journal overall. At the other end of this dimension is 534 is the J. of Management Development with low rankings and no CI scoreiv.
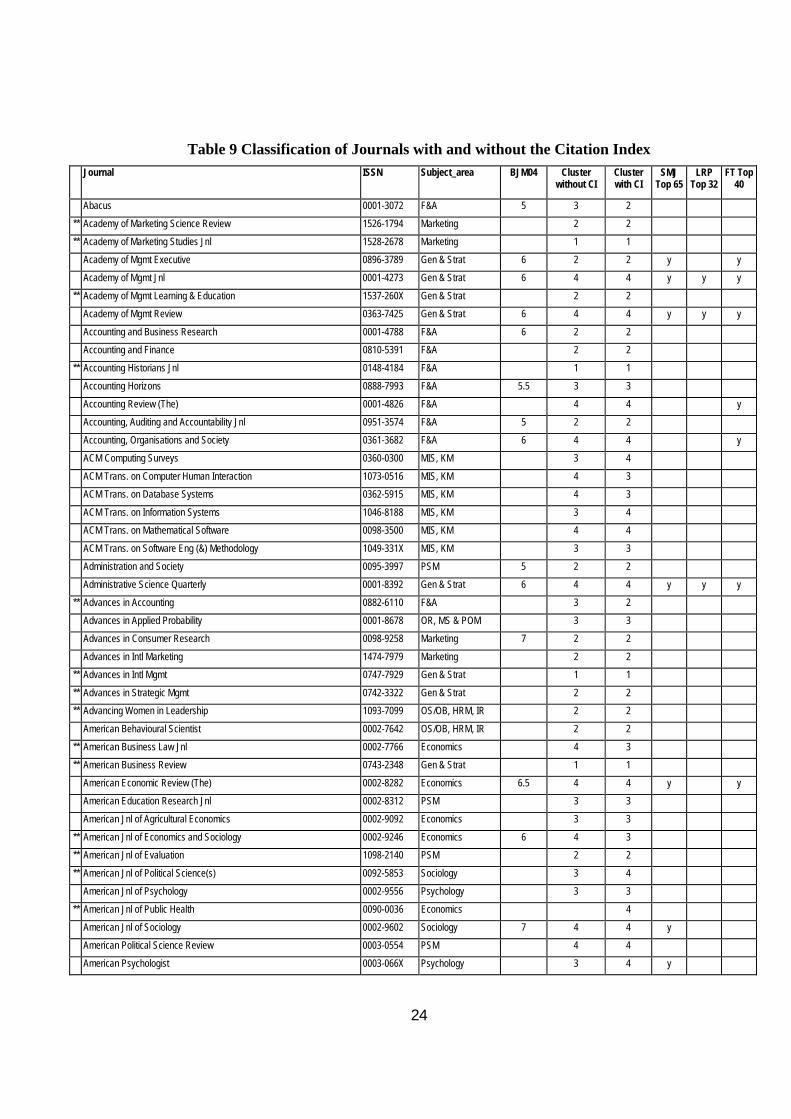
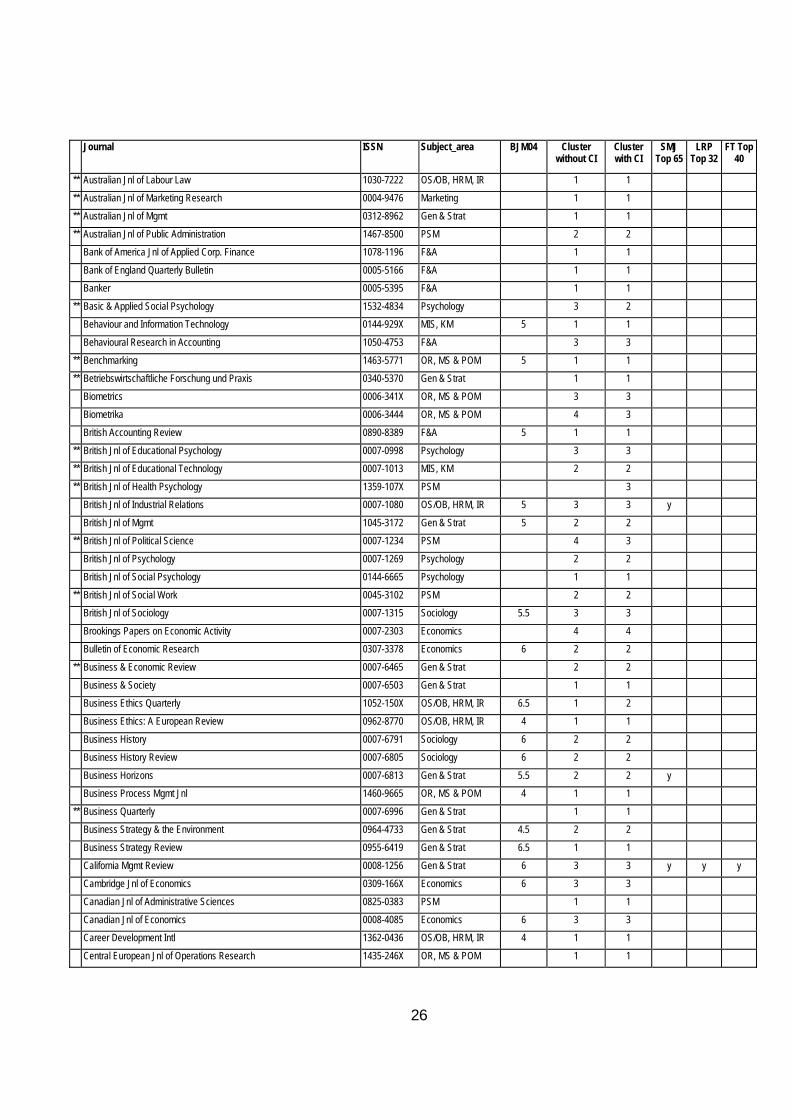
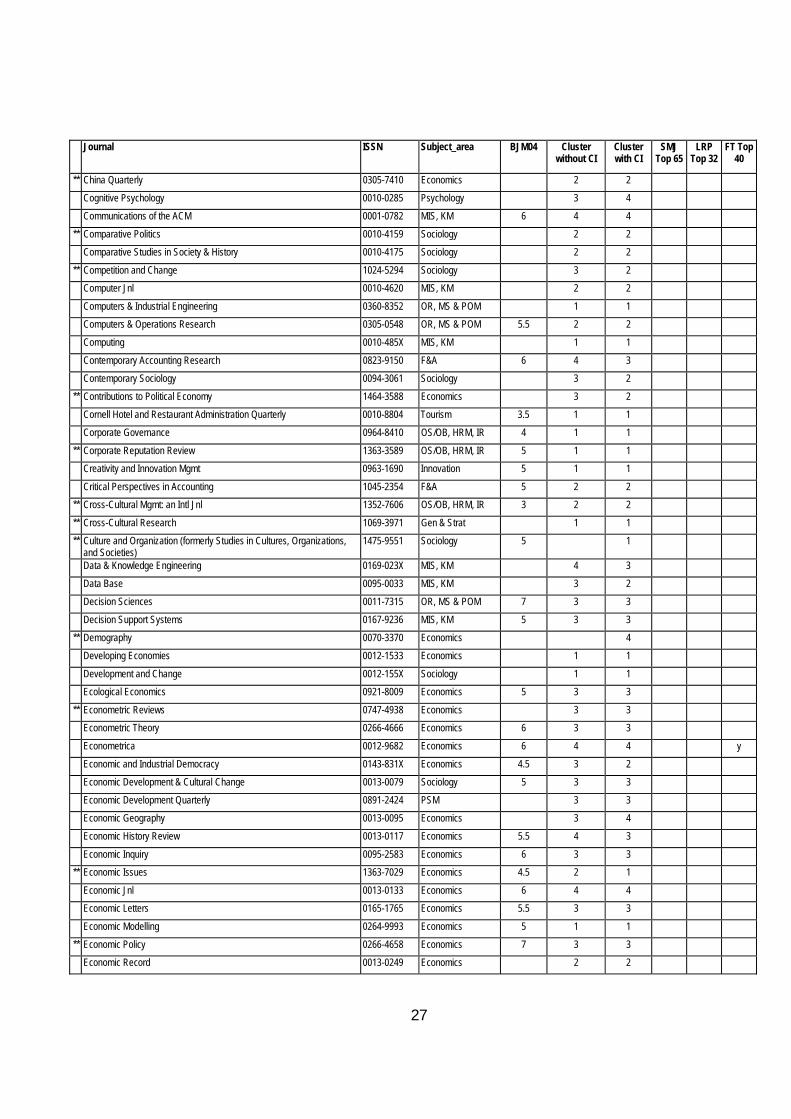
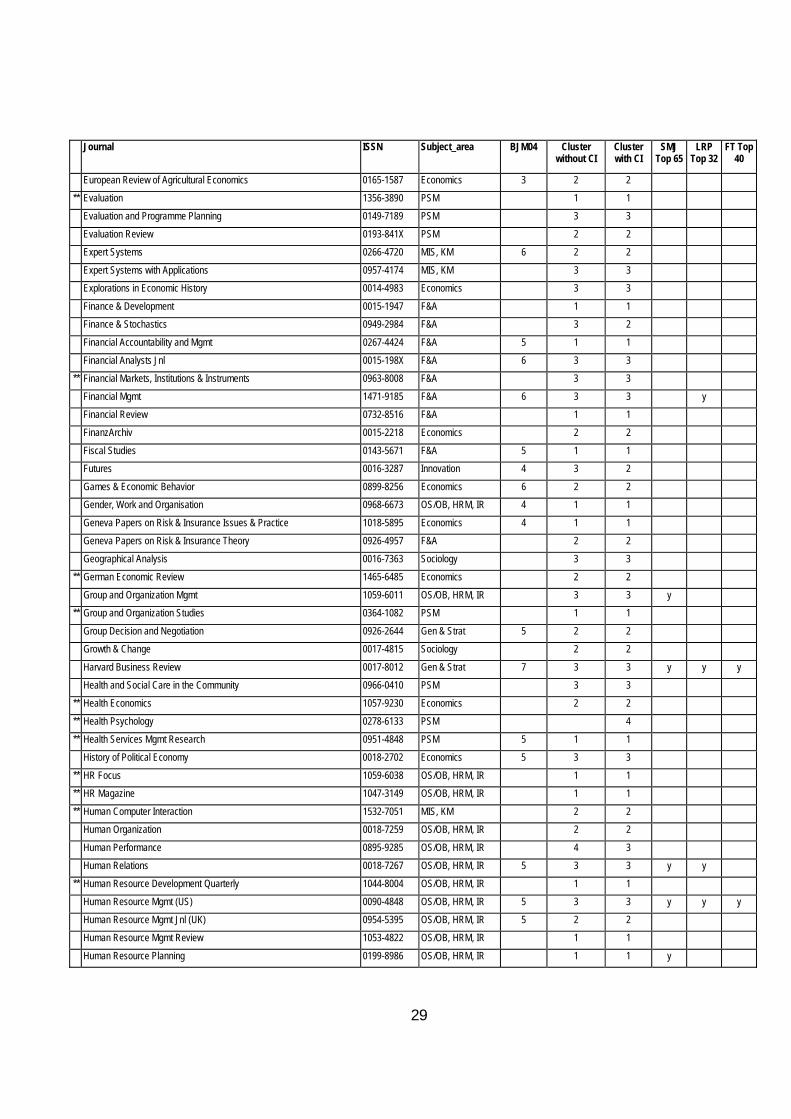
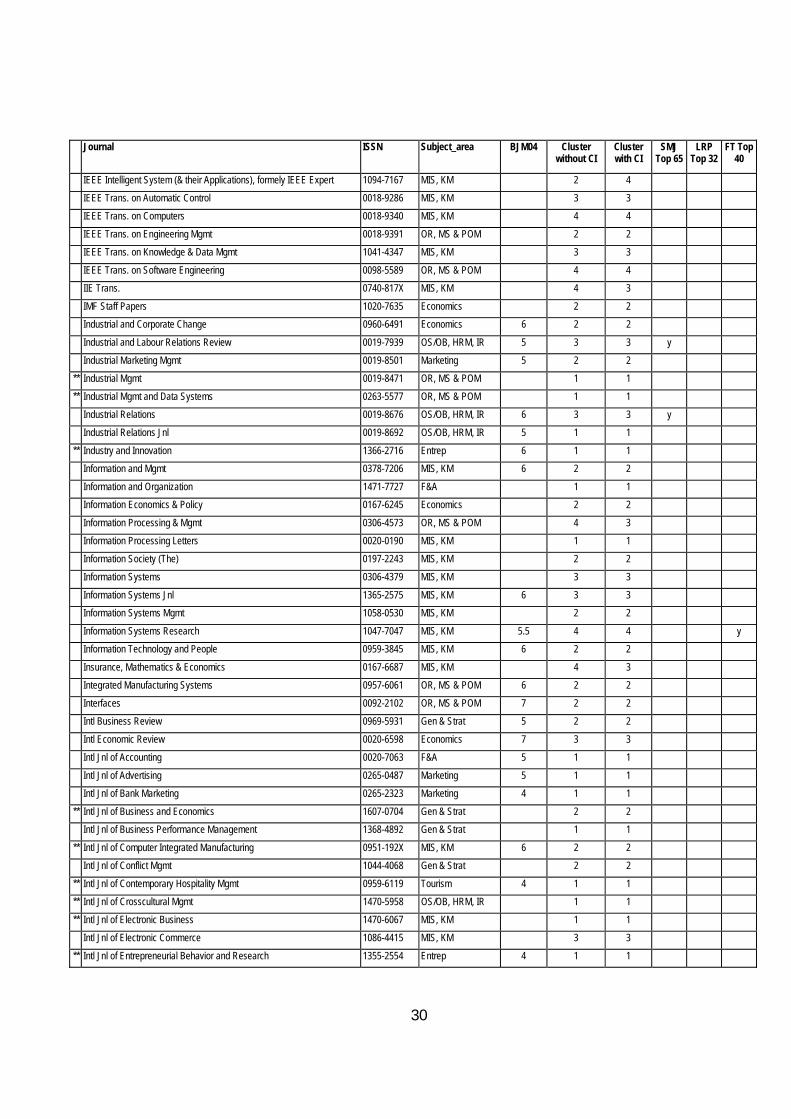
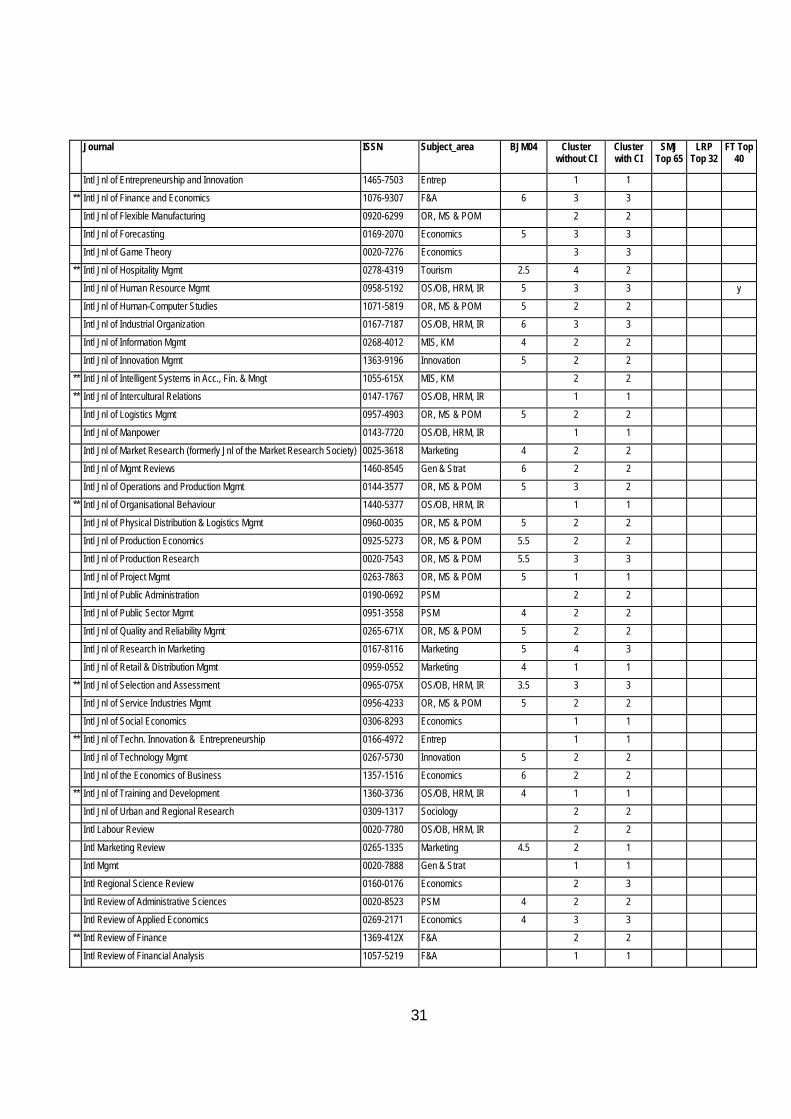
Table 9 at the end of this article contains a full list of the journals that have been ranked in alphabetical order with their ranking with and without CI04 together with the Geary RAE ratings, the SMJ and FT40 Lists.

14
Figure 3 Plot of the Four Clusters on the 1st Two Principal Components
Note: This only shows the cases that have no missing data as regression is used to calculate the factor scores. This especially affects the lower quality journals in groups 1 and 2 as they tend not to be ranked.
Review of the Results Before reviewing the results it is necessary to issue a word of caution. The analysis carried out has been purely statistical, based on the various rankings and the citation index. It has not involved any direct appraisal of individual journals. The results of such an analysis obviously depend crucially on the data that is analysed. In this case we are happy with the accuracy of the data but there is a problem in that a significant number of the journals have only received rankings in one or two lists. These are generally the lower quality journals as good quality journals tend to be included in most of the rankings. This can lead to some anomalies in grouping which may disadvantage some journals, especially perhaps newer ones that are trying to establish themselves.
We will illustrate this with one example. There are two journals in a similar sub-area of management. One was ranked as 3/6 on VHB03 and 4/5 on Ast03. The other had only one ranking, 3/5 on UQ03. The one ranking of the latter appears better than the two of the former and it was allocated to a higher group – 2 rather than 1. However, the first one, a new journal published by Sage, has a high quality editorial board, a strong refereeing procedure and will be registered with ISI soon. The second, an MCB journal, has a largely unknown editorial board and a very weak refereeing policy and would be seen as much poorer than the first by specialists in the area

15
In order to raise awareness of this, in Table 9 journals that have less than 3 rankings are marked with an **. Clearly, for such journals the statistically-based results must be handled with caution and augmented by specialist knowledge of the area. This is especially so for new journals which may take some years to establish a proper place in the rankings.
Moving to the results, prima facie the clustering seems quite sensible in terms of the proportions in each group and the actual members. Certainly in subjects with which the authors are familiar the groupings are quite sound. As stated above it is probably less reliable for the lower quality journals, groups 1 and 2, than for groups 3 and 4. In the following we will generally refer to the clustering including the citation index unless otherwise stated.
It is interesting to compare them with other categorisations. First we compared them with the RAE-based rankings produced by Geary et al (Geary et al., 2004) which are also shown in Table 9 (BJM04 – median score imputed from RAE gradings). Note that the Harzing database does not contain all the Geary journals. Those with low rankings were only included if the journal was already in the Harzing list giving a total of 395. Table 8 shows a cross-tab of the groups against BJM04.
Table 8 Cross-tab of BJM04 and Cluster Groups (Without CI04)
Cluster Number of Case
1 2 3 4 Total 2.5 0 1 0 0 13.0 1 5 0 1 73.5 1 0 1 0 24.0 40 15 13 4 724.5 4 3 4 0 115.0 40 59 33 1 1335.5 0 6 12 2 206.0 3 34 43 20 1006.5 1 3 5 4 13
BJM04
7.0 0 7 14 15 36Total 90 133 125 47 395
Significance: Somers’ d: 0.430, p<0.000
Gamma: 0.559, p<0.000
Looking first at the degree of association both Somer’s d and Gamma (for ordinal contingency tables) are significant at less than the 1% level so there is clearly a high level of positive agreement. However, there are also some interesting anomalies. In the top right-hand corner we find 4* journals that receive low rankings from the RAE analysis. Examples are (numbers of submissions in brackets): J. Cross-Cultural Psychology (1), J. Royal Statistical Society A (10), J. American Statistical Association (1), and the J. of Marketing (9). These are clearly good journals that had few submissions in the RAE where the submissions came from low rated departments. In the opposite corner we find 1* and 2* journals that were highly rated in the RAE. Examples include: Business Strategy Review (10), Industry and Innovation (5), J. Financial Services Research (3), Int. Transactions in OR (5), Interfaces (9).
Taking BJM04 as representative of the 2001 RAE submission as a whole rather than as a ranking per se, we analysed the proportions of Geary journals in each of the groups as follows: group 4, 12%; group 3, 32%; group 2, 34% and group 1, 22%. If the less exclusive grouping excluding the citation index is used the proportion of journals in the top group rises to 16%. By comparison, if we were to take a median of 6 or above in Geary’s data as top
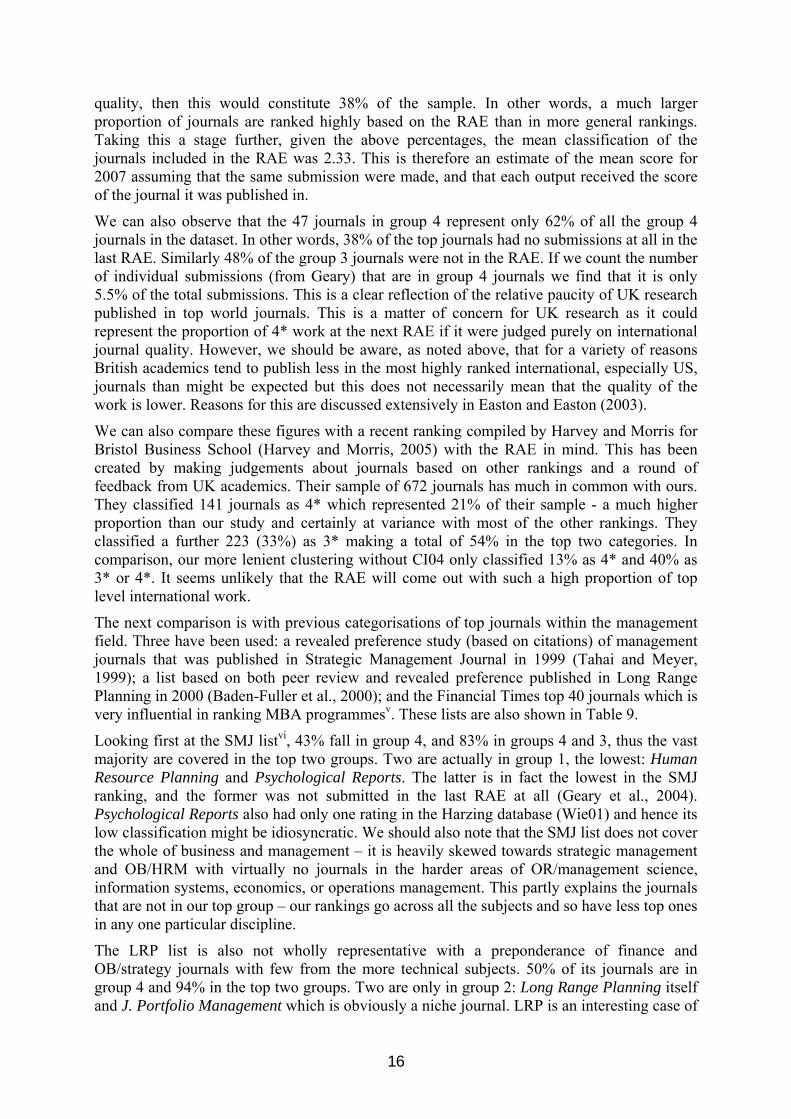
16
quality, then this would constitute 38% of the sample. In other words, a much larger proportion of journals are ranked highly based on the RAE than in more general rankings. Taking this a stage further, given the above percentages, the mean classification of the journals included in the RAE was 2.33. This is therefore an estimate of the mean score for 2007 assuming that the same submission were made, and that each output received the score of the journal it was published in.
We can also observe that the 47 journals in group 4 represent only 62% of all the group 4 journals in the dataset. In other words, 38% of the top journals had no submissions at all in the last RAE. Similarly 48% of the group 3 journals were not in the RAE. If we count the number of individual submissions (from Geary) that are in group 4 journals we find that it is only 5.5% of the total submissions. This is a clear reflection of the relative paucity of UK research published in top world journals. This is a matter of concern for UK research as it could represent the proportion of 4* work at the next RAE if it were judged purely on international journal quality. However, we should be aware, as noted above, that for a variety of reasons British academics tend to publish less in the most highly ranked international, especially US, journals than might be expected but this does not necessarily mean that the quality of the work is lower. Reasons for this are discussed extensively in Easton and Easton (2003).
We can also compare these figures with a recent ranking compiled by Harvey and Morris for Bristol Business School (Harvey and Morris, 2005) with the RAE in mind. This has been created by making judgements about journals based on other rankings and a round of feedback from UK academics. Their sample of 672 journals has much in common with ours. They classified 141 journals as 4* which represented 21% of their sample - a much higher proportion than our study and certainly at variance with most of the other rankings. They classified a further 223 (33%) as 3* making a total of 54% in the top two categories. In comparison, our more lenient clustering without CI04 only classified 13% as 4* and 40% as 3* or 4*. It seems unlikely that the RAE will come out with such a high proportion of top level international work.
The next comparison is with previous categorisations of top journals within the management field. Three have been used: a revealed preference study (based on citations) of management journals that was published in Strategic Management Journal in 1999 (Tahai and Meyer, 1999); a list based on both peer review and revealed preference published in Long Range Planning in 2000 (Baden-Fuller et al., 2000); and the Financial Times top 40 journals which is very influential in ranking MBA programmesv. These lists are also shown in Table 9.
Looking first at the SMJ listvi, 43% fall in group 4, and 83% in groups 4 and 3, thus the vast majority are covered in the top two groups. Two are actually in group 1, the lowest: Human Resource Planning and Psychological Reports. The latter is in fact the lowest in the SMJ ranking, and the former was not submitted in the last RAE at all (Geary et al., 2004). Psychological Reports also had only one rating in the Harzing database (Wie01) and hence its low classification might be idiosyncratic. We should also note that the SMJ list does not cover the whole of business and management – it is heavily skewed towards strategic management and OB/HRM with virtually no journals in the harder areas of OR/management science, information systems, economics, or operations management. This partly explains the journals that are not in our top group – our rankings go across all the subjects and so have less top ones in any one particular discipline.
The LRP list is also not wholly representative with a preponderance of finance and OB/strategy journals with few from the more technical subjects. 50% of its journals are in group 4 and 94% in the top two groups. Two are only in group 2: Long Range Planning itself and J. Portfolio Management which is obviously a niche journal. LRP is an interesting case of

17
a journal that was not considered high quality but which has improved significantly, not least since being included in the FT top 40.
Finally, of the FT top 40 68% are in group 4 and 86% are in the top two groups. The others, which were all in group 2, were an eclectic mixture with little in common: Long Range Planning, J. Small Business Management, Management International Review, J. Business Ethics, Entrepreneurship: Theory and Practice, and Academy of Management Executive.
Conclusions Previous journal ranking studies have either been revealed preference based solely on citations, or stated preference based on subjective judgements, or they have combined the two in a relatively unsophisticated way. This paper has reported on a detailed statistical analysis of the Harzing database of journal rankings and citation indices that has not been carried out before.
Looking at the different rankings, the main conclusions are that there is in general a high degree of conformity between them as shown by a principal components analysis. There is, however, a difference between the citation index and the other rankings. Some highly ranked journals do poorly in citations, often because they are not included in the ISI database, and conversely some high impact journals have relatively low peer rankings. The only other effect to be noticeable is a difference between UK rankings and those from the rest of Europe. This perhaps reflects the UK’s concern with the RAE, and recognised difficulties in publishing in top international, especially US, journals.
Cluster analysis was then used to create four groups of journals relevant to the RAE. When the citation index was included a small group of top journals (76) emerged that were strong on both ranking and impact. This was felt to be somewhat exclusive and so the citation index was excluded generating a wider group of 104. The smaller groups were found to correspond well with previous studies of top management journals and also gave, unlike them, equal coverage to all the management disciplines. There are some concerns at the lower end about the effects of journals that do not appear in many rankings.
The RAE Business and Management panel have a huge and unenviable task in trying to judge the quality of over 10,000 publications and they will inevitable have to resort to some standard mechanistic procedures to do so. Given that they are not supposed to evaluate people, and that citations analyses have many limitations, it seems inevitable that journal rankings will be used. This work will hopefully contribute by producing a grouping based on a statistical analysis of a variety of other rankings. It does highlight, however, the crucial importance of where to draw the top boundary between 4* and 3* work. Of the 76 4* journals highlighted in this paper, only 47 were represented in the last RAE, and they contained only a small percentage of the submitted work (5.5%). Whilst the RAE Business and Management panel have made it clear that a paper can be judged as 4* even if it is not published in a top journal how far they will go in this direction is unclear – perhaps even to them until they actually do it. It seems unlikely however that they will go as far as the Harvey and Morris ranking which has 21% of its journals in the top category.
We should point out the limitations of this study. First, there are significant problems with the extent and nature of the data. The large amount of missing data meant that we had to impute a considerable amount. Even then it limited the techniques that we could use and still left many journals, especially those that are new, with very few rankings to be judged on. Moreover, although the data was generally only ordinal in nature we often treated it as though it were interval. Having seen the results, however, we do not feel that this introduced a significant

18
bias and whilst the results for individual journals with few rankings should be treated with caution we feel that the analyses are robust and informative.
Second, we must be clear that we do not claim that these results speak definitively about the quality of the journals. They are based only on a specific collection of rankings and citations and so can only be relative to those. We have made no attempt to collect other data that may be relevant to judging journal quality such as circulation, acceptance rates, journal editorship, availability in libraries, extent and quality of reviewing processes, originality and significance of the contribution and so on. Peer review, upon which the analysis is largely based, has its own advantages and limitations. Such rankings are selective, biased, and often unresponsive to recent trends; and yet, being based on the collected judgements of experts can reflect a rich multi-dimensional view of overall journal quality.
-------------------------------------------
Table 9 at end of paper
-------------------------------------------

19
Appendix A: Variables in the Harzing Dataset and RAE Quality Levels
This is a brief list of the rankings available in the Harzing dataset. For more details see the Harzing website (Harzing, 2005)
Variable name (nn is the year)
Source Scale
NL94 Association of Dutch Universities A - E
NL99 Business Administration academics in the Netherlands A - C
Not95 UK academics 5.0 – 1.0
Bfd97 Modified version of NL94 A – E, Q for new journals
US98 Virginia Commonwealth University 1.00 – 0.00
SMJ99 Tahai and Meyer list of top 65 journals (Tahai and Meyer, 1999)
1 - 65
HKB00* Hong Kong Baptist University A, B+, B, B-
Wie01* Vienna University A+, A, B, C, D
Ast03* Aston University survey 5 - 1
UQ03* University of Queensland 1 - 5
VHB03* German Professors of Management A+, A, B, C, D, E
BJM04* Geary et al RAE2001 journals (Geary et al., 2004) 7.0 – 1.0
Cra04* Cranfield University 4 - 1
Ess05* Committee of ESSEC Professors 0 - 4
CInn* Citation Impact Factor for year nn Numeric score from 0. Above 2.0 is very high impact
FT40 Journals used by the Financial Times to compile their lists of top Business Schools
Yes/No
Definitions of quality levels for RAE 2008 (source “RAE2008, Guidance to panels”, Feb 2005, HEFCE)
RAE Level Descriptor
4* Quality that is world leading in terms of originality, significance, and rigour.
3* Quality that is internationally excellent in terms of originality, significance, and rigour but which nonetheless falls short of the highest standards of excellence.
2* Quality that is recognised internationally in terms of originality, significance, and rigour.
1* Quality that is recognised nationally in terms of originality, significance, and rigour.
Unclassified Quality that falls below the standard of nationally recognised work. Or work which does not meet the published definition of research for the purposes of the assessment.
20
Appendix B: Dealing with the Missing Data First, all the communications journals were removed as these generally only occurred in one ranking (UQ03) list. Then some of the rankings were removed on the grounds of their small size and selective coverage (NL99, Bfd97, US98, SMJ99 and FT40). Also most of the citation indices were removed as they showed a high degree of commonality with each other (correlation coefficients of around 0.9 with 300-500 cases) leaving only the latest – CI04. This left 11 variables and 834 journals.
The missing data was then examined for patterns using separate variance t-tests, dichotomized correlation and Little’s MCAR test (which tests whether the data is missing completely at random). They all showed that the missing data was not random. In particular, it was clear that for all variables there were significant differences between cases with and without missing data on the mean values of the other variables. These differences were always in the same direction with the cases with missing data having a lower mean, and therefore lower quality, than the cases without missing values. This is quite understandable as we would expect that any particular ranking would tend to include the higher quality journals and so those that are missing would tend to be the lower quality ones which would thus score less well in other rankings.
Imputation of missing values
It was decided to take the step of imputing data for two reasons: the bias in the missing data, and the various statistical routines, e.g., estimating principal component scores, that will only work on complete data – in this case 34 cases. Possible methods are: substituting another case from outside the sample, using the mean value, using an external value, or using regression to predict the missing values on the basis of relationships between the variables. Of these, the first is not possible, and the second and third are likely to introduce significant bias, especially for high or low quality journals. The regression method was therefore chosen on the reasonable assumption that there would be suitable relationships between rankings.
However, there is still a significant problem in getting this process started since a regression equation can only be estimated for cases which are complete in all included variables and as we have seen, there are few of these. To overcome this problem a bootstrapping procedure was devised gradually bringing in more variables. This is summarized in Table B1. The first step was to select the two variables with the least proportion of missing values – Ast04 and Wie01. These were used as independent variables to predict the third largest variable – Cra05 and impute its missing values for all cases where both Ast04 and Wie01 were present. The enhanced Cra05Imp was then added to the list of independents and was available to predict another variable in turn. This procedure was continued until no more variables could be accurately predicted.
In each case (apart from Not95) the dependent variable was essentially ordinal as discussed above, and so rather than use standard regression ordinal logistic regression was employed. Measures of goodness of fit of the models shown in Table B1 are -2LL (log likelihood) and Nagelkerke’s R2. -2LL shows the improvement in fit (roughly like sums of squares) of the model with variables against the intercept only, and its significance can be evaluated with chi-square, and Nagelkerke is an approximation to an R2. Independent variables were included provided that they were significant at least at the 1% level. As part of this phase various options were tested but found not to be beneficial. For instance, non-logistic functions, such

21
as probit, were tried; and the journal subject (e.g., Economics) were modelled using dummy variables but were not significant.
Table B1 Steps in Data Imputation
Stage Dependent variable, n
Independent variables, n
Coefficients 2LL; Χ2
R2(Nagelkerke)
1 Cra05
nbefore 349
nafter 461
Wie01, 474
Ast04, 533
1.501, z=5.4
2.433, z=9.8
253.9-67.1;
Χ2 = 186.8
R2 = 0.604
2 NL94
nbefore 347
nafter 503
Wie01
Cra04Imp
1.111, z=4.2
0.468, z=2.9
151.0-107.5;
Χ2 = 43.5
R2 = 0.197
3 Ess05
nbefore 246
nafter 372
Ast03
NL94Imp
0.744, z=3.6
1.144, z=5.6
152.2-89.2;
Χ2 = 63.1
R2 = 0.373
4 VHB03
nbefore 388
nafter 472
NL94Imp
Cra05Imp
Ess05Imp
0.432, z=2.5
0.677, z=3.7
1.568, z=5.4
282.8-95.5;
Χ2 = 105.9
R2 = 0.444
5 Hkb00
nbefore 251
nafter 368
Cra05Imp
Ess05Imp
VHB03Imp
0.930, z=4.2
1.123, z=3.6
0.535, z=2.4
242.1-147.5
Χ2 = 94.7
R2 = 0.459
5 UQ03
nbefore 383
nafter 540
Cra05Imp
Hkb00Imp
1.11, z=5.1
1.229, z=5.2
252.2-129.9
Χ2 = 122.2
R2 = 0.538
6 Not95 (interval)
nbefore 208
nafter 365
Hkb00Imp
Wie01
Ess05Imp
0.299, z=4.6
0.200,z=2.7
0.196,z=2.2
F = 42.9
R2 = 0.558
The end result of the data development stage was a set of variables to be further analysed. This consisted of Ast04 and Wie04 in their original form, together with Cra05Imp, VHB03Imp, Hkb00Imp, UQ03Imp, NL94Imp, Ess05Imp and Not95Imp with their imputed values.
Various ways of using the impact factor were tried. As it stands it has much missing data but it could be said that not having an impact factor, and thus not being recorded by the ISI database, was itself something of a measure of quality. The vast majority of reputable journals are included. This was tested in two ways. First, by using a dummy variable which was ‘1’ for each non-inclusion together with the CI03 variable. The dummy did not prove to be significant. The second way was to replace each missing value with zero. This would both represent a degree of lack of quality and avoid the missing values problem. This variable (CI040) was found in regressions to be more significant than the original and so was included in the final dataset.
We should note that BJM04 was not part of the imputation process. This is the data derived from the 2001 UK RAE by Geary et al (Geary et al., 2004) and as such is significantly

22
different from the other rankings. While all rankings have their particular orientations and biases, all of the others do aim to be general evaluations of a journal’s quality. BJM04 was imputed from the actual submissions to the RAE ranked in terms of the departmental outcomes. As such it really reflects the particular publishing habits of UK academics rather than global notions of journal quality. It was therefore decided not to try to predict it from the other rankings. It is not used in the generation of groups although it is part of the comparison of rankings and the evaluation of groups at the end of the paper.
23
Correlations Wie01 Ast03 BJM04 Cra05Imp NL94Imp Ess05Imp VHB03Imp Hkb00Imp Not95Imp UQ03Imp CI040
Wie01 Coeff 1.000 .395 .375 .550 .522 .373 .488 .419 .575 .478 .440 N 474 343 284 372 425 284 371 319 315 358 474Ast03 Coeff .395 1.000 .472 .783 .322 .462 .499 .536 .578 .666 .604 N 343 533 318 410 383 316 370 318 301 397 533BJM04 Coeff .375 .472 1.000 .459 .352 .329 .421 .427 .486 .480 .408 N 284 318 395 322 288 238 295 259 247 318 395Cra05Imp Coeff .550 .783 .459 1.000 .470 .487 .595 .636 .650 .718 .657 N 372 410 322 461 391 294 372 330 312 395 461NL94Imp Coeff .522 .322 .352 .470 1.000 .522 .494 .390 .492 .400 .340 N 425 383 288 391 503 322 375 337 318 372 503Ess05Imp Coeff .373 .462 .329 .487 .522 1.000 .546 .550 .602 .488 .403 N 284 316 238 294 322 372 317 301 287 312 372VHB03Imp Coeff .488 .499 .421 .595 .494 .546 1.000 .572 .636 .595 .516 N 371 370 295 372 375 317 472 331 313 396 472Hkb00Imp Coeff .419 .536 .427 .636 .390 .550 .572 1.000 .786 .720 .556 N 319 318 259 330 337 301 331 368 302 345 368Not95Imp Coeff .575 .578 .486 .650 .492 .602 .636 .786 1.000 .717 .644 N 315 301 247 312 318 287 313 302 365 334 365UQ03Imp Coeff .478 .666 .480 .718 .400 .488 .595 .720 .717 1.000 .684 N 358 397 318 395 372 312 396 345 334 540 540CI040 Coeff .440 .604 .408 .657 .340 .403 .516 .556 .644 .684 1.000 N 474 533 395 461 503 372 472 368 365 540 834
Table 2 Spearman Correlation Coefficients between the Main Variables
24
Table 9 Classification of Journals with and without the Citation Index Journal ISSN Subject_area BJM04 Cluster
without CI Cluster with CI
SMJ Top 65
LRP Top 32
FT Top 40
Abacus 0001-3072 F&A 5 3 2
** Academy of Marketing Science Review 1526-1794 Marketing 2 2
** Academy of Marketing Studies Jnl 1528-2678 Marketing 1 1
Academy of Mgmt Executive 0896-3789 Gen & Strat 6 2 2 y y
Academy of Mgmt Jnl 0001-4273 Gen & Strat 6 4 4 y y y
** Academy of Mgmt Learning & Education 1537-260X Gen & Strat 2 2 Academy of Mgmt Review 0363-7425 Gen & Strat 6 4 4 y y y
Accounting and Business Research 0001-4788 F&A 6 2 2 Accounting and Finance 0810-5391 F&A 2 2
** Accounting Historians Jnl 0148-4184 F&A 1 1
Accounting Horizons 0888-7993 F&A 5.5 3 3
Accounting Review (The) 0001-4826 F&A 4 4 y
Accounting, Auditing and Accountability Jnl 0951-3574 F&A 5 2 2
Accounting, Organisations and Society 0361-3682 F&A 6 4 4 y
ACM Computing Surveys 0360-0300 MIS, KM 3 4
ACM Trans. on Computer Human Interaction 1073-0516 MIS, KM 4 3 ACM Trans. on Database Systems 0362-5915 MIS, KM 4 3
ACM Trans. on Information Systems 1046-8188 MIS, KM 3 4 ACM Trans. on Mathematical Software 0098-3500 MIS, KM 4 4
ACM Trans. on Software Eng (&) Methodology 1049-331X MIS, KM 3 3
Administration and Society 0095-3997 PSM 5 2 2
Administrative Science Quarterly 0001-8392 Gen & Strat 6 4 4 y y y
** Advances in Accounting 0882-6110 F&A 3 2
Advances in Applied Probability 0001-8678 OR, MS & POM 3 3
Advances in Consumer Research 0098-9258 Marketing 7 2 2
Advances in Intl Marketing 1474-7979 Marketing 2 2 ** Advances in Intl Mgmt 0747-7929 Gen & Strat 1 1
** Advances in Strategic Mgmt 0742-3322 Gen & Strat 2 2 ** Advancing Women in Leadership 1093-7099 OS/OB, HRM, IR 2 2
American Behavioural Scientist 0002-7642 OS/OB, HRM, IR 2 2
** American Business Law Jnl 0002-7766 Economics 4 3
** American Business Review 0743-2348 Gen & Strat 1 1
American Economic Review (The) 0002-8282 Economics 6.5 4 4 y y
American Education Research Jnl 0002-8312 PSM 3 3
American Jnl of Agricultural Economics 0002-9092 Economics 3 3
** American Jnl of Economics and Sociology 0002-9246 Economics 6 4 3 ** American Jnl of Evaluation 1098-2140 PSM 2 2
** American Jnl of Political Science(s) 0092-5853 Sociology 3 4
American Jnl of Psychology 0002-9556 Psychology 3 3
** American Jnl of Public Health 0090-0036 Economics 4
American Jnl of Sociology 0002-9602 Sociology 7 4 4 y
American Political Science Review 0003-0554 PSM 4 4
American Psychologist 0003-066X Psychology 3 4 y

25
Journal ISSN Subject_area BJM04 Cluster without CI
Cluster with CI
SMJ Top 65
LRP Top 32
FT Top 40
** American Review of Public Administration 0275-0740 PSM 2 2
American Sociological Review 0003-1224 Sociology 6 4 4 y
** American Sociologist 0003-1232 Sociology 3 3
American Statistician 0003-1305 OR, MS & POM 1 2
Annals of Operations Research 0254-5330 OR, MS & POM 5 3 3
Annals of Probability 0091-1798 OR, MS & POM 4 4 ** Annals of Public & Cooperative Economics 1467-8292 Economics 4.5 3 3
Annals of Regional Science 0570-1864 Economics 7 2 2 Annals of Statistics 0090-5364 OR, MS & POM 6 4 4
Annals of the Assoc. of American Geographers 0004-5608 Sociology 3 4
Annals of Tourism Research 0160-7383 Tourism 5 4 3
Annual Review of Psychology 0066-4308 Psychology 4 4 y
Annual Review of Sociology 0360-0572 Sociology 2 4 y
** Applied Artificial Intelligence 0883-9514 MIS, KM 2
Applied Economics 0003-6846 Economics 4 2 2
Applied Economics Letters 1350-4851 Economics 4.5 1 1 ** Applied Ergonomics 0003-6870 OS/OB, HRM, IR 3 3
Applied Financial Economics 0960-3107 Economics 5 2 2 ** Applied Geography 0143-6228 Sociology 2 2
** Applied Intelligence 0924-669X MIS, KM 2
Applied Mathematical Finance 1350-486X F&A 6.5 3 3
Applied Mathematics and Optimization 0095-4616 OR, MS & POM 3 3
** Applied Psychological Measurement 0146-6216 Psychology 3 3
Applied Psychology: an Intl Review 0269-994X Psychology 3 3 Applied Statistics: Jnl of the Royal Statistical Society Series C 0035-9254 OR, MS & POM 2 2
Articifical Intelligence Jnl: an Intl Jnl 0004-3702 MIS, KM 3 4 ** Artificial Intelligence Magazine 0738-4602 MIS, KM 3
** Artificial Intelligence Review 0269-2821 MIS, KM 3
** Asian Development Review 1360-2381 Economics 1 1
** Asian Jnl of Political Science 1608-1625 PSM 2 2
Asia-Pacific Business Review 1038-4111 Economics 5 1 1
** Asia-Pacific Jnl of Accounting & Economics 1355-5855 F&A 2 2
** Asia-Pacific Jnl of Human Resources 0217-4561 OS/OB, HRM, IR 5 2 2
** Asia-Pacific Jnl of Marketing and Logistics 0116-1105 Marketing 2 2 Asia-Pacific Jnl of Mgmt 0218-5377 Gen & Strat 2 2
Atlantic Economic Jnl 0197-4254 Economics 1 1 Auditing: a Jnl of Practice and Theory 0278-0380 F&A 7 3 3
** Australasian Jnl of Market Research 1325-4634 Marketing 1 1
** Australasian Marketing Jnl 1320-1646 Marketing 1 1
** Australian Accounting Review 1035-6908 F&A 1 1
** Australian Bulletin of Labour 0311-6336 OS/OB, HRM, IR 1 1
Australian Economic Papers 0004-8917 Economics 1 1
** Australian Economic Review 0004-9018 Economics 2 2
** Australian Jnl of Information Systems 1039-7841 MIS, KM 1 1
26
Journal ISSN Subject_area BJM04 Cluster without CI
Cluster with CI
SMJ Top 65
LRP Top 32
FT Top 40
** Australian Jnl of Labour Law 1030-7222 OS/OB, HRM, IR 1 1
** Australian Jnl of Marketing Research 0004-9476 Marketing 1 1
** Australian Jnl of Mgmt 0312-8962 Gen & Strat 1 1
** Australian Jnl of Public Administration 1467-8500 PSM 2 2
Bank of America Jnl of Applied Corp. Finance 1078-1196 F&A 1 1
Bank of England Quarterly Bulletin 0005-5166 F&A 1 1 Banker 0005-5395 F&A 1 1
** Basic & Applied Social Psychology 1532-4834 Psychology 3 2 Behaviour and Information Technology 0144-929X MIS, KM 5 1 1
Behavioural Research in Accounting 1050-4753 F&A 3 3
** Benchmarking 1463-5771 OR, MS & POM 5 1 1
** Betriebswirtschaftliche Forschung und Praxis 0340-5370 Gen & Strat 1 1
Biometrics 0006-341X OR, MS & POM 3 3
Biometrika 0006-3444 OR, MS & POM 4 3
British Accounting Review 0890-8389 F&A 5 1 1
** British Jnl of Educational Psychology 0007-0998 Psychology 3 3 ** British Jnl of Educational Technology 0007-1013 MIS, KM 2 2
** British Jnl of Health Psychology 1359-107X PSM 3 British Jnl of Industrial Relations 0007-1080 OS/OB, HRM, IR 5 3 3 y
British Jnl of Mgmt 1045-3172 Gen & Strat 5 2 2
** British Jnl of Political Science 0007-1234 PSM 4 3
British Jnl of Psychology 0007-1269 Psychology 2 2
British Jnl of Social Psychology 0144-6665 Psychology 1 1
** British Jnl of Social Work 0045-3102 PSM 2 2 British Jnl of Sociology 0007-1315 Sociology 5.5 3 3
Brookings Papers on Economic Activity 0007-2303 Economics 4 4 Bulletin of Economic Research 0307-3378 Economics 6 2 2
** Business & Economic Review 0007-6465 Gen & Strat 2 2
Business & Society 0007-6503 Gen & Strat 1 1
Business Ethics Quarterly 1052-150X OS/OB, HRM, IR 6.5 1 2
Business Ethics: A European Review 0962-8770 OS/OB, HRM, IR 4 1 1
Business History 0007-6791 Sociology 6 2 2
Business History Review 0007-6805 Sociology 6 2 2
Business Horizons 0007-6813 Gen & Strat 5.5 2 2 y Business Process Mgmt Jnl 1460-9665 OR, MS & POM 4 1 1
** Business Quarterly 0007-6996 Gen & Strat 1 1 Business Strategy & the Environment 0964-4733 Gen & Strat 4.5 2 2
Business Strategy Review 0955-6419 Gen & Strat 6.5 1 1
California Mgmt Review 0008-1256 Gen & Strat 6 3 3 y y y
Cambridge Jnl of Economics 0309-166X Economics 6 3 3
Canadian Jnl of Administrative Sciences 0825-0383 PSM 1 1
Canadian Jnl of Economics 0008-4085 Economics 6 3 3
Career Development Intl 1362-0436 OS/OB, HRM, IR 4 1 1
Central European Jnl of Operations Research 1435-246X OR, MS & POM 1 1
27
Journal ISSN Subject_area BJM04 Cluster without CI
Cluster with CI
SMJ Top 65
LRP Top 32
FT Top 40
** China Quarterly 0305-7410 Economics 2 2
Cognitive Psychology 0010-0285 Psychology 3 4
Communications of the ACM 0001-0782 MIS, KM 6 4 4
** Comparative Politics 0010-4159 Sociology 2 2
Comparative Studies in Society & History 0010-4175 Sociology 2 2
** Competition and Change 1024-5294 Sociology 3 2 Computer Jnl 0010-4620 MIS, KM 2 2
Computers & Industrial Engineering 0360-8352 OR, MS & POM 1 1 Computers & Operations Research 0305-0548 OR, MS & POM 5.5 2 2
Computing 0010-485X MIS, KM 1 1
Contemporary Accounting Research 0823-9150 F&A 6 4 3
Contemporary Sociology 0094-3061 Sociology 3 2
** Contributions to Political Economy 1464-3588 Economics 3 2
Cornell Hotel and Restaurant Administration Quarterly 0010-8804 Tourism 3.5 1 1
Corporate Governance 0964-8410 OS/OB, HRM, IR 4 1 1
** Corporate Reputation Review 1363-3589 OS/OB, HRM, IR 5 1 1 Creativity and Innovation Mgmt 0963-1690 Innovation 5 1 1
Critical Perspectives in Accounting 1045-2354 F&A 5 2 2 ** Cross-Cultural Mgmt: an Intl Jnl 1352-7606 OS/OB, HRM, IR 3 2 2
** Cross-Cultural Research 1069-3971 Gen & Strat 1 1
** Culture and Organization (formerly Studies in Cultures, Organizations, and Societies)
1475-9551 Sociology 5 1
Data & Knowledge Engineering 0169-023X MIS, KM 4 3
Data Base 0095-0033 MIS, KM 3 2
Decision Sciences 0011-7315 OR, MS & POM 7 3 3
Decision Support Systems 0167-9236 MIS, KM 5 3 3
** Demography 0070-3370 Economics 4
Developing Economies 0012-1533 Economics 1 1
Development and Change 0012-155X Sociology 1 1 Ecological Economics 0921-8009 Economics 5 3 3
** Econometric Reviews 0747-4938 Economics 3 3 Econometric Theory 0266-4666 Economics 6 3 3
Econometrica 0012-9682 Economics 6 4 4 y
Economic and Industrial Democracy 0143-831X Economics 4.5 3 2
Economic Development & Cultural Change 0013-0079 Sociology 5 3 3
Economic Development Quarterly 0891-2424 PSM 3 3
Economic Geography 0013-0095 Economics 3 4
Economic History Review 0013-0117 Economics 5.5 4 3
Economic Inquiry 0095-2583 Economics 6 3 3 ** Economic Issues 1363-7029 Economics 4.5 2 1
Economic Jnl 0013-0133 Economics 6 4 4 Economic Letters 0165-1765 Economics 5.5 3 3
Economic Modelling 0264-9993 Economics 5 1 1
** Economic Policy 0266-4658 Economics 7 3 3
Economic Record 0013-0249 Economics 2 2

28
Journal ISSN Subject_area BJM04 Cluster without CI
Cluster with CI
SMJ Top 65
LRP Top 32
FT Top 40
Economic Theory 0938-2259 Economics 7 3 3
Economica 0013-0427 Economics 6 3 3
** Economics and Philosophy 0266-2671 Economics 1 1
** Economics of Innovation and New Technology 1043-8599 Entrep 2 2
Economics of Planning 0013-0451 Economics 2 2
Economics of Transition 0967-0750 Economics 2 2 Economy & Society 0308-5147 Economics 5 3 3
** Educational Mgmt & Administration 0263-211X PSM 3 2 2 ** Educational Research 0013-1881 PSM 3 2
** Electronic Commerce Research 1389-5753 MIS, KM 1 1
Electronic Markets 1019-6781 MIS, KM 1 1
** Empirica 0340-8744 Economics 2 2
Empirical Economics 0377-7332 Economics 2 2
Employee Relations 0142-5455 OS/OB, HRM, IR 5 1 1
** Employee Relations Law Jnl 0098-8898 OS/OB, HRM, IR 1 1
Energy Economics 0140-9883 Economics 2 2 ** Enterprise and Innovation Mgmt Studies 1463-2446 Entrep 5 1 1
Entrepreneurship and Regional Development 0898-5626 Entrep 5 1 1 ** Entrepreneurship, Innovation and Change 1059-0137 Entrep 1 1
Entrepreneurship: Theory & Practice 1042-2587 Entrep 5 2 2 y
Environment & Planning A 0308-518X PSM 3 3
Environment & Planning B 0308-2164 PSM 3 3
Environment & Planning C 0263-774X PSM 3 3
Environment & Planning D 0263-7758 PSM 3 3 European Accounting Review 0963-8180 F&A 5 2 2
European Business Jnl 0955-808X Gen & Strat 5 1 1 European Business Review 0955-534X Gen & Strat 3 2 2
European Economic Review 0014-2921 Economics 6.5 3 3
European Finance Review 1382-6662 F&A 7 2 2
European Financial Mgmt 1354-7798 F&A 6 2 2
European Jnl of Finance 1351-847X F&A 5 2 2
European Jnl of Industrial Relations 0959-6801 OS/OB, HRM, IR 4 3 2
European Jnl of Information Systems 0960-085X MIS, KM 5 3 2
European Jnl of Innovation Mgmt 1460-1060 Innovation 5 1 1 European Jnl of Marketing 0309-0566 Marketing 5 2 2
European Jnl of Operational Research 0377-2217 OR, MS & POM 6 3 3 European Jnl of Political Economy 0176-2680 Sociology 3 3
** European Jnl of Political Research 0304-4130 Sociology 2 2
European Jnl of Social Psychology 0046-2772 Psychology 3 3
** European Jnl of Sociology 0003-9756 Sociology 2 2
** European Jnl of the History of Economic Thought 0967-2567 Economics 3 2
European Jnl of Work and Organizational Psychology 1359-432X OS/OB, HRM, IR 5 1 1
European Mgmt Jnl 0263-2373 Gen & Strat 5 1 1
** European Planning Studies 0965-4313 PSM 3 3
29
Journal ISSN Subject_area BJM04 Cluster without CI
Cluster with CI
SMJ Top 65
LRP Top 32
FT Top 40
European Review of Agricultural Economics 0165-1587 Economics 3 2 2
** Evaluation 1356-3890 PSM 1 1
Evaluation and Programme Planning 0149-7189 PSM 3 3
Evaluation Review 0193-841X PSM 2 2
Expert Systems 0266-4720 MIS, KM 6 2 2
Expert Systems with Applications 0957-4174 MIS, KM 3 3 Explorations in Economic History 0014-4983 Economics 3 3
Finance & Development 0015-1947 F&A 1 1 Finance & Stochastics 0949-2984 F&A 3 2
Financial Accountability and Mgmt 0267-4424 F&A 5 1 1
Financial Analysts Jnl 0015-198X F&A 6 3 3
** Financial Markets, Institutions & Instruments 0963-8008 F&A 3 3
Financial Mgmt 1471-9185 F&A 6 3 3 y
Financial Review 0732-8516 F&A 1 1
FinanzArchiv 0015-2218 Economics 2 2
Fiscal Studies 0143-5671 F&A 5 1 1 Futures 0016-3287 Innovation 4 3 2
Games & Economic Behavior 0899-8256 Economics 6 2 2 Gender, Work and Organisation 0968-6673 OS/OB, HRM, IR 4 1 1
Geneva Papers on Risk & Insurance Issues & Practice 1018-5895 Economics 4 1 1
Geneva Papers on Risk & Insurance Theory 0926-4957 F&A 2 2
Geographical Analysis 0016-7363 Sociology 3 3
** German Economic Review 1465-6485 Economics 2 2
Group and Organization Mgmt 1059-6011 OS/OB, HRM, IR 3 3 y ** Group and Organization Studies 0364-1082 PSM 1 1
Group Decision and Negotiation 0926-2644 Gen & Strat 5 2 2 Growth & Change 0017-4815 Sociology 2 2
Harvard Business Review 0017-8012 Gen & Strat 7 3 3 y y y
Health and Social Care in the Community 0966-0410 PSM 3 3
** Health Economics 1057-9230 Economics 2 2
** Health Psychology 0278-6133 PSM 4
** Health Services Mgmt Research 0951-4848 PSM 5 1 1
History of Political Economy 0018-2702 Economics 5 3 3
** HR Focus 1059-6038 OS/OB, HRM, IR 1 1 ** HR Magazine 1047-3149 OS/OB, HRM, IR 1 1
** Human Computer Interaction 1532-7051 MIS, KM 2 2 Human Organization 0018-7259 OS/OB, HRM, IR 2 2
Human Performance 0895-9285 OS/OB, HRM, IR 4 3
Human Relations 0018-7267 OS/OB, HRM, IR 5 3 3 y y
** Human Resource Development Quarterly 1044-8004 OS/OB, HRM, IR 1 1
Human Resource Mgmt (US) 0090-4848 OS/OB, HRM, IR 5 3 3 y y y
Human Resource Mgmt Jnl (UK) 0954-5395 OS/OB, HRM, IR 5 2 2
Human Resource Mgmt Review 1053-4822 OS/OB, HRM, IR 1 1
Human Resource Planning 0199-8986 OS/OB, HRM, IR 1 1 y
30
Journal ISSN Subject_area BJM04 Cluster without CI
Cluster with CI
SMJ Top 65
LRP Top 32
FT Top 40
IEEE Intelligent System (& their Applications), formely IEEE Expert 1094-7167 MIS, KM 2 4
IEEE Trans. on Automatic Control 0018-9286 MIS, KM 3 3
IEEE Trans. on Computers 0018-9340 MIS, KM 4 4
IEEE Trans. on Engineering Mgmt 0018-9391 OR, MS & POM 2 2
IEEE Trans. on Knowledge & Data Mgmt 1041-4347 MIS, KM 3 3
IEEE Trans. on Software Engineering 0098-5589 OR, MS & POM 4 4 IIE Trans. 0740-817X MIS, KM 4 3
IMF Staff Papers 1020-7635 Economics 2 2 Industrial and Corporate Change 0960-6491 Economics 6 2 2
Industrial and Labour Relations Review 0019-7939 OS/OB, HRM, IR 5 3 3 y
Industrial Marketing Mgmt 0019-8501 Marketing 5 2 2
** Industrial Mgmt 0019-8471 OR, MS & POM 1 1
** Industrial Mgmt and Data Systems 0263-5577 OR, MS & POM 1 1
Industrial Relations 0019-8676 OS/OB, HRM, IR 6 3 3 y
Industrial Relations Jnl 0019-8692 OS/OB, HRM, IR 5 1 1
** Industry and Innovation 1366-2716 Entrep 6 1 1 Information and Mgmt 0378-7206 MIS, KM 6 2 2
Information and Organization 1471-7727 F&A 1 1 Information Economics & Policy 0167-6245 Economics 2 2
Information Processing & Mgmt 0306-4573 OR, MS & POM 4 3
Information Processing Letters 0020-0190 MIS, KM 1 1
Information Society (The) 0197-2243 MIS, KM 2 2
Information Systems 0306-4379 MIS, KM 3 3
Information Systems Jnl 1365-2575 MIS, KM 6 3 3 Information Systems Mgmt 1058-0530 MIS, KM 2 2
Information Systems Research 1047-7047 MIS, KM 5.5 4 4 y Information Technology and People 0959-3845 MIS, KM 6 2 2
Insurance, Mathematics & Economics 0167-6687 MIS, KM 4 3
Integrated Manufacturing Systems 0957-6061 OR, MS & POM 6 2 2
Interfaces 0092-2102 OR, MS & POM 7 2 2
Intl Business Review 0969-5931 Gen & Strat 5 2 2
Intl Economic Review 0020-6598 Economics 7 3 3
Intl Jnl of Accounting 0020-7063 F&A 5 1 1
Intl Jnl of Advertising 0265-0487 Marketing 5 1 1 Intl Jnl of Bank Marketing 0265-2323 Marketing 4 1 1
** Intl Jnl of Business and Economics 1607-0704 Gen & Strat 2 2 Intl Jnl of Business Performance Management 1368-4892 Gen & Strat 1 1
** Intl Jnl of Computer Integrated Manufacturing 0951-192X MIS, KM 6 2 2
Intl Jnl of Conflict Mgmt 1044-4068 Gen & Strat 2 2
** Intl Jnl of Contemporary Hospitality Mgmt 0959-6119 Tourism 4 1 1
** Intl Jnl of Crosscultural Mgmt 1470-5958 OS/OB, HRM, IR 1 1
** Intl Jnl of Electronic Business 1470-6067 MIS, KM 1 1
Intl Jnl of Electronic Commerce 1086-4415 MIS, KM 3 3
** Intl Jnl of Entrepreneurial Behavior and Research 1355-2554 Entrep 4 1 1
31
Journal ISSN Subject_area BJM04 Cluster without CI
Cluster with CI
SMJ Top 65
LRP Top 32
FT Top 40
Intl Jnl of Entrepreneurship and Innovation 1465-7503 Entrep 1 1
** Intl Jnl of Finance and Economics 1076-9307 F&A 6 3 3
Intl Jnl of Flexible Manufacturing 0920-6299 OR, MS & POM 2 2
Intl Jnl of Forecasting 0169-2070 Economics 5 3 3
Intl Jnl of Game Theory 0020-7276 Economics 3 3
** Intl Jnl of Hospitality Mgmt 0278-4319 Tourism 2.5 4 2 Intl Jnl of Human Resource Mgmt 0958-5192 OS/OB, HRM, IR 5 3 3 y
Intl Jnl of Human-Computer Studies 1071-5819 OR, MS & POM 5 2 2 Intl Jnl of Industrial Organization 0167-7187 OS/OB, HRM, IR 6 3 3
Intl Jnl of Information Mgmt 0268-4012 MIS, KM 4 2 2
Intl Jnl of Innovation Mgmt 1363-9196 Innovation 5 2 2
** Intl Jnl of Intelligent Systems in Acc., Fin. & Mngt 1055-615X MIS, KM 2 2
** Intl Jnl of Intercultural Relations 0147-1767 OS/OB, HRM, IR 1 1
Intl Jnl of Logistics Mgmt 0957-4903 OR, MS & POM 5 2 2
Intl Jnl of Manpower 0143-7720 OS/OB, HRM, IR 1 1
Intl Jnl of Market Research (formerly Jnl of the Market Research Society) 0025-3618 Marketing 4 2 2 Intl Jnl of Mgmt Reviews 1460-8545 Gen & Strat 6 2 2
Intl Jnl of Operations and Production Mgmt 0144-3577 OR, MS & POM 5 3 2 ** Intl Jnl of Organisational Behaviour 1440-5377 OS/OB, HRM, IR 1 1
Intl Jnl of Physical Distribution & Logistics Mgmt 0960-0035 OR, MS & POM 5 2 2
Intl Jnl of Production Economics 0925-5273 OR, MS & POM 5.5 2 2
Intl Jnl of Production Research 0020-7543 OR, MS & POM 5.5 3 3
Intl Jnl of Project Mgmt 0263-7863 OR, MS & POM 5 1 1
Intl Jnl of Public Administration 0190-0692 PSM 2 2 Intl Jnl of Public Sector Mgmt 0951-3558 PSM 4 2 2
Intl Jnl of Quality and Reliability Mgmt 0265-671X OR, MS & POM 5 2 2 Intl Jnl of Research in Marketing 0167-8116 Marketing 5 4 3
Intl Jnl of Retail & Distribution Mgmt 0959-0552 Marketing 4 1 1
** Intl Jnl of Selection and Assessment 0965-075X OS/OB, HRM, IR 3.5 3 3
Intl Jnl of Service Industries Mgmt 0956-4233 OR, MS & POM 5 2 2
Intl Jnl of Social Economics 0306-8293 Economics 1 1
** Intl Jnl of Techn. Innovation & Entrepreneurship 0166-4972 Entrep 1 1
Intl Jnl of Technology Mgmt 0267-5730 Innovation 5 2 2
Intl Jnl of the Economics of Business 1357-1516 Economics 6 2 2 ** Intl Jnl of Training and Development 1360-3736 OS/OB, HRM, IR 4 1 1
Intl Jnl of Urban and Regional Research 0309-1317 Sociology 2 2 Intl Labour Review 0020-7780 OS/OB, HRM, IR 2 2
Intl Marketing Review 0265-1335 Marketing 4.5 2 1
Intl Mgmt 0020-7888 Gen & Strat 1 1
Intl Regional Science Review 0160-0176 Economics 2 3
Intl Review of Administrative Sciences 0020-8523 PSM 4 2 2
Intl Review of Applied Economics 0269-2171 Economics 4 3 3
** Intl Review of Finance 1369-412X F&A 2 2
Intl Review of Financial Analysis 1057-5219 F&A 1 1

32
Journal ISSN Subject_area BJM04 Cluster without CI
Cluster with CI
SMJ Top 65
LRP Top 32
FT Top 40
Intl Review of Law and Economics 0144-8188 Economics 2 2
** Intl Review of Retail Distribution & Cons. Researchr 0959-3969 Marketing 5 1 1
Intl Review of Strategic Mgmt 1047-7918 Gen & Strat 1 1
Intl Small Business Jnl 0266-2426 Entrep 4 1 1
Intl Social Science Jnl 0020-8701 Sociology 1 1
Intl Studies of Mgmt & Organization 0020-8825 OS/OB, HRM, IR 5 2 2 ** Intl Studies Quarterly 0020-8833 Economics 2 2
Intl Transactions in Operational Research 0969-6016 OR, MS & POM 7 2 2 Issues in Accounting Education 0739-3172 F&A 5 2 2
** Japan and the World Economy 0922-1425 Economics 2 2
** Jnl for Quality & Participation 1040-9602 OR, MS & POM 1
Jnl of Accountancy 0021-8448 F&A 1 1
Jnl of Accounting & Economics 0165-4101 F&A 7 4 4 y
Jnl of Accounting and Public Policy 0278-4254 F&A 5 3 3
Jnl of Accounting Education 0748-5751 F&A 1 1
Jnl of Accounting Literature 0737-4607 F&A 3 3 Jnl of Accounting Research 0021-8456 F&A 7 4 4 y
Jnl of Accounting, Auditing and Finance 0148-558X F&A 6.5 3 3 Jnl of Advertising 0091-3367 Marketing 5 2 2
Jnl of Advertising Research 0021-8499 Marketing 4 2 2
** Jnl of Applied Accounting Research 0967-5426 F&A 4.5 1 1
Jnl of Applied Behavioural Sciences 0021-8863 Psychology 5 2 2
Jnl of Applied Business Research 0892-7626 OS/OB, HRM, IR 1 1
Jnl of Applied Corporate Finance 1078-1196 F&A 6.5 2 2 Jnl of Applied Econometrics 0883-7252 Economics 6 4 3
** Jnl of Applied Economics 1514-0326 Economics 3 3 ** Jnl of Applied Mgmt and Entrepreneurship 1077-1158 Entrep 1 1
** Jnl of Applied Mgmt Studies 1360-0796 Gen & Strat 4 2 2
Jnl of Applied Psychology 0021-9010 Psychology 6.5 4 4 y y
Jnl of Applied Social Psychology 0021-9029 Psychology 2 2
** Jnl of Asian Economics 1049-0078 Economics 1 1
** Jnl of Asia-Pacific Business 1059-9231 Gen & Strat 1 1
Jnl of Banking & Finance 0378-4266 F&A 6 3 3 y
Jnl of Behavioral Decision Making 0894-3257 Psychology 6 2 2 y Jnl of Brand Mgmt (The) 1350-231X Marketing 4 1 1
Jnl of Business 0021-9398 Gen & Strat 6.5 4 4 y Jnl of Business & Industrial Marketing (The) 0885-8624 Marketing 5 1 1
Jnl of Business and Economic Statistics 0735-0015 Economics 3 3
Jnl of Business and Psychology 0889-3268 Psychology 2 2
Jnl of Business Communication 0021-9436 Marketing 1 1
Jnl of Business Ethics 0167-4544 OS/OB, HRM, IR 3 2 2 y y
Jnl of Business Finance and Accounting 0306-686X F&A 6 3 3
** Jnl of Business Forecasting Methods and Systems 0278-6087 Gen & Strat 1 1
Jnl of Business Logistics 0735-3766 OR, MS & POM 3 2
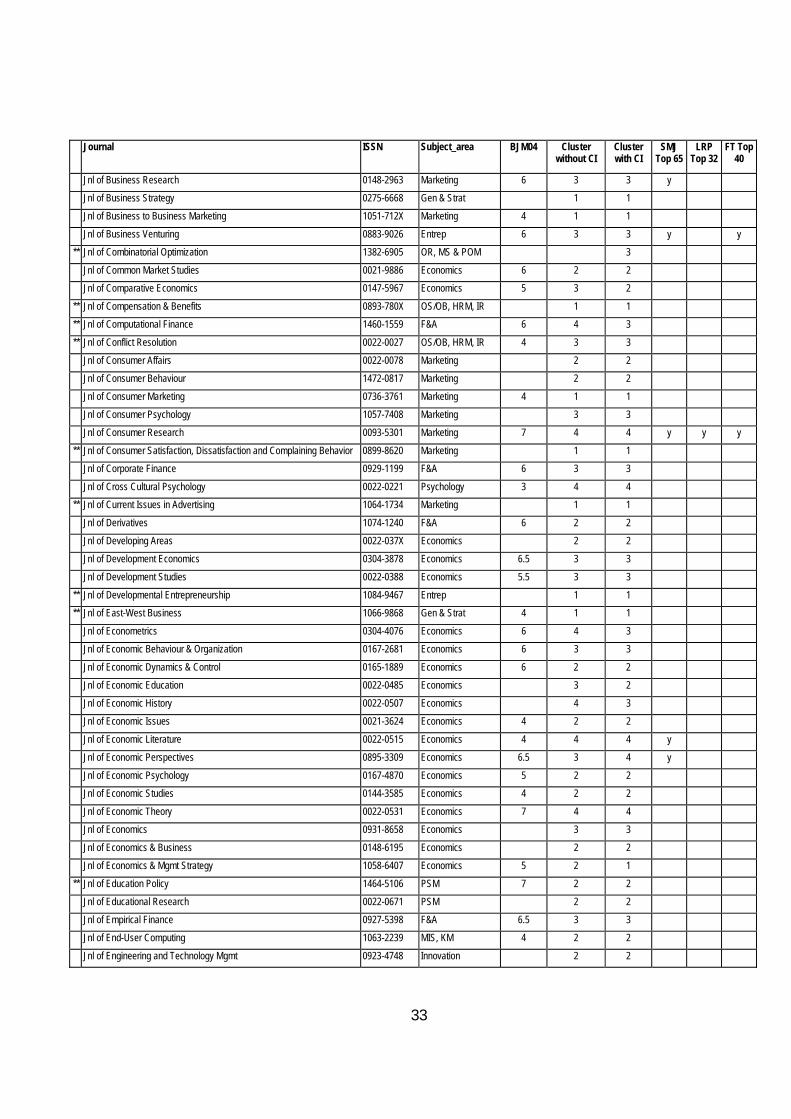
33
Journal ISSN Subject_area BJM04 Cluster without CI
Cluster with CI
SMJ Top 65
LRP Top 32
FT Top 40
Jnl of Business Research 0148-2963 Marketing 6 3 3 y
Jnl of Business Strategy 0275-6668 Gen & Strat 1 1
Jnl of Business to Business Marketing 1051-712X Marketing 4 1 1
Jnl of Business Venturing 0883-9026 Entrep 6 3 3 y y
** Jnl of Combinatorial Optimization 1382-6905 OR, MS & POM 3
Jnl of Common Market Studies 0021-9886 Economics 6 2 2 Jnl of Comparative Economics 0147-5967 Economics 5 3 2
** Jnl of Compensation & Benefits 0893-780X OS/OB, HRM, IR 1 1 ** Jnl of Computational Finance 1460-1559 F&A 6 4 3
** Jnl of Conflict Resolution 0022-0027 OS/OB, HRM, IR 4 3 3
Jnl of Consumer Affairs 0022-0078 Marketing 2 2
Jnl of Consumer Behaviour 1472-0817 Marketing 2 2
Jnl of Consumer Marketing 0736-3761 Marketing 4 1 1
Jnl of Consumer Psychology 1057-7408 Marketing 3 3
Jnl of Consumer Research 0093-5301 Marketing 7 4 4 y y y
** Jnl of Consumer Satisfaction, Dissatisfaction and Complaining Behavior 0899-8620 Marketing 1 1 Jnl of Corporate Finance 0929-1199 F&A 6 3 3
Jnl of Cross Cultural Psychology 0022-0221 Psychology 3 4 4 ** Jnl of Current Issues in Advertising 1064-1734 Marketing 1 1
Jnl of Derivatives 1074-1240 F&A 6 2 2
Jnl of Developing Areas 0022-037X Economics 2 2
Jnl of Development Economics 0304-3878 Economics 6.5 3 3
Jnl of Development Studies 0022-0388 Economics 5.5 3 3
** Jnl of Developmental Entrepreneurship 1084-9467 Entrep 1 1 ** Jnl of East-West Business 1066-9868 Gen & Strat 4 1 1
Jnl of Econometrics 0304-4076 Economics 6 4 3 Jnl of Economic Behaviour & Organization 0167-2681 Economics 6 3 3
Jnl of Economic Dynamics & Control 0165-1889 Economics 6 2 2
Jnl of Economic Education 0022-0485 Economics 3 2
Jnl of Economic History 0022-0507 Economics 4 3
Jnl of Economic Issues 0021-3624 Economics 4 2 2
Jnl of Economic Literature 0022-0515 Economics 4 4 4 y
Jnl of Economic Perspectives 0895-3309 Economics 6.5 3 4 y
Jnl of Economic Psychology 0167-4870 Economics 5 2 2 Jnl of Economic Studies 0144-3585 Economics 4 2 2
Jnl of Economic Theory 0022-0531 Economics 7 4 4 Jnl of Economics 0931-8658 Economics 3 3
Jnl of Economics & Business 0148-6195 Economics 2 2
Jnl of Economics & Mgmt Strategy 1058-6407 Economics 5 2 1
** Jnl of Education Policy 1464-5106 PSM 7 2 2
Jnl of Educational Research 0022-0671 PSM 2 2
Jnl of Empirical Finance 0927-5398 F&A 6.5 3 3
Jnl of End-User Computing 1063-2239 MIS, KM 4 2 2
Jnl of Engineering and Technology Mgmt 0923-4748 Innovation 2 2

34
Journal ISSN Subject_area BJM04 Cluster without CI
Cluster with CI
SMJ Top 65
LRP Top 32
FT Top 40
** Jnl of Enterprise Information Mgmt 0957-6053 MIS, KM 1 1
** Jnl of Entrepreneurial and Small Firm Finance 1057-2287 Entrep 1 1
** Jnl of Entrepreneurship 0971-3557 Entrep 1 1
** Jnl of Entrepreneurship Education 1649-2269 Entrep 1 1
Jnl of Environmental Economics & Mgmt 0095-0696 Economics 3 3
Jnl of Environmental Management 0301-4797 Economics 1 1 Jnl of Euromarketing 1049-6483 Marketing 4 1 1
** Jnl of European Economic History 0391-5115 Economics 2 2 ** Jnl of European Industrial Training 0309-0590 OS/OB, HRM, IR 4 1 1
Jnl of European Public Policy 1350-1763 PSM 5 4 3
** Jnl of European Social Policy 0958-9287 PSM 4 3 3
Jnl of Evolutionary Economics 0936-9937 Economics 6 3 3
** Jnl of Experimental Psychology Applied 1076-898X Psychology 6 4 4
Jnl of Experimental Psychology General 0096-3445 Psychology 3 4
Jnl of Experimental Psychology. Learning Memory and Cognition 0278-7393 Psychology 3 3
Jnl of Experimental Psychology: Human Perception and Performance 0096-1523 Psychology 3 3 Jnl of Experimental Social Psychology 0022-1031 Psychology 3 3 y
Jnl of Finance 0022-2082 F&A 7 4 4 y y y Jnl of Financial & Quantitative Analysis 0022-1090 F&A 5.5 4 4 y
Jnl of Financial Economics 0304-405X F&A 7 4 4 y y y
Jnl of Financial Intermediation 1042-9573 F&A 7 3 3
Jnl of Financial Markets 1386-4181 Economics 2 2
Jnl of Financial Research 0270-2592 F&A 2 2
Jnl of Financial Services Research 0920-8550 F&A 6 1 1 Jnl of Forecasting 0277-6693 Gen & Strat 6 3 3
Jnl of Futures Markets 0270-7314 F&A 5.5 3 3 y Jnl of General Mgmt 0306-3070 Gen & Strat 4 1 1
** Jnl of Global Business 1053-7287 Gen & Strat 1 1
Jnl of Global Marketing 0891-1762 Marketing 1 1
Jnl of Health Economics 0167-6296 Economics 4 3 4
** Jnl of High Tech Mgmt Research 1047-8310 Innovation 2 2
Jnl of Higher Education 0022-1546 PSM 2 2
Jnl of Hospitality and Leisure Marketing 1050-7051 Tourism 2 2
Jnl of Human Resources 0022-166X OS/OB, HRM, IR 6 3 3 y ** Jnl of Industrial Ecology 1088-1980 Economics 4 3
Jnl of Industrial Economics 0022-1821 Economics 5.5 3 3 y ** Jnl of Industrial Relations 0022-1856 OS/OB, HRM, IR 1 1
** Jnl of Information Mgmt 0198-9839 MIS, KM 1
Jnl of Information Science 0165-5515 MIS, KM 1 1
Jnl of Information Systems 0888-7985 MIS, KM 3 2
Jnl of Information Systems Mgmt 0739-9014 MIS, KM 1 1
Jnl of Information Technology 0268-3962 MIS, KM 5 3 2
Jnl of Institutional & Theoretical Economics 0932-4569 Economics 6 2 2
Jnl of Interactive Marketing 1094-9968 Marketing 7 2 2
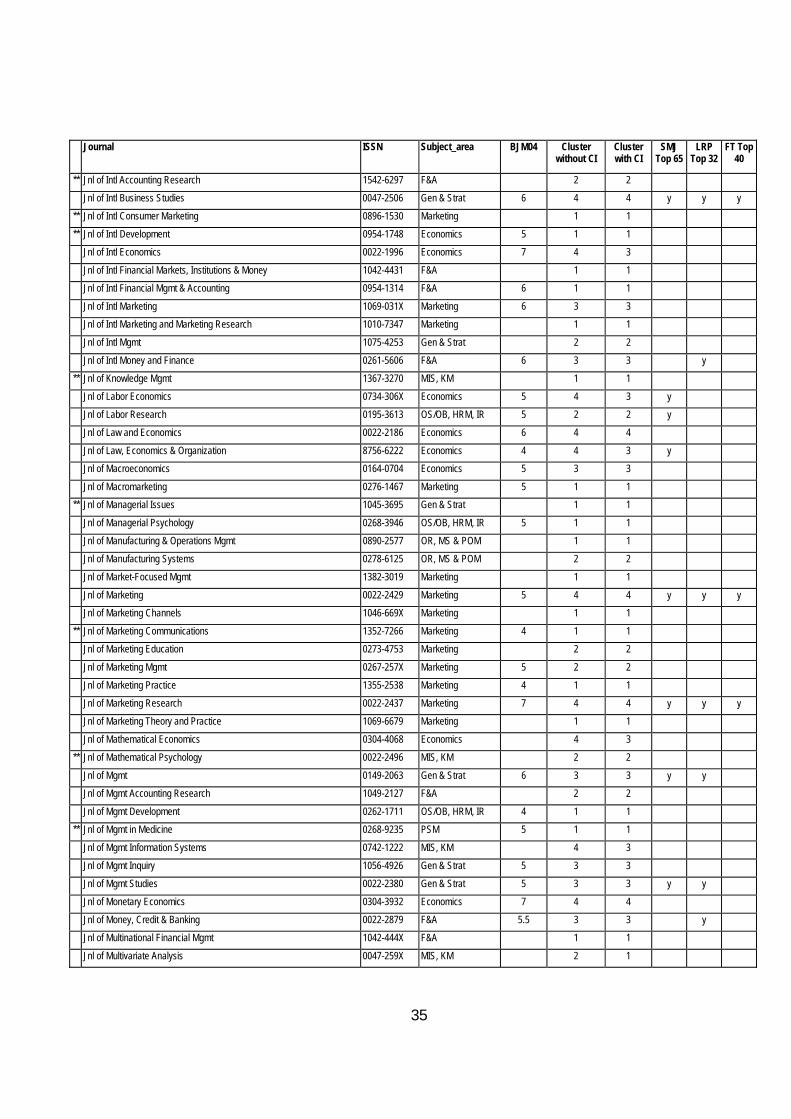
35
Journal ISSN Subject_area BJM04 Cluster without CI
Cluster with CI
SMJ Top 65
LRP Top 32
FT Top 40
** Jnl of Intl Accounting Research 1542-6297 F&A 2 2
Jnl of Intl Business Studies 0047-2506 Gen & Strat 6 4 4 y y y
** Jnl of Intl Consumer Marketing 0896-1530 Marketing 1 1
** Jnl of Intl Development 0954-1748 Economics 5 1 1
Jnl of Intl Economics 0022-1996 Economics 7 4 3
Jnl of Intl Financial Markets, Institutions & Money 1042-4431 F&A 1 1 Jnl of Intl Financial Mgmt & Accounting 0954-1314 F&A 6 1 1
Jnl of Intl Marketing 1069-031X Marketing 6 3 3 Jnl of Intl Marketing and Marketing Research 1010-7347 Marketing 1 1
Jnl of Intl Mgmt 1075-4253 Gen & Strat 2 2
Jnl of Intl Money and Finance 0261-5606 F&A 6 3 3 y
** Jnl of Knowledge Mgmt 1367-3270 MIS, KM 1 1
Jnl of Labor Economics 0734-306X Economics 5 4 3 y
Jnl of Labor Research 0195-3613 OS/OB, HRM, IR 5 2 2 y
Jnl of Law and Economics 0022-2186 Economics 6 4 4
Jnl of Law, Economics & Organization 8756-6222 Economics 4 4 3 y Jnl of Macroeconomics 0164-0704 Economics 5 3 3
Jnl of Macromarketing 0276-1467 Marketing 5 1 1 ** Jnl of Managerial Issues 1045-3695 Gen & Strat 1 1
Jnl of Managerial Psychology 0268-3946 OS/OB, HRM, IR 5 1 1
Jnl of Manufacturing & Operations Mgmt 0890-2577 OR, MS & POM 1 1
Jnl of Manufacturing Systems 0278-6125 OR, MS & POM 2 2
Jnl of Market-Focused Mgmt 1382-3019 Marketing 1 1
Jnl of Marketing 0022-2429 Marketing 5 4 4 y y y Jnl of Marketing Channels 1046-669X Marketing 1 1
** Jnl of Marketing Communications 1352-7266 Marketing 4 1 1 Jnl of Marketing Education 0273-4753 Marketing 2 2
Jnl of Marketing Mgmt 0267-257X Marketing 5 2 2
Jnl of Marketing Practice 1355-2538 Marketing 4 1 1
Jnl of Marketing Research 0022-2437 Marketing 7 4 4 y y y
Jnl of Marketing Theory and Practice 1069-6679 Marketing 1 1
Jnl of Mathematical Economics 0304-4068 Economics 4 3
** Jnl of Mathematical Psychology 0022-2496 MIS, KM 2 2
Jnl of Mgmt 0149-2063 Gen & Strat 6 3 3 y y Jnl of Mgmt Accounting Research 1049-2127 F&A 2 2
Jnl of Mgmt Development 0262-1711 OS/OB, HRM, IR 4 1 1 ** Jnl of Mgmt in Medicine 0268-9235 PSM 5 1 1
Jnl of Mgmt Information Systems 0742-1222 MIS, KM 4 3
Jnl of Mgmt Inquiry 1056-4926 Gen & Strat 5 3 3
Jnl of Mgmt Studies 0022-2380 Gen & Strat 5 3 3 y y
Jnl of Monetary Economics 0304-3932 Economics 7 4 4
Jnl of Money, Credit & Banking 0022-2879 F&A 5.5 3 3 y
Jnl of Multinational Financial Mgmt 1042-444X F&A 1 1
Jnl of Multivariate Analysis 0047-259X MIS, KM 2 1
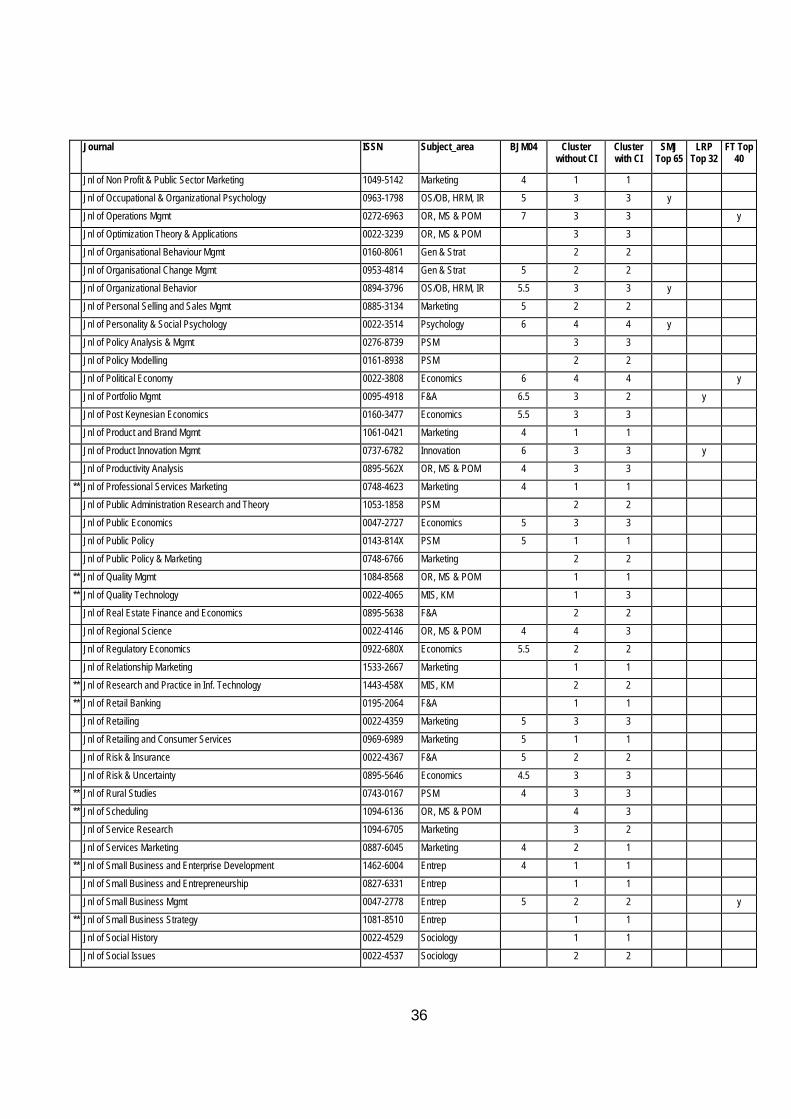
36
Journal ISSN Subject_area BJM04 Cluster without CI
Cluster with CI
SMJ Top 65
LRP Top 32
FT Top 40
Jnl of Non Profit & Public Sector Marketing 1049-5142 Marketing 4 1 1
Jnl of Occupational & Organizational Psychology 0963-1798 OS/OB, HRM, IR 5 3 3 y
Jnl of Operations Mgmt 0272-6963 OR, MS & POM 7 3 3 y
Jnl of Optimization Theory & Applications 0022-3239 OR, MS & POM 3 3
Jnl of Organisational Behaviour Mgmt 0160-8061 Gen & Strat 2 2
Jnl of Organisational Change Mgmt 0953-4814 Gen & Strat 5 2 2 Jnl of Organizational Behavior 0894-3796 OS/OB, HRM, IR 5.5 3 3 y
Jnl of Personal Selling and Sales Mgmt 0885-3134 Marketing 5 2 2 Jnl of Personality & Social Psychology 0022-3514 Psychology 6 4 4 y
Jnl of Policy Analysis & Mgmt 0276-8739 PSM 3 3
Jnl of Policy Modelling 0161-8938 PSM 2 2
Jnl of Political Economy 0022-3808 Economics 6 4 4 y
Jnl of Portfolio Mgmt 0095-4918 F&A 6.5 3 2 y
Jnl of Post Keynesian Economics 0160-3477 Economics 5.5 3 3
Jnl of Product and Brand Mgmt 1061-0421 Marketing 4 1 1
Jnl of Product Innovation Mgmt 0737-6782 Innovation 6 3 3 y Jnl of Productivity Analysis 0895-562X OR, MS & POM 4 3 3
** Jnl of Professional Services Marketing 0748-4623 Marketing 4 1 1 Jnl of Public Administration Research and Theory 1053-1858 PSM 2 2
Jnl of Public Economics 0047-2727 Economics 5 3 3
Jnl of Public Policy 0143-814X PSM 5 1 1
Jnl of Public Policy & Marketing 0748-6766 Marketing 2 2
** Jnl of Quality Mgmt 1084-8568 OR, MS & POM 1 1
** Jnl of Quality Technology 0022-4065 MIS, KM 1 3 Jnl of Real Estate Finance and Economics 0895-5638 F&A 2 2
Jnl of Regional Science 0022-4146 OR, MS & POM 4 4 3 Jnl of Regulatory Economics 0922-680X Economics 5.5 2 2
Jnl of Relationship Marketing 1533-2667 Marketing 1 1
** Jnl of Research and Practice in Inf. Technology 1443-458X MIS, KM 2 2
** Jnl of Retail Banking 0195-2064 F&A 1 1
Jnl of Retailing 0022-4359 Marketing 5 3 3
Jnl of Retailing and Consumer Services 0969-6989 Marketing 5 1 1
Jnl of Risk & Insurance 0022-4367 F&A 5 2 2
Jnl of Risk & Uncertainty 0895-5646 Economics 4.5 3 3 ** Jnl of Rural Studies 0743-0167 PSM 4 3 3
** Jnl of Scheduling 1094-6136 OR, MS & POM 4 3 Jnl of Service Research 1094-6705 Marketing 3 2
Jnl of Services Marketing 0887-6045 Marketing 4 2 1
** Jnl of Small Business and Enterprise Development 1462-6004 Entrep 4 1 1
Jnl of Small Business and Entrepreneurship 0827-6331 Entrep 1 1
Jnl of Small Business Mgmt 0047-2778 Entrep 5 2 2 y
** Jnl of Small Business Strategy 1081-8510 Entrep 1 1
Jnl of Social History 0022-4529 Sociology 1 1
Jnl of Social Issues 0022-4537 Sociology 2 2
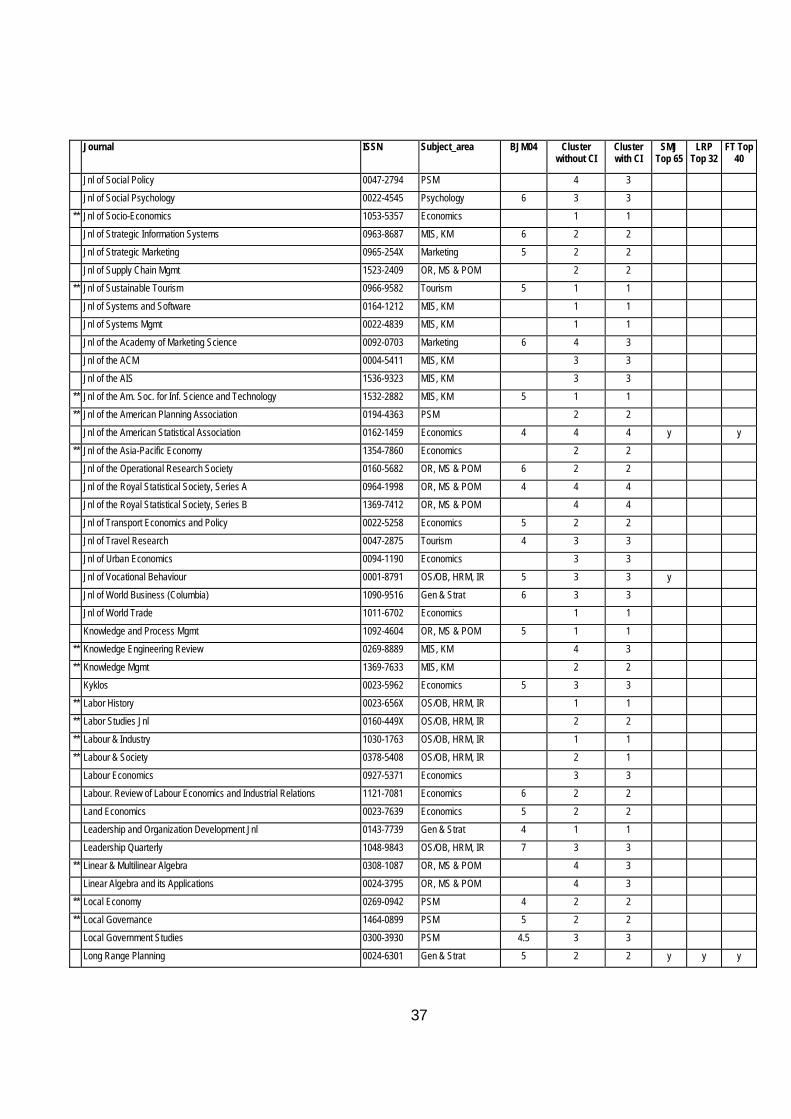
37
Journal ISSN Subject_area BJM04 Cluster without CI
Cluster with CI
SMJ Top 65
LRP Top 32
FT Top 40
Jnl of Social Policy 0047-2794 PSM 4 3
Jnl of Social Psychology 0022-4545 Psychology 6 3 3
** Jnl of Socio-Economics 1053-5357 Economics 1 1
Jnl of Strategic Information Systems 0963-8687 MIS, KM 6 2 2
Jnl of Strategic Marketing 0965-254X Marketing 5 2 2
Jnl of Supply Chain Mgmt 1523-2409 OR, MS & POM 2 2 ** Jnl of Sustainable Tourism 0966-9582 Tourism 5 1 1
Jnl of Systems and Software 0164-1212 MIS, KM 1 1 Jnl of Systems Mgmt 0022-4839 MIS, KM 1 1
Jnl of the Academy of Marketing Science 0092-0703 Marketing 6 4 3
Jnl of the ACM 0004-5411 MIS, KM 3 3
Jnl of the AIS 1536-9323 MIS, KM 3 3
** Jnl of the Am. Soc. for Inf. Science and Technology 1532-2882 MIS, KM 5 1 1
** Jnl of the American Planning Association 0194-4363 PSM 2 2
Jnl of the American Statistical Association 0162-1459 Economics 4 4 4 y y
** Jnl of the Asia-Pacific Economy 1354-7860 Economics 2 2 Jnl of the Operational Research Society 0160-5682 OR, MS & POM 6 2 2
Jnl of the Royal Statistical Society, Series A 0964-1998 OR, MS & POM 4 4 4 Jnl of the Royal Statistical Society, Series B 1369-7412 OR, MS & POM 4 4
Jnl of Transport Economics and Policy 0022-5258 Economics 5 2 2
Jnl of Travel Research 0047-2875 Tourism 4 3 3
Jnl of Urban Economics 0094-1190 Economics 3 3
Jnl of Vocational Behaviour 0001-8791 OS/OB, HRM, IR 5 3 3 y
Jnl of World Business (Columbia) 1090-9516 Gen & Strat 6 3 3 Jnl of World Trade 1011-6702 Economics 1 1
Knowledge and Process Mgmt 1092-4604 OR, MS & POM 5 1 1 ** Knowledge Engineering Review 0269-8889 MIS, KM 4 3
** Knowledge Mgmt 1369-7633 MIS, KM 2 2
Kyklos 0023-5962 Economics 5 3 3
** Labor History 0023-656X OS/OB, HRM, IR 1 1
** Labor Studies Jnl 0160-449X OS/OB, HRM, IR 2 2
** Labour & Industry 1030-1763 OS/OB, HRM, IR 1 1
** Labour & Society 0378-5408 OS/OB, HRM, IR 2 1
Labour Economics 0927-5371 Economics 3 3 Labour. Review of Labour Economics and Industrial Relations 1121-7081 Economics 6 2 2
Land Economics 0023-7639 Economics 5 2 2 Leadership and Organization Development Jnl 0143-7739 Gen & Strat 4 1 1
Leadership Quarterly 1048-9843 OS/OB, HRM, IR 7 3 3
** Linear & Multilinear Algebra 0308-1087 OR, MS & POM 4 3
Linear Algebra and its Applications 0024-3795 OR, MS & POM 4 3
** Local Economy 0269-0942 PSM 4 2 2
** Local Governance 1464-0899 PSM 5 2 2
Local Government Studies 0300-3930 PSM 4.5 3 3
Long Range Planning 0024-6301 Gen & Strat 5 2 2 y y y

38
Journal ISSN Subject_area BJM04 Cluster without CI
Cluster with CI
SMJ Top 65
LRP Top 32
FT Top 40
Managerial and Decision Economics 0143-6570 Economics 6 2 2
Managerial Auditing Jnl 0268-6902 F&A 4 1 1
Managerial Finance 0307-4358 F&A 3 1 1
** Managing Service Quality 0960-4529 Marketing 4 1 1
Manchester School 1463-6786 Economics 6 2 2
Manufacturing and Service Operations Mgmt 1523-4614 OR, MS & POM 1 1 ** Marine Policy 0308-597X Economics 5 3
** Marketing Health Services 1094-1304 Marketing 1 1 Marketing Intelligence and Planning 0263-4503 Marketing 4 1 1
Marketing Letters 0923-0645 Marketing 7 3 3
** Marketing Mgmt 1061-3846 Marketing 1 1
Marketing News 0025-3790 Marketing 1 1
Marketing Science 0732-2399 Marketing 7 4 4 y
Marketing Theory 1470-5931 Marketing 2 2
** Mathematical & Computer Modelling 0895-7177 OR, MS & POM 2 2
Mathematical Finance 0960-1627 F&A 7 3 3 Mathematical Methods of Operational Research 1432-2994 OR, MS & POM 2 2
Mathematical Programming 0025-5610 OR, MS & POM 6 4 4 ** Mathematical Social Sciences 0165-4896 Economics 3 2
** Mathematics of Control, Signals & systems 0932-4194 OR, MS & POM 3 3
Mathematics of Operations Research 0364-765X OR, MS & POM 6 4 3
McKinsey Quarterly 0047-5394 Gen & Strat 1 1
Mgmt Accounting Research 1044-5005 F&A 6 3 3
** Mgmt Communication Quarterly 0893-3189 Gen & Strat 2 2 Mgmt Decision 0025-1747 Gen & Strat 4 1 1
** Mgmt Development Review 0962-2519 OS/OB, HRM, IR 2 1 Mgmt Intl Review 0025-181X Gen & Strat 6 2 2 y y
Mgmt Learning 1350-5076 Gen & Strat 5 2 2
** Mgmt Quarterly 0025-1860 Gen & Strat 1 1
Mgmt Review 0025-1895 Gen & Strat 1 1
Mgmt Science 0025-1909 OR, MS & POM 6 4 4 y y y
** Mgmt Services 0307-6768 Gen & Strat 1 1
MIS Quarterly 0276-7783 MIS, KM 6 4 4 y y
** Modern Asian Studies 0026-749X Sociology 2 1 Monthly Labor Review 0098-1818 OS/OB, HRM, IR 2 2
** Multinational Business Review 1525-383X Gen & Strat 1 1 Multivariate Behavioral Research 0027-3171 Psychology 3 3
National Tax Jnl 0028-0283 Economics 4 3 3
Naval Research Logistics: an Intl Jnl 0894-069X OR, MS & POM 2 2
** Networks 0028-3045 MIS, KM 3
** New Review of Applied Expert Systems 1361-0244 MIS, KM 2 2
New Technology, Work and Employment 0268-1072 OS/OB, HRM, IR 5 2 2
** New Zealand Jnl of Business 0110-9596 Gen & Strat 1 1
** New Zealand Jnl of Industrial Relations 0110-0637 OS/OB, HRM, IR 1 1
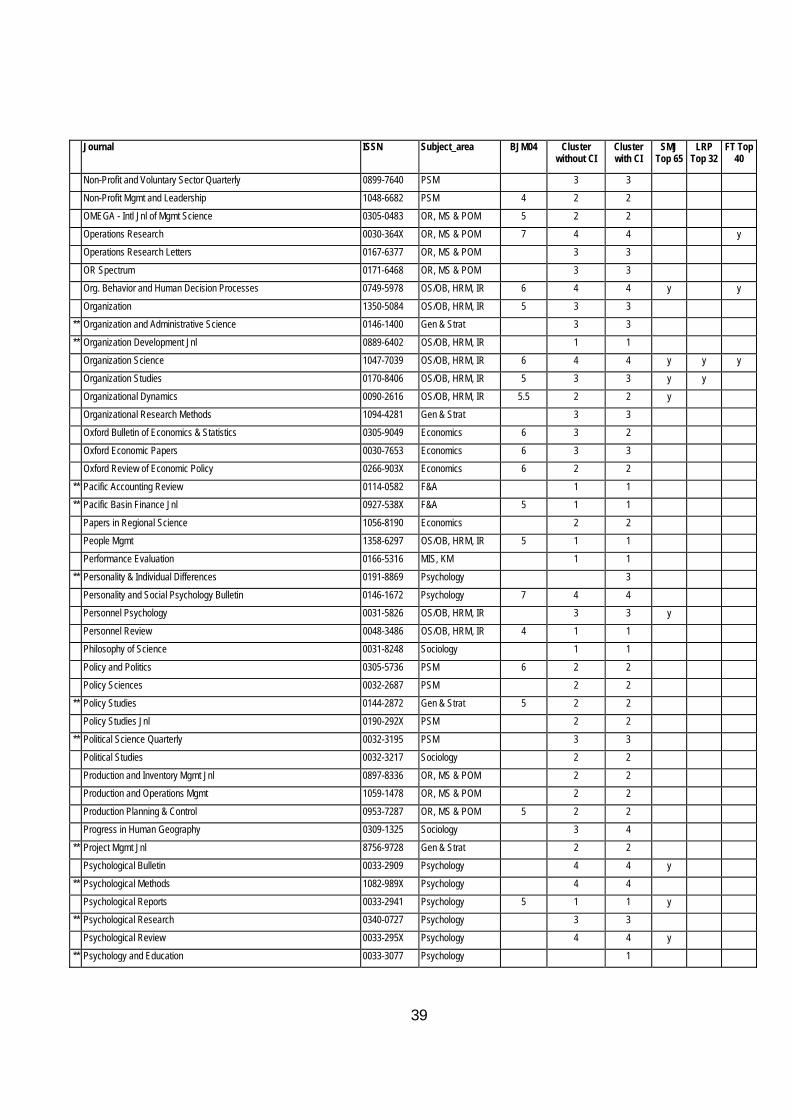
39
Journal ISSN Subject_area BJM04 Cluster without CI
Cluster with CI
SMJ Top 65
LRP Top 32
FT Top 40
Non-Profit and Voluntary Sector Quarterly 0899-7640 PSM 3 3
Non-Profit Mgmt and Leadership 1048-6682 PSM 4 2 2
OMEGA - Intl Jnl of Mgmt Science 0305-0483 OR, MS & POM 5 2 2
Operations Research 0030-364X OR, MS & POM 7 4 4 y
Operations Research Letters 0167-6377 OR, MS & POM 3 3
OR Spectrum 0171-6468 OR, MS & POM 3 3 Org. Behavior and Human Decision Processes 0749-5978 OS/OB, HRM, IR 6 4 4 y y
Organization 1350-5084 OS/OB, HRM, IR 5 3 3 ** Organization and Administrative Science 0146-1400 Gen & Strat 3 3
** Organization Development Jnl 0889-6402 OS/OB, HRM, IR 1 1
Organization Science 1047-7039 OS/OB, HRM, IR 6 4 4 y y y
Organization Studies 0170-8406 OS/OB, HRM, IR 5 3 3 y y
Organizational Dynamics 0090-2616 OS/OB, HRM, IR 5.5 2 2 y
Organizational Research Methods 1094-4281 Gen & Strat 3 3
Oxford Bulletin of Economics & Statistics 0305-9049 Economics 6 3 2
Oxford Economic Papers 0030-7653 Economics 6 3 3 Oxford Review of Economic Policy 0266-903X Economics 6 2 2
** Pacific Accounting Review 0114-0582 F&A 1 1 ** Pacific Basin Finance Jnl 0927-538X F&A 5 1 1
Papers in Regional Science 1056-8190 Economics 2 2
People Mgmt 1358-6297 OS/OB, HRM, IR 5 1 1
Performance Evaluation 0166-5316 MIS, KM 1 1
** Personality & Individual Differences 0191-8869 Psychology 3
Personality and Social Psychology Bulletin 0146-1672 Psychology 7 4 4 Personnel Psychology 0031-5826 OS/OB, HRM, IR 3 3 y
Personnel Review 0048-3486 OS/OB, HRM, IR 4 1 1 Philosophy of Science 0031-8248 Sociology 1 1
Policy and Politics 0305-5736 PSM 6 2 2
Policy Sciences 0032-2687 PSM 2 2
** Policy Studies 0144-2872 Gen & Strat 5 2 2
Policy Studies Jnl 0190-292X PSM 2 2
** Political Science Quarterly 0032-3195 PSM 3 3
Political Studies 0032-3217 Sociology 2 2
Production and Inventory Mgmt Jnl 0897-8336 OR, MS & POM 2 2 Production and Operations Mgmt 1059-1478 OR, MS & POM 2 2
Production Planning & Control 0953-7287 OR, MS & POM 5 2 2 Progress in Human Geography 0309-1325 Sociology 3 4
** Project Mgmt Jnl 8756-9728 Gen & Strat 2 2
Psychological Bulletin 0033-2909 Psychology 4 4 y
** Psychological Methods 1082-989X Psychology 4 4
Psychological Reports 0033-2941 Psychology 5 1 1 y
** Psychological Research 0340-0727 Psychology 3 3
Psychological Review 0033-295X Psychology 4 4 y
** Psychology and Education 0033-3077 Psychology 1
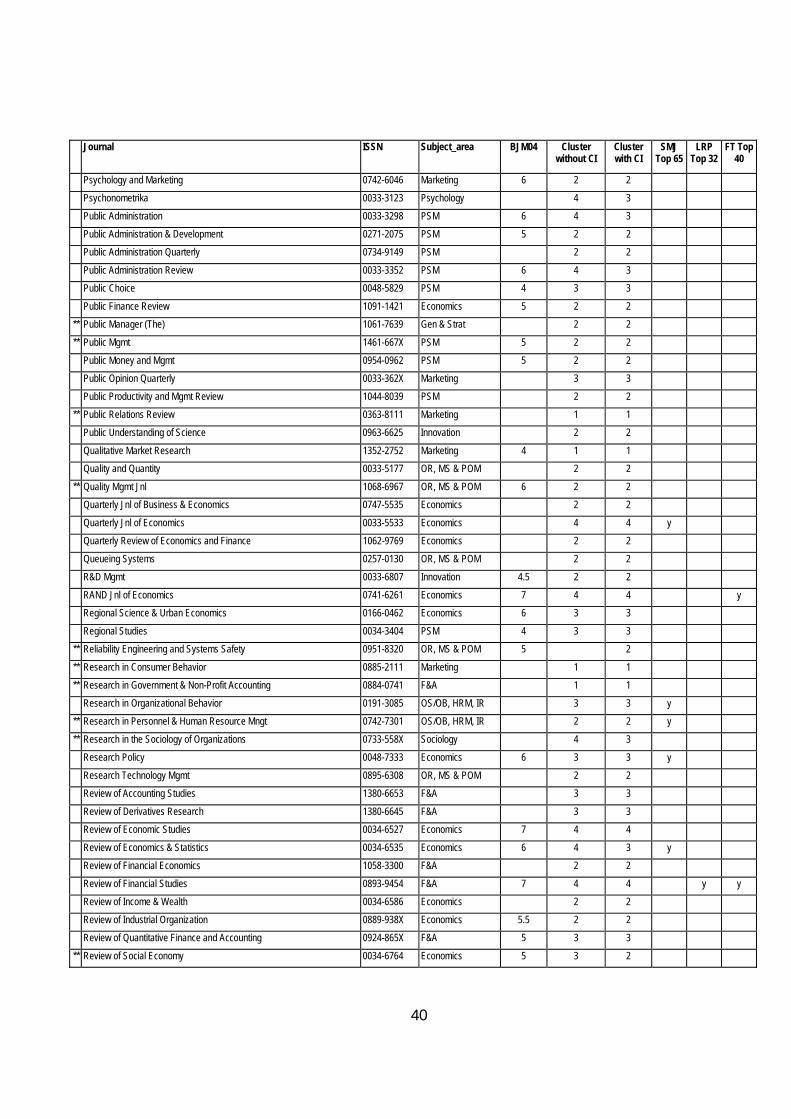
40
Journal ISSN Subject_area BJM04 Cluster without CI
Cluster with CI
SMJ Top 65
LRP Top 32
FT Top 40
Psychology and Marketing 0742-6046 Marketing 6 2 2
Psychonometrika 0033-3123 Psychology 4 3
Public Administration 0033-3298 PSM 6 4 3
Public Administration & Development 0271-2075 PSM 5 2 2
Public Administration Quarterly 0734-9149 PSM 2 2
Public Administration Review 0033-3352 PSM 6 4 3 Public Choice 0048-5829 PSM 4 3 3
Public Finance Review 1091-1421 Economics 5 2 2 ** Public Manager (The) 1061-7639 Gen & Strat 2 2
** Public Mgmt 1461-667X PSM 5 2 2
Public Money and Mgmt 0954-0962 PSM 5 2 2
Public Opinion Quarterly 0033-362X Marketing 3 3
Public Productivity and Mgmt Review 1044-8039 PSM 2 2
** Public Relations Review 0363-8111 Marketing 1 1
Public Understanding of Science 0963-6625 Innovation 2 2
Qualitative Market Research 1352-2752 Marketing 4 1 1 Quality and Quantity 0033-5177 OR, MS & POM 2 2
** Quality Mgmt Jnl 1068-6967 OR, MS & POM 6 2 2 Quarterly Jnl of Business & Economics 0747-5535 Economics 2 2
Quarterly Jnl of Economics 0033-5533 Economics 4 4 y
Quarterly Review of Economics and Finance 1062-9769 Economics 2 2
Queueing Systems 0257-0130 OR, MS & POM 2 2
R&D Mgmt 0033-6807 Innovation 4.5 2 2
RAND Jnl of Economics 0741-6261 Economics 7 4 4 y Regional Science & Urban Economics 0166-0462 Economics 6 3 3
Regional Studies 0034-3404 PSM 4 3 3 ** Reliability Engineering and Systems Safety 0951-8320 OR, MS & POM 5 2
** Research in Consumer Behavior 0885-2111 Marketing 1 1
** Research in Government & Non-Profit Accounting 0884-0741 F&A 1 1
Research in Organizational Behavior 0191-3085 OS/OB, HRM, IR 3 3 y
** Research in Personnel & Human Resource Mngt 0742-7301 OS/OB, HRM, IR 2 2 y
** Research in the Sociology of Organizations 0733-558X Sociology 4 3
Research Policy 0048-7333 Economics 6 3 3 y
Research Technology Mgmt 0895-6308 OR, MS & POM 2 2 Review of Accounting Studies 1380-6653 F&A 3 3
Review of Derivatives Research 1380-6645 F&A 3 3 Review of Economic Studies 0034-6527 Economics 7 4 4
Review of Economics & Statistics 0034-6535 Economics 6 4 3 y
Review of Financial Economics 1058-3300 F&A 2 2
Review of Financial Studies 0893-9454 F&A 7 4 4 y y
Review of Income & Wealth 0034-6586 Economics 2 2
Review of Industrial Organization 0889-938X Economics 5.5 2 2
Review of Quantitative Finance and Accounting 0924-865X F&A 5 3 3
** Review of Social Economy 0034-6764 Economics 5 3 2
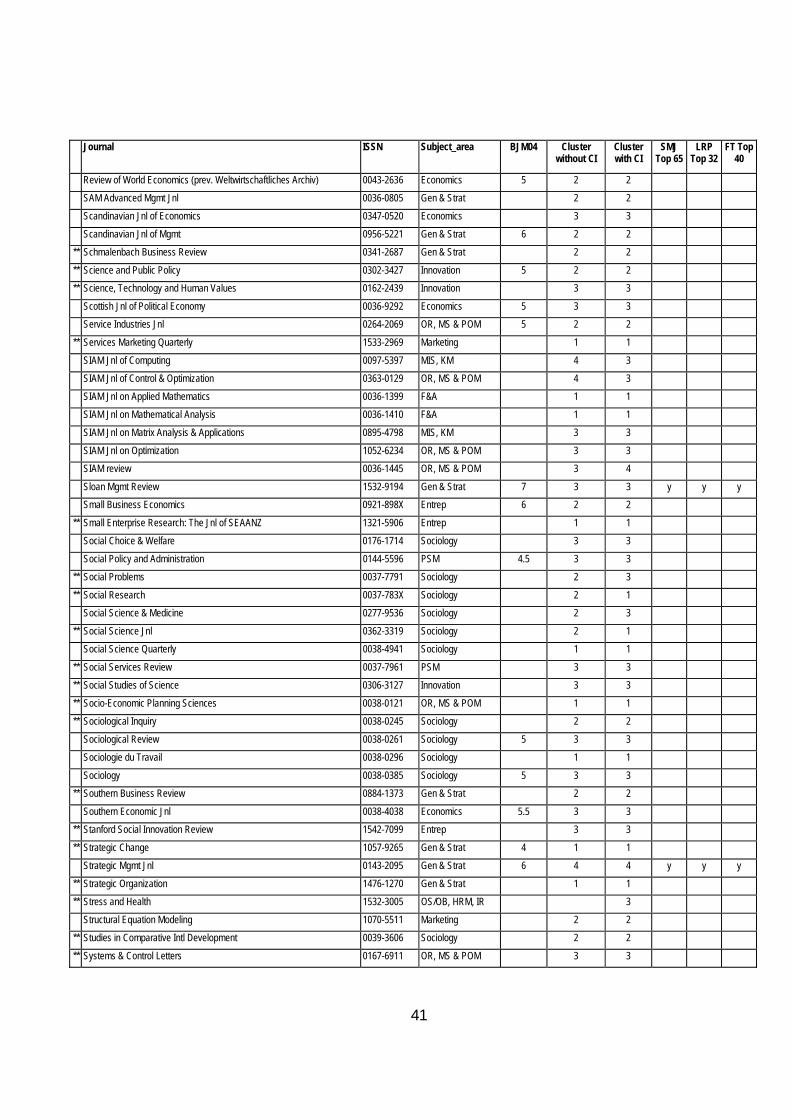
41
Journal ISSN Subject_area BJM04 Cluster without CI
Cluster with CI
SMJ Top 65
LRP Top 32
FT Top 40
Review of World Economics (prev. Weltwirtschaftliches Archiv) 0043-2636 Economics 5 2 2
SAM Advanced Mgmt Jnl 0036-0805 Gen & Strat 2 2
Scandinavian Jnl of Economics 0347-0520 Economics 3 3
Scandinavian Jnl of Mgmt 0956-5221 Gen & Strat 6 2 2
** Schmalenbach Business Review 0341-2687 Gen & Strat 2 2
** Science and Public Policy 0302-3427 Innovation 5 2 2 ** Science, Technology and Human Values 0162-2439 Innovation 3 3
Scottish Jnl of Political Economy 0036-9292 Economics 5 3 3 Service Industries Jnl 0264-2069 OR, MS & POM 5 2 2
** Services Marketing Quarterly 1533-2969 Marketing 1 1
SIAM Jnl of Computing 0097-5397 MIS, KM 4 3
SIAM Jnl of Control & Optimization 0363-0129 OR, MS & POM 4 3
SIAM Jnl on Applied Mathematics 0036-1399 F&A 1 1
SIAM Jnl on Mathematical Analysis 0036-1410 F&A 1 1
SIAM Jnl on Matrix Analysis & Applications 0895-4798 MIS, KM 3 3
SIAM Jnl on Optimization 1052-6234 OR, MS & POM 3 3 SIAM review 0036-1445 OR, MS & POM 3 4
Sloan Mgmt Review 1532-9194 Gen & Strat 7 3 3 y y y Small Business Economics 0921-898X Entrep 6 2 2
** Small Enterprise Research: The Jnl of SEAANZ 1321-5906 Entrep 1 1
Social Choice & Welfare 0176-1714 Sociology 3 3
Social Policy and Administration 0144-5596 PSM 4.5 3 3
** Social Problems 0037-7791 Sociology 2 3
** Social Research 0037-783X Sociology 2 1 Social Science & Medicine 0277-9536 Sociology 2 3
** Social Science Jnl 0362-3319 Sociology 2 1 Social Science Quarterly 0038-4941 Sociology 1 1
** Social Services Review 0037-7961 PSM 3 3
** Social Studies of Science 0306-3127 Innovation 3 3
** Socio-Economic Planning Sciences 0038-0121 OR, MS & POM 1 1
** Sociological Inquiry 0038-0245 Sociology 2 2
Sociological Review 0038-0261 Sociology 5 3 3
Sociologie du Travail 0038-0296 Sociology 1 1
Sociology 0038-0385 Sociology 5 3 3 ** Southern Business Review 0884-1373 Gen & Strat 2 2
Southern Economic Jnl 0038-4038 Economics 5.5 3 3 ** Stanford Social Innovation Review 1542-7099 Entrep 3 3
** Strategic Change 1057-9265 Gen & Strat 4 1 1
Strategic Mgmt Jnl 0143-2095 Gen & Strat 6 4 4 y y y
** Strategic Organization 1476-1270 Gen & Strat 1 1
** Stress and Health 1532-3005 OS/OB, HRM, IR 3
Structural Equation Modeling 1070-5511 Marketing 2 2
** Studies in Comparative Intl Development 0039-3606 Sociology 2 2
** Systems & Control Letters 0167-6911 OR, MS & POM 3 3
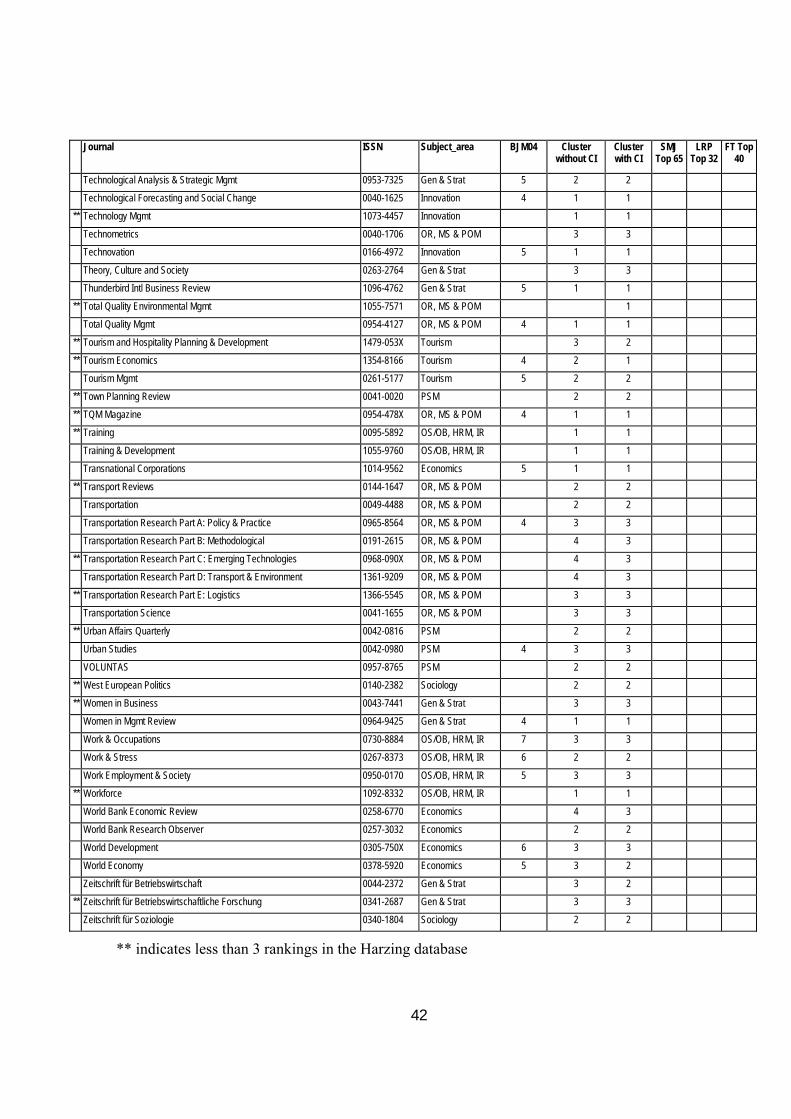
42
Journal ISSN Subject_area BJM04 Cluster without CI
Cluster with CI
SMJ Top 65
LRP Top 32
FT Top 40
Technological Analysis & Strategic Mgmt 0953-7325 Gen & Strat 5 2 2
Technological Forecasting and Social Change 0040-1625 Innovation 4 1 1
** Technology Mgmt 1073-4457 Innovation 1 1
Technometrics 0040-1706 OR, MS & POM 3 3
Technovation 0166-4972 Innovation 5 1 1
Theory, Culture and Society 0263-2764 Gen & Strat 3 3 Thunderbird Intl Business Review 1096-4762 Gen & Strat 5 1 1
** Total Quality Environmental Mgmt 1055-7571 OR, MS & POM 1 Total Quality Mgmt 0954-4127 OR, MS & POM 4 1 1
** Tourism and Hospitality Planning & Development 1479-053X Tourism 3 2
** Tourism Economics 1354-8166 Tourism 4 2 1
Tourism Mgmt 0261-5177 Tourism 5 2 2
** Town Planning Review 0041-0020 PSM 2 2
** TQM Magazine 0954-478X OR, MS & POM 4 1 1
** Training 0095-5892 OS/OB, HRM, IR 1 1
Training & Development 1055-9760 OS/OB, HRM, IR 1 1 Transnational Corporations 1014-9562 Economics 5 1 1
** Transport Reviews 0144-1647 OR, MS & POM 2 2 Transportation 0049-4488 OR, MS & POM 2 2
Transportation Research Part A: Policy & Practice 0965-8564 OR, MS & POM 4 3 3
Transportation Research Part B: Methodological 0191-2615 OR, MS & POM 4 3
** Transportation Research Part C: Emerging Technologies 0968-090X OR, MS & POM 4 3
Transportation Research Part D: Transport & Environment 1361-9209 OR, MS & POM 4 3
** Transportation Research Part E: Logistics 1366-5545 OR, MS & POM 3 3 Transportation Science 0041-1655 OR, MS & POM 3 3
** Urban Affairs Quarterly 0042-0816 PSM 2 2 Urban Studies 0042-0980 PSM 4 3 3
VOLUNTAS 0957-8765 PSM 2 2
** West European Politics 0140-2382 Sociology 2 2
** Women in Business 0043-7441 Gen & Strat 3 3
Women in Mgmt Review 0964-9425 Gen & Strat 4 1 1
Work & Occupations 0730-8884 OS/OB, HRM, IR 7 3 3
Work & Stress 0267-8373 OS/OB, HRM, IR 6 2 2
Work Employment & Society 0950-0170 OS/OB, HRM, IR 5 3 3 ** Workforce 1092-8332 OS/OB, HRM, IR 1 1
World Bank Economic Review 0258-6770 Economics 4 3 World Bank Research Observer 0257-3032 Economics 2 2
World Development 0305-750X Economics 6 3 3
World Economy 0378-5920 Economics 5 3 2
Zeitschrift für Betriebswirtschaft 0044-2372 Gen & Strat 3 2
** Zeitschrift für Betriebswirtschaftliche Forschung 0341-2687 Gen & Strat 3 3
Zeitschrift für Soziologie 0340-1804 Sociology 2 2
** indicates less than 3 rankings in the Harzing database
43
References Agresti, A. (1988), "A model for agreement between ratings on an ordinal scale", Biometrics,
Vol. 44, pp. 539-548. Aldenderfer, M. and Blashfield, R. (1984), Cluster Analysis, Sage, London. Anderberg, M. (1973), Cluster Analysis for Applications, Academic Press, New York. Baden-Fuller, C., Ravazzolo, F. and Schweizer, T. (2000), "Making and measuring reputations -
The research ranking of European business schools", Long Range Planning, Vol. 33, No. 5, pp. 621-650.
Doyle, J. and Arthurs, A. (1995), "Judging the quality of research in business schools", Omega, Int. J. Mgmt. Sci, Vol. 23, No. 3, pp. 257-270.
Doyle, J., Arthurs, A., Green, R., McAulay, L., Pitt, M. and Bottomly, P. (1996), "The judge, the model of the judge, and the nodel of the judged as judge: analysis of the UK 1992 Research Assessment Exercise data for Business and Management Studies", Omega, Vol. 24, No. 1, pp. 13-28.
Doyle, J., Arthurs, A., McAulay, L. and Osbourne, P. (1996), "Citation as effortful voting: a reply to Jones, Brinn and Pendlebury", Omega, Vol. 24, No. 5, pp. 603-606.
DuBois, F. L. and Reeb, D. (2000), "Ranking the international business journals", Journal of International Business Studies, Vol. 31, No. 4, pp. 689-704.
Easton, G. and Easton, D. (2003), "Marketing journals and the Research Assessment Exercise", J. Marketing Management, Vol. 19, pp. 5-24.
Everitt, B. (1980), Cluster Analysis, Heinemann, London. Forgionne, G. and Kohli, R. (2001), "A multiple criteria assessment of decision technology
system journal quality", Information and Management, Vol. 38, pp. 421-435. Geary, J., Marriott, L. and Rowlinson, M. (2004), "Journal rankings in business and management
and the 2001 research assessment exercise in the UK", British J. of Management, Vol. 15, pp. 95-141.
Gibbons, J. (1993), Nonparametric Measures of Association, Sage, London. Gordon, A. (1981), Classification, Chapman and Hall, London. Gower, J. (1971), "A general coefficient of similarity and some of its properties", Biometrics,
Vol. 27, pp. 857-871. Hair, J., Anderson, R., Tatham, R. and Black, W. (1998), Multivariate Data Analysis, Prentice
Hall, New Jersey. Harvey, C. and Morris, H. (2005), "Classification of academic journals in the field of business
and management studies", University of West of England, Bristol. Harzing, A.-W. (2005), "Journal Quality List", 17th Edition, http://www.harzing.com/ Horowitz, I. (2003), "Preference-neutral attribute weights in the journal-ranking problem", J.
Operational Research Society, Vol. 54, pp. 452-457. Jones, M., Brinn, T. and Pendlebury, M. (1996), "Journal evaluation methodologies: a balanced
response", Omega, Vol. 24, No. 5, pp. 607-612. Jones, M., Brinn, T. and Pendlebury, M. (1996), "Judging the quality of research in business
schools: a comment from accounting", Omega, Int. J. Mgmt. Sci., Vol. 24, No. 5, pp. 597-602.
44
Kim, J. (1975), "Multivariate analysis of ordinal data", American J. of Sociology, Vol. 81, pp. 261-298.
Labovitz, S. (1967), "Some observations on measurement and statistics", Social Forces, Vol. 46, No. 2, pp. 151-160.
Labovitz, S. (1970), "The assignment of numbers to rank order categories", American Sociological Review, Vol. 35, pp. 515-525.
Liebertrau, A. (1983), Measures of Association, Sage, London. Schuster, C. and von Eye, A. (2001), "Models for ordinal agreement data", Biometrical Journal,
Vol. 43, No. 7, pp. 795-808. Sneath, P. and Sokal, R. (1973), Numerical Taxonomy, Freeman, San Francison. Tahai, A. and Meyer, M. (1999), "A revealed preference study of management journals' direct
influences", Strategic Management Journal, Vol. 20, pp. 279-296. Tse, A. (2001), "Using mathematical programming to solve large ranking problems", J.
Operational Research Society, Vol. 52, No. 1144-1150. Zumbo, B. and Zimmerman, D. (1993), "Is the selection of statistical methods governed by level
of measurement?" Canadian Psychology, Vol. 34, pp. 390-399. i Agreement is not the same as association as it implies a positive association. ii As was mentioned above, the data is essentially ordinal rather than interval and this does cause some concern in using principal components analysis. There is, in fact, a technique for categorical PCA called CATPCA in SPSS developed by Leiden University. This analysis was undertaken and the results (which are available from the author) were very similar with the same two dimensions picked out. The weakness is that it deals with missing data automatically by simply imputing the modal value of a variable which is not sensible for this data. iii Equivalently measures of distance or dissimilarity. iv This is by no means the lowest quality journal as only the 250 with no missing data are shown on the plot. v The SMJ ranking and the FT list are both included in the Harzing database. Since they were both excluded from the analysis on the grounds of restricted coverage it is useful to use them for comparison purposes. vi Note that the journal titles Journal of Occupational Psychology and Group and Organization Studies in the SMJ ranking refer to Journal of Occupational and Organizational Psychology and Group and Organization Management respectively. The journals changed their names in 1992 and 1982 respectively.
Related Documents